Embed Size (px)
Citation preview
Int J Clin Exp Med 2017;10(10):14232-14243www.ijcem.com /ISSN:1940-5901/IJCEM0053929
Original ArticleQuantitative MRI assessment of glioma response to bevacizumab in a mouse model
Jinlong Zhang1*, Shunan Wang1*, Heng Liu1, Xuesong Du1, Xiao Chen1, Yu Guo1, Junfeng Zhang1, Jingqin Fang1, Weiguo Zhang1,2
1Department of Radiology, Research Institute of Surgery, Daping Hospital, Third Military Medical University, Chongqing, China; 2Chongqing Clinical Research Center for Imaging and Nuclear Medicine, Chongqing, China. *Equal contributors.
Received February 13, 2017; Accepted July 7, 2017; Epub October 15, 2017; Published October 30, 2017
Abstract: We aimed to investigate the changes of MRI parameters in glioma after bevacizumab treatment and to explore possible pathological mechanism to these changes. Forty-two nude mice with intracranial gliomas were divided two groups: bevacizumab group and control group. Various MRI parameters (tumor volume, apparent dif-fusion coefficient [ADC], T1w + contrast, dynamic contrast-enhanced-MRI [DCE-MRI]) were acquired before and after treatment. The expression of Ki67, claudin-5, occludin and CD34 were detected and tight junction changes of blood brain barrier were observed. Neovascularization pattern (intussusceptive microvascular growth) in tumor was also observed after treatment. The results showed bevacizumab reduced tumor growth rate and suppressed tumor cell proliferation. Normalized ADC was negatively correlated with the number of Ki67 positive cells in the tumor tissue (R2 = 0.733). Contrast enhancement on T1w + contrast and the Ktrans value acquired from DCE-MRI showed a significant reduction in glioma. Transmission electron microscope showed tight junction was partially regained after bevacizumab treatment. Meanwhile, claudin-5 and occludin expression increased. In bevacizumab group, the number of intussusceptive microvascular growth (3.83 ± 1.17) in tumor was higher than that in control group (1.16 ± 0.75) (P < 0.05). Ktrans value was negatively correlated with intussusceptive microvascular growth (R2 = 0.7396) and normalized contrast enhancement value was negatively correlated with claudin-5 and occludin expression (R2 = 0.831, 0.924) in tumor. In conclusion, bevacizumab effectively reduced the Ktrans and T1w + contrast values. The mechanisms might involve neovascularization pattern change and reformation of tight junction. And ADC, Ktrans and T1w + contrast might be noninvasive biomarkers to predict cell proliferation, neovascularization pattern and tight junction change in a U87 glioma model. These findings might provide some new guidance to glioma therapy.
Keywords: Bevacizumab, glioma, MRI, neovascularization, biomarker
Introduction
Malignant glioma has a high recurrence and mortality rate. Current strategy contains surgi-cal debulking, radiation therapy and chemo-therapy. Despite the increase in therapy meth-ods, the median survival of patients with glioblastoma multiforme (GBM) remains at 12-14 months [1-3]. GBM is associated with high levels of angiogenesis and has increased expression of angiogenic factors and irregular extensive vascular proliferation. Vascular endo-thelial growth factor (VEGF) is the central factor in regulating GBM neovascularization [4]. High VEGF expression could cause proliferation and growth of endothelial cells, which is associated
with hypoxia and necrosis in glioma [5, 6]. And these factors can promote tumor angiogenesis and progression [7].
Antiangiogenic therapy is the focus of glioma therapeutic development in recent years. Strategies that inhibit VEGF have been explored the most [4]. Bevacizumab is a humanized monoclonal antibody and it could specifically bind to the VEGF-A isoform. Although bevaci-zumab was initially approved by the FDA for treatment of metastatic colorectal cancer, its potential for widespread use in other tumor types still need further investigation. Bevaci- zumab have been approved for use in recurrent and newly diagnosed GBM and promising
Bevacizumab and glioma
14233 Int J Clin Exp Med 2017;10(10):14232-14243
results have been obtained with the treatment of brain tumor patients [8-12]. However, bevaci-zumab could reduce vascular permeability and temporally reverse abnormal capillary leakage. The transient vascular normalization restricts further drugs penetration into brain parenchy-ma and reduces therapy effect on glioma [13, 14]. The mechanism to this phenomenon still needs further investigation.
Magnetic resonance imaging (MRI) plays a major role in management of brain tumors, pro-viding a noninvasive strategy to characterize cellular and vascular properties of tumors in addition to response assessment following treatment [15-17]. Clinical studies have a limi-tation that they could not acquire repeat multi-ple biopsies before and after treatment in a same patient. Therefore, preclinical studies have an advantage of making direct compari-son between tumor correlative pathology and MRI parameters before and after bevacizumab treatment. So, quantitative longitudinal MRI measures of tumor volume, apparent diffusion coefficient (ADC) and vascular responses would show a comprehensive evaluation of glioma response to bevacizumab therapy.
In this study, we applied bevacizumab to treat U87 intracranial xenografts. Then, we obtained several noninvasive MRI parameters for the assessment of glioma response to bevacizum-ab. Furthermore, we investigated the possible mechanism involved in the changes of MRI parameters after bevacizumab therapy.
Materials and methods
Cell culture
Human glioma U87MG cell line was obtained from the Type Culture Collection of the Chinese Academy of Sciences (Shanghai, PR China). Cells were grown in MEM with Earle Salts and L-glutamine (MEM 1*Mediatech, Inc.) supple-mented with 10% fetal bovine serum (Hyclone, Logan, AR), 0.1 mmol/L MEM-nonessential amino acids, 2 mM/L sodium pyruvate and penicillin-streptomycin (Hyclone, Logan, AR). The cells were grown at 37°C in a humidified atmosphere containing 95% air and 5% CO2.
Orthotopic GBM xenograft model
BALB/c nude mice (male, 5-6 weeks old) were supplied by the Department of Experimental
Animals (Daping Hospital, Third Military Medi- cal University, PR China). All animal experi-ments were carried out according to institution-al Animal Care Committee guidelines. Ortho- topic GBM models were established by intrace-rebral implantation of U87MG cells. Mice were anesthetized and placed in a stereotaxic appa-ratus. Then, 1 × 10⁶ U87MG cells suspended in 5 μL of PBS were injected into the right striatum region (2.5 mm behind the bregma, 2.0 mm lat-eral and 3.75 mm deep) of mouse with a micro-injector. The injection was given slowly over a period of 5 min. Then the needle was kept in for 5 min and slowly withdrawn [18]. Two weeks after U87 cell implantation, the mice were pre-pared for experiments. All of the procedures were performed in accordance with the approv-al of the Institutional Review Board of the Hospital. All animals received care in accor-dance with the Guide for the Care and Use of Laboratory Animals.
Anti-angiogenic therapy
Forty-two glioma-bearing mice were random-ized into bevacizumab group and the control group. In bevacizumab group, bevacizumab (15 mg/kg) was injected in a single dose via the tail vein after U87 cell implantation for 14 days. And in control group, PBS was injected via the tail vein instead of bevacizumab.
Magnetic resonance imaging
The animals (n = 6 for each group) were per-formed MRI with a Bruker BioSpec 7T/20 cm system (Bruker, Ettlingen, Germany), using a head surface coil. During all MRI procedures, animals were anesthetized with a 1-2% isofluor-ane/air mixture. T2-weighted image (T2WI) was used to detect tumor volume changes at days 14, 17, 21 after intracranial tumor cell implan-tation. Other MRI parameters were used to detect real-time changes in physiological prop-erties of tumor at days 14 and 17 after tumor cell implantation. The sequences used in this study were as follows: 1): T2WI: repetition time = 4000 ms, echo time = 45 ms, field of view = 25 mm × 25 mm, slice thickness = 0.8 mm, NEX = 4, flip angle = 90°; 2) T1 RARE: repetition time = 1000 ms, echo time = 8 ms, field of view = 25 mm × 25 mm, slice thickness = 0.8 mm, NEX = 4, flip angle = 90°; Diffusion weighted image (DWI): (TR = 4000 ms; TE = 30 ms; field
Bevacizumab and glioma
14234 Int J Clin Exp Med 2017;10(10):14232-14243
of view = 25 mm × 25 mm; b-values = 29, 816 and 1199).
The mice were performed by dynamic contrast-enhanced-MRI (DCE-MRI) to evaluate tumor vessel permeability. To generate T1 maps from precontrast images, DCE FLASH images with multiple flip angles of 10°, 20°, 30°, 40° and 45° were acquired. The following parameters were used to acquire the DCE FLASH images: TR = 70 ms, TE = 1.8 ms using a 256 × 256 matrix, FOV = 25 mm × 25 mm, and NEX = 1. Acquisition of DCE FLASH images started before the administration of contrast to have baseline T1 signals. When the third dynamic loop finished, 0.5 mmol/mL Omniscan (GE Healthcare, Cork, Ireland) was administered at
value of tumor, as compared with contralateral normal brain region, was calculated based on evidence of improved motion sensitivity. For contrast enhancement analysis, the maximal tumor section was selected and three regions of interest (3 mm × 3 mm) were outlined inside the tumor region. The percentage change in contrast enhancement of the tumor on T1- weighted (T1w) + contrast images was normal-ized to contralateral normal brain region. Contrast enhancement regions that were over-lapping with ventricles would be excluded.
Immunohistochemistry
Mice (n = 6 for each group) were sacrificed by an overdose of chloral hydrate. The brains were
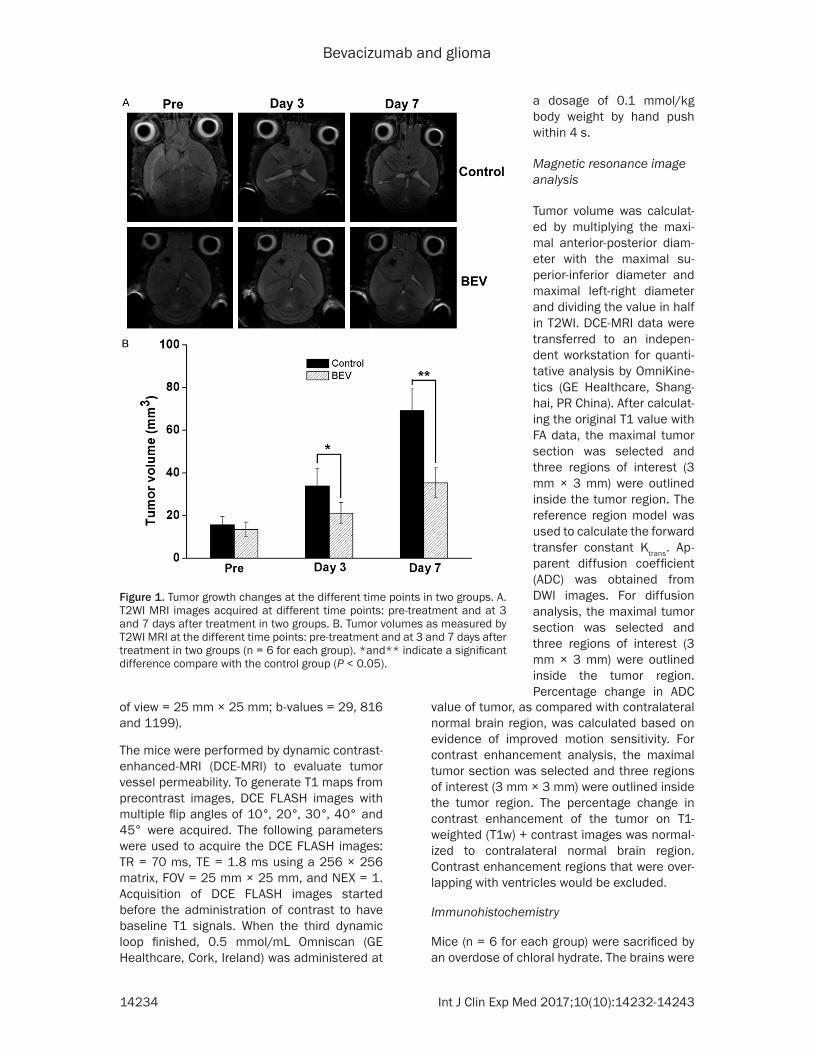
Figure 1. Tumor growth changes at the different time points in two groups. A. T2WI MRI images acquired at different time points: pre-treatment and at 3 and 7 days after treatment in two groups. B. Tumor volumes as measured by T2WI MRI at the different time points: pre-treatment and at 3 and 7 days after treatment in two groups (n = 6 for each group). *and** indicate a significant difference compare with the control group (P < 0.05).
a dosage of 0.1 mmol/kg body weight by hand push within 4 s.
Magnetic resonance image analysis
Tumor volume was calculat-ed by multiplying the maxi-mal anterior-posterior diam-eter with the maximal su- perior-inferior diameter and maximal left-right diameter and dividing the value in half in T2WI. DCE-MRI data were transferred to an indepen-dent workstation for quanti-tative analysis by OmniKine- tics (GE Healthcare, Shang- hai, PR China). After calculat-ing the original T1 value with FA data, the maximal tumor section was selected and three regions of interest (3 mm × 3 mm) were outlined inside the tumor region. The reference region model was used to calculate the forward transfer constant Ktrans. Ap- parent diffusion coefficient (ADC) was obtained from DWI images. For diffusion analysis, the maximal tumor section was selected and three regions of interest (3 mm × 3 mm) were outlined inside the tumor region. Percentage change in ADC
Bevacizumab and glioma
14235 Int J Clin Exp Med 2017;10(10):14232-14243
extracted from skull after perfusion with 150 mL heparinized saline and then 150 mL 4% paraformaldehyde. Then put the brains into fix-ative for one week and immersed them in 30% sucrose solution with PBS for 4 days. Coronal sections were serially cut into pieces at a thick-ness of 6 μm on cryostat and at intervals of 0.8 mm on a cryostat. Before immuno-staining, they were rehydrated in PBS. Then they were incubated of a 0.3% H2O2/methonal solution for 10 min at room temperature so that endog-enous peroxidase activity was inactivated. The next step was to wash and block the sections by using normal goat serum. Then, the sections were incubated with primary antibody at 4°C overnight. Anti-human primary antibody includ-ed anti-CD34 (Millipore, CA, USA; 1:100 dilu-tion), anti-Ki67 (Millipore, CA, USA; 1:50 dilu-tion), anti-occludin (Abcam, Cambridge, UK; 1:50 dilution) and anti-claudin-5 (Abcam, Cambridge, UK; 1:50 dilution). Negative con-trols were conducted by PBS instead of primary antibody. Other procedures were performed according to the immunohistochemistry stan-dard procedures. For semi-quantitative mea-surements of claudin-5 and occludin, the slides were photographed and the mean optical den-sity values were analyzed by using a image ana-lyzing system (Motic Images Advanced 3.2). CD34-positive folds across the lumens of newly formed blood vessels were the key feature of intussusceptive microvascular growth (IMG).
The numbers of folds in 20 cases of intussus-ceptive microvascular growth were counted under light microscopy. The average number of folds across the lumens in 20 cases was regarded as the number of intussusceptive microvascular growth in tumor. Ten fields were randomly selected under a 400 × light micro-scope and Ki67 positive cells were counted. The average number of Ki67 positive cells per 400 × field was determined for the entire area of each tumor.
Transmission electron microscopy (TEM) analysis
Mice (n = 6 for each group) were sacrificed by an overdose of chloral hydrate. Then, they were perfused with 150 ml heparinized saline and 150 ml fixative (4% paraformaldehyde). The tumor tissues were obtained and divided into some pieces of 1 mm3, which were fixed with 2.5% glutaraldehyde-4% paraformaldehyde for several days at 4°C. After that, according to the standard procedures, semi-thin and ultra-thin sections were made and stained with uranyl acetate and lead citrate, and the changes of tight junction were examined by TEM. All exami-nation procedures by TEM were assigned to use a double-blind method to measure tight junction changes.
Statistical analysis
All data are expressed as mean ± standard deviation values. Student’s t-test was per-formed to determine the significant difference between two groups. Spearman correlation analysis was used to compare the correlation between Ktrans value and IMG, T1 + contrast and tight junction proteins expression, ADC value and Ki67 positive cells. A P value < 0.05 was deemed statistical difference. All data were analyzed using SPSS 18.0 software.
Results
Tumor growth in response to bevacizumab therapy
T2WI MRI showed that all tumors were still growing in size within 7 days after treatment in two groups. However, treatment with bevaci-zumab reduced the growth rate of GBM xeno-grafts compared with the control group (P < 0.05) (Figure 1B). This suggested bevacizumab
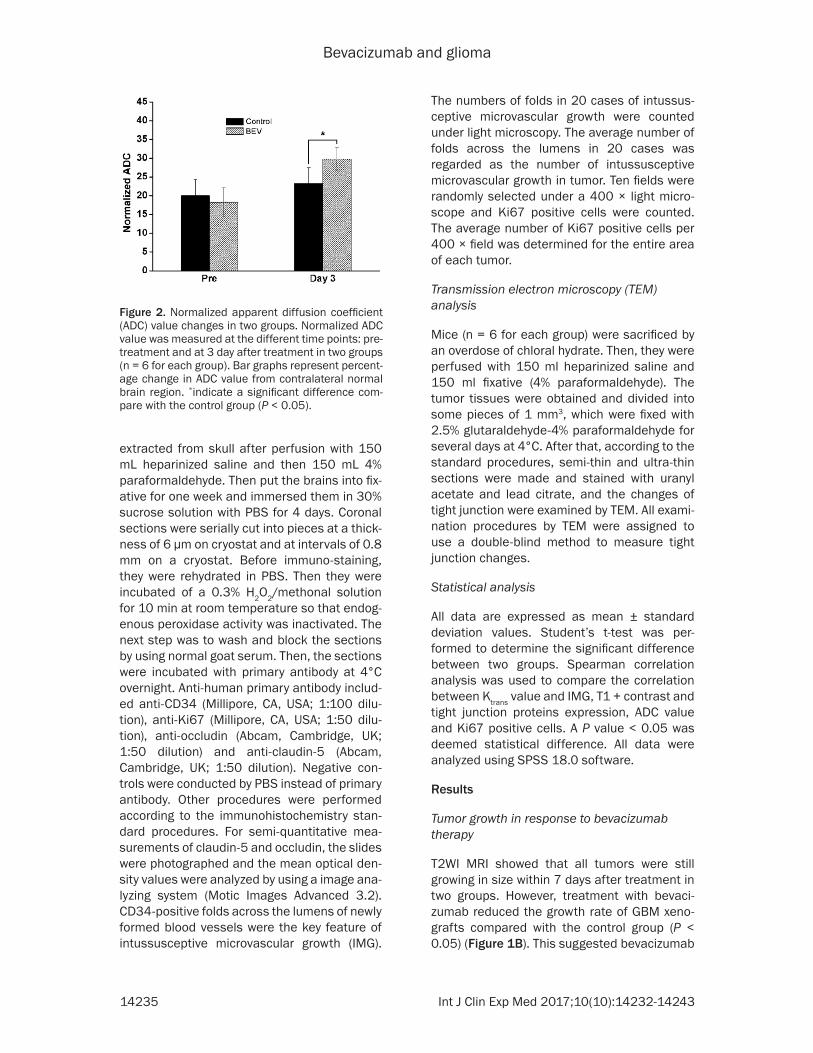
Figure 2. Normalized apparent diffusion coefficient (ADC) value changes in two groups. Normalized ADC value was measured at the different time points: pre-treatment and at 3 day after treatment in two groups (n = 6 for each group). Bar graphs represent percent-age change in ADC value from contralateral normal brain region. *indicate a significant difference com-pare with the control group (P < 0.05).
Bevacizumab and glioma
14236 Int J Clin Exp Med 2017;10(10):14232-14243
had a potent anti-tumor activity. Furthermore, in bevacizumab group, the MRI feature of tumors in T2WI showed distinct differences compared with control group in which tumors became more heterogeneous on the T2WI and this might be associated with necrosis (Figure 1A).
ADC and Ki67 expression changes in glioma
At 14 days post-implantation, normalized base-line ADC values were similar for all groups high-er than contralateral brain parenchyma. ADC values were still rising within 3 days after treat-ment in two groups. However, the magnitude of ADC rise was greater in bevacizumab group (29.8 ± 3.9) compared with the control group (23.3 ± 4.2) (P < 0.05) (Figure 2).
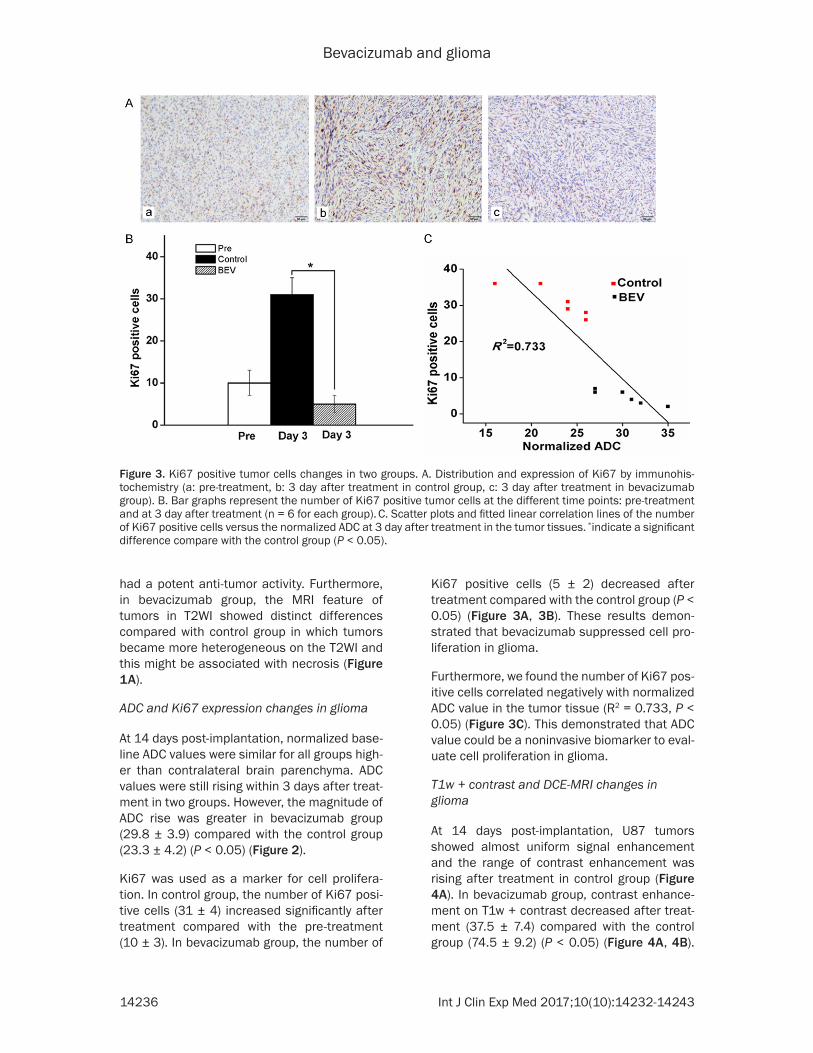
Ki67 was used as a marker for cell prolifera-tion. In control group, the number of Ki67 posi-tive cells (31 ± 4) increased significantly after treatment compared with the pre-treatment (10 ± 3). In bevacizumab group, the number of
Ki67 positive cells (5 ± 2) decreased after treatment compared with the control group (P < 0.05) (Figure 3A, 3B). These results demon-strated that bevacizumab suppressed cell pro-liferation in glioma.
Furthermore, we found the number of Ki67 pos-itive cells correlated negatively with normalized ADC value in the tumor tissue (R2 = 0.733, P < 0.05) (Figure 3C). This demonstrated that ADC value could be a noninvasive biomarker to eval-uate cell proliferation in glioma.
T1w + contrast and DCE-MRI changes in glioma
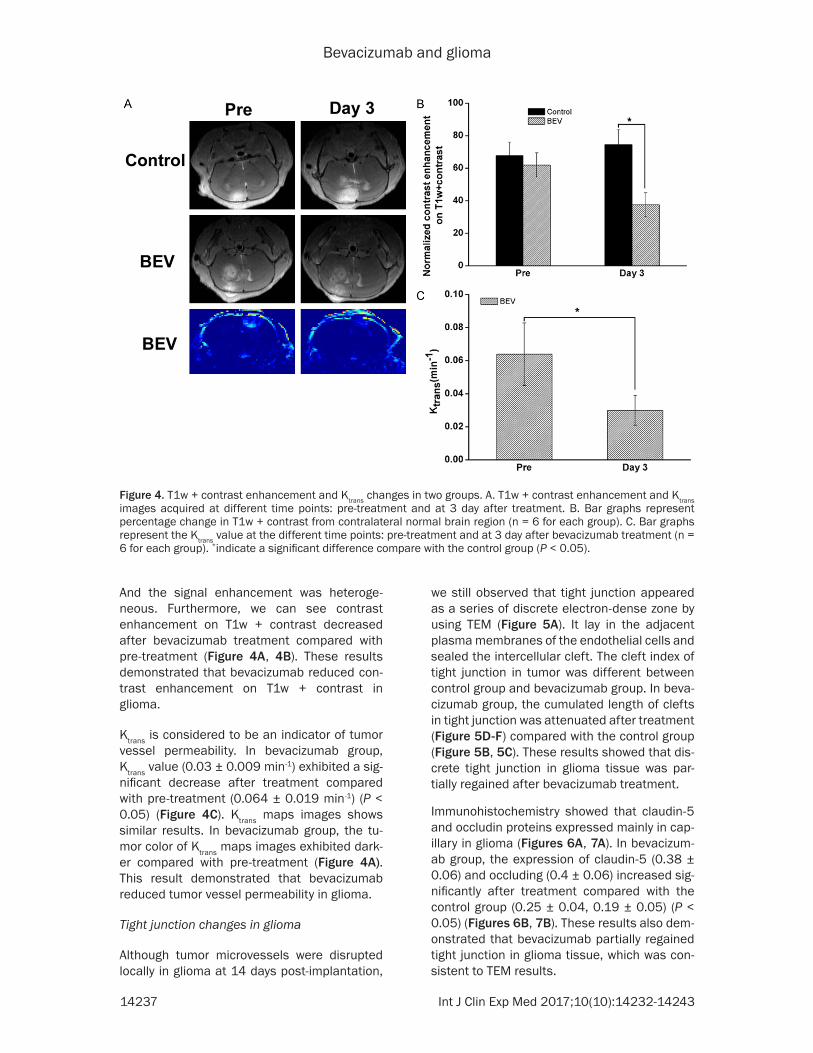
At 14 days post-implantation, U87 tumors showed almost uniform signal enhancement and the range of contrast enhancement was rising after treatment in control group (Figure 4A). In bevacizumab group, contrast enhance-ment on T1w + contrast decreased after treat-ment (37.5 ± 7.4) compared with the control group (74.5 ± 9.2) (P < 0.05) (Figure 4A, 4B).
Figure 3. Ki67 positive tumor cells changes in two groups. A. Distribution and expression of Ki67 by immunohis-tochemistry (a: pre-treatment, b: 3 day after treatment in control group, c: 3 day after treatment in bevacizumab group). B. Bar graphs represent the number of Ki67 positive tumor cells at the different time points: pre-treatment and at 3 day after treatment (n = 6 for each group). C. Scatter plots and fitted linear correlation lines of the number of Ki67 positive cells versus the normalized ADC at 3 day after treatment in the tumor tissues. *indicate a significant difference compare with the control group (P < 0.05).
Bevacizumab and glioma
14237 Int J Clin Exp Med 2017;10(10):14232-14243
And the signal enhancement was heteroge-neous. Furthermore, we can see contrast enhancement on T1w + contrast decreased after bevacizumab treatment compared with pre-treatment (Figure 4A, 4B). These results demonstrated that bevacizumab reduced con-trast enhancement on T1w + contrast in glioma.
Ktrans is considered to be an indicator of tumor vessel permeability. In bevacizumab group, Ktrans value (0.03 ± 0.009 min-1) exhibited a sig-nificant decrease after treatment compared with pre-treatment (0.064 ± 0.019 min-1) (P < 0.05) (Figure 4C). Ktrans maps images shows similar results. In bevacizumab group, the tu- mor color of Ktrans maps images exhibited dark-er compared with pre-treatment (Figure 4A). This result demonstrated that bevacizumab reduced tumor vessel permeability in glioma.
Tight junction changes in glioma
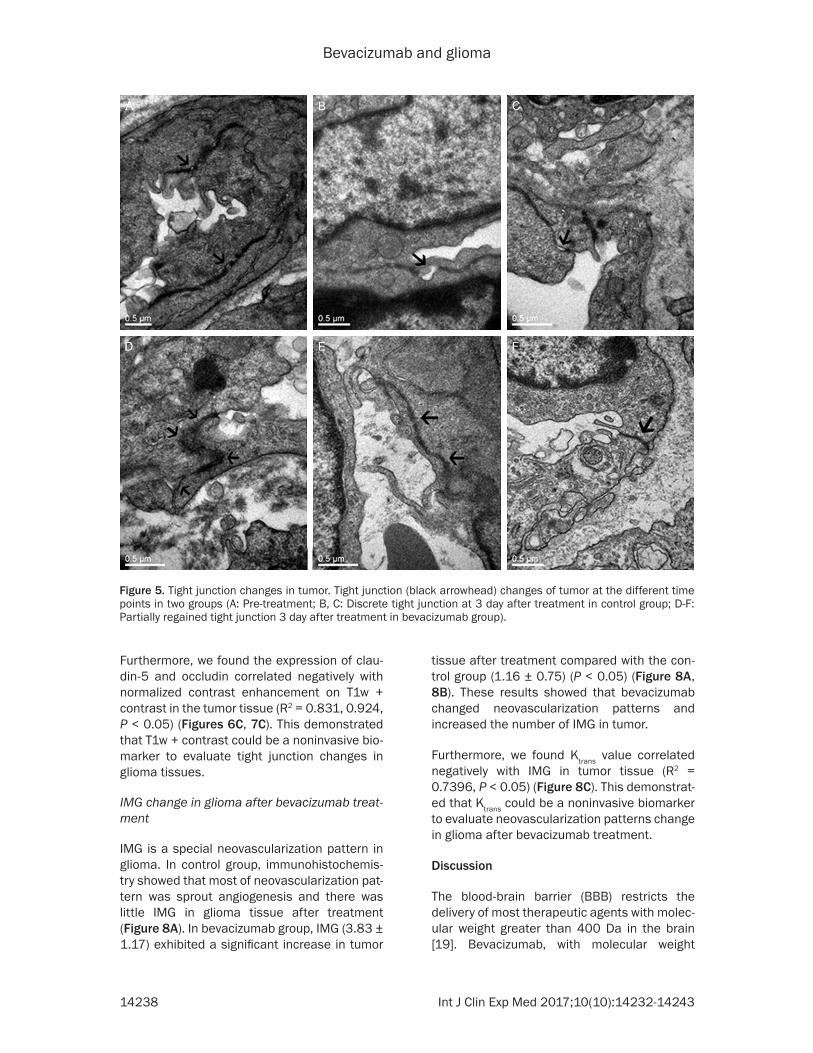
Although tumor microvessels were disrupted locally in glioma at 14 days post-implantation,
we still observed that tight junction appeared as a series of discrete electron-dense zone by using TEM (Figure 5A). It lay in the adjacent plasma membranes of the endothelial cells and sealed the intercellular cleft. The cleft index of tight junction in tumor was different between control group and bevacizumab group. In beva-cizumab group, the cumulated length of clefts in tight junction was attenuated after treatment (Figure 5D-F) compared with the control group (Figure 5B, 5C). These results showed that dis-crete tight junction in glioma tissue was par-tially regained after bevacizumab treatment.
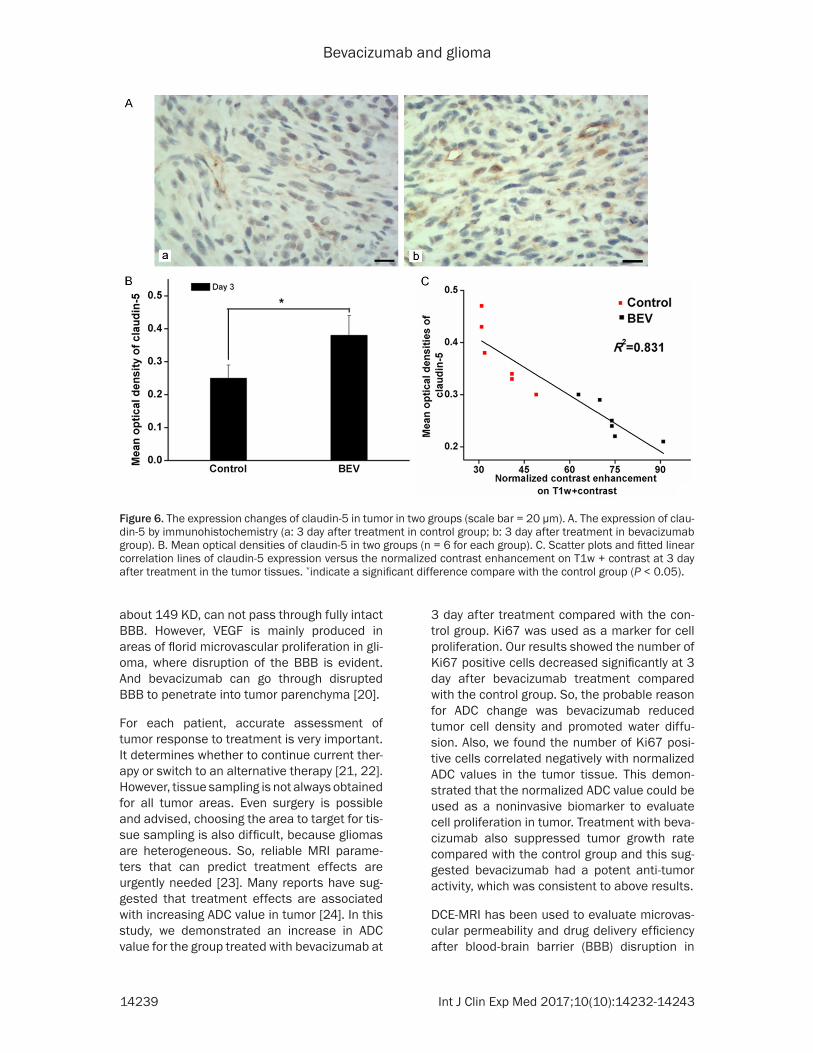
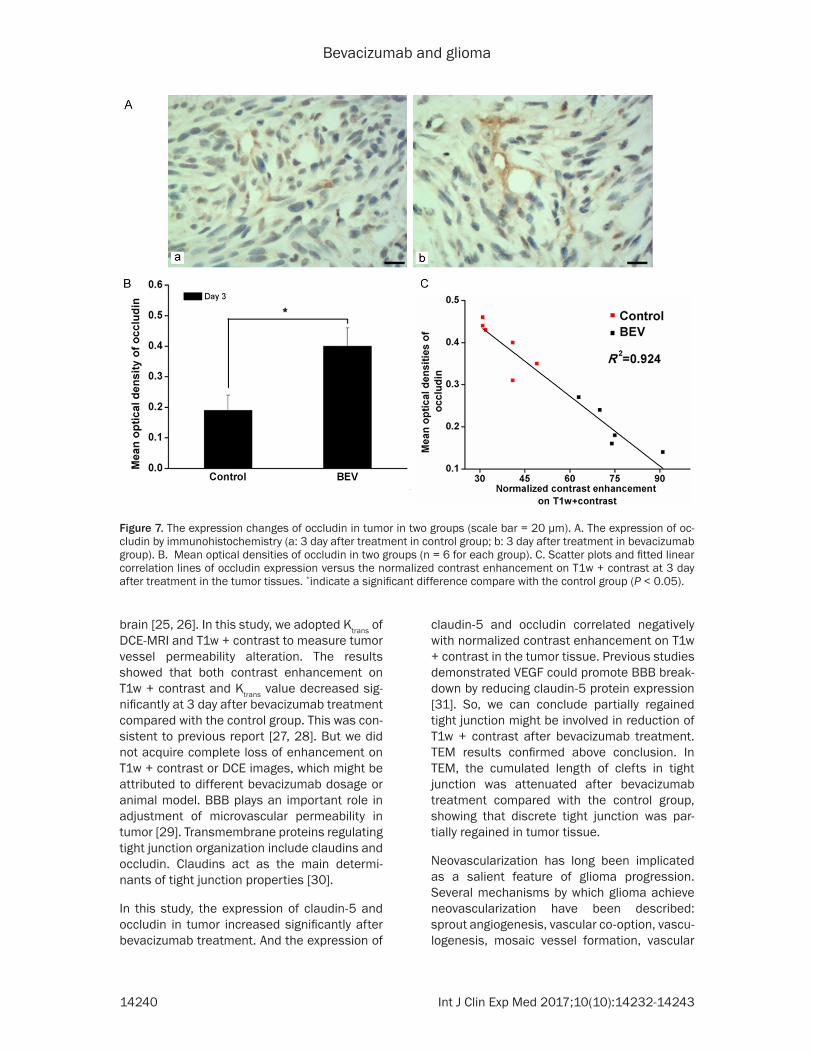
Immunohistochemistry showed that claudin-5 and occludin proteins expressed mainly in cap-illary in glioma (Figures 6A, 7A). In bevacizum-ab group, the expression of claudin-5 (0.38 ± 0.06) and occluding (0.4 ± 0.06) increased sig-nificantly after treatment compared with the control group (0.25 ± 0.04, 0.19 ± 0.05) (P < 0.05) (Figures 6B, 7B). These results also dem-onstrated that bevacizumab partially regained tight junction in glioma tissue, which was con-sistent to TEM results.
Figure 4. T1w + contrast enhancement and Ktrans changes in two groups. A. T1w + contrast enhancement and Ktrans images acquired at different time points: pre-treatment and at 3 day after treatment. B. Bar graphs represent percentage change in T1w + contrast from contralateral normal brain region (n = 6 for each group). C. Bar graphs represent the Ktrans value at the different time points: pre-treatment and at 3 day after bevacizumab treatment (n = 6 for each group). *indicate a significant difference compare with the control group (P < 0.05).
Bevacizumab and glioma
14238 Int J Clin Exp Med 2017;10(10):14232-14243
Furthermore, we found the expression of clau-din-5 and occludin correlated negatively with normalized contrast enhancement on T1w + contrast in the tumor tissue (R2 = 0.831, 0.924, P < 0.05) (Figures 6C, 7C). This demonstrated that T1w + contrast could be a noninvasive bio-marker to evaluate tight junction changes in glioma tissues.
IMG change in glioma after bevacizumab treat-ment
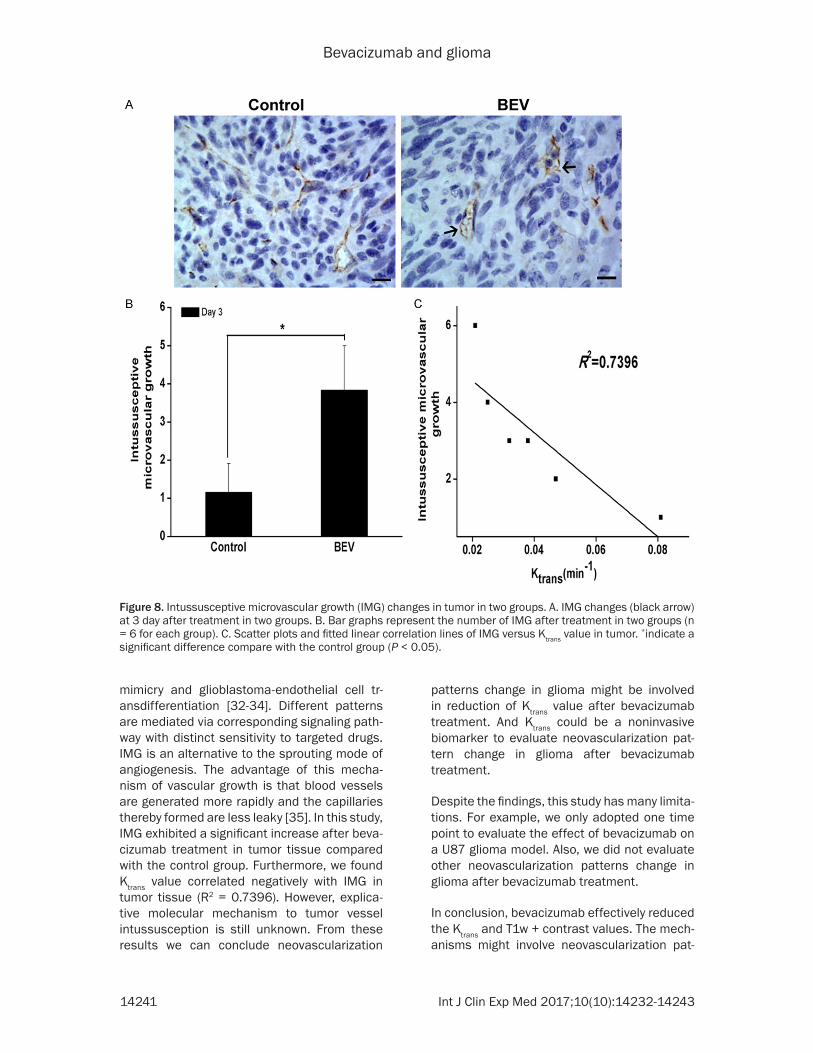
IMG is a special neovascularization pattern in glioma. In control group, immunohistochemis-try showed that most of neovascularization pat-tern was sprout angiogenesis and there was little IMG in glioma tissue after treatment (Figure 8A). In bevacizumab group, IMG (3.83 ± 1.17) exhibited a significant increase in tumor
tissue after treatment compared with the con-trol group (1.16 ± 0.75) (P < 0.05) (Figure 8A, 8B). These results showed that bevacizumab changed neovascularization patterns and increased the number of IMG in tumor.
Furthermore, we found Ktrans value correlated negatively with IMG in tumor tissue (R2 = 0.7396, P < 0.05) (Figure 8C). This demonstrat-ed that Ktrans could be a noninvasive biomarker to evaluate neovascularization patterns change in glioma after bevacizumab treatment.
Discussion
The blood-brain barrier (BBB) restricts the delivery of most therapeutic agents with molec-ular weight greater than 400 Da in the brain [19]. Bevacizumab, with molecular weight
Figure 5. Tight junction changes in tumor. Tight junction (black arrowhead) changes of tumor at the different time points in two groups (A: Pre-treatment; B, C: Discrete tight junction at 3 day after treatment in control group; D-F: Partially regained tight junction 3 day after treatment in bevacizumab group).
Bevacizumab and glioma
14239 Int J Clin Exp Med 2017;10(10):14232-14243
about 149 KD, can not pass through fully intact BBB. However, VEGF is mainly produced in areas of florid microvascular proliferation in gli-oma, where disruption of the BBB is evident. And bevacizumab can go through disrupted BBB to penetrate into tumor parenchyma [20].
For each patient, accurate assessment of tumor response to treatment is very important. It determines whether to continue current ther-apy or switch to an alternative therapy [21, 22]. However, tissue sampling is not always obtained for all tumor areas. Even surgery is possible and advised, choosing the area to target for tis-sue sampling is also difficult, because gliomas are heterogeneous. So, reliable MRI parame-ters that can predict treatment effects are urgently needed [23]. Many reports have sug-gested that treatment effects are associated with increasing ADC value in tumor [24]. In this study, we demonstrated an increase in ADC value for the group treated with bevacizumab at
3 day after treatment compared with the con-trol group. Ki67 was used as a marker for cell proliferation. Our results showed the number of Ki67 positive cells decreased significantly at 3 day after bevacizumab treatment compared with the control group. So, the probable reason for ADC change was bevacizumab reduced tumor cell density and promoted water diffu-sion. Also, we found the number of Ki67 posi-tive cells correlated negatively with normalized ADC values in the tumor tissue. This demon-strated that the normalized ADC value could be used as a noninvasive biomarker to evaluate cell proliferation in tumor. Treatment with beva-cizumab also suppressed tumor growth rate compared with the control group and this sug-gested bevacizumab had a potent anti-tumor activity, which was consistent to above results.
DCE-MRI has been used to evaluate microvas-cular permeability and drug delivery efficiency after blood-brain barrier (BBB) disruption in
Figure 6. The expression changes of claudin-5 in tumor in two groups (scale bar = 20 µm). A. The expression of clau-din-5 by immunohistochemistry (a: 3 day after treatment in control group; b: 3 day after treatment in bevacizumab group). B. Mean optical densities of claudin-5 in two groups (n = 6 for each group). C. Scatter plots and fitted linear correlation lines of claudin-5 expression versus the normalized contrast enhancement on T1w + contrast at 3 day after treatment in the tumor tissues. *indicate a significant difference compare with the control group (P < 0.05).
Bevacizumab and glioma
14240 Int J Clin Exp Med 2017;10(10):14232-14243
brain [25, 26]. In this study, we adopted Ktrans of DCE-MRI and T1w + contrast to measure tumor vessel permeability alteration. The results showed that both contrast enhancement on T1w + contrast and Ktrans value decreased sig-nificantly at 3 day after bevacizumab treatment compared with the control group. This was con-sistent to previous report [27, 28]. But we did not acquire complete loss of enhancement on T1w + contrast or DCE images, which might be attributed to different bevacizumab dosage or animal model. BBB plays an important role in adjustment of microvascular permeability in tumor [29]. Transmembrane proteins regulating tight junction organization include claudins and occludin. Claudins act as the main determi-nants of tight junction properties [30].
In this study, the expression of claudin-5 and occludin in tumor increased significantly after bevacizumab treatment. And the expression of
claudin-5 and occludin correlated negatively with normalized contrast enhancement on T1w + contrast in the tumor tissue. Previous studies demonstrated VEGF could promote BBB break-down by reducing claudin-5 protein expression [31]. So, we can conclude partially regained tight junction might be involved in reduction of T1w + contrast after bevacizumab treatment. TEM results confirmed above conclusion. In TEM, the cumulated length of clefts in tight junction was attenuated after bevacizumab treatment compared with the control group, showing that discrete tight junction was par-tially regained in tumor tissue.
Neovascularization has long been implicated as a salient feature of glioma progression. Several mechanisms by which glioma achieve neovascularization have been described: sprout angiogenesis, vascular co-option, vascu-logenesis, mosaic vessel formation, vascular
Figure 7. The expression changes of occludin in tumor in two groups (scale bar = 20 µm). A. The expression of oc-cludin by immunohistochemistry (a: 3 day after treatment in control group; b: 3 day after treatment in bevacizumab group). B. Mean optical densities of occludin in two groups (n = 6 for each group). C. Scatter plots and fitted linear correlation lines of occludin expression versus the normalized contrast enhancement on T1w + contrast at 3 day after treatment in the tumor tissues. *indicate a significant difference compare with the control group (P < 0.05).
Bevacizumab and glioma
14241 Int J Clin Exp Med 2017;10(10):14232-14243
mimicry and glioblastoma-endothelial cell tr- ansdifferentiation [32-34]. Different patterns are mediated via corresponding signaling path-way with distinct sensitivity to targeted drugs. IMG is an alternative to the sprouting mode of angiogenesis. The advantage of this mecha-nism of vascular growth is that blood vessels are generated more rapidly and the capillaries thereby formed are less leaky [35]. In this study, IMG exhibited a significant increase after beva-cizumab treatment in tumor tissue compared with the control group. Furthermore, we found Ktrans value correlated negatively with IMG in tumor tissue (R2 = 0.7396). However, explica-tive molecular mechanism to tumor vessel intussusception is still unknown. From these results we can conclude neovascularization
patterns change in glioma might be involved in reduction of Ktrans value after bevacizumab treatment. And Ktrans could be a noninvasive biomarker to evaluate neovascularization pat-tern change in glioma after bevacizumab treatment.
Despite the findings, this study has many limita-tions. For example, we only adopted one time point to evaluate the effect of bevacizumab on a U87 glioma model. Also, we did not evaluate other neovascularization patterns change in glioma after bevacizumab treatment.
In conclusion, bevacizumab effectively reduced the Ktrans and T1w + contrast values. The mech-anisms might involve neovascularization pat-
Figure 8. Intussusceptive microvascular growth (IMG) changes in tumor in two groups. A. IMG changes (black arrow) at 3 day after treatment in two groups. B. Bar graphs represent the number of IMG after treatment in two groups (n = 6 for each group). C. Scatter plots and fitted linear correlation lines of IMG versus Ktrans value in tumor. *indicate a significant difference compare with the control group (P < 0.05).
Bevacizumab and glioma
14242 Int J Clin Exp Med 2017;10(10):14232-14243
tern change and reformation of tight junction. And ADC, Ktrans and T1w + contrast might be noninvasive biomarkers to predict cell prolifera-tion, neovascularization pattern and tight junc-tion change in a U87 glioma model. These find-ings might provide some new guidance to glioma therapy.
Acknowledgements
Funding was partially received from the National Natural Science Foundation of China (Grant No. 81571660), the Natural Science Foundation of Chongqing (Grant No. cstc2013jcyjA10106) and Chongqing Science and Technology R&D Base Construction (International Cooperation) Project (No. cstc2014gjhz110002).
Disclosure of conflict of interest
None.
Address correspondence to: Weiguo Zhang, Depart- ment of Radiology, Research Institute of Surgery, Daping Hospital, Third Military Medical University, 10th Changjiang Road, Yuzhong District, Chongqing 400042, China. E-mail: [email protected]
References
[1] Huse JT and Holland EC. Targeting brain can-cer: advances in the molecular pathology of malignant glioma and medulloblastoma. Nat Rev Cancer 2010; 10: 319-331.
[2] Nieder C, Mehta MP and Jalali R. Combined radio- and chemotherapy of brain tumours in adult patients. Clin Oncol (R Coll Radiol) 2009; 21: 515-524.
[3] Wen PY and Kesari S. Malignant gliomas in adults. N Engl J Med 2008; 359: 492-507.
[4] Argyriou AA, Giannopoulou E and Kalofonos HP. Angiogenesis and anti-angiogenic molecu-larly targeted therapies in malignant gliomas. Oncology 2009; 77: 1-11.
[5] Norden AD, Drappatz J and Wen PY. Antiangio-genic therapies for high-grade glioma. Nat Rev Neurol 2009; 5: 610-620.
[6] Shweiki D, Itin A, Soffer D and Keshet E. Vascu-lar endothelial growth factor induced by hypox-ia may mediate hypoxia-initiated angiogenesis. Nature 1992; 359: 843-845.
[7] Jain RK, Duda DG, Clark JW and Loeffler JS. Lessons from phase III clinical trials on anti-VEGF therapy for cancer. Nat Clin Pract Oncol 2006; 3: 24-40.
[8] Friedman HS, Prados MD, Wen PY, Mikkelsen T, Schiff D, Abrey LE, Yung WK, Paleologos N, Nicholas MK, Jensen R, Vredenburgh J, Huang
J, Zheng M and Cloughesy T. Bevacizumab alone and in combination with irinotecan in re-current glioblastoma. J Clin Oncol 2009; 27: 4733-4740.
[9] Vredenburgh JJ, Desjardins A, Herndon JE 2nd, Dowell JM, Reardon DA, Quinn JA, Rich JN, Sa-thornsumetee S, Gururangan S, Wagner M, Bigner DD, Friedman AH and Friedman HS. Phase II trial of bevacizumab and irinotecan in recurrent malignant glioma. Clin Cancer Res 2007; 13: 1253-1259.
[10] Jakobsen JN, Hasselbalch B, Stockhausen MT, Lassen U and Poulsen HS. Irinotecan and bev-acizumab in recurrent glioblastoma multi-forme. Expert Opin Pharmacother 2011; 12: 825-833.
[11] Odia Y, Iwamoto FM, Moustakas A, Fraum TJ, Salgado CA, Li A, Kreisl TN, Sul J, Butman JA and Fine HA. A phase II trial of enzastaurin (LY317615) in combination with bevacizumab in adults with recurrent malignant gliomas. J Neurooncol 2016; 127: 127-135.
[12] Heiland DH, Masalha W, Franco P, Machein MR and Weyerbrock A. Progression-free and overall survival in patients with recurrent glio-blastoma multiforme treated with last-line bevacizumab versus bevacizumab/lomustine. J Neurooncol 2016; 126: 567-575.
[13] Taylor J and Gerstner ER. Anti-angiogenic ther-apy in high-grade glioma (treatment and toxic-ity). Curr Treat Options Neurol 2013; 15: 328-337.
[14] Sorensen AG, Emblem KE, Polaskova P, Jen-nings D, Kim H, Ancukiewicz M, Wang M, Wen PY, Ivy P, Batchelor TT and Jain RK. Increased survival of glioblastoma patients who respond to antiangiogenic therapy with elevated blood perfusion. Cancer Res 2012; 72: 402-407.
[15] Pope WB, Qiao XJ, Kim HJ, Lai A, Nghiemphu P, Xue X, Ellingson BM, Schiff D, Aregawi D, Cha S, Puduvalli VK, Wu J, Yung WK, Young GS, Vre-denburgh J, Barboriak D, Abrey LE, Mikkelsen T, Jain R, Paleologos NA, Rn PL, Prados M, Goldin J, Wen PY and Cloughesy T. Apparent diffusion coefficient histogram analysis strati-fies progression-free and overall survival in pa-tients with recurrent GBM treated with bevaci-zumab: a multi-center study. J Neurooncol 2012; 108: 491-498.
[16] Jenkinson MD, Du Plessis DG, Walker C and Smith TS. Advanced MRI in the management of adult gliomas. Br J Neurosurg 2007; 21: 550-561.
[17] Essock-Burns E, Lupo JM, Cha S, Polley MY, Bu-towski NA, Chang SM and Nelson SJ. Assess-ment of perfusion MRI-derived parameters in evaluating and predicting response to antian-giogenic therapy in patients with newly diag-
Bevacizumab and glioma
14243 Int J Clin Exp Med 2017;10(10):14232-14243
nosed glioblastoma. Neuro Oncol 2011; 13: 119-131.
[18] Liu H, Chen X, Xue W, Chu C, Liu Y, Tong H, Du X, Xie T, Liu G and Zhang W. Recombinant epi-dermal growth factor-like domain-1 from coag-ulation factor VII functionalized iron oxide nanoparticles for targeted glioma magnetic resonance imaging. Int J Nanomedicine 2016; 11: 5099-5108.
[19] Pardridge WM. Drug and gene delivery to the brain: the vascular route. Neuron 2002; 36: 555-558.
[20] van Tellingen O, Yetkin-Arik B, de Gooijer MC, Wesseling P, Wurdinger T and de Vries HE. Overcoming the blood-brain tumor barrier for effective glioblastoma treatment. Drug Resist Updat 2015; 19: 1-12.
[21] Brandes AA, Tosoni A, Spagnolli F, Frezza G, Leonardi M, Calbucci F and Franceschi E. Dis-ease progression or pseudoprogression after concomitant radiochemotherapy treatment: pitfalls in neurooncology. Neuro Oncol 2008; 10: 361-367.
[22] Clarke JL and Chang S. Pseudoprogression and pseudoresponse: challenges in brain tu-mor imaging. Curr Neurol Neurosci Rep 2009; 9: 241-246.
[23] Wen PY, Macdonald DR, Reardon DA, Clough-esy TF, Sorensen AG, Galanis E, Degroot J, Wick W, Gilbert MR, Lassman AB, Tsien C, Mik-kelsen T, Wong ET, Chamberlain MC, Stupp R, Lamborn KR, Vogelbaum MA, van den Bent MJ and Chang SM. Updated response assess-ment criteria for high-grade gliomas: response assessment in neuro-oncology working group. J Clin Oncol 2010; 28: 1963-1972.
[24] Morse DL, Galons JP, Payne CM, Jennings DL, Day S, Xia G and Gillies RJ. MRI-measured wa-ter mobility increases in response to chemo-therapy via multiple cell-death mechanisms. NMR Biomed 2007; 20: 602-614.
[25] Park J, Zhang Y, Vykhodtseva N, Jolesz FA and McDannold NJ. The kinetics of blood brain bar-rier permeability and targeted doxorubicin de-livery into brain induced by focused ultra-sound. J Control Release 2012; 162: 134-142.
[26] Thompson EM, Pishko GL, Muldoon LL and Neuwelt EA. Inhibition of SUR1 decreases the vascular permeability of cerebral metastases. Neoplasia 2013; 15: 535-543.
[27] de Groot JF, Lamborn KR, Chang SM, Gilbert MR, Cloughesy TF, Aldape K, Yao J, Jackson EF, Lieberman F, Robins HI, Mehta MP, Lassman AB, Deangelis LM, Yung WK, Chen A, Prados MD and Wen PY. Phase II study of aflibercept in recurrent malignant glioma: a North American brain tumor consortium study. J Clin Oncol 2011; 29: 2689-2695.
[28] Ellingson BM, Cloughesy TF, Lai A, Nghiemphu PL, Mischel PS and Pope WB. Quantitative vol-umetric analysis of conventional MRI response in recurrent glioblastoma treated with bevaci-zumab. Neuro Oncol 2011; 13: 401-409.
[29] Pardridge WM. Blood-brain barrier delivery. Drug Discov Today 2007; 12: 54-61.
[30] Li YN, Pan R, Qin XJ, Yang WL, Qi Z, Liu W and Liu KJ. Ischemic neurons activate astrocytes to disrupt endothelial barrier via increasing VEGF expression. J Neurochem 2014; 129: 120-129.
[31] Argaw AT, Gurfein BT, Zhang Y, Zameer A and John GR. VEGF-mediated disruption of endo-thelial CLN-5 promotes blood-brain barrier breakdown. Proc Natl Acad Sci U S A 2009; 106: 1977-1982.
[32] Jain RK and Carmeliet P. SnapShot: tumor angiogenesis. Cell 2012; 149: 1408-1408 e1401.
[33] Soda Y, Myskiw C, Rommel A and Verma IM. Mechanisms of neovascularization and resis-tance to anti-angiogenic therapies in glioblas-toma multiforme. J Mol Med (Berl) 2013; 91: 439-448.
[34] Chen X, Fang J, Wang S, Liu H, Du X, Chen J, Li X, Yang Y, Zhang B and Zhang W. A new mosaic pattern in glioma vascularization: exogenous endothelial progenitor cells integrating into the vessels containing tumor-derived endothelial cells. Oncotarget 2014; 5: 1955-1968.
[35] Ribatti D and Djonov V. Intussusceptive micro-vascular growth in tumors. Cancer Lett 2012; 316: 126-131.