Embed Size (px)
Citation preview
RESEARCH Open Access
Quantitative 3-tesla multiparametric MRI indifferentiation between renal cellcarcinoma subtypesAli Elsorougy1*, Hashim Farg1, Dalia Bayoumi2, Mohamed Abou El-Ghar1 and Magda Shady2
Abstract
Background: MRI provides several distinct quantitative parameters that may better differentiate renal cellcarcinoma (RCC) subtypes. The purpose of the study is to evaluate the diagnostic accuracy of apparent diffusioncoefficient (ADC), chemical shift signal intensity index (SII), and contrast enhancement in differentiation betweendifferent subtypes of renal cell carcinoma.
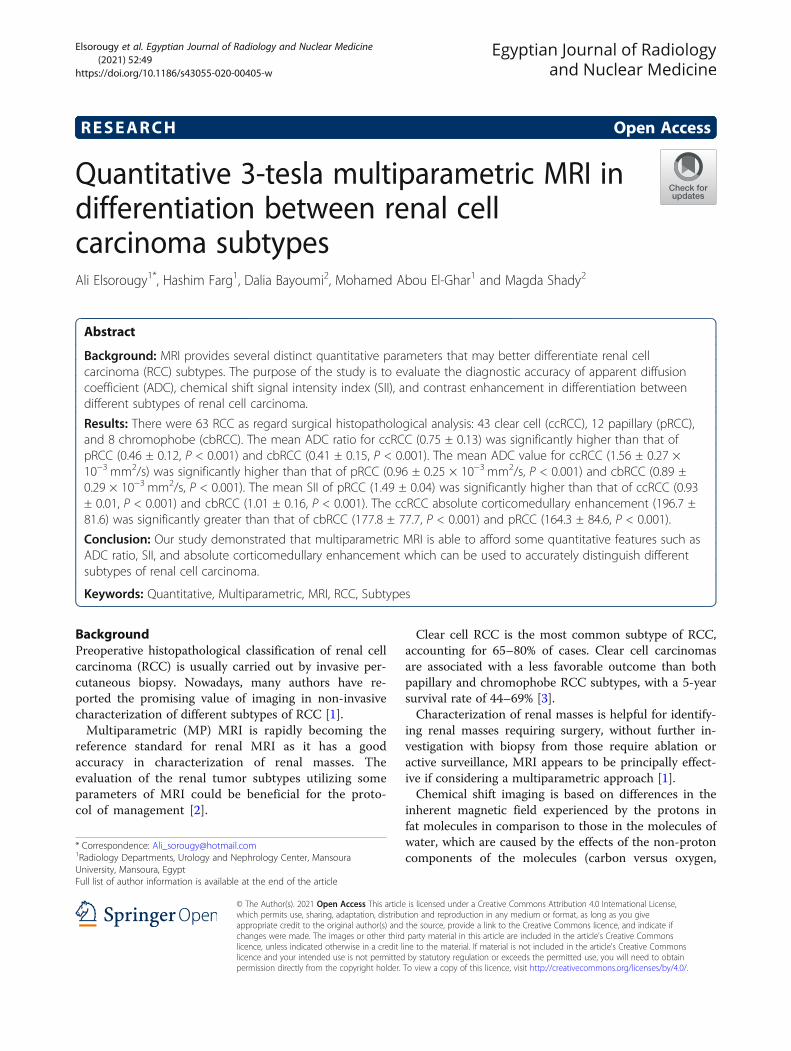
Results: There were 63 RCC as regard surgical histopathological analysis: 43 clear cell (ccRCC), 12 papillary (pRCC),and 8 chromophobe (cbRCC). The mean ADC ratio for ccRCC (0.75 ± 0.13) was significantly higher than that ofpRCC (0.46 ± 0.12, P < 0.001) and cbRCC (0.41 ± 0.15, P < 0.001). The mean ADC value for ccRCC (1.56 ± 0.27 ×10⁻³ mm2/s) was significantly higher than that of pRCC (0.96 ± 0.25 × 10⁻³ mm2/s, P < 0.001) and cbRCC (0.89 ±0.29 × 10⁻³ mm2/s, P < 0.001). The mean SII of pRCC (1.49 ± 0.04) was significantly higher than that of ccRCC (0.93± 0.01, P < 0.001) and cbRCC (1.01 ± 0.16, P < 0.001). The ccRCC absolute corticomedullary enhancement (196.7 ±81.6) was significantly greater than that of cbRCC (177.8 ± 77.7, P < 0.001) and pRCC (164.3 ± 84.6, P < 0.001).
Conclusion: Our study demonstrated that multiparametric MRI is able to afford some quantitative features such asADC ratio, SII, and absolute corticomedullary enhancement which can be used to accurately distinguish differentsubtypes of renal cell carcinoma.
Keywords: Quantitative, Multiparametric, MRI, RCC, Subtypes
BackgroundPreoperative histopathological classification of renal cellcarcinoma (RCC) is usually carried out by invasive per-cutaneous biopsy. Nowadays, many authors have re-ported the promising value of imaging in non-invasivecharacterization of different subtypes of RCC [1].Multiparametric (MP) MRI is rapidly becoming the
reference standard for renal MRI as it has a goodaccuracy in characterization of renal masses. Theevaluation of the renal tumor subtypes utilizing someparameters of MRI could be beneficial for the proto-col of management [2].
Clear cell RCC is the most common subtype of RCC,accounting for 65–80% of cases. Clear cell carcinomasare associated with a less favorable outcome than bothpapillary and chromophobe RCC subtypes, with a 5-yearsurvival rate of 44–69% [3].Characterization of renal masses is helpful for identify-
ing renal masses requiring surgery, without further in-vestigation with biopsy from those require ablation oractive surveillance, MRI appears to be principally effect-ive if considering a multiparametric approach [1].Chemical shift imaging is based on differences in the
inherent magnetic field experienced by the protons infat molecules in comparison to those in the molecules ofwater, which are caused by the effects of the non-protoncomponents of the molecules (carbon versus oxygen,
© The Author(s). 2021 Open Access This article is licensed under a Creative Commons Attribution 4.0 International License,which permits use, sharing, adaptation, distribution and reproduction in any medium or format, as long as you giveappropriate credit to the original author(s) and the source, provide a link to the Creative Commons licence, and indicate ifchanges were made. The images or other third party material in this article are included in the article's Creative Commonslicence, unless indicated otherwise in a credit line to the material. If material is not included in the article's Creative Commonslicence and your intended use is not permitted by statutory regulation or exceeds the permitted use, you will need to obtainpermission directly from the copyright holder. To view a copy of this licence, visit http://creativecommons.org/licenses/by/4.0/.
* Correspondence: [email protected] Departments, Urology and Nephrology Center, MansouraUniversity, Mansoura, EgyptFull list of author information is available at the end of the article
Egyptian Journal of Radiologyand Nuclear Medicine
Elsorougy et al. Egyptian Journal of Radiology and Nuclear Medicine (2021) 52:49 https://doi.org/10.1186/s43055-020-00405-w
respectively) on the electron cloud that surrounds theprotons [4, 5].Diffusion of tissues (Brownian motion) can be mea-
sured utilizing particularly designed DWI sequences.The SI in DWI depends on specific b operation factorand a specific factor concerning tissue, ADC [6]. The bvalue designates how much diffusion weighting is prac-tical. A low b value is related to high SI while a high bvalue designates an elevated level of contrast of the tis-sue. Masses with diffusion restriction appear hyperin-tense in DWI and of low SI in the ADC map [7].DWI allows for determination of renal masses whether
of cystic nature or solid depends on their degree ofwater movement restriction, which is useful in caseswith contrast injection contraindication. A mass that stillof high SI on images of high b value and of low ADCvalue is suggesting of solid component [8]. On the otherhand, hemorrhagic content of non-neoplastic nature in-side cystic lesion may show diffusion restriction. In spiteof some using the ADC values to differentiate betweenbenign and malignant lesions and RCC subtyping whichwas done by some authors [9], significant overlap inthese findings is present and DWI is not applied asdefinitive as DCE imaging [10].Dynamic contrast-enhanced MRI (DCE-MRI) is used
to assess contrast material kinetics within a tumor,reflecting the vascularity of the tissue [11].Enhancing pattern of a mass after the injection of con-
trast agent is the most beneficial tool to differentiatesolid and cystic masses [12]. Cystic mass pattern of en-hancement can discriminate solid components fromdebris. Post-contrast T1WI is useful in determination ofthe pattern of enhancement and its intensity, so thisplays useful differentiating role among the 3 commonRCC subtypes [13].The 3-tesla systems of MRI, phased array coils of
high-density, advanced sequences, like multi-echo Dixon
(mDIXON) affords high-quality images and perfectspatial-resolution. The 3 T machines provide benefit ofgreat signal-to-noise ratio, which is helpful in shorteningthe time acquisition and/or produce high resolution ofimages [14].We hypothesized that quantitative parameters of MRI
can accurately differentiate renal cell carcinomasubtypes. So, we conducted this study to assess the diag-nostic performance of apparent diffusion coefficient,chemical shift signal intensity index, and dynamic con-trast enhancement parameters in differentiation amongdifferent subtypes of renal cell carcinoma.
MethodsSubjectsThis prospective study was conducted upon 63 consecu-tive patients between October 2017 and October 2019.Patients were referred from the outpatient clinic of theUrology Department to our department of radiodiagno-sis, in the same center. Institutional board of ethics hadapproved this study and an informed consent was ob-tained from each patient subsequent to complete clarifi-cation of the profits and the dangers of the procedures.No further apparent risks to the patients who were in-cluded in this study.Patients were selected according to the following
criteria:
� Inclusion criteria: Adult patients (older than 18years) with solid parenchymal renal massesdiagnosed by US or CT.
� Exclusion criteria: Patients with generalcontraindications for MR examination (as withpacemaker or metallic prosthesis), patients with highrenal function tests, not suitable for IV-gadoliniuminjection, and patients refusing consent.
Table 1 Mean values of different quantitative multiparametric MRI parameters in the current study
Subtype Absolute CMenhancement
Absolute NGenhancement
RelativeCMenhancement
RelativeNGenhancement
Absolutewashout
ADC value ofthe lesion
ADCratio SII
ccRCC Mean 196.7 185.1 39.9 35.6 20.5 1.56 × 10⁻³ 0.75 0.93
N 43 43 43 43 43 43 43 43
Std. 81.6 59.9 37.2 21 33 0.27 0.13 0.01
pRCC Mean 164.3 113.9 −6.1 −28.2 50.4 0.96 × 10⁻³ 0.46 1.49
N 12 12 12 12 12 12 12 12
Std. 84.60 58.44 38.24 10.04 46.82 0.25 0.12 0.04
cbRCC Mean 177.8 160.1 96 49.25 30.25 0.89 × 10⁻³ 0.41 1.01
N 8 8 8 8 8 8 8 8
Std. 77.7 7.8 78.5 10.2 73.2 0.29 0.15 0.16
Elsorougy et al. Egyptian Journal of Radiology and Nuclear Medicine (2021) 52:49 Page 2 of 11
Fig. 1 Box plots show multiparametric quantitative evaluation of the subtypes of renal masses. a Absolute CM enhancement, b ADC ratio, andc SII are shown
Elsorougy et al. Egyptian Journal of Radiology and Nuclear Medicine (2021) 52:49 Page 3 of 11
MRI techniqueAll the patients underwent multiparametric MRI exam-ination done by using 3 Tesla MRI scanner (Phillips,Ingenia 3 T, Best, The Netherlands). Imaging will be inthe supine position using phased-array body coil usingM-Dixon program and was include these sequences:
Axial chemical shift (IP + OP)Dual echo CSI gradient recall T1W images were takenat IP and OP echo times with 6–8 mm thickness of slice,approximating matrix size of 256 × 320, 3 mm thicknessof slice, and opposed-phase echo time.Axial T2-weighted imaging is done with time repeti-
tion 2112 ms, echo time 100 ms, flip angle 90 degrees,field-of-view 32 cm, matrix size 268 × 344mm, slicethickness 5 mm, slice gap 0–0.4 mm, and excitationsnumber is 2–3.
Fat-suppressed T1W sequences and DCEImaging before and after IV bolus administration of 0.1mmol/kg of (Dotarem) (gadoteric acid) by rate of 2 mL/
s, and after that giving saline flush. (nonenhanced andgadolinium-enhanced DCE sequences: corticomedullarytimed empirically at 35 s, followed nephrographic at 120s, and excretory phases), time repetition 182 ms, echotime 4.6 ms, flip angle 70 degrees, field of view 37 cm,matrix size 220 × 284 mm, slice thickness 5 mm, slicegap 0-0.4 mm, and excitations number is 1.
DWIDWI was done in axial fat-saturated water-excitedsingle-shot spin-echo with b value (0, 800 s/mm2), timerepetition 1500ms, echo time 76 ms, flip angle 90 de-grees, field of view 40 cm, matrix size 180 × 194 mm,slice thickness 5 mm, slice gap 0.3–0.4 mm, and excita-tions number is 4-10.
Quantitative analysis of MRIQuantitative data were measured for 3 parameters:ADC, SI index (SII), and contrast enhancement (CE).We place the ROI at the slice of maximum diameter andmaximum solid component. We take care to not include
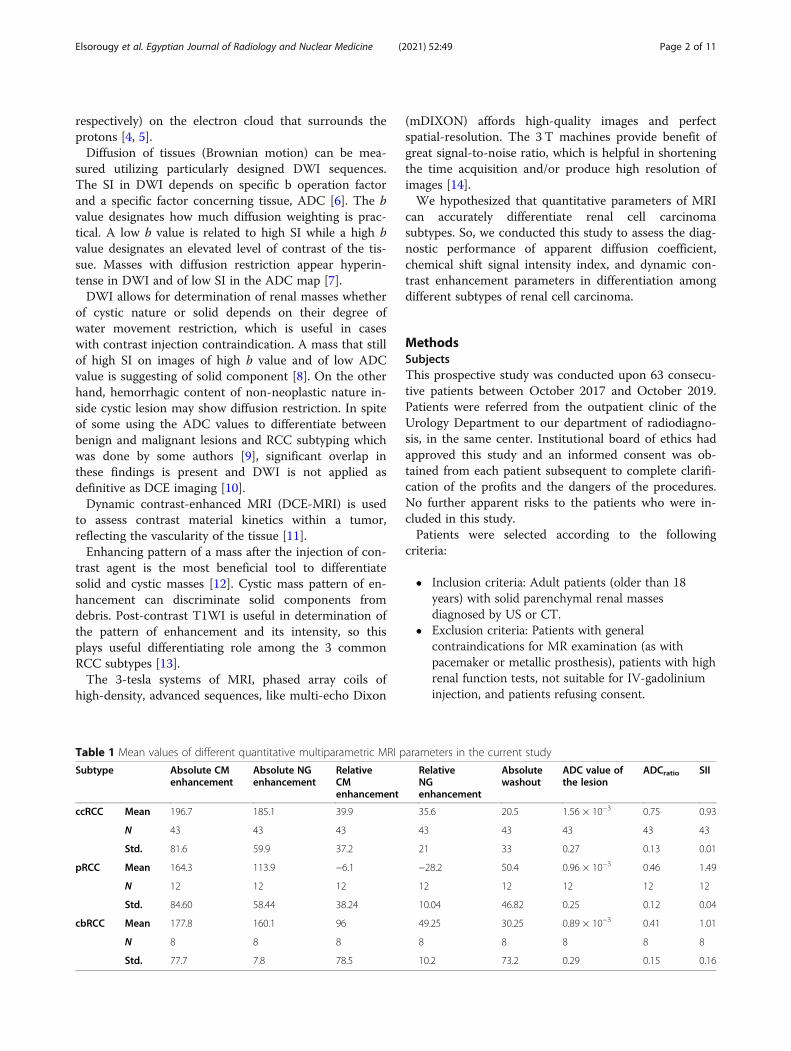
Table 2 AUC, optimal cutoff values, and corresponding performances of dynamic parameters for differentiation between clear cellRCC and non-clear cell RCC lesions
Variables AUC Cutoff value Sensitivity Specificity
Absolute CM enhancement 0.937 182 91.7% 74.4%
Absolute NG enhancement 0.787 156.5 83.3% 76.7%
Relative CM enhancement 0.779 18 75% 88.4%
Relative NG enhancement 0.677 15 83.3% 67.4%
Absolute washout 0.256 111 83.3% 67.4%
Fig. 2 ROC curves for parameters of dynamic study in differentiation between clear cell RCC and non-clear cell RCC lesions
Elsorougy et al. Egyptian Journal of Radiology and Nuclear Medicine (2021) 52:49 Page 4 of 11
any surrounding measurements and to avoid areas ofcystic degeneration if it is found. ROI is drawn inde-pendently on images in each sequence to account forslight patient movement and differences in breathingbetween sequences and phases.We measured the ADC mean, IP SI, OP SI, pre-
contrast SI, CM-phase SI, and NG-phase SI. ADC meanof the same side non-lesion kidney was measured. Wealso measured precontrast enhancement, CM enhance-ment, and NG enhancement of non-lesion cortex of thesame side.The following calculations were performed for each lesion:
1. ADC ratio = ADC mean lesion/ADC meanipsilateral kidney.
2. Signal intensity index = in phase−opposed phase.3. Absolute corticomedullary enhancement =
corticomedullary lesion−precontrast lesion.4. Absolute nephrographic enhancement =
nephrographic lesion−precontrast lesion.
5. Relative corticomedullary enhancement =corticomedullary lesion−corticomedullary non-lesion cortex.
6. Relative nephrographic enhancement =nephrographic lesion−nephrographic non-lesioncortex.
7. Absolute washout = corticomedullary lesion−nephrographic lesion.
Pathological analysisHistopathological diagnosis was available after surgicalexcision of all included renal tumors.
Statistical analysisDescriptive statistics (mean and percent and frequencies)were utilized to represent the collected data of the re-sults. The evaluation of the differences between malig-nant and benign masses in the kidney or betweenspecific comparisons of the subtype was carried out uti-lizing t tests or Wilcoxon rank tests, as suitable. Multi-variable logistic regression with backward stepwiseselection was utilized to recognize predictors of malig-nant tumors. The level of significance was determined tobe at (P ≤ 0.05) for the current study. Analyses were car-ried out using SPSS 23.0 (Chicago, IL, USA) for theWindows software.
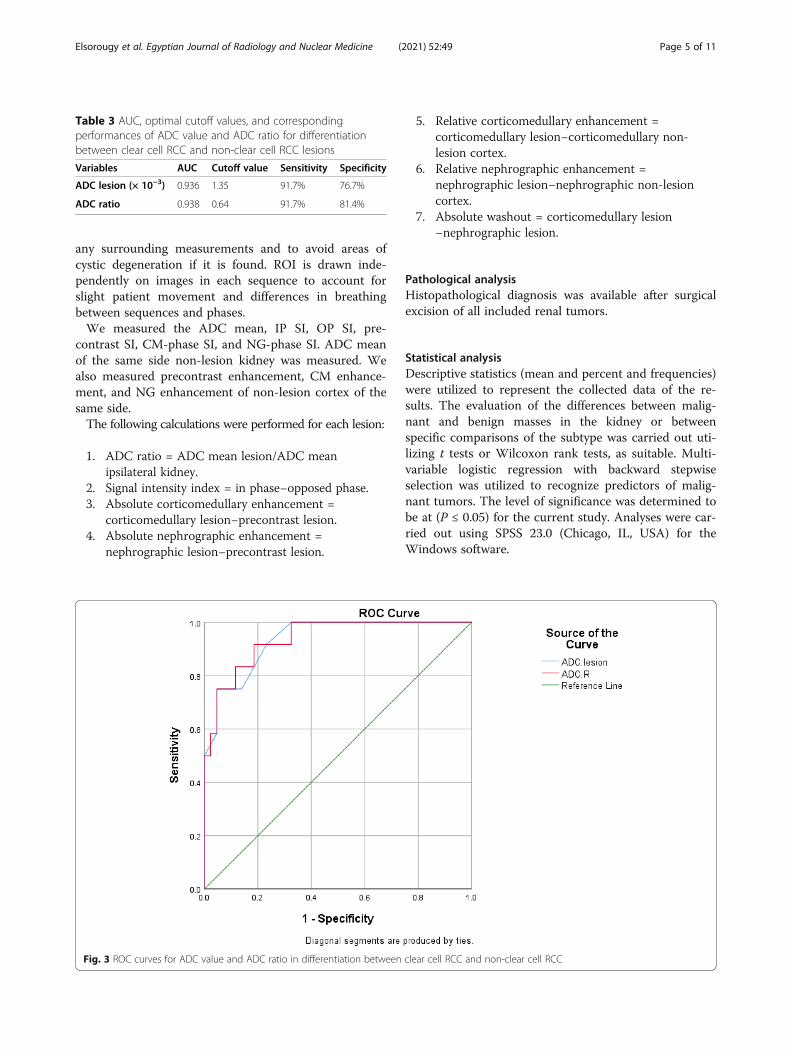
Table 3 AUC, optimal cutoff values, and correspondingperformances of ADC value and ADC ratio for differentiationbetween clear cell RCC and non-clear cell RCC lesions
Variables AUC Cutoff value Sensitivity Specificity
ADC lesion (× 10−3) 0.936 1.35 91.7% 76.7%
ADC ratio 0.938 0.64 91.7% 81.4%
Fig. 3 ROC curves for ADC value and ADC ratio in differentiation between clear cell RCC and non-clear cell RCC
Elsorougy et al. Egyptian Journal of Radiology and Nuclear Medicine (2021) 52:49 Page 5 of 11
ResultsThis prospective study included 63 patients (38 maleand 25 female) with 63 histologically confirmed renalcell carcinomas. The mean age of patients was 68.2 years(range, 43–84 years). There were 43 clear cell RCCs(68.3%), 12 papillary RCCs (19%), and 8 chromophobeRCCs (12.7%). No significant differences were observedeither for age (P = 0.81) or sex (P = 0.34).The mean ADC value for ccRCC (1.56 ± 0.27 × 10⁻³
mm2/s) was significantly higher than that of pRCC (0.96± 0.25 × 10⁻³ mm2/s, P < 0.001) and cbRCC (0.89 ± 0.29× 10⁻³ mm2/s, P < 0.001). The mean ADC ratio forccRCC (0.75 ± 0.13) was significantly higher than that ofpRCC (0.46 ± 0.12, P < 0.001) and cbRCC (0.41 ± 0.15,P < 0.001). However, both ADC ratio and ADC valuedemonstrated no significant difference between pRCCand cbRCC with P values were 0.997 and 0.56. Themean SII of pRCC (1.49 ± 0.04) was significantly higherthan that of ccRCC (0.93 ± 0.01, P < 0.001) and cbRCC(1.01 ± 0.16, P < 0.001). In addition, SII shows
significant difference between ccRCC and cbRCC (P =0.015). Regarding the dynamic MRI parameters, the ab-solute corticomedullary enhancement was the only sta-tistically useful parameter in differentiation betweenclear and non-clear RCC subtypes. The mean ccRCC ab-solute CM enhancement (196.7 ± 81.6) was significantlygreater than that of cbRCC (177.8 ± 77.7, P < 0.001) andpRCC (164.3 ± 84.6, P < 0.001). However, absolute CM en-hancement showed no significant difference between cbRCCand pRCC (P = 0.889), as shown in Table 1 and Fig. 1.
ROC curve analysesThe cutoff value of absolute corticomedullary enhance-ment in differentiation between clear cell RCC and non-clear cell RCC lesions was 182 with AUC of 0.937,sensitivity of 91.7%, and specificity of 74.4%. Absolutecorticomedullary enhancement had the highest AUCvalue compared to other dynamic MRI parameters(Table 2 and Fig. 2).The cutoff value of ADC in differentiation between
clear cell RCC and non-clear cell RCC was (1.35 × 10⁻³)with AUC of (0.936), sensitivity of 91.7% and specificityof 76.7%. However, the ADC ratio demonstrates cutoffvalue (0.64) with AUC of 0.938, sensitivity of 91.7%, andspecificity of 81.4%. There was no significant differencein AUC values in both parameters (Table 3 and Fig. 3).
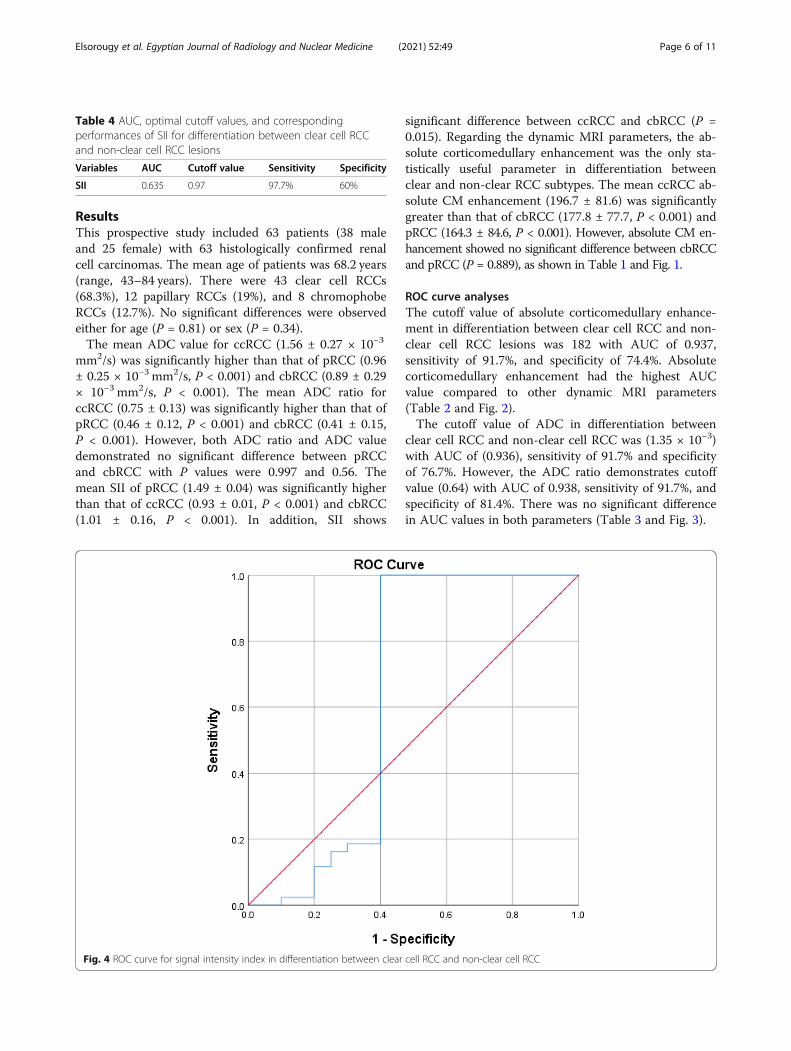
Table 4 AUC, optimal cutoff values, and correspondingperformances of SII for differentiation between clear cell RCCand non-clear cell RCC lesions
Variables AUC Cutoff value Sensitivity Specificity
SII 0.635 0.97 97.7% 60%
Fig. 4 ROC curve for signal intensity index in differentiation between clear cell RCC and non-clear cell RCC
Elsorougy et al. Egyptian Journal of Radiology and Nuclear Medicine (2021) 52:49 Page 6 of 11
The cutoff value of SII in differentiation between clearcell RCC and non-clear cell RCC was 0.97 with AUC of0.635, sensitivity of 97.7%, and specificity of 60% asshown in Table 4 and Fig. 4.Different examples of multiparametric MR studies in
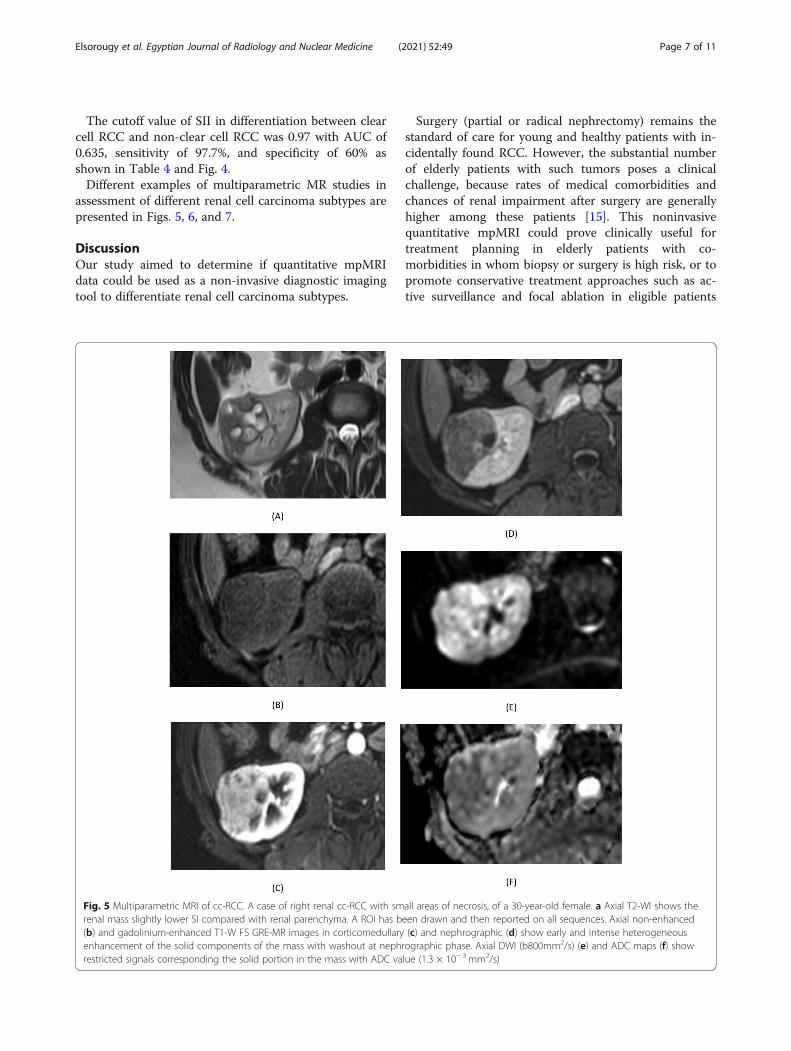
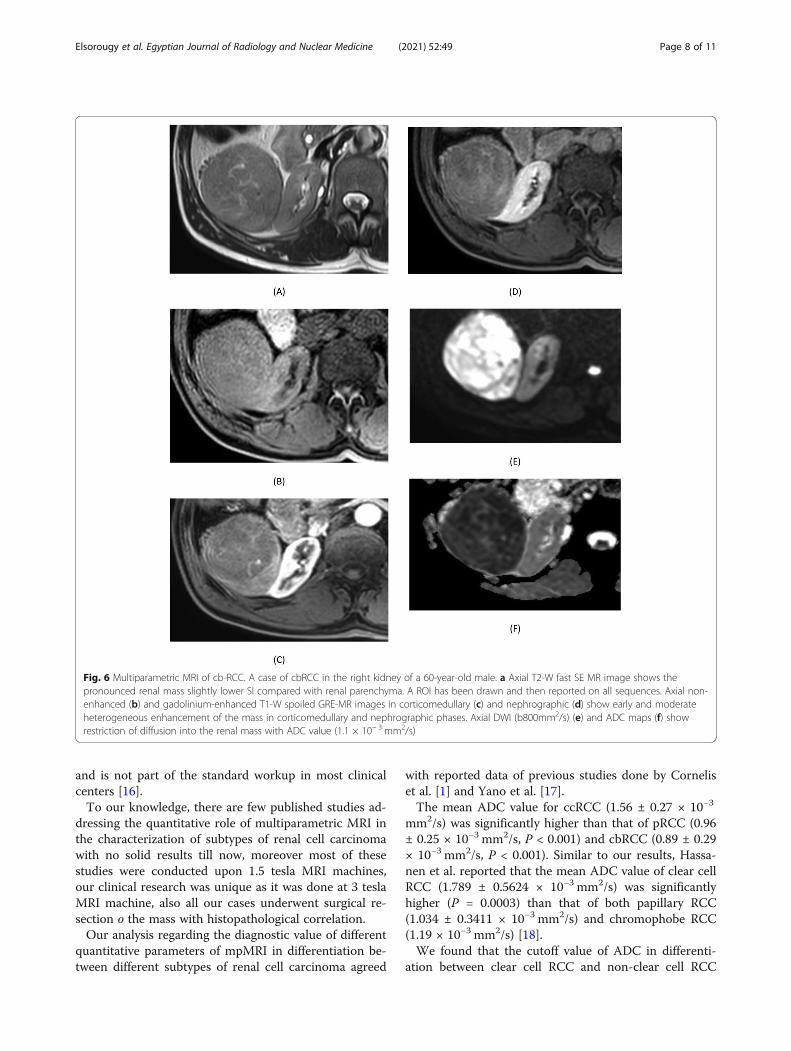
assessment of different renal cell carcinoma subtypes arepresented in Figs. 5, 6, and 7.
DiscussionOur study aimed to determine if quantitative mpMRIdata could be used as a non-invasive diagnostic imagingtool to differentiate renal cell carcinoma subtypes.
Surgery (partial or radical nephrectomy) remains thestandard of care for young and healthy patients with in-cidentally found RCC. However, the substantial numberof elderly patients with such tumors poses a clinicalchallenge, because rates of medical comorbidities andchances of renal impairment after surgery are generallyhigher among these patients [15]. This noninvasivequantitative mpMRI could prove clinically useful fortreatment planning in elderly patients with co-morbidities in whom biopsy or surgery is high risk, or topromote conservative treatment approaches such as ac-tive surveillance and focal ablation in eligible patients
Fig. 5 Multiparametric MRI of cc-RCC. A case of right renal cc-RCC with small areas of necrosis, of a 30-year-old female. a Axial T2-WI shows therenal mass slightly lower SI compared with renal parenchyma. A ROI has been drawn and then reported on all sequences. Axial non-enhanced(b) and gadolinium-enhanced T1-W FS GRE-MR images in corticomedullary (c) and nephrographic (d) show early and intense heterogeneousenhancement of the solid components of the mass with washout at nephrographic phase. Axial DWI (b800mm2/s) (e) and ADC maps (f) showrestricted signals corresponding the solid portion in the mass with ADC value (1.3 × 10− 3 mm2/s)
Elsorougy et al. Egyptian Journal of Radiology and Nuclear Medicine (2021) 52:49 Page 7 of 11
and is not part of the standard workup in most clinicalcenters [16].To our knowledge, there are few published studies ad-
dressing the quantitative role of multiparametric MRI inthe characterization of subtypes of renal cell carcinomawith no solid results till now, moreover most of thesestudies were conducted upon 1.5 tesla MRI machines,our clinical research was unique as it was done at 3 teslaMRI machine, also all our cases underwent surgical re-section o the mass with histopathological correlation.Our analysis regarding the diagnostic value of different
quantitative parameters of mpMRI in differentiation be-tween different subtypes of renal cell carcinoma agreed
with reported data of previous studies done by Corneliset al. [1] and Yano et al. [17].The mean ADC value for ccRCC (1.56 ± 0.27 × 10⁻³
mm2/s) was significantly higher than that of pRCC (0.96± 0.25 × 10⁻³ mm2/s, P < 0.001) and cbRCC (0.89 ± 0.29× 10⁻³ mm2/s, P < 0.001). Similar to our results, Hassa-nen et al. reported that the mean ADC value of clear cellRCC (1.789 ± 0.5624 × 10⁻³ mm2/s) was significantlyhigher (P = 0.0003) than that of both papillary RCC(1.034 ± 0.3411 × 10⁻³ mm2/s) and chromophobe RCC(1.19 × 10⁻³ mm2/s) [18].We found that the cutoff value of ADC in differenti-
ation between clear cell RCC and non-clear cell RCC
Fig. 6 Multiparametric MRI of cb-RCC. A case of cbRCC in the right kidney of a 60-year-old male. a Axial T2-W fast SE MR image shows thepronounced renal mass slightly lower SI compared with renal parenchyma. A ROI has been drawn and then reported on all sequences. Axial non-enhanced (b) and gadolinium-enhanced T1-W spoiled GRE-MR images in corticomedullary (c) and nephrographic (d) show early and moderateheterogeneous enhancement of the mass in corticomedullary and nephrographic phases. Axial DWI (b800mm2/s) (e) and ADC maps (f) showrestriction of diffusion into the renal mass with ADC value (1.1 × 10− 3 mm2/s)
Elsorougy et al. Egyptian Journal of Radiology and Nuclear Medicine (2021) 52:49 Page 8 of 11
was 1.35 × 10⁻³ mm2/s with AUC of 0.936, sensitivity of91.7% and specificity of 76.7%. This was in agreementwith Hassanen et al. study who reported an ADC cutoffvalue of 1.309 × 10⁻³ mm2/s for differentiation betweenthe clear cell RCC and non-clear cell RCC with sensitiv-ity of 79.17% and specificity of 78.57% [18].In the current study, we detected that the mean ADC
ratio for ccRCC (0.75 ± 0.13) was significantly higherthan that of pRCC (0.46 ± 0.12, P < 0.001) and cbRCC
(0.41 ± 0.15, P < 0.001). However, the ADC ratio dem-onstrated no significant difference between pRCC andcbRCC (P = 0.997).We found also that the mean SII of pRCC was signifi-
cantly higher than that of non-papillary RCC, in additionto demonstration of significant difference betweenccRCC and cbRCC.So, the clear cell RCC signal intensity index and
ADC ratio is significantly different from those of
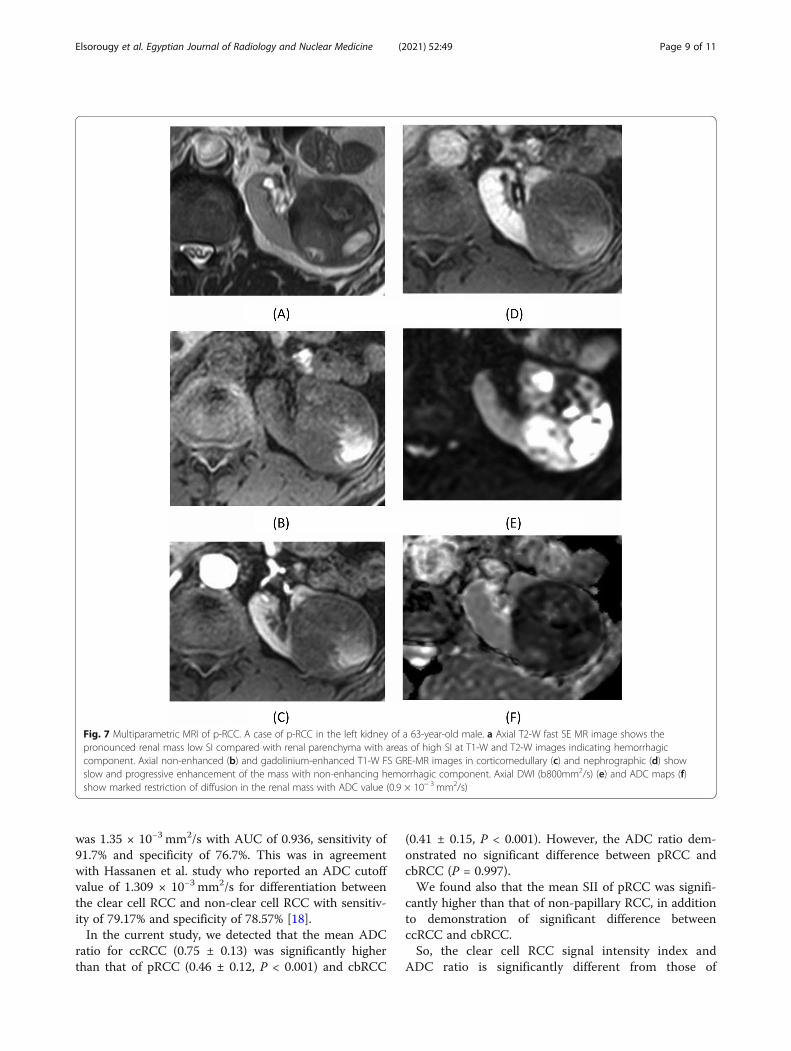
Fig. 7 Multiparametric MRI of p-RCC. A case of p-RCC in the left kidney of a 63-year-old male. a Axial T2-W fast SE MR image shows thepronounced renal mass low SI compared with renal parenchyma with areas of high SI at T1-W and T2-W images indicating hemorrhagiccomponent. Axial non-enhanced (b) and gadolinium-enhanced T1-W FS GRE-MR images in corticomedullary (c) and nephrographic (d) showslow and progressive enhancement of the mass with non-enhancing hemorrhagic component. Axial DWI (b800mm2/s) (e) and ADC maps (f)show marked restriction of diffusion in the renal mass with ADC value (0.9 × 10− 3 mm2/s)
Elsorougy et al. Egyptian Journal of Radiology and Nuclear Medicine (2021) 52:49 Page 9 of 11
other RCC, which was constant with the previousstudies of Pedrosa et al., Karlo et al., Jhaveri et al.,and Yano et al. [17, 19–21].Contrary to Yano et al. study [17] regarding the ab-
solute corticomedullary enhancement parameter, wefound that it plays beneficial significant role indifferentiation between ccRCC (196.7 ± 81.6) and non-clear subtypes of cbRCC (177.8 ± 77.7, P < 0.001) andpRCC (164.3 ± 84.6, P < 0.001); however it did not showsignificant difference between chromophobe and papillarysubtype (P = 0.889), which was agreed with study ofCornelis et al. [2].We found that ADC ratio had the best diagnostic per-
formance (AUC = 0.938) followed by Absolute CMEnhancement (AUC = 0.937). However, SII showed lowerdiagnostic performance (AUC = 0.63) compared to theother two parameters. Similar to our results, Cornelis et al.found that the diagnostic performance of early arterialtumor enhancement (AUC = 0.93) and ADC ratio (AUC =0.84) were higher than that of SII (AUC = 0.75) [2].There are numerous clarifications for the discrimin-
atory values paucity in characterization of solid renal le-sions subtypes compared to others. No limit on lesionsize was set in our study population, similar to otherstudies which were done for the same purpose as Corne-lis et al., Mirka et al., Hötker et al., and Galmiche et al.[2, 22–24] without limits on lesion size, while contraryto Yano et al. who limited the study population to tu-mors < 3 cm [17] or Schieda et al. who studied lesionsless than 4 cm in size [11].We included large lesions more than 4 cm although
MR characterization is more likely to be used with smallrenal masses less than 4 cm for which biopsy can bemore challenging and where the prevalence of malig-nancy is lower. The selection of larger lesions in ourstudy allow better evaluation of diffusion restriction andtissue enhancement; however, it led to variability inmpMRI quantitative results when compared to studiesapplied only on small renal masses.In our study, the involved MRI evaluations were car-
ried out on 3 tesla single-scanner rather than Yano et al.whose study was carried out on two 3 T scanners andone of eleven 1.5 T scanners [17]. We think that thestudies having single-scanner are possibly more accurateand strong as they can adjust this variance.In our study, we have number of limitations. First, it is
relatively small sample size. Second, although our studywas performed on a single-scanner and using a single con-trast agent and that was potentially more robust because ofcontrolling the variance. The scanners heterogeneity mayactually be challenging the ability of application of thequantitative data of a single-scanner in the practice clinic-ally; if the quantitative data are to be clinically utilized, itshould able to be applied across several scanner platforms.
ConclusionOur study demonstrated that multiparametric MRI isable to afford some quantitative features such as ADCratio, SII, and absolute corticomedullary enhancementwhich can be used to accurately distinguish differentsubtypes of renal cell carcinoma. Also, our results sup-port that the quantitative mpMRI is useful for differenti-ation between the clear cells RCC which is the mostaggressive RCC subtype from other less aggressive onesand may play a clinically important value in treatmentstrategy and risk stratification of patients with renaltumors.
AbbreviationsRCC: Renal cell carcinoma; ADC: Apparent diffusion coefficient; SII: Signalintensity index; CcRCC: Clear cell renal cell carcinoma; PRCC: Papillary renalcell carcinoma; CbRCC: Chromophobe renal cell carcinoma;MP: Multiparametric; DWI: Diffusion-weighted image; DCE: Dynamic contrastenhancement; IP: In phase; OP: Opposed phase; CSI: Chemical shift imaging;CE: Contrast enhancement; ROI: Region of interest; CM: Corticomedullary;NG: Nephrographic
AcknowledgementsWe acknowledge the members of the Radiology Department in Urology andNephrology Center, Mansoura University (especially Prof. Tarek El-Diasty), andThe Radiology Department in Mansoura University, Egypt.
Authors’ contributionsMS and AE gave ideas and collected the patients’ data and analyze them.MAE put study design and followed the patients postoperatively. HF and DBwrote the paper with revision. All authors read and approved the finalmanuscript.
FundingThis study had no funding from any resource.
Availability of data and materialsThe datasets used and/or analyzed during the current study are availablefrom the corresponding author on reasonable request.
Ethics approval and consent to participateThis study was approved by the Research Ethics Committee of the Faculty ofMedicine at Mansoura University in Egypt on 20 August 2017; referencenumber of approval: MS/17.08.75.
Consent for publicationAll patients included in this research gave written informed consent topublish the data contained within this study.
Competing interestsThe authors declare that they have no competing interests.
Author details1Radiology Departments, Urology and Nephrology Center, MansouraUniversity, Mansoura, Egypt. 2Radiology Department, Faculty of Medicine,Mansoura University, Mansoura, Egypt.
Received: 23 November 2020 Accepted: 28 December 2020
References1. Cornelis F, Grenier N (2017) Multiparametric magnetic resonance
imaging of solid renal tumors: a practical algorithm. SeminarsUltrasound, CT MRI 38(1):47–58
2. Cornelis F, Tricaud E, Lasserre A, Petitpierre F, Bernhard J, Le Bras Y et al(2014) Routinely performed multiparametric magnetic resonance imaginghelps to differentiate common subtypes of renal tumours. Eur Radiol 24(5):1068–1080
Elsorougy et al. Egyptian Journal of Radiology and Nuclear Medicine (2021) 52:49 Page 10 of 11
3. Lopes Vendrami C, Parada Villavicencio C, DeJulio TJ, Chatterjee A, CasalinoDD, Horowitz JM et al (2017) Differentiation of solid renal tumors withmultiparametric MR imaging. Radiographics. 37(7):2026–2042
4. De Silva S, Lockhart K, Aslan P, Nash P, Hutton A, Malouf D, et al. (2020).Chemical shift imaging in the identification of those renal tumors thatcontain microscopic fat and the utility of multiparametric MRI in theirdifferentiation. J Med Imaging Radiat Oncol. 64(6): 762–768.
5. Adam SZ, Nikolaidis P, Horowitz JM, Gabriel H, Hammond NA, Patel T et al(2016) Chemical shift MR imaging of the adrenal gland: principles, pitfalls,and applications. Radiographics. 36(2):414–432
6. Ramamurthy N, Moosavi B, McInnes M, Flood T, Schieda N (2015)Multiparametric MRI of solid renal masses: pearls and pitfalls. Clin Radiol70(3):304–316
7. Wu Y, Kwon YS, Labib M, Foran DJ, Singer EA. (2015). Magnetic resonanceimaging as a biomarker for renal cell carcinoma. Disease markers. 2015:1–9.
8. Canvasser NE, Kay FU, Xi Y, Pinho DF, Costa D, de Leon AD et al (2017)Diagnostic accuracy of multiparametric magnetic resonance imaging toidentify clear cell renal cell carcinoma in cT1a renal masses. J Urol 198(4):780–786
9. Choi YA, Kim CK, Park SY, Cho SW, Park BK (2014) Subtype differentiation ofrenal cell carcinoma using diffusion-weighted and blood oxygenation level–dependent MRI. Am J Roentgenol 203(1):W78–W84
10. Mittal MK, Sureka B (2016) Solid renal masses in adults. Indian J RadiolImaging 26(4):429
11. Schieda N, Dilauro M, Moosavi B, Hodgdon T, Cron GO, McInnes MD et al(2016) MRI evaluation of small (< 4 cm) solid renal masses: multivariatemodeling improves diagnostic accuracy for angiomyolipoma without visiblefat compared to univariate analysis. Eur Radiol 26(7):2242–2251
12. Young JR, Coy H, Kim HJ, Douek M, Lo P, Pantuck AJ et al (2017)Performance of relative enhancement on multiphasic MRI for thedifferentiation of clear cell renal cell carcinoma (RCC) from papillary andchromophobe RCC subtypes and oncocytoma. Am J Roentgenol 208(4):812–819
13. Galia M, Albano D, Bruno A, Agrusa A, Romano G, Di Buono G et al (2017)Imaging features of solid renal masses. Br J Radiol 90(0):20170077
14. Khatri G, Pedrosa IM (2012) 3 T MR imaging protocol for characterization ofrenal masses. Appl Radiol 41(Suppl):22–26
15. Wang ZJ, Westphalen AC, Zagoria RJ (2018) CT and MRI of small renalmasses. Br J Radiol 91(1087):20180131
16. Hötker AM, Mazaheri Y, Wibmer A, Karlo CA, Zheng J, Moskowitz CS et al(2017) Differentiation of clear cell renal cell carcinoma from other renalcortical tumors by use of a quantitative multiparametric MRI approach. AmJ Roentgenol 208(3):W85–W91
17. Yano M, Fowler KJ, Srisuwan S, Salter A, Siegel CL (2018) Quantitativemultiparametric MR analysis of small renal lesions: correlation with surgicalpathology. Abdominal Radiol 43(12):3390–3399
18. Hassanen O, Ghieda U, Eltomey MA (2017) Contrast enhanced MRI anddiffusion weighted imaging (DWI) in the evaluation of renal cellcarcinoma and differentiation of its subtypes. Egypt J Radiol NuclearMed 48(4):1117–1123
19. Pedrosa I, Sun MR, Spencer M, Genega EM, Olumi AF, Dewolf WC et al(2008) MR imaging of renal masses: correlation with findings at surgery andpathologic analysis. Radiographics. 28(4):985–1003
20. Jhaveri KS, Elmi A, Hosseini-Nik H, Hedgire S, Evans A, Jewett M et al (2015)Predictive value of chemical-shift MRI in distinguishing clear cell renal cellcarcinoma from non–clear cell renal cell carcinoma and minimal-fatangiomyolipoma. Am J Roentgenol 205(1):W79–W86
21. Karlo CA, Donati OF, Burger IA, Zheng J, Moskowitz CS, Hricak H et al (2013)MR imaging of renal cortical tumours: qualitative and quantitative chemicalshift imaging parameters. Eur Radiol 23(6):1738–1744
22. Galmiche C, Bernhard J-C, Yacoub M, Ravaud A, Grenier N, Cornelis F (2017)Is multiparametric MRI useful for differentiating oncocytomas fromchromophobe renal cell carcinomas? Am J Roentgenol 208(2):343–350
23. Mirka H, Korcakova E, Kastner J, Hora M, Hes O, Hosek P et al (2015)Diffusion-weighted imaging using 3.0 T MRI as a possible biomarker of renaltumors. Anticancer Res 35(4):2351–2357
24. Hötker AM, Mazaheri Y, Wibmer A, Zheng J, Moskowitz CS, Tickoo SK et al(2016) Use of DWI in the differentiation of renal cortical tumors. Am JRoentgenol 206(1):100–105
Publisher’s NoteSpringer Nature remains neutral with regard to jurisdictional claims inpublished maps and institutional affiliations.
Elsorougy et al. Egyptian Journal of Radiology and Nuclear Medicine (2021) 52:49 Page 11 of 11