Embed Size (px)
Citation preview
Original Article
Short Duration Hyperbaric Oxygen Therapy to Improve HbA1c, Leukocyte, and Serum
Creatinine in Patient with Diabetic Foot Ulcer Wagner 3-4
Author:
dr. Hendry Irawan
Surgery Department, Faculty of Medicine, UdaYesna University, Sanglah General Hospital,
Denpasar, Indonesia.
Co-Author 1:
Dr. dr. I Nyoman Semadi, Sp.B, Sp.BTKV
Thorax and Cardiovascular Surgery Division, Surgery Department, Faculty of Medicine,
UdaYesna University, Sanglah General Hospital, Denpasar, Indonesia.
Co-Author 2:
Prof. Dr. dr. I Gde Raka Widiana, Sp.PD-KGH
Nephrology and Hypertension Division, Internal Medicine Department, Faculty of Medicine,
UdaYesna University, Sanglah General Hospital, Denpasar, Indonesia.
Correspondence:
Name : dr. Hendry Irawan
Phone : +62 82125097786
Email : [email protected]
Affiliation : Surgery Department, Faculty of Medicine, UdaYesna University,
Sanglah General Hospital, Denpasar, Indonesia.
Address : Kesehatan Street No. 1, Denpasar, Bali, Indonesia.
Denpasar, 10-04-2018
Hendry Irawan
Results
All patients were treated with insulin as antidiabetic and intravenous empiric antibiotics.
We used combination short acting and long acting insulin daily. Dose of short acting
(NovoRapid®, insulin aspart) 8 units every 8 hours and long acting (Lantus®, insulin glargine)
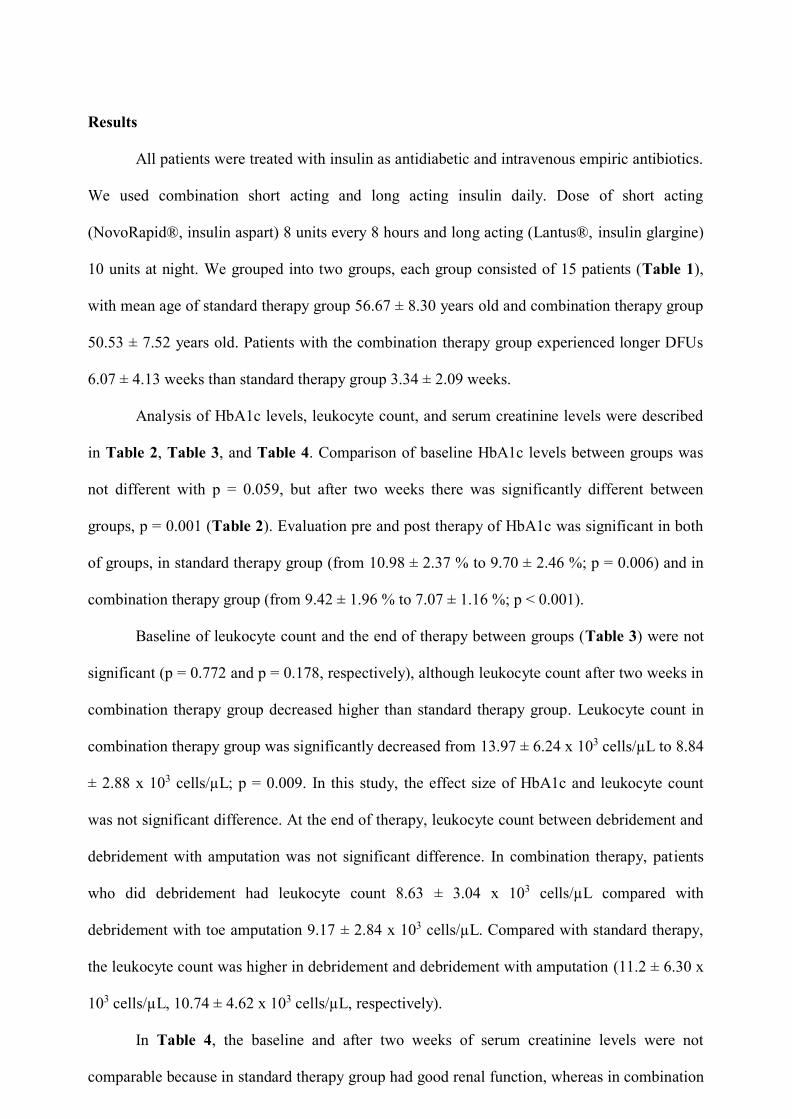
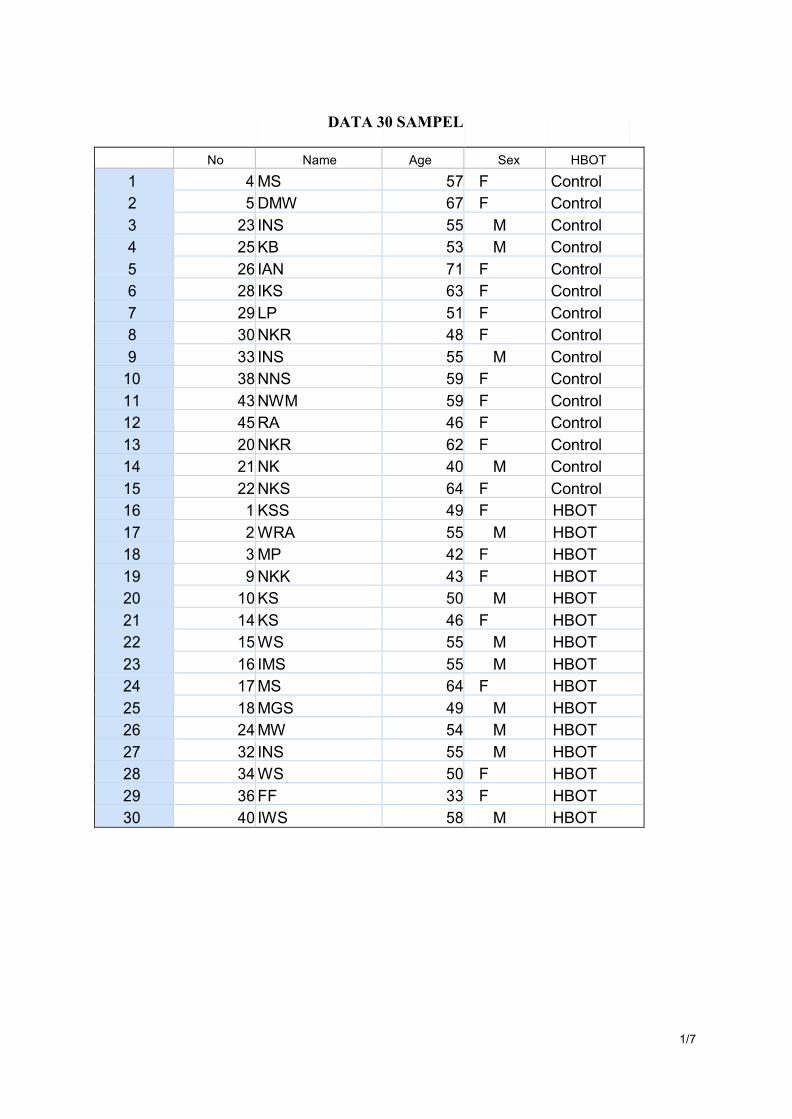
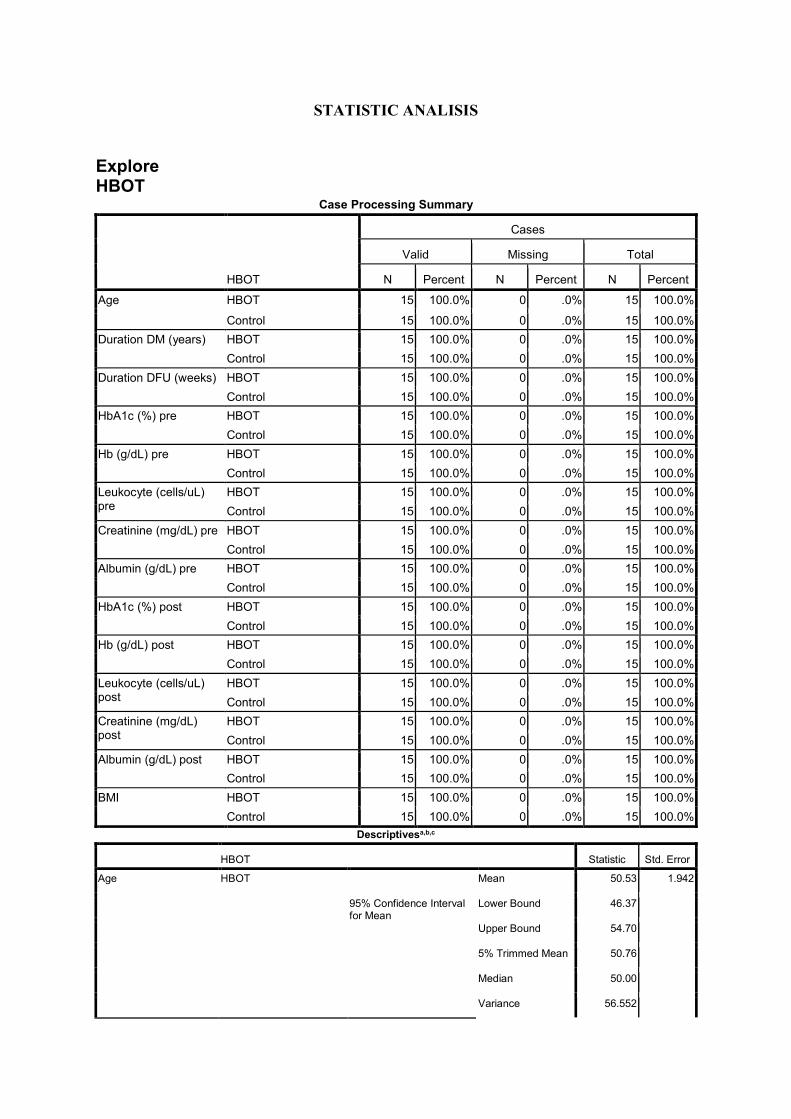
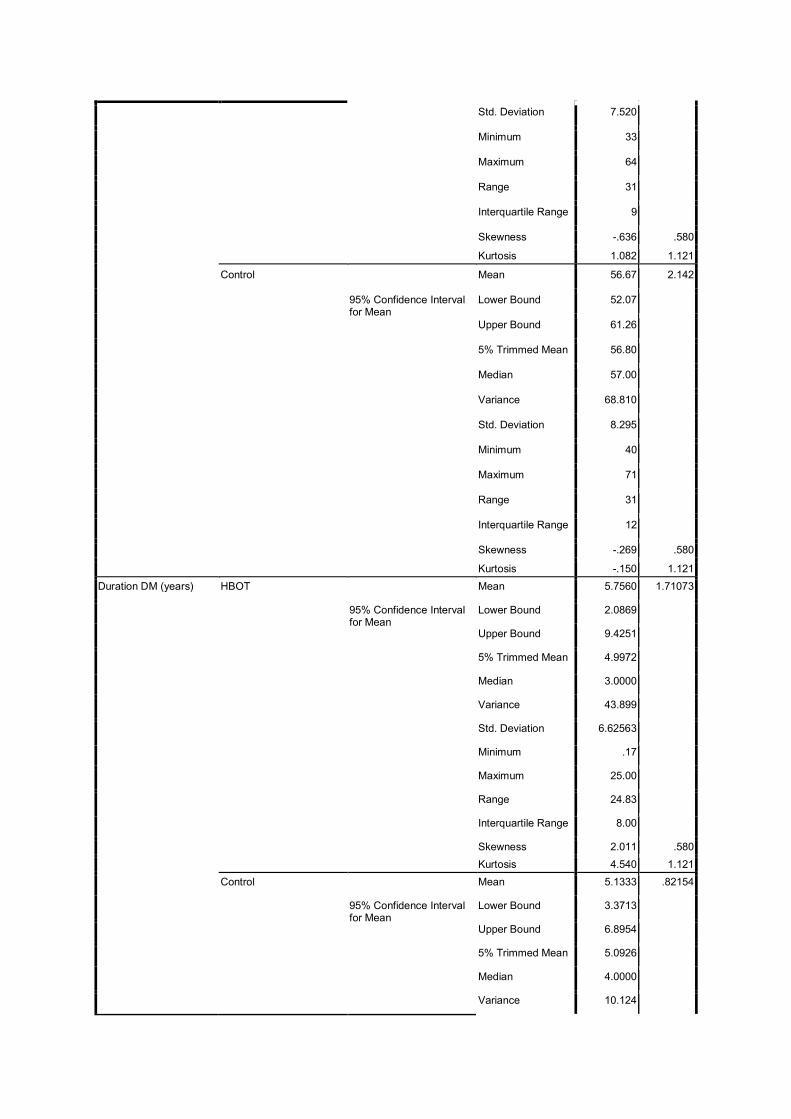
10 units at night. We grouped into two groups, each group consisted of 15 patients (Table 1),
with mean age of standard therapy group 56.67 ± 8.30 years old and combination therapy group
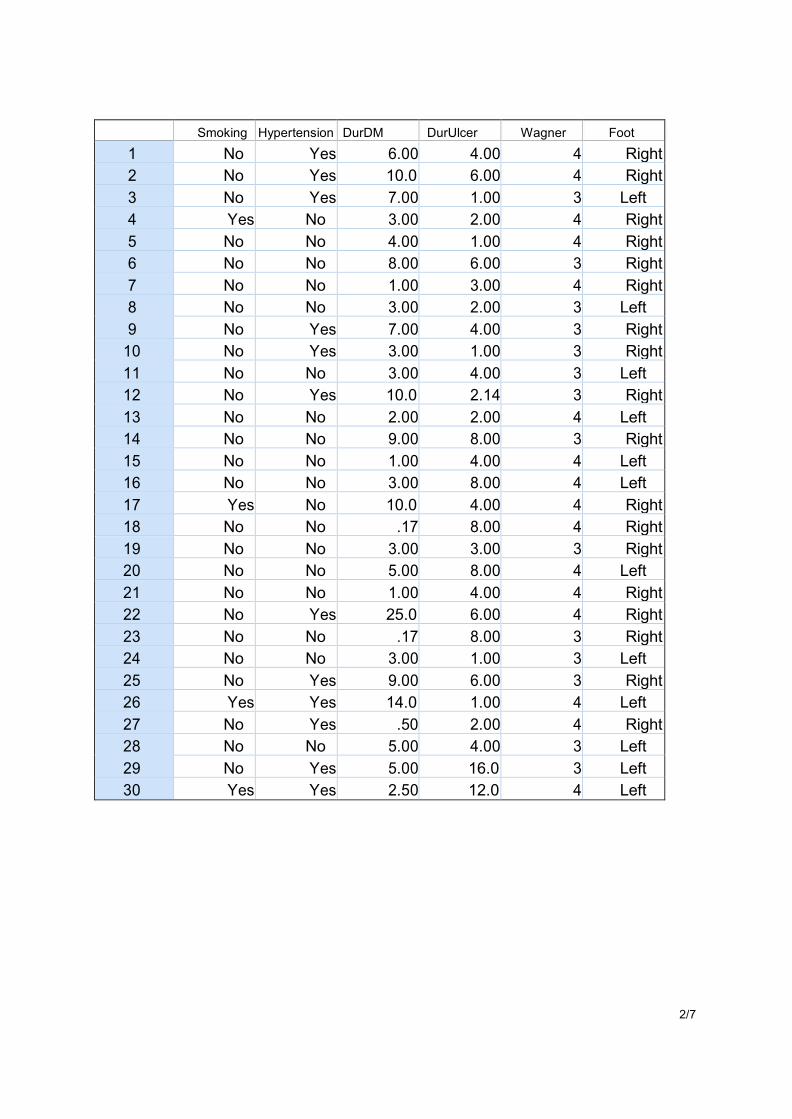
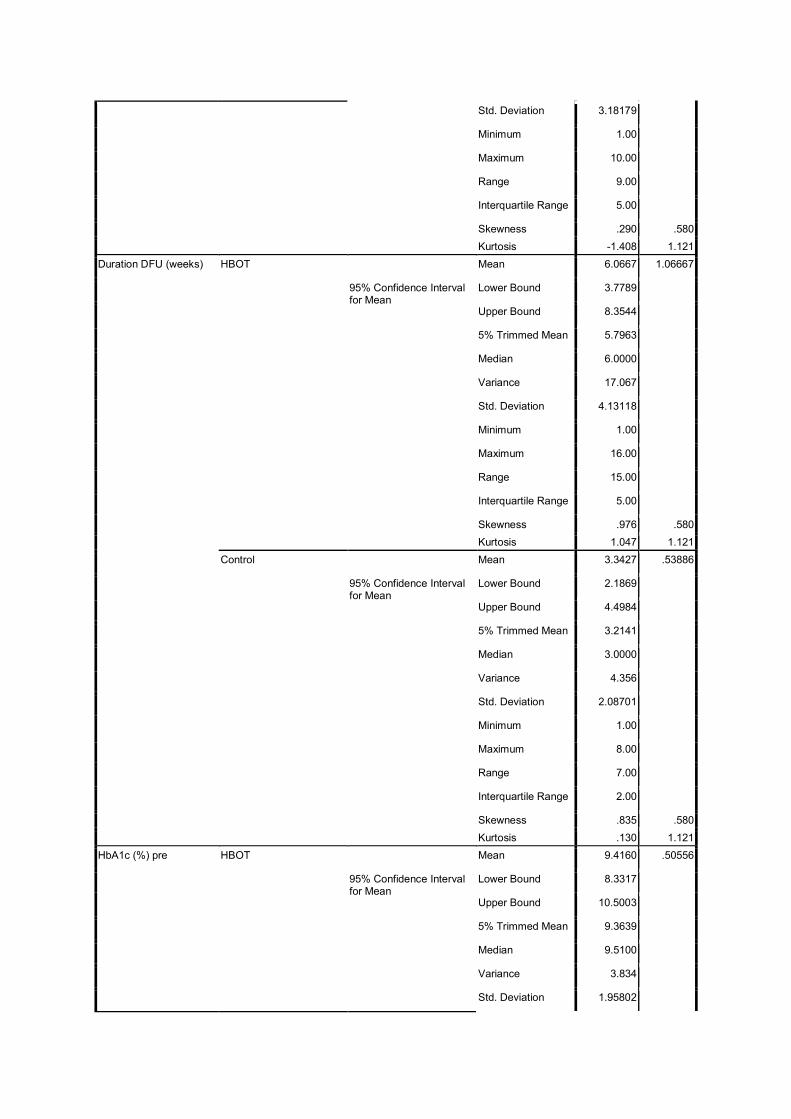
50.53 ± 7.52 years old. Patients with the combination therapy group experienced longer DFUs
6.07 ± 4.13 weeks than standard therapy group 3.34 ± 2.09 weeks.
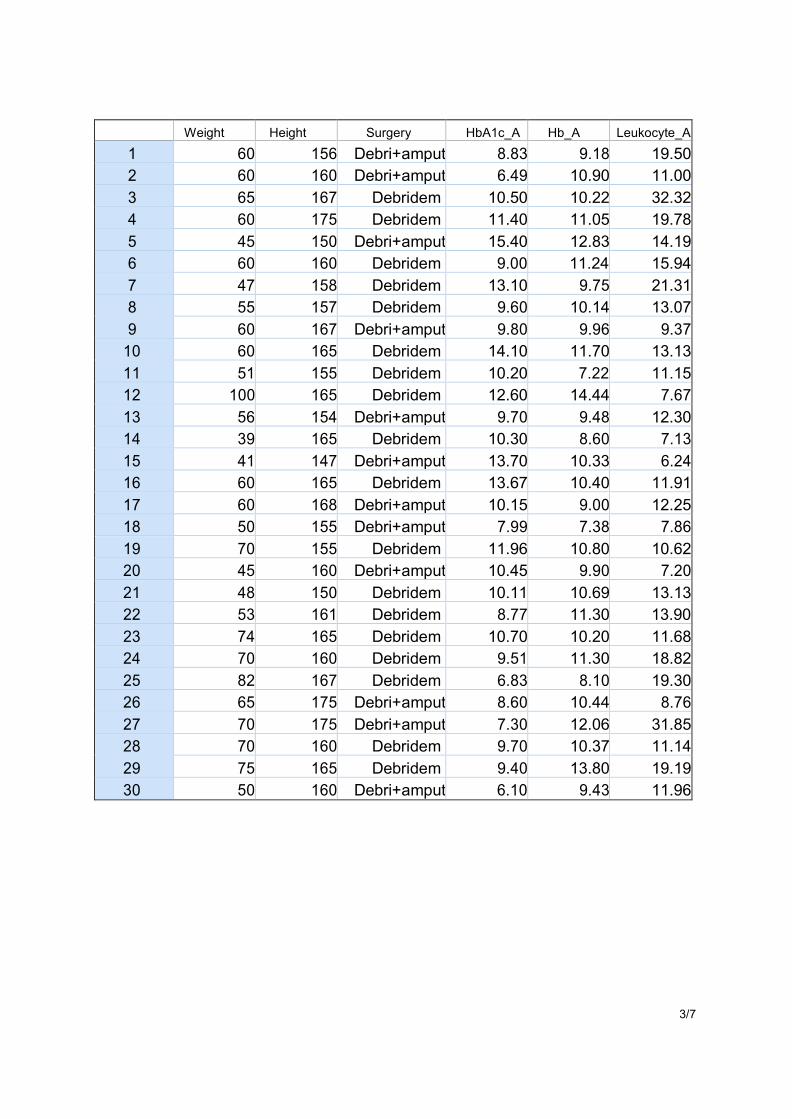
Analysis of HbA1c levels, leukocyte count, and serum creatinine levels were described
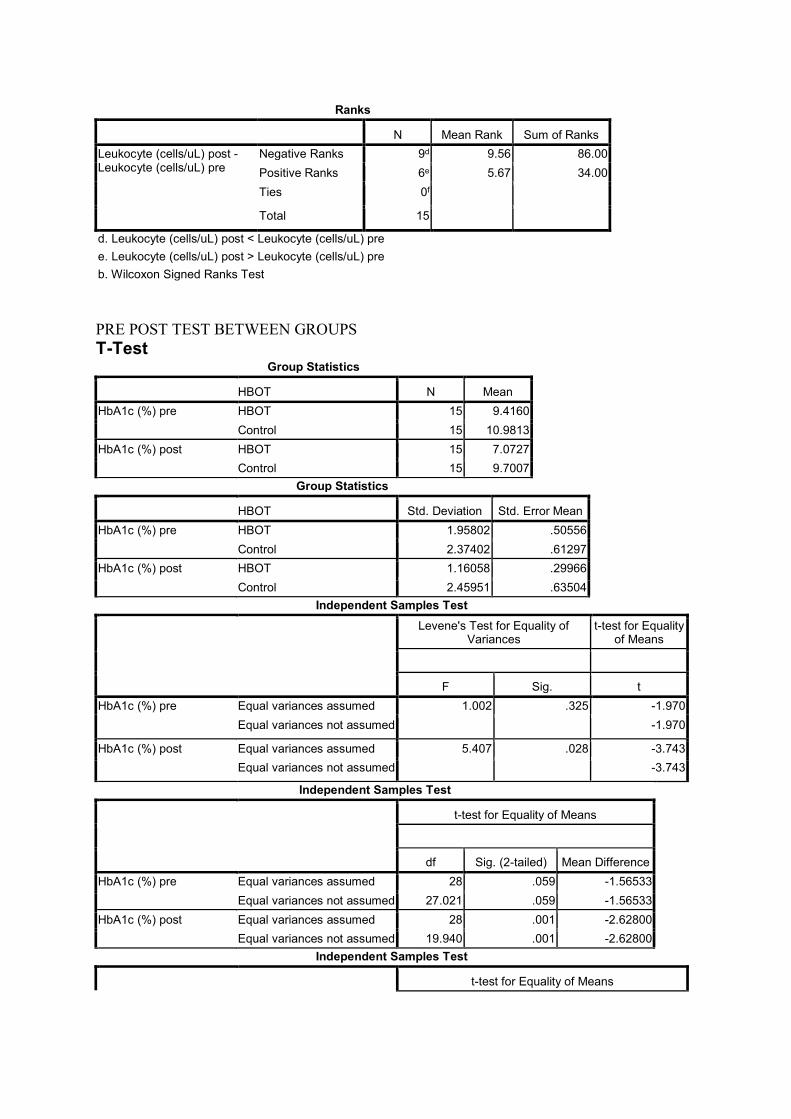
in Table 2, Table 3, and Table 4. Comparison of baseline HbA1c levels between groups was
not different with p = 0.059, but after two weeks there was significantly different between
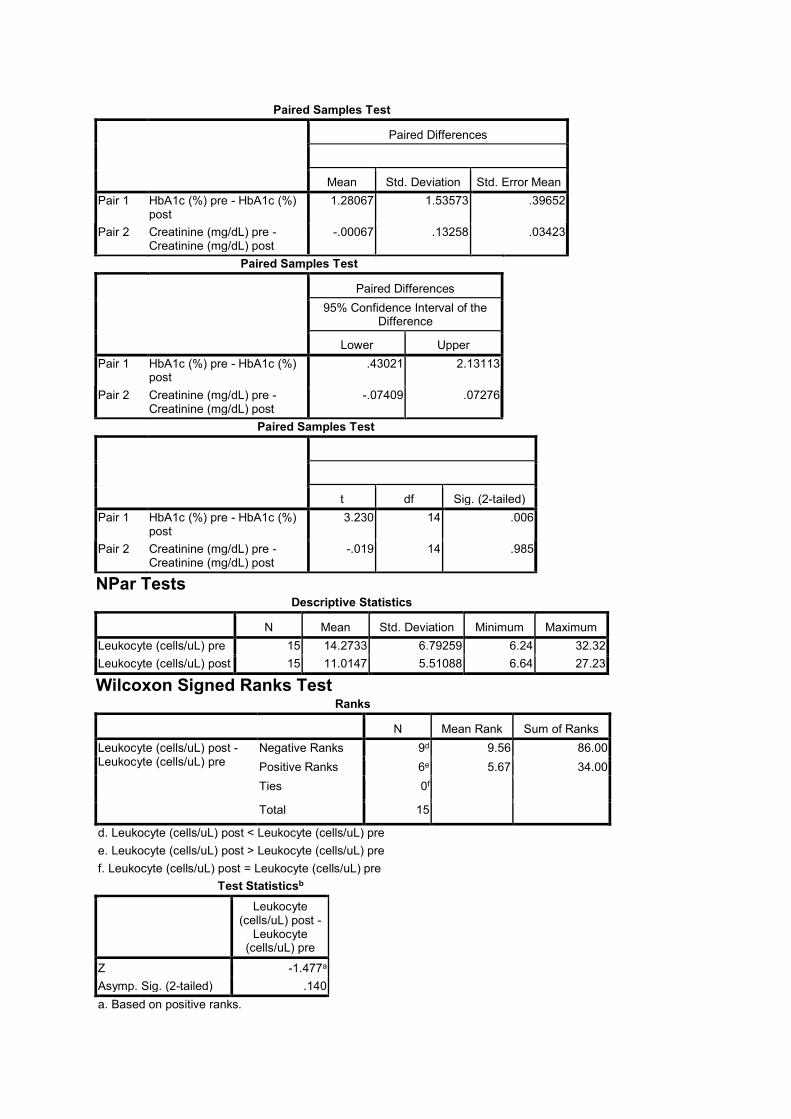
groups, p = 0.001 (Table 2). Evaluation pre and post therapy of HbA1c was significant in both
of groups, in standard therapy group (from 10.98 ± 2.37 % to 9.70 ± 2.46 %; p = 0.006) and in
combination therapy group (from 9.42 ± 1.96 % to 7.07 ± 1.16 %; p < 0.001).
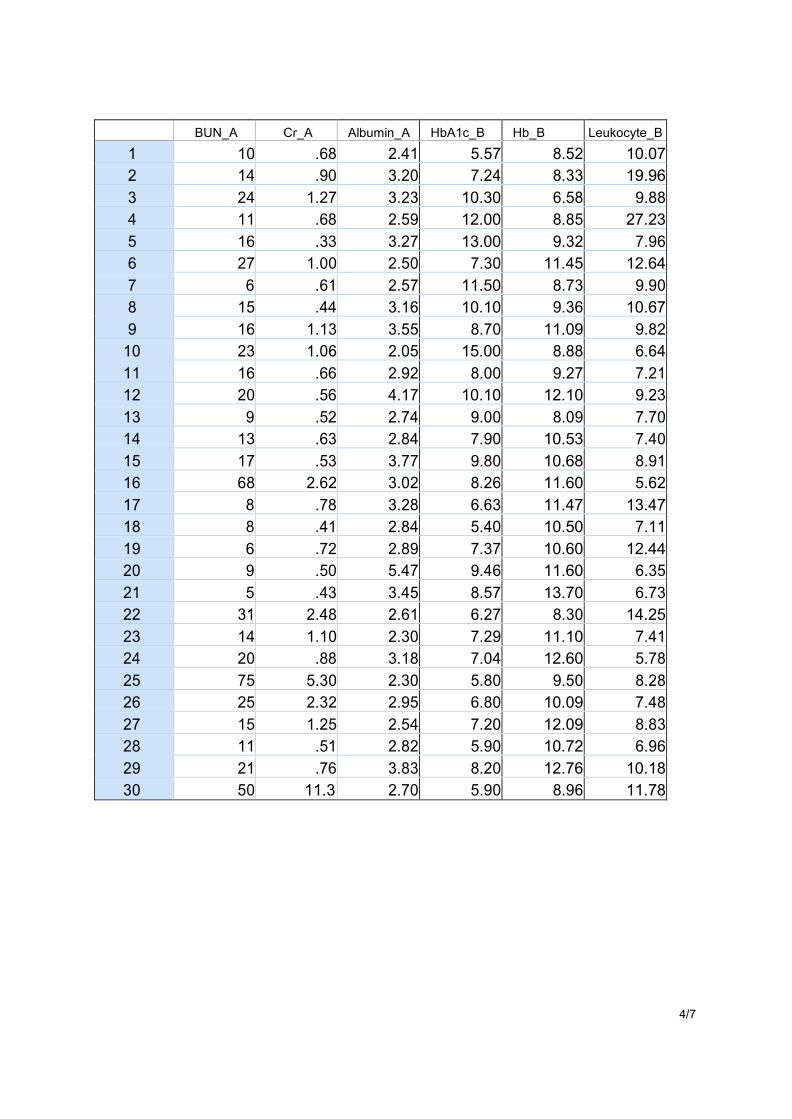
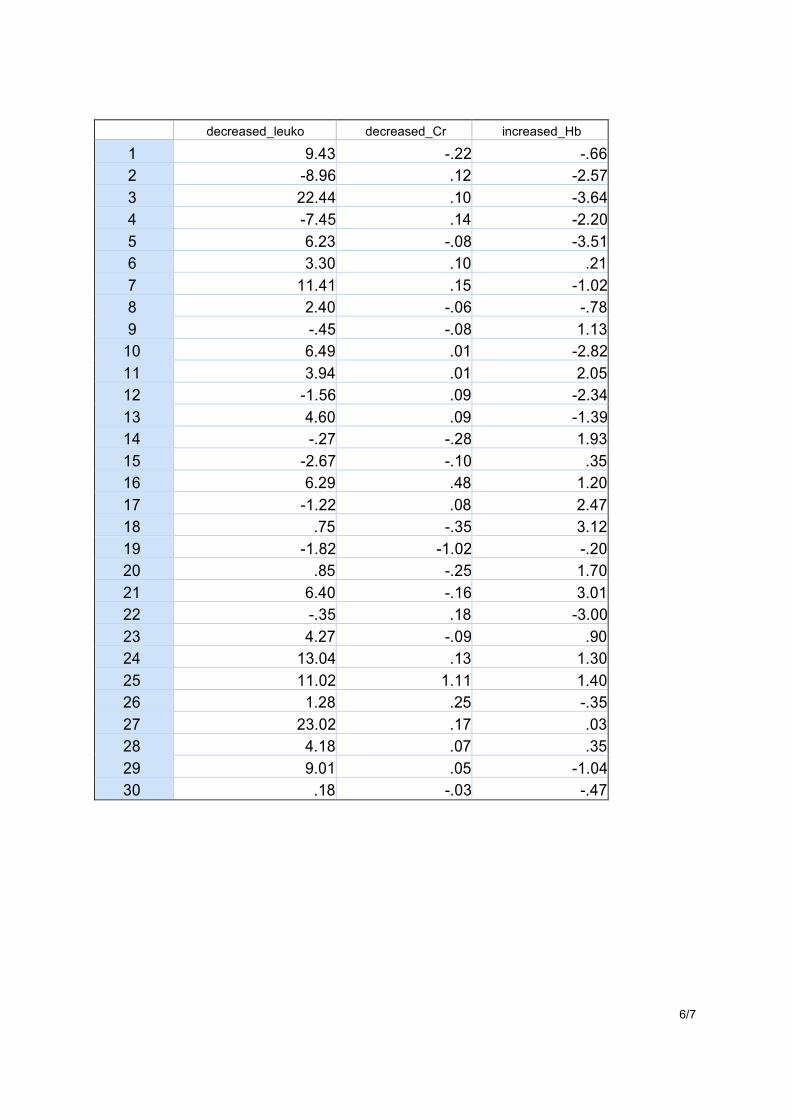
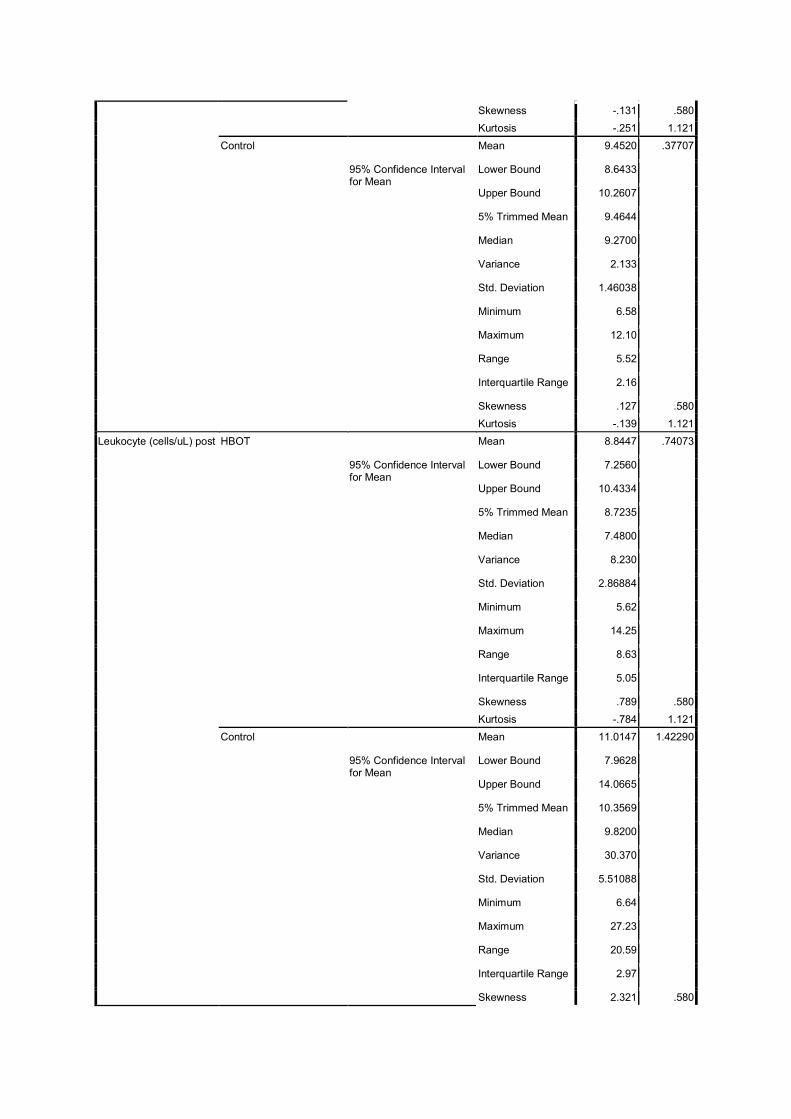
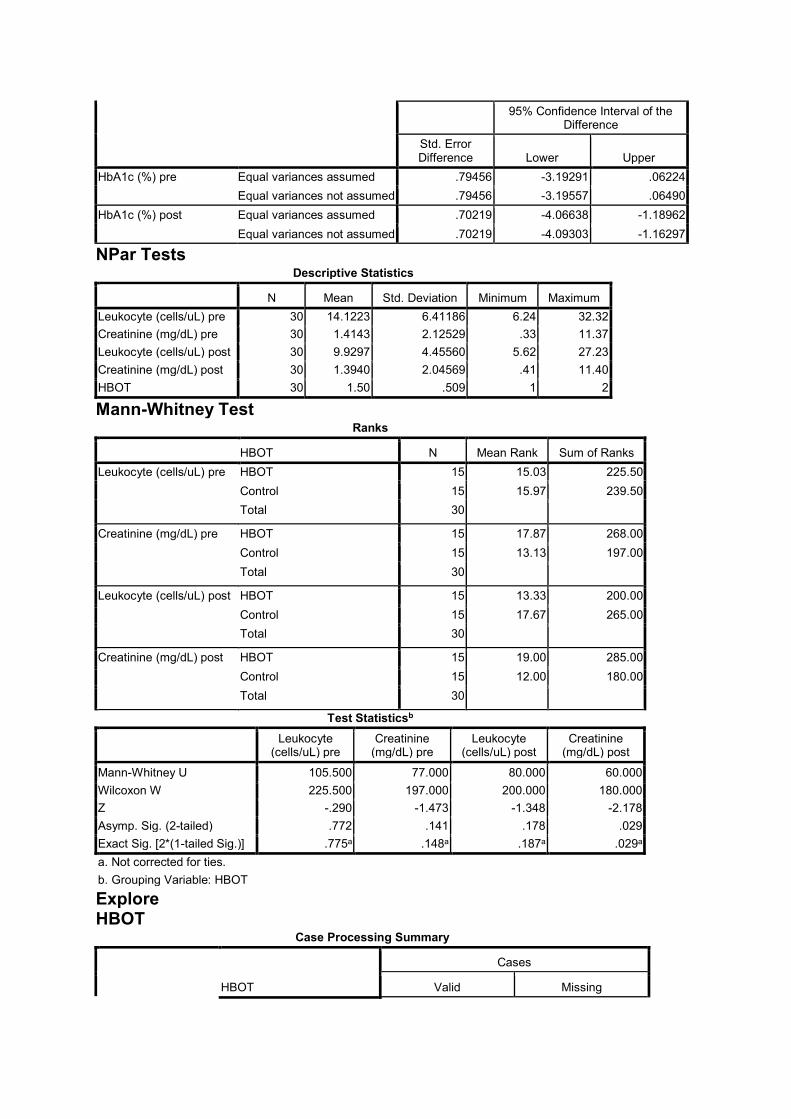
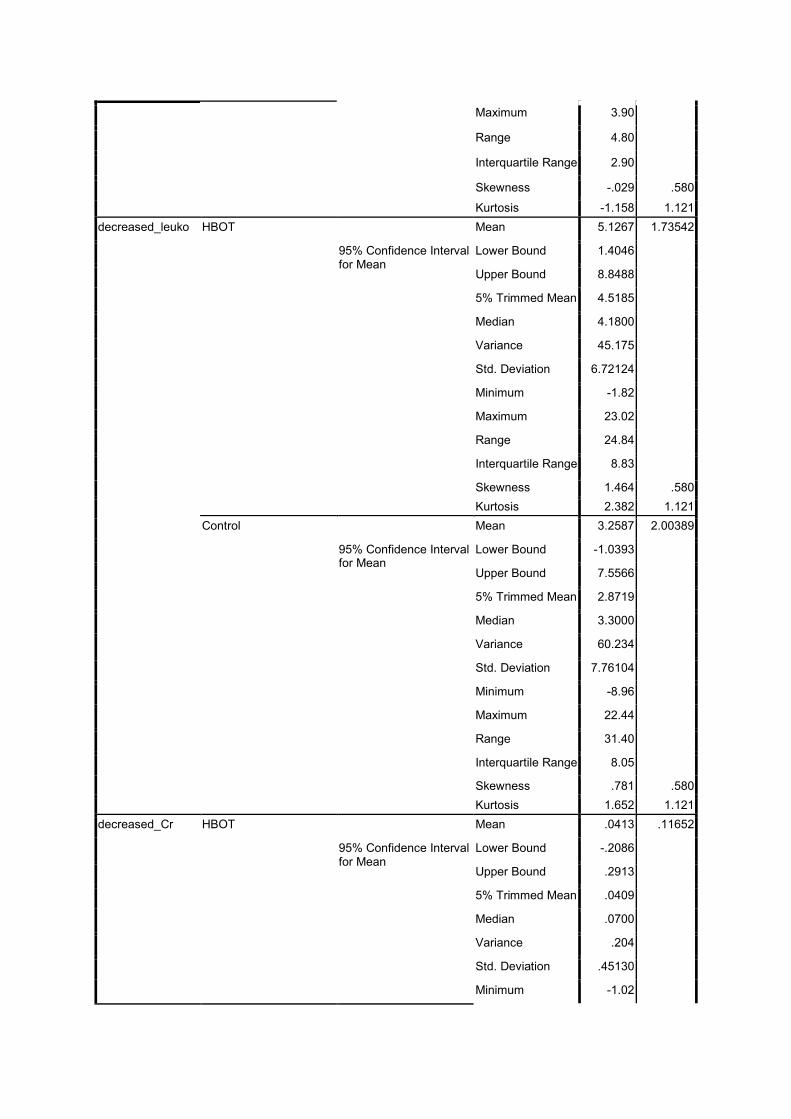
Baseline of leukocyte count and the end of therapy between groups (Table 3) were not
significant (p = 0.772 and p = 0.178, respectively), although leukocyte count after two weeks in
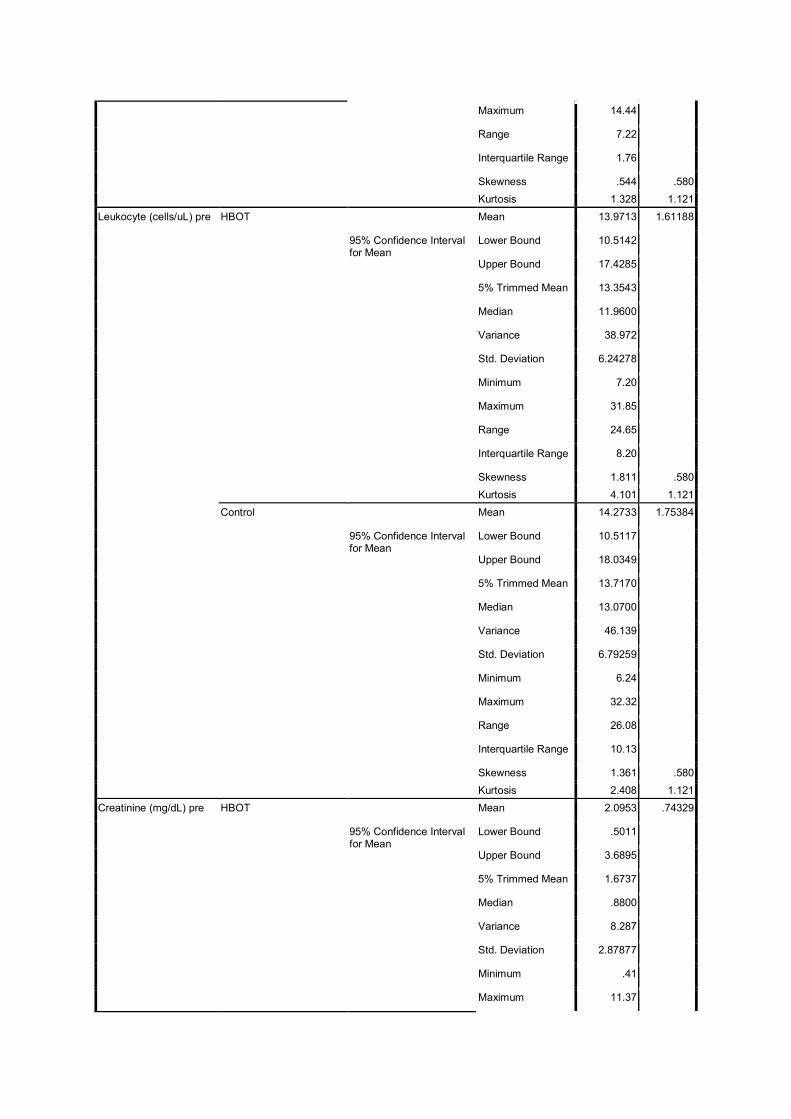
combination therapy group decreased higher than standard therapy group. Leukocyte count in
combination therapy group was significantly decreased from 13.97 ± 6.24 x 10³ cells/µL to 8.84
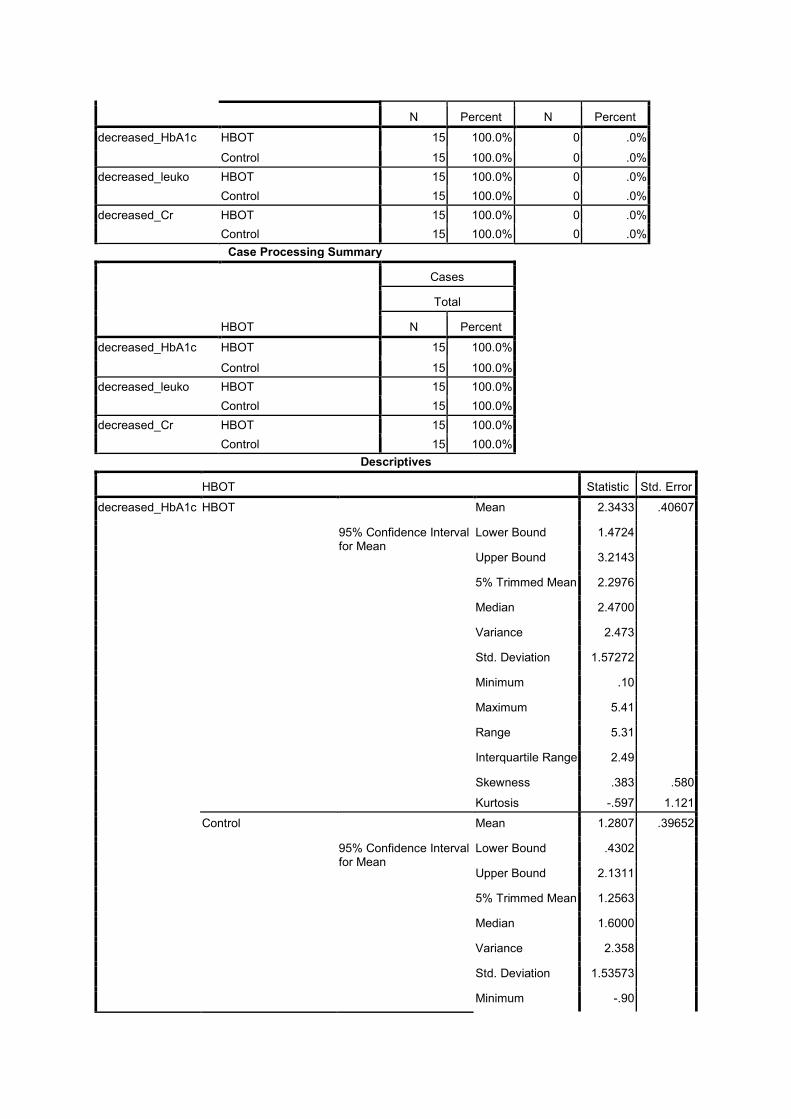
± 2.88 x 10³ cells/µL; p = 0.009. In this study, the effect size of HbA1c and leukocyte count
was not significant difference. At the end of therapy, leukocyte count between debridement and
debridement with amputation was not significant difference. In combination therapy, patients
who did debridement had leukocyte count 8.63 ± 3.04 x 10³ cells/µL compared with
debridement with toe amputation 9.17 ± 2.84 x 10³ cells/µL. Compared with standard therapy,
the leukocyte count was higher in debridement and debridement with amputation (11.2 ± 6.30 x
103 cells/µL, 10.74 ± 4.62 x 10³ cells/µL, respectively).
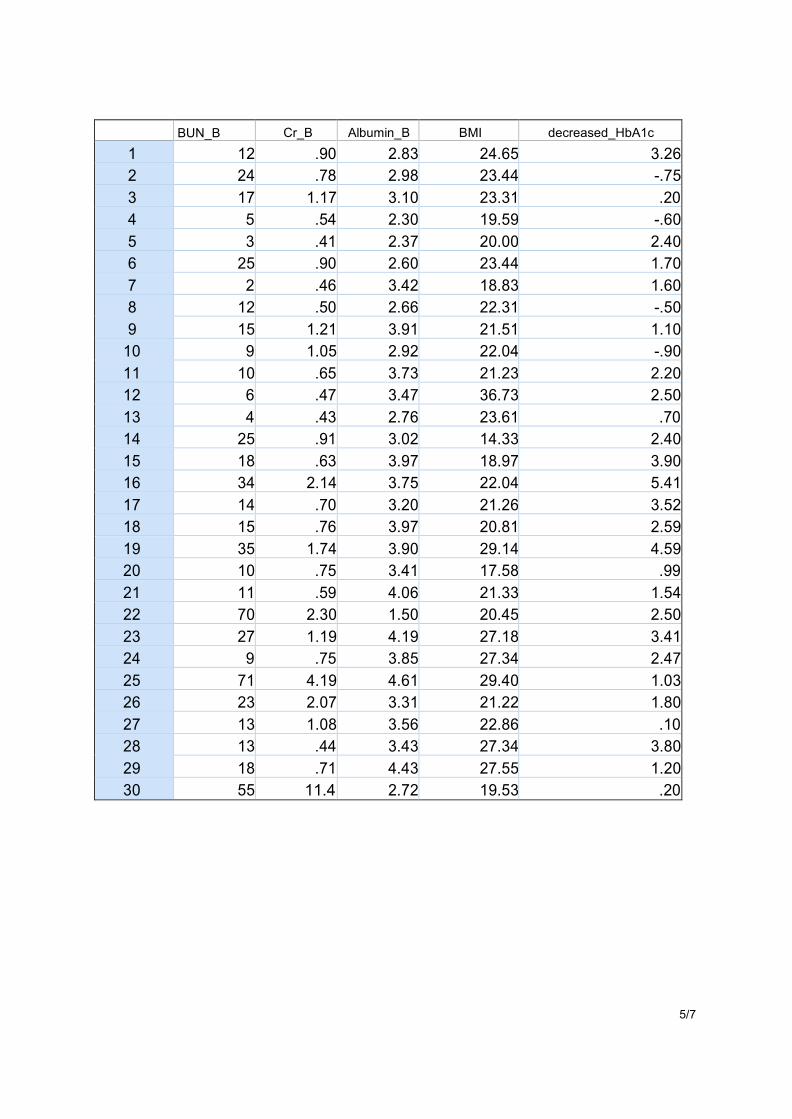
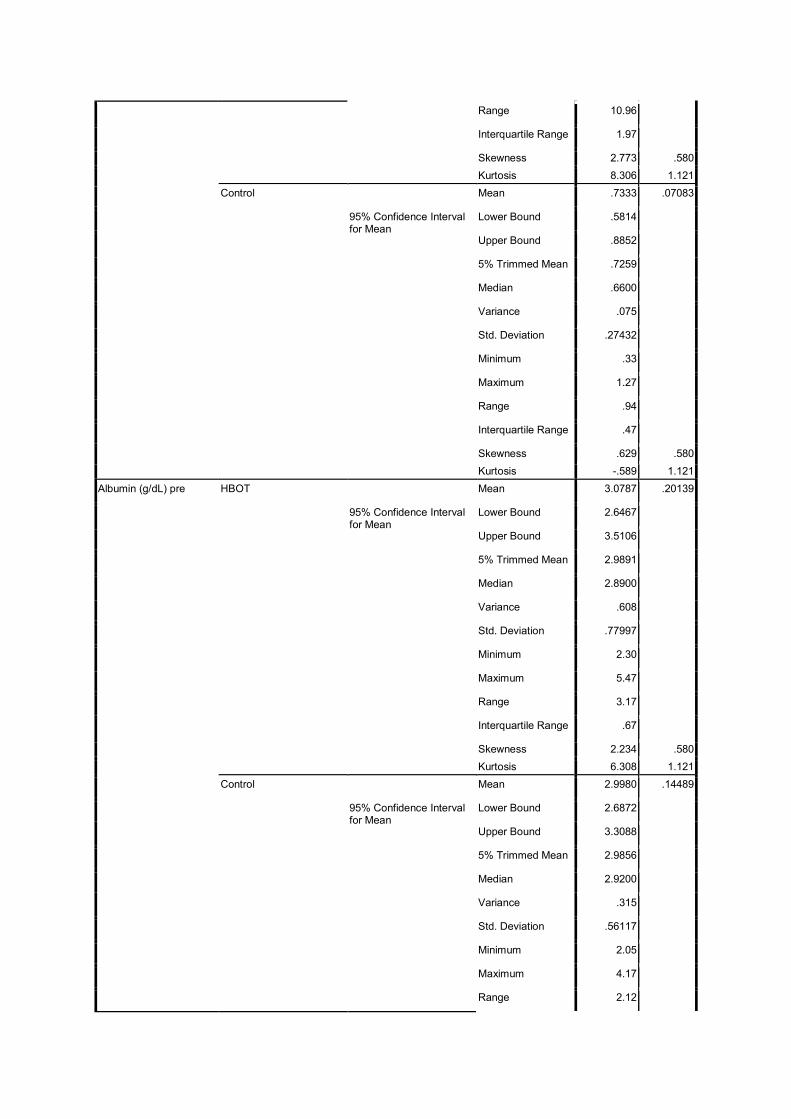
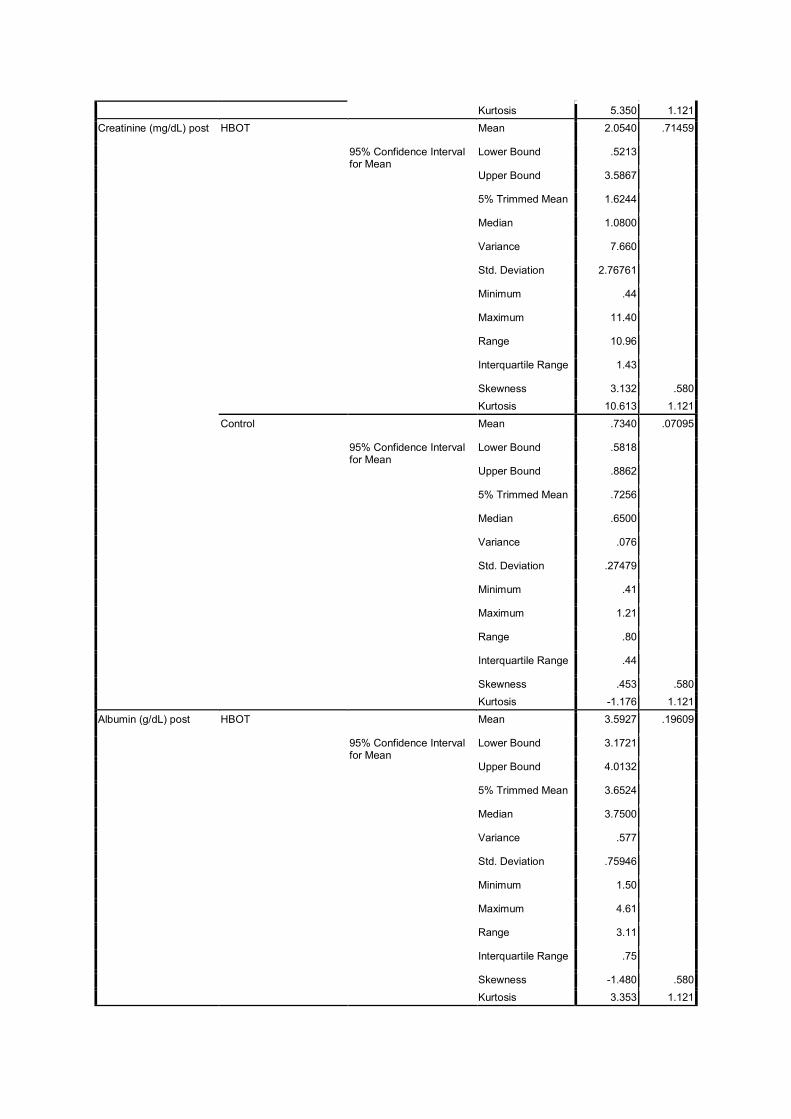
In Table 4, the baseline and after two weeks of serum creatinine levels were not
comparable because in standard therapy group had good renal function, whereas in combination

therapy group had impaired renal function. In standard therapy group, serum creatinine levels
were stable, but serum creatinine levels were little decreased in combination therapy group. The
effect size was not significant decrease in serum creatinine level (p = 0.732) between groups.
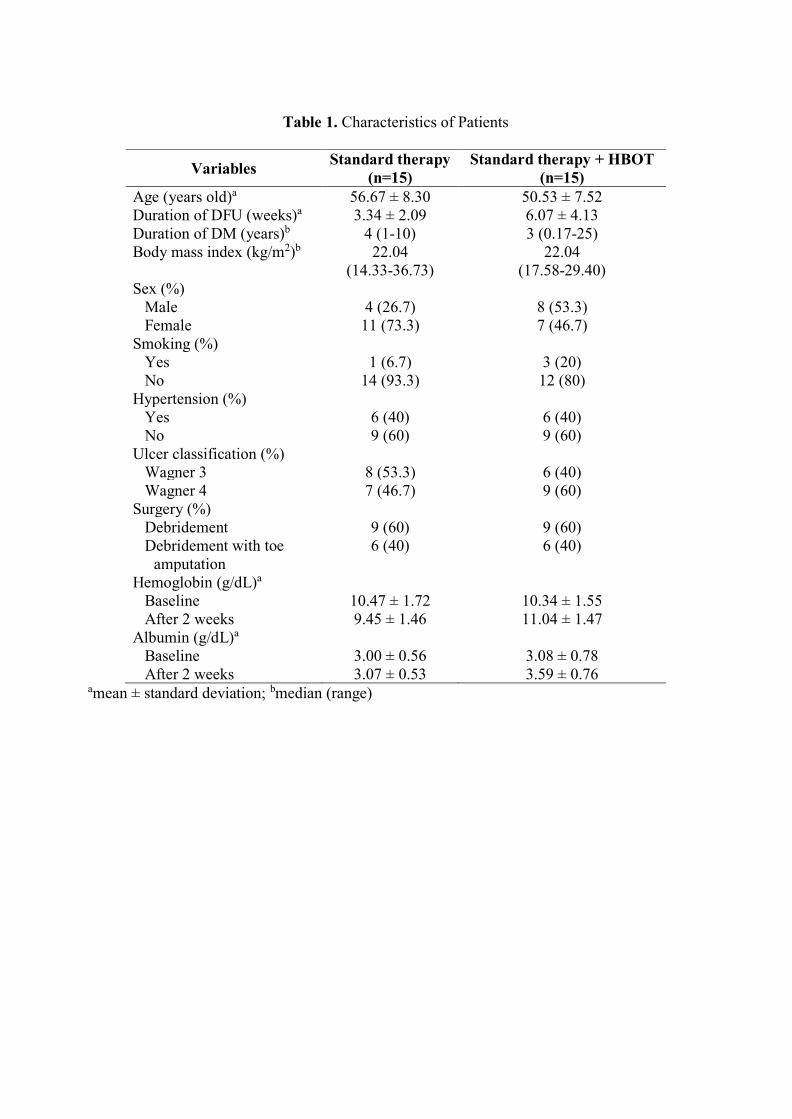
Table 1. Characteristics of Patients
Variables Standard therapy
(n=15)
Standard therapy + HBOT
(n=15)
Age (years old)a 56.67 ± 8.30 50.53 ± 7.52
Duration of DFU (weeks)a 3.34 ± 2.09 6.07 ± 4.13
Duration of DM (years)b 4 (1-10) 3 (0.17-25)
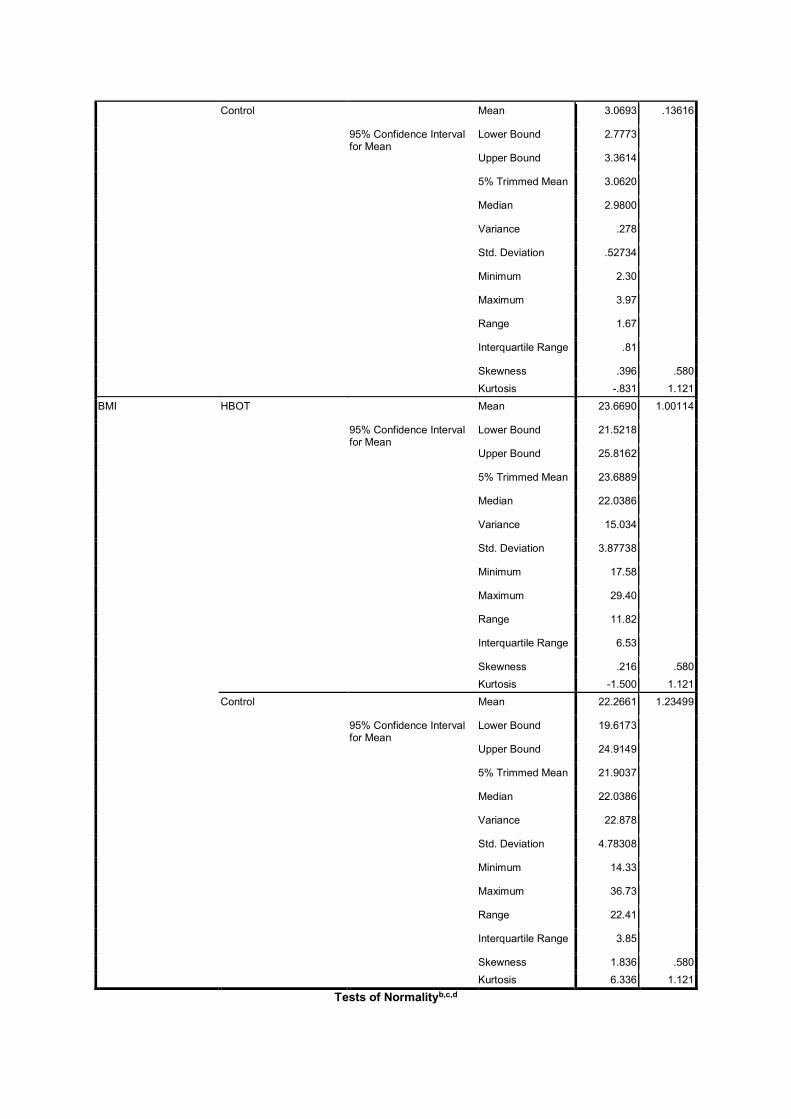
Body mass index (kg/m2)b 22.04
(14.33-36.73)
22.04
(17.58-29.40)
Sex (%)
Male 4 (26.7) 8 (53.3)
Female 11 (73.3) 7 (46.7)
Smoking (%)
Yes 1 (6.7) 3 (20)
No 14 (93.3) 12 (80)
Hypertension (%)
Yes 6 (40) 6 (40)
No 9 (60) 9 (60)
Ulcer classification (%)
Wagner 3 8 (53.3) 6 (40)
Wagner 4 7 (46.7) 9 (60)
Surgery (%)
Debridement 9 (60) 9 (60)
Debridement with toe
amputation
6 (40) 6 (40)
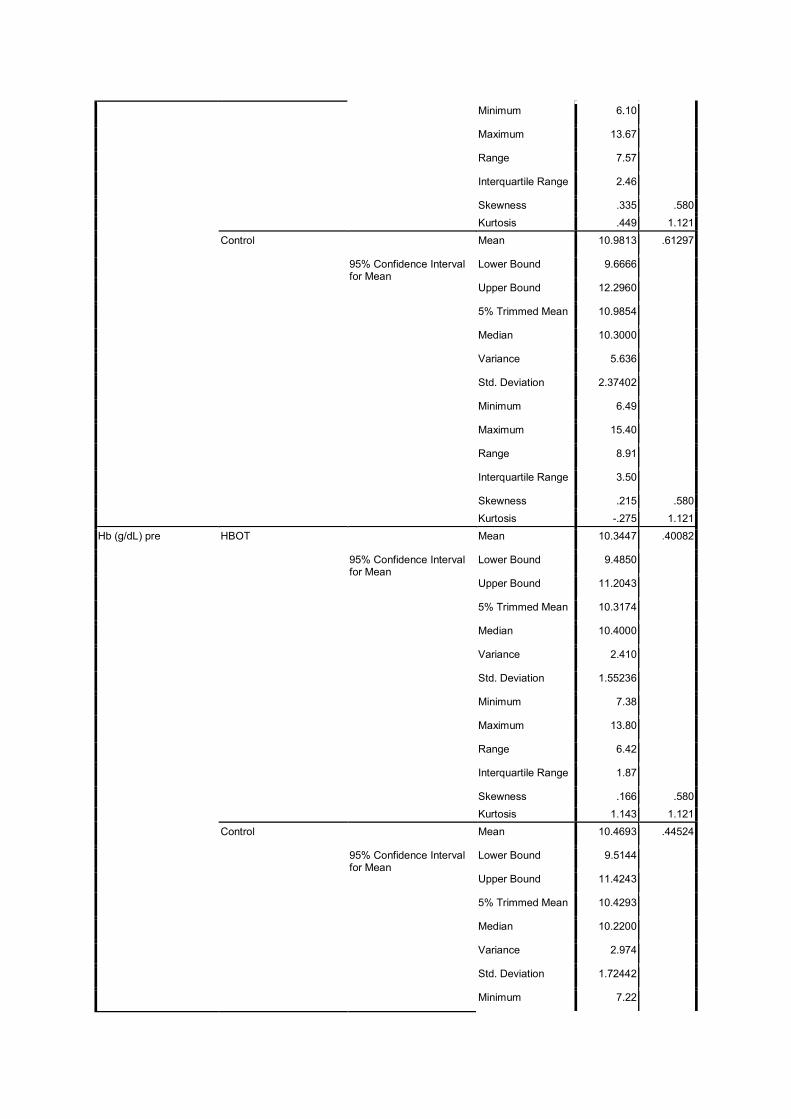
Hemoglobin (g/dL)a
Baseline 10.47 ± 1.72 10.34 ± 1.55
After 2 weeks 9.45 ± 1.46 11.04 ± 1.47
Albumin (g/dL)a
Baseline 3.00 ± 0.56 3.08 ± 0.78
After 2 weeks 3.07 ± 0.53 3.59 ± 0.76 amean ± standard deviation; bmedian (range)
Table 2. HbA1c levels between groups
HbA1c (%)
Standard
therapy
95% CI Combination
therapy
95% CI
p
Lower Upper Lower Upper
Baseline 10.98 ± 2.37 9.67 12.30 9.42 ± 1.96 8.33 10.50 0.059
After 2 weeks 9.70 ± 2.46 8.34 11.06 7.07 ± 1.16 6.43 7.72 0.001*
Effect size 1.28 ± 1.54 0.43 2.13 2.34 ± 1.57 1.47 3.21 0.072
p 0.006* < 0.001*
All values were mean ± standard deviation; *p value < 0.05
Table 3. Leukocyte count between groups
Leukocyte
(103 cells/µL)
Standard
therapy
95% CI Combination
therapy
95% CI
p
Lower Upper Lower Upper
Baseline 14.27 ± 6.79 10.51 18.03 13.97 ± 6.24 10.51 17.43 0.772
After 2 weeks 11.01 ± 5.51 7.96 14.07 8.84 ± 2.88 7.26 10.43 0.178
Effect size 3.26 ± 7.76 -1.04 7.56 5.13 ± 6.72 1.40 8.85 0.468
p 0.14 0.009*
All values were mean ± standard deviation; *p value < 0.05
Table 4. Serum creatinine levels between groups
Serum creatinine
(mg/dL)
Standard
therapy
95% CI Combination
therapy
95% CI
p
Lower Upper Lower Upper
Baseline 0.73 ± 0.27 0.58 0.89 2.10 ± 2.88 0.50 3.69
After 2 weeks 0.73 ± 0.27 0.58 0.89 2.05 ± 2.77 0.52 3.59
Effect size 0 ± 0.13 -0.07 0.07 0.05 ± 0.45 -0.21 0.29 0.732
p 0.985 0.551
All values were mean ± standard deviation
DATA 30 SAMPEL
No Name Age Sex HBOT
1 4 MS 57 F Control
2 5 DMW 67 F Control
3 23 INS 55 M Control
4 25 KB 53 M Control
5 26 IAN 71 F Control
6 28 IKS 63 F Control
7 29 LP 51 F Control
8 30 NKR 48 F Control
9 33 INS 55 M Control
10 38 NNS 59 F Control
11 43 NWM 59 F Control
12 45 RA 46 F Control
13 20 NKR 62 F Control
14 21 NK 40 M Control
15 22 NKS 64 F Control
16 1 KSS 49 F HBOT
17 2 WRA 55 M HBOT
18 3 MP 42 F HBOT
19 9 NKK 43 F HBOT
20 10 KS 50 M HBOT
21 14 KS 46 F HBOT
22 15 WS 55 M HBOT
23 16 IMS 55 M HBOT
24 17 MS 64 F HBOT
25 18 MGS 49 M HBOT
26 24 MW 54 M HBOT
27 32 INS 55 M HBOT
28 34 WS 50 F HBOT
29 36 FF 33 F HBOT
30 40 IWS 58 M HBOT
1/7
Smoking Hypertension DurDM DurUlcer Wagner Foot
1 No Yes 6.00 4.00 4 Right
2 No Yes 10.00
6.00 4 Right
3 No Yes 7.00 1.00 3 Left
4 Yes No 3.00 2.00 4 Right
5 No No 4.00 1.00 4 Right
6 No No 8.00 6.00 3 Right
7 No No 1.00 3.00 4 Right
8 No No 3.00 2.00 3 Left
9 No Yes 7.00 4.00 3 Right
10 No Yes 3.00 1.00 3 Right
11 No No 3.00 4.00 3 Left
12 No Yes 10.00
2.14 3 Right
13 No No 2.00 2.00 4 Left
14 No No 9.00 8.00 3 Right
15 No No 1.00 4.00 4 Left
16 No No 3.00 8.00 4 Left
17 Yes No 10.00
4.00 4 Right
18 No No .17 8.00 4 Right
19 No No 3.00 3.00 3 Right
20 No No 5.00 8.00 4 Left
21 No No 1.00 4.00 4 Right
22 No Yes 25.00
6.00 4 Right
23 No No .17 8.00 3 Right
24 No No 3.00 1.00 3 Left
25 No Yes 9.00 6.00 3 Right
26 Yes Yes 14.00
1.00 4 Left
27 No Yes .50 2.00 4 Right
28 No No 5.00 4.00 3 Left
29 No Yes 5.00 16.00
3 Left
30 Yes Yes 2.50 12.00
4 Left
2/7
Weight Height Surgery HbA1c_A Hb_A Leukocyte_A
1 60 156 Debri+amputasi
8.83 9.18 19.50
2 60 160 Debri+amputasi
6.49 10.90 11.00
3 65 167 Debridemen
10.50 10.22 32.32
4 60 175 Debridemen
11.40 11.05 19.78
5 45 150 Debri+amputasi
15.40 12.83 14.19
6 60 160 Debridemen
9.00 11.24 15.94
7 47 158 Debridemen
13.10 9.75 21.31
8 55 157 Debridemen
9.60 10.14 13.07
9 60 167 Debri+amputasi
9.80 9.96 9.37
10 60 165 Debridemen
14.10 11.70 13.13
11 51 155 Debridemen
10.20 7.22 11.15
12 100 165 Debridemen
12.60 14.44 7.67
13 56 154 Debri+amputasi
9.70 9.48 12.30
14 39 165 Debridemen
10.30 8.60 7.13
15 41 147 Debri+amputasi
13.70 10.33 6.24
16 60 165 Debridemen
13.67 10.40 11.91
17 60 168 Debri+amputasi
10.15 9.00 12.25
18 50 155 Debri+amputasi
7.99 7.38 7.86
19 70 155 Debridemen
11.96 10.80 10.62
20 45 160 Debri+amputasi
10.45 9.90 7.20
21 48 150 Debridemen
10.11 10.69 13.13
22 53 161 Debridemen
8.77 11.30 13.90
23 74 165 Debridemen
10.70 10.20 11.68
24 70 160 Debridemen
9.51 11.30 18.82
25 82 167 Debridemen
6.83 8.10 19.30
26 65 175 Debri+amputasi
8.60 10.44 8.76
27 70 175 Debri+amputasi
7.30 12.06 31.85
28 70 160 Debridemen
9.70 10.37 11.14
29 75 165 Debridemen
9.40 13.80 19.19
30 50 160 Debri+amputasi
6.10 9.43 11.96
3/7
BUN_A Cr_A Albumin_A HbA1c_B Hb_B Leukocyte_B
1 10 .68 2.41 5.57 8.52 10.07
2 14 .90 3.20 7.24 8.33 19.96
3 24 1.27 3.23 10.30 6.58 9.88
4 11 .68 2.59 12.00 8.85 27.23
5 16 .33 3.27 13.00 9.32 7.96
6 27 1.00 2.50 7.30 11.45 12.64
7 6 .61 2.57 11.50 8.73 9.90
8 15 .44 3.16 10.10 9.36 10.67
9 16 1.13 3.55 8.70 11.09 9.82
10 23 1.06 2.05 15.00 8.88 6.64
11 16 .66 2.92 8.00 9.27 7.21
12 20 .56 4.17 10.10 12.10 9.23
13 9 .52 2.74 9.00 8.09 7.70
14 13 .63 2.84 7.90 10.53 7.40
15 17 .53 3.77 9.80 10.68 8.91
16 68 2.62 3.02 8.26 11.60 5.62
17 8 .78 3.28 6.63 11.47 13.47
18 8 .41 2.84 5.40 10.50 7.11
19 6 .72 2.89 7.37 10.60 12.44
20 9 .50 5.47 9.46 11.60 6.35
21 5 .43 3.45 8.57 13.70 6.73
22 31 2.48 2.61 6.27 8.30 14.25
23 14 1.10 2.30 7.29 11.10 7.41
24 20 .88 3.18 7.04 12.60 5.78
25 75 5.30 2.30 5.80 9.50 8.28
26 25 2.32 2.95 6.80 10.09 7.48
27 15 1.25 2.54 7.20 12.09 8.83
28 11 .51 2.82 5.90 10.72 6.96
29 21 .76 3.83 8.20 12.76 10.18
30 50 11.37
2.70 5.90 8.96 11.78
4/7
BUN_B Cr_B Albumin_B BMI decreased_HbA1c
1 12 .90 2.83 24.65 3.26
2 24 .78 2.98 23.44 -.75
3 17 1.17 3.10 23.31 .20
4 5 .54 2.30 19.59 -.60
5 3 .41 2.37 20.00 2.40
6 25 .90 2.60 23.44 1.70
7 2 .46 3.42 18.83 1.60
8 12 .50 2.66 22.31 -.50
9 15 1.21 3.91 21.51 1.10
10 9 1.05 2.92 22.04 -.90
11 10 .65 3.73 21.23 2.20
12 6 .47 3.47 36.73 2.50
13 4 .43 2.76 23.61 .70
14 25 .91 3.02 14.33 2.40
15 18 .63 3.97 18.97 3.90
16 34 2.14 3.75 22.04 5.41
17 14 .70 3.20 21.26 3.52
18 15 .76 3.97 20.81 2.59
19 35 1.74 3.90 29.14 4.59
20 10 .75 3.41 17.58 .99
21 11 .59 4.06 21.33 1.54
22 70 2.30 1.50 20.45 2.50
23 27 1.19 4.19 27.18 3.41
24 9 .75 3.85 27.34 2.47
25 71 4.19 4.61 29.40 1.03
26 23 2.07 3.31 21.22 1.80
27 13 1.08 3.56 22.86 .10
28 13 .44 3.43 27.34 3.80
29 18 .71 4.43 27.55 1.20
30 55 11.40
2.72 19.53 .20
5/7
decreased_leuko decreased_Cr increased_Hb
1 9.43 -.22 -.66
2 -8.96 .12 -2.57
3 22.44 .10 -3.64
4 -7.45 .14 -2.20
5 6.23 -.08 -3.51
6 3.30 .10 .21
7 11.41 .15 -1.02
8 2.40 -.06 -.78
9 -.45 -.08 1.13
10 6.49 .01 -2.82
11 3.94 .01 2.05
12 -1.56 .09 -2.34
13 4.60 .09 -1.39
14 -.27 -.28 1.93
15 -2.67 -.10 .35
16 6.29 .48 1.20
17 -1.22 .08 2.47
18 .75 -.35 3.12
19 -1.82 -1.02 -.20
20 .85 -.25 1.70
21 6.40 -.16 3.01
22 -.35 .18 -3.00
23 4.27 -.09 .90
24 13.04 .13 1.30
25 11.02 1.11 1.40
26 1.28 .25 -.35
27 23.02 .17 .03
28 4.18 .07 .35
29 9.01 .05 -1.04
30 .18 -.03 -.47
6/7
increased_Alb
1 .42
2 -.22
3 -.13
4 -.29
5 -.90
6 .10
7 .85
8 -.50
9 .36
10 .87
11 .81
12 -.70
13 .02
14 .18
15 .20
16 .73
17 -.08
18 1.13
19 1.01
20 -2.06
21 .61
22 -1.11
23 1.89
24 .67
25 2.31
26 .36
27 1.02
28 .61
29 .60
30 .02
7/7
STATISTIC ANALISIS
Explore HBOT
Case Processing Summary
HBOT
Cases
Valid Missing Total
N Percent N Percent N Percent
Age HBOT 15 100.0% 0 .0% 15 100.0%
Control 15 100.0% 0 .0% 15 100.0%
Duration DM (years) HBOT 15 100.0% 0 .0% 15 100.0%
Control 15 100.0% 0 .0% 15 100.0%
Duration DFU (weeks) HBOT 15 100.0% 0 .0% 15 100.0%
Control 15 100.0% 0 .0% 15 100.0%
HbA1c (%) pre HBOT 15 100.0% 0 .0% 15 100.0%
Control 15 100.0% 0 .0% 15 100.0%
Hb (g/dL) pre HBOT 15 100.0% 0 .0% 15 100.0%
Control 15 100.0% 0 .0% 15 100.0%
Leukocyte (cells/uL) pre
HBOT 15 100.0% 0 .0% 15 100.0%
Control 15 100.0% 0 .0% 15 100.0%
Creatinine (mg/dL) pre HBOT 15 100.0% 0 .0% 15 100.0%
Control 15 100.0% 0 .0% 15 100.0%
Albumin (g/dL) pre HBOT 15 100.0% 0 .0% 15 100.0%
Control 15 100.0% 0 .0% 15 100.0%
HbA1c (%) post HBOT 15 100.0% 0 .0% 15 100.0%
Control 15 100.0% 0 .0% 15 100.0%
Hb (g/dL) post HBOT 15 100.0% 0 .0% 15 100.0%
Control 15 100.0% 0 .0% 15 100.0%
Leukocyte (cells/uL) post
HBOT 15 100.0% 0 .0% 15 100.0%
Control 15 100.0% 0 .0% 15 100.0%
Creatinine (mg/dL) post
HBOT 15 100.0% 0 .0% 15 100.0%
Control 15 100.0% 0 .0% 15 100.0%
Albumin (g/dL) post HBOT 15 100.0% 0 .0% 15 100.0%
Control 15 100.0% 0 .0% 15 100.0%
BMI HBOT 15 100.0% 0 .0% 15 100.0%
Control 15 100.0% 0 .0% 15 100.0%
Descriptivesa,b,c
HBOT Statistic Std. Error
Age HBOT Mean 50.53 1.942
95% Confidence Interval for Mean
Lower Bound 46.37
Upper Bound 54.70
5% Trimmed Mean 50.76
Median 50.00
Variance 56.552
Std. Deviation 7.520
Minimum 33
Maximum 64
Range 31
Interquartile Range 9
Skewness -.636 .580
Kurtosis 1.082 1.121
Control Mean 56.67 2.142
95% Confidence Interval for Mean
Lower Bound 52.07
Upper Bound 61.26
5% Trimmed Mean 56.80
Median 57.00
Variance 68.810
Std. Deviation 8.295
Minimum 40
Maximum 71
Range 31
Interquartile Range 12
Skewness -.269 .580
Kurtosis -.150 1.121
Duration DM (years) HBOT Mean 5.7560 1.71073
95% Confidence Interval for Mean
Lower Bound 2.0869
Upper Bound 9.4251
5% Trimmed Mean 4.9972
Median 3.0000
Variance 43.899
Std. Deviation 6.62563
Minimum .17
Maximum 25.00
Range 24.83
Interquartile Range 8.00
Skewness 2.011 .580
Kurtosis 4.540 1.121
Control Mean 5.1333 .82154
95% Confidence Interval for Mean
Lower Bound 3.3713
Upper Bound 6.8954
5% Trimmed Mean 5.0926
Median 4.0000
Variance 10.124
Std. Deviation 3.18179
Minimum 1.00
Maximum 10.00
Range 9.00
Interquartile Range 5.00
Skewness .290 .580
Kurtosis -1.408 1.121
Duration DFU (weeks) HBOT Mean 6.0667 1.06667
95% Confidence Interval for Mean
Lower Bound 3.7789
Upper Bound 8.3544
5% Trimmed Mean 5.7963
Median 6.0000
Variance 17.067
Std. Deviation 4.13118
Minimum 1.00
Maximum 16.00
Range 15.00
Interquartile Range 5.00
Skewness .976 .580
Kurtosis 1.047 1.121
Control Mean 3.3427 .53886
95% Confidence Interval for Mean
Lower Bound 2.1869
Upper Bound 4.4984
5% Trimmed Mean 3.2141
Median 3.0000
Variance 4.356
Std. Deviation 2.08701
Minimum 1.00
Maximum 8.00
Range 7.00
Interquartile Range 2.00
Skewness .835 .580
Kurtosis .130 1.121
HbA1c (%) pre HBOT Mean 9.4160 .50556
95% Confidence Interval for Mean
Lower Bound 8.3317
Upper Bound 10.5003
5% Trimmed Mean 9.3639
Median 9.5100
Variance 3.834
Std. Deviation 1.95802
Minimum 6.10
Maximum 13.67
Range 7.57
Interquartile Range 2.46
Skewness .335 .580
Kurtosis .449 1.121
Control Mean 10.9813 .61297
95% Confidence Interval for Mean
Lower Bound 9.6666
Upper Bound 12.2960
5% Trimmed Mean 10.9854
Median 10.3000
Variance 5.636
Std. Deviation 2.37402
Minimum 6.49
Maximum 15.40
Range 8.91
Interquartile Range 3.50
Skewness .215 .580
Kurtosis -.275 1.121
Hb (g/dL) pre HBOT Mean 10.3447 .40082
95% Confidence Interval for Mean
Lower Bound 9.4850
Upper Bound 11.2043
5% Trimmed Mean 10.3174
Median 10.4000
Variance 2.410
Std. Deviation 1.55236
Minimum 7.38
Maximum 13.80
Range 6.42
Interquartile Range 1.87
Skewness .166 .580
Kurtosis 1.143 1.121
Control Mean 10.4693 .44524
95% Confidence Interval for Mean
Lower Bound 9.5144
Upper Bound 11.4243
5% Trimmed Mean 10.4293
Median 10.2200
Variance 2.974
Std. Deviation 1.72442
Minimum 7.22
Maximum 14.44
Range 7.22
Interquartile Range 1.76
Skewness .544 .580
Kurtosis 1.328 1.121
Leukocyte (cells/uL) pre HBOT Mean 13.9713 1.61188
95% Confidence Interval for Mean
Lower Bound 10.5142
Upper Bound 17.4285
5% Trimmed Mean 13.3543
Median 11.9600
Variance 38.972
Std. Deviation 6.24278
Minimum 7.20
Maximum 31.85
Range 24.65
Interquartile Range 8.20
Skewness 1.811 .580
Kurtosis 4.101 1.121
Control Mean 14.2733 1.75384
95% Confidence Interval for Mean
Lower Bound 10.5117
Upper Bound 18.0349
5% Trimmed Mean 13.7170
Median 13.0700
Variance 46.139
Std. Deviation 6.79259
Minimum 6.24
Maximum 32.32
Range 26.08
Interquartile Range 10.13
Skewness 1.361 .580
Kurtosis 2.408 1.121
Creatinine (mg/dL) pre HBOT Mean 2.0953 .74329
95% Confidence Interval for Mean
Lower Bound .5011
Upper Bound 3.6895
5% Trimmed Mean 1.6737
Median .8800
Variance 8.287
Std. Deviation 2.87877
Minimum .41
Maximum 11.37
Range 10.96
Interquartile Range 1.97
Skewness 2.773 .580
Kurtosis 8.306 1.121
Control Mean .7333 .07083
95% Confidence Interval for Mean
Lower Bound .5814
Upper Bound .8852
5% Trimmed Mean .7259
Median .6600
Variance .075
Std. Deviation .27432
Minimum .33
Maximum 1.27
Range .94
Interquartile Range .47
Skewness .629 .580
Kurtosis -.589 1.121
Albumin (g/dL) pre HBOT Mean 3.0787 .20139
95% Confidence Interval for Mean
Lower Bound 2.6467
Upper Bound 3.5106
5% Trimmed Mean 2.9891
Median 2.8900
Variance .608
Std. Deviation .77997
Minimum 2.30
Maximum 5.47
Range 3.17
Interquartile Range .67
Skewness 2.234 .580
Kurtosis 6.308 1.121
Control Mean 2.9980 .14489
95% Confidence Interval for Mean
Lower Bound 2.6872
Upper Bound 3.3088
5% Trimmed Mean 2.9856
Median 2.9200
Variance .315
Std. Deviation .56117
Minimum 2.05
Maximum 4.17
Range 2.12

Interquartile Range .70
Skewness .437 .580
Kurtosis -.001 1.121
HbA1c (%) post HBOT Mean 7.0727 .29966
95% Confidence Interval for Mean
Lower Bound 6.4300
Upper Bound 7.7154
5% Trimmed Mean 7.0330
Median 7.0400
Variance 1.347
Std. Deviation 1.16058
Minimum 5.40
Maximum 9.46
Range 4.06
Interquartile Range 2.30
Skewness .502 .580
Kurtosis -.389 1.121
Control Mean 9.7007 .63504
95% Confidence Interval for Mean
Lower Bound 8.3386
Upper Bound 11.0627
5% Trimmed Mean 9.6357
Median 9.8000
Variance 6.049
Std. Deviation 2.45951
Minimum 5.57
Maximum 15.00
Range 9.43
Interquartile Range 3.60
Skewness .508 .580
Kurtosis .216 1.121
Hb (g/dL) post HBOT Mean 11.0393 .37848
95% Confidence Interval for Mean
Lower Bound 10.2276
Upper Bound 11.8511
5% Trimmed Mean 11.0437
Median 11.1000
Variance 2.149
Std. Deviation 1.46584
Minimum 8.30
Maximum 13.70
Range 5.40
Interquartile Range 2.00
Skewness -.131 .580
Kurtosis -.251 1.121
Control Mean 9.4520 .37707
95% Confidence Interval for Mean
Lower Bound 8.6433
Upper Bound 10.2607
5% Trimmed Mean 9.4644
Median 9.2700
Variance 2.133
Std. Deviation 1.46038
Minimum 6.58
Maximum 12.10
Range 5.52
Interquartile Range 2.16
Skewness .127 .580
Kurtosis -.139 1.121
Leukocyte (cells/uL) post HBOT Mean 8.8447 .74073
95% Confidence Interval for Mean
Lower Bound 7.2560
Upper Bound 10.4334
5% Trimmed Mean 8.7235
Median 7.4800
Variance 8.230
Std. Deviation 2.86884
Minimum 5.62
Maximum 14.25
Range 8.63
Interquartile Range 5.05
Skewness .789 .580
Kurtosis -.784 1.121
Control Mean 11.0147 1.42290
95% Confidence Interval for Mean
Lower Bound 7.9628
Upper Bound 14.0665
5% Trimmed Mean 10.3569
Median 9.8200
Variance 30.370
Std. Deviation 5.51088
Minimum 6.64
Maximum 27.23
Range 20.59
Interquartile Range 2.97
Skewness 2.321 .580
Kurtosis 5.350 1.121
Creatinine (mg/dL) post HBOT Mean 2.0540 .71459
95% Confidence Interval for Mean
Lower Bound .5213
Upper Bound 3.5867
5% Trimmed Mean 1.6244
Median 1.0800
Variance 7.660
Std. Deviation 2.76761
Minimum .44
Maximum 11.40
Range 10.96
Interquartile Range 1.43
Skewness 3.132 .580
Kurtosis 10.613 1.121
Control Mean .7340 .07095
95% Confidence Interval for Mean
Lower Bound .5818
Upper Bound .8862
5% Trimmed Mean .7256
Median .6500
Variance .076
Std. Deviation .27479
Minimum .41
Maximum 1.21
Range .80
Interquartile Range .44
Skewness .453 .580
Kurtosis -1.176 1.121
Albumin (g/dL) post HBOT Mean 3.5927 .19609
95% Confidence Interval for Mean
Lower Bound 3.1721
Upper Bound 4.0132
5% Trimmed Mean 3.6524
Median 3.7500
Variance .577
Std. Deviation .75946
Minimum 1.50
Maximum 4.61
Range 3.11
Interquartile Range .75
Skewness -1.480 .580
Kurtosis 3.353 1.121
Control Mean 3.0693 .13616
95% Confidence Interval for Mean
Lower Bound 2.7773
Upper Bound 3.3614
5% Trimmed Mean 3.0620
Median 2.9800
Variance .278
Std. Deviation .52734
Minimum 2.30
Maximum 3.97
Range 1.67
Interquartile Range .81
Skewness .396 .580
Kurtosis -.831 1.121
BMI HBOT Mean 23.6690 1.00114
95% Confidence Interval for Mean
Lower Bound 21.5218
Upper Bound 25.8162
5% Trimmed Mean 23.6889
Median 22.0386
Variance 15.034
Std. Deviation 3.87738
Minimum 17.58
Maximum 29.40
Range 11.82
Interquartile Range 6.53
Skewness .216 .580
Kurtosis -1.500 1.121
Control Mean 22.2661 1.23499
95% Confidence Interval for Mean
Lower Bound 19.6173
Upper Bound 24.9149
5% Trimmed Mean 21.9037
Median 22.0386
Variance 22.878
Std. Deviation 4.78308
Minimum 14.33
Maximum 36.73
Range 22.41
Interquartile Range 3.85
Skewness 1.836 .580
Kurtosis 6.336 1.121
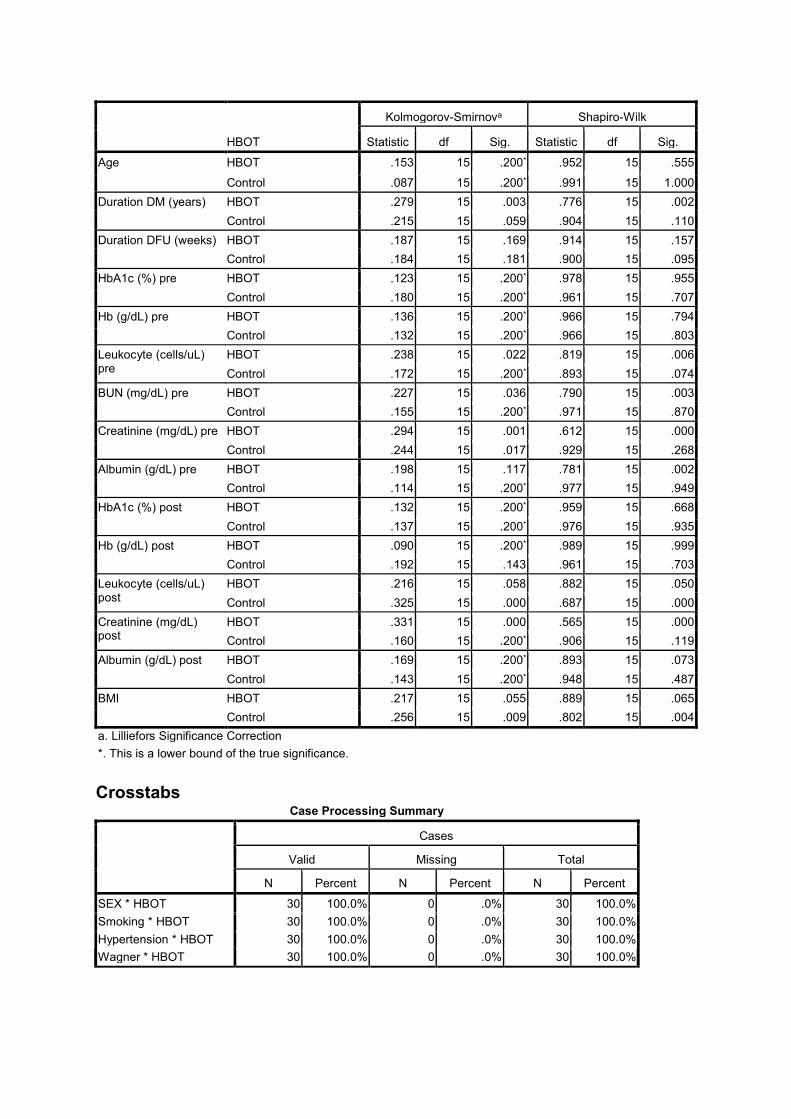
Tests of Normalityb,c,d
HBOT
Kolmogorov-Smirnova Shapiro-Wilk
Statistic df Sig. Statistic df Sig.
Age HBOT .153 15 .200* .952 15 .555
Control .087 15 .200* .991 15 1.000
Duration DM (years) HBOT .279 15 .003 .776 15 .002
Control .215 15 .059 .904 15 .110
Duration DFU (weeks) HBOT .187 15 .169 .914 15 .157
Control .184 15 .181 .900 15 .095
HbA1c (%) pre HBOT .123 15 .200* .978 15 .955
Control .180 15 .200* .961 15 .707
Hb (g/dL) pre HBOT .136 15 .200* .966 15 .794
Control .132 15 .200* .966 15 .803
Leukocyte (cells/uL) pre
HBOT .238 15 .022 .819 15 .006
Control .172 15 .200* .893 15 .074
BUN (mg/dL) pre HBOT .227 15 .036 .790 15 .003
Control .155 15 .200* .971 15 .870
Creatinine (mg/dL) pre HBOT .294 15 .001 .612 15 .000
Control .244 15 .017 .929 15 .268
Albumin (g/dL) pre HBOT .198 15 .117 .781 15 .002
Control .114 15 .200* .977 15 .949
HbA1c (%) post HBOT .132 15 .200* .959 15 .668
Control .137 15 .200* .976 15 .935
Hb (g/dL) post HBOT .090 15 .200* .989 15 .999
Control .192 15 .143 .961 15 .703
Leukocyte (cells/uL) post
HBOT .216 15 .058 .882 15 .050
Control .325 15 .000 .687 15 .000
Creatinine (mg/dL) post
HBOT .331 15 .000 .565 15 .000
Control .160 15 .200* .906 15 .119
Albumin (g/dL) post HBOT .169 15 .200* .893 15 .073
Control .143 15 .200* .948 15 .487
BMI HBOT .217 15 .055 .889 15 .065
Control .256 15 .009 .802 15 .004
a. Lilliefors Significance Correction
*. This is a lower bound of the true significance.
Crosstabs
Case Processing Summary
Cases
Valid Missing Total
N Percent N Percent N Percent
SEX * HBOT 30 100.0% 0 .0% 30 100.0%
Smoking * HBOT 30 100.0% 0 .0% 30 100.0%
Hypertension * HBOT 30 100.0% 0 .0% 30 100.0%
Wagner * HBOT 30 100.0% 0 .0% 30 100.0%
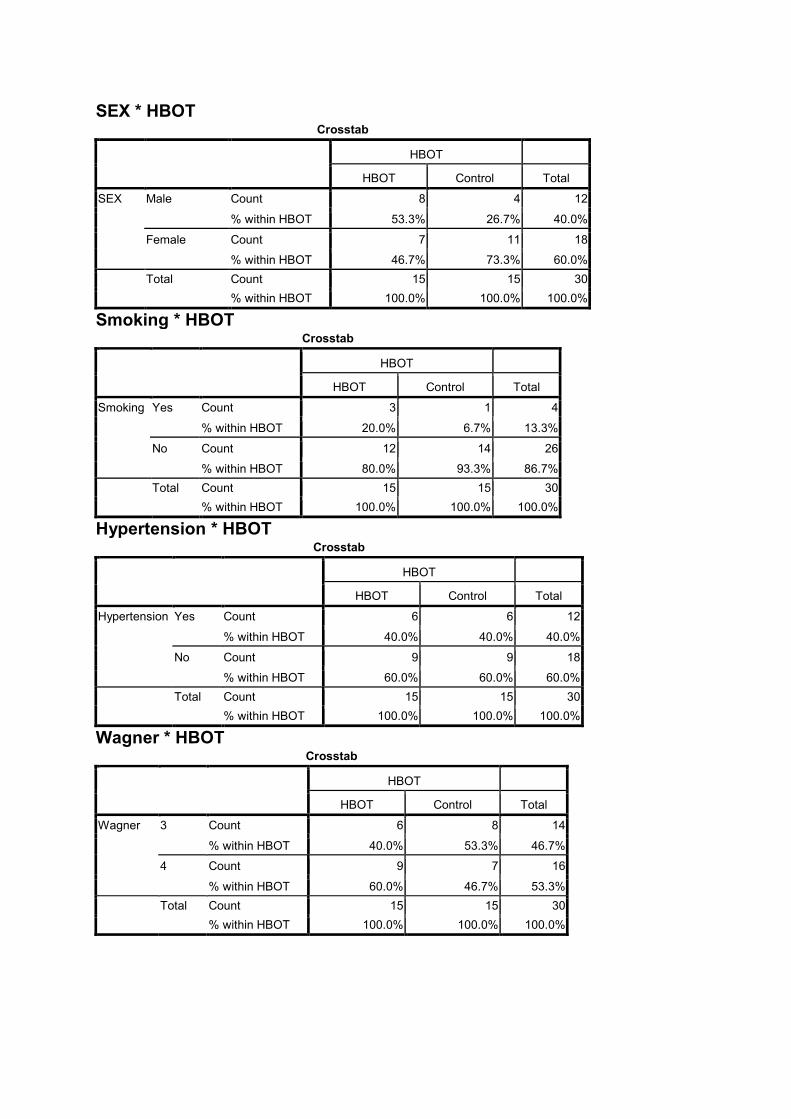
SEX * HBOT Crosstab
HBOT
HBOT Control Total
SEX Male Count 8 4 12
% within HBOT 53.3% 26.7% 40.0%
Female Count 7 11 18
% within HBOT 46.7% 73.3% 60.0%
Total Count 15 15 30
% within HBOT 100.0% 100.0% 100.0%
Smoking * HBOT Crosstab
HBOT
HBOT Control Total
Smoking Yes Count 3 1 4
% within HBOT 20.0% 6.7% 13.3%
No Count 12 14 26
% within HBOT 80.0% 93.3% 86.7%
Total Count 15 15 30
% within HBOT 100.0% 100.0% 100.0%
Hypertension * HBOT Crosstab
HBOT
HBOT Control Total
Hypertension Yes Count 6 6 12
% within HBOT 40.0% 40.0% 40.0%
No Count 9 9 18
% within HBOT 60.0% 60.0% 60.0%
Total Count 15 15 30
% within HBOT 100.0% 100.0% 100.0%
Wagner * HBOT Crosstab
HBOT
HBOT Control Total
Wagner 3 Count 6 8 14
% within HBOT 40.0% 53.3% 46.7%
4 Count 9 7 16
% within HBOT 60.0% 46.7% 53.3%
Total Count 15 15 30
% within HBOT 100.0% 100.0% 100.0%
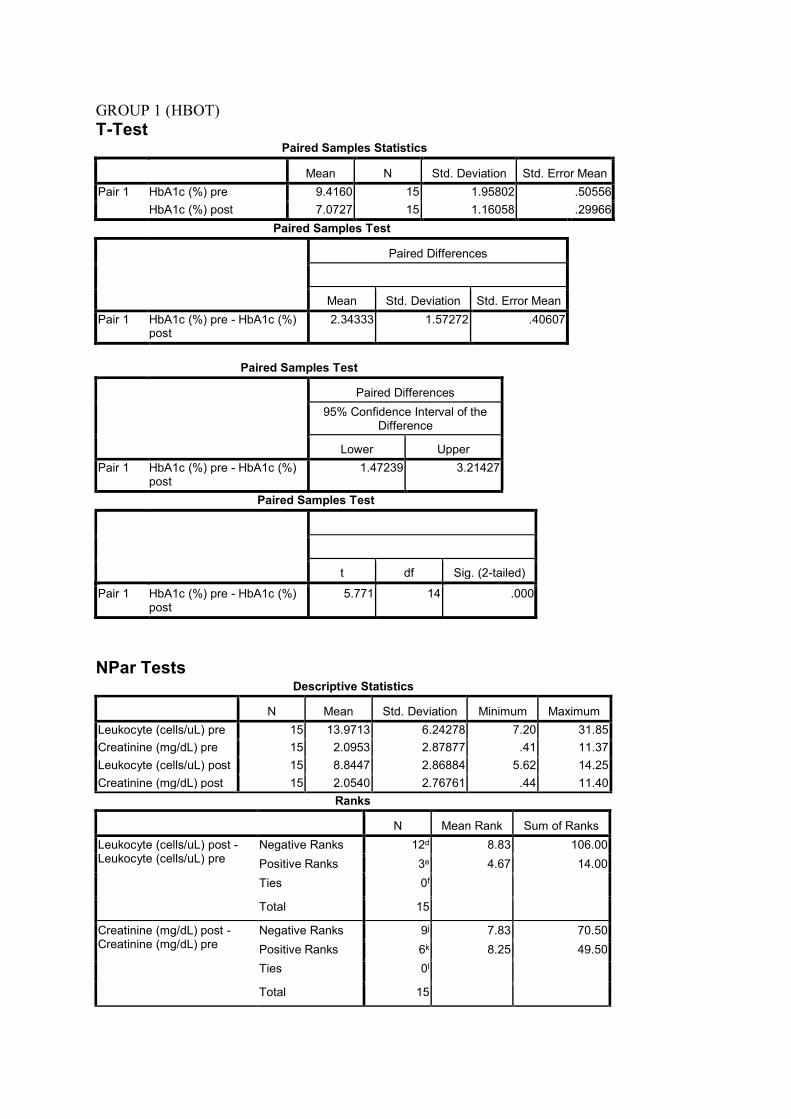
GROUP 1 (HBOT)
T-Test Paired Samples Statistics
Mean N Std. Deviation Std. Error Mean
Pair 1 HbA1c (%) pre 9.4160 15 1.95802 .50556
HbA1c (%) post 7.0727 15 1.16058 .29966
Paired Samples Test
Paired Differences
Mean Std. Deviation Std. Error Mean
Pair 1 HbA1c (%) pre - HbA1c (%) post
2.34333 1.57272 .40607
Paired Samples Test
Paired Differences
95% Confidence Interval of the Difference
Lower Upper
Pair 1 HbA1c (%) pre - HbA1c (%) post
1.47239 3.21427
Paired Samples Test
t df Sig. (2-tailed)
Pair 1 HbA1c (%) pre - HbA1c (%) post
5.771 14 .000
NPar Tests
Descriptive Statistics
N Mean Std. Deviation Minimum Maximum
Leukocyte (cells/uL) pre 15 13.9713 6.24278 7.20 31.85
Creatinine (mg/dL) pre 15 2.0953 2.87877 .41 11.37
Leukocyte (cells/uL) post 15 8.8447 2.86884 5.62 14.25
Creatinine (mg/dL) post 15 2.0540 2.76761 .44 11.40
Ranks
N Mean Rank Sum of Ranks
Leukocyte (cells/uL) post - Leukocyte (cells/uL) pre
Negative Ranks 12d 8.83 106.00
Positive Ranks 3e 4.67 14.00
Ties 0f
Total 15
Creatinine (mg/dL) post - Creatinine (mg/dL) pre
Negative Ranks 9j 7.83 70.50
Positive Ranks 6k 8.25 49.50
Ties 0l
Total 15
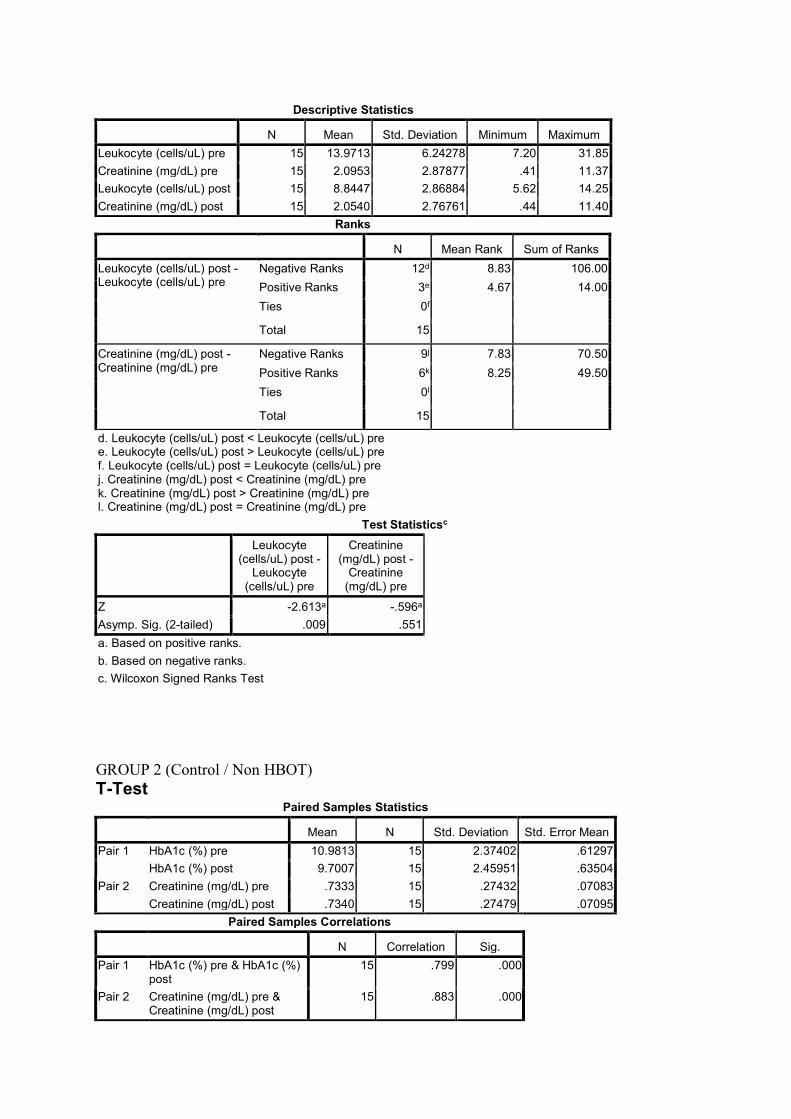
d. Leukocyte (cells/uL) post < Leukocyte (cells/uL) pre e. Leukocyte (cells/uL) post > Leukocyte (cells/uL) pre f. Leukocyte (cells/uL) post = Leukocyte (cells/uL) pre j. Creatinine (mg/dL) post < Creatinine (mg/dL) pre k. Creatinine (mg/dL) post > Creatinine (mg/dL) pre l. Creatinine (mg/dL) post = Creatinine (mg/dL) pre
Test Statisticsc
Leukocyte (cells/uL) post -
Leukocyte (cells/uL) pre
Creatinine (mg/dL) post -
Creatinine (mg/dL) pre
Z -2.613a -.596a
Asymp. Sig. (2-tailed) .009 .551
a. Based on positive ranks.
b. Based on negative ranks.
c. Wilcoxon Signed Ranks Test
GROUP 2 (Control / Non HBOT)
T-Test Paired Samples Statistics
Mean N Std. Deviation Std. Error Mean
Pair 1 HbA1c (%) pre 10.9813 15 2.37402 .61297
HbA1c (%) post 9.7007 15 2.45951 .63504
Pair 2 Creatinine (mg/dL) pre .7333 15 .27432 .07083
Creatinine (mg/dL) post .7340 15 .27479 .07095
Paired Samples Correlations
N Correlation Sig.
Pair 1 HbA1c (%) pre & HbA1c (%) post
15 .799 .000
Pair 2 Creatinine (mg/dL) pre & Creatinine (mg/dL) post
15 .883 .000
Paired Samples Test
Paired Differences
Mean Std. Deviation Std. Error Mean
Pair 1 HbA1c (%) pre - HbA1c (%) post
1.28067 1.53573 .39652
Pair 2 Creatinine (mg/dL) pre - Creatinine (mg/dL) post
-.00067 .13258 .03423
Paired Samples Test
Paired Differences
95% Confidence Interval of the Difference
Lower Upper
Pair 1 HbA1c (%) pre - HbA1c (%) post
.43021 2.13113
Pair 2 Creatinine (mg/dL) pre - Creatinine (mg/dL) post
-.07409 .07276
Paired Samples Test
t df Sig. (2-tailed)
Pair 1 HbA1c (%) pre - HbA1c (%) post
3.230 14 .006
Pair 2 Creatinine (mg/dL) pre - Creatinine (mg/dL) post
-.019 14 .985
NPar Tests Descriptive Statistics
N Mean Std. Deviation Minimum Maximum
Leukocyte (cells/uL) pre 15 14.2733 6.79259 6.24 32.32
Leukocyte (cells/uL) post 15 11.0147 5.51088 6.64 27.23
Wilcoxon Signed Ranks Test Ranks
N Mean Rank Sum of Ranks
Leukocyte (cells/uL) post - Leukocyte (cells/uL) pre
Negative Ranks 9d 9.56 86.00
Positive Ranks 6e 5.67 34.00
Ties 0f
Total 15
d. Leukocyte (cells/uL) post < Leukocyte (cells/uL) pre
e. Leukocyte (cells/uL) post > Leukocyte (cells/uL) pre
f. Leukocyte (cells/uL) post = Leukocyte (cells/uL) pre
Test Statisticsb
Leukocyte (cells/uL) post -
Leukocyte (cells/uL) pre
Z -1.477a
Asymp. Sig. (2-tailed) .140
a. Based on positive ranks.
Ranks
N Mean Rank Sum of Ranks
Leukocyte (cells/uL) post - Leukocyte (cells/uL) pre
Negative Ranks 9d 9.56 86.00
Positive Ranks 6e 5.67 34.00
Ties 0f
Total 15
d. Leukocyte (cells/uL) post < Leukocyte (cells/uL) pre
e. Leukocyte (cells/uL) post > Leukocyte (cells/uL) pre
b. Wilcoxon Signed Ranks Test
PRE POST TEST BETWEEN GROUPS
T-Test Group Statistics
HBOT N Mean
HbA1c (%) pre HBOT 15 9.4160
Control 15 10.9813
HbA1c (%) post HBOT 15 7.0727
Control 15 9.7007
Group Statistics
HBOT Std. Deviation Std. Error Mean
HbA1c (%) pre HBOT 1.95802 .50556
Control 2.37402 .61297
HbA1c (%) post HBOT 1.16058 .29966
Control 2.45951 .63504
Independent Samples Test
Levene's Test for Equality of Variances
t-test for Equality of Means
F Sig. t
HbA1c (%) pre Equal variances assumed 1.002 .325 -1.970
Equal variances not assumed -1.970
HbA1c (%) post Equal variances assumed 5.407 .028 -3.743
Equal variances not assumed -3.743
Independent Samples Test
t-test for Equality of Means
df Sig. (2-tailed) Mean Difference
HbA1c (%) pre Equal variances assumed 28 .059 -1.56533
Equal variances not assumed 27.021 .059 -1.56533
HbA1c (%) post Equal variances assumed 28 .001 -2.62800
Equal variances not assumed 19.940 .001 -2.62800
Independent Samples Test
t-test for Equality of Means
95% Confidence Interval of the Difference
Std. Error Difference Lower Upper
HbA1c (%) pre Equal variances assumed .79456 -3.19291 .06224
Equal variances not assumed .79456 -3.19557 .06490
HbA1c (%) post Equal variances assumed .70219 -4.06638 -1.18962
Equal variances not assumed .70219 -4.09303 -1.16297
NPar Tests Descriptive Statistics
N Mean Std. Deviation Minimum Maximum
Leukocyte (cells/uL) pre 30 14.1223 6.41186 6.24 32.32
Creatinine (mg/dL) pre 30 1.4143 2.12529 .33 11.37
Leukocyte (cells/uL) post 30 9.9297 4.45560 5.62 27.23
Creatinine (mg/dL) post 30 1.3940 2.04569 .41 11.40
HBOT 30 1.50 .509 1 2
Mann-Whitney Test Ranks
HBOT N Mean Rank Sum of Ranks
Leukocyte (cells/uL) pre HBOT 15 15.03 225.50
Control 15 15.97 239.50
Total 30
Creatinine (mg/dL) pre HBOT 15 17.87 268.00
Control 15 13.13 197.00
Total 30
Leukocyte (cells/uL) post HBOT 15 13.33 200.00
Control 15 17.67 265.00
Total 30
Creatinine (mg/dL) post HBOT 15 19.00 285.00
Control 15 12.00 180.00
Total 30
Test Statisticsb
Leukocyte (cells/uL) pre
Creatinine (mg/dL) pre
Leukocyte (cells/uL) post
Creatinine (mg/dL) post
Mann-Whitney U 105.500 77.000 80.000 60.000
Wilcoxon W 225.500 197.000 200.000 180.000
Z -.290 -1.473 -1.348 -2.178
Asymp. Sig. (2-tailed) .772 .141 .178 .029
Exact Sig. [2*(1-tailed Sig.)] .775a .148a .187a .029a
a. Not corrected for ties.
b. Grouping Variable: HBOT
Explore HBOT
Case Processing Summary
HBOT
Cases
Valid Missing
N Percent N Percent
decreased_HbA1c HBOT 15 100.0% 0 .0%
Control 15 100.0% 0 .0%
decreased_leuko HBOT 15 100.0% 0 .0%
Control 15 100.0% 0 .0%
decreased_Cr HBOT 15 100.0% 0 .0%
Control 15 100.0% 0 .0%
Case Processing Summary
HBOT
Cases
Total
N Percent
decreased_HbA1c HBOT 15 100.0%
Control 15 100.0%
decreased_leuko HBOT 15 100.0%
Control 15 100.0%
decreased_Cr HBOT 15 100.0%
Control 15 100.0%
Descriptives
HBOT Statistic Std. Error
decreased_HbA1c HBOT Mean 2.3433 .40607
95% Confidence Interval for Mean
Lower Bound 1.4724
Upper Bound 3.2143
5% Trimmed Mean 2.2976
Median 2.4700
Variance 2.473
Std. Deviation 1.57272
Minimum .10
Maximum 5.41
Range 5.31
Interquartile Range 2.49
Skewness .383 .580
Kurtosis -.597 1.121
Control Mean 1.2807 .39652
95% Confidence Interval for Mean
Lower Bound .4302
Upper Bound 2.1311
5% Trimmed Mean 1.2563
Median 1.6000
Variance 2.358
Std. Deviation 1.53573
Minimum -.90
Maximum 3.90
Range 4.80
Interquartile Range 2.90
Skewness -.029 .580
Kurtosis -1.158 1.121
decreased_leuko HBOT Mean 5.1267 1.73542
95% Confidence Interval for Mean
Lower Bound 1.4046
Upper Bound 8.8488
5% Trimmed Mean 4.5185
Median 4.1800
Variance 45.175
Std. Deviation 6.72124
Minimum -1.82
Maximum 23.02
Range 24.84
Interquartile Range 8.83
Skewness 1.464 .580
Kurtosis 2.382 1.121
Control Mean 3.2587 2.00389
95% Confidence Interval for Mean
Lower Bound -1.0393
Upper Bound 7.5566
5% Trimmed Mean 2.8719
Median 3.3000
Variance 60.234
Std. Deviation 7.76104
Minimum -8.96
Maximum 22.44
Range 31.40
Interquartile Range 8.05
Skewness .781 .580
Kurtosis 1.652 1.121
decreased_Cr HBOT Mean .0413 .11652
95% Confidence Interval for Mean
Lower Bound -.2086
Upper Bound .2913
5% Trimmed Mean .0409
Median .0700
Variance .204
Std. Deviation .45130
Minimum -1.02
Maximum 1.11
Range 2.13
Interquartile Range .34
Skewness .026 .580
Kurtosis 3.239 1.121
Control Mean -.0007 .03423
95% Confidence Interval for Mean
Lower Bound -.0741
Upper Bound .0728
5% Trimmed Mean .0065
Median .0100
Variance .018
Std. Deviation .13258
Minimum -.28
Maximum .15
Range .43
Interquartile Range .18
Skewness -.815 .580
Kurtosis -.195 1.121
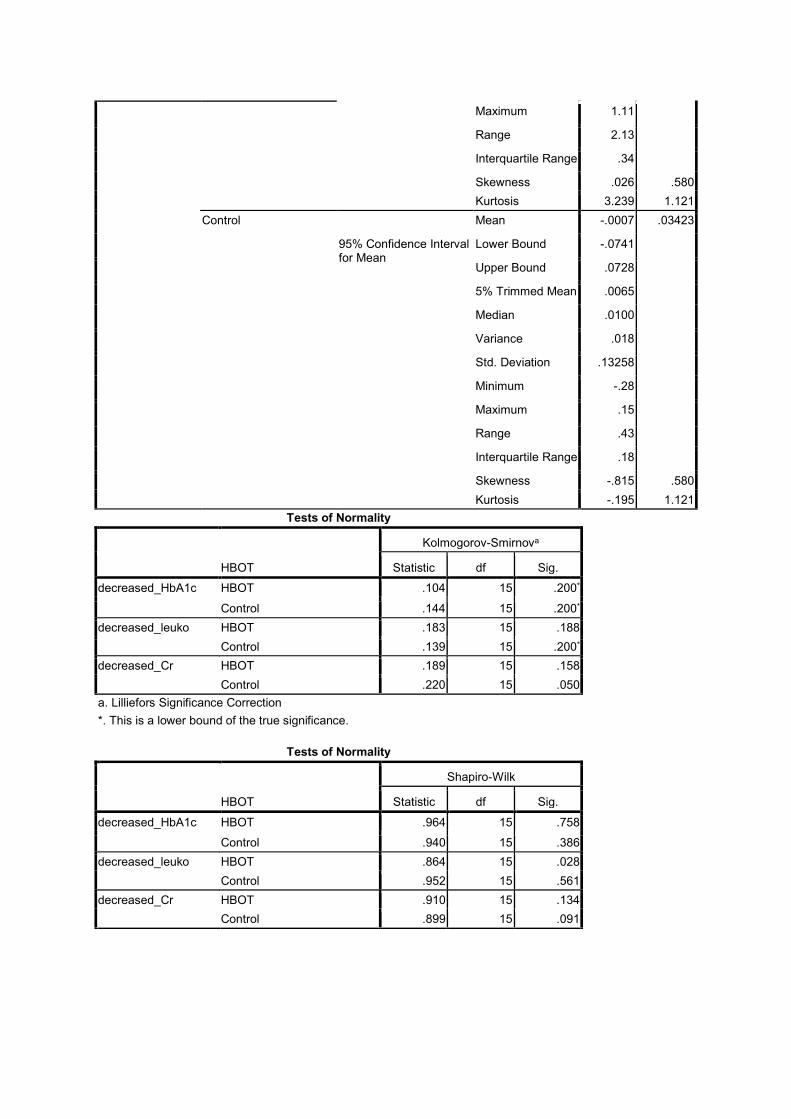
Tests of Normality
HBOT
Kolmogorov-Smirnova
Statistic df Sig.
decreased_HbA1c HBOT .104 15 .200*
Control .144 15 .200*
decreased_leuko HBOT .183 15 .188
Control .139 15 .200*
decreased_Cr HBOT .189 15 .158
Control .220 15 .050
a. Lilliefors Significance Correction
*. This is a lower bound of the true significance.
Tests of Normality
HBOT
Shapiro-Wilk
Statistic df Sig.
decreased_HbA1c HBOT .964 15 .758
Control .940 15 .386
decreased_leuko HBOT .864 15 .028
Control .952 15 .561
decreased_Cr HBOT .910 15 .134
Control .899 15 .091
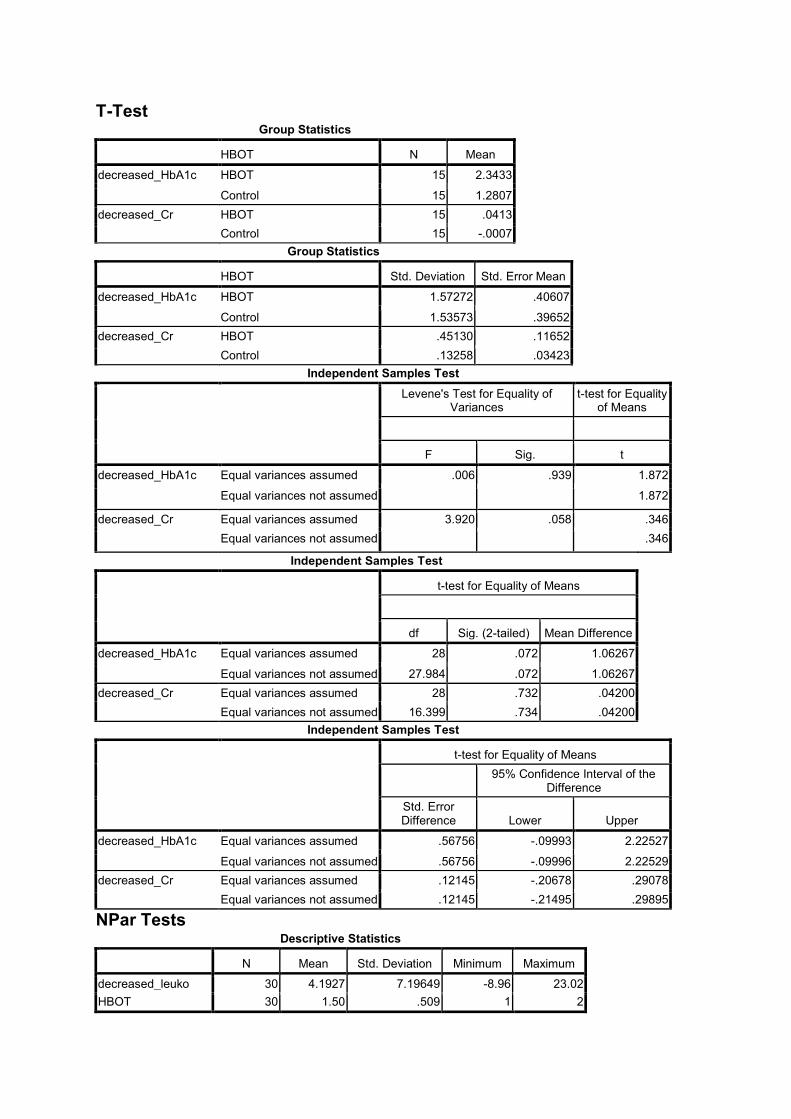
T-Test Group Statistics
HBOT N Mean
decreased_HbA1c HBOT 15 2.3433
Control 15 1.2807
decreased_Cr HBOT 15 .0413
Control 15 -.0007
Group Statistics
HBOT Std. Deviation Std. Error Mean
decreased_HbA1c HBOT 1.57272 .40607
Control 1.53573 .39652
decreased_Cr HBOT .45130 .11652
Control .13258 .03423
Independent Samples Test
Levene's Test for Equality of Variances
t-test for Equality of Means
F Sig. t
decreased_HbA1c Equal variances assumed .006 .939 1.872
Equal variances not assumed 1.872
decreased_Cr Equal variances assumed 3.920 .058 .346
Equal variances not assumed .346
Independent Samples Test
t-test for Equality of Means
df Sig. (2-tailed) Mean Difference
decreased_HbA1c Equal variances assumed 28 .072 1.06267
Equal variances not assumed 27.984 .072 1.06267
decreased_Cr Equal variances assumed 28 .732 .04200
Equal variances not assumed 16.399 .734 .04200
Independent Samples Test
t-test for Equality of Means
95% Confidence Interval of the Difference
Std. Error Difference Lower Upper
decreased_HbA1c Equal variances assumed .56756 -.09993 2.22527
Equal variances not assumed .56756 -.09996 2.22529
decreased_Cr Equal variances assumed .12145 -.20678 .29078
Equal variances not assumed .12145 -.21495 .29895
NPar Tests Descriptive Statistics
N Mean Std. Deviation Minimum Maximum
decreased_leuko 30 4.1927 7.19649 -8.96 23.02
HBOT 30 1.50 .509 1 2
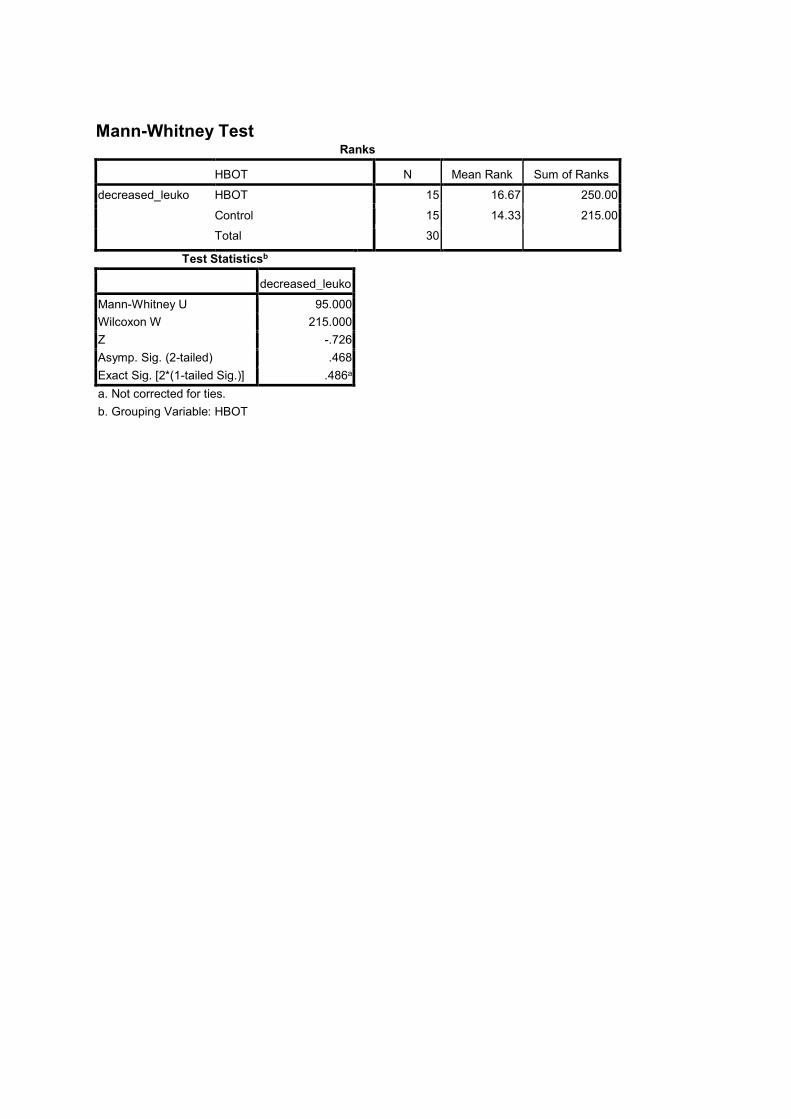
Mann-Whitney Test
Ranks
HBOT N Mean Rank Sum of Ranks
decreased_leuko HBOT 15 16.67 250.00
Control 15 14.33 215.00
Total 30
Test Statisticsb
decreased_leuko
Mann-Whitney U 95.000
Wilcoxon W 215.000
Z -.726
Asymp. Sig. (2-tailed) .468
Exact Sig. [2*(1-tailed Sig.)] .486a
a. Not corrected for ties.
b. Grouping Variable: HBOT


![Hyperbaric Oxygen Therapy (HBOT)1].pdf · Hyperbaric Oxygen Therapy (HBOT) for Tissue Damage, Including Wound Care and Treatment of Central Nervous System (CNS) Conditions ... patients](https://img.pdfslide.us/doc/110x75/5c79ad9809d3f2bd0e8b960a/hyperbaric-oxygen-therapy-hbot-1pdf-hyperbaric-oxygen-therapy-hbot-for.jpg)


![Hyperbaric Oxygen Theray (HBOT) Service Standards[1] Oxygen Theray (H… · (HBOT) service standards, ... Review the design to ensure compliance with the DHA ... the reception in](https://img.pdfslide.us/doc/110x75/5b04c0097f8b9a8c688e27e9/hyperbaric-oxygen-theray-hbot-service-standards1-oxygen-theray-hhbot-service.jpg)


![The Life of Jesus the Son of Mary - Muhammadanismn+ a o F ˚ 48 ]K p’< ˛ ( 0˝i 2 -a "˝ Ak ˚ 56 ] < 57 + "˝ r ! a o F % %F ’< KS˛ ((58 b "˝ ˘ 9 ks j :k˙](https://img.pdfslide.us/doc/110x75/60260849b432615e9a31b3fc/the-life-of-jesus-the-son-of-mary-muhammadanism-n-a-o-f-48-k-pa-.jpg)