Embed Size (px)
Citation preview
ORGANISATIONAL AND PSYCHOSOCIAL FACTORS AND THE DEVELOPMENT OF MUSCULOSKELETAL DISORDERS OF THE UPPER LIMBS
Professeur Malchaire Nathalie Cock
UCL: Unité d’hygiène et physiologie du travail
Professeur Karnas Caroline Pirotte
ULB: Laboratoire de psychologie industrielle et commerciale
Professeur Bundervoet Jan Dombrecht
KUL: Departement Sociologie, afdeling arbeid en organisaties
TABLE OF CONTENTS
Chapter I: Introduction .........................................................................................................1 1. Definition 1 2. Social and economic importance 1 3. Occupational diseases 2 4. Groups at risk 2 5. Risk factors 3 6. Previous Belgian studies 6 7. Conceptual and relational model for the development of MSDs of the neck and upper limbs 6 8. General objectives of the study. 7 Chapter II: Description of research activities .......................................................................9 Phase 1: Elaboration of the methodology 9 A. Personal and occupational characteristics and musculoskeletal history 9
1. A general questionnaire 9 2. A questionnaire on musculoskeletal history 9 3. A questionnaire on the characteristics of current and previous workplaces. 10 4. A clinical examination. 10 5. Two functional tests 10 6. Two psychomotor tests 10
B. "Personality traits" 10 1. Bortner Type A test (1969) 10 2. NEO-FFI personality test 10
C. Psycho-social and stress characteristics 11 1. Professional styles 11 2. Somatic constraints 11 3. Questionnaire on perceived work conditions: Karasek’s “Job Content Questionnaire” 11 4. Additional questions 11 5. Open questions 11
Phase 2: Selection of workplaces and participants 12 A. Criteria for selecting the workplaces and participants in the study 12 B. Description of the companies and workplaces selected 13 Phase 3: First step of the prospective study 14 Phase 4: Analysis of the occupational constraints 15 A. The biomechanical constraints 15 B. The organizational constraints 17
1. The four aspects of the quality of labour and the Sociotechnics 18 2. Conclusion: organizational factors and MSD 21 3. Organizational part: methodology 22
Phase 5: Monitoring of the changes in constraint 22 Phase 6: Second stage of the prospective study for each participant individually 22 Phase 7: Statistical analysis of the data 23 Phase 8: Ethical aspects and recommendations for actions 24 A. Description of the strategy 24 B. Level 2, Observation 24 Chapter III: Collaboration between the three units of the research network .......................26 1. Elaboration of the methodology 26 2. Selection of the workplace and participants 26 3. First phase of the prospective study 27 4. Analysis of the occupational constraints 27 5. Monitoring and changes in the constraints 27 6. Second stage of the prospective study 27 7. Statistical analysis of the data 27 8. Recommendations 28 Chapter IV: Descriptive results of the study ........................................................................29 I. Population and its characteristics 29 A. Description of the subjects dropped out during the study 29 B. Musculoskeletal history 29
1. Prevalence of complaints. 29 2. Incidence of complaints. 31
C. General characteristics and differences between groups 33 D. Professional characteristics 35
1. Current workplace 35 2. Previous workplace 36
E. Psychosocial data and stress 37 1. Professional styles 37 2. Somatic complaints 37 3. Scores of Karasek: perception and appreciation 37 4. Dimensions derived by factorial analysis of the data 39 5. Stress 40
F. Personality 41 1. Bortner test: type A personality 41 2. NEOFFI 41
3. Test of Bonnardel 41 G. Functional and psychomotor tests 42 II. Professional constraints Analysis 43 A. Biomechanical constraints 43 B. Organizational part: descriptive results 46
1. The production characteristics and the terms of employment 46 2. The job content: the checklists for the quality of the job content 47 3. The job content: further elaboration 47
Chapter V: Results of the multivariate analyses .................................................................52 I. Simple statistical analyses 52 A. Choice of variables, simple linear regressions, Chi2 and t-tests. 52 B. Variables kept by group of variables 53 II. Multivariate logistic regressions 58 A. Logistic regression models for the dominant wrist. 58 B. Logistic regression models for the development of neck MSD. 59 III. Organizational part: prospective results 61 A. MVQCA / Multi-Value Qualitative Comparative Analysis 61 B. The results of the MVQCA-analysis 63
1. The problematic group for the wrist proportion 63 2. The less-problematic group for the wrist proportion 64 3. The problematic group for the neck proportion 65 4. The less-problematic group for the neck proportion 66 5. A high percentage of stressed individuals 67 6. A low percentage of stressed individuals 67
Chapter VI: Discussion........................................................................................................69 I. Relevance of the data 69 1. Working conditions 69 2. Prevalence 69 3. Personality 70 4. Functional and psychomotor tests 70 5. Psychosocial factors and of stress 71 6. Organisational data 71 II. Methodology 71 1. Outline of the study and selection of the subjects 71 2. Statistical analysis 72
III. Descriptive results 73 1. Data from the questionnaire 73 2. Professional constraints 73 3. Psycho-organisational factors and of stress 73 IV. Results of the prospective study: regression logistics. 74 1. Individual characteristics of the operators 74 2. Biomechanical constraints 75 3. Psychosocial factors 75 Chapter VII: Practical enhancement of The research ..........................................................78 I. Enhancement with respect to the workers and industry. 78 1. Introduction 78 2. The risk assessment methods proposed in the literature 78 3. Presentation of the strategy and the methods 79 4. Effectiveness of these methods 79 5. The broadening of these methods 80 6. Training 81 7. Fitness training 81 8. Older workers 81 II. Enhancement of research with respect to the political world 82 Chapter VIII: Conclusion ....................................................................................................84 Chapter IX: References .......................................................................................................85 Chapter X: Annexes ............................................................................................................91 Annex 1: Construction of the psychosocial factors and the stress factors 91 Annex 2: Overview of the total configurations 92 Annex 3: Overview of the discriminating variables 93 Annex 4: Detailed description of the comparison processes 94 Annex 5: Classification of the workposts – well-being indicators 99
Final report.doc : 3/05/2004 1
CHAPTER I: INTRODUCTION
1. Definition The musculoskeletal disorders (MSDs) from occupational origin constitute a world problem, as well from the point of view of health as socially and economically. It covers a whole series of pathologies concerning the muscles, tendons and articulations of the back, the neck and the upper limbs (shoulders, elbows, wrists) and, to a lesser extent, the lower limbs. We will designate these as musculoskeletal disorders (MSDs) from occupational origin so as not to imply a particular cause factor. However, they are the same effects as those designated in other countries by "Cumulative trauma disorders" (CTD), or "Work related upper limb disorders" (WRULD) or "repetitive strain injuries" (RSI) or "lésions attribuées au travail répétitif" (LATR).These disorders can be attributable to activities implying postures or uncomfortable movements in a repetitive way, accompanied by relatively significant efforts (Buckle and Dévereux, 1999).
2. Social and economic importance The prevalence of MSDs is extensive in industry in general and in particular in sectors such as healthcare. They can be complaints, pains, short or long duration disabilities or permanent disabilities. Some statistics were noted down at the time of the last European investigation about the working conditions (Paoli et Merllié, 2001). • In the European Union (UE), 30% of the workers complained about pain in the low back,
23% about the neck and shoulders, 13% about the arms and 12% about the lower limbs • The figures for Belgium were respectively 21%, 17%, 11% and 10% • In UE, 60% of the workers estimated that their working conditions negatively affect their
health (in 1995, 57%), including 33% for back problems and 23% for cervical and shoulders problems.
• In UE, 47% of the workers stated to work in painful and tiring postures and 37% declared performing heavy handling operations during more than 25% of their work time.
As the tables of the European investigation show it, the prevalence and incidence rates vary significantly between countries. Belgium appears less concerned by the problem than the average of Europe of the 15 countries. No technical explanation can be given for this: Belgium has a very significant cars production (sector where MSDs are frequent) and seems to have the same range of companies as certainly the neighbouring countries. The explanation is, likely to be a lower awareness due to the fact that MSDs are poorly recognized as occupational diseases. The real impact of the MSDs is consequently difficult to quantify and the estimates vary considerably as the following statistics of days of absence attributed to MSDs show it.
• The Netherlands: 46% of sick leave of more than 1 day (European agency for safety and health at work, fact 9, 2000)
• Finland: 11% of sick leave of more than 9 days • The U.K.: § 10 million lost days including 5 for back problems and 4 for upper limbs problems § 58.000 workers changed work due to MSDs
The estimates of cost vary also greatly but underline the considerable impact for the companies and the society in general:
Final report.doc : 3/05/2004 2
• U.E.: 40 to 50% of the total cost of occupational diseases, that is, 1.3 to 1.9% of the GNP (European agency for safety and health at work, fact 3, 2000)
• Germany: 12 billion € for occupational diseases • The Netherlands: 200 M€, that is 30% of the total for occupational diseases • The U.K.: 120 to 360 M€ including 50% for back problems, 35% for the upper limbs
and 15% for the lower limbs. • USA: 6 billion € per annum indirectly for the country • The USA: 500 to 900 € per employee and per annum, on average • The U.K.: 7500 € per case, including the time wasted by the employee, the operational
losses, the cost of the treatment, the cost of rehabilitation • Scandinavian countries and the Netherlands: 0.5 to 2% of the GNP • Finland: 112 M€, that is approximately 2% of the health care expenditure • Germany: 12.000 M€ of production losses (European agency for safety and health at
work, fact 9, 2000). The consequences for the companies are many and varied: production losses, allowances for sick leaves, insurance premium, loss of qualified workers, recruitment costs, training of new operators… At these costs, a society concerned by its citizens must add the individual losses of quality of life and general well being of the people and their families. The different countries agreed to evaluate the total cost between 0.6 and 2% of the GNP.
3. Occupational diseases MSDs are chronic disorders which affect peripheral tendons, muscles, articulations, and nerves (Forcier and Kuorinka, 2001; Hagberg et al., 1995; Silverstein, 2001). The compensation criteria vary considerably between countries so that the comparisons are again difficult. Some statistics however relate to the prevalence of occupational diseases
• Spain: 1.6% of the workers • Finland: 1279 cases in 1998 • The case of France underlines clearly the influence of the compensation system:
17.450 cases of MSDs, that is 74% of the occupational diseases recognized in 1999: 13% for back problems and 87% for various "periarticular disorders" (European agency for safety and health at work, 2000)
• In Belgium, the number of diseases compensated in 2002 was equal to 1274, that is proportionally much less than in France, including, contrary to France, 78% for problems of low back pain (Fonds des Maladies Professionnelles 2002)
One can conclude from this that the occupational diseases of musculoskeletal nature are probably largely ignored in Belgium and, in any case, little compensated (33% only of the requests).
4. Groups at risk The European investigations show that the industrial sectors most concerned with MSDs of the upper limbs are: (European agency for safety and health at work, fact 5, 2000)
• agriculture forestry and fishing • manufacture and transformation industries • the construction sector • the wholesale and retail s tores • hotel trade and restaurant business
Final report.doc : 3/05/2004 3
The professions most concerned are: § manual workers and craftsmen § machine operators § secretaries and typists § packers
• The unskilled manual workers are at a greater risk, just as (but these categories
overlap) the temporary workers or those with a precarious status • MSDs concern more women, more due to the nature of the tasks entrusted to them
(European agency for safety and health at work, fact 3, 2000) than for reasons related to the gender
A possible explanation of the progressive increase of the frequency of MSDs during the last 30 years is the partial automation of the work which often left to the workers only the tasks of provisioning and evacuation associated with unfavourable postures and significant efforts. It led also to a more continuous work with an increase in work rate (repetitiveness of the movements) and workload (repetition of the efforts) In the tertiary sector, the use of the computer spread with fixed postures and repetitive work (INRS, 1996) Thus, according to the European investigation carried out in 2000: (European agency for safety and health at work, fact 3, 2000)
• 7% of the European workers state to carry out short and repetitive tasks • 57% to make repetitive arm movements • 56% to be subjected to time constraints • 54% to work too fast • 42% not to be able to take a break • 31% not to be able to choose their work pace
5. Risk factors Many cross sectional and a few longitudinal epidemiological researches showed that the development of MSDs can be associated with a whole set of physical, organisational, psychosocial and individual factors (Hagberg et al., 1995; Nordander et al., 1999; European agency for safety and health at work, fact 9, 2000). The biomechanical factors are
• constrained postures • repetitive movements, all the more under constraint • efforts • hands and arm vibration • direct mechanical pressure on body tissues (sharp edges, continuous support of the
wrist…) These factors are directly a function of the work organization: space (reaching zone, lay out…) and temporal organisation (time constraint, work pace, breaks …). Many studies also suggest a dominating role for the psychosocial factors: monotony of work, relations with the colleagues, work contents … Two types of synthesis were carried out in the literature. The first, by the National Institute of Occupational Safety and Health (NIOSH) of the USA (Bernard, 1997), consisted of a meta analysis of a few studies meeting strict criteria of comparability and relating to only proven musculoskeletal pathologies.
Final report.doc : 3/05/2004 4
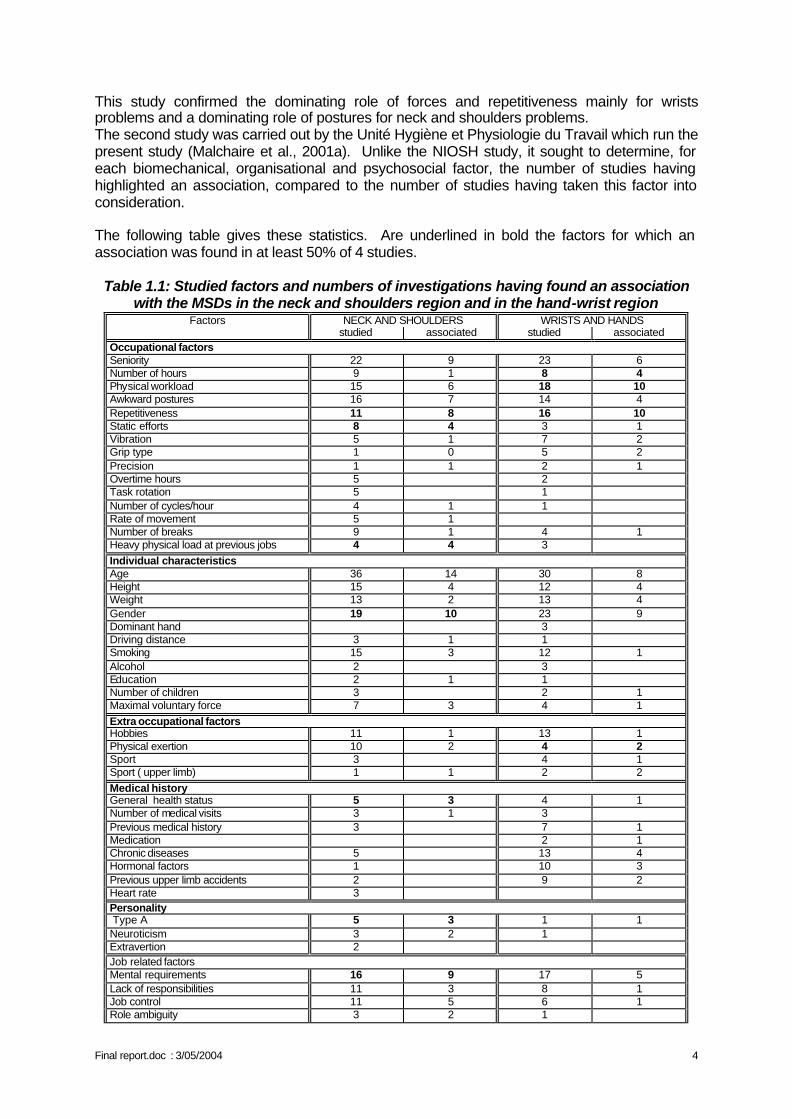
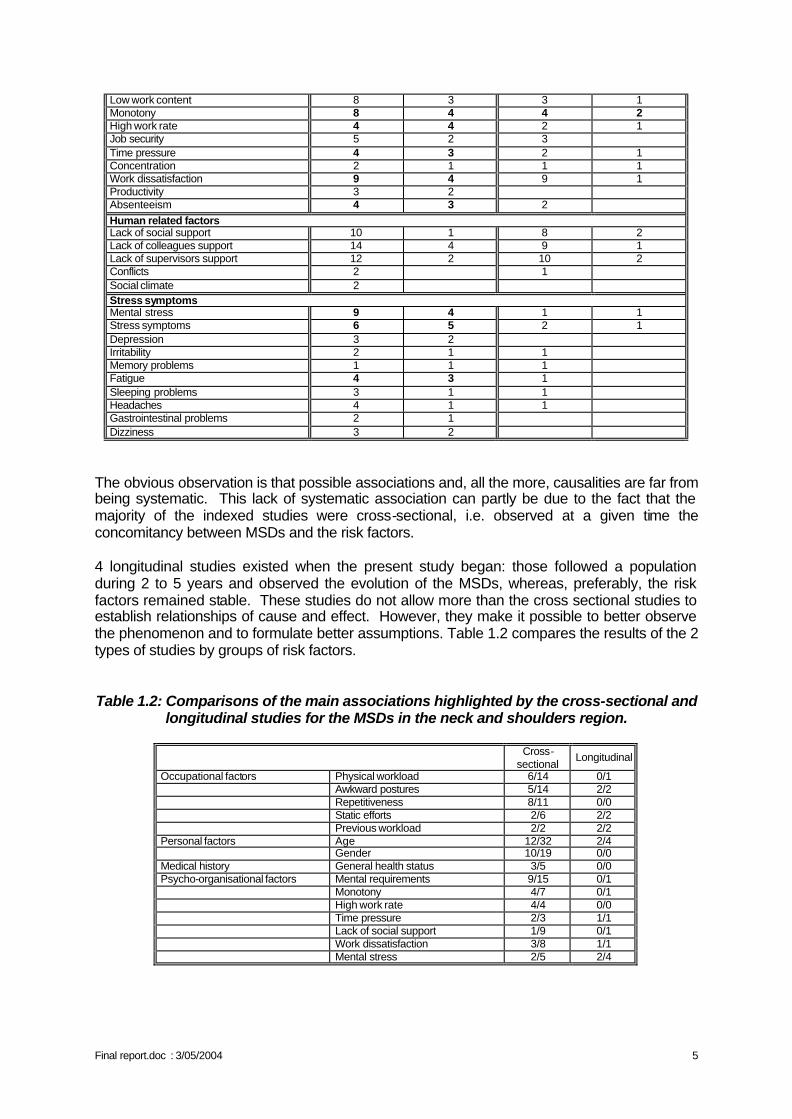
This study confirmed the dominating role of forces and repetitiveness mainly for wrists problems and a dominating role of postures for neck and shoulders problems. The second study was carried out by the Unité Hygiène et Physiologie du Travail which run the present study (Malchaire et al., 2001a). Unlike the NIOSH study, it sought to determine, for each biomechanical, organisational and psychosocial factor, the number of studies having highlighted an association, compared to the number of studies having taken this factor into consideration. The following table gives these statistics. Are underlined in bold the factors for which an association was found in at least 50% of 4 studies.
Table 1.1: Studied factors and numbers of investigations having found an association with the MSDs in the neck and shoulders region and in the hand-wrist region
Factors NECK AND SHOULDERS WRISTS AND HANDS studied associated studied associated Occupational factors Seniority 22 9 23 6 Number of hours 9 1 8 4 Physical workload 15 6 18 10 Awkward postures 16 7 14 4 Repetitiveness 11 8 16 10 Static efforts 8 4 3 1 Vibration 5 1 7 2 Grip type 1 0 5 2 Precision 1 1 2 1 Overtime hours 5 2 Task rotation 5 1 Number of cycles/hour 4 1 1 Rate of movement 5 1 Number of breaks 9 1 4 1 Heavy physical load at previous jobs 4 4 3 Individual characteristics Age 36 14 30 8 Height 15 4 12 4 Weight 13 2 13 4 Gender 19 10 23 9 Dominant hand 3 Driving distance 3 1 1 Smoking 15 3 12 1 Alcohol 2 3 Education 2 1 1 Number of children 3 2 1 Maximal voluntary force 7 3 4 1 Extra occupational factors Hobbies 11 1 13 1 Physical exertion 10 2 4 2 Sport 3 4 1 Sport ( upper limb) 1 1 2 2 Medical history General health status 5 3 4 1 Number of medical visits 3 1 3 Previous medical history 3 7 1 Medication 2 1 Chronic diseases 5 13 4 Hormonal factors 1 10 3 Previous upper limb accidents 2 9 2 Heart rate 3 Personality Type A 5 3 1 1 Neuroticism 3 2 1 Extravertion 2 Job related factors Mental requirements 16 9 17 5 Lack of responsibilities 11 3 8 1 Job control 11 5 6 1 Role ambiguity 3 2 1
Final report.doc : 3/05/2004 5
Low work content 8 3 3 1 Monotony 8 4 4 2 High work rate 4 4 2 1 Job security 5 2 3 Time pressure 4 3 2 1 Concentration 2 1 1 1 Work dissatisfaction 9 4 9 1 Productivity 3 2 Absenteeism 4 3 2 Human related factors Lack of social support 10 1 8 2 Lack of colleagues support 14 4 9 1 Lack of supervisors support 12 2 10 2 Conflicts 2 1 Social climate 2 Stress symptoms Mental stress 9 4 1 1 Stress symptoms 6 5 2 1 Depression 3 2 Irritability 2 1 1 Memory problems 1 1 1 Fatigue 4 3 1 Sleeping problems 3 1 1 Headaches 4 1 1 Gastrointestinal problems 2 1 Dizziness 3 2
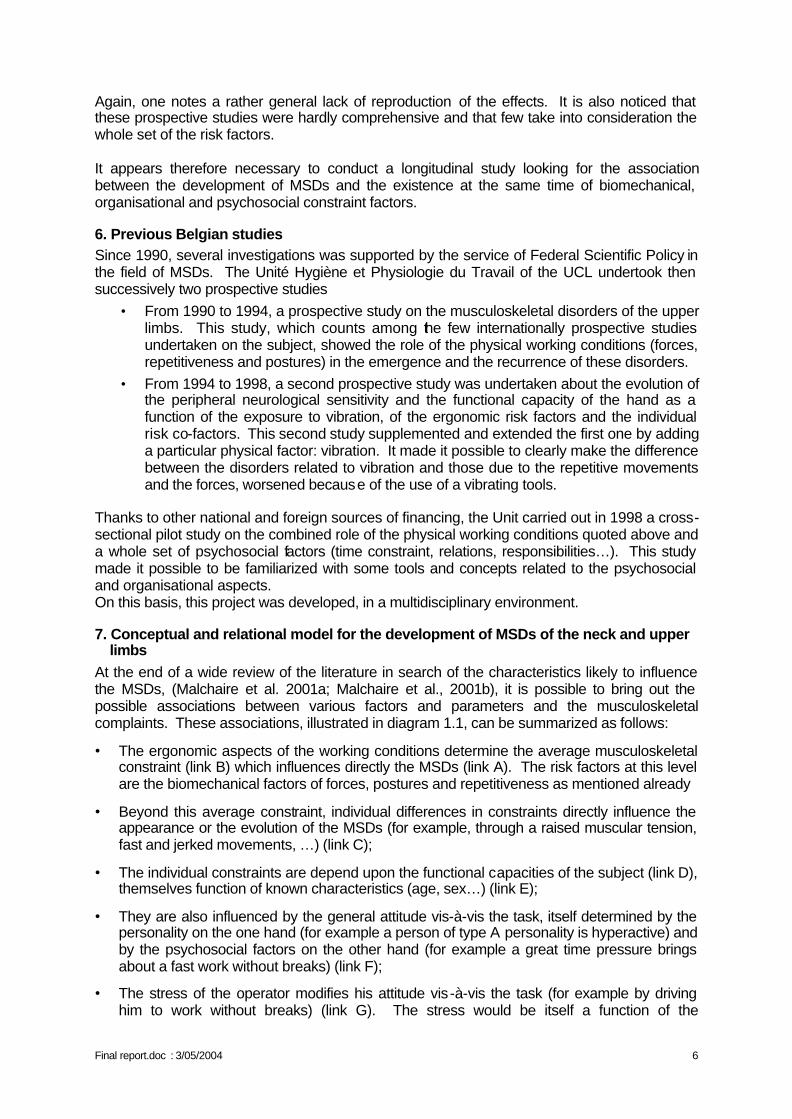
The obvious observation is that possible associations and, all the more, causalities are far from being systematic. This lack of systematic association can partly be due to the fact that the majority of the indexed studies were cross-sectional, i.e. observed at a given time the concomitancy between MSDs and the risk factors. 4 longitudinal studies existed when the present study began: those followed a population during 2 to 5 years and observed the evolution of the MSDs, whereas, preferably, the risk factors remained stable. These studies do not allow more than the cross sectional studies to establish relationships of cause and effect. However, they make it possible to better observe the phenomenon and to formulate better assumptions. Table 1.2 compares the results of the 2 types of studies by groups of risk factors. Table 1.2: Comparisons of the main associations highlighted by the cross-sectional and
longitudinal studies for the MSDs in the neck and shoulders region.
Cross-sectional
Longitudinal
Occupational factors Physical workload 6/14 0/1 Awkward postures 5/14 2/2 Repetitiveness 8/11 0/0 Static efforts 2/6 2/2 Previous workload 2/2 2/2 Personal factors Age 12/32 2/4 Gender 10/19 0/0 Medical history General health status 3/5 0/0 Psycho-organisational factors Mental requirements 9/15 0/1 Monotony 4/7 0/1 High work rate 4/4 0/0 Time pressure 2/3 1/1 Lack of social support 1/9 0/1 Work dissatisfaction 3/8 1/1 Mental stress 2/5 2/4
Final report.doc : 3/05/2004 6
Again, one notes a rather general lack of reproduction of the effects. It is also noticed that these prospective studies were hardly comprehensive and that few take into consideration the whole set of the risk factors. It appears therefore necessary to conduct a longitudinal study looking for the association between the development of MSDs and the existence at the same time of biomechanical, organisational and psychosocial constraint factors.
6. Previous Belgian studies Since 1990, several investigations was supported by the service of Federal Scientific Policy in the field of MSDs. The Unité Hygiène et Physiologie du Travail of the UCL undertook then successively two prospective studies
• From 1990 to 1994, a prospective study on the musculoskeletal disorders of the upper limbs. This study, which counts among the few internationally prospective studies undertaken on the subject, showed the role of the physical working conditions (forces, repetitiveness and postures) in the emergence and the recurrence of these disorders.
• From 1994 to 1998, a second prospective study was undertaken about the evolution of the peripheral neurological sensitivity and the functional capacity of the hand as a function of the exposure to vibration, of the ergonomic risk factors and the individual risk co-factors. This second study supplemented and extended the first one by adding a particular physical factor: vibration. It made it possible to clearly make the difference between the disorders related to vibration and those due to the repetitive movements and the forces, worsened because of the use of a vibrating tools.
Thanks to other national and foreign sources of financing, the Unit carried out in 1998 a cross-sectional pilot study on the combined role of the physical working conditions quoted above and a whole set of psychosocial factors (time constraint, relations, responsibilities…). This study made it possible to be familiarized with some tools and concepts related to the psychosocial and organisational aspects. On this basis, this project was developed, in a multidisciplinary environment.
7. Conceptual and relational model for the development of MSDs of the neck and upper limbs
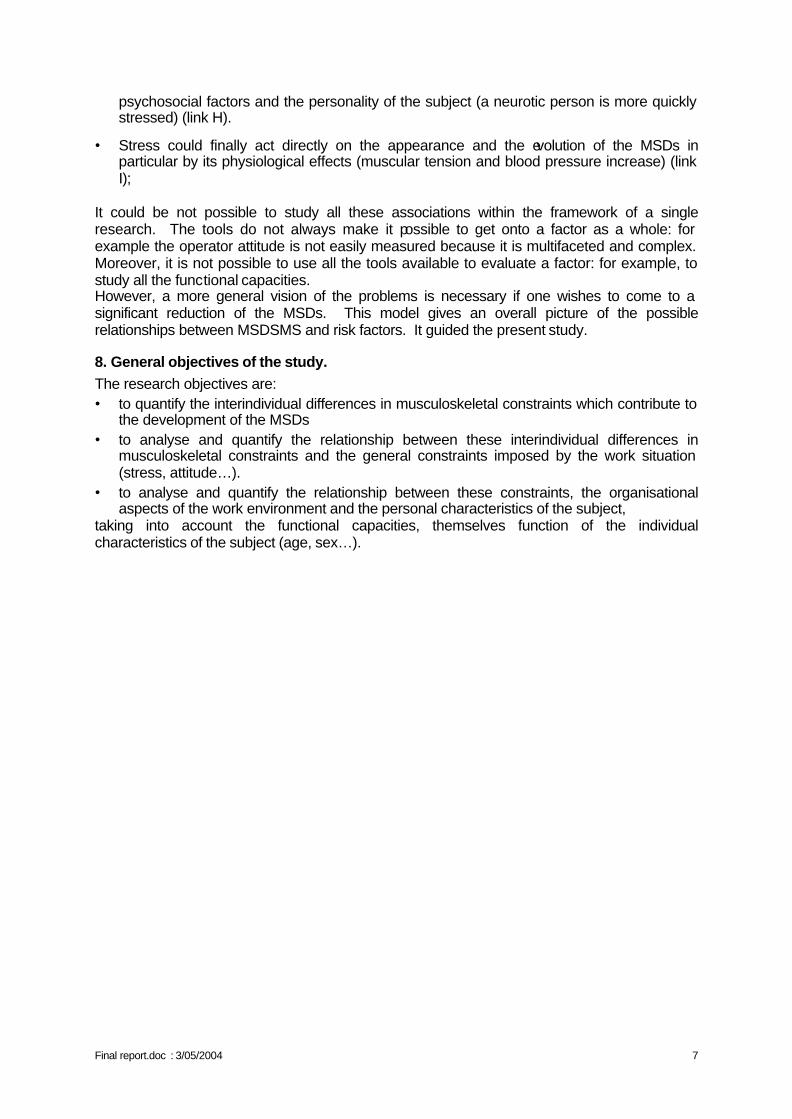
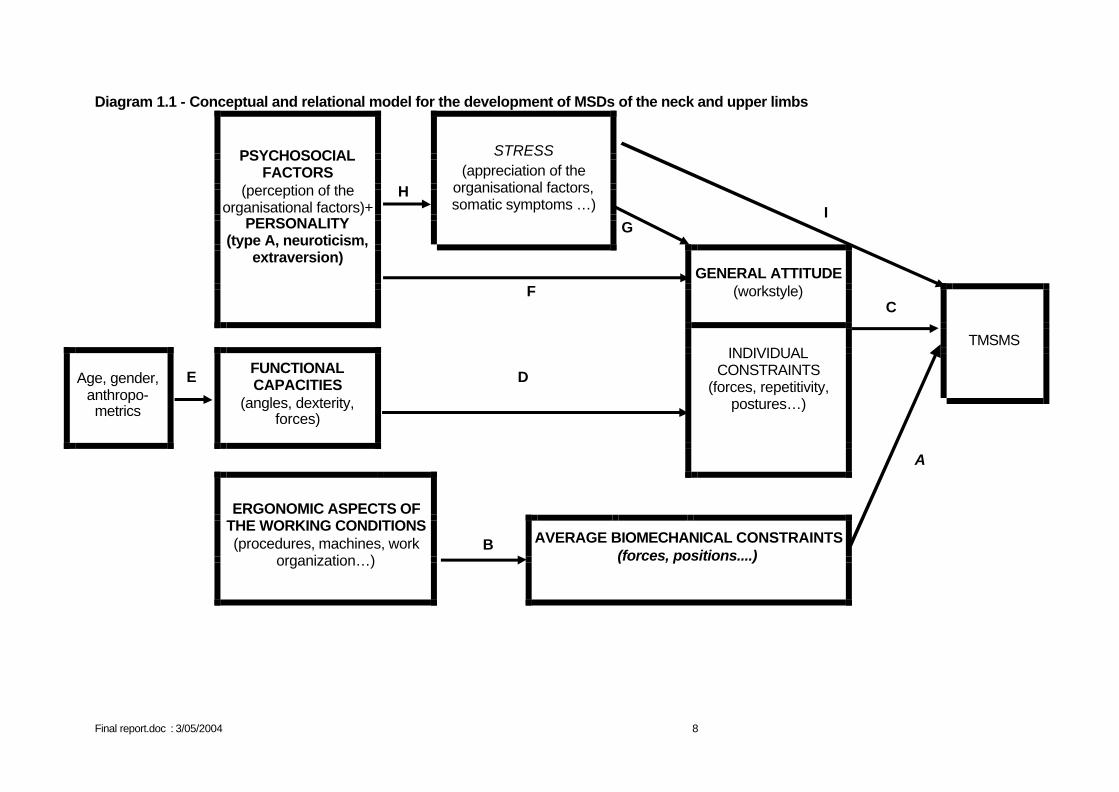
At the end of a wide review of the literature in search of the characteristics likely to influence the MSDs, (Malchaire et al. 2001a; Malchaire et al., 2001b), it is possible to bring out the possible associations between various factors and parameters and the musculoskeletal complaints. These associations, illustrated in diagram 1.1, can be summarized as follows:
• The ergonomic aspects of the working conditions determine the average musculoskeletal constraint (link B) which influences directly the MSDs (link A). The risk factors at this level are the biomechanical factors of forces, postures and repetitiveness as mentioned already
• Beyond this average constraint, individual differences in constraints directly influence the appearance or the evolution of the MSDs (for example, through a raised muscular tension, fast and jerked movements, …) (link C);
• The individual constraints are depend upon the functional capacities of the subject (link D), themselves function of known characteristics (age, sex…) (link E);
• They are also influenced by the general attitude vis-à-vis the task, itself determined by the personality on the one hand (for example a person of type A personality is hyperactive) and by the psychosocial factors on the other hand (for example a great time pressure brings about a fast work without breaks) (link F);
• The stress of the operator modifies his attitude vis-à-vis the task (for example by driving him to work without breaks) (link G). The stress would be itself a function of the
Final report.doc : 3/05/2004 7
psychosocial factors and the personality of the subject (a neurotic person is more quickly stressed) (link H).
• Stress could finally act directly on the appearance and the evolution of the MSDs in particular by its physiological effects (muscular tension and blood pressure increase) (link I);
It could be not possible to study all these associations within the framework of a single research. The tools do not always make it possible to get onto a factor as a whole: for example the operator attitude is not easily measured because it is multifaceted and complex. Moreover, it is not possible to use all the tools available to evaluate a factor: for example, to study all the functional capacities. However, a more general vision of the problems is necessary if one wishes to come to a significant reduction of the MSDs. This model gives an overall picture of the possible relationships between MSDSMS and risk factors. It guided the present study.
8. General objectives of the study. The research objectives are: • to quantify the interindividual differences in musculoskeletal constraints which contribute to
the development of the MSDs • to analyse and quantify the relationship between these interindividual differences in
musculoskeletal constraints and the general constraints imposed by the work situation (stress, attitude…).
• to analyse and quantify the relationship between these constraints, the organisational aspects of the work environment and the personal characteristics of the subject,
taking into account the functional capacities, themselves function of the individual characteristics of the subject (age, sex…).
Final report.doc : 3/05/2004 8
Diagram 1.1 - Conceptual and relational model for the development of MSDs of the neck and upper limbs
H
STRESS (appreciation of the
organisational factors, somatic symptoms …)
G I
PSYCHOSOCIAL FACTORS
(perception of the organisational factors)+
PERSONALITY (type A, neuroticism,
extraversion)
F
GENERAL ATTITUDE (workstyle)
C
TMSMS
Age, gender, anthropo- metrics
E FUNCTIONAL
CAPACITIES (angles, dexterity,
forces)
D
INDIVIDUAL CONSTRAINTS
(forces, repetitivity, postures…)
A
B
ERGONOMIC ASPECTS OF
THE WORKING CONDITIONS (procedures, machines, work
organization…)
AVERAGE BIOMECHANICAL CONSTRAINTS (forces, positions....)
Final report.doc : 3/05/2004 9
CHAPTER II: DESCRIPTION OF RESEARCH ACTIVITIES
The research lasted 4 years and was organised in 8 phases, described in detail below:
• Phase 1: Elaboration of the methodology • Phase 2: Selection of workplaces and participants • Phase 3: First stage of the forward-looking study • Phase 4: Analysis of the occupational constraints • Phase 5: Monitoring changes in constraints • Phase 6: Second stage of the forward-looking study • Phase 7: Statistical analysis of the data • Phase 8: Ethical aspects and recommendations for action
Phase 1: Elaboration of the methodology Three universities participated in this research. Phase 1 was devoted to the set up of an homogeneous interdisciplinary and inter-university team. One researcher was assigned to the project in each university and, during the first 6 months, the research team:
• exchanged experiences acquired during previous investigations • familiarised itself with the respective techniques, procedures and methodologies • established the detailed research methodology • and trained in order to assure the reproducibility of the data and reduce the differences
between observers A questionnaire with 261 questions was prepared for the interviews of operators. It included several sections described hereunder.
A. Personal and occupational characteristics and musculoskeletal history
Each operator was subjected to:
1. A general questionnaire concerning:
• his/her general characteristics: age, weight, size, studies... • his/her health: serious illnesses, accidents, depression... • his/her personal habits: smoking, sport, hobbies...
2. A questionnaire on musculoskeletal history based on the Nordic questionnaire (Kuorinka et al., 1987) about the occurrence of problems during the last 12 months in the area of the shoulders, the elbows, and more particularly of the neck and the wrists/hands, where these complaints were characterised by their intensity, duration and frequency. The questionnaire also included some questions concerning symptoms of tingling and referring to the carpal tunnel syndrome.
Final report.doc : 3/05/2004 10
3. A questionnaire on the characteristics of current and previous workplaces. Current and previous workplaces were characterised in terms of age of the workers, working hours, contract, biomechanical constraints (efforts, repetitiveness, awkward postures…).
4. A clinical examination. This examination focused on MSD in the neck and the wrists. The areas of the shoulders and elbows were not examined, given the much lower occurrence of clinical problems in these areas. Furthermore, this additional examination would have taken too long in relation to the time allotted by the companies to ensure as little disruption as possible. The protocol developed during a previous study was used (Cock and Masset, 1994).
5. Two functional tests comprising:
• The measurement of the maximum voluntary contraction (MVC) at the level of the hands. This was measured using a Jamar hydraulic dynamometer (model PC5030J1 JAMAR CAMP Ltd UK), following a published test procedure. (Cock et al., 1998).
• The measurement of the maximum angles in flexion - extension and in radial - ulnar deviation of the wrists using a goniometer.
6. Two psychomotor tests comprising: • An ocular-motor co-ordination test or finger dexterity test, the O'Connor finger
dexterity test (Lafayette UK). This involves a tray with 100 holes (10 lines of 10 holes). Each employee is asked to fill each hole of the first two rows (20 holes) as quickly as possible, with 3 pins, making as few errors as possible (dropping the pin, taking 2 or 4 pins instead of 3). The time and the number of errors are noted.
• The Bonnardel test (Bonnardel 1983, 1987), to highlight the differences in dexterity, speed of execution, spatial organisation, perseverance or the meticulous character. The person was asked to reconstitute, with bicolour cubes, drawings proposed to her. These drawings were composed of 4 (2 x 2), 9 (3 x 3) et 16 (4 x 4) cubes. The total number of cubes correctly assembled was noted.
B. "Personality traits"
1. Bortner Type A test (1969) This involves a one-dimensional, bipolar questionnaire with 16 items, and 5 levels of answers. The questionnaire is used to apprehend type A behaviour. Persons having a high score for type A behaviour are more rapid, more ambitious and time-conscious.
2. NEO-FFI personality test A shortened version, called “NEO-FFI” of the NEO-PI-R personality test of Costa and McCrae (1992), (the so-called “Big Five”), was used. The dimensions taken into consideration in this questionnaire are “conscientiousness”, “extraversion”, “agreeableness”, “neuroticism”. A fifth dimension, “openness”, was not studied in the framework of our research, since it is not recommended for a population with a low level of education, as it was the case in the present research (important correlation between this dimension and the level of studies). The shortened version comprised 12 items by dimension, with 5 levels of answers in terms of agreement.
Final report.doc : 3/05/2004 11
C. Psycho-social and stress characteristics
1. Professional styles The professional styles questionnaire (Karnas, G. and Nkombondo, L., 1985) seeks to characterize the relationship between the work and life. Three styles are distinguished:
• Integrated style: this style is characterised by a strong acceptance of the work as an integral part of personal objectives. People with an integrated style reject clearly the opinion whereby the work situation imposes restrictions on self-expression and neither underscore the harsh necessity of work nor the feeling of dependency felt in this situation.
• Functional style: this style emphasise the harsh necessity of work and a feeling of dependency in this situation. Self-expression is not felt as impossible. People with a functional style have a moderate opinion as to the instrumental value of work to achieve personal objectives.
• Instrumental style: this style expresses agreement with the impossibility to be oneself in the work situation and with the instrumental meaning of work to pursue personal objectives (instrumental style – in the sense that work is here an instrument for the pursuit of personal objectives most often outside work).
The short version of the questionnaire, with 3 series of 3 items (1 item per style), was used. The worker had to classify the items in order of relevance. This produced a score for each of the 3 styles.
2. Somatic constraints The scale of somatic constraints was composed of 8 questions concerning the occurrence of headaches, tachycardia, dizziness, nausea, chest pains, stomach ache, sleep problems, abnormal fatigue. The answers are collected in terms of: "never, sometimes (once a month), often (once a week), all the time (several times a week)” (Elo et al., 1992) (Maximum score of 24 indicating frequent, numerous problems).
3. Questionnaire on perceived work conditions: Karasek’s “Job Content Questionnaire” The Karasek questionnaire (Karasek 1979, Karasek and Theorell, 1990) was used in previous studies conducted by the partners (in particular in the BELSTRESS research to study the relationship between stress and cardio-vascular problems. This questionnaire studies the dimensions of “work psychological demands” (requirements), “decision latitude” (resources), “social support of superiors”, “social support of colleagues”, as well as “job security” and “physical demands”. A shortened version of 19 questions was used. These questions of "perception" were accompanied systematically with a question of "appreciation": Are you satisfied with this?
4. Additional questions Other dimensions, not covered by the previous questionnaires, were investigated as in the literature: the working hours, including overtime; the problems of the work organisation; responsibilities (probability and consequences of mistakes); the control exerted over the worker; the team spirit between workers; the physical constraints (noise...). The questions were formalised as in the Karasek’s questionnaire.
5. Open questions At the end of the interview, the worker was offered the possibility to talk freely, in order to end in a more “friendly” way and, at the same time, to check that no theme had been ignored which was particularly important for him.
Final report.doc : 3/05/2004 12
The discussions concerned the stress at work and outside work, the major events for the participant over the last year, other work conditions or elements that the participant wanted to discuss…
For all the questionnaires and tests, instructions were developed and tested by the researchers, in order to ensure agreement. Items comprising equivocal terms or which could be interpreted differently were redefined, in particular the different answers.
Phase 2: Selection of workplaces and participants
A. Criteria for selecting the workplaces and participants in the study The following criteria were defined for the selection of the workplaces in order to ensure sufficient diversity of the psychological and organisational environment for the about 300 people participating in the study:
• workplaces from both the secondary sector (industry) and the service sector (services to companies, transport, supplies and cleaning),
• with, if possible, contrasting technological and organisational dimensions and characteristics,
• with different levels of musculoskeletal constraints (effort, repetitiveness, work positions…etc ),
• where complaints of MSD had already been recorded, • that had not been the subject of any major change during the previous year, nor was
any reorganisation of the workplace planned for the following 2 years, • employing both men and women, • with 15 to 20 workers assigned to the same task, • with limited direct contacts with customers, • from the French-speaking and the Dutch-speaking parts of the country.
The workplaces and participants were selected in four stages:
• An initial contact with the occupational physician or the prevention adviser • A presentation of the research project to the company • A visit to the workplace • The selection of participants by workplace
The occupational physician or the prevention adviser made an initial selection of the workplaces. They were indeed ideally placed to select workplaces with a risk of MSD and with a sufficient number of workers carrying out the same tasks.
After this initial selection, the research project was presented to the company management, the trade-union representatives and the members of the Committee of Prevention and Protection at Work (CPPW). This presentation was followed by a visit of the proposed workplace. For the selected work places, the employees were selected according to the following criteria:
• agree willingly to participate in the study and to be filmed during their work, • be full-time employed, • be doing the same work for at least one year • aged under 55 (otherwise a risk of retirement before the end of the study), • employed under a contract of undefined duration (to avoid the risk of temporary
workers or participants leaving during the study),
Final report.doc : 3/05/2004 13
• not having undergone surgery of the upper limbs (carpal tunnel syndrome), • not having had an accident (fracture, injury with after-effects,) involving the upper
limbs, • not suffering from any chronic disease causing pains in the arms, such as rheumatoid
arthritis. During the first workplace visits and based on a checklist, the researchers carried out a global analysis of the workplace. This checklist concerned the following aspects:
• The number of people carrying out the same work and the location of the workplaces (in one or more places).
• The characteristics of the work carried out: the work itself; the work cycles; the work rotation systems; the work postures; the use of special tools; the products manufactured or services provided; the product variations (size, type or quantity); the level of training required.
• Working hours: the time slots; the number of working hours per week; the closing periods; the number of breaks in a working day.
• The characteristics of work organisation: work scheduling; type of contract; type of work (purely physical, purely psychological or both); the participation of employees in the event of a problem; the regulation of the work rate by the individuals, by the team or by the machine.
The final selection of the participants was made after the initial interviews: 10 to 20 people were selected per workplace Identifying suitable workplaces and obtaining the approval of the companies took longer and was more difficult than expected. Accordingly, although the number of contacts was very high (some 50 companies), 19 only agreed to participate. The reasons for their refusal were numerous, mainly:
• deliberate refusal to participate in such studies, • a refusal that problems of stress, organisation or MSD be addressed, • restructuration in progress, • impossibility to find 15 to 20 people assigned to the same tasks, • other studies in progress, • the workload of the protocol: 1 h 30 per person
B. Description of the companies and workplaces selected
In total, 19 workplaces were selected. They came from 15 different companies and from several economic sectors:
• 10 companies from the secondary sector (industry), • 3 companies from the service sector (services to companies, transport, procurement
supplies and cleaning), • 2 companies from the quaternary sector (care, education and administration).
The over-representation of the secondary sector was related, on one hand, to the research question (MSD) and, on the other hand, to the criteria used for the selection of the workplaces. The workplaces selected were quite varied as well as the type of work: assembling work (delicate assembling of small components and assembling of large components), packaging,
Final report.doc : 3/05/2004 14
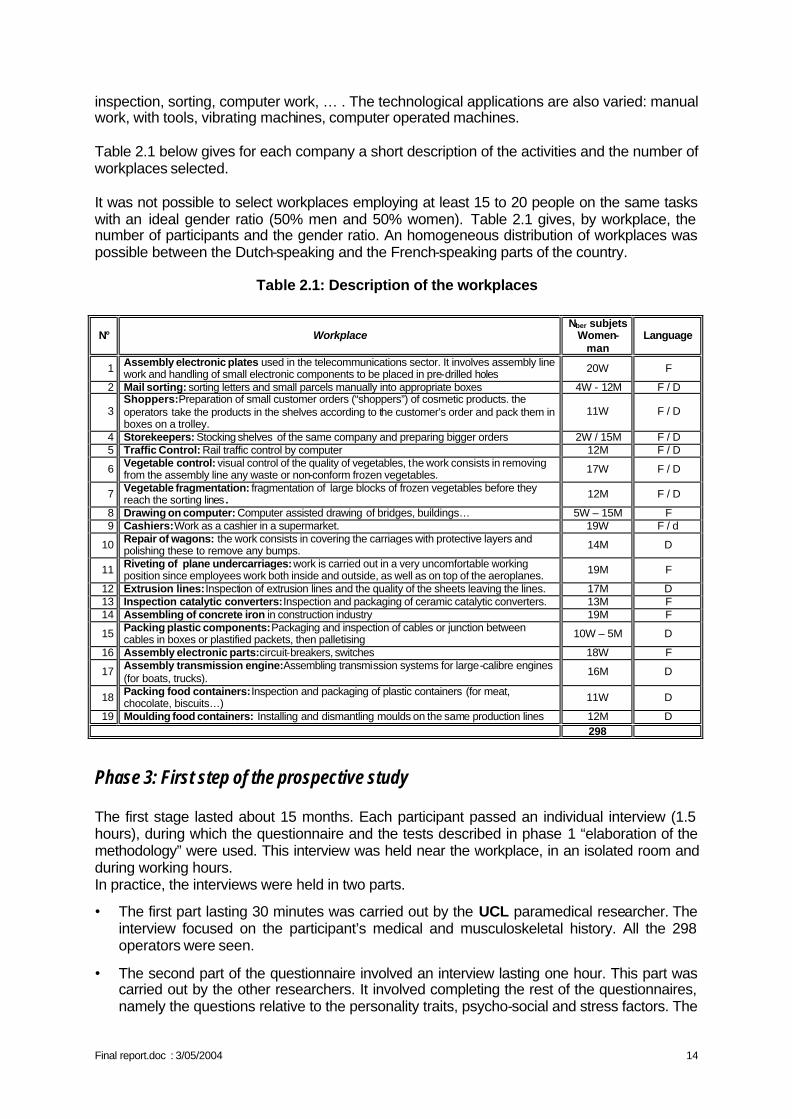
inspection, sorting, computer work, … . The technological applications are also varied: manual work, with tools, vibrating machines, computer operated machines. Table 2.1 below gives for each company a short description of the activities and the number of workplaces selected. It was not possible to select workplaces employing at least 15 to 20 people on the same tasks with an ideal gender ratio (50% men and 50% women). Table 2.1 gives, by workplace, the number of participants and the gender ratio. An homogeneous distribution of workplaces was possible between the Dutch-speaking and the French-speaking parts of the country.
Table 2.1: Description of the workplaces
N° Workplace Nber subjets
Women-man
Language
1 Assembly electronic plates used in the telecommunications sector. It involves assembly line work and handling of small electronic components to be placed in pre-drilled holes 20W F
2 Mail sorting: sorting letters and small parcels manually into appropriate boxes 4W - 12M F / D
3 Shoppers: Preparation of small customer orders (“shoppers”) of cosmetic products. the operators take the products in the shelves according to the customer’s order and pack them in boxes on a trolley.
11W F / D
4 Storekeepers: Stocking shelves of the same company and preparing bigger orders 2W / 15M F / D 5 Traffic Control: Rail traffic control by computer 12M F / D
6 Vegetable control: visual control of the quality of vegetables, the work consists in removing from the assembly line any waste or non-conform frozen vegetables. 17W F / D
7 Vegetable fragmentation: fragmentation of large blocks of frozen vegetables before they reach the sorting lines . 12M F / D
8 Drawing on computer: Computer assisted drawing of bridges, buildings… 5W – 15M F 9 Cashiers: Work as a cashier in a supermarket. 19W F / d
10 Repair of wagons: the work consists in covering the carriages with protective layers and polishing these to remove any bumps. 14M D
11 Riveting of plane undercarriages: work is carried out in a very uncomfortable working position since employees work both inside and outside, as well as on top of the aeroplanes. 19M F
12 Extrusion lines: Inspection of extrusion lines and the quality of the sheets leaving the lines. 17M D 13 Inspection catalytic converters: Inspection and packaging of ceramic catalytic converters. 13M F 14 Assembling of concrete iron in construction industry 19M F
15 Packing plastic components: Packaging and inspection of cables or junction between cables in boxes or plastified packets, then palletising 10W – 5M D
16 Assembly electronic parts: circuit-breakers, switches 18W F
17 Assembly transmission engine: Assembling transmission systems for large-calibre engines (for boats, trucks).
16M D
18 Packing food containers: Inspection and packaging of plastic containers (for meat, chocolate, biscuits…) 11W D
19 Moulding food containers: Installing and dismantling moulds on the same production lines 12M D 298
Phase 3: First step of the prospective study The first stage lasted about 15 months. Each participant passed an individual interview (1.5 hours), during which the questionnaire and the tests described in phase 1 “elaboration of the methodology” were used. This interview was held near the workplace, in an isolated room and during working hours. In practice, the interviews were held in two parts.
• The first part lasting 30 minutes was carried out by the UCL paramedical researcher. The interview focused on the participant’s medical and musculoskeletal history. All the 298 operators were seen.
• The second part of the questionnaire involved an interview lasting one hour. This part was carried out by the other researchers. It involved completing the rest of the questionnaires, namely the questions relative to the personality traits, psycho-social and stress factors. The
Final report.doc : 3/05/2004 15
French-speaking workers were interviewed by the ULB researchers and the Dutch-speaking workers by the researcher from KULeuven.
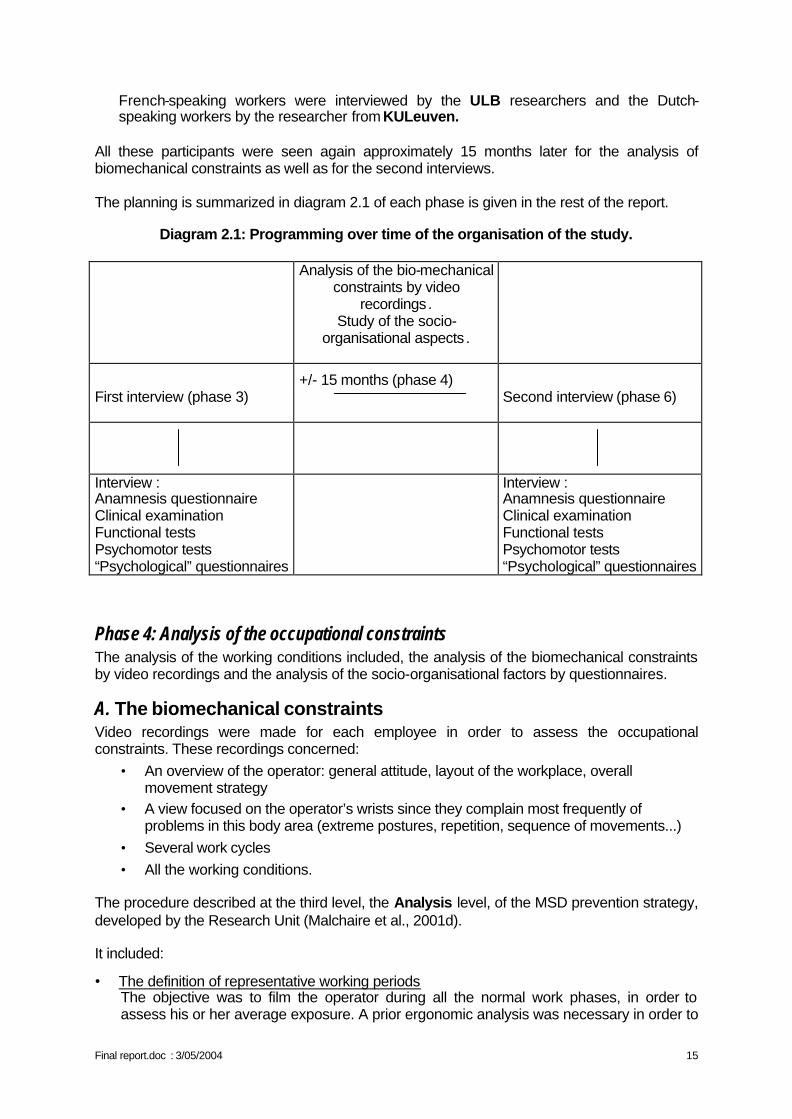
All these participants were seen again approximately 15 months later for the analysis of biomechanical constraints as well as for the second interviews. The planning is summarized in diagram 2.1 of each phase is given in the rest of the report.
Diagram 2.1: Programming over time of the organisation of the study.
Analysis of the bio-mechanical constraints by video
recordings. Study of the socio-
organisational aspects .
+/- 15 months (phase 4)
First interview (phase 3)
Second interview (phase 6)
Interview : Anamnesis questionnaire Clinical examination Functional tests Psychomotor tests “Psychological” questionnaires
Interview : Anamnesis questionnaire Clinical examination Functional tests Psychomotor tests “Psychological” questionnaires
Phase 4: Analysis of the occupational constraints The analysis of the working conditions included, the analysis of the biomechanical constraints by video recordings and the analysis of the socio-organisational factors by questionnaires.
A. The biomechanical constraints Video recordings were made for each employee in order to assess the occupational constraints. These recordings concerned:
• An overview of the operator: general attitude, layout of the workplace, overall movement strategy
• A view focused on the operator’s wrists since they complain most frequently of problems in this body area (extreme postures, repetition, sequence of movements...)
• Several work cycles • All the working conditions.
The procedure described at the third level, the Analysis level, of the MSD prevention strategy, developed by the Research Unit (Malchaire et al., 2001d). It included:
• The definition of representative working periods The objective was to film the operator during all the normal work phases, in order to assess his or her average exposure. A prior ergonomic analysis was necessary in order to
Final report.doc : 3/05/2004 16
determine the "stationary interval", that is to say, the duration (in hours, in days…), covering several cycles of work if they exist, during which all the variations of work are encountered. This analysis included: • The observation of the workplace and activities (types of work carried out, spread over
time, duration of the work cycle.) • The discussion with the operators in order to specify workplace rotations, the division
of the different tasks over the day, the work organisation, individual habits etc.
• Video recording in real time during these representative periods The camera was positioned between the sagittal and frontal planes in order to get the best possible view of the part of the body concerned by the analysis. The field of view was fairly broad in order to film without any obstacle all the movements of this body area.
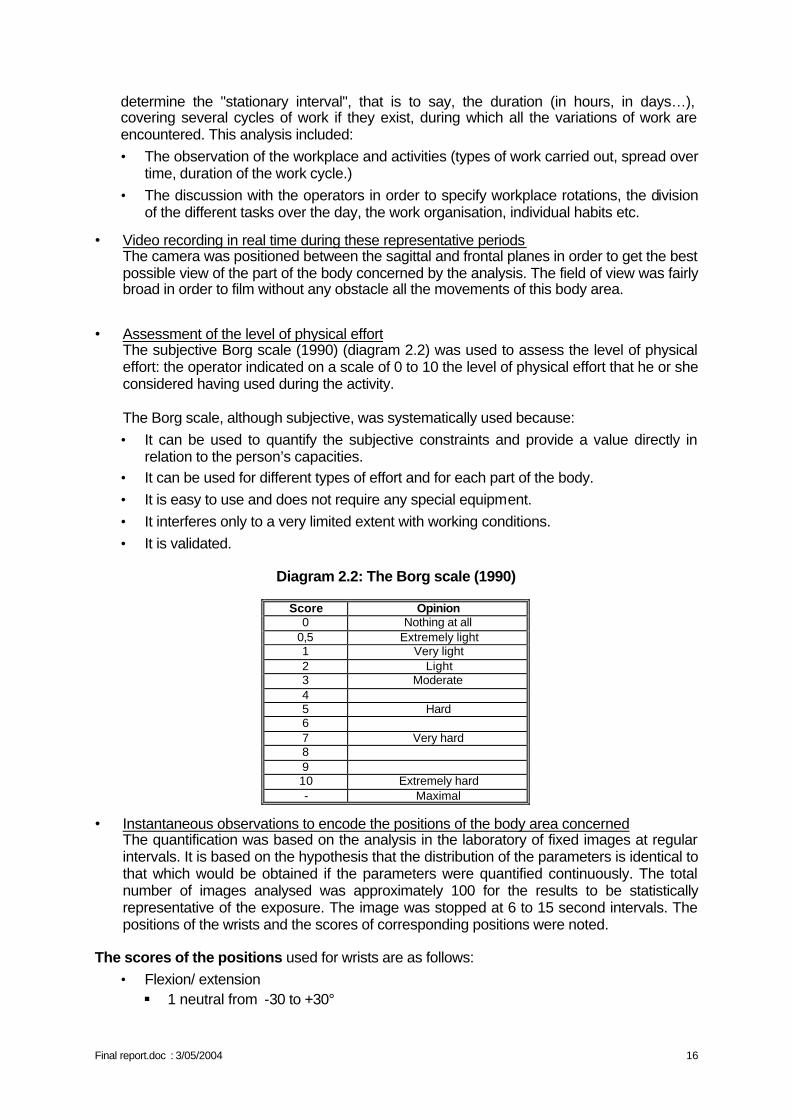
• Assessment of the level of physical effort The subjective Borg scale (1990) (diagram 2.2) was used to assess the level of physical effort: the operator indicated on a scale of 0 to 10 the level of physical effort that he or she considered having used during the activity. The Borg scale, although subjective, was systematically used because: • It can be used to quantify the subjective constraints and provide a value directly in
relation to the person’s capacities. • It can be used for different types of effort and for each part of the body. • It is easy to use and does not require any special equipment. • It interferes only to a very limited extent with working conditions. • It is validated.
Diagram 2.2: The Borg scale (1990)
Score Opinion
0 Nothing at all 0,5 Extremely light 1 Very light 2 Light 3 Moderate 4 5 Hard 6 7 Very hard 8 9 10 Extremely hard - Maximal
• Instantaneous observations to encode the positions of the body area concerned The quantification was based on the analysis in the laboratory of fixed images at regular intervals. It is based on the hypothesis that the distribution of the parameters is identical to that which would be obtained if the parameters were quantified continuously. The total number of images analysed was approximately 100 for the results to be statistically representative of the exposure. The image was stopped at 6 to 15 second intervals. The positions of the wrists and the scores of corresponding positions were noted.
The scores of the positions used for wrists are as follows:
• Flexion/ extension § 1 neutral from -30 to +30°
Final report.doc : 3/05/2004 17
§ 2 extension > 30° § 3 flexion > 30°
• Deviation § 1 neutral § 2 visible ulnar deviation § 3 visible radial deviation
• Grasp § 1 no grip § 2 digital grasp (with several fingers) § 3 full grasp (with the whole hand) § 4 pressure (with the fingertips or the whole hand) or hypothenar hammer § 5 others
Variability index
A programme was developed to calculate a variability index. Repetition is defined in terms of "movement variability". If the movement variability is high, repetition is considered to be important. The movement variability index is the number of times when, from one image to the next (out of 100 images), the position code (e. g. flexion/extension of the wrist) changes irrespective of the importance of the change and of what happened in the meantime. The index therefore varies between 0 and 100. • 0: the variability is zero: the position is maintained continuously (static position). • 100: the variability is maximal: the position changes all the time (dynamic position).
• Identification of the most important risk factors This video analysis quantifies the main bio-mechanical risk factors, that is, the postures, repetition and the physical efforts. The data were interpreted on the basis of the percentages of time during which each postural component occurred and the corresponding variability indices.
B. The organizational constraints The introduction of the report already mentions that repetitive strain injuries of the upper limbs (MSD) are a multifactor problem. Earlier studies have identified the relations between the development of MSD and the biomechanical, personal and psychosocial factors (Malchaire 1995,1998). Despite of these findings, a certain amount of the total variance concerning MSD remains unexplained. Examining the potential influence of certain organizational factors can therefore imply a surplus value. The angle of such a study differs fundamentally from the angle of studies that focus on the first mentioned categories of risk factors. The emphasis lies not on the characteristics and the subjective opinions of the individual, but on the objective characteristics of the work organization or the working environment. The aim consists in identifying the organizational factors, or the combinations of organizational factors, that influence the development of MSD of the upper limbs. In what way can the relation between the organizational factors and MSD take shape? The literature indicates two possibilities (www.ergodirect.nl).
• On the one hand, the organizational workload can be related to a monotonous job content (the direct relation). If a person is confronted with a limited number of tasks, or
Final report.doc : 3/05/2004 18
only with certain types of tasks, then by necessity this situation gives rise to a monotonous physical strain of the muscles, the tendons....
• The second possibility links MSD with stress. If a person has to perform under stress, then he or she will be less inclined to insert breaks in the activities, to raise the productivity for example. As a consequence physical overload can occur. Therefore, the indirect relation takes into account those organizational factors that entail an objective risk on stress. This objective nature of the stress risk is based on the theoretical insights of the organization science and the sociology of organization. “The issue is explicitly not the fact whether or not, one or the other employee has a good feeling about his work situation” (Huys et al., 1997).
1. The four aspects of the quality of labour and the Sociotechnics Talking about organizational factors and their objective stress risks, implies that there is a certain notion of which aspects of the working environment are less or more problematic. Or, which working environments have a low quality of labour and which have a high quality of labour. The theoretical frame consists of the Sociotechnical insights with regard to labour, organization and stress (Christis 1998) and of the four aspects of the quality of labour. An essential point is that each organization can be seen as a set of choices. Organizations exist in many forms: private companies, non-profit organizations, public institutions.... All these variants have at least one thing in common, they make choices in answering questions like:
• What sorts of activities do we want to realise with our organization? • How do we group these activities into departments and services? • Which and how many tasks do we join into separate functions? • How do we reward our employees? • etc.
The answers to these questions, formulated by the organization, are objective and measurable conditions that determine the quality of labour in the organization. These objective conditions can be situated in different spheres, reflected by ‘the four aspects of the quality of labour’.
a. The four aspects of the quality of labour
In a rather broad sense, the quality of labour is determined by organizational factors or conditions with respect to (Huys et al., 1997):
• The job content contains the whole of the tasks that are part of a function: the number of tasks, the different types of tasks, the degree of alternation, the complexity of the tasks....
• The working conditions concern the physical aspects of the working environment like for instance the lighting, the noise, the exposure to hazardous substances, the neatness....
• The terms of employment can be divided into three categories: § the primary terms or the salary aspects, § the secondary terms or the types of contract and the work schedules and finally the
tertiary terms or the training efforts and the selection and promotion criteria.
• The labour relations refer to design of the relations between employer and employees: the formal and informal consultation, the nature of the industrial relations, the most frequent issues....
Final report.doc : 3/05/2004 19
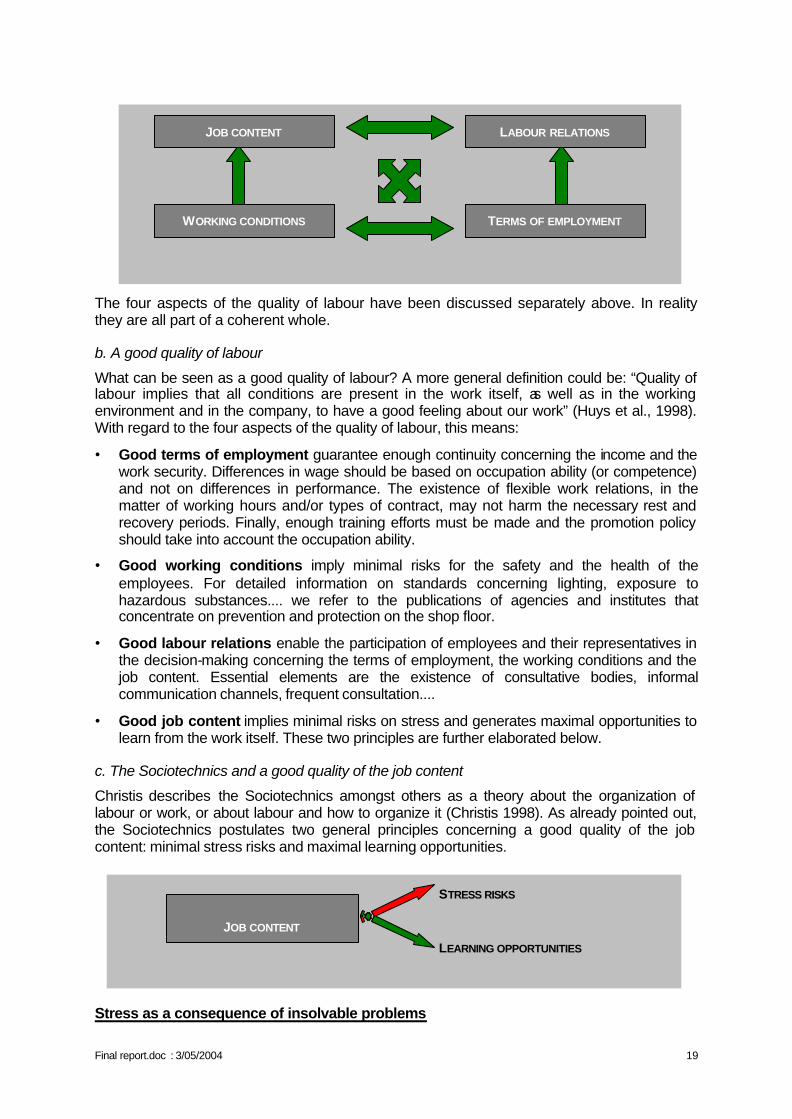
The four aspects of the quality of labour have been discussed separately above. In reality they are all part of a coherent whole.
b. A good quality of labour
What can be seen as a good quality of labour? A more general definition could be: “Quality of labour implies that all conditions are present in the work itself, as well as in the working environment and in the company, to have a good feeling about our work” (Huys et al., 1998). With regard to the four aspects of the quality of labour, this means:
• Good terms of employment guarantee enough continuity concerning the income and the work security. Differences in wage should be based on occupation ability (or competence) and not on differences in performance. The existence of flexible work relations, in the matter of working hours and/or types of contract, may not harm the necessary rest and recovery periods. Finally, enough training efforts must be made and the promotion policy should take into account the occupation ability.
• Good working conditions imply minimal risks for the safety and the health of the employees. For detailed information on standards concerning lighting, exposure to hazardous substances.... we refer to the publications of agencies and institutes that concentrate on prevention and protection on the shop floor.
• Good labour relations enable the participation of employees and their representatives in the decision-making concerning the terms of employment, the working conditions and the job content. Essential elements are the existence of consultative bodies, informal communication channels, frequent consultation....
• Good job content implies minimal risks on stress and generates maximal opportunities to learn from the work itself. These two principles are further elaborated below.
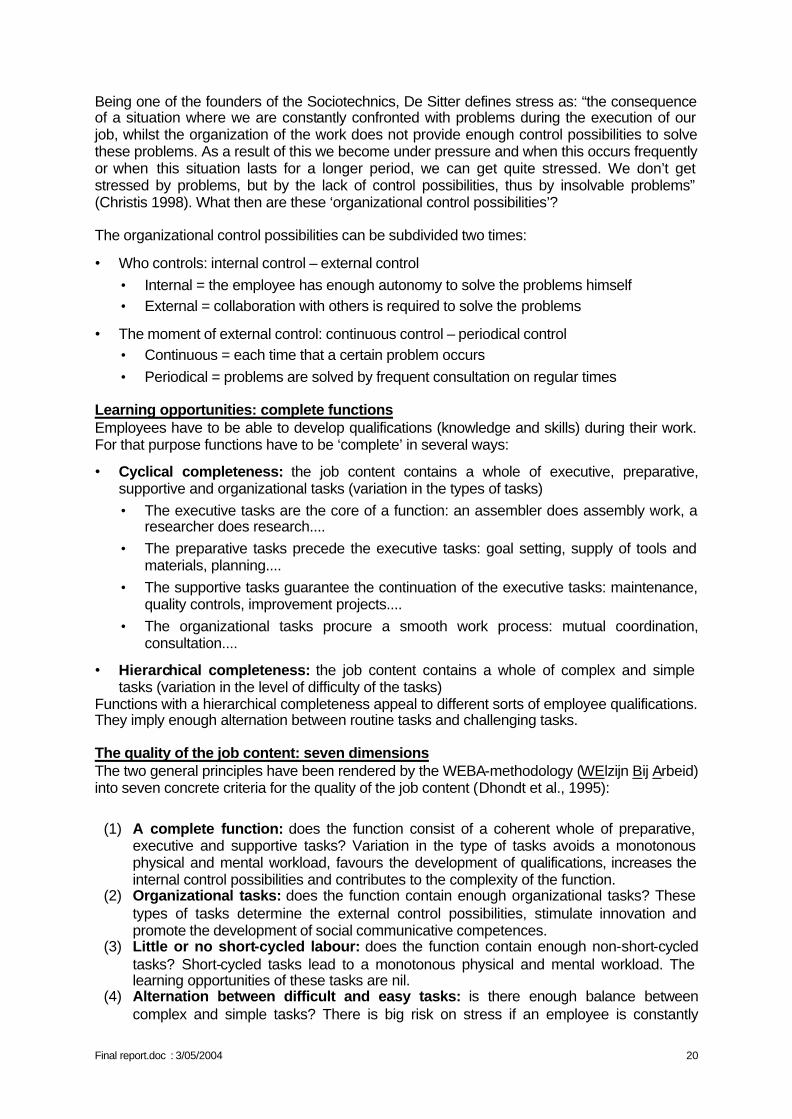
c. The Sociotechnics and a good quality of the job content
Christis describes the Sociotechnics amongst others as a theory about the organization of labour or work, or about labour and how to organize it (Christis 1998). As already pointed out, the Sociotechnics postulates two general principles concerning a good quality of the job content: minimal stress risks and maximal learning opportunities. Stress as a consequence of insolvable problems
JOB CONTENT
STRESS RISKS
LEARNING OPPORTUNITIES
WORKING CONDITIONS
JOB CONTENT
TERMS OF EMPLOYMENT
LABOUR RELATIONS
Final report.doc : 3/05/2004 20
Being one of the founders of the Sociotechnics, De Sitter defines stress as: “the consequence of a situation where we are constantly confronted with problems during the execution of our job, whilst the organization of the work does not provide enough control possibilities to solve these problems. As a result of this we become under pressure and when this occurs frequently or when this situation lasts for a longer period, we can get quite stressed. We don’t get stressed by problems, but by the lack of control possibilities, thus by insolvable problems” (Christis 1998). What then are these ‘organizational control possibilities’? The organizational control possibilities can be subdivided two times:
• Who controls: internal control – external control • Internal = the employee has enough autonomy to solve the problems himself • External = collaboration with others is required to solve the problems
• The moment of external control: continuous control – periodical control • Continuous = each time that a certain problem occurs • Periodical = problems are solved by frequent consultation on regular times
Learning opportunities: complete functions Employees have to be able to develop qualifications (knowledge and skills) during their work. For that purpose functions have to be ‘complete’ in several ways:
• Cyclical completeness: the job content contains a whole of executive, preparative, supportive and organizational tasks (variation in the types of tasks) • The executive tasks are the core of a function: an assembler does assembly work, a
researcher does research.... • The preparative tasks precede the executive tasks: goal setting, supply of tools and
materials, planning.... • The supportive tasks guarantee the continuation of the executive tasks: maintenance,
quality controls, improvement projects.... • The organizational tasks procure a smooth work process: mutual coordination,
consultation....
• Hierarchical completeness: the job content contains a whole of complex and simple tasks (variation in the level of difficulty of the tasks)
Functions with a hierarchical completeness appeal to different sorts of employee qualifications. They imply enough alternation between routine tasks and challenging tasks. The quality of the job content: seven dimensions The two general principles have been rendered by the WEBA-methodology (WElzijn Bij Arbeid) into seven concrete criteria for the quality of the job content (Dhondt et al., 1995):
(1) A complete function: does the function consist of a coherent whole of preparative, executive and supportive tasks? Variation in the type of tasks avoids a monotonous physical and mental workload, favours the development of qualifications, increases the internal control possibilities and contributes to the complexity of the function.
(2) Organizational tasks: does the function contain enough organizational tasks? These types of tasks determine the external control possibilities, stimulate innovation and promote the development of social communicative competences.
(3) Little or no short-cycled labour: does the function contain enough non-short-cycled tasks? Short-cycled tasks lead to a monotonous physical and mental workload. The learning opportunities of these tasks are nil.
(4) Alternation between difficult and easy tasks: is there enough balance between complex and simple tasks? There is big risk on stress if an employee is constantly
Final report.doc : 3/05/2004 21
pushed to the limit. To little challenge on the other hand, has a negative influence on the job motivation, leads to a passive attitude towards the job and offers no learning opportunities.
(5) Autonomy: is there enough autonomy with regard to the pace of the work, the work methods and the sequence of the tasks? The degree of autonomy determines the internal control possibilities. Additionally, the learning opportunities are limited if the work is dictated in detail by strict procedures and/or schedules.
(6) Contact and cooperation possibilities: does the function contain enough contact possibilities? An isolated workstation limits the support, limits the number of functional contacts and allows no learning from each other.
(7) Information supply: is enough information provided on the goals and on the tasks, is there feedback...? Clarity with regard to what is expected of the employees and how they have performed up until now, restricts the uncertainty and allows learning from past experiences.
Each of these seven dimensions can be assessed in three different ways:
• sufficient (no action is needed), • limited sufficient (improvement or further investigation is needed) • and insufficient (action is needed).
Christis observes: “These are absolute assessments and not relative assessments. Relative assessments compare the function to other functions or to the former situation (worse or better). Absolute assessments are made by confronting the function with insights on work-related stress causes and learning opportunities…” (Christis 1998).
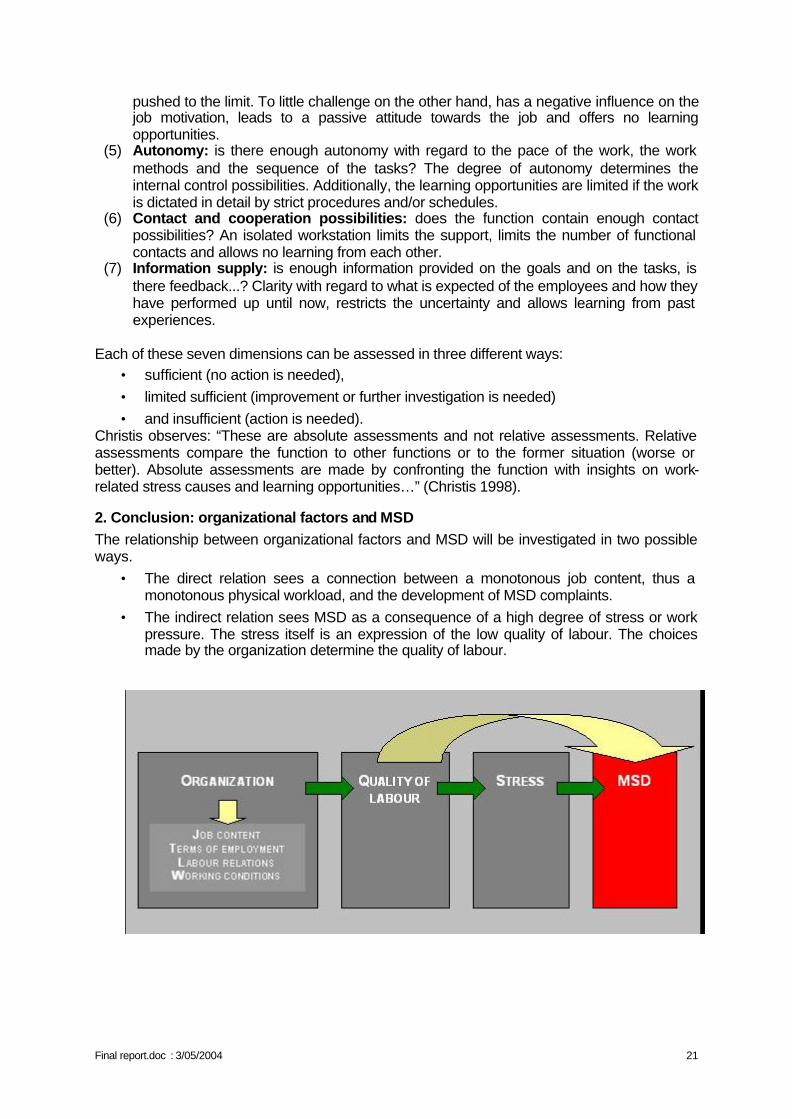
2. Conclusion: organizational factors and MSD The relationship between organizational factors and MSD will be investigated in two possible ways.
• The direct relation sees a connection between a monotonous job content, thus a monotonous physical workload, and the development of MSD complaints.
• The indirect relation sees MSD as a consequence of a high degree of stress or work pressure. The stress itself is an expression of the low quality of labour. The choices made by the organization determine the quality of labour.
1. Monotonous job content / Monotonous
Final report.doc : 3/05/2004 22
3. Organizational part: methodology The four aspects of the quality of labour indicate the focus of the organizational part. However, the working conditions will not be investigated separately. They are already dealt with in the questionnaires for the individuals. To obtain a sufficiently objective image of the working environment, several instruments have been developed and used in practice:
• The questionnaire for the personnel manager collects information on the terms of employment (primary, secondary and tertiary) and on the labour relations. Asked information: the organization chart, the socio-demographic data, the personnel turn over of the function in question, the industrial accidents, the constitution of the wages (fixed and/or variable), the training efforts, the promotion criteria, the consultation opportunities...
• The questionnaire for the production manager focuses on the organization of the production and to a lesser degree on the terms of employment. Asked information: the production base, the three most important production criteria, the nature of the produced goods and services, the subcontracting activities, the production stops, the work schedules...
• The interview with the production manager goes into the job content of the function, by means of a structured questionnaire. Asked information: the components of the production flow, the different departments and their mutual relations, the presence of buffers in the production flow, the rotation opportunities, the tasks of the function, the short-cycled and the simple tasks, the autonomy of the work group and of the individual workers with regard to the work pace, the work methods, the work sequence and the work place, the degree of information supply...
• The checklists on the quality of the job content assess the seven Sociotechnical dimensions: a complete function, the presence of organizational tasks, little or no short-cycled tasks, the alternation between complex and simple tasks, the degree of autonomy, the contact and cooperation possibilities and the information supply. By means of marking different items with a cross, the number of items varying between 6 and 9, each of the dimensions is assessed: ‘sufficient’ / ‘limited sufficient’ / ‘insufficient’). The assessments are made by the researchers themselves, basing on their knowledge of the empiricism (visits, video registrations & interviews).
The video recording aim the filming of the employee during all the phases of his or her normal work. Recording a representative working period allows the identification of the types of tasks, the time needed for each task, the technological applications in the work... During these registrations, further information can be asked of to the workers about some aspects of their work.
Phase 5: Monitoring of the changes in constraint These changes were supervised on the basis of:
• Socio-organisational questionnaires covering the last three years. • Telephone conversations with the contact person concerning structural and cyclical
changes (collective control). • Individual questions during the second interview with the workers (individual control).
Phase 6: Second stage of the prospective study for each participant individually This is the second phase of the interviews and tests.
Final report.doc : 3/05/2004 23
The initial plan was to have a period of 24 months between the two interviews: a first visit in 2000 and a second visit in 2002. Unfortunately, the obstacles encountered at the start of the research (difficulties in finding companies, getting their agreement, arranging appointments) meant that the first interviews in certain companies were delayed. In fact, the first interviews were organised for some workers in 2001 and consequently it was not possible to respect the period of 24 months between the two interviews. The schedule was adjusted in order to standardise the time gap. The period between the two interviews was 15 to 16 months. The questionnaire used during the first interviews was revised and some questions were eliminated because:
• they described a past and/or unchanged situation. The questions concerned were relative to the previous workplace and some socio-organisational aspects.
• the answers remained stable over time. This refers to some personality questionnaires (NEOFFI) and some psychomotor tests (Bonnardel).
• too few people had a positive clinical examination. Consequently, the clinical examination was not renewed during the second interview.
The time devoted to the second interview was 1 hour (instead of 1.5 hours) per person as agreed with the companies.
Phase 7: Statistical analysis of the data The multivariate logistical regression analysis made it possible to study the relationship between MSD complaints over the last 12 months and personal, psychological constraints, the functional and psychomotor tests and biomechanical constraints. Traditionally, the independent variables were introduced into the calculation model using a downward stepwise regression approach. Two difficulties were encountered during the use of this procedure:
• the number of variables (more than 200) compared to the number of participants (238); • the interactions between certain "independent" variables, for example between the
perception and appreciation of stress by employees; age and seniority. To resolve these problems, a progressive approach by "groups" of independent variables was adopted. Five groups were formed:
• personal characteristics (group A); • the characteristics of the workplace (group B1); • the parameters resulting from the video analysis of the workplace constraints (group
B2); • the psychological and stress parameters (group B3) • the personality parameters (group B4); • the socio-organisational characteristics (group B5).
Two approaches were adopted given the nature of the data either individual or averaged for each workplace. Individual data were analysed using logistical models while workplace data were analysed on a quali-quantitative basis. For the individual data, a first logistical model was calculated by introducing only the group A parameters. Then a model was calculated separately for each B1 to B4 group, by introducing simultaneously the group A parameters significantly associated at the level of 15% with the development of MSD. The final model was obtained by introducing at the outset, once again,
Final report.doc : 3/05/2004 24
the same group A parameters and those of the four other groups which were associated with MSD complaints in the preceding models at the level of 15%. The significance level of 5% was adopted for the final model.
Phase 8: Ethical aspects and recommendations for actions As the video analyses and the quantification of the biomechanical constraints were focused on evaluation and not prevention, they did not allow us to provide the ergonomic improvements expected by workers and their management. Therefore we used additionally the strategy for the prevention of musculoskeletal problems in the upper limbs developed by the UCL “Unité d’hygiène et de Physiologie du travail”, in order to get an overall view of the work situation and take advantage of the opinion of the employees directly concerned by the workplace. This strategy was developed in the framework of an earlier OSTC project (Strategy for the collective prevention of musculoskeletal risks PS/10/01) and was the subject of two publications (a leaflet and a brochure) by the Federal Ministry of Employment and Labour (Malchaire et al., 2001d).
A. Description of the strategy The strategy, called SOBANE-MSD comprises 4 levels:
• Level 1, "Screening", simple and easy to use by the employees themselves, to recognise the problems, identify immediate solutions and decide whether a more systematic Observation is required. This screening method is described in a leaflet.
• Level 2, "Observation", based on a detailed list of items which must be discussed by the employees and their management, with simple recommendations to improve the work situation.
• Level 3, "Analysis", where more specific and expensive investigation techniques are used by occupational health specialists to help people in the field to identify more technical preventive measures.
• Level 4, "Expertise ", carried out with the help of experts, with measurements and sophisticated prevention measures.
The strategy wants to be easy to apprehend, and rapid and inexpensive to implement, so that it can be used as systematically as possible by employees and management, with the co-operation of internal prevention advisers. The key factor is to encourage these people to reflect on the different aspects of the working conditions and to identify as early as possible preventive solutions. The SOBANE-MSD strategy makes it possible to optimise the process for resolving MSD problems, not only in large companies but also in small companies, by relying progressively, as and when necessary, on the complementary nature of knowledge of employees, management, health and safety at work prevention advisers and experts.
B. Level 2, Observation The level 2 "Observation" of the strategy was used in some workplaces.

Final report.doc : 3/05/2004 25
A co-ordinator had to be designated in the company. This role was played by the researchers responsible for the study, with a view to conveying the information, raising awareness about the strategy and providing a tool which could be used afterwards. In the document intended as a guide for the co-ordinator, the MSD risk factors are grouped into 20 headings find solutions. Two guiding the discussion in order to sections help the user to measure the importance of the items in question (Why worry about it?) and try to find improvements (Recommendations). The 20 headings were not necessary for the Observation of all the workplaces. The co-ordinator selected the relevant headings and adapted the method to the situation encountered. 5 to 6 motivated people (maximum 10), ready to ignore possible earlier conflicts, to reconsider the situation as a whole and to focus on the purpose of the meeting were brought together: experienced operators accepted by their colleagues, with very good “practical” knowledge of the work processes; foremen, team leaders and technicians with more of a "theoretical" knowledge of the work and occupational health specialists. The meetings were held in the vicinity of the workplace and lasted approximately 2 hours.
In practice, for each heading selected, the following questions were discussed: • What is the situation concerning …?: the participants were invited to discuss certain
aspects of the workplace. The aim was to see whether a problem existed and if so, for what reasons. After this discussion, a decision was taken as to whether the current situation was acceptable or needed to be improved.
• What can be done in practical terms to improve the situation?: this involved a discussion of technical, organisational, training solutions capable of eliminating or reducing the problem and which could be implemented easily.
In conclusion, it was decided: • whether the future situation after the implementation of the solutions envisaged would
certainly be acceptable • or whether a doubt remained and whether the identification and implementation of the
solutions required an additional Analysis with the help of prevention advisers.
In the framework of this project, the Observation process was applied to 11 workplaces. A report was sent to the prevention adviser. In some companies the results were presented verbally to the CPPW. This discussion enabled immediate solutions to be identified (work habits to be avoided, small changes to the workplace), as well as solutions which needed to be implemented over time or proposals which needed to be analysed in more detail (another model of table, chair...).
The following workplaces were the subject of this observation: • Assembly electronic plates • Shoppers • Storekeepers • Traffic Control • Drawing on computer • Cashiers • Inspection catalytic converters • Packing plastic components • Assembly electronic parts • Packing food containers • Moulding food containers
This intervention study was unfortunately not possible for the other 8 workplaces.
Final report.doc : 3/05/2004 26
CHAPTER III: COLLABORATION BETWEEN THE THREE UNITS OF THE
RESEARCH NETWORK Regular meetings between the various partners in the network were organised according to a precise timetable throughout the research in order to allow the necessary exchanges and discussions. The different stages of the research will be reviewed hereunder and the activities of each researcher will be described in the closely co-ordinated implementation of the project:
1. Elaboration of the methodology
The methodology was established jointly by the three universities. Each discipline presented the instruments related to its area of investigation. The Hygiene and Work Physiology Unit (HYTR) of UCL (led by Professor J. Malchaire) had already carried out several research projects on the influence of the ergonomic aspects of working conditions on the development of musculoskeletal disorders. The experience and methods of investigation acquired during those projects have been used in this research, in particular for the physical and biomechanical aspects. In addition, the HYTR Unit had developed the prevention strategy SOBANE with 4 levels: “Screening", "Observation", "Analysis" and "Expertise" for the prevention of musculoskeletal disorders. This strategy was used in this research (as explained before) with a view to finding improvements for the work situations and meeting the expectations of companies.
The Laboratory of Industrial and Commercial Psychology (L.P.I.C.) of ULB (led by Professor G. Karnas) has acquired considerable experience in studies on working conditions in general and the cognitive concomitants of work, more specifically in activities with an important mental load effort. The L.P.I.C. has carried out in recent years studies on the relationships between the characteristics of the work organisation, the factors of working conditions and the dimensions of work satisfaction, motivation, perception of work and attitude to work. The laboratory used its experience for the development of the questionnaire for investigating psychological, stress and psycho-organisational factors.
The Sociology Department, work and organisation section, of KUL (supervised by Professor J. Bundervoet) mainly contributed its know-how for the investigation of the organisational aspects. The KUL contribution was essential for the study of the workplaces, their integration into the system, the organisation of production and the relationships between the different departments within the companies.
The methodology as a whole was discussed and structured during meetings between the researchers of the 3 units: presentation of tools pre-selected according to the discipline, elaboration of the common protocol, exchange and pre-test of the tools between researchers, … .
2. Selection of the workplace and participants After defining together the profile of the workplaces and the participants, the three units contacted the companies. Identifying suitable workplaces and obtaining the agreement of companies was a difficult task requiring close cooperation between the researchers consulted each other frequently. When the contacts were established and the companies expressed an interest, the researchers visited the companies (two to three researchers) to study the workplace proposed.
Final report.doc : 3/05/2004 27
3. First phase of the prospective study The 3 teams trained themselves jointly on how to use the questionnaires to standardise as far as possible the terminology, assess certain questions, react in a specific situation... Once the selection made, the workplaces were “divided” in order for the researchers to concentrate on certain companies and organise their planning more freely. Given its specific characteristics, the clinical examination of all the workers was entrusted to the paramedical assistant from the UCL team. Otherwise, the tasks were allotted on the basis of the mother tongue.
4. Analysis of the occupational constraints The analysis of the biomechanical constraints included several steps: 1. An ergonomic analysis of the workplace in order to ensure that the video recording be
representative: this analysis was carried out by each of the researchers in the field and supplemented by a discussion among researchers.
2. The video recording of each participant during a representative period: the workplaces were divided up between the researchers.
3. The analysis of the images collected: the quantification of the positions of the wrists was also divided up among the researchers on the same basis as for the recordings. This step was carried out after a training given by the UCL team in order to ensure the homogeneousness of the evaluations.
As regards the collection of data relative to socio-organisational constraints, the KUL team trained the other researchers in the relevant social theories of organisations and in the use of the questionnaire.
5. Monitoring and changes in the constraints The monitoring was carried out on the basis of the socio-organisational questionnaires, regular communications with the contact persons, questions to workers during the second interviews and contacts during visits for the video recordings. The 3 researchers were responsible for monitoring the companies allocated to them.
6. Second stage of the prospective study The researchers met first to reformulate the initial questionnaire. Several meetings were needed to shorten it. Then, the researchers divided up the workplaces as before for the second interviews.
7. Statistical analysis of the data Before starting the data analysis, the UCL team centralised the data and checked their accuracy. Then, final data files for the statistical analysis were prepared.
Day-long meetings were organised monthly between the different teams to contribute to the statistical analysis of the different biomechanical, psychological and socio-organisational data.
The statistical processing of the data was divided up between the teams.
• KUL was responsible for the quali-quantitative analysis of the socio-organisational data.
• ULB was responsible for the analysis of the psycho-social, stress and personality data. • UCL was responsible for the logistical analysis of the influence of the different factors
on the development or aggravation of MSD
Final report.doc : 3/05/2004 28
8. Recommendations Level 2 of the SOBANE prevention strategy was used. The meetings were co-ordinated by the UCL team, which developed the strategy and which had the most experience in its use. The UCL researcher was assisted by the researcher from another team (ULB in the French-speaking part of the country and KUL in the Dutch-speaking part of the country) who contributed his knowledge of the work situations and of the opinions of the workers, acquired during the other phases of the project. Following these meetings, a report was prepared and sent to the companies.
Final report.doc : 3/05/2004 29
CHAPTER IV: DESCRIPTIVE RESULTS OF THE STUDY
I. POPULATION AND ITS CHARACTERISTICS
A. Description of the subjects dropped out during the study All the workers of the first year could not be re-examined the second year for various reasons: change of workplaces, departure of the company, absence at the time of the interview due to disease or accidents. These reasons were systematically investigated and one can conclude that, at one exception (1 worker drawn aside definitively for chronic lumbar problems), the problems of MSD were not the direct cause. 298 people were interviewed the first year, 181 men and 117 women. Of this, only 238 people were re-examined during the second interviews. The 60 people (34 men and 26 women) dropped out come from the different companies. The mean age, seniority at the workplace and in the company, size and weight characteristics are comparable between the people re-examined and the others. The 60 subjects not re-examined constitute therefore a random sample of the initial sample. The prevalence of complaints, whatever the area (neck, back or upper limb) was not significantly different between the two groups. As an example, the prevalence of neck complaints was respectively 59 and 58% for the 238 and 60 people and was respectively 34 and 38% for the dominant wrist.
B. Musculoskeletal history
1. Prevalence of complaints. Table 4.1 shows the prevalence of complaints in the area of the neck, the back and the upper limbs (on the right, on the left and on the dominant side) for the last 12 months period for the 238 subjects who take part in the two interviews. This table shows that on average the prevalence is the most important for the area of the low back (64%), followed by the neck (60%) and the wrists (34% on the dominant side). The complaints during the last 12 months are more frequent for the dominant side. The prevalence of complaints is presented at table 4.2 for each workplace, for the neck and the dominant wrist.
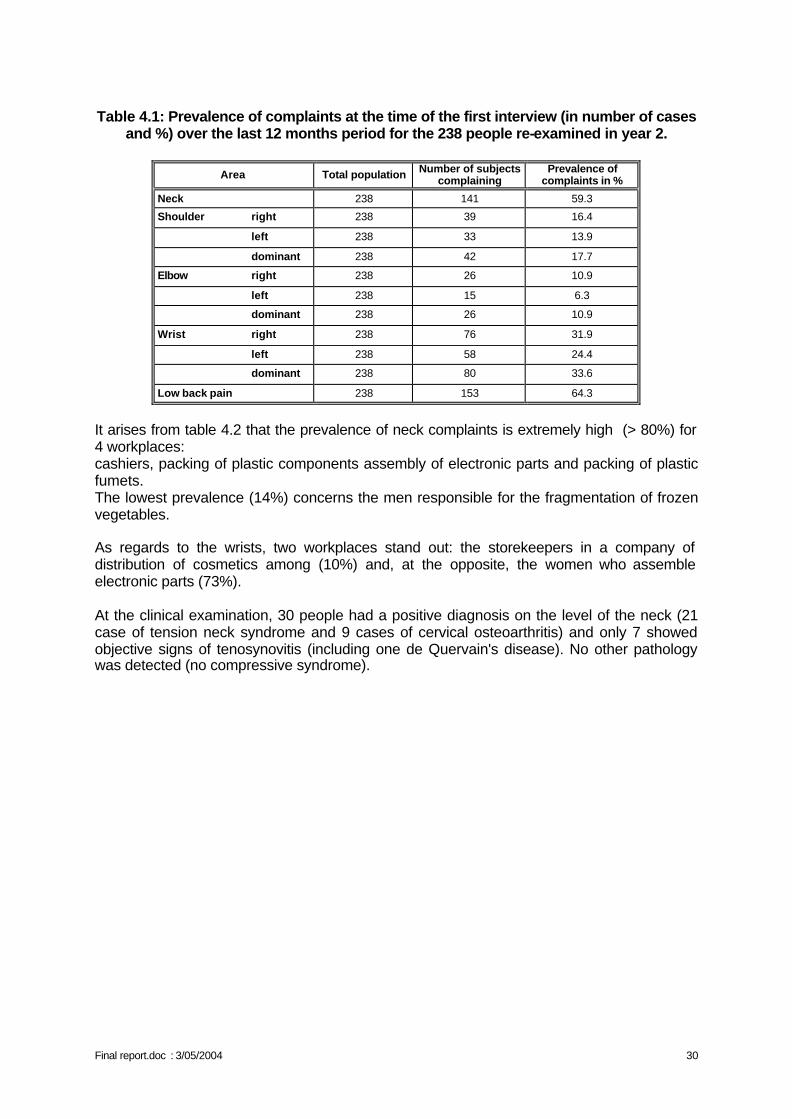
Final report.doc : 3/05/2004 30
Table 4.1: Prevalence of complaints at the time of the first interview (in number of cases
and %) over the last 12 months period for the 238 people re-examined in year 2.
Area Total population Number of subjects complaining
Prevalence of complaints in %
Neck 238 141 59.3
Shoulder right 238 39 16.4
left 238 33 13.9
dominant 238 42 17.7
Elbow right 238 26 10.9
left 238 15 6.3
dominant 238 26 10.9
Wrist right 238 76 31.9
left 238 58 24.4
dominant 238 80 33.6
Low back pain 238 153 64.3
It arises from table 4.2 that the prevalence of neck complaints is extremely high (> 80%) for 4 workplaces: cashiers, packing of plastic components assembly of electronic parts and packing of plastic fumets. The lowest prevalence (14%) concerns the men responsible for the fragmentation of frozen vegetables. As regards to the wrists, two workplaces stand out: the storekeepers in a company of distribution of cosmetics among (10%) and, at the opposite, the women who assemble electronic parts (73%). At the clinical examination, 30 people had a positive diagnosis on the level of the neck (21 case of tension neck syndrome and 9 cases of cervical osteoarthritis) and only 7 showed objective signs of tenosynovitis (including one de Quervain's disease). No other pathology was detected (no compressive syndrome).
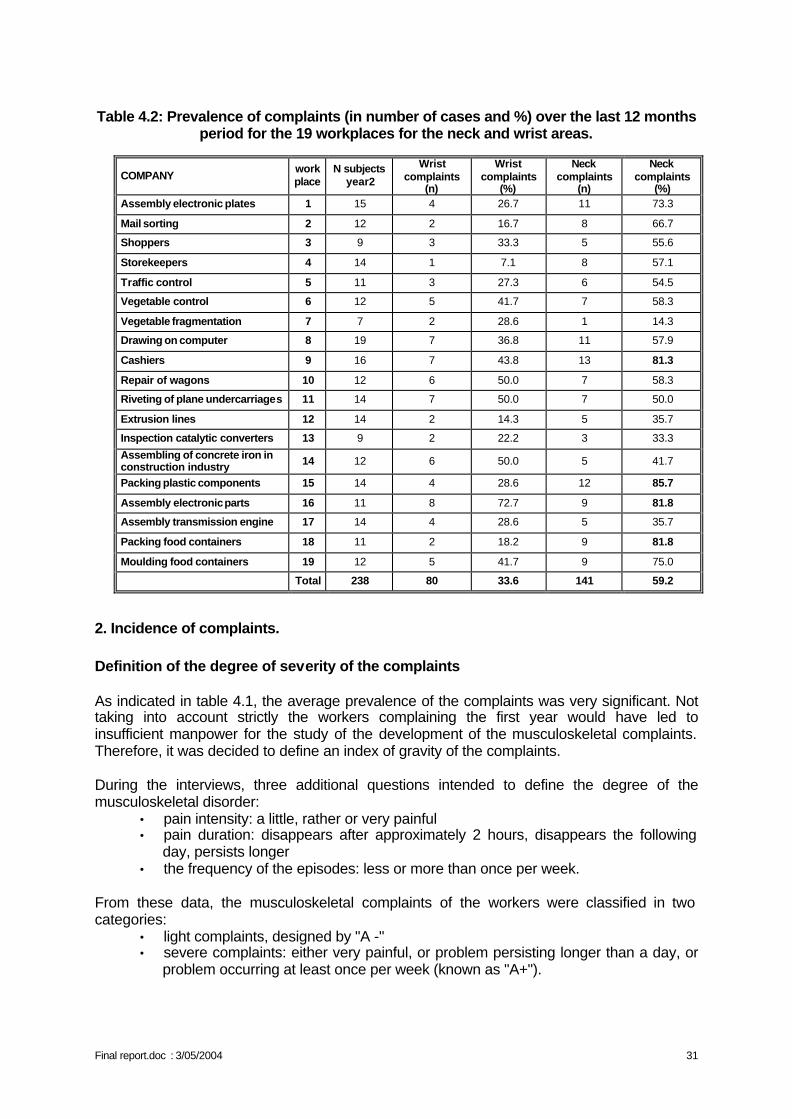
Final report.doc : 3/05/2004 31
Table 4.2: Prevalence of complaints (in number of cases and %) over the last 12 months
period for the 19 workplaces for the neck and wrist areas.
COMPANY work place
N subjects year2
Wrist complaints
(n)
Wrist complaints
(%)
Neck complaints
(n)
Neck complaints
(%) Assembly electronic plates 1 15 4 26.7 11 73.3
Mail sorting 2 12 2 16.7 8 66.7
Shoppers 3 9 3 33.3 5 55.6
Storekeepers 4 14 1 7.1 8 57.1
Traffic control 5 11 3 27.3 6 54.5
Vegetable control 6 12 5 41.7 7 58.3
Vegetable fragmentation 7 7 2 28.6 1 14.3
Drawing on computer 8 19 7 36.8 11 57.9
Cashiers 9 16 7 43.8 13 81.3
Repair of wagons 10 12 6 50.0 7 58.3
Riveting of plane undercarriages 11 14 7 50.0 7 50.0
Extrusion lines 12 14 2 14.3 5 35.7
Inspection catalytic converters 13 9 2 22.2 3 33.3
Assembling of concrete iron in construction industry 14 12 6 50.0 5 41.7
Packing plastic components 15 14 4 28.6 12 85.7
Assembly electronic parts 16 11 8 72.7 9 81.8
Assembly transmission engine 17 14 4 28.6 5 35.7
Packing food containers 18 11 2 18.2 9 81.8
Moulding food containers 19 12 5 41.7 9 75.0
Total 238 80 33.6 141 59.2
2. Incidence of complaints. Definition of the degree of severity of the complaints As indicated in table 4.1, the average prevalence of the complaints was very significant. Not taking into account strictly the workers complaining the first year would have led to insufficient manpower for the study of the development of the musculoskeletal complaints. Therefore, it was decided to define an index of gravity of the complaints. During the interviews, three additional questions intended to define the degree of the musculoskeletal disorder:
• pain intensity: a little, rather or very painful • pain duration: disappears after approximately 2 hours, disappears the following
day, persists longer • the frequency of the episodes: less or more than once per week.
From these data, the musculoskeletal complaints of the workers were classified in two categories:
• light complaints, designed by "A -" • severe complaints: either very painful, or problem persisting longer than a day, or
problem occurring at least once per week (known as "A+").
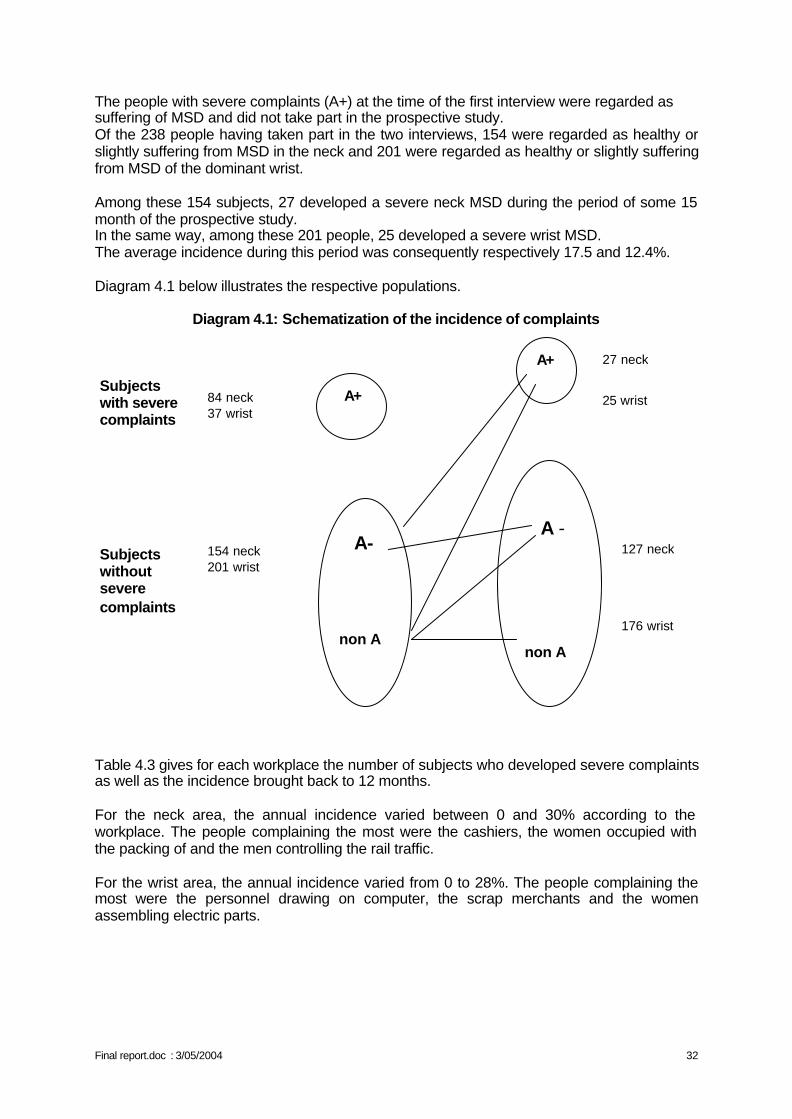
Final report.doc : 3/05/2004 32
The people with severe complaints (A+) at the time of the first interview were regarded as suffering of MSD and did not take part in the prospective study. Of the 238 people having taken part in the two interviews, 154 were regarded as healthy or slightly suffering from MSD in the neck and 201 were regarded as healthy or slightly suffering from MSD of the dominant wrist. Among these 154 subjects, 27 developed a severe neck MSD during the period of some 15 month of the prospective study. In the same way, among these 201 people, 25 developed a severe wrist MSD. The average incidence during this period was consequently respectively 17.5 and 12.4%. Diagram 4.1 below illustrates the respective populations.
Diagram 4.1: Schematization of the incidence of complaints
Table 4.3 gives for each workplace the number of subjects who developed severe complaints as well as the incidence brought back to 12 months. For the neck area, the annual incidence varied between 0 and 30% according to the workplace. The people complaining the most were the cashiers, the women occupied with the packing of and the men controlling the rail traffic. For the wrist area, the annual incidence varied from 0 to 28%. The people complaining the most were the personnel drawing on computer, the scrap merchants and the women assembling electric parts.
A+
A - non A
A+
A- non A
27 neck 25 wrist
127 neck 176 wrist
84 neck 37 wrist 154 neck 201 wrist
Subjects with severe complaints Subjects without severe complaints
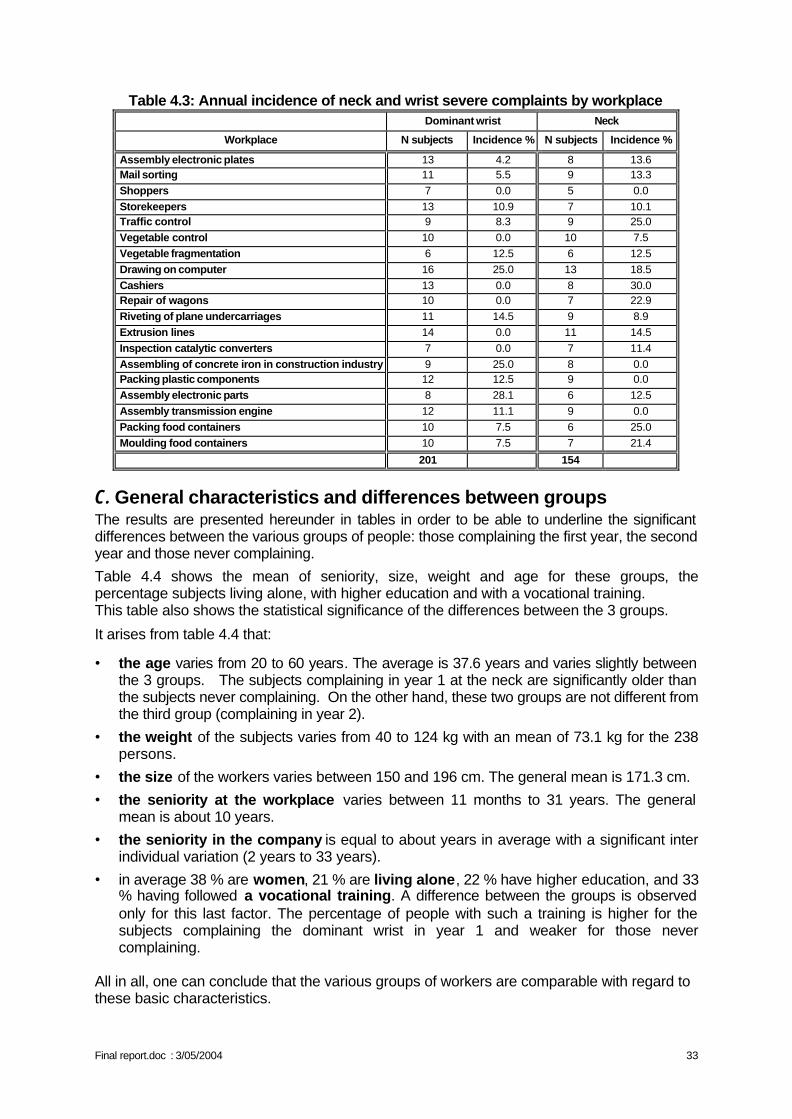
Final report.doc : 3/05/2004 33
Table 4.3: Annual incidence of neck and wrist severe complaints by workplace Dominant wrist Neck
Workplace N subjects Incidence % N subjects Incidence %
Assembly electronic plates 13 4.2 8 13.6 Mail sorting 11 5.5 9 13.3 Shoppers 7 0.0 5 0.0 Storekeepers 13 10.9 7 10.1 Traffic control 9 8.3 9 25.0 Vegetable control 10 0.0 10 7.5 Vegetable fragmentation 6 12.5 6 12.5 Drawing on computer 16 25.0 13 18.5 Cashiers 13 0.0 8 30.0 Repair of wagons 10 0.0 7 22.9 Riveting of plane undercarriages 11 14.5 9 8.9 Extrusion lines 14 0.0 11 14.5 Inspection catalytic converters 7 0.0 7 11.4 Assembling of concrete iron in construction industry 9 25.0 8 0.0 Packing plastic components 12 12.5 9 0.0 Assembly electronic parts 8 28.1 6 12.5 Assembly transmission engine 12 11.1 9 0.0 Packing food containers 10 7.5 6 25.0 Moulding food containers 10 7.5 7 21.4
201 154
C. General characteristics and differences between groups The results are presented hereunder in tables in order to be able to underline the significant differences between the various groups of people: those complaining the first year, the second year and those never complaining.
Table 4.4 shows the mean of seniority, size, weight and age for these groups, the percentage subjects living alone, with higher education and with a vocational training. This table also shows the statistical significance of the differences between the 3 groups.
It arises from table 4.4 that:
• the age varies from 20 to 60 years. The average is 37.6 years and varies slightly between the 3 groups. The subjects complaining in year 1 at the neck are significantly older than the subjects never complaining. On the other hand, these two groups are not different from the third group (complaining in year 2).
• the weight of the subjects varies from 40 to 124 kg with an mean of 73.1 kg for the 238 persons.
• the size of the workers varies between 150 and 196 cm. The general mean is 171.3 cm.
• the seniority at the workplace varies between 11 months to 31 years. The general mean is about 10 years.
• the seniority in the company is equal to about years in average with a significant inter individual variation (2 years to 33 years).
• in average 38 % are women, 21 % are living alone, 22 % have higher education, and 33 % having followed a vocational training. A difference between the groups is observed only for this last factor. The percentage of people with such a training is higher for the subjects complaining the dominant wrist in year 1 and weaker for those never complaining.
All in all, one can conclude that the various groups of workers are comparable with regard to these basic characteristics.
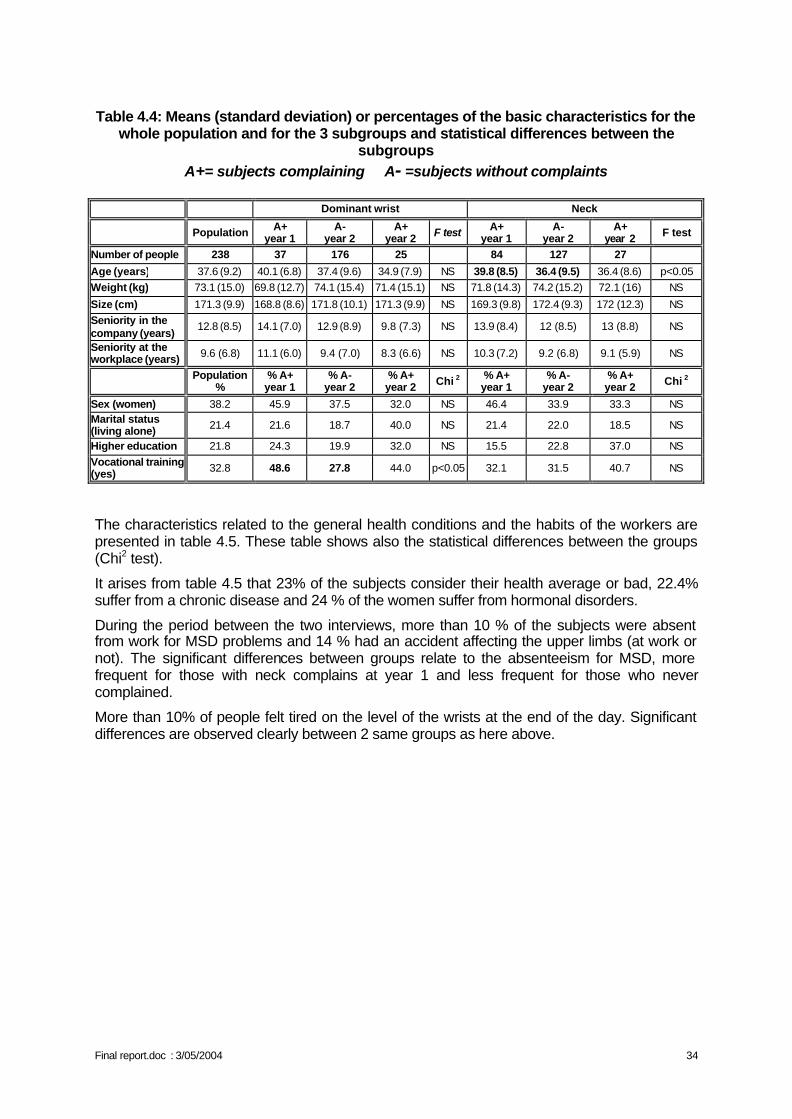
Final report.doc : 3/05/2004 34
Table 4.4: Means (standard deviation) or percentages of the basic characteristics for the
whole population and for the 3 subgroups and statistical differences between the subgroups
A+= subjects complaining A- =subjects without complaints
Dominant wrist Neck
Population A+ year 1
A- year 2
A+ year 2 F test A+
year 1 A-
year 2 A+
year 2 F test
Number of people 238 37 176 25 84 127 27
Age (years) 37.6 (9.2) 40.1 (6.8) 37.4 (9.6) 34.9 (7.9) NS 39.8 (8.5) 36.4 (9.5) 36.4 (8.6) p<0.05 Weight (kg) 73.1 (15.0) 69.8 (12.7) 74.1 (15.4) 71.4 (15.1) NS 71.8 (14.3) 74.2 (15.2) 72.1 (16) NS
Size (cm) 171.3 (9.9) 168.8 (8.6) 171.8 (10.1) 171.3 (9.9) NS 169.3 (9.8) 172.4 (9.3) 172 (12.3) NS Seniority in the company (years)
12.8 (8.5) 14.1 (7.0) 12.9 (8.9) 9.8 (7.3) NS 13.9 (8.4) 12 (8.5) 13 (8.8) NS
Seniority at the workplace (years) 9.6 (6.8) 11.1 (6.0) 9.4 (7.0) 8.3 (6.6) NS 10.3 (7.2) 9.2 (6.8) 9.1 (5.9) NS
Population %
% A+ year 1
% A- year 2
% A+ year 2 Chi 2 % A+
year 1 % A-
year 2 % A+ year 2 Chi 2
Sex (women) 38.2 45.9 37.5 32.0 NS 46.4 33.9 33.3 NS Marital status (living alone) 21.4 21.6 18.7 40.0 NS 21.4 22.0 18.5 NS
Higher education 21.8 24.3 19.9 32.0 NS 15.5 22.8 37.0 NS Vocational training (yes) 32.8 48.6 27.8 44.0 p<0.05 32.1 31.5 40.7 NS
The characteristics related to the general health conditions and the habits of the workers are presented in table 4.5. These table shows also the statistical differences between the groups (Chi2 test).
It arises from table 4.5 that 23% of the subjects consider their health average or bad, 22.4% suffer from a chronic disease and 24 % of the women suffer from hormonal disorders.
During the period between the two interviews, more than 10 % of the subjects were absent from work for MSD problems and 14 % had an accident affecting the upper limbs (at work or not). The significant differences between groups relate to the absenteeism for MSD, more frequent for those with neck complains at year 1 and less frequent for those who never complained.
More than 10% of people felt tired on the level of the wrists at the end of the day. Significant differences are observed clearly between 2 same groups as here above.
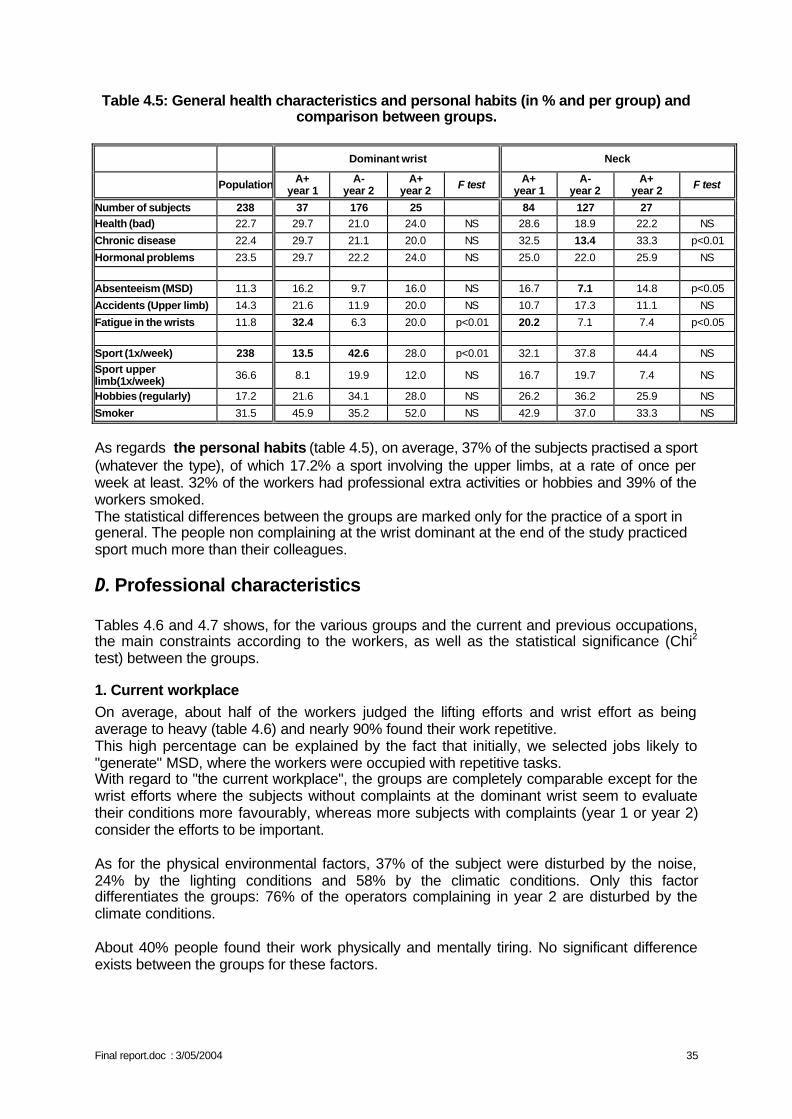
Final report.doc : 3/05/2004 35
Table 4.5: General health characteristics and personal habits (in % and per group) and comparison between groups.
Dominant wrist Neck
Population A+ year 1
A- year 2
A+ year 2 F test A+
year 1 A-
year 2 A+
year 2 F test
Number of subjects 238 37 176 25 84 127 27
Health (bad) 22.7 29.7 21.0 24.0 NS 28.6 18.9 22.2 NS
Chronic disease 22.4 29.7 21.1 20.0 NS 32.5 13.4 33.3 p<0.01
Hormonal problems 23.5 29.7 22.2 24.0 NS 25.0 22.0 25.9 NS Absenteeism (MSD) 11.3 16.2 9.7 16.0 NS 16.7 7.1 14.8 p<0.05
Accidents (Upper limb) 14.3 21.6 11.9 20.0 NS 10.7 17.3 11.1 NS
Fatigue in the wrists 11.8 32.4 6.3 20.0 p<0.01 20.2 7.1 7.4 p<0.05 Sport (1x/week) 238 13.5 42.6 28.0 p<0.01 32.1 37.8 44.4 NS Sport upper limb(1x/week) 36.6 8.1 19.9 12.0 NS 16.7 19.7 7.4 NS
Hobbies (regularly) 17.2 21.6 34.1 28.0 NS 26.2 36.2 25.9 NS
Smoker 31.5 45.9 35.2 52.0 NS 42.9 37.0 33.3 NS
As regards the personal habits (table 4.5), on average, 37% of the subjects practised a sport (whatever the type), of which 17.2% a sport involving the upper limbs, at a rate of once per week at least. 32% of the workers had professional extra activities or hobbies and 39% of the workers smoked. The statistical differences between the groups are marked only for the practice of a sport in general. The people non complaining at the wrist dominant at the end of the study practiced sport much more than their colleagues.
D. Professional characteristics Tables 4.6 and 4.7 shows, for the various groups and the current and previous occupations, the main constraints according to the workers, as well as the statistical significance (Chi2 test) between the groups.
1. Current workplace On average, about half of the workers judged the lifting efforts and wrist effort as being average to heavy (table 4.6) and nearly 90% found their work repetitive. This high percentage can be explained by the fact that initially, we selected jobs likely to "generate" MSD, where the workers were occupied with repetitive tasks. With regard to "the current workplace", the groups are completely comparable except for the wrist efforts where the subjects without complaints at the dominant wrist seem to evaluate their conditions more favourably, whereas more subjects with complaints (year 1 or year 2) consider the efforts to be important. As for the physical environmental factors, 37% of the subject were disturbed by the noise, 24% by the lighting conditions and 58% by the climatic conditions. Only this factor differentiates the groups: 76% of the operators complaining in year 2 are disturbed by the climate conditions.
About 40% people found their work physically and mentally tiring. No significant difference exists between the groups for these factors.
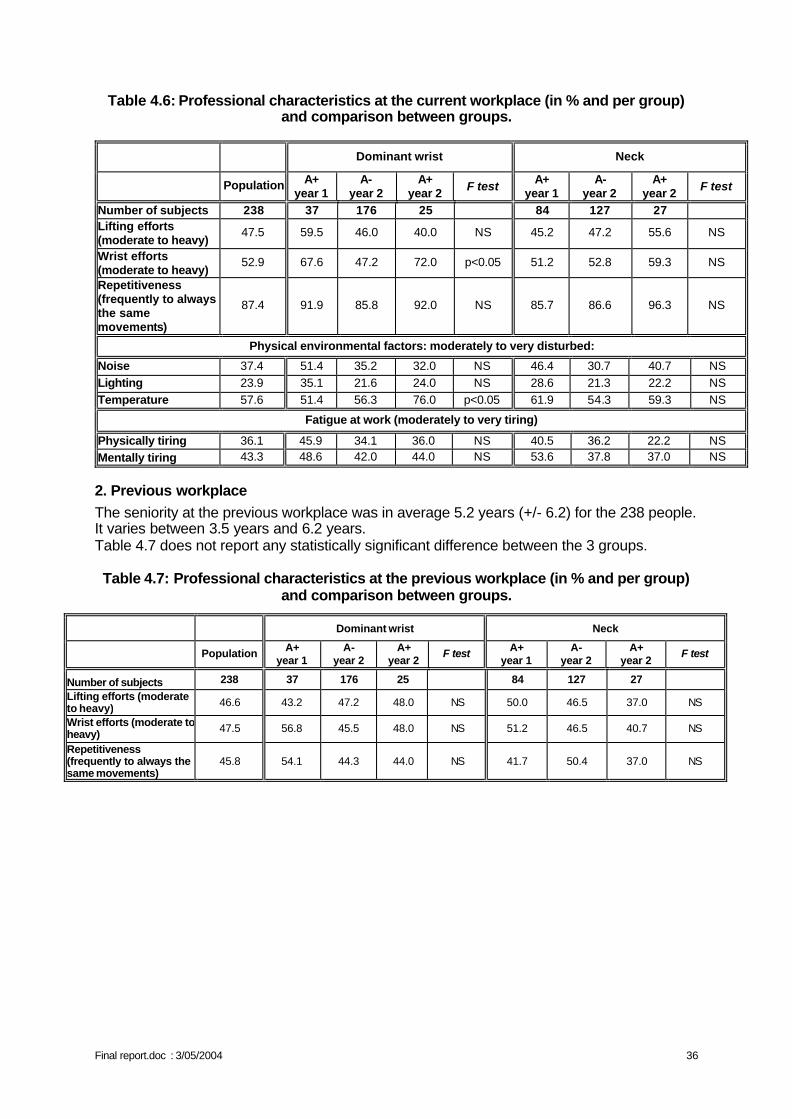
Final report.doc : 3/05/2004 36
Table 4.6: Professional characteristics at the current workplace (in % and per group) and comparison between groups.
Dominant wrist Neck
Population A+ year 1
A- year 2
A+ year 2 F test A+
year 1 A-
year 2 A+
year 2 F test
Number of subjects 238 37 176 25 84 127 27 Lifting efforts (moderate to heavy)
47.5 59.5 46.0 40.0 NS 45.2 47.2 55.6 NS
Wrist efforts (moderate to heavy)
52.9 67.6 47.2 72.0 p<0.05 51.2 52.8 59.3 NS
Repetitiveness (frequently to always the same movements)
87.4 91.9 85.8 92.0 NS 85.7 86.6 96.3 NS
Physical environmental factors: moderately to very disturbed:
Noise 37.4 51.4 35.2 32.0 NS 46.4 30.7 40.7 NS Lighting 23.9 35.1 21.6 24.0 NS 28.6 21.3 22.2 NS Temperature 57.6 51.4 56.3 76.0 p<0.05 61.9 54.3 59.3 NS
Fatigue at work (moderately to very tiring)
Physically tiring 36.1 45.9 34.1 36.0 NS 40.5 36.2 22.2 NS Mentally tiring 43.3 48.6 42.0 44.0 NS 53.6 37.8 37.0 NS
2. Previous workplace The seniority at the previous workplace was in average 5.2 years (+/- 6.2) for the 238 people. It varies between 3.5 years and 6.2 years. Table 4.7 does not report any statistically significant difference between the 3 groups. Table 4.7: Professional characteristics at the previous workplace (in % and per group)
and comparison between groups.
Dominant wrist Neck
Population A+ year 1
A- year 2
A+ year 2
F test A+ year 1
A- year 2
A+ year 2
F test
Number of subjects 238 37 176 25 84 127 27
Lifting efforts (moderate to heavy) 46.6 43.2 47.2 48.0 NS 50.0 46.5 37.0 NS
Wrist efforts (moderate to heavy) 47.5 56.8 45.5 48.0 NS 51.2 46.5 40.7 NS
Repetitiveness (frequently to always the same movements)
45.8 54.1 44.3 44.0 NS 41.7 50.4 37.0 NS
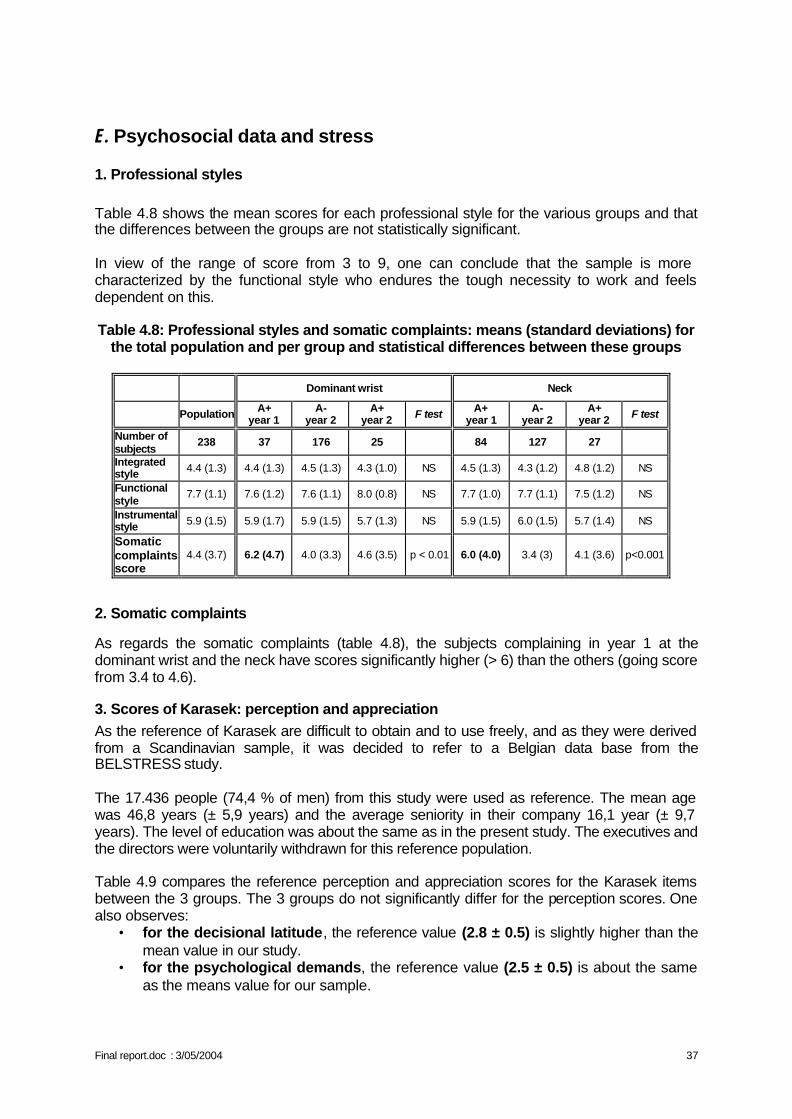
Final report.doc : 3/05/2004 37
E. Psychosocial data and stress
1. Professional styles Table 4.8 shows the mean scores for each professional style for the various groups and that the differences between the groups are not statistically significant. In view of the range of score from 3 to 9, one can conclude that the sample is more characterized by the functional style who endures the tough necessity to work and feels dependent on this. Table 4.8: Professional styles and somatic complaints: means (standard deviations) for
the total population and per group and statistical differences between these groups
Dominant wrist Neck
Population A+ year 1
A- year 2
A+ year 2 F test A+
year 1 A-
year 2 A+
year 2 F test
Number of subjects
238 37 176 25 84 127 27
Integrated style 4.4 (1.3) 4.4 (1.3) 4.5 (1.3) 4.3 (1.0) NS 4.5 (1.3) 4.3 (1.2) 4.8 (1.2) NS
Functional style
7.7 (1.1) 7.6 (1.2) 7.6 (1.1) 8.0 (0.8) NS 7.7 (1.0) 7.7 (1.1) 7.5 (1.2) NS
Instrumental style 5.9 (1.5) 5.9 (1.7) 5.9 (1.5) 5.7 (1.3) NS 5.9 (1.5) 6.0 (1.5) 5.7 (1.4) NS
Somatic complaints score
4.4 (3.7) 6.2 (4.7) 4.0 (3.3) 4.6 (3.5) p < 0.01 6.0 (4.0) 3.4 (3) 4.1 (3.6) p<0.001
2. Somatic complaints
As regards the somatic complaints (table 4.8), the subjects complaining in year 1 at the dominant wrist and the neck have scores significantly higher (> 6) than the others (going score from 3.4 to 4.6).
3. Scores of Karasek: perception and appreciation As the reference of Karasek are difficult to obtain and to use freely, and as they were derived from a Scandinavian sample, it was decided to refer to a Belgian data base from the BELSTRESS study. The 17.436 people (74,4 % of men) from this study were used as reference. The mean age was 46,8 years (± 5,9 years) and the average seniority in their company 16,1 year (± 9,7 years). The level of education was about the same as in the present study. The executives and the directors were voluntarily withdrawn for this reference population. Table 4.9 compares the reference perception and appreciation scores for the Karasek items between the 3 groups. The 3 groups do not significantly differ for the perception scores. One also observes:
• for the decisional latitude, the reference value (2.8 ± 0.5) is slightly higher than the mean value in our study.
• for the psychological demands, the reference value (2.5 ± 0.5) is about the same as the means value for our sample.
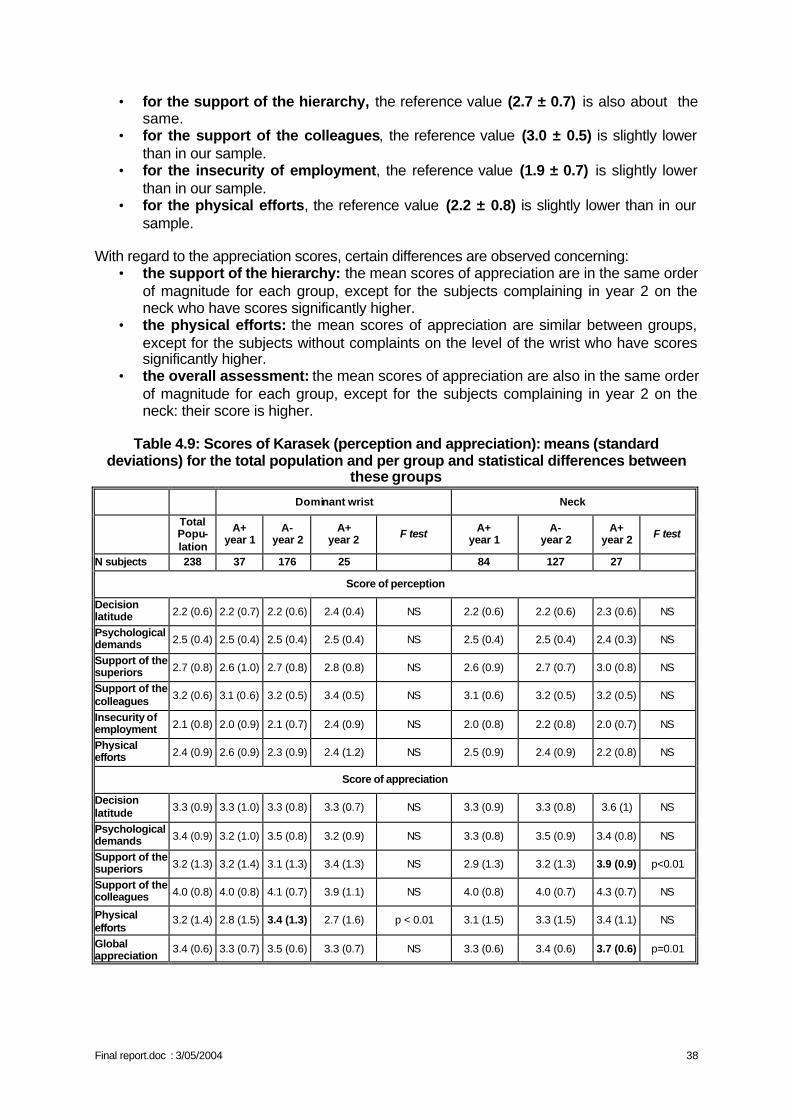
Final report.doc : 3/05/2004 38
• for the support of the hierarchy, the reference value (2.7 ± 0.7) is also about the same.
• for the support of the colleagues, the reference value (3.0 ± 0.5) is slightly lower than in our sample.
• for the insecurity of employment, the reference value (1.9 ± 0.7) is slightly lower than in our sample.
• for the physical efforts, the reference value (2.2 ± 0.8) is slightly lower than in our sample.
With regard to the appreciation scores, certain differences are observed concerning:
• the support of the hierarchy: the mean scores of appreciation are in the same order of magnitude for each group, except for the subjects complaining in year 2 on the neck who have scores significantly higher.
• the physical efforts: the mean scores of appreciation are similar between groups, except for the subjects without complaints on the level of the wrist who have scores significantly higher.
• the overall assessment: the mean scores of appreciation are also in the same order of magnitude for each group, except for the subjects complaining in year 2 on the neck: their score is higher.
Table 4.9: Scores of Karasek (perception and appreciation): means (standard
deviations) for the total population and per group and statistical differences between these groups
Dominant wrist Neck
Total Popu-lation
A+ year 1
A- year 2
A+ year 2 F test A+
year 1 A-
year 2 A+
year 2 F test
N subjects 238 37 176 25 84 127 27
Score of perception
Decision latitude 2.2 (0.6) 2.2 (0.7) 2.2 (0.6) 2.4 (0.4) NS 2.2 (0.6) 2.2 (0.6) 2.3 (0.6) NS
Psychological demands 2.5 (0.4) 2.5 (0.4) 2.5 (0.4) 2.5 (0.4) NS 2.5 (0.4) 2.5 (0.4) 2.4 (0.3) NS
Support of the superiors 2.7 (0.8) 2.6 (1.0) 2.7 (0.8) 2.8 (0.8) NS 2.6 (0.9) 2.7 (0.7) 3.0 (0.8) NS
Support of the colleagues 3.2 (0.6) 3.1 (0.6) 3.2 (0.5) 3.4 (0.5) NS 3.1 (0.6) 3.2 (0.5) 3.2 (0.5) NS
Insecurity of employment 2.1 (0.8) 2.0 (0.9) 2.1 (0.7) 2.4 (0.9) NS 2.0 (0.8) 2.2 (0.8) 2.0 (0.7) NS
Physical efforts 2.4 (0.9) 2.6 (0.9) 2.3 (0.9) 2.4 (1.2) NS 2.5 (0.9) 2.4 (0.9) 2.2 (0.8) NS
Score of appreciation
Decision latitude 3.3 (0.9) 3.3 (1.0) 3.3 (0.8) 3.3 (0.7) NS 3.3 (0.9) 3.3 (0.8) 3.6 (1) NS
Psychological demands 3.4 (0.9) 3.2 (1.0) 3.5 (0.8) 3.2 (0.9) NS 3.3 (0.8) 3.5 (0.9) 3.4 (0.8) NS
Support of the superiors 3.2 (1.3) 3.2 (1.4) 3.1 (1.3) 3.4 (1.3) NS 2.9 (1.3) 3.2 (1.3) 3.9 (0.9) p<0.01
Support of the colleagues 4.0 (0.8) 4.0 (0.8) 4.1 (0.7) 3.9 (1.1) NS 4.0 (0.8) 4.0 (0.7) 4.3 (0.7) NS
Physical efforts
3.2 (1.4) 2.8 (1.5) 3.4 (1.3) 2.7 (1.6) p < 0.01 3.1 (1.5) 3.3 (1.5) 3.4 (1.1) NS
Global appreciation
3.4 (0.6) 3.3 (0.7) 3.5 (0.6) 3.3 (0.7) NS 3.3 (0.6) 3.4 (0.6) 3.7 (0.6) p=0.01
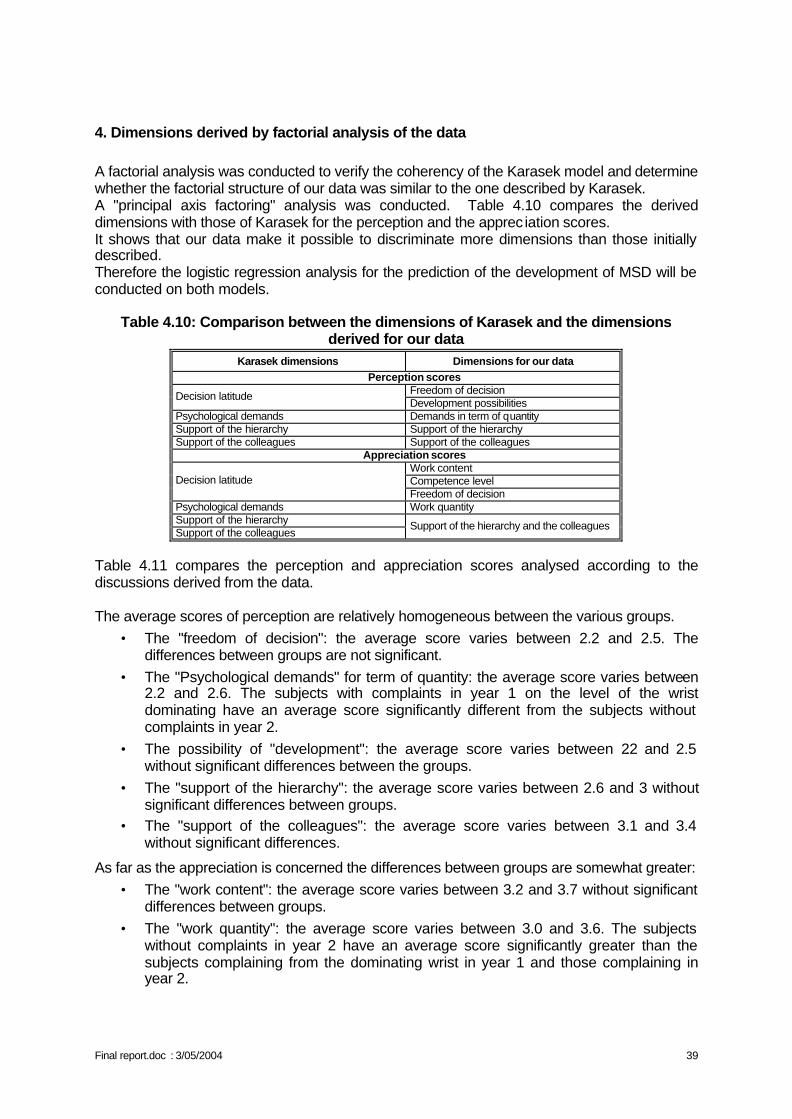
Final report.doc : 3/05/2004 39
4. Dimensions derived by factorial analysis of the data A factorial analysis was conducted to verify the coherency of the Karasek model and determine whether the factorial structure of our data was similar to the one described by Karasek. A "principal axis factoring" analysis was conducted. Table 4.10 compares the derived dimensions with those of Karasek for the perception and the apprec iation scores. It shows that our data make it possible to discriminate more dimensions than those initially described. Therefore the logistic regression analysis for the prediction of the development of MSD will be conducted on both models.
Table 4.10: Comparison between the dimensions of Karasek and the dimensions derived for our data
Karasek dimensions Dimensions for our data Perception scores
Freedom of decision Decision latitude Development possibilities
Psychological demands Demands in term of quantity Support of the hierarchy Support of the hierarchy Support of the colleagues Support of the colleagues
Appreciation scores Work content Competence level Decision latitude Freedom of decision
Psychological demands Work quantity Support of the hierarchy Support of the colleagues
Support of the hierarchy and the colleagues
Table 4.11 compares the perception and appreciation scores analysed according to the discussions derived from the data.
The average scores of perception are relatively homogeneous between the various groups.
• The "freedom of decision": the average score varies between 2.2 and 2.5. The differences between groups are not significant.
• The "Psychological demands" for term of quantity: the average score varies between 2.2 and 2.6. The subjects with complaints in year 1 on the level of the wrist dominating have an average score significantly different from the subjects without complaints in year 2.
• The possibility of "development": the average score varies between 2.2 and 2.5 without significant differences between the groups.
• The "support of the hierarchy": the average score varies between 2.6 and 3 without significant differences between groups.
• The "support of the colleagues": the average score varies between 3.1 and 3.4 without significant differences.
As far as the appreciation is concerned the differences between groups are somewhat greater: • The "work content": the average score varies between 3.2 and 3.7 without significant
differences between groups. • The "work quantity": the average score varies between 3.0 and 3.6. The subjects
without complaints in year 2 have an average score significantly greater than the subjects complaining from the dominating wrist in year 1 and those complaining in year 2.
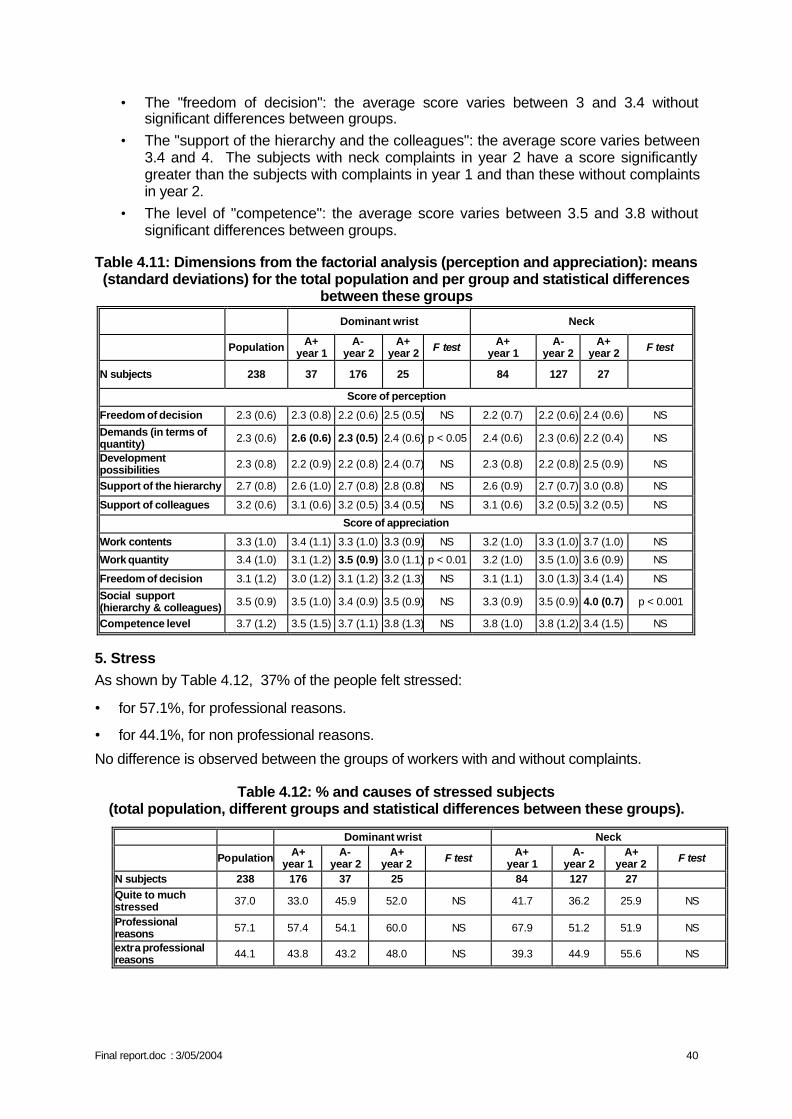
Final report.doc : 3/05/2004 40
• The "freedom of decision": the average score varies between 3 and 3.4 without significant differences between groups.
• The "support of the hierarchy and the colleagues": the average score varies between 3.4 and 4. The subjects with neck complaints in year 2 have a score significantly greater than the subjects with complaints in year 1 and than these without complaints in year 2.
• The level of "competence": the average score varies between 3.5 and 3.8 without significant differences between groups.
Table 4.11: Dimensions from the factorial analysis (perception and appreciation): means (standard deviations) for the total population and per group and statistical differences
between these groups
Dominant wrist Neck
Population A+ year 1
A- year 2
A+ year 2 F test A+
year 1 A-
year 2 A+
year 2 F test
N subjects 238 37 176 25 84 127 27
Score of perception
Freedom of decision 2.3 (0.6) 2.3 (0.8) 2.2 (0.6) 2.5 (0.5) NS 2.2 (0.7) 2.2 (0.6) 2.4 (0.6) NS
Demands (in terms of quantity) 2.3 (0.6) 2.6 (0.6) 2.3 (0.5) 2.4 (0.6) p < 0.05 2.4 (0.6) 2.3 (0.6) 2.2 (0.4) NS
Development possibilities 2.3 (0.8) 2.2 (0.9) 2.2 (0.8) 2.4 (0.7) NS 2.3 (0.8) 2.2 (0.8) 2.5 (0.9) NS
Support of the hierarchy 2.7 (0.8) 2.6 (1.0) 2.7 (0.8) 2.8 (0.8) NS 2.6 (0.9) 2.7 (0.7) 3.0 (0.8) NS
Support of colleagues 3.2 (0.6) 3.1 (0.6) 3.2 (0.5) 3.4 (0.5) NS 3.1 (0.6) 3.2 (0.5) 3.2 (0.5) NS
Score of appreciation
Work contents 3.3 (1.0) 3.4 (1.1) 3.3 (1.0) 3.3 (0.9) NS 3.2 (1.0) 3.3 (1.0) 3.7 (1.0) NS
Work quantity 3.4 (1.0) 3.1 (1.2) 3.5 (0.9) 3.0 (1.1) p < 0.01 3.2 (1.0) 3.5 (1.0) 3.6 (0.9) NS
Freedom of decision 3.1 (1.2) 3.0 (1.2) 3.1 (1.2) 3.2 (1.3) NS 3.1 (1.1) 3.0 (1.3) 3.4 (1.4) NS
Social support (hierarchy & colleagues) 3.5 (0.9) 3.5 (1.0) 3.4 (0.9) 3.5 (0.9) NS 3.3 (0.9) 3.5 (0.9) 4.0 (0.7) p < 0.001
Competence level 3.7 (1.2) 3.5 (1.5) 3.7 (1.1) 3.8 (1.3) NS 3.8 (1.0) 3.8 (1.2) 3.4 (1.5) NS
5. Stress As shown by Table 4.12, 37% of the people felt stressed:
• for 57.1%, for professional reasons.
• for 44.1%, for non professional reasons.
No difference is observed between the groups of workers with and without complaints.
Table 4.12: % and causes of stressed subjects (total population, different groups and statistical differences between these groups).
Dominant wrist Neck
Population A+ year 1
A- year 2
A+ year 2 F test A+
year 1 A-
year 2 A+
year 2 F test
N subjects 238 176 37 25 84 127 27
Quite to much stressed 37.0 33.0 45.9 52.0 NS 41.7 36.2 25.9 NS
Professional reasons 57.1 57.4 54.1 60.0 NS 67.9 51.2 51.9 NS
extra professional reasons 44.1 43.8 43.2 48.0 NS 39.3 44.9 55.6 NS
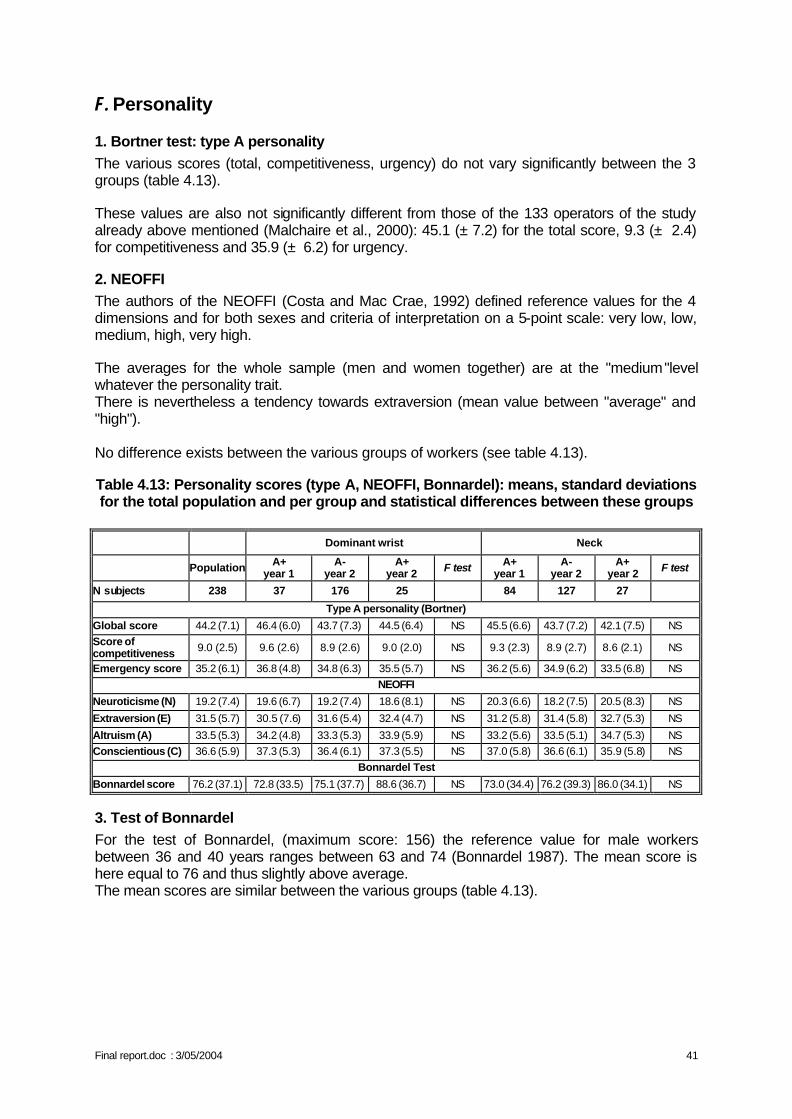
Final report.doc : 3/05/2004 41
F. Personality
1. Bortner test: type A personality The various scores (total, competitiveness, urgency) do not vary significantly between the 3 groups (table 4.13). These values are also not significantly different from those of the 133 operators of the study already above mentioned (Malchaire et al., 2000): 45.1 (± 7.2) for the total score, 9.3 (± 2.4) for competitiveness and 35.9 (± 6.2) for urgency.
2. NEOFFI The authors of the NEOFFI (Costa and Mac Crae, 1992) defined reference values for the 4 dimensions and for both sexes and criteria of interpretation on a 5-point scale: very low, low, medium, high, very high. The averages for the whole sample (men and women together) are at the "medium"level whatever the personality trait. There is nevertheless a tendency towards extraversion (mean value between "average" and "high"). No difference exists between the various groups of workers (see table 4.13). Table 4.13: Personality scores (type A, NEOFFI, Bonnardel): means, standard deviations for the total population and per group and statistical differences between these groups
Dominant wrist Neck
Population A+ year 1
A- year 2
A+ year 2 F test A+
year 1 A-
year 2 A+
year 2 F test
N subjects 238 37 176 25 84 127 27
Type A personality (Bortner)
Global score 44.2 (7.1) 46.4 (6.0) 43.7 (7.3) 44.5 (6.4) NS 45.5 (6.6) 43.7 (7.2) 42.1 (7.5) NS Score of competitiveness 9.0 (2.5) 9.6 (2.6) 8.9 (2.6) 9.0 (2.0) NS 9.3 (2.3) 8.9 (2.7) 8.6 (2.1) NS
Emergency score 35.2 (6.1) 36.8 (4.8) 34.8 (6.3) 35.5 (5.7) NS 36.2 (5.6) 34.9 (6.2) 33.5 (6.8) NS NEOFFI
Neuroticisme (N) 19.2 (7.4) 19.6 (6.7) 19.2 (7.4) 18.6 (8.1) NS 20.3 (6.6) 18.2 (7.5) 20.5 (8.3) NS
Extraversion (E) 31.5 (5.7) 30.5 (7.6) 31.6 (5.4) 32.4 (4.7) NS 31.2 (5.8) 31.4 (5.8) 32.7 (5.3) NS
Altruism (A) 33.5 (5.3) 34.2 (4.8) 33.3 (5.3) 33.9 (5.9) NS 33.2 (5.6) 33.5 (5.1) 34.7 (5.3) NS Conscientious (C) 36.6 (5.9) 37.3 (5.3) 36.4 (6.1) 37.3 (5.5) NS 37.0 (5.8) 36.6 (6.1) 35.9 (5.8) NS
Bonnardel Test
Bonnardel score 76.2 (37.1) 72.8 (33.5) 75.1 (37.7) 88.6 (36.7) NS 73.0 (34.4) 76.2 (39.3) 86.0 (34.1) NS
3. Test of Bonnardel For the test of Bonnardel, (maximum score: 156) the reference value for male workers between 36 and 40 years ranges between 63 and 74 (Bonnardel 1987). The mean score is here equal to 76 and thus slightly above average. The mean scores are similar between the various groups (table 4.13).
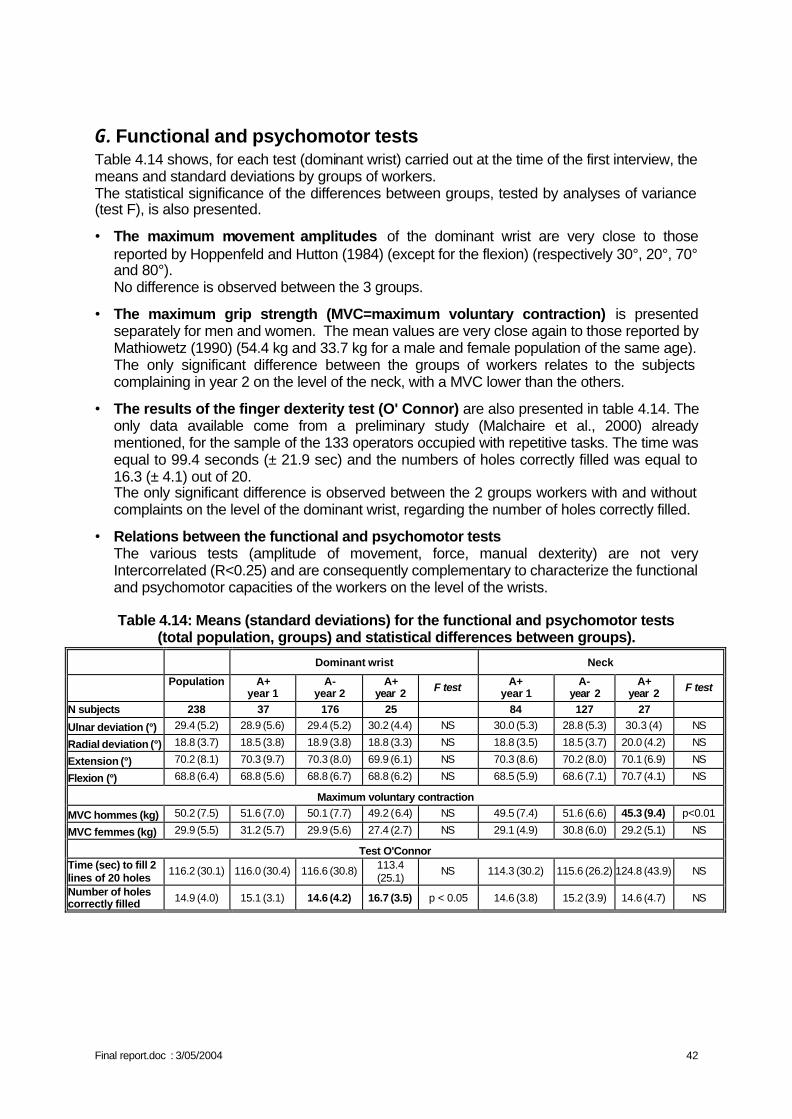
Final report.doc : 3/05/2004 42
G. Functional and psychomotor tests Table 4.14 shows, for each test (dominant wrist) carried out at the time of the first interview, the means and standard deviations by groups of workers. The statistical significance of the differences between groups, tested by analyses of variance (test F), is also presented.
• The maximum movement amplitudes of the dominant wrist are very close to those reported by Hoppenfeld and Hutton (1984) (except for the flexion) (respectively 30°, 20°, 70° and 80°). No difference is observed between the 3 groups.
• The maximum grip strength (MVC=maximum voluntary contraction) is presented separately for men and women. The mean values are very close again to those reported by Mathiowetz (1990) (54.4 kg and 33.7 kg for a male and female population of the same age). The only significant difference between the groups of workers relates to the subjects complaining in year 2 on the level of the neck, with a MVC lower than the others.
• The results of the finger dexterity test (O' Connor) are also presented in table 4.14. The only data available come from a preliminary study (Malchaire et al., 2000) already mentioned, for the sample of the 133 operators occupied with repetitive tasks. The time was equal to 99.4 seconds (± 21.9 sec) and the numbers of holes correctly filled was equal to 16.3 (± 4.1) out of 20. The only significant difference is observed between the 2 groups workers with and without complaints on the level of the dominant wrist, regarding the number of holes correctly filled.
• Relations between the functional and psychomotor tests The various tests (amplitude of movement, force, manual dexterity) are not very Intercorrelated (R<0.25) and are consequently complementary to characterize the functional and psychomotor capacities of the workers on the level of the wrists.
Table 4.14: Means (standard deviations) for the functional and psychomotor tests
(total population, groups) and statistical differences between groups).
Dominant wrist Neck
Population A+ year 1
A- year 2
A+ year 2 F test A+
year 1 A-
year 2 A+
year 2 F test
N subjects 238 37 176 25 84 127 27
Ulnar deviation (°) 29.4 (5.2) 28.9 (5.6) 29.4 (5.2) 30.2 (4.4) NS 30.0 (5.3) 28.8 (5.3) 30.3 (4) NS
Radial deviation (°) 18.8 (3.7) 18.5 (3.8) 18.9 (3.8) 18.8 (3.3) NS 18.8 (3.5) 18.5 (3.7) 20.0 (4.2) NS
Extension (°) 70.2 (8.1) 70.3 (9.7) 70.3 (8.0) 69.9 (6.1) NS 70.3 (8.6) 70.2 (8.0) 70.1 (6.9) NS
Flexion (°) 68.8 (6.4) 68.8 (5.6) 68.8 (6.7) 68.8 (6.2) NS 68.5 (5.9) 68.6 (7.1) 70.7 (4.1) NS
Maximum voluntary contraction
MVC hommes (kg) 50.2 (7.5) 51.6 (7.0) 50.1 (7.7) 49.2 (6.4) NS 49.5 (7.4) 51.6 (6.6) 45.3 (9.4) p<0.01
MVC femmes (kg) 29.9 (5.5) 31.2 (5.7) 29.9 (5.6) 27.4 (2.7) NS 29.1 (4.9) 30.8 (6.0) 29.2 (5.1) NS
Test O'Connor Time (sec) to fill 2 lines of 20 holes
116.2 (30.1) 116.0 (30.4) 116.6 (30.8) 113.4 (25.1)
NS 114.3 (30.2) 115.6 (26.2) 124.8 (43.9) NS
Number of holes correctly filled 14.9 (4.0) 15.1 (3.1) 14.6 (4.2) 16.7 (3.5) p < 0.05 14.6 (3.8) 15.2 (3.9) 14.6 (4.7) NS
Final report.doc : 3/05/2004 43
II. PROFESSIONAL CONSTRAINTS ANALYSIS
A. Biomechanical constraints The video analysis was done for the biomechanical constraints at the dominant wrist and for the 187 subjects complaining and not complaining in year 2. Table 4.15 shows the mean results.
• On average, the operators work very little in extreme flexion (7%) whereas they work in extension during nearly 40% of the time. Variability is not very high, it is about equal to 40 on a scale from 0 to 100.
• It is the same for the radial deviation adopted during 5% of time only and the ulnar deviation adopted during 26% of their time. Again variability is not very high (34).
• The power grasp is the most frequent and this occurs during 37% of the time on average. The variability of the type of grasp is higher and equal to 46.
• The level of effort is judged "moderate" (3.6) on the Borg scale with individual values ranging from nil (0) to very important (9).
These biomechanical constraints are about the same for the various groups with however the variability in postures and forces slightly greater for those not complaining. The results were also presented by workplace at table 4.16. Very significant differences exist between workplaces: from 9% to 75% for the extension of the wrist for example. The percentages of time exceeding 25% are indicated in bold in the table and those greater than 50% are underlined. The efforts considered to be significant (5 = important on the scale of Borg) are also underlined. On average, the operators work at certain workplaces up to 70% of their time with the wrist in extension (assembly transmission engine), up to 43% of their time with the wrist in ulnar deviation (riveting of plane undercarriages) and up to 71% of their time with a digital grasp (mail sorting). Broadly the individual values by workplace are well distributed. Nevertheless, it arises from the results that the distributions of the values within the same workstation are not always gaussian. At the same workplace, opposite extremes are met.
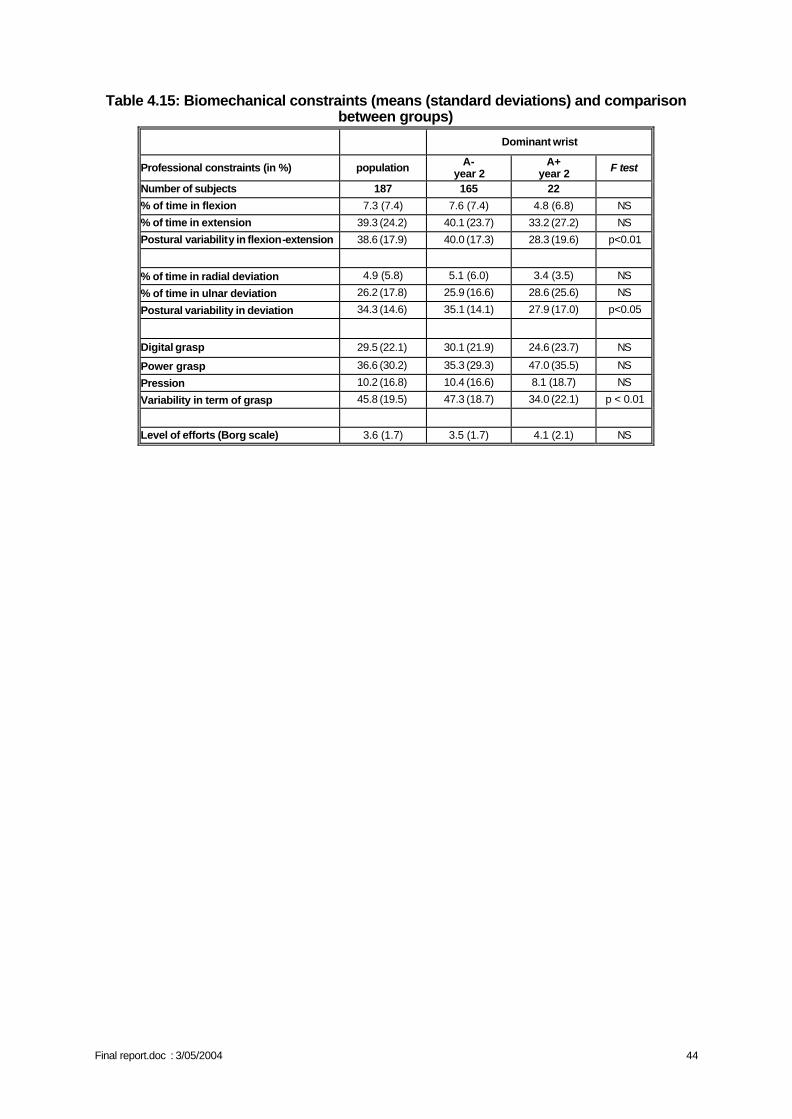
Final report.doc : 3/05/2004 44
Table 4.15: Biomechanical constraints (means (standard deviations) and comparison between groups)
Dominant wrist
Professional constraints (in %) population A- year 2
A+ year 2 F test
Number of subjects 187 165 22
% of time in flexion 7.3 (7.4) 7.6 (7.4) 4.8 (6.8) NS
% of time in extension 39.3 (24.2) 40.1 (23.7) 33.2 (27.2) NS
Postural variability in flexion-extension 38.6 (17.9) 40.0 (17.3) 28.3 (19.6) p<0.01
% of time in radial deviation 4.9 (5.8) 5.1 (6.0) 3.4 (3.5) NS
% of time in ulnar deviation 26.2 (17.8) 25.9 (16.6) 28.6 (25.6) NS
Postural variability in deviation 34.3 (14.6) 35.1 (14.1) 27.9 (17.0) p<0.05
Digital grasp 29.5 (22.1) 30.1 (21.9) 24.6 (23.7) NS
Power grasp 36.6 (30.2) 35.3 (29.3) 47.0 (35.5) NS
Pression 10.2 (16.8) 10.4 (16.6) 8.1 (18.7) NS
Variability in term of grasp 45.8 (19.5) 47.3 (18.7) 34.0 (22.1) p < 0.01
Level of efforts (Borg scale) 3.6 (1.7) 3.5 (1.7) 4.1 (2.1) NS
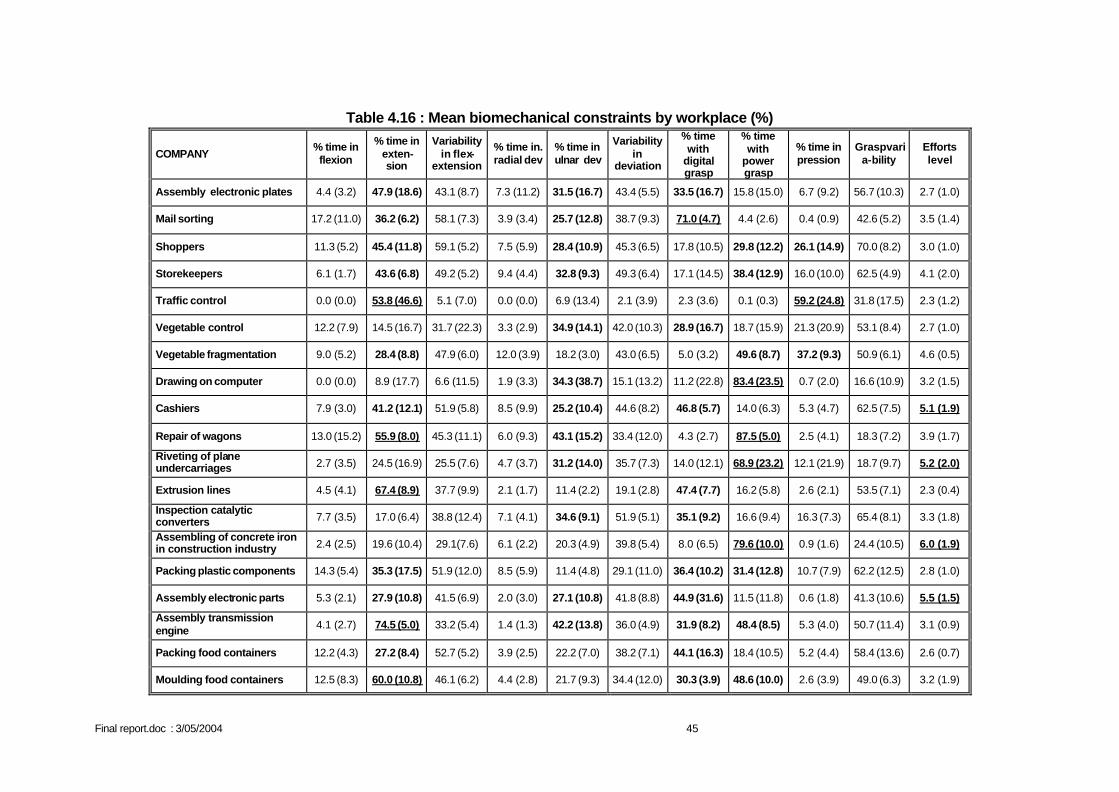
Final report.doc : 3/05/2004 45
Table 4.16 : Mean biomechanical constraints by workplace (%)
COMPANY % time in flexion
% time in exten-sion
Variability in flex-
extension
% time in. radial dev
% time in ulnar dev
Variability in
deviation
% time with
digital grasp
% time with
power grasp
% time in pression
Graspvaria-bility
Efforts level
Assembly electronic plates 4.4 (3.2) 47.9 (18.6) 43.1 (8.7) 7.3 (11.2) 31.5 (16.7) 43.4 (5.5) 33.5 (16.7) 15.8 (15.0) 6.7 (9.2) 56.7 (10.3) 2.7 (1.0)
Mail sorting 17.2 (11.0) 36.2 (6.2) 58.1 (7.3) 3.9 (3.4) 25.7 (12.8) 38.7 (9.3) 71.0 (4.7) 4.4 (2.6) 0.4 (0.9) 42.6 (5.2) 3.5 (1.4)
Shoppers 11.3 (5.2) 45.4 (11.8) 59.1 (5.2) 7.5 (5.9) 28.4 (10.9) 45.3 (6.5) 17.8 (10.5) 29.8 (12.2) 26.1 (14.9) 70.0 (8.2) 3.0 (1.0)
Storekeepers 6.1 (1.7) 43.6 (6.8) 49.2 (5.2) 9.4 (4.4) 32.8 (9.3) 49.3 (6.4) 17.1 (14.5) 38.4 (12.9) 16.0 (10.0) 62.5 (4.9) 4.1 (2.0)
Traffic control 0.0 (0.0) 53.8 (46.6) 5.1 (7.0) 0.0 (0.0) 6.9 (13.4) 2.1 (3.9) 2.3 (3.6) 0.1 (0.3) 59.2 (24.8) 31.8 (17.5) 2.3 (1.2)
Vegetable control 12.2 (7.9) 14.5 (16.7) 31.7 (22.3) 3.3 (2.9) 34.9 (14.1) 42.0 (10.3) 28.9 (16.7) 18.7 (15.9) 21.3 (20.9) 53.1 (8.4) 2.7 (1.0)
Vegetable fragmentation 9.0 (5.2) 28.4 (8.8) 47.9 (6.0) 12.0 (3.9) 18.2 (3.0) 43.0 (6.5) 5.0 (3.2) 49.6 (8.7) 37.2 (9.3) 50.9 (6.1) 4.6 (0.5)
Drawing on computer 0.0 (0.0) 8.9 (17.7) 6.6 (11.5) 1.9 (3.3) 34.3 (38.7) 15.1 (13.2) 11.2 (22.8) 83.4 (23.5) 0.7 (2.0) 16.6 (10.9) 3.2 (1.5)
Cashiers 7.9 (3.0) 41.2 (12.1) 51.9 (5.8) 8.5 (9.9) 25.2 (10.4) 44.6 (8.2) 46.8 (5.7) 14.0 (6.3) 5.3 (4.7) 62.5 (7.5) 5.1 (1.9)
Repair of wagons 13.0 (15.2) 55.9 (8.0) 45.3 (11.1) 6.0 (9.3) 43.1 (15.2) 33.4 (12.0) 4.3 (2.7) 87.5 (5.0) 2.5 (4.1) 18.3 (7.2) 3.9 (1.7)
Riveting of plane undercarriages 2.7 (3.5) 24.5 (16.9) 25.5 (7.6) 4.7 (3.7) 31.2 (14.0) 35.7 (7.3) 14.0 (12.1) 68.9 (23.2) 12.1 (21.9) 18.7 (9.7) 5.2 (2.0)
Extrusion lines 4.5 (4.1) 67.4 (8.9) 37.7 (9.9) 2.1 (1.7) 11.4 (2.2) 19.1 (2.8) 47.4 (7.7) 16.2 (5.8) 2.6 (2.1) 53.5 (7.1) 2.3 (0.4)
Inspection catalytic converters 7.7 (3.5) 17.0 (6.4) 38.8 (12.4) 7.1 (4.1) 34.6 (9.1) 51.9 (5.1) 35.1 (9.2) 16.6 (9.4) 16.3 (7.3) 65.4 (8.1) 3.3 (1.8)
Assembling of concrete iron in construction industry 2.4 (2.5) 19.6 (10.4) 29.1(7.6) 6.1 (2.2) 20.3 (4.9) 39.8 (5.4) 8.0 (6.5) 79.6 (10.0) 0.9 (1.6) 24.4 (10.5) 6.0 (1.9)
Packing plastic components 14.3 (5.4) 35.3 (17.5) 51.9 (12.0) 8.5 (5.9) 11.4 (4.8) 29.1 (11.0) 36.4 (10.2) 31.4 (12.8) 10.7 (7.9) 62.2 (12.5) 2.8 (1.0)
Assembly electronic parts 5.3 (2.1) 27.9 (10.8) 41.5 (6.9) 2.0 (3.0) 27.1 (10.8) 41.8 (8.8) 44.9 (31.6) 11.5 (11.8) 0.6 (1.8) 41.3 (10.6) 5.5 (1.5)
Assembly transmission engine 4.1 (2.7) 74.5 (5.0) 33.2 (5.4) 1.4 (1.3) 42.2 (13.8) 36.0 (4.9) 31.9 (8.2) 48.4 (8.5) 5.3 (4.0) 50.7 (11.4) 3.1 (0.9)
Packing food containers 12.2 (4.3) 27.2 (8.4) 52.7 (5.2) 3.9 (2.5) 22.2 (7.0) 38.2 (7.1) 44.1 (16.3) 18.4 (10.5) 5.2 (4.4) 58.4 (13.6) 2.6 (0.7)
Moulding food containers 12.5 (8.3) 60.0 (10.8) 46.1 (6.2) 4.4 (2.8) 21.7 (9.3) 34.4 (12.0) 30.3 (3.9) 48.6 (10.0) 2.6 (3.9) 49.0 (6.3) 3.2 (1.9)
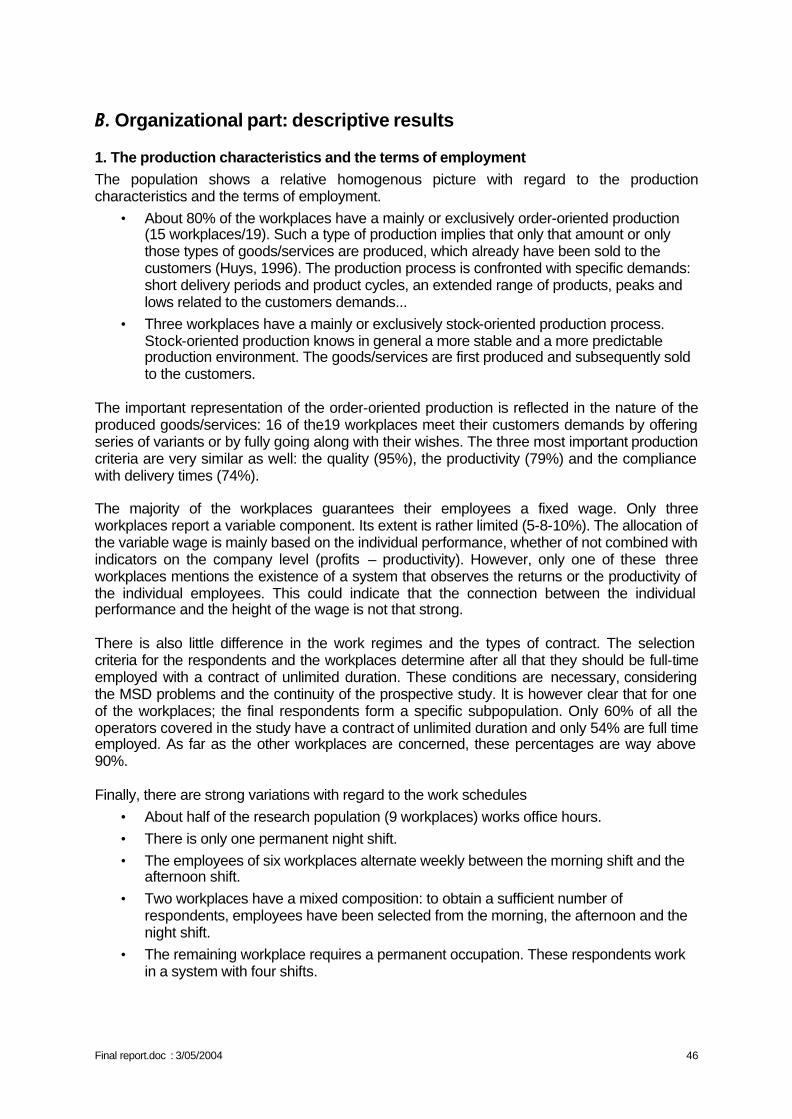
Final report.doc : 3/05/2004 46
B. Organizational part: descriptive results
1. The production characteristics and the terms of employment The population shows a relative homogenous picture with regard to the production characteristics and the terms of employment.
• About 80% of the workplaces have a mainly or exclusively order-oriented production (15 workplaces/19). Such a type of production implies that only that amount or only those types of goods/services are produced, which already have been sold to the customers (Huys, 1996). The production process is confronted with specific demands: short delivery periods and product cycles, an extended range of products, peaks and lows related to the customers demands...
• Three workplaces have a mainly or exclusively stock-oriented production process. Stock-oriented production knows in general a more stable and a more predictable production environment. The goods/services are first produced and subsequently sold to the customers.
The important representation of the order-oriented production is reflected in the nature of the produced goods/services: 16 of the19 workplaces meet their customers demands by offering series of variants or by fully going along with their wishes. The three most important production criteria are very similar as well: the quality (95%), the productivity (79%) and the compliance with delivery times (74%). The majority of the workplaces guarantees their employees a fixed wage. Only three workplaces report a variable component. Its extent is rather limited (5-8-10%). The allocation of the variable wage is mainly based on the individual performance, whether of not combined with indicators on the company level (profits – productivity). However, only one of these three workplaces mentions the existence of a system that observes the returns or the productivity of the individual employees. This could indicate that the connection between the individual performance and the height of the wage is not that strong. There is also little difference in the work regimes and the types of contract. The selection criteria for the respondents and the workplaces determine after all that they should be full-time employed with a contract of unlimited duration. These conditions are necessary, considering the MSD problems and the continuity of the prospective study. It is however clear that for one of the workplaces; the final respondents form a specific subpopulation. Only 60% of all the operators covered in the study have a contract of unlimited duration and only 54% are full time employed. As far as the other workplaces are concerned, these percentages are way above 90%. Finally, there are strong variations with regard to the work schedules
• About half of the research population (9 workplaces) works office hours. • There is only one permanent night shift. • The employees of six workplaces alternate weekly between the morning shift and the
afternoon shift. • Two workplaces have a mixed composition: to obtain a sufficient number of
respondents, employees have been selected from the morning, the afternoon and the night shift.
• The remaining workplace requires a permanent occupation. These respondents work in a system with four shifts.
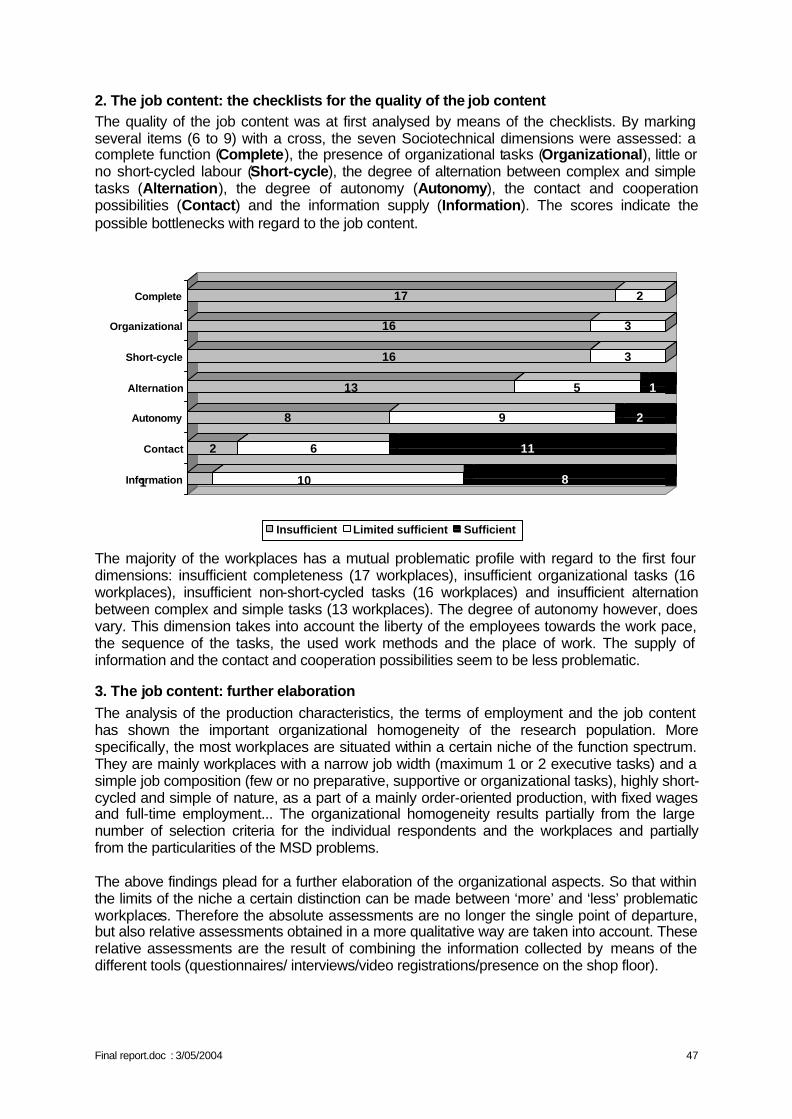
Final report.doc : 3/05/2004 47
2. The job content: the checklists for the quality of the job content The quality of the job content was at first analysed by means of the checklists. By marking several items (6 to 9) with a cross, the seven Sociotechnical dimensions were assessed: a complete function (Complete), the presence of organizational tasks (Organizational), little or no short-cycled labour (Short-cycle), the degree of alternation between complex and simple tasks (Alternation), the degree of autonomy (Autonomy), the contact and cooperation possibilities (Contact) and the information supply (Information). The scores indicate the possible bottlenecks with regard to the job content.
1 10 8
2 6 11
8 9 2
13 5 1
16 3
16 3
17 2
Information
Contact
Autonomy
Alternation
Short-cycle
Organizational
Complete
Insufficient Limited sufficient Sufficient
The majority of the workplaces has a mutual problematic profile with regard to the first four dimensions: insufficient completeness (17 workplaces), insufficient organizational tasks (16 workplaces), insufficient non-short-cycled tasks (16 workplaces) and insufficient alternation between complex and simple tasks (13 workplaces). The degree of autonomy however, does vary. This dimension takes into account the liberty of the employees towards the work pace, the sequence of the tasks, the used work methods and the place of work. The supply of information and the contact and cooperation possibilities seem to be less problematic.
3. The job content: further elaboration The analysis of the production characteristics, the terms of employment and the job content has shown the important organizational homogeneity of the research population. More specifically, the most workplaces are situated within a certain niche of the function spectrum. They are mainly workplaces with a narrow job width (maximum 1 or 2 executive tasks) and a simple job composition (few or no preparative, supportive or organizational tasks), highly short-cycled and simple of nature, as a part of a mainly order-oriented production, with fixed wages and full-time employment... The organizational homogeneity results partially from the large number of selection criteria for the individual respondents and the workplaces and partially from the particularities of the MSD problems. The above findings plead for a further elaboration of the organizational aspects. So that within the limits of the niche a certain distinction can be made between ‘more’ and ‘less’ problematic workplaces. Therefore the absolute assessments are no longer the single point of departure, but also relative assessments obtained in a more qualitative way are taken into account. These relative assessments are the result of combining the information collected by means of the different tools (questionnaires/ interviews/video registrations/presence on the shop floor).
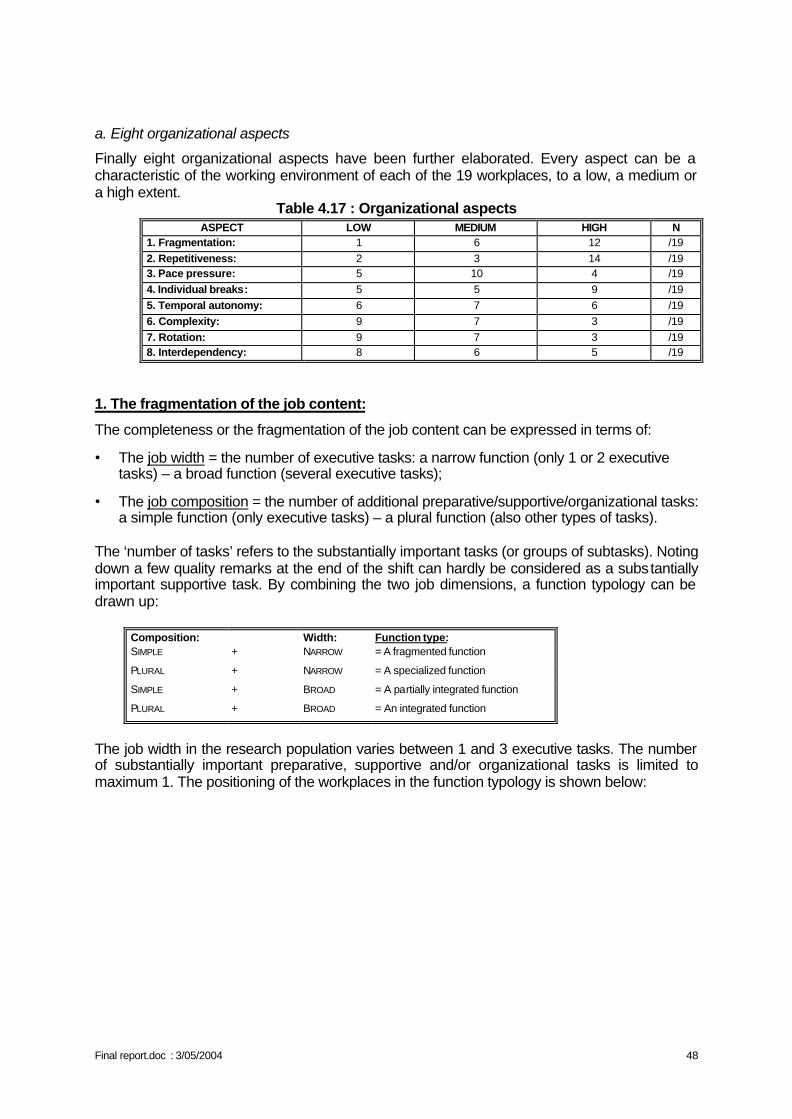
Final report.doc : 3/05/2004 48
a. Eight organizational aspects
Finally eight organizational aspects have been further elaborated. Every aspect can be a characteristic of the working environment of each of the 19 workplaces, to a low, a medium or a high extent.
Table 4.17 : Organizational aspects ASPECT LOW MEDIUM HIGH N
1. Fragmentation: 1 6 12 /19 2. Repetitiveness: 2 3 14 /19 3. Pace pressure: 5 10 4 /19 4. Individual breaks: 5 5 9 /19 5. Temporal autonomy: 6 7 6 /19 6. Complexity: 9 7 3 /19 7. Rotation: 9 7 3 /19 8. Interdependency: 8 6 5 /19
1. The fragmentation of the job content:
The completeness or the fragmentation of the job content can be expressed in terms of:
• The job width = the number of executive tasks: a narrow function (only 1 or 2 executive tasks) – a broad function (several executive tasks);
• The job composition = the number of additional preparative/supportive/organizational tasks: a simple function (only executive tasks) – a plural function (also other types of tasks).
The ‘number of tasks’ refers to the substantially important tasks (or groups of subtasks). Noting down a few quality remarks at the end of the shift can hardly be considered as a substantially important supportive task. By combining the two job dimensions, a function typology can be drawn up:
Composition: Width: Function type: SIMPLE + NARROW = A fragmented function
PLURAL + NARROW = A specialized function
SIMPLE + BROAD = A partially integrated function
PLURAL + BROAD = An integrated function
The job width in the research population varies between 1 and 3 executive tasks. The number of substantially important preparative, supportive and/or organizational tasks is limited to maximum 1. The positioning of the workplaces in the function typology is shown below:
Final report.doc : 3/05/2004 49
Table 4.18 : Positioning of the workplaces in the function typology
Job composition FUNCTION TYPOLOGIE
g i
Simple 0
Plural 1
NARROW
1
Fragmented function . . .
(1,0)
. . . Specialized function (1,1)
2
(2,0)
(2,1)
JOB
WID
TH
3
BROAD
Partially integrated function . . .
(3,1)
. . . Integrated function
The majority of the workplaces has a high degree of fragmentation (1,0 – 1,1). Besides the single executive task, there are few or no other types of tasks. The remaining workplaces have two or more executive tasks, but in general the number of other types of tasks stays limited. [FRAGMENTATION: 1 WORKPLACE ‘LOW’ / 6 WORKPLACES ‘MEDIUM’ / 12 WORKPLACES ‘HIGH’]. 2. The repetitivity of the tasks:
84% of the workplaces scores as ‘insufficient’ concerning few or no short-cycled tasks (=50% of the executive tasks has a cycle of less than 90 seconds). The remaining 16% receives a ‘limited sufficient’. Once again the organizational homogeneity becomes clear. The further differentiating between ‘more’ and ‘less’ problematic workplaces concerning the short-cycled tasks or the repetitivity, takes into account: the assessments made by the production manager, the percentages of the checklists, the degree of fragmentation and the analysis of the video registrations (an actions cycle which repeats itself after a few seconds, after tens of seconds...). [REPETITIVITY: 2 WORKPLACES ‘LOW’ / 3 WORKPLACES ‘MEDIUM’ / 14 WORKPLACES ‘HIGH’]. 3. The temporal autonomy, the pace pressure and the liberty to insert individual breaks:
The ‘autonomy’ dimension in the checklists for the quality of the job content relates to four different elements: the work pace, the sequence of the tasks, the work methods and the workplace. To obtain a more accurate image of the cases and their mutual diversity, the various forms of autonomy have been analysed separately. Facts taken into account: the corresponding items in the checklists, the assessments of the production manager and the qualitative analysis of the cases.
Autonomy Low Medium High Work sequence: 12/19 6/19 1/19 Work method: 14/19 5/19 / Work place: 19/19 / /
Just as the above-mentioned forms of autonomy, the ‘temporal autonomy’ is a compounded variable. Additionally two of its constituents have been further elaborated, to be able to include them separately in the analysis:
ú Mail sorting ú Train traffic observance ú Waste sorting ú Plastic tray packaging
ú Electronic board assembly ú Shoppers ú Technical drawing ú Cashiers ú Iron workers ú Plastic component packaging ú Switch assembly ú Transmission assembly
ú Bodywork riveting ú Punching machine adjustment
ú Stock managers cosmetics ú Ceramic filter packaging ú Coach repair ú Frozen vegetables flow
ú Extruders
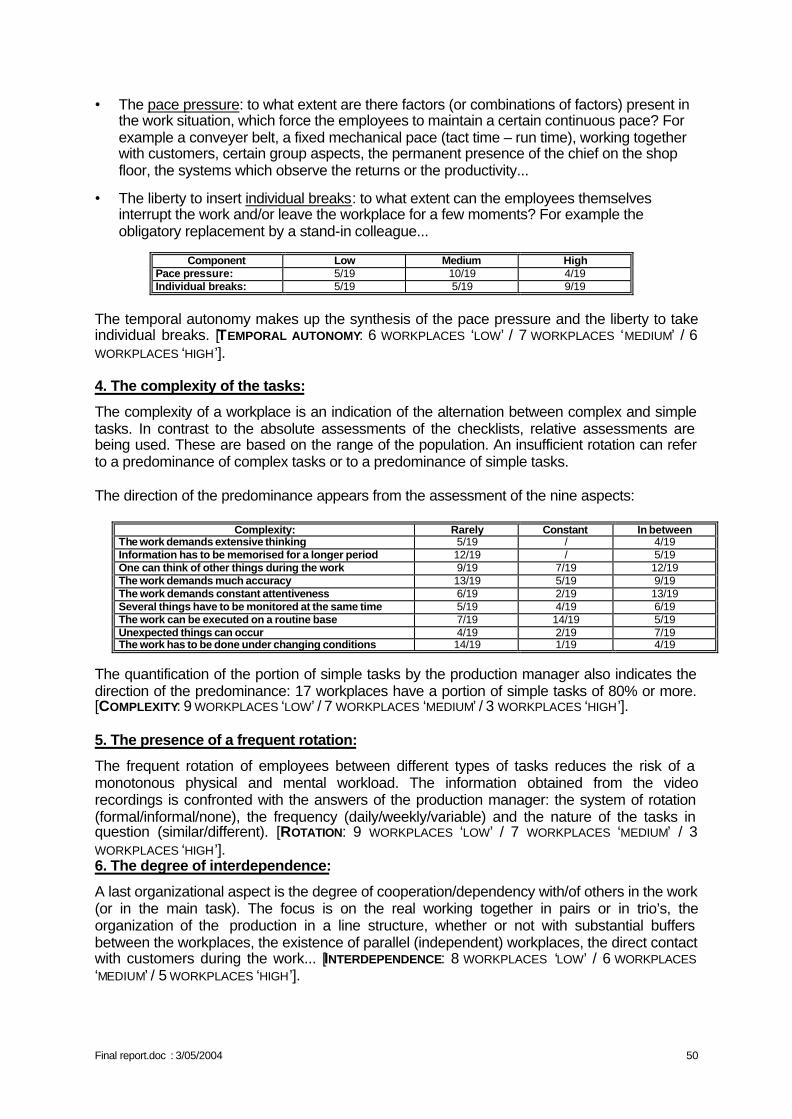
Final report.doc : 3/05/2004 50
• The pace pressure: to what extent are there factors (or combinations of factors) present in the work situation, which force the employees to maintain a certain continuous pace? For example a conveyer belt, a fixed mechanical pace (tact time – run time), working together with customers, certain group aspects, the permanent presence of the chief on the shop floor, the systems which observe the returns or the productivity...
• The liberty to insert individual breaks: to what extent can the employees themselves interrupt the work and/or leave the workplace for a few moments? For example the obligatory replacement by a stand-in colleague...
Component Low Medium High
Pace pressure: 5/19 10/19 4/19 Individual breaks: 5/19 5/19 9/19
The temporal autonomy makes up the synthesis of the pace pressure and the liberty to take individual breaks. [TEMPORAL AUTONOMY: 6 WORKPLACES ‘LOW’ / 7 WORKPLACES ‘MEDIUM’ / 6 WORKPLACES ‘HIGH’]. 4. The complexity of the tasks:
The complexity of a workplace is an indication of the alternation between complex and simple tasks. In contrast to the absolute assessments of the checklists, relative assessments are being used. These are based on the range of the population. An insufficient rotation can refer to a predominance of complex tasks or to a predominance of simple tasks. The direction of the predominance appears from the assessment of the nine aspects:
Complexity: Rarely Constant In between The work demands extensive thinking 5/19 / 4/19 Information has to be memorised for a longer period 12/19 / 5/19 One can think of other things during the work 9/19 7/19 12/19 The work demands much accuracy 13/19 5/19 9/19 The work demands constant attentiveness 6/19 2/19 13/19 Several things have to be monitored at the same time 5/19 4/19 6/19 The work can be executed on a routine base 7/19 14/19 5/19 Unexpected things can occur 4/19 2/19 7/19 The work has to be done under changing conditions 14/19 1/19 4/19
The quantification of the portion of simple tasks by the production manager also indicates the direction of the predominance: 17 workplaces have a portion of simple tasks of 80% or more. [COMPLEXITY: 9 WORKPLACES ‘LOW’ / 7 WORKPLACES ‘MEDIUM’ / 3 WORKPLACES ‘HIGH’]. 5. The presence of a frequent rotation:
The frequent rotation of employees between different types of tasks reduces the risk of a monotonous physical and mental workload. The information obtained from the video recordings is confronted with the answers of the production manager: the system of rotation (formal/informal/none), the frequency (daily/weekly/variable) and the nature of the tasks in question (similar/different). [ROTATION: 9 WORKPLACES ‘LOW’ / 7 WORKPLACES ‘MEDIUM’ / 3 WORKPLACES ‘HIGH’]. 6. The degree of interdependence:
A last organizational aspect is the degree of cooperation/dependency with/of others in the work (or in the main task). The focus is on the real working together in pairs or in trio’s, the organization of the production in a line structure, whether or not with substantial buffers between the workplaces, the existence of parallel (independent) workplaces, the direct contact with customers during the work... [INTERDEPENDENCE: 8 WORKPLACES ‘LOW’ / 6 WORKPLACES ‘MEDIUM’ / 5 WORKPLACES ‘HIGH’].
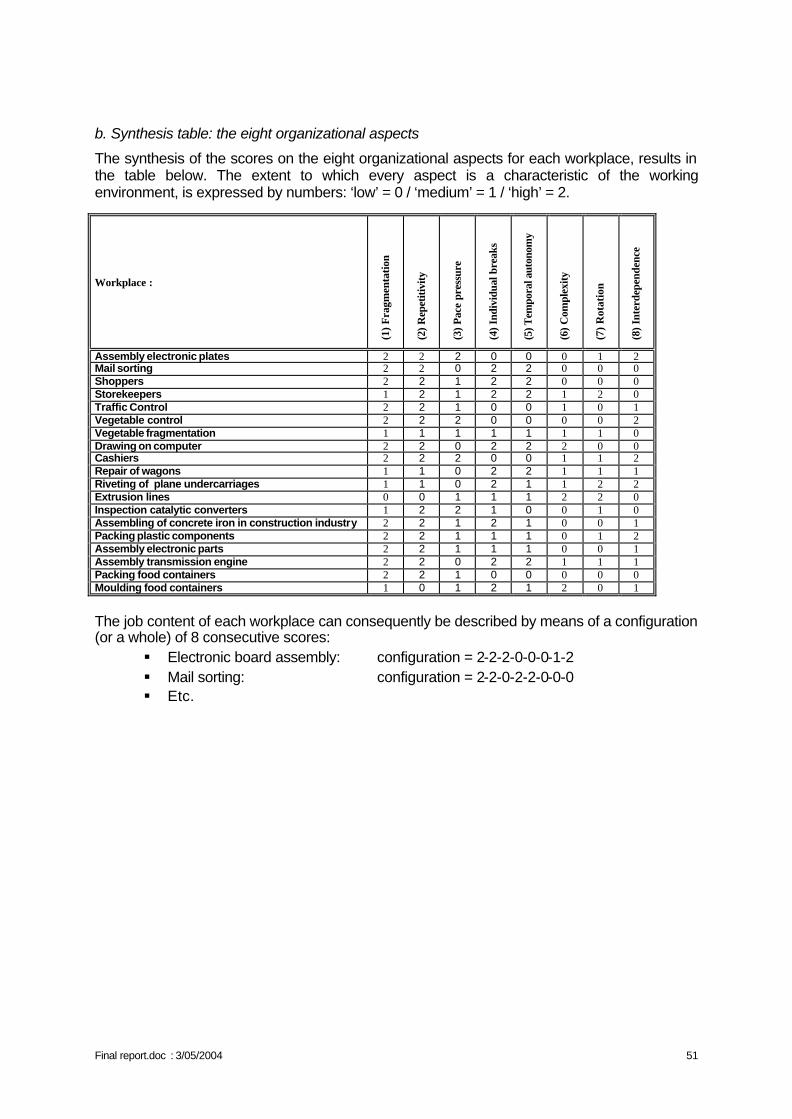
Final report.doc : 3/05/2004 51
b. Synthesis table: the eight organizational aspects
The synthesis of the scores on the eight organizational aspects for each workplace, results in the table below. The extent to which every aspect is a characteristic of the working environment, is expressed by numbers: ‘low’ = 0 / ‘medium’ = 1 / ‘high’ = 2.
Workplace :
(1) F
ragm
enta
tion
(2) R
epet
itivi
ty
(3) P
ace
pres
sure
(4) I
ndiv
idua
l bre
aks
(5) T
empo
ral a
uton
omy
(6) C
ompl
exity
(7) R
otat
ion
(8) I
nter
depe
nden
ce
Assembly electronic plates 2 2 2 0 0 0 1 2 Mail sorting 2 2 0 2 2 0 0 0 Shoppers 2 2 1 2 2 0 0 0 Storekeepers 1 2 1 2 2 1 2 0 Traffic Control 2 2 1 0 0 1 0 1 Vegetable control 2 2 2 0 0 0 0 2 Vegetable fragmentation 1 1 1 1 1 1 1 0 Drawing on computer 2 2 0 2 2 2 0 0 Cashiers 2 2 2 0 0 1 1 2 Repair of wagons 1 1 0 2 2 1 1 1 Riveting of plane undercarriages 1 1 0 2 1 1 2 2 Extrusion lines 0 0 1 1 1 2 2 0 Inspection catalytic converters 1 2 2 1 0 0 1 0 Assembling of concrete iron in construction industry 2 2 1 2 1 0 0 1 Packing plastic components 2 2 1 1 1 0 1 2 Assembly electronic parts 2 2 1 1 1 0 0 1 Assembly transmission engine 2 2 0 2 2 1 1 1 Packing food containers 2 2 1 0 0 0 0 0 Moulding food containers 1 0 1 2 1 2 0 1
The job content of each workplace can consequently be described by means of a configuration (or a whole) of 8 consecutive scores:
§ Electronic board assembly: configuration = 2-2-2-0-0-0-1-2 § Mail sorting: configuration = 2-2-0-2-2-0-0-0 § Etc.
Final report.doc : 3/05/2004 52
CHAPTER V: RESULTS OF THE MULTIVARIATE ANALYSES
I. SIMPLE STATISTICAL ANALYSES
A. Choice of variables, simple linear regressions, Chi2 and t-tests. Preliminary studies were necessary to prepare the multivariate analyses since:
• The number of variables is very high, • Some are strongly correlated (seniorities in the company, at the workplace and age,
weight and height, gender and hormonal diseases …), • Some are derived one from the other or are a subset (the urgency score which is the
sum of 11 of the 14 questions of the Bortner score …), • Some can not be kept, as they are not sufficiently distributed (repetition: almost
everyone indeed judged the work very repetitive). Two workplaces were also dropped from the final analysis because the type of work differed too strongly from the others. They are the two stations in the tertiary sector where computer work represents the principal component. These two workplaces were also extremely different from the others regarding other parameters of organization, work schedule or training, constituting a very considerable "workplace" effect. Tables 5.1 to 5.7 give the statistical significance of associations between pairs of variables, calculated
• using a student test when comparing a discrete variable with a continuous variable, • using a chi 2 test in the case of 2 discrete variables, • using a simple linear correlation in the case of 2 continuous variables.
The tables report only the variables significantly associated at the threshold level of p = 0.01 The greatest number of associations was found for the individual variables of group A. Age is associated with seniorities and the functional tests. Gender in correlated with the force, the weight and height and with some functional tests....
Some associations (p<0.01) are noted in the B1 group mainly between the opinions about the lifting efforts, the efforts of the wrists, the repetition and the work physically tiring.
Many very significant associations are to be noted for the variables of the B2 group, mainly between the parameters characterizing the hand grasp and between repetition and the other factors.
Many associations exist also between variables of the B3 group. The scores of Karasek are obviously very related to the scores from the factorial analysis, and the five scores of appreciation with the score of overall assessment (their sum).
Similarly, for the B4 group of variables, the scores of competitiveness and urgency are strongly associated to the score of Bortner. The conscientious character (NEOFFI) is correlated to the other personality characteristics.
Final report.doc : 3/05/2004 53
B. Variables kept by group of variables
Following these analyses, the variables kept for the multivariate analysis are:
• Group A: chronic diseases; age; health status; smoking habits; sports activities, sports activities implying the arm; as well as the time necessary to fill the first 2 lines during the O' Connor test and the number of holes correctly filled.
• B1 Group: efforts with the wrists, work considered to be physically tiring and mentally tiring.
• B2b Group: quantitative results from the video analysis: percentage of time passed in extension, in flexion, in ulnar deviation, radial deviation, digital grasp, in power grasp, variability in flexion-extension and in deviation and finally the level of efforts.
• B3a Group: the 13 scores of functional style, instrumental style, somatic complaints, overtime, break, the influence over work, the fact of being stressed and the dimension from Karasek (physical efforts, decision latitude, psychological demands, the relation with the superiors and the colleagues, the job security).
• B3b Group: the same variables as above with the Karasek dimensions replaced by the dimensions arising of the factorial analysis: freedom of decision, demands in term of quantity of work, development, support of the superiors, support of the colleagues, satisfaction in term of contents of work, satisfaction in term of quantity of work, satisfaction in term of freedom of decision, satisfaction in term of social support.
• B4 Group: the scores of the type A (characterized by the scores of competitiveness and emergency), neuroticism, extraversion, altruism, conscientious character and the result of the Bonnardel test.
Tables 5.6 and 5.7 show the relations between variables of the various groups. Only the variables which were significantly associated at the threshold of 15% to the MSD in the initial models were used in subsequent models. The results are respectively presented for the dominant wrist and for the neck.
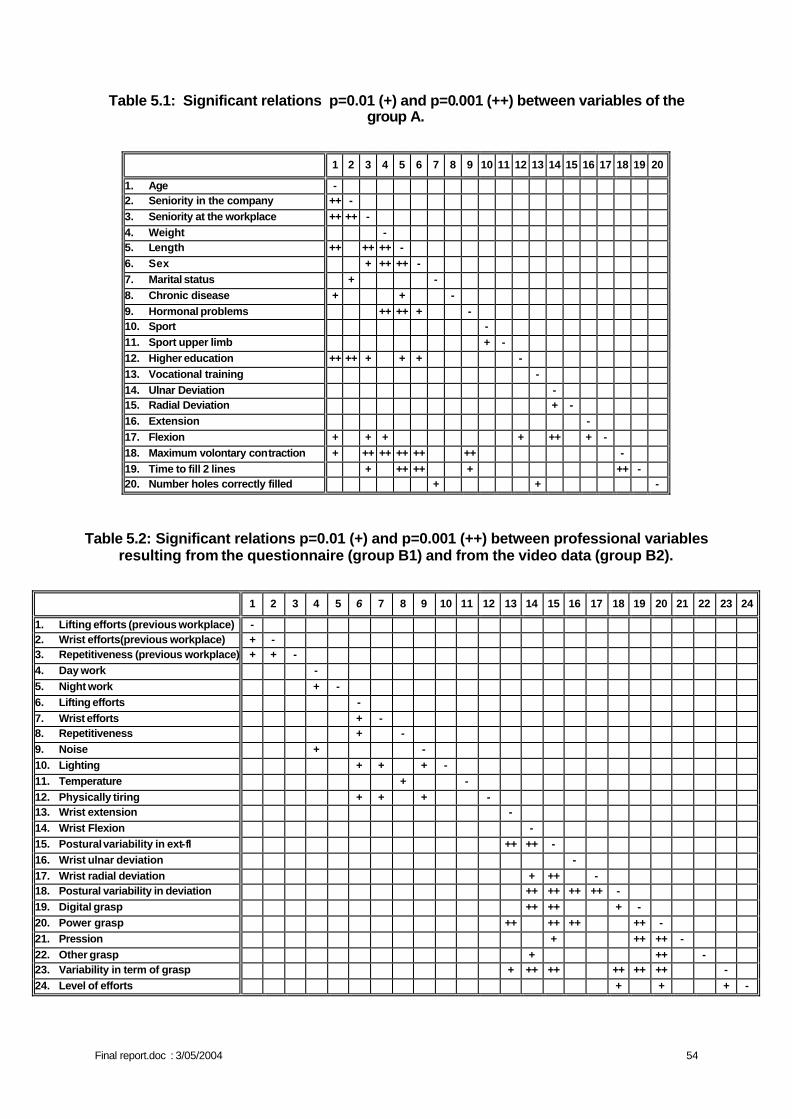
Final report.doc : 3/05/2004 54
Table 5.1: Significant relations p=0.01 (+) and p=0.001 (++) between variables of the group A.
1 2 3 4 5 6 7 8 9 10 11 12 13 14 15 16 17 18 19 20
1. Age - 2. Seniority in the company ++ - 3. Seniority at the workplace ++ ++ - 4. Weight - 5. Length ++ ++ ++ - 6. Sex + ++ ++ - 7. Marital status + - 8. Chronic disease + + - 9. Hormonal problems ++ ++ + - 10. Sport - 11. Sport upper limb + - 12. Higher education ++ ++ + + + - 13. Vocational training - 14. Ulnar Deviation - 15. Radial Deviation + - 16. Extension - 17. Flexion + + + + ++ + - 18. Maximum volontary contraction + ++ ++ ++ ++ ++ - 19. Time to fill 2 lines + ++ ++ + ++ - 20. Number holes correctly filled + + -
Table 5.2: Significant relations p=0.01 (+) and p=0.001 (++) between professional variables resulting from the questionnaire (group B1) and from the video data (group B2).
1 2 3 4 5 6 7 8 9 10 11 12 13 14 15 16 17 18 19 20 21 22 23 24
1. Lifting efforts (previous workplace) - 2. Wrist efforts(previous workplace) + - 3. Repetitiveness (previous workplace) + + - 4. Day work - 5. Night work + - 6. Lifting efforts - 7. Wrist efforts + - 8. Repetitiveness + - 9. Noise + - 10. Lighting + + + - 11. Temperature + - 12. Physically tiring + + + - 13. Wrist extension - 14. Wrist Flexion - 15. Postural variability in ext-fl ++ ++ - 16. Wrist ulnar deviation - 17. Wrist radial deviation + ++ - 18. Postural variability in deviation ++ ++ ++ ++ - 19. Digital grasp ++ ++ + - 20. Power grasp ++ ++ ++ ++ - 21. Pression + ++ ++ - 22. Other grasp + ++ - 23. Variability in term of grasp + ++ ++ ++ ++ ++ - 24. Level of efforts + + + -
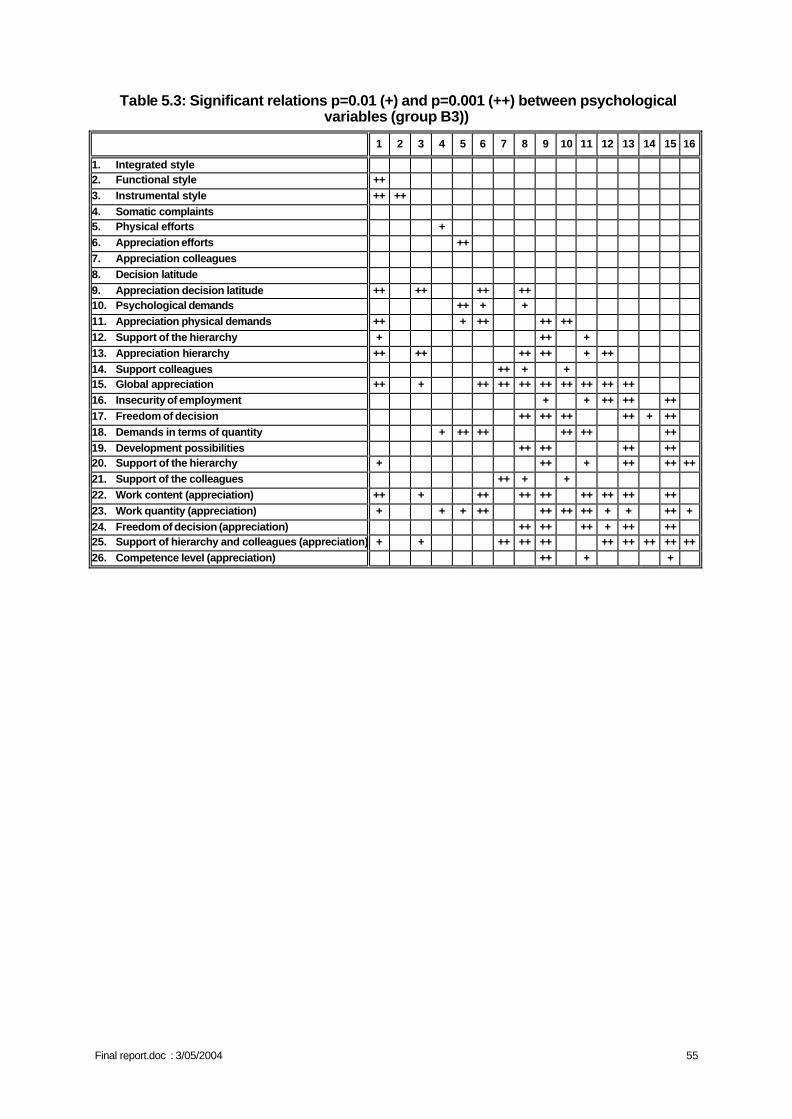
Final report.doc : 3/05/2004 55
Table 5.3: Significant relations p=0.01 (+) and p=0.001 (++) between psychological variables (group B3))
1 2 3 4 5 6 7 8 9 10 11 12 13 14 15 16
1. Integrated style 2. Functional style ++ 3. Instrumental style ++ ++ 4. Somatic complaints 5. Physical efforts + 6. Appreciation efforts ++ 7. Appreciation colleagues 8. Decision latitude 9. Appreciation decision latitude ++ ++ ++ ++ 10. Psychological demands ++ + + 11. Appreciation physical demands ++ + ++ ++ ++ 12. Support of the hierarchy + ++ + 13. Appreciation hierarchy ++ ++ ++ ++ + ++ 14. Support colleagues ++ + + 15. Global appreciation ++ + ++ ++ ++ ++ ++ ++ ++ ++ 16. Insecurity of employment + + ++ ++ ++ 17. Freedom of decision ++ ++ ++ ++ + ++ 18. Demands in terms of quantity + ++ ++ ++ ++ ++ 19. Development possibilities ++ ++ ++ ++ 20. Support of the hierarchy + ++ + ++ ++ ++ 21. Support of the colleagues ++ + + 22. Work content (appreciation) ++ + ++ ++ ++ ++ ++ ++ ++ 23. Work quantity (appreciation) + + + ++ ++ ++ ++ + + ++ + 24. Freedom of decision (appreciation) ++ ++ ++ + ++ ++ 25. Support of hierarchy and colleagues (appreciation) + + ++ ++ ++ ++ ++ ++ ++ ++ 26. Competence level (appreciation) ++ + +
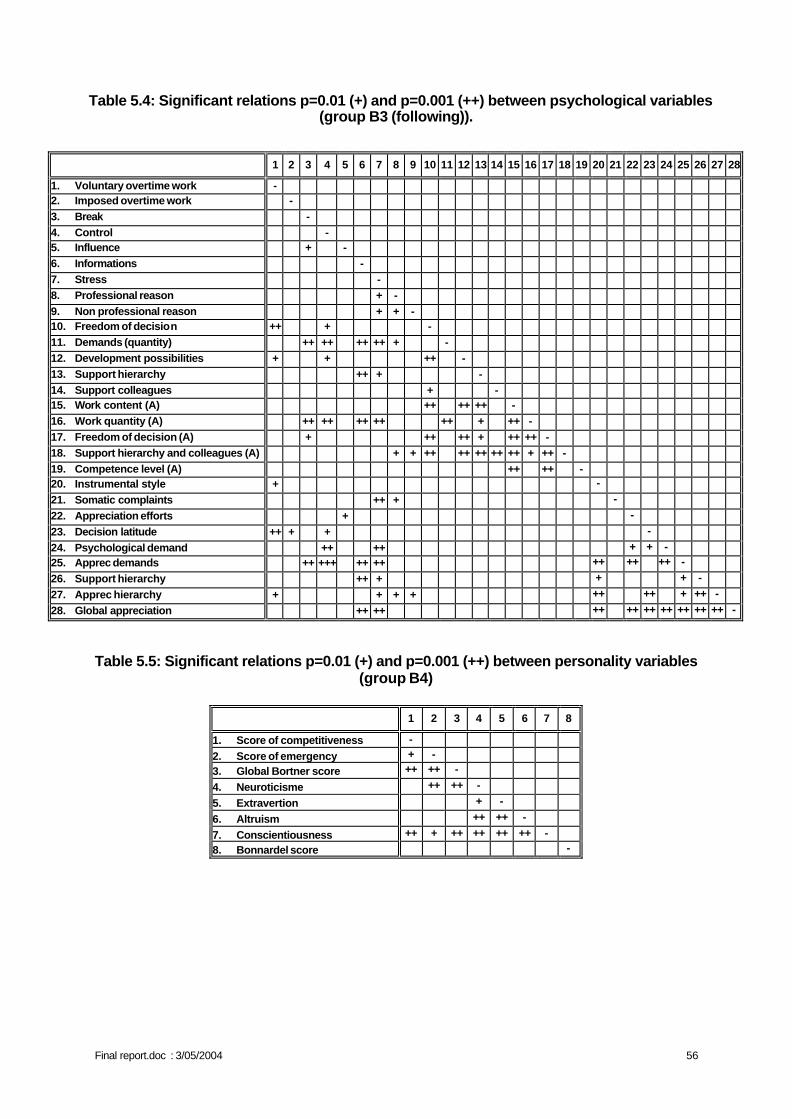
Final report.doc : 3/05/2004 56
Table 5.4: Significant relations p=0.01 (+) and p=0.001 (++) between psychological variables (group B3 (following)).
1 2 3 4 5 6 7 8 9 10 11 12 13 14 15 16 17 18 19 20 21 22 23 24 25 26 27 28
1. Voluntary overtime work - 2. Imposed overtime work -
3. Break -
4. Control - 5. Influence + -
6. Informations -
7. Stress -
8. Professional reason + -
9. Non professional reason + + - 10. Freedom of decision ++ + -
11. Demands (quantity) ++ ++ ++ ++ + -
12. Development possibilities + + ++ -
13. Support hierarchy ++ + -
14. Support colleagues + - 15. Work content (A) ++ ++ ++ -
16. Work quantity (A) ++ ++ ++ ++ ++ + ++ -
17. Freedom of decision (A) + ++ ++ + ++ ++ -
18. Support hierarchy and colleagues (A) + + ++ ++ ++ ++ ++ + ++ -
19. Competence level (A) ++ ++ - 20. Instrumental style + -
21. Somatic complaints ++ + -
22. Appreciation efforts + -
23. Decision latitude ++ + + -
24. Psychological demand ++ ++ + + - 25. Apprec demands ++ +++ ++ ++ ++ ++ ++ -
26. Support hierarchy ++ + + + -
27. Apprec hierarchy + + + + ++ ++ + ++ -
28. Global appreciation ++ ++ ++ ++ ++ ++ ++ ++ ++ -
Table 5.5: Significant relations p=0.01 (+) and p=0.001 (++) between personality variables (group B4)
1 2 3 4 5 6 7 8
1. Score of competitiveness -
2. Score of emergency + -
3. Global Bortner score ++ ++ -
4. Neuroticisme ++ ++ -
5. Extravertion + -
6. Altruism ++ ++ -
7. Conscientiousness ++ + ++ ++ ++ ++ -
8. Bonnardel score -
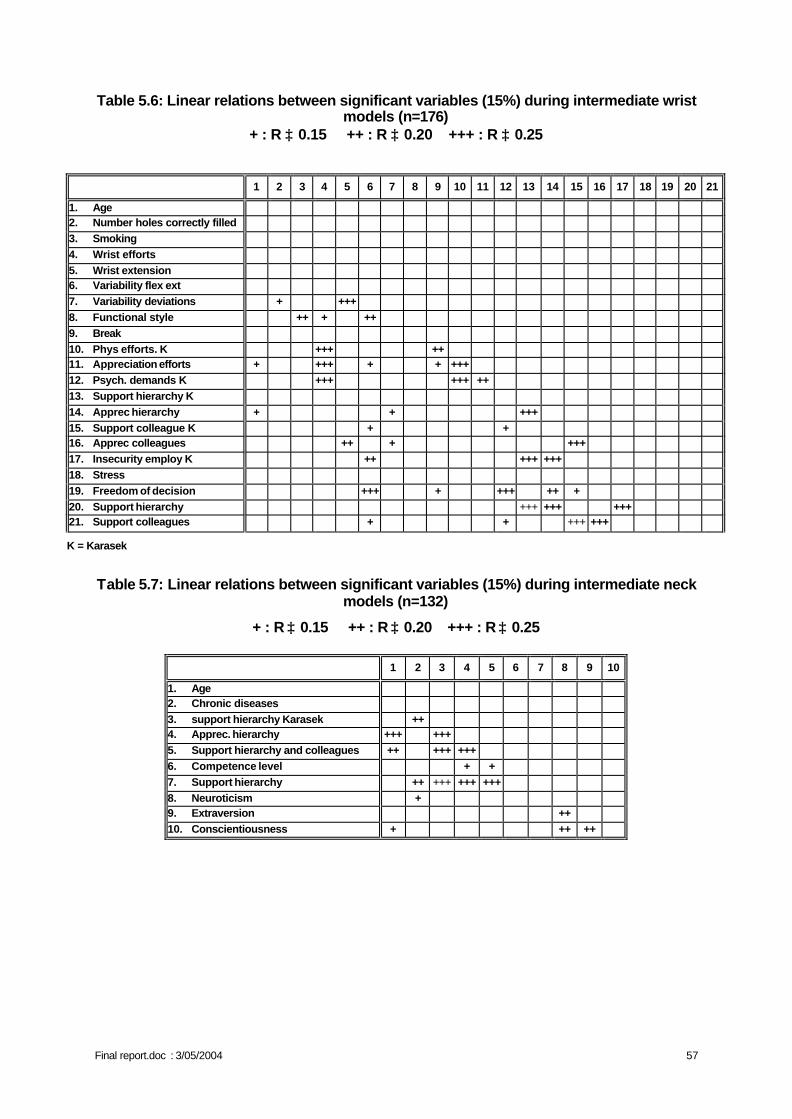
Final report.doc : 3/05/2004 57
Table 5.6: Linear relations between significant variables (15%) during intermediate wrist models (n=176)
+ : R ≥ 0.15 ++ : R ≥ 0.20 +++ : R ≥ 0.25
K = Karasek
Table 5.7: Linear relations between significant variables (15%) during intermediate neck models (n=132)
+ : R ≥ 0.15 ++ : R ≥ 0.20 +++ : R ≥ 0.25
1 2 3 4 5 6 7 8 9 10
1. Age 2. Chronic diseases 3. support hierarchy Karasek ++ 4. Apprec. hierarchy +++ +++ 5. Support hierarchy and colleagues ++ +++ +++ 6. Competence level + + 7. Support hierarchy ++ +++ +++ +++ 8. Neuroticism + 9. Extraversion ++ 10. Conscientiousness + ++ ++
1 2 3 4 5 6 7 8 9 10 11 12 13 14 15 16 17 18 19 20 21
1. Age 2. Number holes correctly filled 3. Smoking 4. Wrist efforts 5. Wrist extension 6. Variability flex ext 7. Variability deviations + +++ 8. Functional style ++ + ++ 9. Break 10. Phys efforts. K +++ ++ 11. Appreciation efforts + +++ + + +++ 12. Psych. demands K +++ +++ ++ 13. Support hierarchy K 14. Apprec hierarchy + + +++ 15. Support colleague K + + 16. Apprec colleagues ++ + +++ 17. Insecurity employ K ++ +++ +++ 18. Stress 19. Freedom of decision +++ + +++ ++ + 20. Support hierarchy +++ +++ +++ 21. Support colleagues + + +++ +++
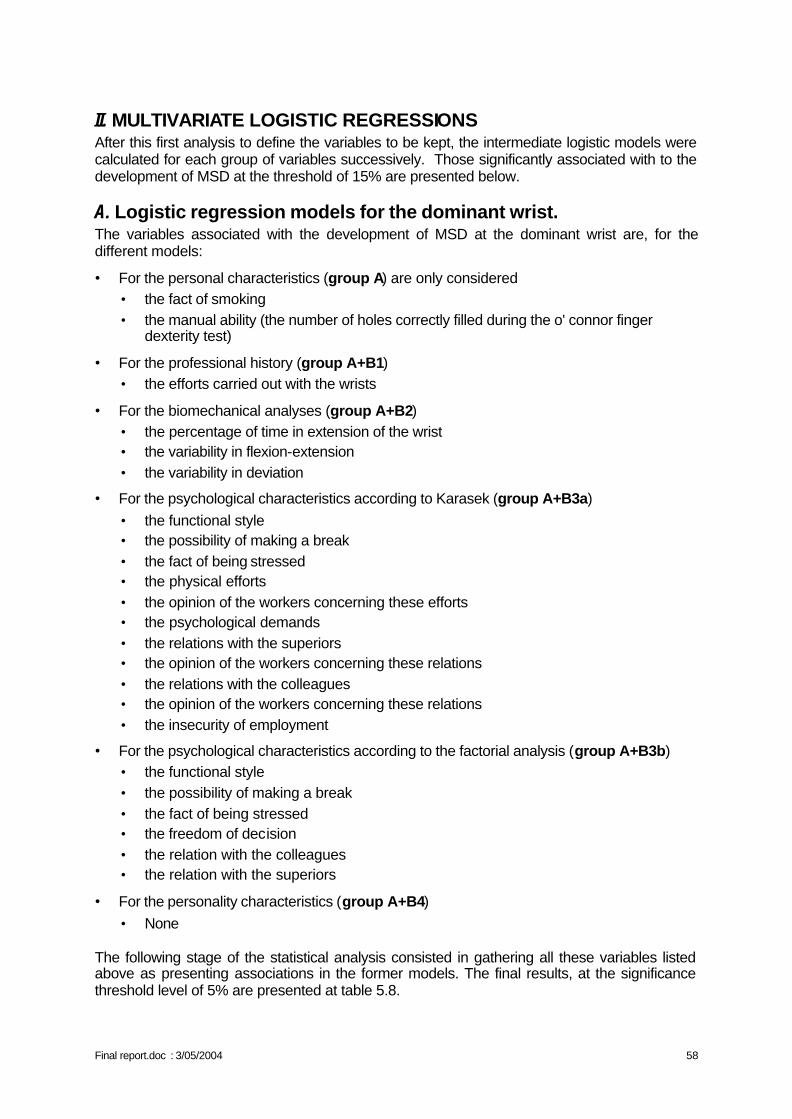
Final report.doc : 3/05/2004 58
II. MULTIVARIATE LOGISTIC REGRESSIONS After this first analysis to define the variables to be kept, the intermediate logistic models were calculated for each group of variables successively. Those significantly associated with to the development of MSD at the threshold of 15% are presented below.
A. Logistic regression models for the dominant wrist. The variables associated with the development of MSD at the dominant wrist are, for the different models:
• For the personal characteristics (group A) are only considered • the fact of smoking • the manual ability (the number of holes correctly filled during the o' connor finger
dexterity test)
• For the professional history (group A+B1) • the efforts carried out with the wrists
• For the biomechanical analyses (group A+B2) • the percentage of time in extension of the wrist • the variability in flexion-extension • the variability in deviation
• For the psychological characteristics according to Karasek (group A+B3a) • the functional style • the possibility of making a break • the fact of being stressed • the physical efforts • the opinion of the workers concerning these efforts • the psychological demands • the relations with the superiors • the opinion of the workers concerning these relations • the relations with the colleagues • the opinion of the workers concerning these relations • the insecurity of employment
• For the psychological characteristics according to the factorial analysis (group A+B3b) • the functional style • the possibility of making a break • the fact of being stressed • the freedom of decision • the relation with the colleagues • the relation with the superiors
• For the personality characteristics (group A+B4) • None
The following stage of the statistical analysis consisted in gathering all these variables listed above as presenting associations in the former models. The final results, at the significance threshold level of 5% are presented at table 5.8.
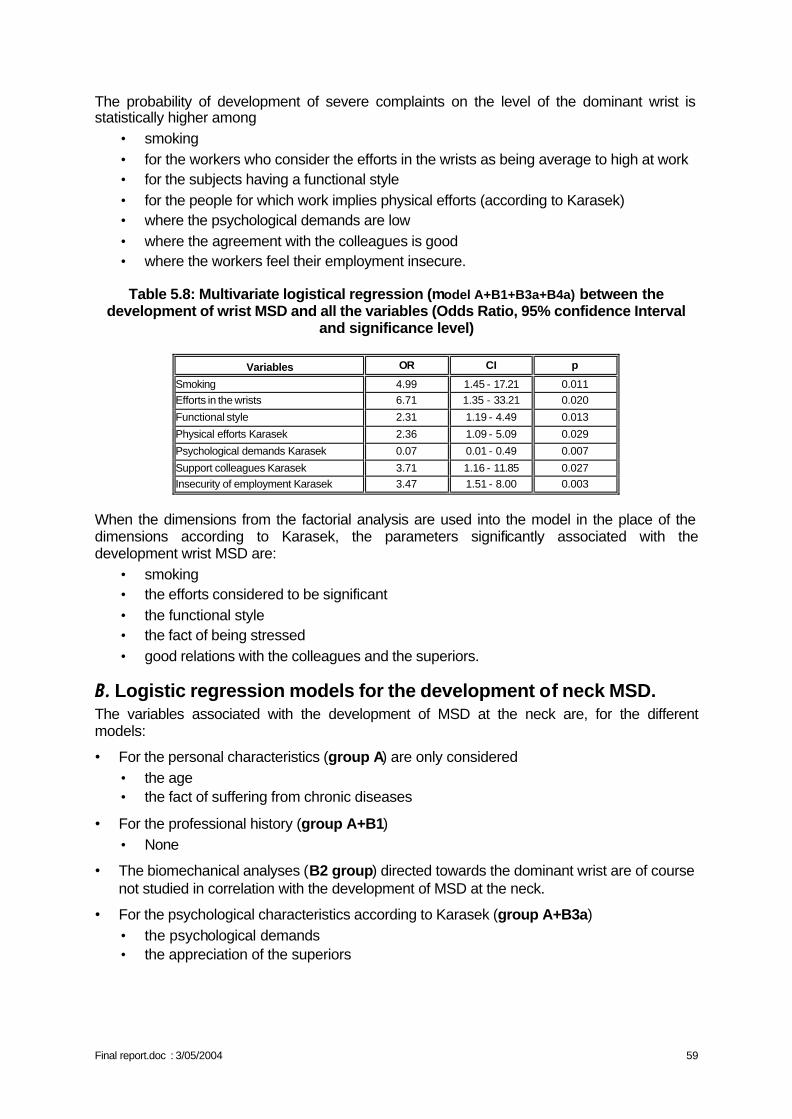
Final report.doc : 3/05/2004 59
The probability of development of severe complaints on the level of the dominant wrist is statistically higher among
• smoking • for the workers who consider the efforts in the wrists as being average to high at work • for the subjects having a functional style • for the people for which work implies physical efforts (according to Karasek) • where the psychological demands are low • where the agreement with the colleagues is good • where the workers feel their employment insecure.
Table 5.8: Multivariate logistical regression (model A+B1+B3a+B4a) between the
development of wrist MSD and all the variables (Odds Ratio, 95% confidence Interval and significance level)
Variables OR CI p
Smoking 4.99 1.45 - 17.21 0.011 Efforts in the wrists 6.71 1.35 - 33.21 0.020
Functional style 2.31 1.19 - 4.49 0.013
Physical efforts Karasek 2.36 1.09 - 5.09 0.029
Psychological demands Karasek 0.07 0.01 - 0.49 0.007
Support colleagues Karasek 3.71 1.16 - 11.85 0.027 Insecurity of employment Karasek 3.47 1.51 - 8.00 0.003
When the dimensions from the factorial analysis are used into the model in the place of the dimensions according to Karasek, the parameters significantly associated with the development wrist MSD are:
• smoking • the efforts considered to be significant • the functional style • the fact of being stressed • good relations with the colleagues and the superiors.
B. Logistic regression models for the development of neck MSD. The variables associated with the development of MSD at the neck are, for the different models:
• For the personal characteristics (group A) are only considered • the age • the fact of suffering from chronic diseases
• For the professional history (group A+B1) • None
• The biomechanical analyses (B2 group) directed towards the dominant wrist are of course not studied in correlation with the development of MSD at the neck.
• For the psychological characteristics according to Karasek (group A+B3a) • the psychological demands • the appreciation of the superiors
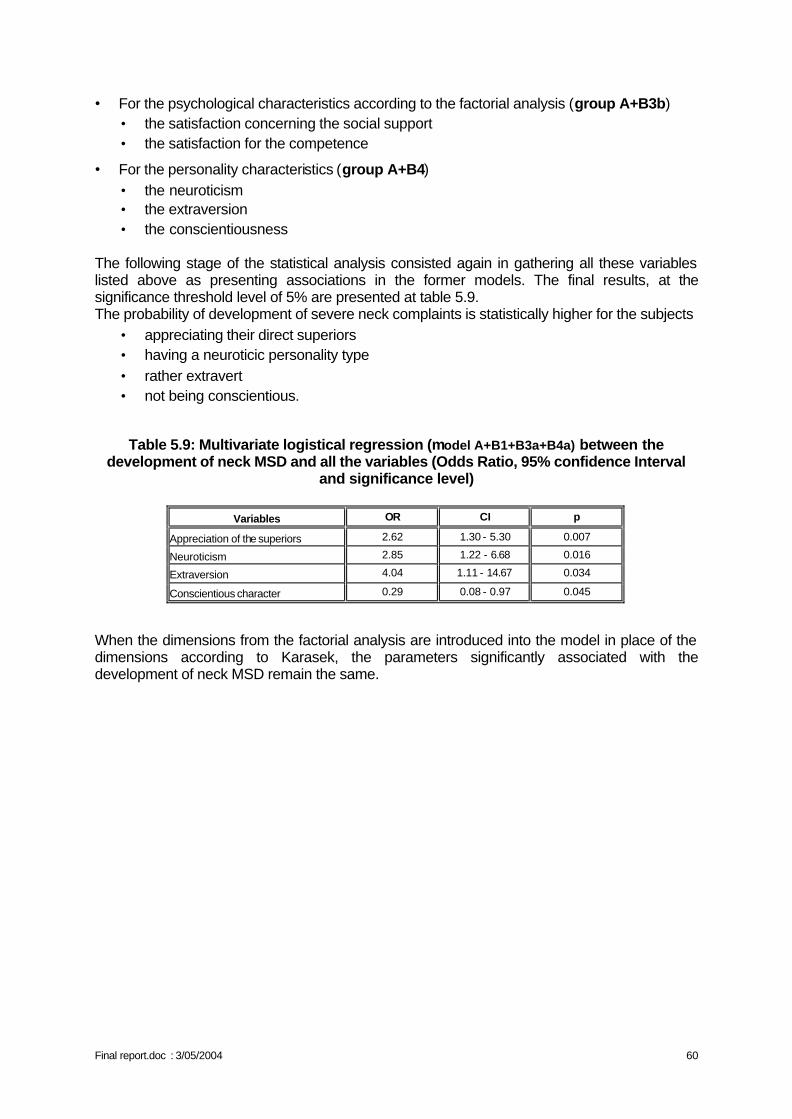
Final report.doc : 3/05/2004 60
• For the psychological characteristics according to the factorial analysis (group A+B3b) • the satisfaction concerning the social support • the satisfaction for the competence
• For the personality characteristics (group A+B4) • the neuroticism • the extraversion • the conscientiousness
The following stage of the statistical analysis consisted again in gathering all these variables listed above as presenting associations in the former models. The final results, at the significance threshold level of 5% are presented at table 5.9. The probability of development of severe neck complaints is statistically higher for the subjects
• appreciating their direct superiors • having a neuroticic personality type • rather extravert • not being conscientious.
Table 5.9: Multivariate logistical regression (model A+B1+B3a+B4a) between the development of neck MSD and all the variables (Odds Ratio, 95% confidence Interval
and significance level)
Variables OR CI p
Appreciation of the superiors 2.62 1.30 - 5.30 0.007
Neuroticism 2.85 1.22 - 6.68 0.016
Extraversion 4.04 1.11 - 14.67 0.034
Conscientious character 0.29 0.08 - 0.97 0.045
When the dimensions from the factorial analysis are introduced into the model in place of the dimensions according to Karasek, the parameters significantly associated with the development of neck MSD remain the same.
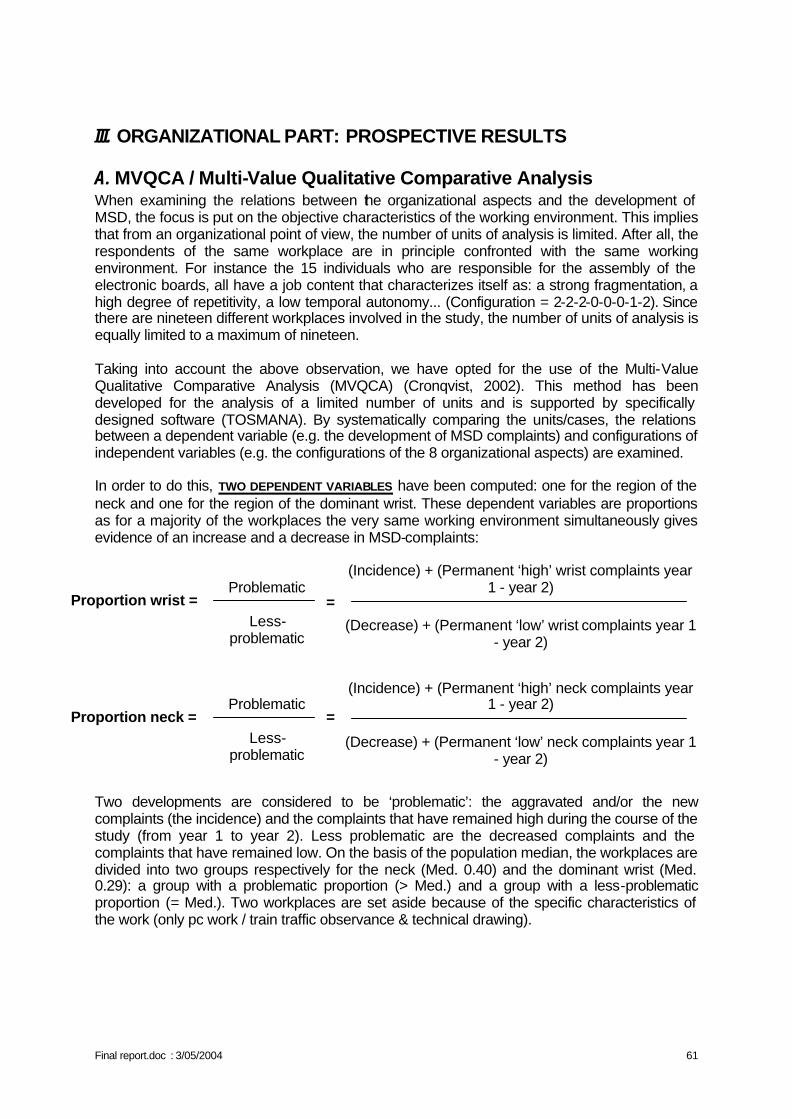
Final report.doc : 3/05/2004 61
III. ORGANIZATIONAL PART: PROSPECTIVE RESULTS
A. MVQCA / Multi-Value Qualitative Comparative Analysis When examining the relations between the organizational aspects and the development of MSD, the focus is put on the objective characteristics of the working environment. This implies that from an organizational point of view, the number of units of analysis is limited. After all, the respondents of the same workplace are in principle confronted with the same working environment. For instance the 15 individuals who are responsible for the assembly of the electronic boards, all have a job content that characterizes itself as: a strong fragmentation, a high degree of repetitivity, a low temporal autonomy... (Configuration = 2-2-2-0-0-0-1-2). Since there are nineteen different workplaces involved in the study, the number of units of analysis is equally limited to a maximum of nineteen. Taking into account the above observation, we have opted for the use of the Multi-Value Qualitative Comparative Analysis (MVQCA) (Cronqvist, 2002). This method has been developed for the analysis of a limited number of units and is supported by specifically designed software (TOSMANA). By systematically comparing the units/cases, the relations between a dependent variable (e.g. the development of MSD complaints) and configurations of independent variables (e.g. the configurations of the 8 organizational aspects) are examined. In order to do this, TWO DEPENDENT VARIABLES have been computed: one for the region of the neck and one for the region of the dominant wrist. These dependent variables are proportions as for a majority of the workplaces the very same working environment simultaneously gives evidence of an increase and a decrease in MSD-complaints:
Proportion wrist =
Problematic
Less-
problematic
=
(Incidence) + (Permanent ‘high’ wrist complaints year 1 - year 2)
(Decrease) + (Permanent ‘low’ wrist complaints year 1
- year 2)
Proportion neck =
Problematic
Less-
problematic
=
(Incidence) + (Permanent ‘high’ neck complaints year 1 - year 2)
(Decrease) + (Permanent ‘low’ neck complaints year 1
- year 2)
Two developments are considered to be ‘problematic’: the aggravated and/or the new complaints (the incidence) and the complaints that have remained high during the course of the study (from year 1 to year 2). Less problematic are the decreased complaints and the complaints that have remained low. On the basis of the population median, the workplaces are divided into two groups respectively for the neck (Med. 0.40) and the dominant wrist (Med. 0.29): a group with a problematic proportion (> Med.) and a group with a less-problematic proportion (= Med.). Two workplaces are set aside because of the specific characteristics of the work (only pc work / train traffic observance & technical drawing).
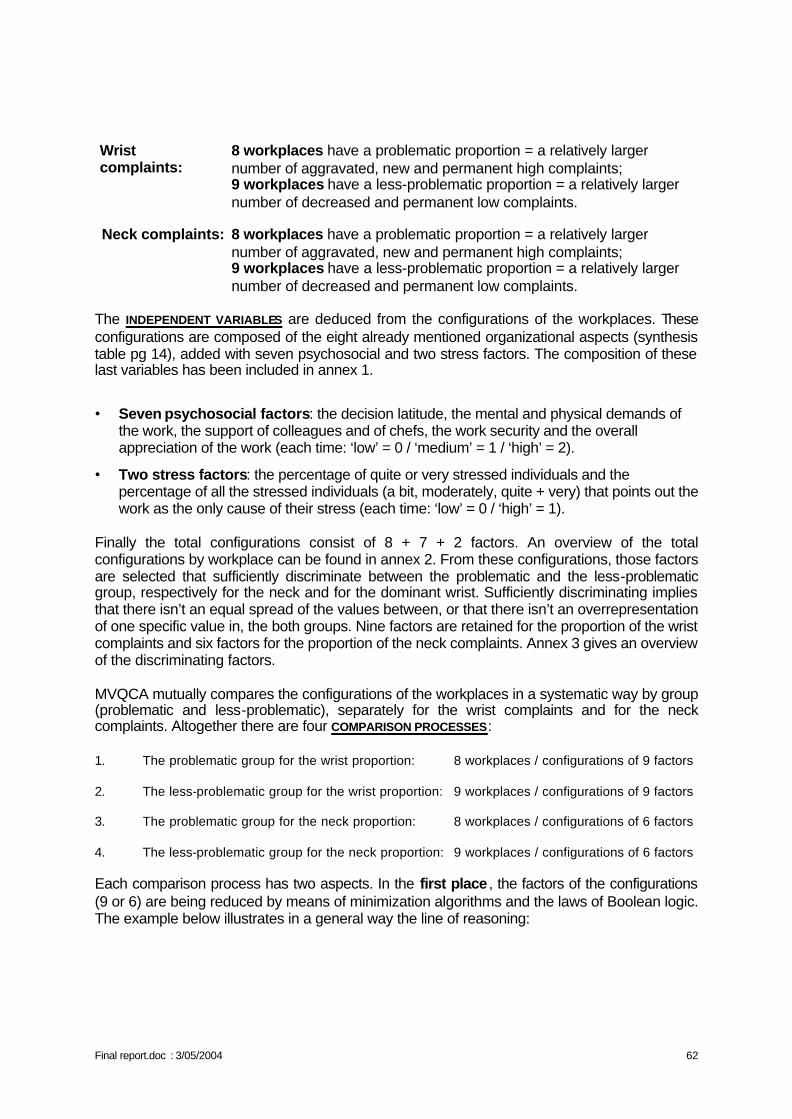
Final report.doc : 3/05/2004 62
Wrist complaints:
8 workplaces have a problematic proportion = a relatively larger number of aggravated, new and permanent high complaints; 9 workplaces have a less-problematic proportion = a relatively larger number of decreased and permanent low complaints.
Neck complaints:
8 workplaces have a problematic proportion = a relatively larger number of aggravated, new and permanent high complaints; 9 workplaces have a less-problematic proportion = a relatively larger number of decreased and permanent low complaints.
The INDEPENDENT VARIABLES are deduced from the configurations of the workplaces. These configurations are composed of the eight already mentioned organizational aspects (synthesis table pg 14), added with seven psychosocial and two stress factors. The composition of these last variables has been included in annex 1.
• Seven psychosocial factors: the decision latitude, the mental and physical demands of the work, the support of colleagues and of chefs, the work security and the overall appreciation of the work (each time: ‘low’ = 0 / ‘medium’ = 1 / ‘high’ = 2).
• Two stress factors: the percentage of quite or very stressed individuals and the percentage of all the stressed individuals (a bit, moderately, quite + very) that points out the work as the only cause of their stress (each time: ‘low’ = 0 / ‘high’ = 1).
Finally the total configurations consist of 8 + 7 + 2 factors. An overview of the total configurations by workplace can be found in annex 2. From these configurations, those factors are selected that sufficiently discriminate between the problematic and the less-problematic group, respectively for the neck and for the dominant wrist. Sufficiently discriminating implies that there isn’t an equal spread of the values between, or that there isn’t an overrepresentation of one specific value in, the both groups. Nine factors are retained for the proportion of the wrist complaints and six factors for the proportion of the neck complaints. Annex 3 gives an overview of the discriminating factors. MVQCA mutually compares the configurations of the workplaces in a systematic way by group (problematic and less-problematic), separately for the wrist complaints and for the neck complaints. Altogether there are four COMPARISON PROCESSES: 1. The problematic group for the wrist proportion: 8 workplaces / configurations of 9 factors 2. The less-problematic group for the wrist proportion: 9 workplaces / configurations of 9 factors 3. The problematic group for the neck proportion: 8 workplaces / configurations of 6 factors 4. The less-problematic group for the neck proportion: 9 workplaces / configurations of 6 factors Each comparison process has two aspects. In the first place , the factors of the configurations (9 or 6) are being reduced by means of minimization algorithms and the laws of Boolean logic. The example below illustrates in a general way the line of reasoning:
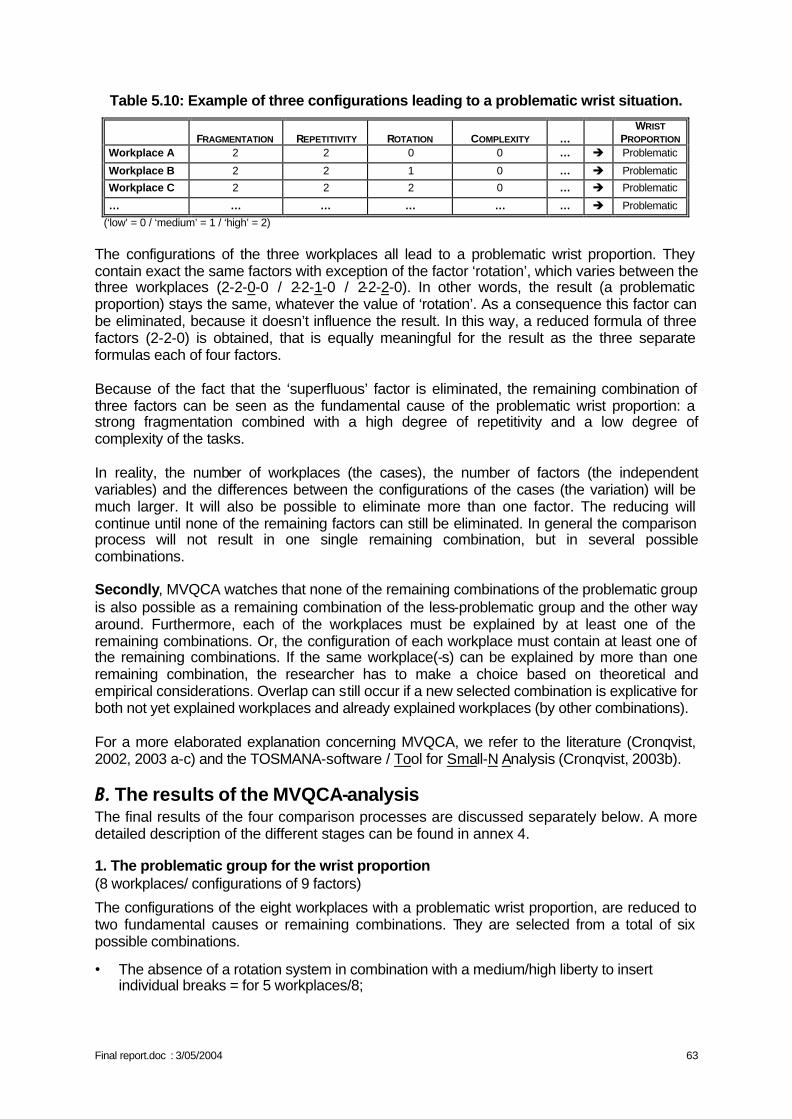
Final report.doc : 3/05/2004 63
Table 5.10: Example of three configurations leading to a problematic wrist situation.
FRAGMENTATION
REPETITIVITY
ROTATION
COMPLEXITY
…
WRIST PROPORTION
Workplace A 2 2 0 0 … è Problematic
Workplace B 2 2 1 0 … è Problematic
Workplace C 2 2 2 0 … è Problematic
… … … … … … è Problematic
(‘low’ = 0 / ‘medium’ = 1 / ‘high’ = 2) The configurations of the three workplaces all lead to a problematic wrist proportion. They contain exact the same factors with exception of the factor ‘rotation’, which varies between the three workplaces (2-2-0-0 / 2-2-1-0 / 2-2-2-0). In other words, the result (a problematic proportion) stays the same, whatever the value of ‘rotation’. As a consequence this factor can be eliminated, because it doesn’t influence the result. In this way, a reduced formula of three factors (2-2-0) is obtained, that is equally meaningful for the result as the three separate formulas each of four factors. Because of the fact that the ‘superfluous’ factor is eliminated, the remaining combination of three factors can be seen as the fundamental cause of the problematic wrist proportion: a strong fragmentation combined with a high degree of repetitivity and a low degree of complexity of the tasks. In reality, the number of workplaces (the cases), the number of factors (the independent variables) and the differences between the configurations of the cases (the variation) will be much larger. It will also be possible to eliminate more than one factor. The reducing will continue until none of the remaining factors can still be eliminated. In general the comparison process will not result in one single remaining combination, but in several possible combinations. Secondly, MVQCA watches that none of the remaining combinations of the problematic group is also possible as a remaining combination of the less-problematic group and the other way around. Furthermore, each of the workplaces must be explained by at least one of the remaining combinations. Or, the configuration of each workplace must contain at least one of the remaining combinations. If the same workplace(-s) can be explained by more than one remaining combination, the researcher has to make a choice based on theoretical and empirical considerations. Overlap can still occur if a new selected combination is explicative for both not yet explained workplaces and already explained workplaces (by other combinations). For a more elaborated explanation concerning MVQCA, we refer to the literature (Cronqvist, 2002, 2003 a-c) and the TOSMANA-software / Tool for Small-N Analysis (Cronqvist, 2003b).
B. The results of the MVQCA-analysis The final results of the four comparison processes are discussed separately below. A more detailed description of the different stages can be found in annex 4.
1. The problematic group for the wrist proportion (8 workplaces/ configurations of 9 factors)
The configurations of the eight workplaces with a problematic wrist proportion, are reduced to two fundamental causes or remaining combinations. They are selected from a total of six possible combinations.
• The absence of a rotation system in combination with a medium/high liberty to insert individual breaks = for 5 workplaces/8;
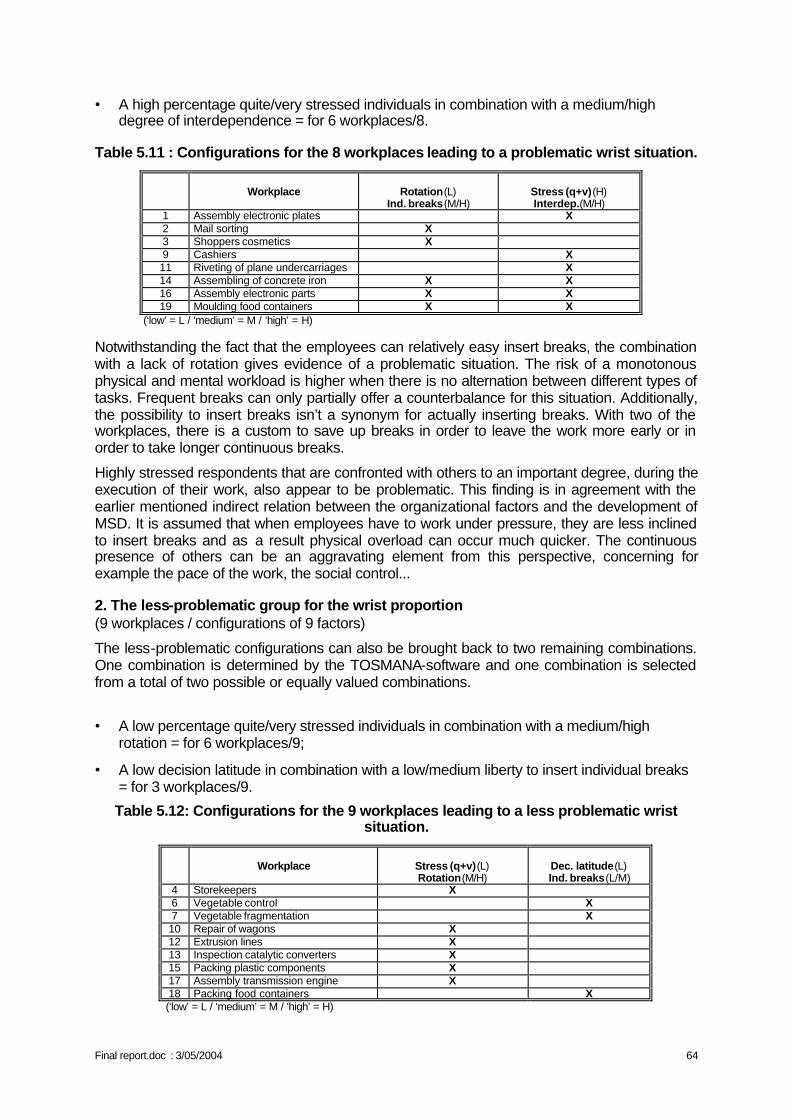
Final report.doc : 3/05/2004 64
• A high percentage quite/very stressed individuals in combination with a medium/high degree of interdependence = for 6 workplaces/8.
Table 5.11 : Configurations for the 8 workplaces leading to a problematic wrist situation.
Workplace
Rotation(L)
Ind. breaks(M/H)
Stress (q+v)(H) Interdep.(M/H)
1 Assembly electronic plates X 2 Mail sorting X 3 Shoppers cosmetics X 9 Cashiers X 11 Riveting of plane undercarriages X 14 Assembling of concrete iron X X 16 Assembly electronic parts X X 19 Moulding food containers X X
(‘low’ = L / ‘medium’ = M / ‘high’ = H) Notwithstanding the fact that the employees can relatively easy insert breaks, the combination with a lack of rotation gives evidence of a problematic situation. The risk of a monotonous physical and mental workload is higher when there is no alternation between different types of tasks. Frequent breaks can only partially offer a counterbalance for this situation. Additionally, the possibility to insert breaks isn’t a synonym for actually inserting breaks. With two of the workplaces, there is a custom to save up breaks in order to leave the work more early or in order to take longer continuous breaks.
Highly stressed respondents that are confronted with others to an important degree, during the execution of their work, also appear to be problematic. This finding is in agreement with the earlier mentioned indirect relation between the organizational factors and the development of MSD. It is assumed that when employees have to work under pressure, they are less inclined to insert breaks and as a result physical overload can occur much quicker. The continuous presence of others can be an aggravating element from this perspective, concerning for example the pace of the work, the social control...
2. The less-problematic group for the wrist proportion (9 workplaces / configurations of 9 factors)
The less-problematic configurations can also be brought back to two remaining combinations. One combination is determined by the TOSMANA-software and one combination is selected from a total of two possible or equally valued combinations.
• A low percentage quite/very stressed individuals in combination with a medium/high rotation = for 6 workplaces/9;
• A low decision latitude in combination with a low/medium liberty to insert individual breaks = for 3 workplaces/9.
Table 5.12: Configurations for the 9 workplaces leading to a less problematic wrist situation.
Workplace
Stress (q+v)(L) Rotation(M/H)
Dec. latitude(L) Ind. breaks(L/M)
4 Storekeepers X 6 Vegetable control X 7 Vegetable fragmentation X 10 Repair of wagons X 12 Extrusion lines X 13 Inspection catalytic converters X 15 Packing plastic components X 17 Assembly transmission engine X 18 Packing food containers X
(‘low’ = L / ‘medium’ = M / ‘high’ = H)
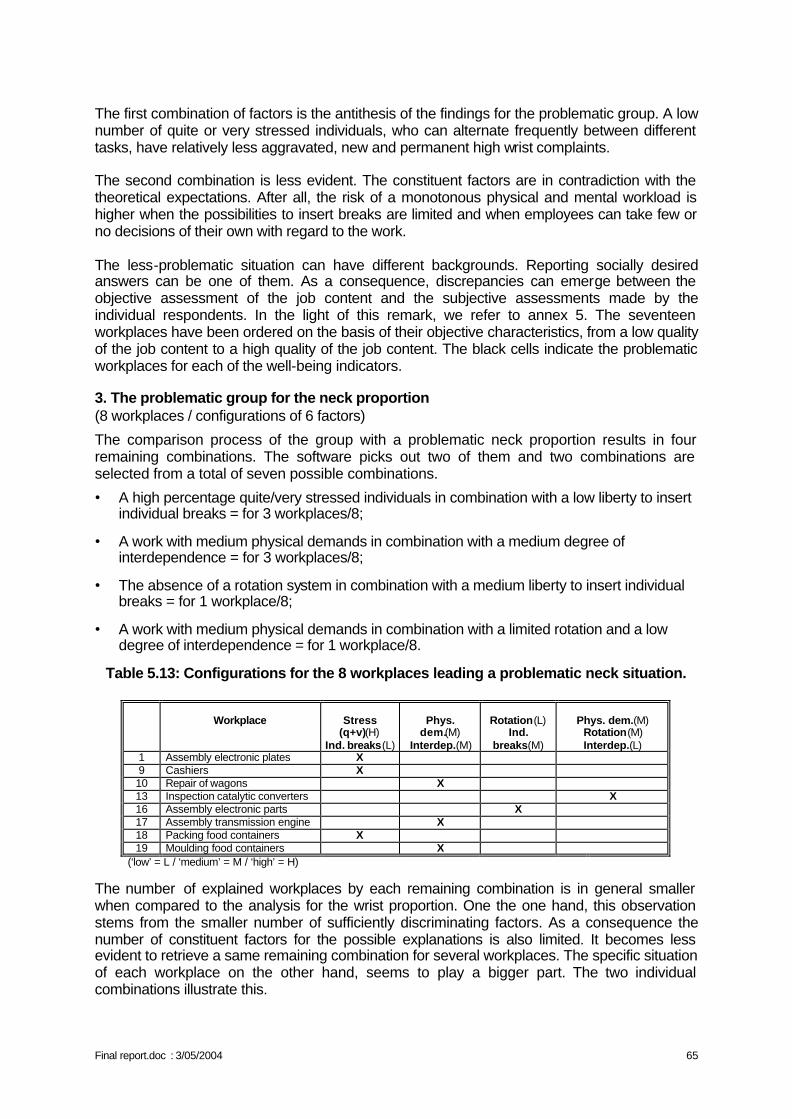
Final report.doc : 3/05/2004 65
The first combination of factors is the antithesis of the findings for the problematic group. A low number of quite or very stressed individuals, who can alternate frequently between different tasks, have relatively less aggravated, new and permanent high wrist complaints. The second combination is less evident. The constituent factors are in contradiction with the theoretical expectations. After all, the risk of a monotonous physical and mental workload is higher when the possibilities to insert breaks are limited and when employees can take few or no decisions of their own with regard to the work. The less-problematic situation can have different backgrounds. Reporting socially desired answers can be one of them. As a consequence, discrepancies can emerge between the objective assessment of the job content and the subjective assessments made by the individual respondents. In the light of this remark, we refer to annex 5. The seventeen workplaces have been ordered on the basis of their objective characteristics, from a low quality of the job content to a high quality of the job content. The black cells indicate the problematic workplaces for each of the well-being indicators.
3. The problematic group for the neck proportion (8 workplaces / configurations of 6 factors)
The comparison process of the group with a problematic neck proportion results in four remaining combinations. The software picks out two of them and two combinations are selected from a total of seven possible combinations.
• A high percentage quite/very stressed individuals in combination with a low liberty to insert individual breaks = for 3 workplaces/8;
• A work with medium physical demands in combination with a medium degree of interdependence = for 3 workplaces/8;
• The absence of a rotation system in combination with a medium liberty to insert individual breaks = for 1 workplace/8;
• A work with medium physical demands in combination with a limited rotation and a low degree of interdependence = for 1 workplace/8.
Table 5.13: Configurations for the 8 workplaces leading a problematic neck situation.
Workplace
Stress
(q+v)(H) Ind. breaks(L)
Phys.
dem.(M) Interdep.(M)
Rotation(L)
Ind. breaks(M)
Phys. dem.(M)
Rotation(M) Interdep.(L)
1 Assembly electronic plates X 9 Cashiers X 10 Repair of wagons X 13 Inspection catalytic converters X 16 Assembly electronic parts X 17 Assembly transmission engine X 18 Packing food containers X 19 Moulding food containers X
(‘low’ = L / ‘medium’ = M / ‘high’ = H)
The number of explained workplaces by each remaining combination is in general smaller when compared to the analysis for the wrist proportion. One the one hand, this observation stems from the smaller number of sufficiently discriminating factors. As a consequence the number of constituent factors for the possible explanations is also limited. It becomes less evident to retrieve a same remaining combination for several workplaces. The specific situation of each workplace on the other hand, seems to play a bigger part. The two individual combinations illustrate this.
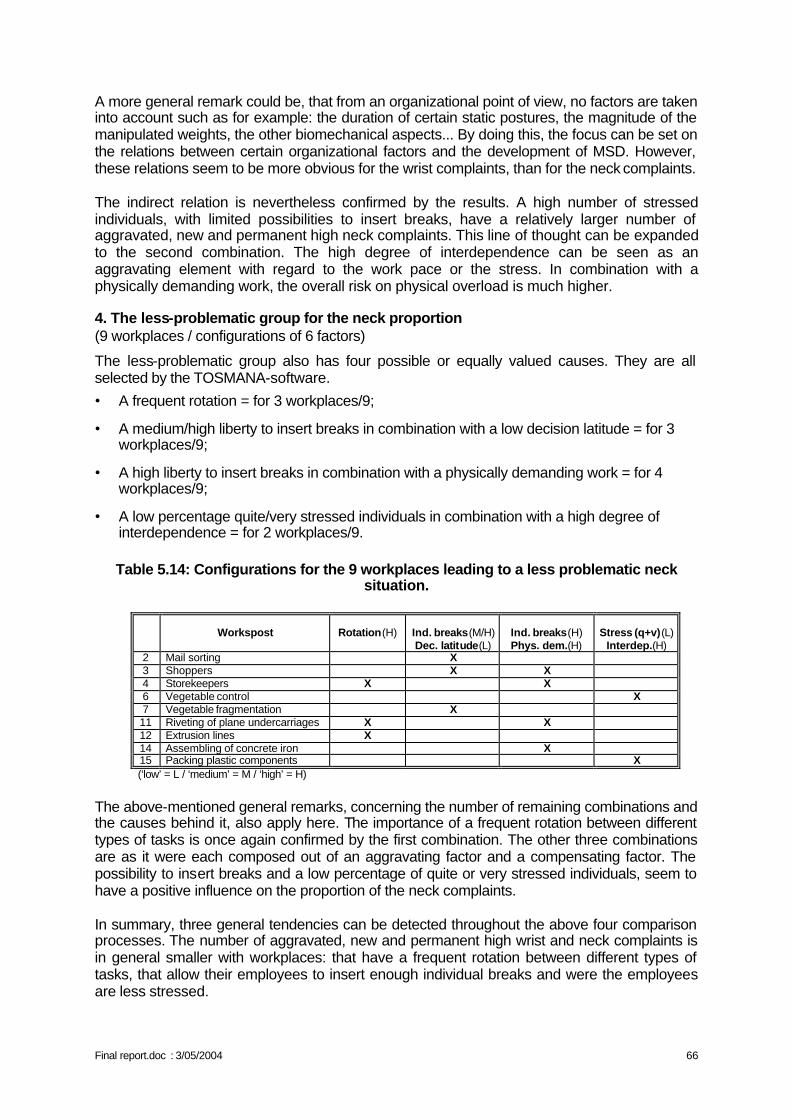
Final report.doc : 3/05/2004 66
A more general remark could be, that from an organizational point of view, no factors are taken into account such as for example: the duration of certain static postures, the magnitude of the manipulated weights, the other biomechanical aspects... By doing this, the focus can be set on the relations between certain organizational factors and the development of MSD. However, these relations seem to be more obvious for the wrist complaints, than for the neck complaints. The indirect relation is nevertheless confirmed by the results. A high number of stressed individuals, with limited possibilities to insert breaks, have a relatively larger number of aggravated, new and permanent high neck complaints. This line of thought can be expanded to the second combination. The high degree of interdependence can be seen as an aggravating element with regard to the work pace or the stress. In combination with a physically demanding work, the overall risk on physical overload is much higher.
4. The less-problematic group for the neck proportion (9 workplaces / configurations of 6 factors)
The less-problematic group also has four possible or equally valued causes. They are all selected by the TOSMANA-software.
• A frequent rotation = for 3 workplaces/9;
• A medium/high liberty to insert breaks in combination with a low decision latitude = for 3 workplaces/9;
• A high liberty to insert breaks in combination with a physically demanding work = for 4 workplaces/9;
• A low percentage quite/very stressed individuals in combination with a high degree of interdependence = for 2 workplaces/9.
Table 5.14: Configurations for the 9 workplaces leading to a less problematic neck situation.
Workspost
Rotation(H)
Ind. breaks(M/H) Dec. latitude(L)
Ind. breaks(H) Phys. dem.(H)
Stress (q+v)(L)
Interdep.(H) 2 Mail sorting X 3 Shoppers X X 4 Storekeepers X X 6 Vegetable control X 7 Vegetable fragmentation X 11 Riveting of plane undercarriages X X 12 Extrusion lines X 14 Assembling of concrete iron X 15 Packing plastic components X
(‘low’ = L / ‘medium’ = M / ‘high’ = H)
The above-mentioned general remarks, concerning the number of remaining combinations and the causes behind it, also apply here. The importance of a frequent rotation between different types of tasks is once again confirmed by the first combination. The other three combinations are as it were each composed out of an aggravating factor and a compensating factor. The possibility to insert breaks and a low percentage of quite or very stressed individuals, seem to have a positive influence on the proportion of the neck complaints. In summary, three general tendencies can be detected throughout the above four comparison processes. The number of aggravated, new and permanent high wrist and neck complaints is in general smaller with workplaces: that have a frequent rotation between different types of tasks, that allow their employees to insert enough individual breaks and were the employees are less stressed.
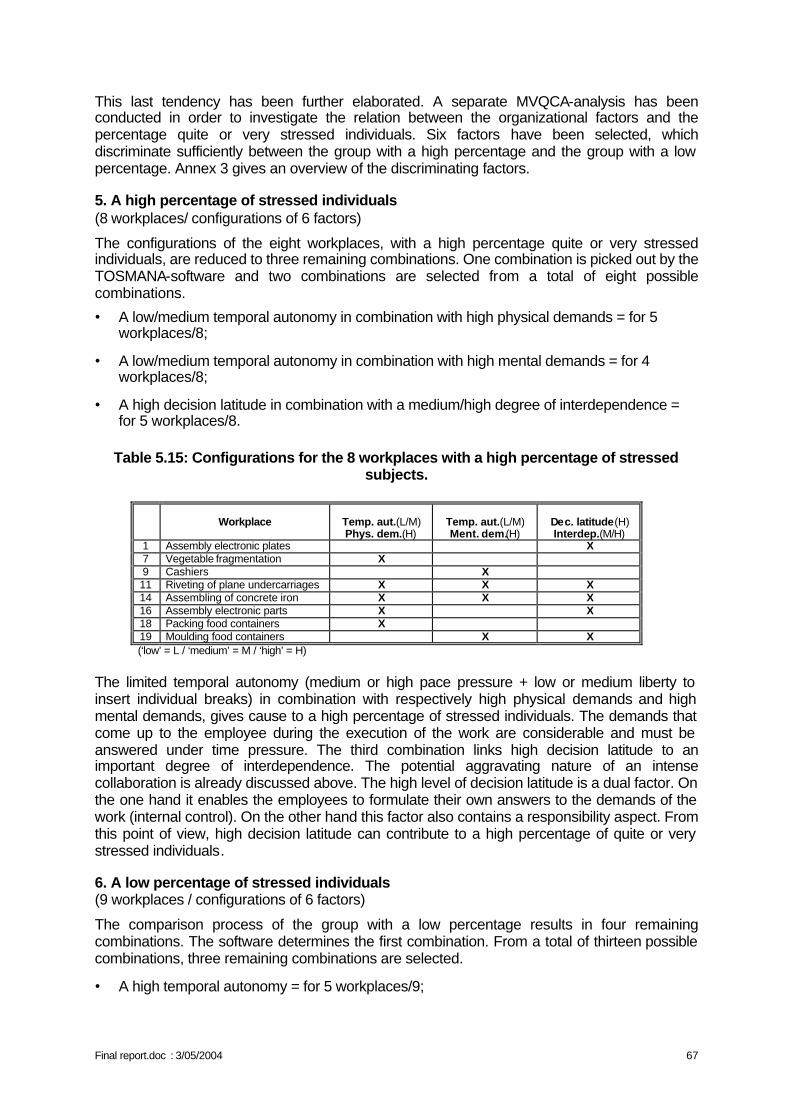
Final report.doc : 3/05/2004 67
This last tendency has been further elaborated. A separate MVQCA-analysis has been conducted in order to investigate the relation between the organizational factors and the percentage quite or very stressed individuals. Six factors have been selected, which discriminate sufficiently between the group with a high percentage and the group with a low percentage. Annex 3 gives an overview of the discriminating factors.
5. A high percentage of stressed individuals (8 workplaces/ configurations of 6 factors)
The configurations of the eight workplaces, with a high percentage quite or very stressed individuals, are reduced to three remaining combinations. One combination is picked out by the TOSMANA-software and two combinations are selected from a total of eight possible combinations.
• A low/medium temporal autonomy in combination with high physical demands = for 5 workplaces/8;
• A low/medium temporal autonomy in combination with high mental demands = for 4 workplaces/8;
• A high decision latitude in combination with a medium/high degree of interdependence = for 5 workplaces/8.
Table 5.15: Configurations for the 8 workplaces with a high percentage of stressed subjects.
Workplace
Temp. aut.(L/M) Phys. dem.(H)
Temp. aut.(L/M) Ment. dem.(H)
Dec. latitude(H) Interdep.(M/H)
1 Assembly electronic plates X 7 Vegetable fragmentation X 9 Cashiers X 11 Riveting of plane undercarriages X X X 14 Assembling of concrete iron X X X 16 Assembly electronic parts X X 18 Packing food containers X 19 Moulding food containers X X
(‘low’ = L / ‘medium’ = M / ‘high’ = H) The limited temporal autonomy (medium or high pace pressure + low or medium liberty to insert individual breaks) in combination with respectively high physical demands and high mental demands, gives cause to a high percentage of stressed individuals. The demands that come up to the employee during the execution of the work are considerable and must be answered under time pressure. The third combination links high decision latitude to an important degree of interdependence. The potential aggravating nature of an intense collaboration is already discussed above. The high level of decision latitude is a dual factor. On the one hand it enables the employees to formulate their own answers to the demands of the work (internal control). On the other hand this factor also contains a responsibility aspect. From this point of view, high decision latitude can contribute to a high percentage of quite or very stressed individuals.
6. A low percentage of stressed individuals (9 workplaces / configurations of 6 factors)
The comparison process of the group with a low percentage results in four remaining combinations. The software determines the first combination. From a total of thirteen possible combinations, three remaining combinations are selected.
• A high temporal autonomy = for 5 workplaces/9;
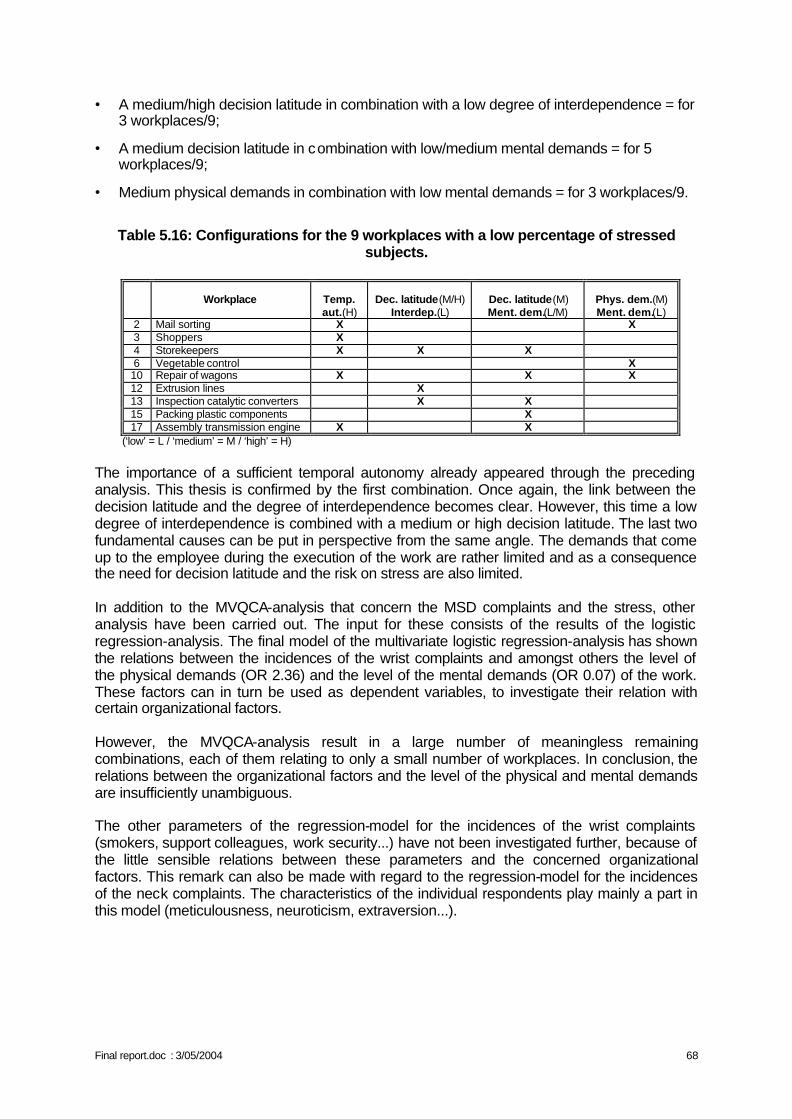
Final report.doc : 3/05/2004 68
• A medium/high decision latitude in combination with a low degree of interdependence = for 3 workplaces/9;
• A medium decision latitude in combination with low/medium mental demands = for 5 workplaces/9;
• Medium physical demands in combination with low mental demands = for 3 workplaces/9. Table 5.16: Configurations for the 9 workplaces with a low percentage of stressed
subjects.
Workplace
Temp. aut.(H)
Dec. latitude(M/H)
Interdep.(L)
Dec. latitude(M) Ment. dem.(L/M)
Phys. dem.(M) Ment. dem.(L)
2 Mail sorting X X 3 Shoppers X 4 Storekeepers X X X 6 Vegetable control X 10 Repair of wagons X X X 12 Extrusion lines X 13 Inspection catalytic converters X X 15 Packing plastic components X 17 Assembly transmission engine X X
(‘low’ = L / ‘medium’ = M / ‘high’ = H)
The importance of a sufficient temporal autonomy already appeared through the preceding analysis. This thesis is confirmed by the first combination. Once again, the link between the decision latitude and the degree of interdependence becomes clear. However, this time a low degree of interdependence is combined with a medium or high decision latitude. The last two fundamental causes can be put in perspective from the same angle. The demands that come up to the employee during the execution of the work are rather limited and as a consequence the need for decision latitude and the risk on stress are also limited. In addition to the MVQCA-analysis that concern the MSD complaints and the stress, other analysis have been carried out. The input for these consists of the results of the logistic regression-analysis. The final model of the multivariate logistic regression-analysis has shown the relations between the incidences of the wrist complaints and amongst others the level of the physical demands (OR 2.36) and the level of the mental demands (OR 0.07) of the work. These factors can in turn be used as dependent variables, to investigate their relation with certain organizational factors. However, the MVQCA-analysis result in a large number of meaningless remaining combinations, each of them relating to only a small number of workplaces. In conclusion, the relations between the organizational factors and the level of the physical and mental demands are insufficiently unambiguous. The other parameters of the regression-model for the incidences of the wrist complaints (smokers, support colleagues, work security...) have not been investigated further, because of the little sensible relations between these parameters and the concerned organizational factors. This remark can also be made with regard to the regression-model for the incidences of the neck complaints. The characteristics of the individual respondents play mainly a part in this model (meticulousness, neuroticism, extraversion...).
Final report.doc : 3/05/2004 69
CHAPTER VI: DISCUSSION
I. RELEVANCE OF THE DATA The effect of a parameter can be highlighted only if this parameter varies from one person to another. A first limitation of the study is thus the fact that few stations were occupied by men and women in comparable proportions. Consequently no "gender" effect can be observed. It would be the same for the personality effect if all the people had about the same profile. It is thus necessary to analyse the inter individual variances within the sample.
1. Working conditions The working conditions prove rather constraining with regard to the positions of the wrists and the repetitiveness: on average 39% of the time spent in extension and 26% in ulnar deviation of the dominant wrist, with an index of postural variability higher than 30 for the two types of movement. Variations are important between workplaces as shown in table 5.16 and between people of the same workplace, so that these parameters must necessarily be considered in the analysis for the dominant wrist. The most influential biomechanical parameter, the efforts, is considered on average as being "moderate" (on the scale of Borg), but again inter individual differences are important (from "zero" to "very hard").
2. Prevalence The mean age of the participants is 38 years, the mean weight 73 kg and the mean size 170 cm. The seniority at the workplace is about 10 years. The ranges of variations cover the most current values and the distributions are uniform: age between 20 and 60 years, weight between 40 and 124 kg, size from 150 to 196 cm, seniority at the workplace from 1 to 31 years. The prevalence of development of musculoskeletal complaints (over 12 months) is high in this highly selected sample: 60% for the neck and 34% for the dominant wrist but varies between company: 14 to 86% for the neck and from 7 to 73% for the dominant wrist. The prevalence cannot easily be compared with those of the literature, among other reasons because strong methodological differences. Anatomical areas are also sometimes different, such as for the areas of the neck and the shoulders considered together or separately. In addition, this comparison would not make sense since our study is a case-control study. The companies were selected for these high prevalence's that are not representative for the industrial sector nor, furthermore, for the industry in general. The objective of research being the study of the factors playing a role in the development of the MSD, it was necessary to select workplaces where some people were already complaining about MSD. If at the beginning no one was complaining about MSD, there was little chance that, 15 month later, the incidence would be sufficient to be able to study any relationship. On the opposite, at a workplace where too many people would be complaining at the beginning of the study, few new complaints would have been observed at the end of the study. The selection of the workplaces was made on the basis of the risk for MSD in the region of the wrists. The prevalence of severe complaints at the wrist was 16% at the beginning of the study and the annual incidence was approximately 11%. The choice of the workplaces being made on this basis, the prevalence of neck complaints could only be observed: 35% and the incidence of the severe complaints of 17%. The prevalence of disorders noted during the clinical examination is very low. It is in fact too low to be able to undertake on this basis the study of the relationship to individual variables.
Final report.doc : 3/05/2004 70
This is unfortunate from a statistics point of view, but understandable and fortunate on the human level: the subjects suffering from severe disorders are probably no longer at work. The study will consequently relate to the musculoskeletal complaints that, more than the disorders, should be in relation with personal characteristics. These observations on the proportions of complaints and disorders raise however some questions:
• either the employees have indeed many complaints and few disorders for the reason mentioned above;
• or the employees suffer from clinical disorders other from those investigated during the study and thus not detected: this is unlikely in the present state of knowledge concerning MSD
• or the criteria used to diagnose the MSD are too severe
3. Personality Reference values do exist only for the Big Five personality scales. The results are largely distributed and reach the possible minimum and maximum. The people are characterized as:
• slightly competitive: 9,0, from 3 to 15 (possible min and max) • with a light sense of urgently: 35,2, from 19 to 50 (possible min and max 11 and 55) • fairly conscientious: 36. 6, from 9 to 48 (possible min and max 0 and 48) • very extraverted: 31. 5, from 16 to 46 (min and possible max 0 to 48) • with an average score of altruism: 33. 5, from 19 to 46 (min and possible max 0 to 48) • with an average score of neuroticism: 19. 2 from 4 to 39 (min and possible max 0 to
48) These data being collected during an interview, the people were likely to tone down somewhat the situation, few of them for example tending to declare themselves not conscientious. This could influence the fact that a relationship with MS complaints is statistically significant or not (by reducing the inter individual variance) as well as the strength of the association. However, the variability remains important and there does not exist any correlation between these personality components. All the combinations of principal components of personality are met and consequently the analysis will not be dependent on particular cases.
4. Functional and psychomotor tests The maximal angulations and forces are on average similar to those reported in the literature, and with approximately the same variability. No reference value is available for the O' Connor dexterity test, except the results from the quoted study (Malchaire et al., 2000) that are slightly lower on average. The inter individual differences are rather considerable: some people spent 266 seconds while others performed the test in 4 times less time. Although the personal factors responsible for these differences (oculo-motor coordination, dexterity, tactile sensitivity…) are difficult to identify, this clearly highlights differences in aptitude that logically should be reflected in the work constraints and possibly in the MS complaint. The results of the Bonnardel test are still more striking, the distribution extending from 14 to 156 cubes assembled in 10 minutes. The average score (76.2) is close to the reference values (between 63 and 74).
Final report.doc : 3/05/2004 71
5. Psychosocial factors and of stress The population includes operators selected with the passing of years and having found operational compromises enabling them to continue their activity highly repetitive and bio mechanically exacting during nearly 10 years in the majority of the cases. The average score of somatic disorders is 6.0, which, in view of the severity of the symptoms called upon in the questions, represents a relatively good situation (maximum score = 24). The distribution of the individual values extends from 0 (nothing) with 19 (severe). The results of the stress questionnaire of Karasek reveal a psychological demand similar to that of the reference population of BELSTRESS (2.5) and a lower latitude of decision (2.2 vs. 2.8). Again the distributions are broad underlining very variable answers (min and max values: 1 and 4). It is timely to discuss the fact that the 238 operators came from companies that accepted to participate. Many companies refused, for various reasons (reorganization, overload…) or without reason. It is allowed to wonder about the distortion this introduces. The participating companies had stress problems. However, they had an open mindedness and a spirit of dialogue without any doubt better than the others. The average scores cannot thus be regarded as representative of this type of companies. On the other hand, the inter individual differences are perhaps larger, if it is recognized that the companies involved in the study were not in critical situation where the individual scores would tend to be similar.
6. Organisational data The organisational characteristics are specific to the companies and shared by all the people working at the same workstation. As already exposed, we had to choose, at the beginning of this study, workplaces likely to lead to MSD, i.e. where repetitive work requiring some efforts had to be carried out in unfavourable postures. The workstations fulfilling these criteria share inevitably some organisational characteristics and the differences between the stations are low. The comparisons between workstations and the search for effects of these characteristics on the development of MSD will consequently be difficult. Some variables were eliminated straightaway because of this lack of discrimination: types of contract, type of remuneration. Moreover, the 2 stations of the tertiary sector had to be neglected. The obvious organisational differences being concomitant with differences quite as manifest for the biomechanical characteristics, it became impossible to differentiate these influences.
II. METHODOLOGY
1. Outline of the study and selection of the subjects The study is original in two aspects:
• It is an prospective study. Such studies are rare as the great majority of the investigations about MSD of the upper limbs are cross sectional.
• The research ambitions to study the influence of all the factors suspected to influence the development of MSD: factors personal, biomechanical, of personality, psychological or organisational.
This study is parallel to the longitudinal study conducted previously by the same researchers in various industrial sectors (Malchaire, 1995). This study had emphasized the biomechanical constraints, their quantification, as well as their importance in the development of the MSD of the wrists. The study showed that these constraints did not explain all the variance and the
Final report.doc : 3/05/2004 72
present research was consequently directed towards the other risk factors, more difficult to quantify. The prevalence of complaints at the selected workstations was such that, if the absence of complaint had been retained as the selection criterion for the prospective part, this one would have become impossible. Therefore, in the prospective part of the study, a criterion of severity of the complaints was adopted. This degree of severity was evaluated from the frequency of appearance of the complaints and from their severity and cannot thus be compared to the severity of a disorder. The aim of the study was to follow about 300 people coming from 20 working stations. This objective was almost achieved, but with many difficulties: 19 stations were selected for 298 people. One of the major problems of any prospective study is the number of workers who cannot be re-examined in the later years. This was the case for 60 people. However, the reasons of the withdrawals seem not having anything to do with the MSD of the upper limb. Initially it had also been decided to re-examine the people after a 24-month period. The difficulties for the selection of the participating companies made that this interval had to be reduced to approximately 16 month. This is not likely to influence the results negatively. Over a 2-year period, the number of new cases would have been greater, but also the risk of alterations of the working conditions that would have harmed the study since exposure conditions should remain identical during a prospective study.
2. Statistical analysis The probability of development of a MS complaint was studied classically as a function of the whole set of continuous and discrete variables by means of logistic regression models. The variables and parameters taken into account are the personal and psychosocial data of each subject, his scores for the functional and sensitive tests and the biomechanical constraints at the workstations. 3 groups were compared
• Group A1+ of people with severe complaints at the time of the first interview in year 1 of
the prospective research and who were not interviewed anymore thereafter.
• Group A2+ of people who, without severe complaint in year 1, developed complaints
during the 16-month duration of the prospective study.
• Group A2– of people who remained without complaints during these 16 months
The biomechanical constraints at work were characterized in two different ways: on the basis of the opinions of the workers and by quantitative analysis from video recordings. This made it possible to compare these two approaches and to notice the significant differences between the 2 approaches: this comparison is not presented nor discussed in this document. The odds ratios give an estimate of the incidence ratios or relative risks, for a given variation of a parameter, taking into account the influence of the other parameters. In the case of MSD for which the incidence is relatively high, this estimate significantly over-estimates the relative risk. The organisational constraints were not used in the logistic model, but rather using a quail-quantitative analysis (QCA), so as not to regard group variables as individual variables. The fact of having to use two radically different statistical approaches strongly complicates the synthesis and the interpretation of the results. This will be discussed later.
Final report.doc : 3/05/2004 73
III. DESCRIPTIVE RESULTS
1. Data from the questionnaire The whole of the tables show that the 3 groups of people defined above are little different. Some differences appear logical:
• Subjects A1+ for the wrist as well as the neck are those who also complain from
tiredness of the wrists. • Subjects A2
– for the wrist are those practicing sport the most and those who find the efforts as being less heavy.
On the other hand, the A2+ subjects for the neck are those appreciating best their psychosocial
environment (according to the dimensions of Karasek). As in our previous studies, the functional tests do show any difference between the 3 groups.
2. Professional constraints The 3 groups are hardly different, except for the fact that the subjects without complaints (A2
-) adopt more frequently extreme postures of the wrist. This appears logical: the pain, or fear of the pain, restricting the gestures of the workers from the other groups. However this difference is not statistically significant.
3. Psycho-organisational factors and of stress The model of Karasek was tested in 2 already old studies: one Swedish (Johansson, 1971, quoted by Karasek, 1979), and the other, American (University of Michigan Quality of Employment Survey, 1972, quoted by Karasek, 1979). However, to our knowledge, until 2002, no research had studied the factorial structure of the questionnaire assumed to bring out the three dimensions of the Karasek model, and this, neither for the english nor the french version. Attempts in this direction were made (Hellemans and Karnas, 1998, 1999), but these analyses related only to restricted samples of workers. In 2002, were published the results of an analysis of the validity of the Karasek questionnaire, performed on the extensive population of the BELSTRESS study. The objective of the analysis was to test the model "internally" (Does one find the three dimensions of the Karasek's model) and "externally" (Does one find the associations described by Karasek between the dimensions of the model and the tensions perceived by the workers?) (Karnas and Hellemans, 2002). These analyses showed that the model of Karasek had to be "revisited". Indeed,
• The factorial analysis revealed that the aspects of "work demand" and "social support" had to be considered separately.
• The relations highlighted between dimensions and the indices of mental stress explained only a negligible part of the variance of the phenomenon that they were supposed to explain.
In the present research, we consequently opted for a double approach: • On the one hand, analyses using the dimensions of the Karasek model in order to
follow the trend of many Anglo-Saxon publications in organizational and occupational psychology
• In addition, analyses based on the dimensions derived from a factorial analysis of our own data.
As table 4.11 shows it, the main dimensions of Karasek (decision latitude and psychological demand) are moderate for the perception (Karasek model) as well as the appreciation of the work situations. These new dimensions make it possible to highlight differences between
Final report.doc : 3/05/2004 74
groups that, however, appear not very informative. Thus the A2+ group for the neck complaints
is finding the psychological demand to be high but appreciating best the social support.
IV. RESULTS OF THE PROSPECTIVE STUDY: REGRESSION LOGISTICS.
Tables 5.8 and 5.9 give the results of the logistic regression models, respectively for the dominant wrist and the neck. The model for the wrist MS complaints highlights factors related to: the individual characteristics of the operators, the biomechanical constraints and the psychological constraints. While the model for the neck complaints highlights factors linked to the individual characteristics of the operators and the psychological constraints.
1. Individual characteristics of the operators Smoking
Smoking is positively associated with the fact of complaining from MSD at the wrist (odds ratio very high, 4. 99). The importance of this OR suggests a direct relationship. The consumption of tobacco is recognized as being a risk factor of lumbagos (Coste and Paolaggi, 1989). A study undertaken in Finland on workers financially compensated for low back pain, suggests that smoking would be a risk factor with an etiologic fraction of 51 % (Heliövaara et al., 1987). In the ESTEV investigation that considered more than 21000 employees 37 to 52-years old in 1990 (Derriennic et al., 1990), the odds ratio of lumbar pains as a function of smoking was smaller (1.2). The pathogenic mechanisms called upon are, on the one hand, an accelerated degeneration of the intervertebral discs because of the deceleration of the blood flow caused by nicotine and, on the other hand, the cough of the smoker. The relationship between tobacco and MSD of the wrist is less clear. Alterations of the muscular oxygenation secondary to the circulation disorders induced by smoking could explain the muscular complaints. Several publications suggest a relationship between smoking and hand tingling during the night and pains in the wrist (Hagberg et al.,1990; Hagberg et al., 1995), or else between smoking and the conduction velocity of the median nerve (Nathan et al., 1996). Smoking was studied as a risk factor in 15 studies reported in the literature (Malchaire et al., 2001a). However, a relationship was found with complaints at the neck and wrists in respectively 3 and 1 studies only. Therefore, the association cannot be regarded as proven. Personality characteristics According to the same review of the literature carried out in 2000 (Malchaire et al., 2001a), very few studies investigated the potential association between the personality characteristics and the MSD. Some references exist for the neck but 2 only concerning the MS complaints at the wrists. The personality characteristics appear here in relationship only to the neck complaints. Contrary to Flodmark and Aase (1992), the study does not show any relationship with the type A personality, whereas, contrary to the studies of Bru et al.(1993) and Vasseljen et al. (1995), a rather strong relation (OR = 4) is observed with extraversion. The study relates to the existence of MS complaints declared by the operators and not to clinically diagnosed disorders. A greater expression of the complaints by extraverted people could explain this association. A relationship is also found with neuroticism, in agreement with the results of 2 out of the 3 authors who studied this association (Bergqvist et al.,1995; Bru et al., 1993; Vasseljen et al., 1995).
Final report.doc : 3/05/2004 75
The subjects with a high score of neuroticism have a tendency to introspection and somatic complaints (McCrae and Costa, 1987). They would thus perceive more strongly the physiological symptoms. This exaggerated perception, as well as their tendency to anxiety and introspection would lead them to complain more easily (Hansell and Mechanic, 1985; Watson and Pennebaker, 1989). In addition, they would have an increased vulnerability to the stress and a tendency to professional dissatisfaction, factors which appear associated with the neck and shoulders MSD (Bongers et al., 1993; Bernard, 1997; Swinnen, 1997). This dimension is currently compared to an evaluation of mood called "negative affectivity" (Watson and Clark, 1984). A high score of negative affectivity is in relation to a nature hostile, nervous, tense, in opposition to calm and relaxed. Neuroticism is regarded as the susceptibility to negative affectivity. In the study performed by Bergqvist et al.(1995), the subjects with a high score of negative affectivity presented approximately twice more MS complaints than the others. One study (Vasseljen et al.,1995) found an association with the neck and shoulders MS complaints for white-collar employees (p<0,01), but not for blue-collar employees. A negative relationship exists between the conscientiousness and the neck complaints. To our knowledge this was never investigated and a rational explanation seems difficult to provide. A relation between MS complaints and personality having been mentioned, some companies have started to select operators on basis, among others, of personality tests. This is ethically indefensible. It appears moreover not founded, as the results in the literature (and ours) appear contradictory. Besides would it be recommended not to hire the conscientious workers? It must be concluded that the studies taking these factors into consideration are too few and too small and that the results are dependent on the particular population investigated.
2. Biomechanical constraints The study shows that the biomechanical factors and primarily the efforts remain the principal risk factors of wrist MS complaints. This increase in the risk of MS complaints in the event of intense physical efforts is recognized in many studies (Brusco and Malchaire, 1993; Chiang et al., 1993; Fransson-hall et al., 1995; Roquelaure et al.,1997; Burdorf et al., 1997; Silverstein et al., 1986; 1987; 1996). Generally, the highlighted factor relates to the intensity of the grip strength (Silverstein et al., 1987; Wieslander et al., 1989) or the weight of the handled objects. The former prospective and quantitative study of the biomechanical constraints (Malchaire et al., 1997) already showed clearly the main role of the efforts of the hands and wrists in the development of wrist MSD. No association is found with the work postures. This can certainly be explained by the fact that elementary ergonomic measures were already taken at these workstations and that extreme postures are rare and occasional. The absence of association with the repetitiveness of the movements can probably be explained by the over-pairing of the work situations, since all tasks were repetitive.
3. Psychosocial factors The assumption of an association between MSD and the psychosocial factors was made several years ago following some epidemiological studies (Bongers et al., 1993; Houtman et al., 1994). This relationship remains badly established because the number of factors to be considered is unlimited and that the methods remain not objective and not standardized. No consensus exists on the factors to study and the method to use. Moreover, few validated data exist in the literature so that a comparison is difficult.
Final report.doc : 3/05/2004 76
The risk models obtained in this research highlight few objective constraints of the work situations. In particular, none of the variables coming from the video analysis of the postures is significant. On the other hand, they show a significant association between the psychosocial variables (as approached by the questionnaire of Karasek) and the development of the wrist MS complaints and, to a lesser extend, with the neck MS complaints. The variable "physical effort" according to Karasek is significant, confirming what was already discussed concerning the efforts. The precariousness seems to be associated with a higher risk of wrist complaints. The odds ratio is particularly significant. This association appears logical but can be considered only indirectly: precariousness would lead to increased tension and consequently would worsen the effects of the biomechanical constraints. It is then surprising not to find this association for the neck complaints. The models suggest that the risk is higher if the support of the colleagues is better (wrist OR = 3.71) and if superiors are better appreciated (neck OR = 2.62). This is completely in contradiction with the basic principles of many prevention policies. Among the studies reviewed by Malchaire et al.(2001a),
• 21 had studied the relation between the complaints in the area of the neck and shoulders and the social support: 6 only found an association
• 15 had taken into account the same factors this time in relation to the complaints in the area of the wrists and elbows: 2 only mentioned an association
Association between wrist complaints and "psychological demand" is quite as contradictory to the current ideas: the risk would be particularly low (OR = 0.07) if the demand is high. The literature (Malchaire et al., 2001a) suggests a opposite relationship in 9 studies out of 16 for the neck and 5 studies out of 13 for the wrists. Actually, of all the parameters in connection with the questionnaire of Karasek, the "psychological demand" was the variable with the lowest inter individual differences and that the scores were remarkably identical for the 3 groups A1
+ A2
+ and A2- defined previously (Table 4.9).
As underlined in the review article (Malchaire et al., 2001a), it is likely that the risk does not increase linearly with the increase of psychological demand. The score (2.5) is identical to the reference value from the BELSTRESS study. At these repetitive workstations, the workers seem to have an average psychological demand, unlikely to induce stress problems. This average state relates however to this population, accustomed to repetitive work and having developed an definite tolerance to it. One can make the hypothesis however that the mental requirements are in fact rather low so that an increase constitutes an improvement and not an overload. It is consequently explainable that a relative increase in the low demand be associated with a risk reduction. The last characteristic that appears associated with a greater risk of wrist complaints is the functional style. Faverge (1974) defines the style of a person in her professional life by the organized set of behaviours that reflect her personal understanding of her work life. The meaning one gives to his work, the place he gives to it in his life would appear in his behaviour at work and out of work. The functional style is clearly that of a person bound to work but hardly finding in this work any personal achievement. One can understand that it is the case of the majority of the people occupied with these repetitive tasks. The functional style is statistically opposed to the "integrated" style, so that the statistical result can be interpreted conversely: the integrated style, i.e. of a subject getting involved in his work and integrating it into his life would be associated with a lower risk of MSD.
Final report.doc : 3/05/2004 77
If this result appears reasonable, it is on the other hand hardly logical that it relates only to the wrist MS complaints and not to complaints in the area of the neck. The analysis of the organisational characteristics of the companies had to be carried out by another statistical method, the MVQCA analysis. It does not highlight a simple model making it possible to identify the situations "at risk". The reason is to be found in the organisational homogeneity of the population. The significant number of selection criteria indeed created a significant bias. A great majority of the working stations are located in a narrow range of the organisational spectrum. This type of function is characterized, among others, by a limited number (1 to 3) of tasks, repetitive, with short cycles, without secondary organisational tasks, alternations with other responsibilities in a system for production on order, with always the same type of contract and the same wage system. Consequently, the factors "fragmentation" and "repetitiveness" discriminate insufficiently between the stations with the higher and lower prevalence. Consequently from an organisational point of view, their influence on the development of the MS complaints cannot be studied. An association could only be found, if it exists, if the research was extended to other types of functions (for example work on projects).
Final report.doc : 3/05/2004 78
CHAPTER VII: PRACTICAL ENHANCEMENT OF THE RESEARCH
I. ENHANCEMENT WITH RESPECT TO THE WORKERS AND INDUSTRY.
1. Introduction As this report shows it, the understanding of the interactions between the risk factors, that is the effect that the combined exposures have on the global risk of physical disorders, remains limited. However all the researchers agree on the multi-factor aetiology MSDs and the fact that a reduction of the biomechanical load and an improvement of the work organization and of the living environment should lead to a fall of the prevalence of MSDs of professional origin. After having described the evaluation methods available, we will discuss their effectiveness and will study the criteria to be filled in by a method that would include comprehensively all the risk factors.
2. The risk assessment methods proposed in the literature During the last twenty years, many methods have been proposed for the evaluation of the exposure of the employees. Their main goal was to evaluate the biomechanical risk factors: force, repetitiveness, and postures. These assessment methods were generally developed and published by experts seeking to bring to people of the field what they consider necessary to correctly evaluate the risks at the workplace. Two fundamental critiques can be made concerning these methods:
• They correspond to various levels of qualifications and technical and temporal possibilities and must therefore be classified according to the people who can use them in the companies.
• They are relevant to differing levels of interventions in industry. The fundamental question is to know which type of assessment leads most directly and most surely to the prevention of the risks of MSDs. In this respect, it is significant to distinguish between
• The evaluation with the purpose of collecting epidemiological data and • The technical assessment to search for solutions.
In an epidemiological study, the exposure of many employees has to be evaluated quantitatively by individual measurements, during several representative periods, using calibrated equipment and according to validated and standardized procedures. On the opposite, the daily objective in a company is not to evaluate the risk like the scientists must do it for an epidemiological study, but to collect the information necessary to improve the working conditions and, if possible, to avoid the problems as soon as possible and at the lowest cost. Then, the people responsible for this prevention do not need a method defining a total index of constraint, but, on the contrary, need a procedure allowing them to gather information gradually, insofar as it is necessary to define adequate control measure. Often, local and instantaneous measurements during the most constraining work phases meet the needs to search the most effective solutions. The existing assessment methods can help to find solutions by identifying the problems but they are in general not conceived accordingly. There is thus a pressing need to make available in the field tools helping to find solutions.
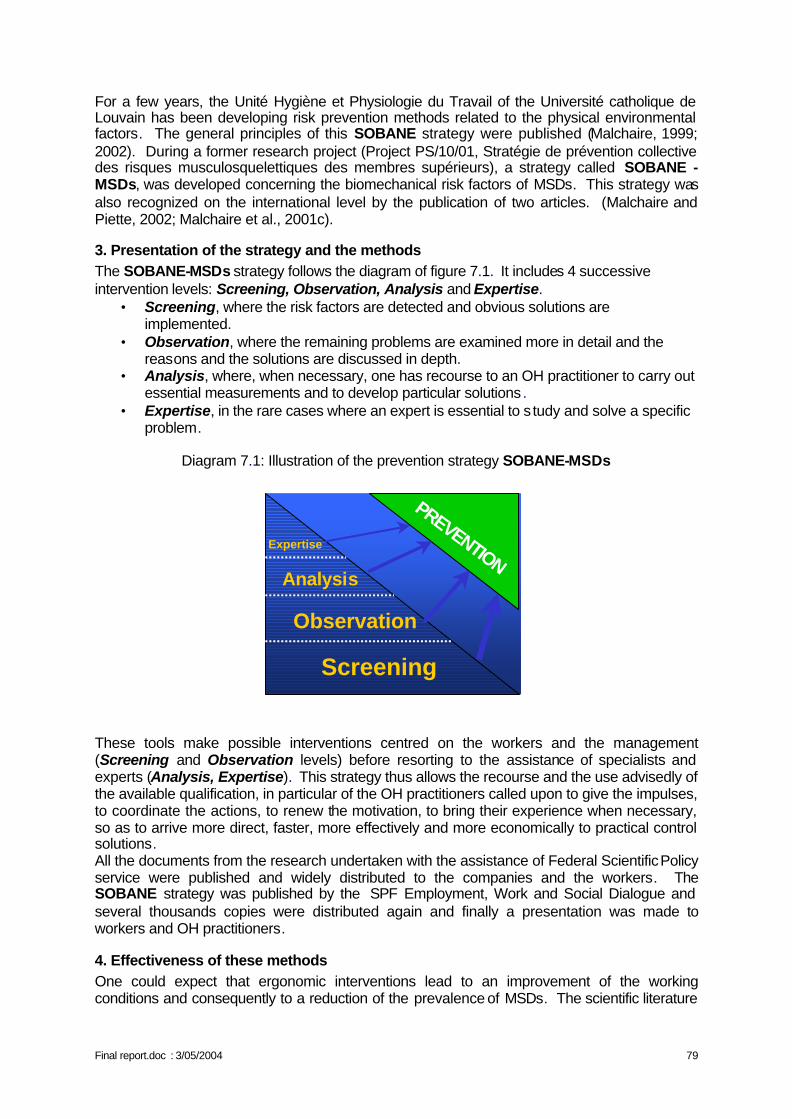
Final report.doc : 3/05/2004 79
For a few years, the Unité Hygiène et Physiologie du Travail of the Université catholique de Louvain has been developing risk prevention methods related to the physical environmental factors. The general principles of this SOBANE strategy were published (Malchaire, 1999; 2002). During a former research project (Project PS/10/01, Stratégie de prévention collective des risques musculosquelettiques des membres supérieurs), a strategy called SOBANE - MSDs, was developed concerning the biomechanical risk factors of MSDs. This strategy was also recognized on the international level by the publication of two articles. (Malchaire and Piette, 2002; Malchaire et al., 2001c).
3. Presentation of the strategy and the methods The SOBANE-MSDs strategy follows the diagram of figure 7.1. It includes 4 successive intervention levels: Screening, Observation, Analysis and Expertise.
• Screening, where the risk factors are detected and obvious solutions are implemented.
• Observation, where the remaining problems are examined more in detail and the reasons and the solutions are discussed in depth.
• Analysis, where, when necessary, one has recourse to an OH practitioner to carry out essential measurements and to develop particular solutions.
• Expertise, in the rare cases where an expert is essential to s tudy and solve a specific problem.
Diagram 7.1: Illustration of the prevention strategy SOBANE-MSDs
Analysis
Expertise
PREVENTION
Screening
Observation
Analysis
Expertise
PREVENTION
Screening
Observation
These tools make possible interventions centred on the workers and the management (Screening and Observation levels) before resorting to the assistance of specialists and experts (Analysis, Expertise). This strategy thus allows the recourse and the use advisedly of the available qualification, in particular of the OH practitioners called upon to give the impulses, to coordinate the actions, to renew the motivation, to bring their experience when necessary, so as to arrive more direct, faster, more effectively and more economically to practical control solutions. All the documents from the research undertaken with the assistance of Federal Scientific Policy service were published and widely distributed to the companies and the workers. The SOBANE strategy was published by the SPF Employment, Work and Social Dialogue and several thousands copies were distributed again and finally a presentation was made to workers and OH practitioners.
4. Effectiveness of these methods One could expect that ergonomic interventions lead to an improvement of the working conditions and consequently to a reduction of the prevalence of MSDs. The scientific literature
Final report.doc : 3/05/2004 80
however shows that many interventions did not have the expected results (Westgaard and Winkel, 1997). The reasons are many:
• The inadequacy of the evaluation methods to identify control measures • The lack of participation of the workers who are not even asked their opinion, so that
control measures are sometimes inappropriate and always badly received. • The fact that these interventions often focus on a particular aspect of the problem, such
as the working tools or the physical factors, ignoring aspects such as the organization of the work system and even more often the psychosocial factors.
5. The broadening of these methods The SOBANE strategy and the methods concerning the MSDs make it possible to avoid the first 2 pitfalls since the discussion with the workers and their technical staff is directed straight towards the search for solutions. However, as a European document underlines it (European agency for safety and health at work, fact 4, 2000): "To bring an effective solution to the risk of MSDs, it is essential to observe with attention the real situation of the workplace, while keeping in mind that the working conditions are related to the specificity of each occupation and to the diversity of the workplaces. All the potential risks must be examined, in particular those which can be generated by a combination of factors " And the document insists on the need for participation and a progressive approach: "The proposed solutions must answer the specific problems of the workplace and must be discussed with the personnel concerned and his representatives . There is no standard approach and when unusual or serious difficulties appear, it can be necessary to call upon an expert. However, many solutions are simple and inexpensive " Whereas, 20 years ago, the productivity of a company still depended on the number of workers employed, at the present time it depends much more on their qualification, their quality, their motivation and their implication. Also, whereas, 20 years ago, the problems were primarily the accidents and the occupational diseases, they are now more and more related to the physical and psychosocial well being of the workers. The goal is to seek flexible, pleasant and technically effective working conditions for the workers and to guarantee in corollary conditions of technical and economic health for the company. The goal is not only to comply with the law and the limits for health, but also to ensure the best possible living conditions in the company, to develop employment conditions more attractive, more stable, more rewarding for the workers and more productive for the companies. This can be done only through an active participation of the workers who become thus the actors and no more the objects of the prevention. The intervention tools discussed above took into consideration until now only the physical factors (forces, postures…) and the work organization. It appears now essential (and it would be an innovation at the scientific level) to develop intervention and management tools integrating the physical and psychosocial aspects . This would at last allow a comprehensive approach where the workers are the actors and make possible an overall improvement of the work situation and a significant reduction of the morbidity associated with the MSDs. The Federal Scientific Policy (FSP) service supported during the last 15 years a significant number of research concerning the psychosocial problems in general and the stress in particular. An overall enhancement of these researches and of the one discussed here would be the broadening of the SOBANE strategy in its various levels, so that it takes into consideration, comprehensively the physical, organisational and psychosocial aspects.
Final report.doc : 3/05/2004 81
6. Training The SOBANE strategy, through the 4 levels, draws the attention to the need for a coordinated action of the various prevention partners, from the worker to the expert. It also underlines the fact that the prevention consists in acting, if only moderately, on a great number of factors: the tools, the workstation, the work allocation, the relations, the possibilities of control…, all the physical and psychosocial workload. These prevention measures must go with training of the workers. Just as for the interventions, many training did not reach their goal because they were stereotyped and inappropriate to the real working conditions. In the study additional to the present report, we describe an approach by video and show its short-term interest. Video recordings are carried out at the workplaces and show behaviours, efforts, postures to avoid or to adopt preferably, with explanations of the risks and the advantages. The return of such methods could only be demonstrated in the short term. Longer studies bearing on more working situations are necessary to determine the long-term advantages, the frequency with which the training and the motivation must be reactivated and the results in terms of reduction of morbidity.
7. Fitness training Other investigations financed by FSP service related to the training criteria to manual handling techniques. They showed the interest of "back schools" for the prevention of recurrence of lumbar problems (Moens et al., 1999-2003). Other studies (Nielens, 2003) and an abundant literature define the criteria for such "back schools". Few studies on the contrary (Kerr et al., 1996; Lasfargues et al., 2003) considered the feasibility of schools for the prevention of MSDs by fitness training, a specific coaching or a warming-up of the muscles and tendons before exposure. Insofar as all the techniques and organisational means are implemented to reduce the risks, and an adequate training to the tasks is organized periodically, an action at the individual level is ethically feasible to reduce the influence of individual factors. It is what we intend to investigate in our work following the present study.
8. Older workers Another alarming aspect raised in the scientific literature, as well as indirectly during our study, concerns the workers who, in spite of heavy physical work constraints, did not develop MSDs and remained at work. Getting older, remaining active professionally, these workers undergo however the chronic effects of their heavy or repetitive work. A European publication (European agency for safety and health at work, facts 3 and 9, 2000) reports that: • "Older workers in Europe report more MSDs problems. For example the EU average for
reports of backache is 30%, for 15-24 year olds it is 25%, for 55 plus it is 35%. Many older workers will have spent more time working in MSDs risky situations. In addition jobs are generally designed for young and healthy male workers"
• "In Finland 31% of the new disability pensioners (early retirements) is due to MSDs. Work-relatedness of MSDs is estimated at one-third. As a consequence around 6,600 working years were lost in 1996 because of work-related MSDs"
• "In Germany (1997) around 70,000 workers took early retirement due to (work-related) MSDs. These are not recognised as occupational diseases. Approximately 25.9% of all early retirements are caused by MSDs."
Any policy aiming at keeping at work these older workers must take account of these chronic effects and of their residual work aptitudes. But this problem remains little investigated and
Final report.doc : 3/05/2004 82
badly known. In particular, must be studied, not the average effects associated with age in the general population, but the interindividual differences and their relationship to the personal life style and the living conditions at work, in their physical, psychic and social dimensions.
II. ENHANCEMENT OF RESEARCH WITH RESPECT TO THE POLITICAL WORLD
The legislative arsenal concerning directly or indirectly the MSDs is rather rich already. It includes:
• Directive 89/391: general framework on the introduction of measures to encourage improvements in the safety and health of workers at work
• Directive 90/269: minimum health and safety requirements for the manual handling of loads
• Directive 90/270: minimum safety and health requirements for work with display screen equipment
• Directive 89/654: minimum safety and health requirements for the workplace • Directive 89/655: minimum safety and health requirement for the use of work
equipment • Directive 89/656: minimum safety and health requirement for the use of personal
protective equipment at the workplace • Directive 98/37: essential health and safety requirements relating to the design and
construction of machinery and safety components • Directive 93/104: directive concerning certain aspects of the organisation of working
time In accordance with the decisions taken in 1988, these directives define the objectives and not the means. Those are defined by a set always growing of CEN standards and in particular by the EN standard "Safety of machinery - human physical Performance". The European approach of the prevention consists with sequentially
• To avoid the MSDs risks • To evaluate the risks that cannot be avoided • To fight the MSDs risks at the source • To adapt work to the individual, in particular the design of the working stations, the
choice of the work equipment and the working and production methods • To take account of the state of development of the technique • To replace the "dangerous" by the "non dangerous" or the " least dangerous" • To develop an overall and coherent prevention policy covering the technological
aspects, the work organization, the working conditions, the social relations and the influence of the factors related to the work environment
• To give the priority to collective protective measures rather than to individual protective measures
• To give appropriate instructions to the workers A report from the European Agency published in 1999 draws up the balance of the actions carried out by the member states with regard to the prevention of MSDs (European agency for safety and health at work, fact 5, 2000). Some member states developed specific policies and plans aiming at reduce the incidence of MSDs of professional origin. These initiatives have various forms, including the following ones:
• Preventive action targeted on specific sectors • Improvement of the systems for the collection of information • Financing of research or specific studies • Production of information material, making of guides…
Final report.doc : 3/05/2004 83
• Reports of medical surveillance • Preparation of action plans and objectives in order to reduce the incidence of MSDs.
In other member states, the prevention of the MSDs seems to be an integral part of the global approach aiming at preventing the occupational hazards and implementing the European legislation. This study reports that in Belgium, an official working group was created in order to study the MSD problem and the possibilities of actions of information for the employers and the employees. No action appears however to have been undertaken since 1999, except for the publication by FSP of the SOBANE methods of Screening, Observation and Analysis described previously and 6 seminars organized in 2002 to inform OH practitioners about the contents of these documents and to illustrate the use of the SOBANE strategy.
Final report.doc : 3/05/2004 84
CHAPTER VIII: CONCLUSION The research does not actually lead to new results:
• It confirms the role of the force for the development of severe wrist complaints. • It does not show any association with the postures and the repetitiveness, probably
because the extreme postures were already prevented and that all the workstations were repetitive.
• It shows an association between the risk in the neck region and the personality parameters and between the risk in the wrist region and the Karasek dimensions. Some of these associations, at first sight, contradict what a small number of studies have suggested.
One of the major difficulties of this type of analysis is to define the independent variables characteristic of the psychological conditions. As underlined at the time of the review of literature (Malchaire et al., 2001a), the methods used differ considerably. Each method seeing the problem under a somewhat different angle and the variables being strongly inter correlated, comparisons become impossible. Standing back from these individual factors, one can however conclude that the models clearly show, on the one hand, the importance of the force for the wrist complaints and, on the other hand, a very significant contribution of characteristics relative to the real-life experience of the work situation. This duality is the most significant element with regard to the prevention and the multi-factor character of MSDs again underlines the need for a global approach – an ergonomic approach – of the working conditions, under all their physical, psychological and social components . Any action of prevention must include:
• a technical part intended to improve the workspaces, the tools, the procedures, so as to eliminate the constraining postures and to reduce the efforts,
• a psychosocial part intended to improve the real-life experience at work, for not only avoiding the MSDs, but improving the well-being, the quality of life,
• a training module, as many operators lack information on the MSDs and on the risk factors. In particular, they lack information on the warning signs of MSDs and the most dangerous positions and movements .
Measurements at the workstation must attempt as much as possible to reach the optimum situation for the workers. This optimum is certainly a relative value, function of the physical, social, psychological characteristics of these workers. Being given the interindividual differences, compromises will be necessary. On this matter, as with regard to the work procedures, the operators are the holders of an irreplaceable knowledge, which they are the only ones able to express. It is thus up to them to define this optimum and to manage these compromises. This management of the psychosocial factors is however not done overnight but is a long process of tests and errors. This process is all the more fast as the workers are trained about the MSDs risk factors as well as the risk factors of discomfort at work. Methodological and pedagogical efforts are necessary to finalize progressive training programmes adapted to the specific conditions of a given company as well as to specify the role that occupational physicians and OH practitioners have to play to facilitate the evolution.
Final report.doc : 3/05/2004 85
CHAPTER IX: REFERENCES
Bernard B.P. (ed.) Musculoskeletal disorders (MSDs) and workplace factors., NIOSH. July, 1997.
Bergqvist U., Wolgast E., Nilsson B.; Voss M., Musculoskeletal disorders among visual display terminal workers: individual, ergonomic, and work organisational factors. Ergonomics, 1995, 38, 763-776.
Bongers P.M., de Winter C.R., Kompier M.A.J., Hildebrandt V.H., Psychosocial factors at work and musculoskeletal disease. Scand. J. Work Environ. Health, 1993, 19, 297-312.
Bonnardel R., Intelligence concrète et psychométrie. Etablissements d'applications psychotechniques, Issy-les-Moulineaux, France, 1983, pp. 187.
Bonnardel R., Les tests d'intelligence concrète (pratique). Etablissements d'applications psychotechniques, Issy-les-Moulineaux, France, 1987, pp. 75.
Borg G., Psychophysical scaling with applications in physical work and the perception of exertion. Scand J. Work Environ Health, 1990, 16, 55-58.
Bortner R. W., A short rating scale as a potential measure of pattern A behaviour. J. Chron. Dis., 1969, 22, 87-91.
Bru E, Mykletun R, Svebak S. Neuroticism, extraversion, anxiety and type A behavior as mediators of neck, shoulder and lower back pain in female hospital staff. Person individ Diff, 1993, 15, 5: 485-492.
Brusco F., Malchaire J., Problèmes musculosquelettiques des membres supérieurs. Facteurs professionnels et extra professionnels.. Cahiers De Médecine Du Travail, 1993, XXX, 4, 181-185.
Buckle P., Devereux J., Work-related neck and upper limb musculoskeletal disorders, report for the European agency for safety and health at work, 1999.
Burdorf A.; van Riel M.; Brand T., Physical load as risk factor for musculoskeletal complaints among tank terminal workers.. Am. Ind. Hyg. Assoc. J., 1997, 58 pp.489-497.
Chiang H.C., Ko Y.C., Chen S.S. and coll., Prevalence of shoulder and upper-limb disorders among workers in the fish-processing industry. Scand. J. Work Environ. Health, 1993, 19, 126-131.
Christis J., ‘Arbeid, organisatie en stress. Een visie vanuit de sociotechnische arbeids- en organisatiekunde’, Universiteit Amsterdam, Het Spinhuis, Amsterdam, 1998, p 9-70.
Cock N., Masset D., Le diagnostic précoce de troubles musculosquelettiques du membre supérieur en médecine du travail. Cahiers de Médecine du Travail, 1994, XXXI, 2: 93-100.
Cock N., Piette A., Malchaire J. Validité de trois tests fonctionnels et sensoriels pour la détection précoce des problèmes musculosquelettiques du poignet et de la main. Revue de Médecine du Travail, 1998, XXV, 2, 63-71.
Final report.doc : 3/05/2004 86
Coetsier P., De Backer G., De Corte W., Gheeraert P., Hellemans C., Karnas G., Kornitzer M., Stam M., Vlerick P., Onderzoeksdesign en instrumentarium van het belgisch jobstress onderzoek – Modèle de recherche et manuel de travail de l'étude belge du stress au travail, Theoretische en Toegepaste Psychologie, N° 6, Infoservice, Deinze, 1996a, 252 paginas.
Coetsier P., De Backer G., De Corte W., Hellemans C., Karnas G., Kornizer M., Pelfrene E., Stam M., Vlerick P., Etude belge du stress au travail: aperçu du modèle de recherche et des outils d'investigation., Psychologie et Psychométrie, 1996b, 17, 4, 17-35.
Costa P., McCrae R., NEO PI-R Professional Manual. FL:PAR (Ed.), Odessa, 1992.
Coste J., Paolaggi J.B., Revue critique de l'épidémiologie des lombalgies. Rev. Epidem. Santé Pub., 1989, 37, 371-383.
Cronqvist L., ‘How MVQCA works: A short introduction to the ideas of the algorithm used in Tosmana’, Marburg University, 2002, http://www.tosmana.net
Cronqvist L., ‘Tosmana – User Manual’, Marburg University, 2003a, http://www.tosmana.net
Cronqvist L., ‘Tosmana - Tool for Small-N Analysis: Version 1.0’, Marburg University, 2003b, http://www.tosmana.net
Cronqvist L., ‘Using Multi-Value Logic Synthesis in Social Science’, Marburg University, 2003c, http://www.tosmana.net
Derriennic F., Touranchet A., Volkoff S. (1990) Etudes sur les salariés âgés de 37 à 52 ans Enquête ESTEV 1990., INSERM. pp.440
Dhondt S., Peeters M.H.H., Middendorp J. & Vaas S., ‘De Weba-methode: Deel 1 Weba-analyse handleiding’, TNO – NIA – Samson Bedrijfsinformatie, Alphen aan den Rijn-Zaventem, 1995, p 9-71.
De Meur G., Rihoux B., ‘L’analyse Quali-Quantitative Comparée (AQQC-QCA)’, ABSPCF, Bruylant-Academia s.a., Louvain-la-Neuve, 2002, p 15-173.
Elo A.L., Leppänen A., Lindström K., Ropponen T., Occupational stress questionnaire: user's instructions (OSQ). Institute of Occupational Health, Helsinki, Finland, 1992, pp. 43.
European agency for safety and health at work, http://osha.eu.int., Work-related musculoskeletal disorders in Europe, fact 3, 2000.
European agency for safety and health at work, http://osha.eu.int , Preventing work-related musculoskeletal disorders, fact 4, 2000.
European agency for safety and health at work, http://osha.eu.int , Work-related neck and upper limb musculoskeletal disorders: Summary of Agency report, fact 5, 2000.
European agency for safety and health at work, http://osha.eu.int , Inventory of socio-economic information about work-related musculoskeletal disorders in the Member States of the European union, fact 9, 2000.
Faverge, J. M., Les styles des étudiants. Psychologica Belgica, 1974, 14, 93-104.
Flodmark T., Aase G., Musculoskeletal symptoms and type A behaviour in blue collar workers. Brit. J. Industr. Med., 1992, 49, 683-687.
Final report.doc : 3/05/2004 87
Fonds des maladies professionnelles, rapport annuel 2002 du fonds des maladies professionnelles. Bruxelles , pp 223.
Forcier, L., & Kuorinka, I. Work-related musculoskeletal disorders: Overview. In W. Karwowski (Ed.), International Encyclopedia of Ergonomics and Human Factors (Vol. III, pp. 1625-1632). London: Taylor & Francis. 2001.
Fransson-Hall C., Byström S., Kilbom A., Self-reported physical exposure and musculoskeletal symptoms of the forearm-hand among automobile assembly-line workers. Occupational And Environmental Medicine, 1995, 37, 9, 1136-1144.
Hagberg M., Silverstein B., Wells R. et coll., Work related musculoskeletal disorders (WMSDs) Areference book for prevention. Taylor & Francis, 1995, pp. 421.
Hansell S.and Mechanic D., Introspectiveness adolescent symptom reporting, Journal of human stress, 1985, 11, 165-176.
Héliövaara M., Knecht P., Aromaa A. , Incidence and risk factors of herniated lumbar intervertebral disc or sciatica leading to hospitalisazation. J. Chron. Dis., 1987, 1, 251-258.
Hellemans C., Karnas G. Différents types de travail perçu dans le secteur tertiaire. Rapports avec le stress perçu et la position dans la hiérarchie. Psychologie du Travail et des Organisations. 1998, 4, 1-2, 27-43.
Hellemans C., Karnas G. Epreuve de validation du modèle de Karasek auprès de travailleurs du secteur tertiaire. Relations du modèle avec les tensions mentales., Revue européenne de psychologie appliquée. 1999, 49, 3, 215-224.
Hoppenfeld S., Hutton R., Examen clinique des membres supérieurs et du rachis. Masson, Paris, 1984, pp. 302.
Houtman I.L.D., Bongers P.M., Smulders P. et al. Psychosocial stressors at work and musculoskeletal problems. Scandinavian Journal of Work, Environment and Health. 1994, 20, 139-145.
Huys R. (1996), ‘Arbeidsorganisatie in een veranderende confectienijverheid. Programma Maatschappelijk Onderzoek van de DWTC (1990-1994)’, DWTC, Brussel, p 3-6.
Huys R., Pollet I., Van Hootegem G. & Wouters L. ‘Bouwen en schaven aan de kwaliteit van de arbeid: een handboek’, HIVA – K.U.Leuven – CCHB, Leuven-Brussel, 1997, p 15-84, 183-251.
Huys R., Van Hootegem G. & Wouters L. ‘Bouwen en schaven aan de kwaliteit van de arbeid: een instrument’, HIVA – K.U.Leuven – CCHB, Leuven-Brussel, 1998, p 7-105.
INRS. Les troubles musculosquelettiques du membre supérieur. Guide pour les préventeurs. Paris: Institut National de Recherche et Sécurité, 1996.
Karasek R., Theorell T., Healthy work: stress, productivity and the reconstruction of working time. Basic Books, New York, 1990.
Karasek R.A. Jr., Job demands, job decision latitude, and mental strain: implications for job redesign. Administrative Science Quarterly, 1979, 24, 285-311.
Karhu O., Kansi P., Kuorinka I., Correcting working postures in industry: a practical method for analysis. Applied Ergonomics, 1977, 8, 4, 199-201.
Final report.doc : 3/05/2004 88
Karnas, G. and Nkombondo, L.,. Analyse de la compatibilité entre styles professionnels et critères d’évaluation du personnel par la méthode des images réciproques, Revue Internationale de Psychologie Appliquée, 1985, 34, 225-239.
Karnas G., Hellemans C. Approche psycho-organisationnelle du stress professionnel : les limites d'un modèle. In : Neboit M. et Vezina M. (Eds.) Stress au travail et santé psychique. Toulouse. Octarès, 2002, pp. 175-188.
Kerr J., Griffiths A., Cox T. Workplace health. Employee fitness and exercise. Issues in occupational health., Taylor & Francis. 1996, 193 pp.
Kuorinka I., Jonsson B., Kilbom A. et coll., Standardised Nordic questionnaires for the analysis of musculoskeletal symptoms. Applied Ergonomics, 1987, 18, 3, 233-237.
Lasfargues G., Roquelaure Y., Fouquet B., Leclerc A., Pathologie d’hypersollicitation périarticulaire des membres supérieurs, Troubles musculo-squelettiques en milieu du travail, Masson, 2003, pp147.
Malchaire J. Pathologie musculosquelettique du membre supérieur., Rapport final, contrat n° HH/10/024. Programme d'impulsion "Risques pour la Santé", Services fédéraux des Affaires scientifiques, techniques et culturelles, 1990-1994.
Malchaire J., Cock N., Piette A., Leao R.D, Lara M, Amaral F., Relationship between work constraints and the development of musculoskeletal disorders of the wrists: A prospective study, Int. J. Indust. Erg., 1997, 19, 471-482.
Malchaire J. Problèmes neurosensoriels liés à l'exposition aux machines vibrantes., Rapport final. Contrat de recherche ST/10/027. Programme d'appui scientifique à la protection des travailleurs en matière de santé, Services du Premier Ministre, Affaires scientifiques, techniques et culturelles. 1998.
Malchaire J. Stratégies d'évaluation et de prévention des risques physiques. Cahiers de Médecine du Travail et Ergonomie. 1999, XXXVI, 4, 205-206
Malchaire J, Roquelaure Y, Cock N, Piette A., Vergracht S.,Chiron H., Variabilité interindividuelle du geste professionnel, Recherche INRS, 2000, pp 66.
Malchaire J., Cock N., Vergracht S. Review of the factors associated with musculoskeletal problems in epidemiological studies. International Archives of Occupational and Environmental Health. 2001a, 74, 2, 79-90.
Malchaire J., Roquelaure Y., Cock N., Piette A., Vergracht S., Chiron H. Musculoskeletal complaints, functional capacity, personality and psychosocial factors. International Archives of Occupational and Environmental Health. 2001b, 74, 549-557.
Malchaire J., Piette A., Cock N. Stratégie de prévention collective des risques musculosquelettiques (TMS). Médecine et Hygiène du Travail & Ergonomie, Volume XXXVIII, N° 4, 147- 156. Médecine et Hygiène du Travail & Ergonomie. 2001c, XXXVIII, N° 4, 147 - 156.
Malchaire J., Piette A., Cock N. Troubles musculosquelettiques du dos et des membres supérieurs (TMS) - Stratégie d'évaluation et de prévention., Ministère fédéral de l'emploi et du Travail. 2001d, 69 pp.
Malchaire J. (2002) Stratégie générale de gestion des risques professionnels Illustration dans le cas des ambiances thermiques au travail. Cahiers de Notes Documentaires, INRS. N° 186 - 1er trimestre.
Final report.doc : 3/05/2004 89
Malchaire J., Piette A. (2002) Co-ordinated strategy of prevention and control of the biomechanical factors associated with the risk of musculoskeletal disorders. Int. Arch. Occup. Environ. Health, Springer. 75, 459-467.
Mathiowetz V., Grip and pinch strength measurements. In: Amundsen L.R. (Ed) Muscle strength testing. Instrumented and non-instrumented systems. Churchill Livingstone, New York, 1990, 163-177.
McCrae R.R., Costa P.T. Validation of the five-factor model of personality across instruments and observers. Journal of Personality and Social Psychology. 1987, 52, 81-90.
Moens G, Mairiaux Ph., Masschelein R, Etude de cohorte des facteurs étiologiques et pronostiques des lombalgies à caractère professionnel, Etude réalisée dans le cadre du programme d’appui scientifique à la protection des travailleurs, 1999-2003.
Nathan PA, Keniston RC, Lockwood RS, Meadows KD., Tobacco, caffeine, alcohol, and carpal tunnel syndrome in a cross-sectional study of 1464 workers. J. Occup. Environ. Med., 1996, 38, 3, 290-298.
Nielens H, Physical capacity evaluation and reconditioning of patients with chronic pain, thesis at the Université catholique de Louvain, Bruxelles, 2003, pp127.
Nordander C., Ohlsson K., Balogh I., Rylander L., Palsson B., Skerfving S. Fish processing work: the impact of two sex dependent exposure profiles on musculoskeletal health. Occupational and Environmental Medicine. 1999, 56, 256-264.
Paoli P. et Merllié D. Troisième enquête européenne sur les conditions de travail 2000 Fondation Européenne pour l’amélioration des conditions de vie et de travail, Dublin. 2001.
Rapport final de la recherche Belstress, en collaboration avec les équipes de la recherche Belstress, ronéo, 1999, 307 pages et annexes.
Roquelaure Y.; Mechali S.; Dano C. et coll., Occupational and personal risk factors for carpal tunnel syndrome in industrial workers. Scand. J. Work Environ. Health, 1997, 23 pp.364-369.
Silverstein B.A., Fine L.J., Armstrong T.J., Hand wrist cumulative trauma disorders in industry. Brit. J. Industr. Med., 1986, 43, 779-784.
Silverstein B.A., Fine L.J., Armstrong T.J., Occupational factors and carpal tunnel syndrome. Am. J. Ind. Med., 1987, 11, 343-358.
Silverstein B.A. and Hughes R.E., Upper extremity musculoskeletal disorders at a pulp and paper mill, Applied Ergonomics, 1996, 27, 3, 189-194.
Silverstein, B. Work-related musculoskeletal disorders: General Issues. In W. Karwowski (Ed.), International Encyclopedia of Ergonomics and Human Factors (Vol. III, pp. 1621-1624). London: Taylor & Francis. 2001.
Sunderland S., The nerve lesion in carpal tunnel syndrome, J. Neurol. Neurosurch. Psychiat, 1976, 39, 615-626.
Swinnen L. La couleur du stress., Editions standaard. 1997, pp. 200.
Vasseljen O.Jr, Westgaard R.H., Larsen S., A case-control study of psychological and psychosocial risk factors for shoulder and neck pain at the workplace. Int. Arch. Occup. Environ. Health, 1995, 66, 375-382.
Final report.doc : 3/05/2004 90
Watson D., Clark L.A., Negative affectivity: the disposition to experience aversive emotional states. Psychological Bulletin, 1984, 96, 465-490.
Watson D., Pennebaker J.W. Health complaints, stress, and distress: exploring the central role of negative affectivity. Psychological Review. 1989, 96, 2, 234-254
Westgaard R.H., Winkel J. Review article. Ergonomic intervention research for improved musculo- skeletal health: a critical review. International Journal of Industrial Ergonomics. 1997, 20, 463-500.
Wieslander G., Norback D., Gothe C.J., et al. Carpal tunnel syndrome and exposure to vibration, repetitive movement and heavy manual work, Br. J. Ind. Med., 1989, 46, 43-47.
http://www.ergodirect.nl/RSI/Risicofactoren, Ergodirect BV
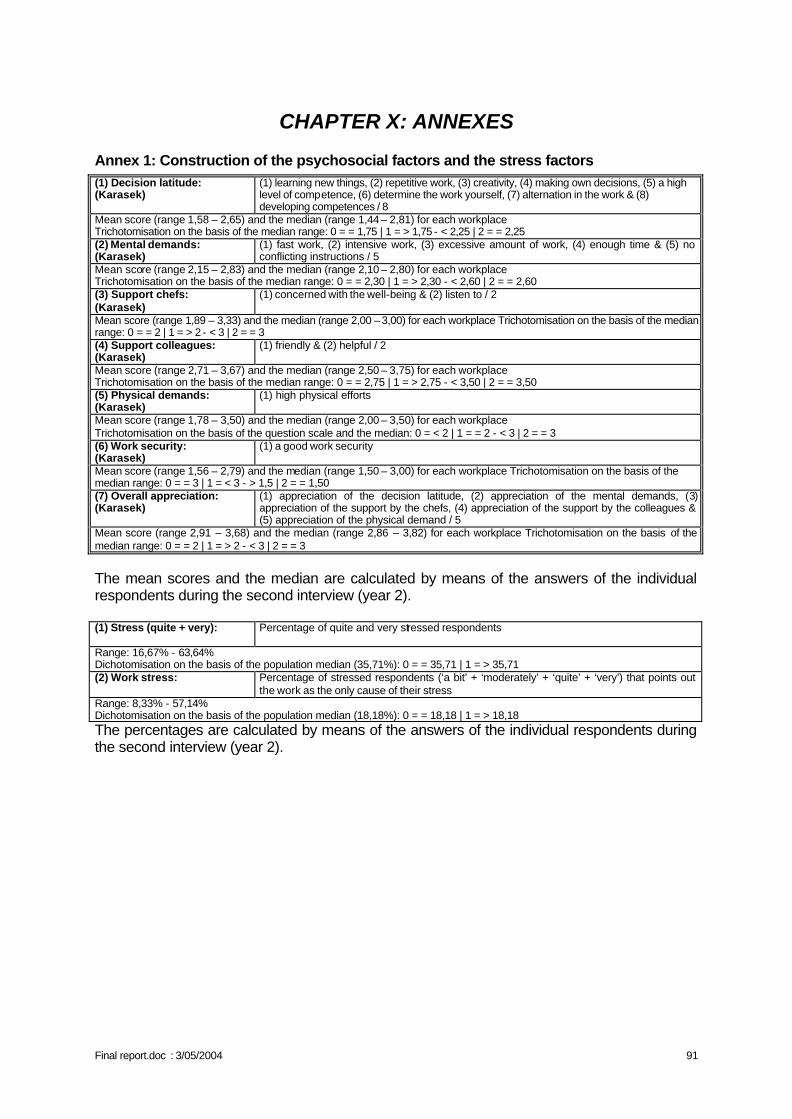
Final report.doc : 3/05/2004 91
CHAPTER X: ANNEXES
Annex 1: Construction of the psychosocial factors and the stress factors (1) Decision latitude: (Karasek)
(1) learning new things, (2) repetitive work, (3) creativity, (4) making own decisions, (5) a high level of competence, (6) determine the work yourself, (7) alternation in the work & (8) developing competences / 8
Mean score (range 1,58 – 2,65) and the median (range 1,44 – 2,81) for each workplace Trichotomisation on the basis of the median range: 0 = = 1,75 | 1 = > 1,75 - < 2,25 | 2 = = 2,25 (2) Mental demands: (Karasek)
(1) fast work, (2) intensive work, (3) excessive amount of work, (4) enough time & (5) no conflicting instructions / 5
Mean score (range 2,15 – 2,83) and the median (range 2,10 – 2,80) for each workplace Trichotomisation on the basis of the median range: 0 = = 2,30 | 1 = > 2,30 - < 2,60 | 2 = = 2,60 (3) Support chefs: (Karasek)
(1) concerned with the well-being & (2) listen to / 2
Mean score (range 1,89 – 3,33) and the median (range 2,00 – 3,00) for each workplace Trichotomisation on the basis of the median range: 0 = = 2 | 1 = > 2 - < 3 | 2 = = 3 (4) Support colleagues: (Karasek)
(1) friendly & (2) helpful / 2
Mean score (range 2,71 – 3,67) and the median (range 2,50 – 3,75) for each workplace Trichotomisation on the basis of the median range: 0 = = 2,75 | 1 = > 2,75 - < 3,50 | 2 = = 3,50 (5) Physical demands: (Karasek)
(1) high physical efforts
Mean score (range 1,78 – 3,50) and the median (range 2,00 – 3,50) for each workplace Trichotomisation on the basis of the question scale and the median: 0 = < 2 | 1 = = 2 - < 3 | 2 = = 3 (6) Work security: (Karasek)
(1) a good work security
Mean score (range 1,56 – 2,79) and the median (range 1,50 – 3,00) for each workplace Trichotomisation on the basis of the median range: 0 = = 3 | 1 = < 3 - > 1,5 | 2 = = 1,50 (7) Overall appreciation: (Karasek)
(1) appreciation of the decision latitude, (2) appreciation of the mental demands, (3) appreciation of the support by the chefs, (4) appreciation of the support by the colleagues & (5) appreciation of the physical demand / 5
Mean score (range 2,91 – 3,68) and the median (range 2,86 – 3,82) for each workplace Trichotomisation on the basis of the median range: 0 = = 2 | 1 = > 2 - < 3 | 2 = = 3
The mean scores and the median are calculated by means of the answers of the individual respondents during the second interview (year 2). (1) Stress (quite + very): Percentage of quite and very stressed respondents
Range: 16,67% - 63,64% Dichotomisation on the basis of the population median (35,71%): 0 = = 35,71 | 1 = > 35,71 (2) Work stress: Percentage of stressed respondents (‘a bit’ + ‘moderately’ + ‘quite’ + ‘very’) that points out
the work as the only cause of their stress Range: 8,33% - 57,14% Dichotomisation on the basis of the population median (18,18%): 0 = = 18,18 | 1 = > 18,18 The percentages are calculated by means of the answers of the individual respondents during the second interview (year 2).

Final report.doc : 3/05/2004 92
Annex 2: Overview of the total configurations
ORGANIZATIONAL
MSD
PSYCHOSOCIAL
STRESS
WORKPLACE
(1) F
ragm
enta
tion
(2) R
epet
itivi
ty
(3) P
ace
pre
ssu
re
(4) I
ndiv
idua
l bre
aks
(5) T
empo
ral a
uton
omy
(6) C
ompl
exity
(7) R
otat
ion
(8) I
nte
rdep
ende
nce
Pro
port
ion
Wri
st
Pro
po
rtio
n N
eck
Dec
isio
n la
titud
e
Men
tal d
eman
ds
Sup
port
che
fs
Sup
port
col
leag
ues
Phy
sica
l dem
ands
Wor
k se
curi
ty
Ove
rall
appr
ecia
tion
Str
ess
(qui
te +
ver
y)
Wor
k st
ress
1 Assembly electronic plates 2 2 2 0 0 0 1 2 1 1 2 1 1 2 1 1 2 1 1 2 Mail sorting 2 2 0 2 2 0 0 0 1 0 0 0 2 0 1 1 2 0 0 3 Shoppers 2 2 1 2 2 0 0 0 1 0 0 2 2 1 2 1 2 0 0 4 Storekeepers 1 2 1 2 2 1 2 0 0 0 1 1 2 1 2 1 2 0 1 6 Vegetable control 2 2 2 0 0 0 0 2 0 0 0 0 2 0 1 2 2 0 0 7 Vegetable fragmentation 1 1 1 1 1 1 1 0 0 0 0 0 2 2 2 1 2 1 0 9 Cashiers 2 2 2 0 0 1 1 2 1 1 1 2 2 1 1 1 2 1 1 10 Repair of wagons 1 1 0 2 2 1 1 1 0 1 1 0 2 0 1 1 2 0 0 11 Riveting of plane undercarriages 1 1 0 2 1 1 2 2 1 0 2 2 1 2 2 0 1 1 1 12 Extrusion lines 0 0 1 1 1 2 2 0 0 0 2 1 2 1 1 1 2 0 1 13 Inspection catalytic converters 1 2 2 1 0 0 1 0 0 1 1 1 1 2 1 1 2 0 0 14 Assembling of concrete iron 2 2 1 2 1 0 0 1 1 0 2 2 1 2 2 1 2 1 1 15 Packing plastic components 2 2 1 1 1 0 1 2 0 0 1 1 2 1 1 0 2 0 1 16 Assembly electronic parts 2 2 1 1 1 0 0 1 1 1 2 1 2 2 2 1 2 1 0 17 Assembly transmission engine 2 2 0 2 2 1 1 1 0 1 1 1 1 1 1 0 2 0 0 18 Packing food containers 2 2 1 0 0 0 0 0 0 1 0 1 2 1 2 1 2 1 0 19 Moulding food containers 1 0 1 2 1 2 0 1 1 1 2 2 2 1 1 1 2 1 1 Dichotomous variables (2 possible values): ‘0’ = less-problematic or low / ‘1’ = problematic or high Trichotomous variables (3 possible values): ‘0’ = low / ‘1’ = medium / ‘2’ = high
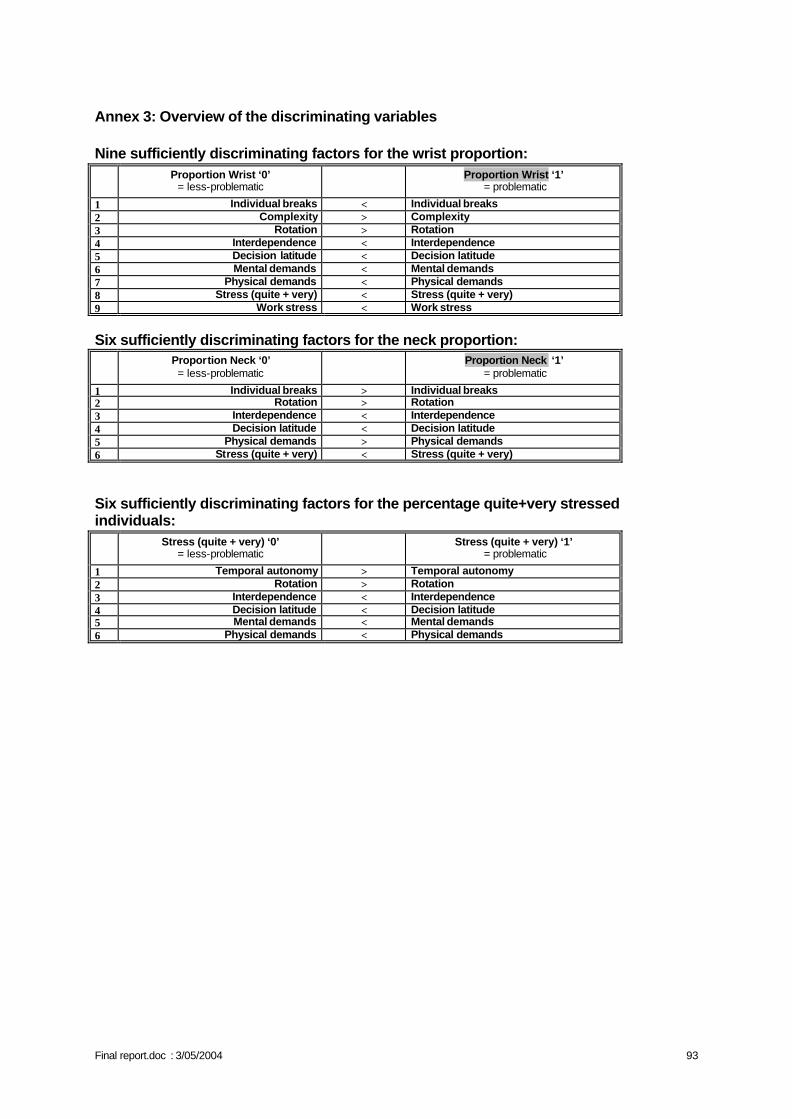
Final report.doc : 3/05/2004 93
Annex 3: Overview of the discriminating variables Nine sufficiently discriminating factors for the wrist proportion:
Proportion Wrist ‘0’
= less-problematic Proportion Wrist ‘1’ = problematic
1 Individual breaks < Individual breaks 2 Complexity > Complexity 3 Rotation > Rotation 4 Interdependence < Interdependence 5 Decision latitude < Decision latitude 6 Mental demands < Mental demands 7 Physical demands < Physical demands 8 Stress (quite + very) < Stress (quite + very) 9 Work stress < Work stress
Six sufficiently discriminating factors for the neck proportion:
Proportion Neck ‘0’ = less-problematic
Proportion Neck ‘1’ = problematic
1 Individual breaks > Individual breaks 2 Rotation > Rotation 3 Interdependence < Interdependence 4 Decision latitude < Decision latitude 5 Physical demands > Physical demands 6 Stress (quite + very) < Stress (quite + very)
Six sufficiently discriminating factors for the percentage quite+very stressed individuals:
Stress (quite + very) ‘0’
= less-problematic Stress (quite + very) ‘1’ = problematic
1 Temporal autonomy > Temporal autonomy 2 Rotation > Rotation 3 Interdependence < Interdependence 4 Decision latitude < Decision latitude 5 Mental demands < Mental demands 6 Physical demands < Physical demands
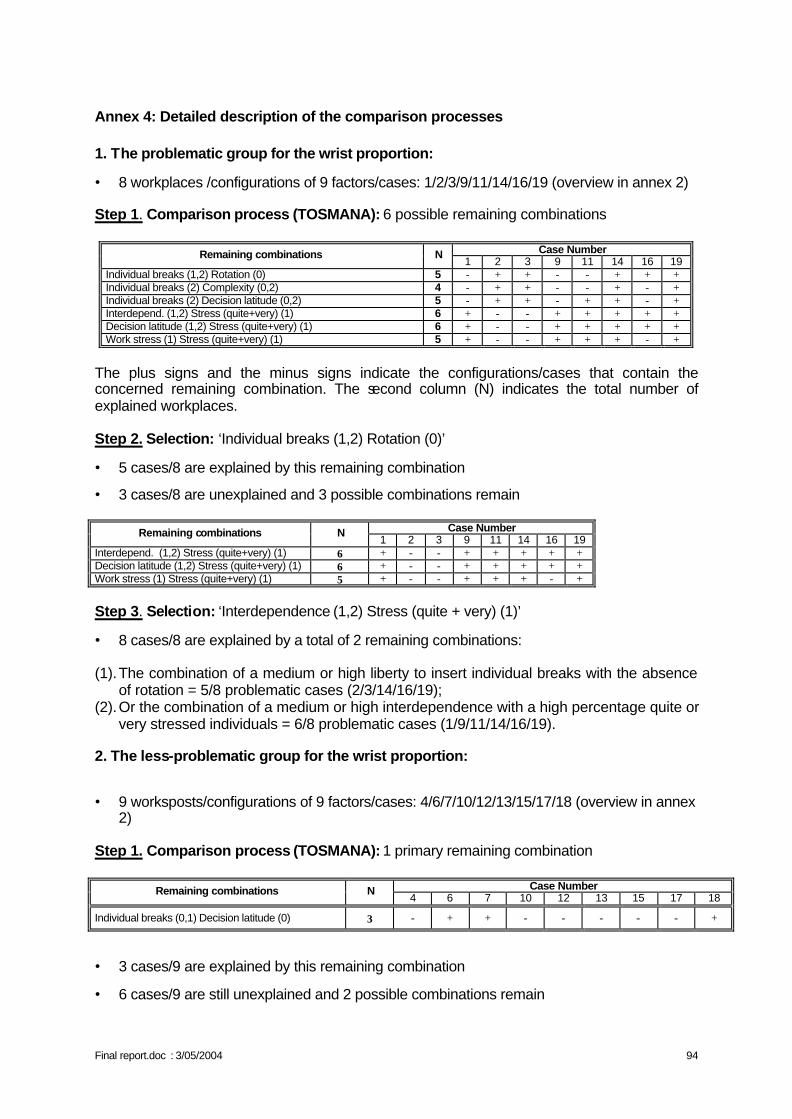
Final report.doc : 3/05/2004 94
Annex 4: Detailed description of the comparison processes 1. The problematic group for the wrist proportion:
• 8 workplaces /configurations of 9 factors/cases: 1/2/3/9/11/14/16/19 (overview in annex 2) Step 1. Comparison process (TOSMANA): 6 possible remaining combinations
Case Number Remaining combinations N 1 2 3 9 11 14 16 19
Individual breaks (1,2) Rotation (0) 5 - + + - - + + + Individual breaks (2) Complexity (0,2) 4 - + + - - + - + Individual breaks (2) Decision latitude (0,2) 5 - + + - + + - + Interdepend. (1,2) Stress (quite+very) (1) 6 + - - + + + + + Decision latitude (1,2) Stress (quite+very) (1) 6 + - - + + + + + Work stress (1) Stress (quite+very) (1) 5 + - - + + + - +
The plus signs and the minus signs indicate the configurations/cases that contain the concerned remaining combination. The second column (N) indicates the total number of explained workplaces. Step 2. Selection: ‘Individual breaks (1,2) Rotation (0)’
• 5 cases/8 are explained by this remaining combination
• 3 cases/8 are unexplained and 3 possible combinations remain
Case Number Remaining combinations N 1 2 3 9 11 14 16 19
Interdepend. (1,2) Stress (quite+very) (1) 6 + - - + + + + + Decision latitude (1,2) Stress (quite+very) (1) 6 + - - + + + + + Work stress (1) Stress (quite+very) (1) 5 + - - + + + - +
Step 3. Selection: ‘Interdependence (1,2) Stress (quite + very) (1)’
• 8 cases/8 are explained by a total of 2 remaining combinations: (1). The combination of a medium or high liberty to insert individual breaks with the absence
of rotation = 5/8 problematic cases (2/3/14/16/19); (2). Or the combination of a medium or high interdependence with a high percentage quite or
very stressed individuals = 6/8 problematic cases (1/9/11/14/16/19). 2. The less-problematic group for the wrist proportion:
• 9 worksposts/configurations of 9 factors/cases: 4/6/7/10/12/13/15/17/18 (overview in annex 2)
Step 1. Comparison process (TOSMANA): 1 primary remaining combination
Case Number Remaining combinations N 4 6 7 10 12 13 15 17 18
Individual breaks (0,1) Decision latitude (0) 3 - + + - - - - - +
• 3 cases/9 are explained by this remaining combination
• 6 cases/9 are still unexplained and 2 possible combinations remain
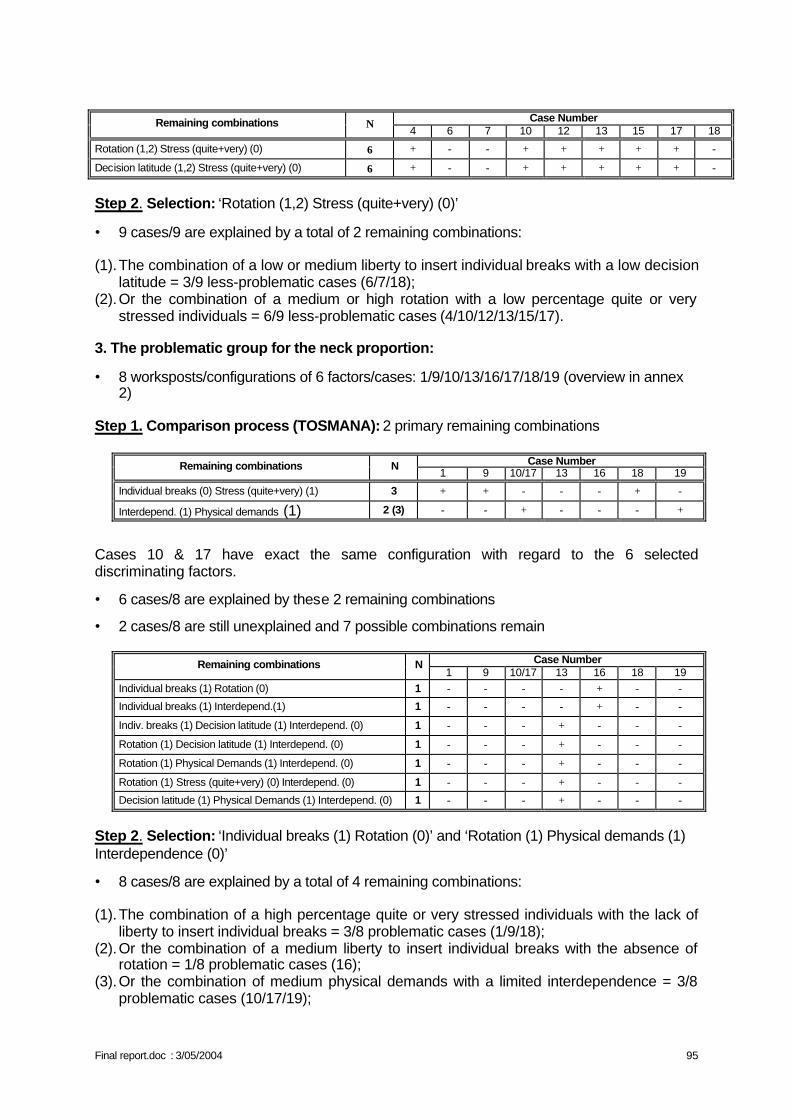
Final report.doc : 3/05/2004 95
Case Number Remaining combinations N
4 6 7 10 12 13 15 17 18
Rotation (1,2) Stress (quite+very) (0) 6 + - - + + + + + -
Decision latitude (1,2) Stress (quite+very) (0) 6 + - - + + + + + -
Step 2. Selection: ‘Rotation (1,2) Stress (quite+very) (0)’
• 9 cases/9 are explained by a total of 2 remaining combinations: (1). The combination of a low or medium liberty to insert individual breaks with a low decision
latitude = 3/9 less-problematic cases (6/7/18); (2). Or the combination of a medium or high rotation with a low percentage quite or very
stressed individuals = 6/9 less-problematic cases (4/10/12/13/15/17). 3. The problematic group for the neck proportion:
• 8 worksposts/configurations of 6 factors/cases: 1/9/10/13/16/17/18/19 (overview in annex 2)
Step 1. Comparison process (TOSMANA): 2 primary remaining combinations
Case Number Remaining combinations N 1 9 10/17 13 16 18 19
Individual breaks (0) Stress (quite+very) (1) 3 + + - - - + -
Interdepend. (1) Physical demands (1) 2 (3) - - + - - - +
Cases 10 & 17 have exact the same configuration with regard to the 6 selected discriminating factors.
• 6 cases/8 are explained by these 2 remaining combinations
• 2 cases/8 are still unexplained and 7 possible combinations remain
Case Number Remaining combinations N 1 9 10/17 13 16 18 19
Individual breaks (1) Rotation (0) 1 - - - - + - -
Individual breaks (1) Interdepend.(1) 1 - - - - + - -
Indiv. breaks (1) Decision latitude (1) Interdepend. (0) 1 - - - + - - -
Rotation (1) Decision latitude (1) Interdepend. (0) 1 - - - + - - -
Rotation (1) Physical Demands (1) Interdepend. (0) 1 - - - + - - -
Rotation (1) Stress (quite+very) (0) Interdepend. (0) 1 - - - + - - -
Decision latitude (1) Physical Demands (1) Interdepend. (0) 1 - - - + - - -
Step 2. Selection: ‘Individual breaks (1) Rotation (0)’ and ‘Rotation (1) Physical demands (1) Interdependence (0)’
• 8 cases/8 are explained by a total of 4 remaining combinations: (1). The combination of a high percentage quite or very stressed individuals with the lack of
liberty to insert individual breaks = 3/8 problematic cases (1/9/18); (2). Or the combination of a medium liberty to insert individual breaks with the absence of
rotation = 1/8 problematic cases (16); (3). Or the combination of medium physical demands with a limited interdependence = 3/8
problematic cases (10/17/19);
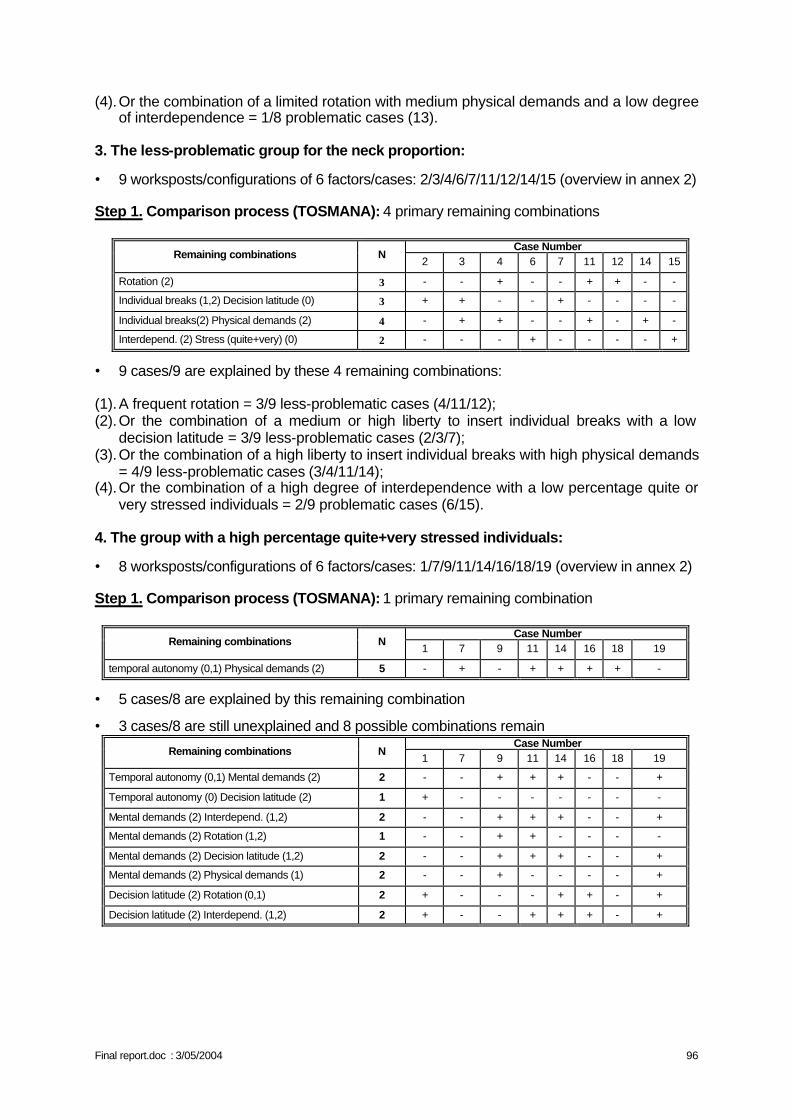
Final report.doc : 3/05/2004 96
(4). Or the combination of a limited rotation with medium physical demands and a low degree of interdependence = 1/8 problematic cases (13).
3. The less-problematic group for the neck proportion:
• 9 worksposts/configurations of 6 factors/cases: 2/3/4/6/7/11/12/14/15 (overview in annex 2)
Step 1. Comparison process (TOSMANA): 4 primary remaining combinations
Case Number Remaining combinations N
2 3 4 6 7 11 12 14 15
Rotation (2) 3 - - + - - + + - -
Individual breaks (1,2) Decision latitude (0) 3 + + - - + - - - -
Individual breaks(2) Physical demands (2) 4 - + + - - + - + -
Interdepend. (2) Stress (quite+very) (0) 2 - - - + - - - - +
• 9 cases/9 are explained by these 4 remaining combinations: (1). A frequent rotation = 3/9 less-problematic cases (4/11/12); (2). Or the combination of a medium or high liberty to insert individual breaks with a low
decision latitude = 3/9 less-problematic cases (2/3/7); (3). Or the combination of a high liberty to insert individual breaks with high physical demands
= 4/9 less-problematic cases (3/4/11/14); (4). Or the combination of a high degree of interdependence with a low percentage quite or
very stressed individuals = 2/9 problematic cases (6/15). 4. The group with a high percentage quite+very stressed individuals:
• 8 worksposts/configurations of 6 factors/cases: 1/7/9/11/14/16/18/19 (overview in annex 2)
Step 1. Comparison process (TOSMANA): 1 primary remaining combination
Case Number Remaining combinations N
1 7 9 11 14 16 18 19
temporal autonomy (0,1) Physical demands (2) 5 - + - + + + + -
• 5 cases/8 are explained by this remaining combination
• 3 cases/8 are still unexplained and 8 possible combinations remain Case Number
Remaining combinations N 1 7 9 11 14 16 18 19
Temporal autonomy (0,1) Mental demands (2) 2 - - + + + - - +
Temporal autonomy (0) Decision latitude (2) 1 + - - - - - - -
Mental demands (2) Interdepend. (1,2) 2 - - + + + - - +
Mental demands (2) Rotation (1,2) 1 - - + + - - - -
Mental demands (2) Decision latitude (1,2) 2 - - + + + - - +
Mental demands (2) Physical demands (1) 2 - - + - - - - +
Decision latitude (2) Rotation (0,1) 2 + - - - + + - +
Decision latitude (2) Interdepend. (1,2) 2 + - - + + + - +
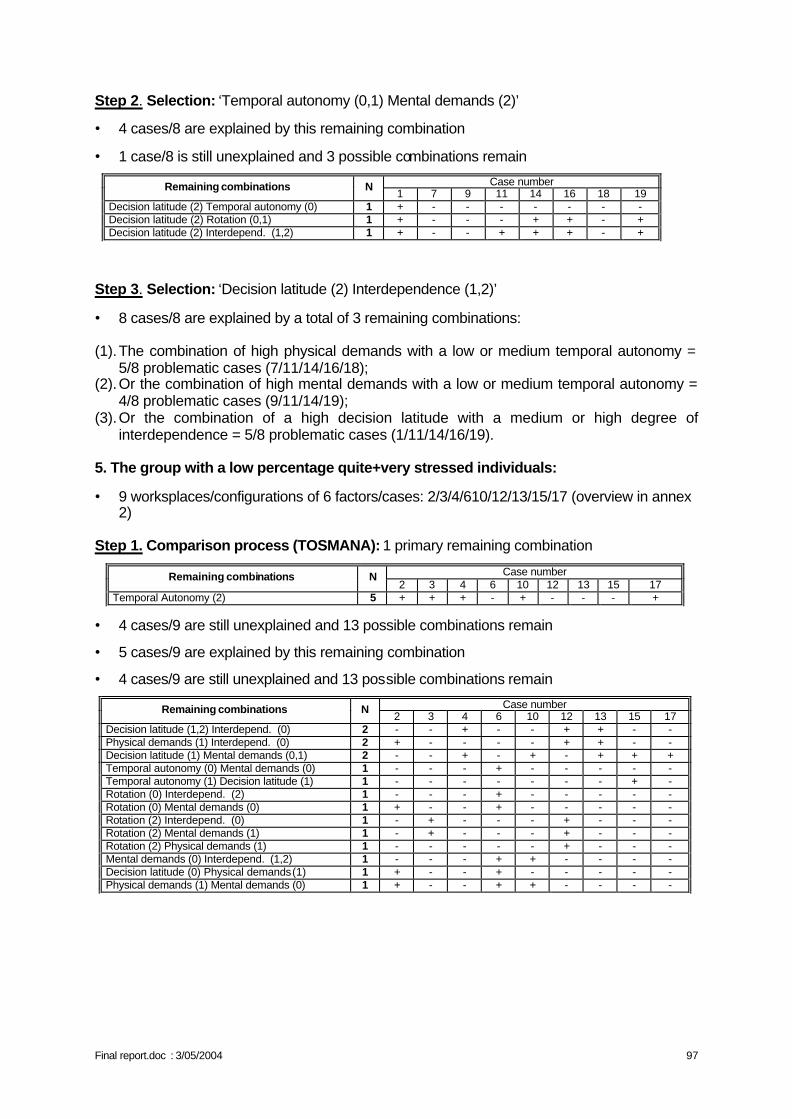
Final report.doc : 3/05/2004 97
Step 2. Selection: ‘Temporal autonomy (0,1) Mental demands (2)’
• 4 cases/8 are explained by this remaining combination
• 1 case/8 is still unexplained and 3 possible combinations remain
Step 3. Selection: ‘Decision latitude (2) Interdependence (1,2)’
• 8 cases/8 are explained by a total of 3 remaining combinations: (1). The combination of high physical demands with a low or medium temporal autonomy =
5/8 problematic cases (7/11/14/16/18); (2). Or the combination of high mental demands with a low or medium temporal autonomy =
4/8 problematic cases (9/11/14/19); (3). Or the combination of a high decision latitude with a medium or high degree of
interdependence = 5/8 problematic cases (1/11/14/16/19). 5. The group with a low percentage quite+very stressed individuals:
• 9 worksplaces/configurations of 6 factors/cases: 2/3/4/610/12/13/15/17 (overview in annex 2)
Step 1. Comparison process (TOSMANA): 1 primary remaining combination
• 4 cases/9 are still unexplained and 13 possible combinations remain
• 5 cases/9 are explained by this remaining combination
• 4 cases/9 are still unexplained and 13 possible combinations remain
Case number Remaining combinations N 1 7 9 11 14 16 18 19
Decision latitude (2) Temporal autonomy (0) 1 + - - - - - - - Decision latitude (2) Rotation (0,1) 1 + - - - + + - + Decision latitude (2) Interdepend. (1,2) 1 + - - + + + - +
Case number Remaining combinations N 2 3 4 6 10 12 13 15 17
Temporal Autonomy (2) 5 + + + - + - - - +
Case number Remaining combinations N 2 3 4 6 10 12 13 15 17
Decision latitude (1,2) Interdepend. (0) 2 - - + - - + + - - Physical demands (1) Interdepend. (0) 2 + - - - - + + - - Decision latitude (1) Mental demands (0,1) 2 - - + - + - + + + Temporal autonomy (0) Mental demands (0) 1 - - - + - - - - - Temporal autonomy (1) Decision latitude (1) 1 - - - - - - - + - Rotation (0) Interdepend. (2) 1 - - - + - - - - - Rotation (0) Mental demands (0) 1 + - - + - - - - - Rotation (2) Interdepend. (0) 1 - + - - - + - - - Rotation (2) Mental demands (1) 1 - + - - - + - - - Rotation (2) Physical demands (1) 1 - - - - - + - - - Mental demands (0) Interdepend. (1,2) 1 - - - + + - - - - Decision latitude (0) Physical demands (1) 1 + - - + - - - - - Physical demands (1) Mental demands (0) 1 + - - + + - - - -
Final report.doc : 3/05/2004 98
Step 2. Selection: ‘Decision latitude (1,2) Interdependence (0)’, ‘Decision latitude (1) Mental demands (0,1)’ and ‘Physical demands (1) Mental demands (0)’
• 9 cases/9 are explained by a total of 4 remaining combinations: (1). A high degree of temporal autonomy = 5/9 less-problematic cases (2/3/4/10/17); (2). Or the combination of a medium or high decision latitude with a low degree of
interdependence = 3/9 less-problematic cases (4/12/13); (3). Or the combination of a medium decision latitude with low or medium mental demands =
5/9 less-problematic cases (4/10/13/15/17); (4). Or the combination of medium physical demands with low mental demands = 3/9 less-
problematic cases (2/6/10).
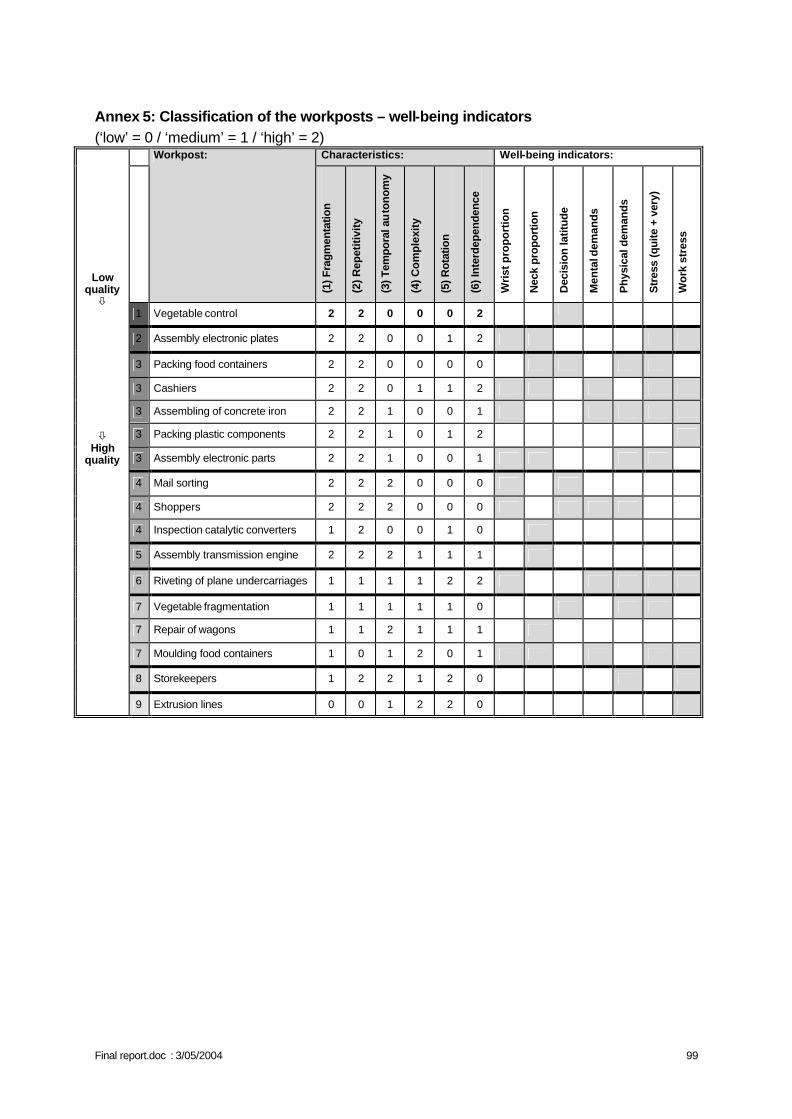
Final report.doc : 3/05/2004 99
Annex 5: Classification of the workposts – well-being indicators (‘low’ = 0 / ‘medium’ = 1 / ‘high’ = 2)
Characteristics: Well-being indicators:
Workpost:
(1) F
ragm
enta
tion
(2) R
epet
itivi
ty
(3) T
empo
ral a
uto
nom
y
(4) C
ompl
exity
(5) R
otat
ion
(6) I
nter
depe
nden
ce
Wri
st p
ropo
rtio
n
Nec
k pr
opor
tion
Dec
isio
n la
titud
e
Men
tal d
eman
ds
Phy
sica
l dem
ands
Str
ess
(qui
te +
ver
y)
Wor
k st
ress
1 Vegetable control 2 2 0 0 0 2
2 Assembly electronic plates 2 2 0 0 1 2
3 Packing food containers 2 2 0 0 0 0
3 Cashiers 2 2 0 1 1 2
3 Assembling of concrete iron 2 2 1 0 0 1
3 Packing plastic components 2 2 1 0 1 2
3 Assembly electronic parts 2 2 1 0 0 1
4 Mail sorting 2 2 2 0 0 0
4 Shoppers 2 2 2 0 0 0
4 Inspection catalytic converters 1 2 0 0 1 0
5 Assembly transmission engine 2 2 2 1 1 1
6 Riveting of plane undercarriages 1 1 1 1 2 2
7 Vegetable fragmentation 1 1 1 1 1 0
7 Repair of wagons 1 1 2 1 1 1
7 Moulding food containers 1 0 1 2 0 1
8 Storekeepers 1 2 2 1 2 0
Low quality ò ò
High quality
9 Extrusion lines 0 0 1 2 2 0
D/2004/1191/7 Published by the Belgian Science Policy For more informations: Madame E. Bourgeois Belgian Science Policy rue de la science 8 Wetenschapstraat Bruxelles 1000 Brussel Tel.: +32-2-238.34.94 Fax.: +32-2-230.59.12 E-mail: [email protected] Internet: http://www.belspo.be LEGAL NOTICE Neither the Belgian Science Policy nor any person acting on behalf of the Belgian Science Policy is responsible for the use which might be made of the following information. No part of this publication may be reproduced, stored in a retrieval system, or transmitted in any form or by any means, electronic, mechanical, photocopying, recording, or otherwise, without indicating the reference.