Embed Size (px)
Citation preview
RESEARCH ARTICLE Open Access
Impact of early psychosocial factors (childhoodsocioeconomic factors and adversities) on futurerisk of type 2 diabetes, metabolic disturbancesand obesity: a systematic reviewTeresa Tamayo1*, Christian Herder2, Wolfgang Rathmann1
Abstract
Background: Psychological factors and socioeconomic status (SES) have a notable impact on health disparities,including type 2 diabetes risk. However, the link between childhood psychosocial factors, such as childhoodadversities or parental SES, and metabolic disturbances is less well established. In addition, the lifetime perspectiveincluding adult socioeconomic factors remains of further interest.We carried out a systematic review with the main question if there is evidence in population- or community-basedstudies that childhood adversities (like neglect, traumata and deprivation) have considerable impact on type 2 dia-betes incidence and other metabolic disturbances. Also, parental SES was included in the search as risk factor forboth, diabetes and adverse childhood experiences. Finally, we assumed that obesity might be a mediator for theassociation of childhood adversities with diabetes incidence. Therefore, we carried out a second review on obesity,applying a similar search strategy.
Methods: Two systematic reviews were carried out. Longitudinal, population- or community-based studies wereincluded if they contained data on psychosocial factors in childhood and either diabetes incidence or obesity risk.
Results: We included ten studies comprising a total of 200,381 individuals. Eight out of ten studies indicated thatlow parental status was associated with type 2 diabetes incidence or the development of metabolic abnormalities.Adjustment for adult SES and obesity tended to attenuate the childhood SES-attributable risk but the associationremained. For obesity, eleven studies were included with a total sample size of 70,420 participants. Four out ofeleven studies observed an independent association of low childhood SES on the risk for overweight and obesitylater in life.
Conclusions: Taken together, there is evidence that childhood SES is associated with type 2 diabetes and obesityin later life. The database on the role of psychological factors such as traumata and childhood adversities for thefuture risk of type 2 diabetes or obesity is too small to draw conclusions. Thus, more population-based longitudinalstudies and international standards to assess psychosocial factors are needed to clarify the mechanisms leading tothe observed health disparities.
BackgroundIn adults, adverse psychosocial factors such as lowsocioeconomic status (SES), deprivation and traumatahave been shown to be associated with type 2 diabetes
[1], obesity [2-5], cardiovascular disease [6,7], andunhealthy lifestyle habits [8-11]. A lower social status isrelated to higher stress levels [12] and poor living condi-tions [13], which may partly explain these associations.Health disparities can be observed fairly early withlower birth weights, an earlier adiposity rebound andhigher rates of infant mortality in the low SES groups[14-16].
* Correspondence: [email protected] of Biometrics and Epidemiology, German Diabetes Center, LeibnizCenter for Diabetes Research at Heinrich-Heine-University, Düsseldorf,GermanyFull list of author information is available at the end of the article
Tamayo et al. BMC Public Health 2010, 10:525http://www.biomedcentral.com/1471-2458/10/525
© 2010 Tamayo et al; licensee BioMed Central Ltd. This is an Open Access article distributed under the terms of the Creative CommonsAttribution License (http://creativecommons.org/licenses/by/2.0), which permits unrestricted use, distribution, and reproduction inany medium, provided the original work is properly cited.
Data on the association of type 2 diabetes and adversechildhood circumstances is more limited [17]. In twocross-sectional analyses there was evidence that adversesocial conditions in childhood are independently asso-ciated with an increased risk of metabolic impairmentsand insulin resistance [18,19]. In a Swedish population-based study, Agardh et al. found low parental education,low family household income and low parental occupa-tional position to be associated with a more than two-fold increased diabetes risk in adulthood, which wasattenuated after accounting for adult socioeconomic fac-tors [20].Thus, the primary aim of this review was to evaluate
the risk of psychosocial factors on type 2 diabetes inci-dence and the role of change in socioeconomic condi-tions throughout life on the basis of population-basedand longitudinal studies. As several factors of childhoodenvironment are closely related and interact with eachother [21], we aimed not only to address the relation-ship of childhood socioeconomic status (CSES) with dia-betes incidence, but to investigate a broad range ofpsychosocial factors. Furthermore, obesity was includedas it is considered a key factor for diabetes incidence inyouth and as it is also influenced by SES [22]. Since afirst comprehensive review [23] on the inverse relation-ship between SES and obesity in developed countries,these early results have been substantiated in furthersystematic reviews [2,4]. We included obesity as end-point in our review and concentrated on longitudinaland population-based studies with particular focus onthe analysis of change in weight status and psychosocialcircumstances.
MethodsSearch criteriaWe searched Medline in July 2008 and carried out anupdate of the search in April 2010 applying the searchalgorithm “(diabetes or insulin resistance or prediabetesor metabolic syndrome) and (SES or social or socioeco-nomic or psychosocial or income or working status ormigration or community or adversities or deprivation ordepression or abuse or high risk family or hostility)”.For obesity a search in Medline was carried out in
November 2008 (updated in April 2010) using the algo-rithm” (obesity or overweight) and (socioeconomic orsocial or deprivation or adversities or childhood socioe-conomic or family environment or early life or youth orchildhood adversities or deprivation) and (longitudinalor prospective or cohort)”.Both searches were limited to publications after 31
December 1994 in English language. During the 1990 s,the diabetes criteria were changed several times, whichcomplicates comparison with earlier publications.
Inclusion and exclusion criteriaStudies were included if incident cases of type 2 diabeteswere assessed. Cross-sectional studies with data on dia-betes prevalence only were excluded. Only population-or community-based studies were included to have amore homogeneous database for this review. Furtheroutcome criteria were insulin resistance, elevatedHbA1c values, and the metabolic syndrome becausethey share risk factors and pathophysiological pathwayswith type 2 diabetes. Obesity and overweight are consid-ered key risk factors for type 2 diabetes incidence espe-cially in youth, and were furthermore included asoutcome parameters, but were analysed separately.
Risk factor specification: Childhood psychosocial factorsStudies on incident type 2 diabetes or obesity wereincluded if they contained data on psychosocial factorsincluding a wide range of indicators reflecting the socialand psychological conditions under which the partici-pants grew up:(1) basic indicators of CSES: parental education; par-
ental occupation and family income as indicators of eco-nomic wealth and stability;(2) further indicators of wealth and deprivation: public
housing, housing conditions, house ownership,unemployment;(3) the high-risk family concept (adverse childhood
experiences) regarding neglect, abuse and householddysfunction [24];(4) indicators of impaired psychological health in chil-
dren such as depression or anxiety;(5) indicators of the ability to cope with stressful con-
ditions like coping skills or sense of control [25];(6) indicators of possibly stressful situations: migra-
tion, parental stress (e.g. stressful working conditions orparenting stress which are supposed to have implica-tions for children’s stress as well);(7) neighbourhood deprivation indexes as indicator for
the aggregation of unfavourable circumstances clusteredin residential areas. These indexes are based on thesocial composition of neighbourhoods regarding forexample the social status of its habitants, housing andstreet conditions, mean household sizes per person andother indicators of wealth such as mean householdnumber of cars [26,27].Studies were excluded if information on obesity and
overweight was only available at one time point and noadjustment for previous weight status was done. Studies,which only included type 1 diabetes were also excluded.Self-reported diabetes type may not offer a reliable dis-tinction between the diabetes mellitus types. However,self-reported diabetes type was found in most studiesand as type 1 diabetes contributes to a fairly small
Tamayo et al. BMC Public Health 2010, 10:525http://www.biomedcentral.com/1471-2458/10/525
Page 2 of 15
proportion of the total number of diabetes cases weaccepted self-reported diabetes type for the assessmentof type 2 diabetes incidence.
Data extraction and quality managementEligible studies were assessed by one reviewer (T. T.)and discussed with a second reviewer (W. R.). The finallist of variables extracted from the selected studies con-tained the first author, publication year, country wherethe study was carried out, cohort size, study duration,age characteristics of participants, measurement of riskfactors, definition of diabetes/obesity variables and abrief description of results including effect size. Formissing information we contacted some of the authorsof the selected studies. Any disagreements regardingnumbers, study inclusion, and further analysis wereresolved by consensus between the authors (T.T., C.H.,W.R.).
Analysis and quality assessmentWe restricted the analysis to descriptive measuresbecause of the lack of statistical comparability for moststudies. Effect sizes extracted from the publicationsreflect adjusted results for odds ratio (OR), hazard ratio(HR) and relative risk (RR) regarding confounding (1)for age, sex, BMI, physical activity, smoking and alcohol(for type 2 diabetes incidence) or (2) for birth weightand adult SES (for obesity and overweight). We devel-oped a 5 item quality scale adapted to our purpose withreference to methodological recommendations of theMeta-analysis Of Observational Studies in Epidemiology(MOOSE) group [28,29]. The sum score derived fromthis scale mainly had to reflect the study design, theexamined outcome parameters, the risk factor construc-tion and the control for confounders. Quality wasjudged taking into account the current state of researchon type 2 diabetes and obesity and possible sources ofbias. The following criteria were included into the qual-ity score for the (1) diabetes and (2) obesity studies:• (1&2) Study Duration (D): Highest quality was con-
sidered to be obtained from birth cohorts (D = 1) as thefuture diabetes and obesity risk is influenced strongly byvery early health indicators such as birth weight andgestational age. Furthermore, especially in childhoodbody composition and metabolic functioning vary in dif-ferent age groups, so that homogeneous age groups asaccomplished by birth cohort studies offer another qual-ity advantage [30,31].• (1&2) Recruitment (R): Our inclusion criteria com-
prised only studies from which a high grade of represen-tativeness and reproducibility was expected. To furtherassess the quality of recruitment in the score, popula-tion-based or school-based studies with characteristicsof a census were rated as of highest quality (R = 1).
• (1&2) Explanatory variables/risk factor specification(E): We expected a source of bias from retrospectivelyassessed childhood psychosocial factors in the offspring(E = 0). In case parents gave direct information on theiroccupational, educational and financial situationwe rated the quality of risk factor construction as high(E = 1).• (1) Outcome parameter diabetes: Highest evidence
was expected from blood glucose measurements withinternationally valid cut off-levels as defined by theAmerican Diabetes Association or WHO (O = 1) [32].Self-reported diabetes leads to an underestimation oftype 2 diabetes cases due to a high number of undiag-nosed cases [33,34]. Therefore, we considered thequality based on self-report as low (O = 0). The plasma-based measure of insulin resistance (HOMA-IR calcu-lated from fasting glucose and insulin levels) is closelyrelated to (pre)diabetes. Thus, evidence from HOMA-IR-based data were considered as high (O = 1).Although HbA1c has been suggested as diagnostic toolfor type 2 diabetes (ADA 2010), especially in early dia-betes and in prediabetes, HbA1c values lead to misinter-pretation which may be also due to a geneticcomponent in the metabolisation of glycated haemoglo-bin [35-39]. Thus, we rated the quality of HbA1c valuesas low (O = 0). Metabolic syndrome and type 2 diabetesshare some risk factors, but are too different as entitiesto include the metabolic syndrome as surrogate for type2 diabetes. We allowed for the term ‘metabolic’ duringMedline search, but rated metabolic syndrome as out-come criteria of low evidence for our study question(O = 0).• (2) Outcome parameter obesity (O): First, measured
weight and height to calculate BMI met our qualitydemands. Self-reported weight and height on the otherhand have been reported to be imprecise in adults andin parents reporting anthropometric data of their chil-dren. Standard cut-off values for overweight and obesityserved as second indicator for high quality: In childrenoverweight and obesity are defined based on the age andsex-specific 85th and 95th BMI percentiles in growthcharts from the National Health and Nutrition Examina-tion Survey (NHANES), the Centers for Disease Controland Prevention (CDC) or the International ObesityTaskforce (IOTF), whereas in adults cut-off values forBMI ≥ 25 kg/m² for overweight and ≥ 30 kg/m² for obe-sity were used. The highest score (O = 1) was given onlyif both criteria were fulfilled.• (1&2) Confounding (C): Quality of adjustment for
confounders was inferred from important behaviouralpathways leading to type 2 diabetes. Adjustment of age,sex, BMI, smoking, physical activity and alcohol con-sumption was required for the highest quality score(C = 1). Adjustment for obesity in the extracted studies
Tamayo et al. BMC Public Health 2010, 10:525http://www.biomedcentral.com/1471-2458/10/525
Page 3 of 15
was heterogeneous and depended highly on the studyquestion. According to the basic requirements for ourreview question a high study quality (O = 1) demandedat least control for birth weight or baseline BMI to havepossible weight change considered and the adjustmentfor adult SES to control SES change throughout life.
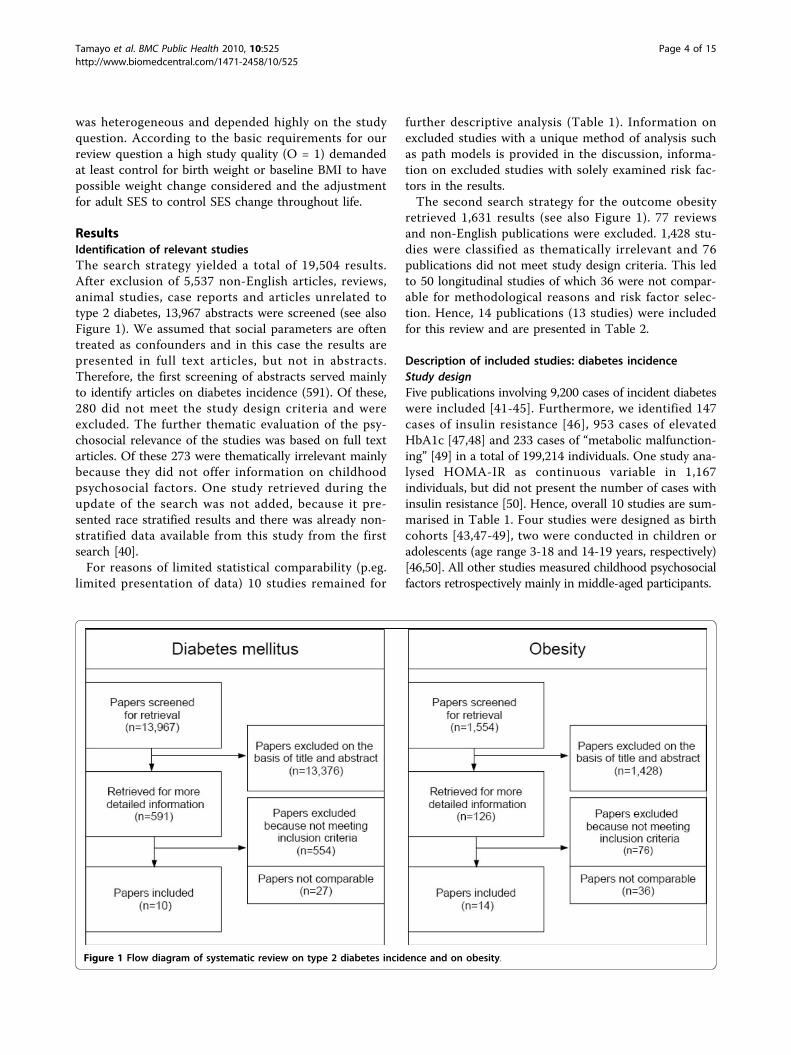
ResultsIdentification of relevant studiesThe search strategy yielded a total of 19,504 results.After exclusion of 5,537 non-English articles, reviews,animal studies, case reports and articles unrelated totype 2 diabetes, 13,967 abstracts were screened (see alsoFigure 1). We assumed that social parameters are oftentreated as confounders and in this case the results arepresented in full text articles, but not in abstracts.Therefore, the first screening of abstracts served mainlyto identify articles on diabetes incidence (591). Of these,280 did not meet the study design criteria and wereexcluded. The further thematic evaluation of the psy-chosocial relevance of the studies was based on full textarticles. Of these 273 were thematically irrelevant mainlybecause they did not offer information on childhoodpsychosocial factors. One study retrieved during theupdate of the search was not added, because it pre-sented race stratified results and there was already non-stratified data available from this study from the firstsearch [40].For reasons of limited statistical comparability (p.eg.
limited presentation of data) 10 studies remained for
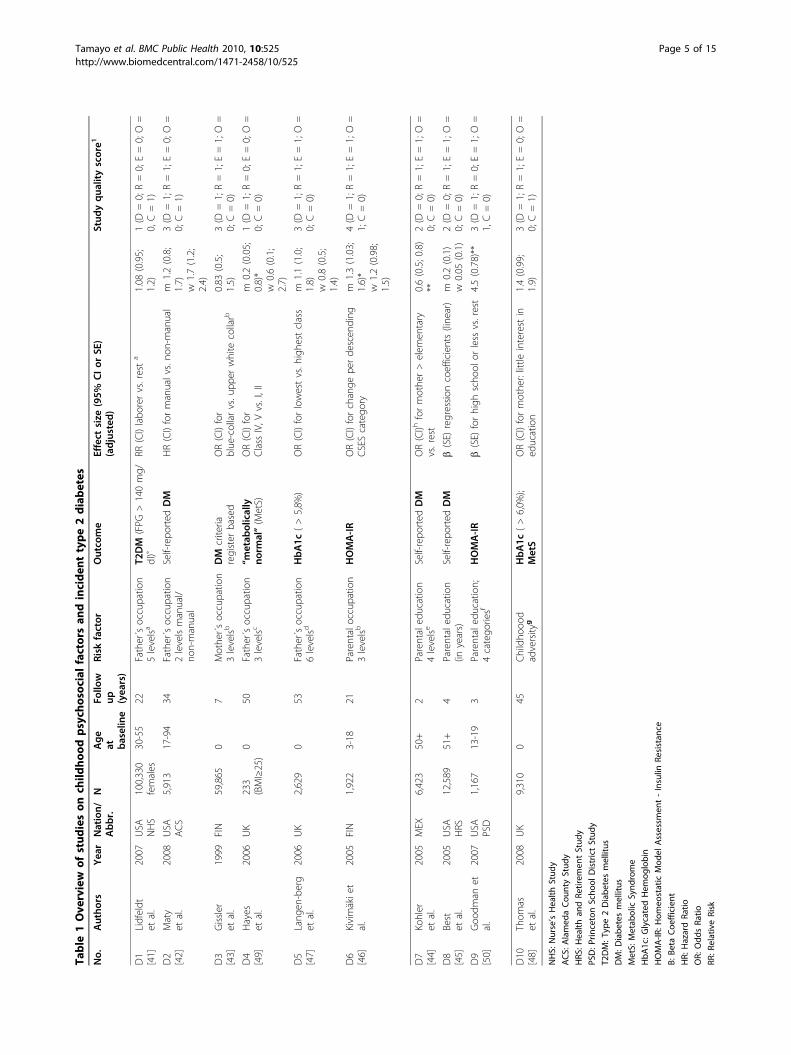
further descriptive analysis (Table 1). Information onexcluded studies with a unique method of analysis suchas path models is provided in the discussion, informa-tion on excluded studies with solely examined risk fac-tors in the results.The second search strategy for the outcome obesity
retrieved 1,631 results (see also Figure 1). 77 reviewsand non-English publications were excluded. 1,428 stu-dies were classified as thematically irrelevant and 76publications did not meet study design criteria. This ledto 50 longitudinal studies of which 36 were not compar-able for methodological reasons and risk factor selec-tion. Hence, 14 publications (13 studies) were includedfor this review and are presented in Table 2.
Description of included studies: diabetes incidenceStudy designFive publications involving 9,200 cases of incident diabeteswere included [41-45]. Furthermore, we identified 147cases of insulin resistance [46], 953 cases of elevatedHbA1c [47,48] and 233 cases of “metabolic malfunction-ing” [49] in a total of 199,214 individuals. One study ana-lysed HOMA-IR as continuous variable in 1,167individuals, but did not present the number of cases withinsulin resistance [50]. Hence, overall 10 studies are sum-marised in Table 1. Four studies were designed as birthcohorts [43,47-49], two were conducted in children oradolescents (age range 3-18 and 14-19 years, respectively)[46,50]. All other studies measured childhood psychosocialfactors retrospectively mainly in middle-aged participants.
Figure 1 Flow diagram of systematic review on type 2 diabetes incidence and on obesity.
Tamayo et al. BMC Public Health 2010, 10:525http://www.biomedcentral.com/1471-2458/10/525
Page 4 of 15
Table
1Ove
rview
ofstud
ieson
child
hoo
dpsych
osoc
ialfactorsan
dinciden
ttype2diabetes
No.
Autho
rsYea
rNation/
Abbr.
NAge
at baseline
Follo
wup (yea
rs)
Risk
factor
Outco
me
Effect
size
(95%
CIor
SE)
(adjusted
)Stud
yqua
lityscore1
D1
[41]
Lidfeldt
etal.
2007
USA
NHS
100,330
females
30-55
22Father´soccupatio
n5levelsa
T2DM
(FPG
>140mg/
dl)˚
RR(CI)labo
rervs.resta
1.08
(0.95;
1.2)
1(D
=0;R=0;E=0;O=
0,C=1)
D2
[42]
Maty
etal.
2008
USA
ACS
5,913
17-94
34Father´soccupatio
n2levelsmanual/
non-manual
Self-repo
rted
DM
HR(CI)formanualvs.no
n-manual
m1.2(0.8;
1.7)
w1.7(1.2;
2.4)
3(D
=1;R=1;E=0;O=
0;C=1)
D3
[43]
Gissler
etal.
1999
FIN
59,865
07
Mothe
r´soccupatio
n3levelsb
DM
criteria
register
based
OR(CI)for
blue-collarvs.u
pper
white
collarb
0.83
(0.5;
1.5)
3(D
=1;R=1;E=1;O=
0;C=0)
D4
[49]
Hayes
etal.
2006
UK
233
(BMI≥25)
050
Father´soccupatio
n3levelsc
“metab
olically
norm
al”(M
etS)
OR(CI)for
Class
IV,V
vs.I,II
m0.2(0.05;
0.8)*
w0.6(0.1;
2.7)
1(D
=1;R=0;E=0;O=
0;C=0)
D5
[47]
Lang
en-berg
etal.
2006
UK
2,629
053
Father´soccupatio
n6levelsd
HbA1c
(>5,8%
)OR(CI)forlowestvs.h
ighe
stclass
m1.1(1.0;
1.8)
w0.8(0.5;
1.4)
3(D
=1;R=1;E=1;O=
0;C=0)
D6
[46]
Kivimäkie
tal.
2005
FIN
1,922
3-18
21Parentaloccupatio
n3levelsb
HOMA-IR
OR(CI)forchange
perde
scen
ding
CSEScatego
rym
1.3(1.03;
1.6)*
w1.2(0.98;
1.5)
4(D
=1;R=1;E=1;O=
1;C=0)
D7
[44]
Kohler
etal.
2005
MEX
6,423
50+
2Parentaled
ucation
4levelse
Self-repo
rted
DM
OR(CI)h
formothe
r>elem
entary
vs.rest
0.6(0.5;0.8)
**2(D
=0;R=1;E=1;O=
0;C=0)
D8
[45]
Best
etal.
2005
USA
HRS
12,589
51+
4Parentaled
ucation
(inyears)
Self-repo
rted
DM
b(SE)
regression
coefficients(line
ar)
m0.2(0.1)
w0.05
(0.1)
2(D
=0;R=1;E=1;O=
0;C=0)
D9
[50]
Goo
dman
etal.
2007
USA
PSD
1,167
13-19
3Parentaled
ucation;
4catego
riesf
HOMA-IR
b(SE)
forhigh
scho
olor
less
vs.rest
4.5(0.78)**
3(D
=1;R=0;E=1;O=
1,C=0)
D10
[48]
Thom
aset
al.
2008
UK
9,310
045
Childho
ood
adversity
gHbA1c
(>6,0%
);MetS
OR(CI)formothe
r:little
interestin
education
1.4(0.99;
1.9)
3(D
=1;R=1;E=0;O=
0;C=1)
NHS:
Nurse’sHealth
Stud
y
ACS:
Alamed
aCou
ntyStud
y
HRS
:Health
andRe
tirem
entStud
y
PSD:P
rincetonScho
olDistrictStud
y
T2DM:T
ype2Diabe
tesmellitus
DM:D
iabe
tesmellitus
MetS:
Metab
olic
Synd
rome
HbA
1c:G
lycatedHem
oglobin
HOMA-IR
:Hom
eostatic
Mod
elAssessm
ent-Insulin
Resistan
ce
Β:B
etaCoe
fficient
HR:
HazardRa
tio
OR:
Odd
sRa
tio
RR:R
elativeRisk
Tamayo et al. BMC Public Health 2010, 10:525http://www.biomedcentral.com/1471-2458/10/525
Page 5 of 15
Psychosocial factorsMost of the articles provide data of parents’ occupationas basic indicator variable for socioeconomic status(Table 1). Parental education was offered as main SESrisk factor in three other studies. However, both SESvariables were heterogeneously defined in these studies.Parents’ occupation, for instance, was measured in fivedifferent classification scales ranging from two to sixlevels and following three different classification stan-dards [51-53]. Childhood adversity as risk factor wasfound in one study only [48]. In this study, little paren-tal interest in education was assessed as one aspect ofemotional neglect. As this item might be related to for-mal parental education as well, results are presented inTable 1.OutcomesSelf-reported diabetes was the most common outcomemeasure without restriction to type 2 diabetes. Only onearticle by Lidfeldt et al. was completely concordant withour review question by defining type 2 diabetes inci-dence on the basis of fasting plasma glucose levelsaccording to ADA recommendations in an originallydiabetes-free cohort [41]. HbA1c levels above 5.8% and6.0% were used in two studies to define metabolicallyabnormal cases [47,48]. Insulin resistance according toHOMA-IR levels above 5.8 and 6.0 was the outcomeparameter in two more studies [46,50]. One studydefined “metabolically normal” cases following the defi-nition of metabolic syndrome from the InternationalDiabetes Federation, but without weight indicatorsbecause only participants with BMI ≥ 25 kg/m2 wereincluded [49].
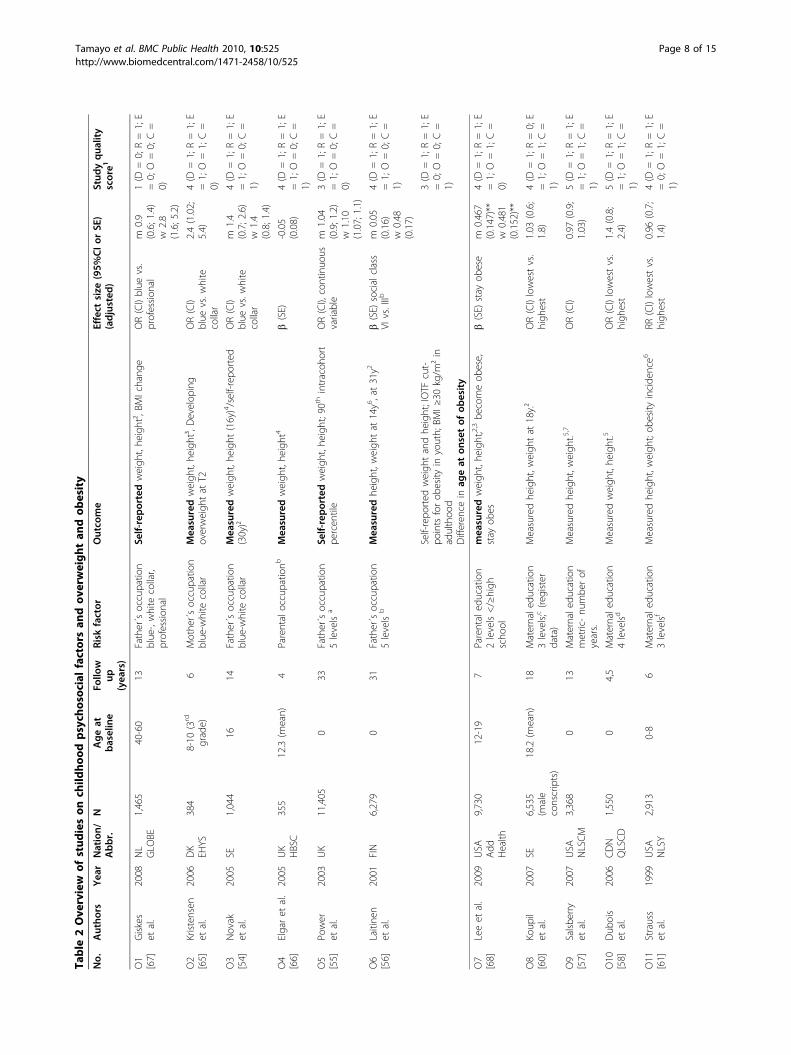
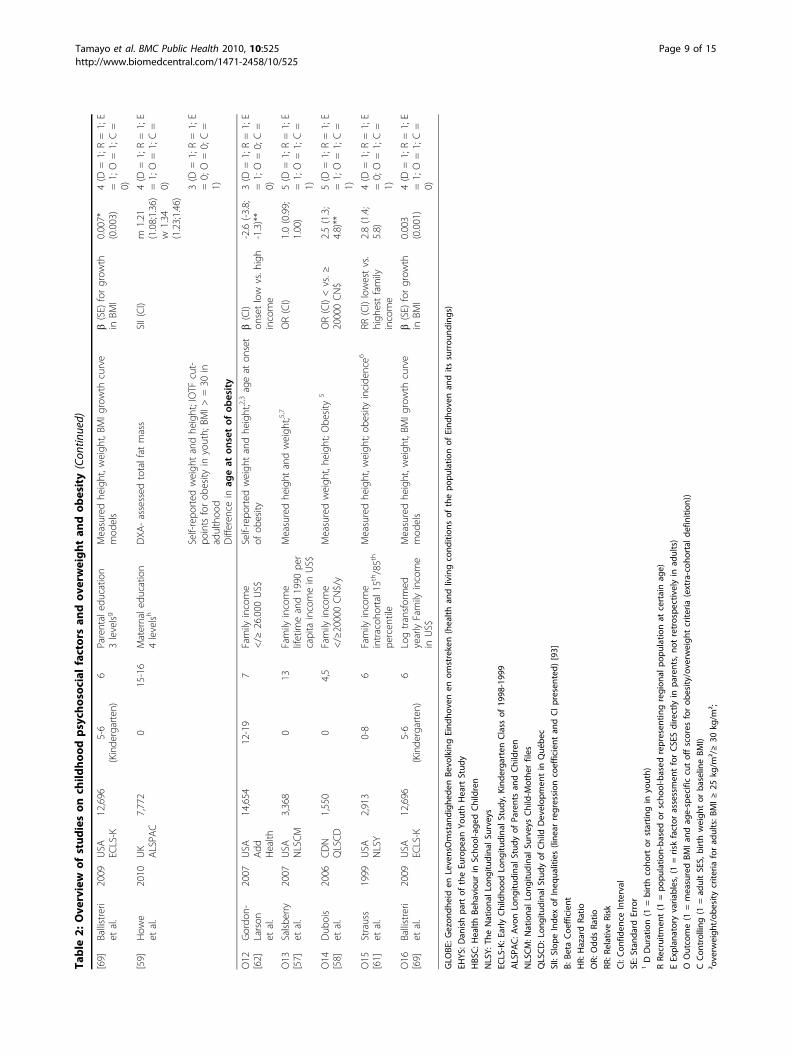
Description of included studies: Overweight and obesityStudy designThirteen studies met the inclusion criteria for obesity asoutcome parameter adding up to a sample size of70,420 participants with mainly young age groups ran-ging from 0-19 years. One study included middle-agedpersons from 40-60 years and retrospectively assessedpaternal occupation [54]. Overall, the study durationsranged from 4-33 years (median: 13 years), five studieswere designed as birth cohorts [55-59].Psychological factorsThe risk factor definition among the obesity studies wassimilarly heterogeneous as in the diabetes studies. Dataon parental occupation was most frequently presentedfollowed by parental education. Family income was addi-tionally included to parental education in four studies[58,60-62]. In one study results on the Home Observa-tion for Measurement of the Environment Short FormInventory (HOME-SF), a questionnaire measuring emo-tional and cognitive family environment and parentingabilities, was presented [61,63,64].C
I:Con
fiden
ceInterval
SE:S
tand
ardError
1DDuration(1
=birthcoho
rtor
startin
gin
youth)
RRe
cruitm
ent(1
=po
pulatio
n-ba
sedor
scho
ol-based
)
EExplan
atoryvaria
bles,(1=riskfactor
assessmen
tforCSESdirectly
inpa
rents,no
tretrospe
ctivelyin
adults)
OOutcometype
2diab
etes
(1=accordingto
ADAdiag
nostic
crite
riaforfastingplasmaglucose)
CCon
foun
ding
(1=ad
justmen
tof
age,
sex,BM
I,ph
ysical
activ
ity,smok
ingan
dalcoho
l)aEd
wardsclassificationof
social
class:up
perwhite-collar,lower
white-collar,blue
-collar,labo
rers,farmers
bAsclassifie
dby
Statistic
sFinlan
d,19
89:u
pper
non-man
ual,lower
non-man
ual,man
ual,
cUKRe
gristrar
Gen
eral’sStan
dard
Occup
ational
Classificatio
n:Iu
.IImostad
vantag
ed;IIIman
ual;IV
u.Vleastad
vantag
ed.
dProfession
al,intermed
iate,skilledno
nman
ual,skilled
man
ual,semiskilled,u
nskilled.
eWith
outan
y;someelem
entary;com
pleted
elem
entary;m
orethan
elem
entary
education(≥7years)
fWith
outan
yform
aled
ucation,
high
scho
olor
less,som
ecollege
,college
grad
uate
orhigh
er.
gQue
stionn
aire
includ
ingab
use,
physical
&em
otiona
lne
glect,ho
useh
olddy
sfun
ction
hCon
fiden
ceinterval
self-calculated
from
stan
dard
error.
m=men
;w=wom
en
˚ADAdiag
nostic
crite
riafortype
2diab
etes
mellitus:fastin
gplasmaglucose(FPG
)≥12
6mg/dl
**p<0.01
/*p<0.05
Tamayo et al. BMC Public Health 2010, 10:525http://www.biomedcentral.com/1471-2458/10/525
Page 6 of 15
OutcomesIn most studies the outcome regarding obesity and over-weight was defined according to standard cut-off valuesbased on BMI values calculated from measured heightand weight [54,56,58,60,61,65,66,68,69]. Three studiesdeduced BMI from self-reported anthropometric mea-sures [55,62,67]. One study analysed dual-energy X-rayabsorptiometry (DXA)-assessed fat mass [59]. Obesityincidence was determined only in the National Longitu-dinal Survey of Youth [61]. One study analysed age atonset of obesity and in a later publication also weightchange, but without exclusion of cases with obesity atbaseline [62,68]. Analysis of weight change over timewas also done in three other studies [58,65,67].
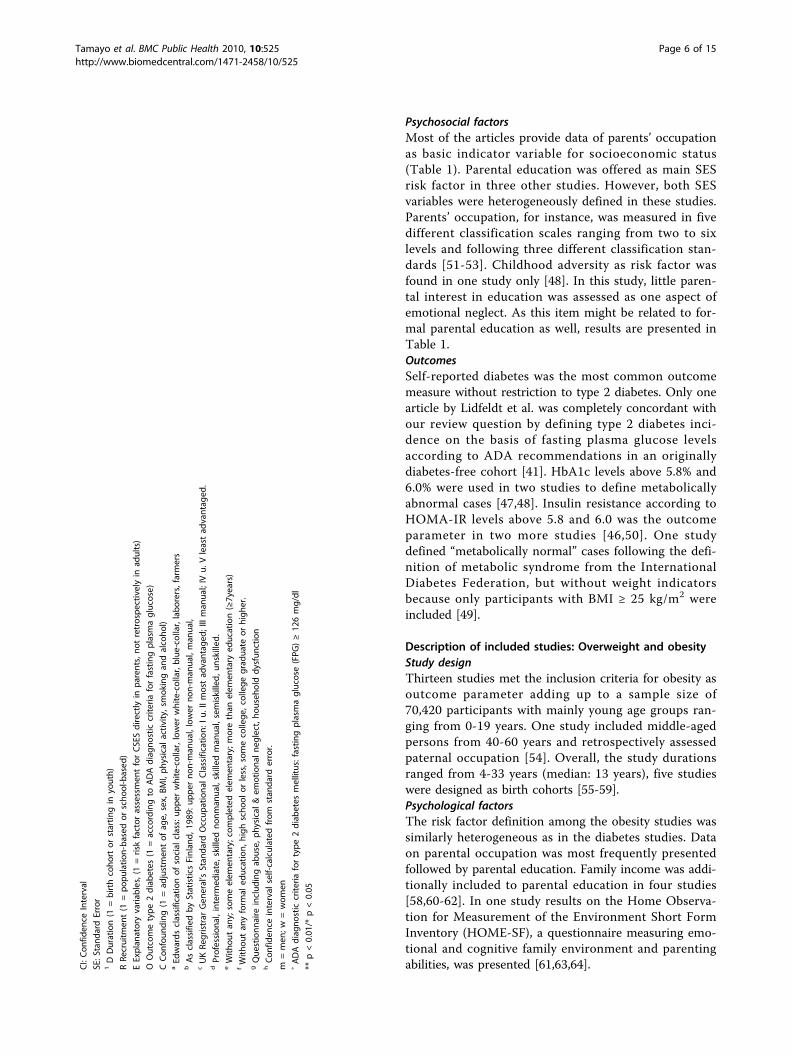
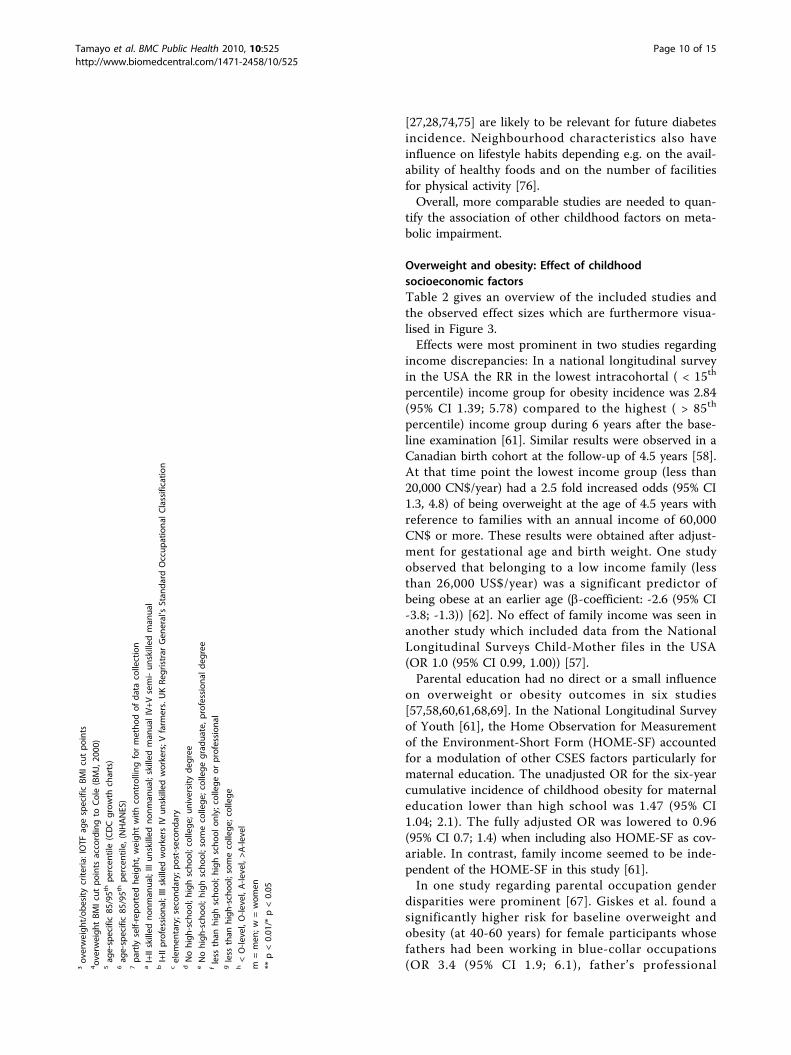
Diabetes incidence: Effect of childhood socioeconomicfactorsIn four studies, the risk of developing type 2 diabetes ormetabolic disturbances in the offspring of lower socialclasses compared to children of higher status was onlyslightly elevated after adjustment with different effectmeasures (OR, HR and RR) ranging between 1.08 and1.7 [41,42,46,48]. In the Alameda County Study, dispari-ties in self-reported diabetes were most striking in over-weight women with low childhood socioeconomicposition [42]: The odds of developing type 2 diabeteswas 3.2 fold higher for them than for their high SEPcounterparts (OR: 2.9 (95% CI 1.7; 4.8) vs. 0.9 (95% CI0.4; 2.2)).As shown in Table 1, the study with the smallest
population size (N = 233) showed the largest protectiveeffect (men OR 0.2 (95% CI 0.05, 0.8); women 0.6 (0.1,2.7)) of a high social status (father’s occupation) [49].This study was based on middle-aged participants of theNewcastle Thousand Families Cohort with a BMIexceeding 25 kg/m². Furthermore a large protectiveeffect of maternal education (beyond elementary level)was found in a Mexican population (OR 0.6 (95% CI0.5; 0,8)) [44]. In contrary, low maternal education athigh school level or less was a significant factor influen-cing type 2 diabetes incidence in the Princeton SchoolDistrict Study (ß-coefficient = 4.47 (SE 0.78)).On the other hand, two studies indicated small, non-
significant protective effects of low social class. In aFinnish cohort children at the age of 7 years from blue-collar families had a reduced risk (OR 0.8 (95% CI 0.48;1.45) of being diagnosed with type 2 diabetes in compar-ison with their white-collar counterparts [43]. In a Brit-ish Cohort only women of the lowest classes were lesslikely to have HbA1c levels exceeding 5.8% (OR 0.8(95% CI 0.5; 1.4)). In men, no effect of social class wasseen in this study (OR 1.1 (95% CI 1.0; 1.8)) [47].The effect sizes observed in the included studies
(except for beta coefficients) are shown in Figure 2.
Effects of high social status have been inverted for bettervisual comparability.
Diabetes incidence: Change in socioeconomic factorsfrom childhood to adulthoodFurthermore, we were interested in the interaction ofchildhood and adult psychosocial variables. SES changewas explicitly examined in the Nurses Health Study[41]. Participants in this study were relatively homoge-neous with respect to their educational level and occu-pational status as all 100,330 participants were femalenurses. Disparities emerged from different childhoodsocioeconomic positions and from husband’s educa-tional level. Improving SES over lifetime (spouse’s higheducational level and low father´s occupational status)with stable high SES as reference resulted in a slightlyreduced, albeit non-significant relative risk for type 2diabetes (RR 0.9 (95% CI 0.7; 1.3), whereas a stableintermediate SES and a declining SES influenced thetype 2 diabetes relative risk negatively (RR 1.2 (95% CI1.06; 1.4) and RR 1.18 (95% CI 1.06; 1.3), respectively).The relative risk in participants with stable low SES wascomparable to those participants with stable high SES.Langenberg et al. examined lifetime effects by analys-
ing the change in the influence of the socioeconomicposition on HbA1c levels with adjustment for childhoodand adult SEP [47]. In both men and women, adultsocial class had stronger effects than childhood socialclass on HbA1c values exceeding 5.8%. In women child-hood effects on HbA1c even reversed in the fullyadjusted model. Langenberg et al. interpret these find-ings by postulating that low childhood social class con-tinues to influence adult social class as both variableswere highly correlated [47].A high continuity of childhood and adult SEP para-
meters was also observed in a Finnish cohort, wherechildren from manual classes were more likely to workin manual or lower non-manual occupations in adult-hood [46].
Diabetes incidence: Effect of other psychosocial factorsAmong the retrieved studies there were several uniquefindings that were not comparable with other studiesand other results. However, most of these studiesrevealed a possible association with future diabetes.For example psychological factors such as childhood
adversities [48] were associated with elevated HbA1cand obesity in one study. After full adjustment, theseassociations were no longer significant for elevatedHbA1c. A further possible psychological risk factors fordiabetes among our findings were depression and anxi-ety [70,71], hostility [72], and sense of coherence [73].Also, indirect measures of socioeconomic status such
as deprived neighbourhoods, and housing conditions
Tamayo et al. BMC Public Health 2010, 10:525http://www.biomedcentral.com/1471-2458/10/525
Page 7 of 15
Table
2Ove
rview
ofstud
ieson
child
hoo
dpsych
osoc
ialfactorsan
dov
erweightan
dob
esity
No.
Autho
rsYea
rNation/
Abbr.
NAgeat
baseline
Follo
wup
(yea
rs)
Risk
factor
Outco
me
Effect
size
(95%
CIor
SE)
(adjusted
)Stud
yqua
lity
score1
O1
[67]
Giskes
etal.
2008
NL
GLO
BE1,465
40-60
13Father´soccupatio
nblue-,white
collar,
profession
al
Self-reportedweigh
t,he
ight²,BM
Ichang
eOR(CI)blue
vs.
profession
alm
0.9
(0.6;1.4)
w2.8
(1.6;5.2)
1(D
=0;R=1;E
=0;O
=0;C=
0)
O2
[65]
Kristensen
etal.
2006
DK
EHYS
384
8-10
(3rd
grade)
6Mothe
r´soccupatio
nblue-w
hite
collar
Mea
suredweigh
t,he
ight³,Develop
ing
overweigh
tat
T2OR(CI)
blue
vs.w
hite
collar
2.4(1.02;
5.4)
4(D
=1;R=1;E
=1;O
=1;C=
0)
O3
[54]
Novak
etal.
2005
SE1,044
1614
Father´soccupatio
nblue-w
hite
collar
Mea
suredweigh
t,he
ight
(16y)4/self-rep
orted
(30y)²
OR(CI)
blue
vs.w
hite
collar
m1.4
(0.7;2.6)
w1.4
(0.8;1.4)
4(D
=1;R=1;E
=1;O
=0;C=
1)
O4
[66]
Elgaret
al.
2005
UK
HBSC
355
12.3(m
ean)
4Parentaloccupatio
nbMea
suredweigh
t,he
ight
4b(SE)
-0.05
(0.08)
4(D
=1;R=1;E
=1;O
=0;C=
1)
O5
[55]
Power
etal.
2003
UK
11,405
033
Father´soccupatio
n5levels
aSe
lf-reportedweigh
t,he
ight;90thintracoh
ort
percen
tile
OR(CI),continuo
usvariable
m1.04
(0.9;1.2)
w1.10
(1.07;1.1)
3(D
=1;R=1;E
=1;O
=0;C=
0)
O6
[56]
Laitine
net
al.
2001
FIN
6,279
031
Father´soccupatio
n5levels
bMea
suredhe
ight,w
eigh
tat
14y6,at31y2
b(SE)
socialclass
VIvs.IIIb
m0.05
(0.16)
w0.48
(0.17)
4(D
=1;R=1;E
=1;O
=0;C=
1)
Self-repo
rted
weigh
tandhe
ight;IOTF
cut-
pointsforob
esity
inyouth;
BMI≥
30kg/m
²in
adulthoo
dDifferen
cein
ageat
onsetof
obesity
3(D
=1;R=1;E
=0;O
=0;C=
1)
O7
[68]
Leeet
al.
2009
USA
Add
Health
9,730
12-19
7Parentaled
ucation
2levels</≥high
scho
ol
mea
suredweigh
t,he
ight;2,3be
comeob
ese,
stay
obes
b(SE)
stay
obese
m0.467
(0.147)**
w0.481
(0.152)**
4(D
=1;R=1;E
=1;O
=1;C=
0)
O8
[60]
Koup
ilet
al.
2007
SE6,535
(male
conscripts)
18.2(m
ean)
18Maternale
ducatio
n3levels;c(re
gister
data)
Measuredhe
ight,w
eigh
tat
18y.²
OR(CI)lowestvs.
high
est
1.03
(0.6;
1.8)
4(D
=1;R=0;E
=1;O
=1;C=
1)
O9
[57]
Salsbe
rry
etal.
2007
USA
NLSCM
3,368
013
Maternale
ducatio
nmetric-nu
mbe
rof
years.
Measuredhe
ight,w
eigh
t.5,7
OR(CI)
0.97
(0.9;
1.03)
5(D
=1;R=1;E
=1;O
=1;C=
1)
O10
[58]
Dub
ois
etal.
2006
CDN
QLSCD
1,550
04,5
Maternale
ducatio
n4levelsd
Measuredweigh
t,he
ight.5
OR(CI)lowestvs.
high
est
1.4(0.8;
2.4)
5(D
=1;R=1;E
=1;O
=1;C=
1)
O11
[61]
Strauss
etal.
1999
USA
NLSY
2,913
0-8
6Maternale
ducatio
n3levelsf
Measuredhe
ight,w
eigh
t;ob
esity
incide
nce6
RR(CI)lowestvs.
high
est
0.96
(0.7;
1.4)
4(D
=1;R=1;E
=0;O
=1;C=
1)
Tamayo et al. BMC Public Health 2010, 10:525http://www.biomedcentral.com/1471-2458/10/525
Page 8 of 15
Table
2:Ove
rview
ofstud
ieson
child
hoo
dpsych
osoc
ialfactorsan
dov
erweightan
dob
esity(Con
tinued)
[69]
Ballistreri
etal.
2009
USA
ECLS-K
12,696
5-6
(Kinde
rgarten)
6Parentaled
ucation
3levelsg
Measuredhe
ight,w
eigh
t,BM
Igrowth
curve
mod
els
b(SE)
forgrow
thin
BMI
0.007*
(0.003)
4(D
=1;R=1;E
=1;O
=1;C=
0)
[59]
How
eet
al.
2010
UK
ALSPA
C7,772
015-16
Maternale
ducatio
n4levelsh
DXA
-assessed
totalfat
mass
SII(CI)
m1.21
(1.08;1.36)
w1.34
(1.23;1.46)
4(D
=1;R=1;E
=1;O
=1;C=
0)
Self-repo
rted
weigh
tandhe
ight;IOTF
cut-
pointsforob
esity
inyouth;
BMI>
=30
inadulthoo
dDifferen
cein
ageat
onsetof
obesity
3(D
=1;R=1;E
=0;O
=0;C=
1)
O12
[62]
Gordo
n-Larson
etal.
2007
USA
Add
Health
14,654
12-19
7Family
income
</≥
26.000
US$
Self-repo
rted
weigh
tandhe
ight;2,3ageat
onset
ofob
esity
b(CI)
onsetlow
vs.h
igh
income
-2.6(-3
.8;
-1.3)**
3(D
=1;R=1;E
=1;O
=0;C=
0)
O13
[57]
Salsbe
rry
etal.
2007
USA
NLSCM
3,368
013
Family
income
lifetim
eand1990
per
capita
incomein
US$
Measuredhe
ight
andweigh
t;5,7
OR(CI)
1.0(0.99;
1.00)
5(D
=1;R=1;E
=1;O
=1;C=
1)
O14
[58]
Dub
ois
etal.
2006
CDN
QLSCD
1,550
04,5
Family
income
</≥20000CN$/y
Measuredweigh
t,he
ight;O
besity
5OR(CI)<vs.≥
20000CN$
2.5(1.3;
4.8)**
5(D
=1;R=1;E
=1;O
=1;C=
1)
O15
[61]
Strauss
etal.
1999
USA
NLSY
2,913
0-8
6Family
income
intracoh
ortal1
5th/85th
percen
tile
Measuredhe
ight,w
eigh
t;ob
esity
incide
nce6
RR(CI)lowestvs.
high
estfamily
income
2.8(1.4;
5.8)
4(D
=1;R=1;E
=0;O
=1;C=
1)
O16
[69]
Ballistreri
etal.
2009
USA
ECLS-K
12,696
5-6
(Kinde
rgarten)
6Logtransformed
yearlyFamily
income
inUS$
Measuredhe
ight,w
eigh
t,BM
Igrowth
curve
mod
els
b(SE)
forgrow
thin
BMI
0.003
(0.001)
4(D
=1;R=1;E
=1;O
=1;C=
0)
GLO
BE:G
ezon
dheiden
LevensOmstan
digh
eden
Bevo
lkingEind
hovenen
omstreken(health
andlivingcond
ition
sof
thepo
pulatio
nof
Eind
hovenan
dits
surrou
nding
s)
EHYS
:Dan
ishpa
rtof
theEu
rope
anYo
uthHeartStud
y
HBS
C:H
ealth
Beha
viou
rin
Scho
ol-age
dChildren
NLSY:
TheNationa
lLo
ngitu
dinal
Surveys
ECLS-K:E
arly
Childho
odLo
ngitu
dinal
Stud
y,Kind
erga
rten
Class
of19
98-199
9
ALSPA
C:A
vonLo
ngitu
dinal
Stud
yof
Parentsan
dChildren
NLSCM:N
ationa
lLo
ngitu
dinal
SurveysChild-M
othe
rfiles
QLSCD:L
ongitudinal
Stud
yof
Child
Develop
men
tin
Qué
bec
SII:Slop
eInde
xof
Ineq
ualities(line
arregression
coefficient
andCIpresen
ted)[93]
Β:B
etaCoe
fficient
HR:
HazardRa
tio
OR:
Odd
sRa
tio
RR:R
elativeRisk
CI:Con
fiden
ceInterval
SE:S
tand
ardError
1DDuration(1
=birthcoho
rtor
startin
gin
youth)
RRe
cruitm
ent(1
=po
pulatio
n-based
orscho
ol-based
represen
ting
region
alpo
pulatio
nat
certainag
e)
EExplan
atoryvaria
bles,(1=riskfactor
assessmen
tforCSESdirectly
inpa
rents,no
tretrospe
ctivelyin
adults)
OOutcome(1
=measuredBM
Ian
dag
e-specificcutoffscores
forob
esity
/overw
eigh
tcrite
ria(extra-coho
rtal
defin
ition
))
CCon
trollin
g(1
=ad
ultSES,
birthweigh
tor
baselin
eBM
I)
²overw
eigh
t/ob
esity
crite
riaforad
ults:B
MI≥25
kg/m
²/≥30
kg/m
²;
Tamayo et al. BMC Public Health 2010, 10:525http://www.biomedcentral.com/1471-2458/10/525
Page 9 of 15
[27,28,74,75] are likely to be relevant for future diabetesincidence. Neighbourhood characteristics also haveinfluence on lifestyle habits depending e.g. on the avail-ability of healthy foods and on the number of facilitiesfor physical activity [76].Overall, more comparable studies are needed to quan-
tify the association of other childhood factors on meta-bolic impairment.
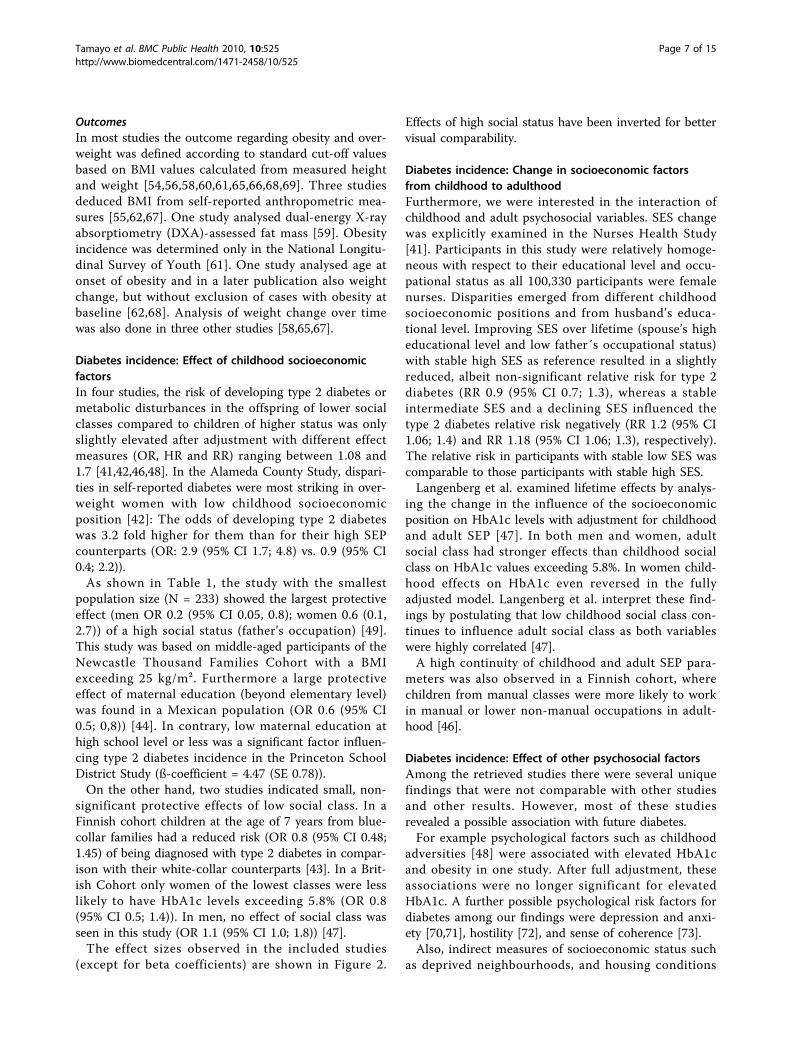
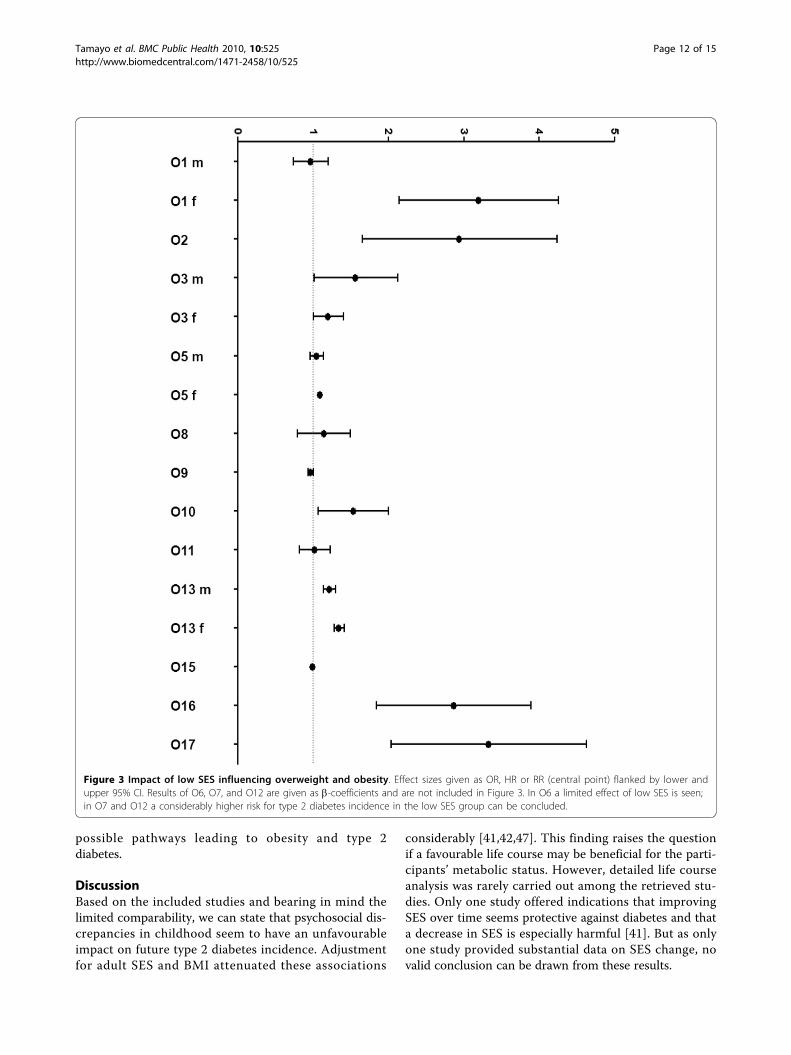
Overweight and obesity: Effect of childhoodsocioeconomic factorsTable 2 gives an overview of the included studies andthe observed effect sizes which are furthermore visua-lised in Figure 3.Effects were most prominent in two studies regarding
income discrepancies: In a national longitudinal surveyin the USA the RR in the lowest intracohortal ( < 15th
percentile) income group for obesity incidence was 2.84(95% CI 1.39; 5.78) compared to the highest ( > 85th
percentile) income group during 6 years after the base-line examination [61]. Similar results were observed in aCanadian birth cohort at the follow-up of 4.5 years [58].At that time point the lowest income group (less than20,000 CN$/year) had a 2.5 fold increased odds (95% CI1.3, 4.8) of being overweight at the age of 4.5 years withreference to families with an annual income of 60,000CN$ or more. These results were obtained after adjust-ment for gestational age and birth weight. One studyobserved that belonging to a low income family (lessthan 26,000 US$/year) was a significant predictor ofbeing obese at an earlier age (b-coefficient: -2.6 (95% CI-3.8; -1.3)) [62]. No effect of family income was seen inanother study which included data from the NationalLongitudinal Surveys Child-Mother files in the USA(OR 1.0 (95% CI 0.99, 1.00)) [57].Parental education had no direct or a small influence
on overweight or obesity outcomes in six studies[57,58,60,61,68,69]. In the National Longitudinal Surveyof Youth [61], the Home Observation for Measurementof the Environment-Short Form (HOME-SF) accountedfor a modulation of other CSES factors particularly formaternal education. The unadjusted OR for the six-yearcumulative incidence of childhood obesity for maternaleducation lower than high school was 1.47 (95% CI1.04; 2.1). The fully adjusted OR was lowered to 0.96(95% CI 0.7; 1.4) when including also HOME-SF as cov-ariable. In contrast, family income seemed to be inde-pendent of the HOME-SF in this study [61].In one study regarding parental occupation gender
disparities were prominent [67]. Giskes et al. found asignificantly higher risk for baseline overweight andobesity (at 40-60 years) for female participants whosefathers had been working in blue-collar occupations(OR 3.4 (95% CI 1.9; 6.1), father’s professional³
overweigh
t/ob
esity
crite
ria:IOTF
agespecificBM
Icutpo
ints
4ov
erweigh
tBM
Icutpo
ints
accordingto
Cole(BMJ,20
00)
5ag
e-specific85
/95t
hpe
rcen
tile(CDCgrow
thcharts)
6ag
e-specific85
/95t
hpe
rcen
tile,
(NHANES)
7pa
rtly
self-repo
rted
height,w
eigh
twith
controlling
formetho
dof
data
collection
aI+IIskilled
nonm
anua
l;III
unskilled
nonm
anua
l;skilled
man
ualIV+Vsemi-un
skilled
man
ual
bI+IIprofession
al;IIIskilled
workers
IVun
skilled
workers;V
farm
ers.UKRe
gristrar
Gen
eral’sStan
dard
Occup
ational
Classificatio
ncelem
entary;secon
dary;p
ost-second
ary
dNohigh
-schoo
l;high
scho
ol;college
;universityde
gree
eNohigh
-schoo
l;high
scho
ol;som
ecollege
;college
grad
uate,p
rofessiona
ldeg
ree
fless
than
high
scho
ol;h
ighscho
olon
ly;college
orprofession
algless
than
high
-schoo
l;somecollege
;college
h<O-le
vel,O-le
vel,A-le
vel,>A-le
vel
m=men
;w=wom
en
**p<0.01
/*p<0.05
Tamayo et al. BMC Public Health 2010, 10:525http://www.biomedcentral.com/1471-2458/10/525
Page 10 of 15
occupation as reference). This effect decreased slightlyafter adjustment for adult SES (OR 2.8 (95% CI 1.6;5.2)). These women also gained significantly moreweight between baseline and follow-up 13 years later(OR 2.0 (95% CI 1.7; 2.3)). In another study the riskfor developing overweight during the 6-year follow-upperiod was increased for children from blue-collarfamilies (OR 2.4 (95% CI 1.02; 5.4) in comparison withtheir white-collar counterparts [65]. Furthermore, intwo studies the adjusted effects of low status weresmall [54,55].Based on results of regression analysis, two studies
determined low social status as factor influencing over-weight and obesity [56,62], whereas in a third study nosuch effect was seen (ß-coefficient: -0.05 (SE 0.08)) [66].In another study, DXA-assessed fat mass was analysedusing a slope index of inequality (SII). The results ofthis method are comparable to regression coefficientsand pointed towards a moderate association of maternaleducation on body fat [59].However, as these studies only displayed data on
regression coefficients, effect sizes cannot be comparedto the other studies and are therefore not included inFigure 3.Taken together, whenever effects were seen in any of
the thirteen studies, they pointed towards a deleteriousinfluence of low social status on future risk of over-weight and obesity.
Overweight and obesity: Effect of change insocioeconomic factors from childhood to adulthoodThe role of change in psychosocial factors in relation toobesity was investigated in the 1958 British birth cohort[55]: Power et al. reported a continuous decrease of theeffects of low socioeconomic status in childhood onobesity especially in women with an increase in socialposition in adulthood. The effect of low social class atthe age of seven years in 33-year old women decreasedfrom an unadjusted OR of 1.4 (95% CI 1.3; 1.6) to 1.3(95% CI 1.1; 1.4) after adjustment for personal education[55].
Overweight and Obesity: Effect of other psychosocialfactorsWe found one study which showed that traumata areassociated with obesity [77]. Furthermore, depressionand stress [78] are not only relevant for type 2 diabetes,but also for obesity. Also, indirect measures of socioeco-nomic status such as deprived neighbourhoods, housingconditions [79] and supply for healthy lifestyle habits[80], are likely to be relevant for obesity.Therefore, psychological factors, and several measures
of deprivation in childhood remain an interesting fieldfor further examinations helping to understand the
Figure 2 Impact of low SES influencing the incidence of type 2diabetes. Effect sizes given as OR, HR or RR (central point) flankedby lower and upper 95% CI (results of high SES have been inverted,x-axis ends with 8, end points of higher results are not shown).Results of D8 and D9 are given as b-coefficients and are notincluded in Figure 2. D8 shows no effect of low SES; in D9 aconsiderably higher risk for type 2 diabetes incidence in the lowSES group can be concluded.
Tamayo et al. BMC Public Health 2010, 10:525http://www.biomedcentral.com/1471-2458/10/525
Page 11 of 15
possible pathways leading to obesity and type 2diabetes.
DiscussionBased on the included studies and bearing in mind thelimited comparability, we can state that psychosocial dis-crepancies in childhood seem to have an unfavourableimpact on future type 2 diabetes incidence. Adjustmentfor adult SES and BMI attenuated these associations
considerably [41,42,47]. This finding raises the questionif a favourable life course may be beneficial for the parti-cipants’ metabolic status. However, detailed life courseanalysis was rarely carried out among the retrieved stu-dies. Only one study offered indications that improvingSES over time seems protective against diabetes and thata decrease in SES is especially harmful [41]. But as onlyone study provided substantial data on SES change, novalid conclusion can be drawn from these results.
Figure 3 Impact of low SES influencing overweight and obesity. Effect sizes given as OR, HR or RR (central point) flanked by lower andupper 95% CI. Results of O6, O7, and O12 are given as b-coefficients and are not included in Figure 3. In O6 a limited effect of low SES is seen;in O7 and O12 a considerably higher risk for type 2 diabetes incidence in the low SES group can be concluded.
Tamayo et al. BMC Public Health 2010, 10:525http://www.biomedcentral.com/1471-2458/10/525
Page 12 of 15
Furthermore, we found the family income [67,58,61]and the father´s occupation [[67], in women only; [65]]of relevance for overweight and obesity. Surprisingly, incontrast to our findings on diabetes incidence parentaleducation seemed to have less impact on future obesityrisk. However, lower parental education was linked toan earlier age at onset of obesity in one study [62].
LimitationsAltogether we observe that for both type 2 diabetes andobesity longitudinal, population-based data are scarce.Especially, the life course including childhood indicatorsof psychosocial status and the role of risk factor cluster-ing is under-investigated. Additionally, analysis of psy-chosocial factors is carried out heterogeneously and thusexposed to the critique of constructing SES risk factorsarbitrarily. Although there are some national consensusstatements especially regarding the assessment of theoccupational position [51-53], it is difficult to comparethese positions because they are attributed with varyingamounts of prestige and are influenced by general shiftsin composition [81].
Implications for researchThree steps may help to gain further evidence on thetopic: First, basic SES measures in youth and in adult-hood should be consequently presented in publications.Second, for a better understanding of the role of psy-chosocial factors throughout life on the risk of type 2diabetes, detailed analysis of a broad set of psychosocialfactors, their interrelation and their impact on type 2diabetes are needed. This requires a large-scale systema-tic analysis applying various psychosocial measures inyouth and adulthood that have been found to be of rele-vance for diabetes and obesity such as depression[82-84], stress [85,86], unemployment [87], lifestylehabits [76,80] deprived neighbourhoods [27,28,74,75,79]and other factors [72,77].Finally, such a large-scale systematic analysis would
also require the application of different analyticapproaches. As an example, the interpretation of theresults of regression models analysing closely relatedrisk factors throughout lifetime is controversial.Attenuation after adjustment for various risk factorsmay be attributable to a strong correlation of these riskfactors [22] rather than to confounding. An interestingalternative approach may be the analysis of path models.For example Lehman et al. showed that childhood SEShad a direct impact on metabolic functioning in the par-ticipants by applying path models on data from the Cor-onary Artery Risk Development in Young Adults study(CARDIA). Furthermore, childhood SES had an impacton early family environment, psychosocial functioningand adult SES. Interestingly, adult SES in this study had
no direct influence on metabolic functioning [88]. Addi-tionally, cluster and discriminance analysis can shedfurther light on the interaction of a broad set of child-hood and adult psychosocial indicators accounting alsofor highly differentiated social milieus with distinctbeliefs, behaviours and tastes [89].
Implications for practiceValid results on the association of childhood socio-eco-nomic circumstances and future risk of diabetes andobesity would be important to design targeted and moreefficient prevention strategies. Diabetes and obesity pre-vention may not only profit from educational pro-grammes but also from health politics, frominterventions for high-risk families, from coping skillstraining [90], from empowerment of social networks andfrom healthy neighbourhoods [91,92].
ConclusionTaken together, despite the lack of homogeneous data,there is evidence for adverse effects of low psychosocialposition in childhood on the risk for type 2 diabetes andobesity in later life. However, more studies and homoge-neous standards regarding assessment of exposure andoutcome variables and statistical analyses are needed.
AcknowledgementsThe work is part of the Diabetes Competence Network including the DIAB-CORE (Collaborative Research of Epidemiologic Studies) Consortium which isfunded by the German Ministry of Education and Research. Further supportwas obtained from The German Federal Ministry of Health and the Ministryof Innovation, Science, Research and Technology of the state North Rhine-Westphalia (Düsseldorf, Germany).
Author details1Institute of Biometrics and Epidemiology, German Diabetes Center, LeibnizCenter for Diabetes Research at Heinrich-Heine-University, Düsseldorf,Germany. 2Institute for Clinical Diabetology, German Diabetes Center, LeibnizCenter for Diabetes Research at Heinrich-Heine-University, Düsseldorf,Germany.
Authors’ contributionsWR and TT conceived the study aims and design. TT, CH and WRcontributed to the systematic review, data extraction, quality assessment andinterpretation of the results. TT wrote the manuscript, supervised by CH andWR. All authors approved the final version of the manuscript.
Competing interestsThe authors declare that they have no competing interests.
Received: 25 November 2009 Accepted: 1 September 2010Published: 1 September 2010
References1. Brown AF, Ettner SL, Piette J, Weinberger M, Gregg E, Shapiro MF, Karter AJ,
Safford M, Waitzfelder B, Prata PA, Beckles GL: Socioeconomic Position andHealth among Persons with Diabetes Mellitus: A Conceptual Frameworkand Review of the Literature. Epidemiol Reviews 2004, 26:63-77.
2. Parsons TJ, Power C, Logan S, Summerbell CD: Childhood predictors ofadult obesity: a systematic review. Int J Obes Relat Metab Disord 1999,23(Suppl 8):S1-107.
Tamayo et al. BMC Public Health 2010, 10:525http://www.biomedcentral.com/1471-2458/10/525
Page 13 of 15
3. Wang Y, Beydoun MA: The obesity epidemic in the United States-gender,age, socioeconomic, racial/ethnic, and geographic characteristics: asystematic review and meta-regression analysis. Epidemiol Rev 2007, 29:6-28.
4. McLaren L: Socioeconomic status and obesity. Epidemiol Rev 2007,29:29-48.
5. Shrewsbury V, Wardle J: Socioeconomic status and adiposity inchildhood: a systematic review of cross-sectional studies 1990-2005.Obesity (Silver Spring) 2008, 16(2):275-284.
6. Hemingway H, Marmot M: Evidence based cardiology: psychosocialfactors in the aetiology and prognosis of coronary heart disease.Systematic review of prospective cohort studies. BMJ 1999,318(7196):1460-1467.
7. Blane D, Hart CL, Smith GD, Gillis CR, Hole DJ, Hawthorne VM: Associationof cardiovascular disease risk factors with socioeconomic positionduring childhood and during adulthood. BMJ 1996, 313(7070):1434-1438.
8. Kvaavik E, Lien N, Tell GS, Klepp KI: Psychosocial predictors of eatinghabits among adults in their mid-30s: the Oslo Youth Study follow-up1991-1999. Int J Behav Nutr Phys Act 2005, 2:9.
9. Osler M, Madsen M, Nybo Andersen AM, Avlund K, McGue M, Jeune B,Christensen K: Do childhood and adult socioeconomic circumstancesinfluence health and physical function in middle-age? Soc Sci Med 2009,68(8):1425-1431.
10. Mackenbach JP, Stirbu I, Roskam AJ: Socioeconomic inequalities in healthin 22 European countries. N Engl J Med 2008, 358(23):2468-2481.
11. Lawlor DA, Davey Smith G, Ebrahim S: Life course influences on insulinresistance: findings from the British Women’s Heart and Health Study.Diabetes Care 2003, 26(1):97-103.
12. Meyer IH, Schwartz S, Frost DM: Social patterning of stress and coping:does disadvantaged social statuses confer more stress and fewer copingresources? Soc Sci Med 2008, 67(3):368-379.
13. Connolly V, Unwin N, Sherriff P, Bilous R, Kelly W: Diabetes prevalence andsocioeconomic status: a population based study showing increasedprevalence of type 2 diabetes mellitus in deprived areas. J EpidemiolCommunity Health 2000, 54(3):173-177.
14. Lynch JW, Kaplan GA, Cohen RD, Kauhanen J, Wilson TW, Smith NL,Salonen JT: Childhood and adult socio-economic status as predictors ofmortality in Finland. Lancet 1994, 343(8896):524-527.
15. Espelt A, Borrell C, Roskam AJ, Rodríguez-Sanz M, Stirbu I, Dalmau-Bueno A,Regidor E, Bopp M, Martikainen P, Leinsalu M, Artnik B, Rychtarikova J,Kalediene R, Dzurova D, Mackenbach J, Kunst AE: Socioeconomicinequalities in diabetes mellitus across Europe at the beginning of the21st century. Diabetologia 2008, 51(11):1971-1979.
16. Dietz WH: Critical periods in childhood for the development of obesity.Am J Clin Nutr 1994, 59(5):955-959.
17. Kempf K, Rathmann W, Herder C: Impaired glucose regulation and type 2diabetes in children and adolescents. Diab Metab Res Rev 2008,24(6):427-437.
18. Lawlor DA, Ebrahim S, Davey Smith G: Socioeconomic position inchildhood and adulthood and insulin resistance: cross sectional surveyusing data from British women’s heart and health study. BMJ 2002,325(7368):805.
19. Lawlor DA, Harro M, Wedderkopp N: Association of socioeconomicposition with insulin resistance among children from Denmark, Estonia,and Portugal: cross sectional study. BMJ 2005, 331(7510):183-187.
20. Agardh EE, Ahlbom A, Andersson T, Efendic S, Grill V, Hallqvist J,Ostenson CG: Socio-economic position at three points in life inassociation with type 2 diabetes and impaired glucose tolerance inmiddle-aged Swedish men and women. Int J Epidemiol 2007, 36(1):84-92.
21. Ebrahim S, Montaner D, Lawlor DA: Clustering of risk factors and socialclass in childhood and adulthood in British women’s heart and healthstudy: cross sectional analysis. BMJ 2004, 328(7444):861.
22. Goran MI, Ball GD, Cruz ML: Obesity and risk of type 2 diabetes andcardiovascular disease in children and adolescents. J Clin EndocrinolMetab 2003, 88(4):1417-1427.
23. Sobal J, Stunkard AJ: Socioeconomic status and obesity: a review of theliterature. Psychol Bull 1989, 105(2):260-275.
24. Felitti VJ, Anda RF, Nordenberg D, Williamson DF, Spitz AM, Edwards V,Koss MP, Marks JS: Relationship of Childhood Abuse and HouseholdDysfunction to Many of the Leading Causes of Death in Adults: TheAdverse Childhood Experiences (ACE) Study. Am J Prev Med 1998,14(4):245-258.
25. Antonovsky A: Unravelling the Mystery of Health: How People ManageStress and Stay Well. San Francisco: Jossey-Boss 1987.
26. Carstairs V: Deprivation indices: their interpretation and use in relation tohealth. J Epidemiol Community Health 1995, 49(Suppl 2):S3-8.
27. Diez Roux AV, Jacobs DR, Kiefe CI: Neighborhood characteristics andcomponents of the insulin resistance syndrome in young adults: thecoronary artery risk development in young adults (CARDIA) study.Diabetes Care 2002, 25(11):1976-1982.
28. Stroup DF, Berlin JA, Morton SC, Olkin I, Williamson GD, Rennie D,Moher D, Becker BJ, Sipe TA, Thacker SB: Meta-analysis of observationalstudies in epidemiology: a proposal for reporting. Meta-analysis OfObservational Studies in Epidemiology (MOOSE) group. JAMA 2000,283(15):2008-2012.
29. Chida Y, Hamer M: An association of adverse psychosocial factors withdiabetes mellitus: a meta-analytic review of longitudinal cohort studies.Diabetologia 2008, 51(12):2168-2178.
30. Karlberg J: A biologically-oriented mathematical model (ICP) for humangrowth. Acta Paediatr Scand 1989, 350:70-94.
31. Lammi N, Moltchanova E, Blomstedt PA, Tuomilehto J, Eriksson JG,Karvonen M: Childhood BMI trajectories and the risk of developingyoung adult-onset diabetes. Diabetologia 2009, 52(3):408-414.
32. Expert Committee on the Diagnosis and Classification of Diabetes Mellitus:Report of the Expert Committee on Diagnosis and Classification ofDiabetes Mellitus. Diabetes Care 1997, 20(7):1183-1194.
33. Manson JE, Colditz GA, Stampfer MJ: A prospective study of maturity-onset diabetes mellitus and risk of coronary heart disease and stroke inwomen. Arch Intern Med 1991, 151(6):1141-1147.
34. Field AE, Coakley EH, Must A, Spadano JL, Laird N, Dietz WH, Rimm E,Colditz GA: Impact of overweight on the risk of developing commonchronic diseases during a 10-year period. Arch Intern Med 2001,161(13):1581-1586.
35. Likhari T, Aulakh TS, Singh BM, Gama R: Does HbA1C predict isolatedimpaired fasting glycaemia in the oral glucose tolerance test insubjects with impaired fasting glycaemia? Ann Clin Biochem 2008,45(4):418-420.
36. Kilpatrick ES: HbA1c of glucose for diabetes diagnosis? Ann Clin Biochem2005, 42(3):165-166.
37. Yudkin JS, Forrest RD, Jackson CA, Ryle AJ, Davie S, Gould BJ: Unexplainedvariability of glycated haemoglobin in non-diabetic subjects not relatedto glycemia. Diabetologia 1990, 33(4):208-215.
38. Snieder H, Sawtell PA, Ross L, Walker J, Spector TD, Leslie RD: HbA1c levelsare genetically determined even in type 1 diabetes: evidence fromhealthy and diabetic twins. Diabetes 2001, 50(12):2858-2863.
39. Barakat O, Krishnan ST, Dhatariya K: Falsely low HbA1c value due to a rarevariant of hemoglobin J-Baltimore. Prim Care Diabetes 2008, 2(3):155-157.
40. Maty SC, James SA, Kaplan GA: Life-course socioeconomic position andincidence of diabetes mellitus among blacks and whites: the AlamedaCounty Study, 1965-1999. Am J Public Health 2010, 100(1):137-45.
41. Lidfeldt J, Li TY, Hu FB, Manson JE, Kawachi I: A prospective study ofchildhood and adult socioeconomic status and incidence of type 2diabetes in women. Am J Epidemiol 2007, 165(8):882-889.
42. Maty SC, Lynch JW, Raghunathan TE, Kaplan GA: Childhood socioeconomicposition, gender, adult body mass index, and incidence of type 2diabetes mellitus over 34 years in the Alameda County Study. Am JPublic Health 2008, 98(8):1486-1494.
43. Gissler M, Rahkonen O, Järvelin MR, Hemminki E: Social class differences inhealth until the age of seven years among the finnish 1987 birth cohort.Soc Sci Med 1998, 46(12):1543-1552.
44. Kohler IV, Soldo BJ: Childhood predictors of late-life diabetes: the case ofMexico. Soc Biol 2005, 52(3-4):112-131.
45. Best LE, Hayward MD, Hidajat MM: Life course pathways to adult-onsetdiabetes. Soc Biol 2005, 52(3-4):94-111.
46. Kivimäki M, Smith GD, Juonala M, Ferrie JE, Keltikangas-Järvinen L,Elovainio M, Pulkki-Råback L, Vahtera J, Leino M, Viikari JS, Raitakari OT:Socioeconomic position in childhood and adult cardiovascular riskfactors, vascular structure, and function: cardiovascular risk in youngFinns study. Heart 2006, 92(4):474-480.
47. Langenberg C, Kuh D, Wadsworth ME, Brunner E, Hardy R: Socialcircumstances and education: life course origins of social inequalities inmetabolic risk in a prospective national birth cohort. Am J Public Health2006, 96(12):2216-2221.
Tamayo et al. BMC Public Health 2010, 10:525http://www.biomedcentral.com/1471-2458/10/525
Page 14 of 15
48. Thomas C, Hypponen E, Power C: Obesity and type 2 diabetes risk inmidadult life: the role of childhood adversity. Pediatrics 2008,121(5):1240-1249.
49. Hayes L, Pearce MS, Unwin NC: Lifecourse predictors of normal metabolicparameters in overweight and obese adults. Int J Obes (Lond) 2006,30(6):970-976.
50. Goodman E, Daniels SR, Dolan LM: Socioeconomic disparities in insulinresistance: results from the Princeton School District Study. PsychosomMed 2007, 69(1):61-67.
51. Edwards AM: Classification of occupations. J Am Stat Assoc 1911,12:618-646.
52. Statistics Finland: Classification of socioeconomic groups 1989. StatisticsFinland 1989 Handbooks 17, Helsinki [http://www.stat.fi/meta/luokitukset/ammatti/001-2001/koko_luokitus_en.html], assessed 20 may 2009.
53. British Registrar General’s Scale, adapted from Stevenson THC: The VitalStatistics of Wealth and Poverty. J R Stat Soc 1928, 91:207-230.
54. Novak M, Ahlgren C, Hammarström A: A life-course approach inexplaining social inequity in obesity among young adult men andwomen. Int J Obes (Lond) 2006, 30(1):191-200.
55. Power C, Manor O, Matthews S: Child to adult socioeconomic conditionsand obesity in a national cohort. Int J Obes Relat Metab Disord 2003,27(9):1081-1086.
56. Laitinen J, Power C, Jarvelin MR: Family social class, maternal body massindex, childhood body mass index, and age at menarche as predictorsof adult obesity. Am J Clin Nutr 2001, 74(3):287-294.
57. Salsberry PJ, Reagan PB: Taking the long view: the prenatal environmentand early adolescent overweight. Res Nurs Health 2007, 30(3):297-307.
58. Dubois L, Girard M: Early determinants of overweight at 4.5 years in apopulation-based longitudinal study. Int J Obes (Lond) 2006, 30(4):610-617.
59. Howe LD, Galobardes B, Sattar N, Hingorani AD, Deanfield J, Ness AR,Davey-Smith G, Lawlor DA: Are there socioeconomic inequalities incardiovascular risk factors in childhood, and are they mediated byadiposity? Findings from a prospective cohort study. Int J Obes (Lond) 2010.
60. Koupil I, Toivanen P: Social and early-life determinants of overweight andobesity in 18-year-old Swedish men. Int J Obes (Lond) 2008, 32(1):73-81.
61. Strauss RS, Knight J: Influence of the home environment on thedevelopment of obesity in children. Pediatrics 1999, 103(6):e85.
62. Gordon-Larsen P, Adair LS, Suchindran CM: Maternal obesity is associatedwith younger age at obesity onset in U.S. adolescent offspring followedinto adulthood. Obesity (Silver Spring) 2007, 15(11):2790-2796.
63. Bradley RH: Children’s home environments, health, behavior andintervention efforts: a review using the HOME inventory as a markermeasure. Genet Soc Gen Psychol Monogr 1993, 119(4):439-490.
64. Bradley RH: The HOME inventory: review and reflections. Adv Child DevBehav 1994, 25:242-288.
65. Kristensen PL, Wedderkopp N, Møller NC, Andersen LB, Bai CN, Froberg K:Tracking and prevalence of cardiovascular disease risk factors acrosssocio-economic classes: a longitudinal substudy of the European YouthHeart Study. BMC Public Health 2006, 6:20.
66. Elgar FJ, Roberts C, Moore L, Tudor-Smith C: Sedentary behaviour, physicalactivity and weight problems in adolescents in Wales. Public Health 2005,119(6):518-524.
67. Giskes K, van Lenthe FJ, Turrell G, Kamphuis CB, Brug J, Mackenbach JP:Socioeconomic position at different stages of the life course and itsinfluence on body weight and weight gain in adulthood: a longitudinalstudy with 13-year follow-up. Obesity (Silver Spring) 2008, 16(6):1377-1381.
68. Lee H, Harris KM, Gordon-Larsen P: Life Course Perspectives on the LinksBetween Poverty and Obesity During the Transition to YoungAdulthood. Popul Res Policy Rev 2009, 28(4):505-532.
69. Balistreri KS, Van Hook J: Socioeconomic status and body mass indexamong Hispanic children of immigrants and children of natives. Am JPublic Health 2009, 99(12):2238-2246.
70. Engum A: The role of depression and anxiety in onset of diabetes in alarge population-based study. J Psychosom Res 2007, 62(1):31-38.
71. Eaton WW, Armenian H, Gallo J, Pratt L, Ford DE: Depression and risk foronset of type II diabetes. A prospective population-based study. DiabetesCare 1996, 19(10):1097-1102.
72. Räikkönen K, Matthews KA, Salomon K: Hostility predicts metabolicsyndrome risk factors in children and adolescents. Health Psychology2003, 22(3):279-286.
73. Kouvonen AM, Väänänen A, Woods SA, Heponiemi T, Koskinen A,Toppinen-Tanner S: Sense of coherence and diabetes: a prospectiveoccupational cohort study. BMC Public Health 2008, 8:46.
74. Cox M, Boyle PJ, Davey P, Morris A: Does health-selective migrationfollowing diagnosis strengthen the relationship between Type 2diabetes and deprivation? Soc Sci Med 2007, 65(1):32-42.
75. Schootman M, Andresen EM, Wolinsky FD, Malmstrom TK, Miller JP, Yan Y,Miller DK: The effect of adverse housing and neighborhood conditionson the development of diabetes mellitus among middle-aged AfricanAmericans. Am J Epidemiol 2007, 166(4):379-387.
76. Wilsgaard T, Jacobsen BK: Lifestyle factors and incident metabolicsyndrome. The Tromsø Study 1979-2001. Diabetes Res Clin Prac 2007,78(2):217-224.
77. Perkonigg A, Owashi T, Stein MB, Kirschbaum C, Wittchen HU:Posttraumatic stress disorder and obesity: evidence for a riskassociation. Am J Prev Med 2009, 36(1):1-8.
78. Coogan PF, Cozier YC, Krishnan S, Wise LA, Adams-Campbell LL,Rosenberg L, Palmer JR: Neighborhood Socioeconomic Status in Relationto 10-Year Weight Gain in the Black Women’s Health Study. Obesity(Silver Spring) 2010.
79. Koch FS, Sepa A, Ludvigsson J: Psychological stress and obesity. J Pediatr2008, 153(6):839-44.
80. Robinson WR, Stevens J, Kaufman JS, Gordon-Larsen P: The Role ofAdolescent Behaviors in the Female-Male Disparity in Obesity Incidencein US Black and White Young Adults. Obesity (Silver Spring) 2009.
81. Liberatos P, Link BG, Kelsey JL: The measurement of social class inepidemiology. Epidemiol Rev 1988, 10:87-121.
82. Liem ET, Sauer PJ, Oldehinkel AJ, Stolk RP: Association between depressivesymptoms in childhood and adolescence and overweight in later life:review of the recent literature. Arch Pediatr Adolesc Med 2008,162(10):981-988.
83. Knol MJ, Twisk JW, Beekman AT, Heine RJ, Snoek FJ, Pouwer F: Depressionas a risk factor for the onset of type 2 diabetes mellitus. A meta-analysis. Diabetologia 2006, 49(5):837-845.
84. Brown LC, Majumdar SR, Newman SC, Johnson JA: History of depressionincreases risk of type 2 diabetes in younger adults. Diabetes Care 2005,28(5):1063-1067.
85. Turner RJ, Wheaton B, Lloyd DA: The epidemiology of social stress. AmSociol Rev 1995, 60:104-125.
86. Pouwer F, Kupper N, Adriaanse MC: Does emotional stress cause type 2diabetes mellitus? A review from the European Depression in Diabetes(EDID) Research Consortium. Discov Med 2010, 9(45):112-118.
87. Laitinen J, Power C, Ek E, Sovio U, Järvelin MR: Unemployment and obesityamong young adults in a northern Finland 1966 birth cohort. Int J ObesRelat Metab Disord 2002, 26(10):1329-1338.
88. Lehman BJ, Taylor SE, Kiefe CI, Seeman TE: Relation of childhoodsocioeconomic status and family environment to adult metabolicfunctioning in the CARDIA study. Psychosom Med 2005, 67(6):846-854.
89. Bourdieu P: La distinction. Critique sociale du jugement. Éditions deMinuit. Paris 1979.
90. Taylor SE, Stanton AL: Coping resources, coping processes, and mentalhealth. Annu Rev Clin Psychol 2007, 3:377-401.
91. Sallis JF, Saelens BE, Frank LD, Conway TL, Slymen DJ, Cain KL, Chapman JE,Kerr J: Neighborhood built environment and income: examining multiplehealth outcomes. Soc Sci Med 2009, 68(7):1285-1293.
92. Veugelers P, Sithole F, Zhang S, Muhajarine N: Neighborhoodcharacteristics in relation to diet, physical activity and overweight ofCanadian children. Int J Pediatr Obes 2008, 3(3):152-159.
93. Sergeant JC, Firth D: Relative index of inequality: definition, estimation,and inference. Biostatistics 2006, 7:213-224.
Pre-publication historyThe pre-publication history for this paper can be accessed here:http://www.biomedcentral.com/1471-2458/10/525/prepub
doi:10.1186/1471-2458-10-525Cite this article as: Tamayo et al.: Impact of early psychosocial factors(childhood socioeconomic factors and adversities) on future risk of type2 diabetes, metabolic disturbances and obesity: a systematic review.BMC Public Health 2010 10:525.
Tamayo et al. BMC Public Health 2010, 10:525http://www.biomedcentral.com/1471-2458/10/525
Page 15 of 15