Embed Size (px)
Citation preview

Oregon
Property Tax
Statistics
Fiscal Year 2015-16
150-303-405 (Rev. 8-16)
Publication OR-PTS
Ore
go
n P
rop
erty
Tax S
tatis
tics
– F
isc
al Y
ea
r 20
15
-16

To order additional copies, please contact:
Publications
Oregon Department of Revenue
955 Center Street NE
Salem OR 97301-2555
503-945-8625
Statistical publications are also available on our web site:
http://www.oregon.gov/DOR/
Please cite this publication when using information derived from it.
Taxpayer assistance
General tax information ....................... www.oregon.gov/DOR
Salem ................................................................. 503-378-4988
Toll-free from an Oregon prefix ....................... 1-800-356-4222
Asistencia en español:
Salem ................................................................. 503-378-4988
Gratis de prefijo de Oregon ........................... 1-800-356-4222
TTY (hearing or speech impaired; machine only):
Salem ................................................................. 503-945-8617
Toll-free from an Oregon prefix .................... 1-800-886-7204
Americans with Disabilities Act (ADA): Call one of the help numbers for information in alternative
formats.
Oregon
Property Tax
Statistics
Fiscal Year 2015-16
Prepared by
Research Section
Principal analyst: Tim Fitzgerald
Oregon Department of Revenue
Salem OR 97301-2555
150-303-405 (Rev. 8-16)
Publication OR-PTS


i
Table of Contents
Page
I. INTRODUCTION .......................................................................................................................... 1
II. HIGHLIGHTS ................................................................................................................................ 3
III. BASIC PROPERTY TAX CONCEPTS IN HISTORICAL CONTEXT ................................ 9
IV. HOW THE PROPERTY TAX SYSTEM WORKS ................................................................... 13
1. Assessment ................................................................................................................................... 13
2. Tax Authority and Tax Due Calculation ...................................................................................... 15
3. Urban Renewal............................................................................................................................. 16
4. Tax Collection .............................................................................................................................. 17
5. Tax Relief..................................................................................................................................... 18
6. How Property Taxes Are Determined for an Individual Property ............................................... 18
V. DETAILED TABLES .................................................................................................................. 21
Assessment
1.1 Total Assessed Value by Property Class ............................................................................. 24
1.2 Total Real Market and Assessed Value by County and Property Type............................... 25
1.3 Total Assessed Value of Centrally Assessed Property by County ...................................... 26
1.4 Total and Net Assessed Value of Property by County ........................................................ 27
1.5 Real Market Value and Net Assessed Value of Property, Property Tax Imposed,
and Average Tax Rates by Type of Taxing District……………………………………….28
1.6 Real Market Value and Net Assessed Value of Property, Property Tax Imposed
and Average Tax Rates by County………………………………………………………...29
1.7 Assessed and Real Market Value of Fully and Partially Exempt Property by County ....... 30
1.8 Assessed and Real Market Value of Specially Assessed Farmland and Forestland ............ 31
1.9 Board of Property Tax Appeals (BOPTA) by County ......................................................... 32
Tax Authority and Tax Due Calculation
2.1 Growth in Tax Imposed by Category of Tax and County ................................................... 34
2.2 Growth in Tax Imposed by Category of Tax and Type of District...................................... 35
2.3 Tax Extended, Tax Imposed, and Compression Loss by County ........................................ 36
2.4 Tax Extended, Tax Imposed, and Compression Loss by Type of Taxing District .............. 37
2.5 Change in Tax Imposed and Compression Loss by County ................................................ 38
2.6 Change in Tax Imposed and Compression Loss by Type of Taxing District ...................... 39

ii
Urban Renewal
3.1 Urban Renewal Excess Value Used and Revenue by Urban Renewal Plan Area ............... 42
3.2 Urban Renewal Division of Tax Revenue by Agency, County, Type of Levy,
and District Type .................................................................................................................45
Tax Collection
4.1 Property Tax Certified, Collected, and Uncollected for all Years, by County .................... 54
4.2 Property Tax Certified, Collected, and Uncollected for FY 2014-15, by County ............... 55
APPENDIX: GLOSSARY .................................................................................................................. 57
List of Exhibits
Exhibit 1 Oregon Property Values and Taxes Imposed.................................................................... 3
Exhibit 2a Property Taxes Imposed by Type of District .................................................................... 4
Exhibit 2b Property Taxes Imposed by Type of Tax .......................................................................... 4
Exhibit 3 Type of Property Taxes Imposed by Type of District ...................................................... 5
Exhibit 4 Percent of Total Taxes Imposed by Property Class .......................................................... 6
Exhibit 5 Effective Tax Rates by County ......................................................................................... 7
Exhibit 6 Assessed and Real Market Values of Property in Oregon ................................................ 10
Exhibit 7 Average Growth in Taxes by Levy Type, FY 1997-98 to 2015-2016 .............................. 10
Exhibit 8 Property Taxes Imposed, FY 1960-61 to 2015-16............................................................ 11
Exhibit 9 Annual Growth in Property Taxes Imposed, FY 1961-62 to 2015-16 ............................. 11
Exhibit 10 Average Tax Rate per $1,000 of RMV and AV, FY 1982-83 to 2015-16 ....................... 12
Exhibit 11 Property Taxes as Share of Oregon Personal Income, FY 1961-62 to 2015-16 ............... 12
Exhibit 12 Simplified Property Tax Calculation for a Residential Property ...................................... 19

Section I
Introduction
Oregon Department of Revenue, Research Section 1
regon’s property tax is one of the most important sources of revenue for the public sector in
Oregon, raising $6.0 billion for local governments in fiscal year (FY) 2015-16. Only state personal
income tax collections exceed property tax collections as a single source of state and local tax revenue.
This publication describes Oregon’s property tax system through the presentation of statistical
information. Specifically, it presents assessed values, market values, and taxes imposed by county and
type of taxing district. In addition, the publication contains a brief overview of Oregon’s property tax
since 1990. The subsequent sections of this document contain the following:
Highlights: This section illustrates distinguishing features of FY 2015-16 and recent trends in
Oregon’s property tax system.
Basic Property Tax Concepts in Historical Context: This section briefly describes the property tax
system that resulted from Measures 5 and 50, two of the most significant changes to the property tax
system, both of which were instituted during the 1990s. The section also discusses the basic terms used
throughout the publication.
How the Property Tax System Works: This section explains the steps of the property tax process in
Oregon and connects it with the statistical tables in the Detailed Tables section. These tables contain
information on property values and taxes imposed, by both county and type of district. Taxes
collected and uncollected by county are also included.
Appendix: This final section contains a glossary of the terms used in the publication.
The information in this publication is presented primarily by county or district type. Property values
reported within this publication are based upon a January 1 assessment date prior to the fiscal year
reported. For example, values reported for Fiscal Year 2015-16 refer to value that existed as of January
1, 2015.1 Additional information about property taxes is available in three other Department of Revenue
publications:
Oregon Property Tax Statistics Supplement, Fiscal Year 2015-16 provides extensive detail on
property taxes and assessed values at the taxing district level, as well as property class information
and city-level data on property tax rates.
A Brief History of Oregon Property Taxation discusses the history of property taxation, with a focus
on changes since 1990.
The State of Oregon 2015-2017 Tax Expenditure Report contains detailed information about
property tax exemptions.
All of these reports are available on the Oregon Department of Revenue website:
www.oregon.gov/DOR/ .
1 See Section IV (4) “Tax Collection” for more information on the annual calendar of dates used in the assessment process.
O


Section II
Highlights
Oregon Department of Revenue, Research Section 3
xhibit 1 below gives an overview of real market and assessed property values and taxes imposed for
fiscal years 2014-15 and 2015-16. The total real market value of taxable property in Oregon in FY
2015-16 was $506 billion2, an increase of 7.8 percent from the previous fiscal year. Total real market
value of property in Oregon is still less than the peak of the recent housing bubble when it reached $525
billion in FY 2008-09. Growth in total assessed value, the property value subject to tax, was 4.6 percent
in FY 2015-16, for a total assessed value of $371 billion.3 Assessed value of residential property
represents 53 percent of all assessed property value (this increases to 61 percent when tract property,
which is property available for residential development, is included). Three Portland area metropolitan
counties (Multnomah, Washington, and Clackamas) contain 53 percent of the residential property value
in Oregon.
Statewide, the ratio of assessed value to real market value decreased slightly from 0.755 in FY 2014-15
to 0.732 in FY 2015-16. A decreasing ratio means that real market values are growing faster than
assessed values; growth in assessed values are generally capped at 3 percent per year for existing
properties. Exhibit 6 on page 10 shows the trend for real market value and assessed value.
Property taxes imposed in Oregon totaled $6.04 billion in FY 2015-16, an increase of 4.8 percent from
FY 2014-15. Since 1997-98, the first fiscal year following implementation of Measure 50, annual growth
in property taxes imposed has averaged 5.1 percent.
Compression, the reduction in the property tax owed on an individual property due to rate limitations
created by Measure 5 (1990), also reduces the amount of tax imposed in the state. In FY 2015-16,
compression reduced total taxes owed by $156 million. Measure 5 compression is best measured as a
2 This reflects property values as of January 1, 2015, and does not include value exempt from taxation. 3 See subsection “Measure 50” on page 9 for a description of taxable assessed and real market values, and for an explanation as to why assessed values may
increase during times of decreasing real market values.
FY 2014-15 FY 2015-16
Percent
Change
469,453 506,152 7.8%
354,336 370,564 4.6%
343,171 358,867 4.6%
4,761 5,025 5.5%
780 793 1.7%
220 221 0.7%
5,760 6,038 4.8%
Exhibit 1—Oregon Property Values and Taxes Imposed
Dollars in millions
Real Market Value*
Total Assessed Value*
Net Assessed Value*
Total All Taxes
* For a discussion of the terms please refer to Section 3, Basic Tax Concepts in
Historical Context or the Glossary.
** Urban renewal taxes includes those from tax increment financing and special levies.
Urban Renewal Taxes**
Operating Taxes*
Bond Taxes
E

Section II: Highlights
4 Oregon Department of Revenue, Research Section
percentage of taxes that would have otherwise been collected (tax extended) if not for the Measure 5 rate
limitations.4 Statewide compression as a percentage of tax extended for non-urban renewal districts was
3.0 percent for FY 2015-16, down from 3.6 percent in FY 2014-15. More data on compression can be
found on the detailed tables 2.3 through 2.6 in Section V of this report.
More than 1,300 districts impose property taxes in Oregon. Exhibit 2a illustrates the relative share of
property taxes that each type of district imposes, with K-12 schools and Education Service Districts
(ESDs) receiving the largest share (41 percent of the total). Cities (21 percent), counties (17 percent),
and community colleges (4 percent) are the next largest district categories. All other special districts,
such as fire, road, library, water, hospital, and park districts represent the largest number of districts, but
impose only 14 percent of the taxes. The share of taxes by district type has been very stable over the last
several years.
Exhibit 2b shows the four primary components of property tax revenue: 1) permanent rate,5 2) bond
levies, 3) local option levies (also called local option taxes), and 4) urban renewal revenues. Taxes from
permanent rates are the most significant portion of property taxes, representing 77 percent of all property
taxes imposed. The shares of these four types of taxes in total revenue have remained mostly unchanged
for the last few years.
Exhibit 3 on the following page presents a composition of taxes by type of taxing district for FY 2014-15
and FY 2015-16. It is worth noting that statewide figures presented here result from a wide range of
individual district characteristics. For example, over a hundred districts (of the roughly 1,300) did not
impose taxes in FY 2015-16; these were mostly water, sanitary, and road districts. When large districts
have substantial changes in their taxes, they can noticeably impact the statewide numbers. The largest 25
districts by total assessed value accounted for about one third of all district property taxes imposed in FY
2015-16. Detailed data about specific taxing districts, including the assessed and real market value of
property within a district, the types of levies used by districts, and division of tax for urban renewal plan
areas are available in the Oregon Property Tax Statistics Supplement on the Oregon Department of
Revenue website.
4 See subsection “Determination of Tax and Compression” on page 16 for more information on how compression is calculated. 5 For simplicity, we include the only remaining gap bond, the Portland pension levy, in with the permanent rates in the Highlights section. See Section IV (2) for more information on gap bond levies.
41%
21%
17%
14%
4%
4%
K-12 & ESDs
Cities
Counties
Special Districts
Comm. Colleges
Urban Renewal
Exhibit 2aFY 2015-16 Property Taxes Imposed
by Type of District*
77%
13%
7%
4%
Permanent Rate
Bond
Local Option
Urban Renewal
Exhibit 2b FY 2015-16 Property Taxes Imposed
by Type of Tax*
* %'s are rounded

Section II: Highlights
Oregon Department of Revenue, Research Section 5
Several points related to this table are worth noting:
Taxes from permanent rates grew by 4.8 percent in FY 2015-16. Permanent rates are the largest
component of total taxes, ranging from 45 percent for sanitary districts to 100 percent for education
service districts (ESDs). See Table 2.2 on page 35 for more information on the breakdown of tax
imposed by the various district types.
Overall, local option taxes increased by 14.3 percent from the last fiscal year, accounting for 7
percent of total taxes imposed by districts. Community college districts have had the option to use
local option levies since 2001, but none have so far. Local options are not available for ESDs.
The combined growth of permanent levies and local option levies (the combination is commonly
referred to as operating levies) was 5.5 percent.
Bond revenues, the primary funding for capital projects, increased by 1.7 percent. Two-thirds of all
bond dollars in FY2015-16 were for schools, which is about the average for the last decade.
Statewide, 197 school districts imposed property taxes this year; 22 of those districts had a local
option levy and 119 had one or more bond measures. Overall, 30 percent of property taxes imposed
by K-12 districts are collected through these voter-approved mechanisms. See the Oregon Property
Tax Statistics Supplement, available at the Oregon Department of Revenue website, for data on
specific districts.
Urban renewal revenue increased 0.7 percent in FY 2015-16, following a 3.5 percent increase in FY
2014-15. Revenues from both taxation of excess value and from urban renewal special levies
increased this year.6 Seventy-seven urban renewal plan areas increased the amount of revenue they
received in FY 2015-16, while twenty-nine plan areas raised less revenue than the previous year.
6 See Section IV (3) “Urban Renewal” on page 16 for more information on the financing of urban renewal districts.
Dollars in millions
Type of District 14-15 15-16 % CH 14-15 15-16 % CH 14-15 15-16 % CH 14-15 15-16 % CH
Counties 845 888 5.1% 94 101 7.8% 26 21 -18.6% 965 1,011 4.7%
Cities 1,069 1,116 4.4% 61 68 11.8% 79 83 5.0% 1,209 1,267 4.8%
K-12 & ESDs 1,694 1,775 4.8% 134 155 15.9% 520 550 5.6% 2,348 2,481 5.6%
Community Colleges 154 162 4.8% 0 0 N/A 81 72 -11.2% 235 233 -0.7%
Special Districts 646 680 5.3% 64 79 23.1% 73 67 -8.7% 783 825 5.4%
Total District Taxes 4,408 4,621 4.8% 353 403 14.3% 780 793 1.7% 5,541 5,817 5.0%
Urban Renewal Agencies 220 221 0.7%
Total 5,760 6,038 4.8%
Exhibit 3—Type of Property Taxes Imposed, FY 2014-15 and 2015-16By Type of District
Permanent Rate Local Option TotalBond

Section II: Highlights
6 Oregon Department of Revenue, Research Section
Exhibit 4 displays an approximate percentage of total property taxes imposed by primary property class
for FY 2015-16. As shown, residential properties comprised the majority of tax imposed followed by
commercial and locally assessed industrial properties, and tract land. Exhibit 4 values are based on tax
bill summary reports provided by thirty of Oregon’s thirty-six counties.7 Because the estimate does not
include data from six counties, actual statewide percentages may differ slightly from approximates
displayed in the exhibit.
Exhibit 5 on the following page presents the average ad valorem8 tax rate for all properties within each
county.9 Actual tax imposed on any individual property is calculated on an individual property basis, and
imposed tax amounts differ depending upon a property’s particular circumstances. In general, taxes are
calculated based on taxing district rates applied to the assessed value of a property, but operating taxes
are limited to no more than $10 per thousand dollars of real market value for general government
districts, and $5 per thousand for education districts.10 Overall statewide imposed property taxes
averaged $16.30 per thousand dollars of assessed value, and $11.93 per thousand dollars of real market
value.
7 DOR receives tax bill summary reports through the Oregon Association of County Tax Collectors data exchange program. Six counties are either not
members of the data exchange program, or did not provide tax bill summary files. The 30 counties that provided data include 99 percent of all property real market value in Oregon and 99 percent of tax imposed. 8 See the glossary, page 57, for specific definitions of terms. 9 Tax rates in Exhibit 5 differ from those presented in Table 1.6 on page 29 because urban renewal taxes are excluded from the rates presented in Table 1.6. 10 The calculation of property taxes is explained in more detail in Section IV.
56.7%
14.7%
6.4%
5.3%
5.2%
3.2%
2.8%
2.7%
1.7%
0.9%
0.5%
Residential
Comm / Indust***
Tract Land
Multi-Family
Miscellaneous
Central Industrial**
Farm
Personal Prop
Forest
Recreation
Manufactured
Exhibit 4 Estimated Percent of Total Taxes Imposed by Primary Property Class,
FY 2015-16*
*Estimated percentages are based on tax bill summary files reported by 30 of Oregon's 36 counties.
**Central Industrial refers to large industrial properties that are assessed by the Department of Revenue.
***Commercial and locally assessed industrial property classes were merged into a single class - ORS 308.215 (2013 edition)

Section II: Highlights
Oregon Department of Revenue, Research Section 7
Total Tax Imposed Total Real Market Value Total Assessed Value Average Tax Rate Average Tax Rate
(RMV) (AV)
County (Thousands of Dollars) (Thousands of Dollars) (Thousands of Dollars) (per $1000 of RMV) (per $1000 of AV)
Baker 18,143 1,683,494 1,392,640 $10.78 $13.03
Benton 125,022 10,037,213 7,601,093 $12.46 $16.45
Clackamas 719,276 56,343,848 44,289,384 $12.77 $16.24
Clatsop 69,758 7,516,836 5,705,270 $9.28 $12.23
Columbia 64,948 5,714,983 4,712,236 $11.36 $13.78
Coos 62,416 6,061,057 5,012,689 $10.30 $12.45
Crook 24,942 2,270,641 1,845,840 $10.98 $13.51
Curry 24,764 3,218,603 2,800,498 $7.69 $8.84
Deschutes 315,413 28,841,302 20,933,290 $10.94 $15.07
Douglas 96,820 10,022,265 8,576,128 $9.66 $11.29
Gilliam 9,001 901,058 751,180 $9.99 $11.98
Grant 7,313 652,325 539,688 $11.21 $13.55
Harney 7,099 745,064 514,407 $9.53 $13.80
Hood River 31,065 3,350,140 2,245,768 $9.27 $13.83
Jackson 270,669 23,707,721 18,499,539 $11.42 $14.63
Jefferson 25,406 2,092,066 1,589,592 $12.14 $15.98
Josephine 62,480 8,206,959 6,944,419 $7.61 $9.00
Klamath 63,974 6,701,483 5,418,247 $9.55 $11.81
Lake 12,770 1,201,389 967,525 $10.63 $13.20
Lane 475,640 41,304,027 30,453,751 $11.52 $15.62
Lincoln 100,172 8,115,795 7,111,632 $12.34 $14.09
Linn 144,979 10,632,638 9,017,708 $13.64 $16.08
Malheur 23,917 2,060,572 1,791,973 $11.61 $13.35
Marion 366,928 27,893,950 22,488,589 $13.15 $16.32
Morrow 31,874 3,254,274 2,047,974 $9.79 $15.56
Multnomah 1,510,176 119,611,750 72,186,765 $12.63 $20.92
Polk 83,987 6,398,670 5,358,665 $13.13 $15.67
Sherman 6,987 553,463 439,753 $12.62 $15.89
Tillamook 49,943 5,670,955 4,501,292 $8.81 $11.10
Umatilla 83,110 7,051,500 5,193,608 $11.79 $16.00
Union 24,749 2,396,934 1,794,754 $10.33 $13.79
Wallowa 8,378 1,058,680 730,340 $7.91 $11.47
Wasco 35,011 2,960,678 2,120,282 $11.83 $16.51
Washington 958,219 77,393,915 56,908,257 $12.38 $16.84
Wheeler 2,186 222,341 129,115 $9.83 $16.93
Yamhill 120,947 10,303,700 7,950,155 $11.74 $15.21
Statewide 6,038,478 506,152,289 370,564,047 $11.93 $16.30
Notes: Total Tax Imposed includes all taxing districts, all urban renewal division of tax, and all urban renewal special levies.
Total taxable Measure 5 Value (M5V) is used for Real Market Value (RMV) in this table. See glossary, page 57, for specific definition of terms.
Exhibit 5: Total Property Tax Imposed, Total Assessed Value, Total Real Market Value, and Average Effective Tax Rates
FY 2015-16 by County


Section III
Basic Property Tax Concepts in Historical Context
Oregon Department of Revenue, Research Section 9
ocal governments in Oregon began taxing property before statehood, but the structure of the tax
changed very little until the 1990s when two statewide ballot measures dramatically altered the
system. To find more detailed information on the history of Oregon property taxes, please refer to the
publication “A Brief History of Oregon Property Taxation” that can be found at the Oregon Department
of Revenue website.
Pre-Measure 5. Prior to Measure 5, which became effective beginning in FY 1991-92, Oregon had a
pure levy-based property tax system. Each taxing district calculated its own tax levy based on its budget
needs. County assessors estimated the real market values of all property in the state. At this time, a
property’s assessed and real market values were equal. The levy for each taxing district was then divided
by the total real market value in the district to arrive at a district tax rate. The taxes each district imposed
equaled its tax rate multiplied by the real market value of all the properties within the district’s
boundaries. The tax rate for an individual property depended on the combination of taxing districts in
which it resided. Taxes for each property were calculated by adding the tax rates for the relevant taxing
districts to arrive at a consolidated tax rate. That tax rate was multiplied by the assessed value of the
property to determine the tax imposed on that property. Most levies were constitutionally limited to an
annual growth rate of 6 percent, and levies that would increase by more than 6 percent required voter
approval.
Measure 5. Starting in FY 1991-92, Measure 5 introduced constitutional limits on the taxes imposed on
individual properties. The individual property tax limits of $5 per $1,000 real market value for school
taxes and $10 per $1,000 real market value for general government taxes applied only to operating taxes,
not bonds.11 If the total taxes for either school or general government exceeded the set limits for a
property, then each corresponding taxing district would have its tax rate reduced proportionately until
the tax limit was reached. This process of reducing taxes based on Measure 5 rate limits is called
compression and the resulting tax reduction is referred to as compression loss.
Measure 50. The objective of Measure 50, passed in 1997, was to reduce property taxes in FY 1997-98
and to control their future growth. It achieved these goals by making three changes: shifting district
permanent authorities from levy based to rate based,12 reducing assessed values of individual properties,
and limiting annual growth of assessed value. Assessed value (AV) is the value of the property subject to
taxation for a given year and is the lower of the property’s maximum assessed value (MAV) and the
Real market value (RMV). RMV is the amount the assessor has calculated the property could sell for in
an arm’s length transaction on January 1 of the assessment year. It is used to establish Measure 5 value
and, for new property added to the roll, is a significant factor in establishing assessed value. Measure 5
value is used to check the $5 and $10 of tax per $1,000 of value rate limits set forth in the Oregon
Constitution by Measure 5. Measure 5 value is generally equal to RMV with the exception of specially
assessed property (e.g. farm and forest lands) and partially exempt property. Measure 50 separated a
property’s AV from its real market value beginning in tax year 1997-98 when a property’s MAV was set
11 The limit for school taxes was $15 per $1,000 real market value in 1991-92. It was reduced by $2.50 each year until it reached a rate of $5 per $1,000 real
market value in 1995-96. 12 Districts were allowed to continue gap bond levies to meet the funding commitments that were made prior to 1996.
L

Section III: Basic Property Tax Concepts in Historical Context
10 Oregon Department of Revenue, Research Section
at 90 percent of the property’s 1995-96 real market value. Measure 50 also limited a property’s MAV
growth to no more than 103 percent of its previous year’s MAV (assuming no substantial improvements
were made to the property). To calculate the MAV for a new property the assessor multiplies the RMV
by the changed property ratio (CPR). The CPR is the ratio of MAV to RMV for existing properties in
the county; each class of property (residential, commercial/industrial, farmland, etc.) has its own CPR.
When implemented in 1997-98, the subsequent effect of Measure 50 was an average effective tax rate
reduction of 11 percent compared to the previous tax year.
Exhibit 6 displays the relationship between total real market and assessed values for the past 31 years.
Due to Measure 50 requirements, 1997-98 total assessed value fell 12.5 percent below the prior year and
21 percent below the 1997-98 real market value. Since 1997-98, statewide assessed value has been
increasing each year. However, from 1997-98 through 2007-08, assessed value grew at a rate slower
than real market value because the maximum assessed values of unchanged individual properties are
subject to a 3 percent annual growth limit.
The two most prominent sources of growth in total assessed
value are changes in the value of existing property and
construction of new property. While Measure 50 generally
limits the growth of maximum assessed value on existing
properties to 3 percent, the assessed value of an existing
property can increase by more than 3 percent if the property
had major renovations, new improvements, or if the property
is rezoned in such a way that it increases the sale value. New
property, such as a newly constructed home, represents a new source of assessed value.
Both Measure 5 and Measure 50 were aimed at limiting property taxes. Exhibits 7, 8, and 9 display the
trend in Oregon property taxes imposed for the last several decades. For many years prior to the 1990s,
statewide property taxes grew steadily. The limitations of Measures 5 and 50 resulted in nearly a decade
$0
$100
$200
$300
$400
$500
$600
1985-86 1988-89 1991-92 1994-95 1997-98 2000-01 2003-04 2006-07 2009-10 2012-13 2015-16
Va
lue
($
Bil
lio
n)
Exhibit 6Assessed and Real Market Values of Property in Oregon
FY 1985-86 to 2015-16
RMV AV
Exhibit 7 - Average Growth in Taxes
by Levy Type FY 1997-98 to 2015-16
Levy Type Avg. Annual Growth
Permanent 5.1%
Local Option 18.3%
Bond 4.8%
Urban Renewal 4.7%
Total 5.4%

Section III: Basic Property Tax Concepts in Historical Context
Oregon Department of Revenue, Research Section 11
without significant overall growth. Overall growth in property taxes per year since 1997-98 has been 5.4
percent, compared to about 6.4 percent annual growth from the 1982-83 tax year to the 1989-90 tax year,
and about 10 percent from 1970-71 to 1981-82. Exhibit 7 displays the average growth in property taxes
by levy type for fiscal year 1997-98 to present. Exhibit 8 displays the total property taxes imposed from
the 1960s to present, while Exhibit 9 displays the annual growth over the same period13. In the most
recent fiscal year, overall imposed tax growth was about 5 percent, matching the average annual growth
rate of imposed taxes since Measure 50 took effect in FY 1997-98.
13 Exhibits 7, 8, and 9 show figures for property tax imposed in actual dollars; they are not adjusted for inflation or population growth.
$0
$1
$2
$3
$4
$5
$6
$7
1960-61 1965-66 1970-71 1975-76 1980-81 1985-86 1990-91 1995-96 2000-01 2005-06 2010-11 2015-16
$ b
illi
on
s
Exhibit 8 Total Property Taxes Imposed
FY 1960-61 to 2015-16
Measure 5 Fully Phased In
Measure 5 Begins
First Year Measure 50
Section III: Basic Property Tax Concepts in Historical Context
12 Oregon Department of Revenue, Research Section
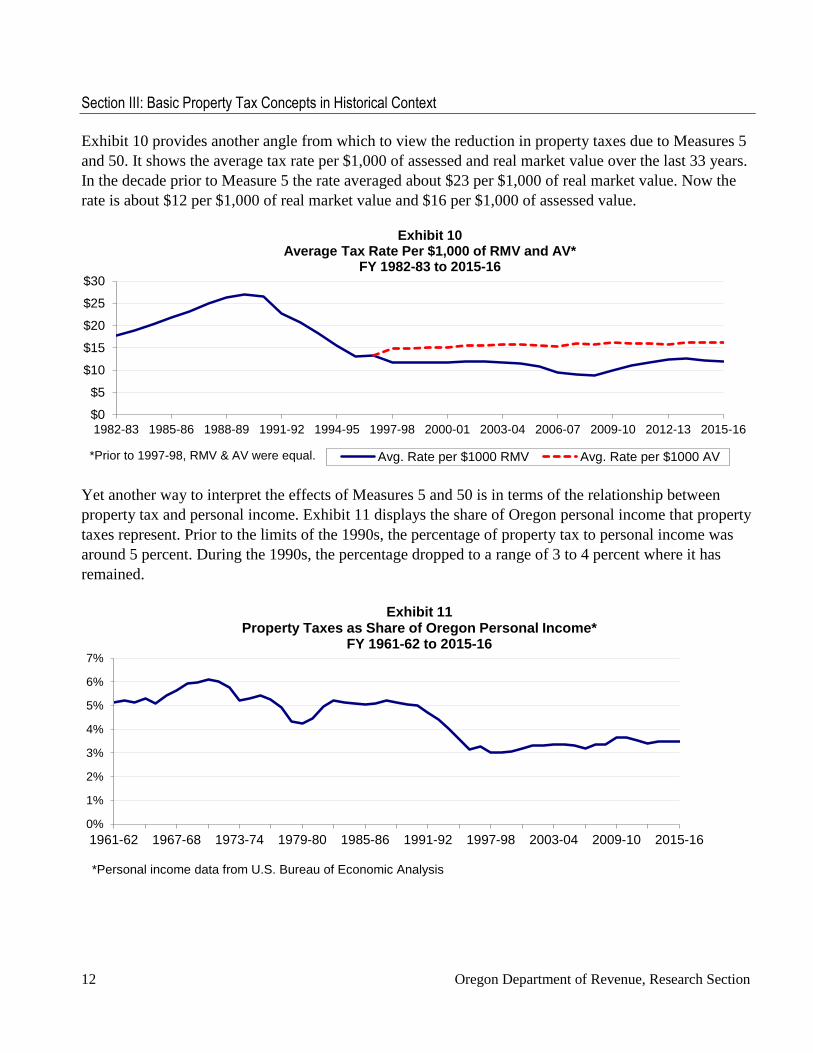
Exhibit 10 provides another angle from which to view the reduction in property taxes due to Measures 5
and 50. It shows the average tax rate per $1,000 of assessed and real market value over the last 33 years.
In the decade prior to Measure 5 the rate averaged about $23 per $1,000 of real market value. Now the
rate is about $12 per $1,000 of real market value and $16 per $1,000 of assessed value.
Yet another way to interpret the effects of Measures 5 and 50 is in terms of the relationship between
property tax and personal income. Exhibit 11 displays the share of Oregon personal income that property
taxes represent. Prior to the limits of the 1990s, the percentage of property tax to personal income was
around 5 percent. During the 1990s, the percentage dropped to a range of 3 to 4 percent where it has
remained.
$0
$5
$10
$15
$20
$25
$30
1982-83 1985-86 1988-89 1991-92 1994-95 1997-98 2000-01 2003-04 2006-07 2009-10 2012-13 2015-16
Exhibit 10 Average Tax Rate Per $1,000 of RMV and AV*
FY 1982-83 to 2015-16
Avg. Rate per $1000 RMV Avg. Rate per $1000 AV*Prior to 1997-98, RMV & AV were equal.
0%
1%
2%
3%
4%
5%
6%
7%
1961-62 1967-68 1973-74 1979-80 1985-86 1991-92 1997-98 2003-04 2009-10 2015-16
Exhibit 11Property Taxes as Share of Oregon Personal Income*
FY 1961-62 to 2015-16
*Personal income data from U.S. Bureau of Economic Analysis

Section IV
How the Property Tax System Works
Oregon Department of Revenue, Research Section 13
his section and the subsequent subsections provide an overview of property tax administration and
introduce the detailed tables in Section V.
1. Assessment, explains the process of assigning taxable values to properties.
2. Tax Authority and Tax Due Calculation, provides an overview of types of taxes and an explanation
of how tax limits are tested.
3. Urban Renewal, explains operations of urban renewal agencies.
4. Tax Collection, explains when and how property taxes are collected.
5. Tax Relief, describes tax relief programs that are currently in effect.
6. How Property Taxes are Determined for an Individual Property, offers an example of how
property tax imposed is calculated for a hypothetical property.
More extensive information on these topics can be found at the Property Tax Division’s section of the
Oregon Department of Revenue website.
1. Assessment
General Procedure
The process of identifying and assigning a value to taxable property is called assessment. County
assessors administer most property assessment and prepare the assessment rolls for each county, which
is a listing of all taxable property as of January 1 of each year. Assessment is performed to identify the
tax base to which tax rates apply. Table 1.1 in Section V of this report displays assessed value (AV) by
county and property class. Table 1.2 displays real market value (RMV) and AV by county, and type of
property.
The Oregon Department of Revenue assesses some property, including public utilities, and large
industrial properties with an improvement value greater than $1 million. Utility property is placed on a
separate assessment roll, which is transferred to the county assessment roll prior to the preparation of tax
bills. Small railcar utility properties, which represent a small piece of total value (less than 1 percent of
all utility property), cannot be attributed to specific counties. Assessors do not put the value of small
railcars on the roll; owners of these utilities pay taxes to the state, which then distributes the monies to
counties. Table 1.3 shows the AV of state centrally assessed utilities by utility type, prior to application
of exemptions and/or special assessments. Since the implementation of Measure 50 in 1997-98,
assessors track the assessed value and real market value for each property, in addition to any specially
assessed property and exempt property.
Net assessed value (NAV) is the value used to calculate district tax rates for dollar levies and is
calculated by summing assessed value, state fish and wildlife property value, nonprofit housing property
value, and subtracting urban renewal excess value (see Table 1.4 for breakdown of values) for all code
areas within a district. Both state fish and wildlife property and nonprofit housing property are added to
total assessed value because, while they do not pay property taxes directly to taxing districts, the state
T

Section IV: How the Property Tax System Works
14 Oregon Department of Revenue, Research Section
makes equivalent payments to taxing districts. Because property tax revenues derived from urban
renewal excess value go to urban renewal agencies instead of local taxing districts, NAV does not
include urban renewal excess value.14 Table 1.5 shows RMV and NAV by type of taxing district, while
Table 1.6 has a breakdown of RMV and NAV by county.
Exemptions and Special Assessments
Certain property owners receive exemptions from property taxation or have their properties assessed in a
special way. The value of an exempt property is adjusted prior to being placed on the roll by the
assessor. When the Legislature grants such exemptions, it is usually to pursue socially desirable
outcomes such as: helping educational and charitable organizations, encouraging economic development
in Oregon, protecting wildlife and forestlands, or to comply with federal law. Property can also be
exempt from taxation because of the complexity associated with taxing the property (e.g., personal
property for personal use).
The three primary ways of reducing the assessed value of property are:
Full exemption: A property is wholly exempt from taxation.
Partial exemption: Partial exemptions exist in several different forms. For example, a program may
exempt only a percentage of value, or only part of a property may qualify for exemption. Partial
exemptions also result when taxable value is frozen at a point in time, and all additions to value are
exempt from taxation.
Special assessment: Specially assessed properties are valued using an assessment technique that
results in a lower taxable value than would be the case if the usual assessment practice were used.
Table 1.7 presents AV and RMV by county for three broad categories of exemptions: public exemptions
(mostly property owned by governments of different levels), social welfare exemptions, and business,
housing and other exemptions. Table 1.8 provides AV and RMV for farmland and forestland by county.
Assessed value for farmland and forestland denotes assessed value of the specially assessed property.
Detailed information on property tax exemptions and special assessment can be found in the 2015-2017
State of Oregon Tax Expenditure Report, a companion document to the Governor’s Budget, available at
the Oregon Department of Revenue website.
Assessment Appeals
A property owner can appeal the valuation of their property to the local Board of Property Tax Appeals
(BOPTA).15 Petitions to the Board must be filed between October 25 and December 31. Petitions are
filed in the office of the county clerk in the county where the property is located.
14 Please see subsection 3, Urban Renewal, for more information. 15 In addition to a property owner, a person who holds an interest in a property that obligates the person to pay the taxes imposed on the property may appeal the valuation to BOPTA.

Section IV: How the Property Tax System Works
Oregon Department of Revenue, Research Section 15
A property owner or assessor may appeal the BOPTA decision regarding property value to the
Magistrate Division of the Oregon Tax Court. Magistrate decisions can be appealed to the Regular
Division of the Tax Court. Decisions of the Regular Division of the Tax Court can be appealed to the
Oregon Supreme Court.
Owners of industrial property appraised by the Oregon Department of Revenue must file their appeals
directly with the Magistrate Division of the Oregon Tax Court, rather than with the Board of Property
Tax Appeals. Detailed information about the appeal process can be found at the Oregon Department of
Revenue website.
Table 1.9 contains information about accounts appealed, the AV of appealed accounts, and net
reductions that resulted from BOPTA decisions.
2. Tax Authority and Tax Due Calculation
Tax Authority and Types of Taxes
Oregon statutes allow for the establishment of a wide variety of local entities which can impose tax to
provide services. Examples include counties, cities, school districts, sanitary districts, and water control
districts. Most properties in Oregon reside within five to ten different taxing districts. There are more
than 1,300 districts that impose property taxes in Oregon.
Property taxes are composed of three primary parts: 1) permanent rate and gap bond levies, 2) local
option levies, and 3) bond levies. In addition, urban renewal agencies get a portion of their revenue from
the aforementioned levies and can in some cases also impose special levies.16
Measure 50 established permanent rate limits for each taxing district based upon operating taxes that
each district historically had charged prior to the measure. Districts are allowed to impose tax on
properties up to their authority by notification to the county assessor. Voter approval is required to
establish permanent rates when new taxing districts are formed.
Gap bond levies are operating levies used to pay off indebtedness that was incurred prior to the passage
of Measure 50. The indebtedness had been paid out of operating taxes prior to passage of Measure 50,
and to protect that ability to pay indebtedness, Measure 50 allowed for the gap bond operating taxes to
continue to be imposed beyond the permanent rate authority. Because these levies were not part of the
Measure 50 permanent rate calculations in 1997, after the indebtedness has been paid off, they are
reduced and then added to the permanent rate authority. This preserved the district’s operating tax
authority at a level that would have been calculated if the gap bond levies had been pulled into the
permanent rates in 1997. As of FY 2015-16 only one gap bond levy remains, the Portland pension levy.
Districts can, with voter approval, establish local option levies (or local option taxes); temporary taxing
authority in addition to the district’s permanent rate authority. Typically, local option levies are
16 See subsection 3, Urban Renewal, for more information.
Section IV: How the Property Tax System Works
16 Oregon Department of Revenue, Research Section
established to fund specific operations of a district such as road repair or the operation of a library.
Bonds require voter approval and are a temporary levy that is exclusively used to fund construction and
other capital projects. Most bonds are levy-based and raise a specific dollar amount spread across all
properties in the district. Bond rates are not included when calculating Measure 5 rate limits for an
individual property, also referred to as being “outside the limit”.
Table 2.1 displays taxes levied by type of tax and county, while Table 2.2 shows the same information
broken out by type of taxing district for FY 2015-16.
Determination of Tax and Compression
Measure 50 replaced most tax levies with permanent tax rates. In addition to permanent levies,
temporary levies can be imposed through local options, bonds, or urban renewal special levies. For
dollar-based levies, usually bonds or urban renewal special levies, county assessors compute the tax rates
by dividing the levy amounts by the net assessed value within the taxing district. Those rates are then
added to the permanent rates to compute the total rate to be extended to a property. The tax extended to a
property is the total tax rate multiplied by the assessed value of the property.
Since Measure 5 limits must be tested, tax extended is not necessarily the tax imposed. The limits are $5
per $1,000 Measure 5 value for education taxes, and $10 per $1,000 Measure 5 value for general
government taxes. These limits are applied only to operating taxes (including urban renewal), not bond
levies. For each property, the assessor compares education taxes with the education limit and general
governmental taxes with the general government limit. If the amount of property tax extended exceeds
the Measure 5 limits, then taxes are compressed in a specific order until they meet the limit. First, local
option taxes are proportionally reduced, possibly to zero. If there are no local option taxes or they have
been reduced to zero, the permanent tax rates for each taxing district are then reduced proportionately.17
Total tax after compression is called tax imposed and is the amount billed to the property owner(s).
Table 2.3 shows tax extended, tax imposed and compression amounts by county and Table 2.4 provides
the breakdown by type of taxing district. Tables 2.5 and 2.6 demonstrate changes in tax imposed (both
inside and outside the measure 5 limit) and compression, by county and by type of taxing district for FY
2014-15 to FY 2015-16.
3. Urban Renewal
In Oregon, urban renewal agencies receive most of their revenues through a tax increment financing
mechanism. Urban renewal agencies can be approved by counties or cities with the objective of
eliminating blight within an area. Urban renewal agencies do not have the authority to impose taxes
(except for special levies), but they do get a portion of the property tax revenue that would otherwise
have gone to taxing districts if the agency did not exist. When an urban renewal plan area is created
(plan areas are created and administered by urban renewal agencies), the assessed value of the property
17 Gap bond levies are reduced also, if present.

Section IV: How the Property Tax System Works
Oregon Department of Revenue, Research Section 17
within the area’s boundaries is frozen at the amount calculated from the most recently certified tax roll
prior to the plan’s approval. The agency then raises revenue in subsequent years from any value growth
above the frozen amount; this value growth is referred to as the increment or excess value.
A tax rate is calculated for the urban renewal plan as the consolidated tax rate for the taxing districts
within the geographic boundaries of the plan. These urban renewal taxes, referred to as “tax off the
increment,” are calculated as the consolidated tax rate multiplied by the value of the increment. The
sharing of tax between taxing districts that each get a portion of the tax imposed on the frozen base value
and urban renewal agencies that get the tax imposed on the excess value is also referred to as urban
renewal division of tax.
Most urban renewal agencies that have plan areas adopted before December 1996 can also impose
special levies. These levies compensate urban renewal agencies for the revenue loss caused by the
implementation of Measure 50. Special levies, as well as division of tax revenues, are subject to the tax
limitations of Measure 5.
Table 3.1 provides information on the amount of excess value, and the revenue from excess value and
special levies, broken down by urban renewal agency, plan area, and county. Table 3.2 displays the
amount of increment tax imposed by urban renewal agencies broken down by urban renewal agency, the
type of district within which the excess value growth occurred, and by county. More information
regarding urban renewal is available at the Oregon Department of Revenue website.
4. Tax Collection
Once the tax rates and Measure 5 tax rate limits are applied to each property, the assessor certifies the
assessment roll and turns it over to the tax collector. The tax collector bills and collects all taxes and
makes periodic remittances of collections to taxing districts. Tax statements mailed to property owners
list the assessed value of the property and the taxes imposed by each taxing district. Statements also
indicate how much is inside and how much is outside the Measure 5 property tax limits and the amount
of taxes actually due after the limits have been applied.
Based on property values assessed as of January 1, taxes are levied and become a lien on property on
July 1. Tax payments are due on November 15 of the same calendar year. Under the partial payment
schedule, the first one-third of taxes is due on November 15, the second one-third on February 15, and
the remaining one-third on May 15. A discount of 3 percent is allowed if full payment is made by
November 15; a 2 percent discount is allowed for a two-thirds payment made by November 15. For late
payments, interest accrues at a rate of 1.33 percent per month (16 percent annual rate). If taxes remain
unpaid after three years from the beginning of delinquency date, counties then initiate property
foreclosure proceedings. Table 4.1 shows tax uncollected for all years, whereas Table 4.2 shows tax
uncollected for FY 2014-15.

Section IV: How the Property Tax System Works
18 Oregon Department of Revenue, Research Section
5. Tax Relief
During the past 35 years, the legislature created several property tax relief programs; currently only two
of these programs remain: the Elderly Rental Assistance and Homestead Deferral programs.
The Elderly Rental Assistance (ERA) program provides tax relief to elderly renters whose rent, fuel, and
utility expenses are more than 20 percent of their income. Participants must be at least 58 years old with
an annual household income of less than $10,000. Property they rent must be subject to property tax. An
eligible taxpayer is paid an amount equal to the positive difference between the taxpayer’s gross rent, not
to exceed $2,100, and 20 percent of household income. If the suspense account designated to hold
appropriations to pay assistance does not have enough money to cover all payments for the fiscal year,
individual payments may be prorated. Effective in 2017, the ERA program will be administered by
Oregon Housing and Community Services rather than the Department of Revenue (Senate Bill 296).
The Homestead Deferral program has two parts: one for seniors (62 years and older) and one for
disabled homeowners. The first deferral program, the Senior Citizen’s Homestead Deferral program,
allows homeowners 62 years or older who meet certain income, asset, and property related requirements
to defer all property taxes. Under the Senior Citizen’s Homestead Deferral program, the state pays the
property taxes of participants and charges the homeowner six percent compound interest on the deferred
amount (interest on deferred amounts will once again be charged six percent simple interest beginning
July 1, 2016). Homeowners are not required to pay the taxes or interest to the state until they die, sell, or
no longer inhabit their home (except for medical reasons). The income eligibility requirement is indexed
to inflation and is $43,000 for 2015-16 property tax year deferrals. Under current law, once approved,
senior citizens are eligible for continued deferral in future years so long as they continue to meet
program requirements (prior to the program sunset date in 2021).
The second deferral program, the Disabled Citizen’s Property Tax Deferral program, began in 2001 and
is similar to the Senior Citizen’s Deferral program in that the same income, asset, and property
limitations apply, and property taxes are deferred at 6 percent compound (interest on deferred amounts
will once again be charged six percent simple interest beginning July 1, 2016). However, this program is
for disabled homeowners who are eligible for, or receive Social Security Disability benefits. Age
limitations do not apply to this program. This program is also scheduled to sunset in 2021.
In the past few years the Oregon Legislature made multiple changes to the senior and disabled deferral
programs. For more information visit the Oregon Department of Revenue website.
6. How Property Taxes are Determined for an Individual Property
Exhibit 12 shows the process used to determine the property tax bill for an individual property. Most
property in Oregon is located within 7-12 taxing districts. Each of these districts will have a billing rate,
and the sum of those rates will equal the consolidated tax rate for the property. The assessed value of a
property multiplied by the consolidated tax rate results in the tax extended. The non-bond taxes paid to
K-12, education service, and community college districts are subject to the Measure 5 education limit of

Section IV: How the Property Tax System Works
Oregon Department of Revenue, Research Section 19
$5 per $1000 of assessed value, while the non-bond taxes paid to all other districts are subject to the
Measure 5 general government limit of $10 per $1000 of assessed value. If either the school or the
general government tax extended amount is greater than the respective Measure 5 limit allows, then the
tax is compressed down to the limit. In compressing non-bond tax, local option taxes are first reduced to
zero. If further reduction is needed after all local option taxes have been reduced, then the non-bond
taxes for each district are reduced proportionately. The final tax (non-bond tax plus bond tax) is referred
to as the tax imposed, and this is the amount the property owner must pay.
Exhibit 12
Simplified Property Tax Calculation for a Residential Property
* If improvements were made to the property during the previous year, then the assessed value could grow more than 3 percent.
Assessed value calculation above is for a property with real market value greater than assessed value.
times
equals
equals
minus
times
sum of district levy rates equals
Taxing District Types
K – 12 County
Education Service City
Community College Special Districts
UR Plan Area
sum of each district’s total tax
rate equals
equals
Assessed Value of Property
for current year
Tax Extended
Final Tax Imposed on
Property
The Effect of Compression
after Testing Against
Measure 5 Limits
1.03
(3 Percent Growth in
Assessed Value)*
Taxing District Levies
Permanent Gap Bonds
Local Option UR Special Levies
Bonds
Assessed Value of Property
in prior year
Total District Tax Rate
Consolidated Tax Rate for
properties within code area
Consolidated Tax Rate


Section V
Detailed Tables
Oregon Department of Revenue, Research Section 21
he county assessor offices provide all data contained within the following tables except for the
values for property that are assessed by the Department of Revenue. There are occasional
discrepancies in the tables as a result of inconsistencies in the data reported by counties. Rather than
letting these data discrepancies prevent the publication of available information, we attempt to provide
available information as clearly as possible. In an effort to provide as much useful information as
possible, we have included tables with missing data. Where data is missing, the gaps are clearly
identified. Because this publication is designed to be a description of the property tax system using true
and correct figures, we have not included estimates where actual data was unavailable.
T


Section V
Detailed Tables – Assessment
Oregon Department of Revenue, Research Section 23
Detailed Tables: Assessment
Table 1.1 – Total Assessed Value by County and Property Class
Table 1.2 – Total Real Market and Assessed Value by County and Property Type
Table 1.3 – Total Assessed Value of Centrally Assessed Utility Property
Table 1.4 – Total Assessed and Net Assessed Value of Property by County
Table 1.5 – Real Market Value and Net Assessed Value of Property, Property Tax Imposed, and
Average Tax Rates, by Type of Taxing District
Table 1.6 – Real Market Value and Net Assessed Value of Property, Property Tax Imposed, and
Average Tax Rates, by County
Table 1.7 – Assessed and Real Market Value of Fully and Partially Exempt Property by County
Table 1.8 – Assessed and Real Market Value of Specially Assessed Farmland and Forestland by County
Table 1.9 – Appeals to Board of Property Tax Appeals by County

Section V: Detailed Tables – Assessment
24 Oregon Department of Revenue, Research Section
County Residential
Commercial/
Industrial Tract Farm / Forest Multi-Housing
Recreation/
Misc Personal
Machinery &
Equipment
Manufactured
Structures Utilities
Total All
Classes
Baker 426,815 125,268 135,995 253,072 16,471 19,268 28,686 65,980 4,856 316,230 1,392,640
Benton 3,868,296 892,613 1,177,723 606,229 492,929 1,298 158,624 170,261 37,095 196,025 7,601,093
Clackamas 27,340,981 6,123,898 2,135,539 2,864,462 2,148,294 726,666 811,312 539,277 155,816 1,443,139 44,289,384
Clatsop 3,282,224 789,310 711,284 222,295 94,748 23,620 111,029 241,791 21,115 207,855 5,705,270
Columbia 1,465,566 441,485 1,148,109 718,659 49,678 14,095 77,404 132,125 28,452 636,662 4,712,236
Coos 2,866,657 707,783 85,088 588,330 245,624 87,763 97,012 58,238 81,968 194,227 5,012,689
Crook 940,435 195,636 197,784 225,754 21,149 31,245 40,244 24,319 96,522 72,751 1,845,840
Curry 1,607,050 352,803 310,906 220,658 130,499 2,301 30,264 30,131 70,653 45,233 2,800,498
Deschutes 8,579,231 2,713,117 4,422,493 491,785 697,674 2,812,390 415,663 89,709 58,322 652,906 20,933,290
Douglas 4,594,669 1,119,762 204,665 1,243,050 225,938 203,595 233,931 151,295 132,533 628,101 8,737,539
Gilliam 30,322 96,338 6,285 110,184 907 571 20,225 27,526 11,156 447,666 751,180
Grant 128,036 50,866 125,286 159,391 4,002 13,862 7,796 11,370 4,064 35,299 539,972
Harney 127,078 69,785 21,540 133,736 513 4,504 8,874 0 82,668 65,709 514,407
Hood River 737,426 389,019 486,787 330,450 58,426 10,069 76,368 56,473 14,531 86,221 2,245,768
Jackson 9,012,317 3,073,049 3,200,937 1,183,791 517,990 19,565 452,579 214,957 148,818 675,537 18,499,539
Jefferson 519,080 138,518 109,666 150,669 17,026 24,701 21,479 18,463 183,755 406,234 1,589,592
Josephine 1,972,832 859,196 2,576,179 869,640 184,709 54,119 117,364 38,951 58,752 212,676 6,944,419
Klamath 2,654,882 697,565 246,295 404,770 86,296 15,368 104,399 89,473 61,578 1,057,623 5,418,247
Lake 104,558 51,942 83,792 173,768 0 22,323 9,508 7,683 88,712 425,240 967,525
Lane 15,457,387 5,141,875 4,236,302 1,512,601 1,579,882 6,728 698,779 668,929 270,015 881,254 30,453,751
Lincoln 4,659,957 981,638 396,250 405,025 102,944 7,367 105,673 140,487 79,524 232,765 7,111,632
Linn 3,324,556 1,422,256 1,387,744 1,265,201 311,135 59,384 275,484 414,729 110,668 446,550 9,017,708
Malheur 406,858 305,128 237,724 402,031 20,046 34,592 40,480 96,769 45,675 202,670 1,791,973
Marion 11,130,071 4,134,186 2,574,799 1,531,160 1,246,420 347,679 561,608 330,543 180,181 784,377 22,821,023
Morrow 154,394 384,343 94,761 210,129 4,177 29,948 47,950 164,036 21,580 936,655 2,047,974
Multnomah 43,820,414 15,128,518 423,402 435,448 4,576,941 22,774 2,507,649 1,709,612 182,430 3,379,577 72,186,765
Polk 3,114,571 386,333 484,632 805,651 243,004 0 70,893 34,248 44,581 174,752 5,358,665
Sherman 20,162 35,790 5,229 100,651 0 805 4,612 0 16,698 255,808 439,753
Tillamook 3,225,080 308,787 348,094 287,876 16,347 29,108 37,667 78,182 15,315 154,836 4,501,292
Umatilla 1,596,257 750,881 631,926 678,952 89,551 69,113 138,706 160,756 34,984 1,042,482 5,193,608
Union 673,734 225,647 216,410 338,585 32,828 15,038 35,209 44,115 10,146 203,041 1,794,754
Wallowa 176,481 62,024 119,329 190,978 4,908 94,622 9,969 606 9,735 61,690 730,341
Wasco 771,963 316,211 149,970 264,608 57,905 56,189 47,024 11,204 213,935 231,274 2,120,282
Washington 33,539,738 10,619,308 1,066,692 1,926,128 3,725,455 0 2,258,296 1,963,356 94,183 1,715,100 56,908,257
Wheeler 14,824 3,745 21,791 57,116 0 2,144 263 0 21,384 7,847 129,115
Yamhill 3,508,395 1,418,198 1,009,163 1,245,425 200,496 25 207,787 8,500 90,619 261,548 7,950,155
Unallocated Utilities 23,175 23,175
Total 195,853,295 60,512,823 30,790,570 22,608,261 17,204,913 4,862,840 9,870,811 7,794,092 2,783,016 18,800,731 371,081,352
Unallocated properties are small, privately owned railcar companies that pay property taxes to the state which are then distributed back to county governments.
Table 1.1 Summary of Total Assessed Value of Locally and Centrally Assessed Property, by Property Class
FY 2015-16 by County (Thousands of Dollars)
Notes: Value totals differ slightly from values reported elsewhere due to differences in data sources.

Section V: Detailed Tables – Assessment
Oregon Department of Revenue, Research Section 25
County RMV AV RMV AV RMV AV RMV AV RMV AV
Baker 1,281,865 1,042,869 28,686 28,686 5,148 4,856 367,795 316,230 1,683,494 1,392,640
Benton 9,610,139 7,209,349 158,624 158,624 38,332 37,095 230,117 196,025 10,037,213 7,601,093
Clackamas 53,776,410 41,879,117 811,312 811,312 171,102 155,816 1,585,024 1,443,139 56,343,848 44,289,384
Clatsop 7,134,185 5,365,272 140,580 111,029 22,930 21,115 219,142 207,855 7,516,836 5,705,270
Columbia 4,695,195 3,969,718 81,012 77,404 33,117 28,452 905,659 636,662 5,714,983 4,712,236
Coos 5,661,735 4,639,482 97,042 97,012 95,492 81,968 206,787 194,227 6,061,057 5,012,689
Crook 2,039,465 1,636,322 40,244 40,244 116,165 96,522 74,766 72,751 2,270,641 1,845,840
Curry 3,062,622 2,654,496 30,264 30,264 74,375 70,505 51,342 45,233 3,218,603 2,800,498
Deschutes 27,680,220 19,806,399 415,679 415,663 68,328 58,322 677,075 652,906 28,841,302 20,933,290
Douglas 8,988,634 7,581,630 234,010 233,866 138,841 132,533 660,780 628,101 10,022,265 8,576,128
Gilliam 391,094 272,132 20,225 20,225 13,704 11,156 1,507,049 447,666 1,932,072 751,180
Grant 604,217 492,529 7,796 7,796 4,565 4,064 35,747 35,299 652,325 539,688
Harney 662,841 434,167 8,884 8,874 5,970 5,657 67,369 65,709 745,064 514,407
Hood River 3,152,503 2,068,649 76,383 76,368 15,771 14,531 105,483 86,221 3,350,140 2,245,768
Jackson 22,374,282 17,222,606 454,123 452,579 161,214 148,818 718,103 675,537 23,707,721 18,499,539
Jefferson 1,646,525 1,154,895 21,496 21,479 7,336 6,983 416,709 406,234 2,092,066 1,589,592
Josephine 7,800,153 6,555,627 117,367 117,364 63,363 58,752 226,076 212,676 8,206,959 6,944,419
Klamath 5,416,888 4,194,648 104,399 104,399 66,919 61,578 1,113,277 1,057,623 6,701,483 5,418,247
Lake 649,250 444,066 9,508 9,508 114,840 88,712 427,792 425,240 1,201,389 967,525
Lane 39,224,817 28,603,703 729,319 698,779 293,005 270,015 1,056,886 881,254 41,304,027 30,453,751
Lincoln 7,673,291 6,693,669 105,753 105,673 89,368 79,524 247,383 232,765 8,115,795 7,111,632
Linn 9,740,014 8,185,427 275,484 275,484 119,720 110,255 497,420 446,542 10,632,638 9,017,708
Malheur 1,756,036 1,503,148 40,532 40,480 47,649 45,675 216,354 202,670 2,060,572 1,791,973
Marion 26,106,960 20,962,424 561,608 561,608 191,780 180,181 1,033,602 784,377 27,893,950 22,488,589
Morrow 1,435,004 1,041,789 558,883 47,950 23,548 21,580 1,236,840 936,655 3,254,274 2,047,974
Multnomah 113,107,773 66,185,724 2,508,943 2,507,649 154,843 113,815 3,840,191 3,379,577 119,611,750 72,186,765
Polk 6,089,596 5,068,439 70,926 70,893 46,430 44,581 191,718 174,752 6,398,670 5,358,665
Sherman 259,416 166,102 4,612 4,612 14,628 13,232 1,378,558 255,808 1,657,214 439,753
Tillamook 5,455,218 4,293,474 37,667 37,667 16,639 15,315 161,432 154,836 5,670,955 4,501,292
Umatilla 5,727,975 3,977,436 138,708 138,706 37,422 34,984 1,147,396 1,042,482 7,051,500 5,193,608
Union 2,101,344 1,546,358 35,216 35,209 11,256 10,146 249,118 203,041 2,396,934 1,794,754
Wallowa 971,293 648,946 9,970 9,969 11,189 9,735 66,228 61,690 1,058,680 730,340
Wasco 2,363,344 1,628,050 47,024 47,024 267,550 213,935 282,760 231,274 2,960,678 2,120,282
Washington 73,102,262 52,840,678 2,258,307 2,258,296 124,145 94,183 1,909,200 1,715,100 77,393,915 56,908,257
Wheeler 181,006 99,622 263 263 33,225 21,384 7,847 7,847 222,341 129,115
Yamhill 9,709,604 7,390,201 207,951 207,787 98,288 90,619 287,858 261,548 10,303,700 7,950,155
Total 471,633,177 339,459,163 10,448,800 9,870,745 2,798,197 2,456,591 23,406,880 18,777,548 508,287,053 370,564,047
Notes: Value totals may differ slightly from values reported elsewhere due to differences in data sources.
Table 1.2 Total Real Market Value (RMV) and Total Assessed Value (AV) of Property
FY 2015-16 by County and Type of Property (Thousands of Dollars)
Real Property Personal Property Manufactured Structures Public Utilities Total

Section V: Detailed Tables – Assessment
26 Oregon Department of Revenue, Research Section
County
Air
Transportation Communication Electric Gas Pipeline Gas Pipeline Oil
Private Rail
Cars
Rail
Transportation
Water
Transportation Total Utilities
Baker 0 74,393 115,817 3,830 29,173 11,028 32,638 49,322 0 316,200
Benton 379 111,298 46,482 29,731 0 0 0 8,136 0 196,025
Clackamas 0 513,914 703,225 189,267 27,571 333 2,255 5,295 1,279 1,443,139
Clatsop 23 75,538 78,904 37,094 0 0 3,204 2,779 10,313 207,855
Columbia 0 50,592 652,930 167,611 576 0 5,406 4,709 11,592 893,416
Coos 713 113,551 53,484 22,080 0 0 339 1,989 2,071 194,227
Crook 0 27,276 35,106 3,677 7,123 0 0 0 0 73,182
Curry 1 40,156 3,673 0 0 0 0 0 1,403 45,233
Deschutes 10,296 354,112 102,946 54,078 68,929 0 6,800 22,385 0 619,546
Douglas 181 191,318 382,724 35,965 8,260 0 1,262 23,430 0 643,141
Gilliam 0 5,233 1,406,718 0 26,399 0 16,933 25,486 597 1,481,365
Grant 0 33,088 2,210 0 0 0 0 0 0 35,299
Harney 0 34,850 30,859 0 0 0 0 0 0 65,709
Hood River 46 27,371 12,651 10,739 51 0 12,358 21,693 838 85,746
Jackson 12,128 263,187 277,416 103,069 5,156 0 598 13,983 0 675,537
Jefferson 0 30,256 307,743 2,618 43,621 0 7,160 14,864 0 406,263
Josephine 23 97,944 84,721 20,236 1,387 0 347 7,204 814 212,676
Klamath 634 161,965 417,444 35,899 351,866 0 28,416 60,992 407 1,057,623
Lake 1 33,264 48,870 0 348,233 0 0 407 0 430,776
Lane 15,660 508,902 151,809 96,487 9,955 29,114 17,770 51,557 0 881,254
Lincoln 115 93,414 94,501 41,059 0 0 0 3,677 0 232,765
Linn 0 199,506 110,817 61,762 29,573 6,639 7,416 30,828 0 446,542
Malheur 0 40,663 225,135 6,452 7,466 5,997 5,994 12,638 0 304,344
Marion 293 393,117 334,311 141,013 19,988 6,401 7,986 19,632 122 922,862
Morrow 0 26,791 1,082,057 2,463 46,382 0 13,325 20,252 3,978 1,195,247
Multnomah 981,620 1,190,985 756,811 159,032 14,098 31,945 58,858 136,636 52,634 3,382,618
Polk 0 53,854 48,366 68,397 0 0 0 4,136 0 174,752
Sherman 0 12,150 1,294,739 0 36,814 0 7,111 11,495 4,819 1,367,128
Tillamook 0 74,674 79,710 38 0 0 0 0 0 154,422
Umatilla 430 109,658 740,463 18,573 62,561 14,937 45,735 140,331 2,760 1,135,448
Union 150 44,962 124,484 14,640 16,463 10,769 25,700 44,855 0 282,023
Wallowa 0 8,087 53,539 0 0 0 0 4,061 63 65,751
Wasco 0 55,042 44,008 9,393 19,176 0 33,451 72,305 1,863 235,238
Washington 900 909,903 476,486 319,046 0 1,678 59 7,027 0 1,715,100
Wheeler 0 7,858 10 0 0 0 0 0 0 7,867
Yamhill 0 92,908 126,405 37,250 0 0 0 4,985 0 261,548
Total 1,023,593 6,061,777 10,507,572 1,691,500 1,180,822 118,840 341,120 827,089 95,553 21,847,866
Unallocated Utilities 0 0 0 0 0 0 23,175 0 0 23,175
Statewide Total 1,023,593 6,061,777 10,507,572 1,691,500 1,180,822 118,840 364,295 827,089 95,553 21,871,041
Utility values reported in this table include property value that may be partially or fully exempt causing discrepancies between other tables.
Table 1.3 Total Assessed Value of Centrally Assessed Property
FY 2015-16 by County and Type of Utility Property (Thousands of Dollars)
Notes: Unallocated properties are small, privately owned railcar companies that pay property taxes to the state which are then distributed to counties.

Section V: Detailed Tables – Assessment
Oregon Department of Revenue, Research Section 27
County
Total
Assessed
Value
Non-Profit
Housing
Fish &
Wildlife
Urban
Renewal
Excess Value
Net Assessed
Value
Baker 1,392,640 0 244 0 1,392,885
Benton 7,601,093 0 0 32,139 7,568,955
Clackamas 44,289,384 3,999 0 1,590,335 42,703,048
Clatsop 5,705,270 0 551 116,124 5,589,697
Columbia 4,712,236 989 2,465 273,509 4,442,181
Coos 5,012,689 0 0 206,735 4,805,954
Crook 1,845,840 0 0 0 1,845,840
Curry 2,800,498 1,316 3 44,301 2,757,517
Deschutes 20,933,290 0 0 273,891 20,659,399
Douglas 8,576,128 10,098 0 256,161 8,330,065
Gilliam 751,180 2,796 0 0 753,975
Grant 539,688 0 475 0 540,162
Harney 514,407 0 0 0 514,407
Hood River 2,245,768 0 0 144,366 2,101,402
Jackson 18,499,539 16,332 25 370,812 18,145,085
Jefferson 1,589,592 0 0 26,432 1,563,159
Josephine 6,944,419 2,032 0 0 6,946,451
Klamath 5,418,247 0 0 40,235 5,378,012
Lake 967,525 76 755 0 968,356
Lane 30,453,751 10,501 0 428,142 30,036,110
Lincoln 7,111,632 0 53 229,132 6,882,553
Linn 9,017,708 0 0 399,444 8,618,265
Malheur 1,791,973 797 363 0 1,793,133
Marion 22,488,589 1,892 0 578,632 21,911,849
Morrow 2,047,974 0 5 4,441 2,043,538
Multnomah 72,186,765 34,940 1,054 6,080,697 66,142,063
Polk 5,358,665 0 0 121,558 5,237,107
Sherman 439,753 0 29 0 439,782
Tillamook 4,501,292 0 0 31,416 4,469,876
Umatilla 5,193,608 0 199 50,865 5,142,942
Union 1,794,754 0 1,152 80,318 1,715,589
Wallowa 730,340 0 611 0 730,951
Wasco 2,120,282 0 2,406 78,567 2,044,121
Washington 56,908,257 2,635 0 322,430 56,588,462
Wheeler 129,115 932 0 0 130,047
Yamhill 7,950,155 0 0 15,735 7,934,419
Statewide Total 370,564,047 89,334 10,390 11,796,416 358,867,356
Table 1.4 Total Assessed Value and Net Assessed Value of Property
FY 2015-16 by County (Thousands of Dollars)
Notes: NAV includes non-profit housing and state fish and wildlife value and excludes urban renewal
excess value used.

Section V: Detailed Tables – Assessment
28 Oregon Department of Revenue, Research Section
District Type FY 2014-15 FY 2015-16 % CH FY 2014-15 FY 2015-16 % CH FY 2014-15 FY 2015-16 % CH FY 14-15 FY 15-16 FY 14-15 FY 15-16
County 469,452,701 508,287,053 8.3 343,171,236 358,867,356 4.6 965,261 1,010,547 4.7 2.06 1.99 2.81 2.82
City 314,668,034 340,762,241 8.3 222,640,129 233,062,717 4.7 1,209,303 1,267,466 4.8 3.84 3.72 5.43 5.44
School 469,372,520 508,200,714 8.3 343,132,422 358,828,007 4.6 2,235,736 2,363,237 5.7 4.76 4.65 6.52 6.59
Education Service 469,317,428 508,142,955 8.3 343,090,330 358,784,406 4.6 112,577 117,520 4.4 0.24 0.23 0.33 0.33
Community College 460,216,957 496,491,857 7.9 336,381,942 351,895,768 4.6 234,833 233,210 -0.7 0.51 0.47 0.70 0.66
Cemetery 25,535,933 28,210,696 10.5 19,891,548 20,610,772 3.6 2,625 2,650 0.9 0.10 0.09 0.13 0.13
Fire 215,573,219 233,808,069 8.5 168,286,070 175,974,318 4.6 319,257 346,118 8.4 1.48 1.48 1.90 1.97
Health 79,610,695 87,776,864 10.3 61,304,835 64,111,594 4.6 31,363 32,653 4.1 0.39 0.37 0.51 0.51
Park 116,567,663 130,153,254 11.7 88,163,195 94,990,481 7.7 86,401 89,979 4.1 0.74 0.69 0.98 0.95
Port 278,811,185 304,776,994 9.3 194,189,310 203,491,586 4.8 19,252 20,108 4.4 0.07 0.07 0.10 0.10
Road 35,016,847 68,647,141 96.0 25,756,333 49,733,807 93.1 10,615 11,076 4.3 0.30 0.16 0.41 0.22
Sanitary 75,198,783 81,648,380 8.6 56,502,938 60,492,654 7.1 2,468 2,485 0.7 0.03 0.03 0.04 0.04
Water Supply 45,491,808 60,607,285 33.2 34,308,725 45,214,159 31.8 4,895 5,059 3.3 0.11 0.08 0.14 0.11
Water Control 204,781,508 223,138,001 9.0 140,175,926 146,071,783 4.2 11,522 12,148 5.4 0.06 0.05 0.08 0.08
Vector Control 94,572,375 102,800,645 8.7 75,339,416 78,660,960 4.4 5,606 5,966 6.4 0.06 0.06 0.07 0.08
Service 355,847,579 422,578,312 18.8 257,512,497 297,722,081 15.6 96,735 76,433 -21.0 0.27 0.18 0.38 0.26
Other 388,268,344 423,608,918 9.1 280,659,488 293,902,688 4.7 192,307 220,678 14.8 0.50 0.52 0.69 0.75
Statewide Total 469,452,710 508,287,053 8.3 343,171,244 358,867,356 4.6 5,540,756 5,817,332 5 11.8 11.44 16.15 16.21
Notes: The category "Other" includes taxing districts such as library, transit, and public utility districts.
Tax rates are applied to net assessed value. It includes nonprofit housing value and state fish and wildlife value and excludes urban renewal excess value.
Property taxes imposed excludes special assessments and taxes allocated to urban renewal agencies.
Table 1.5 Real Market Value of Property, Net Assessed Value of Property, Property Tax Imposed, and Average Tax Rate
FY 2014-15 and 2015-16 by Type of Taxing District (Thousands of Dollars)
RMV Base NAV Base
Average Tax Rate ($/1000)
Real Market Value (RMV) Net Assessed Value (NAV) Property Tax Imposed

Section V: Detailed Tables – Assessment
Oregon Department of Revenue, Research Section 29
County FY 2014-15 FY 2015-16 % CH FY 2014-15 FY 2015-16 % CH FY 2014-15 FY 2015-16 % CH FY 14-15 FY 15-16 FY 14-15 FY 15-16
Baker 1,588,651 1,683,494 6.0 1,330,221 1,392,885 4.7 17,358 18,143 4.5 10.93 10.78 13.05 13.03
Benton 9,603,954 10,037,213 4.5 7,337,316 7,568,955 3.2 120,885 124,032 2.6 12.59 12.36 16.48 16.39
Clackamas 51,012,956 56,343,848 10.5 40,854,060 42,703,048 4.5 656,794 695,813 5.9 12.88 12.35 16.08 16.29
Clatsop 7,281,392 7,516,836 3.2 5,355,056 5,589,697 4.4 65,289 68,176 4.4 8.97 9.07 12.19 12.20
Columbia 5,201,140 5,714,983 9.9 4,245,915 4,442,181 4.6 60,101 62,060 3.3 11.56 10.86 14.15 13.97
Coos 6,026,084 6,061,057 0.6 4,678,656 4,805,954 2.7 58,926 59,280 0.6 9.78 9.78 12.59 12.33
Crook 2,088,229 2,270,641 8.7 1,743,829 1,845,840 5.8 23,280 24,942 7.1 11.15 10.98 13.35 13.51
Curry 3,161,631 3,218,603 1.8 2,690,895 2,757,517 2.5 23,180 24,314 4.9 7.33 7.55 8.61 8.82
Deschutes 25,322,403 28,841,302 13.9 19,432,643 20,659,399 6.3 292,079 311,567 6.7 11.53 10.80 15.03 15.08
Douglas 9,953,184 10,022,265 0.7 8,157,038 8,330,065 2.1 91,274 92,964 1.9 9.17 9.28 11.19 11.16
Gilliam 912,521 1,932,072 111.7 753,455 753,975 0.1 8,974 9,001 0.3 9.83 4.66 11.91 11.94
Grant 650,048 652,325 0.4 530,773 540,162 1.8 7,771 7,313 -5.9 11.95 11.21 14.64 13.54
Harney 730,364 745,064 2.0 499,036 514,407 3.1 6,909 7,099 2.7 9.46 9.53 13.85 13.80
Hood River 3,224,342 3,350,140 3.9 2,023,520 2,101,402 3.8 28,480 29,369 3.1 8.83 8.77 14.07 13.98
Jackson 22,228,024 23,707,721 6.7 17,442,139 18,145,085 4.0 252,804 262,135 3.7 11.37 11.06 14.49 14.45
Jefferson 1,948,292 2,092,066 7.4 1,476,688 1,563,159 5.9 23,724 25,008 5.4 12.18 11.95 16.07 16.00
Josephine 8,061,091 8,206,959 1.8 6,706,560 6,946,451 3.6 60,010 62,480 4.1 7.44 7.61 8.95 8.99
Klamath 6,479,490 6,701,483 3.4 5,247,207 5,378,012 2.5 59,289 63,710 7.5 9.15 9.51 11.30 11.85
Lake 1,198,407 1,201,389 0.2 953,429 968,356 1.6 12,531 12,770 1.9 10.46 10.63 13.14 13.19
Lane 39,537,653 41,304,027 4.5 28,789,625 30,036,110 4.3 454,302 469,382 3.3 11.49 11.36 15.78 15.63
Lincoln 7,938,058 8,115,795 2.2 6,704,929 6,882,553 2.6 94,055 97,146 3.3 11.85 11.97 14.03 14.11
Linn 9,972,966 10,632,638 6.6 8,324,737 8,618,265 3.5 133,270 138,956 4.3 13.36 13.07 16.01 16.12
Malheur 2,072,541 2,060,572 -0.6 1,752,017 1,793,133 2.3 23,802 23,917 0.5 11.48 11.61 13.59 13.34
Marion 26,344,481 27,893,950 5.9 20,959,166 21,911,849 4.5 336,022 355,813 5.9 12.75 12.76 16.03 16.24
Morrow 2,703,966 3,254,274 20.4 1,774,504 2,043,538 15.2 27,559 31,800 15.4 10.19 9.77 15.53 15.56
Multnomah 108,209,204 119,611,750 10.5 63,519,701 66,142,063 4.1 1,312,159 1,378,878 5.1 12.13 11.53 20.66 20.85
Polk 5,923,505 6,398,670 8.0 5,000,030 5,237,107 4.7 76,326 81,298 6.5 12.89 12.71 15.27 15.52
Sherman 558,319 1,657,214 196.8 433,722 439,782 1.4 6,884 6,987 1.5 12.33 4.22 15.87 15.89
Tillamook 5,434,135 5,670,955 4.4 4,333,451 4,469,876 3.1 48,704 49,620 1.9 8.96 8.75 11.24 11.10
Umatilla 6,736,994 7,051,500 4.7 4,958,881 5,142,942 3.7 77,889 82,262 5.6 11.56 11.67 15.71 16.00
Union 2,314,010 2,396,934 3.6 1,655,564 1,715,589 3.6 20,716 23,354 12.7 8.95 9.74 12.51 13.61
Wallowa 990,120 1,058,680 6.9 702,179 730,951 4.1 8,072 8,378 3.8 8.15 7.91 11.50 11.46
Wasco 2,683,887 2,960,678 10.3 1,976,930 2,044,121 3.4 33,068 33,608 1.6 12.32 11.35 16.73 16.44
Washington 71,453,358 77,393,915 8.3 53,175,317 56,588,462 6.4 904,390 952,842 5.4 12.66 12.31 17.01 16.84
Wheeler 207,921 222,341 6.9 126,790 130,047 2.6 2,139 2,186 2.2 10.29 9.83 16.87 16.81
Yamhill 9,699,391 10,303,700 6.2 7,525,262 7,934,419 5.4 111,743 120,729 8.0 11.52 11.72 14.85 15.22
Statewide Total 469,452,710 508,287,053 8.3 343,171,244 358,867,356 4.6 5,540,756 5,817,332 5 11.8 11.44 16.15 16.21
Notes: NAV includes nonprofit housing value and state fish and wildlife value and excludes urban renewal excess value.
Property taxes imposed excludes taxes allocated to urban renewal agencies and special assessments.
Table 1.6 Real Market Value of Property, Net Assessed Value of Property, Property Tax Imposed, and Average Tax Rate
FY 2014-15 and 2015-16 by County (Thousands of Dollars)
Average Tax Rate ($/1000)
RMV Base NAV BaseReal Market Value (RMV) Net Assessed Value (NAV) Property Tax Imposed

Section V: Detailed Tables – Assessment
30 Oregon Department of Revenue, Research Section
County # Accts AV RMV # Accts AV RMV # Accts AV RMV # Accts AV RMV
Baker 1,399 0 514,504 157 0 51,561 638 34,221 60,403 2,194 34,221 626,469
Benton 1,263 456 1,728,824 385 89,112 548,142 1,758 129,876 250,415 3,406 219,443 2,527,381
Clackamas 3,995 0 4,512,294 1,181 0 1,609,714 5,334 789,962 1,316,160 10,510 789,962 7,438,168
Clatsop 3,143 564,676 971,640 492 144,899 222,618 1,133 181,959 517,296 4,768 891,534 1,711,554
Columbia 947 0 103,790 166 0 24,991 1,358 463,680 504,242 2,471 463,680 633,023
Coos 2,373 0 2,790,541 313 0 121,076 2,267 200,432 269,776 4,953 200,432 3,181,393
Crook 807 0 484,781 108 0 51,782 643 38,315 1,127,110 1,558 38,315 1,663,673
Curry 1,843 N/A N/A 165 N/A N/A 1,143 98,170 128,219 3,151 N/A N/A
Deschutes 2,523 0 1,642,291 211 16,530 122,634 5,306 429,652 663,074 8,040 446,182 2,427,998
Douglas 4,742 7,059 2,243,357 955 0 428,276 6,922 406,798 707,878 12,619 413,857 3,379,511
Gilliam 469 0 90,655 40 0 2,670 186 59,028 1,101,299 695 59,028 1,194,625
Grant 1,000 0 447,573 61 0 9,955 538 13,732 24,509 1,599 13,732 482,036
Harney 1,339 0 1,607,044 64 0 31,483 263 9,172 12,879 1,666 9,172 1,651,406
Hood River 640 0 391,701 113 0 119,894 1,629 55,194 102,562 2,382 55,194 614,157
Jackson 3,554 0 2,189,983 720 0 483,209 13,554 619,579 844,091 17,828 619,579 3,517,283
Jefferson 898 13 461,493 80 0 23,170 539 42,945 64,260 1,517 42,958 548,924
Josephine 2,053 5,073 685,131 388 33,347 277,922 4,016 319,430 457,447 6,457 357,850 1,420,500
Klamath 2,935 236 784,456 380 639 115,864 1,713 139,253 223,277 5,028 140,128 1,123,597
Lake 1,548 0 1,314,025 90 421 12,460 439 11,547 36,616 2,077 11,968 1,363,101
Lane 7,705 75,449 7,335,241 1,730 255,065 2,800,776 8,005 773,803 1,511,089 17,440 1,104,317 11,647,106
Lincoln 2,957 0 904,922 407 0 173,382 6,563 143,652 330,428 9,927 143,652 1,408,732
Linn 1,954 0 936,867 324 0 112,289 1,836 217,287 281,172 4,114 217,287 1,330,328
Malheur 2,186 0 1,847,312 169 0 112,262 566 21,668 38,352 2,921 21,668 1,997,926
Marion 2,852 77,124 5,383,183 1,256 70,458 1,684,611 7,939 965,570 2,064,843 12,047 1,113,152 9,132,637
Morrow 596 0 268,477 60 0 11,823 193 342,340 1,618,117 849 342,340 1,898,417
Multnomah 7,924 58,960 15,130,796 5,388 1,812,687 13,243,981 16,242 2,463,192 8,868,197 29,554 4,334,839 37,242,974
Polk 1,413 0 1,023,434 334 0 180,388 1,469 182,794 228,110 3,216 182,794 1,431,932
Sherman 330 0 21,471 35 0 2,091 41 91,345 1,202,730 406 91,345 1,226,292
Tillamook 2,123 0 844,831 254 0 123,448 1,405 177,023 219,513 3,782 177,023 1,187,791
Umatilla 2,246 0 1,458,553 384 981 166,010 1,231 276,480 332,156 3,861 277,461 1,956,720
Union 636 0 490,724 205 0 103,396 433 69,609 180,085 1,274 69,609 774,205
Wallowa 749 0 862,753 110 0 16,786 313 16,923 31,917 1,172 16,923 911,456
Wasco 1,064 8,477 214,768 152 2,776 89,544 1,710 52,742 841,973 2,926 63,996 1,146,285
Washington 4,244 92,666 2,961,384 1,804 461,446 2,661,918 13,590 1,143,555 13,532,760 19,638 1,697,667 19,156,062
Wheeler 488 0 133,853 29 0 1,162 68 1,404 3,038 585 1,404 138,053
Yamhill 1,227 5,726 600,149 498 45,328 427,234 2,096 134,384 229,820 3,821 185,439 1,257,202
Total* 78,165 895,915 63,382,797 19,208 2,933,690 26,168,524 113,079 11,116,716 39,925,816 210,452 14,946,320 129,477,137
Notes: N/A indicates that the county was unable to provide the data. Refer to glossary for explanation of categories.
* Total values reported are not the statewide totals because not all counties reported data.
AV refers to the assessed value of the property listed on the roll. Fully exempt properties would have an AV equal to zero.
Table 1.7 Summary of Assessed (AV) and Real Market Value (RMV) of Fully and Partially Exempt Property
FY 2015-16 by County (Thousands of Dollars)
Public Exemptions Social Welfare Exemptions
Business/Housing/Misc
Exemptions Total

Section V: Detailed Tables – Assessment
Oregon Department of Revenue, Research Section 31
County # Accts # Acres AV RMV # Accts # Acres AV RMV # Accts # Acres AV RMV
Baker 4,035 850,377 72,940 626,796 388 39,429 1,981 39,729 4,423 889,806 74,921 666,525
Benton 3,478 103,621 69,243 530,384 3,614 174,476 65,150 401,126 7,092 278,097 134,394 931,510
Clackamas 9,312 125,594 94,769 1,867,454 8,417 216,713 83,460 1,187,910 17,729 342,307 178,228 3,055,364
Clatsop 357 14,578 4,401 86,258 2,196 293,203 132,072 327,209 2,553 307,781 136,472 413,467
Columbia 1,355 41,115 11,122 229,649 5,408 299,826 132,960 816,384 6,763 340,941 144,082 1,046,033
Coos 2,708 79,856 27,345 29,232 6,196 539,371 207,003 336,103 8,904 619,227 234,348 365,335
Crook 2,363 752,403 40,744 51,442 177 37,372 2,291 4,603 2,540 789,775 43,035 56,045
Curry 2,028 41,940 11,409 N/A 3,335 263,206 80,904 N/A 5,363 305,146 92,313 N/A
Deschutes 2,832 156,407 18,792 538,097 619 77,664 5,153 316,785 3,451 234,071 23,945 854,881
Douglas 7,767 268,757 47,976 635,113 10,504 1,068,654 326,885 680,821 18,271 1,337,411 374,861 1,315,934
Gilliam 1,336 693,655 81,149 155,400 0 0 0 0 1,336 693,655 81,149 155,400
Grant 2,152 886,963 32,926 602,866 543 124,841 7,853 112,436 2,695 1,011,804 40,780 715,302
Harney 4,282 1,501,771 88,994 752,565 44 6,077 287 6,715 4,326 1,507,848 89,280 759,279
Hood River 1,752 22,373 43,735 316,967 954 48,544 9,089 107,582 2,706 70,917 52,824 424,549
Jackson 4,800 195,198 31,345 880,379 5,271 440,190 74,500 459,265 10,071 635,388 105,845 1,339,645
Jefferson 1,887 425,752 52,093 424,448 107 80,009 5,528 86,503 1,994 505,761 57,621 510,950
Josephine 1,081 19,964 9,233 78,453 6,295 170,165 17,419 281,127 7,376 190,129 26,652 359,580
Klamath 6,377 601,764 139,352 596,161 1,648 694,776 56,330 56,688 8,025 1,296,540 195,682 652,849
Lake 3,581 798,024 90,136 644,621 576 284,193 19,511 83,209 4,157 1,082,217 109,647 727,829
Lane 6,144 11,641 3,458 48,026 11,123 801,466 287,421 1,331,428 17,267 813,107 290,879 1,379,454
Lincoln 916 13,599 3,527 48,510 4,326 330,947 163,203 413,796 5,242 344,546 166,730 462,306
Linn 6,716 348,770 227,872 1,603,989 5,009 452,188 159,896 457,829 11,725 800,958 387,768 2,061,817
Malheur 6,238 1,299,125 199,471 1,256,405 0 0 0 0 6,238 1,299,125 199,471 1,256,405
Marion 20,297 282,949 265,063 2,617,338 3,353 106,831 37,018 297,210 23,650 389,780 302,081 2,914,548
Morrow 2,091 1,019,181 107,934 679,061 116 13,728 817 12,941 2,207 1,032,909 108,751 692,001
Multnomah 1,222 22,691 35,273 393,946 1,531 30,381 10,351 234,688 2,753 53,072 45,625 628,634
Polk 4,541 169,393 108,696 1,103,850 3,235 213,381 78,845 366,629 7,776 382,774 187,541 1,470,479
Sherman 1,496 451,197 73,840 131,124 0 0 0 0 1,496 451,197 73,840 131,124
Tillamook 1,280 30,506 25,821 116,166 1,905 183,627 77,504 185,459 3,185 214,133 103,326 301,625
Umatilla 8,393 1,343,640 307,162 1,794,337 591 68,302 4,962 47,959 8,984 1,411,942 312,124 1,842,296
Union 3,333 493,318 80,016 653,735 794 145,450 10,042 100,041 4,127 638,768 90,058 753,776
Wallowa 2,700 657,726 45,844 768,614 379 136,127 9,711 131,413 3,079 793,853 55,555 900,027
Wasco 2,955 758,377 114,988 572,520 898 158,822 3,590 56,498 3,853 917,199 118,579 629,018
Washington 5,295 113,028 86,873 1,395,008 4,824 164,284 63,267 753,340 10,119 277,312 150,140 2,148,348
Wheeler 968 572,199 22,707 298,399 351 318,667 19,976 143,405 1,319 890,866 42,683 441,804
Yamhill 5,451 110,520 72,094 780,441 3,395 110,097 46,255 302,283 8,846 220,617 118,349 1,082,725
Notes: "Forestland" includes designated forestland, highest and best use forestland, and small tract forestland.
N/A indicates that the data was unavailable.
Statewide totals were not provided because of missing values.
Farm Use Forestland Total
Table 1.8 Assessed Value (AV) and Real Market Value (RMV) of Specially Assessed Farmland and Forestland
FY 2015-16 by County (Thousands of Dollars)

Section V: Detailed Tables – Assessment
32 Oregon Department of Revenue, Research Section
County
Number of
Accounts
Appealed
Assessed Value
of Accounts
Appealed ($)
Adjusted Value
of Accounts
Appealed ($)
Number of
Accounts
Adjusted
BOPTA
Reduction
in Assessed
Value ($)
Reduction as
Percent of
Total Appealed
Value
Reduction as
Percent of
State Total
Reduction as
Percent of Total
Net Assessed
Value
Baker 1 1,348,730 1,193,554 11 155,176 11.51% 0.10% 0.01%
Benton 57 28,563,931 26,409,512 1 2,154,419 7.54% 1.33% 0.03%
Clackamas 371 601,026,798 576,719,473 55 24,307,325 4.04% 14.96% 0.06%
Clatsop 47 11,978,632 11,525,110 5 453,522 3.79% 0.28% 0.01%
Columbia 20 7,140,106 5,006,356 7 2,133,750 29.88% 1.31% 0.05%
Coos 5 3,466,150 3,466,150 5 0 0.00% 0.00% 0.00%
Crook 4 1,209,022 1,201,835 2 7,187 0.59% 0.00% 0.00%
Curry 6 1,354,430 1,338,560 16 15,870 1.17% 0.01% 0.00%
Deschutes 105 61,410,403 50,154,303 28 11,256,100 18.33% 6.93% 0.05%
Douglas 140 26,761,077 19,523,133 28 7,237,944 27.05% 4.46% 0.09%
Gilliam 0 0 0 0 0 n/a 0.00% 0.00%
Grant 1 93,689 84,099 1 9,590 10.24% 0.01% 0.00%
Harney 2 982,710 982,710 0 0 0.00% 0.00% 0.00%
Hood River 5 4,317,410 4,126,870 0 190,540 4.41% 0.12% 0.01%
Jackson 133 88,525,135 78,032,000 35 10,493,135 11.85% 6.46% 0.06%
Jefferson 8 3,309,195 3,296,255 6 12,940 0.39% 0.01% 0.00%
Josephine 8 2,432,443 2,432,443 6 0 0.00% 0.00% 0.00%
Klamath 134 36,944,022 33,933,688 35 3,010,334 8.15% 1.85% 0.06%
Lake 1 24,733 24,733 4 0 0.00% 0.00% 0.00%
Lane 721 392,665,762 359,410,096 24 33,255,666 8.47% 20.47% 0.11%
Lincoln 108 29,938,030 25,840,859 7 4,097,171 13.69% 2.52% 0.06%
Linn 35 30,036,049 28,292,259 14 1,743,790 5.81% 1.07% 0.02%
Malheur 5 2,295,034 1,798,094 2 496,940 21.65% 0.31% 0.03%
Marion 266 117,357,733 94,944,415 27 22,413,318 19.10% 13.80% 0.10%
Morrow 2 767,100 586,360 0 180,740 23.56% 0.11% 0.01%
Multnomah 710 1,318,947,370 1,307,674,960 116 11,272,410 0.85% 6.94% 0.02%
Polk 9 2,056,873 1,900,437 14 156,436 7.61% 0.10% 0.00%
Sherman 3 2,453,830 2,453,830 0 0 0.00% 0.00% 0.00%
Tillamook 27 4,617,260 4,360,780 0 256,480 5.55% 0.16% 0.01%
Umatilla 7 1,654,360 1,617,670 56 36,690 2.22% 0.02% 0.00%
Union 3 908,380 908,380 0 0 0.00% 0.00% 0.00%
Wallowa 11 1,834,291 1,762,959 0 71,332 3.89% 0.04% 0.01%
Wasco 26 9,105,599 8,681,641 2 423,958 4.66% 0.26% 0.02%
Washington 234 235,289,586 209,256,561 49 26,033,025 11.06% 16.03% 0.05%
Wheeler 3 393,133 378,503 0 14,630 3.72% 0.01% 0.01%
Yamhill 60 14,265,744 13,721,238 11 544,506 3.82% 0.34% 0.01%
Total* 3,278 3,045,474,750 2,883,039,826 567 162,434,924 5.33% 100% 0.05%
Table 1.9 Assessed Value Reductions Resulting From Board of Property Tax Appeals (BOPTA) Actions
FY 2014-15, By County
Notes: Number of Accounts does not include withdrawn petitions.
*Total values are not statewide totals because of unavailable data.

Section V
Detailed Tables – Tax Authority and Tax Due Calculation
Oregon Department of Revenue, Research Section 33
Detailed Tables: Tax Authority and Tax Due Calculation
Table 2.1 – Growth in Tax Imposed by Category of Tax and County
Table 2.2 – Growth in Tax Imposed by Category of Tax and Type of District
Table 2.3 – Tax Extended, Imposed and Compression Loss by County
Table 2.4 – Tax Extended, Imposed and Compression Loss by Type of Taxing District
Table 2.5 – Change in Tax Imposed and Compression Loss by County
Table 2.6 – Change in Tax Imposed and Compression Loss by Type of Taxing District

Section V: Detailed Tables - Tax Authority and Tax Due Calculation
34 Oregon Department of Revenue, Research Section
Table 2.1 Growth in Tax Imposed from FY 2014-15 to 2015-16
by Category of Tax and County (Thousands of Dollars)
County FY 2014-15 FY 2015-16 % CH FY 2014-15 FY 2015-16 % CH FY 2014-15 FY 2015-16 % CH FY 2014-15 FY 2015-16 % CH FY 2014-15 FY 2015-16 % CH
Baker 16,736 17,495 4.5 534 555 4.0 0 0 0.0 88 93 6.4 17,358 18,143 4.5
Benton 89,737 92,499 3.1 15,134 15,667 3.5 0 0 0.0 16,014 15,866 -0.9 120,885 124,032 2.6
Clackamas 522,341 548,123 4.9 33,645 39,288 16.8 233 223 -4.5 100,575 108,180 7.6 656,794 695,813 5.9
Clatsop 56,580 59,097 4.4 2,467 2,376 -3.7 0 0 0.0 6,242 6,702 7.4 65,289 68,176 4.4
Columbia 46,042 48,103 4.5 5,690 5,841 2.7 0 0 0.0 8,369 8,116 -3.0 60,101 62,060 3.3
Coos 53,796 55,086 2.4 361 372 3.0 0 0 0.0 4,769 3,822 -19.9 58,926 59,280 0.6
Crook 21,715 22,977 5.8 105 111 5.9 0 0 0.0 1,460 1,854 26.9 23,280 24,942 7.1
Curry 21,200 21,678 2.3 241 306 26.9 0 0 0.0 1,740 2,330 33.9 23,180 24,314 4.9
Deschutes 240,539 257,808 7.2 9,448 10,178 7.7 0 0 0.0 42,092 43,581 3.5 292,079 311,567 6.7
Douglas 84,684 86,265 1.9 355 355 0.1 0 0 0.0 6,236 6,344 1.7 91,274 92,964 1.9
Gilliam 8,389 8,396 0.1 109 110 1.0 0 0 0.0 476 495 3.9 8,974 9,001 0.3
Grant 6,731 6,839 1.6 0 0 0.0 0 0 0.0 1,040 474 -54.4 7,771 7,313 -5.9
Harney 6,712 6,882 2.5 0 0 0.0 0 0 0.0 197 217 10.0 6,909 7,099 2.7
Hood River 20,211 20,986 3.8 1,969 2,348 19.2 0 0 0.0 6,300 6,036 -4.2 28,480 29,369 3.1
Jackson 214,960 223,587 4.0 3,766 4,098 8.8 0 0 0.0 34,078 34,450 1.1 252,804 262,135 3.7
Jefferson 17,078 18,133 6.2 2,033 2,209 8.6 0 0 0.0 4,612 4,666 1.2 23,724 25,008 5.4
Josephine 49,837 51,909 4.2 5,703 6,059 6.3 0 0 0.0 4,471 4,511 0.9 60,010 62,480 4.1
Klamath 55,259 57,524 4.1 1,705 1,715 0.6 0 0 0.0 2,325 4,471 92.3 59,289 63,710 7.5
Lake 11,875 12,057 1.5 0 0 0.0 0 0 0.0 656 712 8.5 12,531 12,770 1.9
Lane 345,348 360,541 4.4 38,057 40,586 6.6 0 0 0.0 70,897 68,255 -3.7 454,302 469,382 3.3
Lincoln 78,545 80,865 3.0 1,943 2,713 39.6 0 0 0.0 13,566 13,569 0.0 94,055 97,146 3.3
Linn 90,804 94,621 4.2 24,076 26,090 8.4 0 0 0.0 18,390 18,245 -0.8 133,270 138,956 4.3
Malheur 21,544 22,079 2.5 0 0 0.0 0 0 0.0 2,258 1,838 -18.6 23,802 23,917 0.5
Marion 276,438 290,801 5.2 3,345 3,187 -4.7 0 0 0.0 56,239 61,824 9.9 336,022 355,813 5.9
Morrow 23,301 26,345 13.1 995 1,172 17.8 0 0 0.0 3,263 4,282 31.2 27,559 31,800 15.4
Multnomah 970,644 1,021,956 5.3 84,856 102,876 21.2 126,220 125,840 -0.3 130,440 128,206 -1.7 1,312,159 1,378,878 5.1
Polk 57,623 60,608 5.2 301 1,959 550.6 0 0 0.0 18,402 18,732 1.8 76,326 81,298 6.5
Sherman 6,778 6,878 1.5 0 0 0.0 0 0 0.0 106 109 2.9 6,884 6,987 1.5
Tillamook 37,654 38,901 3.3 3,474 3,579 3.0 0 0 0.0 7,576 7,140 -5.8 48,704 49,620 1.9
Umatilla 62,272 64,521 3.6 734 997 35.9 0 0 0.0 14,883 16,744 12.5 77,889 82,262 5.6
Union 20,205 20,779 2.8 264 264 0.2 0 0 0.0 247 2,311 835.2 20,716 23,354 12.7
Wallowa 7,665 7,971 4.0 400 400 0.0 0 0 0.0 8 8 0.0 8,072 8,378 3.8
Wasco 28,814 29,219 1.4 184 184 0.3 0 0 0.0 4,070 4,206 3.3 33,068 33,608 1.6
Washington 620,812 660,141 6.3 110,442 127,268 15.2 341 329 -3.5 172,794 165,104 -4.5 904,390 952,842 5.4
Wheeler 2,063 2,110 2.3 2 2 19.6 0 0 0.0 74 74 0.3 2,139 2,186 2.2
Yamhill 86,669 91,244 5.3 344 361 5.0 0 0 0.0 24,730 29,125 17.8 111,743 120,729 8.0
Statewide Total 4,281,601 4,495,024 5 352,680 403,224 14.3 126,794 126,391 -0.3 779,681 792,693 1.7 5,540,756 5,817,332 5.0
Notes: Gap Bonds refer to the City of Portland pension levy. See Section IV (2) for more information on types of levies.
TotalPermanent Authority Local Option Gap Bonds Bonds

Section V: Detailed Tables - Tax Authority and Tax Due Calculation
Oregon Department of Revenue, Research Section 35
Table 2.2 Growth in Tax Imposed from FY 2014-15 and 2015-16
by Category of Tax and Type of District (Thousands of Dollars)
District Type FY 2014-15 FY 2015-16 % CH FY 2014-15 FY 2015-16 % CH FY 2014-15 FY 2015-16 % CH FY 2014-15 FY 2015-16 % CH FY 2014-15 FY 2015-16 % CH
County 845,201 888,085 5.1 93,783 101,074 7.8 0 0 0.0 26,276 21,388 -18.6 965,261 1,010,547 4.7
City 942,676 990,095 5.0 60,841 68,044 11.8 126,794 126,391 -0.3 78,992 82,935 5.0 1,209,303 1,267,466 4.8
School 1,581,121 1,657,960 4.9 134,129 155,413 15.9 0 0 0.0 520,486 549,864 5.6 2,235,736 2,363,237 5.7
Education Service 112,577 117,520 4.4 0 0 0.0 0 0 0.0 0 0 0.0 112,577 117,520 4.4
Community College 154,216 161,644 4.8 0 0 0.0 0 0 0.0 80,617 71,566 -11.2 234,833 233,210 -0.7
Cemetery 2,564 2,650 3.3 61 0 -100.0 0 0 0.0 0 0 0.0 2,625 2,650 0.9
Fire 277,197 289,806 4.5 27,987 40,018 43.0 0 0 0.0 14,073 16,294 15.8 319,257 346,118 8.4
Health 22,242 22,982 3.3 7,402 7,967 7.6 0 0 0.0 1,719 1,704 -0.9 31,363 32,653 4.1
Park 71,736 75,280 4.9 998 1,042 4.4 0 0 0.0 13,666 13,657 -0.1 86,401 89,979 4.1
Port 18,144 18,991 4.7 0 0 0.0 0 0 0.0 1,108 1,117 0.8 19,252 20,108 4.4
Road 10,548 10,979 4.1 67 97 44.0 0 0 0.0 0 0 0.0 10,615 11,076 4.3
Sanitary 1,118 1,146 2.5 0 0 0.0 0 0 0.0 1,350 1,339 -0.8 2,468 2,485 0.7
Water Supply 2,452 2,518 2.7 1,137 1,250 10.0 0 0 0.0 1,307 1,291 -1.2 4,895 5,059 3.3
Water Control 11,243 11,879 5.7 0 0 0.0 0 0 0.0 279 269 -3.6 11,522 12,148 5.4
Vector Control 4,086 4,261 4.3 1,520 1,705 12.2 0 0 0.0 0 0 0.0 5,606 5,966 6.4
Service 46,145 33,240 -28.0 12,154 13,343 9.8 0 0 0.0 38,436 29,851 -22.3 96,735 76,433 -21.0
Other 178,334 205,988 15.5 12,601 13,272 5.3 0 0 0.0 1,371 1,418 3.4 192,307 220,678 14.8
Statewide Total 4,281,601 4,495,024 5.0 352,680 403,224 14.3 126,794 126,391 -0.3 779,681 792,693 1.7 5,540,756 5,817,332 5.0
Notes: The category "Other" includes taxing districts such as library, transit, and public utility districts.
Gap Bonds refer to the City of Portland pension levy.
TotalPermanent Authority Local Option Gap Bonds Bonds

Section V: Detailed Tables - Tax Authority and Tax Due Calculation
36 Oregon Department of Revenue, Research Section
Table 2.3 Tax Extended, Tax Imposed, and Compression due to Measure 5 Rate Limits
FY 2015-16 by County and Limit Category
County Inside Limit Outside Limit Total Inside Limit Outside Limit Total
$ Reduction
Due to Limit
% of Tax
Extended
Baker 19,184,389 93,137 19,277,526 18,050,202 93,137 18,143,339 1,134,187 5.9
Benton 114,043,288 15,866,443 129,909,732 108,165,489 15,866,443 124,031,933 5,877,799 5.2
Clackamas 597,946,345 108,179,510 706,125,855 587,633,434 108,179,510 695,812,944 10,312,911 1.7
Clatsop 62,669,003 6,702,478 69,371,481 61,473,036 6,702,479 68,175,515 1,195,968 1.9
Columbia 55,426,167 8,116,237 63,542,403 53,944,001 8,116,236 62,060,237 1,482,180 2.7
Coos 55,938,678 3,822,393 59,761,071 55,457,206 3,822,394 59,279,600 481,478 0.9
Crook 23,421,741 1,853,592 25,275,333 23,087,890 1,853,777 24,941,667 333,852 1.4
Curry 22,009,519 2,330,004 24,339,523 21,984,096 2,330,004 24,314,100 25,432 0.1
Deschutes 269,874,165 43,580,866 313,455,031 267,985,718 43,580,875 311,566,592 1,888,479 0.7
Douglas 88,309,799 6,344,088 94,653,887 86,619,949 6,344,093 92,964,041 1,689,878 1.9
Gilliam 8,749,703 494,926 9,244,629 8,505,969 494,960 9,000,929 243,733 2.8
Grant 6,935,125 474,027 7,409,152 6,839,219 474,026 7,313,245 95,907 1.4
Harney 7,212,778 216,973 7,429,751 6,881,721 216,973 7,098,694 331,056 4.6
Hood River 24,210,642 6,035,943 30,246,585 23,333,458 6,035,944 29,369,402 877,205 3.6
Jackson 229,329,923 34,450,086 263,780,009 227,684,810 34,450,089 262,134,899 1,645,213 0.7
Jefferson 20,995,136 4,665,660 25,660,796 20,342,413 4,665,660 25,008,074 652,726 3.1
Josephine 58,445,870 4,511,302 62,957,173 57,968,400 4,511,307 62,479,707 477,496 0.8
Klamath 60,286,382 4,447,874 64,734,255 59,238,672 4,471,149 63,709,821 1,390,413 2.3
Lake 12,333,966 712,164 13,046,131 12,057,492 712,164 12,769,656 276,475 2.2
Lane 414,179,035 68,255,354 482,434,389 401,126,980 68,255,354 469,382,334 13,052,055 3.2
Lincoln 84,431,279 13,568,591 97,999,870 83,577,732 13,568,600 97,146,332 853,587 1.0
Linn 130,073,559 18,245,066 148,318,624 120,710,797 18,245,096 138,955,893 9,363,066 7.2
Malheur 22,646,162 1,837,807 24,483,970 22,079,197 1,837,807 23,917,004 566,967 2.5
Marion 296,678,955 61,824,220 358,503,175 293,988,324 61,824,241 355,812,566 2,690,729 0.9
Morrow 30,436,312 4,282,470 34,718,782 27,517,646 4,282,471 31,800,116 2,918,673 9.6
Multnomah 1,326,162,365 128,206,337 1,454,368,702 1,250,671,350 128,206,475 1,378,877,825 75,491,314 5.7
Polk 63,173,000 18,731,637 81,904,638 62,566,852 18,731,640 81,298,491 606,157 1.0
Sherman 7,170,132 109,374 7,279,506 6,877,648 109,374 6,987,022 292,484 4.1
Tillamook 42,806,448 7,140,239 49,946,687 42,479,990 7,140,240 49,620,230 326,477 0.8
Umatilla 69,292,036 16,743,819 86,035,855 65,518,390 16,743,819 82,262,208 3,773,662 5.5
Union 21,553,080 2,311,014 23,864,094 21,043,294 2,311,016 23,354,309 509,794 2.4
Wallowa 8,434,209 7,599 8,441,808 8,370,414 7,599 8,378,013 63,792 0.8
Wasco 30,856,225 4,205,748 35,061,973 29,402,725 4,205,748 33,608,473 1,453,500 4.7
Washington 800,349,063 165,103,925 965,452,988 787,738,091 165,103,993 952,842,084 12,611,213 1.6
Wheeler 2,228,362 73,920 2,302,282 2,112,169 73,920 2,186,090 116,193 5.2
Yamhill 92,276,215 29,124,534 121,400,749 91,604,281 29,124,589 120,728,870 672,870 0.7
Statewide Total 5,180,069,060 792,669,358 5,972,738,417 5,024,639,053 792,693,201 5,817,332,254 155,774,919 3.0
Notes: Taxes in the "Outside Limit" category are not subject to Measure 5 limits.
Differences between "Outside Limit" tax extended and tax imposed is due to rounding done at the district level.
Difference between imposed and extended amounts are caused by compression and rounding done at the district level.
Urban renewal revenues are not included in this table.
Tax Extended Tax Imposed Compression

Section V: Detailed Tables - Tax Authority and Tax Due Calculation
Oregon Department of Revenue, Research Section 37
Table 2.4 Tax Extended, Tax Imposed, and Compression due to Measure 5 Rate Limits
FY 2015-16 by Type of Taxing District and Limit Category
District Type Inside Limit Outside Limit Total Inside Limit Outside Limit Total
$ Reduction
Due to Limit
% of Tax
Extended
County 1,012,341,633 21,388,011 1,033,729,645 989,158,825 21,388,041 1,010,546,866 23,222,075 2.3
City 1,219,996,340 82,935,060 1,302,931,400 1,184,530,437 82,935,097 1,267,465,534 35,588,781 2.9
School 1,896,153,504 549,841,014 2,445,994,518 1,813,372,806 549,864,489 2,363,237,296 82,851,317 4.4
Education Service 119,471,676 0 119,471,676 117,519,580 0 117,519,580 1,960,099 1.6
Community College 164,237,258 71,566,107 235,803,365 161,643,981 71,566,329 233,210,310 2,602,625 1.6
Cemetery 2,680,763 0 2,680,763 2,650,009 0 2,650,009 30,760 1.2
Fire 331,081,849 16,294,037 347,375,886 329,824,126 16,294,058 346,118,184 1,322,735 0.4
Health 31,694,388 1,703,762 33,398,150 30,948,956 1,703,761 32,652,718 748,937 2.4
Park 76,540,686 13,657,360 90,198,045 76,321,839 13,657,365 89,979,205 218,872 0.3
Port 19,248,927 1,116,692 20,365,618 18,991,057 1,116,692 20,107,749 257,899 1.3
Road 11,081,413 0 11,081,413 11,075,588 0 11,075,588 5,835 0.1
Sanitary 1,146,369 1,338,857 2,485,226 1,146,135 1,338,857 2,484,992 235 0.0
Water Supply 3,769,804 1,290,727 5,060,531 3,768,648 1,290,728 5,059,376 1,157 0.0
Water Control 12,177,902 269,180 12,447,082 11,878,912 269,180 12,148,092 299,058 2.5
Vector Control 6,204,348 0 6,204,348 5,965,976 0 5,965,976 242,432 3.9
Service 49,058,381 29,850,462 78,908,844 46,582,138 29,850,515 76,432,653 2,476,401 5.1
Other 223,183,818 1,418,089 224,601,907 219,260,038 1,418,089 220,678,127 3,945,701 1.8
Statewide Total 5,180,069,060 792,669,358 5,972,738,417 5,024,639,053 792,693,201 5,817,332,254 155,774,919 3.0
Notes: The category "Other" includes taxing districts such as library, transit, and public utility districts.
Taxes in the "Outside Limit" category are not subject to the Measure 5 rate limits.
Differences between "Outside Limit" tax extended and tax imposed is due to rounding done at the district level.
Urban renewal revenues are not included in this table.
Tax Extended Tax Imposed Compression

Section V: Detailed Tables - Tax Authority and Tax Due Calculation
38 Oregon Department of Revenue, Research Section
Table 2.5 Change in Tax Imposed and Compression due to Measure 5 Limits
FY 2014-15 and 2015-16 by County (Thousands of Dollars)
County FY 2014-15 FY 2015-16 % CH FY 2014-15 FY 2015-16 % CH FY 2014-15 FY 2015-16 % CH FY 2014-15 FY 2015-16 % CH
Baker 17,270 18,050 4.5 88 93 6.4 17,358 18,143 4.5 1,110 1,134 2.2
Benton 104,871 108,165 3.1 16,014 15,866 -0.9 120,885 124,032 2.6 5,780 5,878 1.7
Clackamas 556,219 587,633 5.6 100,575 108,180 7.6 656,794 695,813 5.9 13,659 10,313 -24.5
Clatsop 59,047 61,473 4.1 6,242 6,702 7.4 65,289 68,176 4.4 975 1,196 22.7
Columbia 51,732 53,944 4.3 8,369 8,116 -3.0 60,101 62,060 3.3 1,499 1,482 -1.1
Coos 54,157 55,457 2.4 4,769 3,822 -19.9 58,926 59,280 0.6 381 481 26.4
Crook 21,820 23,088 5.8 1,460 1,854 26.9 23,280 24,942 7.1 371 334 -10.1
Curry 21,441 21,984 2.5 1,740 2,330 33.9 23,180 24,314 4.9 23 25 9.3
Deschutes 249,986 267,986 7.2 42,092 43,581 3.5 292,079 311,567 6.7 2,360 1,888 -20.0
Douglas 85,038 86,620 1.9 6,236 6,344 1.7 91,274 92,964 1.9 1,496 1,690 13.0
Gilliam 8,498 8,506 0.1 476 495 3.9 8,974 9,001 0.3 233 244 4.4
Grant 6,731 6,839 1.6 1,040 474 -54.4 7,771 7,313 -5.9 89 96 8.1
Harney 6,712 6,882 2.5 197 217 10.0 6,909 7,099 2.7 294 331 12.5
Hood River 22,181 23,333 5.2 6,300 6,036 -4.2 28,480 29,369 3.1 857 877 2.4
Jackson 218,726 227,685 4.1 34,078 34,450 1.1 252,804 262,135 3.7 1,923 1,645 -14.5
Jefferson 19,111 20,342 6.4 4,612 4,666 1.2 23,724 25,008 5.4 712 653 -8.3
Josephine 55,539 57,968 4.4 4,471 4,511 0.9 60,010 62,480 4.1 379 477 25.9
Klamath 56,964 59,239 4.0 2,325 4,471 92.3 59,289 63,710 7.5 1,114 1,390 24.8
Lake 11,875 12,057 1.5 656 712 8.5 12,531 12,770 1.9 257 276 7.4
Lane 383,405 401,127 4.6 70,897 68,255 -3.7 454,302 469,382 3.3 13,139 13,052 -0.7
Lincoln 80,489 83,578 3.8 13,566 13,569 0.0 94,055 97,146 3.3 839 854 1.7
Linn 114,881 120,711 5.1 18,390 18,245 -0.8 133,270 138,956 4.3 10,389 9,363 -9.9
Malheur 21,544 22,079 2.5 2,258 1,838 -18.6 23,802 23,917 0.5 533 567 6.4
Marion 279,783 293,988 5.1 56,239 61,824 9.9 336,022 355,813 5.9 3,454 2,691 -22.1
Morrow 24,296 27,518 13.3 3,263 4,282 31.2 27,559 31,800 15.4 2,692 2,919 8.4
Multnomah 1,181,719 1,250,671 5.8 130,440 128,206 -1.7 1,312,159 1,378,878 5.1 90,636 75,491 -16.7
Polk 57,924 62,567 8.0 18,402 18,732 1.8 76,326 81,298 6.5 809 606 -25.0
Sherman 6,778 6,878 1.5 106 109 2.9 6,884 6,987 1.5 288 292 1.6
Tillamook 41,128 42,480 3.3 7,576 7,140 -5.8 48,704 49,620 1.9 376 326 -13.2
Umatilla 63,006 65,518 4.0 14,883 16,744 12.5 77,889 82,262 5.6 3,602 3,774 4.8
Union 20,469 21,043 2.8 247 2,311 835.2 20,716 23,354 12.7 388 510 31.4
Wallowa 8,065 8,370 3.8 8 8 0.0 8,072 8,378 3.8 67 64 -4.6
Wasco 28,998 29,403 1.4 4,070 4,206 3.3 33,068 33,608 1.6 793 1,454 83.3
Washington 731,596 787,738 7.7 172,794 165,104 -4.5 904,390 952,842 5.4 13,042 12,611 -3.3
Wheeler 2,065 2,112 2.3 74 74 0.3 2,139 2,186 2.2 105 116 11.0
Yamhill 87,013 91,604 5.3 24,730 29,125 17.8 111,743 120,729 8.0 556 673 20.9
Statewide Total 4,761,075 5,024,639 5.5 779,681 792,693 1.7 5,540,756 5,817,332 5.0 175,219 155,775 -11.1
Note: Urban renewal revenues are not included in this table.
Inside the Limit Outside the Limit Total Tax Imposed Compression Due to M5 Limits

Section V: Detailed Tables - Tax Authority and Tax Due Calculation
Oregon Department of Revenue, Research Section 39
Table 2.6 Change in Tax Imposed and Compression due to Measure 5 Limits
FY 2014-15 and FY 2015-16 by Type of Taxing District (Thousands of Dollars)
District Type FY 2014-15 FY 2015-16 % CH FY 2014-15 FY 2015-16 % CH FY 2014-15 FY 2015-16 % CH FY 2014-15 FY 2015-16 % CH
County 938,984 989,159 5.3 26,276 21,388 -18.6 965,261 1,010,547 4.7 27,434 23,222 -15.4
City 1,130,312 1,184,530 4.8 78,992 82,935 5.0 1,209,303 1,267,466 4.8 43,934 35,589 -19.0
School 1,715,249 1,813,373 5.7 520,486 549,864 5.6 2,235,736 2,363,237 5.7 88,064 82,851 -5.9
Education Service 112,577 117,520 4.4 0 0 0.0 112,577 117,520 4.4 2,121 1,960 -7.6
Community College 154,216 161,644 4.8 80,617 71,566 -11.2 234,833 233,210 -0.7 2,885 2,603 -9.8
Cemetery 2,625 2,650 0.9 0 0 0.0 2,625 2,650 0.9 28 31 10.4
Fire 305,184 329,824 8.1 14,073 16,294 15.8 319,257 346,118 8.4 1,083 1,323 22.1
Health 29,644 30,949 4.4 1,719 1,704 -0.9 31,363 32,653 4.1 710 749 5.4
Park 72,735 76,322 4.9 13,666 13,657 -0.1 86,401 89,979 4.1 193 219 13.5
Port 18,144 18,991 4.7 1,108 1,117 0.8 19,252 20,108 4.4 306 258 -15.6
Road 10,615 11,076 4.3 0 0 0.0 10,615 11,076 4.3 6 6 -0.4
Sanitary 1,118 1,146 2.5 1,350 1,339 -0.8 2,468 2,485 0.7 0 0 0.0
Water Supply 3,589 3,769 5.0 1,307 1,291 -1.2 4,895 5,059 3.3 1 1 14.1
Water Control 11,243 11,879 5.7 279 269 -3.6 11,522 12,148 5.4 378 299 -20.8
Vector Control 5,606 5,966 6.4 0 0 0.0 5,606 5,966 6.4 218 242 11.4
Service 58,299 46,582 -20.1 38,436 29,851 -22.3 96,735 76,433 -21.0 2,962 2,476 -16.4
Other 190,935 219,260 14.8 1,371 1,418 3.4 192,307 220,678 14.8 4,899 3,946 -19.5
Statewide Total 4,761,075 5,024,639 5.5 779,681 792,693 1.7 5,540,756 5,817,332 5 175,219 155,775 -11.1
Notes: The category "Other" includes taxing districts such as library, transit, and public utility districts.
Urban renewal revenues are not included in this table.
Inside the Limit Outside the Limit Total Tax Imposed Compression Due to M5 Limits


Section V
Detailed Tables – Urban Renewal
Oregon Department of Revenue, Research Section 41
Detailed Tables: Urban Renewal
Table 3.1 – Urban Renewal Excess Value Used and Revenue Received by Urban Renewal Plan Area
Table 3.2 – Urban Renewal Division of Tax Revenue by Type of Levy and District Type

Section V: Detailed Tables – Urban Renewal
42 Oregon Department of Revenue, Research Section
Table 3.1 Urban Renewal Excess Value Used and Revenue for FYs 2014-15 and 2015-16 by Urban Renewal Plan Area
Agency Plan Area County FY 2014-15 FY 2015-16 FY 2014-15 FY 2015-16 FY 2014-15 FY 2015-16 FY 2014-15 FY 2015-16 % CH
City of Philomath Agency Philomath UR Plan Area Benton 30,781,622 32,138,556 496,071 518,948 0 0 496,071 518,948 4.6
City of Estacada Agency Estacada Plan Area Clackamas 14,153,864 15,636,566 230,161 246,962 0 0 230,161 246,962 7.3
Clackamas County Agency N Clackamas Revitalization UR Plan Area Clackamas 141,731,246 169,607,486 1,989,738 2,377,317 0 0 1,989,738 2,377,317 19.5
City of Gladstone Agency Gladstone 1 UR Plan Area Clackamas 58,624,873 61,350,465 815,836 849,169 0 0 815,836 849,169 4.1
City of Lake Oswego Agency East End Lake Oswego UR Plan Area Clackamas 220,642,967 230,013,285 3,726,093 3,493,519 0 0 3,726,093 3,493,519 -6.2
City of Lake Oswego Agency Lake Grove Village Center UR Plan Area Clackamas 28,865,562 48,779,509 416,200 698,165 0 0 416,200 698,165 67.7
City of Oregon City Agency Oregon City Downtown/N. End UR Plan Area Clackamas 128,141,127 129,397,100 2,254,016 2,257,702 0 0 2,254,016 2,257,702 0.2
City of Wilsonville Agency Wilsonville Yr2000 UR Plan Area Clackamas 303,000,000 303,000,000 4,427,450 4,219,533 0 0 4,427,450 4,219,533 -4.7
City of Wilsonville Agency Wilsonville West Side UR Plan Area Clackamas 296,303,413 361,205,632 4,328,792 5,031,171 0 0 4,328,792 5,031,171 16.2
City of Sandy Agency Sandy UR Plan Area Clackamas 85,394,146 89,375,547 1,472,456 1,535,275 0 0 1,472,456 1,535,275 4.3
City of Canby Agency Canby UR Plan Area Clackamas 149,261,677 160,747,472 2,530,866 2,719,426 0 0 2,530,866 2,719,426 7.5
City of Molalla Molalla UR Plan Area Clackamas 20,272,774 21,221,783 299,285 313,257 0 0 299,285 313,257 4.7
City of Astoria Agency Astoria East UR Plan Area Clatsop 18,613,638 18,578,978 333,560 326,209 0 0 333,560 326,209 -2.2
City of Astoria Agency Astoria West UR Plan Area Clatsop 34,546,631 40,581,593 619,469 712,841 0 0 619,469 712,841 15.1
City of Seaside Agency Greater Seaside UR Plan Area Clatsop 74,257,472 N/A 865,684 N/A 455,628 N/A 1,321,312 N/A N/A
City of Warrenton Warrenton UR Plan Area Clatsop 52,179,015 56,963,784 497,892 543,717 0 0 497,892 543,717 9.2
City of Rainier Agency Rainier Waterfront UR Plan Area Columbia 16,848,365 16,657,752 282,413 281,862 0 0 282,413 281,862 -0.2
Columbia County Agency Port Westward UR Plan Area Columbia 297,179,573 256,851,408 3,021,055 2,606,013 0 0 3,021,055 2,606,013 -13.7
Coos County Agency Coos County North Bay UR Plan Area Coos 10,832,675 11,509,470 96,359 98,272 108,447 120,477 204,806 218,749 6.8
City of Bandon Agency Bandon 1 UR Plan Area Coos 29,391,137 30,359,545 289,580 289,913 0 0 289,580 289,913 0.1
City of Bandon Agency Bandon 2 UR Plan Area Coos 14,817,600 15,283,264 145,836 145,814 0 0 145,836 145,814 0.0
City of Coos Bay Agency Coos Bay Downtown UR Plan Area Coos 65,564,358 58,488,484 999,870 879,949 0 0 999,870 879,949 -12.0
City of Coos Bay Agency Coos Bay Empire UR Plan Area Coos 46,372,572 47,775,708 706,972 718,515 0 0 706,972 718,515 1.6
City of North Bend Agency North Bend Downtown UR Plan Area Coos 27,336,775 25,705,605 401,912 372,647 233,683 225,100 635,595 597,747 -6.0
City of Coquille Agency Coquille UR Plan Area Coos 17,610,188 17,613,145 290,121 285,728 0 0 290,121 285,728 -1.5
City of Brookings Agency Brookings Downtown UR Plan Area Curry 44,255,124 44,300,513 451,478 449,756 0 0 451,478 449,756 -0.4
City of Redmond Agency Redmond Downtown UR Plan Area Deschutes 145,085,911 154,346,356 2,241,386 2,390,577 0 0 2,241,386 2,390,577 6.7
City of Bend Agency Bend Juniper Ridge UR Plan Area Deschutes 79,182,528 89,715,344 941,334 1,055,960 0 0 941,334 1,055,960 12.2
City of Bend Agency Murphy Crossing UR Plan Area Deschutes 20,829,622 18,924,375 267,603 241,610 0 0 267,603 241,610 -9.7
City of Sisters Agency Sisters Downtown UR Plan Area Deschutes 8,601,495 10,849,315 124,563 157,139 0 0 124,563 157,139 26.2
City of La Pine La Pine UR Plan Area Deschutes N/A 55,119 N/A 636 N/A 0 N/A 636 N/A
City of Roseburg Agency North Roseburg UR Plan Area Douglas 236,148,150 242,170,028 3,553,438 3,629,716 0 0 3,553,438 3,629,716 2.1
City of Winston Winston Division UR Plan Area Douglas 5,891,970 6,597,214 99,633 111,411 0 0 99,633 111,411 11.8
City of Reedsport Reedsport Urban Renewal Division Douglas 5,145,500 7,393,721 79,410 114,546 0 0 79,410 114,546 44.2
City of Hood River Agency Columbia Cascade/H.R. UR Plan Area Hood River 74,781,664 87,751,211 913,197 1,051,582 0 0 913,197 1,051,582 15.2
City of Hood River Agency Waterfront UR Plan Area Hood River 25,118,601 29,855,685 306,454 357,367 0 0 306,454 357,367 16.6
City of Hood River Agency Hood River Heights Business District Hood River 7,684,080 10,919,252 93,219 130,253 0 0 93,219 130,253 39.7
Hood River County Agency Windmaster UR Plan Area Hood River 13,710,706 15,840,280 138,003 156,391 0 0 138,003 156,391 13.3
City of Medford Agency Medford City Center UR Plan Area Jackson 227,154,169 242,241,543 3,086,620 3,285,377 2,770,034 2,958,860 5,856,654 6,244,237 6.6
City of Talent Agency Talent UR Plan Area Jackson 55,383,757 59,456,205 823,850 896,433 442,072 481,618 1,265,922 1,378,051 8.9
City of Jacksonville Agency Jacksonville UR Plan Area Jackson 30,541,959 34,447,657 328,135 369,546 0 0 328,135 369,546 12.6
City of Phoenix Agency Downtown & East Pine ST Plan Area Jackson 20,142,328 22,554,800 316,948 357,814 0 0 316,948 357,814 12.9
City of Central Point Downtown & East Pine ST Corridor Revitalization Plan ArJackson 7,728,500 12,112,138 126,944 197,920 0 0 126,944 197,920 55.9City of Culver Agency City Of Culver UR Plan Area Jefferson 2,327,999 2,454,115 36,104 38,485 0 0 36,104 38,485 6.6
Excess Value Used
Revenue from Excess
Value
Revenue from
Special Levies Total Revenue
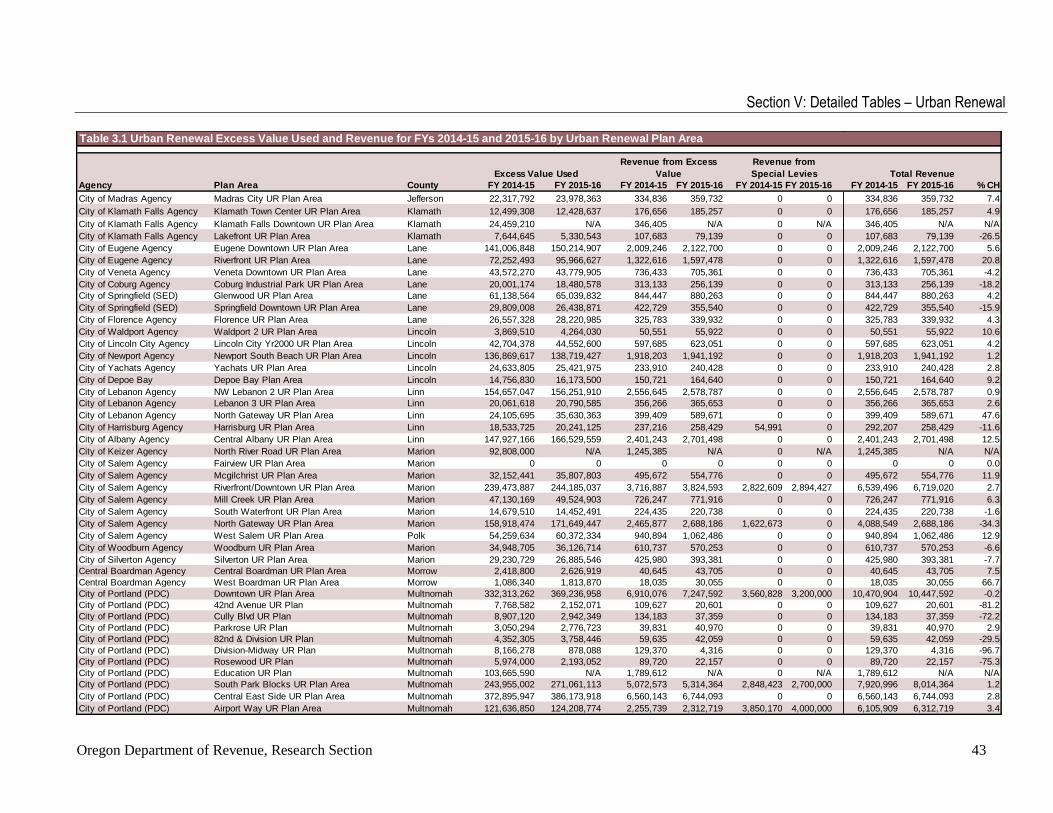
Section V: Detailed Tables – Urban Renewal
Oregon Department of Revenue, Research Section 43
Table 3.1 Urban Renewal Excess Value Used and Revenue for FYs 2014-15 and 2015-16 by Urban Renewal Plan Area
Agency Plan Area County FY 2014-15 FY 2015-16 FY 2014-15 FY 2015-16 FY 2014-15 FY 2015-16 FY 2014-15 FY 2015-16 % CH
City of Madras Agency Madras City UR Plan Area Jefferson 22,317,792 23,978,363 334,836 359,732 0 0 334,836 359,732 7.4
City of Klamath Falls Agency Klamath Town Center UR Plan Area Klamath 12,499,308 12,428,637 176,656 185,257 0 0 176,656 185,257 4.9
City of Klamath Falls Agency Klamath Falls Downtown UR Plan Area Klamath 24,459,210 N/A 346,405 N/A 0 N/A 346,405 N/A N/A
City of Klamath Falls Agency Lakefront UR Plan Area Klamath 7,644,645 5,330,543 107,683 79,139 0 0 107,683 79,139 -26.5
City of Eugene Agency Eugene Downtown UR Plan Area Lane 141,006,848 150,214,907 2,009,246 2,122,700 0 0 2,009,246 2,122,700 5.6
City of Eugene Agency Riverfront UR Plan Area Lane 72,252,493 95,966,627 1,322,616 1,597,478 0 0 1,322,616 1,597,478 20.8
City of Veneta Agency Veneta Downtown UR Plan Area Lane 43,572,270 43,779,905 736,433 705,361 0 0 736,433 705,361 -4.2
City of Coburg Agency Coburg Industrial Park UR Plan Area Lane 20,001,174 18,480,578 313,133 256,139 0 0 313,133 256,139 -18.2
City of Springfield (SED) Glenwood UR Plan Area Lane 61,138,564 65,039,832 844,447 880,263 0 0 844,447 880,263 4.2
City of Springfield (SED) Springfield Downtown UR Plan Area Lane 29,809,008 26,438,871 422,729 355,540 0 0 422,729 355,540 -15.9
City of Florence Agency Florence UR Plan Area Lane 26,557,328 28,220,985 325,783 339,932 0 0 325,783 339,932 4.3
City of Waldport Agency Waldport 2 UR Plan Area Lincoln 3,869,510 4,264,030 50,551 55,922 0 0 50,551 55,922 10.6
City of Lincoln City Agency Lincoln City Yr2000 UR Plan Area Lincoln 42,704,378 44,552,600 597,685 623,051 0 0 597,685 623,051 4.2
City of Newport Agency Newport South Beach UR Plan Area Lincoln 136,869,617 138,719,427 1,918,203 1,941,192 0 0 1,918,203 1,941,192 1.2
City of Yachats Agency Yachats UR Plan Area Lincoln 24,633,805 25,421,975 233,910 240,428 0 0 233,910 240,428 2.8
City of Depoe Bay Depoe Bay Plan Area Lincoln 14,756,830 16,173,500 150,721 164,640 0 0 150,721 164,640 9.2
City of Lebanon Agency NW Lebanon 2 UR Plan Area Linn 154,657,047 156,251,910 2,556,645 2,578,787 0 0 2,556,645 2,578,787 0.9
City of Lebanon Agency Lebanon 3 UR Plan Area Linn 20,061,618 20,790,585 356,266 365,653 0 0 356,266 365,653 2.6
City of Lebanon Agency North Gateway UR Plan Area Linn 24,105,695 35,630,363 399,409 589,671 0 0 399,409 589,671 47.6
City of Harrisburg Agency Harrisburg UR Plan Area Linn 18,533,725 20,241,125 237,216 258,429 54,991 0 292,207 258,429 -11.6
City of Albany Agency Central Albany UR Plan Area Linn 147,927,166 166,529,559 2,401,243 2,701,498 0 0 2,401,243 2,701,498 12.5
City of Keizer Agency North River Road UR Plan Area Marion 92,808,000 N/A 1,245,385 N/A 0 N/A 1,245,385 N/A N/A
City of Salem Agency Fairview UR Plan Area Marion 0 0 0 0 0 0 0 0 0.0
City of Salem Agency Mcgilchrist UR Plan Area Marion 32,152,441 35,807,803 495,672 554,776 0 0 495,672 554,776 11.9
City of Salem Agency Riverfront/Downtown UR Plan Area Marion 239,473,887 244,185,037 3,716,887 3,824,593 2,822,609 2,894,427 6,539,496 6,719,020 2.7
City of Salem Agency Mill Creek UR Plan Area Marion 47,130,169 49,524,903 726,247 771,916 0 0 726,247 771,916 6.3
City of Salem Agency South Waterfront UR Plan Area Marion 14,679,510 14,452,491 224,435 220,738 0 0 224,435 220,738 -1.6
City of Salem Agency North Gateway UR Plan Area Marion 158,918,474 171,649,447 2,465,877 2,688,186 1,622,673 0 4,088,549 2,688,186 -34.3
City of Salem Agency West Salem UR Plan Area Polk 54,259,634 60,372,334 940,894 1,062,486 0 0 940,894 1,062,486 12.9
City of Woodburn Agency Woodburn UR Plan Area Marion 34,948,705 36,126,714 610,737 570,253 0 0 610,737 570,253 -6.6
City of Silverton Agency Silverton UR Plan Area Marion 29,230,729 26,885,546 425,980 393,381 0 0 425,980 393,381 -7.7
Central Boardman Agency Central Boardman UR Plan Area Morrow 2,418,800 2,626,919 40,645 43,705 0 0 40,645 43,705 7.5
Central Boardman Agency West Boardman UR Plan Area Morrow 1,086,340 1,813,870 18,035 30,055 0 0 18,035 30,055 66.7
City of Portland (PDC) Downtown UR Plan Area Multnomah 332,313,262 369,236,958 6,910,076 7,247,592 3,560,828 3,200,000 10,470,904 10,447,592 -0.2
City of Portland (PDC) 42nd Avenue UR Plan Multnomah 7,768,582 2,152,071 109,627 20,601 0 0 109,627 20,601 -81.2
City of Portland (PDC) Cully Blvd UR Plan Multnomah 8,907,120 2,942,349 134,183 37,359 0 0 134,183 37,359 -72.2
City of Portland (PDC) Parkrose UR Plan Multnomah 3,050,294 2,776,723 39,831 40,970 0 0 39,831 40,970 2.9
City of Portland (PDC) 82nd & Division UR Plan Multnomah 4,352,305 3,758,446 59,635 42,059 0 0 59,635 42,059 -29.5
City of Portland (PDC) Division-Midway UR Plan Multnomah 8,166,278 878,088 129,370 4,316 0 0 129,370 4,316 -96.7
City of Portland (PDC) Rosewood UR Plan Multnomah 5,974,000 2,193,052 89,720 22,157 0 0 89,720 22,157 -75.3
City of Portland (PDC) Education UR Plan Multnomah 103,665,590 N/A 1,789,612 N/A 0 N/A 1,789,612 N/A N/A
City of Portland (PDC) South Park Blocks UR Plan Area Multnomah 243,955,002 271,061,113 5,072,573 5,314,364 2,848,423 2,700,000 7,920,996 8,014,364 1.2
City of Portland (PDC) Central East Side UR Plan Area Multnomah 372,895,947 386,173,918 6,560,143 6,744,093 0 0 6,560,143 6,744,093 2.8
City of Portland (PDC) Airport Way UR Plan Area Multnomah 121,636,850 124,208,774 2,255,739 2,312,719 3,850,170 4,000,000 6,105,909 6,312,719 3.4
Excess Value Used
Revenue from Excess
Value
Revenue from
Special Levies Total Revenue

Section V: Detailed Tables – Urban Renewal
44 Oregon Department of Revenue, Research Section
Table 3.1 Urban Renewal Excess Value Used and Revenue for FYs 2014-15 and 2015-16 by Urban Renewal Plan Area
Agency Plan Area County FY 2014-15 FY 2015-16 FY 2014-15 FY 2015-16 FY 2014-15 FY 2015-16 FY 2014-15 FY 2015-16 % CH
City of Portland (PDC) Convention Center UR Plan Area Multnomah 247,136,829 274,563,640 5,139,843 5,375,307 3,630,813 5,100,000 8,770,656 10,475,307 19.4
City of Portland (PDC) Lents Town Center UR Plan Area Multnomah 650,846,315 698,111,797 13,229,750 13,700,742 0 0 13,229,750 13,700,742 3.6
City of Portland (PDC) River District UR Plan Area Multnomah 1,424,799,374 1,552,291,205 29,808,527 30,600,154 0 0 29,808,527 30,600,154 2.7
City of Portland (PDC) Macadam UR Plan Area Multnomah 626,124,703 656,547,113 13,063,419 12,916,054 0 0 13,063,419 12,916,054 -1.1
City of Portland (PDC) N Interstate Corridor UR Plan Area Multnomah 1,075,480,078 1,222,834,128 22,520,068 24,121,730 0 0 22,520,068 24,121,730 7.1
City of Portland (PDC) Gateway UR Plan Area Multnomah 213,423,949 245,514,959 4,044,318 4,745,956 0 0 4,044,318 4,745,956 17.3
City of Portland (PDC) Willamette Industrial UR Plan Area Multnomah 0 N/A 0 N/A 0 N/A 0 N/A N/A
City of Gresham (GRC) Rockwood/W Gresham UR Plan Area Multnomah 225,995,571 250,742,002 3,688,006 3,947,617 0 0 3,688,006 3,947,617 7.0
City of Troutdale Troutdale Riverfront UR Plan Area Multnomah 10,515,210 8,308,240 181,425 137,301 0 0 181,425 137,301 -24.3
City of Wood Village Wood Village UR Plan Area Multnomah 3,900,960 6,402,150 61,732 97,676 0 0 61,732 97,676 58.2
City of Independence Agency Independence UR Plan Area Polk 28,129,956 30,839,796 420,260 448,370 0 0 420,260 448,370 6.7
City of Dallas Agency Dallas UR Plan Area Polk 10,765,510 11,800,365 132,324 144,171 0 0 132,324 144,171 9.0
City of Monmouth Agency Monmouth UR Plan Area Polk 17,214,059 18,545,251 237,783 248,823 0 0 237,783 248,823 4.6
City of Garibaldi Agency Garibaldi UR Plan Area Tillamook 4,769,837 5,090,527 51,233 54,162 0 0 51,233 54,162 5.7
City of Tillamook Agency Tillamook UR Plan Area Tillamook 25,633,492 26,325,428 263,346 268,395 0 0 263,346 268,395 1.9
City of Pendleton Agency Pendleton UR Plan Area Umatilla 43,738,510 48,902,352 744,661 815,954 0 0 744,661 815,954 9.6
City of Hermiston Agency Hermiston UR Plan Area Umatilla 1,073,854 1,962,760 17,900 32,299 0 0 17,900 32,299 80.4
City of La Grande Agency La Grande UR Plan Area Union 68,829,452 80,317,520 1,083,135 1,394,833 0 0 1,083,135 1,394,833 28.8
City of The Dalles Agency Columbia Gateway Downtown UR Plan Area Wasco 76,855,699 78,567,011 1,433,437 1,402,087 0 0 1,433,437 1,402,087 -2.2
City of Sherwood Agency Old Town UR Plan Area Washington 190,000,000 96,450,000 3,561,323 1,730,398 0 0 3,561,323 1,730,398 -51.4
City of North Plains Agency North Plains UR Plan Area Washington 11,938,683 14,114,304 144,629 168,181 0 0 144,629 168,181 16.3
City of Tigard Agency Tigard UR Plan Area Washington 29,010,331 31,637,128 360,196 381,825 0 0 360,196 381,825 6.0
City of Hillsboro Downtown Hillsboro UR Plan Area Washington 59,130,182 76,244,538 744,184 941,302 0 0 744,184 941,302 26.5
City of Beaverton Agency Central Beaverton UR Plan Area Washington 50,465,617 101,896,858 801,120 1,554,518 0 0 801,120 1,554,518 94.0
Forest Grove Agency Forest Grove UR Plan Area Washington N/A 2,087,388 N/A 27,917 N/A 0 N/A 27,917 N/A
City of Carlton Carlton UR Plan Area Yamhill 4,446,352 6,431,725 63,760 92,584 0 0 63,760 92,584 45.2
City of McMinnville McMinnVille UR Plan Area Yamhill 6,475,329 9,303,755 87,552 125,076 0 0 87,552 125,076 42.9
Total for all Plans 11,268,307,135 11,773,939,826 197,253,052 200,335,005 22,400,370 21,680,482 219,653,422 222,015,487 1.1
NOTES: N/A indicates that the plan did not divide tax that year, the plan area did not exist that year, or that the information was unavailable.
West Salem UR is reported in Polk County rather than Marion as the urban renewal plan area resides within Polk county. Some previous publications reported West Salem in Marion County.
Excess Value Used
Revenue from Excess
Value
Revenue from
Special Levies Total Revenue

Section V: Detailed Tables – Urban Renewal
Oregon Department of Revenue, Research Section 45
Table 3.2 Urban Renewal Division of Tax Revenue for FYs 2014-15 and 2015-16, by Agency, County, Type of Levy, and District Type
County Agency District Type FY 2014-15 FY 2015-16 FY 2014-15 FY 2015-16 FY 2014-15 FY 2015-16 FY 2014-15 FY 2015-16 % CH
Benton City of Philomath County 67,490 70,519 0 0 0 0 67,490 70,519 4.5
Benton City of Philomath City 150,988 158,766 0 0 0 0 150,988 158,766 5.2
Benton City of Philomath Education 173,632 181,419 0 0 44,244 45,833 217,876 227,252 4.3
Benton City of Philomath Other 59,717 62,411 0 0 0 0 59,717 62,411 4.5
Clackamas City of Estacada County 42,117 46,526 0 0 0 0 42,117 46,526 10.5
Clackamas City of Estacada City 37,859 41,810 0 0 4,887 5,147 42,746 46,957 9.9
Clackamas City of Estacada Education 71,775 79,310 0 0 30,626 26,775 102,401 106,084 3.6
Clackamas City of Estacada Other 42,898 47,395 0 0 0 0 42,898 47,395 10.5
Clackamas Clackamas County County 416,532 498,562 0 0 0 0 416,532 498,562 19.7
Clackamas Clackamas County City 22,502 28,941 0 0 10 0 22,512 28,941 28.6
Clackamas Clackamas County Education 816,115 975,686 0 0 118,979 163,113 935,094 1,138,799 21.8
Clackamas Clackamas County Other 596,174 711,015 0 0 19,425 0 615,599 711,015 15.5
Clackamas City of Gladstone County 140,904 147,459 0 0 0 0 140,904 147,459 4.7
Clackamas City of Gladstone City 282,377 295,508 0 0 0 0 282,377 295,508 4.7
Clackamas City of Gladstone Education 339,457 355,208 0 0 8,761 9,238 348,217 364,446 4.7
Clackamas City of Gladstone Other 39,209 40,914 0 0 5,129 844 44,338 41,757 -5.8
Clackamas City of Lake Oswego County 599,506 669,815 54,389 56,992 0 0 653,895 726,807 11.2
Clackamas City of Lake Oswego City 1,245,899 1,393,184 0 0 93,639 92,636 1,339,539 1,485,821 10.9
Clackamas City of Lake Oswego Education 1,278,544 1,429,302 307,825 0 333,442 325,212 1,919,811 1,754,514 -8.6
Clackamas City of Lake Oswego Other 166,057 181,775 5,500 0 57,490 42,768 229,047 224,543 -2.0
Clackamas City of Oregon City County 307,574 310,616 0 0 0 0 307,574 310,616 1.0
Clackamas City of Oregon City City 564,109 569,742 0 0 14,237 14,831 578,347 584,574 1.1
Clackamas City of Oregon City Education 752,952 760,590 0 0 204,692 204,000 957,644 964,590 0.7
Clackamas City of Oregon City Other 392,188 396,243 0 0 18,262 1,679 410,451 397,922 -3.1
Clackamas City of Wilsonville County 1,440,626 1,596,619 0 0 0 0 1,440,626 1,596,619 10.8
Clackamas City of Wilsonville City 1,449,232 1,609,837 0 0 87,011 84,519 1,536,243 1,694,356 10.3
Clackamas City of Wilsonville Education 3,557,822 3,945,946 0 0 897,695 591,666 4,455,517 4,537,611 1.8
Clackamas City of Wilsonville Other 1,273,060 1,412,657 0 0 50,796 9,461 1,323,856 1,422,117 7.4
Clackamas City of Sandy County 206,306 215,938 19,602 20,771 0 0 225,908 236,709 4.8
Clackamas City of Sandy City 342,267 358,450 0 0 0 0 342,267 358,450 4.7
Clackamas City of Sandy Education 469,181 491,174 0 0 198,658 203,377 667,839 694,551 4.0
Clackamas City of Sandy Other 234,489 245,564 1,953 0 0 0 236,442 245,564 3.9
Clackamas City of Canby County 361,043 389,003 36,893 39,664 0 0 397,936 428,667 7.7
Clackamas City of Canby City 506,549 545,005 71,015 76,151 0 0 577,564 621,156 7.5
Clackamas City of Canby Education 821,323 884,354 0 0 363,838 390,793 1,185,161 1,275,147 7.6
Clackamas City of Canby Other 316,007 340,179 54,197 54,277 0 0 370,204 394,456 6.6
Clackamas City of Molalla County 49,200 51,476 0 0 0 0 49,200 51,476 4.6
Clackamas City of Molalla City 103,037 108,087 0 0 2,599 2,554 105,636 110,641 4.7
Clackamas City of Molalla Education 114,036 119,313 0 0 2,994 3,177 117,030 122,490 4.7
Clackamas City of Molalla Other 27,419 28,650 0 0 0 0 27,419 28,650 4.5
Permanent/Gap Bonds Local Option Bonds Total Revenue

Section V: Detailed Tables – Urban Renewal
46 Oregon Department of Revenue, Research Section
Table 3.2 Urban Renewal Division of Tax Revenue for FYs 2014-15 and 2015-16, by Agency, County, Type of Levy, and District Type
County Agency District Type FY 2014-15 FY 2015-16 FY 2014-15 FY 2015-16 FY 2014-15 FY 2015-16 FY 2014-15 FY 2015-16 % CH
Clatsop City of Astoria County 80,672 89,610 0 0 0 0 80,672 89,610 11.1
Clatsop City of Astoria City 430,224 477,761 0 0 0 0 430,224 477,761 11.0
Clatsop City of Astoria Education 308,961 343,156 0 0 106,306 98,501 415,267 441,657 6.4
Clatsop City of Astoria Other 26,866 30,022 0 0 0 0 26,866 30,022 11.7
Clatsop City of Seaside County 113,826 N/A 0 N/A 0 N/A 113,826 N/A N/A
Clatsop City of Seaside City 235,212 N/A 0 N/A 0 N/A 235,212 N/A N/A
Clatsop City of Seaside Education 396,448 N/A 0 N/A 0 N/A 396,448 N/A N/A
Clatsop City of Seaside Other 120,198 N/A 0 N/A 0 N/A 120,198 N/A N/A
Clatsop City of Warrenton County 79,986 87,357 0 0 0 0 79,986 87,357 9.2
Clatsop City of Warrenton City 87,098 95,109 0 0 15,840 17,325 102,938 112,434 9.2
Clatsop City of Warrenton Education 288,095 314,531 0 0 0 0 288,095 314,531 9.2
Clatsop City of Warrenton Other 26,874 29,396 0 0 0 0 26,874 29,396 9.4
Columbia City of Rainier County 22,137 21,847 0 0 4,125 4,071 26,262 25,918 -1.3
Columbia City of Rainier City 74,111 75,102 0 0 35,162 35,920 109,273 111,023 1.6
Columbia City of Rainier Education 88,675 87,493 0 0 0 0 88,675 87,493 -1.3
Columbia City of Rainier Other 58,203 57,429 0 0 0 0 58,203 57,429 -1.3
Columbia Columbia County County 407,235 350,615 0 0 75,713 65,048 482,948 415,664 -13.9
Columbia Columbia County City 0 0 0 0 0 0 0 0 0.0
Columbia Columbia County Education 1,389,617 1,195,699 0 0 257,478 228,101 1,647,096 1,423,800 -13.6
Columbia Columbia County Other 891,012 766,549 0 0 0 0 891,012 766,549 -14.0
Coos Coos County County 11,242 12,023 0 0 4,888 3,006 16,130 15,028 -6.8
Coos Coos County City 2,476 66 0 0 0 0 2,476 66 -97.3
Coos Coos County Education 60,381 64,630 0 0 0 0 60,381 64,630 7.0
Coos Coos County Other 17,372 18,547 0 0 0 0 17,372 18,547 6.8
Coos City of Bandon County 47,702 49,235 0 0 20,907 12,133 68,608 61,367 -10.6
Coos City of Bandon City 20,224 20,881 0 0 20,395 16,661 40,619 37,541 -7.6
Coos City of Bandon Education 225,964 233,337 0 0 0 0 225,964 233,337 3.3
Coos City of Bandon Other 100,224 103,481 0 0 0 0 100,224 103,481 3.2
Coos City of Coos Bay County 120,780 114,611 0 0 52,823 28,253 173,602 142,864 -17.7
Coos City of Coos Bay City 712,214 676,185 0 0 0 0 712,214 676,185 -5.1
Coos City of Coos Bay Education 634,563 602,506 0 0 0 0 634,563 602,506 -5.1
Coos City of Coos Bay Other 186,462 176,908 0 0 0 0 186,462 176,908 -5.1
Coos City of North Bend County 29,471 27,748 0 0 12,910 6,821 42,381 34,569 -18.4
Coos City of North Bend City 169,003 158,938 0 0 0 0 169,003 158,938 -6.0
Coos City of North Bend Education 145,017 136,359 0 0 0 0 145,017 136,359 -6.0
Coos City of North Bend Other 45,511 42,781 0 0 0 0 45,511 42,781 -6.0
Coos City of Coquille County 18,805 18,754 0 0 8,244 4,621 27,050 23,375 -13.6
Coos City of Coquille City 106,291 106,024 0 0 0 0 106,291 106,024 -0.3
Coos City of Coquille Education 93,945 93,709 0 0 12,182 12,085 106,127 105,794 -0.3
Coos City of Coquille Other 50,654 50,535 0 0 0 0 50,654 50,535 -0.2
Permanent/Gap Bonds Local Option Bonds Total Revenue

Section V: Detailed Tables – Urban Renewal
Oregon Department of Revenue, Research Section 47
Table 3.2 Urban Renewal Division of Tax Revenue for FYs 2014-15 and 2015-16, by Agency, County, Type of Levy, and District Type
County Agency District Type FY 2014-15 FY 2015-16 FY 2014-15 FY 2015-16 FY 2014-15 FY 2015-16 FY 2014-15 FY 2015-16 % CH
Curry City of Brookings County 26,491 26,507 0 0 0 0 26,491 26,507 0.1
Curry City of Brookings City 166,472 166,678 0 0 0 0 166,472 166,678 0.1
Curry City of Brookings Education 194,383 194,553 0 0 35,226 33,494 229,610 228,047 -0.7
Curry City of Brookings Other 28,905 28,524 0 0 0 0 28,905 28,524 -1.3
Deschutes City of Redmond County 185,319 197,004 0 0 19,955 19,505 205,274 216,509 5.5
Deschutes City of Redmond City 639,657 679,957 0 0 11,640 11,313 651,297 691,270 6.1
Deschutes City of Redmond Education 832,736 885,348 0 0 0 0 832,736 885,348 6.3
Deschutes City of Redmond Other 552,078 597,449 0 0 0 0 552,078 597,449 8.2
Deschutes City of Bend County 126,902 137,888 0 0 13,063 12,989 139,965 150,878 7.8
Deschutes City of Bend City 278,997 303,754 0 0 0 0 278,997 303,754 8.9
Deschutes City of Bend Education 545,865 591,521 0 0 25,194 10,991 571,058 602,512 5.5
Deschutes City of Bend Other 218,916 240,426 0 0 0 0 218,916 240,426 9.8
Deschutes City of Sisters County 10,974 13,840 0 0 1,172 1,380 12,146 15,220 25.3
Deschutes City of Sisters City 22,697 28,635 0 0 0 0 22,697 28,635 26.2
Deschutes City of Sisters Education 41,356 52,209 0 0 8,825 10,548 50,180 62,757 25.1
Deschutes City of Sisters Other 39,539 50,526 0 0 0 0 39,539 50,526 27.8
Deschutes City of La Pine County N/A 69 N/A 0 N/A 0 N/A 69 N/A
Deschutes City of La Pine City N/A 97 N/A 0 N/A 0 N/A 97 N/A
Deschutes City of La Pine Education N/A 277 N/A 0 N/A 0 N/A 277 N/A
Deschutes City of La Pine Other N/A 192 N/A 0 N/A 0 N/A 192 N/A
Douglas City of Roseburg County 258,829 263,806 0 0 0 0 258,829 263,806 1.9
Douglas City of Roseburg City 1,973,078 2,011,683 0 0 0 0 1,973,078 2,011,683 2.0
Douglas City of Roseburg Education 1,167,488 1,199,936 0 0 140,248 140,160 1,307,736 1,340,096 2.5
Douglas City of Roseburg Other 13,795 14,132 0 0 0 0 13,795 14,132 2.4
Douglas City of Winston County 6,477 7,256 0 0 0 0 6,477 7,256 12.0
Douglas City of Winston City 24,906 28,470 0 0 0 0 24,906 28,470 14.3
Douglas City of Winston Education 31,360 35,159 0 0 9,465 9,831 40,825 44,990 10.2
Douglas City of Winston Other 27,425 30,696 0 0 0 0 27,425 30,696 11.9
Douglas City of Reedsport County 5,077 7,298 0 0 0 0 5,077 7,298 43.7
Douglas City of Reedsport City 28,270 40,661 0 0 0 0 28,270 40,661 43.8
Douglas City of Reedsport Education 25,237 36,269 0 0 0 0 25,237 36,269 43.7
Douglas City of Reedsport Other 20,826 30,318 0 0 0 0 20,826 30,318 45.6
Hood River City of Hood River County 152,405 181,988 0 0 19,811 0 172,216 181,988 5.7
Hood River City of Hood River City 302,344 361,280 0 0 0 0 302,344 361,280 19.5
Hood River City of Hood River Education 596,632 712,909 0 0 53,514 61,909 650,147 774,818 19.2
Hood River City of Hood River Other 151,090 180,423 0 0 37,074 40,693 188,164 221,116 17.5
Hood River Hood River County County 19,303 22,233 0 0 2,359 0 21,663 22,233 2.6
Hood River Hood River County City 0 0 0 0 0 0 0 0 0.0
Hood River Hood River County Education 75,699 87,549 0 0 6,649 7,636 82,348 95,184 15.6
Hood River Hood River County Other 29,539 34,079 0 0 4,453 4,895 33,992 38,973 14.7
Permanent/Gap Bonds Local Option Bonds Total Revenue

Section V: Detailed Tables – Urban Renewal
48 Oregon Department of Revenue, Research Section
Table 3.2 Urban Renewal Division of Tax Revenue for FYs 2014-15 and 2015-16, by Agency, County, Type of Levy, and District Type
County Agency District Type FY 2014-15 FY 2015-16 FY 2014-15 FY 2015-16 FY 2014-15 FY 2015-16 FY 2014-15 FY 2015-16 % CH
Jackson City of Medford County 456,400 486,579 0 0 40,024 41,053 496,424 527,632 6.3
Jackson City of Medford City 1,202,650 1,282,065 0 0 0 0 1,202,650 1,282,065 6.6
Jackson City of Medford Education 1,198,401 1,277,145 0 0 0 0 1,198,401 1,277,145 6.6
Jackson City of Medford Other 189,145 198,535 0 0 0 0 189,145 198,535 5.0
Jackson City of Talent County 107,756 116,160 0 0 9,533 9,905 117,289 126,065 7.5
Jackson City of Talent City 173,283 186,808 0 0 0 0 173,283 186,808 7.8
Jackson City of Talent Education 273,880 295,229 0 0 42,985 55,666 316,865 350,896 10.7
Jackson City of Talent Other 216,413 232,664 0 0 0 0 216,413 232,664 7.5
Jackson City of Jacksonville County 61,352 69,214 0 0 5,441 5,899 66,792 75,113 12.5
Jackson City of Jacksonville City 56,220 63,436 0 0 18,483 20,768 74,703 84,204 12.7
Jackson City of Jacksonville Education 161,097 181,743 0 0 0 0 161,097 181,743 12.8
Jackson City of Jacksonville Other 25,544 28,486 0 0 0 0 25,544 28,486 11.5
Jackson City of Phoenix County 40,379 45,180 0 0 3,581 3,848 43,960 49,028 11.5
Jackson City of Phoenix City 73,264 81,953 0 0 0 0 73,264 81,953 11.9
Jackson City of Phoenix Education 102,592 114,783 0 0 16,099 21,635 118,691 136,418 14.9
Jackson City of Phoenix Other 81,034 90,415 0 0 0 0 81,034 90,415 11.6
Jackson City of Central Point County 14,989 23,447 0 0 1,324 1,990 16,313 25,437 55.9
Jackson City of Central Point City 33,323 52,162 0 0 0 0 33,323 52,162 56.5
Jackson City of Central Point Education 39,344 61,573 0 0 8,470 12,719 47,814 74,291 55.4
Jackson City of Central Point Other 29,494 46,030 0 0 0 0 29,494 46,030 56.1
Jefferson City of Culver County 8,046 8,577 0 0 0 0 8,046 8,577 6.6
Jefferson City of Culver City 14,137 15,069 0 0 0 0 14,137 15,069 6.6
Jefferson City of Culver Education 12,941 13,794 0 0 0 0 12,941 13,794 6.6
Jefferson City of Culver Other 980 1,045 0 0 0 0 980 1,045 6.7
Jefferson City of Madras County 79,577 85,478 0 0 0 0 79,577 85,478 7.4
Jefferson City of Madras City 92,085 98,907 0 0 0 0 92,085 98,907 7.4
Jefferson City of Madras Education 121,490 130,572 0 0 0 0 121,490 130,572 7.5
Jefferson City of Madras Other 41,684 44,776 0 0 0 0 41,684 44,776 7.4
Klamath City of Klamath Falls County 71,636 28,184 0 0 0 0 71,636 28,184 -60.7
Klamath City of Klamath Falls City 225,788 88,703 0 0 0 0 225,788 88,703 -60.7
Klamath City of Klamath Falls Education 160,431 62,916 0 0 0 16,763 160,431 79,679 -50.3
Klamath City of Klamath Falls Other 172,890 67,829 0 0 0 0 172,890 67,829 -60.8
Lane City of Eugene County 271,483 313,462 0 0 21,189 0 292,672 313,462 7.1
Lane City of Eugene City 1,492,595 1,721,985 0 0 117,864 143,496 1,610,458 1,865,481 15.8
Lane City of Eugene Education 1,187,766 1,372,580 108,100 0 132,865 168,654 1,428,731 1,541,234 7.9
Lane City of Eugene Other 0 0 0 0 0 0 0 0 0.0
Lane City of Veneta County 55,398 55,792 0 0 4,547 0 59,945 55,792 -6.9
Lane City of Veneta City 243,696 245,369 0 0 0 0 243,696 245,369 0.7
Lane City of Veneta Education 245,385 247,114 0 0 85,077 54,119 330,463 301,233 -8.8
Lane City of Veneta Other 102,330 102,967 0 0 0 0 102,330 102,967 0.6
Permanent/Gap Bonds Local Option Bonds Total Revenue

Section V: Detailed Tables – Urban Renewal
Oregon Department of Revenue, Research Section 49
Table 3.2 Urban Renewal Division of Tax Revenue for FYs 2014-15 and 2015-16, by Agency, County, Type of Levy, and District Type
County Agency District Type FY 2014-15 FY 2015-16 FY 2014-15 FY 2015-16 FY 2014-15 FY 2015-16 FY 2014-15 FY 2015-16 % CH
Lane City of Coburg County 25,576 23,627 10,985 0 2,092 0 38,652 23,627 -38.9
Lane City of Coburg City 65,775 69,309 0 0 0 0 65,775 69,309 5.4
Lane City of Coburg Education 111,805 103,305 29,989 0 36,461 32,514 178,256 135,819 -23.8
Lane City of Coburg Other 26,547 24,530 0 0 3,903 2,854 30,450 27,384 -10.1
Lane City of Springfield (SED) County 115,852 116,479 0 0 9,010 0 124,863 116,479 -6.7
Lane City of Springfield (SED) City 389,232 388,848 0 0 18,717 0 407,949 388,848 -4.7
Lane City of Springfield (SED) Education 503,722 507,243 0 0 12,533 1,125 516,255 508,368 -1.5
Lane City of Springfield (SED) Other 218,109 222,108 0 0 0 0 218,109 222,108 1.8
Lane City of Florence County 33,892 36,033 0 0 2,767 0 36,659 36,033 -1.7
Lane City of Florence City 75,912 80,699 0 0 7,868 4,845 83,780 85,545 2.1
Lane City of Florence Education 125,626 133,471 0 0 23,517 25,108 149,143 158,579 6.3
Lane City of Florence Other 56,201 59,775 0 0 0 0 56,201 59,775 6.4
Lincoln City of Waldport County 10,906 12,010 0 0 0 0 10,906 12,010 10.1
Lincoln City of Waldport City 8,355 9,322 0 0 1,496 1,678 9,851 11,000 11.7
Lincoln City of Waldport Education 20,812 22,962 0 0 0 0 20,812 22,962 10.3
Lincoln City of Waldport Other 8,981 9,950 0 0 0 0 8,981 9,950 10.8
Lincoln City of Lincoln City County 120,382 125,553 0 0 0 0 120,382 125,553 4.3
Lincoln City of Lincoln City City 174,921 182,623 0 0 0 0 174,921 182,623 4.4
Lincoln City of Lincoln City Education 229,876 239,853 0 0 0 0 229,876 239,853 4.3
Lincoln City of Lincoln City Other 67,087 69,740 0 0 5,420 5,282 72,507 75,022 3.5
Lincoln City of Newport County 385,978 391,124 0 0 0 0 385,978 391,124 1.3
Lincoln City of Newport City 682,224 688,566 0 0 0 0 682,224 688,566 0.9
Lincoln City of Newport Education 737,476 747,518 0 0 0 0 737,476 747,518 1.4
Lincoln City of Newport Other 112,524 113,984 0 0 0 0 112,524 113,984 1.3
Lincoln City of Yachats County 69,462 71,692 0 0 0 0 69,462 71,692 3.2
Lincoln City of Yachats City 4,211 4,347 0 0 5,023 4,165 9,235 8,512 -7.8
Lincoln City of Yachats Education 132,733 136,968 0 0 0 0 132,733 136,968 3.2
Lincoln City of Yachats Other 22,480 23,256 0 0 0 0 22,480 23,256 3.5
Lincoln City of Depoe Bay County 41,608 45,599 0 0 0 0 41,608 45,599 9.6
Lincoln City of Depoe Bay City 0 0 0 0 7,009 6,931 7,009 6,931 -1.1
Lincoln City of Depoe Bay Education 79,464 87,115 0 0 0 0 79,464 87,115 9.6
Lincoln City of Depoe Bay Other 22,639 24,996 0 0 0 0 22,639 24,996 10.4
Linn City of Lebanon County 246,418 265,068 3,654 3,746 0 0 250,072 268,814 7.5
Linn City of Lebanon City 976,946 1,051,086 0 0 27,076 25,343 1,004,022 1,076,429 7.2
Linn City of Lebanon Education 1,122,108 1,207,314 0 0 438,240 442,578 1,560,349 1,649,892 5.7
Linn City of Lebanon Other 493,829 534,815 0 0 4,048 4,161 497,878 538,976 8.3
Linn City of Harrisburg County 23,600 25,760 0 0 0 0 23,600 25,760 9.2
Linn City of Harrisburg City 58,984 64,367 0 0 5,761 7,214 64,744 71,580 10.6
Linn City of Harrisburg Education 103,378 112,899 0 0 23,600 23,912 126,978 136,811 7.7
Linn City of Harrisburg Other 21,893 24,278 0 0 0 0 21,893 24,278 10.9
Permanent/Gap Bonds Local Option Bonds Total Revenue

Section V: Detailed Tables – Urban Renewal
50 Oregon Department of Revenue, Research Section
Table 3.2 Urban Renewal Division of Tax Revenue for FYs 2014-15 and 2015-16, by Agency, County, Type of Levy, and District Type
County Agency District Type FY 2014-15 FY 2015-16 FY 2014-15 FY 2015-16 FY 2014-15 FY 2015-16 FY 2014-15 FY 2015-16 % CH
Linn City of Albany County 182,296 206,290 27,204 30,768 0 0 209,500 237,058 13.2
Linn City of Albany City 922,068 1,042,572 157,984 178,569 53,136 47,307 1,133,189 1,268,449 11.9
Linn City of Albany Education 776,899 878,090 0 0 274,363 306,767 1,051,262 1,184,857 12.7
Linn City of Albany Other 7,292 11,135 0 0 0 0 7,292 11,135 52.7
Marion City of Keizer County 280,692 N/A 0 N/A 0 N/A 280,692 N/A N/A
Marion City of Keizer City 193,204 N/A 0 N/A 0 N/A 193,204 N/A N/A
Marion City of Keizer Education 504,654 N/A 0 N/A 49,212 N/A 553,866 N/A N/A
Marion City of Keizer Other 207,955 N/A 0 N/A 9,668 N/A 217,623 N/A N/A
Marion City of Salem County 1,560,958 1,648,816 0 0 29,430 31,272 1,590,389 1,680,088 5.6
Marion City of Salem City 3,148,880 3,332,721 0 0 52,030 60,141 3,200,910 3,392,862 6.0
Marion City of Salem Education 2,929,841 3,104,543 0 0 370,700 418,703 3,300,541 3,523,246 6.7
Marion City of Salem Other 478,171 526,499 0 0 0 0 478,171 526,499 10.1
Marion City of Woodburn County 101,455 105,943 0 0 0 0 101,455 105,943 4.4
Marion City of Woodburn City 203,044 212,168 0 0 0 0 203,044 212,168 4.5
Marion City of Woodburn Education 182,646 190,696 0 0 66,429 0 249,075 190,696 -23.4
Marion City of Woodburn Other 57,162 61,446 0 0 0 0 57,162 61,446 7.5
Marion City of Silverton County 88,426 81,291 0 0 0 0 88,426 81,291 -8.1
Marion City of Silverton City 107,179 98,578 0 0 11,430 11,501 118,609 110,078 -7.2
Marion City of Silverton Education 159,743 146,866 0 0 0 0 159,743 146,866 -8.1
Marion City of Silverton Other 50,921 48,074 0 0 8,281 7,072 59,202 55,146 -6.9
Morrow Central Boardman County 13,057 16,532 0 0 0 0 13,057 16,532 26.6
Morrow Central Boardman City 13,327 16,861 0 0 3,006 4,236 16,333 21,097 29.2
Morrow Central Boardman Education 16,692 21,220 0 0 3,994 3,948 20,686 25,168 21.7
Morrow Central Boardman Other 8,604 10,962 0 0 0 0 8,604 10,962 27.4
Multnomah City of Portland (PDC) County 21,402,993 23,813,993 199,210 240,077 450,540 485,885 22,052,744 24,539,955 11.3
Multnomah City of Portland (PDC) City 35,689,207 38,767,029 0 0 1,109,687 1,429,377 36,798,893 40,196,406 9.2
Multnomah City of Portland (PDC) Education 29,195,103 32,562,159 7,921,403 0 6,862,570 7,243,391 43,979,076 39,805,551 -9.5
Multnomah City of Portland (PDC) Other 6,960,493 7,756,928 0 0 1,165,227 947,334 8,125,719 8,704,262 7.1
Multnomah City of Gresham (GRC) County 980,240 1,087,586 0 0 21,683 23,173 1,001,923 1,110,759 10.9
Multnomah City of Gresham (GRC) City 814,997 904,519 0 0 0 0 814,997 904,519 11.0
Multnomah City of Gresham (GRC) Education 1,221,140 1,355,252 0 0 304,507 213,270 1,525,646 1,568,523 2.8
Multnomah City of Gresham (GRC) Other 325,999 360,726 0 0 19,440 3,090 345,439 363,816 5.3
Multnomah City of Troutdale County 45,623 36,032 0 0 902 660 46,526 36,692 -21.1
Multnomah City of Troutdale City 39,566 31,149 0 0 8,506 6,071 48,072 37,220 -22.6
Multnomah City of Troutdale Education 56,780 44,697 0 0 14,195 6,945 70,975 51,642 -27.2
Multnomah City of Troutdale Other 14,950 11,747 0 0 902 0 15,852 11,747 -25.9
Multnomah City of Wood Village County 16,927 27,782 0 0 361 587 17,288 28,369 64.1
Multnomah City of Wood Village City 12,187 19,989 0 0 0 0 12,187 19,989 64.0
Multnomah City of Wood Village Education 21,076 34,587 0 0 5,256 5,444 26,332 40,031 52.0
Multnomah City of Wood Village Other 5,591 9,207 0 0 335 80 5,926 9,287 56.7
Permanent/Gap Bonds Local Option Total RevenueBonds
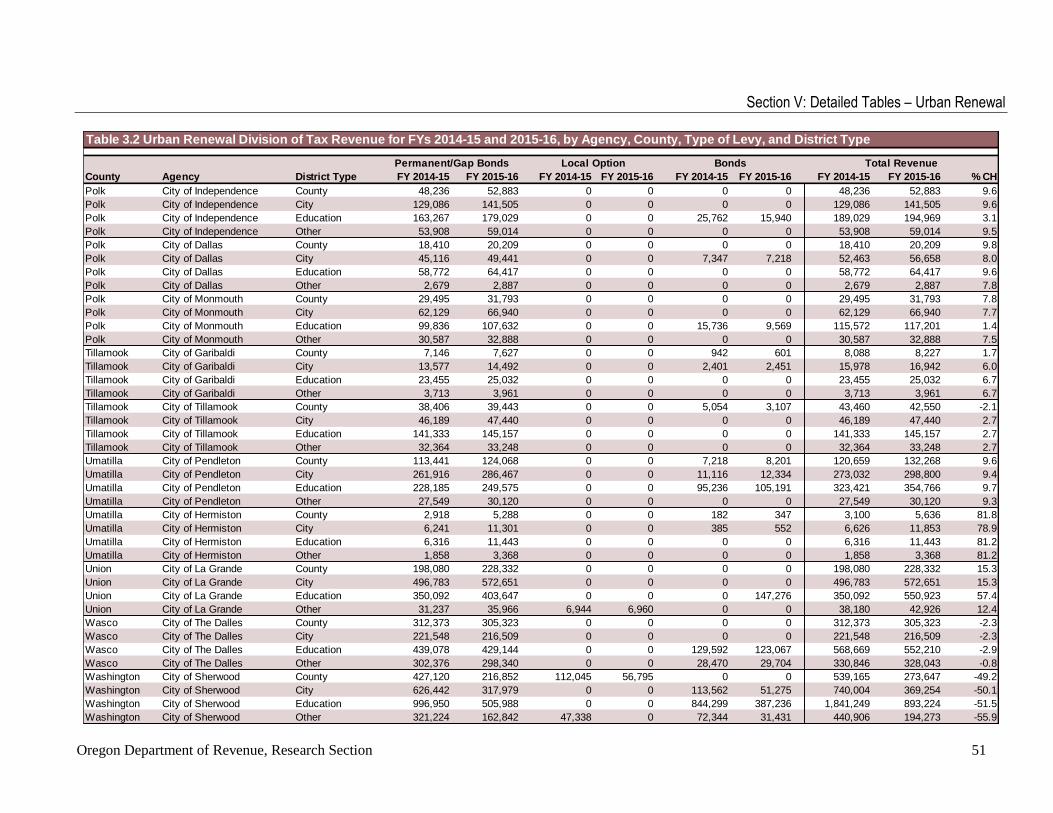
Section V: Detailed Tables – Urban Renewal
Oregon Department of Revenue, Research Section 51
Table 3.2 Urban Renewal Division of Tax Revenue for FYs 2014-15 and 2015-16, by Agency, County, Type of Levy, and District Type
County Agency District Type FY 2014-15 FY 2015-16 FY 2014-15 FY 2015-16 FY 2014-15 FY 2015-16 FY 2014-15 FY 2015-16 % CH
Polk City of Independence County 48,236 52,883 0 0 0 0 48,236 52,883 9.6
Polk City of Independence City 129,086 141,505 0 0 0 0 129,086 141,505 9.6
Polk City of Independence Education 163,267 179,029 0 0 25,762 15,940 189,029 194,969 3.1
Polk City of Independence Other 53,908 59,014 0 0 0 0 53,908 59,014 9.5
Polk City of Dallas County 18,410 20,209 0 0 0 0 18,410 20,209 9.8
Polk City of Dallas City 45,116 49,441 0 0 7,347 7,218 52,463 56,658 8.0
Polk City of Dallas Education 58,772 64,417 0 0 0 0 58,772 64,417 9.6
Polk City of Dallas Other 2,679 2,887 0 0 0 0 2,679 2,887 7.8
Polk City of Monmouth County 29,495 31,793 0 0 0 0 29,495 31,793 7.8
Polk City of Monmouth City 62,129 66,940 0 0 0 0 62,129 66,940 7.7
Polk City of Monmouth Education 99,836 107,632 0 0 15,736 9,569 115,572 117,201 1.4
Polk City of Monmouth Other 30,587 32,888 0 0 0 0 30,587 32,888 7.5
Tillamook City of Garibaldi County 7,146 7,627 0 0 942 601 8,088 8,227 1.7
Tillamook City of Garibaldi City 13,577 14,492 0 0 2,401 2,451 15,978 16,942 6.0
Tillamook City of Garibaldi Education 23,455 25,032 0 0 0 0 23,455 25,032 6.7
Tillamook City of Garibaldi Other 3,713 3,961 0 0 0 0 3,713 3,961 6.7
Tillamook City of Tillamook County 38,406 39,443 0 0 5,054 3,107 43,460 42,550 -2.1
Tillamook City of Tillamook City 46,189 47,440 0 0 0 0 46,189 47,440 2.7
Tillamook City of Tillamook Education 141,333 145,157 0 0 0 0 141,333 145,157 2.7
Tillamook City of Tillamook Other 32,364 33,248 0 0 0 0 32,364 33,248 2.7
Umatilla City of Pendleton County 113,441 124,068 0 0 7,218 8,201 120,659 132,268 9.6
Umatilla City of Pendleton City 261,916 286,467 0 0 11,116 12,334 273,032 298,800 9.4
Umatilla City of Pendleton Education 228,185 249,575 0 0 95,236 105,191 323,421 354,766 9.7
Umatilla City of Pendleton Other 27,549 30,120 0 0 0 0 27,549 30,120 9.3
Umatilla City of Hermiston County 2,918 5,288 0 0 182 347 3,100 5,636 81.8
Umatilla City of Hermiston City 6,241 11,301 0 0 385 552 6,626 11,853 78.9
Umatilla City of Hermiston Education 6,316 11,443 0 0 0 0 6,316 11,443 81.2
Umatilla City of Hermiston Other 1,858 3,368 0 0 0 0 1,858 3,368 81.2
Union City of La Grande County 198,080 228,332 0 0 0 0 198,080 228,332 15.3
Union City of La Grande City 496,783 572,651 0 0 0 0 496,783 572,651 15.3
Union City of La Grande Education 350,092 403,647 0 0 0 147,276 350,092 550,923 57.4
Union City of La Grande Other 31,237 35,966 6,944 6,960 0 0 38,180 42,926 12.4
Wasco City of The Dalles County 312,373 305,323 0 0 0 0 312,373 305,323 -2.3
Wasco City of The Dalles City 221,548 216,509 0 0 0 0 221,548 216,509 -2.3
Wasco City of The Dalles Education 439,078 429,144 0 0 129,592 123,067 568,669 552,210 -2.9
Wasco City of The Dalles Other 302,376 298,340 0 0 28,470 29,704 330,846 328,043 -0.8
Washington City of Sherwood County 427,120 216,852 112,045 56,795 0 0 539,165 273,647 -49.2
Washington City of Sherwood City 626,442 317,979 0 0 113,562 51,275 740,004 369,254 -50.1
Washington City of Sherwood Education 996,950 505,988 0 0 844,299 387,236 1,841,249 893,224 -51.5
Washington City of Sherwood Other 321,224 162,842 47,338 0 72,344 31,431 440,906 194,273 -55.9
Permanent/Gap Bonds Local Option Bonds Total Revenue

Section V: Detailed Tables – Urban Renewal
52 Oregon Department of Revenue, Research Section
Table 3.2 Urban Renewal Division of Tax Revenue for FYs 2014-15 and 2015-16, by Agency, County, Type of Levy, and District Type
County Agency District Type FY 2014-15 FY 2015-16 FY 2014-15 FY 2015-16 FY 2014-15 FY 2015-16 FY 2014-15 FY 2015-16 % CH
Washington City of North Plains County 26,827 31,721 0 0 0 0 26,827 31,721 18.2
Washington City of North Plains City 25,905 30,641 0 0 0 0 25,905 30,641 18.3
Washington City of North Plains Education 64,577 76,342 0 0 13,100 12,669 77,677 89,011 14.6
Washington City of North Plains Other 14,220 16,808 0 0 0 0 14,220 16,808 18.2
Washington City of Tigard County 65,094 70,891 0 0 0 0 65,094 70,891 8.9
Washington City of Tigard City 72,287 78,992 0 0 0 0 72,287 78,992 9.3
Washington City of Tigard Education 156,666 171,417 0 0 13,520 5,477 170,185 176,894 3.9
Washington City of Tigard Other 50,355 55,049 0 0 2,275 0 52,630 55,049 4.6
Washington City of Hillsboro County 132,088 170,634 0 0 0 0 132,088 170,634 29.2
Washington City of Hillsboro City 216,303 279,425 0 0 0 0 216,303 279,425 29.2
Washington City of Hillsboro Education 317,724 410,972 0 0 63,975 67,772 381,699 478,744 25.4
Washington City of Hillsboro Other 9,080 11,368 0 0 5,015 1,131 14,095 12,499 -11.3
Washington City of Beaverton County 112,870 228,711 0 0 0 0 112,870 228,711 102.6
Washington City of Beaverton City 210,980 424,878 0 0 9,551 19,888 220,530 444,766 101.7
Washington City of Beaverton Education 258,229 520,894 0 0 50,502 56,937 308,731 577,831 87.2
Washington City of Beaverton Other 149,498 302,307 0 0 9,490 903 158,989 303,210 90.7
Washington Forest Grove County N/A 4,605 N/A 0 N/A 0 N/A 4,605 N/A
Washington Forest Grove City N/A 8,202 N/A 0 N/A 576 N/A 8,778 N/A
Washington Forest Grove Education N/A 11,081 N/A 0 N/A 3,166 N/A 14,246 N/A
Washington Forest Grove Other N/A 287 N/A 0 N/A 0 N/A 287 N/A
Yamhill City of Carlton County 11,458 16,569 0 0 0 0 11,458 16,569 44.6
Yamhill City of Carlton City 21,604 31,573 0 0 0 0 21,604 31,573 46.1
Yamhill City of Carlton Education 25,336 36,674 0 0 0 0 25,336 36,674 44.7
Yamhill City of Carlton Other 5,362 7,768 0 0 0 0 5,362 7,768 44.9
Yamhill City of McMinnville County 16,573 23,769 0 0 0 0 16,573 23,769 43.4
Yamhill City of McMinnville City 32,494 46,174 0 0 0 0 32,494 46,174 42.1
Yamhill City of McMinnville Education 32,494 46,802 0 0 5,300 7,106 37,794 53,908 42.6
Yamhill City of McMinnville Other 691 1,225 0 0 0 0 691 1,225 77.2
District Totals** County 33,828,825 36,574,222 463,982 448,812 851,789 774,356 35,144,596 37,797,390 7.5
City 59,653,959 63,766,430 229,000 254,720 1,876,872 2,148,274 61,759,830 66,169,424 7.1
Education 60,634,468 64,878,905 8,367,317 0 12,887,112 12,571,106 81,888,898 77,450,011 -5.4
Other 16,816,349 17,723,564 115,932 61,237 1,527,448 1,133,379 18,459,728 18,918,179 2.5
Statewide Totals 170,933,601 182,943,121 9,176,230 764,769 17,143,221 16,627,116 197,253,052 200,335,005 1.6
Notes: N/A indicates the agency did not exist that year, or that the information was not available.
The category "Education" includes K-12, Community Colleges, and ESD's.
Revenue reported does not include revenue from urban renewal special levies.
Permanent/Gap Bonds Local Option Bonds Total Revenue

Section V
Detailed Tables - Tax Collection
Oregon Department of Revenue, Research Section 53
Detailed Tables: Tax Collection
Table 4.1 – Property Tax Certified, Collected, and Uncollected for all Years, by County
Table 4.2 – Property Tax Certified, Collected, and Uncollected, for FY 2014-15, by County

Section V: Detailed Tables - Tax Collection
54 Oregon Department of Revenue, Research Section
Table 4.1 Property Tax Certified, Property Tax Collection, and Total Cumulative Uncollected
For All Years, as of June 30, 2015 by County
County
Total Amount
Property Tax
Certified
Uncollected
Balance
7/1/2014
Taxes Added
to Rolls
Total for
Collection Total Credits
Net Total for
Collection
Taxes with
Deferred
Billing Credits
6/30/2015*
Total Taxes
Collected
FY 2014-15
Total Interest
Collected
FY 2014-15
Total Uncollected
All Years
6/30/2015**
% Uncollected
All Years
6/30/2015*
Baker 18,129,379 1,474,809 2,801 19,606,990 463,066 19,143,924 328,176 17,485,413 215,151 1,658,511 8.5
Benton 122,660,648 6,462,284 5,780 129,128,712 3,387,464 125,741,248 4,032,073 118,069,350 641,832 7,671,898 5.9
Clackamas 684,782,849 39,131,360 0 723,914,209 19,136,127 704,778,082 14,936,317 665,531,210 4,525,939 39,246,872 5.4
Clatsop 68,985,882 5,992,084 14,534 74,992,500 2,012,095 72,980,405 0 67,685,193 931,398 5,295,211 7.1
Columbia 64,770,613 5,074,712 43,188 69,888,512 1,905,120 67,983,393 182,603 63,454,444 833,102 4,528,948 6.5
Coos 63,214,463 6,388,857 4,677 69,607,997 1,731,414 67,876,583 0 61,846,571 941,646 6,030,011 8.7
Crook 23,634,090 1,906,796 59,582 25,600,468 669,835 24,930,632 0 23,266,777 346,109 1,663,855 6.5
Curry 24,072,492 2,378,693 2,914 26,454,099 740,395 25,713,704 520,979 23,428,219 301,088 2,285,486 8.6
Deschutes 298,302,143 10,186,726 85,031 308,573,900 8,487,417 300,086,482 1,386,060 291,874,005 1,774,278 8,212,477 2.7
Douglas 97,476,323 10,226,385 235,244 107,937,952 3,182,355 104,755,596 988,557 94,568,953 1,385,126 10,186,643 9.4
Gilliam 9,267,831 177,424 0 9,445,255 66,569 9,378,685 0 9,095,920 12,586 282,765 3.0
Grant 8,851,596 1,155,913 0 10,007,509 210,953 9,796,556 0 8,685,636 137,449 1,110,920 11.1
Harney 7,000,900 882,870 2,000 7,885,770 180,036 7,705,734 90,065 6,918,198 142,653 787,536 10.0
Hood River 30,380,360 1,548,734 1,675 31,930,770 899,395 31,031,375 1,332,688 29,413,181 177,487 1,618,193 5.1
Jackson 263,388,484 16,462,139 217,815 280,068,438 7,968,706 272,099,732 0 255,482,801 2,119,003 16,616,931 5.9
Jefferson 24,324,490 1,941,328 0 26,265,818 658,294 25,607,524 0 23,975,617 346,837 1,631,907 6.2
Josephine 61,820,316 5,668,991 321,855 67,811,161 2,053,022 65,758,139 1,240,767 59,981,630 689,881 5,776,510 8.5
Klamath 62,675,840 6,030,834 296,906 69,003,580 1,893,857 67,109,723 0 61,270,359 907,855 5,839,364 8.5
Lake 13,037,283 1,302,261 2,935 14,342,479 385,876 13,956,604 370,645 12,499,564 135,043 1,457,040 10.2
Lane 464,606,017 33,309,131 46,759 497,961,907 15,901,259 482,060,648 12,487,353 447,519,728 3,257,390 34,540,920 6.9
Lincoln 97,901,346 8,870,085 1,601 106,773,032 2,690,278 104,082,755 151,050 95,654,031 1,163,963 8,428,723 7.9
Linn 139,681,035 13,876,113 1,009,796 154,566,944 4,080,672 150,486,273 4,082,514 136,593,854 1,613,029 13,892,419 9
Malheur 24,168,823 1,760,097 912 25,929,831 665,155 25,264,677 0 23,623,063 287,701 1,641,614 6.3
Marion 351,252,413 20,762,296 32,369 372,047,078 10,637,432 361,409,646 0 342,686,280 3,058,363 18,723,366 5
Morrow 27,839,805 789,028 0 28,628,832 844,789 27,784,043 0 27,049,736 126,744 734,307 2.6
Multnomah 1,449,548,240 83,052,081 809,924 1,533,410,245 44,788,224 1,488,622,021 37,556,465 1,400,671,206 8,271,277 87,950,814 5.7
Polk 79,602,212 5,814,331 17,535 85,434,078 2,187,231 83,246,847 1,137,020 77,959,238 862,126 5,287,609 6.2
Sherman 6,884,254 369,079 408 7,253,742 275,461 6,978,281 0 6,606,170 47,234 372,111 5.1
Tillamook 49,908,418 3,932,729 3,177 53,844,324 1,293,227 52,551,097 277,237 49,004,907 554,886 3,546,190 6.6
Umatilla 79,222,151 5,267,727 56,835 84,546,713 2,848,206 81,698,508 0 77,276,531 839,106 4,421,977 5.2
Union 22,258,926 2,027,368 495 24,286,789 586,194 23,700,595 221,465 21,620,725 339,767 2,079,870 8.6
Wallowa 8,585,310 503,249 0 9,088,558 232,827 8,855,732 0 8,360,080 77,980 495,652 5.5
Wasco 34,925,988 3,116,696 0 38,042,684 915,701 37,126,983 0 34,154,290 489,229 2,972,693 7.8
Washington 915,946,763 39,446,586 4,739,380 960,132,729 32,388,939 927,743,790 18,964,999 889,500,950 3,252,011 38,242,840 4
Wheeler 2,566,238 326,693 0 2,892,931 65,019 2,827,912 0 2,541,043 52,651 286,869 9.9
Yamhill 112,957,576 10,172,095 110,593 123,240,263 3,327,485 119,912,778 2,699,338 108,982,320 1,190,372 10,930,458 8.9
Statewide Total 5,814,631,496 357,788,583 8,126,721 6,180,546,800 179,760,095 6,000,786,705 102,986,370 5,644,337,195 42,048,290 356,449,509 5.8
Note: Discounts for prompt payment of taxes are included in the Total Credits column.
Percent uncollected is calculated by dividing Total Uncollected by Total for Collection
*ORS 305.286 allows counties to defer payments for property taxes if the dollar amount is large and in dispute; taxes with deferred billing credits are also included in uncollected taxes.
** Total for all years refers to the total amount of tax not collected for taxes that were owed in any previous year that had not been paid as of 6/30/2015.

Section V: Detailed Tables – Urban Renewal
Oregon Department of Revenue, Research Section 55
Table 4.2 Property Tax Certified, Property Tax Collection, and Total Uncollected
FY 2014-15, by County
County
Certified Real
Property
FY 2014-15
Certified
Personal
Property
FY 2014-15
Certified Utility
Property
FY 2014-15
Certified
Manuf
Structures
FY 2014-15
Taxes Added
to Rolls
FY 2014-15
Total for
Collection
FY 2014-15
Total Credits
FY 2014-15
Net Total for
Collection
FY 2014-15
Taxes with
Deferred
Billing Credits*
FY 2014-15
Total Taxes
Collected
FY 2014-15
Total
Uncollected
FY 2014-15
Percent
Uncoll
FY 2014-15
Baker 14,610,135 357,180 3,104,786 57,279 2,801 18,132,180 456,556 17,675,625 200,022 16,825,974 849,651 4.7
Benton 116,720,808 2,607,118 2,769,458 563,264 5,780 122,666,428 3,339,096 119,327,333 1,683,900 115,689,988 3,637,345 3.0
Clackamas 650,459,242 12,729,620 19,439,205 2,154,783 0 684,782,849 18,535,447 666,247,402 3,192,939 650,276,224 15,971,178 2.3
Clatsop 64,987,579 1,374,404 2,368,556 255,344 14,113 68,999,996 1,917,667 67,082,328 0 64,545,899 2,536,429 3.7
Columbia 54,309,683 1,095,416 8,979,726 385,789 40,164 64,810,777 1,841,877 62,968,900 182,603 60,767,748 2,201,152 3.4
Coos 58,536,877 1,297,565 2,403,380 976,641 4,677 63,219,139 1,670,094 61,549,045 0 58,758,011 2,791,034 4.4
Crook 21,147,119 515,370 827,294 1,144,308 50,156 23,684,246 636,667 23,047,579 0 22,246,919 800,660 3.4
Curry 22,861,293 267,062 405,713 538,424 2,914 24,075,407 715,899 23,359,508 133,122 22,358,602 1,000,905 4.2
Deschutes 284,622,811 6,142,294 6,745,598 791,440 62,335 298,364,478 8,205,044 290,159,434 374,704 285,387,114 4,772,320 1.6
Douglas 87,145,700 3,391,196 5,481,163 1,458,263 230,328 97,706,650 3,024,032 94,682,618 230,226 90,455,042 4,227,576 4.3
Gilliam 3,755,877 212,554 5,099,820 199,581 0 9,267,831 264,299 9,003,532 0 8,839,003 164,529 1.8
Grant 8,145,299 123,699 555,563 27,035 0 8,851,596 207,463 8,644,133 0 8,260,083 384,050 4.3
Harney 6,032,692 100,517 798,581 69,110 1,990 7,002,889 172,884 6,830,005 25,582 6,491,957 338,048 4.8
Hood River 28,028,389 1,049,774 1,112,957 189,240 1,663 30,382,023 830,245 29,551,778 633,079 28,851,092 700,686 2.3
Jackson 245,959,066 6,757,681 8,551,851 2,119,887 217,475 263,605,959 7,465,891 256,140,068 0 248,405,873 7,734,195 2.9
Jefferson 18,465,021 370,163 5,367,623 121,683 0 24,324,490 638,046 23,686,444 0 22,883,207 803,238 3.3
Josephine 58,530,799 1,200,440 1,637,642 451,435 315,657 62,135,973 2,008,280 60,127,693 296,848 57,784,875 2,342,818 3.8
Klamath 51,601,207 1,263,203 9,192,551 618,879 289,136 62,964,976 1,768,048 61,196,928 0 58,561,359 2,635,569 4.2
Lake 6,373,213 136,517 5,407,057 1,120,496 2,935 13,040,218 359,417 12,680,801 81,196 12,063,045 617,756 4.7
Lane 438,361,254 11,087,162 11,494,073 3,663,528 46,759 464,652,776 14,078,709 450,574,067 2,668,220 437,874,952 12,699,115 2.7
Lincoln 91,994,639 1,687,269 3,148,511 1,070,927 1,601 97,902,947 2,568,490 95,334,457 151,050 91,767,672 3,566,785 3.6
Linn 127,697,473 3,993,705 6,362,026 1,627,831 23,271 139,704,306 3,885,291 135,819,015 887,903 130,569,990 5,249,025 3.8
Malheur 21,113,115 593,604 2,296,093 166,011 912 24,169,735 643,233 23,526,502 0 22,697,304 829,198 3.4
Marion 328,525,844 9,092,054 10,951,501 2,683,014 32,369 351,284,782 10,306,878 340,977,904 0 331,821,386 9,156,518 2.6
Morrow 16,264,624 643,407 10,590,700 341,074 0 27,839,805 784,556 27,055,249 0 26,730,409 324,841 1.2
Multnomah 1,346,544,623 44,953,460 56,871,959 1,178,197 808,294 1,450,356,533 41,853,037 1,408,503,496 8,306,696 1,374,391,656 34,111,841 2.4
Polk 75,924,304 940,284 2,217,537 520,086 7,431 79,609,642 2,158,512 77,451,130 234,750 75,193,384 2,257,746 2.8
Sherman 2,634,295 90,857 3,949,295 209,808 326 6,884,581 271,864 6,612,717 0 6,463,159 149,557 2.2
Tillamook 47,643,479 389,076 1,714,132 161,731 3,177 49,911,595 1,250,928 48,660,667 0 47,216,265 1,444,403 2.9
Umatilla 62,629,406 2,510,731 13,541,877 540,137 55,095 79,277,247 2,687,550 76,589,696 0 74,386,126 2,203,570 2.8
Union 19,719,725 461,808 1,947,178 130,214 495 22,259,422 577,354 21,682,068 0 20,746,053 936,015 4.2
Wallowa 7,860,198 123,209 581,496 20,407 0 8,585,310 224,820 8,360,490 0 8,096,399 264,091 3.1
Wasco 27,737,342 730,978 3,171,804 3,285,864 0 34,925,988 862,450 34,063,537 0 32,693,594 1,369,943 3.9
Washington 851,124,087 35,896,649 27,648,273 1,277,753 4,624,396 920,571,159 29,747,679 890,823,480 4,383,584 875,378,690 15,444,790 1.7
Wheeler 2,055,676 6,956 118,048 385,558 0 2,566,238 67,459 2,498,780 0 2,367,414 131,366 5.1
Yamhill 105,394,596 3,125,930 3,202,488 1,234,562 55,112 113,012,687 3,215,701 109,796,986 793,655 105,196,784 4,600,202 4.1
Statewide Total 5,375,517,487 157,318,911 250,055,514 31,739,583 6,901,362 5,821,532,857 169,241,460 5,652,291,397 24,460,080 5,503,043,253 149,248,144 2.6
*ORS 305.286 allows counties to defer payments for property taxes if the dollar amount is large and in dispute; taxes with deferred billing credits are also included in uncollected taxes.
Discounts for prompt payment of taxes are included in the Total Credits column.


Appendix: Glossary
Oregon Department of Revenue, Research Section 57
Ad Valorem Tax. Tax levied as a percentage of
a property’s value. English translation of the
Latin term ad valorem is “according to value”.
Additional taxes. Revenues for taxing districts,
including penalty upon reclassification, as a
result of various statutory provisions:
Farmland. Additional tax and penalty paid
when farmland changes use and becomes
ineligible for farm use assessment.
Forestland. Additional tax and penalty paid
when forestland becomes ineligible for
forestland assessment.
Small tract. Additional tax and penalty paid
when land becomes ineligible for Western
Oregon Small Tract preferential tax
treatment.
Open space. Additional tax and penalty paid
when open space land becomes ineligible for
preferential tax treatment.
Historic property. Additional tax and
penalty paid when property is no longer used
as a historic site.
Late filing fee. Penalty amount paid for
failure to file a personal property return on
time under ORS 308.302.
Clerical error. Additional tax paid as a
result of the correction of a clerical error
under ORS 311.206.
Other. Other additional taxes and penalties,
such as those resulting from a
reclassification of an enterprise zone (ORS
285.617) or riparian land (ORS 308.798).
Arm’s length transaction. Transaction between
an informed buyer and informed seller who are
not related or on close terms, and who are
presumed to have roughly equal bargaining
power not involving a confidential relationship.
Assessed value (AV). Value of property subject
to taxation. Under the provisions of Measure 50,
assessed value for the 1997–98 fiscal year was
set at 90 percent of the 1995–96 assessed value
for each property in the state. The assessed
value for each property is allowed to grow a
maximum of 3 percent per year (unless a
significant change to the property occurs), but
cannot exceed the real market value of the
property. Assessed value does not include the
exemptions allowed for property.
Assessment. The process of identifying and
assigning a value to taxable property.
Assessment roll. A listing of all taxable
property in a county as of January 1 of each
year.
Average tax rate. Average rate computed for an
area by dividing the taxes imposed in that area
by the net assessed value of taxable property.
Billing rate. Tax rate expressed in dollars per
$1,000 of assessed property value.
Board of Property Tax Appeals (BOPTA).
County board that hears taxpayer appeals of
property assessment. Property owners can file
appeals between October 25 and December 31,
after they receive their property tax bill. Refunds
are granted when appeals are successful.
Taxpayers may appeal the BOPTA decision to
the Magistrate Division of the Oregon Tax
Court.
Bond levy. Amount of levies needed to pay
principal and interest on district bonded debt.
Business, housing, and miscellaneous
exemptions. Exempt value of certain business,

Appendix: Glossary
58 Oregon Department of Revenue, Research Section
housing, and miscellaneous other properties that
are partially or totally exempt from property
taxation. The qualifying exemptions include:
Personal Property for Personal Use.
Tangible personal property held by the
owner for personal use. Examples of
personal property include: household goods,
furniture, appliances, personal effects,
clothing, etc.
Veterans’ exemptions. Exemption applies
to the assessed value of the home site and
personal property of a disabled veteran or
their surviving spouse.
Historic property. Improved property that
has been specially assessed due to its
historic designation.
Enterprise zones. Certain business
properties within designated enterprise zones
that qualify for exemption for a limited
number of years, under provisions included
in ORS Chapter 285C. To be eligible, a
business must meet several conditions
relating to type of business activity and
requirements for hiring and investment.
Commercial facilities under construction.
Certain commercial buildings in the process
of construction that qualify for exemption
from property taxation for not more than two
consecutive years, under ORS 307.330 and
307.340.
All other business, housing, and
miscellaneous exemptions. These include
alternative energy systems, farm labor
camps, fallout shelters, housing for low
income rental, multiple-unit housing in core
areas, nonprofit homes for the elderly,
pollution control facilities, port and airport
property leased, etc.
Centrally assessed property. Taxable property
assessed by the Department of Revenue,
including electric and communication utilities,
rail transportation, air transportation, water
transportation, gas pipelines, private railcars,
and others.
Changed property ratio (CPR). The ratio of
average maximum assessed value to average
real market value for unchanged properties.
(Averages are determined by property class by
county.) This ratio is used in calculating the
assessed values of new properties,
improvements and other additions to the tax roll.
See Oregon Administrative Rule 150-308.156
for more information regarding CPRs.
Code area. Geographic unit established by a
county assessor, and identified by a code
number representing a unique combination of
taxing districts. All properties in a code area pay
taxes to the same taxing districts.
Compression. Reduction in taxes required by
the Measure 5 property tax rate limits approved
in 1990. Compression is computed on a
property-by-property basis.
Compression loss. Amount of reduction in
taxes due to compression.
Consolidated tax rate. Sum of the billing rates
of all taxing districts that impose taxes in a
given code area. Billing rates are calculated
prior to any compression that may result from
Measure 5 property tax rate limits.
District. A local government entity that imposes
property taxes (e.g., county, city, K-12 school
district). A district may cross county lines. For

Appendix: Glossary
Oregon Department of Revenue, Research Section 59
example, the City of Portland District includes
taxing districts representing the portions of the
city that are located in Clackamas, Multnomah,
and Washington counties.
Deferral programs. More information related
to the Senior and Disabled Deferral programs
can be found at the Oregon Department of
Revenue website.
Deferred Billing Credits. ORS 305.286 allows
counties to defer payments for disputed property
taxes if the dollar amount is more than a million
dollars. The county temporarily credits the
account for a portion of the amount of disputed
tax in order to avoid paying penalty interest if
the tax dispute is eventually lost.
District tax rate. Computed by adding together
the permanent rate, the local option rate, the gap
bond rate, and the bond rate for the district. Tax
rate expressed in dollars and cents per $1,000 of
property value.
Division of tax. The process of, and revenue
from, apportioning tax to urban renewal
agencies based on the relationship between the
frozen base value and the growth of value
(“excess value” or “increment”) of properties in
a particular geographic area (urban renewal plan
area). The tax is split between urban renewal
agency and taxing district in the same
proportion as the ratio of excess value to frozen
value.
Elderly Rental Assistance (ERA). Program for
low-income people who rent their home and are
age 58 or older. More information is available at
the Oregon Department of Revenue website.
Excess value. See urban renewal excess value.
Exempt property. Properties that are not taxed
under the property tax system. See public
exemptions, social welfare exemptions, and
business, housing, and miscellaneous
exemptions.
Existing urban renewal plan area. Urban
renewal plan area that 1) existed in December
1996, 2) chose an option (see Urban renewal
option), and 3) established a maximum amount
of indebtedness by July 1998.
Farm use special assessment. Special
assessment at less than full assessed value for
land (ORS 308A.062–308A.068).
Fiscal Year. The term fiscal year as used in this
publication refers to July 1st through the
following June 30th. FY 2015-16 would
therefore be July 1, 2014 through June 30, 2015.
Fish and Wildlife. Total assessed value of state
Fish and Wildlife Commission property. While
not subject to property tax, the commission
makes equivalent payments to counties under
ORS 496.340.
Forestland special assessment. Special
assessment at less than full assessed value of
land used for growing timber.
Frozen base value. The assessed value of
property within an urban renewal plan area at
the time that the plan was created.
Full local option authority. Estimate of the
amount of tax that could be levied if a district
were to use the full amount of local option
levies passed by voters.
Full permanent rate authority. Estimate of the
amount of tax that could be levied if a district
were to use its entire permanent rate.

Appendix: Glossary
60 Oregon Department of Revenue, Research Section
Gap bonds. Principal and interest obligations of
districts that are paid for with operating
revenues rather than with the proceeds of a bond
levy.
Inside the Limit. Imposed taxes subject to the
constitutionally prescribed Measure 5 rate
limits.
Joint taxing district. A taxing district that
crosses county lines.
Levy based property tax system. Tax system
in which levies are determined by budget needs
of a taxing district (which in many cases must
be approved by voters), and tax rates are
calculated as levies divided by total assessed
value in a district. The alternative is rate based
tax system.
Local option levies. Property tax levies beyond
the revenues generated by permanent tax rates.
Local option levies must be approved by voters
in a general election or an election that has at
least 50 percent voter participation.
Locally assessed property. Taxable property
assessed by county assessors, including real
property, personal property, and manufactured
structures carried on a separate roll.
Manufactured structures value. Total assessed
value of all manufactured structures (ORS
801.333).
Market value. See real market value.
Measure 5. Constitutional tax rate limitations
passed by voters in November 1990, which can
be found at Article XI, Section 11b of the
Oregon Constitution. Measure 5 limited school
taxes to $15 per $1,000 of assessed value and
non-school taxes to $10 per $1,000 of assessed
value starting in 1991–92. The school limit fell
by $2.50 per $1,000 each year until it reached
$5 per $1,000 in 1995–96. The non-school limit
remains at $10 per $1,000. Levies to pay bond
principal and interest for capital construction
projects are outside the limitation. The Measure
5 rate limits still apply under the provisions of
Measure 50, passed in 1997, but now apply to
real market value.
Measure 5 value. Value to which Measure 5
rate limits are applied. For properties that are
not partially exempt or specially assessed,
Measure 5 value will be equal to real market
value. See ORS 310.165 for more information.
Measure 50. Measure 50 is a legislatively
referred measure drafted to correct technical
problems with Measure 47, a tax cutting
citizens’ initiative passed in 1996. For 1997-98,
Measure 50 reduced the assessed value of every
property to 90 percent of its 1995-96 assessed
value. Measure 50 then limited the annual
growth in assessed value of existing property to
3 percent. In addition, Measure 50 led to the
replacement of most levies with permanent tax
rates.
Mobile homes. See manufactured structures.
Net assessed value. Value used to calculate
district tax rates for dollar levies. It is total
assessed value plus nonprofit housing value and
state fish and wildlife value minus urban
renewal excess value used.
Net tax for collection. Total tax for collection
minus total credits. (See total credits for
description.)
Nonprofit housing value. Total assessed value
of property removed from the roll for nonprofit
housing purposes. This property consists of land
and improvements owned by nonprofit
corporations to provide permanent housing,
recreational and social facilities, and care to
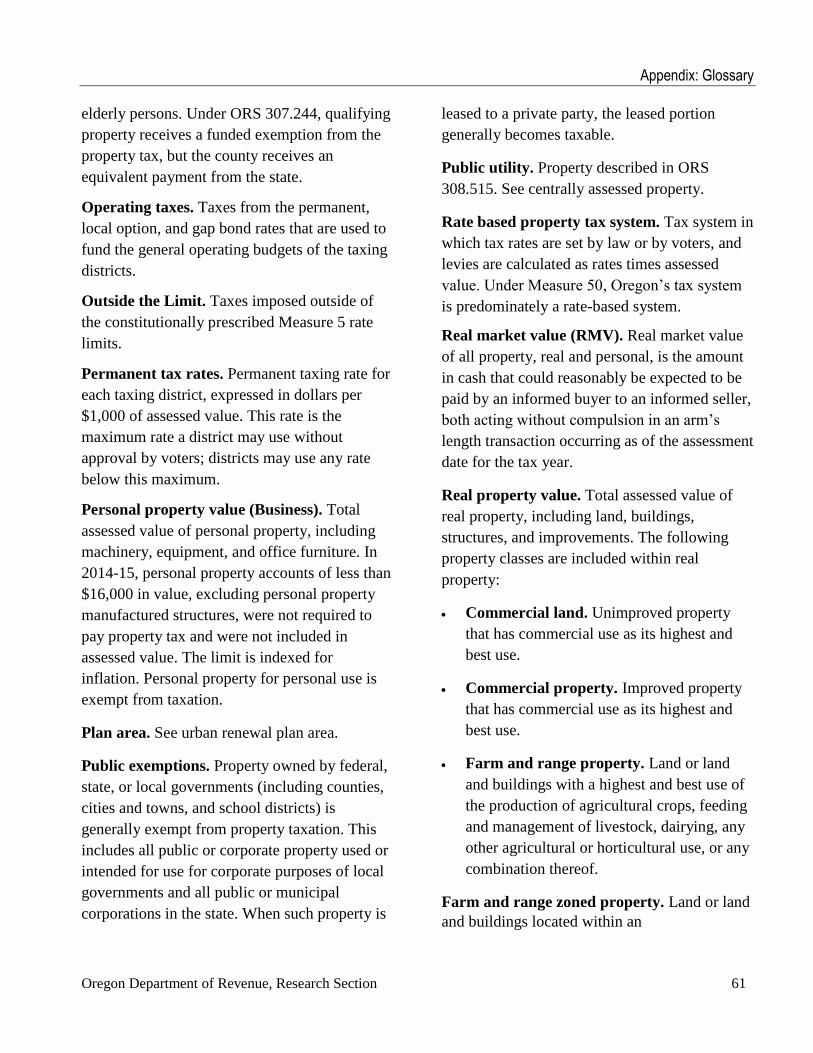
Appendix: Glossary
Oregon Department of Revenue, Research Section 61
elderly persons. Under ORS 307.244, qualifying
property receives a funded exemption from the
property tax, but the county receives an
equivalent payment from the state.
Operating taxes. Taxes from the permanent,
local option, and gap bond rates that are used to
fund the general operating budgets of the taxing
districts.
Outside the Limit. Taxes imposed outside of
the constitutionally prescribed Measure 5 rate
limits.
Permanent tax rates. Permanent taxing rate for
each taxing district, expressed in dollars per
$1,000 of assessed value. This rate is the
maximum rate a district may use without
approval by voters; districts may use any rate
below this maximum.
Personal property value (Business). Total
assessed value of personal property, including
machinery, equipment, and office furniture. In
2014-15, personal property accounts of less than
$16,000 in value, excluding personal property
manufactured structures, were not required to
pay property tax and were not included in
assessed value. The limit is indexed for
inflation. Personal property for personal use is
exempt from taxation.
Plan area. See urban renewal plan area.
Public exemptions. Property owned by federal,
state, or local governments (including counties,
cities and towns, and school districts) is
generally exempt from property taxation. This
includes all public or corporate property used or
intended for use for corporate purposes of local
governments and all public or municipal
corporations in the state. When such property is
leased to a private party, the leased portion
generally becomes taxable.
Public utility. Property described in ORS
308.515. See centrally assessed property.
Rate based property tax system. Tax system in
which tax rates are set by law or by voters, and
levies are calculated as rates times assessed
value. Under Measure 50, Oregon’s tax system
is predominately a rate-based system.
Real market value (RMV). Real market value
of all property, real and personal, is the amount
in cash that could reasonably be expected to be
paid by an informed buyer to an informed seller,
both acting without compulsion in an arm’s
length transaction occurring as of the assessment
date for the tax year.
Real property value. Total assessed value of
real property, including land, buildings,
structures, and improvements. The following
property classes are included within real
property:
Commercial land. Unimproved property
that has commercial use as its highest and
best use.
Commercial property. Improved property
that has commercial use as its highest and
best use.
Farm and range property. Land or land
and buildings with a highest and best use of
the production of agricultural crops, feeding
and management of livestock, dairying, any
other agricultural or horticultural use, or any
combination thereof.
Farm and range zoned property. Land or land
and buildings located within an

Appendix: Glossary
62 Oregon Department of Revenue, Research Section
exclusive farm-use zone assessed as farm-
use land.
Farm and range unzoned property. Land
or land and buildings assessed as unzoned
farmland.
Forestland and forest property. Consists
of land with a highest and best use of
growing and harvesting trees of a marketable
species, and land that has been designated as
forestland.
Improvement. Includes any building,
wharf, bridge, ditch, flume, reservoir, well,
tunnel, fence, street, sidewalk, machinery,
aqueduct and all other structures and
superstructures (ORS 87.005).
Industrial land. Unimproved property that
has industrial use as its highest and best use.
Industrial property. Improved property
that is a single plant or a complex of
properties engaged in manufacturing or
processing a product. The Department of
Revenue or County may be responsible for
appraisal of industrial property.
Multiple housing land. Unimproved
property that has multiple housing use (five
living units or more) as its highest and best
use.
Multiple housing property. Improved
property that has multiple housing use (five
living units or more) as its highest and best
use.
Recreation land. Unimproved property that
has recreational use as its highest and best
use.
Recreational property. Improved property
that provides recreational opportunities as its
highest and best use.
Residential land. Unimproved property that
has residential use as its highest and best
use.
Residential property. Improved property
that has residential use as its highest and best
use.
Tract land. Unimproved acreage with a
highest and best use other than farm, range,
or timber production.
Tract property. Improved acreage with a
highest and best use other than farm, range,
or timber production.
Roll. See Assessment roll.
Social welfare exemptions. Assessed value of
properties owned by private organizations and
used for educational, religious, or
developmental purposes is exempt from
property taxes. The qualifying organizations
include:
Fraternal organizations (ORS 307.136).
Literary and charitable organizations
(ORS 307.130).
Religious organizations (ORS 307.140).
Burial grounds (ORS 307.150).
All other social welfare. Includes private
schools and day care facilities, public
libraries privately owned, senior centers
privately owned, etc.
Special levy. See urban renewal special levy.
Specially assessed property. Property that is
assessed at less than its full value. See farm use
special assessment and forestland special
assessment.
Appendix: Glossary
Oregon Department of Revenue, Research Section 63
Supervisory orders. Orders to the counties
from the Department of Revenue to correct the
values of centrally assessed utility accounts on
the tax rolls. These orders are related to
corrections in valuations, not appeals.
Taxable value. See assessed value.
Taxes added to rolls. Additional taxes
generated when a final order is entered in an
appeal, other omitted property is included, or
error corrections are made.
Tax extended. Amount of tax before the
Measure 5 rate limits are applied. If, for an
individual property, taxes exceed Measure 5
limits, then the taxes for that property are
reduced to the limits.
Tax imposed. Taxes to be paid by taxpayers
after the Measure 5 rate limits have been
applied. For individual properties, the tax
imposed always will be less than or equal to the
tax extended.
Tax increment financing. A financial tool
designed to tax the increases in property value
that occur over time in a specific geographic
area. Given the frozen base value of the property
at the time such a plan area is established, any
growth in value (“excess value”) is taxed to
raise revenue.
Tax increment revenue. Revenue raised from
taxing the growth in value (“excess value” or
“increment”) of properties in a given geographic
area.
Taxing district. The portion of a district that
exists within a county.
Tax limit category. Under the 1990 Measure 5
constitutional property tax limitation, taxes are
divided into three categories: 1) inside the
general government limits, 2) inside the
education limit, and 3) outside the limit. All
taxes, other than bond levies for capital
construction, that are used for non-school
purposes fall inside the general government
limit of $10 per $1,000 of assessed value. All
taxes, other than bond levies, that are used for
education purposes fall inside the education
limit of $5 per $1,000 of assessed value. All
bond levies used for capital construction fall
outside the limit. Of the current types of levies,
permanent rate, local option, gap bond, and
pension levy taxes are subject to the limitations.
Total amount of property tax certified.
Amount of taxes charged by the tax collector as
certified by the assessor and authorized by the
county clerk. The total includes taxes on real
property, personal property, manufactured
structures, and public utilities. The amount
reported by counties generally includes taxes
relating to special assessments and in-lieu
payments for fish and wildlife property and
nonprofit housing property.
Total assessed value. Sum of assessed values of
all taxable properties on the roll.
Total credits. Includes discount allowed for
prompt payments, personal property taxes
canceled by order of county clerk, real property
foreclosures, and other corrections or
cancellations.
Total levy. Total levy submitted by the district,
including the local option levy and the levy for
bonded indebtedness.
Total taxes collected. Taxes collected by the
tax collector during the fiscal year ending June
30. Tax collections are reported separately from
interest and penalty collections.

Appendix: Glossary
64 Oregon Department of Revenue, Research Section
Unallocated utilities. Small, private railcar
companies that pay property taxes to the state.
These taxes are distributed by the state to county
governments.
Urban renewal. A state-sanctioned program
designed to help communities improve and
redevelop areas that are physically deteriorated,
unsafe, or poorly planned.
Urban renewal agency. Entity responsible for
administering urban renewal programs. Urban
renewal agencies can be organized by city
governments or county governments. They
oversee activities in urban renewal plan areas.
An urban renewal agency can administer
multiple plan areas.
Urban renewal excess value. Total assessed
value of property in urban renewal plan areas in
excess of the base assessed values when the plan
areas were established. This is also called the
“increment.”
Urban renewal option. Funding option that the
urban renewal plan uses. Only “existing” plan
areas could choose option 1, 2, or 3 (see existing
urban renewal plan). Plan areas that are not
“existing” can raise revenue as described under
“Other’” below.
Option 1 plan areas receive full division of
tax revenue from all levies except local
option and bond levies passed after October
6, 2001. A special levy on all taxable
property in the municipality may be used to
reach the plan area’s maximum revenue
authority.
Option 2 plan areas cannot receive division
of tax revenue but a special levy may be
used to raise revenue up to the plan area’s
maximum revenue authority from properties
in the municipality.
Option 3 plan areas had their revenue from
division of tax limited when the option was
selected. These plan areas receive division
of tax revenue up to their limit and may
impose a special levy on all taxable property
in the municipality up to their maximum
revenue authority.
Other plan areas that did not select an
option, but were adopted before October 6,
2001, raise division of tax revenue from all
levies, but cannot use a special levy. Other
plans that were adopted after October 6,
2001, must exclude local option and bond
levies passed after October 6, 2001, when
calculating division of tax revenue; they also
cannot use a special levy.
Urban renewal plan area. Geographic area in
which urban renewal activity takes place. It is
the “excess” value in urban renewal plan areas
that determines the amount of tax to raise for
urban renewal agencies.
Urban renewal shared value. The assessed
value of property that is both 1) within the
district that covers part of a plan area, and 2)
within the boundaries of the urban renewal
agency. It also includes portions of a district that
are within a plan area but outside the area of the
urban renewal agency. Property owners within
the shared value area may have part of their
taxes allocated for urban renewal rather than for
their tax districts.
Urban renewal special levy. Levy imposed by
an urban renewal agency if the amount of
revenue raised from excess value is below its
revenue-raising authority.