Embed Size (px)
Citation preview
TAX REVENUEFORECASTING DOCUMENTATIONFinancial Plan FiscalYears 2010–2014
TAX POLICY, REVENUE FORECASTING& ECONOMIC ANALYSIS TASK FORCE
Office of Managementand Budget
The City of New YorkMichael R. BloombergMayor
Offi ce of Management and BudgetMark PageBudget Director
Michael DardiaDeputy Director
John GrathwolAssistant Director
(212) 788-6001
Rodney ChunChief Economist(212) 788-5982
Fax(212) 788-5928
Webhttp://www. nyc.gov/html/omb

Photos by: Mae Mortel Scott Domansky
City of New YorkOffi ce of Management and Budget75 Park Place, New York, NY 10007-2146
Mark PageDirector
March 31, 2011
TO OUR READERS
The City Charter requires that the Offi ce of Management and Budget
(OMB) publish documentation of forecasting methodologies used for projecting
tax revenues for those taxes which account for five percent or more of total City tax
revenues. The following taxes meet this criterion: the real property tax, the personal
income tax, the general corporation tax and the sales and use taxes. In order to aid
the public to better understand the City’s tax base, non-Charter mandated taxes
have been included in this report as well.
OMB staff use the forecasting models detailed in this report, applying the
latest economic forecasts and tax collection data available, to project tax revenues for
the City’s budget and financial plans. This report also includes the latest updates to
the tax law.
I hope this report serves as a valuable aid to public understanding of our
forecasting methodologies.
Sincerely,
Mark Page
Office of Managementand Budget

TAX REVENUEFORECASTING DOCUMENTATION
FINANCIAL PLANFiscal Years 2010–2014
Table of ContentsIntroduction .............................................................................................................. 1
Economic Forecasting ............................................................................................... 5
Charter Mandated Taxes
Real Property Tax ................................................................................................ 15
Personal Income Tax ............................................................................................ 31
Sales Tax .............................................................................................................. 43
General Corporation Tax ..................................................................................... 51
Non-Charter Mandated Taxes
Banking Corporation Tax .................................................................................... 63
Unincorporated Business Tax ............................................................................... 71
Real Property Transfer Tax ................................................................................... 81
Mortgage Recording Tax ...................................................................................... 87
Commercial Rent Tax .......................................................................................... 93
Utility Tax ........................................................................................................... 99
Hotel Room Occupancy Tax ..............................................................................105
Cigarette Tax ......................................................................................................111
Other Taxes ........................................................................................................115
Appendices
I. Real Property Tax ........................................................................................... I-1
II. Personal Income Tax...................................................................................... II-1
III. Sales Tax ....................................................................................................... III-1
IV. General Corporation Tax .............................................................................. IV-1
V. History of Tax Collections .............................................................................. V-1

1
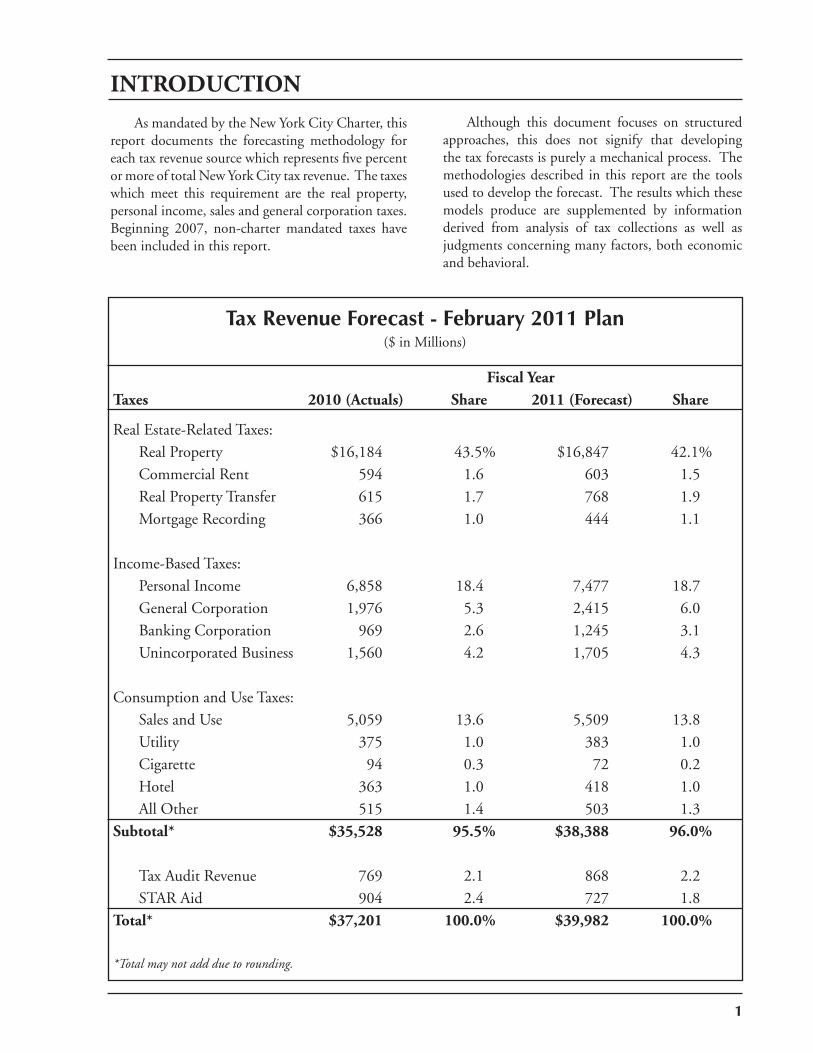
Tax Revenue Forecast - February 2011 Plan($ in Millions)
Fiscal YearTaxes 2010 (Actuals) Share 2011 (Forecast) Share
Real Estate-Related Taxes:Real Property $16,184 43.5% $16,847 42.1%Commercial Rent 594 1.6 603 1.5Real Property Transfer 615 1.7 768 1.9Mortgage Recording 366 1.0 444 1.1
Income-Based Taxes:Personal Income 6,858 18.4 7,477 18.7General Corporation 1,976 5.3 2,415 6.0Banking Corporation 969 2.6 1,245 3.1Unincorporated Business 1,560 4.2 1,705 4.3
Consumption and Use Taxes:Sales and Use 5,059 13.6 5,509 13.8Utility 375 1.0 383 1.0Cigarette 94 0.3 72 0.2Hotel 363 1.0 418 1.0All Other 515 1.4 503 1.3
Subtotal* $35,528 95.5% $38,388 96.0%
Tax Audit Revenue 769 2.1 868 2.2STAR Aid 904 2.4 727 1.8
Total* $37,201 100.0% $39,982 100.0%
*Total may not add due to rounding.
INTRODUCTION
As mandated by the New York City Charter, this report documents the forecasting methodology for each tax revenue source which represents fi ve percent or more of total New York City tax revenue. The taxes which meet this requirement are the real property, personal income, sales and general corporation taxes. Beginning 2007, non-charter mandated taxes have been included in this report.
Although this document focuses on structured approaches, this does not signify that developing the tax forecasts is purely a mechanical process. The methodologies described in this report are the tools used to develop the forecast. The results which these models produce are supplemented by information derived from analysis of tax collections as well as judgments concerning many factors, both economic and behavioral.

2
ECONOMIC FORECASTING

4
EF
EF
5
ECONOMIC FORECASTING
Table of Contents
Overview ......................................................................................................................................7
NYCEMOD .................................................................................................................................8

6
EF
7
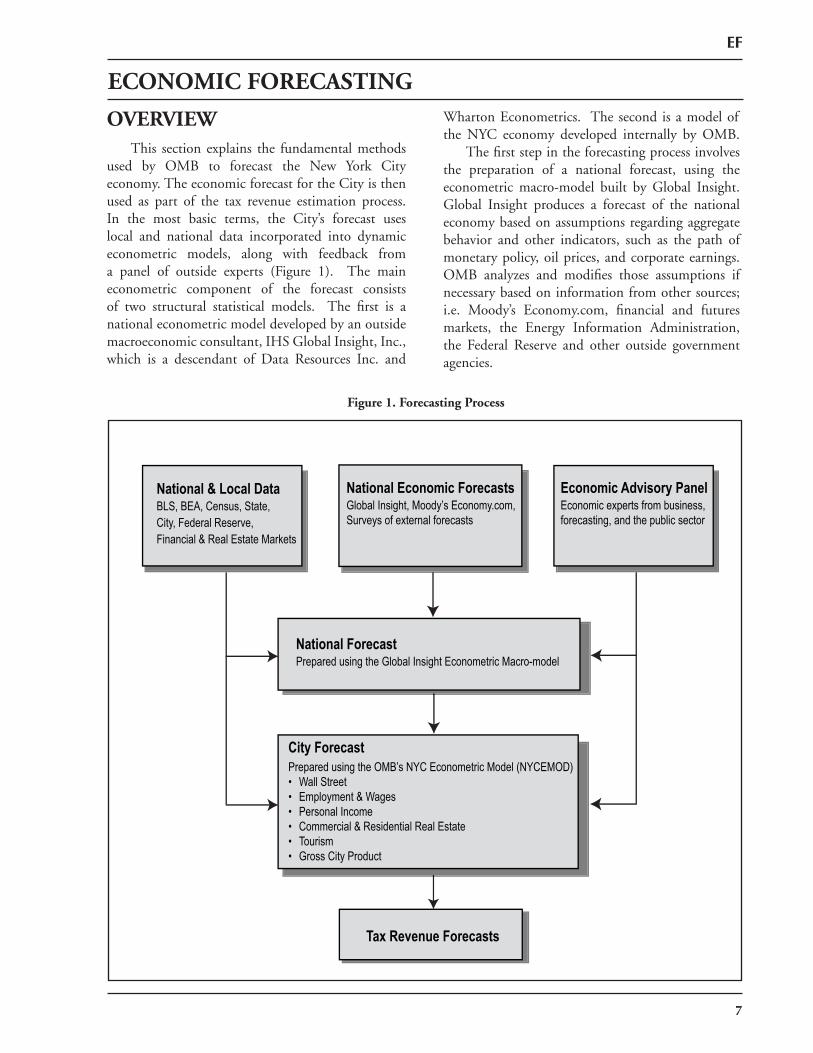
National Economic ForecastsGlobal Insight, Moody’s Economy.com, Surveys of external forecasts
Economic Advisory PanelEconomic experts from business, forecasting, and the public sector
Tax Revenue Forecasts
City ForecastPrepared using the OMB’s NYC Econometric Model (NYCEMOD)• Wall Street• Employment & Wages• Personal Income• Commercial & Residential Real Estate• Tourism• Gross City Product
National ForecastPrepared using the Global Insight Econometric Macro-model
National & Local DataBLS, BEA, Census, State,City, Federal Reserve, Financial & Real Estate Markets
OVERVIEW This section explains the fundamental methods used by OMB to forecast the New York City economy. The economic forecast for the City is then used as part of the tax revenue estimation process. In the most basic terms, the City’s forecast uses local and national data incorporated into dynamic econometric models, along with feedback from a panel of outside experts (Figure 1). The main econometric component of the forecast consists of two structural statistical models. The fi rst is a national econometric model developed by an outside macroeconomic consultant, IHS Global Insight, Inc., which is a descendant of Data Resources Inc. and
Wharton Econometrics. The second is a model of the NYC economy developed internally by OMB. The fi rst step in the forecasting process involves the preparation of a national forecast, using the econometric macro-model built by Global Insight. Global Insight produces a forecast of the national economy based on assumptions regarding aggregate behavior and other indicators, such as the path of monetary policy, oil prices, and corporate earnings. OMB analyzes and modifi es those assumptions if necessary based on information from other sources; i.e. Moody’s Economy.com, fi nancial and futures markets, the Energy Information Administration, the Federal Reserve and other outside government agencies.
Figure 1. Forecasting Process
EF
ECONOMIC FORECASTING
To augment the many sources of assumptions, OMB convenes its Panel of Economic Advisers twice a year – in December before the Financial Plan and in March before the Executive Budget. Members of the Panel include economists and forecasters representing the major sectors of the economy including banking, commercial and residential real estate, and tourism. The Panel members present their opinions and projections on both the U.S. and New York City economies, as well as any specifi c economic factors that might infl uence the forecast. The main U.S. forecast assumptions are fi nalized after this Panel meeting. A baseline U.S. macroeconomic forecast is then produced by OMB using the Global Insight macroeconometric simulation software. The major indicators of the U.S. forecast are then compared with the latest forecast released by other noteworthy organizations including the Federal Reserve Bank, the Federal OMB, the Congressional Budget Offi ce, the Blue Chip Consensus Forecast, and other outside forecasters.
NEW YORK CITY FORECAST
A forecast of the New York City economy is produced using OMB’s internal New York City Economic Model (NYCEMOD). Exogenous inputs for NYCEMOD consist of OMB’s forecast of the major U.S. indicators based on the Global Insight macro-model, other forecast providers (such as Moody’s Economy. com), and the Economic Advisory Panel. The equations in NYCEMOD produce forecasts for the major sectors of the NYC economy, including Wall Street profi ts, employment and wages, personal income, commercial & residential real estate, tourism, and Gross City Product. More details of each NYCEMOD sector are discussed below. Certain adjustments to the City model are part of the forecasting process. One of the most diffi cult sectors to project is Wall Street’s fi nancial performance. OMB utilizes a combination of econometric techniques, a probability analysis of the pattern of historical growth rates of Wall Street profi ts, and the latest analysis from industry experts in arriving at the fi nal forecast for NYSE member-fi rm profi ts. In addition, the latest estimates of New York City wage earnings are calibrated with the data on New York City personal income tax withholding, which are more current and provide a good proxy of wage earnings. The fi nal forecast of New York City economic indicators is produced after all these forecast assumptions are incorporated into NYCEMOD and the overall output is reviewed for consistency.
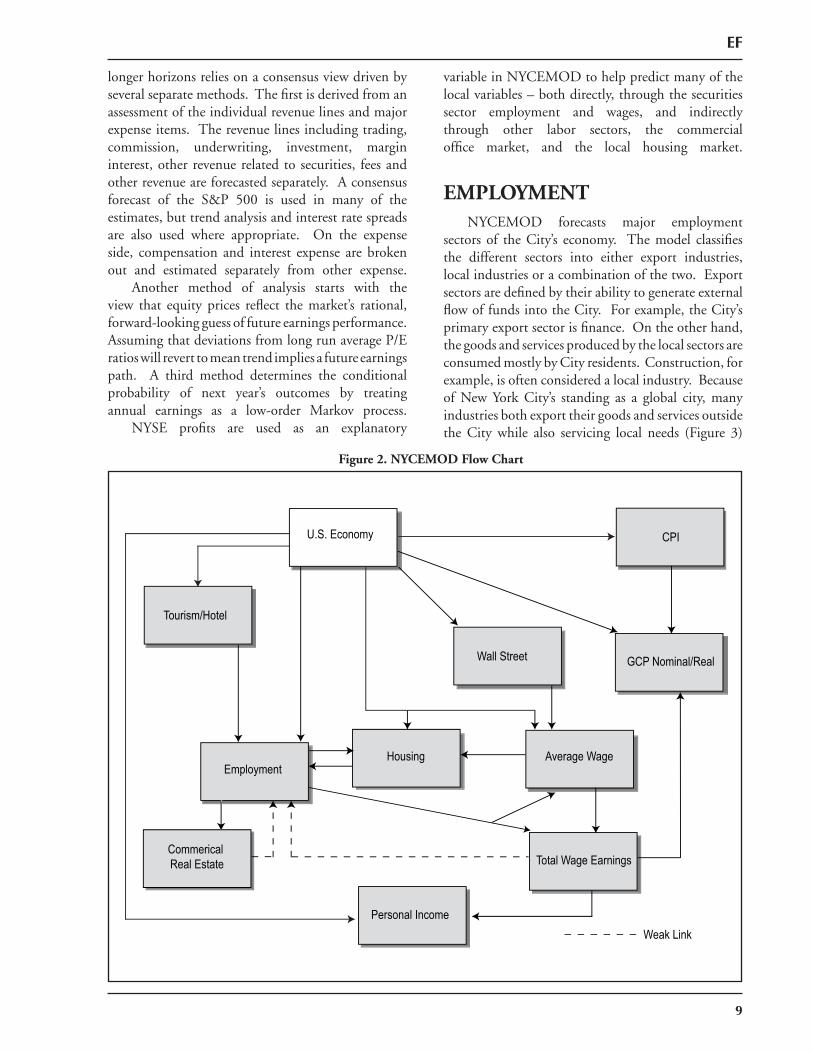
NYCEMOD New York City’s Economic Model (NYCEMOD) is a structural econometric model that forecasts a number of key variables. These variables serve as inputs for the tax revenue forecast. NYCEMOD consists of over 100 equations and identities describing Wall Street, labor markets, wages, personal income, commercial & residential real estate markets, tourism and Gross City Product. NYCEMOD’s base frequency is quarterly and most of the relationships are estimated over a historical span from 1990 to the latest available data. The start date is determined by the availability of industry-level data classifi ed using the North American Industry Classifi cation System. Stochastic equations are periodically re estimated and the model is solved to generate a four-year projection of the NYC economy. Figure 2 shows the logical relationships in the model. Each of the major blocks is described in more detail below, including general equation structure and data sources
WALL STREET
Due to the changing nature of fi nancial markets, it is inherently diffi cult to forecast the performance of the fi nancial sector – which provides a disproportionately large share of the City’s income. The securities sector alone, while only fi ve percent of the employment in the City, accounts for over 20 percent of the City’s annual wage earnings. While vitally important to forecast, it is impractical to rely on the output of the econometric model alone. Because of this sector’s complexity, it is necessary to augment the model’s results by using a number of quantitative techniques and judgments to better refl ect Wall Street behavior at different time horizons. As a proxy for Wall Street activity, OMB tracks and analyzes the performance of New York Stock Exchange (NYSE) member fi rms. Aggregate statistics of the fi rms’ performance are reported by the NYSE on a quarterly basis, usually 2-3 months after the close of a calendar quarter. A general proxy used to summarize the overall performance of these fi rms is referred to as NYSE member-fi rm profi ts. For the immediate forecast quarter, OMB monitors the advance earnings reports of the large NYC banks. These fi rms release their quarterly reports soon after their fi scal quarters conclude, providing an early picture of fi nancial activity for the industry as a whole. Forecasting earnings over
8
EF
9
EF
longer horizons relies on a consensus view driven by several separate methods. The fi rst is derived from an assessment of the individual revenue lines and major expense items. The revenue lines including trading, commission, underwriting, investment, margin interest, other revenue related to securities, fees and other revenue are forecasted separately. A consensus forecast of the S&P 500 is used in many of the estimates, but trend analysis and interest rate spreads are also used where appropriate. On the expense side, compensation and interest expense are broken out and estimated separately from other expense. Another method of analysis starts with the view that equity prices refl ect the market’s rational, forward-looking guess of future earnings performance. Assuming that deviations from long run average P/E ratios will revert to mean trend implies a future earnings path. A third method determines the conditional probability of next year’s outcomes by treating annual earnings as a low-order Markov process. NYSE profi ts are used as an explanatory
variable in NYCEMOD to help predict many of the local variables – both directly, through the securities sector employment and wages, and indirectly through other labor sectors, the commercial offi ce market, and the local housing market.
EMPLOYMENTNYCEMOD forecasts major employment
sectors of the City’s economy. The model classifi es the different sectors into either export industries, local industries or a combination of the two. Export sectors are defi ned by their ability to generate external fl ow of funds into the City. For example, the City’s primary export sector is fi nance. On the other hand, the goods and services produced by the local sectors are consumed mostly by City residents. Construction, for example, is often considered a local industry. Because of New York City’s standing as a global city, many industries both export their goods and services outside the City while also servicing local needs (Figure 3)
U.S. Economy
Tourism/Hotel
Wall Street
CPI
Employment
Commerical Real Estate
Housing
Personal Income
Total Wage Earnings
Average Wage
GCP Nominal/Real
Weak Link
Figure 2. NYCEMOD Flow Chart
10
EF
The source of the employment data is the Current Employment Statistics (CES) provided by the New York State Department of Labor. OMB applies the Census X12 statistical method to seasonally adjust the raw data. The core employment equations in NYCEMOD utilize the seasonally adjusted data.
The model forecasts the fi rst difference of the cyclical sectors, while the non-cyclical sectors are forecast in levels. First differencing accounts for stochastic trends in the employment data. An equation estimated for an employment sector has three types of regressors:
CES Sector Employment = F(Macro Variables, Sector Specifi c Variables, Dummy Variables)
CES aggregates are determined as identities that sum over the component sectors. For instance, private employment would be the summation of all sectors with the exception of government.
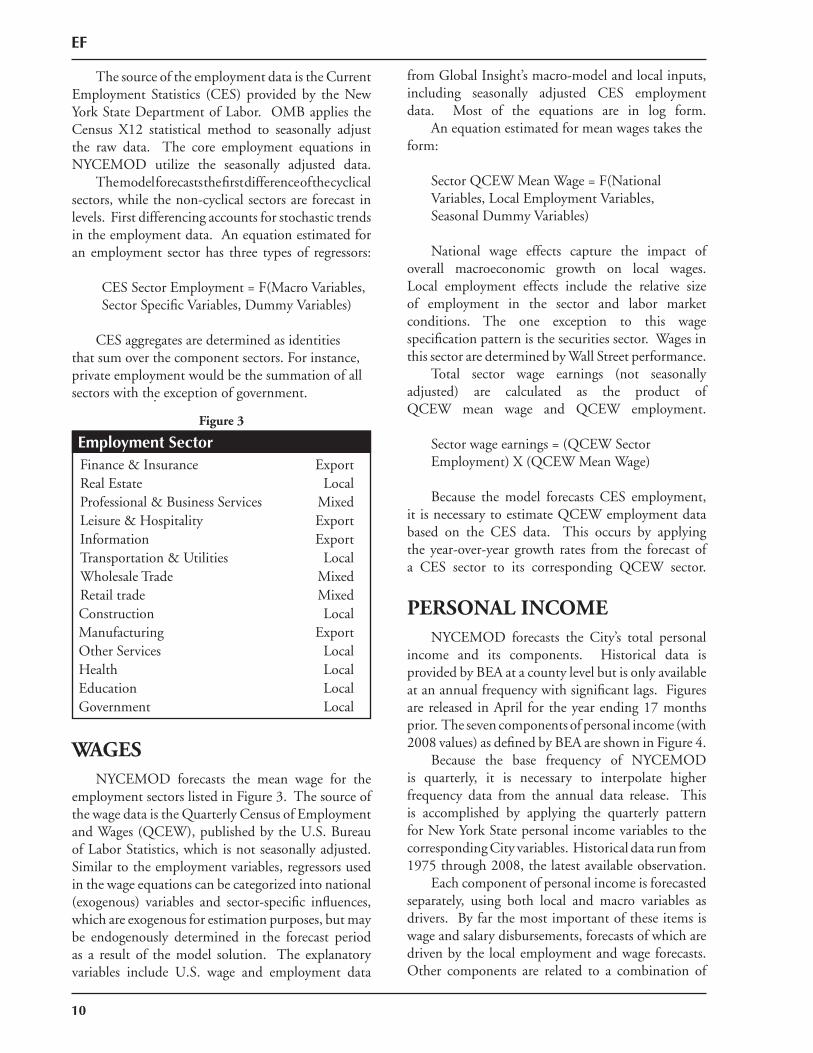
WAGESNYCEMOD forecasts the mean wage for the
employment sectors listed in Figure 3. The source of the wage data is the Quarterly Census of Employment and Wages (QCEW), published by the U.S. Bureau of Labor Statistics, which is not seasonally adjusted. Similar to the employment variables, regressors used in the wage equations can be categorized into national (exogenous) variables and sector-specifi c infl uences, which are exogenous for estimation purposes, but may be endogenously determined in the forecast period as a result of the model solution. The explanatory variables include U.S. wage and employment data
from Global Insight’s macro-model and local inputs, including seasonally adjusted CES employment data. Most of the equations are in log form.
An equation estimated for mean wages takes the form:
Sector QCEW Mean Wage = F(National Variables, Local Employment Variables,
Seasonal Dummy Variables)
National wage effects capture the impact of overall macroeconomic growth on local wages. Local employment effects include the relative size of employment in the sector and labor market conditions. The one exception to this wage specifi cation pattern is the securities sector. Wages in this sector are determined by Wall Street performance.
Total sector wage earnings (not seasonally adjusted) are calculated as the product of QCEW mean wage and QCEW employment.
Sector wage earnings = (QCEW Sector Employment) X (QCEW Mean Wage)
Because the model forecasts CES employment, it is necessary to estimate QCEW employment data based on the CES data. This occurs by applying the year-over-year growth rates from the forecast of a CES sector to its corresponding QCEW sector.
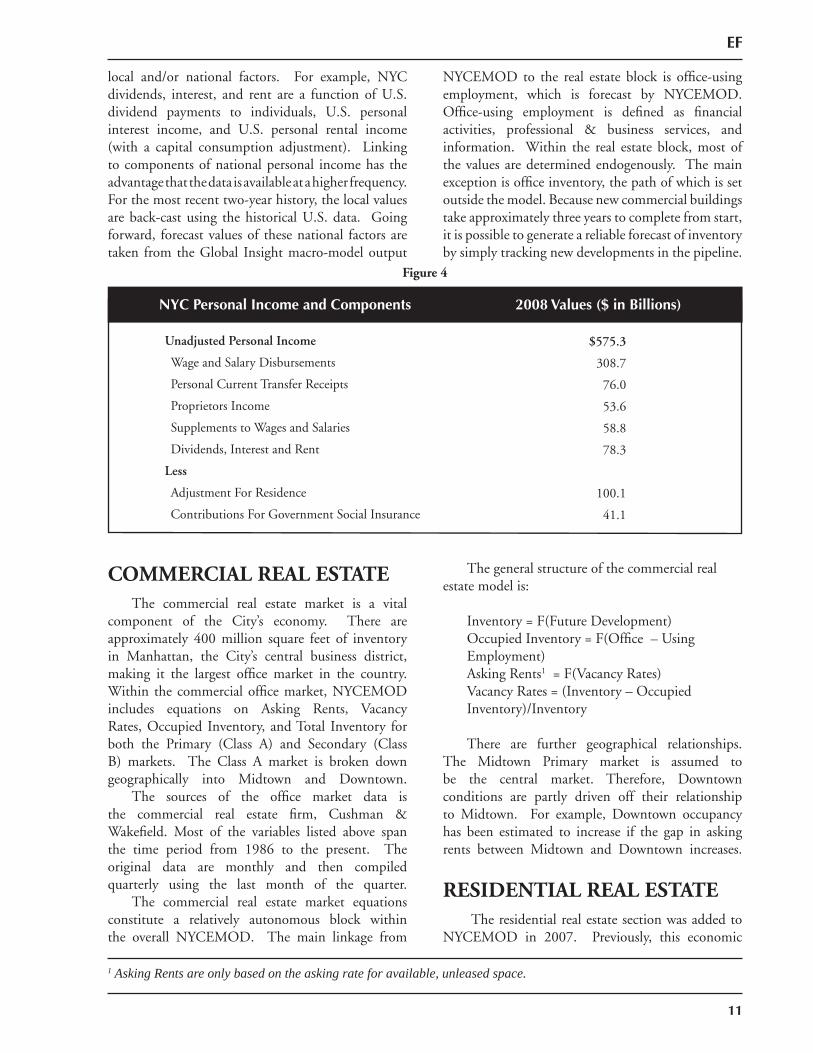
PERSONAL INCOMENYCEMOD forecasts the City’s total personal
income and its components. Historical data is provided by BEA at a county level but is only available at an annual frequency with signifi cant lags. Figures are released in April for the year ending 17 months prior. The seven components of personal income (with 2008 values) as defi ned by BEA are shown in Figure 4.
Because the base frequency of NYCEMOD is quarterly, it is necessary to interpolate higher frequency data from the annual data release. This is accomplished by applying the quarterly pattern for New York State personal income variables to the corresponding City variables. Historical data run from 1975 through 2008, the latest available observation.
Each component of personal income is forecasted separately, using both local and macro variables as drivers. By far the most important of these items is wage and salary disbursements, forecasts of which are driven by the local employment and wage forecasts. Other components are related to a combination of
Employment SectorFinance & Insurance ExportReal Estate LocalProfessional & Business Services MixedLeisure & Hospitality ExportInformation ExportTransportation & Utilities LocalWholesale Trade MixedRetail trade MixedConstruction LocalManufacturing ExportOther Services LocalHealth LocalEducation LocalGovernment Local
Figure 3
11
EF
local and/or national factors. For example, NYC dividends, interest, and rent are a function of U.S. dividend payments to individuals, U.S. personal interest income, and U.S. personal rental income (with a capital consumption adjustment). Linking to components of national personal income has the advantage that the data is available at a higher frequency. For the most recent two-year history, the local values are back-cast using the historical U.S. data. Going forward, forecast values of these national factors are taken from the Global Insight macro-model output
COMMERCIAL REAL ESTATEThe commercial real estate market is a vital
component of the City’s economy. There are approximately 400 million square feet of inventory in Manhattan, the City’s central business district, making it the largest offi ce market in the country. Within the commercial offi ce market, NYCEMOD includes equations on Asking Rents, Vacancy Rates, Occupied Inventory, and Total Inventory for both the Primary (Class A) and Secondary (Class B) markets. The Class A market is broken down geographically into Midtown and Downtown.
The sources of the offi ce market data is the commercial real estate fi rm, Cushman & Wakefi eld. Most of the variables listed above span the time period from 1986 to the present. The original data are monthly and then compiled quarterly using the last month of the quarter.
The commercial real estate market equations constitute a relatively autonomous block within the overall NYCEMOD. The main linkage from
NYCEMOD to the real estate block is offi ce-using employment, which is forecast by NYCEMOD. Offi ce-using employment is defi ned as fi nancial activities, professional & business services, and information. Within the real estate block, most of the values are determined endogenously. The main exception is offi ce inventory, the path of which is set outside the model. Because new commercial buildings take approximately three years to complete from start, it is possible to generate a reliable forecast of inventory by simply tracking new developments in the pipeline.
The general structure of the commercial real estate model is:
Inventory = F(Future Development) Occupied Inventory = F(Offi ce – Using
Employment) Asking Rents 1 = F(Vacancy Rates) Vacancy Rates = (Inventory – Occupied
Inventory)/Inventory
There are further geographical relationships. The Midtown Primary market is assumed to be the central market. Therefore, Downtown conditions are partly driven off their relationship to Midtown. For example, Downtown occupancy has been estimated to increase if the gap in asking rents between Midtown and Downtown increases.
RESIDENTIAL REAL ESTATE The residential real estate section was added to
NYCEMOD in 2007. Previously, this economic
1 Asking Rents are only based on the asking rate for available, unleased space.
Unadjusted Personal Income $575.3
Wage and Salary Disbursements 308.7
Personal Current Transfer Receipts 76.0
Proprietors Income 53.6
Supplements to Wages and Salaries 58.8
Dividends, Interest and Rent 78.3
Less
Adjustment For Residence 100.1
Contributions For Government Social Insurance 41.1
NYC Personal Income and Components 2008 Values ($ in Billions)
Figure 4
12
EF
sector was forecast separately from the main model. However, with an increase in the availability and frequency of relevant data, it became possible to incorporate a basic analysis into the model. Three components of the residential real estate markets are tracked within NYCEMOD: transaction volume (sales), transaction prices, and new construction.
Transaction volumes and prices are estimated for both Class 1 (1-3 family homes) and Class 2 (co-op and condo) properties. Historical data are compiled quarterly using transaction data provided by the NYC Department of Finance.2 Transaction volume measures the number of sales per quarter and transaction price represents the average price of those sales. The product of these two gives the total gross quarterly value of residential sales.
The basic framework of the residential market is given by the following equations:
Price of Single-Family Homes = F(S&P/Case- Shiller)
Price of Co-op = F(Single-Family Price) Price of Condo = F(Single-Family Price,
Securities Sector Wages)
Sales of Single-Family Homes = F(U.S. Single-Family Homes Sales, NY Affordability Index3) Sales of Co-ops = F(Sales of 1-3 Family homes)Sales of Condos = F(NYC Housing Permits,
NYSE Member-Firm Profi ts)
Permits = F(U.S. Housing Starts, NYC Employment, Interest Rates)
Completions = F(Permits)
TOURSIMA section of NYCEMOD is dedicated to
forecasting hotel activity. The two key indicators useful for measuring growth in the industry are hotel occupancy rates and the hotel room rates.
Historical data for hotel occupancy rates and hotel room rates are supplied by PKF Consulting,
which obtains industry data through monthly surveys of NYC hotels. Hotel occupancy rates come from a questionnaire directed at hotel managers who are asked to report average monthly vacancy rates and the average monthly room rate. The City average room rate is the mean pre-tax rate across all surveyed establishments. These two data series date back to 1980.4
The tourism industry is primarily an export sector. As a result, behavior is mainly driven by the performance of the U.S. and international economies. To capture these relationships occupancy rates are modeled as a function of real U.S. disposable income, a trade-weighted exchange rate, and local business activity. Room rates are then determined as a function of contemporaneous occupancy rates.
The inventory of hotel rooms is not forecast within NYCEMOD. Similar to projections of offi ce building inventory, there is suffi cient information outside of the model to estimate the number of new hotel rooms in the development pipeline. Price Waterhouse Coopers’ lodging reports are an important source of data. Industry contacts and media reports are also used to track additions to inventory.
GROSS CITY PRODUCTGross City Product (GCP) is estimated on
an annual basis using the wage earnings forecast generated by NYCEMOD. NYC real gross city product is determined as a share-down of U.S. GDP. The magnitude of the share proportion varies over time and is determined as the ratio of adjusted NYC wage earnings to U.S. wage earnings. OMB makes accrual adjustments to wages in order to attribute bonus sector payments to the year in which the bonus was earned. This is particularly important for the securities sector, where bonuses are often paid in the fi rst quarter of the calendar year based on performance in the previous year.
2 Administrative data provided by the NYC Department of Finance is processed before it is used for analytical purposes. This includes removing non-arms length transfers and consolidating multiple records of the same transaction. This process is frequently revised, as new information is provided, and due to corrections, amendments, and other administrative procedures, data may not stabilize for up to a year after the quarter closes.
3 NY affordability is defi ned as the ratio: (1/3 * NYC wage) / (Mortgage payments for an average priced home). Higher values correspond to more affordable housing.
4 The survey responses, which are averaged to create the series, are not weighted to refl ect the number of rooms in each hotel that responds. The survey is comprehesive, however, with completed responses covering 35,000-45,000 rooms across a variety of hotels.
CHARTER MANDATED TAXES
Real Property TaxPersonal Income Tax
Sales TaxGeneral Corporation Tax

RPT
15
REAL PROPERTY TAX
Table of Contents
Overview ..................................................................................................................................17
Summary ..................................................................................................................................17
Forecasting Methodology ..........................................................................................................18
Tax Detail .................................................................................................................................21
Legislative History ...................................................................See Appendix I: Real Property Tax

RPT
16
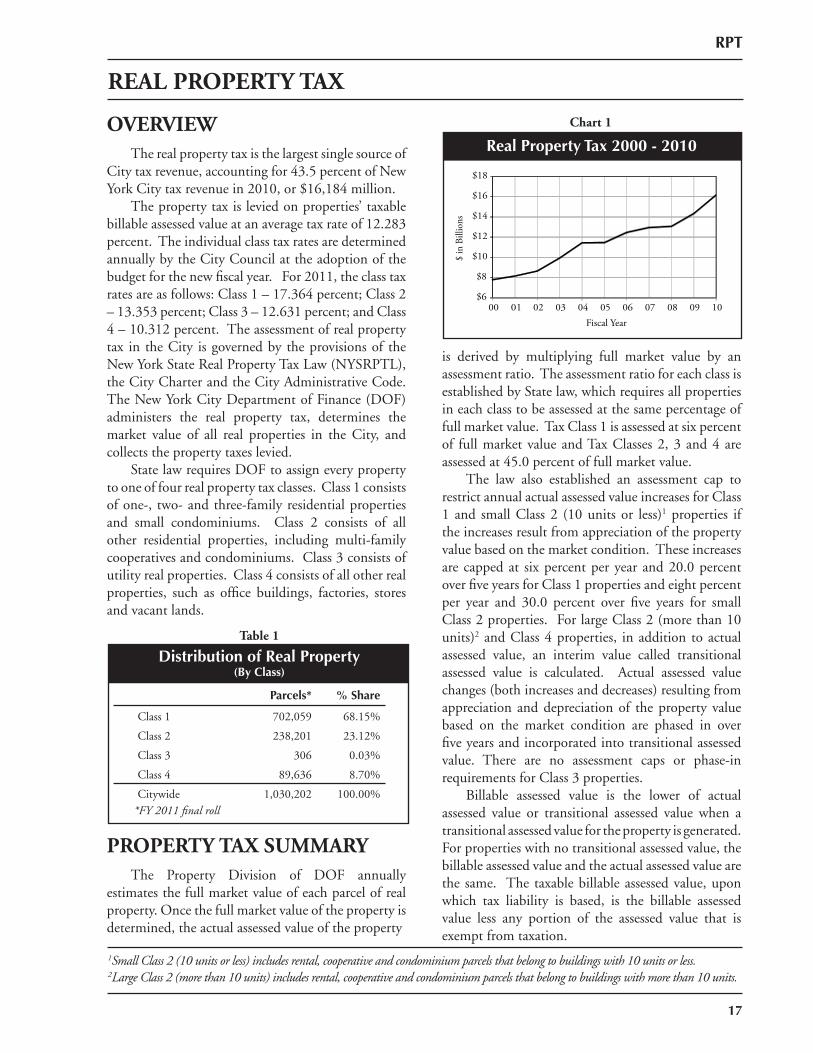
OVERVIEW The real property tax is the largest single source of City tax revenue, accounting for 43.5 percent of New York City tax revenue in 2010, or $16,184 million. The property tax is levied on properties’ taxable billable assessed value at an average tax rate of 12.283 percent. The individual class tax rates are determined annually by the City Council at the adoption of the budget for the new fi scal year. For 2011, the class tax rates are as follows: Class 1 – 17.364 percent; Class 2 – 13.353 percent; Class 3 – 12.631 percent; and Class 4 – 10.312 percent. The assessment of real property tax in the City is governed by the provisions of the New York State Real Property Tax Law (NYSRPTL), the City Charter and the City Administrative Code. The New York City Department of Finance (DOF) administers the real property tax, determines the market value of all real properties in the City, and collects the property taxes levied. State law requires DOF to assign every property to one of four real property tax classes. Class 1 consists of one-, two- and three-family residential properties and small condominiums. Class 2 consists of all other residential properties, including multi-family cooperatives and condominiums. Class 3 consists of utility real properties. Class 4 consists of all other real properties, such as offi ce buildings, factories, stores and vacant lands.
PROPERTY TAX SUMMARY The Property Division of DOF annually estimates the full market value of each parcel of real property. Once the full market value of the property isdetermined, the actual assessed value of the property
is derived by multiplying full market value by an assessment ratio. The assessment ratio for each class is established by State law, which requires all properties in each class to be assessed at the same percentage of full market value. Tax Class 1 is assessed at six percent of full market value and Tax Classes 2, 3 and 4 are assessed at 45.0 percent of full market value. The law also established an assessment cap to restrict annual actual assessed value increases for Class 1 and small Class 2 (10 units or less)1 properties if the increases result from appreciation of the property value based on the market condition. These increases are capped at six percent per year and 20.0 percent over fi ve years for Class 1 properties and eight percent per year and 30.0 percent over fi ve years for small Class 2 properties. For large Class 2 (more than 10 units)2 and Class 4 properties, in addition to actual assessed value, an interim value called transitional assessed value is calculated. Actual assessed value changes (both increases and decreases) resulting from appreciation and depreciation of the property value based on the market condition are phased in over fi ve years and incorporated into transitional assessed value. There are no assessment caps or phase-in requirements for Class 3 properties. Billable assessed value is the lower of actual assessed value or transitional assessed value when a transitional assessed value for the property is generated. For properties with no transitional assessed value, the billable assessed value and the actual assessed value are the same. The taxable billable assessed value, upon which tax liability is based, is the billable assessed value less any portion of the assessed value that is exempt from taxation.
Chart 1
Real Property Tax 2000 - 2010
$6
$8
$10
$12
$14
$16
$18
00 01 02 03 04 05 06 07 08 09 10
$ in
Bill
ions
Fiscal Year
Table 1
Distribution of Real Property(By Class)
Parcels* % Share
Class 1 702,059 68.15%
Class 2 238,201 23.12%
Class 3 306 0.03%
Class 4 89,636 8.70%
Citywide 1,030,202 100.00%*FY 2011 fi nal roll
RPT
17
REAL PROPERTY TAX
1Small Class 2 (10 units or less) includes rental, cooperative and condominium parcels that belong to buildings with 10 units or less.2Large Class 2 (more than 10 units) includes rental, cooperative and condominium parcels that belong to buildings with more than 10 units.
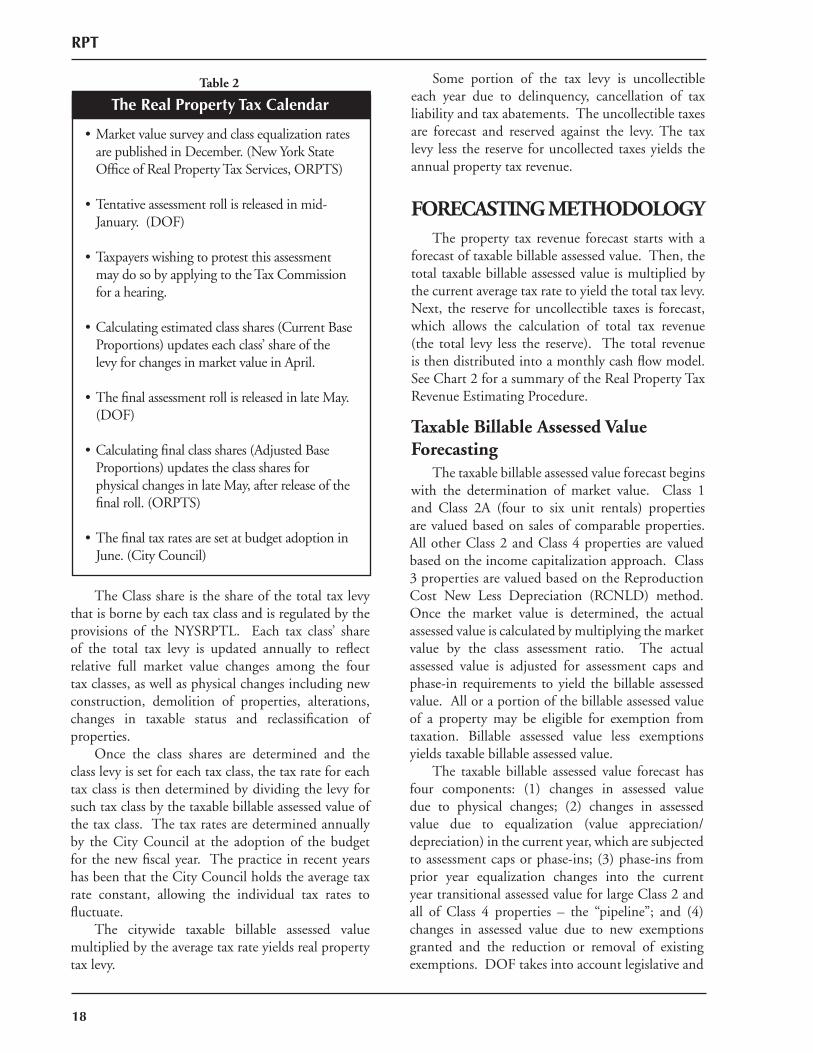
• Market value survey and class equalization rates are published in December. (New York State Offi ce of Real Property Tax Services, ORPTS)
• Tentative assessment roll is released in mid-January. (DOF)
• Taxpayers wishing to protest this assessment may do so by applying to the Tax Commission for a hearing.
• Calculating estimated class shares (Current Base Proportions) updates each class’ share of the levy for changes in market value in April.
• The fi nal assessment roll is released in late May. (DOF)
• Calculating fi nal class shares (Adjusted Base Proportions) updates the class shares for physical changes in late May, after release of the fi nal roll. (ORPTS)
• The fi nal tax rates are set at budget adoption in June. (City Council)
Table 2
The Real Property Tax Calendar
RPT
18
The Class share is the share of the total tax levy that is borne by each tax class and is regulated by the provisions of the NYSRPTL. Each tax class’ share of the total tax levy is updated annually to refl ect relative full market value changes among the four tax classes, as well as physical changes including new construction, demolition of properties, alterations, changes in taxable status and reclassifi cation of properties. Once the class shares are determined and the class levy is set for each tax class, the tax rate for each tax class is then determined by dividing the levy for such tax class by the taxable billable assessed value of the tax class. The tax rates are determined annually by the City Council at the adoption of the budget for the new fi scal year. The practice in recent years has been that the City Council holds the average tax rate constant, allowing the individual tax rates to fl uctuate. The citywide taxable billable assessed value multiplied by the average tax rate yields real property tax levy.
Some portion of the tax levy is uncollectible each year due to delinquency, cancellation of tax liability and tax abatements. The uncollectible taxes are forecast and reserved against the levy. The tax levy less the reserve for uncollected taxes yields the annual property tax revenue.
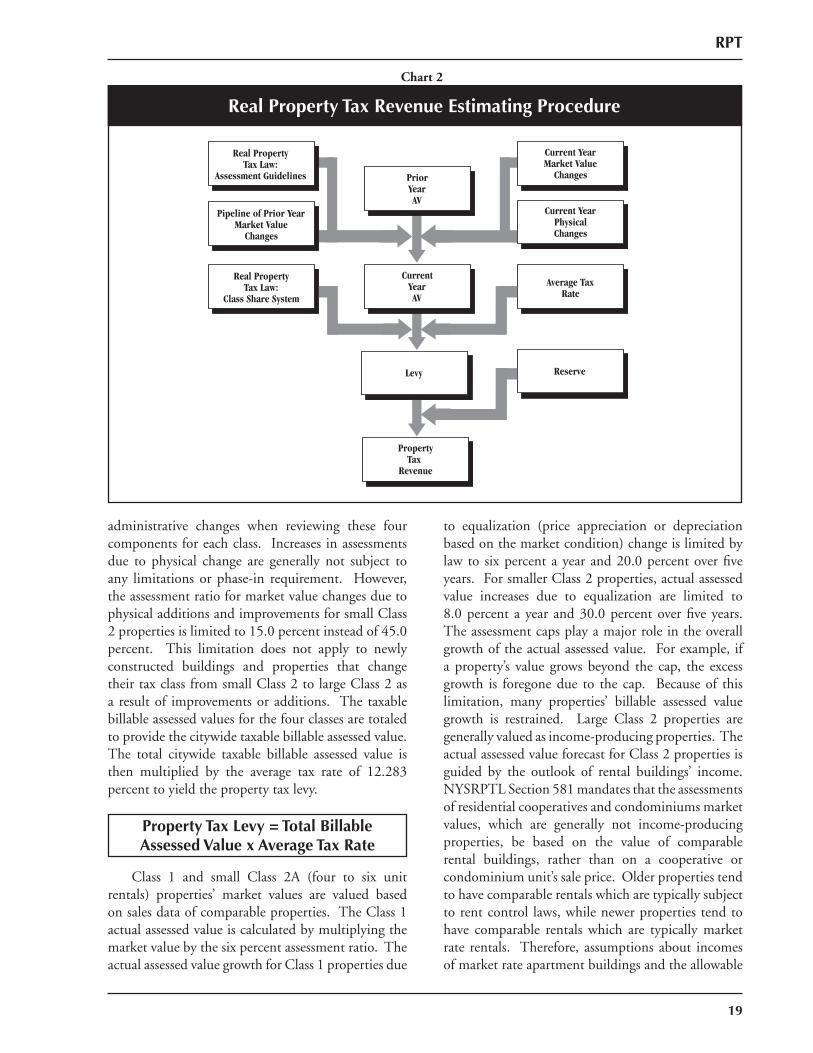
FORECASTING METHODOLOGY The property tax revenue forecast starts with a forecast of taxable billable assessed value. Then, the total taxable billable assessed value is multiplied by the current average tax rate to yield the total tax levy. Next, the reserve for uncollectible taxes is forecast, which allows the calculation of total tax revenue (the total levy less the reserve). The total revenue is then distributed into a monthly cash fl ow model. See Chart 2 for a summary of the Real Property Tax Revenue Estimating Procedure.
Taxable Billable Assessed Value Forecasting The taxable billable assessed value forecast begins with the determination of market value. Class 1 and Class 2A (four to six unit rentals) properties are valued based on sales of comparable properties. All other Class 2 and Class 4 properties are valued based on the income capitalization approach. Class 3 properties are valued based on the Reproduction Cost New Less Depreciation (RCNLD) method. Once the market value is determined, the actual assessed value is calculated by multiplying the market value by the class assessment ratio. The actual assessed value is adjusted for assessment caps and phase-in requirements to yield the billable assessed value. All or a portion of the billable assessed value of a property may be eligible for exemption from taxation. Billable assessed value less exemptions yields taxable billable assessed value. The taxable billable assessed value forecast has four components: (1) changes in assessed value due to physical changes; (2) changes in assessed value due to equalization (value appreciation/depreciation) in the current year, which are subjected to assessment caps or phase-ins; (3) phase-ins from prior year equalization changes into the current year transitional assessed value for large Class 2 and all of Class 4 properties – the “pipeline”; and (4) changes in assessed value due to new exemptions granted and the reduction or removal of existing exemptions. DOF takes into account legislative and
RPT
19
administrative changes when reviewing these four components for each class. Increases in assessments due to physical change are generally not subject to any limitations or phase-in requirement. However, the assessment ratio for market value changes due to physical additions and improvements for small Class 2 properties is limited to 15.0 percent instead of 45.0 percent. This limitation does not apply to newly constructed buildings and properties that change their tax class from small Class 2 to large Class 2 as a result of improvements or additions. The taxable billable assessed values for the four classes are totaled to provide the citywide taxable billable assessed value. The total citywide taxable billable assessed value is then multiplied by the average tax rate of 12.283 percent to yield the property tax levy.
Class 1 and small Class 2A (four to six unit rentals) properties’ market values are valued based on sales data of comparable properties. The Class 1 actual assessed value is calculated by multiplying the market value by the six percent assessment ratio. The actual assessed value growth for Class 1 properties due
to equalization (price appreciation or depreciation based on the market condition) change is limited by law to six percent a year and 20.0 percent over fi ve years. For smaller Class 2 properties, actual assessed value increases due to equalization are limited to 8.0 percent a year and 30.0 percent over fi ve years. The assessment caps play a major role in the overall growth of the actual assessed value. For example, if a property’s value grows beyond the cap, the excess growth is foregone due to the cap. Because of this limitation, many properties’ billable assessed value growth is restrained. Large Class 2 properties are generally valued as income-producing properties. The actual assessed value forecast for Class 2 properties is guided by the outlook of rental buildings’ income. NYSRPTL Section 581 mandates that the assessments of residential cooperatives and condominiums market values, which are generally not income-producing properties, be based on the value of comparable rental buildings, rather than on a cooperative or condominium unit’s sale price. Older properties tend to have comparable rentals which are typically subject to rent control laws, while newer properties tend to have comparable rentals which are typically market rate rentals. Therefore, assumptions about incomes of market rate apartment buildings and the allowable
Prior Year AV
Real PropertyTax Law:
Assessment Guidelines
Current Year AV
Current Year Physical Changes
Levy
Real Property Tax Law:
Class Share System
Average Tax Rate
Property Tax
Revenue
Reserve
Current Year Market Value
Changes
Pipeline of Prior Year Market Value
Changes
Real Property Tax Revenue Estimating Procedure
Chart 2
Property Tax Levy = Total BillableAssessed Value x Average Tax Rate
RPT
20
rent increases for rent-stabilized units, set by the Rent Guidelines Board, drive the forecast for Class 2 actual assessed values. Rent regulated apartments account for about 62.0 percent of the City’s total rental units of 1,005,340 in 2011. Class 3 properties are unique in that three utility companies comprise the vast majority of the class tax base. Utility properties are classifi ed as special franchise properties (easements and rights of way), Real Estate Utility Corporations (REUC - plant and equipment), or other Class 3 properties. The valuation of special franchise utility properties is done by the New York State Offi ce of Real Property Tax Services (ORPTS). In appraising the full value of these properties, ORPTS uses the inventory information reported by the utility companies to value the properties using the RCNLD method. The fi nal actual assessed value is determined by DOF by multiplying the ORPTS certifi ed full market value by the assessment ratio of 45.0 percent for Class 3 special franchise properties. The rest of Class 3 properties are valued by DOF using a similar approach. Class 4 properties are generally valued as income-producing properties. The starting point for the valuation is the net operating income data from income and expense statements fi led by the property owners annually with DOF. For example, data from the calendar year 2008 income and expense statements were used for valuing Class 4 properties in fi scal year 2011. The income data is then adjusted for changes in economic conditions such as vacancy rates and building conditions since the last fi ling date. Finally, the market value is derived by capitalizing the net income using the income capitalization method.
Reserve Forecasting The next step in forecasting property tax revenue is to forecast the reserve for uncollectible taxes. The levy less the reserve produces the total revenue forecast. The reserve represents the portion of the tax levy which remains uncollected in the levy year for a variety of reasons. Delinquency, arising from the failure of the taxpayers to pay their taxes in full by year end, is accounted for in the reserve. Statutory abatement programs, which lower the amount of levied tax (e.g. the co-op/condo abatement, the SCRIE and J-51 programs), are also accounted for in the reserve. Reductions in tax levy due to the Tax Commission and Law Department decisions are included in the refunds and cancellations components of the reserve.
The forecasts for refunds and cancellations are based on an estimate of the number of outstanding petitions, the average amount of estimated reductions that are expected to be granted in assessed values for those properties in dispute. The reserve also allows the City to account for shelter rent and exempt property restored to the tax roll after the fi nal roll is published. Both of these are positive offsets to property tax revenue, which are unaccounted for in the initial tax levy. In addition, collections from prior years’ levies are also estimated and included in the reserve as a positive offset. After the reserve is estimated, it is subtracted from the total levy to yield the tax revenue.
Cash Plan Model The cash plan model is a monthly forecast of total fi scal year revenue or anticipated tax receipts. It provides a measure for monitoring monthly collections to determine whether tax receipts meet planned revenue. A separate cash plan is made for each of the four quarterly billing periods, for prior year collections, refunds and the lien sale. At the beginning of the fi scal year, a quarterly payment schedule for taxpayers is determined based on the amount of actual assessed value that falls into the semi-annual or quarterly payment schedules. If a parcel’s actual assessed value is greater than $250,000, the real property tax is payable semi-annually in July and January. If the parcel’s actual assessed value is $250,000 or less, the real property tax is payable quarterly in July, October, January and April. The threshold of billable assessed value was increased from $80,000 to $250,000 in 2009 in order to allow more homeowners to pay the real property tax quarterly. Once the breakout by billing schedule is set, a monthly cash plan is made for the upcoming fi scal year using historical data on the percentage of total collections received in each month. Other factors, which affect the timing of collections such as administrative and legislative changes, are also considered in fi nalizing the monthly cash plan. The historical monthly patterns for prior year collections (PYCs) and refunds are also taken into consideration. For PYCs and refunds, however, July and August receipts are accrued back to the prior fi scal year. Therefore, the current year cash plan refl ects the
Tax Revenue = Tax Levy -Reserve for Uncollectibles
RPT
21
12-month period from September through August. A revenue shortfall or surplus against the monthly cash plan may signal a temporary payment pattern shift or an incorrect estimate of the reserve component as the real property tax levy is a fi xed amount set at the beginning of each fi scal year. If it is determined that this variance will not be resolved in the current fi scal year, adjustments to the reserve forecast are made at budget modifi cations, resulting in a change in revenue.
TAX DETAIL
Tax Base
Tax Class and Assessment Cycle State law requires that DOF assign every property to one of four tax classes. Class 1 consists of one-, two- and three-family residential properties and small condominiums. Class 2 comprises all other residential properties, including multi-family cooperatives and condominiums. Class 3 represents utility real properties. Class 4 consists of all other real properties, such as offi ce buildings, factories, stores and vacant lands. On the fi scal year 2011 fi nal roll, the market values for Class 1 and Class 2 account for 49.2 percent and 23.8 percent, respectively, while Class 3 and Class 4 account for 3.2 percent and 23.8 percent, respectively, of the total market value. Among the residential properties, 37.0 percent of total residential units are Class 1, and the remaining 63.0 percent are Class 2. The taxable status and billable assessed value of each property in the City are determined on January 5th for the subsequent fi scal year, which begins on July 1st. In mid-January, a tentative assessment roll is produced and taxpayers are notifi ed of their new assessment level. The tentative roll is open for public inspection and examination on January 15th. Taxpayers can fi le a protest with DOF to correct factual errors relating to their properties’ descriptions and market values. Owners of residential properties may fi le a request to review their property values by March 15th. Class 4 property owners may fi le a request by April 1st. DOF’s change-by-notices are incorporated into the fi nal roll, which is normally released by late May. A change-by-notice must be
mailed to the owner ten days before the assessment roll becomes fi nal. Taxpayers can also fi le a petition to challenge their properties’ actual assessed value to the Tax Commission.3 Owners of Class 2, 3, and 4 properties are required to fi le their applications before March 1st. Class 1 property owners must fi le their applications by March 15th. The Tax Commission holds hearings on assessments beginning in April. Reductions in actual assessed value, granted by the Tax Commission up to approximately May 20th, are also incorporated into the fi nal roll. A taxpayer who does not wish to accept a Tax Commission decision may begin an Article 7 proceeding (tax certiorari) in the appropriate State Supreme Court. The property’s actual assessed value may be protested if the underlying property is misclassifi ed, or the underlying market value is alleged to be unlawful, unequal or excessive.
Determination of Market Value For Class 1 properties, the valuation methodology is based on the sales price of comparable properties. Sales price information is obtained from real property transfer tax returns. Physical inspections are conducted periodically and are compared with other information such as building permits (for repairs/renovation), fi re reports and exemption applications. Properties are re-inspected at least once every fi ve years. The Computer Assisted Mass Appraisal (CAMA) model is used to estimate the market value of each Class 1 parcel every year. CAMA generated values are adjusted for factors not considered by the CAMA model to fi ne-tune market values. For Class 2A (four to six unit rentals) properties, DOF also employs the valuation methodology based on the recent sales data of comparable properties. For all other Class 2 and Class 4 properties, the primary valuation methodology is the income capitalization approach. This approach requires three variables: income, expenses and a capitalization rate (cap rate), the rate of return an investor would reasonably expect. Income and expense statements are required to be fi led each year by owners of income-producing properties with an actual assessed value of more than $40,000. Data from these statements are the starting point for the income capitalization approach to valuation. Income and expenses are adjusted to refl ect the lag between reporting and the valuation dates for the assessment roll. When actual
3The Tax Commission is the City of New York’s forum for independent administrative review of real property tax assessments set by the Department of Finance.
RPT
22
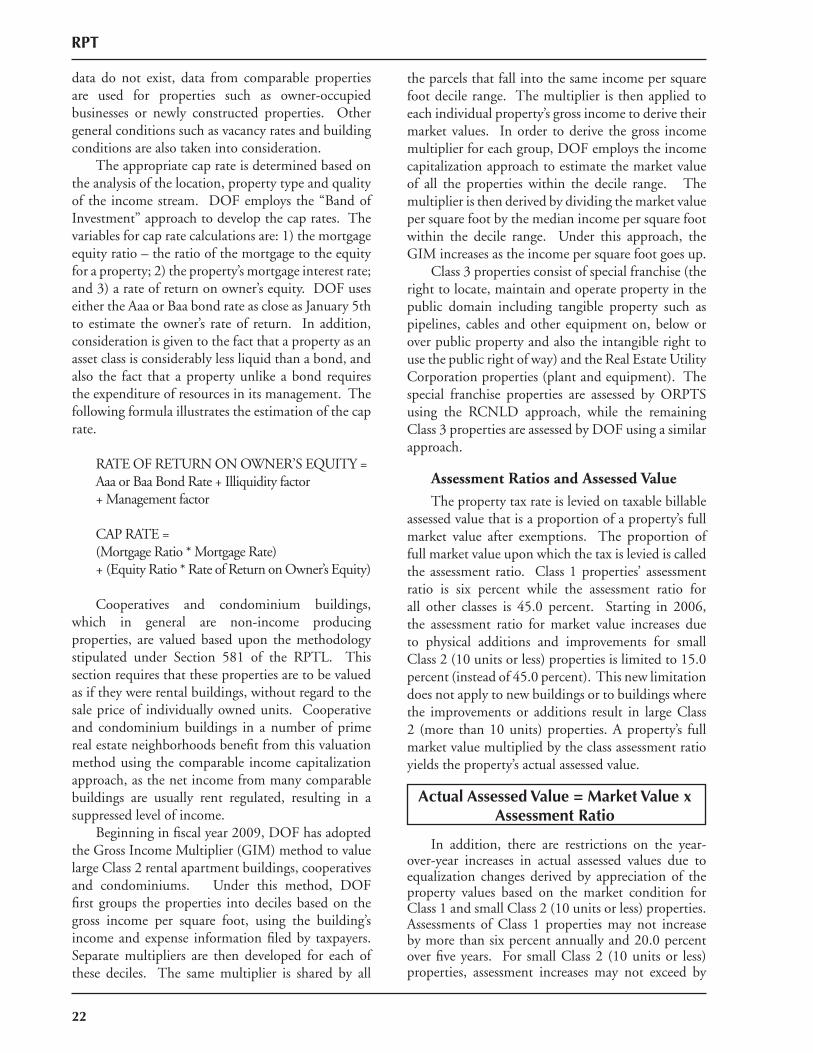
data do not exist, data from comparable properties are used for properties such as owner-occupied businesses or newly constructed properties. Other general conditions such as vacancy rates and building conditions are also taken into consideration. The appropriate cap rate is determined based on the analysis of the location, property type and quality of the income stream. DOF employs the “Band of Investment” approach to develop the cap rates. The variables for cap rate calculations are: 1) the mortgage equity ratio – the ratio of the mortgage to the equity for a property; 2) the property’s mortgage interest rate; and 3) a rate of return on owner’s equity. DOF uses either the Aaa or Baa bond rate as close as January 5th to estimate the owner’s rate of return. In addition, consideration is given to the fact that a property as an asset class is considerably less liquid than a bond, and also the fact that a property unlike a bond requires the expenditure of resources in its management. The following formula illustrates the estimation of the cap rate.
RATE OF RETURN ON OWNER’S EQUITY = Aaa or Baa Bond Rate + Illiquidity factor + Management factor
CAP RATE = (Mortgage Ratio * Mortgage Rate) + (Equity Ratio * Rate of Return on Owner’s Equity)
Cooperatives and condominium buildings, which in general are non-income producing properties, are valued based upon the methodology stipulated under Section 581 of the RPTL. This section requires that these properties are to be valued as if they were rental buildings, without regard to the sale price of individually owned units. Cooperative and condominium buildings in a number of prime real estate neighborhoods benefi t from this valuation method using the comparable income capitalization approach, as the net income from many comparable buildings are usually rent regulated, resulting in a suppressed level of income. Beginning in fi scal year 2009, DOF has adopted the Gross Income Multiplier (GIM) method to value large Class 2 rental apartment buildings, cooperatives and condominiums. Under this method, DOF fi rst groups the properties into deciles based on the gross income per square foot, using the building’s income and expense information fi led by taxpayers. Separate multipliers are then developed for each of these deciles. The same multiplier is shared by all
the parcels that fall into the same income per square foot decile range. The multiplier is then applied to each individual property’s gross income to derive their market values. In order to derive the gross income multiplier for each group, DOF employs the income capitalization approach to estimate the market value of all the properties within the decile range. The multiplier is then derived by dividing the market value per square foot by the median income per square foot within the decile range. Under this approach, the GIM increases as the income per square foot goes up. Class 3 properties consist of special franchise (the right to locate, maintain and operate property in the public domain including tangible property such as pipelines, cables and other equipment on, below or over public property and also the intangible right to use the public right of way) and the Real Estate Utility Corporation properties (plant and equipment). The special franchise properties are assessed by ORPTS using the RCNLD approach, while the remaining Class 3 properties are assessed by DOF using a similar approach.
Assessment Ratios and Assessed Value The property tax rate is levied on taxable billable assessed value that is a proportion of a property’s full market value after exemptions. The proportion of full market value upon which the tax is levied is called the assessment ratio. Class 1 properties’ assessment ratio is six percent while the assessment ratio for all other classes is 45.0 percent. Starting in 2006, the assessment ratio for market value increases due to physical additions and improvements for small Class 2 (10 units or less) properties is limited to 15.0 percent (instead of 45.0 percent). This new limitation does not apply to new buildings or to buildings where the improvements or additions result in large Class 2 (more than 10 units) properties. A property’s full market value multiplied by the class assessment ratio yields the property’s actual assessed value.
In addition, there are restrictions on the year-over-year increases in actual assessed values due to equalization changes derived by appreciation of the property values based on the market condition for Class 1 and small Class 2 (10 units or less) properties. Assessments of Class 1 properties may not increase by more than six percent annually and 20.0 percent over fi ve years. For small Class 2 (10 units or less) properties, assessment increases may not exceed by
Actual Assessed Value = Market Value xAssessment Ratio
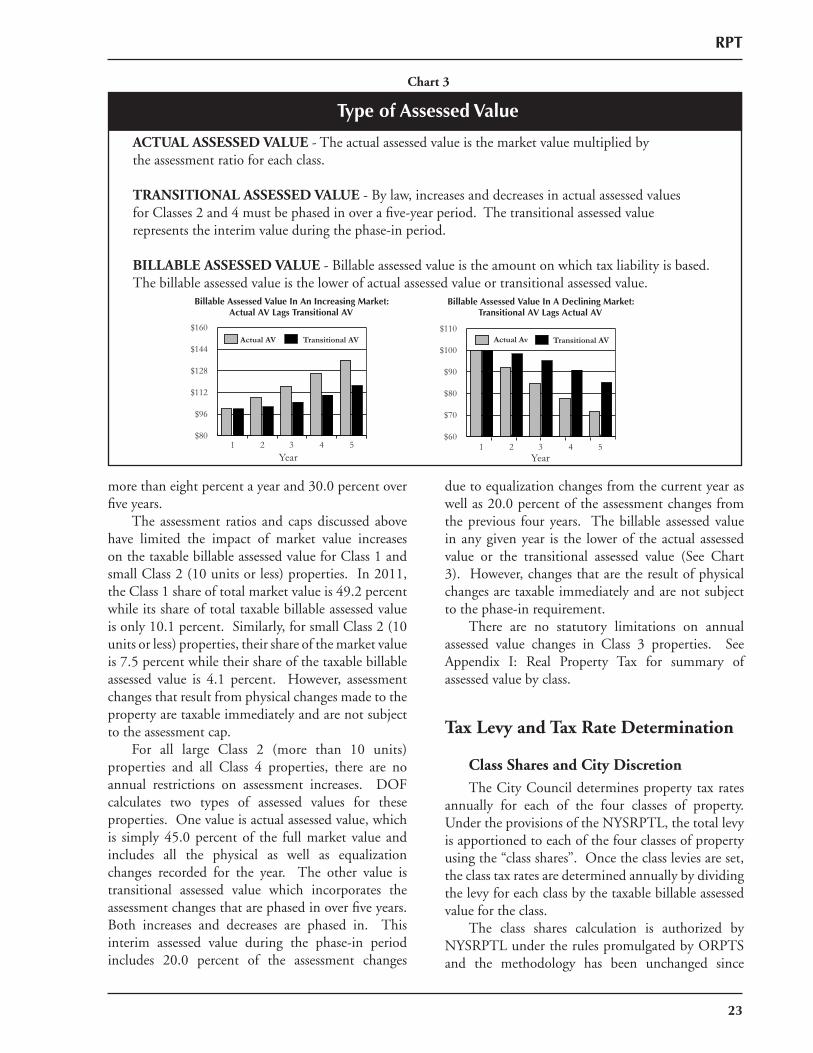
Type of Assessed Value
Chart 3
Billable Assessed Value In An Increasing Market:Actual AV Lags Transitional AV
$80
$96
$112
$128
$144
$160Actual AV Transitional AV
1 2 3 4 5Year
Billable Assessed Value In A Declining Market:Transitional AV Lags Actual AV
$60
$70
$80
$90
$100
$110Transitional AVActual Av
1 2 3 4 5Year
ACTUAL ASSESSED VALUE - The actual assessed value is the market value multiplied bythe assessment ratio for each class.
TRANSITIONAL ASSESSED VALUE - By law, increases and decreases in actual assessed valuesfor Classes 2 and 4 must be phased in over a fi ve-year period. The transitional assessed valuerepresents the interim value during the phase-in period.
BILLABLE ASSESSED VALUE - Billable assessed value is the amount on which tax liability is based. The billable assessed value is the lower of actual assessed value or transitional assessed value.
RPT
23
more than eight percent a year and 30.0 percent over fi ve years. The assessment ratios and caps discussed above have limited the impact of market value increases on the taxable billable assessed value for Class 1 and small Class 2 (10 units or less) properties. In 2011, the Class 1 share of total market value is 49.2 percent while its share of total taxable billable assessed value is only 10.1 percent. Similarly, for small Class 2 (10 units or less) properties, their share of the market value is 7.5 percent while their share of the taxable billable assessed value is 4.1 percent. However, assessment changes that result from physical changes made to the property are taxable immediately and are not subject to the assessment cap. For all large Class 2 (more than 10 units) properties and all Class 4 properties, there are no annual restrictions on assessment increases. DOF calculates two types of assessed values for these properties. One value is actual assessed value, which is simply 45.0 percent of the full market value and includes all the physical as well as equalization changes recorded for the year. The other value is transitional assessed value which incorporates the assessment changes that are phased in over fi ve years. Both increases and decreases are phased in. This interim assessed value during the phase-in period includes 20.0 percent of the assessment changes
due to equalization changes from the current year as well as 20.0 percent of the assessment changes from the previous four years. The billable assessed value in any given year is the lower of the actual assessed value or the transitional assessed value (See Chart 3). However, changes that are the result of physical changes are taxable immediately and are not subject to the phase-in requirement. There are no statutory limitations on annual assessed value changes in Class 3 properties. See Appendix I: Real Property Tax for summary of assessed value by class.
Tax Levy and Tax Rate Determination
Class Shares and City Discretion The City Council determines property tax rates annually for each of the four classes of property. Under the provisions of the NYSRPTL, the total levy is apportioned to each of the four classes of property using the “class shares”. Once the class levies are set, the class tax rates are determined annually by dividing the levy for each class by the taxable billable assessed value for the class. The class shares calculation is authorized by NYSRPTL under the rules promulgated by ORPTS and the methodology has been unchanged since
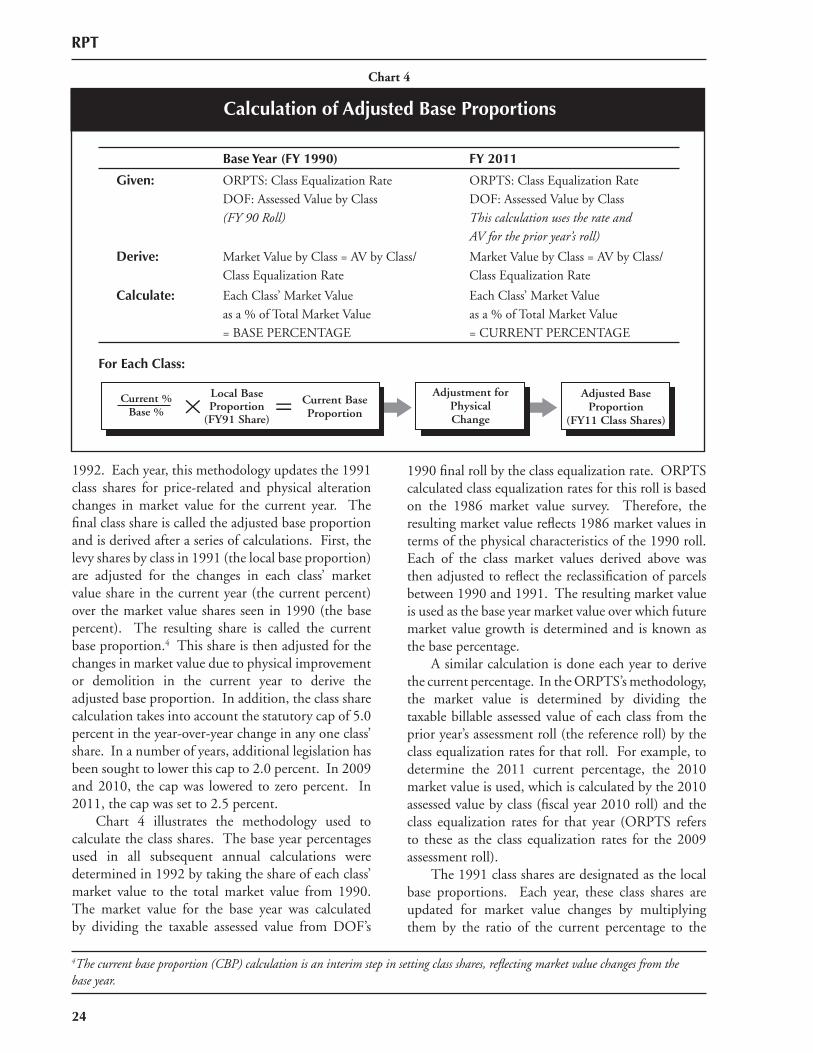
Base Year (FY 1990) FY 2011
Given: ORPTS: Class Equalization RateDOF: Assessed Value by Class(FY 90 Roll)
ORPTS: Class Equalization RateDOF: Assessed Value by ClassThis calculation uses the rate andAV for the prior year’s roll)
Derive: Market Value by Class = AV by Class/Class Equalization Rate
Market Value by Class = AV by Class/Class Equalization Rate
Calculate: Each Class’ Market Valueas a % of Total Market Value= BASE PERCENTAGE
Each Class’ Market Valueas a % of Total Market Value= CURRENT PERCENTAGE
For Each Class:
Calculation of Adjusted Base Proportions
Chart 4
Adjustment forPhysicalChange
Adjusted BaseProportion
(FY11 Class Shares)
Local BaseProportion
(FY91 Share)× = Current Base
ProportionCurrent %
Base %
RPT
24
1992. Each year, this methodology updates the 1991 class shares for price-related and physical alteration changes in market value for the current year. The fi nal class share is called the adjusted base proportion and is derived after a series of calculations. First, the levy shares by class in 1991 (the local base proportion) are adjusted for the changes in each class’ market value share in the current year (the current percent) over the market value shares seen in 1990 (the base percent). The resulting share is called the current base proportion.4 This share is then adjusted for the changes in market value due to physical improvement or demolition in the current year to derive the adjusted base proportion. In addition, the class share calculation takes into account the statutory cap of 5.0 percent in the year-over-year change in any one class’ share. In a number of years, additional legislation has been sought to lower this cap to 2.0 percent. In 2009 and 2010, the cap was lowered to zero percent. In 2011, the cap was set to 2.5 percent. Chart 4 illustrates the methodology used to calculate the class shares. The base year percentages used in all subsequent annual calculations were determined in 1992 by taking the share of each class’ market value to the total market value from 1990. The market value for the base year was calculated by dividing the taxable assessed value from DOF’s
1990 fi nal roll by the class equalization rate. ORPTS calculated class equalization rates for this roll is based on the 1986 market value survey. Therefore, the resulting market value refl ects 1986 market values in terms of the physical characteristics of the 1990 roll. Each of the class market values derived above was then adjusted to refl ect the reclassifi cation of parcels between 1990 and 1991. The resulting market value is used as the base year market value over which future market value growth is determined and is known as the base percentage. A similar calculation is done each year to derive the current percentage. In the ORPTS’s methodology, the market value is determined by dividing the taxable billable assessed value of each class from the prior year’s assessment roll (the reference roll) by the class equalization rates for that roll. For example, to determine the 2011 current percentage, the 2010 market value is used, which is calculated by the 2010 assessed value by class (fi scal year 2010 roll) and the class equalization rates for that year (ORPTS refers to these as the class equalization rates for the 2009 assessment roll). The 1991 class shares are designated as the local base proportions. Each year, these class shares are updated for market value changes by multiplying them by the ratio of the current percentage to the
4The current base proportion (CBP) calculation is an interim step in setting class shares, refl ecting market value changes from the base year.
RPT
25
base percentage for each class, yielding the current base proportion for each class. Since the current base proportion for any class cannot exceed the class’ prior year adjusted base proportion by more than 5.0 percent, any excess must be distributed to other classes. The City Council exercises its discretion on how the excess is apportioned among the remaining classes. The last step in updating the current base proportion for market value changes is to normalize the proportions so that the sum of all the class percentages equals 100.0 percent. Finally, the current base proportion is adjusted for physical alteration and related market value changes (physical changes such as new construction, renovation, additions and demolitions) to arrive at the adjusted base proportion.
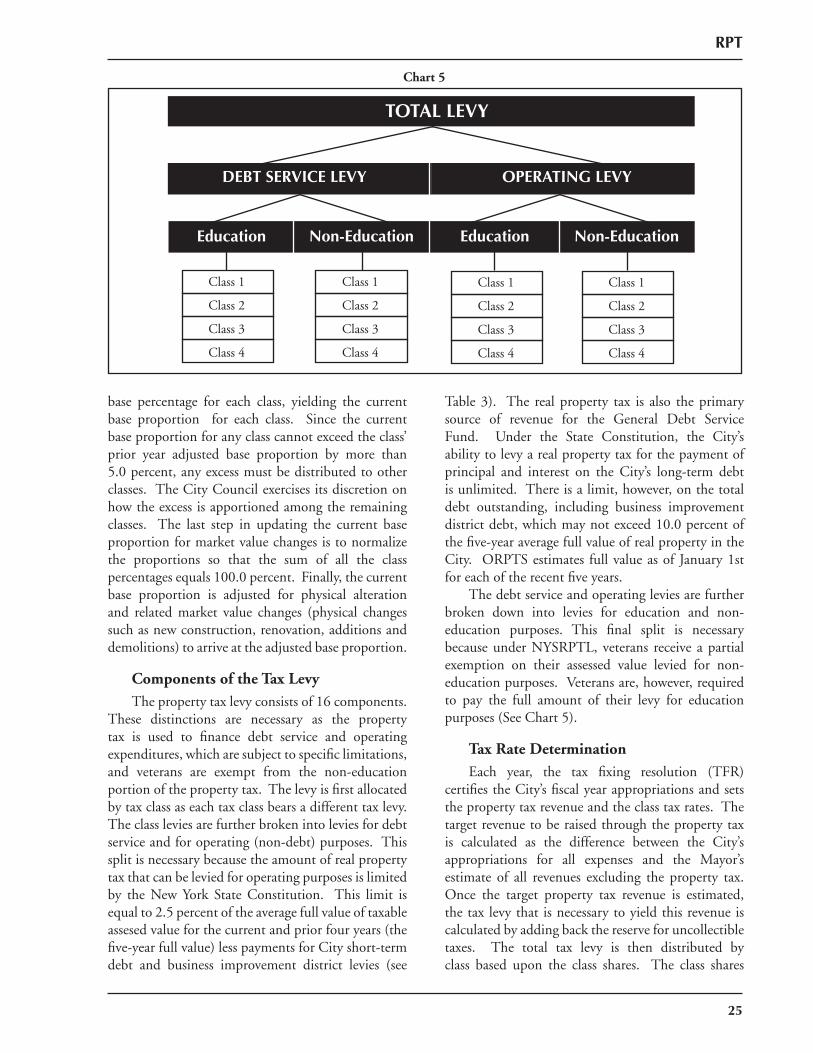
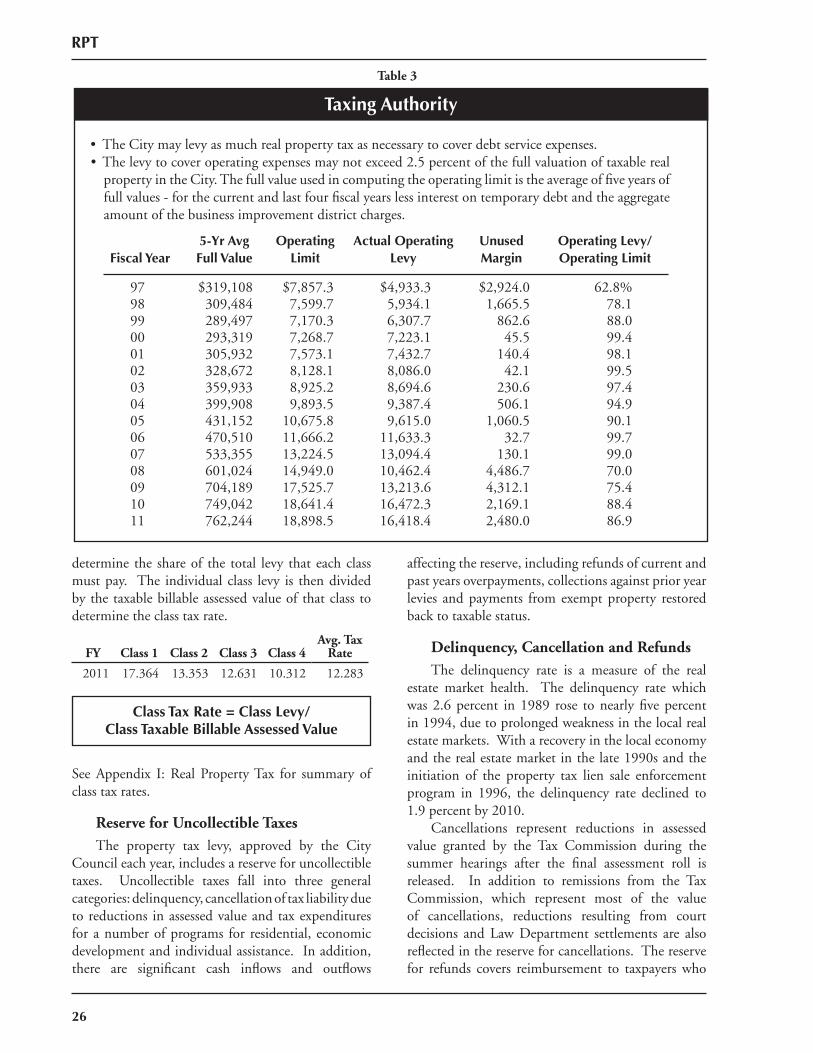
Components of the Tax Levy The property tax levy consists of 16 components. These distinctions are necessary as the property tax is used to fi nance debt service and operating expenditures, which are subject to specifi c limitations, and veterans are exempt from the non-education portion of the property tax. The levy is fi rst allocated by tax class as each tax class bears a different tax levy. The class levies are further broken into levies for debt service and for operating (non-debt) purposes. This split is necessary because the amount of real property tax that can be levied for operating purposes is limited by the New York State Constitution. This limit is equal to 2.5 percent of the average full value of taxable assesed value for the current and prior four years (the fi ve-year full value) less payments for City short-term debt and business improvement district levies (see
Table 3). The real property tax is also the primary source of revenue for the General Debt Service Fund. Under the State Constitution, the City’s ability to levy a real property tax for the payment of principal and interest on the City’s long-term debt is unlimited. There is a limit, however, on the total debt outstanding, including business improvement district debt, which may not exceed 10.0 percent of the fi ve-year average full value of real property in the City. ORPTS estimates full value as of January 1st for each of the recent fi ve years. The debt service and operating levies are further broken down into levies for education and non-education purposes. This fi nal split is necessary because under NYSRPTL, veterans receive a partial exemption on their assessed value levied for non-education purposes. Veterans are, however, required to pay the full amount of their levy for education purposes (See Chart 5).
Tax Rate Determination Each year, the tax fi xing resolution (TFR) certifi es the City’s fi scal year appropriations and sets the property tax revenue and the class tax rates. The target revenue to be raised through the property tax is calculated as the difference between the City’s appropriations for all expenses and the Mayor’s estimate of all revenues excluding the property tax. Once the target property tax revenue is estimated, the tax levy that is necessary to yield this revenue is calculated by adding back the reserve for uncollectible taxes. The total tax levy is then distributed by class based upon the class shares. The class shares
Taxing AuthorityChart 5
TOTAL LEVY
DEBT SERVICE LEVY
Education EducationNon-Education Non-Education
OPERATING LEVY
Class 1 Class 1 Class 1 Class 1
Class 2 Class 2 Class 2 Class 2
Class 3 Class 3 Class 3 Class 3
Class 4 Class 4 Class 4 Class 4
RPT
26
determine the share of the total levy that each class must pay. The individual class levy is then divided by the taxable billable assessed value of that class to determine the class tax rate.
See Appendix I: Real Property Tax for summary of class tax rates.
Reserve for Uncollectible Taxes The property tax levy, approved by the City Council each year, includes a reserve for uncollectible taxes. Uncollectible taxes fall into three general categories: delinquency, cancellation of tax liability due to reductions in assessed value and tax expenditures for a number of programs for residential, economic development and individual assistance. In addition, there are signifi cant cash infl ows and outfl ows
affecting the reserve, including refunds of current and past years overpayments, collections against prior year levies and payments from exempt property restored back to taxable status.
Delinquency, Cancellation and Refunds The delinquency rate is a measure of the real estate market health. The delinquency rate which was 2.6 percent in 1989 rose to nearly fi ve percent in 1994, due to prolonged weakness in the local real estate markets. With a recovery in the local economy and the real estate market in the late 1990s and the initiation of the property tax lien sale enforcement program in 1996, the delinquency rate declined to 1.9 percent by 2010. Cancellations represent reductions in assessed value granted by the Tax Commission during the summer hearings after the fi nal assessment roll is released. In addition to remissions from the Tax Commission, which represent most of the value of cancellations, reductions resulting from court decisions and Law Department settlements are also refl ected in the reserve for cancellations. The reserve for refunds covers reimbursement to taxpayers who
Class Tax Rate = Class Levy/Class Taxable Billable Assessed Value
FY Class 1 Class 2 Class 3 Class 4Avg. Tax
Rate
2011 17.364 13.353 12.631 10.312 12.283
Taxing Authority
Fiscal Year5-Yr Avg Full Value
Operating Limit
Actual Operating Levy
Unused Margin
Operating Levy/Operating Limit
97 $319,108 $7,857.3 $4,933.3 $2,924.0 62.8%98 309,484 7,599.7 5,934.1 1,665.5 78.199 289,497 7,170.3 6,307.7 862.6 88.000 293,319 7,268.7 7,223.1 45.5 99.401 305,932 7,573.1 7,432.7 140.4 98.102 328,672 8,128.1 8,086.0 42.1 99.503 359,933 8,925.2 8,694.6 230.6 97.404 399,908 9,893.5 9,387.4 506.1 94.905 431,152 10,675.8 9,615.0 1,060.5 90.106 470,510 11,666.2 11,633.3 32.7 99.707 533,355 13,224.5 13,094.4 130.1 99.008 601,024 14,949.0 10,462.4 4,486.7 70.009 704,189 17,525.7 13,213.6 4,312.1 75.410 749,042 18,641.4 16,472.3 2,169.1 88.411 762,244 18,898.5 16,418.4 2,480.0 86.9
• The City may levy as much real property tax as necessary to cover debt service expenses. • The levy to cover operating expenses may not exceed 2.5 percent of the full valuation of taxable real
property in the City. The full value used in computing the operating limit is the average of fi ve years of full values - for the current and last four fi scal years less interest on temporary debt and the aggregate amount of the business improvement district charges.
Table 3
RPT
27
overpaid their tax liabilities, or whose liabilities were reduced after payment was made.
Tax Expenditures The City is required to provide real estate tax expenditures by a variety of New York State laws, provisions in the City Charter, the City Administrative Code and underlying agency regulations. Tax expenditures are mainly granted and administered by various City agencies. There are also State programs and public agencies that provide housing and economic development incentives to the local real estate market. All or a portion of the assessed value of a property may be eligible for exemption from taxation. Typically, government-owned (public) properties are exempt from taxation and include properties owned by the Federal Government, the State of New York, the City of New York, public benefi t corporations, the United Nations and foreign governments (if they use such properties as missions to the United Nations or as consulates). Private properties that are exempt from taxation include property owned by non profi t, religious, charitable, educational, medical and cultural organizations. In addition, a variety of property tax expenditure programs are offered by the City, granting varying degrees of tax exemptions to privately owned properties. These property tax expenditure programs generally fall into the following categories: (1) Residential - incentives for spurring residential construction and renovation; (2) Commercial - promotion of economic development; and (3) Individual assistance - tax relief to classes of individual homeowners or tenants. Residential: Residential housing benefi ts comprised 47.5 percent of property tax expenditures, valued at $1,790 million in 2010. Residential exemptions are intended to encourage rehabilitation of existing housing and new construction or renovation. Program benefi ts vary based on geographic criteria. The exemption benefi ts granted to residential properties are frequently extended to commercial space within the same building. Economic Development: The value of economic development incentives totaled $1,364 million in 2010, or 36.2 percent of total property tax expenditures. The City provided these benefi ts through 13,043 exemptions and 865 abatements. Commercial and industrial exemptions are intended to encourage economic development. Properties assisted by these programs range from hotels, retail
space and offi ce buildings to properties involved in manufacturing and distribution activities, such as factories and warehouses. These programs typically provide greater benefi ts to industrial construction and renovation. Individual Assistance: The programs for individual assistance totaled $614 million in 2010, or 16.3 percent of total property tax expenditures. A total of 112,905 exemptions reduced taxes for homeowners who are qualifi ed veterans, seniors, or persons with disabilities and provided relief to qualifi ed renters who are seniors or with disabilities. For example, senior citizen programs are based on the income of the qualifying individual who legally owns or occupies the property.See Appendix I: Estimated Value of Real Property Tax Exemptions and Abatements 1986-2010
Administration The real property tax is administered by DOF, which assesses property values annually, issues bills, collects revenues and conducts enforcement. ORPTS assesses special franchise properties and approves current and adjusted base proportions. All properties with an actual assessed value of $250,000 or less (or in the case of cooperatives, the average per unit assessed value of $250,000 or less) pay quarterly installments. All other properties with an actual assessed value of more than $250,000 pay semi -annual installments. Quarterly installments are due on July 1st, October 1st, January 1st and April 1st while the semi-annual payments are due on July 1st and January 1st. In addition, quarterly taxpayers are entitled to a 15-day interest-free grace period. Taxpayers are also entitled to an early payment discount. If the entire amount due for the year is prepaid by the July due date (or grace period due date for quarterly payers), they receive a 1.0 percent discount on the full amount of the property tax paid. If the remainder of the full year tax is paid by the October due date, they receive a 0.66 percent discount on the remainder of the full year balance paid. If the remainder of the balance due for the year is paid by the January due date, they receive a 0.33 percent discount on the balance paid. Interest is charged to taxpayers on the outstanding amount of property tax and is compounded daily until the payment is received. The interest rate for late payment depends on the assessed value of the property. For properties with an actual assessed value of less than $250,000, the interest rate is 9.0 percent and for all other properties the interest rate is 18.0 percent.
RPT
28
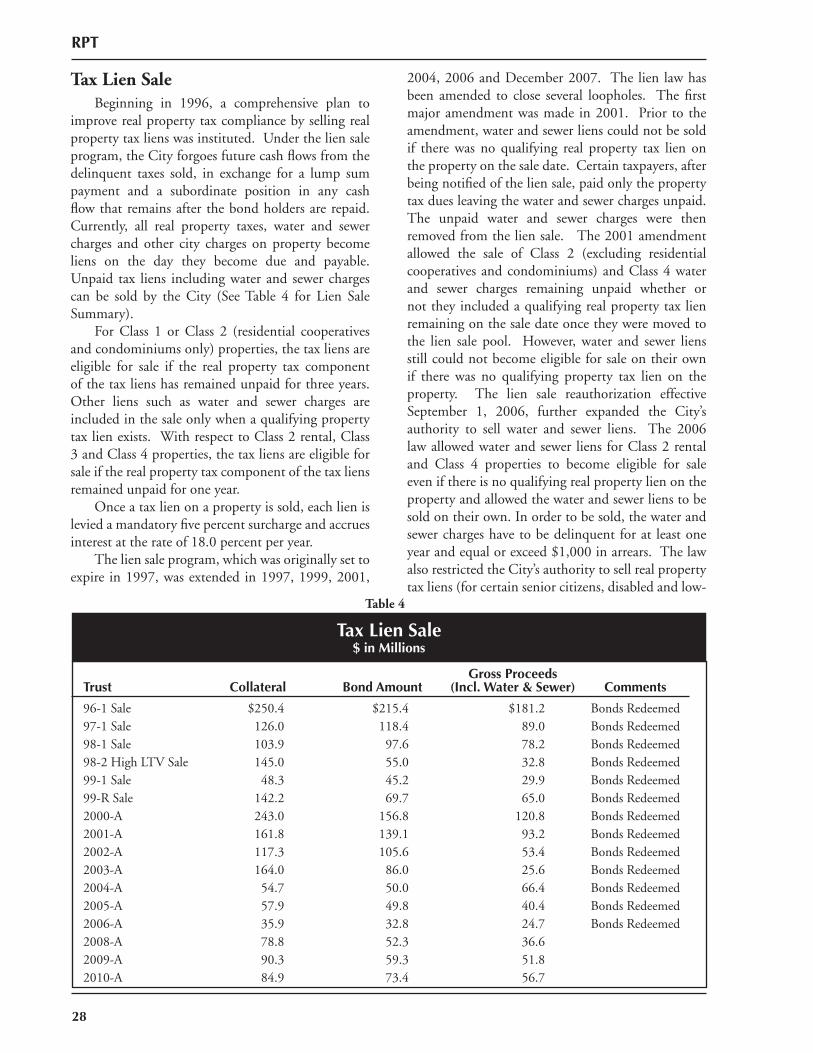
Tax Lien Sale Beginning in 1996, a comprehensive plan to improve real property tax compliance by selling real property tax liens was instituted. Under the lien sale program, the City forgoes future cash fl ows from the delinquent taxes sold, in exchange for a lump sum payment and a subordinate position in any cash fl ow that remains after the bond holders are repaid. Currently, all real property taxes, water and sewer charges and other city charges on property become liens on the day they become due and payable. Unpaid tax liens including water and sewer charges can be sold by the City (See Table 4 for Lien Sale Summary). For Class 1 or Class 2 (residential cooperatives and condominiums only) properties, the tax liens are eligible for sale if the real property tax component of the tax liens has remained unpaid for three years. Other liens such as water and sewer charges are included in the sale only when a qualifying property tax lien exists. With respect to Class 2 rental, Class 3 and Class 4 properties, the tax liens are eligible for sale if the real property tax component of the tax liens remained unpaid for one year. Once a tax lien on a property is sold, each lien is levied a mandatory fi ve percent surcharge and accrues interest at the rate of 18.0 percent per year. The lien sale program, which was originally set to expire in 1997, was extended in 1997, 1999, 2001,
2004, 2006 and December 2007. The lien law has been amended to close several loopholes. The fi rst major amendment was made in 2001. Prior to the amendment, water and sewer liens could not be sold if there was no qualifying real property tax lien on the property on the sale date. Certain taxpayers, after being notifi ed of the lien sale, paid only the property tax dues leaving the water and sewer charges unpaid. The unpaid water and sewer charges were then removed from the lien sale. The 2001 amendment allowed the sale of Class 2 (excluding residential cooperatives and condominiums) and Class 4 water and sewer charges remaining unpaid whether or not they included a qualifying real property tax lien remaining on the sale date once they were moved to the lien sale pool. However, water and sewer liens still could not become eligible for sale on their own if there was no qualifying property tax lien on the property. The lien sale reauthorization effective September 1, 2006, further expanded the City’s authority to sell water and sewer liens. The 2006 law allowed water and sewer liens for Class 2 rental and Class 4 properties to become eligible for sale even if there is no qualifying real property lien on the property and allowed the water and sewer liens to be sold on their own. In order to be sold, the water and sewer charges have to be delinquent for at least one year and equal or exceed $1,000 in arrears. The law also restricted the City’s authority to sell real property tax liens (for certain senior citizens, disabled and low-
Tax Lien Sale$ in Millions
Table 4
Trust Collateral Bond AmountGross Proceeds
(Incl. Water & Sewer) Comments
96-1 Sale $250.4 $215.4 $181.2 Bonds Redeemed97-1 Sale 126.0 118.4 89.0 Bonds Redeemed98-1 Sale 103.9 97.6 78.2 Bonds Redeemed98-2 High LTV Sale 145.0 55.0 32.8 Bonds Redeemed99-1 Sale 48.3 45.2 29.9 Bonds Redeemed99-R Sale 142.2 69.7 65.0 Bonds Redeemed2000-A 243.0 156.8 120.8 Bonds Redeemed2001-A 161.8 139.1 93.2 Bonds Redeemed2002-A 117.3 105.6 53.4 Bonds Redeemed2003-A 164.0 86.0 25.6 Bonds Redeemed2004-A 54.7 50.0 66.4 Bonds Redeemed2005-A 57.9 49.8 40.4 Bonds Redeemed2006-A 35.9 32.8 24.7 Bonds Redeemed2008-A 78.8 52.3 36.6 2009-A 90.3 59.3 51.8 2010-A 84.9 73.4 56.7
RPT
29
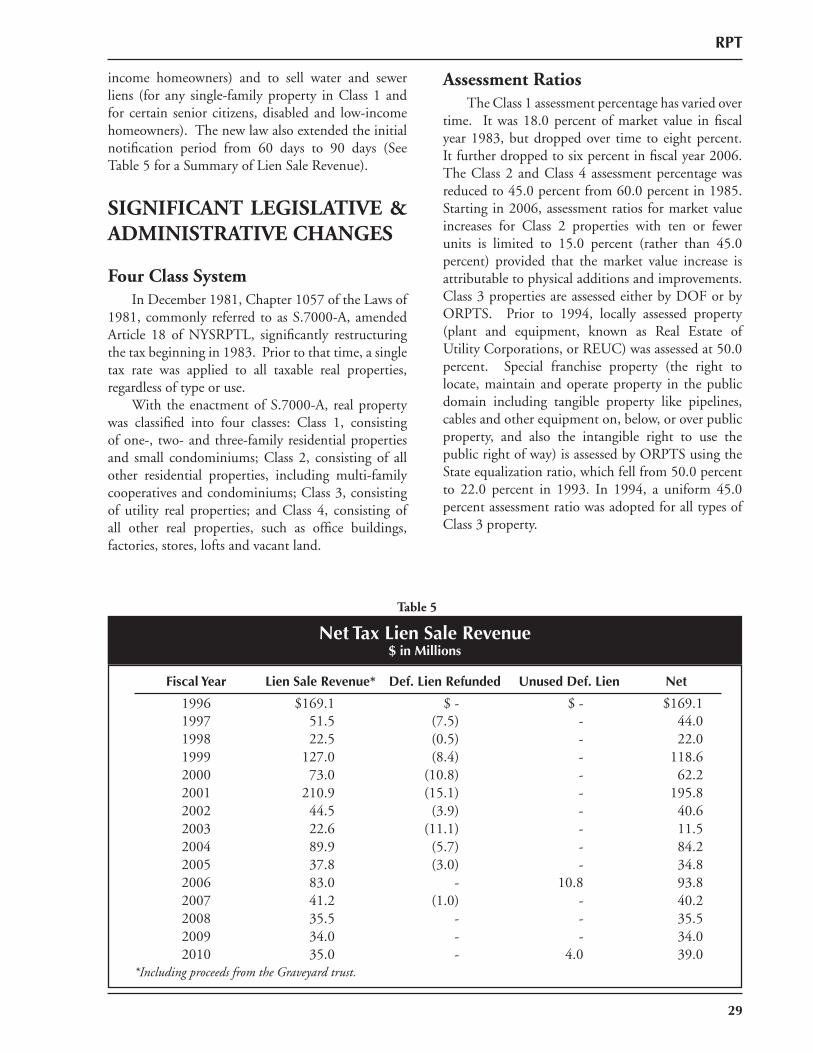
income homeowners) and to sell water and sewer liens (for any single-family property in Class 1 and for certain senior citizens, disabled and low-income homeowners). The new law also extended the initial notifi cation period from 60 days to 90 days (See Table 5 for a Summary of Lien Sale Revenue).
SIGNIFICANT LEGISLATIVE & ADMINISTRATIVE CHANGES
Four Class System In December 1981, Chapter 1057 of the Laws of 1981, commonly referred to as S.7000-A, amended Article 18 of NYSRPTL, signifi cantly restructuring the tax beginning in 1983. Prior to that time, a single tax rate was applied to all taxable real properties, regardless of type or use. With the enactment of S.7000-A, real property was classifi ed into four classes: Class 1, consisting of one-, two- and three-family residential properties and small condominiums; Class 2, consisting of all other residential properties, including multi-family cooperatives and condominiums; Class 3, consisting of utility real properties; and Class 4, consisting of all other real properties, such as offi ce buildings, factories, stores, lofts and vacant land.
Assessment Ratios The Class 1 assessment percentage has varied over time. It was 18.0 percent of market value in fi scal year 1983, but dropped over time to eight percent. It further dropped to six percent in fi scal year 2006. The Class 2 and Class 4 assessment percentage was reduced to 45.0 percent from 60.0 percent in 1985. Starting in 2006, assessment ratios for market value increases for Class 2 properties with ten or fewer units is limited to 15.0 percent (rather than 45.0 percent) provided that the market value increase is attributable to physical additions and improvements. Class 3 properties are assessed either by DOF or by ORPTS. Prior to 1994, locally assessed property (plant and equipment, known as Real Estate of Utility Corporations, or REUC) was assessed at 50.0 percent. Special franchise property (the right to locate, maintain and operate property in the public domain including tangible property like pipelines, cables and other equipment on, below, or over public property, and also the intangible right to use the public right of way) is assessed by ORPTS using the State equalization ratio, which fell from 50.0 percent to 22.0 percent in 1993. In 1994, a uniform 45.0 percent assessment ratio was adopted for all types of Class 3 property.
Net Tax Lien Sale Revenue$ in Millions
Table 5
Fiscal Year Lien Sale Revenue* Def. Lien Refunded Unused Def. Lien Net
1996 $169.1 $ - $ - $169.11997 51.5 (7.5) - 44.01998 22.5 (0.5) - 22.01999 127.0 (8.4) - 118.62000 73.0 (10.8) - 62.22001 210.9 (15.1) - 195.82002 44.5 (3.9) - 40.62003 22.6 (11.1) - 11.52004 89.9 (5.7) - 84.22005 37.8 (3.0) - 34.82006 83.0 - 10.8 93.82007 41.2 (1.0) - 40.22008 35.5 - - 35.52009 34.0 - - 34.02010 35.0 - 4.0 39.0
*Including proceeds from the Graveyard trust.
RPT
30
Assessment Increases, Caps and Phase-ins The S.7000-A law also established restrictions on annual assessment increases due to equalization increase, which is defi ned as appreciation of the existing property value based on the market condition. Assessments of Class 1 properties may not increase by more than six percent annually and 20.0 percent over fi ve years. Beginning in 1994, increases in assessments of small Class 2 properties (10 units or less) due to equalization, are also limited to eight percent a year and 30.0 percent over fi ve years. For all other Class 2 and all Class 4 properties there are no annual restrictions on assessment increases. Instead, market value changes are refl ected in actual assessed value. At the same time, however, DOF calculates an alternative assessed value called transitional assessed value in addition to the actual assessed value. Increases and decreases in value due to the market condition are phased in over fi ve years and the interim value during the phase-in period is represented by the transitional assessment. Billable assessed value, which is used for tax purposes, is based on the lower of the actual assessed value or the transitional assessed value. Changes that are the result of physical changes are taxable immediately and are not subject to the assessment cap or the phase-in requirement.
Class shares As originally enacted, S.7000-A required that the class shares for the 1981 roll be certifi ed as base proportions. These base proportions were to be modifi ed periodically by ORPTS for relative changes in market values among the four classes as well as for physical changes. While the adjustment for physical changes took place each year, the fi rst market value adjustment was not scheduled until 1987. At that time, legislation postponed the implementation of market value changes until calendar year 1989 (for use in fi scal year 1990). This legislation was also intended to substitute the 1984 class shares for the 1981 base proportions in calculating class shares. However, neither amendment was implemented. Legislation passed in the spring of 1989 amended S.7000-A, changed the mechanics of the market value adjustment and further postponed the market value adjustment until 1992 in order to prevent a signifi cant shift in tax burden towards Class 1 taxpayers in fi scal year 1990. From 1983 to 1991, the City apportioned the tax levy by using the 1981
proportions, as adjusted annually for physical change. Starting in 1992, the 1981 proportions were replaced by the 1991 proportions, which were set to be base proportions. The 1991 proportions have been used as the base proportions to apportion the tax levy to date. During the 1983 to 1991 period, the City Council had discretion in setting class shares as long as an increase in each class’ share was within 5.0 percent of the previous year’s share. Since 1992, class shares have been adjusted annually for relative changes in market value (subject to a “cap” of 5.0 percent over the prior year’s share) in addition to physical change. The resulting shares are called adjusted base proportions.
Assessment Methodology Changes Prior to the early 1990s, DOF’s assessment policy emphasized the sales approach to establish the estimated market value of Class 4 properties. Properties which were sold during this period were assessed at 45.0 percent of their purchase price regardless of their actual income, and capitalization rates derived from these sales were applied by assessors to the income of unsold properties (the income capitalization approach). During or soon after construction, the cost approach was often used. With the onset of the 1990-91 recession, fewer sales were available to derive capitalization rates and DOF began to focus less on the sales comparison approach to value properties and instead relied primarily upon the income capitalization approach. The deepening local recession led to large increases in vacancy rates and drops in asking rents. Consequently, the current rent of a building no longer indicated the rents the building would command upon lease renewal. Therefore, actual or contractual rents were increasingly discounted in favor of current market rents. This “mark-to-market” technique resulted in signifi cant assessment reductions for buildings where income and expenses were estimated, and tenants were paying above-market rents. As a result of the reliance on the “mark-to-market” technique, the forecast of actual assessed value relies upon the outlook for net income, which in turn is based on the forecast of asking rents, vacancy rates and building expenses.
PIT
31
PERSONAL INCOME TAX
Table of Contents
Overview ...................................................................................................................................33
Forecasting Methodology ...........................................................................................................33
Tax Detail ..................................................................................................................................38
Legislative History ........................................................................................See Appendix II: PIT

PIT
32
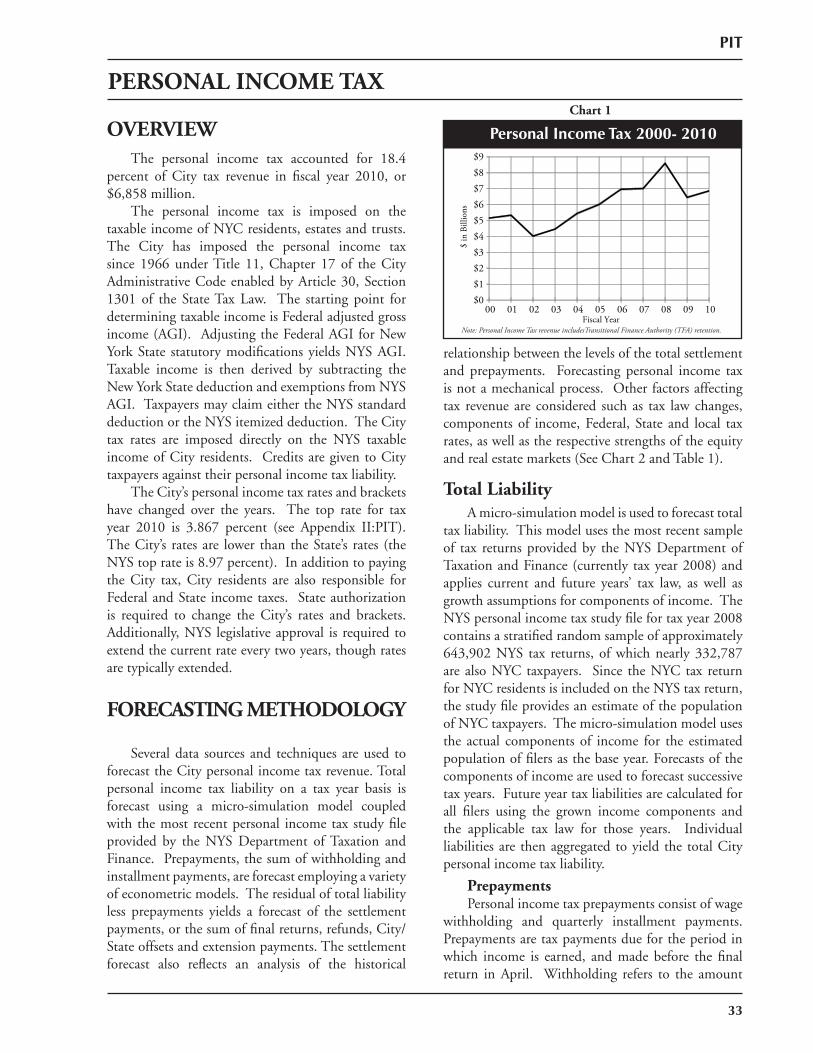
PERSONAL INCOME TAXChart 1
OVERVIEWThe personal income tax accounted for 18.4
percent of City tax revenue in fi scal year 2010, or $6,858 million.
The personal income tax is imposed on the taxable income of NYC residents, estates and trusts. The City has imposed the personal income tax since 1966 under Title 11, Chapter 17 of the City Administrative Code enabled by Article 30, Section 1301 of the State Tax Law. The starting point for determining taxable income is Federal adjusted gross income (AGI). Adjusting the Federal AGI for New York State statutory modifi cations yields NYS AGI. Taxable income is then derived by subtracting the New York State deduction and exemptions from NYS AGI. Taxpayers may claim either the NYS standard deduction or the NYS itemized deduction. The City tax rates are imposed directly on the NYS taxable income of City residents. Credits are given to City taxpayers against their personal income tax liability.
The City’s personal income tax rates and brackets have changed over the years. The top rate for tax year 2010 is 3.867 percent (see Appendix II:PIT). The City’s rates are lower than the State’s rates (the NYS top rate is 8.97 percent). In addition to paying the City tax, City residents are also responsible for Federal and State income taxes. State authorization is required to change the City’s rates and brackets. Additionally, NYS legislative approval is required to extend the current rate every two years, though rates are typically extended.
FORECASTING METHODOLOGY
Several data sources and techniques are used to forecast the City personal income tax revenue. Total personal income tax liability on a tax year basis is forecast using a micro-simulation model coupled with the most recent personal income tax study fi le provided by the NYS Department of Taxation and Finance. Prepayments, the sum of withholding and installment payments, are forecast employing a variety of econometric models. The residual of total liability less prepayments yields a forecast of the settlement payments, or the sum of fi nal returns, refunds, City/State offsets and extension payments. The settlement forecast also refl ects an analysis of the historical
relationship between the levels of the total settlement and prepayments. Forecasting personal income tax is not a mechanical process. Other factors affecting tax revenue are considered such as tax law changes, components of income, Federal, State and local tax rates, as well as the respective strengths of the equity and real estate markets (See Chart 2 and Table 1).
Total LiabilityA micro-simulation model is used to forecast total
tax liability. This model uses the most recent sample of tax returns provided by the NYS Department of Taxation and Finance (currently tax year 2008) and applies current and future years’ tax law, as well as growth assumptions for components of income. The NYS personal income tax study fi le for tax year 2008 contains a stratifi ed random sample of approximately 643,902 NYS tax returns, of which nearly 332,787 are also NYC taxpayers. Since the NYC tax return for NYC residents is included on the NYS tax return, the study fi le provides an estimate of the population of NYC taxpayers. The micro-simulation model uses the actual components of income for the estimated population of fi lers as the base year. Forecasts of the components of income are used to forecast successive tax years. Future year tax liabilities are calculated for all fi lers using the grown income components and the applicable tax law for those years. Individual liabilities are then aggregated to yield the total City personal income tax liability.
PrepaymentsPersonal income tax prepayments consist of wage
withholding and quarterly installment payments. Prepayments are tax payments due for the period in which income is earned, and made before the fi nal return in April. Withholding refers to the amount
Personal Income Tax 2000- 2010
Note: Personal Income Tax revenue includesTransitional Finance Authority (TFA) retention.
$0$1$2$3$4$5$6$7$8$9
00 01 02 03 04 05 06 07 08 09 10
$ in
Bill
ions
Fiscal Year
PIT
33

PIT
Personal Income Tax Forecast Methodology
Chart 2
Total Liability
Tax Law• Rates• Definition of Income
Withholding
HistoricalPaymentPatterns
Personal IncomeTax
Revenue
Local Personal Income and
Capital Gains Forecast
Estimated Payments
Settlements
StatutoryPayment
Rules
HistoricalRelationships
AccountingStandards
34
collections. This equation is an ARIMAX model, and uses a combination of autoregressive, moving average and explanatory variables to forecast withholding on a quarterly basis. The ARIMAX model accounts for the seasonality of withholding by using prior quarterly withholding collections as a predictor of future collections, structured to account for regular quarterly patterns across years (e.g. bonus vs. non-bonus quarters). Further, it accounts for business cycles by using a moving average of prior quarterly collections as a predictor of future collections. Once both equations have been estimated, judgment of their output is considered along with economic forecasts of employment, wages, and fi nancial sector bonuses in determining the withholding forecast.
The withholding forecast is also supplemented with a monthly withholding pattern analysis, particularly the change in the daily average withholding collections. This is especially useful during the December through March bonus period when large bonus payments are paid out. Tracking the average daily collection makes it possible to estimate base withholding (or withholding on non-bonus wages), so that withholding collections beyond the base can be estimated as withholding on bonus payments. Base withholding is estimated by examining withholding collections during non-bonus periods, and also by using the economic forecasts of total wages and securities sector wages to determine trends in base withholding and withholding on bonus payments.
of an employee’s income that an employer withholds from a paycheck and remits directly to NYS (who administers the tax for NYC) as prepayment of the individual’s tax liability for the year. In general, installment payments are quarterly tax payments due on income from sole proprietorship or partnership income. Also, fi lers who receive signifi cant investment income, a pension, an annuity or any other unearned income from which taxes are not withheld, are also required to make installment payments.
WithholdingWithholding is forecast as a function of wage
earnings in the City and the City tax rate. Nonwage income, such as dividends, interest and rental income, also affects withholding since taxpayers may adjust withholding to refl ect changes in their nonwage income. The fi nal forecast is adjusted for any withholding table changes (see Appendix II: PIT). The withholding equation is as follows:
LOG (WITHHOLDING)= a + b1 * log (Wage Earnings + Dividends, Interest and Rental Income) + b2 * log (Maximum City PIT Rate)
In addition to this annual withholding equation, a complimentary quarterly equation is used which accounts for the cyclical nature of withholding
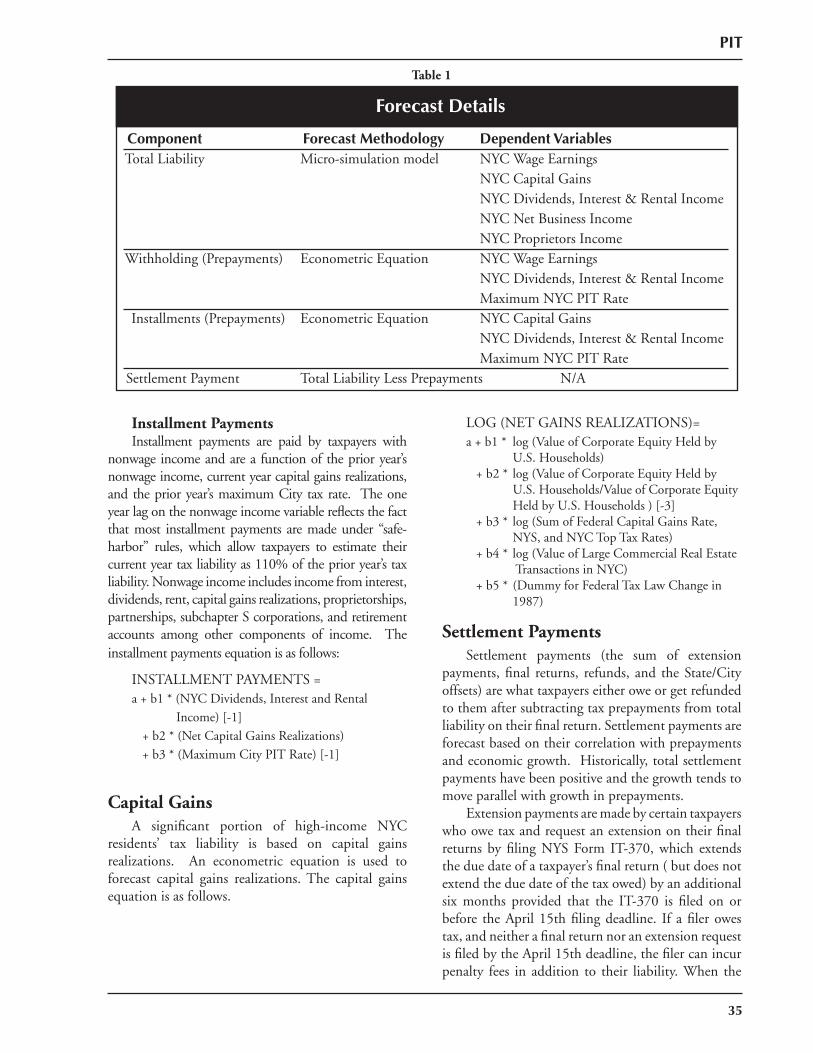
PIT
Installment PaymentsInstallment payments are paid by taxpayers with
nonwage income and are a function of the prior year’s nonwage income, current year capital gains realizations, and the prior year’s maximum City tax rate. The one year lag on the nonwage income variable refl ects the fact that most installment payments are made under “safe-harbor” rules, which allow taxpayers to estimate their current year tax liability as 110% of the prior year’s tax liability. Nonwage income includes income from interest, dividends, rent, capital gains realizations, proprietorships, partnerships, subchapter S corporations, and retirement accounts among other components of income. The installment payments equation is as follows:
INSTALLMENT PAYMENTS = a + b1 * (NYC Dividends, Interest and Rental Income) [-1] + b2 * (Net Capital Gains Realizations) + b3 * (Maximum City PIT Rate) [-1]
Capital GainsA signifi cant portion of high-income NYC
residents’ tax liability is based on capital gains realizations. An econometric equation is used to forecast capital gains realizations. The capital gains equation is as follows.
LOG (NET GAINS REALIZATIONS)= a + b1 * log (Value of Corporate Equity Held by U.S. Households) + b2 * log (Value of Corporate Equity Held by U.S. Households/Value of Corporate Equity Held by U.S. Households ) [-3] + b3 * log (Sum of Federal Capital Gains Rate, NYS, and NYC Top Tax Rates) + b4 * log (Value of Large Commercial Real Estate Transactions in NYC) + b5 * (Dummy for Federal Tax Law Change in 1987)
Settlement PaymentsSettlement payments (the sum of extension
payments, fi nal returns, refunds, and the State/City offsets) are what taxpayers either owe or get refunded to them after subtracting tax prepayments from total liability on their fi nal return. Settlement payments are forecast based on their correlation with prepayments and economic growth. Historically, total settlement payments have been positive and the growth tends to move parallel with growth in prepayments.
Extension payments are made by certain taxpayers who owe tax and request an extension on their fi nal returns by fi ling NYS Form IT-370, which extends the due date of a taxpayer’s fi nal return ( but does not extend the due date of the tax owed) by an additional six months provided that the IT-370 is fi led on or before the April 15th fi ling deadline. If a fi ler owes tax, and neither a fi nal return nor an extension request is fi led by the April 15th deadline, the fi ler can incur penalty fees in addition to their liability. When the
35
Forecast Details
Table 1
Component Forecast Methodology Dependent Variables Total Liability Micro-simulation model NYC Wage Earnings NYC Capital Gains NYC Dividends, Interest & Rental Income NYC Net Business Income NYC Proprietors Income Withholding (Prepayments) Econometric Equation NYC Wage Earnings NYC Dividends, Interest & Rental Income Maximum NYC PIT Rate Installments (Prepayments) Econometric Equation NYC Capital Gains NYC Dividends, Interest & Rental Income Maximum NYC PIT Rate Settlement Payment Total Liability Less Prepayments N/A
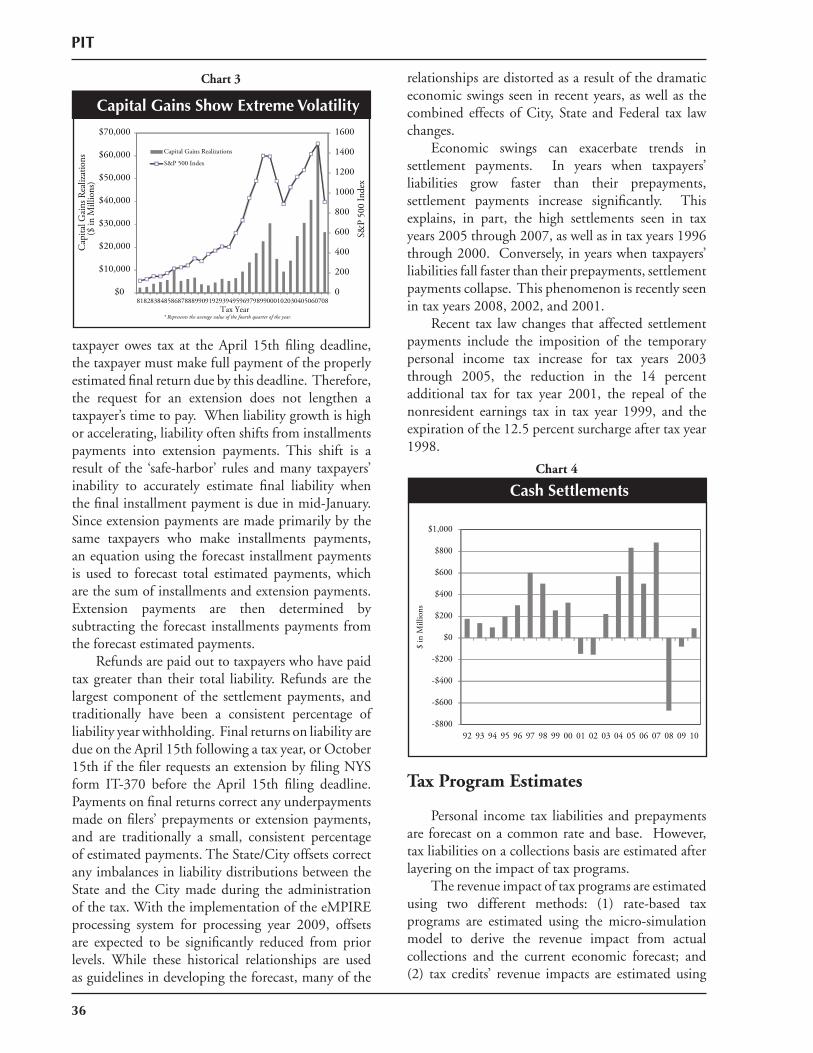
PIT
* Represents the average value of the fourth quarter of the year.
0
200
400
600
800
1000
1200
1400
1600
$0
$10,000
$20,000
$30,000
$40,000
$50,000
$60,000
$70,000
81828384858687888990919293949596979899000102030405060708
S&P
500
Inde
x
Cap
ital G
ains
Rea
lizat
ions
($ in
Mill
ions
)
Tax Year
Capital Gains Realizations
S&P 500 Index
Chart 3
Capital Gains Show Extreme Volatility
36
relationships are distorted as a result of the dramatic economic swings seen in recent years, as well as the combined effects of City, State and Federal tax law changes.
Economic swings can exacerbate trends in settlement payments. In years when taxpayers’ liabilities grow faster than their prepayments, settlement payments increase signifi cantly. This explains, in part, the high settlements seen in tax years 2005 through 2007, as well as in tax years 1996 through 2000. Conversely, in years when taxpayers’ liabilities fall faster than their prepayments, settlement payments collapse. This phenomenon is recently seen in tax years 2008, 2002, and 2001.
Recent tax law changes that affected settlement payments include the imposition of the temporary personal income tax increase for tax years 2003 through 2005, the reduction in the 14 percent additional tax for tax year 2001, the repeal of the nonresident earnings tax in tax year 1999, and the expiration of the 12.5 percent surcharge after tax year 1998.
Chart 4
Cash Settlements
Tax Program Estimates
Personal income tax liabilities and prepayments are forecast on a common rate and base. However, tax liabilities on a collections basis are estimated after layering on the impact of tax programs.
The revenue impact of tax programs are estimated using two different methods: (1) rate-based tax programs are estimated using the micro-simulation model to derive the revenue impact from actual collections and the current economic forecast; and (2) tax credits’ revenue impacts are estimated using
taxpayer owes tax at the April 15th fi ling deadline, the taxpayer must make full payment of the properly estimated fi nal return due by this deadline. Therefore, the request for an extension does not lengthen a taxpayer’s time to pay. When liability growth is high or accelerating, liability often shifts from installments payments into extension payments. This shift is a result of the ‘safe-harbor’ rules and many taxpayers’ inability to accurately estimate fi nal liability when the fi nal installment payment is due in mid-January. Since extension payments are made primarily by the same taxpayers who make installments payments, an equation using the forecast installment payments is used to forecast total estimated payments, which are the sum of installments and extension payments. Extension payments are then determined by subtracting the forecast installments payments from the forecast estimated payments.
Refunds are paid out to taxpayers who have paid tax greater than their total liability. Refunds are the largest component of the settlement payments, and traditionally have been a consistent percentage of liability year withholding. Final returns on liability are due on the April 15th following a tax year, or October 15th if the fi ler requests an extension by fi ling NYS form IT-370 before the April 15th fi ling deadline. Payments on fi nal returns correct any underpayments made on fi lers’ prepayments or extension payments, and are traditionally a small, consistent percentage of estimated payments. The State/City offsets correct any imbalances in liability distributions between the State and the City made during the administration of the tax. With the implementation of the eMPIRE processing system for processing year 2009, offsets are expected to be signifi cantly reduced from prior levels. While these historical relationships are used as guidelines in developing the forecast, many of the
-$800
-$600
-$400
-$200
$0
$200
$400
$600
$800
$1,000
92 93 94 95 96 97 98 99 00 01 02 03 04 05 06 07 08 09 10
$ in
Mill
ions
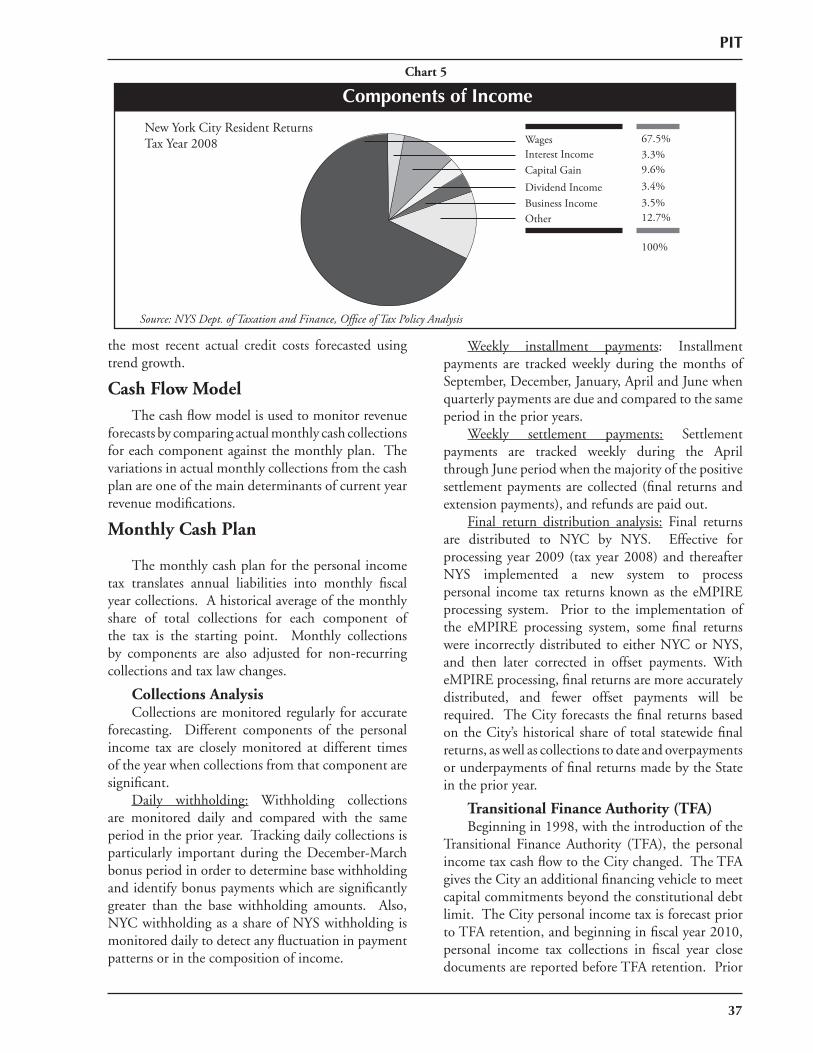
PIT
Components of IncomeChart 5
OtherBusiness IncomeDividend IncomeCapital GainInterest IncomeWages 67.5%
3.3%9.6%3.4%3.5%12.7%
100%
New York City Resident ReturnsTax Year 2008
Source: NYS Dept. of Taxation and Finance, Offi ce of Tax Policy Analysis
the most recent actual credit costs forecasted using trend growth.
Cash Flow ModelThe cash fl ow model is used to monitor revenue
forecasts by comparing actual monthly cash collections for each component against the monthly plan. The variations in actual monthly collections from the cash plan are one of the main determinants of current year revenue modifi cations.
Monthly Cash Plan
The monthly cash plan for the personal income tax translates annual liabilities into monthly fi scal year collections. A historical average of the monthly share of total collections for each component of the tax is the starting point. Monthly collections by components are also adjusted for non-recurring collections and tax law changes.
Collections AnalysisCollections are monitored regularly for accurate
forecasting. Different components of the personal income tax are closely monitored at different times of the year when collections from that component are signifi cant.
Daily withholding: Withholding collections are monitored daily and compared with the same period in the prior year. Tracking daily collections is particularly important during the December-March bonus period in order to determine base withholding and identify bonus payments which are signifi cantly greater than the base withholding amounts. Also, NYC withholding as a share of NYS withholding is monitored daily to detect any fl uctuation in payment patterns or in the composition of income.
Weekly installment payments: Installment payments are tracked weekly during the months of September, December, January, April and June when quarterly payments are due and compared to the same period in the prior years.
Weekly settlement payments: Settlement payments are tracked weekly during the April through June period when the majority of the positive settlement payments are collected (fi nal returns and extension payments), and refunds are paid out.
Final return distribution analysis: Final returns are distributed to NYC by NYS. Effective for processing year 2009 (tax year 2008) and thereafter NYS implemented a new system to process personal income tax returns known as the eMPIRE processing system. Prior to the implementation of the eMPIRE processing system, some fi nal returns were incorrectly distributed to either NYC or NYS, and then later corrected in offset payments. With eMPIRE processing, fi nal returns are more accurately distributed, and fewer offset payments will be required. The City forecasts the fi nal returns based on the City’s historical share of total statewide fi nal returns, as well as collections to date and overpayments or underpayments of fi nal returns made by the State in the prior year.
Transitional Finance Authority (TFA)Beginning in 1998, with the introduction of the
Transitional Finance Authority (TFA), the personal income tax cash fl ow to the City changed. The TFA gives the City an additional fi nancing vehicle to meet capital commitments beyond the constitutional debt limit. The City personal income tax is forecast prior to TFA retention, and beginning in fi scal year 2010, personal income tax collections in fi scal year close documents are reported before TFA retention. Prior
37
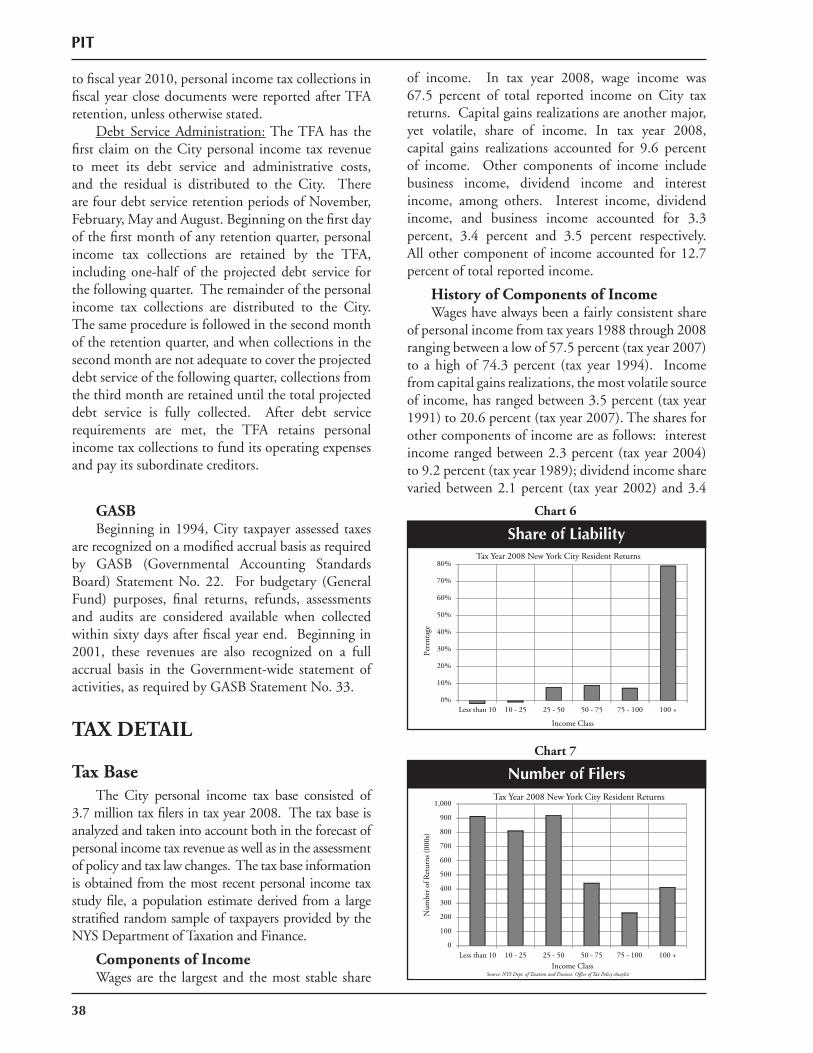
PIT
to fi scal year 2010, personal income tax collections in fi scal year close documents were reported after TFA retention, unless otherwise stated.
Debt Service Administration: The TFA has the fi rst claim on the City personal income tax revenue to meet its debt service and administrative costs, and the residual is distributed to the City. There are four debt service retention periods of November, February, May and August. Beginning on the fi rst day of the fi rst month of any retention quarter, personal income tax collections are retained by the TFA, including one-half of the projected debt service for the following quarter. The remainder of the personal income tax collections are distributed to the City. The same procedure is followed in the second month of the retention quarter, and when collections in the second month are not adequate to cover the projected debt service of the following quarter, collections from the third month are retained until the total projected debt service is fully collected. After debt service requirements are met, the TFA retains personal income tax collections to fund its operating expenses and pay its subordinate creditors.
GASBBeginning in 1994, City taxpayer assessed taxes
are recognized on a modifi ed accrual basis as required by GASB (Governmental Accounting Standards Board) Statement No. 22. For budgetary (General Fund) purposes, fi nal returns, refunds, assessments and audits are considered available when collected within sixty days after fi scal year end. Beginning in 2001, these revenues are also recognized on a full accrual basis in the Government-wide statement of activities, as required by GASB Statement No. 33.
TAX DETAIL
Tax BaseThe City personal income tax base consisted of
3.7 million tax fi lers in tax year 2008. The tax base is analyzed and taken into account both in the forecast of personal income tax revenue as well as in the assessment of policy and tax law changes. The tax base information is obtained from the most recent personal income tax study fi le, a population estimate derived from a large stratifi ed random sample of taxpayers provided by the NYS Department of Taxation and Finance.
Components of IncomeWages are the largest and the most stable share
of income. In tax year 2008, wage income was 67.5 percent of total reported income on City tax returns. Capital gains realizations are another major, yet volatile, share of income. In tax year 2008, capital gains realizations accounted for 9.6 percent of income. Other components of income include business income, dividend income and interest income, among others. Interest income, dividend income, and business income accounted for 3.3 percent, 3.4 percent and 3.5 percent respectively. All other component of income accounted for 12.7 percent of total reported income.
History of Components of IncomeWages have always been a fairly consistent share
of personal income from tax years 1988 through 2008 ranging between a low of 57.5 percent (tax year 2007) to a high of 74.3 percent (tax year 1994). Income from capital gains realizations, the most volatile source of income, has ranged between 3.5 percent (tax year 1991) to 20.6 percent (tax year 2007). The shares for other components of income are as follows: interest income ranged between 2.3 percent (tax year 2004) to 9.2 percent (tax year 1989); dividend income share varied between 2.1 percent (tax year 2002) and 3.4
Number of Filers
0
100
200
300
400
500
600
700
800
900
1,000
Less than 10 10 - 25 25 - 50 50 - 75 75 - 100 100 +
Num
ber o
f Ret
urns
(000
s)
Income ClassSource: NYS Dept. of Tasation and Finance, Office of Tax Policy Anaylsis
Tax Year 2008 New York City Resident Returns
Chart 7
0%
10%
20%
30%
40%
50%
60%
70%
80%
Less than 10 10 - 25 25 - 50 50 - 75 75 - 100 100 +
Pere
ntag
e
Income Class
Tax Year 2008 New York City Resident Returns
Share of Liability
Chart 6
38
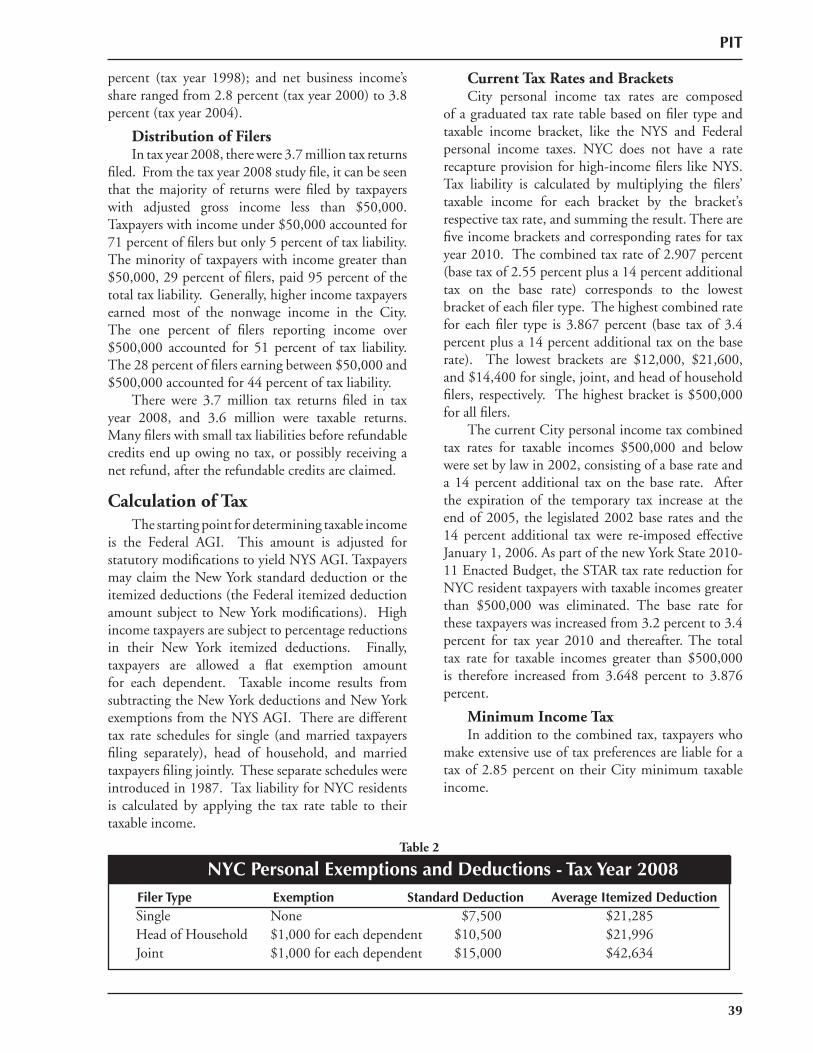
PIT
percent (tax year 1998); and net business income’s share ranged from 2.8 percent (tax year 2000) to 3.8 percent (tax year 2004).
Distribution of FilersIn tax year 2008, there were 3.7 million tax returns
fi led. From the tax year 2008 study fi le, it can be seen that the majority of returns were fi led by taxpayers with adjusted gross income less than $50,000. Taxpayers with income under $50,000 accounted for 71 percent of fi lers but only 5 percent of tax liability. The minority of taxpayers with income greater than $50,000, 29 percent of fi lers, paid 95 percent of the total tax liability. Generally, higher income taxpayers earned most of the nonwage income in the City. The one percent of fi lers reporting income over $500,000 accounted for 51 percent of tax liability. The 28 percent of fi lers earning between $50,000 and $500,000 accounted for 44 percent of tax liability.
There were 3.7 million tax returns fi led in tax year 2008, and 3.6 million were taxable returns. Many fi lers with small tax liabilities before refundable credits end up owing no tax, or possibly receiving a net refund, after the refundable credits are claimed.
Calculation of TaxThe starting point for determining taxable income
is the Federal AGI. This amount is adjusted for statutory modifi cations to yield NYS AGI. Taxpayers may claim the New York standard deduction or the itemized deductions (the Federal itemized deduction amount subject to New York modifi cations). High income taxpayers are subject to percentage reductions in their New York itemized deductions. Finally, taxpayers are allowed a fl at exemption amount for each dependent. Taxable income results from subtracting the New York deductions and New York exemptions from the NYS AGI. There are different tax rate schedules for single (and married taxpayers fi ling separately), head of household, and married taxpayers fi ling jointly. These separate schedules were introduced in 1987. Tax liability for NYC residents is calculated by applying the tax rate table to their taxable income.
Current Tax Rates and BracketsCity personal income tax rates are composed
of a graduated tax rate table based on fi ler type and taxable income bracket, like the NYS and Federal personal income taxes. NYC does not have a rate recapture provision for high-income fi lers like NYS. Tax liability is calculated by multiplying the fi lers’ taxable income for each bracket by the bracket’s respective tax rate, and summing the result. There are fi ve income brackets and corresponding rates for tax year 2010. The combined tax rate of 2.907 percent (base tax of 2.55 percent plus a 14 percent additional tax on the base rate) corresponds to the lowest bracket of each fi ler type. The highest combined rate for each fi ler type is 3.867 percent (base tax of 3.4 percent plus a 14 percent additional tax on the base rate). The lowest brackets are $12,000, $21,600, and $14,400 for single, joint, and head of household fi lers, respectively. The highest bracket is $500,000 for all fi lers.
The current City personal income tax combined tax rates for taxable incomes $500,000 and below were set by law in 2002, consisting of a base rate and a 14 percent additional tax on the base rate. After the expiration of the temporary tax increase at the end of 2005, the legislated 2002 base rates and the 14 percent additional tax were re-imposed effective January 1, 2006. As part of the new York State 2010-11 Enacted Budget, the STAR tax rate reduction for NYC resident taxpayers with taxable incomes greater than $500,000 was eliminated. The base rate for these taxpayers was increased from 3.2 percent to 3.4 percent for tax year 2010 and thereafter. The total tax rate for taxable incomes greater than $500,000 is therefore increased from 3.648 percent to 3.876 percent.
Minimum Income TaxIn addition to the combined tax, taxpayers who
make extensive use of tax preferences are liable for a tax of 2.85 percent on their City minimum taxable income.
Table 2
Filer Type Exemption Standard Deduction Average Itemized Deduction Single None $7,500 $21,285 Head of Household $1,000 for each dependent $10,500 $21,996 Joint $1,000 for each dependent $15,000 $42,634
NYC Personal Exemptions and Deductions - Tax Year 2008
39
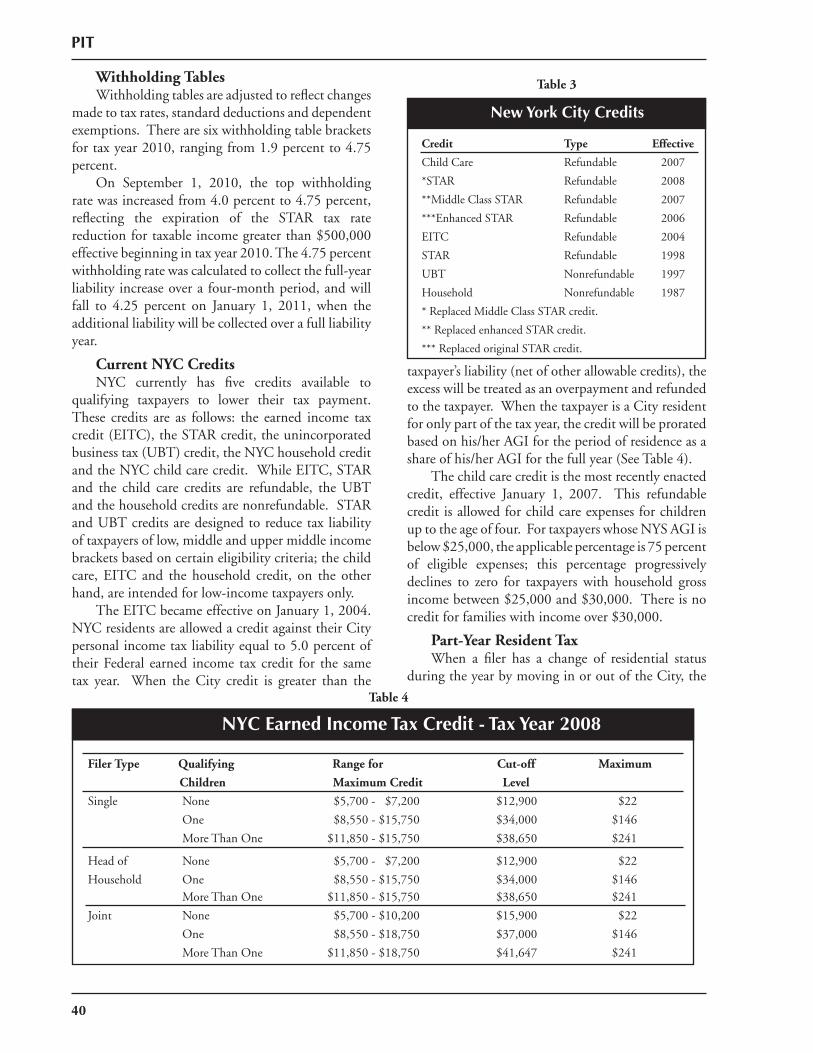
PIT
New York City Credits
Table 3
Credit Type Effective
Child Care Refundable 2007
*STAR Refundable 2008
**Middle Class STAR Refundable 2007
***Enhanced STAR Refundable 2006
EITC Refundable 2004
STAR Refundable 1998
UBT Nonrefundable 1997
Household Nonrefundable 1987
* Replaced Middle Class STAR credit.
** Replaced enhanced STAR credit.
*** Replaced original STAR credit.
40
Withholding TablesWithholding tables are adjusted to refl ect changes
made to tax rates, standard deductions and dependent exemptions. There are six withholding table brackets for tax year 2010, ranging from 1.9 percent to 4.75 percent.
On September 1, 2010, the top withholding rate was increased from 4.0 percent to 4.75 percent, refl ecting the expiration of the STAR tax rate reduction for taxable income greater than $500,000 effective beginning in tax year 2010. The 4.75 percent withholding rate was calculated to collect the full-year liability increase over a four-month period, and will fall to 4.25 percent on January 1, 2011, when the additional liability will be collected over a full liability year.
Current NYC CreditsNYC currently has fi ve credits available to
qualifying taxpayers to lower their tax payment. These credits are as follows: the earned income tax credit (EITC), the STAR credit, the unincorporated business tax (UBT) credit, the NYC household credit and the NYC child care credit. While EITC, STAR and the child care credits are refundable, the UBT and the household credits are nonrefundable. STAR and UBT credits are designed to reduce tax liability of taxpayers of low, middle and upper middle income brackets based on certain eligibility criteria; the child care, EITC and the household credit, on the other hand, are intended for low-income taxpayers only.
The EITC became effective on January 1, 2004. NYC residents are allowed a credit against their City personal income tax liability equal to 5.0 percent of their Federal earned income tax credit for the same tax year. When the City credit is greater than the
taxpayer’s liability (net of other allowable credits), the excess will be treated as an overpayment and refunded to the taxpayer. When the taxpayer is a City resident for only part of the tax year, the credit will be prorated based on his/her AGI for the period of residence as a share of his/her AGI for the full year (See Table 4).
The child care credit is the most recently enacted credit, effective January 1, 2007. This refundable credit is allowed for child care expenses for children up to the age of four. For taxpayers whose NYS AGI is below $25,000, the applicable percentage is 75 percent of eligible expenses; this percentage progressively declines to zero for taxpayers with household gross income between $25,000 and $30,000. There is no credit for families with income over $30,000.
Part-Year Resident TaxWhen a fi ler has a change of residential status
during the year by moving in or out of the City, the
Filer Type Qualifying Range for Cut-off Maximum
Children Maximum Credit Level
Single None $5,700 - $7,200 $12,900 $22
One $8,550 - $15,750 $34,000 $146
More Than One $11,850 - $15,750 $38,650 $241
Head of None $5,700 - $7,200 $12,900 $22
Household One $8,550 - $15,750 $34,000 $146 More Than One $11,850 - $15,750 $38,650 $241
Joint None $5,700 - $10,200 $15,900 $22
One $8,550 - $18,750 $37,000 $146
More Than One $11,850 - $18,750 $41,647 $241
Table 4
Taxing Authority NYC Earned Income Tax Credit - Tax Year 2008
PIT
fi ler is considered a part-year resident for the year. The tax is based on his/her NYS AGI for his/her period of residence, computed as if the year for federal income tax purposes were limited to the period of residence. NYC deductions, exemptions and credits are prorated for part-year residents based on the period of residence in the city.
Nonresident Tax From 1966 through 1970, a nonresident
earnings tax was levied at 0.25 percent on wages and 0.375 percent on net earnings from self-employment. Nonresidents were taxed only on their NYC source income. From 1971 through July 1, 1999 the tax rates were increased to 0.45 percent on wages and 0.65 percent on net earnings from self-employment. Retroactive to January 1, 1999, the City’s nonresident earnings tax was repealed. (See Appendix II:PIT, Legislative History, 1999).
AdministrationThe NYC personal income tax has been
administered by NYS since 1966. The NYS Department of Taxation and Finance are responsible for tax collections. Within that department, the Offi ce of Tax Policy Analysis generates and provides the City with the daily collections, refund reports and other reports. At the end of each month, the City receives a letter from the State Comptroller verifying the fi nal amount of personal income tax revenue by components due to the City for that month.
Prepayment RulesNYC withholding collections are administered
by NYS. Employers with withholding of $15,000 or more in the preceding calendar year are required to fi le withholding with the State within three business days following the payroll that caused the total accumulated tax withheld to equal or exceed $700. For those withholding less than $15,000 during such a period as well as for higher educational institutions and health care providers, the due date is within fi ve business days.
Installment taxpayers can fi le either on a calendar year basis or on a fi scal year basis. For both types of fi lers, the payments are due on the fi fteenth day of the fourth, sixth, and ninth months of their calendar or fi scal year, and on the fi rst month of the following calendar or fi scal year.
A fi ler is not required to make an estimated payment when the taxpayer’s withholding payments are (a) 90 percent or greater of the total tax due for the year, (b) 100 percent or greater of the total tax
liability from the prior year, (c) 110 percent of the taxpayer’s prior year liability when the taxpayer’s NYS AGI exceeds $150,000, or (d) the taxpayer expects to owe less than $300 after credits.
ChargesEach month the State charges the City for the
administration of the personal income tax. The charge is based on State expenditures for data entry, processing of tax returns and taxpayer services, which can be attributed to the City. For fi scal year 2010 the City paid $80 million in administrative charges.
Final ReturnsDue to the implementation of the eMIPRE
processing system for processing year 2009 (tax year 2008) and thereafter, all fi nal return payments will now be allocated as received based on the taxpayers’ zip code. This will improve the accuracy of distributing fi nal returns between NYC and NYS, and reduce the amount of offset payments needed to correctly distribute liability. For tax years prior to 2008, fi nal tax payments on returns were initially distributed to the City based on a percentage of the State pool of fi nal returns. The distribution percentage was based on the City’s historical share of total statewide fi nal returns. Adjustments were made for prior distributions, changes to State and City tax laws and the relative rates of economic growth.
State/ City Offsets Beginning in tax year 2008 (processing year
2009), NYS implemented the eMPIRE processing system, which more accurately allocates City and State liability throughout the processing year. With the implementation of the eMPIRE processing system, the size of the State/City offsets are expected to be signifi cantly reduced, particularly when fi nal returns are processed. Final returns will be more accurately distributed as received under eMPIRE processing, which will minimize imbalances in liability between NYC and NYS. This in turn will reduce State/City offset corrections.
41

42
STX
43
SALES TAX
Table of Contents
Overview ...................................................................................................................................45
Forecasting Methodology ...........................................................................................................45
Sales Tax Components ...............................................................................................................46
Tax Detail ..................................................................................................................................47
Legislative History ...............................................................................See Appendix III: Sales Tax

44
STX
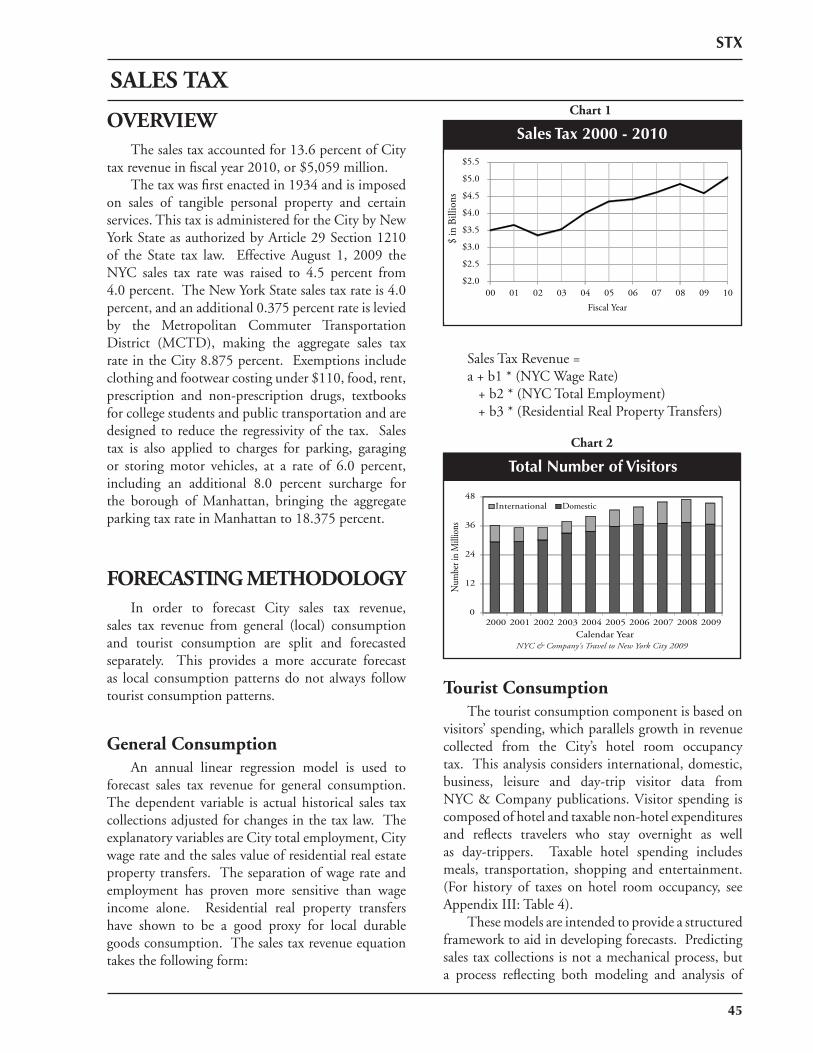
STX
45
Sales Tax Revenue = a + b1 * (NYC Wage Rate) + b2 * (NYC Total Employment) + b3 * (Residential Real Property Transfers)
Tourist Consumption The tourist consumption component is based on visitors’ spending, which parallels growth in revenue collected from the City’s hotel room occupancy tax. This analysis considers international, domestic, business, leisure and day-trip visitor data from NYC & Company publications. Visitor spending is composed of hotel and taxable non-hotel expenditures and refl ects travelers who stay overnight as well as day-trippers. Taxable hotel spending includes meals, transportation, shopping and entertainment. (For history of taxes on hotel room occupancy, see Appendix III: Table 4). These models are intended to provide a structured framework to aid in developing forecasts. Predicting sales tax collections is not a mechanical process, but a process refl ecting both modeling and analysis of
OVERVIEW The sales tax accounted for 13.6 percent of City tax revenue in fi scal year 2010, or $5,059 million. The tax was fi rst enacted in 1934 and is imposed on sales of tangible personal property and certain services. This tax is administered for the City by New York State as authorized by Article 29 Section 1210 of the State tax law. Effective August 1, 2009 the NYC sales tax rate was raised to 4.5 percent from 4.0 percent. The New York State sales tax rate is 4.0 percent, and an additional 0.375 percent rate is levied by the Metropolitan Commuter Transportation District (MCTD), making the aggregate sales tax rate in the City 8.875 percent. Exemptions include clothing and footwear costing under $110, food, rent, prescription and non-prescription drugs, textbooks for college students and public transportation and are designed to reduce the regressivity of the tax. Sales tax is also applied to charges for parking, garaging or storing motor vehicles, at a rate of 6.0 percent, including an additional 8.0 percent surcharge for the borough of Manhattan, bringing the aggregate parking tax rate in Manhattan to 18.375 percent.
FORECASTING METHODOLOGY In order to forecast City sales tax revenue, sales tax revenue from general (local) consumption and tourist consumption are split and forecasted separately. This provides a more accurate forecast as local consumption patterns do not always follow tourist consumption patterns.
General Consumption An annual linear regression model is used to forecast sales tax revenue for general consumption. The dependent variable is actual historical sales tax collections adjusted for changes in the tax law. The explanatory variables are City total employment, City wage rate and the sales value of residential real estate property transfers. The separation of wage rate and employment has proven more sensitive than wage income alone. Residential real property transfers have shown to be a good proxy for local durable goods consumption. The sales tax revenue equation takes the following form:
Chart 1
$2.0
$2.5
$3.0
$3.5
$4.0
$4.5
$5.0
$5.5
00 01 02 03 04 05 06 07 08 09 10
$ in
Bill
ions
Fiscal Year
Sales Tax 2000 - 2010
Chart 2
0
12
24
36
48
2000 2001 2002 2003 2004 2005 2006 2007 2008 2009
Num
ber i
n M
illion
s
Calendar Year
DomesticInternational
NYC & Company's Travel to New York City 2009
Total Number of Visitors
SALES TAX
46
STX
other factors that affect the tax. The local real estate market, general business conditions, total taxable sales data as well as national same store sales data, durable and nondurable goods sales, consumer confi dence and consumer installment debt are signifi cant factors considered in the forecast process.
Cash Flow Model Annual sales tax revenue estimates are broken down into a quarterly and a monthly cash fl ow based on seasonal consumption patterns and historical collection shares. Analysis of collections over an entire quarter has proven more helpful than a monthly analysis. Monthly data does not always refl ect current consumption activity because the majority of vendors who fi le tax returns fi le estimated returns during the fi rst two months of the quarter. Furthermore, for the fi rst two months of the quarter, New York State (who administers the sales tax for all localities) distributes the total statewide pool of sales tax revenue to localities based on the share of the statewide sales tax pool the locality received for that same quarter in the prior year. Vendors, when making the fi nal payment in the third month of a sales tax quarter, reconcile their estimated payments with actual liability and pay accordingly. This often results in large swings in payments received in the third month of the quarter. These swings are made more severe as NYS corrects for distribution errors made in the fi rst two months in the third month of each quarter and other errors made in previous quarters
GASB The City’s cash fl ow forecast for the sales tax presents sales tax revenue on a modifi ed accrual recognition basis as required by GASB (Government Accounting Standards Board) Statement No. 22. For example, sales tax collections released to the City on September 4th and September 12th are counted as August revenue (see Appendix III: Table 1). For budgetary (General Fund) purposes, such revenues are considered available when collected within sixty days after fi scal year end. Beginning in 2001, these revenues are also recognized on a full accrual basis in the government-wide statement of activities, as required by GASB Statement No. 33.
SALES TAX COMPONENTS
NYC Gross The NYC gross collections component comprises about 95 percent of sales tax collections and refl ects both general consumption and tourist consumption.
Prior Period Adjustments (PPAs) The State, which administers the NYC sales tax, is not always in possession of complete quarterly information at the end of each quarter from all reporting vendors. As this information becomes available, it becomes necessary to adjust the original distribution of revenue among localities through PPAs. PPAs may be positive or negative, depending on whether the previous distribution is determined to be too large or too small. PPAs can also result from late payments. PPAs are reported the last month of the quarter.
Assessments Assessments include collections from audit activity. They are disaggregated into City audits and State assessments less City audits. The forecast for State assessments is based on the expected rate of growth for the NYC gross component.
Late File Payments The State, which administers the NYC sales tax, is not always in possession of timely fi led returns at the end of each quarter (September, December, March and June otherwise known as “peak months”) from reporting vendors. When the State receives these returns with a payment attached, the cash is accounted for in the following non-peak month and is considered a late fi le payment. Further, when a vendor amends their tax return from a prior a quarter and submits a payment the received money is considered a late fi le payment. Late fi le payments are received by the City the fi rst two months of the quarter.
Administrative Charges The State charges localities for administering and collecting the sales tax. The charge to each locality is based on the proportion of the locality’s collections to the total pool. The formula is:
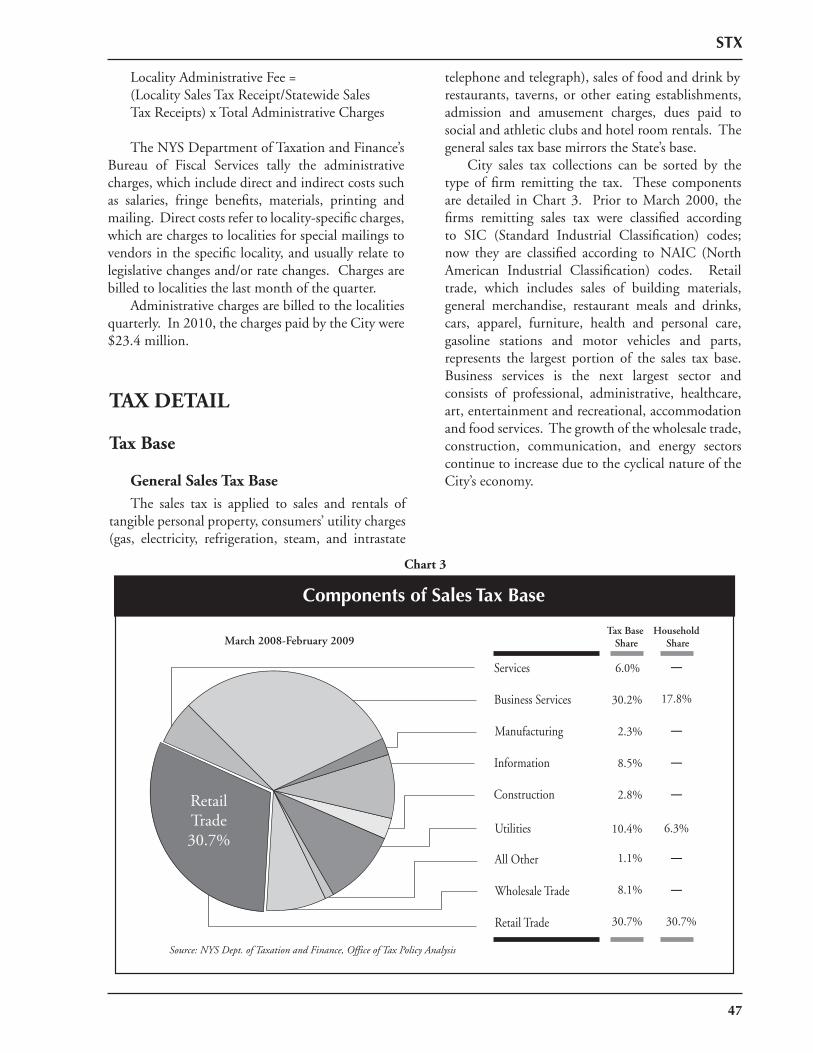
47
STX
Locality Administrative Fee = (Locality Sales Tax Receipt/Statewide Sales Tax Receipts) x Total Administrative Charges
The NYS Department of Taxation and Finance’s Bureau of Fiscal Services tally the administrative charges, which include direct and indirect costs such as salaries, fringe benefi ts, materials, printing and mailing. Direct costs refer to locality-specifi c charges, which are charges to localities for special mailings to vendors in the specifi c locality, and usually relate to legislative changes and/or rate changes. Charges are billed to localities the last month of the quarter. Administrative charges are billed to the localities quarterly. In 2010, the charges paid by the City were $23.4 million.
TAX DETAIL
Tax Base
General Sales Tax Base The sales tax is applied to sales and rentals of tangible personal property, consumers’ utility charges (gas, electricity, refrigeration, steam, and intrastate
telephone and telegraph), sales of food and drink by restaurants, taverns, or other eating establishments, admission and amusement charges, dues paid to social and athletic clubs and hotel room rentals. The general sales tax base mirrors the State’s base. City sales tax collections can be sorted by the type of fi rm remitting the tax. These components are detailed in Chart 3. Prior to March 2000, the fi rms remitting sales tax were classifi ed according to SIC (Standard Industrial Classifi cation) codes; now they are classifi ed according to NAIC (North American Industrial Classifi cation) codes. Retail trade, which includes sales of building materials, general merchandise, restaurant meals and drinks, cars, apparel, furniture, health and personal care, gasoline stations and motor vehicles and parts, represents the largest portion of the sales tax base. Business services is the next largest sector and consists of professional, administrative, healthcare, art, entertainment and recreational, accommodation and food services. The growth of the wholesale trade, construction, communication, and energy sectors continue to increase due to the cyclical nature of the City’s economy.
8.1%
All Other
March 2008-February 2009
Services
Business Services
Manufacturing
Information
Construction
Utilities
Wholesale Trade
6.0%
30.2%
2.3%
8.5%
2.8%
10.4%
1.1%
Source: NYS Dept. of Taxation and Finance, Office of Tax Policy Analysis
Tax Base Share
17.8%
6.3%
—
—
—
—
—
—
Household Share
RetailTrade30.7%
30.7%Retail Trade 30.7%
Components of Sales Tax Base
Chart 3
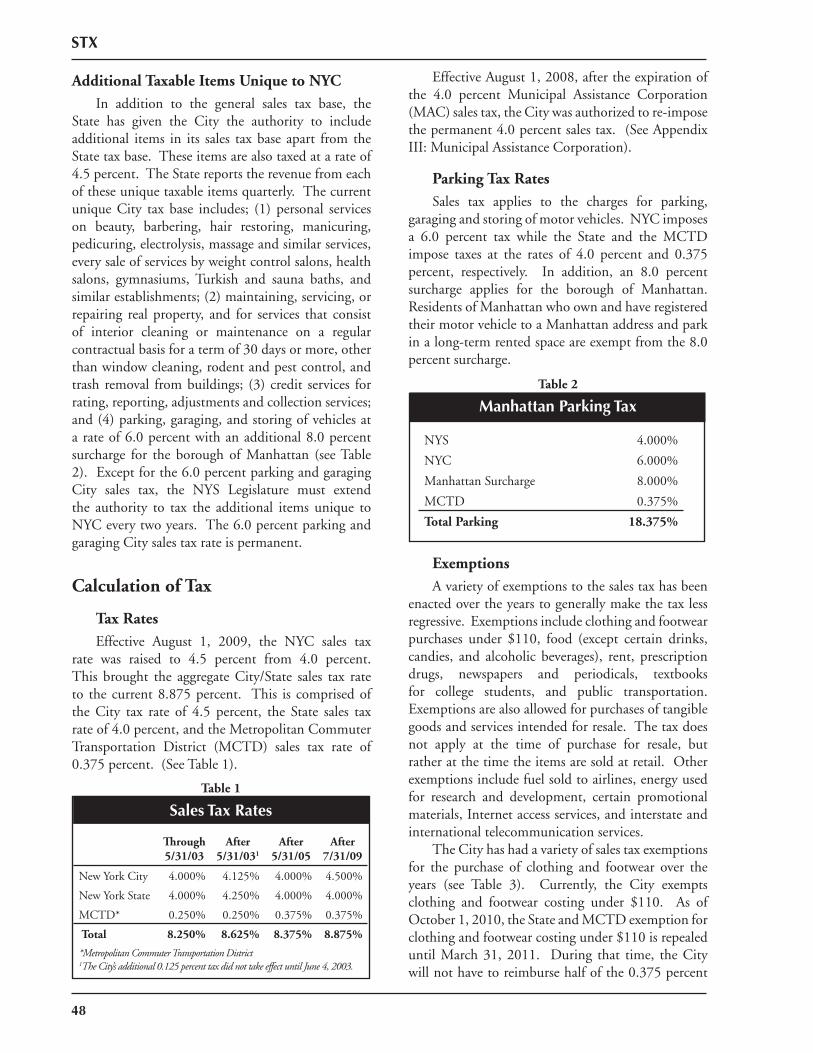
48
STX
Effective August 1, 2008, after the expiration of the 4.0 percent Municipal Assistance Corporation (MAC) sales tax, the City was authorized to re-impose the permanent 4.0 percent sales tax. (See Appendix III: Municipal Assistance Corporation).
Parking Tax Rates Sales tax applies to the charges for parking, garaging and storing of motor vehicles. NYC imposes a 6.0 percent tax while the State and the MCTD impose taxes at the rates of 4.0 percent and 0.375 percent, respectively. In addition, an 8.0 percent surcharge applies for the borough of Manhattan. Residents of Manhattan who own and have registered their motor vehicle to a Manhattan address and park in a long-term rented space are exempt from the 8.0 percent surcharge.
Exemptions A variety of exemptions to the sales tax has been enacted over the years to generally make the tax less regressive. Exemptions include clothing and footwear purchases under $110, food (except certain drinks, candies, and alcoholic beverages), rent, prescription drugs, newspapers and periodicals, textbooks for college students, and public transportation. Exemptions are also allowed for purchases of tangible goods and services intended for resale. The tax does not apply at the time of purchase for resale, but rather at the time the items are sold at retail. Other exemptions include fuel sold to airlines, energy used for research and development, certain promotional materials, Internet access services, and interstate and international telecommunication services. The City has had a variety of sales tax exemptions for the purchase of clothing and footwear over the years (see Table 3). Currently, the City exempts clothing and footwear costing under $110. As of October 1, 2010, the State and MCTD exemption for clothing and footwear costing under $110 is repealed until March 31, 2011. During that time, the City will not have to reimburse half of the 0.375 percent
Additional Taxable Items Unique to NYC In addition to the general sales tax base, the State has given the City the authority to include additional items in its sales tax base apart from the State tax base. These items are also taxed at a rate of 4.5 percent. The State reports the revenue from each of these unique taxable items quarterly. The current unique City tax base includes; (1) personal services on beauty, barbering, hair restoring, manicuring, pedicuring, electrolysis, massage and similar services, every sale of services by weight control salons, health salons, gymnasiums, Turkish and sauna baths, and similar establishments; (2) maintaining, servicing, or repairing real property, and for services that consist of interior cleaning or maintenance on a regular contractual basis for a term of 30 days or more, other than window cleaning, rodent and pest control, and trash removal from buildings; (3) credit services for rating, reporting, adjustments and collection services; and (4) parking, garaging, and storing of vehicles at a rate of 6.0 percent with an additional 8.0 percent surcharge for the borough of Manhattan (see Table 2). Except for the 6.0 percent parking and garaging City sales tax, the NYS Legislature must extend the authority to tax the additional items unique to NYC every two years. The 6.0 percent parking and garaging City sales tax rate is permanent.
Calculation of Tax
Tax Rates Effective August 1, 2009, the NYC sales tax rate was raised to 4.5 percent from 4.0 percent. This brought the aggregate City/State sales tax rate to the current 8.875 percent. This is comprised of the City tax rate of 4.5 percent, the State sales tax rate of 4.0 percent, and the Metropolitan Commuter Transportation District (MCTD) sales tax rate of 0.375 percent. (See Table 1).
Sales Tax RatesTable 1
Th rough5/31/03
After5/31/031
After5/31/05
After7/31/09
New York City 4.000% 4.125% 4.000% 4.500%
New York State 4.000% 4.250% 4.000% 4.000%
MCTD* 0.250% 0.250% 0.375% 0.375%
Total 8.250% 8.625% 8.375% 8.875%
*Metropolitan Commuter Transportation District1The City’s additional 0.125 percent tax did not take effect until June 4, 2003.
Table 2
Manhattan Parking Tax
NYS 4.000%
NYC 6.000%
Manhattan Surcharge 8.000%
MCTD 0.375%
Total Parking 18.375%
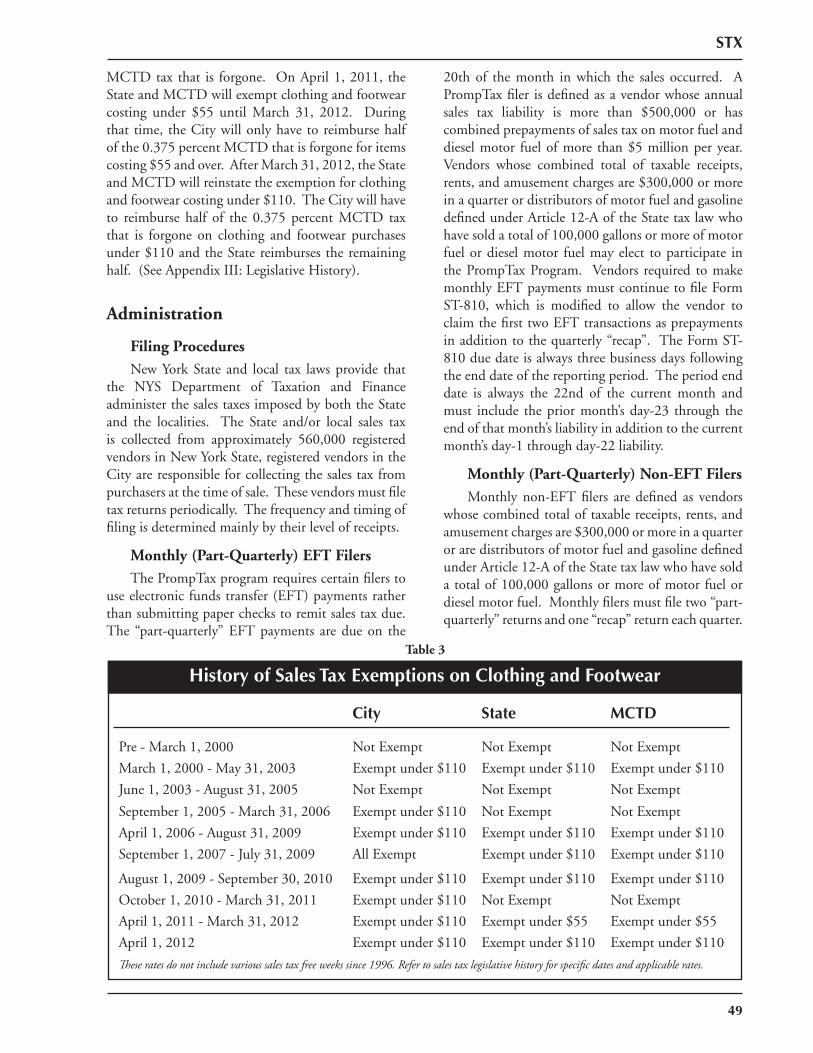
49
STX
MCTD tax that is forgone. On April 1, 2011, the State and MCTD will exempt clothing and footwear costing under $55 until March 31, 2012. During that time, the City will only have to reimburse half of the 0.375 percent MCTD that is forgone for items costing $55 and over. After March 31, 2012, the State and MCTD will reinstate the exemption for clothing and footwear costing under $110. The City will have to reimburse half of the 0.375 percent MCTD tax that is forgone on clothing and footwear purchases under $110 and the State reimburses the remaining half. (See Appendix III: Legislative History).
Administration
Filing Procedures New York State and local tax laws provide that the NYS Department of Taxation and Finance administer the sales taxes imposed by both the State and the localities. The State and/or local sales tax is collected from approximately 560,000 registered vendors in New York State, registered vendors in the City are responsible for collecting the sales tax from purchasers at the time of sale. These vendors must fi le tax returns periodically. The frequency and timing of fi ling is determined mainly by their level of receipts.
Monthly (Part-Quarterly) EFT Filers The PrompTax program requires certain fi lers to use electronic funds transfer (EFT) payments rather than submitting paper checks to remit sales tax due. The “part-quarterly” EFT payments are due on the
20th of the month in which the sales occurred. A PrompTax fi ler is defi ned as a vendor whose annual sales tax liability is more than $500,000 or has combined prepayments of sales tax on motor fuel and diesel motor fuel of more than $5 million per year. Vendors whose combined total of taxable receipts, rents, and amusement charges are $300,000 or more in a quarter or distributors of motor fuel and gasoline defi ned under Article 12-A of the State tax law who have sold a total of 100,000 gallons or more of motor fuel or diesel motor fuel may elect to participate in the PrompTax Program. Vendors required to make monthly EFT payments must continue to fi le Form ST-810, which is modifi ed to allow the vendor to claim the fi rst two EFT transactions as prepayments in addition to the quarterly “recap”. The Form ST-810 due date is always three business days following the end date of the reporting period. The period end date is always the 22nd of the current month and must include the prior month’s day-23 through the end of that month’s liability in addition to the current month’s day-1 through day-22 liability.
Monthly (Part-Quarterly) Non-EFT Filers Monthly non-EFT fi lers are defi ned as vendors whose combined total of taxable receipts, rents, and amusement charges are $300,000 or more in a quarter or are distributors of motor fuel and gasoline defi ned under Article 12-A of the State tax law who have sold a total of 100,000 gallons or more of motor fuel or diesel motor fuel. Monthly fi lers must fi le two “part-quarterly” returns and one “recap” return each quarter.
Table 3
History of Sales Tax Exemptions on Clothing and Footwear
City State MCTD
Pre - March 1, 2000 Not Exempt Not Exempt Not Exempt
March 1, 2000 - May 31, 2003 Exempt under $110 Exempt under $110 Exempt under $110
June 1, 2003 - August 31, 2005 Not Exempt Not Exempt Not Exempt
September 1, 2005 - March 31, 2006 Exempt under $110 Not Exempt Not Exempt
April 1, 2006 - August 31, 2009 Exempt under $110 Exempt under $110 Exempt under $110
September 1, 2007 - July 31, 2009 All Exempt Exempt under $110 Exempt under $110
August 1, 2009 - September 30, 2010 Exempt under $110 Exempt under $110 Exempt under $110
October 1, 2010 - March 31, 2011 Exempt under $110 Not Exempt Not Exempt
April 1, 2011 - March 31, 2012 Exempt under $110 Exempt under $55 Exempt under $55April 1, 2012 Exempt under $110 Exempt under $110 Exempt under $110Th ese rates do not include various sales tax free weeks since 1996. Refer to sales tax legislative history for specifi c dates and applicable rates.
50
STX
The “part-quarterly” return, the New York State and Local Sales and Use Tax Return for Part-Quarterly Filers (Form ST-809), can be based on actual sales data, or may be a “short-form” return in which the tax remitted is one-third of the total State and local taxes paid in the comparable quarter of the preceding year, provided that the vendor has been in business for at least one year. The “recap” return, the New York State and Local Sales and Use Tax Return Quarterly for Part-Quarterly Filers (Form ST-810), is fi led after the last month of each quarter. Form ST-810 reports actual sales and services by each locality for the entire quarter. The amount of sales tax receipts remitted to the State at this time is calculated by subtracting the amounts paid in the “part-quarterly” months from the amount indicated as due for the quarter in the “recap” report. These vendors fi le by the 20th of each “part-quarterly” month for collections from the previous month and by the 22nd of the “recap” month.
Quarterly Filers Quarterly sales tax fi lers are vendors who have not been notifi ed that they are an annual fi ler and their taxable receipts were less than $300,000 during the previous quarter. Most vendors fi le quarterly when they fi rst register to collect sales tax. Quarterly fi lers must fi le the New York State and Local Quarterly Sales and Use Tax Return (Form ST-100). The period end date is always the 22nd day of the current quarter and must include the prior quarter’s day-23 through the end of that quarter’s liability in addition to the current quarter’s day-1 through day-22 liability
Annual Filers Annual sales tax fi lers are vendors who collect less than $3,000 in sales tax for the twelve-month period beginning March 1 and ending the last day in February. They must fi le the New York State and Local Annual Sales and Use Tax Return (Form ST-101) by March 20th.(See Appendix III: Sales Tax, for sales tax return fi ling dates for the respective activity periods, and the dates on which collections are distributed to the City by the State.)
Sales Tax Distribution Because a large percentage of monthly sales tax collections for the “part-quarterly” months are comprised of estimated payments paid on “short-form” returns where sales are not broken down by
locality, the State estimates the local share for monthly distribution purposes. Revenue is distributed based on the percentage that each locality had of the total sales tax pool in the comparable quarter of the preceding year (the comparable quarter, rather than the comparable month, is used because the quarter has “recap” information about sales by locality). The distribution for the “recap” month in each quarter is based on actual sales and service information by locality, from both monthly and quarterly fi lers. This distribution is determined by subtracting the previous estimated distributions of the fi rst two months of the quarter from the quarter totals reported in the “recap” reports. In order to expedite the monthly distribution of revenue, the State Comptroller makes two distributions to localities. The fi rst distribution or “early draw” is generally made on the 4th (or next business day) of each month and the second distribution or “fi nal draw” is made on the 12th (or next business day) of each month. The “early draw” is comprised of approximately 75 percent of estimated or actual liability fi led by vendors due on the 20th of each month. Also distributed on the 4th (or next business day) is 100 percent of EFT liability due from large vendors on the 25th (or the third business day following the 22nd day) of each month. The “fi nal draw” is made up of the remaining 25 percent of actual or estimated liability. (See Appendix III: Sales Tax Table 1 for an example of a typical monthly distribution). The months of June and December are, however, exceptions to this pattern. The State makes three distributions of collections due to localities in these months, as some localities are on a cash accounting basis and have fi scal years ending on June 30th or December 31st. The State sales tax law requires that the State make estimated distributions of the fi rst 25 days of sales tax collections, prior to the fi rst day of January and July, for sales tax revenue collected by the State during these months (December and June). This ensures that the bulk of current year cash collections are received by each locality in their current fi scal year. As a result, in December and June distributions on the 29th replace the distributions which otherwise would have been made on the 4th of the following month.
GENERAL CORPORATION TAX
Table of Contents
Overview ...................................................................................................................................53
Forecasting Methodology ...........................................................................................................53
Tax Detail ..................................................................................................................................55
Legislative History .................................................................................... See Appendix IV: GCT
51
GCT

52
General Corporation Tax 1998 - 2008
GCT
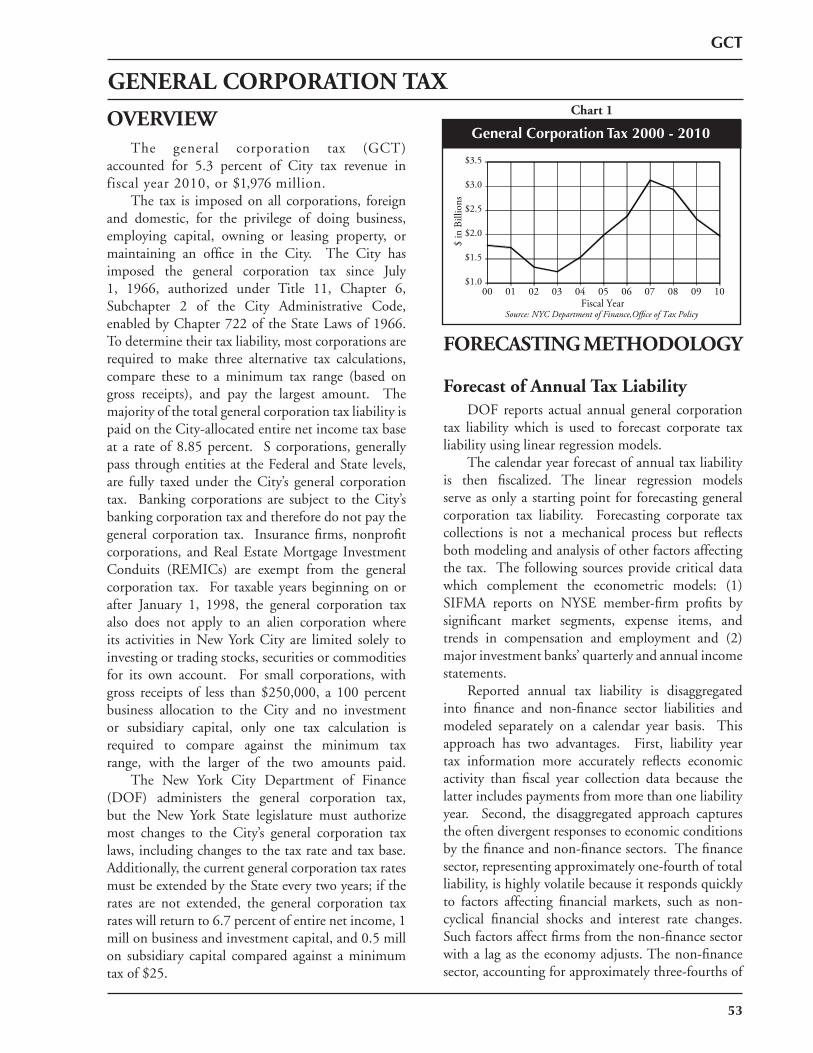
53
FORECASTING METHODOLOGY
Forecast of Annual Tax LiabilityDOF reports actual annual general corporation
tax liability which is used to forecast corporate taxliabilityusinglinearregressionmodels.
Thecalendaryearforecastofannualtaxliabilityis then fiscalized. The linear regression modelsserveasonlyastartingpoint for forecastinggeneralcorporation tax liability. Forecasting corporate taxcollections is not a mechanical process but reflectsbothmodelingandanalysisofotherfactorsaffectingthe tax. The followingsourcesprovidecriticaldatawhich complement the econometric models: (1)SIFMA reports on NYSE member-firm profits bysignificant market segments, expense items, andtrends in compensation and employment and (2)majorinvestmentbanks’quarterlyandannualincomestatements.
Reported annual tax liability is disaggregatedinto finance and non-finance sector liabilities andmodeled separately on a calendar year basis. Thisapproach has two advantages. First, liability yeartax information more accurately reflects economicactivity than fiscal year collection data because thelatterincludespaymentsfrommorethanoneliabilityyear. Second, the disaggregated approach capturestheoftendivergentresponsestoeconomicconditionsbythefinanceandnon-financesectors.Thefinancesector,representingapproximatelyone-fourthoftotalliability,ishighlyvolatilebecauseitrespondsquicklyto factors affecting financial markets, such as non-cyclical financial shocks and interest rate changes.Suchfactorsaffectfirmsfromthenon-financesectorwitha lagastheeconomyadjusts.Thenon-financesector,accountingforapproximatelythree-fourthsof
OVERVIEWThe general corporation tax (GCT)
accounted for 5.3 percent of City tax revenue infiscalyear2010,or$1,976million. The tax is imposedonall corporations, foreignand domestic, for the privilege of doing business,employing capital, owning or leasing property, ormaintaining an office in the City. The City hasimposed the general corporation tax since July1, 1966, authorized under Title 11, Chapter 6,Subchapter 2 of the City Administrative Code,enabledbyChapter722oftheStateLawsof1966.Todeterminetheirtaxliability,mostcorporationsarerequired to make three alternative tax calculations,compare these to a minimum tax range (based ongross receipts), and pay the largest amount. ThemajorityofthetotalgeneralcorporationtaxliabilityispaidontheCity-allocatedentirenetincometaxbaseat a rateof8.85percent. S corporations, generallypassthroughentitiesattheFederalandState levels,are fully taxed under the City’s general corporationtax. Banking corporations are subject to the City’sbankingcorporationtaxandthereforedonotpaythegeneral corporation tax. Insurancefirms,nonprofitcorporations, and Real Estate Mortgage InvestmentConduits (REMICs) are exempt from the generalcorporation tax. For taxable yearsbeginningonorafter January 1, 1998, the general corporation taxalso does not apply to an alien corporation whereits activities inNewYorkCity are limited solely toinvestingortradingstocks,securitiesorcommoditiesfor its own account. For small corporations, withgross receipts of less than $250,000, a 100 percentbusiness allocation to the City and no investmentor subsidiary capital, only one tax calculation isrequired to compare against the minimum taxrange, with the larger of the two amounts paid. The New York City Department of Finance(DOF) administers the general corporation tax,but the New York State legislature must authorizemost changes to the City’s general corporation taxlaws,includingchangestothetaxrateandtaxbase.Additionally,thecurrentgeneralcorporationtaxratesmustbeextendedbytheStateeverytwoyears;iftherates are not extended, the general corporation taxrateswillreturnto6.7percentofentirenetincome,1millonbusinessandinvestmentcapital,and0.5millon subsidiary capital compared against aminimumtaxof$25.
Chart 1
General Corporation Tax 2000 - 2010
$1.0
$1.5
$2.0
$2.5
$3.0
$3.5
00 01 02 03 04 05 06 07 08 09 10
$ in
Bill
ions
Fiscal YearSource: NYC Department of Finance,Oce of Tax Policy
GCT
GENERAL CORPORATION TAX
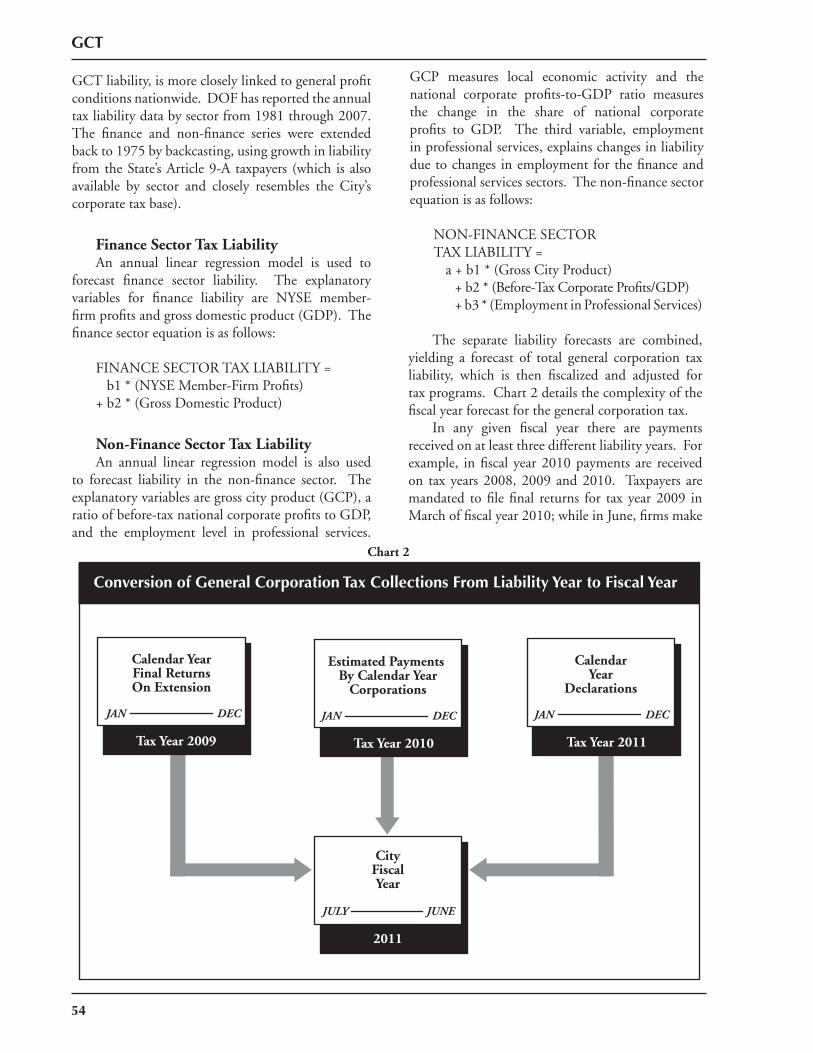
54
GCT
GCTliability,ismorecloselylinkedtogeneralprofitconditionsnationwide.DOFhasreportedtheannualtaxliabilitydatabysectorfrom1981through2007.The finance and non-finance series were extendedbackto1975bybackcasting,usinggrowthinliabilityfromtheState’sArticle9-Ataxpayers (which isalsoavailable by sector and closely resembles the City’scorporatetaxbase).
Finance Sector Tax Liability An annual linear regression model is used to
forecast finance sector liability. The explanatoryvariables for finance liability are NYSE member-firmprofitsandgrossdomesticproduct(GDP).Thefinancesectorequationisasfollows:
FINANCESECTORTAXLIABILITY=b1*(NYSEMember-FirmProfits)+b2*(GrossDomesticProduct)
Non-Finance Sector Tax Liability An annual linear regression model is also used
to forecast liability in the non-finance sector. Theexplanatoryvariablesaregrosscityproduct(GCP),aratioofbefore-taxnationalcorporateprofitstoGDP,and the employment level in professional services.
GCP measures local economic activity and thenational corporate profits-to-GDP ratio measuresthe change in the share of national corporateprofits to GDP. The third variable, employmentinprofessionalservices,explainschangesinliabilityduetochanges inemploymentforthefinanceandprofessionalservicessectors.Thenon-financesectorequationisasfollows:
NON-FINANCESECTORTAXLIABILITY= a+b1*(GrossCityProduct) +b2*(Before-TaxCorporateProfits/GDP) +b3*(EmploymentinProfessionalServices)
The separate liability forecasts are combined,yielding a forecast of total general corporation taxliability, which is then fiscalized and adjusted fortaxprograms.Chart2detailsthecomplexityofthefiscalyearforecastforthegeneralcorporationtax.
In any given fiscal year there are paymentsreceivedonatleastthreedifferentliabilityyears.Forexample, infiscal year2010payments are receivedon taxyears2008,2009and2010. Taxpayers aremandated tofilefinal returns for tax year2009 inMarchoffiscalyear2010;whileinJune,firmsmake
Chart 2
Conversion of General Corporation Tax Collections From Liability Year to Fiscal Year
CityFiscalYear
JULY JUNE
Calendar YearFinal ReturnsOn Extension
JAN DEC
Tax Year 2009
Estimated Payments By Calendar Year
Corporations
JAN DEC
Tax Year 2010
CalendarYear
Declarations
JAN DEC
Tax Year 2011
2011
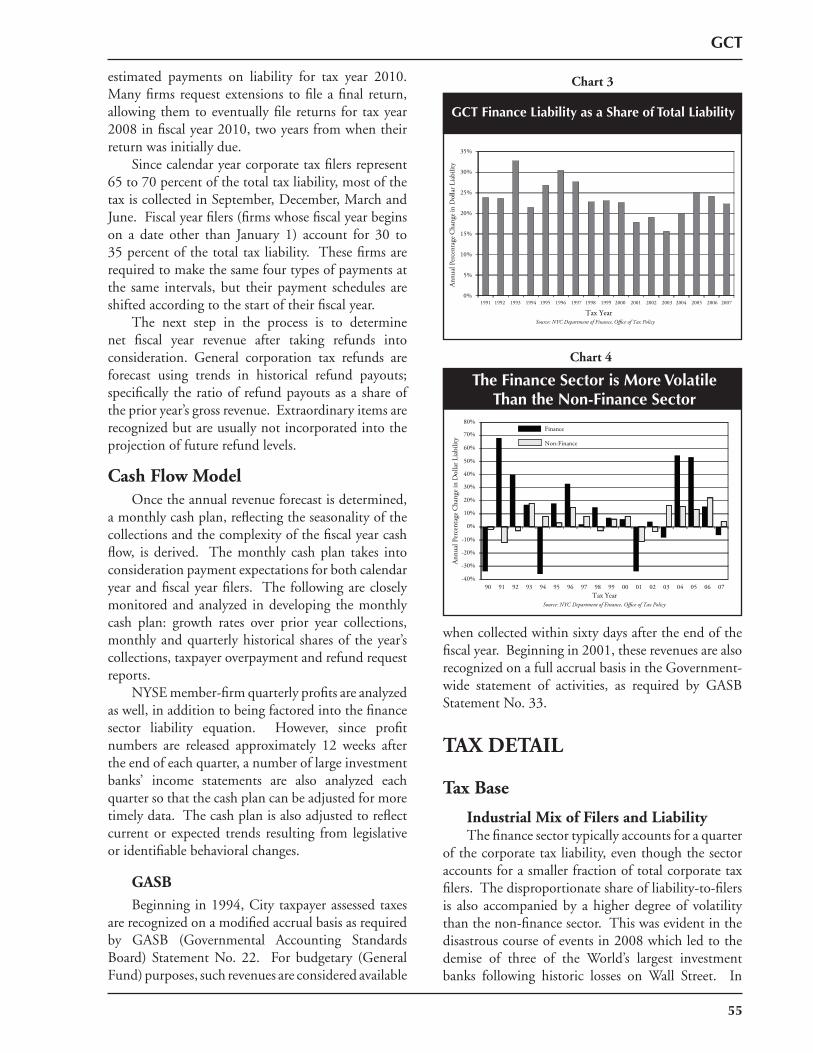
55
GCT
whencollectedwithinsixtydaysaftertheendofthefiscalyear.Beginningin2001,theserevenuesarealsorecognizedonafullaccrualbasisintheGovernment-wide statement of activities, as required by GASBStatementNo.33.
TAX DETAIL
Tax Base
Industrial Mix of Filers and LiabilityThefinancesectortypicallyaccountsforaquarter
ofthecorporatetaxliability,eventhoughthesectoraccountsforasmallerfractionoftotalcorporatetaxfilers.Thedisproportionateshareofliability-to-filersis also accompaniedby ahigherdegreeof volatilitythanthenon-financesector.Thiswasevidentinthedisastrouscourseofeventsin2008whichledtothedemise of three of the World’s largest investmentbanks following historic losses on Wall Street. In
estimated payments on liability for tax year 2010.Manyfirmsrequestextensions tofileafinal return,allowing themtoeventuallyfile returns for taxyear2008infiscalyear2010,twoyearsfromwhentheirreturnwasinitiallydue.
Sincecalendaryearcorporatetaxfilersrepresent65to70percentofthetotaltaxliability,mostofthetaxiscollectedinSeptember,December,MarchandJune.Fiscalyearfilers(firmswhosefiscalyearbeginson a date other than January 1) account for 30 to35percentofthetotaltaxliability. Thesefirmsarerequiredtomakethesamefourtypesofpaymentsatthe same intervals, but their payment schedules areshiftedaccordingtothestartoftheirfiscalyear.
The next step in the process is to determinenet fiscal year revenue after taking refunds intoconsideration. General corporation tax refunds areforecast using trends in historical refund payouts;specifically the ratioof refundpayoutsasa shareoftheprioryear’sgrossrevenue.Extraordinaryitemsarerecognizedbutareusuallynotincorporatedintotheprojectionoffuturerefundlevels.
Cash Flow ModelOncetheannualrevenueforecastisdetermined,
amonthlycashplan,reflectingtheseasonalityofthecollectionsandthecomplexityofthefiscalyearcashflow, is derived. Themonthly cashplan takes intoconsiderationpaymentexpectationsforbothcalendaryearandfiscalyearfilers. Thefollowingarecloselymonitoredandanalyzed indeveloping themonthlycash plan: growth rates over prior year collections,monthlyandquarterlyhistorical sharesof theyear’scollections,taxpayeroverpaymentandrefundrequestreports.
NYSEmember-firmquarterlyprofitsareanalyzedaswell,inadditiontobeingfactoredintothefinancesector liability equation. However, since profitnumbers are released approximately 12 weeks aftertheendofeachquarter,anumberoflargeinvestmentbanks’ income statements are also analyzed eachquartersothatthecashplancanbeadjustedformoretimelydata.Thecashplanisalsoadjustedtoreflectcurrentor expected trends resulting from legislativeoridentifiablebehavioralchanges.
GASBBeginning in1994,Citytaxpayerassessedtaxes
arerecognizedonamodifiedaccrualbasisasrequiredby GASB (Governmental Accounting StandardsBoard) Statement No. 22. For budgetary (GeneralFund)purposes,suchrevenuesareconsideredavailable
GCT Finance Liability as a Share of Total Liability
Chart 3
GCT Finance Liability as a Share of Total Liability
The Finance Sector is More VolatileThan the Non-Finance Sector
Chart 4
0%
5%
10%
15%
20%
25%
30%
35%
1991 1992 1993 1994 1995 1996 1997 1998 1999 2000 2001 2002 2003 2004 2005 2006 2007
Tax YearSource: NYC Department of Finance, Oce of Tax Policy
Annu
al P
erce
ntag
e Cha
nge i
n D
olla
r Lia
bilit
y
-40%
-30%
-20%
-10%
0%
10%
20%
30%
40%
50%
60%
70%
80%
90 91 92 93 94 95 96 97 98 99 00 01 02 03 04 05 06 07
Annu
al P
erce
ntag
e Cha
nge i
n D
olla
r Lia
bilit
y
Tax YearSource: NYC Department of Finance, Oce of Tax Policy
Finance
Non-Finance
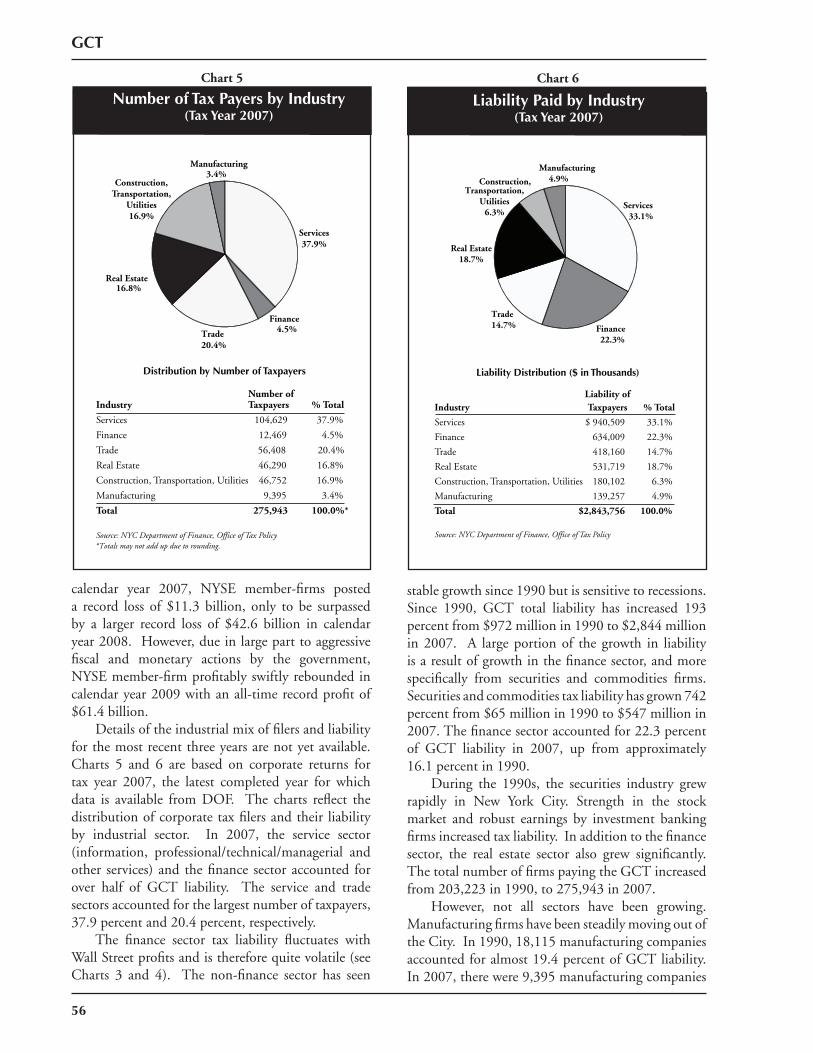
56
Chart 6
Liability Paid by Industry(Tax Year 2007)
Chart 5
Number of Tax Payers by Industry(Tax Year 2007)
Liability ofIndustry Taxpayers % Total
Services $ 940,509 33.1%
Finance 634,009 22.3%
Trade 418,160 14.7%
Real Estate 531,719 18.7%
Construction, Transportation, Utilities 180,102 6.3%
Manufacturing 139,257 4.9%
Total $2,843,756 100.0%
Source: NYC Department of Finance, Office of Tax Policy
Liability Distribution ($ in Thousands)
Manufacturing4.9%
Services33.1%
Finance22.3%
Trade14.7%
Real Estate18.7%
Construction,Transportation,
Utilities6.3%
GCT
stablegrowthsince1990butissensitivetorecessions.Since 1990, GCT total liability has increased 193percentfrom$972millionin1990to$2,844millionin2007. A largeportionof thegrowth in liabilityisaresultofgrowthinthefinancesector,andmorespecifically from securities and commodities firms.Securitiesandcommoditiestaxliabilityhasgrown742percentfrom$65millionin1990to$547millionin2007.Thefinancesectoraccountedfor22.3percentof GCT liability in 2007, up from approximately16.1percentin1990.
During the 1990s, the securities industry grewrapidly in New York City. Strength in the stockmarket and robust earnings by investment bankingfirmsincreasedtaxliability.Inadditiontothefinancesector, the real estate sector also grew significantly.ThetotalnumberoffirmspayingtheGCTincreasedfrom203,223in1990,to275,943in2007.
However, not all sectors have been growing.ManufacturingfirmshavebeensteadilymovingoutoftheCity.In1990,18,115manufacturingcompaniesaccountedforalmost19.4percentofGCTliability.In2007,therewere9,395manufacturingcompanies
calendar year 2007, NYSE member-firms posteda record loss of $11.3 billion, only to be surpassedby a larger record loss of $42.6 billion in calendaryear2008.However,dueinlargeparttoaggressivefiscal and monetary actions by the government,NYSEmember-firmprofitablyswiftlyreboundedincalendaryear2009withanall-timerecordprofitof$61.4billion.
Detailsoftheindustrialmixoffilersandliabilityforthemostrecentthreeyearsarenotyetavailable.Charts 5 and 6 are based on corporate returns fortax year 2007, the latest completed year for whichdata is available from DOF. The charts reflect thedistributionofcorporatetaxfilersandtheir liabilityby industrial sector. In 2007, the service sector(information, professional/technical/managerial andother services) and thefinance sector accounted forover half of GCT liability. The service and tradesectorsaccountedforthelargestnumberoftaxpayers,37.9percentand20.4percent,respectively.
The finance sector tax liability fluctuates withWallStreetprofitsandisthereforequitevolatile(seeCharts 3 and 4). The non-finance sector has seen
Number ofIndustry Taxpayers % Total
Services 104,629 37.9%
Finance 12,469 4.5%
Trade 56,408 20.4%
Real Estate 46,290 16.8%
Construction, Transportation, Utilities 46,752 16.9%
Manufacturing 9,395 3.4%
Total 275,943 100.0%*
Source: NYC Department of Finance, Office of Tax Policy
Distribution by Number of Taxpayers
Manufacturing3.4%
Services37.9%
Finance4.5%Trade
20.4%
Real Estate16.8%
Construction,Transportation,
Utilities16.9%
*Totals may not add up due to rounding.
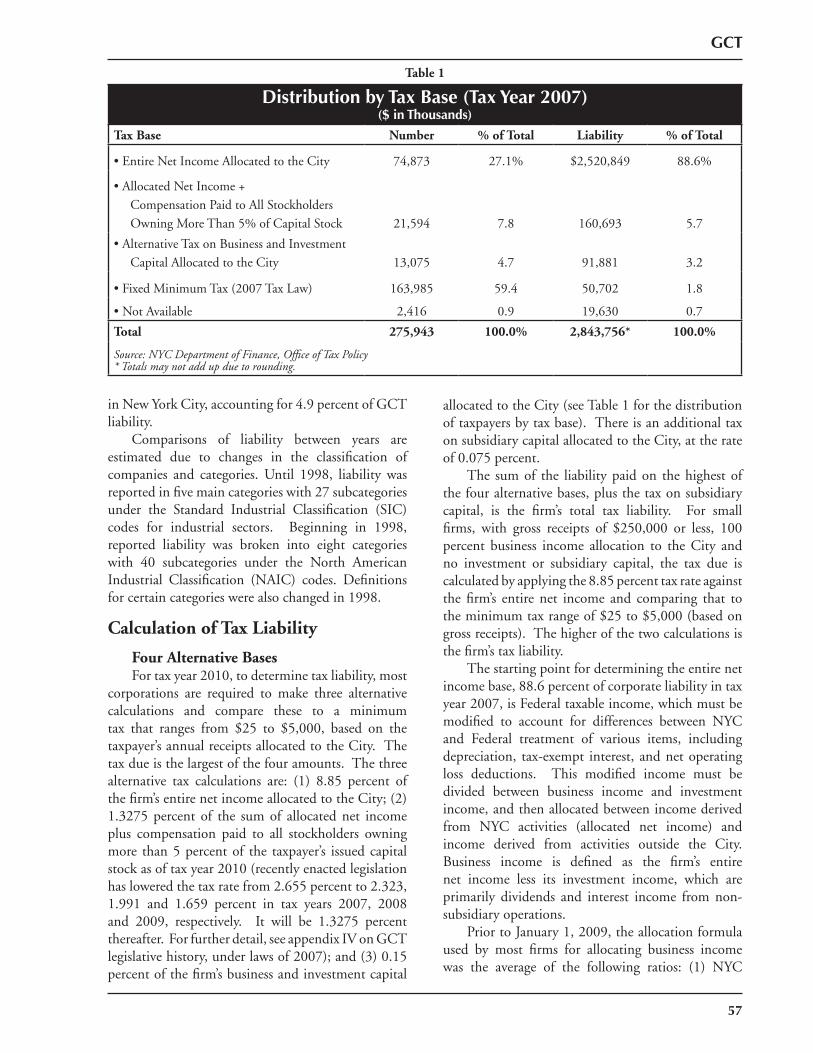
57
GCT
Table 1
Distribution by Tax Base (Tax Year 2007)($ in Thousands)
Tax Base Number % of Total Liability % of Total
•EntireNetIncomeAllocatedtotheCity 74,873 27.1% $2,520,849 88.6%
•AllocatedNetIncome+CompensationPaidtoAllStockholdersOwningMoreThan5%ofCapitalStock 21,594 7.8 160,693 5.7
•AlternativeTaxonBusinessandInvestmentCapitalAllocatedtotheCity 13,075 4.7 91,881 3.2
•FixedMinimumTax(2007TaxLaw) 163,985 59.4 50,702 1.8
•NotAvailable 2,416 0.9 19,630 0.7
Total 275,943 100.0% 2,843,756* 100.0%
Source: NYC Department of Finance, Office of Tax Policy* Totals may not add up due to rounding.
inNewYorkCity,accountingfor4.9percentofGCTliability.
Comparisons of liability between years areestimated due to changes in the classification ofcompanies and categories. Until 1998, liability wasreportedinfivemaincategorieswith27subcategoriesunder the Standard Industrial Classification (SIC)codes for industrial sectors. Beginning in 1998,reported liability was broken into eight categorieswith 40 subcategories under the North AmericanIndustrial Classification (NAIC) codes. Definitionsforcertaincategorieswerealsochangedin1998.
Calculation of Tax Liability
Four Alternative BasesFortaxyear2010,todeterminetaxliability,most
corporations are required to make three alternativecalculations and compare these to a minimumtax that ranges from $25 to $5,000, based on thetaxpayer’sannualreceiptsallocatedtotheCity.Thetaxdueisthelargestofthefouramounts.Thethreealternative tax calculations are: (1) 8.85 percent ofthefirm’sentirenetincomeallocatedtotheCity;(2)1.3275percent of the sumof allocatednet incomeplus compensation paid to all stockholders owningmore than5percentof the taxpayer’s issuedcapitalstockasoftaxyear2010(recentlyenactedlegislationhasloweredthetaxratefrom2.655percentto2.323,1.991 and 1.659 percent in tax years 2007, 2008and 2009, respectively. It will be 1.3275 percentthereafter.Forfurtherdetail,seeappendixIVonGCTlegislativehistory,underlawsof2007);and(3)0.15percentofthefirm’sbusinessandinvestmentcapital
allocatedtotheCity(seeTable1forthedistributionoftaxpayersbytaxbase).ThereisanadditionaltaxonsubsidiarycapitalallocatedtotheCity,attherateof0.075percent.
The sumof the liabilitypaidon thehighestofthefouralternativebases,plusthetaxonsubsidiarycapital, is the firm’s total tax liability. For smallfirms, with gross receipts of $250,000 or less, 100percent business income allocation to the City andno investment or subsidiary capital, the tax due iscalculatedbyapplyingthe8.85percenttaxrateagainstthefirm’s entire net income and comparing that totheminimumtaxrangeof$25to$5,000(basedongrossreceipts).Thehigherofthetwocalculationsisthefirm’staxliability.
Thestartingpointfordeterminingtheentirenetincomebase,88.6percentofcorporateliabilityintaxyear2007,isFederaltaxableincome,whichmustbemodified to account for differences between NYCand Federal treatment of various items, includingdepreciation, tax-exempt interest,andnetoperatingloss deductions. This modified income must bedivided between business income and investmentincome,andthenallocatedbetweenincomederivedfrom NYC activities (allocated net income) andincome derived from activities outside the City.Business income is defined as the firm’s entirenet income less its investment income, which areprimarily dividends and interest income from non-subsidiaryoperations.
PriortoJanuary1,2009,theallocationformulaused by most firms for allocating business incomewas the average of the following ratios: (1) NYC
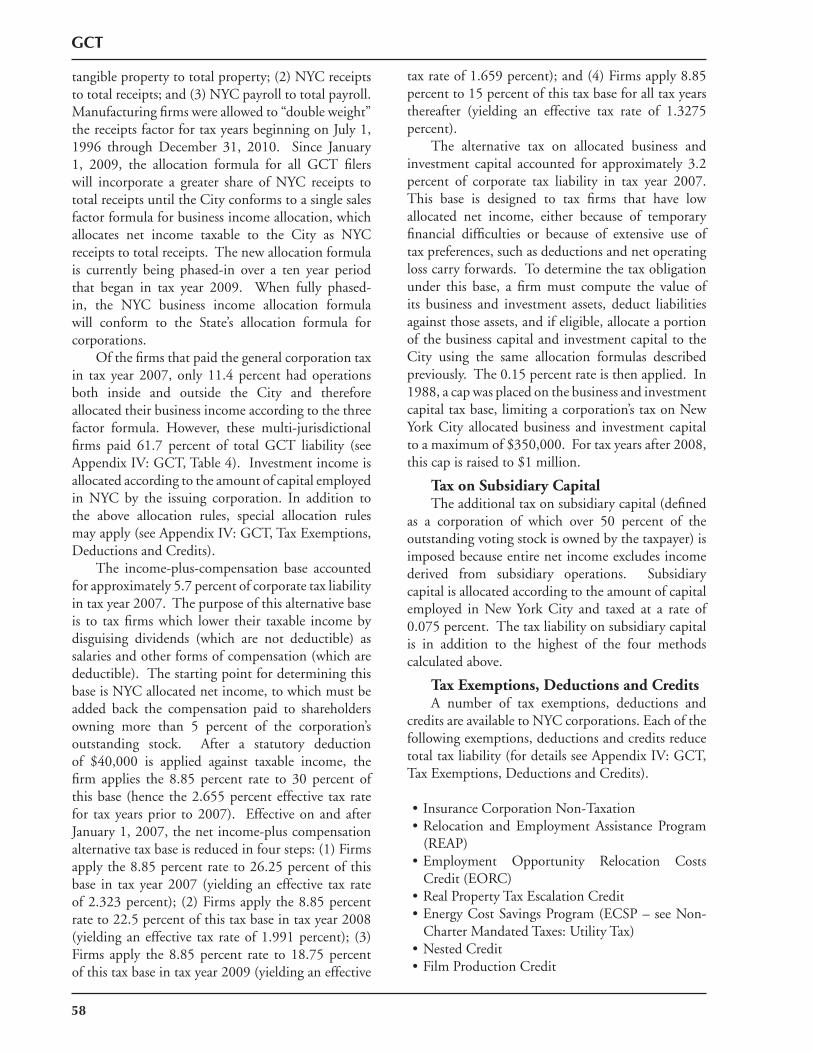
58
GCT
tangiblepropertytototalproperty;(2)NYCreceiptstototalreceipts;and(3)NYCpayrolltototalpayroll.Manufacturingfirmswereallowedto“doubleweight”thereceiptsfactorfortaxyearsbeginningonJuly1,1996 through December 31, 2010. Since January1, 2009, the allocation formula for all GCT filerswill incorporate a greater share of NYC receipts tototalreceiptsuntiltheCityconformstoasinglesalesfactorformulaforbusinessincomeallocation,whichallocates net income taxable to the City as NYCreceiptstototalreceipts.Thenewallocationformulais currently being phased-in over a ten year periodthat began in tax year 2009. When fully phased-in, the NYC business income allocation formulawill conform to the State’s allocation formula forcorporations.
Ofthefirmsthatpaidthegeneralcorporationtaxin tax year2007, only11.4percenthadoperationsboth inside and outside the City and thereforeallocatedtheirbusinessincomeaccordingtothethreefactor formula. However, these multi-jurisdictionalfirms paid 61.7 percent of total GCT liability (seeAppendixIV:GCT,Table4).Investmentincomeisallocatedaccordingtotheamountofcapitalemployedin NYC by the issuing corporation. In addition tothe above allocation rules, special allocation rulesmayapply(seeAppendixIV:GCT,TaxExemptions,DeductionsandCredits).
The income-plus-compensation base accountedforapproximately5.7percentofcorporatetaxliabilityintaxyear2007.Thepurposeofthisalternativebaseis to taxfirmswhich lower their taxable incomebydisguising dividends (which are not deductible) assalariesandotherformsofcompensation(whicharedeductible).ThestartingpointfordeterminingthisbaseisNYCallocatednetincome,towhichmustbeadded back the compensation paid to shareholdersowning more than 5 percent of the corporation’soutstanding stock. After a statutory deductionof $40,000 is applied against taxable income, thefirm applies the 8.85 percent rate to 30 percent ofthisbase (hence the2.655percenteffective tax ratefor taxyearsprior to2007). EffectiveonandafterJanuary1,2007,thenetincome-pluscompensationalternativetaxbaseisreducedinfoursteps:(1)Firmsapplythe8.85percentrateto26.25percentofthisbase in taxyear2007 (yielding an effective tax rateof2.323percent); (2)Firmsapplythe8.85percentrateto22.5percentofthistaxbaseintaxyear2008(yieldinganeffective tax rateof1.991percent); (3)Firms apply the8.85percent rate to18.75percentofthistaxbaseintaxyear2009(yieldinganeffective
taxrateof1.659percent);and(4)Firmsapply8.85percentto15percentofthistaxbaseforalltaxyearsthereafter (yielding an effective tax rate of 1.3275percent).
The alternative tax on allocated business andinvestment capital accounted for approximately 3.2percent of corporate tax liability in tax year 2007.This base is designed to tax firms that have lowallocated net income, either because of temporaryfinancial difficulties or because of extensive use oftaxpreferences,suchasdeductionsandnetoperatinglosscarryforwards.Todeterminethetaxobligationunder this base, a firm must compute the value ofits business and investment assets, deduct liabilitiesagainstthoseassets,andifeligible,allocateaportionofthebusinesscapitalandinvestmentcapitaltotheCity using the same allocation formulas describedpreviously.The0.15percentrateisthenapplied.In1988,acapwasplacedonthebusinessandinvestmentcapitaltaxbase,limitingacorporation’staxonNewYorkCity allocatedbusiness and investment capitaltoamaximumof$350,000.Fortaxyearsafter2008,thiscapisraisedto$1million.
Tax on Subsidiary CapitalTheadditionaltaxonsubsidiarycapital(defined
as a corporation of which over 50 percent of theoutstandingvotingstockisownedbythetaxpayer)isimposedbecauseentirenetincomeexcludesincomederived from subsidiary operations. Subsidiarycapitalisallocatedaccordingtotheamountofcapitalemployed in NewYork City and taxed at a rate of0.075percent.Thetaxliabilityonsubsidiarycapitalis in addition to the highest of the four methodscalculatedabove.
Tax Exemptions, Deductions and CreditsA number of tax exemptions, deductions and
creditsareavailabletoNYCcorporations.Eachofthefollowingexemptions,deductionsandcreditsreducetotaltaxliability(fordetailsseeAppendixIV:GCT,TaxExemptions,DeductionsandCredits).
•InsuranceCorporationNon-Taxation•Relocation and Employment Assistance Program(REAP)•Employment Opportunity Relocation CostsCredit(EORC)•RealPropertyTaxEscalationCredit•EnergyCostSavingsProgram(ECSP–seeNon-CharterMandatedTaxes:UtilityTax)•NestedCredit•FilmProductionCredit
59
GCT
•Industrial Business Zone (IBZ) Relocation TaxCredit•Small Corporation Exemption from AlternativeTaxes•Cooperative Housing Corporation Four-TenthsMillTaxRateonCapital•SchoolBusOperationDeduction•Manufacturing and Research & DevelopmentPropertyDepreciationDeduction•AirPollutionControlFacilitiesDeduction•BiotechnologyCredit
Tax Treatment of Special Corporations
S CorporationsUnder New York City’s general corporation
tax,Scorporationsarenot taxeddifferently thanCcorporations. They are required to make all threealternative tax calculations and compare that to aminimum tax range, based on receipts. However,unliketheCity,NewYorkState’scorporatefranchisetax,leviedbyArticle9-AoftheStatetaxlaw,appliesdifferenttaxtreatmentstoSandCcorporations.Scorporations for State tax purposes are subject to aminimumtaxrangeof$25to$4,500,basedonNewYorkStatereceipts.IncomefromtheScorporationisthenpassed-throughtoshareholderswhomaketaxpayments based on their marginal personal incometaxrates.
Limited Liability Companies (LLCs)For City tax purposes, LLCs and LLPs do not
pay the general corporation tax. Instead, they paythe unincorporated business tax (see Non-CharterMandatedTaxes:UnincorporatedBusinessTax).
Regulated Investment Companies (RICs)ARIC,asdefinedbyFederal tax law, issubject
totheGCT.UndertheGCT,RICsarenotsubjectto the alternative tax on business and investmentcapital, but they are subject to the other three taxbases(entirenetincome,income-plus-compensation,andtheminimumtaxbases).ForCitytaxpurposes,RICsareonlytaxedonanyundistributedincomeorlong-termcapitalgains.Therefore,totheextentthata RIC passes through its income to shareholders, aRICpaysminimalCitygeneralcorporationtax.
Real Estate Investment Trusts (REITs)AREIT,asdefinedbyFederaltaxlaw,issubject
to theGCT. Under theGCT,the tax liabilityofaREITisdeterminedbyutilizingonlythenetincometaxandtheminimumtaxbases;payingwhicheverislarger(REITsarenotsubjecttothealternativetaxon
capitalandtheincome-plus-compensationtaxbases).New York City conforms to Federal tax treatmentof REITs, taxing REITs only on any undistributedincome or long-term capital gains. Therefore, tothe extent that a REIT passes through its incometo shareholders, a REIT pays minimal City generalcorporationtax.
AdministrationThe general corporation tax is administered by
theNewYorkCityDepartmentofFinance(DOF).Firms subject to the tax must file according to apayment schedule that conforms to Federal andState filing dates. For firms that have a fiscal yearbeginning on January 1, a prepayment on currentyear liability equal to25percent of theprior year’sliability is due inMarch. A second installment, orannualdeclarationof estimated tax, is due in June,and estimated payments, or the third and fourthinstallments,aremadeinSeptemberandDecember.AfinalreturnforthetaxyearisthendueonMarch15thofthefollowingtaxyear.Firmsmayfileamendeddeclarationsofestimatedtaxatanytimetocorrectorchangetaxestimates.DOFisalsoempoweredtograntareasonableextensionoftimeforfilingreturnswhenthereisgoodcausefordoingso.Forannualreturns,anautomaticsixmonthextensioncanbegrantedifthefirmfilesanapplicationforextension,extendingtheirfinal returnduedate toSeptember (insteadofMarch) of the following tax year. If eligible, firmscanfileforanadditionalsixmonthextension,beyondSeptember to the succeeding March, to complete afinal return. This allows firms that have filed twoextensions toaccuratelycompleteafinal returndueinMarch,twoyearsafterthecompletionofataxyear.

60
NON-CHARTER MANDATED TAXES
Banking Corporation TaxUnincorporated Business Tax
Real Property Transfer TaxMortgage Recording Tax
Commercial Rent TaxUtility Tax
Hotel Room Occupancy TaxCigarette TaxOther Taxes

62
BCT
63
BANKING CORPORATION TAX
Table of Contents
Overview ...................................................................................................................................65
Forecasting Methodology ...........................................................................................................65
Tax Detail ..................................................................................................................................66
Legislative History .....................................................................................................................67

64
BCT
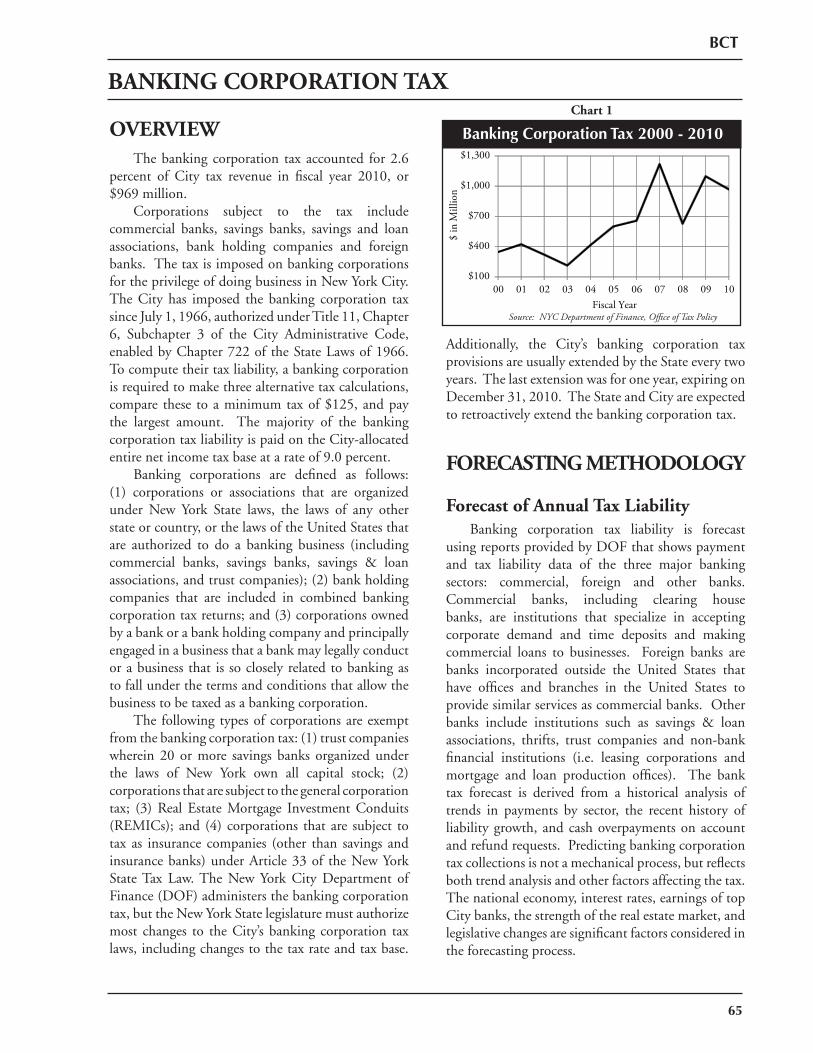
BCT
65
Additionally, the City’s banking corporation tax provisions are usually extended by the State every two years. The last extension was for one year, expiring on December 31, 2010. The State and City are expected to retroactively extend the banking corporation tax.
FORECASTING METHODOLOGY
Forecast of Annual Tax Liability Banking corporation tax liability is forecast using reports provided by DOF that shows payment and tax liability data of the three major banking sectors: commercial, foreign and other banks. Commercial banks, including clearing house banks, are institutions that specialize in accepting corporate demand and time deposits and making commercial loans to businesses. Foreign banks are banks incorporated outside the United States that have offi ces and branches in the United States to provide similar services as commercial banks. Other banks include institutions such as savings & loan associations, thrifts, trust companies and non-bank fi nancial institutions (i.e. leasing corporations and mortgage and loan production offi ces). The bank tax forecast is derived from a historical analysis of trends in payments by sector, the recent history of liability growth, and cash overpayments on account and refund requests. Predicting banking corporation tax collections is not a mechanical process, but refl ects both trend analysis and other factors affecting the tax. The national economy, interest rates, earnings of top City banks, the strength of the real estate market, and legislative changes are signifi cant factors considered in the forecasting process.
OVERVIEW The banking corporation tax accounted for 2.6 percent of City tax revenue in fi scal year 2010, or $969 million. Corporations subject to the tax include commercial banks, savings banks, savings and loan associations, bank holding companies and foreign banks. The tax is imposed on banking corporations for the privilege of doing business in New York City. The City has imposed the banking corporation tax since July 1, 1966, authorized under Title 11, Chapter 6, Subchapter 3 of the City Administrative Code, enabled by Chapter 722 of the State Laws of 1966. To compute their tax liability, a banking corporation is required to make three alternative tax calculations, compare these to a minimum tax of $125, and pay the largest amount. The majority of the banking corporation tax liability is paid on the City-allocated entire net income tax base at a rate of 9.0 percent. Banking corporations are defi ned as follows: (1) corporations or associations that are organized under New York State laws, the laws of any other state or country, or the laws of the United States that are authorized to do a banking business (including commercial banks, savings banks, savings & loan associations, and trust companies); (2) bank holding companies that are included in combined banking corporation tax returns; and (3) corporations owned by a bank or a bank holding company and principally engaged in a business that a bank may legally conduct or a business that is so closely related to banking as to fall under the terms and conditions that allow the business to be taxed as a banking corporation. The following types of corporations are exempt from the banking corporation tax: (1) trust companies wherein 20 or more savings banks organized under the laws of New York own all capital stock; (2) corporations that are subject to the general corporation tax; (3) Real Estate Mortgage Investment Conduits (REMICs); and (4) corporations that are subject to tax as insurance companies (other than savings and insurance banks) under Article 33 of the New York State Tax Law. The New York City Department of Finance (DOF) administers the banking corporation tax, but the New York State legislature must authorize most changes to the City’s banking corporation tax laws, including changes to the tax rate and tax base.
Chart 1
Banking Corporation Tax 2000 - 2010
Source: NYC Department of Finance, Office of Tax Policy
$100
$400
$700
$1,000
$1,300
00 01 02 03 04 05 06 07 08 09 10
$ in
Mill
ion
Fiscal Year
BANKING CORPORATION TAX
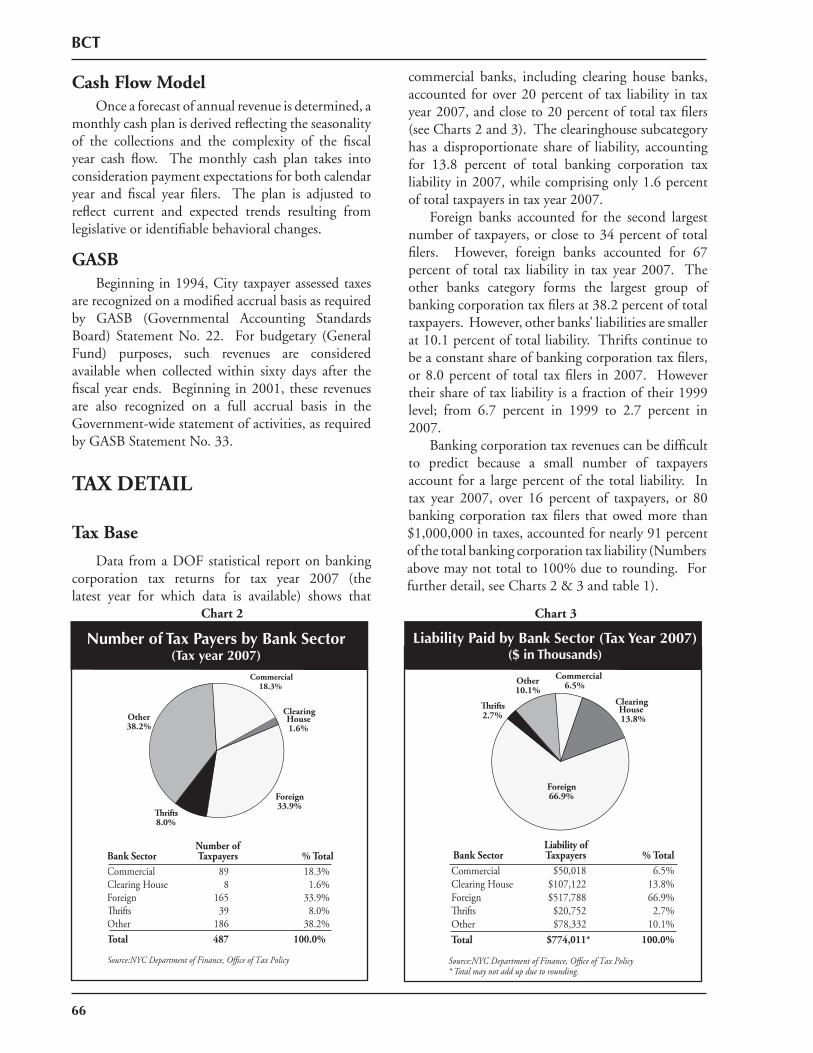
66
BCT
Cash Flow Model Once a forecast of annual revenue is determined, a monthly cash plan is derived refl ecting the seasonality of the collections and the complexity of the fi scal year cash fl ow. The monthly cash plan takes into consideration payment expectations for both calendar year and fi scal year fi lers. The plan is adjusted to refl ect current and expected trends resulting from legislative or identifi able behavioral changes.
GASB Beginning in 1994, City taxpayer assessed taxes are recognized on a modifi ed accrual basis as required by GASB (Governmental Accounting Standards Board) Statement No. 22. For budgetary (General Fund) purposes, such revenues are considered available when collected within sixty days after the fi scal year ends. Beginning in 2001, these revenues are also recognized on a full accrual basis in the Government-wide statement of activities, as required by GASB Statement No. 33.
TAX DETAIL
Tax Base
Data from a DOF statistical report on banking corporation tax returns for tax year 2007 (the latest year for which data is available) shows that
commercial banks, including clearing house banks, accounted for over 20 percent of tax liability in tax year 2007, and close to 20 percent of total tax fi lers (see Charts 2 and 3). The clearinghouse subcategory has a disproportionate share of liability, accounting for 13.8 percent of total banking corporation tax liability in 2007, while comprising only 1.6 percent of total taxpayers in tax year 2007. Foreign banks accounted for the second largest number of taxpayers, or close to 34 percent of total fi lers. However, foreign banks accounted for 67 percent of total tax liability in tax year 2007. The other banks category forms the largest group of banking corporation tax fi lers at 38.2 percent of total taxpayers. However, other banks’ liabilities are smaller at 10.1 percent of total liability. Thrifts continue to be a constant share of banking corporation tax fi lers, or 8.0 percent of total tax fi lers in 2007. However their share of tax liability is a fraction of their 1999 level; from 6.7 percent in 1999 to 2.7 percent in 2007. Banking corporation tax revenues can be diffi cult to predict because a small number of taxpayers account for a large percent of the total liability. In tax year 2007, over 16 percent of taxpayers, or 80 banking corporation tax fi lers that owed more than $1,000,000 in taxes, accounted for nearly 91 percent of the total banking corporation tax liability (Numbers above may not total to 100% due to rounding. For further detail, see Charts 2 & 3 and table 1).
Chart 2
Number of Tax Payers by Bank Sector(Tax year 2007)
Commercial18.3%
ClearingHouse1.6%
Foreign33.9%
Thrifts8.0%
Other38.2%
Number ofBank Sector Taxpayers % TotalCommercial 89 18.3%Clearing House 8 1.6%Foreign 165 33.9%Thrifts 39 8.0%Other 186 38.2%Total 487 100.0%
Source:NYC Department of Finance, Office of Tax Policy
Chart 3
Liability Paid by Bank Sector (Tax Year 2007)($ in Thousands)
Commercial6.5%
ClearingHouse13.8%
Foreign66.9%
Thrifts2.7%
Other10.1%
Liability ofBank Sector TaxpayersCommercialClearing HouseForeignThriftsOtherTotal
* Total may not add up due to rounding.Source:NYC Department of Finance, Office of Tax Policy
$50,018 6.5%$107,122 13.8%$517,788 66.9%$20,752 2.7%$78,332 10.1%
% Total
$774,011* 100.0%
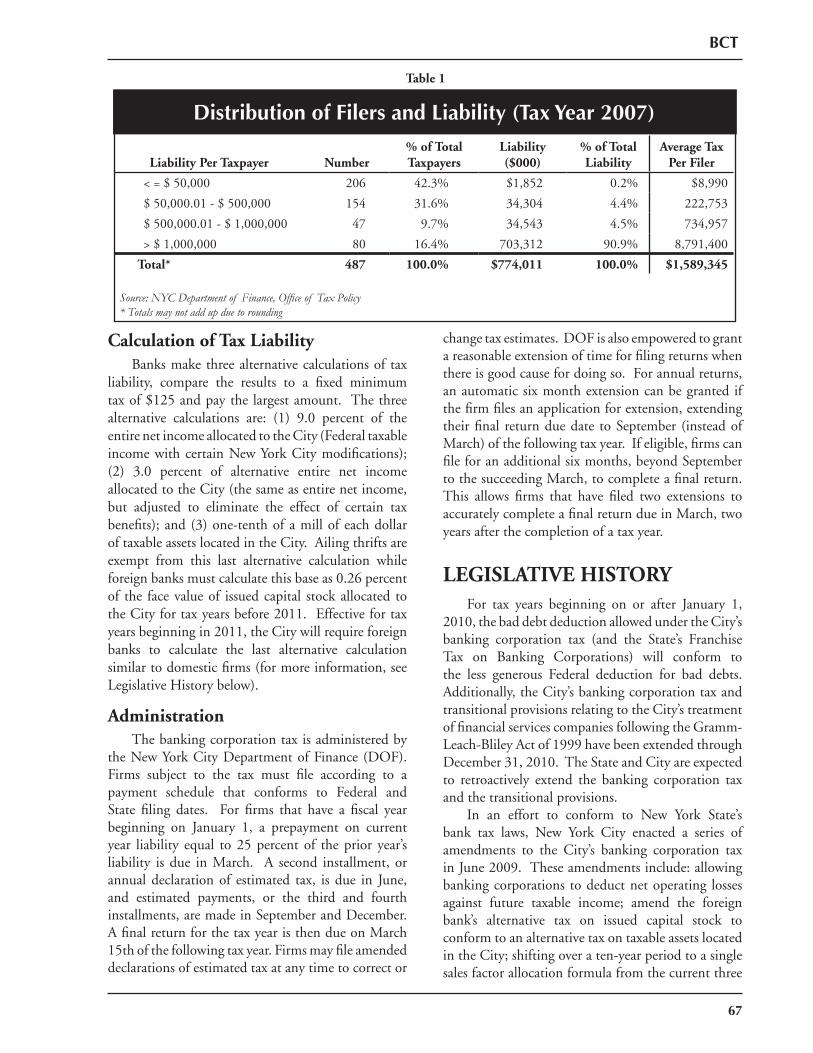
67
BCT
Calculation of Tax Liability Banks make three alternative calculations of tax liability, compare the results to a fi xed minimum tax of $125 and pay the largest amount. The three alternative calculations are: (1) 9.0 percent of the entire net income allocated to the City (Federal taxable income with certain New York City modifi cations); (2) 3.0 percent of alternative entire net income allocated to the City (the same as entire net income, but adjusted to eliminate the effect of certain tax benefi ts); and (3) one-tenth of a mill of each dollar of taxable assets located in the City. Ailing thrifts are exempt from this last alternative calculation while foreign banks must calculate this base as 0.26 percent of the face value of issued capital stock allocated to the City for tax years before 2011. Effective for tax years beginning in 2011, the City will require foreign banks to calculate the last alternative calculation similar to domestic fi rms (for more information, see Legislative History below).
Administration The banking corporation tax is administered by the New York City Department of Finance (DOF). Firms subject to the tax must fi le according to a payment schedule that conforms to Federal and State fi ling dates. For fi rms that have a fi scal year beginning on January 1, a prepayment on current year liability equal to 25 percent of the prior year’s liability is due in March. A second installment, or annual declaration of estimated tax, is due in June, and estimated payments, or the third and fourth installments, are made in September and December. A fi nal return for the tax year is then due on March 15th of the following tax year. Firms may fi le amended declarations of estimated tax at any time to correct or
change tax estimates. DOF is also empowered to grant a reasonable extension of time for fi ling returns when there is good cause for doing so. For annual returns, an automatic six month extension can be granted if the fi rm fi les an application for extension, extending their fi nal return due date to September (instead of March) of the following tax year. If eligible, fi rms can fi le for an additional six months, beyond September to the succeeding March, to complete a fi nal return. This allows fi rms that have fi led two extensions to accurately complete a fi nal return due in March, two years after the completion of a tax year.
LEGISLATIVE HISTORY For tax years beginning on or after January 1, 2010, the bad debt deduction allowed under the City’s banking corporation tax (and the State’s Franchise Tax on Banking Corporations) will conform to the less generous Federal deduction for bad debts. Additionally, the City’s banking corporation tax and transitional provisions relating to the City’s treatment of fi nancial services companies following the Gramm-Leach-Bliley Act of 1999 have been extended through December 31, 2010. The State and City are expected to retroactively extend the banking corporation tax and the transitional provisions. In an effort to conform to New York State’s bank tax laws, New York City enacted a series of amendments to the City’s banking corporation tax in June 2009. These amendments include: allowing banking corporations to deduct net operating losses against future taxable income; amend the foreign bank’s alternative tax on issued capital stock to conform to an alternative tax on taxable assets located in the City; shifting over a ten-year period to a single sales factor allocation formula from the current three
Liability Per Taxpayer Number% of Total Taxpayers
Liability($000)
% of Total Liability
Average TaxPer Filer
< = $ 50,000 206 42.3% $1,852 0.2% $8,990
$ 50,000.01 - $ 500,000 154 31.6% 34,304 4.4% 222,753
$ 500,000.01 - $ 1,000,000 47 9.7% 34,543 4.5% 734,957
> $ 1,000,000 80 16.4% 703,312 90.9% 8,791,400
Total* 487 100.0% $774,011 100.0% $1,589,345
Source: NYC Department of Finance, Offi ce of Tax Policy* Totals may not add up due to rounding
Table 1
Taxing AuthorityDistribution of Filers and Liability (Tax Year 2007)
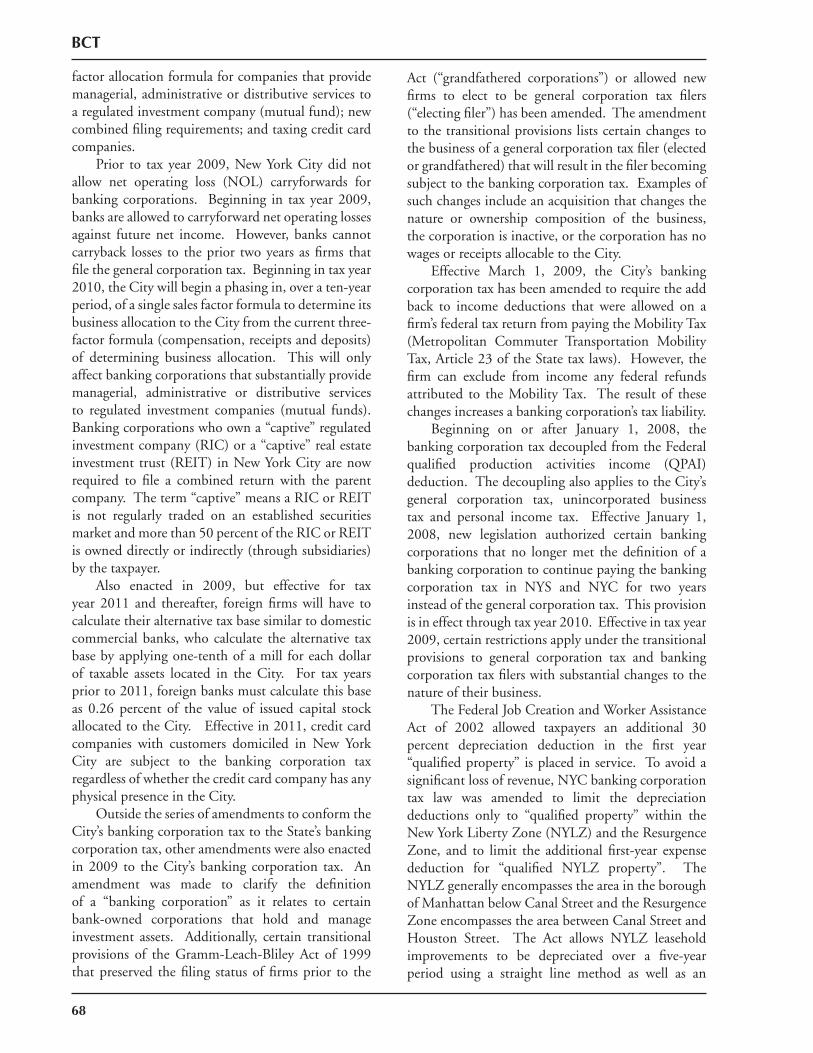
68
factor allocation formula for companies that provide managerial, administrative or distributive services to a regulated investment company (mutual fund); new combined fi ling requirements; and taxing credit card companies. Prior to tax year 2009, New York City did not allow net operating loss (NOL) carryforwards for banking corporations. Beginning in tax year 2009, banks are allowed to carryforward net operating losses against future net income. However, banks cannot carryback losses to the prior two years as fi rms that fi le the general corporation tax. Beginning in tax year 2010, the City will begin a phasing in, over a ten-year period, of a single sales factor formula to determine its business allocation to the City from the current three-factor formula (compensation, receipts and deposits) of determining business allocation. This will only affect banking corporations that substantially provide managerial, administrative or distributive services to regulated investment companies (mutual funds). Banking corporations who own a “captive” regulated investment company (RIC) or a “captive” real estate investment trust (REIT) in New York City are now required to fi le a combined return with the parent company. The term “captive” means a RIC or REIT is not regularly traded on an established securities market and more than 50 percent of the RIC or REIT is owned directly or indirectly (through subsidiaries) by the taxpayer. Also enacted in 2009, but effective for tax year 2011 and thereafter, foreign fi rms will have to calculate their alternative tax base similar to domestic commercial banks, who calculate the alternative tax base by applying one-tenth of a mill for each dollar of taxable assets located in the City. For tax years prior to 2011, foreign banks must calculate this base as 0.26 percent of the value of issued capital stock allocated to the City. Effective in 2011, credit card companies with customers domiciled in New York City are subject to the banking corporation tax regardless of whether the credit card company has any physical presence in the City. Outside the series of amendments to conform the City’s banking corporation tax to the State’s banking corporation tax, other amendments were also enacted in 2009 to the City’s banking corporation tax. An amendment was made to clarify the defi nition of a “banking corporation” as it relates to certain bank-owned corporations that hold and manage investment assets. Additionally, certain transitional provisions of the Gramm-Leach-Bliley Act of 1999 that preserved the fi ling status of fi rms prior to the
Act (“grandfathered corporations”) or allowed new fi rms to elect to be general corporation tax fi lers (“electing fi ler”) has been amended. The amendment to the transitional provisions lists certain changes to the business of a general corporation tax fi ler (elected or grandfathered) that will result in the fi ler becoming subject to the banking corporation tax. Examples of such changes include an acquisition that changes the nature or ownership composition of the business, the corporation is inactive, or the corporation has no wages or receipts allocable to the City. Effective March 1, 2009, the City’s banking corporation tax has been amended to require the add back to income deductions that were allowed on a fi rm’s federal tax return from paying the Mobility Tax (Metropolitan Commuter Transportation Mobility Tax, Article 23 of the State tax laws). However, the fi rm can exclude from income any federal refunds attributed to the Mobility Tax. The result of these changes increases a banking corporation’s tax liability. Beginning on or after January 1, 2008, the banking corporation tax decoupled from the Federal qualifi ed production activities income (QPAI) deduction. The decoupling also applies to the City’s general corporation tax, unincorporated business tax and personal income tax. Effective January 1, 2008, new legislation authorized certain banking corporations that no longer met the defi nition of a banking corporation to continue paying the banking corporation tax in NYS and NYC for two years instead of the general corporation tax. This provision is in effect through tax year 2010. Effective in tax year 2009, certain restrictions apply under the transitional provisions to general corporation tax and banking corporation tax fi lers with substantial changes to the nature of their business. The Federal Job Creation and Worker Assistance Act of 2002 allowed taxpayers an additional 30 percent depreciation deduction in the fi rst year “qualifi ed property” is placed in service. To avoid a signifi cant loss of revenue, NYC banking corporation tax law was amended to limit the depreciation deductions only to “qualifi ed property” within the New York Liberty Zone (NYLZ) and the Resurgence Zone, and to limit the additional fi rst-year expense deduction for “qualifi ed NYLZ property”. The NYLZ generally encompasses the area in the borough of Manhattan below Canal Street and the Resurgence Zone encompasses the area between Canal Street and Houston Street. The Act allows NYLZ leasehold improvements to be depreciated over a fi ve-year period using a straight line method as well as an
BCT
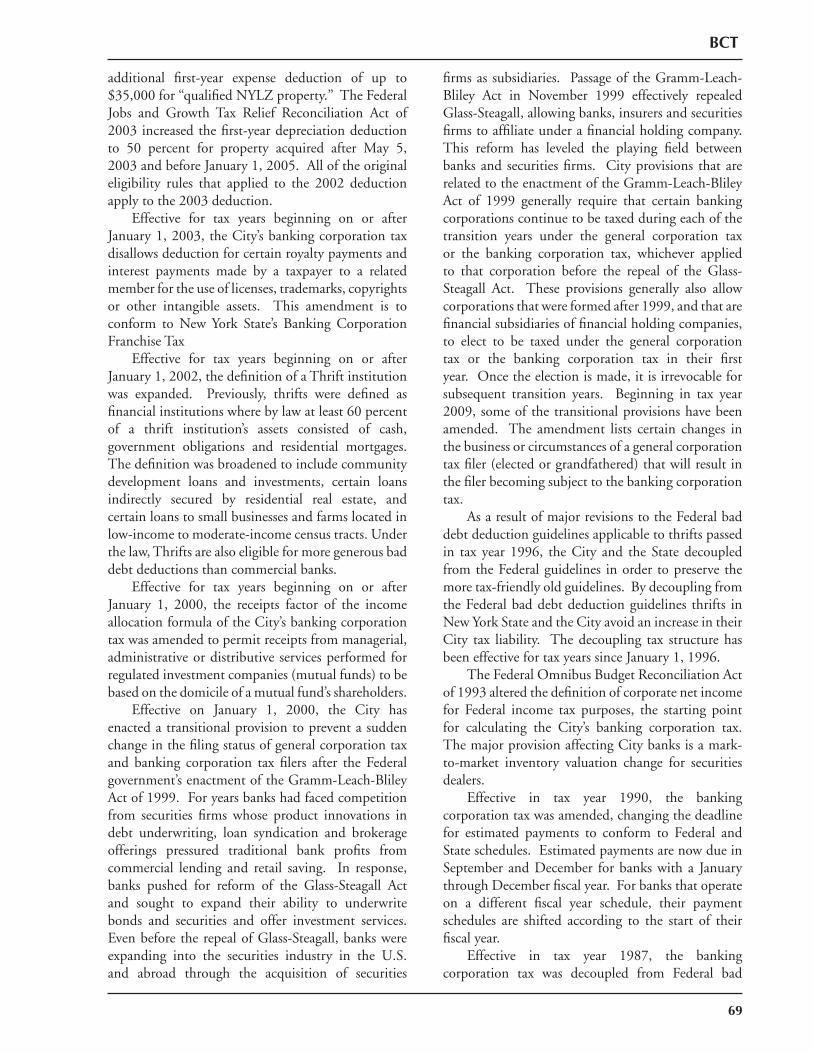
69
BCT
additional fi rst-year expense deduction of up to $35,000 for “qualifi ed NYLZ property.” The Federal Jobs and Growth Tax Relief Reconciliation Act of 2003 increased the fi rst-year depreciation deduction to 50 percent for property acquired after May 5, 2003 and before January 1, 2005. All of the original eligibility rules that applied to the 2002 deduction apply to the 2003 deduction. Effective for tax years beginning on or after January 1, 2003, the City’s banking corporation tax disallows deduction for certain royalty payments and interest payments made by a taxpayer to a related member for the use of licenses, trademarks, copyrights or other intangible assets. This amendment is to conform to New York State’s Banking Corporation Franchise Tax Effective for tax years beginning on or after January 1, 2002, the defi nition of a Thrift institution was expanded. Previously, thrifts were defi ned as fi nancial institutions where by law at least 60 percent of a thrift institution’s assets consisted of cash, government obligations and residential mortgages. The defi nition was broadened to include community development loans and investments, certain loans indirectly secured by residential real estate, and certain loans to small businesses and farms located in low-income to moderate-income census tracts. Under the law, Thrifts are also eligible for more generous bad debt deductions than commercial banks. Effective for tax years beginning on or after January 1, 2000, the receipts factor of the income allocation formula of the City’s banking corporation tax was amended to permit receipts from managerial, administrative or distributive services performed for regulated investment companies (mutual funds) to be based on the domicile of a mutual fund’s shareholders. Effective on January 1, 2000, the City has enacted a transitional provision to prevent a sudden change in the fi ling status of general corporation tax and banking corporation tax fi lers after the Federal government’s enactment of the Gramm-Leach-Bliley Act of 1999. For years banks had faced competition from securities fi rms whose product innovations in debt underwriting, loan syndication and brokerage offerings pressured traditional bank profi ts from commercial lending and retail saving. In response, banks pushed for reform of the Glass-Steagall Act and sought to expand their ability to underwrite bonds and securities and offer investment services. Even before the repeal of Glass-Steagall, banks were expanding into the securities industry in the U.S. and abroad through the acquisition of securities
fi rms as subsidiaries. Passage of the Gramm-Leach-Bliley Act in November 1999 effectively repealed Glass-Steagall, allowing banks, insurers and securities fi rms to affi liate under a fi nancial holding company. This reform has leveled the playing fi eld between banks and securities fi rms. City provisions that are related to the enactment of the Gramm-Leach-Bliley Act of 1999 generally require that certain banking corporations continue to be taxed during each of the transition years under the general corporation tax or the banking corporation tax, whichever applied to that corporation before the repeal of the Glass-Steagall Act. These provisions generally also allow corporations that were formed after 1999, and that are fi nancial subsidiaries of fi nancial holding companies, to elect to be taxed under the general corporation tax or the banking corporation tax in their fi rst year. Once the election is made, it is irrevocable for subsequent transition years. Beginning in tax year 2009, some of the transitional provisions have been amended. The amendment lists certain changes in the business or circumstances of a general corporation tax fi ler (elected or grandfathered) that will result in the fi ler becoming subject to the banking corporation tax. As a result of major revisions to the Federal bad debt deduction guidelines applicable to thrifts passed in tax year 1996, the City and the State decoupled from the Federal guidelines in order to preserve the more tax-friendly old guidelines. By decoupling from the Federal bad debt deduction guidelines thrifts in New York State and the City avoid an increase in their City tax liability. The decoupling tax structure has been effective for tax years since January 1, 1996. The Federal Omnibus Budget Reconciliation Act of 1993 altered the defi nition of corporate net income for Federal income tax purposes, the starting point for calculating the City’s banking corporation tax. The major provision affecting City banks is a mark-to-market inventory valuation change for securities dealers. Effective in tax year 1990, the banking corporation tax was amended, changing the deadline for estimated payments to conform to Federal and State schedules. Estimated payments are now due in September and December for banks with a January through December fi scal year. For banks that operate on a different fi scal year schedule, their payment schedules are shifted according to the start of their fi scal year. Effective in tax year 1987, the banking corporation tax was decoupled from Federal bad
70
BCT
debt deduction guidelines. The Federal Tax Reform Act of 1986 required that large commercial banks, those with assets over $500 million, deduct only actual loan losses when determining taxable income, rather than deducting additions to a loan loss reserve account based on a percentage of loans outstanding. These banks were required to recapture portions of their outstanding loan loss reserves over a four-year period beginning in 1987. Decoupling allowed banks to use the more liberal pre-reform bad debt reserve deductions for State and City tax purposes. For thrifts and mutual savings banks, Federal tax reform retained the percentage-of-taxable income method of deducting bad debts but reduced the excludable percentage from 40 to 8 percent. In July 1985, State legislation was enacted which restructured the banking corporation tax, effective retroactively to January 1, 1985. Recognizing that the line between bank and non-bank fi nancial institutions had become blurred, the amendments were designed to make the tax more analogous to the general corporation tax. The law lowered the nominal tax rate on allocated entire net income from 13.823 percent (12.134 percent for savings banks) to 9.0 percent for all banking corporations. This rate reduction was coupled with a number of base-broadening provisions. In addition, the separate accounting method of allocating entire net income was replaced by a three-factor allocation formula based on compensation, receipts and deposits. The factors included in the formula, with the exception of deposits, are similar to those used by non-banking corporations. The adoption of the three-factor allocation formula also provided consistency in the jurisdictional apportionment of income as these same allocation factors were commonly used in other states. In addition, the 1985 bank tax law established two new alternative bases: alternative entire net income and taxable assets. Alternative entire net income adds back certain deductions allowed in the calculation of entire net income. These deductions are: (1) 17.0 percent of interest from subsidiary capital; (2) 60 percent of dividend income and gains and losses from subsidiary capital; and (3) 22.5 percent of the interest income earned from holding obligations of the United States, NYS and localities within the State. Taxable assets are the average value of total assets refl ected on a bank’s balance sheet. The 1985 changes maintained the 1978 provisions authorizing an exemption for net income generated from the operation of an international banking facility (IBF). Deposits in an IBF are not subject to reserve requirements or interest
rate ceilings, and the IBF is not required to pay FDIC premiums. State law exempts income generated by an IBF from both State and City taxation. These exemptions were designed to enhance the ability of banks to conduct international business in NYC. The major difference between the State and City banking corporation tax laws is the treatment of foreign banks under the alternative tax base on assets. For banks organized under the laws of another country, NYS imposes the alternative tax on assets, while NYC imposes the alternative tax on capital stock.
UBT
71
UNINCORPORATED BUSINESS TAX
Table of Contents
Overview ...................................................................................................................................73
Forecasting Methodology ...........................................................................................................73
Tax Detail ..................................................................................................................................75
Legislative History .....................................................................................................................76

UBT
72
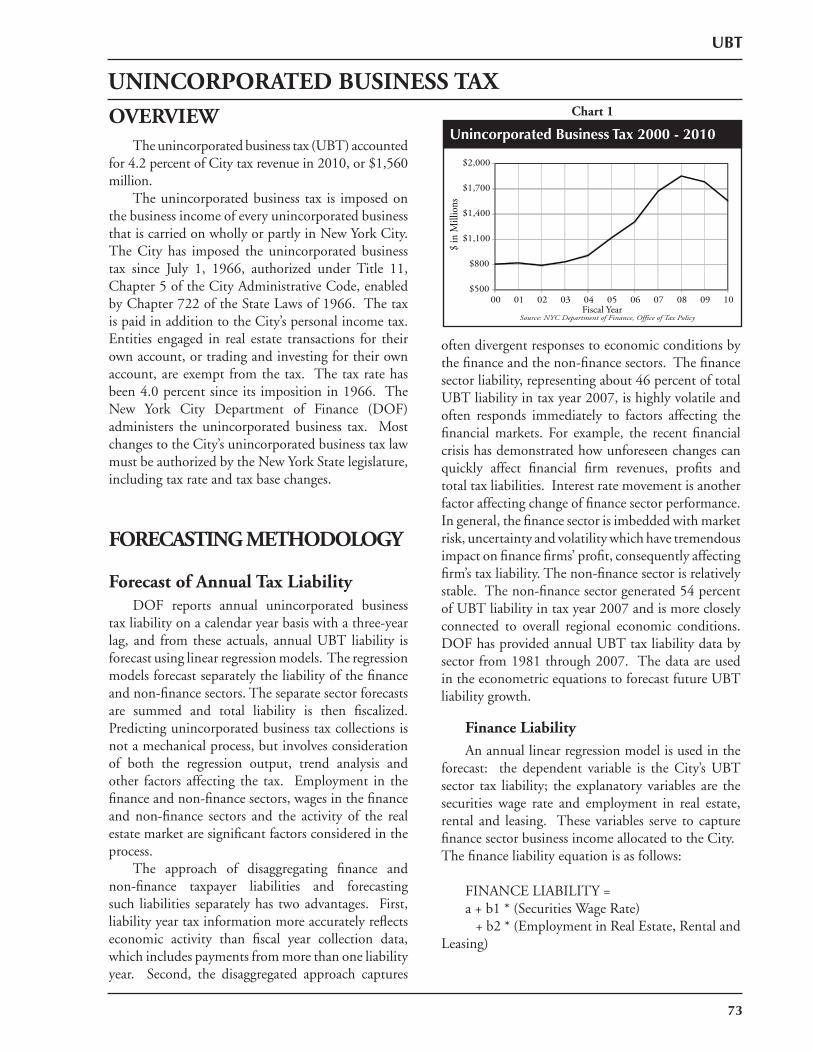
OVERVIEW The unincorporated business tax (UBT) accounted for 4.2 percent of City tax revenue in 2010, or $1,560 million. The unincorporated business tax is imposed on the business income of every unincorporated business that is carried on wholly or partly in New York City. The City has imposed the unincorporated business tax since July 1, 1966, authorized under Title 11, Chapter 5 of the City Administrative Code, enabled by Chapter 722 of the State Laws of 1966. The tax is paid in addition to the City’s personal income tax. Entities engaged in real estate transactions for their own account, or trading and investing for their own account, are exempt from the tax. The tax rate has been 4.0 percent since its imposition in 1966. The New York City Department of Finance (DOF) administers the unincorporated business tax. Most changes to the City’s unincorporated business tax law must be authorized by the New York State legislature, including tax rate and tax base changes.
FORECASTING METHODOLOGY
Forecast of Annual Tax Liability DOF reports annual unincorporated business tax liability on a calendar year basis with a three-year lag, and from these actuals, annual UBT liability is forecast using linear regression models. The regression models forecast separately the liability of the fi nance and non-fi nance sectors. The separate sector forecasts are summed and total liability is then fi scalized. Predicting unincorporated business tax collections is not a mechanical process, but involves consideration of both the regression output, trend analysis and other factors affecting the tax. Employment in the fi nance and non-fi nance sectors, wages in the fi nance and non-fi nance sectors and the activity of the real estate market are signifi cant factors considered in the process. The approach of disaggregating fi nance and non-fi nance taxpayer liabilities and forecasting such liabilities separately has two advantages. First, liability year tax information more accurately refl ects economic activity than fi scal year collection data, which includes payments from more than one liability year. Second, the disaggregated approach captures
often divergent responses to economic conditions by the fi nance and the non-fi nance sectors. The fi nance sector liability, representing about 46 percent of total UBT liability in tax year 2007, is highly volatile and often responds immediately to factors affecting the fi nancial markets. For example, the recent fi nancial crisis has demonstrated how unforeseen changes can quickly affect fi nancial fi rm revenues, profi ts and total tax liabilities. Interest rate movement is another factor affecting change of fi nance sector performance. In general, the fi nance sector is imbedded with market risk, uncertainty and volatility which have tremendous impact on fi nance fi rms’ profi t, consequently affecting fi rm’s tax liability. The non-fi nance sector is relatively stable. The non-fi nance sector generated 54 percent of UBT liability in tax year 2007 and is more closely connected to overall regional economic conditions. DOF has provided annual UBT tax liability data by sector from 1981 through 2007. The data are used in the econometric equations to forecast future UBT liability growth.
Finance Liability An annual linear regression model is used in the forecast: the dependent variable is the City’s UBT sector tax liability; the explanatory variables are the securities wage rate and employment in real estate, rental and leasing. These variables serve to capture fi nance sector business income allocated to the City.The fi nance liability equation is as follows:
FINANCE LIABILITY = a + b1 * (Securities Wage Rate) + b2 * (Employment in Real Estate, Rental and Leasing)
Unincorporated Business Tax 2000 - 2010
$500
$800
$1,100
$1,400
$1,700
$2,000
00 01 02 03 04 05 06 07 08 09 10
$ in
Mill
ions
Fiscal YearSource: NYC Department of Finance, Office of Tax Policy
73
UNINCORPORATED BUSINESS TAXChart 1
UBT
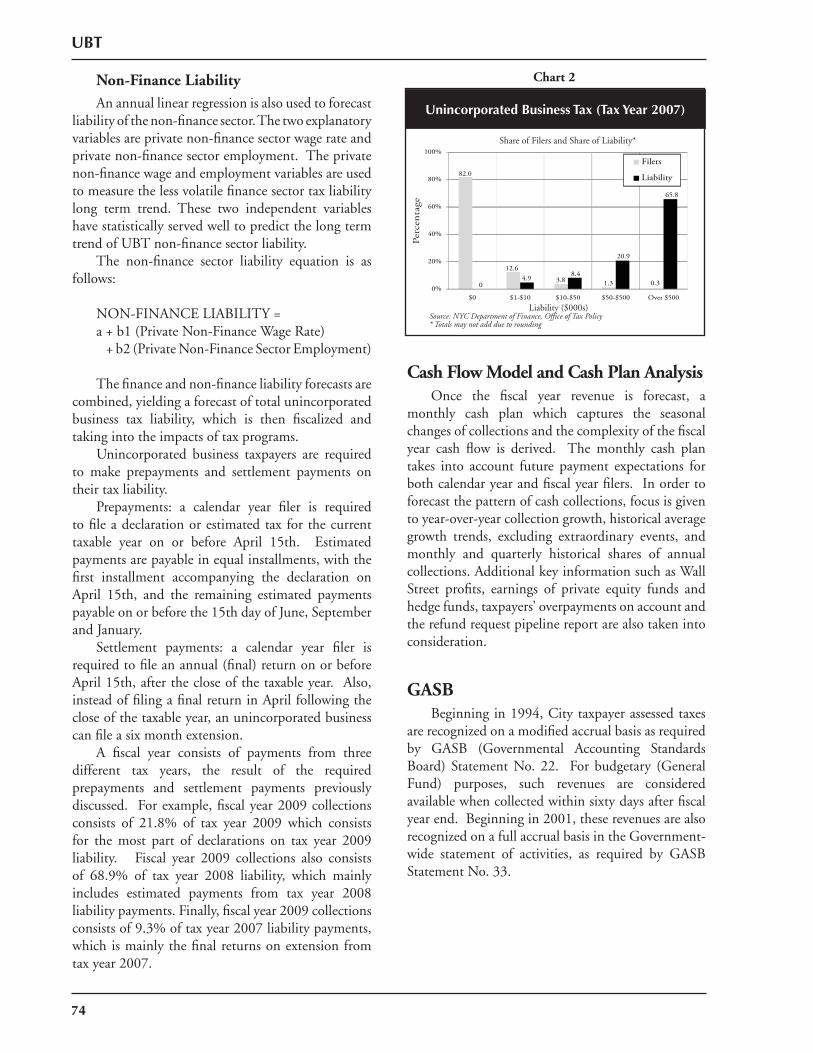
UBT
74
Unincorporated Business Tax (Tax Year 2007)
82.0
12.6
3.8 1.3 0.304.9 8.4
20.9
65.8
0%
20%
40%
60%
80%
100%
$0 $1-$10 $10-$50 $50-$500 Over $500
Filers
Liability
Liability ($000s)Source: NYC Department of Finance, Office of Tax Policy* Totals may not add due to rounding
Share of Filers and Share of Liability*
Perc
enta
ge
Non-Finance Liability An annual linear regression is also used to forecast liability of the non-fi nance sector. The two explanatory variables are private non-fi nance sector wage rate and private non-fi nance sector employment. The private non-fi nance wage and employment variables are used to measure the less volatile fi nance sector tax liability long term trend. These two independent variables have statistically served well to predict the long term trend of UBT non-fi nance sector liability. The non-fi nance sector liability equation is as follows:
NON-FINANCE LIABILITY = a + b1 (Private Non-Finance Wage Rate) + b2 (Private Non-Finance Sector Employment)
The fi nance and non-fi nance liability forecasts are combined, yielding a forecast of total unincorporated business tax liability, which is then fi scalized and taking into the impacts of tax programs. Unincorporated business taxpayers are required to make prepayments and settlement payments on their tax liability. Prepayments: a calendar year fi ler is required to fi le a declaration or estimated tax for the current taxable year on or before April 15th. Estimated payments are payable in equal installments, with the fi rst installment accompanying the declaration on April 15th, and the remaining estimated payments payable on or before the 15th day of June, September and January. Settlement payments: a calendar year fi ler is required to fi le an annual (fi nal) return on or before April 15th, after the close of the taxable year. Also, instead of fi ling a fi nal return in April following the close of the taxable year, an unincorporated business can fi le a six month extension. A fi scal year consists of payments from three different tax years, the result of the required prepayments and settlement payments previously discussed. For example, fi scal year 2009 collections consists of 21.8% of tax year 2009 which consists for the most part of declarations on tax year 2009 liability. Fiscal year 2009 collections also consists of 68.9% of tax year 2008 liability, which mainly includes estimated payments from tax year 2008 liability payments. Finally, fi scal year 2009 collections consists of 9.3% of tax year 2007 liability payments, which is mainly the fi nal returns on extension from tax year 2007.
Chart 2
Cash Flow Model and Cash Plan Analysis Once the fi scal year revenue is forecast, a monthly cash plan which captures the seasonal changes of collections and the complexity of the fi scal year cash fl ow is derived. The monthly cash plan takes into account future payment expectations for both calendar year and fi scal year fi lers. In order to forecast the pattern of cash collections, focus is given to year-over-year collection growth, historical average growth trends, excluding extraordinary events, and monthly and quarterly historical shares of annual collections. Additional key information such as Wall Street profi ts, earnings of private equity funds and hedge funds, taxpayers’ overpayments on account and the refund request pipeline report are also taken into consideration.
GASB Beginning in 1994, City taxpayer assessed taxes are recognized on a modifi ed accrual basis as required by GASB (Governmental Accounting Standards Board) Statement No. 22. For budgetary (General Fund) purposes, such revenues are considered available when collected within sixty days after fi scal year end. Beginning in 2001, these revenues are also recognized on a full accrual basis in the Government-wide statement of activities, as required by GASB Statement No. 33.
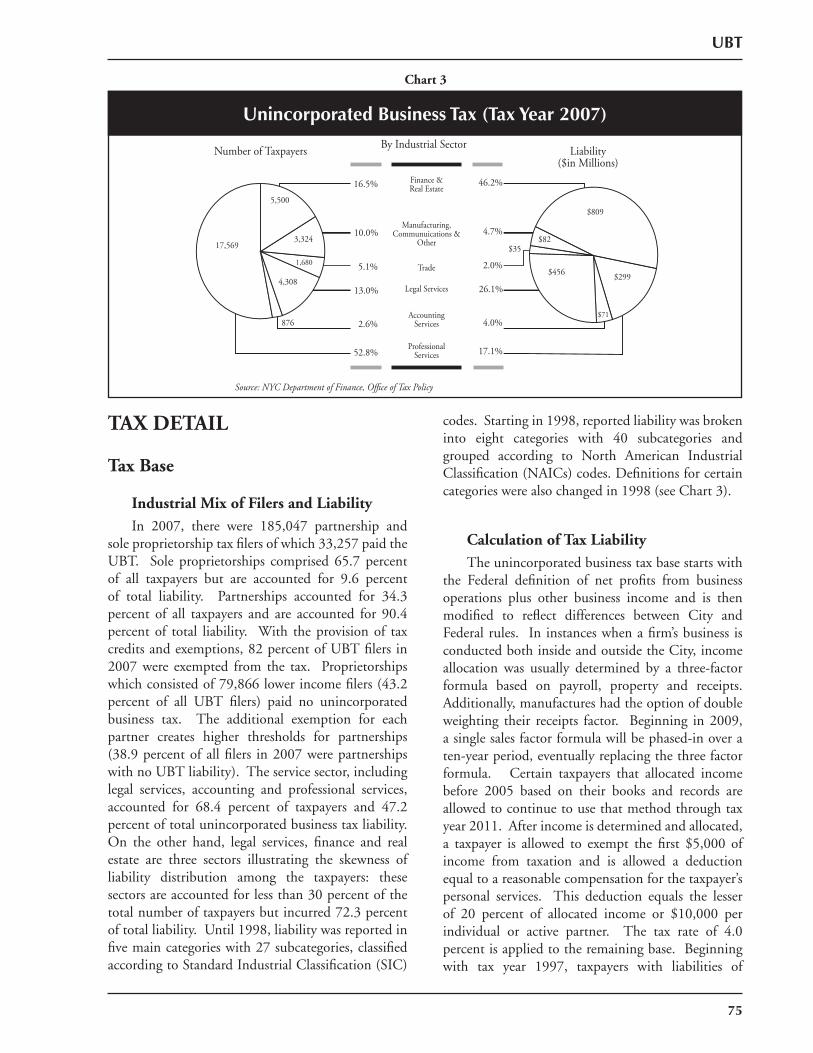
UBT
75
Chart 3
Taxing AuthorityUnincorporated Business Tax (Tax Year 2007)
TAX DETAIL
Tax Base
Industrial Mix of Filers and Liability In 2007, there were 185,047 partnership and sole proprietorship tax fi lers of which 33,257 paid the UBT. Sole proprietorships comprised 65.7 percent of all taxpayers but are accounted for 9.6 percent of total liability. Partnerships accounted for 34.3 percent of all taxpayers and are accounted for 90.4 percent of total liability. With the provision of tax credits and exemptions, 82 percent of UBT fi lers in 2007 were exempted from the tax. Proprietorships which consisted of 79,866 lower income fi lers (43.2 percent of all UBT fi lers) paid no unincorporated business tax. The additional exemption for each partner creates higher thresholds for partnerships (38.9 percent of all fi lers in 2007 were partnerships with no UBT liability). The service sector, including legal services, accounting and professional services, accounted for 68.4 percent of taxpayers and 47.2 percent of total unincorporated business tax liability. On the other hand, legal services, fi nance and real estate are three sectors illustrating the skewness of liability distribution among the taxpayers: these sectors are accounted for less than 30 percent of the total number of taxpayers but incurred 72.3 percent of total liability. Until 1998, liability was reported in fi ve main categories with 27 subcategories, classifi ed according to Standard Industrial Classifi cation (SIC)
codes. Starting in 1998, reported liability was broken into eight categories with 40 subcategories and grouped according to North American Industrial Classifi cation (NAICs) codes. Defi nitions for certain categories were also changed in 1998 (see Chart 3).
Calculation of Tax Liability The unincorporated business tax base starts with the Federal defi nition of net profi ts from business operations plus other business income and is then modifi ed to refl ect differences between City and Federal rules. In instances when a fi rm’s business is conducted both inside and outside the City, income allocation was usually determined by a three-factor formula based on payroll, property and receipts. Additionally, manufactures had the option of double weighting their receipts factor. Beginning in 2009, a single sales factor formula will be phased-in over a ten-year period, eventually replacing the three factor formula. Certain taxpayers that allocated income before 2005 based on their books and records are allowed to continue to use that method through tax year 2011. After income is determined and allocated, a taxpayer is allowed to exempt the fi rst $5,000 of income from taxation and is allowed a deduction equal to a reasonable compensation for the taxpayer’s personal services. This deduction equals the lesser of 20 percent of allocated income or $10,000 per individual or active partner. The tax rate of 4.0 percent is applied to the remaining base. Beginning with tax year 1997, taxpayers with liabilities of
Finance &Real Estate
Manufacturing,Communuications &
Other
Trade
Legal Services
AccountingServices
ProfessionalServices
16.5%
10.0%
5.1%
13.0%
2.6%
52.8%
46.2%
4.7%
2.0%
26.1%
4.0%
17.1%
By Industrial SectorNumber of Taxpayers Liability($in Millions)
5,500
3,324
1,680
4,308
876
17,569
$809
$299
$71
$456
$82$35
Source: NYC Department of Finance, Office of Tax Policy
UBT
76
$1,800 or less were entitled to a credit which eliminated their liability. The credit was reduced for taxpayers with liabilities between $1,800 and $3,200, and for liabilities of $3,200 and above no credit is allowed. The laws of 2009 enacted an increase in credits allowed. The full credit is now available for UBT liabilities up to $3,400, while for liabilities between $3,400 and $5,400, the credit is phased out. The effect of the credit is that unincorporated businesses with incomes under $100,000 pay no tax, and unincorporated businesses with incomes under $150,000 pay a reduced tax.
ADMINISTRATION The unincorporated business tax is administered by the New York City Department of Finance (DOF). The businesses subject to the tax must fi le according to a payment schedule that conforms to Federal and State fi ling dates. Effective for tax year 2009 and thereafter, any individual, partnership or unincorporated entity with unincorporated business gross income of more than $95,000 (prior to any deduction for cost of goods sold or services performed) must fi le an Unincorporated Business Tax Return. Effective for tax year 2008 and thereafter, every unincorporated business which operates in New York City must fi le quarterly declarations of estimated tax when its estimated tax can reasonably be expected to exceed $3,400. The unincorporated businesses with income that reached the above mentioned levels are required to submit installment payments with the following fi ling date deadlines: if the fi ling requirement occurs after January 1 but before April 1, the UBT fi ler is required to pay 25% of estimated tax for the tax year before April 15; if the requirement for fi ling occurs after April 1 but before June 2, the UBT fi ler is required to pay one third of estimated tax for the tax year before June 15; if the fi ling requirement occurs after June 1 but before Sept. 2, the UBT fi ler is required to pay one half of estimated tax for the tax year before September 15; fi nally, if the fi ling requirement occurs after September 1 but before January 1, the UBT fi ler is required to pay 100% of estimated tax for the tax year before January 18. A fi nal return for the tax year is due on April 15 (if April 15 falls on a weekend, the due date will be the following Monday). Annual returns are granted an automatic six month extension. If eligible, the business can fi le for an additional six month extension.
TAX TREATMENT OF LLC, PRIVATE EQUITY FUNDS AND HEDGE FUND COMPANIES
Limited Liability Companies (LLCs) In July 1994, New York State passed legislation allowing the formation of limited liability companies (LLCs). These business entities have the limited liability of corporations, but the organizational fl exibility and tax treatment of partnerships. At the Federal level, LLCs are not taxed as separate entities, but partners are taxed on their share of the income. In New York City, Limited Liability Partnerships (LLPs) and LLCs pay the unincorporated business tax. As a result businesses have increasingly opted to form LLPs or LLCs rather than corporations.
Private Equity Funds and Hedge Funds The majority of private equity funds and hedge funds located in New York City are organized as limited liability partnerships (LLPs) or limited liabilities companies (LLCs), and generate profi ts from charging a management fee and a performance-based fee called “carried interest.” Management fees, typically two percent of a fund’s invested capital, are subject to the unincorporated business tax. Carried interest income, typically 20 percent of a fund’s annual return from invested capital, is treated for City tax purposes as income derived from trading on one’s own account and therefore is exempt from the UBT. If a managing partner has invested signifi cant capital into the fund, then the he would receive a partial self-trading exemption on the management fees earned. However, partners (including managing partners) must recognize pass through income from management fees and carried interest income on their City personal income tax return.
LEGISLATIVE HISTORY Since the imposition of the Unincorporated Business Tax in 1966, the tax rate has remained at 4 percent. Major legislative changes related to the tax are highlighted below, starting with the most recent. In an effort to conform to New York State’s tax law in June 2009, New York City enacted a series of amendments to the City’s unincorporated business tax. These amendments include: the replacement of the three factor allocation formula with a single sales
UBT
77
factor apportionment formula over a 10-year phase-in period, the customer sourcing of broker/dealer receipts, higher graduated sliding-scale business tax credits against tax liability and an increased fi ling threshold. Effective for tax years beginning on January 1, 2009 and thereafter, the UBT instant credit against liability is raised to $3,400 and phased-out between $3,400 and $5,400. The higher credit will eliminate tax liabilities up to $3,400 (taxable incomes up to $100,000 for unincorporated businesses) and will provide tax reduction for liabilities up to $5,400 (taxable incomes up to $150,000 for unincorporated businesses). No credit will be allowed for taxpayers whose liabilities are greater or equal to $5,400 (taxable incomes greater than $150,000). Effective for tax years beginning on January 1, 2007 and thereafter, the unincorporated business per partner (and proprietor) deduction in lieu of the deduction of partnership salaries from fi rm’s net income was raised from $5,000 to $10,000 (provided that the total amount deductible does not exceed 20 percent of the fi rm’s taxable income). Prior to this $10,000 deduction per partner and proprietor, the deduction had been unchanged at $5,000 since the unincorporated business tax was enacted in 1966. New York City residents are allowed to claim a credit against the City personal income tax for a percentage of the unincorporated business taxed paid by businesses they carry on as sole proprietors or by partnerships in which they are partners. For tax years beginning on or after January 1, 2007, the percentage is increased from 65 percent to 100 percent for resident taxpayers whose taxable income is not more than $42,000; for taxpayers whose taxable income is $142,000 or more, the percentage is increased from 15 percent to 23 percent; and for taxpayers with income above $42,000 but less than $142,000, a statutory formula produces a percentage that declines from 100 percent to 23 percent as income rises from $42,000 to $142,000. For tax years beginning on or after January 1, 2005, fi lm and television companies may claim a credit against the unincorporated business (or general corporation) tax equal to 5.0 percent of specifi ed production costs incurred in producing a qualifi ed fi lm or television program in the City. A total amount of credits to be allocated per calendar year was originally $12.5 million. If the total amount of allocated credits exceeds the maximum amount of credits, the excess is treated as having been applied for the fi rst day of the subsequent year. The total
amount of credits allocated in the fi rst four years was $50 million. The credit was set to expire on August 20, 2008. Effective July 11, 2006, the fi lm credit was enhanced with an annual credit allocation increased to $30 million per calendar year. The former allocation policy was kept in place: allocated credits that exceed the $30 million annual target can be carried over to the following year. The tax credit was also extended through December 31, 2011. The total amount of credits allowed through calendar year 2011 is $205 million, an increase of $155 million over the original amount. State legislation also enacted a State credit for qualifying costs of producing certain TV, radio and movie theatre commercials. The City has the authorization to adopt a local law for a similar credit but has taken no action to date on that authorization. In an effort to bring the UBT into closer conformity with the general corporation tax, the following UBT amendments were adopted. First, for tax years beginning after 2004, the books and records method of allocating business income will no longer be the preferred allocation method under the UBT. Taxpayers will be required to use the three-factor allocation formula, unless it fails to properly refl ect New York City income. A taxpayer that validly used the books and records method for the two tax years before the 2005 tax year may make a revocable election to continue to use that method through the 2011 tax year. For partnerships or other entities making the election, a continuity-of-ownership test must be satisfi ed for the election to continue during the entire period. Second, for tax years beginning after 2004, personal property rented to the taxpayer will be included in the property factor of the business allocation formula, and will be valued at eight times the annual rent payable. Third, in calculating the receipts factor of the business allocation formula, receipts from the performance of services will be allocated to the City to the extent that the services are performed in the City. For taxpayers with total gross receipts of less than $100,000, the new rule applies for tax years that begin on or after July 1, 2005; for those whose gross receipts are under $300,000, the rule is effective for years beginning on or after July 1, 2006; and for all other taxpayers, it takes effect for years beginning on or after July 1, 2007. Fourth, UBT provisions that reduced certain tax benefi ts related to highly leveraged merger and acquisition transactions have been repealed, retroactive to years beginning on or after January 1, 2000, the effective date of the repeal of comparable general corporation tax provisions.
UBT
78
The Federal Jobs and Growth Tax Relief Reconciliation Act of 2003 amended federal tax law which passed through to UBT. The fi rst-year depreciation deduction was increased from 30 percent to 50 percent for property acquired after May 5, 2003 and before January 1, 2005. All of the original eligibility rules that applied to the 2002 deduction apply to the 2003 deduction. The Federal Job Creation and Worker Assistance Act of 2002 amended existing federal tax law that allowed businesses to recover through an annual depreciation deduction the cost of certain property used in doing business. This amendment allowed business taxpayers to take an additional 30 percent depreciation deduction in the fi rst year “qualifi ed property” is placed in service. A similar depreciation deduction for “qualifi ed property” in the New York Liberty Zone (NYLZ) and the Resurgence Zone is allowed. The NYLZ generally encompasses the area in the borough of Manhattan below Canal Street and the Resurgence Zone encompasses the area between Canal Street and Houston Street. Additionally, the 2002 Act also allows NYLZ leasehold improvements to be depreciated over a fi ve-year period using a straight line method as well as an additional fi rst-year expense deduction of up to $35,000 for “qualifi ed NYLZ property”. To avoid a signifi cant loss of revenue, New York City unincorporated business tax law was amended to limit the depreciation deductions to “qualifi ed property” within the NYLZ and the Resurgence Zone and to limit the additional fi rst-year expense deduction to “qualifi ed NYLZ property”. As a result of the September 11, 2001 terrorist attack, the fi ling deadline for the quarterly estimated tax payment due September 17, 2001 was extended to December 17, 2001. Effective for tax years beginning on January 1, 2000 and thereafter, the allocation formula for regulated investment companies (mutual funds) was relaxed. The receipts factor of the three factor income allocation formula (payroll, property and receipts) was amended to permit receipts from management, administration or distribution services for regulated investment companies (mutual funds) to be allocated based on the domicile of the mutual funds’ shareholders. The City’s tax program for 1998 revised the unincorporated business tax credit increase granted in the 1996 tax program. For tax years 1997 and thereafter, the maximum credit was lifted to $1,800 with the level of liability at which the credit phases out at $3,200. The new credit eliminates the
unincorporated business tax for sole proprietors with net income up to $55,000. Beginning in 1996, certain unincorporated businesses (including LLCs) treated as corporations for Federal and State tax purposes became subject to the City’s general corporation tax. This law lists several exceptions for businesses subject to the unincorporated business tax in 1995, which may elect to irrevocably continue in that status. The City’s tax program for 1996 made several important changes to the unincorporated business tax law. The unincorporated business tax credit was raised from a maximum of $600 to $1,000 over a period of two years. The maximum credit was $800 for tax year 1996, growing to $1,000 for tax years 1997 and thereafter. The level of tax liability at which the credit is phased out was also raised to $1,000 in 1996 and to $2,000 in 1997. To correspond to the new higher credit, the thresholds for making estimated payments and for fi ling annual returns were also raised. Changes were also made to the rules governing the allocation of business income. The “regular place of business” requirement was repealed, allowing businesses to allocate income to sales outside the City, even when they have no regular place of business outside the City. Manufacturers are now allowed to “double weight” the receipts factor when allocating income. All businesses with receipts from the sale of tangible goods, as opposed to services, no longer have to allocate income to the City for goods shipped to points outside the City. Finally, broadcasters and publishers are now allowed to allocate income based upon audience location. Also in 1996, a number of the tax reform measures passed in July of 1994 were enhanced. The exemptions for other sources of income for “self trading” entities and for real estate management companies were extended. Provisions were enacted that exempted income from self-trading activities for unincorporated entities that were primarily engaged in trading for their own account or in the ownership, as an investor, of interests in unincorporated entities engaged in unincorporated business activities in the City. This provision is in addition to the self-trading exemption. An unincorporated entity qualifying for the partial exemption is allowed to exclude from its unincorporated business gross income any income and gains from activity qualifying for the self-trading exemption. Prior to the change, any amount of income could “taint” the trading income, causing all of it to be taxed. Further, rules for apportioning investment income subject to tax were conformed to the general
UBT
79
corporation tax (issuer’s allocation percentage). Additions also were made to the number of fi nancial instruments used by self-traders and a “primarily engaged” test was established, which defi nes taxpayers as self-trading according to the nature of their assets. In July of 1994, several reforms were enacted. First, the self-trading exemption was broadened to allow fi rms, which are generally exempt from the unincorporated business tax under this provision, to retain the exemption on their self-trading income if they have gross receipts of $25,000 or less from business activities (normally subject to the tax). Second, owners and operators of real property with income from business activities were able to retain the exemption on income from their real estate activity if the business income was incidental and carried on solely for the benefi t of the tenants as in the case of a garage or health club. Finally, partnerships which are corporations or unincorporated businesses subject to City tax were granted a credit for the share of taxes paid by the partnership in lieu of the exemption for the distribution which existed prior to the change. Two signifi cant amendments were enacted in 1987. The unincorporated business tax credit was raised from $100 to a maximum of $600 and the taxable income threshold for making estimated payments was raised from $2,500 to $15,000. The higher credit removed approximately 30,000 taxpayers from the tax rolls. Prior to 1971 exemptions were made for professions where capital was not an income-producing factor and where more than 80 percent of the gross income was derived from personal service. This primarily affected attorneys, doctors, accountants and other professionals. Beginning in tax year 1971, all such professionals were added to the City’s unincorporated business tax base.

80

RPTT
81
REAL PROPERTY TRANSFER TAX
Table of Contents
Overview ...................................................................................................................................83
Forecasting Methodology ...........................................................................................................83
Tax Detail ..................................................................................................................................84
Legislative History .....................................................................................................................84

RPTT
82
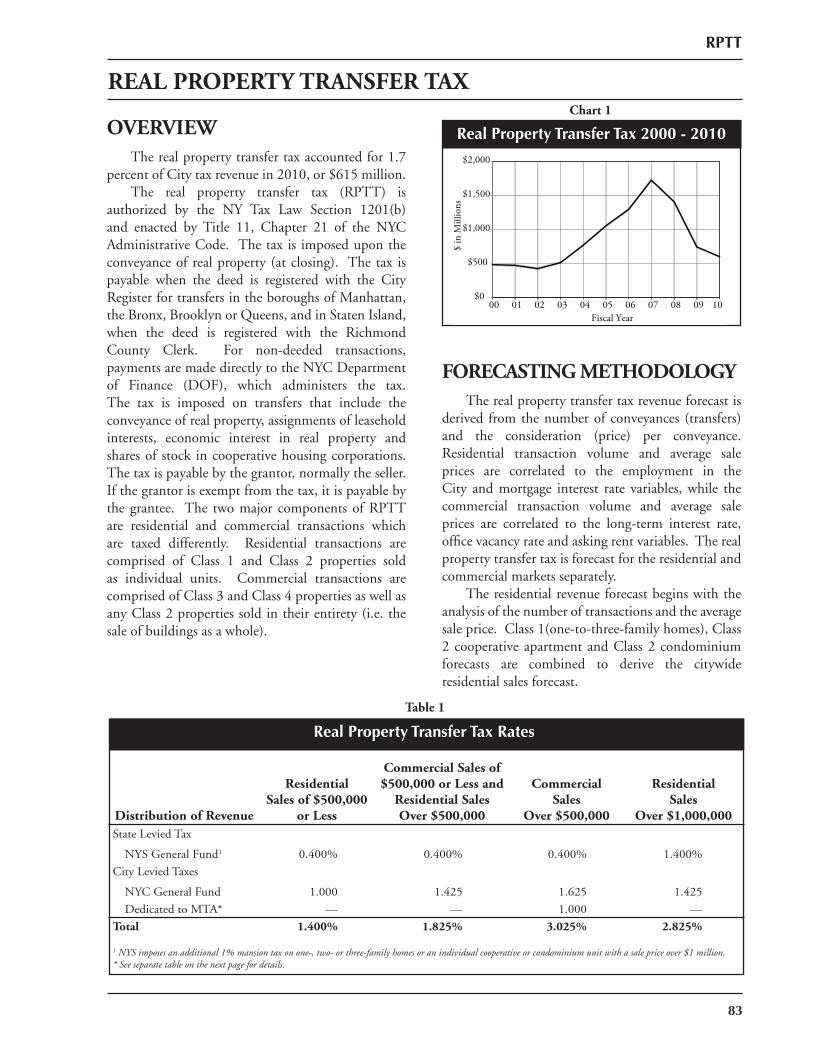
RPTT
83
REAL PROPERTY TRANSFER TAXChart 1
Real Property Transfer Tax 2000 - 2010OVERVIEW The real property transfer tax accounted for 1.7 percent of City tax revenue in 2010, or $615 million. The real property transfer tax (RPTT) is authorized by the NY Tax Law Section 1201(b) and enacted by Title 11, Chapter 21 of the NYC Administrative Code. The tax is imposed upon the conveyance of real property (at closing). The tax is payable when the deed is registered with the City Register for transfers in the boroughs of Manhattan, the Bronx, Brooklyn or Queens, and in Staten Island, when the deed is registered with the Richmond County Clerk. For non-deeded transactions, payments are made directly to the NYC Department of Finance (DOF), which administers the tax. The tax is imposed on transfers that include the conveyance of real property, assignments of leasehold interests, economic interest in real property and shares of stock in cooperative housing corporations. The tax is payable by the grantor, normally the seller. If the grantor is exempt from the tax, it is payable by the grantee. The two major components of RPTT are residential and commercial transactions which are taxed differently. Residential transactions are comprised of Class 1 and Class 2 properties sold as individual units. Commercial transactions are comprised of Class 3 and Class 4 properties as well as any Class 2 properties sold in their entirety (i.e. the sale of buildings as a whole).
FORECASTING METHODOLOGY The real property transfer tax revenue forecast is derived from the number of conveyances (transfers) and the consideration (price) per conveyance. Residential transaction volume and average sale prices are correlated to the employment in the City and mortgage interest rate variables, while the commercial transaction volume and average sale prices are correlated to the long-term interest rate, offi ce vacancy rate and asking rent variables. The real property transfer tax is forecast for the residential and commercial markets separately. The residential revenue forecast begins with the analysis of the number of transactions and the average sale price. Class 1(one-to-three-family homes), Class 2 cooperative apartment and Class 2 condominium forecasts are combined to derive the citywide residential sales forecast.
$0
$500
$1,000
$1,500
$2,000
00 01 02 03 04 05 06 07 08 09 10
$ in
Mill
ions
Fiscal Year
Distribution of Revenue
ResidentialSales of $500,000
or Less
Commercial Sales of$500,000 or Less and
Residential SalesOver $500,000
CommercialSales
Over $500,000
ResidentialSales
Over $1,000,000State Levied Tax
NYS General Fund1 0.400% 0.400% 0.400% 1.400%
City Levied Taxes
NYC General Fund 1.000 1.425 1.625 1.425
Dedicated to MTA* –– –– 1.000 ––
Total 1.400% 1.825% 3.025% 2.825%
1 NYS imposes an additional 1% mansion tax on one-, two- or three-family homes or an individual cooperative or condominium unit with a sale price over $1 million.* See separate table on the next page for details.
Table 1
Taxing AuthorityReal Property Transfer Tax Rates
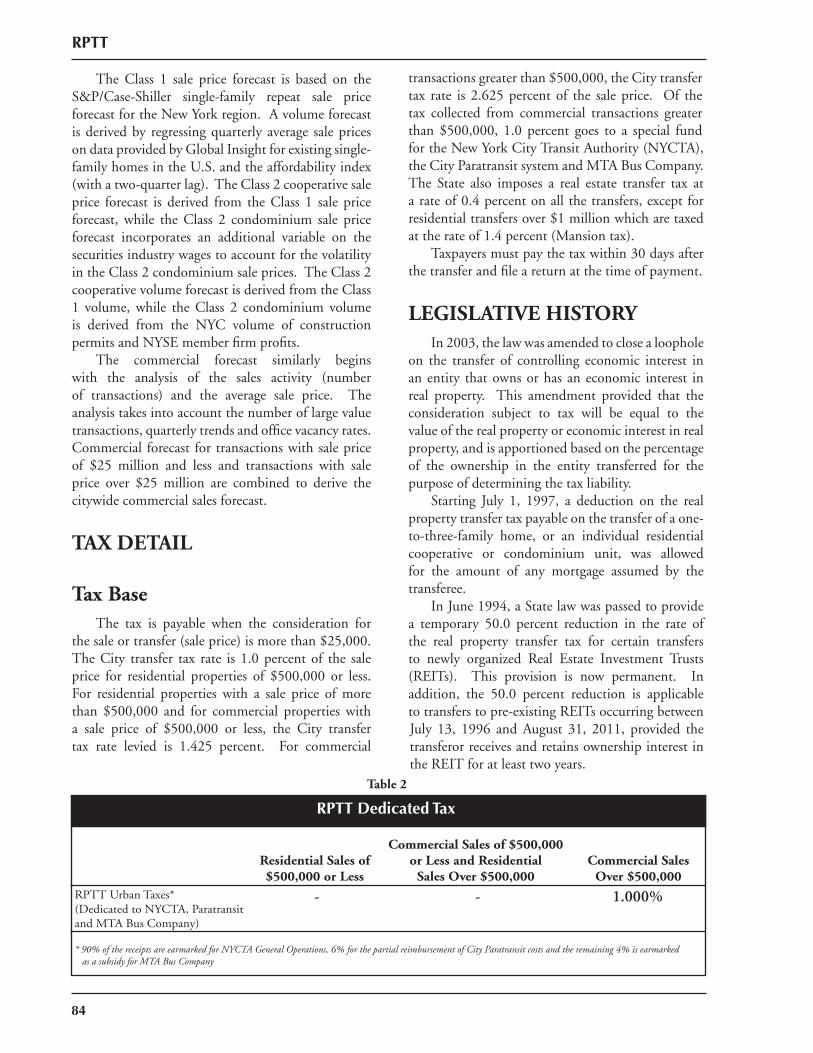
RPTT
84
The Class 1 sale price forecast is based on the S&P/Case-Shiller single-family repeat sale price forecast for the New York region. A volume forecast is derived by regressing quarterly average sale prices on data provided by Global Insight for existing single-family homes in the U.S. and the affordability index (with a two-quarter lag). The Class 2 cooperative sale price forecast is derived from the Class 1 sale price forecast, while the Class 2 condominium sale price forecast incorporates an additional variable on the securities industry wages to account for the volatility in the Class 2 condominium sale prices. The Class 2 cooperative volume forecast is derived from the Class 1 volume, while the Class 2 condominium volume is derived from the NYC volume of construction permits and NYSE member fi rm profi ts. The commercial forecast similarly begins with the analysis of the sales activity (number of transactions) and the average sale price. The analysis takes into account the number of large value transactions, quarterly trends and offi ce vacancy rates. Commercial forecast for transactions with sale price of $25 million and less and transactions with sale price over $25 million are combined to derive the citywide commercial sales forecast.
TAX DETAIL
Tax Base The tax is payable when the consideration for the sale or transfer (sale price) is more than $25,000. The City transfer tax rate is 1.0 percent of the sale price for residential properties of $500,000 or less. For residential properties with a sale price of more than $500,000 and for commercial properties with a sale price of $500,000 or less, the City transfer tax rate levied is 1.425 percent. For commercial
transactions greater than $500,000, the City transfer tax rate is 2.625 percent of the sale price. Of the tax collected from commercial transactions greater than $500,000, 1.0 percent goes to a special fund for the New York City Transit Authority (NYCTA), the City Paratransit system and MTA Bus Company. The State also imposes a real estate transfer tax at a rate of 0.4 percent on all the transfers, except for residential transfers over $1 million which are taxed at the rate of 1.4 percent (Mansion tax). Taxpayers must pay the tax within 30 days after the transfer and fi le a return at the time of payment.
LEGISLATIVE HISTORY In 2003, the law was amended to close a loophole on the transfer of controlling economic interest in an entity that owns or has an economic interest in real property. This amendment provided that the consideration subject to tax will be equal to the value of the real property or economic interest in real property, and is apportioned based on the percentage of the ownership in the entity transferred for the purpose of determining the tax liability. Starting July 1, 1997, a deduction on the real property transfer tax payable on the transfer of a one-to-three-family home, or an individual residential cooperative or condominium unit, was allowed for the amount of any mortgage assumed by the transferee. In June 1994, a State law was passed to provide a temporary 50.0 percent reduction in the rate of the real property transfer tax for certain transfers to newly organized Real Estate Investment Trusts (REITs). This provision is now permanent. In addition, the 50.0 percent reduction is applicable to transfers to pre-existing REITs occurring between July 13, 1996 and August 31, 2011, provided the transferor receives and retains ownership interest in the REIT for at least two years.
Residential Sales of $500,000 or Less
Commercial Sales of $500,000 or Less and Residential
Sales Over $500,000Commercial Sales
Over $500,000RPTT Urban Taxes*(Dedicated to NYCTA, Paratransit and MTA Bus Company)
- - 1.000%
* 90% of the receipts are earmarked for NYCTA General Operations, 6% for the partial reimbursement of City Paratransit costs and the remaining 4% is earmarked as a subsidy for MTA Bus Company
Table 2
Taxing AuthorityRPTT Dedicated Tax
85
RPTT
In August 1989, the tax rate was raised from 1.0 percent to 1.425 percent for commercial transactions of $500,000 or less and residential transactions of more than $500,000. For commercial sales with consideration greater than $500,000, the tax rate was increased from 1.0 percent to 1.625 percent. The same legislation expanded the tax base to include resale of residential cooperative apartments, the remaining category of untaxed cooperative transactions. In July 1989, the State imposed an additional tax rate of 1.0 percent on residential transfers with a sale price of $1,000,000 or more. Legislation expanded the base beginning in 1987 by including transfers of a majority interest in an entity which owns real property in New York City (the “Pan Am” tax). Only the value of the property is taxable, not the value of the entire interest. This change was enacted to prevent avoidance of the tax when a transfer takes place but formal ownership of the property remains unchanged. Initial transfers of cooperative apartment units were also made subject to the “Pan Am” tax. In 1982, the tax rate was raised from 1.0 percent to 2.0 percent for commercial transfers with a sale price of $500,000 or more. Revenue from the rate increase of 1.0 percent is dedicated to the NYCTA, Paratransit and certain private bus operators franchised by the City. At the same time, the base of the tax was expanded to include leasehold transfers and to disallow the deduction for continuing liens. In 1971, the real property tax rate was raised from 0.5 percent to 1.0 percent of the amount of the net consideration. Effective 1968, the State imposed a real estate transfer tax on residential and commercial properties at a rate of 0.4 percent of the sale price. The real property transfer tax came into effect for the fi rst time in 1959 at a rate of 0.5 percent of the sale price.

86
87
MRT
MORTGAGE RECORDING TAX
Table of Contents
Overview ...................................................................................................................................89
Forecasting Methodology ...........................................................................................................89
Tax Detail ..................................................................................................................................90
Legislative History .....................................................................................................................90

88
MRT
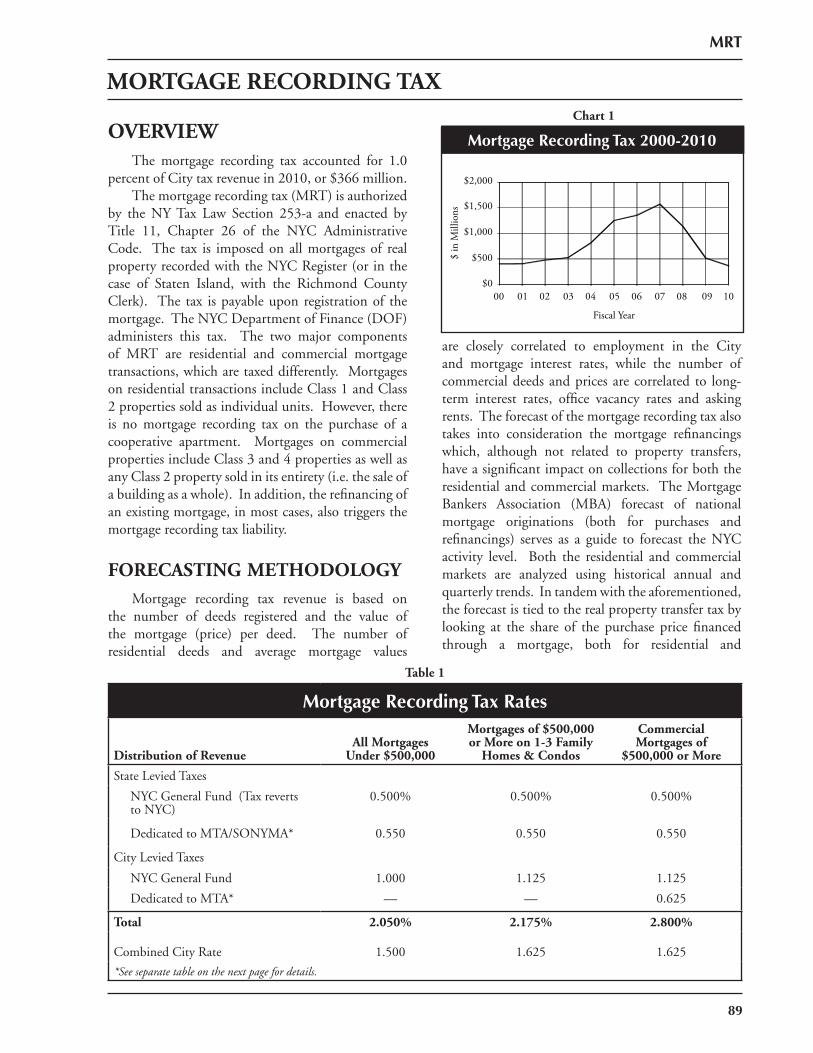
OVERVIEWThe mortgage recording tax accounted for 1.0
percent of City tax revenue in 2010, or $366 million.The mortgage recording tax (MRT) is authorized
by the NY Tax Law Section 253-a and enacted by Title 11, Chapter 26 of the NYC Administrative Code. The tax is imposed on all mortgages of real property recorded with the NYC Register (or in the case of Staten Island, with the Richmond County Clerk). The tax is payable upon registration of the mortgage. The NYC Department of Finance (DOF) administers this tax. The two major components of MRT are residential and commercial mortgage transactions, which are taxed differently. Mortgages on residential transactions include Class 1 and Class 2 properties sold as individual units. However, there is no mortgage recording tax on the purchase of a cooperative apartment. Mortgages on commercial properties include Class 3 and 4 properties as well as any Class 2 property sold in its entirety (i.e. the sale of a building as a whole). In addition, the refi nancing of an existing mortgage, in most cases, also triggers the mortgage recording tax liability.
FORECASTING METHODOLOGYMortgage recording tax revenue is based on
the number of deeds registered and the value of the mortgage (price) per deed. The number of residential deeds and average mortgage values
are closely correlated to employment in the City and mortgage interest rates, while the number of commercial deeds and prices are correlated to long-term interest rates, offi ce vacancy rates and asking rents. The forecast of the mortgage recording tax also takes into consideration the mortgage refi nancings which, although not related to property transfers, have a signifi cant impact on collections for both the residential and commercial markets. The Mortgage Bankers Association (MBA) forecast of national mortgage originations (both for purchases and refi nancings) serves as a guide to forecast the NYC activity level. Both the residential and commercial markets are analyzed using historical annual and quarterly trends. In tandem with the aforementioned, the forecast is tied to the real property transfer tax by looking at the share of the purchase price fi nanced through a mortgage, both for residential and
Table 1
Mortgage Recording Tax Rates
Distribution of RevenueAll Mortgages
Under $500,000
Mortgages of $500,000 or More on 1-3 Family
Homes & Condos
CommercialMortgages of
$500,000 or More
State Levied Taxes
NYC General Fund (Tax reverts to NYC)
0.500% 0.500% 0.500%
Dedicated to MTA/SONYMA* 0.550 0.550 0.550
City Levied Taxes
NYC General Fund 1.000 1.125 1.125
Dedicated to MTA* –– –– 0.625
Total 2.050% 2.175% 2.800%
Combined City Rate 1.500 1.625 1.625
*See separate table on the next page for details.
89
MORTGAGE RECORDING TAX
MRT
Chart 1
Mortgage Recording Tax 2000-2010
$0
$500
$1,000
$1,500
$2,000
00 01 02 03 04 05 06 07 08 09 10
$ in
Mill
ions
Fiscal Year
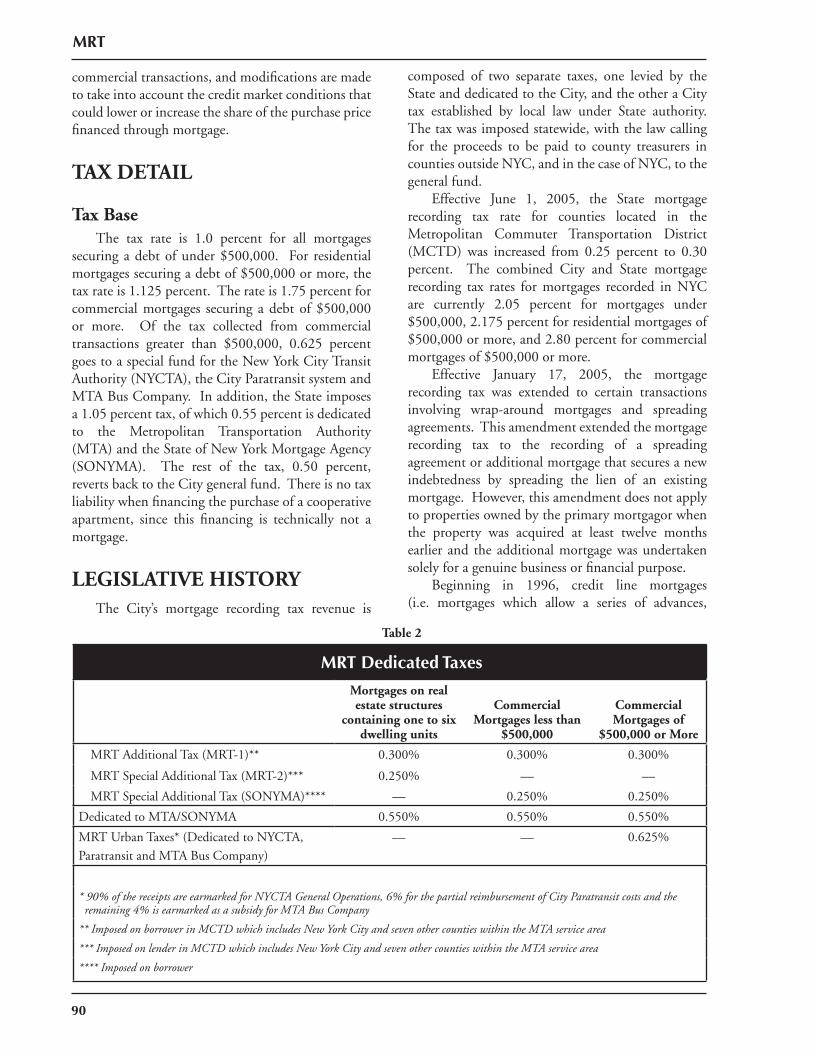
90
commercial transactions, and modifi cations are made to take into account the credit market conditions that could lower or increase the share of the purchase price fi nanced through mortgage.
TAX DETAIL
Tax BaseThe tax rate is 1.0 percent for all mortgages
securing a debt of under $500,000. For residential mortgages securing a debt of $500,000 or more, the tax rate is 1.125 percent. The rate is 1.75 percent for commercial mortgages securing a debt of $500,000 or more. Of the tax collected from commercial transactions greater than $500,000, 0.625 percent goes to a special fund for the New York City Transit Authority (NYCTA), the City Paratransit system and MTA Bus Company. In addition, the State imposes a 1.05 percent tax, of which 0.55 percent is dedicated to the Metropolitan Transportation Authority (MTA) and the State of New York Mortgage Agency (SONYMA). The rest of the tax, 0.50 percent, reverts back to the City general fund. There is no tax liability when fi nancing the purchase of a cooperative apartment, since this fi nancing is technically not a mortgage.
LEGISLATIVE HISTORYThe City’s mortgage recording tax revenue is
composed of two separate taxes, one levied by the State and dedicated to the City, and the other a City tax established by local law under State authority. The tax was imposed statewide, with the law calling for the proceeds to be paid to county treasurers in counties outside NYC, and in the case of NYC, to the general fund.
Effective June 1, 2005, the State mortgage recording tax rate for counties located in the Metropolitan Commuter Transportation District (MCTD) was increased from 0.25 percent to 0.30 percent. The combined City and State mortgage recording tax rates for mortgages recorded in NYC are currently 2.05 percent for mortgages under $500,000, 2.175 percent for residential mortgages of $500,000 or more, and 2.80 percent for commercial mortgages of $500,000 or more.
Effective January 17, 2005, the mortgage recording tax was extended to certain transactions involving wrap-around mortgages and spreading agreements. This amendment extended the mortgage recording tax to the recording of a spreading agreement or additional mortgage that secures a new indebtedness by spreading the lien of an existing mortgage. However, this amendment does not apply to properties owned by the primary mortgagor when the property was acquired at least twelve months earlier and the additional mortgage was undertaken solely for a genuine business or fi nancial purpose.
Beginning in 1996, credit line mortgages (i.e. mortgages which allow a series of advances,
Table 2
MRT Dedicated Taxes
Mortgages on real estate structures
containing one to six dwelling units
Commercial Mortgages less than
$500,000
Commercial Mortgages of
$500,000 or More
MRT Additional Tax (MRT-1)** 0.300% 0.300% 0.300%
MRT Special Additional Tax (MRT-2)*** 0.250% –– ––
MRT Special Additional Tax (SONYMA)**** –– 0.250% 0.250%
Dedicated to MTA/SONYMA 0.550% 0.550% 0.550%
MRT Urban Taxes* (Dedicated to NYCTA, Paratransit and MTA Bus Company)
–– –– 0.625%
* 90% of the receipts are earmarked for NYCTA General Operations, 6% for the partial reimbursement of City Paratransit costs and the remaining 4% is earmarked as a subsidy for MTA Bus Company
** Imposed on borrower in MCTD which includes New York City and seven other counties within the MTA service area
*** Imposed on lender in MCTD which includes New York City and seven other counties within the MTA service area
**** Imposed on borrower
MRT
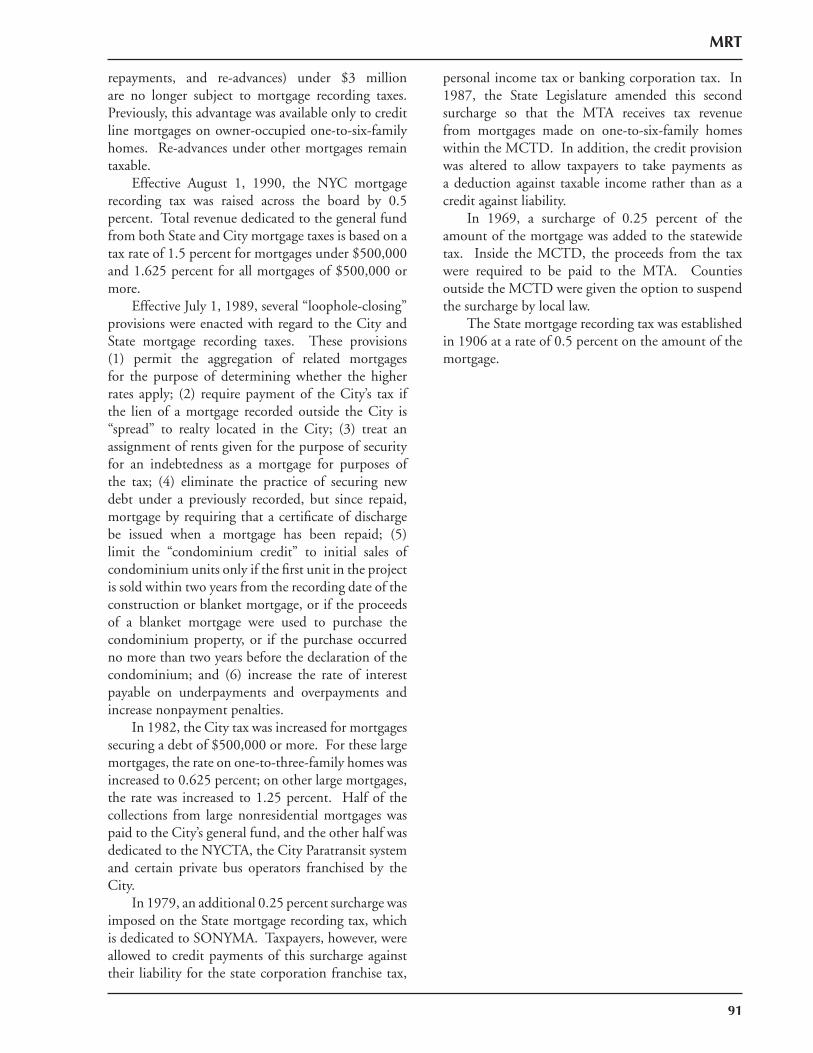
91
repayments, and re-advances) under $3 million are no longer subject to mortgage recording taxes. Previously, this advantage was available only to credit line mortgages on owner-occupied one-to-six-family homes. Re-advances under other mortgages remain taxable.
Effective August 1, 1990, the NYC mortgage recording tax was raised across the board by 0.5 percent. Total revenue dedicated to the general fund from both State and City mortgage taxes is based on a tax rate of 1.5 percent for mortgages under $500,000 and 1.625 percent for all mortgages of $500,000 or more.
Effective July 1, 1989, several “loophole-closing” provisions were enacted with regard to the City and State mortgage recording taxes. These provisions (1) permit the aggregation of related mortgages for the purpose of determining whether the higher rates apply; (2) require payment of the City’s tax if the lien of a mortgage recorded outside the City is “spread” to realty located in the City; (3) treat an assignment of rents given for the purpose of security for an indebtedness as a mortgage for purposes of the tax; (4) eliminate the practice of securing new debt under a previously recorded, but since repaid, mortgage by requiring that a certifi cate of discharge be issued when a mortgage has been repaid; (5) limit the “condominium credit” to initial sales of condominium units only if the fi rst unit in the project is sold within two years from the recording date of the construction or blanket mortgage, or if the proceeds of a blanket mortgage were used to purchase the condominium property, or if the purchase occurred no more than two years before the declaration of the condominium; and (6) increase the rate of interest payable on underpayments and overpayments and increase nonpayment penalties.
In 1982, the City tax was increased for mortgages securing a debt of $500,000 or more. For these large mortgages, the rate on one-to-three-family homes was increased to 0.625 percent; on other large mortgages, the rate was increased to 1.25 percent. Half of the collections from large non residential mortgages was paid to the City’s general fund, and the other half was dedicated to the NYCTA, the City Paratransit system and certain private bus operators franchised by the City.
In 1979, an additional 0.25 percent surcharge was imposed on the State mortgage recording tax, which is dedicated to SONYMA. Taxpayers, however, were allowed to credit payments of this surcharge against their liability for the state corporation franchise tax,
personal income tax or banking corporation tax. In 1987, the State Legislature amended this second surcharge so that the MTA receives tax revenue from mortgages made on one-to-six-family homes within the MCTD. In addition, the credit provision was altered to allow taxpayers to take payments as a deduction against taxable income rather than as a credit against liability.
In 1969, a surcharge of 0.25 percent of the amount of the mortgage was added to the statewide tax. Inside the MCTD, the proceeds from the tax were required to be paid to the MTA. Counties outside the MCTD were given the option to suspend the surcharge by local law.
The State mortgage recording tax was established in 1906 at a rate of 0.5 percent on the amount of the mortgage.
MRT

92
CRT
93
COMMERCIAL RENT TAX
Table of Contents
Overview ................................................................................................................................. 95
Forecasting Methodology ...........................................................................................................95
Tax Detail ..................................................................................................................................95
Legislative History .....................................................................................................................95

CRT
94
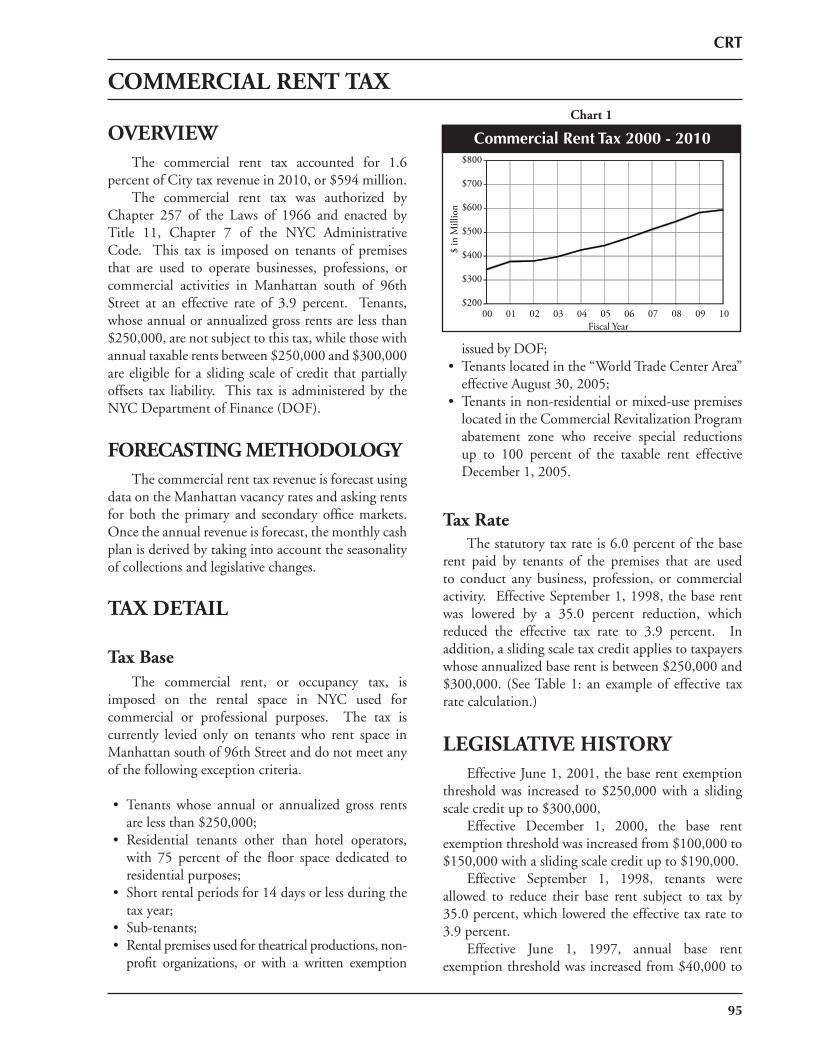
CRT
COMMERCIAL RENT TAX
95
issued by DOF; • Tenants located in the “World Trade Center Area”
effective August 30, 2005;• Tenants in non-residential or mixed-use premises
located in the Commercial Revitalization Program abatement zone who receive special reductions up to 100 percent of the taxable rent effective December 1, 2005.
Tax Rate The statutory tax rate is 6.0 percent of the base rent paid by tenants of the premises that are used to conduct any business, profession, or commercial activity. Effective September 1, 1998, the base rent was lowered by a 35.0 percent reduction, which reduced the effective tax rate to 3.9 percent. In addition, a sliding scale tax credit applies to taxpayers whose annualized base rent is between $250,000 and $300,000. (See Table 1: an example of effective tax rate calculation.)
LEGISLATIVE HISTORY Effective June 1, 2001, the base rent exemption threshold was increased to $250,000 with a sliding scale credit up to $300,000, Effective December 1, 2000, the base rent exemption threshold was increased from $100,000 to $150,000 with a sliding scale credit up to $190,000. Effective September 1, 1998, tenants were allowed to reduce their base rent subject to tax by 35.0 percent, which lowered the effective tax rate to 3.9 percent. Effective June 1, 1997, annual base rent exemption threshold was increased from $40,000 to
OVERVIEW The commercial rent tax accounted for 1.6 percent of City tax revenue in 2010, or $594 million. The commercial rent tax was authorized by Chapter 257 of the Laws of 1966 and enacted by Title 11, Chapter 7 of the NYC Administrative Code. This tax is imposed on tenants of premises that are used to operate businesses, professions, or commercial activities in Manhattan south of 96th Street at an effective rate of 3.9 percent. Tenants, whose annual or annualized gross rents are less than $250,000, are not subject to this tax, while those with annual taxable rents between $250,000 and $300,000 are eligible for a sliding scale of credit that partially offsets tax liability. This tax is administered by the NYC Department of Finance (DOF).
FORECASTING METHODOLOGY The commercial rent tax revenue is forecast using data on the Manhattan vacancy rates and asking rents for both the primary and secondary offi ce markets. Once the annual revenue is forecast, the monthly cash plan is derived by taking into account the seasonality of collections and legislative changes.
TAX DETAIL
Tax Base The commercial rent, or occupancy tax, is imposed on the rental space in NYC used for commercial or professional purposes. The tax is currently levied only on tenants who rent space in Manhattan south of 96th Street and do not meet any of the following exception criteria.
• Tenants whose annual or annualized gross rents are less than $250,000;
• Residential tenants other than hotel operators, with 75 percent of the fl oor space dedicated to residential purposes;
• Short rental periods for 14 days or less during the tax year;
• Sub-tenants; • Rental premises used for theatrical productions, non-
profi t organizations, or with a written exemption
Chart 1
Commercial Rent Tax 2000 - 2010
$200
$300
$400
$500
$600
$700
$800
00 01 02 03 04 05 06 07 08 09 10
$ in
Mill
ion
Fiscal Year
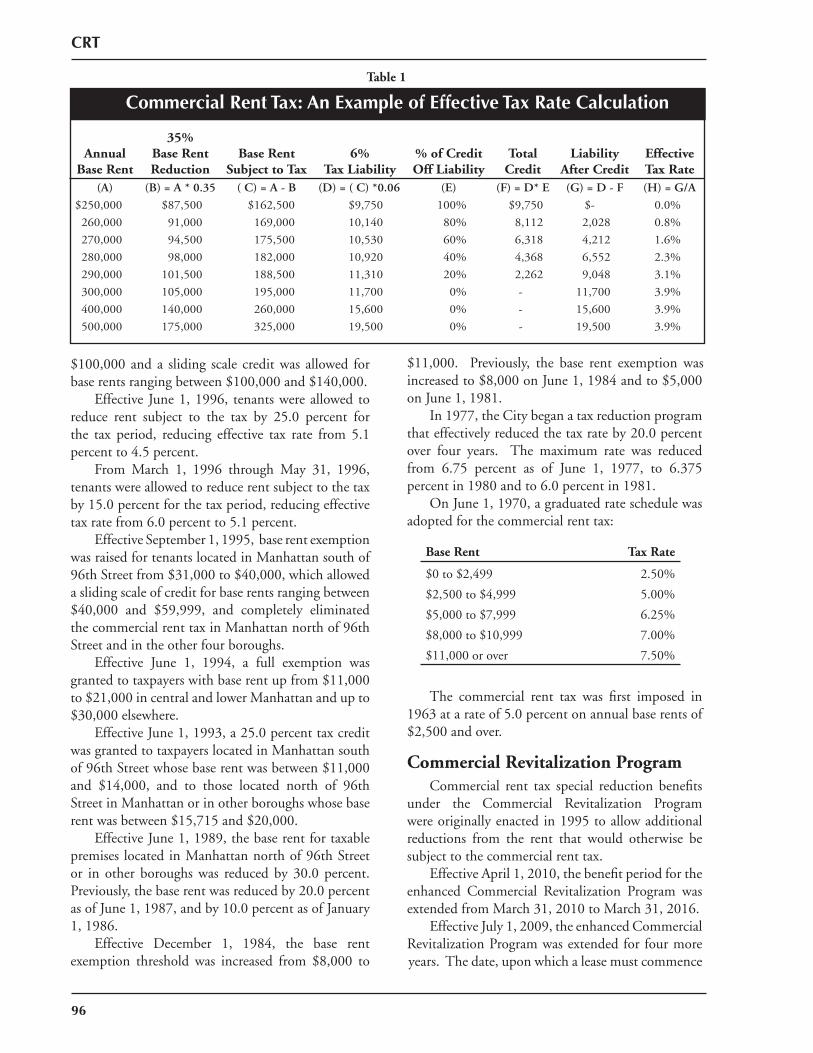
AnnualBase Rent
35%Base RentReduction
Base Rent Subject to Tax
6%Tax Liability
% of Credit Off Liability
TotalCredit
Liability After Credit
Effective Tax Rate
(A) (B) = A * 0.35 ( C) = A - B (D) = ( C) *0.06 (E) (F) = D* E (G) = D - F (H) = G/A
$250,000 $87,500 $162,500 $9,750 100% $9,750 $- 0.0%
260,000 91,000 169,000 10,140 80% 8,112 2,028 0.8%
270,000 94,500 175,500 10,530 60% 6,318 4,212 1.6%
280,000 98,000 182,000 10,920 40% 4,368 6,552 2.3%
290,000 101,500 188,500 11,310 20% 2,262 9,048 3.1%
300,000 105,000 195,000 11,700 0% - 11,700 3.9%
400,000 140,000 260,000 15,600 0% - 15,600 3.9%
500,000 175,000 325,000 19,500 0% - 19,500 3.9%
Table 1
Taxing Authority Commercial Rent Tax: An Example of Effective Tax Rate Calculation
CRT
96
$100,000 and a sliding scale credit was allowed for base rents ranging between $100,000 and $140,000. Effective June 1, 1996, tenants were allowed to reduce rent subject to the tax by 25.0 percent for the tax period, reducing effective tax rate from 5.1 percent to 4.5 percent. From March 1, 1996 through May 31, 1996, tenants were allowed to reduce rent subject to the tax by 15.0 percent for the tax period, reducing effective tax rate from 6.0 percent to 5.1 percent. Effective September 1, 1995, base rent exemption was raised for tenants located in Manhattan south of 96th Street from $31,000 to $40,000, which allowed a sliding scale of credit for base rents ranging between $40,000 and $59,999, and completely eliminated the commercial rent tax in Manhattan north of 96th Street and in the other four boroughs. Effective June 1, 1994, a full exemption was granted to taxpayers with base rent up from $11,000 to $21,000 in central and lower Manhattan and up to $30,000 elsewhere. Effective June 1, 1993, a 25.0 percent tax credit was granted to taxpayers located in Manhattan south of 96th Street whose base rent was between $11,000 and $14,000, and to those located north of 96th Street in Manhattan or in other boroughs whose base rent was between $15,715 and $20,000. Effective June 1, 1989, the base rent for taxable premises located in Manhattan north of 96th Street or in other boroughs was reduced by 30.0 percent. Previously, the base rent was reduced by 20.0 percent as of June 1, 1987, and by 10.0 percent as of January 1, 1986. Effective December 1, 1984, the base rent exemption threshold was increased from $8,000 to
$11,000. Previously, the base rent exemption was increased to $8,000 on June 1, 1984 and to $5,000 on June 1, 1981. In 1977, the City began a tax reduction program that effectively reduced the tax rate by 20.0 percent over four years. The maximum rate was reduced from 6.75 percent as of June 1, 1977, to 6.375 percent in 1980 and to 6.0 percent in 1981. On June 1, 1970, a graduated rate schedule was adopted for the commercial rent tax:
The commercial rent tax was fi rst imposed in 1963 at a rate of 5.0 percent on annual base rents of $2,500 and over.
Commercial Revitalization Program Commercial rent tax special reduction benefi ts under the Commercial Revitalization Program were originally enacted in 1995 to allow additional reductions from the rent that would otherwise be subject to the commercial rent tax. Effective April 1, 2010, the benefi t period for the enhanced Commercial Revitalization Program was extended from March 31, 2010 to March 31, 2016. Effective July 1, 2009, the enhanced Commercial Revitalization Program was extended for four more years. The date, upon which a lease must commence
Base Rent Tax Rate
$0 to $2,499 2.50%
$2,500 to $4,999 5.00%
$5,000 to $7,999 6.25%
$8,000 to $10,999 7.00%
$11,000 or over 7.50%
CRT
in order to qualify for the special rent reduction was also extended from June 30, 2009 to June 30, 2013. Effective December 1, 2005, the retail space located south of Murray Street are also exempt from tax as part of the Commercial Revitalization Program. Effective August 31, 2005, Commercial Revitalization Program was expanded to include more buildings and provided greater base rent reductions. First, the new law expands the program to include post-1975 buildings located south of Canal Street. Second, the two-third and one-third limits on the last two years of the benefi ts are eliminated. The new law offers a base rent reduction for the fi rst fi ve years of the lease equal to the lesser of the base year rent paid or 100.0 percent of the rent paid for the period. Third, the special reduction is available only for leases other than sub-leases commencing between July 1, 2005 and June 30, 2009. Fourth, the benefi t is expanded for all tenants located in the World Trade Center area (including the former Deutsche Bank Building and 7 World Trade Center). Furthermore, a special reduction is allowed for premises located in Manhattan’s Special Garment Center District that are used for industrial and manufacturing activities. The special rent reduction is applied to eligible leases commencing on or after July 1, 2005, and was available for up to ten years. (2006 legislation specifi ed that no special reduction would be allowed after June 30, 2020.) Effective April 1, 1995, the Commercial Revitalization Program was established and benefi ts were initially available only for the pre-1975 buildings located in the title 4 abatement zone in lower Manhattan. Qualifying tenants were eligible for a three- or fi ve-year special reduction to their commercial rent tax liability. The tax reduction period was determined by the number of employees the tenant employs, the length of the initial lease term and the lease execution date. The fi rst year commercial rent tax special reduction was equal to the actual rent paid (called the base year). Within the benefi t period, the second and third year benefi ts were equal to the lesser of the rent paid during each period or the base year rent paid. The last two years of benefi ts under both the three- or fi ve-year programs were generally equal to two-thirds and one-third respectively of the lesser of the rent paid during each period or 100 percent of the base year rent paid. See Appendix I: Schedule of Tax Incentive Under the Commercial Revitalization Program.
97

98
UTX
99
UTILITY TAX
Table of Contents
Overview .................................................................................................................................101
Forecasting Methodology .........................................................................................................101
Tax Detail ................................................................................................................................101
Legislative History ...................................................................................................................102

UTX
100
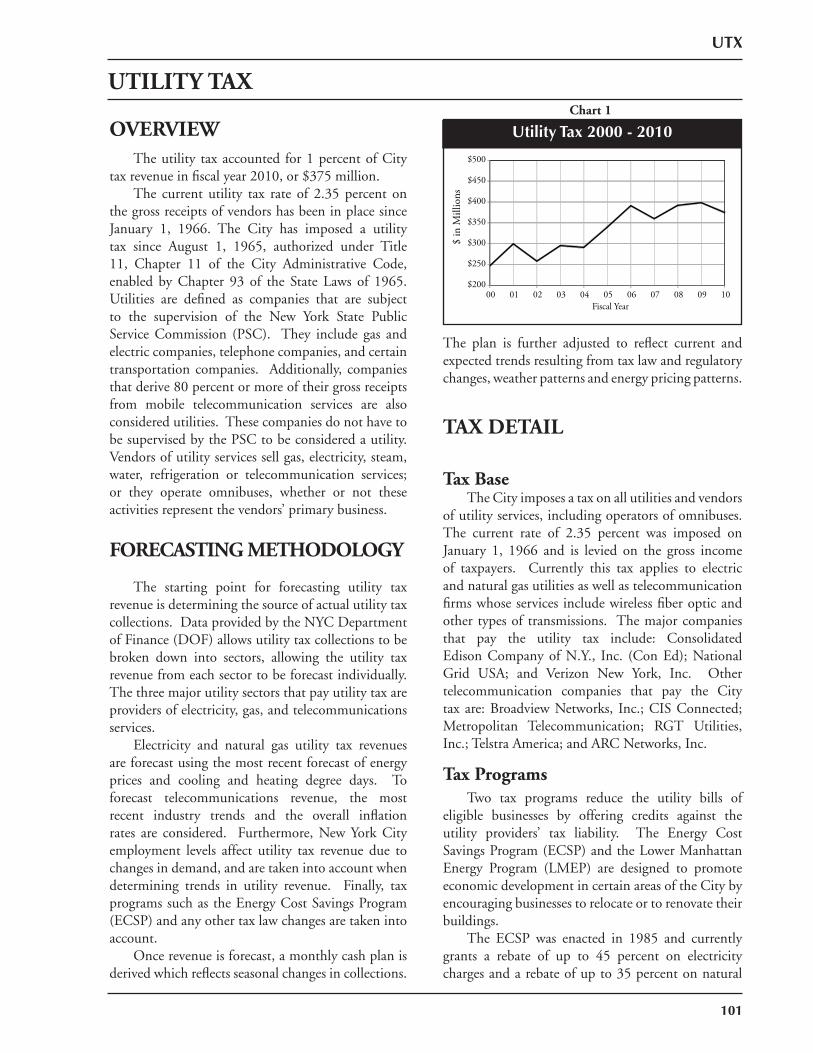
UTX
UTILITY TAX
OVERVIEW The utility tax accounted for 1 percent of City tax revenue in fi scal year 2010, or $375 million. The current utility tax rate of 2.35 percent on the gross receipts of vendors has been in place since January 1, 1966. The City has imposed a utility tax since August 1, 1965, authorized under Title 11, Chapter 11 of the City Administrative Code, enabled by Chapter 93 of the State Laws of 1965. Utilities are defi ned as companies that are subject to the supervision of the New York State Public Service Commission (PSC). They include gas and electric companies, telephone companies, and certain transportation companies. Additionally, companies that derive 80 percent or more of their gross receipts from mobile telecommunication services are also considered utilities. These companies do not have to be supervised by the PSC to be considered a utility. Vendors of utility services sell gas, electricity, steam, water, refrigeration or telecommunication services; or they operate omnibuses, whether or not these activities represent the vendors’ primary business.
FORECASTING METHODOLOGY The starting point for forecasting utility tax revenue is determining the source of actual utility tax collections. Data provided by the NYC Department of Finance (DOF) allows utility tax collections to be broken down into sectors, allowing the utility tax revenue from each sector to be forecast individually. The three major utility sectors that pay utility tax are providers of electricity, gas, and telecommunications services. Electricity and natural gas utility tax revenues are forecast using the most recent forecast of energy prices and cooling and heating degree days. To forecast telecommunications revenue, the most recent industry trends and the overall infl ation rates are considered. Furthermore, New York City employment levels affect utility tax revenue due to changes in demand, and are taken into account when determining trends in utility revenue. Finally, tax programs such as the Energy Cost Savings Program (ECSP) and any other tax law changes are taken into account. Once revenue is forecast, a monthly cash plan is derived which refl ects seasonal changes in collections.
The plan is further adjusted to refl ect current and expected trends resulting from tax law and regulatory changes, weather patterns and energy pricing patterns.
TAX DETAIL
Tax Base The City imposes a tax on all utilities and vendors of utility services, including operators of omnibuses. The current rate of 2.35 percent was imposed on January 1, 1966 and is levied on the gross income of taxpayers. Currently this tax applies to electric and natural gas utilities as well as telecommunication fi rms whose services include wireless fi ber optic and other types of transmissions. The major companies that pay the utility tax include: Consolidated Edison Company of N.Y., Inc. (Con Ed); National Grid USA; and Verizon New York, Inc. Other telecommunication companies that pay the City tax are: Broadview Networks, Inc.; CIS Connected; Metropolitan Telecommunication; RGT Utilities, Inc.; Telstra America; and ARC Networks, Inc.
Tax Programs Two tax programs reduce the utility bills of eligible businesses by offering credits against the utility providers’ tax liability. The Energy Cost Savings Program (ECSP) and the Lower Manhattan Energy Program (LMEP) are designed to promote economic development in certain areas of the City by encouraging businesses to relocate or to renovate their buildings. The ECSP was enacted in 1985 and currently grants a rebate of up to 45 percent on electricity charges and a rebate of up to 35 percent on natural
Chart 1
Utility Tax 2000 - 2010
$200
$250
$300
$350
$400
$450
$500
00 01 02 03 04 05 06 07 08 09 10
$ in
Mill
ions
Fiscal Year
101
UTX
gas charges to eligible nonresidential users operating in Brooklyn, The Bronx, Queens, Staten Island and Manhattan North of 96th Street. Non-retailers outside the City which relocate to the designated areas are also eligible. A full benefi t is allowed for eight years, followed by a four-year phase-out. The utility company that gives the rebate is compensated for the forgone revenue through a credit against its City utility tax liability. The ECSP must be renewed by the City, ranging from every one to three years. The ECSP was last extended for the period including July 1, 2010 to July 1, 2013. The LMEP was included as part of the Commercial Revitalization Program, enacted in 1995. The LMEP currently grants a rebate of up to 45 percent on electricity charges and a rebate of up to a 35 percent on natural gas charges to eligible commercial tenants south of Murray Street in Manhattan who have improved their buildings by at least 20 percent of assessed value. A full benefi t is allowed for eight years, followed by a four-year phase-out. The LMEP must be renewed by the City, ranging from every one to three years. The LMEP was last extended for the period including July 1, 2010 to July 1, 2013. The New York City Department of Finance reports the monthly credit distribution of the combined ECSP and LMEP for the four major utility taxpayers. This information is factored in the forecast of utility tax collections.
LEGISLATIVE HISTORY Effective July 1, 2010, the Energy Cost Saving Program and Lower Manhattan Energy Programs were extended until July 1, 2013. Effective tax year 2009 and thereafter, refunds for utility tax may be requested within three years from the time a utility tax return is fi led and two years from the time the tax is paid. Effective January 1, 2006, metered sales of energy to tenants of certain cooperative housing corporations are exempted from the City utility tax. The exemption applies to cooperative corporations with at least 1,500 apartments that own or operate a cogeneration facility that was in place before January 1, 2004, which also make metered sales of energy produced to the development’s tenants or occupants. October 20, 2003 through January 23, 2004, certain taxpayers of the City utility tax were able to apply for tax amnesty. During this period, eligible taxpayers that remitted their taxes owed were granted
a waiver of civil penalties and criminal prosecutions and a reduction in the interest due. Effective December 1, 2002, certain utility services used during the production of a fi lm for sale are eligible for exemption from the utility tax. Effective August 1, 2002, the City utility tax law was amended to align taxation of wireless telecommunication services with the Federal Mobile Telecommunications Sourcing Act of 2000. Previous legislation based on landlines defi ned taxable calls as those which “originate and terminate” geographically within the State. The new amendment replaces this method with a “place of primary use” (PPU) provision, which simplifi es taxable receipts for wireless devices. Under the new law, 84 percent of the total wireless services billed to a customer’s PPU are subject to the utility tax. Effective June 1, 2001, the Department of Business Services (DBS) promulgated rules that divided the ECSP participants into three categories with various schedules of rebate percentages in order to allow participants to receive the same program benefi ts as those received under the original rebate percentages of the bundled bill. Effective November 1, 2000 legislation changed the ECSP and LMEP rebates on electricity and gas from a discount on all utility charges to a discount solely on utility delivery charges. The legislation raised the rebate percentages to 45 percent of eligible electricity charges and 35 percent of eligible natural gas charges in an effort to maintain roughly the same benefi t levels, in dollar terms, as previously. Subsequently, program participants complained that following the enactment of the new rebate percentages, commodity prices had increased while utility delivery charges remained relatively low. Thus, the benefi t program participants received with the revised rebate percentages were less than if original percentages were applied. Effective January 1, 1999, utility taxpayers whose tax liability for the preceding year was less than $100,000 are able to fi le semi-annual utility tax returns for the current year. Previously, these taxpayers were required to fi le monthly returns. Effective January 1, 1998 the defi nition of “telephone or telegraph service” subject to the City utility tax was broadened to “telecommunication services” in order to be consistent with the State utility tax defi nition. Under the new law, any transmission of voice, image, data, information and paging through wired or wireless media are subject to the utility tax. Additionally, telephone services such
102
UTX
as dial tone, directory information, call forwarding and call waiting are also included. Cable television services and air safety transmissions are excluded from this defi nition. Effective January 1, 1998, the utility tax law was modifi ed so that landlords that resell utility services to their tenants are no longer subject to utility tax. Under the amended law, the original vendor will be taxed for the sale of utility services to the landlord, and the landlord will not be subject to the utility tax. Beginning July 1, 1995, businesses in Lower Manhattan south of Murray Street which improve the market value of their property by 20 percent are eligible to apply for the LMEP. The LMEP grants a credit against a taxpayer’s utility tax liability by providing a 30 percent reduction on electric charges and a 20 percent reduction on natural gas charges to eligible businesses. Beginning May 3, 1985, businesses which relocate to the outer boroughs or Manhattan north of 96th Street from outside this area are eligible to apply for the ECSP. The ECSP grants a credit against a taxpayer’s utility tax liability by providing a 30 percent reduction on electric charges and a 20 percent reduction on natural gas charges to eligible businesses. Effective January 1, 1966, the utility tax rate was raised to 2.35 percent of the gross receipts of taxpayers. Beginning August 1, 1965, a tax at a rate of 2.0 percent was levied against the gross receipts of all utilities and vendors of utility services in New York City. A vendor of utility services furnishes or sells gas, electricity, steam, water or refrigeration, or furnishes or sells gas, electric, steam, water, refrigeration or telecommunications services, or who operates omnibuses.
Utility Deregulation
The deregulation of the energy industry and subsequent legislative actions has, and are forecast to continue to have, minimal impact on the forecast of utility tax revenue. Beginning in 1997, the Public Service Commission (PSC), Con Ed and subsequently other utilities entered into an agreement that set a schedule for competitive retail access and the deregulation of the electric industry in New York State. The natural gas industry has been deregulated since 1991. On March 13, 1997, Con Ed and the PSC entered into a settlement with respect to the PSC’s competitive opportunities proceeding, with PSC
approval granted on August 29, 1997. The settlement agreement featured a fi ve-year rate plan to facilitate the transition to competitive retail access, effective January 1, 1998. The fi ve-year rate plan called for an immediate 25.0 percent electric rate reduction for Con Ed’s largest industrial customers, a 10.0 percent rate reduction for other large industrial and commercial customers (which include offi ce buildings, hospitals, colleges and universities) and a 3.3 percent rate reduction for residential and small commercial customers. The fi ve-year rate plan superseded the prior 1995 rate agreement as of March 31, 1997, and the revenue requirement increase for the third year of the 1995 rate agreement was reversed. In calendar year 2000, Con Ed agreed to further reduce retail electric rates and extend the electric restructuring agreement to 2005. Effective October 1, 2000, the total reduction in retail distribution rates was 16.8 percent. An additional 200 megawatts of capacity also became eligible for business rate incentives. These rate reductions have had a slight negative impact on utility tax collections. As a result of the 1996 PSC Competitive Opportunities proceeding, the PSC ordered a complete restructuring of the State’s energy utilities to encourage competitive markets. This agreement originally set the pace of deregulation in the State with the expectation of full retail access by 2006. The original PSC agreements provided a transition to a competitive retail market through the development of retail access plans, a reasonable recovery of strandable costs and the divestiture to unaffi liated third parties of approximately 50 percent of electric generating capacity in the City. The PSC agreements were revised in 2000, allowing for full retail access for all customers as of November 1, 2000. Additionally, Con Ed has divested itself from all its generating capacity beyond the 50 percent requirement. Deregulation of the electric industry has had a slight negative impact on utility tax collections. Effective April 1, 2008, Con Ed and the PSC agreed on a 4.7 percent electric service delivery rate increase. The decision approved signifi cant increases in infrastructure spending to improve and maintain the reliability of Con Ed services. Effective April 1, 2010, Con Ed and the PSC agreed on a 4.3 percent electric service delivery rate increase.
103

104

HTL
105
HOTEL ROOM OCCUPANCY TAX
Table of Contents
Overview .................................................................................................................................107
Forecasting Methodology .........................................................................................................107
Tax Detail ................................................................................................................................108
Legislative History ...................................................................................................................108

HTL
106
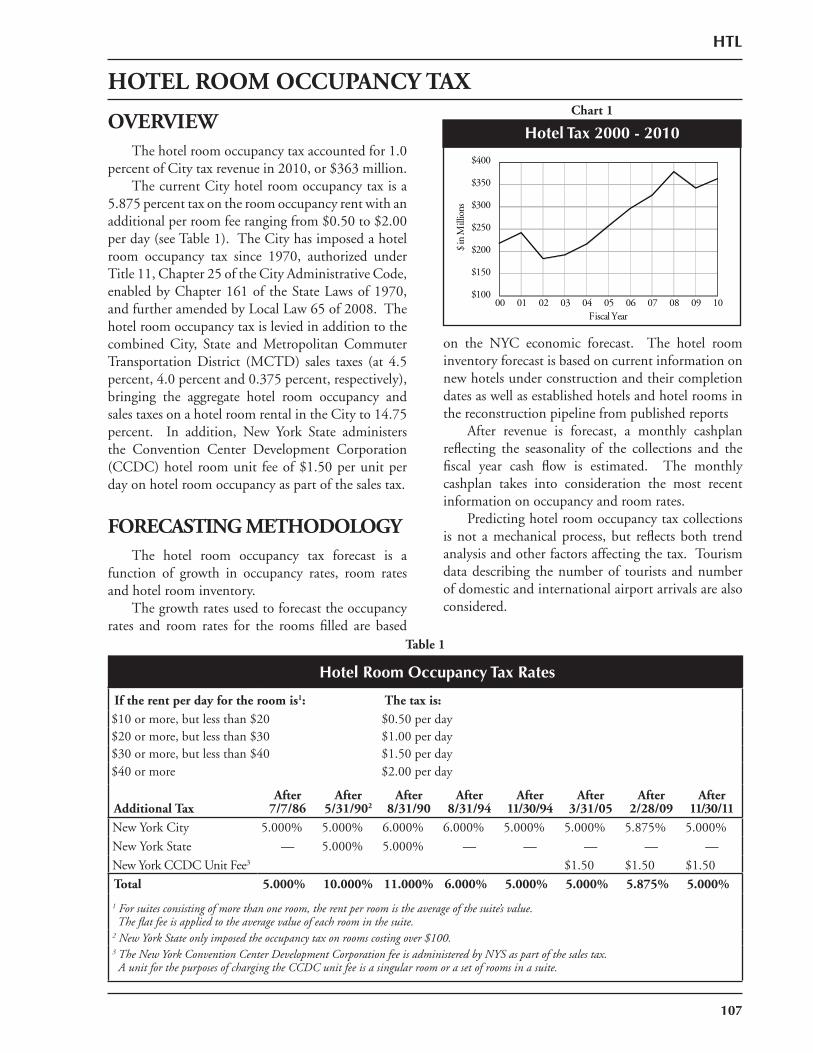
on the NYC economic forecast. The hotel room inventory forecast is based on current information on new hotels under construction and their completion dates as well as established hotels and hotel rooms in the reconstruction pipeline from published reports
After revenue is forecast, a monthly cashplan refl ecting the seasonality of the collections and the fi scal year cash fl ow is estimated. The monthly cashplan takes into consideration the most recent information on occupancy and room rates.
Predicting hotel room occupancy tax collections is not a mechanical process, but refl ects both trend analysis and other factors affecting the tax. Tourism data describing the number of tourists and number of domestic and international airport arrivals are also considered.
OVERVIEWThe hotel room occupancy tax accounted for 1.0
percent of City tax revenue in 2010, or $363 million.The current City hotel room occupancy tax is a
5.875 percent tax on the room occupancy rent with an additional per room fee ranging from $0.50 to $2.00 per day (see Table 1). The City has imposed a hotel room occupancy tax since 1970, authorized under Title 11, Chapter 25 of the City Administrative Code, enabled by Chapter 161 of the State Laws of 1970, and further amended by Local Law 65 of 2008. The hotel room occupancy tax is levied in addition to the combined City, State and Metropolitan Commuter Transportation District (MCTD) sales taxes (at 4.5 percent, 4.0 percent and 0.375 percent, respectively), bringing the aggregate hotel room occupancy and sales taxes on a hotel room rental in the City to 14.75 percent. In addition, New York State administers the Convention Center Development Corporation (CCDC) hotel room unit fee of $1.50 per unit per day on hotel room occupancy as part of the sales tax.
FORECASTING METHODOLOGYThe hotel room occupancy tax forecast is a
function of growth in occupancy rates, room rates and hotel room inventory.
The growth rates used to forecast the occupancy rates and room rates for the rooms fi lled are based
Chart 1
Hotel Tax 2000 - 2010
Table 1
Hotel Room Occupancy Tax Rates
If the rent per day for the room is1: The tax is:$10 or more, but less than $20 $0.50 per day$20 or more, but less than $30 $1.00 per day$30 or more, but less than $40 $1.50 per day$40 or more $2.00 per day
Additional TaxAfter
7/7/86After
5/31/902After
8/31/90After
8/31/94After
11/30/94After
3/31/05After
2/28/09After
11/30/11
New York City 5.000% 5.000% 6.000% 6.000% 5.000% 5.000% 5.875% 5.000%
New York State — 5.000% 5.000% — — — — —
New York CCDC Unit Fee3 $1.50 $1.50 $1.50
Total 5.000% 10.000% 11.000% 6.000% 5.000% 5.000% 5.875% 5.000%
1 For suites consisting of more than one room, the rent per room is the average of the suite’s value. The fl at fee is applied to the average value of each room in the suite. 2 New York State only imposed the occupancy tax on rooms costing over $100.3 The New York Convention Center Development Corporation fee is administered by NYS as part of the sales tax. A unit for the purposes of charging the CCDC unit fee is a singular room or a set of rooms in a suite.
$100
$150
$200
$250
$300
$350
$400
00 01 02 03 04 05 06 07 08 09 10
$ in
Mill
ions
Fiscal Year
HTL
HOTEL ROOM OCCUPANCY TAX
107
TAX DETAIL
Tax BaseThe City imposes a hotel room occupancy tax
on all hotel rooms that are occupied at the rate of 5.875 percent plus a per room fee for rooms ranging from $0.50 to $2.00 per day based on the dollar value of the hotel room. To determine the rate of the per room fee for a suite with multiple rooms, the dollar value of each room is determined by averaging the total cost of the suite. In addition, the City and the State each impose a 4.5 percent and 4.0 percent sales tax, respectively, along with the 0.375 sales tax imposed by the MCTD, making the aggregate tax on hotel room occupancy 14.75 percent. Further, New York State administers the CCDC hotel unit fee for $1.50 per unit per day on hotel room occupancy as part of the sales tax. A suite with multiple rooms is considered one unit for charging the CCDC hotel unit fee.
ExemptionsExemptions from the hotel room occupancy tax
include; (1) permanent residents of a hotel or other eligible facility; (2) organizations and associations exempt from the State and City sales tax on hotel room rents including the Federal Government, the State and City of New York, The United Nations, or any agency thereof; and (3) not-for-profi t organizations that were formed and operated exclusively for religious, charitable, or educational purposes, or for the prevention of cruelty to children and animals.
LEGISLATIVE HISTORY
Effective September 1, 2009, Internet and other hotel room occupancy resellers must collect and remit hotel room occupancy tax on the value of any hotel room rate markup. This closes a hotel room occupancy tax loophole, where the City only collected hotel room occupancy tax on the discounted room rate a hotel sold to occupancy resellers, not the ultimate value of the room sold to the occupant.
Effective August 1, 2009, the NYC sales tax rate increased from 4.0 percent to 4.5 percent, bringing the aggregate tax on hotel room rental to 14.75 percent. (For history of taxes on hotel room occupancy, see Sales Tax Appendix III: Table 3).
Effective March 1, 2009, the City temporarily increased the hotel room occupancy tax rate from 5.0 percent to 5.875 percent, bringing the aggregate hotel room occupancy tax and sales tax on a hotel rental in the City to 14.25 percent for the period of March 1, 2009 through July 31, 2009. The temporary hotel room occupancy tax rate increase is set to expire on November 30, 2011.
Effective June 1, 2005, the NYC sales tax rate decreased from 4.125 percent to 4.0 percent and the NYS sales tax rate decreased from 4.25 percent to 4.0 percent, while the MCTD sales tax rate increased from 0.25 percent to 0.375 percent, bringing the aggregate tax on hotel room rental to 13.375 percent, for the period June 1, 2005 through February 28, 2009.
Effective April 1, 2005, the State imposed a hotel unit fee of $1.50 per unit per day on all hotel room occupancy within New York City as part of the sales tax. This fee is dedicated to the securitization of bonds issued by the New York Convention Center Development Corporation (CCDC) for the expansion and improvement of the Jacob K. Javits Convention Center. The fee will terminate after all bonds secured have been paid. A unit for the purposes of the $1.50 unit fee may be a single room or a set of rooms in a suite.
Effective June 1, 2003, the NYC sales tax increased from 4.0 percent to 4.125 percent, and the NYS sales tax increased from 4.0 percent to 4.25 percent bringing the aggregate tax on hotel room rental to 13.625 percent, for the period June 1, 2003 through May 31, 2005.
In 1994, both the State and City acted to reduce the hotel room occupancy tax burden. Effective September 1, 1994 the State eliminated its 5.0 percent tax. Effective December 1, 1994 the City repealed the 1.0 percent tax increase that was effective September 1, 1990, including the dedication of the one-quarter percent to tourism development, returning the rate to 5.0 percent from 6.0 percent. This lowered the aggregate tax rate on hotel rooms priced over $100 to 13.25 percent, in addition to the fl at fee for the period December 1, 1994 through May 31, 2003.
Effective September 1, 1990, the City hotel room occupancy tax rate was increased from 5.0 percent to 6.0 percent. The aggregate tax rate payable on rooms priced over $100 in the City was 19.25 percent, in addition to the fl at fee, for the period September 1, 1990 through August 31, 1994. One-quarter of the revenue collected from the additional City hotel room occupancy 1.0 percent tax rate increase was
HTL
108
HTL
109
earmarked for the development of tourism. Of this dedicated revenue, seven-eighths of the one-quarter percent funded the New York Convention and Visitors Bureau. The remaining one-eighth percent was not dedicated to a specifi c organization but had to be expended on tourism-related activities.
Effective June 1, 1990, the State introduced an additional special NYS hotel room occupancy tax of 5.0 percent on rooms costing $100 or more per day.
Effective July 8, 1986, a City 5.0 percent hotel room occupancy tax was imposed in addition to the hotel room occupancy tax fl at fee. Subsequently, tax collections increased from $26 million in City Fiscal Year 1986 to $79 million in City Fiscal Year 1987.
Effective September 1, 1980, the hotel room occupancy tax fl at fee increased from a range of $0.25 to $1.00 per day to a range of $0.50 to $2.00 per day.
Effective July 1, 1970, the hotel room occupancy tax was imposed as a fl at fee based on the daily rental value of the hotel room occupied. The fee ranged from a minimum of $0.25 up to $1.00 per day depending on the value of the room.

110
CTX
111
CIGARETTE TAX
Table of Contents
Overview .................................................................................................................................113
Forecasting Methodology .........................................................................................................113
Tax Detail ................................................................................................................................113
Legislative History ...................................................................................................................114

112
CTX
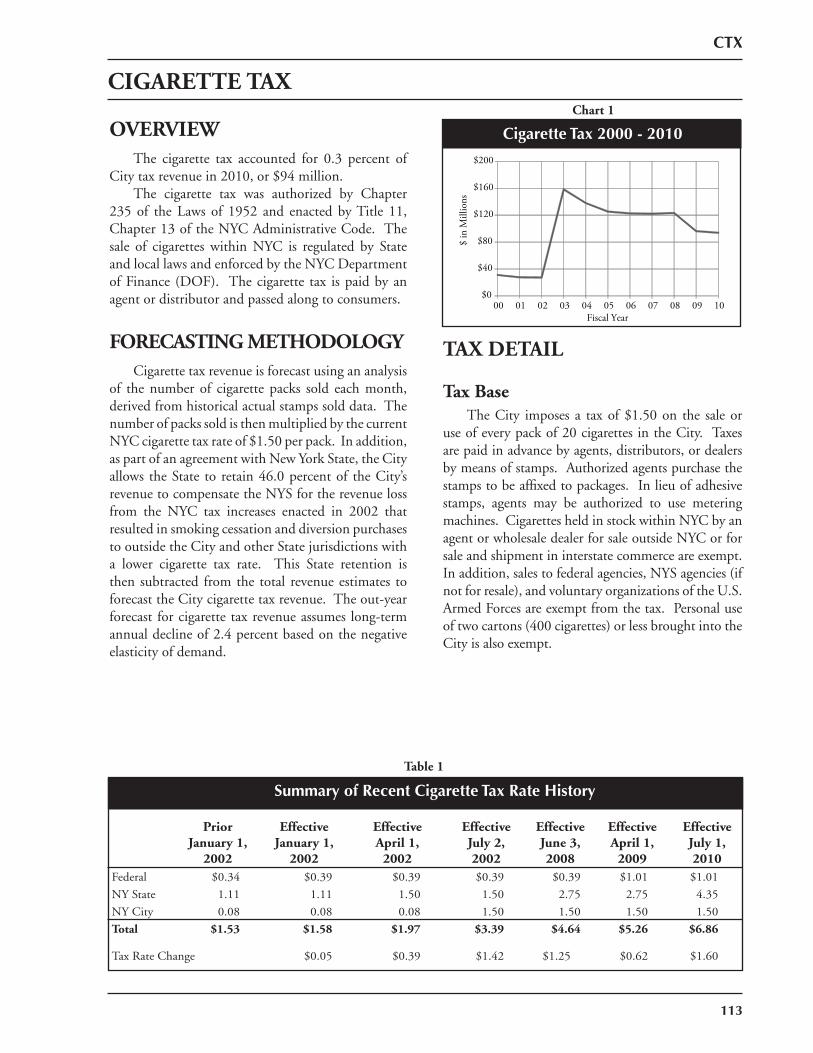
113
TAX DETAIL
Tax Base The City imposes a tax of $1.50 on the sale or use of every pack of 20 cigarettes in the City. Taxes are paid in advance by agents, distributors, or dealers by means of stamps. Authorized agents purchase the stamps to be affi xed to packages. In lieu of adhesive stamps, agents may be authorized to use metering machines. Cigarettes held in stock within NYC by an agent or wholesale dealer for sale outside NYC or for sale and shipment in interstate commerce are exempt. In addition, sales to federal agencies, NYS agencies (if not for resale), and voluntary organizations of the U.S. Armed Forces are exempt from the tax. Personal use of two cartons (400 cigarettes) or less brought into the City is also exempt.
OVERVIEW The cigarette tax accounted for 0.3 percent of City tax revenue in 2010, or $94 million. The cigarette tax was authorized by Chapter 235 of the Laws of 1952 and enacted by Title 11, Chapter 13 of the NYC Administrative Code. The sale of cigarettes within NYC is regulated by State and local laws and enforced by the NYC Department of Finance (DOF). The cigarette tax is paid by an agent or distributor and passed along to consumers.
FORECASTING METHODOLOGY Cigarette tax revenue is forecast using an analysis of the number of cigarette packs sold each month, derived from historical actual stamps sold data. The number of packs sold is then multiplied by the current NYC cigarette tax rate of $1.50 per pack. In addition, as part of an agreement with New York State, the City allows the State to retain 46.0 percent of the City’s revenue to compensate the NYS for the revenue loss from the NYC tax increases enacted in 2002 that resulted in smoking cessation and diversion purchases to outside the City and other State jurisdictions with a lower cigarette tax rate. This State retention is then subtracted from the total revenue estimates to forecast the City cigarette tax revenue. The out-year forecast for cigarette tax revenue assumes long-term annual decline of 2.4 percent based on the negative elasticity of demand.
Cigarette Tax 2000 - 2010
Chart 1
$0
$40
$80
$120
$160
$200
00 01 02 03 04 05 06 07 08 09 10
$ in
Mill
ions
Fiscal Year
PriorJanuary 1,
2002
Effective January 1,
2002
Effective April 1,
2002
Effective July 2,2002
Effective June 3, 2008
Effective April 1,
2009
Effective July 1, 2010
Federal $0.34 $0.39 $0.39 $0.39 $0.39 $1.01 $1.01
NY State 1.11 1.11 1.50 1.50 2.75 2.75 4.35
NY City 0.08 0.08 0.08 1.50 1.50 1.50 1.50
Total $1.53 $1.58 $1.97 $3.39 $4.64 $5.26 $6.86
Tax Rate Change $0.05 $0.39 $1.42 $1.25 $0.62 $1.60
Table 1
Taxing Authority Summary of Recent Cigarette Tax Rate History
CTX
CIGARETTE TAX
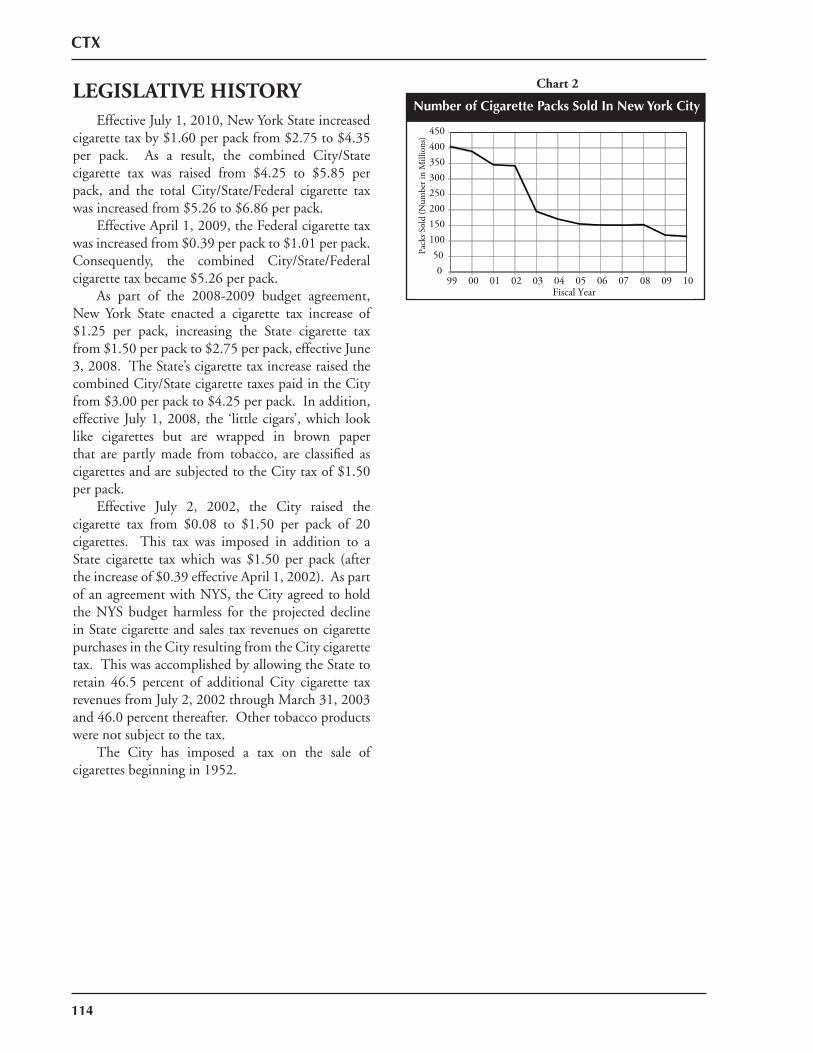
114
LEGISLATIVE HISTORY Effective July 1, 2010, New York State increased cigarette tax by $1.60 per pack from $2.75 to $4.35 per pack. As a result, the combined City/State cigarette tax was raised from $4.25 to $5.85 per pack, and the total City/State/Federal cigarette tax was increased from $5.26 to $6.86 per pack. Effective April 1, 2009, the Federal cigarette tax was increased from $0.39 per pack to $1.01 per pack. Consequently, the combined City/State/Federal cigarette tax became $5.26 per pack. As part of the 2008-2009 budget agreement, New York State enacted a cigarette tax increase of $1.25 per pack, increasing the State cigarette tax from $1.50 per pack to $2.75 per pack, effective June 3, 2008. The State’s cigarette tax increase raised the combined City/State cigarette taxes paid in the City from $3.00 per pack to $4.25 per pack. In addition, effective July 1, 2008, the ‘little cigars’, which look like cigarettes but are wrapped in brown paper that are partly made from tobacco, are classifi ed as cigarettes and are subjected to the City tax of $1.50 per pack. Effective July 2, 2002, the City raised the cigarette tax from $0.08 to $1.50 per pack of 20 cigarettes. This tax was imposed in addition to a State cigarette tax which was $1.50 per pack (after the increase of $0.39 effective April 1, 2002). As part of an agreement with NYS, the City agreed to hold the NYS budget harmless for the projected decline in State cigarette and sales tax revenues on cigarette purchases in the City resulting from the City cigarette tax. This was accomplished by allowing the State to retain 46.5 percent of additional City cigarette tax revenues from July 2, 2002 through March 31, 2003 and 46.0 percent thereafter. Other tobacco products were not subject to the tax. The City has imposed a tax on the sale of cigarettes beginning in 1952.
Number of Cigarette Packs Sold In New York City
Chart 2
050
100150200250300350400450
99 00 01 02 03 04 05 06 07 08 09 10
Pack
s Sol
d (N
umbe
r in
Mill
ions
)
Fiscal Year
CTX
OTX
115
OTHER TAXES
Table of Contents
Auto Related Taxes ...................................................................................................................117
Excise Taxes..............................................................................................................................117
Miscellaneous ...........................................................................................................................118
STAR Aid ................................................................................................................................118
Tax Enforcement Revenue .......................................................................................................119

116
OTX
OTX
117
Other taxes accounted for 1.4 percent of City tax revenue in 2010, or $515 million.
AUTO RELATED TAXES
Auto Use Tax
This tax is imposed by the City on privately-owned vehicles at the annual rate of $15 per vehicle. The tax was fi rst imposed on October 1, 1974, and has remained unchanged. The tax is administered by the State Department of Motor Vehicles, with an administrative charge levied on the City for this service. In 1990, taxpayers were required to change from annual to biennial payments to conform to a change in the State registration procedures. This new procedure resulted in roughly half of all registrants in 1990 paying for two years, while the other half continued to pay only the annual fee. Revenue from this tax was $28.1 million in 2010.
Commercial Motor Vehicle Tax This tax was fi rst levied in 1960 on vehicles used for the transportation of passengers (medallion taxicabs, omnibuses and other for-hire passenger vehicles) and on all other commercial trucks and vehicles. The tax is administered by the State Department of Motor Vehicles and is charged at different rates, based on the purpose for which the vehicles are used. Signifi cant legislative changes in 1990 resulted in a revision of the rate schedules for many commercial motor vehicles. The rate for medallion taxicabs was raised to $1,000 per year, from $100 the previous year. Other for-hire passenger vehicles (livery cabs and omnibuses) pay $400 per year, a $300 increase over the 1989 rate. The rate schedule for other commercial vehicles weighing less than 10,000 pounds was left unchanged at $40 per year, while the rate for heavier vehicles was increased, with trucks weighing over 15,000 pounds paying the highest rate, $300 per year. Medallion taxicabs pay twice a year, in December and June, while owners of other types of commercial vehicles pay annually in June. In 2001, following a DOF initiative, the City transferred the collection and administration of the commercial motor vehicle tax for livery taxicabs and light trucks to the State, thereby improving the rate of compliance. Until 2001, all registration for taxi and livery vehicles ran from March 1st through the end of February of the following
year. Beginning in 2002, the State Department of Motor Vehicles staggered the registration period for these vehicles so that the renewals were spread throughout the year resulting in a one-time revenue loss of $3.5 million in fi scal year 2002. Revenue from this tax was $46.2 million in 2010.
Taxi Medallion Transfer Tax This tax is imposed at a rate of 5.0 percent on the consideration paid for transfer of taxicab licenses (medallions) and was fi rst imposed effective July 1, 1980. The tax is payable by the transferee but the transferor is liable if the tax is not paid by the transferee. The tax is administered by the NYC Taxi and Limousine Commission. Revenue from this tax was $10.5 million in 2010.
EXCISE TAXES
Beer and Liquor Excise Tax Since 1980, the City has imposed a tax on licensed distributors and non-commercial importers on the sale of beer and liquor within New York City. The current tax rate is 12 cents per gallon of beer and 26.4 cents per liter of liquor with alcohol content greater than 24.0 percent. The City does not impose a tax on wine. The tax is administered by NYS. Revenue generated from this tax was $23.7 million in 2010.
Liquor License Surcharge This tax is imposed on distributors and non-commercial importers of beer and liquor at a rate of 25 percent of the license fees payable under the New York State Alcoholic Beverage Control Law. Revenue generated from this tax was $5.0 million in 2010.
Horse Race Admissions Tax A 3.0 percent tax was imposed in 1952 on the price of all paid admissions to horse races held either partly or wholly within NYC. Revenue from this tax was $0.02 million in 2010.
Off-Track Betting Surtax A surcharge is levied on most bets placed at New York City Off-Track Betting offi ces, and on most bets placed statewide on races held within NYC. Revenue from this tax was $3.0 million in 2010.
OTHER TAXES
118
OTX
MISCELLANEOUS
Other Refunds
Other refunds are primarily paid out on the commercial rent tax and waiver. The paid out refunds were $27.4 million in 2010.
PILOTs Payments in lieu of taxes (PILOTs) are contractual agreements between public agencies and private property holders which result in a real property tax relief in order to: (1) induce businesses to remain in New York City; (2) attract new business; (3) provide subsidies for low-income housing; and (4) promote economic growth. PILOTs are either fi xed sums based on real property taxes paid on the underlying property in the year preceding the agreement, formulas calculated on the income derived from business operations at the PILOT facility, or a combination of both. Payments are remitted quarterly, semi-annually or annually. There are three primary sponsor agencies which serve as intermediaries between the City and the PILOT facility owners: (1) New York City Housing Authority; (2) Industrial Development Agency; and (3) Battery Park City Authority. These agencies administer projects that comprise approximately 95 percent of PILOT payments received. Two smaller sponsors are the Economic Development Corporation and the Port Authority of New York and New Jersey. The revenue from this tax was $262.4 million in 2010.
Section 1127 (Waiver) Under section 1127 of the New York City Charter, the City may collects payments from non-resident employees of the City or any of its agencies in an amount which equalizes their personal income tax liability to what it would be if they were city residents. Revenue from this tax was $123.5 million in 2010.
Prior Year and Current Year Penalty and Interest - Real Estate Taxpayers who do not pay their real property tax on time are liable for interest charges on outstanding balances. The interest rate for a late payment depends on the assessed value of the property. If the assessed value of the property is $250,000 or less and if the
property is not vacant land, the interest rate is 9.0 percent. If the assessed value of the property is over $250,000 or if the property is vacant land, it is 18.0 percent. Interest rates are set annually by the City Council based on a recommendation from the City Council Finance Division’s Banking Commission. Revenue from this tax was $43.0 million in 2010.
Penalty and Interest - Other Refunds The City currently pays out interest on refunds claimed on overpayments against the business income taxes, on audits of the general corporation, banking corporation, and unincorporated business taxes already collected by DOF but overturned by Federal or State rulings, and on payments made under protest by taxpayers who subsequently substantiate their claims. As a result of legislation, interest on overpayments claimed on amended returns is currently no longer paid for tax years beginning with 1989 as long as the refund is paid within a 90-day period. The paid out refunds for 2010 was $2.7 million.
School Tax Relief Aid (STAR Aid) STAR aid program was fi rst enacted by the New York State in 1997 to provide education aid and tax relief to localities. Under this program, the State reimburses the localities for the foregone tax revenues. This program allowed the localities to provide tax relief in the form of basic property tax exemption to primary homeowners in one-, two- and three- family homes, cooperatives and condominiums and an enhanced exemption for primary senior citizen homeowners, who are age 65 years or older, with a household income of less than $79,050. In addition to the property tax relief, the STAR program reduces the City personal income tax liability through both a City personal income tax rate cut and a refundable personal income tax credit (for more details see personal income tax appendix on NYC tax credit). STAR aid payment from the State was $903.6 million in 2010.
Stock Transfer Tax The State repealed the City’s stock transfer tax in 1980 and provided for annual appropriations of no more than $120 million as compensation. Until 1988, the State appropriated to the City approximately $118 million annually. Following a slowdown in State revenue growth, the appropriation was reduced
119
OTX
to $83 million in 1990 and to $56 million in 1991. In 1992, the appropriation was restored to $114 million. In 2001, the appropriation was eliminated by the State.
Vault Charge The City’s vault charge was imposed on any sub-surface opening or structure which extends from the building line into the street. It was fi rst introduced on July 1, 1962 at a rate of 35 cents per square foot. The rate was changed in 1980 to $2 per square foot. Certain reductions in the total tax paid were allowed depending on the size of the vault. As of January 1, 1989, vaults smaller than 36 square feet in size and all vaults attached to Class 1 property were exempted from the tax. The vault charge was eliminated in June 1998.
Coin-Operated Amusement Devices TaxThis tax was imposed on every coin-operated amusement device (including juke boxes) located in New York City. The tax rate was raised from $25 to $175 per device as of July 1, 1989. This tax was eliminated in August 1997.
Tax Enforcement Revenue DOF targets delinquent taxpayers through agency audit activities, selected use of collection agencies and computer matches. Revenue from this enforcement effort yielded $769.4 million in 2010.

120
Real Property TaxPersonal Income Tax
Sales TaxGeneral Corporation Tax
History of Tax Collections
APPENDICES

Appendix I-RPT
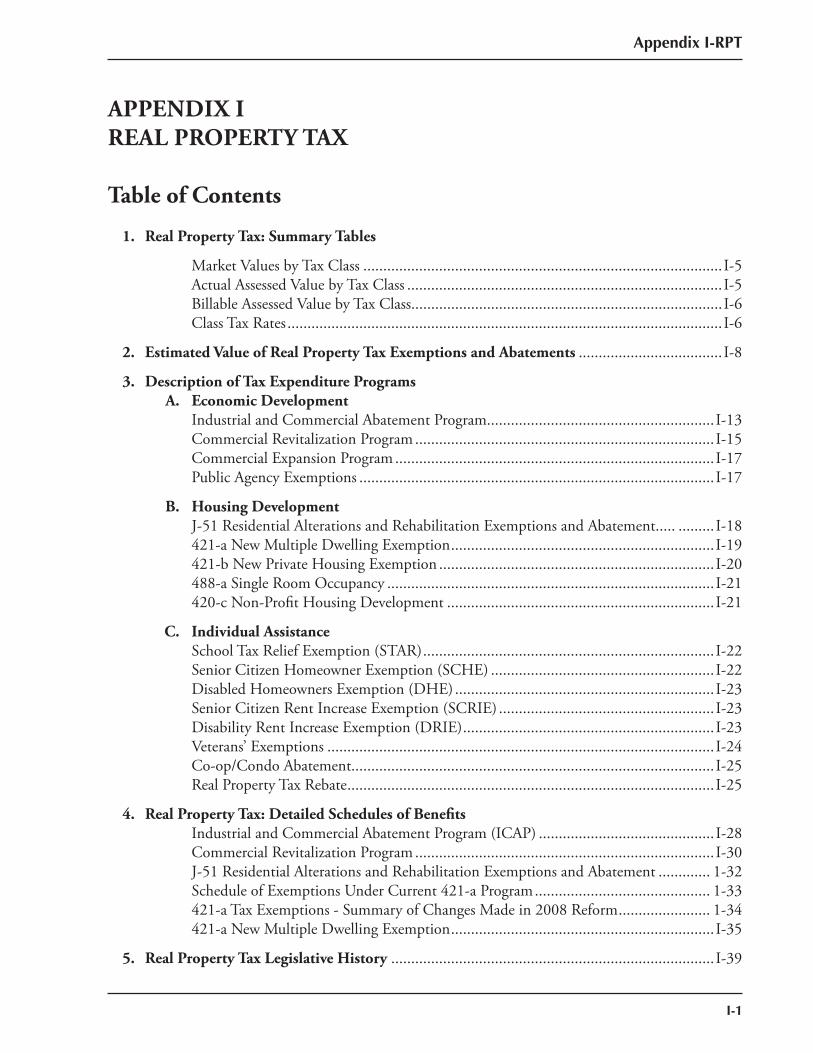
Appendix I-RPT
I-1
APPENDIX I REAL PROPERTY TAX
Table of Contents
1. Real Property Tax: Summary Tables
Market Values by Tax Class .......................................................................................... I-5 Actual Assessed Value by Tax Class ............................................................................... I-5 Billable Assessed Value by Tax Class.............................................................................. I-6 Class Tax Rates ............................................................................................................. I-6
2. Estimated Value of Real Property Tax Exemptions and Abatements .................................... I-8
3. Description of Tax Expenditure Programs A. Economic Development Industrial and Commercial Abatement Program ......................................................... I-13 Commercial Revitalization Program ........................................................................... I-15 Commercial Expansion Program ................................................................................ I-17 Public Agency Exemptions ......................................................................................... I-17
B. Housing Development J-51 Residential Alterations and Rehabilitation Exemptions and Abatement..... ......... I-18 421-a New Multiple Dwelling Exemption .................................................................. I-19 421-b New Private Housing Exemption ..................................................................... I-20 488-a Single Room Occupancy .................................................................................. I-21 420-c Non-Profi t Housing Development ................................................................... I-21
C. Individual Assistance School Tax Relief Exemption (STAR) ......................................................................... I-22 Senior Citizen Homeowner Exemption (SCHE) ........................................................ I-22 Disabled Homeowners Exemption (DHE) ................................................................. I-23 Senior Citizen Rent Increase Exemption (SCRIE) ...................................................... I-23 Disability Rent Increase Exemption (DRIE) ............................................................... I-23 Veterans’ Exemptions ................................................................................................. I-24 Co-op/Condo Abatement........................................................................................... I-25 Real Property Tax Rebate ............................................................................................ I-25
4. Real Property Tax: Detailed Schedules of Benefi ts Industrial and Commercial Abatement Program (ICAP) ............................................ I-28 Commercial Revitalization Program ........................................................................... I-30 J-51 Residential Alterations and Rehabilitation Exemptions and Abatement ............. 1-32 Schedule of Exemptions Under Current 421-a Program ............................................ 1-33 421-a Tax Exemptions - Summary of Changes Made in 2008 Reform ....................... 1-34 421-a New Multiple Dwelling Exemption .................................................................. I-35
5. Real Property Tax Legislative History ................................................................................. I-39

I-2
Appendix I-RPT
Appendix I-RPT
I-3
APPENDIX IREAL PROPERTY TAX
1.Real Property TaxSummary Tables

I-4
Appendix I-RPT
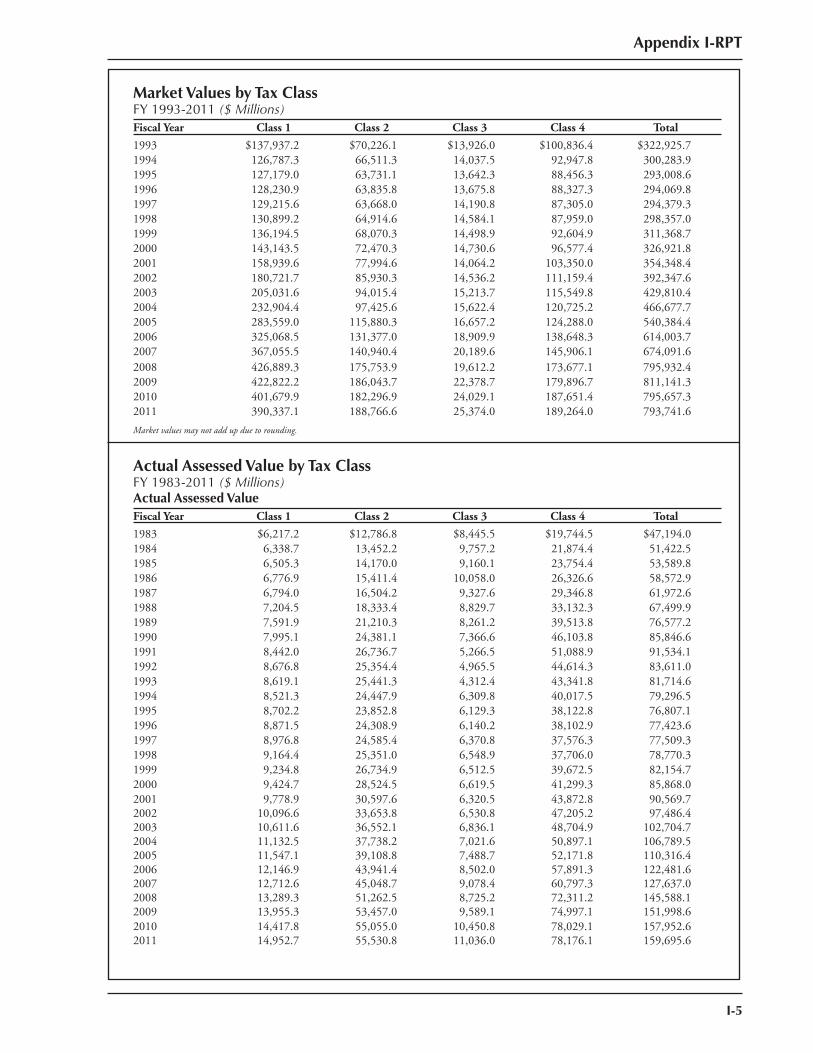
Appendix I-RPT
I-5
Market Values by Tax Class FY 1993-2011 ($ Millions) Fiscal Year Class 1 Class 2 Class 3 Class 4 Total
1993 $137,937.2 $70,226.1 $13,926.0 $100,836.4 $322,925.7 1994 126,787.3 66,511.3 14,037.5 92,947.8 300,283.91995 127,179.0 63,731.1 13,642.3 88,456.3 293,008.61996 128,230.9 63,835.8 13,675.8 88,327.3 294,069.81997 129,215.6 63,668.0 14,190.8 87,305.0 294,379.31998 130,899.2 64,914.6 14,584.1 87,959.0 298,357.01999 136,194.5 68,070.3 14,498.9 92,604.9 311,368.72000 143,143.5 72,470.3 14,730.6 96,577.4 326,921.82001 158,939.6 77,994.6 14,064.2 103,350.0 354,348.42002 180,721.7 85,930.3 14,536.2 111,159.4 392,347.62003 205,031.6 94,015.4 15,213.7 115,549.8 429,810.42004 232,904.4 97,425.6 15,622.4 120,725.2 466,677.72005 283,559.0 115,880.3 16,657.2 124,288.0 540,384.42006 325,068.5 131,377.0 18,909.9 138,648.3 614,003.72007 367,055.5 140,940.4 20,189.6 145,906.1 674,091.62008 426,889.3 175,753.9 19,612.2 173,677.1 795,932.42009 422,822.2 186,043.7 22,378.7 179,896.7 811,141.32010 401,679.9 182,296.9 24,029.1 187,651.4 795,657.32011 390,337.1 188,766.6 25,374.0 189,264.0 793,741.6
Market values may not add up due to rounding.
Actual Assessed Value by Tax Class FY 1983-2011 ($ Millions) Actual Assessed ValueFiscal Year Class 1 Class 2 Class 3 Class 4 Total
1983 $6,217.2 $12,786.8 $8,445.5 $19,744.5 $47,194.0 1984 6,338.7 13,452.2 9,757.2 21,874.4 51,422.51985 6,505.3 14,170.0 9,160.1 23,754.4 53,589.81986 6,776.9 15,411.4 10,058.0 26,326.6 58,572.91987 6,794.0 16,504.2 9,327.6 29,346.8 61,972.61988 7,204.5 18,333.4 8,829.7 33,132.3 67,499.91989 7,591.9 21,210.3 8,261.2 39,513.8 76,577.21990 7,995.1 24,381.1 7,366.6 46,103.8 85,846.61991 8,442.0 26,736.7 5,266.5 51,088.9 91,534.11992 8,676.8 25,354.4 4,965.5 44,614.3 83,611.01993 8,619.1 25,441.3 4,312.4 43,341.8 81,714.61994 8,521.3 24,447.9 6,309.8 40,017.5 79,296.51995 8,702.2 23,852.8 6,129.3 38,122.8 76,807.11996 8,871.5 24,308.9 6,140.2 38,102.9 77,423.61997 8,976.8 24,585.4 6,370.8 37,576.3 77,509.31998 9,164.4 25,351.0 6,548.9 37,706.0 78,770.31999 9,234.8 26,734.9 6,512.5 39,672.5 82,154.72000 9,424.7 28,524.5 6,619.5 41,299.3 85,868.02001 9,778.9 30,597.6 6,320.5 43,872.8 90,569.72002 10,096.6 33,653.8 6,530.8 47,205.2 97,486.42003 10,611.6 36,552.1 6,836.1 48,704.9 102,704.72004 11,132.5 37,738.2 7,021.6 50,897.1 106,789.52005 11,547.1 39,108.8 7,488.7 52,171.8 110,316.42006 12,146.9 43,941.4 8,502.0 57,891.3 122,481.62007 12,712.6 45,048.7 9,078.4 60,797.3 127,637.02008 13,289.3 51,262.5 8,725.2 72,311.2 145,588.12009 13,955.3 53,457.0 9,589.1 74,997.1 151,998.62010 14,417.8 55,055.0 10,450.8 78,029.1 157,952.62011 14,952.7 55,530.8 11,036.0 78,176.1 159,695.6
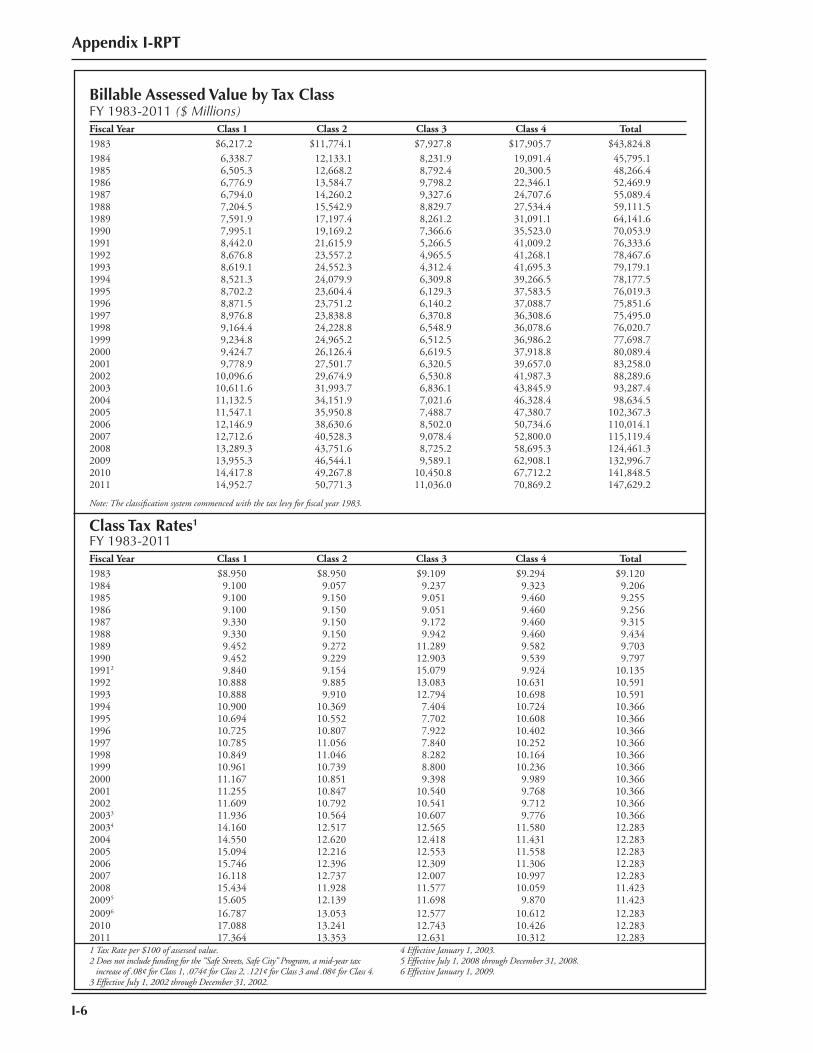
I-6
Appendix I-RPT
Billable Assessed Value by Tax Class FY 1983-2011 ($ Millions) Fiscal Year Class 1 Class 2 Class 3 Class 4 Total1983 $6,217.2 $11,774.1 $7,927.8 $17,905.7 $43,824.81984 6,338.7 12,133.1 8,231.9 19,091.4 45,795.11985 6,505.3 12,668.2 8,792.4 20,300.5 48,266.41986 6,776.9 13,584.7 9,798.2 22,346.1 52,469.91987 6,794.0 14,260.2 9,327.6 24,707.6 55,089.41988 7,204.5 15,542.9 8,829.7 27,534.4 59,111.51989 7,591.9 17,197.4 8,261.2 31,091.1 64,141.61990 7,995.1 19,169.2 7,366.6 35,523.0 70,053.91991 8,442.0 21,615.9 5,266.5 41,009.2 76,333.61992 8,676.8 23,557.2 4,965.5 41,268.1 78,467.61993 8,619.1 24,552.3 4,312.4 41,695.3 79,179.11994 8,521.3 24,079.9 6,309.8 39,266.5 78,177.51995 8,702.2 23,604.4 6,129.3 37,583.5 76,019.31996 8,871.5 23,751.2 6,140.2 37,088.7 75,851.61997 8,976.8 23,838.8 6,370.8 36,308.6 75,495.01998 9,164.4 24,228.8 6,548.9 36,078.6 76,020.71999 9,234.8 24,965.2 6,512.5 36,986.2 77,698.72000 9,424.7 26,126.4 6,619.5 37,918.8 80,089.42001 9,778.9 27,501.7 6,320.5 39,657.0 83,258.02002 10,096.6 29,674.9 6,530.8 41,987.3 88,289.62003 10,611.6 31,993.7 6,836.1 43,845.9 93,287.42004 11,132.5 34,151.9 7,021.6 46,328.4 98,634.52005 11,547.1 35,950.8 7,488.7 47,380.7 102,367.32006 12,146.9 38,630.6 8,502.0 50,734.6 110,014.12007 12,712.6 40,528.3 9,078.4 52,800.0 115,119.42008 13,289.3 43,751.6 8,725.2 58,695.3 124,461.32009 13,955.3 46,544.1 9,589.1 62,908.1 132,996.72010 14,417.8 49,267.8 10,450.8 67,712.2 141,848.52011 14,952.7 50,771.3 11,036.0 70,869.2 147,629.2
Note: The classifi cation system commenced with the tax levy for fi scal year 1983.
Class Tax Rates1 FY 1983-2011 Fiscal Year Class 1 Class 2 Class 3 Class 4 Total1983 $8.950 $8.950 $9.109 $9.294 $9.1201984 9.100 9.057 9.237 9.323 9.2061985 9.100 9.150 9.051 9.460 9.2551986 9.100 9.150 9.051 9.460 9.2561987 9.330 9.150 9.172 9.460 9.3151988 9.330 9.150 9.942 9.460 9.4341989 9.452 9.272 11.289 9.582 9.7031990 9.452 9.229 12.903 9.539 9.79719912 9.840 9.154 15.079 9.924 10.1351992 10.888 9.885 13.083 10.631 10.5911993 10.888 9.910 12.794 10.698 10.5911994 10.900 10.369 7.404 10.724 10.3661995 10.694 10.552 7.702 10.608 10.3661996 10.725 10.807 7.922 10.402 10.3661997 10.785 11.056 7.840 10.252 10.3661998 10.849 11.046 8.282 10.164 10.3661999 10.961 10.739 8.800 10.236 10.3662000 11.167 10.851 9.398 9.989 10.3662001 11.255 10.847 10.540 9.768 10.3662002 11.609 10.792 10.541 9.712 10.36620033 11.936 10.564 10.607 9.776 10.36620034 14.160 12.517 12.565 11.580 12.2832004 14.550 12.620 12.418 11.431 12.2832005 15.094 12.216 12.553 11.558 12.2832006 15.746 12.396 12.309 11.306 12.2832007 16.118 12.737 12.007 10.997 12.2832008 15.434 11.928 11.577 10.059 11.42320095 15.605 12.139 11.698 9.870 11.42320096 16.787 13.053 12.577 10.612 12.2832010 17.088 13.241 12.743 10.426 12.2832011 17.364 13.353 12.631 10.312 12.2831 Tax Rate per $100 of assessed value.2 Does not include funding for the “Safe Streets, Safe City” Program, a mid-year tax increase of .08¢ for Class 1, .074¢ for Class 2, .121¢ for Class 3 and .08¢ for Class 4.3 Effective July 1, 2002 through December 31, 2002.
4 Effective January 1, 2003.5 Effective July 1, 2008 through December 31, 2008.6 Effective January 1, 2009.
Appendix I-RPT
APPENDIX IREAL PROPERTY TAX
2.Estimated Value of Real PropertyTax Exemptions and Abatements
I-7
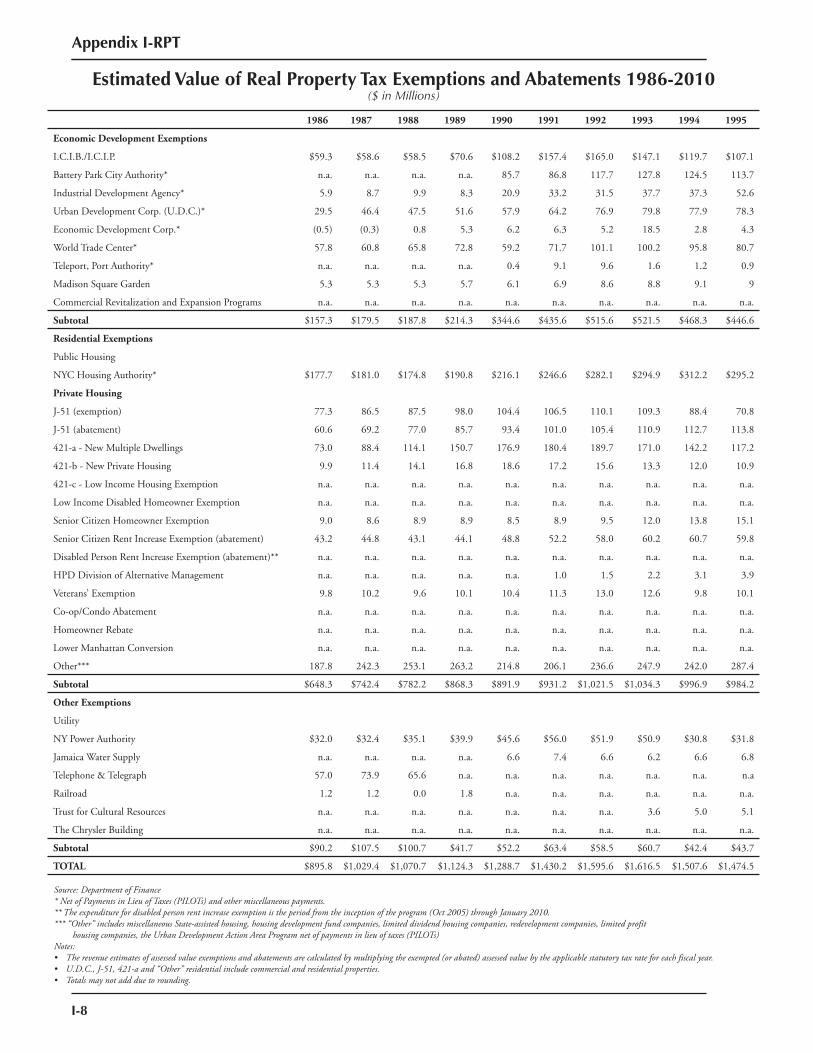
I-8
Appendix I-RPT
Estimated Value of Real Property Tax Exemptions and Abatements 1986-2010($ in Millions)
1986 1987 1988 1989 1990 1991 1992 1993 1994 1995
Economic Development Exemptions
I.C.I.B./I.C.I.P. $59.3 $58.6 $58.5 $70.6 $108.2 $157.4 $165.0 $147.1 $119.7 $107.1
Battery Park City Authority* n.a. n.a. n.a. n.a. 85.7 86.8 117.7 127.8 124.5 113.7
Industrial Development Agency* 5.9 8.7 9.9 8.3 20.9 33.2 31.5 37.7 37.3 52.6
Urban Development Corp. (U.D.C.)* 29.5 46.4 47.5 51.6 57.9 64.2 76.9 79.8 77.9 78.3
Economic Development Corp.* (0.5) (0.3) 0.8 5.3 6.2 6.3 5.2 18.5 2.8 4.3
World Trade Center* 57.8 60.8 65.8 72.8 59.2 71.7 101.1 100.2 95.8 80.7
Teleport, Port Authority* n.a. n.a. n.a. n.a. 0.4 9.1 9.6 1.6 1.2 0.9
Madison Square Garden 5.3 5.3 5.3 5.7 6.1 6.9 8.6 8.8 9.1 9
Commercial Revitalization and Expansion Programs n.a. n.a. n.a. n.a. n.a. n.a. n.a. n.a. n.a. n.a.
Subtotal $157.3 $179.5 $187.8 $214.3 $344.6 $435.6 $515.6 $521.5 $468.3 $446.6
Residential Exemptions
Public Housing
NYC Housing Authority* $177.7 $181.0 $174.8 $190.8 $216.1 $246.6 $282.1 $294.9 $312.2 $295.2
Private Housing
J-51 (exemption) 77.3 86.5 87.5 98.0 104.4 106.5 110.1 109.3 88.4 70.8
J-51 (abatement) 60.6 69.2 77.0 85.7 93.4 101.0 105.4 110.9 112.7 113.8
421-a - New Multiple Dwellings 73.0 88.4 114.1 150.7 176.9 180.4 189.7 171.0 142.2 117.2
421-b - New Private Housing 9.9 11.4 14.1 16.8 18.6 17.2 15.6 13.3 12.0 10.9
421-c - Low Income Housing Exemption n.a. n.a. n.a. n.a. n.a. n.a. n.a. n.a. n.a. n.a.
Low Income Disabled Homeowner Exemption n.a. n.a. n.a. n.a. n.a. n.a. n.a. n.a. n.a. n.a.
Senior Citizen Homeowner Exemption 9.0 8.6 8.9 8.9 8.5 8.9 9.5 12.0 13.8 15.1
Senior Citizen Rent Increase Exemption (abatement) 43.2 44.8 43.1 44.1 48.8 52.2 58.0 60.2 60.7 59.8
Disabled Person Rent Increase Exemption (abatement)** n.a. n.a. n.a. n.a. n.a. n.a. n.a. n.a. n.a. n.a.
HPD Division of Alternative Management n.a. n.a. n.a. n.a. n.a. 1.0 1.5 2.2 3.1 3.9
Veterans’ Exemption 9.8 10.2 9.6 10.1 10.4 11.3 13.0 12.6 9.8 10.1
Co-op/Condo Abatement n.a. n.a. n.a. n.a. n.a. n.a. n.a. n.a. n.a. n.a.
Homeowner Rebate n.a. n.a. n.a. n.a. n.a. n.a. n.a. n.a. n.a. n.a.
Lower Manhattan Conversion n.a. n.a. n.a. n.a. n.a. n.a. n.a. n.a. n.a. n.a.
Other*** 187.8 242.3 253.1 263.2 214.8 206.1 236.6 247.9 242.0 287.4
Subtotal $648.3 $742.4 $782.2 $868.3 $891.9 $931.2 $1,021.5 $1,034.3 $996.9 $984.2
Other Exemptions
Utility
NY Power Authority $32.0 $32.4 $35.1 $39.9 $45.6 $56.0 $51.9 $50.9 $30.8 $31.8
Jamaica Water Supply n.a. n.a. n.a. n.a. 6.6 7.4 6.6 6.2 6.6 6.8
Telephone & Telegraph 57.0 73.9 65.6 n.a. n.a. n.a. n.a. n.a. n.a. n.a
Railroad 1.2 1.2 0.0 1.8 n.a. n.a. n.a. n.a. n.a. n.a.
Trust for Cultural Resources n.a. n.a. n.a. n.a. n.a. n.a. n.a. 3.6 5.0 5.1
The Chrysler Building n.a. n.a. n.a. n.a. n.a. n.a. n.a. n.a. n.a. n.a.
Subtotal $90.2 $107.5 $100.7 $41.7 $52.2 $63.4 $58.5 $60.7 $42.4 $43.7
TOTAL $895.8 $1,029.4 $1,070.7 $1,124.3 $1,288.7 $1,430.2 $1,595.6 $1,616.5 $1,507.6 $1,474.5
Source: Department of Finance * Net of Payments in Lieu of Taxes (PILOTs) and other miscellaneous payments.** The expenditure for disabled person rent increase exemption is the period from the inception of the program (Oct 2005) through January 2010.*** “Other” includes miscellaneous State-assisted housing, housing development fund companies, limited dividend housing companies, redevelopment companies, limited profit housing companies, the Urban Development Action Area Program net of payments in lieu of taxes (PILOTs)Notes:• The revenue estimates of assessed value exemptions and abatements are calculated by multiplying the exempted (or abated) assessed value by the applicable statutory tax rate for each fiscal year.• U.D.C., J-51, 421-a and “Other” residential include commercial and residential properties.• Totals may not add due to rounding.
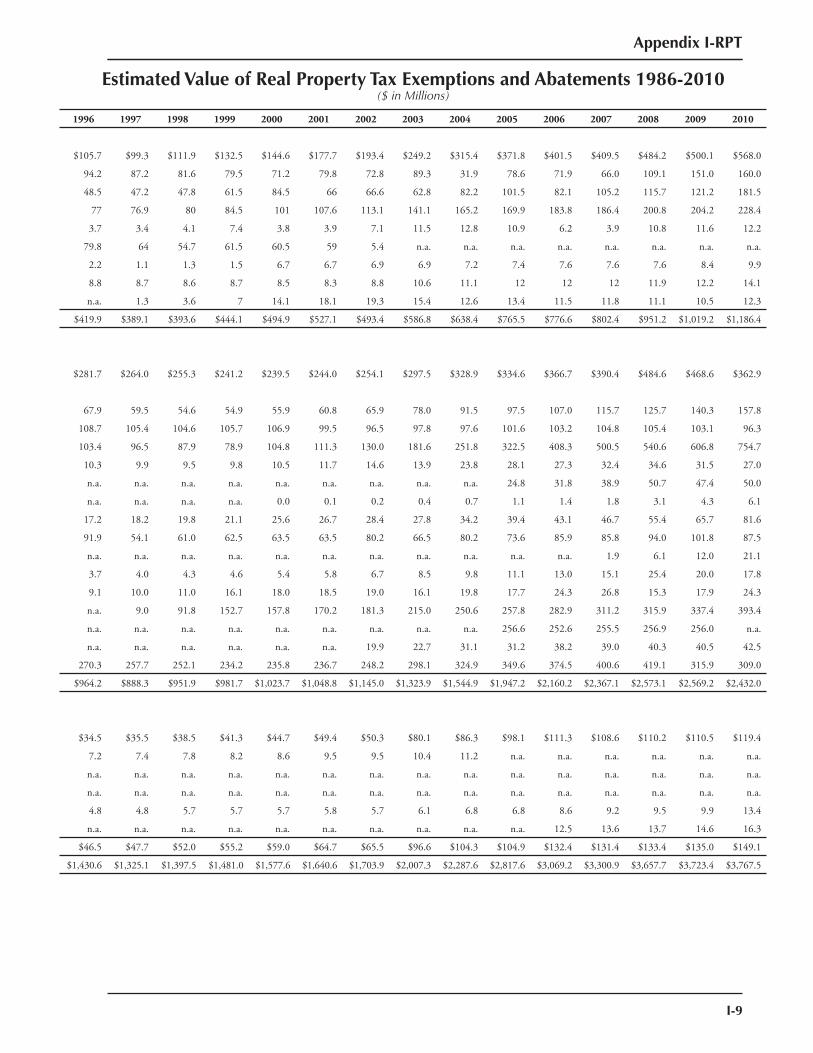
Appendix I-RPT
I-9
Estimated Value of Real Property Tax Exemptions and Abatements 1986-2010($ in Millions)
1996 1997 1998 1999 2000 2001 2002 2003 2004 2005 2006 2007 2008 2009 2010
$105.7 $99.3 $111.9 $132.5 $144.6 $177.7 $193.4 $249.2 $315.4 $371.8 $401.5 $409.5 $484.2 $500.1 $568.0
94.2 87.2 81.6 79.5 71.2 79.8 72.8 89.3 31.9 78.6 71.9 66.0 109.1 151.0 160.0
48.5 47.2 47.8 61.5 84.5 66 66.6 62.8 82.2 101.5 82.1 105.2 115.7 121.2 181.5
77 76.9 80 84.5 101 107.6 113.1 141.1 165.2 169.9 183.8 186.4 200.8 204.2 228.4
3.7 3.4 4.1 7.4 3.8 3.9 7.1 11.5 12.8 10.9 6.2 3.9 10.8 11.6 12.2
79.8 64 54.7 61.5 60.5 59 5.4 n.a. n.a. n.a. n.a. n.a. n.a. n.a. n.a.
2.2 1.1 1.3 1.5 6.7 6.7 6.9 6.9 7.2 7.4 7.6 7.6 7.6 8.4 9.9
8.8 8.7 8.6 8.7 8.5 8.3 8.8 10.6 11.1 12 12 12 11.9 12.2 14.1
n.a. 1.3 3.6 7 14.1 18.1 19.3 15.4 12.6 13.4 11.5 11.8 11.1 10.5 12.3
$419.9 $389.1 $393.6 $444.1 $494.9 $527.1 $493.4 $586.8 $638.4 $765.5 $776.6 $802.4 $951.2 $1,019.2 $1,186.4
$281.7 $264.0 $255.3 $241.2 $239.5 $244.0 $254.1 $297.5 $328.9 $334.6 $366.7 $390.4 $484.6 $468.6 $362.9
67.9 59.5 54.6 54.9 55.9 60.8 65.9 78.0 91.5 97.5 107.0 115.7 125.7 140.3 157.8
108.7 105.4 104.6 105.7 106.9 99.5 96.5 97.8 97.6 101.6 103.2 104.8 105.4 103.1 96.3
103.4 96.5 87.9 78.9 104.8 111.3 130.0 181.6 251.8 322.5 408.3 500.5 540.6 606.8 754.7
10.3 9.9 9.5 9.8 10.5 11.7 14.6 13.9 23.8 28.1 27.3 32.4 34.6 31.5 27.0
n.a. n.a. n.a. n.a. n.a. n.a. n.a. n.a. n.a. 24.8 31.8 38.9 50.7 47.4 50.0
n.a. n.a. n.a. n.a. 0.0 0.1 0.2 0.4 0.7 1.1 1.4 1.8 3.1 4.3 6.1
17.2 18.2 19.8 21.1 25.6 26.7 28.4 27.8 34.2 39.4 43.1 46.7 55.4 65.7 81.6
91.9 54.1 61.0 62.5 63.5 63.5 80.2 66.5 80.2 73.6 85.9 85.8 94.0 101.8 87.5
n.a. n.a. n.a. n.a. n.a. n.a. n.a. n.a. n.a. n.a. n.a. 1.9 6.1 12.0 21.1
3.7 4.0 4.3 4.6 5.4 5.8 6.7 8.5 9.8 11.1 13.0 15.1 25.4 20.0 17.8
9.1 10.0 11.0 16.1 18.0 18.5 19.0 16.1 19.8 17.7 24.3 26.8 15.3 17.9 24.3
n.a. 9.0 91.8 152.7 157.8 170.2 181.3 215.0 250.6 257.8 282.9 311.2 315.9 337.4 393.4
n.a. n.a. n.a. n.a. n.a. n.a. n.a. n.a. n.a. 256.6 252.6 255.5 256.9 256.0 n.a.
n.a. n.a. n.a. n.a. n.a. n.a. 19.9 22.7 31.1 31.2 38.2 39.0 40.3 40.5 42.5
270.3 257.7 252.1 234.2 235.8 236.7 248.2 298.1 324.9 349.6 374.5 400.6 419.1 315.9 309.0
$964.2 $888.3 $951.9 $981.7 $1,023.7 $1,048.8 $1,145.0 $1,323.9 $1,544.9 $1,947.2 $2,160.2 $2,367.1 $2,573.1 $2,569.2 $2,432.0
$34.5 $35.5 $38.5 $41.3 $44.7 $49.4 $50.3 $80.1 $86.3 $98.1 $111.3 $108.6 $110.2 $110.5 $119.4
7.2 7.4 7.8 8.2 8.6 9.5 9.5 10.4 11.2 n.a. n.a. n.a. n.a. n.a. n.a.
n.a. n.a. n.a. n.a. n.a. n.a. n.a. n.a. n.a. n.a. n.a. n.a. n.a. n.a. n.a.
n.a. n.a. n.a. n.a. n.a. n.a. n.a. n.a. n.a. n.a. n.a. n.a. n.a. n.a. n.a.
4.8 4.8 5.7 5.7 5.7 5.8 5.7 6.1 6.8 6.8 8.6 9.2 9.5 9.9 13.4
n.a. n.a. n.a. n.a. n.a. n.a. n.a. n.a. n.a. n.a. 12.5 13.6 13.7 14.6 16.3
$46.5 $47.7 $52.0 $55.2 $59.0 $64.7 $65.5 $96.6 $104.3 $104.9 $132.4 $131.4 $133.4 $135.0 $149.1
$1,430.6 $1,325.1 $1,397.5 $1,481.0 $1,577.6 $1,640.6 $1,703.9 $2,007.3 $2,287.6 $2,817.6 $3,069.2 $3,300.9 $3,657.7 $3,723.4 $3,767.5

I-10
Appendix I-RPT
Appendix I-RPT
I-11
APPENDIX IREAL PROPERTY TAX
3.Description of Tax
Expenditure Programs

I-12
Appendix I-RPT
Appendix I-RPT
I-13
DESCRIPTION OF TAXEXPENDITURE PROGRAMS
A. ECONOMIC DEVELOPMENTIndustrial and Commercial Abatement Program (ICAP) (NYSRPTL, Sections 489-aaaaaa to 489-kkkkkk) The Industrial and Commercial Incentive Program (ICIP) was established in 1984 to stimulate economic development by providing real property tax exemptions and abatements for new construction and the modernization of existing industrial and commercial structures. This program was modifi ed in 2008 to address the needs arising from New York City’s ever-changing economic climate. Effective July 1, 2008, ICAP replaces the ICIP. The new ICAP program provides real property tax abatement for eligible industrial and commercial buildings that are newly built, modernized, rehabilitated, expanded or otherwise physically improved. In order to qualify, construction work must be completed before December 31, 2013. The application deadline is March 1, 2011. The benefit period ranges from eight to 25 years. An additional “inflation protection” benefit allows tax increases due to market value increases to be exempted as well. These incentives are granted “as-of-right” based on geographic location. The projects are automatically eligible for the benefit if they meet specific eligibility requirements and complete the appropriate legal and administrative requirements. ICAP benefi ts consist of an abatement base plus infl ation protection (when available). The ICAP abatement base is calculated as the difference between post-completion tax1 on a building or structure and 115 percent of the initial tax. Furthermore, in order to be eligible for ICAP, construction cost must meet minimum required expenditure of 30.0 percent of the initial taxable assessed value (AV) within four years from the date of issuance of the building permit or start of construction if no permit is required. In addition, construction is required to be completed within five years from the date of issuance of the building permit or commencement of construction if no permit is required.
Inflation protection is an additional benefit that prevents significant increase in tax as a result of substantial change in market value. Only commercial construction work and industrial construction work are entitled for these benefi ts. Inflation protection provides benefits during years two through 13, and is more generous for industrial construction work than commercial construction work. For industrial construction work, the amount of the benefi ts is equal to full annual percentage increase in the building taxable assessed value. For commercial construction work, the amount of the benefi ts is equal to zero if the taxable assessed value grows less than five percent, or is equal to the change in taxable assessed value above annual five percent times the initial tax rate if the growth rate is above fi ve percent. Inflation protection does not apply to increases in taxable assessed value above five percent resulting from physical changes (resulting from additional renovation not covered in the ICAP application or alterations finished after four years from issuance of the first building permit). The New York City Department of Finance (DOF) administers the ICAP. The following tax incentives are detailed on page I-28. The new ICAP can be classified under the following five categories:
1a. Industrial Projects All industrial projects throughout the City, regardless of location, enjoy a total of 25 years of benefits, which include 16 years of full abatement on the increased assessed value due to physical changes followed by an additional nine years of declining abatement phase-out at ten percent each year from year 17 through 25. An industrial property is defined as a non-residential property, where at least 75.0 percent of the total net square footage is used for manufacturing activity involving assembling of goods or fabrication or processing of raw materials – but does not include utility properties. If more than ten percent of the building or structure is used for retail purposes, the excess retail space is subject to a 15-year benefit schedule, with 100.0 percent full abatement for the first 11 years followed by a four-year phase-out of benefits declining at 20.0 percent each year from year 12 through 15.
1 The post-completion tax is determined by multiplying the initial tax rate by the fi nal taxable assessed value, without regard to any exemptions.
ICAP abatement base = Initial Tax Rate x (AV building end – 1.15 x AV building initial )
I-14
The minimum required expenditure is 30.0 percent of the initial taxable assessed value of the building. The industrial buildings are eligible for inflation protection. 1b. Industrial Projects (Additional Industrial Abatement) Industrial projects that meet a higher minimum required expenditure of 40.0 percent rather than 30.0 percent are eligible for an additional abatement of the initial tax. This abatement is 50.0 percent of the initial tax amount for the first four years followed by a phase-out of benefits declining at ten percent every two years between years five and 12. These additional benefi ts start at the same time as ICAP benefi ts regardless of the amount of space dedicated to retail purposes. Inflation protection is not available for additional industrial abatement. 2. Commercial Projects (Regular Abatement Areas) Commercial projects in regular abatement areas, which include areas in Manhattan north of the centerline of 96th Street, south of Murray, Frankfort and Dove Street, The Bronx, Brooklyn, Queens and Staten Island, will be eligible for tax benefits for a period of 15 years. Qualified projects receive a full abatement on the increased assessed value due to physical changes for the first 11 years, with an additional four years of abatement phase-out decreasing by 20.0 percent each year from year 12 through 15. The minimum required expenditure is 30.0 percent of the taxable assessed value of the building at the start of the project. The buildings are not eligible for infl ation protection. 3. Commercial Projects (Special Abatement Areas) Commercial projects in designated special abatement areas enjoy a total of 25 years of tax abatement. The first 16 years of full tax abatement on the increased assessed value due to physical changes are followed by nine years of declining abatement phased out at ten percent each year from years 17 through 25. If more than ten percent of the building or structure is used for retail purposes, the excess retail space is subject to a 15-year benefit schedule, where 100.0 percent full abatement for the first 11 years is followed by a phase-out of benefits declining at 20.0 percent each year between years 12 and 15. The minimum required expenditure is 30.0 percent of the initial assessed value. The buildings are eligible for inflation protection depending on the annual percentage increase in the taxable assessed value (see chart for details).
4. Commercial Projects (Renovation Areas) Commercial renovation provides abatements for expanding, modernizing or improving existing structures anywhere in the City except areas located in Manhattan between the centerline of 59th Street and the centerline of 96th Street. In Manhattan, benefits are available for renovation in three areas: the Garment Center District; an area located in lower Manhattan bounded generally by Murray Street, South Street, Battery Place and West Street; and the remainder of Manhattan below 59th Street with exception of “smart buildings” in lower Manhattan. The types of benefits vary depending on the location of the project: (1) the renovation constructions located south of 59th Street, excluding the lower Manhattan and Garment District areas, get ten-year benefits with 100.0 percent abatement in the first five years followed by an additional four years of abatement declining by 20.0 percent each year from years six to nine. The tenth year abatement equals 20.0 percent. This benefit is available for all eligible constructions and buildings with retail use of up to five percent. (2) Renovation constructions located in lower Manhattan and Garment District get a total of 12 years of benefits with a 100.0 percent renovation benefit for the first eight years and an additional four years of exemption declining by 20.0 percent each year from years nine through 12. The minimum required expenditure is 30.0 percent of the initial assessed value. In the Garment District area and South of 59th Street, the construction expenditures on the retail portion of the building that exceed five percent of its area do not enter the minimum required expenditure calculation. In addition, the ICAP benefits are available for all eligible uses including buildings with up to five percent use for retail purposes with the exception of lower Manhattan where ICAP benefits are available for all uses regardless of the percentage of retail use in the building. Abatement is restricted to the renovation of existing buildings only. The buildings are not eligible for infl ation protection.
5. Commercial Projects (New Construction Incentive for “Smart Buildings”) “Smart buildings” must meet certain construction standards to accommodate advanced computer and telecommunications equipment and have enhanced electrical capacity and emergency back-up power (see table on page I-28 for the definition of a “smart building”).
Appendix I-RPT
Appendix I-RPT
I-15
This program grants an eight-year tax abatement for eligible projects, with full abatement for the first four years followed by a phase-out of benefits declining 20.0 percent each year from year five through eight. The minimum required expenditure is 30.0 percent of the initial assessed value. ICAP does not provide benefits for utility properties, which include all properties used by utility companies in the ordinary course of business, as well as land and buildings owned by utility companies.
Commercial Revitalization Program (NYSRPTL, Section 499-a to 499-h) The Commercial Revitalization Program was enacted in 1995 to promote more productive use of older non-residential and mixed-use buildings constructed before 1975 in lower Manhattan. This program offers real property tax abatement, commercial rent tax special reduction and energy tax reduction to spur economic activity by encouraging the conversion and/or renovation of obsolete commercial buildings to viable residential housing or mixed-use commercial and residential properties. The Commercial Revitalization Program was revised throughout the years to address the problems of high vacancy and obsolescence, primarily in the downtown Manhattan area. The program was originally set to expire on March 31, 1998. In March 2010, this program was extended until March 31, 2014 with the benefi t period sunsetting on March 31, 2020. This program is administered by DOF. The following tax incentives are detailed on page I-30.
1. Real Property Tax Abatement Property tax abatements are available for pre-1975 buildings located in the statutorily designated abatement zone and leased for commercial offi ce space or retail space between April 1, 1997 and March 31, 2014. The abatement zone area is bounded by Murray Street and Frankfort Street on the north, South Street on the east, Battery Place on the south and West Street on the west. Eligible leases’ terms range from three to ten years depending on the number of people employed. Businesses employing 125 or fewer people must sign lease terms with a minimum of three to five years. Businesses employing more than 125 people must sign leases with a minimum of ten years. The property tax abatement is three years for leases with a minimum of three years but less than fi ve years, or fi ve years for leases with a term of fi ve years or more.
The abatement is the lower of the actual tax liability per square foot or $2.50 per square foot for a three-year benefit or a five-year benefit. The abatement for the last two years equals two-thirds and one-third, respectively, of the abatement in the initial year. The expenditure requirement is $10 per square foot for renewal leases with a ten-year lease term, and $35 per square foot for new leases and expansion leases. The time period to incur the expenditures in order to qualify for the real property tax abatement is from September 30, 2010 to September 30, 2014. In 1997, the benefi t was modifi ed to provide enhanced benefit to small (fewer than 125 employees) tenants by lowering the minimum expenditure and the minimum lease period requirements for leases commencing on or after April 1, 1997. This program also extended real property tax reductions to qualifying properties in boroughs other than Manhattan. In 2006, this program was extended to cover private elementary or secondary school premises as well.
2. Commercial Rent Tax Special Reduction This benefit takes the form of a “special reduction” that is subtracted from the amount of rent otherwise subject to the commercial rent tax for buildings (including government-owned buildings) in lower Manhattan. Tenants who qualify for real property tax abatement under Commercial Revitalization Program automatically qualify for the commercial rent tax special reduction as well. Commercial rent tax special reduction program offers three- or fi ve- year reductions. The fi rst year commercial rent tax reduction is equal to the fi rst year base rent. For the three-year benefi ts, the special reductions for the second and third years are equal to two-thirds and one-third, respectively, of the lesser of the initial year’s reduction or the base rent for that year. For the fi ve-year benefi ts, the second and third year’s commercial rent reductions are equal to the lesser of the initial year’s rent reduction or the base rent for that year. For the fourth and fi fth years, the reductions are equal to two-thirds and one-third, respectively, of the lesser of the initial year’s reduction or the base rent for that year. Prior to the program changes enacted in 1997, a lease term of at least ten years was required of tenants with more than 50 employees. The amendment of the program reduced the minimum lease term requirement for tenants with fewer than 125 employees to five years for leases commencing on or after July 1, 1996, and to three years for leases
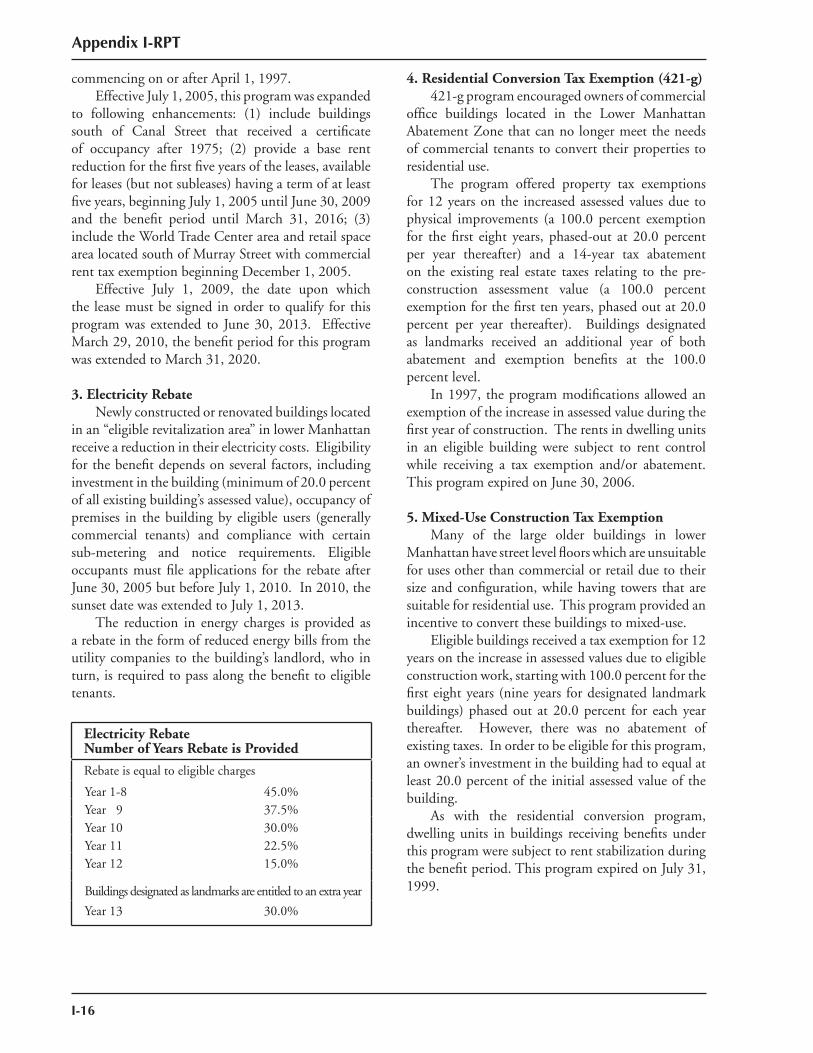
I-16
commencing on or after April 1, 1997. Effective July 1, 2005, this program was expanded to following enhancements: (1) include buildings south of Canal Street that received a certificate of occupancy after 1975; (2) provide a base rent reduction for the first five years of the leases, available for leases (but not subleases) having a term of at least five years, beginning July 1, 2005 until June 30, 2009 and the benefi t period until March 31, 2016; (3) include the World Trade Center area and retail space area located south of Murray Street with commercial rent tax exemption beginning December 1, 2005. Effective July 1, 2009, the date upon which the lease must be signed in order to qualify for this program was extended to June 30, 2013. Effective March 29, 2010, the benefi t period for this program was extended to March 31, 2020.
3. Electricity Rebate Newly constructed or renovated buildings located in an “eligible revitalization area” in lower Manhattan receive a reduction in their electricity costs. Eligibility for the benefit depends on several factors, including investment in the building (minimum of 20.0 percent of all existing building’s assessed value), occupancy of premises in the building by eligible users (generally commercial tenants) and compliance with certain sub-metering and notice requirements. Eligible occupants must fi le applications for the rebate after June 30, 2005 but before July 1, 2010. In 2010, the sunset date was extended to July 1, 2013. The reduction in energy charges is provided as a rebate in the form of reduced energy bills from the utility companies to the building’s landlord, who in turn, is required to pass along the benefit to eligible tenants.
4. Residential Conversion Tax Exemption (421-g) 421-g program encouraged owners of commercial office buildings located in the Lower Manhattan Abatement Zone that can no longer meet the needs of commercial tenants to convert their properties to residential use. The program offered property tax exemptions for 12 years on the increased assessed values due to physical improvements (a 100.0 percent exemption for the first eight years, phased-out at 20.0 percent per year thereafter) and a 14-year tax abatement on the existing real estate taxes relating to the pre-construction assessment value (a 100.0 percent exemption for the first ten years, phased out at 20.0 percent per year thereafter). Buildings designated as landmarks received an additional year of both abatement and exemption benefits at the 100.0 percent level. In 1997, the program modifications allowed an exemption of the increase in assessed value during the first year of construction. The rents in dwelling units in an eligible building were subject to rent control while receiving a tax exemption and/or abatement. This program expired on June 30, 2006.
5. Mixed-Use Construction Tax Exemption Many of the large older buildings in lower Manhattan have street level floors which are unsuitable for uses other than commercial or retail due to their size and configuration, while having towers that are suitable for residential use. This program provided an incentive to convert these buildings to mixed-use. Eligible buildings received a tax exemption for 12 years on the increase in assessed values due to eligible construction work, starting with 100.0 percent for the first eight years (nine years for designated landmark buildings) phased out at 20.0 percent for each year thereafter. However, there was no abatement of existing taxes. In order to be eligible for this program, an owner’s investment in the building had to equal at least 20.0 percent of the initial assessed value of the building. As with the residential conversion program, dwelling units in buildings receiving benefits under this program were subject to rent stabilization during the benefit period. This program expired on July 31, 1999.
Electricity RebateNumber of Years Rebate is Provided
Rebate is equal to eligible charges
Year 1-8 45.0%Year 9 37.5%Year 10 30.0%Year 11 22.5%Year 12 15.0%
Buildings designated as landmarks are entitled to an extra year
Year 13 30.0%
Appendix I-RPT
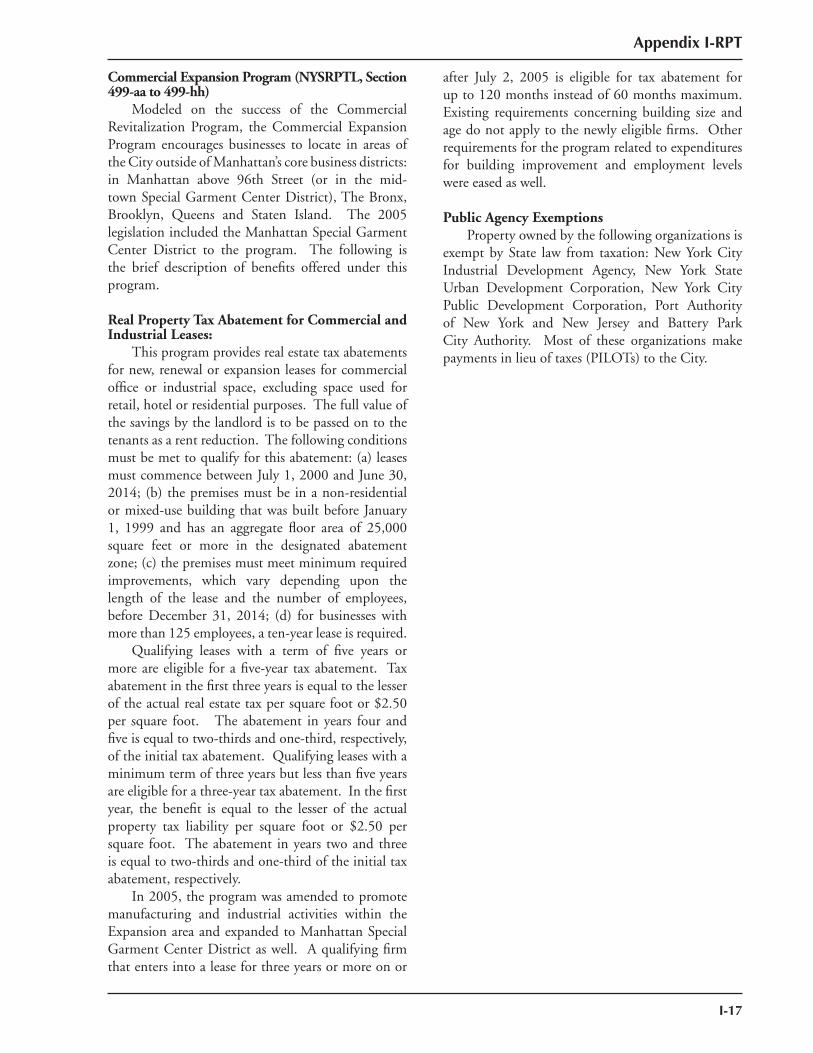
Appendix I-RPT
I-17
Commercial Expansion Program (NYSRPTL, Section 499-aa to 499-hh) Modeled on the success of the Commercial Revitalization Program, the Commercial Expansion Program encourages businesses to locate in areas of the City outside of Manhattan’s core business districts: in Manhattan above 96th Street (or in the mid-town Special Garment Center District), The Bronx, Brooklyn, Queens and Staten Island. The 2005 legislation included the Manhattan Special Garment Center District to the program. The following is the brief description of benefits offered under this program.
Real Property Tax Abatement for Commercial and Industrial Leases: This program provides real estate tax abatements for new, renewal or expansion leases for commercial office or industrial space, excluding space used for retail, hotel or residential purposes. The full value of the savings by the landlord is to be passed on to the tenants as a rent reduction. The following conditions must be met to qualify for this abatement: (a) leases must commence between July 1, 2000 and June 30, 2014; (b) the premises must be in a non-residential or mixed-use building that was built before January 1, 1999 and has an aggregate floor area of 25,000 square feet or more in the designated abatement zone; (c) the premises must meet minimum required improvements, which vary depending upon the length of the lease and the number of employees, before December 31, 2014; (d) for businesses with more than 125 employees, a ten-year lease is required. Qualifying leases with a term of five years or more are eligible for a five-year tax abatement. Tax abatement in the first three years is equal to the lesser of the actual real estate tax per square foot or $2.50 per square foot. The abatement in years four and five is equal to two-thirds and one-third, respectively, of the initial tax abatement. Qualifying leases with a minimum term of three years but less than five years are eligible for a three-year tax abatement. In the first year, the benefit is equal to the lesser of the actual property tax liability per square foot or $2.50 per square foot. The abatement in years two and three is equal to two-thirds and one-third of the initial tax abatement, respectively. In 2005, the program was amended to promote manufacturing and industrial activities within the Expansion area and expanded to Manhattan Special Garment Center District as well. A qualifying fi rm that enters into a lease for three years or more on or
after July 2, 2005 is eligible for tax abatement for up to 120 months instead of 60 months maximum. Existing requirements concerning building size and age do not apply to the newly eligible fi rms. Other requirements for the program related to expenditures for building improvement and employment levels were eased as well.
Public Agency Exemptions Property owned by the following organizations is exempt by State law from taxation: New York City Industrial Development Agency, New York State Urban Development Corporation, New York City Public Development Corporation, Port Authority of New York and New Jersey and Battery Park City Authority. Most of these organizations make payments in lieu of taxes (PILOTs) to the City.
I-18
B. HOUSING DEVELOPMENTResidential Alterations and Rehabilitation Exemptions and Abatement
J-51 Program (NYSRPTL, Section 489) The J-51 program promotes rehabilitation of existing multiple dwellings or conversion of non-residential buildings to Class A residential multiple dwellings by providing a 14-year exemption on the increased assessed value resulting from the improvements, alterations or rehabilitations (certain government-assisted rehabilitations of vacant City-owned buildings are eligible for a 34-year exemption) and an abatement on the existing taxes, which is based on the lesser of the owner’s claimed cost or Certified Reasonable Cost (CRC) of the improvement. The amount and duration of benefits granted are determined by the type of “renovation category” into which the project falls. All conversions, alterations, and improvements must be completed prior to December 31, 2011 to qualify for benefi ts under this program. In 2001, the program was extended to cooperatives, condominiums and housing development fund companies to cover eligible expenses for converting a direct metering system to a sub-metering system. This program is administered jointly by HPD and DOF. In 2003, the program was expanded to allow exemption (but not abatement) benefits for projects that result in an expansion of the gross cubic content of the building, provided the floor area of the existing building that was converted, altered or improved comprises at least 50 percent of the completed structure. For projects in Manhattan between 110th Street and Chambers Street, such a project can qualify for exemption benefits only if it is aided by a grant, loan or subsidy from a Federal, State or local agency. J-51 benefi ts are generally restricted to properties with pre-rehabilitation assessed values of over $40,000 per dwelling unit. In 2008, this restriction was lifted for mutual redevelopment companies established under Article 5 of the Private Housing Finance Law, provided they made a binding agreement to continue in that status for at least 15 years from the commencement of J-51 benefi ts or the expiration of certain tax benefi ts under Private Housing Finance Law. The current benefi ciary under of this law change
is the Penn South housing development on the west side of Manhattan.
Eligibility Requirements The following list details the conditions for eligibility for J-51 benefits:
• All renovation and rehabilitation must fit into one of the renovation categories described in the table on page I-32.
• All work must be completed in three years, or within five years if government-assisted.
• The pre-rehabilitation assessed value cannot exceed $40,000 per dwelling unit for all conversions north of 110th Street and the post-rehabilitation assessed value per dwelling unit cannot exceed $38,000 per dwelling unit for conversions in Manhattan south of 110th Street1.
• Limited Profit Housing companies formed under Article 2 of the Private Housing Finance Law (Mitchell-Lamas) are also eligible, provided the housing company signs a binding agreement to remain in the Mitchell-Lama program for at least 15 years from commencement of J-51 benefits.
• At the time benefits are granted, all back taxes on land and building, plus all charges for water and sewer must be current. During the benefit period, these taxes cannot be delinquent for more than one year, or else the J-51 benefits will be revoked.
• The tax abatements issued on any property that is located in the Minimum Tax Zone2 cannot be used to abate or reduce taxes on the land portion of the property.
• An application can be filed for any property located in the Tax Abatement Exclusion Zone3 for the abatement portion of the benefits only, and for not more than $2,500 per unit.
• Rental units must remain under rent regulation during the benefit period.
Conditions of Ineligibility Any one of the following conditions would render a project ineligible for benefits under the J-51 program:
• Any building that receives exemptions or abatements from another program (i.e. 421-a program) at the time of renovation is ineligible
1 This restriction does not apply to projects under Article 5 of the Private Housing Finance Law.2 The Minimum Tax Zone is generally the area in Manhattan bounded by 86th Street and the East River to Houston Street, and then northward along the Hudson
River to 72nd Street on the west side.3 The Tax Abatement Exclusion Zone is generally the area in Manhattan bounded by 96th Street and the East River to 34th Street, then northward along Broadway to 59th Street and Central Park West, and then continuing northward along Central Park West to 96th Street on the west side.
Appendix I-RPT
Appendix I-RPT
I-19
for J-51 benefits. This does not include provisions of the Private Housing Finance Law.
• Any multiple dwelling that results from the renovation of a private dwelling will be ineligible for benefits, unless the project is carried out with substantial government assistance.
• Buildings receiving benefits under section J-51 are not eligible for the following exemptions: School Tax Relief, Senior Citizen Homeowner Exemption and Veterans’ Exemption.
• Any property where the improvement is assessed at $1,000 or less at the start of the renovation process will not qualify for the program, unless the project is carried out with substantial government assistance.
• Single Room Occupancy (SRO) conversions cannot receive J-51 exemption or abatement benefits if the project is not carried out with substantial government assistance.
J-51 exemption (but not abatement) benefits are available for projects that result in an expansion of the gross cubic content of the building, provided the floor area of the existing building that was converted, altered or improved comprises at least 50.0 percent of the completed structure. In Manhattan between 110th Street and Chambers Street, such projects can qualify for exemption benefits only if they are aided by a grant, loan or subsidy from a Federal, State or local agency. The renovation categories and corresponding exemption and abatement schedules are shown in the table on page I-32. New Multiple Dwelling Exemption, 421-a Program (NYSRPTL, Section 421-a) The 421-a exemption is a tax incentive program that was created in 1971 to promote supply of affordable housing to low and moderate income New Yorkers by stimulating the construction of multi-family residential buildings by providing declining exemptions on the new value created by the improvements when many developers were reluctant to invest in new housing in the City. In order to qualify, the construction site must be vacant or improved only with non-conforming use three years prior to the start of construction. However, the City and its real estate market have changed dramatically since that time. In recognition of the need to reform the program, the Mayor formed a task force to examine the existing 421-a program and suggest changes that would better align with the current real estate environment.
Under the old program, four different exemptions with different exemption periods of 10, 15, 20 and 25 years were provided depending on the location of the project and the qualifying requirements. Properties except in Manhattan Geographic Exclusion Area (GEA), defined by an area south of 96th Street and north of Houston Street on the west side and north of 14th Street on the east side, were eligible for the as-of-right 421-a benefits. The original GEA was expanded in 2003 to include the Greenpoint-Williamsburg waterfront in Brooklyn and in 2006 to include parts of the far west side in Manhattan between 28th Street and 41st Street. In February 2006, the Mayor convened the task force to examine 421-a. In October 2006, the task force issued a final report. The reformed 421-a tax exemption program was signed into law on February 21, 2008 (see table on page I-34 for a summary of changes). The following were the major programmatic changes:
1. The existing GEA was further expanded - the new GEA includes:
• In Manhattan: all of Manhattan• In The Bronx: south of 136th Street in West
Harlem, south of 126th Street in Central Harlem and south of 117th Street in East Harlem.
• In Brooklyn: all of downtown Brooklyn, portions of Red Hook, Sunset Park, East Williamsburg, Bushwick, East New York, Crown Heights, Weeksville, Highland Park, Ocean Hill, Prospect Heights, Carroll Gardens, Cobble Hill, Boerum Hill and Park Slope.
• In Queens: Portions of Long Island City, Astoria, Woodside, Jackson Heights and the East River Waterfront.
• In Staten Island: Portions of St. George, Stapleton, New Brighton and Port Richmond (see table on page I-35).
2. Elimination of as-of-right 25-year benefits in NPP/ REMIC areas: Under the old program, properties were eligible for a 15-year as-of-right exemption or a 25-year enhanced exemption if the developments were located in designated Neighborhood Preservation Program (NPP) areas or in locations eligible for Rehabilitation Mortgage Insurance Corporation (REMIC) insurance. The reformed 421-a program eliminates these benefits for NPP and REMIC areas. Only developments that meet on-site affordability requirements or receive substantial governmental assistance pursuant to an affordable housing program are eligible to receive 25-
I-20
year benefits. Projects located in the NPP/REMIC area must create 20.0 percent on-site affordable units (see table on page I-33). 3. Imposition of a cap on the total amount of 421-a tax benefits that any market rate unit may receive: The cap establishes a maximum per unit exempt building assessed value of $65,000. The assessed value above this threshold is ineligible to receive 421-a benefit. The $65,000 cap will be increased by three percent compounded annually, on each taxable status date following the first anniversary of the effective date of the State law (Aug 17, 2008). Projects that qualify for extended benefits will not be subject to the assessed value cap. 4. Elimination of the negotiable certificate program: Any property within the GEA must provide affordable housing on-site in order to receive any 421-a tax benefits. Effective December 28, 2007, no new written agreements for negotiable certificates projects have been issued. Existing certificates will not expire, and can still be used with some limitations. 5. Creation of a dedicated fund for affordable housing: Approximately $400 million affordable housing fund will be created and used to finance the development and rehabilitation of affordable housing outside the GEA, targeting primarily the 15 highest poverty districts in the City. 6. Reservation 421-a tax benefits for buildings with a minimum of four units: Three-unit buildings are no longer eligible for 421-a benefits unless they are constructed with substantial governmental assistance pursuant to an affordable housing project. 7. Community preference for affordable units in GEA: Within the GEA, residents of the community board in which the building receiving benefits is located will have priority for purchase or rental of 50.0 percent of the affordable units upon initial occupancy. 8. Specified unit and bedroom mix: Unless preempted by federal requirements, within the GEA, a) an affordable unit must have a comparable number of bedrooms as market rate units and a unit mix proportional to the market rate units; or b) at least 50.0 percent of the affordable units must have two or more bedrooms and the remaining 50.0 percent of the units cannot be smaller than one bedroom; or c) the floor area of affordable units must be no less than 20.0 percent of the total floor area of all dwelling units. 9. 35-year affordability and rent stabilization requirement: Affordable rental units within the GEA must be kept affordable at initial as well as subsequent
rentals after vacancy and should remain rent-stabilized for 35 years after the completion of construction. After the 35 years, leases will remain rent-stabilized for the duration of the tenant’s occupancy. Homeownership projects within the GEA must be affordable upon initial sale. In addition, rent registration forms must now be filed with HPD and DHCR. 10. Prevailing wage requirement: This requirement applies to all persons employed in care or maintenance work at a building receiving 421-a benefits who are regularly scheduled to work at least eight hours a week in the building. Exemptions apply to buildings with fewer than 50 dwelling units and buildings where at least 50.0 percent of the units are affordable to those at or below 125.0 percent of AMI and will remain affordable throughout the benefit period. 11. Creation of a boundary review commission: The Mayor and City council will appoint members to the boundary review commission who will reassess the GEA every two years to determine whether the existing boundaries should be revised. The commission will issue a biennial report to the Council and the Mayor with recommendations for changes to the GEA or an explanation as to why no recommendations are being made.
New Private One- and Two- Family Housing Exemption, 421-b Program (NYSRPTL, Section 421-b) The 421-b program promotes new one- and two- family home construction by making home ownership more affordable to a larger segment of the population. To be eligible for the exemption, construction must begin on or after July 1, 2002 and before July 1, 2006 and be completed no later than July 1, 2010. This program offers a declining eight-year tax exemption applicable to the actual assessed value of the new construction. The property owner must continue to pay taxes on the full pre-construction assessment. Benefi ts under the 421-b program are not restricted by geographic location; however, the construction period is not to exceed two years. An existing one-to-three-family dwelling may qualify for an exemption if it has been improved to the extent of 40.0 percent of its pre-improvement assessed value. Starting from 2005, these benefits are extended to newly constructed, reconstructed or converted owner-occupied multiple dwellings with no more than four dwelling units. To qualify, these multiple dwelling units must be developed in a government-assisted project, located on property acquired by
Appendix I-RPT
Appendix I-RPT
I-21
non-profi t organizations in providing affordable housing for low-income tenants. The program provides a complete exemption from real property taxes for the term of the regulatory agreement up to 30 years, for qualifying low-income housing located in New York City. Eligible projects are owned or controlled by a not-for-profit Housing Development Fund company, subject to HPD regulatory agreement which requires properties to be used as low-income housing and to be financed in part with a loan from the City or State in conjunction with Federal low-income housing tax credits.
the Federal government through foreclosure of a Federally insured mortgage, and conveyed to an approved owner for rehabilitation pursuant to an agreement with the Federal government. Buildings receiving benefits under Section 421-b are not eligible for the following abatement/exemptions: Co-op/Condo Property Tax Abatement, School Tax Relief, Senior Citizen Homeowner Exemption and Veterans’ Exemption. This program is administered jointly by HPD and DOF.
Single Room Occupancy, 488-a Program (NYSRPTL, Section 488-a) This program provides owners of Single Room Occupancy (SRO) buildings with tax exemptions and abatements for improving and rehabilitating their properties. Eligible improvements include various renovations on heating systems, electrical systems, elevators, plumbing, sprinklers, fi re escapes, roofs and other necessary work. The exemption is effective for 32 years and is based on any increase in actual assessed value due to eligible improvements. In addition, the property will also be eligible for an abatement of real property taxes equal to 12.5 percent of either 150.0 percent of the certified reasonable cost of eligible improvements or the actual cost, whichever is less. The tax abatement cannot exceed a period of 20 years. During the period of tax exemption and abatement, the dwelling units are subject to rent regulation. This program has been extended periodically, most recently to eligible improvements commenced before December 31, 2011 and completed within 36 months from commencement.
Non-Profit Housing Development Fund Companies Providing Low-Income Housing Accommodation (NYSRPTL, Section 420-c) The 420-c program was enacted in 1993 to assist
421-b Exemption ScheduleNumber of Years New Value is Exempt
During Construction (up to 2 years) 100.0%8-Year Exemption (Post Construction):
Year 1-2 100.0%Year 3 75.0%Year 4 62.5%Year 5 50.0%Year 6 37.5%Year 7 25.0%
Year 8 12.5%
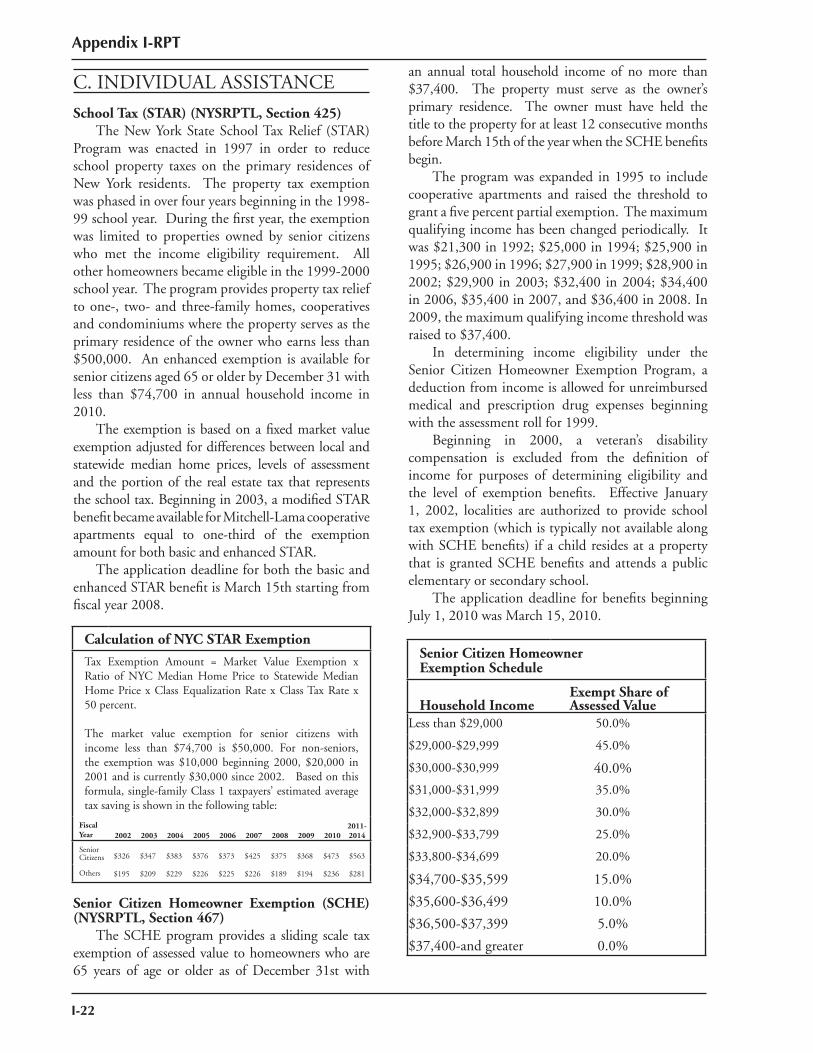
I-22
C. INDIVIDUAL ASSISTANCE
School Tax (STAR) (NYSRPTL, Section 425) The New York State School Tax Relief (STAR) Program was enacted in 1997 in order to reduce school property taxes on the primary residences of New York residents. The property tax exemption was phased in over four years beginning in the 1998-99 school year. During the first year, the exemption was limited to properties owned by senior citizens who met the income eligibility requirement. All other homeowners became eligible in the 1999-2000 school year. The program provides property tax relief to one-, two- and three-family homes, cooperatives and condominiums where the property serves as the primary residence of the owner who earns less than $500,000. An enhanced exemption is available for senior citizens aged 65 or older by December 31 with less than $74,700 in annual household income in 2010. The exemption is based on a fixed market value exemption adjusted for differences between local and statewide median home prices, levels of assessment and the portion of the real estate tax that represents the school tax. Beginning in 2003, a modified STAR benefit became available for Mitchell-Lama cooperative apartments equal to one-third of the exemption amount for both basic and enhanced STAR. The application deadline for both the basic and enhanced STAR benefit is March 15th starting from fiscal year 2008.
Senior Citizen Homeowner Exemption (SCHE) (NYSRPTL, Section 467) The SCHE program provides a sliding scale tax exemption of assessed value to homeowners who are 65 years of age or older as of December 31st with
an annual total household income of no more than $37,400. The property must serve as the owner’s primary residence. The owner must have held the title to the property for at least 12 consecutive months before March 15th of the year when the SCHE benefits begin. The program was expanded in 1995 to include cooperative apartments and raised the threshold to grant a five percent partial exemption. The maximum qualifying income has been changed periodically. It was $21,300 in 1992; $25,000 in 1994; $25,900 in 1995; $26,900 in 1996; $27,900 in 1999; $28,900 in 2002; $29,900 in 2003; $32,400 in 2004; $34,400 in 2006, $35,400 in 2007, and $36,400 in 2008. In 2009, the maximum qualifying income threshold was raised to $37,400. In determining income eligibility under the Senior Citizen Homeowner Exemption Program, a deduction from income is allowed for unreimbursed medical and prescription drug expenses beginning with the assessment roll for 1999. Beginning in 2000, a veteran’s disability compensation is excluded from the definition of income for purposes of determining eligibility and the level of exemption benefits. Effective January 1, 2002, localities are authorized to provide school tax exemption (which is typically not available along with SCHE benefi ts) if a child resides at a property that is granted SCHE benefits and attends a public elementary or secondary school. The application deadline for benefits beginning July 1, 2010 was March 15, 2010.
Calculation of NYC STAR Exemption
Tax Exemption Amount = Market Value Exemption x Ratio of NYC Median Home Price to Statewide Median Home Price x Class Equalization Rate x Class Tax Rate x 50 percent.
The market value exemption for senior citizens with income less than $74,700 is $50,000. For non-seniors, the exemption was $10,000 beginning 2000, $20,000 in 2001 and is currently $30,000 since 2002. Based on this formula, single-family Class 1 taxpayers’ estimated average tax saving is shown in the following table:
FiscalYear 2002 2003 2004 2005 2006 2007 2008 2009 2010
2011- 2014
SeniorCitizens $326 $347 $383 $376 $373 $425 $375 $368 $473 $563
Others $195 $209 $229 $226 $225 $226 $189 $194 $236 $281
Senior Citizen HomeownerExemption Schedule
Household IncomeExempt Share ofAssessed Value
Less than $29,000 50.0%
$29,000-$29,999 45.0%
$30,000-$30,999 40.0%
$31,000-$31,999 35.0%
$32,000-$32,899 30.0%
$32,900-$33,799 25.0%
$33,800-$34,699 20.0%
$34,700-$35,599 15.0%
$35,600-$36,499 10.0%
$36,500-$37,399 5.0%
$37,400-and greater 0.0%
Appendix I-RPT
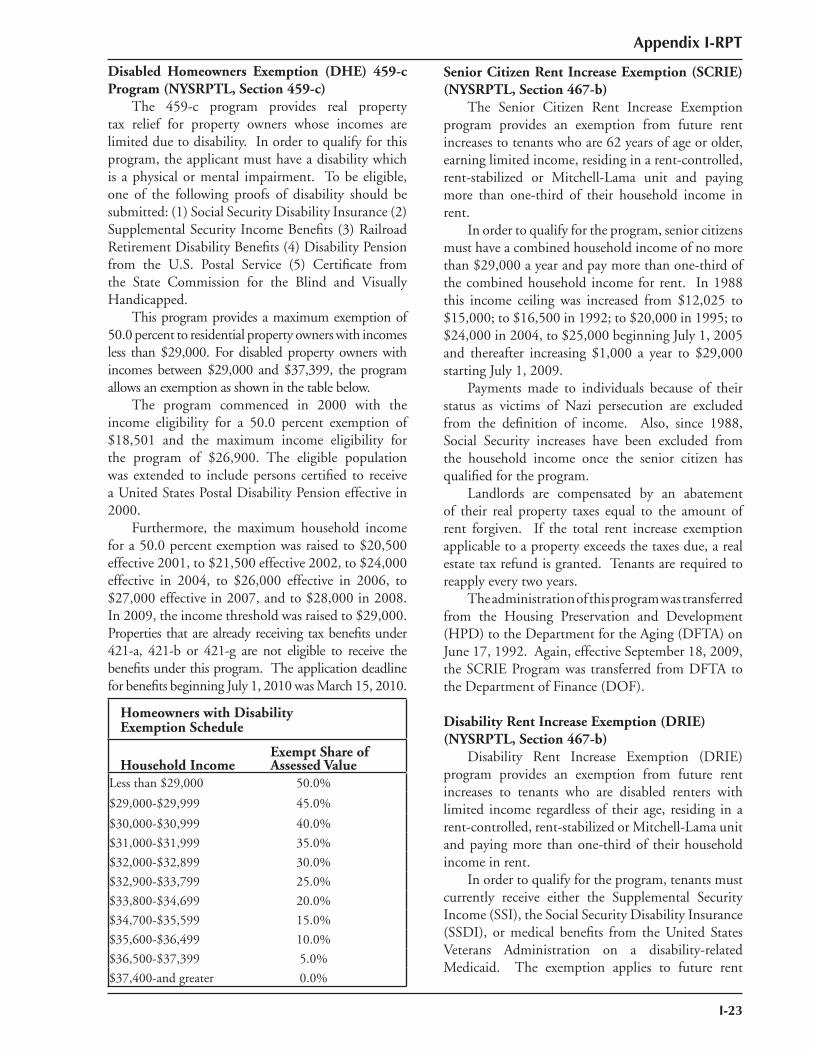
Appendix I-RPT
I-23
Disabled Homeowners Exemption (DHE) 459-c Program (NYSRPTL, Section 459-c) The 459-c program provides real property tax relief for property owners whose incomes are limited due to disability. In order to qualify for this program, the applicant must have a disability which is a physical or mental impairment. To be eligible, one of the following proofs of disability should be submitted: (1) Social Security Disability Insurance (2) Supplemental Security Income Benefits (3) Railroad Retirement Disability Benefits (4) Disability Pension from the U.S. Postal Service (5) Certificate from the State Commission for the Blind and Visually Handicapped. This program provides a maximum exemption of 50.0 percent to residential property owners with incomes less than $29,000. For disabled property owners with incomes between $29,000 and $37,399, the program allows an exemption as shown in the table below. The program commenced in 2000 with the income eligibility for a 50.0 percent exemption of $18,501 and the maximum income eligibility for the program of $26,900. The eligible population was extended to include persons certified to receive a United States Postal Disability Pension effective in 2000. Furthermore, the maximum household income for a 50.0 percent exemption was raised to $20,500 effective 2001, to $21,500 effective 2002, to $24,000 effective in 2004, to $26,000 effective in 2006, to $27,000 effective in 2007, and to $28,000 in 2008. In 2009, the income threshold was raised to $29,000. Properties that are already receiving tax benefits under 421-a, 421-b or 421-g are not eligible to receive the benefits under this program. The application deadline for benefits beginning July 1, 2010 was March 15, 2010.
Senior Citizen Rent Increase Exemption (SCRIE) (NYSRPTL, Section 467-b) The Senior Citizen Rent Increase Exemption program provides an exemption from future rent increases to tenants who are 62 years of age or older, earning limited income, residing in a rent-controlled, rent-stabilized or Mitchell-Lama unit and paying more than one-third of their household income in rent. In order to qualify for the program, senior citizens must have a combined household income of no more than $29,000 a year and pay more than one-third of the combined household income for rent. In 1988 this income ceiling was increased from $12,025 to $15,000; to $16,500 in 1992; to $20,000 in 1995; to $24,000 in 2004, to $25,000 beginning July 1, 2005 and thereafter increasing $1,000 a year to $29,000 starting July 1, 2009. Payments made to individuals because of their status as victims of Nazi persecution are excluded from the definition of income. Also, since 1988, Social Security increases have been excluded from the household income once the senior citizen has qualified for the program. Landlords are compensated by an abatement of their real property taxes equal to the amount of rent forgiven. If the total rent increase exemption applicable to a property exceeds the taxes due, a real estate tax refund is granted. Tenants are required to reapply every two years. The administration of this program was transferred from the Housing Preservation and Development (HPD) to the Department for the Aging (DFTA) on June 17, 1992. Again, effective September 18, 2009, the SCRIE Program was transferred from DFTA to the Department of Finance (DOF).
Disability Rent Increase Exemption (DRIE) (NYSRPTL, Section 467-b) Disability Rent Increase Exemption (DRIE) program provides an exemption from future rent increases to tenants who are disabled renters with limited income regardless of their age, residing in a rent-controlled, rent-stabilized or Mitchell-Lama unit and paying more than one-third of their household income in rent. In order to qualify for the program, tenants must currently receive either the Supplemental Security Income (SSI), the Social Security Disability Insurance (SSDI), or medical benefits from the United States Veterans Administration on a disability-related Medicaid. The exemption applies to future rent
Homeowners with DisabilityExemption Schedule
Household IncomeExempt Share ofAssessed Value
Less than $29,000 50.0%
$29,000-$29,999 45.0%
$30,000-$30,999 40.0%
$31,000-$31,999 35.0%
$32,000-$32,899 30.0%
$32,900-$33,799 25.0%
$33,800-$34,699 20.0%
$34,700-$35,599 15.0%
$35,600-$36,499 10.0%
$36,500-$37,399 5.0%
$37,400-and greater 0.0%
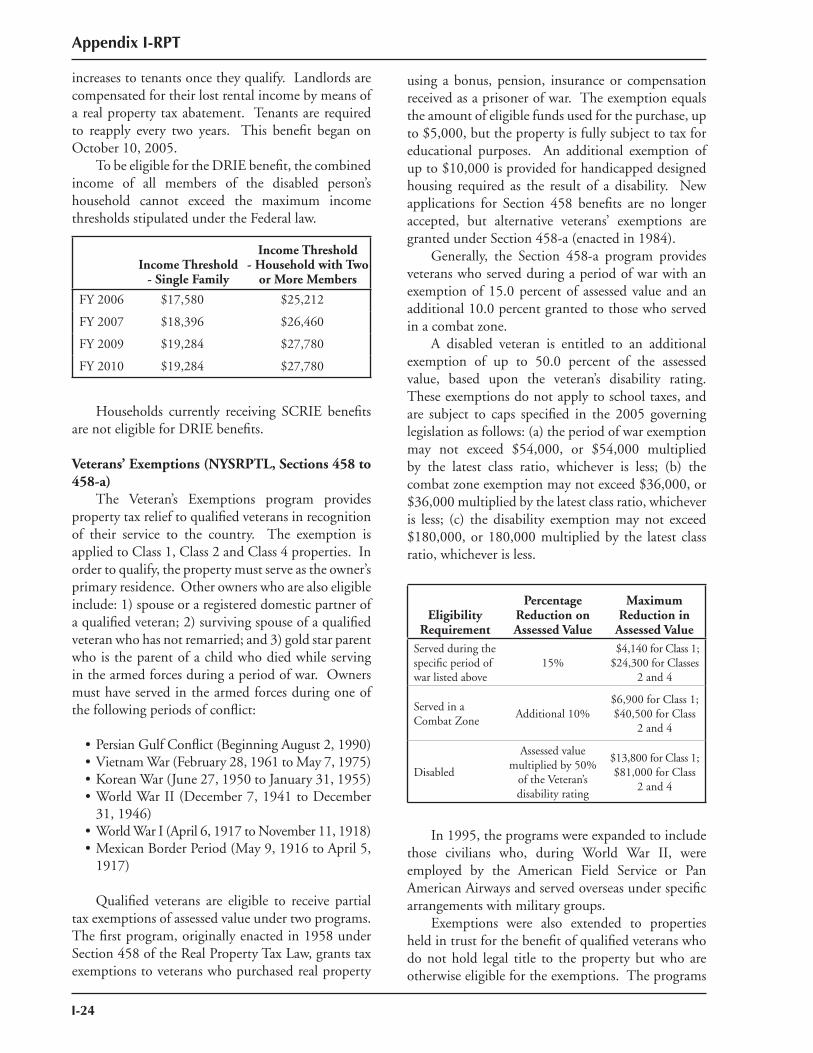
I-24
increases to tenants once they qualify. Landlords are compensated for their lost rental income by means of a real property tax abatement. Tenants are required to reapply every two years. This benefit began on October 10, 2005. To be eligible for the DRIE benefi t, the combined income of all members of the disabled person’s household cannot exceed the maximum income thresholds stipulated under the Federal law.
Households currently receiving SCRIE benefits are not eligible for DRIE benefits.
Veterans’ Exemptions (NYSRPTL, Sections 458 to 458-a) The Veteran’s Exemptions program provides property tax relief to qualifi ed veterans in recognition of their service to the country. The exemption is applied to Class 1, Class 2 and Class 4 properties. In order to qualify, the property must serve as the owner’s primary residence. Other owners who are also eligible include: 1) spouse or a registered domestic partner of a qualifi ed veteran; 2) surviving spouse of a qualifi ed veteran who has not remarried; and 3) gold star parent who is the parent of a child who died while serving in the armed forces during a period of war. Owners must have served in the armed forces during one of the following periods of confl ict:
• Persian Gulf Confl ict (Beginning August 2, 1990)• Vietnam War (February 28, 1961 to May 7, 1975)• Korean War (June 27, 1950 to January 31, 1955)• World War II (December 7, 1941 to December
31, 1946)• World War I (April 6, 1917 to November 11, 1918)• Mexican Border Period (May 9, 1916 to April 5,
1917)
Qualified veterans are eligible to receive partial tax exemptions of assessed value under two programs. The first program, originally enacted in 1958 under Section 458 of the Real Property Tax Law, grants tax exemptions to veterans who purchased real property
using a bonus, pension, insurance or compensation received as a prisoner of war. The exemption equals the amount of eligible funds used for the purchase, up to $5,000, but the property is fully subject to tax for educational purposes. An additional exemption of up to $10,000 is provided for handicapped designed housing required as the result of a disability. New applications for Section 458 benefits are no longer accepted, but alternative veterans’ exemptions are granted under Section 458-a (enacted in 1984). Generally, the Section 458-a program provides veterans who served during a period of war with an exemption of 15.0 percent of assessed value and an additional 10.0 percent granted to those who served in a combat zone. A disabled veteran is entitled to an additional exemption of up to 50.0 percent of the assessed value, based upon the veteran’s disability rating. These exemptions do not apply to school taxes, and are subject to caps specified in the 2005 governing legislation as follows: (a) the period of war exemption may not exceed $54,000, or $54,000 multiplied by the latest class ratio, whichever is less; (b) the combat zone exemption may not exceed $36,000, or $36,000 multiplied by the latest class ratio, whichever is less; (c) the disability exemption may not exceed $180,000, or 180,000 multiplied by the latest class ratio, whichever is less.
In 1995, the programs were expanded to include those civilians who, during World War II, were employed by the American Field Service or Pan American Airways and served overseas under specific arrangements with military groups. Exemptions were also extended to properties held in trust for the benefit of qualified veterans who do not hold legal title to the property but who are otherwise eligible for the exemptions. The programs
Income Threshold- Single Family
Income Threshold- Household with Two
or More Members
FY 2006 $17,580 $25,212
FY 2007 $18,396 $26,460
FY 2009 $19,284 $27,780
FY 2010 $19,284 $27,780
Eligibility Requirement
Percentage Reduction on Assessed Value
Maximum Reduction in
Assessed Value Served during the specifi c period of war listed above
15%$4,140 for Class 1;
$24,300 for Classes2 and 4
Served in a Combat Zone
Additional 10% $6,900 for Class 1;$40,500 for Class
2 and 4
Disabled
Assessed value multiplied by 50%
of the Veteran’s disability rating
$13,800 for Class 1;$81,000 for Class
2 and 4
Appendix I-RPT
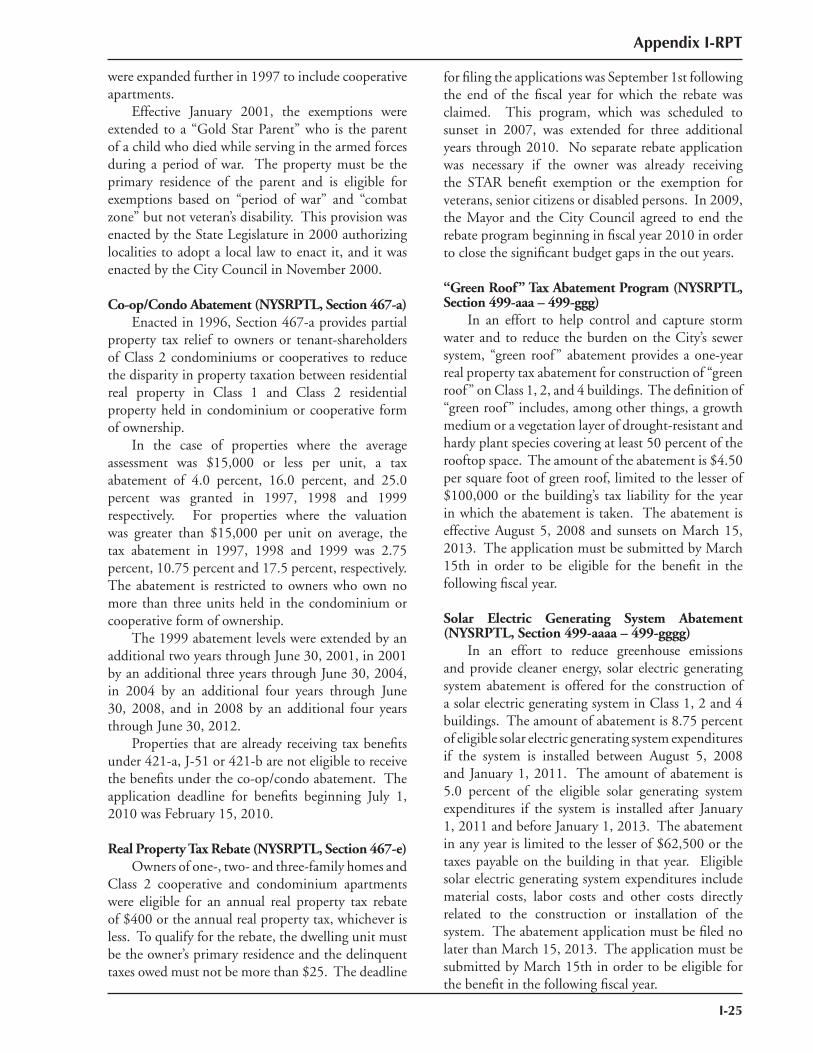
Appendix I-RPT
I-25
were expanded further in 1997 to include cooperative apartments. Effective January 2001, the exemptions were extended to a “Gold Star Parent” who is the parent of a child who died while serving in the armed forces during a period of war. The property must be the primary residence of the parent and is eligible for exemptions based on “period of war” and “combat zone” but not veteran’s disability. This provision was enacted by the State Legislature in 2000 authorizing localities to adopt a local law to enact it, and it was enacted by the City Council in November 2000.
Co-op/Condo Abatement (NYSRPTL, Section 467-a) Enacted in 1996, Section 467-a provides partial property tax relief to owners or tenant-shareholders of Class 2 condominiums or cooperatives to reduce the disparity in property taxation between residential real property in Class 1 and Class 2 residential property held in condominium or cooperative form of ownership. In the case of properties where the average assessment was $15,000 or less per unit, a tax abatement of 4.0 percent, 16.0 percent, and 25.0 percent was granted in 1997, 1998 and 1999 respectively. For properties where the valuation was greater than $15,000 per unit on average, the tax abatement in 1997, 1998 and 1999 was 2.75 percent, 10.75 percent and 17.5 percent, respectively. The abatement is restricted to owners who own no more than three units held in the condominium or cooperative form of ownership. The 1999 abatement levels were extended by an additional two years through June 30, 2001, in 2001 by an additional three years through June 30, 2004, in 2004 by an additional four years through June 30, 2008, and in 2008 by an additional four years through June 30, 2012. Properties that are already receiving tax benefits under 421-a, J-51 or 421-b are not eligible to receive the benefits under the co-op/condo abatement. The application deadline for benefits beginning July 1, 2010 was February 15, 2010.
Real Property Tax Rebate (NYSRPTL, Section 467-e) Owners of one-, two- and three-family homes and Class 2 cooperative and condominium apartments were eligible for an annual real property tax rebate of $400 or the annual real property tax, whichever is less. To qualify for the rebate, the dwelling unit must be the owner’s primary residence and the delinquent taxes owed must not be more than $25. The deadline
for filing the applications was September 1st following the end of the fiscal year for which the rebate was claimed. This program, which was scheduled to sunset in 2007, was extended for three additional years through 2010. No separate rebate application was necessary if the owner was already receiving the STAR benefit exemption or the exemption for veterans, senior citizens or disabled persons. In 2009, the Mayor and the City Council agreed to end the rebate program beginning in fiscal year 2010 in order to close the significant budget gaps in the out years.
“Green Roof” Tax Abatement Program (NYSRPTL, Section 499-aaa – 499-ggg) In an effort to help control and capture storm water and to reduce the burden on the City’s sewer system, “green roof” abatement provides a one-year real property tax abatement for construction of “green roof” on Class 1, 2, and 4 buildings. The defi nition of “green roof” includes, among other things, a growth medium or a vegetation layer of drought-resistant and hardy plant species covering at least 50 percent of the rooftop space. The amount of the abatement is $4.50 per square foot of green roof, limited to the lesser of $100,000 or the building’s tax liability for the year in which the abatement is taken. The abatement is effective August 5, 2008 and sunsets on March 15, 2013. The application must be submitted by March 15th in order to be eligible for the benefi t in the following fi scal year.
Solar Electric Generating System Abatement (NYSRPTL, Section 499-aaaa – 499-gggg) In an effort to reduce greenhouse emissions and provide cleaner energy, solar electric generating system abatement is offered for the construction of a solar electric generating system in Class 1, 2 and 4 buildings. The amount of abatement is 8.75 percent of eligible solar electric generating system expenditures if the system is installed between August 5, 2008 and January 1, 2011. The amount of abatement is 5.0 percent of the eligible solar generating system expenditures if the system is installed after January 1, 2011 and before January 1, 2013. The abatement in any year is limited to the lesser of $62,500 or the taxes payable on the building in that year. Eligible solar electric generating system expenditures include material costs, labor costs and other costs directly related to the construction or installation of the system. The abatement application must be fi led no later than March 15, 2013. The application must be submitted by March 15th in order to be eligible for the benefi t in the following fi scal year.

I-26
Appendix I-RPT
Appendix I-RPT
I-27
APPENDIX IREAL PROPERTY TAX
4.Real Property Tax
Detailed Schedules of Benefi ts
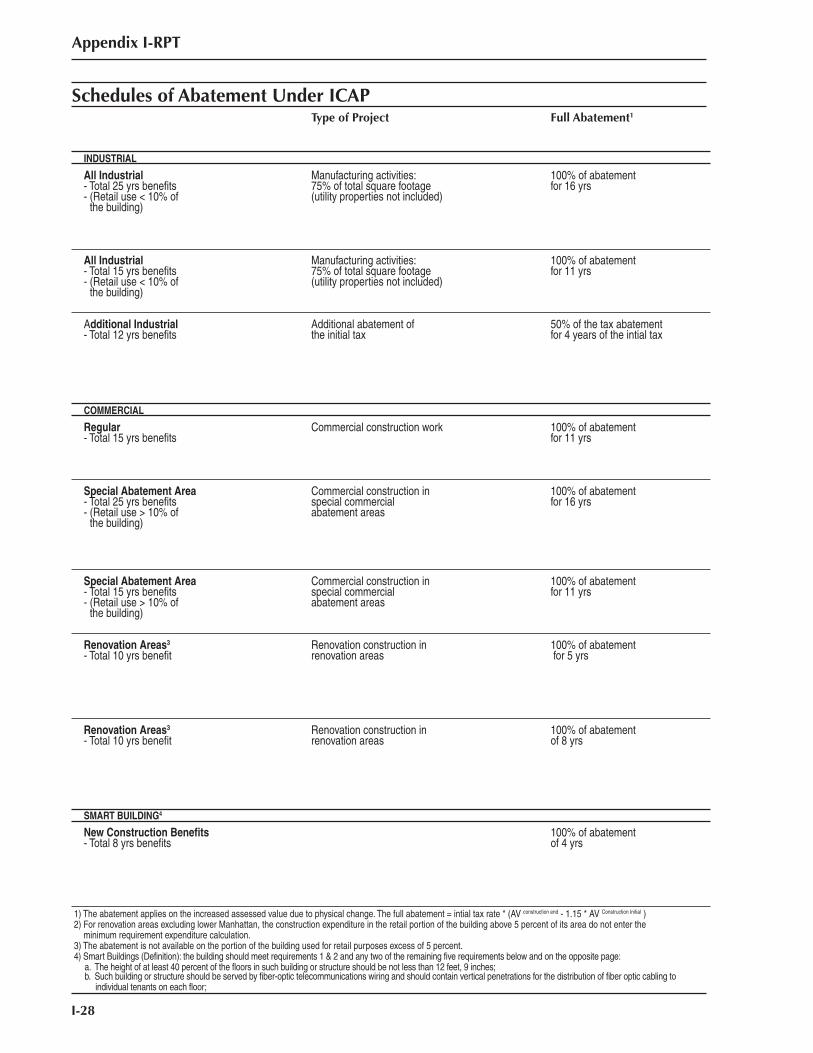
I-28
Appendix I-RPT
Schedules of Abatement Under ICAPType of Project Full Abatement1
INDUSTRIAL
All Industrial- Total 25 yrs benefits- (Retail use < 10% of
the building)
Manufacturing activities:75% of total square footage(utility properties not included)
100% of abatementfor 16 yrs
All Industrial- Total 15 yrs benefi ts- (Retail use < 10% of
the building)
Manufacturing activities: 75% of total square footage (utility properties not included)
100% of abatementfor 11 yrs
Additional Industrial- Total 12 yrs benefi ts
Additional abatement of the initial tax
50% of the tax abatementfor 4 years of the intial tax
COMMERCIAL
Regular- Total 15 yrs benefi ts
Commercial construction work 100% of abatementfor 11 yrs
Special Abatement Area- Total 25 yrs benefi ts- (Retail use > 10% of
the building)
Commercial construction in special commercialabatement areas
100% of abatementfor 16 yrs
Special Abatement Area- Total 15 yrs benefi ts- (Retail use > 10% of
the building)
Commercial construction in special commercialabatement areas
100% of abatementfor 11 yrs
Renovation Areas3
- Total 10 yrs benefi tRenovation construction inrenovation areas
100% of abatement for 5 yrs
Renovation Areas3
- Total 10 yrs benefi tRenovation construction inrenovation areas
100% of abatementof 8 yrs
SMART BUILDING4
New Construction Benefi ts- Total 8 yrs benefi ts
100% of abatementof 4 yrs
1) The abatement applies on the increased assessed value due to physical change. The full abatement = intial tax rate * (AV construction end - 1.15 * AV Construction Initial )2) For renovation areas excluding lower Manhattan, the construction expenditure in the retail portion of the building above 5 percent of its area do not enter the
minimum requirement expenditure calculation.3) The abatement is not available on the portion of the building used for retail purposes excess of 5 percent.4) Smart Buildings (Definition): the building should meet requirements 1 & 2 and any two of the remaining five requirements below and on the opposite page: a. The height of at least 40 percent of the floors in such building or structure should be not less than 12 feet, 9 inches; b. Such building or structure should be served by fiber-optic telecommunications wiring and should contain vertical penetrations for the distribution of fiber optic cabling to individual tenants on each floor;
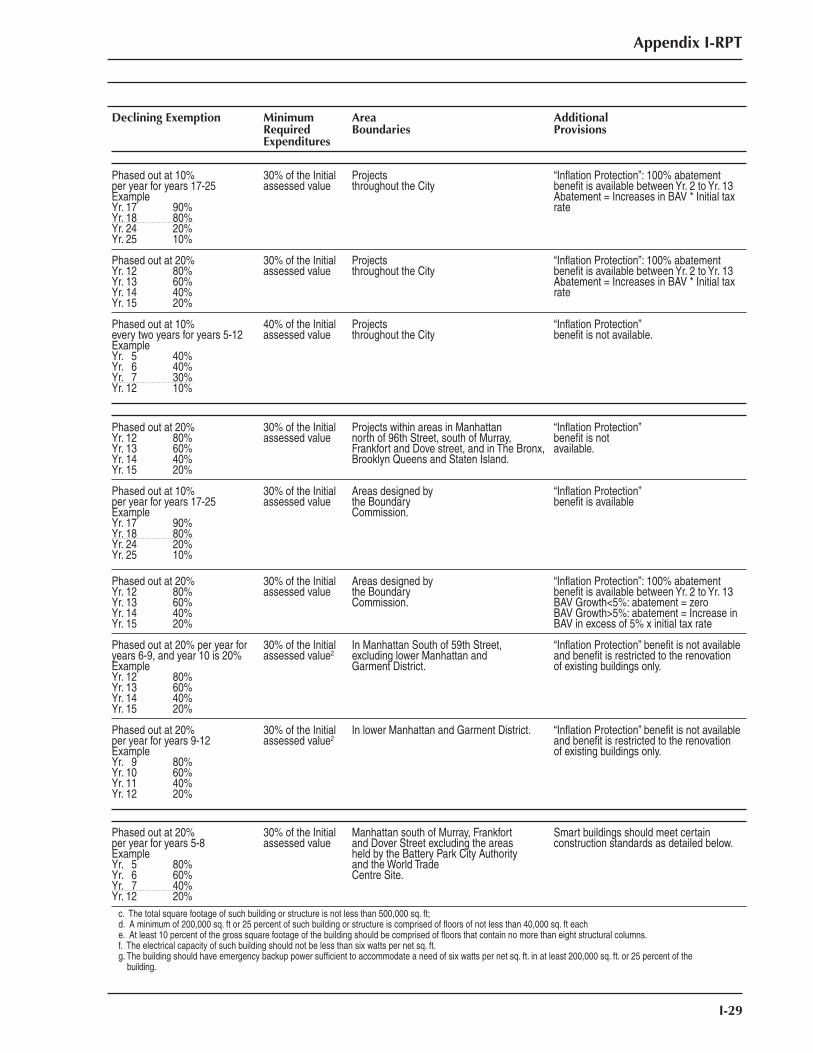
Appendix I-RPT
I-29
c. The total square footage of such building or structure is not less than 500,000 sq. ft; d. A minimum of 200,000 sq. ft or 25 percent of such building or structure is comprised of floors of not less than 40,000 sq. ft each e. At least 10 percent of the gross square footage of the building should be comprised of floors that contain no more than eight structural columns. f. The electrical capacity of such building should not be less than six watts per net sq. ft. g. The building should have emergency backup power sufficient to accommodate a need of six watts per net sq. ft. in at least 200,000 sq. ft. or 25 percent of the building.
Declining Exemption MinimumRequiredExpenditures
AreaBoundaries
AdditionalProvisions
Phased out at 10%per year for years 17-25ExampleYr. 17 90%Yr. 18 80%Yr. 24 20%Yr. 25 10%
30% of the Initialassessed value
Projectsthroughout the City
“Inflation Protection”: 100% abatement benefit is available between Yr. 2 to Yr. 13Abatement = Increases in BAV * Initial tax rate
Phased out at 20%Yr. 12 80%Yr. 13 60%Yr. 14 40%Yr. 15 20%
30% of the Initialassessed value
Projectsthroughout the City
“Inflation Protection”: 100% abatement benefit is available between Yr. 2 to Yr. 13Abatement = Increases in BAV * Initial tax rate
Phased out at 10%every two years for years 5-12ExampleYr. 5 40%Yr. 6 40%Yr. 7 30%Yr. 12 10%
40% of the Initialassessed value
Projectsthroughout the City
“Infl ation Protection”benefi t is not available.
Phased out at 20% Yr. 12 80%Yr. 13 60%Yr. 14 40%Yr. 15 20%
30% of the Initialassessed value
Projects within areas in Manhattannorth of 96th Street, south of Murray, Frankfort and Dove street, and in The Bronx, Brooklyn Queens and Staten Island.
“Infl ation Protection”benefi t is notavailable.
Phased out at 10%per year for years 17-25ExampleYr. 17 90%Yr. 18 80%Yr. 24 20%Yr. 25 10%
30% of the Initialassessed value
Areas designed bythe BoundaryCommission.
“Infl ation Protection”benefi t is available
Phased out at 20%Yr. 12 80%Yr. 13 60%Yr. 14 40%Yr. 15 20%
30% of the Initialassessed value
Areas designed bythe BoundaryCommission.
“Infl ation Protection”: 100% abatement benefi t is available between Yr. 2 to Yr. 13 BAV Growth<5%: abatement = zeroBAV Growth>5%: abatement = Increase in BAV in excess of 5% x initial tax rate
Phased out at 20% per year foryears 6-9, and year 10 is 20% Example Yr. 12 80%Yr. 13 60%Yr. 14 40%Yr. 15 20%
30% of the Initialassessed value2
In Manhattan South of 59th Street,excluding lower Manhattan and Garment District.
“Infl ation Protection” benefi t is not available and benefi t is restricted to the renovation of existing buildings only.
Phased out at 20%per year for years 9-12Example Yr. 9 80%Yr. 10 60%Yr. 11 40%Yr. 12 20%
30% of the Initialassessed value2
In lower Manhattan and Garment District. “Infl ation Protection” benefi t is not available and benefi t is restricted to the renovation of existing buildings only.
Phased out at 20%per year for years 5-8ExampleYr. 5 80%Yr. 6 60%Yr. 7 40%Yr. 12 20%
30% of the Initialassessed value
Manhattan south of Murray, Frankfortand Dover Street excluding the areas held by the Battery Park City Authority and the World Trade Centre Site.
Smart buildings should meet certainconstruction standards as detailed below.
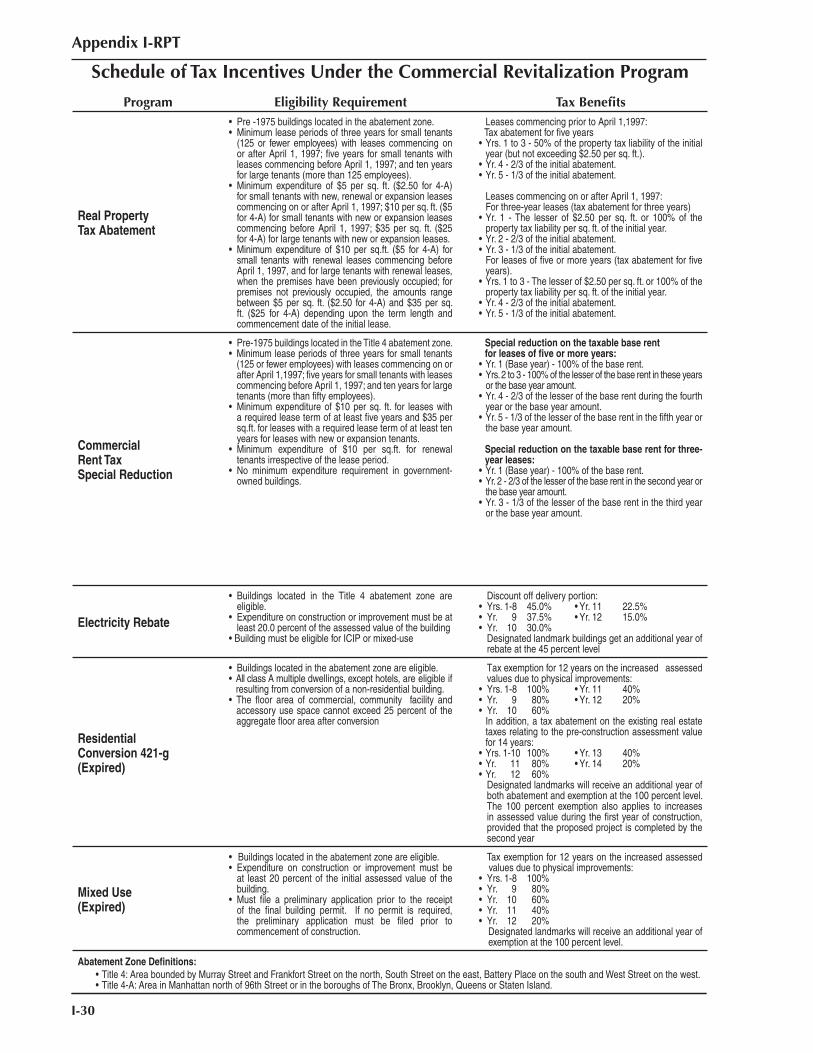
I-30
Appendix I-RPT
Schedule of Tax Incentives Under the Commercial Revitalization Program
Program Eligibility Requirement Tax Benefi ts
Real PropertyTax Abatement
• Pre -1975 buildings located in the abatement zone.• Minimum lease periods of three years for small tenants
(125 or fewer employees) with leases commencing on or after April 1, 1997; fi ve years for small tenants with leases commencing before April 1, 1997; and ten years for large tenants (more than 125 employees).
• Minimum expenditure of $5 per sq. ft. ($2.50 for 4-A) for small tenants with new, renewal or expansion leases commencing on or after April 1, 1997; $10 per sq. ft. ($5 for 4-A) for small tenants with new or expansion leases commencing before April 1, 1997; $35 per sq. ft. ($25 for 4-A) for large tenants with new or expansion leases.
• Minimum expenditure of $10 per sq.ft. ($5 for 4-A) for small tenants with renewal leases commencing before April 1, 1997, and for large tenants with renewal leases, when the premises have been previously occupied; for premises not previously occupied, the amounts range between $5 per sq. ft. ($2.50 for 4-A) and $35 per sq. ft. ($25 for 4-A) depending upon the term length and commencement date of the initial lease.
Leases commencing prior to April 1,1997: Tax abatement for fi ve years
• Yrs. 1 to 3 - 50% of the property tax liability of the initial year (but not exceeding $2.50 per sq. ft.).
• Yr. 4 - 2/3 of the initial abatement.• Yr. 5 - 1/3 of the initial abatement.
Leases commencing on or after April 1, 1997: For three-year leases (tax abatement for three years)• Yr. 1 - The lesser of $2.50 per sq. ft. or 100% of the
property tax liability per sq. ft. of the initial year.• Yr. 2 - 2/3 of the initial abatement.• Yr. 3 - 1/3 of the initial abatement. For leases of fi ve or more years (tax abatement for fi ve
years).• Yrs. 1 to 3 - The lesser of $2.50 per sq. ft. or 100% of the
property tax liability per sq. ft. of the initial year.• Yr. 4 - 2/3 of the initial abatement. • Yr. 5 - 1/3 of the initial abatement.
CommercialRent TaxSpecial Reduction
• Pre-1975 buildings located in the Title 4 abatement zone. • Minimum lease periods of three years for small tenants
(125 or fewer employees) with leases commencing on or after April 1,1997; fi ve years for small tenants with leases commencing before April 1, 1997; and ten years for large tenants (more than fi fty employees).
• Minimum expenditure of $10 per sq. ft. for leases with a required lease term of at least fi ve years and $35 per sq.ft. for leases with a required lease term of at least ten years for leases with new or expansion tenants.
• Minimum expenditure of $10 per sq.ft. for renewal tenants irrespective of the lease period.
• No minimum expenditure requirement in government-owned buildings.
Special reduction on the taxable base rentfor leases of fi ve or more years:
• Yr. 1 (Base year) - 100% of the base rent.• Yrs. 2 to 3 - 100% of the lesser of the base rent in these years
or the base year amount.• Yr. 4 - 2/3 of the lesser of the base rent during the fourth
year or the base year amount.• Yr. 5 - 1/3 of the lesser of the base rent in the fi fth year or
the base year amount.
Special reduction on the taxable base rent for three-year leases:
• Yr. 1 (Base year) - 100% of the base rent.• Yr. 2 - 2/3 of the lesser of the base rent in the second year or
the base year amount.• Yr. 3 - 1/3 of the lesser of the base rent in the third year
or the base year amount.
Electricity Rebate
• Buildings located in the Title 4 abatement zone are eligible.
• Expenditure on construction or improvement must be at least 20.0 percent of the assessed value of the building
• Building must be eligible for ICIP or mixed-use
Discount off delivery portion:• Yrs. 1-8 45.0% • Yr. 11 22.5%• Yr. 9 37.5% • Yr. 12 15.0%• Yr. 10 30.0% Designated landmark buildings get an additional year of
rebate at the 45 percent level
ResidentialConversion 421-g(Expired)
• Buildings located in the abatement zone are eligible.• All class A multiple dwellings, except hotels, are eligible if
resulting from conversion of a non-residential building.• The fl oor area of commercial, community facility and
accessory use space cannot exceed 25 percent of the aggregate fl oor area after conversion
Tax exemption for 12 years on the increased assessed values due to physical improvements:
• Yrs. 1-8 100% • Yr. 11 40%• Yr. 9 80% • Yr. 12 20%• Yr. 10 60% In addition, a tax abatement on the existing real estate
taxes relating to the pre-construction assessment value for 14 years:
• Yrs. 1-10 100% • Yr. 13 40%• Yr. 11 80% • Yr. 14 20%• Yr. 12 60% Designated landmarks will receive an additional year of
both abatement and exemption at the 100 percent level. The 100 percent exemption also applies to increases in assessed value during the fi rst year of construction, provided that the proposed project is completed by the second year
Mixed Use(Expired)
• Buildings located in the abatement zone are eligible.• Expenditure on construction or improvement must be
at least 20 percent of the initial assessed value of the building.
• Must fi le a preliminary application prior to the receipt of the fi nal building permit. If no permit is required, the preliminary application must be fi led prior to commencement of construction.
Tax exemption for 12 years on the increased assessed values due to physical improvements:• Yrs. 1-8 100%• Yr. 9 80%• Yr. 10 60%• Yr. 11 40%• Yr. 12 20%
Designated landmarks will receive an additional year of exemption at the 100 percent level.
Abatement Zone Definitions:• Title 4: Area bounded by Murray Street and Frankfort Street on the north, South Street on the east, Battery Place on the south and West Street on the west.• Title 4-A: Area in Manhattan north of 96th Street or in the boroughs of The Bronx, Brooklyn, Queens or Staten Island.
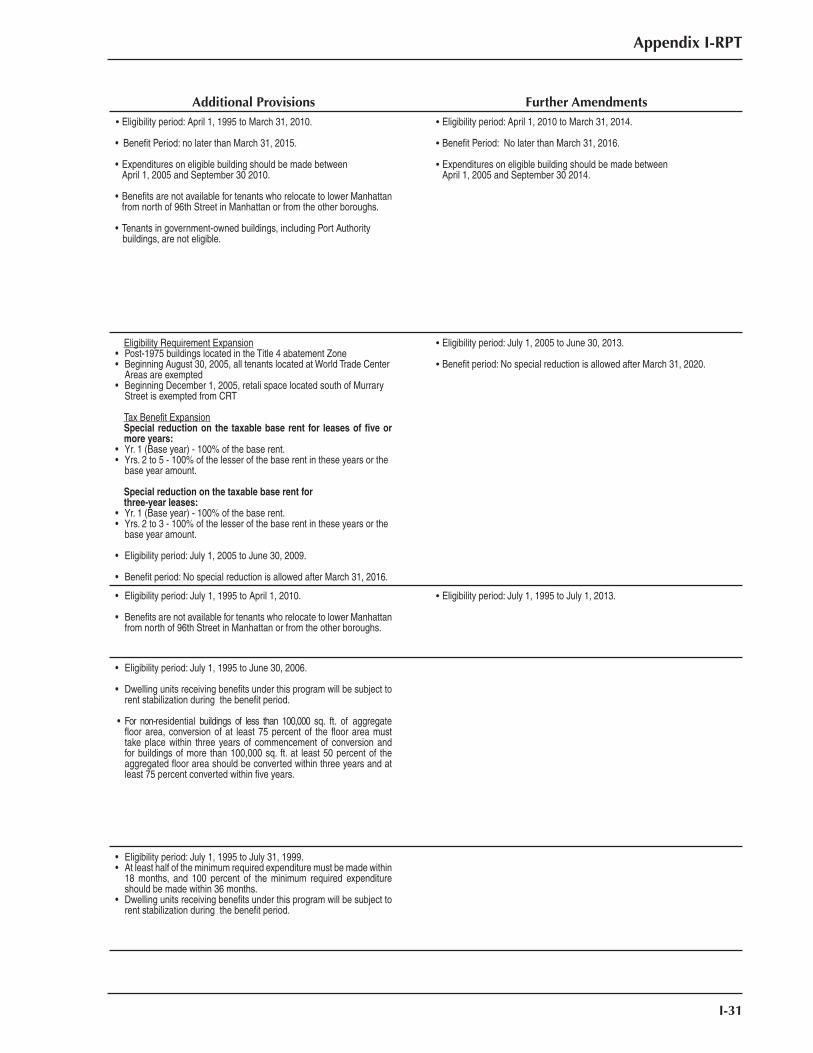
Appendix I-RPT
I-31
Additional Provisions Further Amendments• Eligibility period: April 1, 1995 to March 31, 2010.
• Benefit Period: no later than March 31, 2015.
• Expenditures on eligible building should be made between April 1, 2005 and September 30 2010.
• Benefits are not available for tenants who relocate to lower Manhattan from north of 96th Street in Manhattan or from the other boroughs.
• Tenants in government-owned buildings, including Port Authority buildings, are not eligible.
• Eligibility period: April 1, 2010 to March 31, 2014.
• Benefit Period: No later than March 31, 2016.
• Expenditures on eligible building should be made between April 1, 2005 and September 30 2014.
Eligibility Requirement Expansion• Post-1975 buildings located in the Title 4 abatement Zone• Beginning August 30, 2005, all tenants located at World Trade Center Areas are exempted• Beginning December 1, 2005, retali space located south of Murrary Street is exempted from CRT
Tax Benefit ExpansionSpecial reduction on the taxable base rent for leases of five or more years:
• Yr. 1 (Base year) - 100% of the base rent.• Yrs. 2 to 5 - 100% of the lesser of the base rent in these years or the base year amount.
Special reduction on the taxable base rent for three-year leases:
• Yr. 1 (Base year) - 100% of the base rent.• Yrs. 2 to 3 - 100% of the lesser of the base rent in these years or the base year amount.
• Eligibility period: July 1, 2005 to June 30, 2009.
• Benefit period: No special reduction is allowed after March 31, 2016.
• Eligibility period: July 1, 2005 to June 30, 2013.
• Benefit period: No special reduction is allowed after March 31, 2020.
• Eligibility period: July 1, 1995 to April 1, 2010.
• Benefits are not available for tenants who relocate to lower Manhattan from north of 96th Street in Manhattan or from the other boroughs.
• Eligibility period: July 1, 1995 to July 1, 2013.
• Eligibility period: July 1, 1995 to June 30, 2006.
• Dwelling units receiving benefits under this program will be subject to rent stabilization during the benefit period.
• For non-residential buildings of less than 100,000 sq. ft. of aggregate floor area, conversion of at least 75 percent of the floor area must take place within three years of commencement of conversion and for buildings of more than 100,000 sq. ft. at least 50 percent of the aggregated floor area should be converted within three years and at least 75 percent converted within five years.
• Eligibility period: July 1, 1995 to July 31, 1999.• At least half of the minimum required expenditure must be made within
18 months, and 100 percent of the minimum required expenditure should be made within 36 months.
• Dwelling units receiving benefits under this program will be subject to rent stabilization during the benefit period.
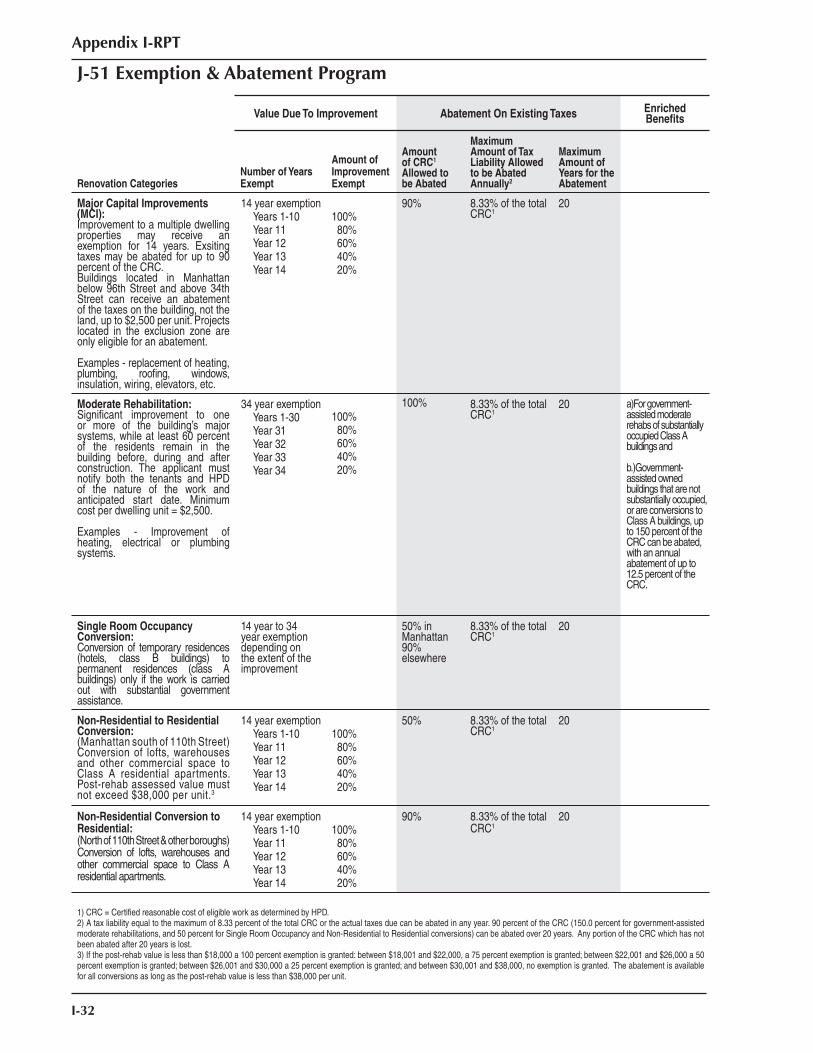
I-32
Appendix I-RPT
J-51 Exemption & Abatement Program
Value Due To Improvement Abatement On Existing Taxes Enriched Benefi ts
Renovation CategoriesNumber of Years Exempt
Amount of ImprovementExempt
Amount of CRC1 Allowed to be Abated
Maximum Amount of TaxLiability Allowed to be Abated Annually2
Maximum Amount ofYears for the Abatement
Major Capital Improvements (MCI): Improvement to a multiple dwelling properties may receive an exemption for 14 years. Exsiting taxes may be abated for up to 90 percent of the CRC. Buildings located in Manhattan below 96th Street and above 34th Street can receive an abatement of the taxes on the building, not the land, up to $2,500 per unit. Projects located in the exclusion zone are only eligible for an abatement.
Examples - replacement of heating, plumbing, roofi ng, windows, insulation, wiring, elevators, etc.
14 year exemptionYears 1-10Year 11Year 12Year 13Year 14
100% 80% 60% 40% 20%
90% 8.33% of the total CRC1
20
Moderate Rehabilitation: Signifi cant improvement to one or more of the building’s major systems, while at least 60 percent of the residents remain in the building before, during and after construction. The applicant must notify both the tenants and HPD of the nature of the work and anticipated start date. Minimum cost per dwelling unit = $2,500.
Examples - Improvement of heating, electrical or plumbing systems.
34 year exemptionYears 1-30Year 31Year 32Year 33Year 34
100% 80% 60% 40% 20%
100% 8.33% of the total CRC1
20 a)For government-assisted moderate rehabs of substantially occupied Class A buildings and
b.)Government-assisted owned buildings that are not substantially occupied, or are conversions to Class A buildings, up to 150 percent of the CRC can be abated, with an annual abatement of up to 12.5 percent of the CRC.
Single Room Occupancy Conversion:Conversion of temporary residences (hotels, class B buildings) to permanent residences (class A buildings) only if the work is carried out with substantial government assistance.
14 year to 34 year exemption depending on the extent of the improvement
50% inManhattan 90% elsewhere
8.33% of the total CRC1
20
Non-Residential to Residential Conversion: (Manhattan south of 110th Street) Conversion of lofts, warehouses and other commercial space to Class A residential apartments. Post-rehab assessed value must not exceed $38,000 per unit.3
14 year exemptionYears 1-10Year 11Year 12Year 13Year 14
100% 80% 60% 40% 20%
50% 8.33% of the total CRC1
20
Non-Residential Conversion to Residential:(North of 110th Street & other boroughs) Conversion of lofts, warehouses and other commercial space to Class A residential apartments.
14 year exemptionYears 1-10Year 11Year 12Year 13Year 14
100% 80% 60% 40% 20%
90% 8.33% of the total CRC1
20
1) CRC = Certified reasonable cost of eligible work as determined by HPD.2) A tax liability equal to the maximum of 8.33 percent of the total CRC or the actual taxes due can be abated in any year. 90 percent of the CRC (150.0 percent for government-assisted moderate rehabilitations, and 50 percent for Single Room Occupancy and Non-Residential to Residential conversions) can be abated over 20 years. Any portion of the CRC which has not been abated after 20 years is lost.3) If the post-rehab value is less than $18,000 a 100 percent exemption is granted: between $18,001 and $22,000, a 75 percent exemption is granted; between $22,001 and $26,000 a 50 percent exemption is granted; between $26,001 and $30,000 a 25 percent exemption is granted; and between $30,001 and $38,000, no exemption is granted. The abatement is available for all conversions as long as the post-rehab value is less than $38,000 per unit.
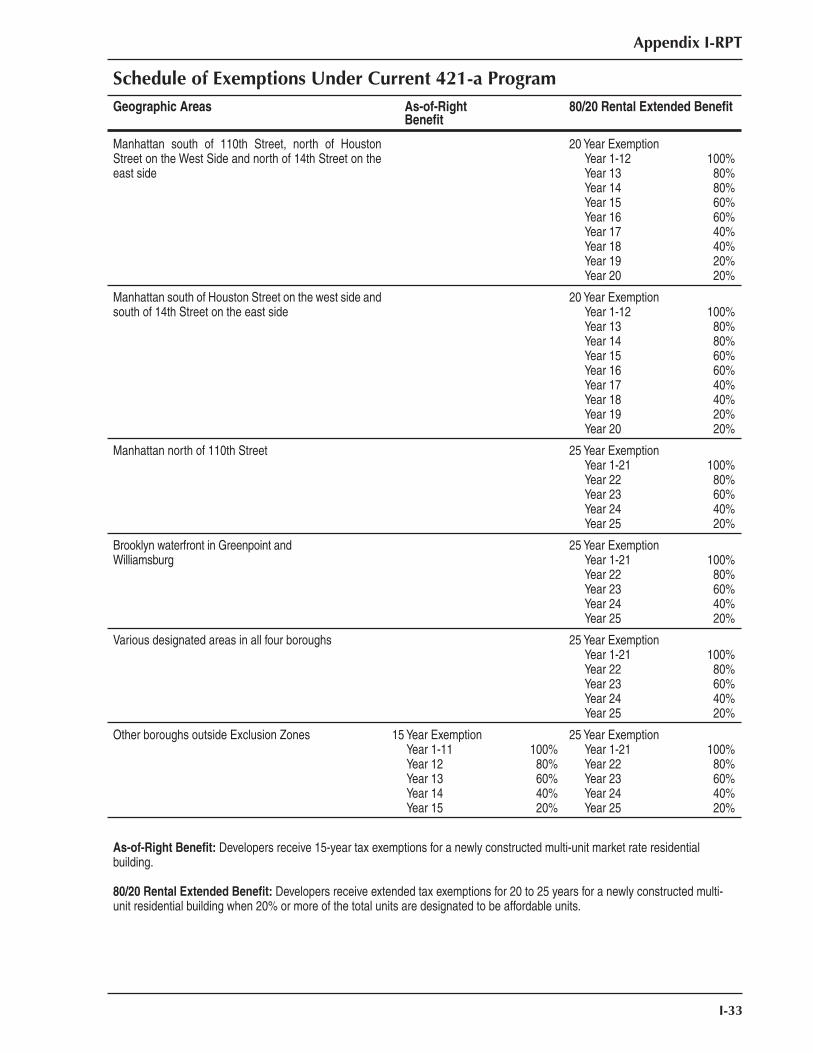
Appendix I-RPT
I-33
Schedule of Exemptions Under Current 421-a ProgramGeographic Areas As-of-Right
Benefi t80/20 Rental Extended Benefi t
Manhattan south of 110th Street, north of Houston Street on the West Side and north of 14th Street on the east side
20 Year ExemptionYear 1-12Year 13Year 14Year 15Year 16Year 17Year 18Year 19Year 20
100%80%80%60%60%40%40%20%20%
Manhattan south of Houston Street on the west side and south of 14th Street on the east side
20 Year ExemptionYear 1-12Year 13Year 14Year 15Year 16Year 17Year 18Year 19Year 20
100%80%80%60%60%40%40%20%20%
Manhattan north of 110th Street 25 Year ExemptionYear 1-21Year 22Year 23Year 24Year 25
100%80%60%40%20%
Brooklyn waterfront in Greenpoint and Williamsburg
25 Year ExemptionYear 1-21Year 22Year 23Year 24Year 25
100%80%60%40%20%
Various designated areas in all four boroughs 25 Year ExemptionYear 1-21Year 22Year 23Year 24Year 25
100%80%60%40%20%
Other boroughs outside Exclusion Zones 15 Year ExemptionYear 1-11Year 12Year 13Year 14Year 15
100%80%60%40%20%
25 Year ExemptionYear 1-21Year 22Year 23Year 24Year 25
100%80%60%40%20%
As-of-Right Benefit: Developers receive 15-year tax exemptions for a newly constructed multi-unit market rate residential building.
80/20 Rental Extended Benefit: Developers receive extended tax exemptions for 20 to 25 years for a newly constructed multi-unit residential building when 20% or more of the total units are designated to be affordable units.
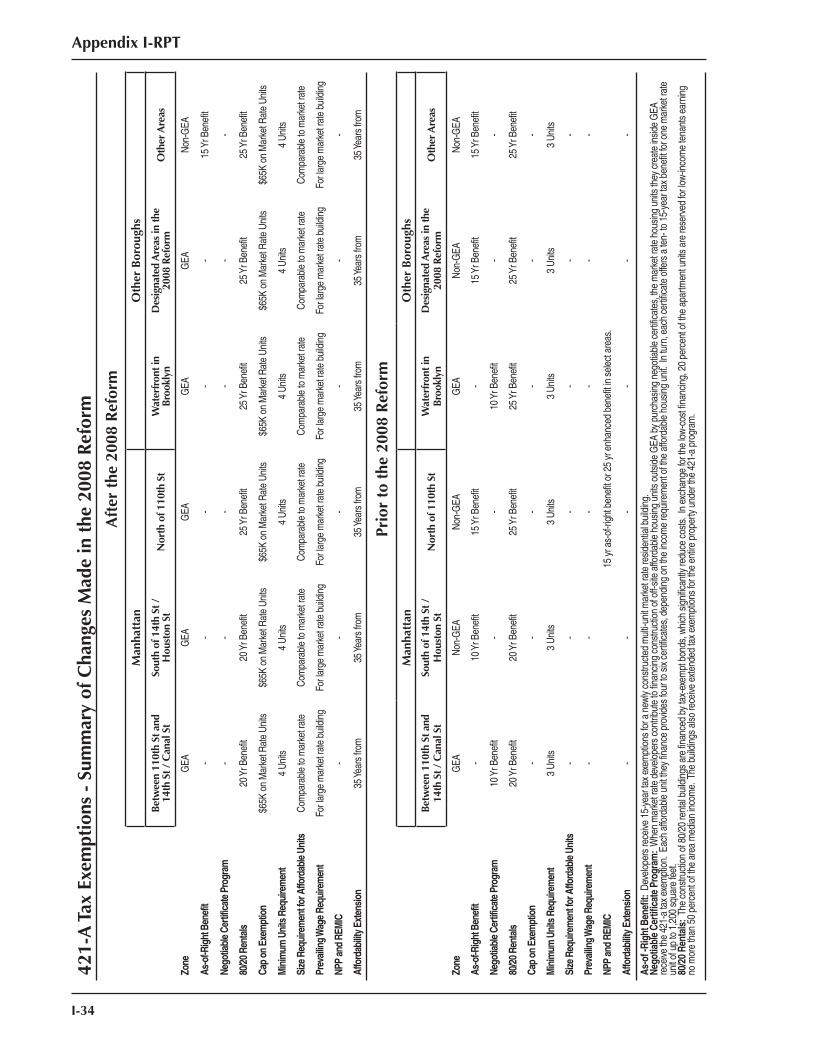
I-34
Appendix I-RPT
421-
A T
ax E
xem
ptio
ns -
Sum
mar
y of
Cha
nges
Mad
e in
the
200
8 R
efor
mA
fter
the
200
8 R
efor
mM
anha
ttan
Oth
er B
orou
ghs
Betw
een
110t
h St
and
14
th S
t / C
anal
St
Sout
h of
14t
h St
/
Hou
ston
St
Nor
th o
f 110
th S
tW
ater
fron
t in
Broo
klyn
Des
igna
ted
Are
as in
the
2008
Ref
orm
Oth
er A
reas
Zone
GEA
GEA
GEA
GEA
GEA
Non-
GEA
As-o
f-Rig
ht B
enef
it-
--
--
15 Y
r Ben
efit
Nego
tiabl
e Ce
rtific
ate
Prog
ram
--
--
--
80/2
0 Re
ntal
s20
Yr B
enef
it20
Yr B
enef
it25
Yr B
enef
it25
Yr B
enef
it25
Yr B
enef
it25
Yr B
enef
it
Cap
on E
xem
ptio
n$6
5K o
n M
arke
t Rat
e Un
its$6
5K o
n M
arke
t Rat
e Un
its$6
5K o
n M
arke
t Rat
e Un
its$6
5K o
n M
arke
t Rat
e Un
its$6
5K o
n M
arke
t Rat
e Un
its$6
5K o
n M
arke
t Rat
e Un
its
Min
imum
Uni
ts R
equi
rem
ent
4 Un
its4
Units
4 Un
its4
Units
4 Un
its4
Units
Size
Req
uire
men
t for
Affo
rdab
le U
nits
Com
para
ble
to m
arke
t rat
eCo
mpa
rabl
e to
mar
ket r
ate
Com
para
ble
to m
arke
t rat
eCo
mpa
rabl
e to
mar
ket r
ate
Com
para
ble
to m
arke
t rat
eCo
mpa
rabl
e to
mar
ket r
ate
Prev
ailin
g Wag
e Re
quire
men
tFo
r lar
ge m
arke
t rat
e bu
ildin
gFo
r lar
ge m
arke
t rat
e bu
ildin
gFo
r lar
ge m
arke
t rat
e bu
ildin
gFo
r lar
ge m
arke
t rat
e bu
ildin
gFo
r lar
ge m
arke
t rat
e bu
ildin
gFo
r lar
ge m
arke
t rat
e bu
ildin
g
NPP
and
REM
IC-
--
--
-
Affo
rdab
ility
Exte
nsio
n35
Year
s fro
m35
Year
s fro
m35
Year
s fro
m35
Year
s fro
m35
Year
s fro
m35
Year
s fro
m
Prio
r to
the
200
8 R
efor
mM
anha
ttan
Oth
er B
orou
ghs
Betw
een
110t
h St
and
14
th S
t / C
anal
St
Sout
h of
14t
h St
/
Hou
ston
St
Nor
th o
f 110
th S
tW
ater
fron
t in
Broo
klyn
Des
igna
ted
Are
as in
the
2008
Ref
orm
Oth
er A
reas
Zone
GEA
Non-
GEA
Non-
GEA
GEA
Non-
GEA
Non-
GEA
As-o
f-Rig
ht B
enef
it-
10 Y
r Ben
efit
15 Y
r Ben
efit
-15
Yr B
enef
it15
Yr B
enef
it
Nego
tiabl
e Ce
rtific
ate
Prog
ram
10 Y
r Ben
efit
--
10 Y
r Ben
efit
--
80/2
0 Re
ntal
s20
Yr B
enef
it20
Yr B
enef
it25
Yr B
enef
it25
Yr B
enef
it25
Yr B
enef
it25
Yr B
enef
it
Cap
on E
xem
ptio
n-
--
--
-
Min
imum
Uni
ts R
equi
rem
ent
3 Un
its3
Units
3 Un
its3
Units
3 Un
its3
Units
Size
Req
uire
men
t for
Affo
rdab
le U
nits
--
--
--
Prev
ailin
g Wag
e Re
quire
men
t-
--
--
-
NPP
and
REM
IC15
yr a
s-of
-righ
t ben
efit o
r 25
yr e
nhan
ced
bene
fit in
sel
ect a
reas
.
Affo
rdab
ility
Exte
nsio
n-
--
--
-
As-o
f -Ri
ght B
enefi
t: D
evel
oper
s re
ceive
15-
year
tax
exem
ptio
ns fo
r a n
ewly
cons
truct
ed m
ulti-
unit m
arke
t rat
e re
siden
tial b
uild
ing.
Nego
tiabl
e Ce
rtific
ate
Prog
ram
: W
hen
mar
ket r
ate
deve
lope
rs c
ontri
bute
to fin
ancin
g co
nstru
ctio
n of
off-
site
affo
rdab
le h
ousin
g un
its o
utsid
e G
EA b
y pu
rcha
sing
nego
tiabl
e ce
rtific
ates
, the
mar
ket r
ate
hous
ing
units
they
cre
ate
insid
e G
EA
rece
ive th
e 42
1-a
tax
exem
ptio
n. E
ach
affo
rdab
le u
nit t
hey
finan
ce p
rovid
es fo
ur to
six
certi
ficat
es, d
epen
ding
on
the
inco
me
requ
irem
ent o
f the
affo
rdab
le h
ousin
g un
it. In
turn
, eac
h ce
rtific
ate
offe
rs a
ten-
to 1
5-ye
ar ta
x be
nefit
for o
ne m
arke
t rat
e un
it of u
p to
1,2
00 s
quar
e fe
et.
80/2
0 Re
ntal
s: T
he c
onst
ruct
ion
of 8
0/20
rent
al b
uild
ings
are
finan
ced
by ta
x-ex
empt
bon
ds, w
hich
sig
nific
antly
redu
ce c
osts
. In
exch
ange
for t
he lo
w-co
st fi
nanc
ing,
20
perc
ent o
f the
apa
rtmen
t uni
ts a
re re
serv
ed fo
r low
-inco
me
tena
nts
earn
ing
no m
ore
than
50
perc
ent o
f the
are
a m
edia
n in
com
e. T
he b
uild
ings
also
rece
ive e
xten
ded
tax
exem
ptio
ns fo
r the
ent
ire p
rope
rty u
nder
the
421-
a pr
ogra
m.
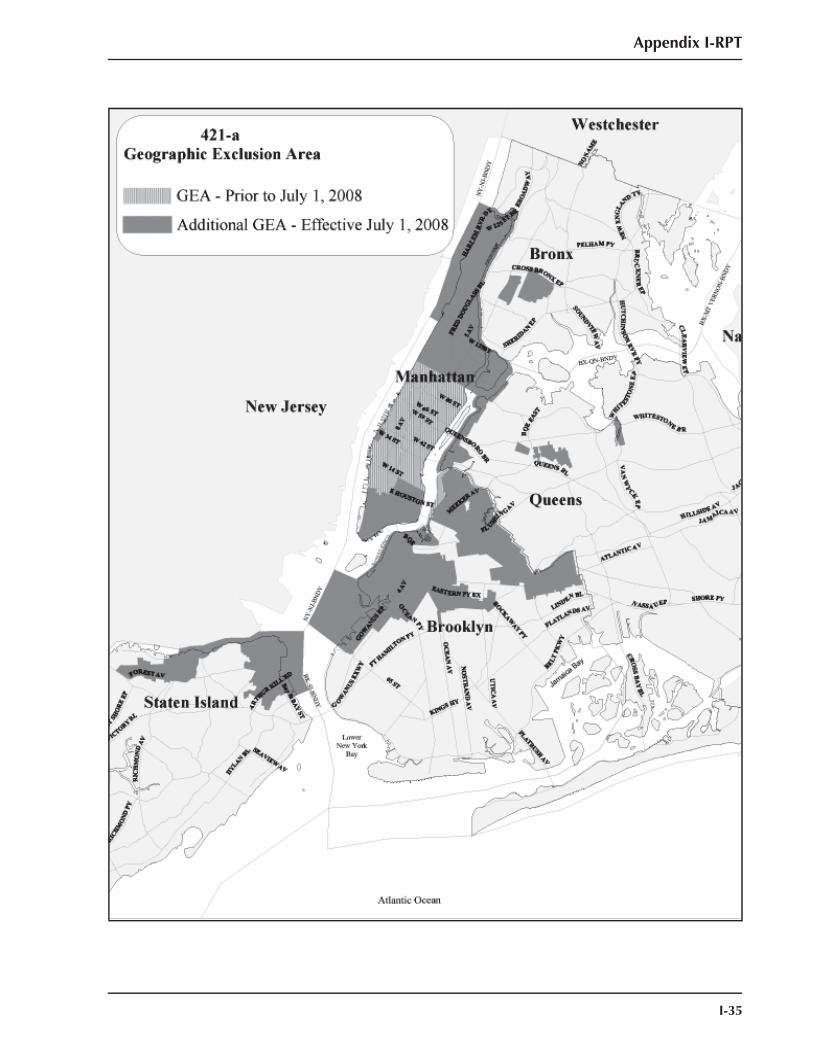
Appendix I-RPT
I-35

I-36
Appendix I-RPT

Appendix I-RPT
I-37
APPENDIX IREAL PROPERTY TAX
5.Real Property Tax
Legislative History

I-38
Appendix I-RPT
Appendix I-RPT
I-39
2009
Real Property Tax: Legislative History A number of changes have been made to the tax base and to assessment practices since the implementation of S.7000-A:
The real property tax abatement under the Lower Manhattan Commercial Revitalization Program was extended for four more years. The deadline by which the eligible lease term must begin has been extended from March 31, 2010 to March 31, 2014. The deadline by which certain expenditures on common area improvements must be made was extended from September 30, 2010 to September 30, 2014. The end of the benefi t period during which the abatement is available was also extended from March 31, 2016 to March 31, 2020.
The deadline for construction completion for the section 421-b benefi t was extended from July 1, 2009 to July 1, 2010. Partial property tax exemptions for up to 10 years are available to newly constructed or converted owner occupied one- and two-family homes. Construction work must have commenced prior to July 1, 2006 to be eligible, which remained unchanged.
Effective November 24, 2009, the eligibility defi nition was expanded for the partial property tax exemptions for homeowners with disability and limited income. The program benefi t was extended to include people who are certifi ed to receive a US Department of Veterans Affairs disability pension.
Effective July 1, 2009, the green roof tax abatement program was available to provide incentives to Class 1, 2 and 4 building owners to construct a “green roof” on their properties in exchange for a one-year property tax abatement. The abatement amount is the lesser of $4.50 per square foot of green roof (capped at $100,000) or the building’s total tax liability for the year. Applications must
be fi led by the March 15th of each year. This program is scheduled to sunset at the end of fi scal year 2014.
Effective July 1, 2009, a solar electric generating system abatement program was enacted to provide a four-year tax abatement for the construction of a solar electric generating system in a Class 1, 2 and 4 building. Applications must be fi led by the March 15th deadline. The program is scheduled to sunset after fi scal year 2014.
Effective 2010, the defi nition of Class 1 vacant land was restricted in Manhattan above 110th Street. For non-residential vacant land to be included in Class 1 in this area, it must have been included in Class 1 on the 2009 roll and the owner must have entered into a recorded agreement requiring construction of affordable housing with a governmental entity by December 31, 2008. Prior to the change, non-residential vacant land that is 10,000 square feet or less and adjacent to a Class 1 parcel could be classifi ed as Class 1 if the vacant land and the Class 1 property are both owned by the same owner and they were located above 110th Street in Manhattan or in the other boroughs.
In response to the national and local economic slowdown and declining tax revenues, the seven percent real property tax rate reduction enacted in 2008 was repealed effective January 1, 2009. The average tax rate was raised to $12.283 from $11.423 per $100 of assessed value.
As part of a budget agreement with the Mayor, the City Council passed a local law that allowed more homeowners to pay property taxes on a quarterly basis. Effective January 1, 2009, the actual assessed value threshold for quarterly payments was increased from $80,000 to $250,000. Owners of all residential and commercial properties (including houses, condominiums, and cooperatives) with an actual assessed value of $250,000 or less (for co-ops, the per-unit actual assessed
2010
Appendix I-RPT
I-40
2008
value of $250,000 or less) were allowed to pay quarterly installments. Owners of properties with an actual assessed value of more than $250,000 pay semi-annually.
Effective fi scal year 2010, the $400 homeowner rebate program was repealed. The homeowner rebate program had originally been set to expire after fi scal year 2007 but was extended for three more years until fi scal year 2010. However, due to the national and local economic slowdown, the rebate was repealed in 2009, saving the City $256 million in fi scal year 2010.
The co-op/condo partial tax abatement program was extended for four years through June 30, 2012. The abatement had been scheduled to expire at the end of fi scal year 2008.
Effective July 1, 2008, the Industrial and Commercial Incentive Program (ICIP) has been reformed and replaced by the Industrial and Commercial Abatement Program (ICAP). Under the new program, tax abatements are available for qualifying commercial or industrial construction work for up to 25 years. Utility properties are not eligible for any abatements and properties used partly for retail purposes are subject to limited benefi ts. Non-retail commercial activities in Manhattan south of 59th street would see a reduction in benefi t period from 12 years to 10 years. The minimum required expenditure was raised to 30.0 percent after the initial taxable assessed value of the project. (The property tax after the construction or improvements must exceed the original tax by more than 15 percent. Benefi t applications must be fi led no later than March 1, 2011).
The deadline for construction completion for section 421-b benefi t was extended from July 1, 2008 to July 1, 2009. Partial property tax exemptions for up to 10 years are provided to newly constructed or converted owner occupied one- and two-family homes. Construction work must
have commenced prior to July 1, 2006 to be eligible, which remained unchanged.Effective fi scal year 2009, the state-wide school tax relief (STAR) exemption calculation was modifi ed. STAR exemptions are granted to residential properties used as owner’s primary residence. The percentage decline by which the current year’s exempt amount can fall below the prior year’s amount was reduced to 90 percent for 2009 from the previous years’ 95 percent. This percentage was also set to be reduced further to 89 percent for the subsequent years.
Effective July 21, 2008, an assessed value based restriction on the availability of the J-51 benefi ts was eliminated for mutual redevelopment companies established under Article 5 of the Private Housing Finance Law (PHFL). They no longer need to meet the regular J-51 program requirement for the average assessed value per unit to be $40,000 or less as long as they maintain the status until the earlier of 15 years from the commencement of J-51 benefi ts or the expiration of certain tax benefi ts under the PHFL. The only benefi ciary of this law at the time of the passage of the law was the Penn South Housing Development.
The special commercial rent reduction under the commercial revitalization program for premises used for retail sales in lower Manhattan and the World Trade Center area, which expired on June 30, 2009, has now been extended for four more years until June 30, 2013.
The reform bill of 421-a tax incentive program was signed into law by the Governor in February 2008. Under the new law, the Geographic Exclusion Area was expanded, the exemption amount was capped for market rate units (a $65,000 cap imposed on the exempt assessed value which increases by three percent annually), the negotiable certificate program was eliminated, and four- to fi ve- unit buildings were excluded from
Appendix I-RPT
I-41
2007
the program. The law also established a dedicated fund for affordable housing. The program was extended for three additional years by resetting the deadline to December 28, 2010, by which construction must commence for projects to be eligible for the benefi ts. While the projects that commenced construction prior to July 1, 2009 remained eligible for the pre-reform benefi ts, the project that start construction on or after July 1, 2009 are eligible for the benefi ts defi ned under the new law.
Effective July 1, 2007, the mayor and the City Council agreed to reduce the real property tax rate by seven percent in an effort to reduce homeowner’s tax burden. As a result, the average tax rate was decreased from $12.283 to $11.423 per $100 of assessed value.
The $400 homeowner rebate program was extended for three years until the end of fi scal year 2010. The deadline for fi ling the rebate application is September 1st, following the end of the fi scal year for which the rebate is claimed.
Effective August 1, 2007, non-profi t organizations acquiring real property in New York City are exempt from the real estate taxes from the date of the title transfer. Prior to this change, the exemption status was determined for the entire fi scal year based on the ownership on the taxable status date (January 5th).The deadline by which a renovation work must be completed in order to qualify for J-51 benefi ts was extended from December 30, 2007 to December 30, 2011.
The Industrial and Commercial Incentive Program (ICIP) was extended for one year, by resetting the application deadline to June 30, 2008 and the deadline for building permits to be issued to July 31, 2008.
The deadline for starting rehabilitation on multiple dwellings used for single
room occupancy program was extended from December 30, 2007 to December 30, 2011.
The lower Manhattan commercial revitalization program was extended for three more years by extending the end of eligibility period from March 31, 2007 to March 31, 2010. The benefi t period for real property tax abatement was extended from March 31, 2013 to March 31, 2016. The benefi t period for commercial rent tax special reduction was also extended from March 31, 2013 to March 31, 2016.
Tax lien sale program was extended until December 31, 2010, which was originally scheduled to expire on August 31, 2006. The new law also allowed water and sewer liens on Class 2 rental and Class 4 properties to be sold on their own independent of whether or not there is a qualifying real property lien on the property. In order for the liens to be sold, the water and sewer charges have to be delinquent for at least one year and equal or exceed $1,000 in arrears. The law also restricted the City’s authority to sell real property tax and water and sewer liens for certain low-income homeowners who are receiving senior citizen homeowner exemption or disabled homeowners exemption or NYS PIT circuit breaker credit. In addition, the City’s authority to sell water and sewer liens on any Class 1 single-family homes was also restricted. The new law also extended the initial notifi cation period from 60 days to 90 days.
Effective April 2007, the eligibility requirements for Mitchell-Lama developments under the J-51 program were eased. Mitchell-Lama properties whose repairs are fi nanced with grants or loans from Federal, State or local government agencies became eligible for the J-51 benefi ts. Previously, the repairs had to be fi nanced with private loans. To be eligible, however, these housing companies must sign a binding agreement to remain in the Mitchell-
Appendix I-RPT
I-42
Lama program for an additional 15 years. In addition, the assessed value requirement was eliminated for Mitchell-Lama cooperative buildings. The average assessed value per unit should be $40,000 or less for other cooperative buildings to be eligible for the J-51 benefi ts. To be eligible, they need to sign a binding agreement to remain in the program for at least 15 years from the commencement of the benefi ts. The J-51 tax abatement program has also been modifi ed to extend the benefi ts to lead remediation work in buildings both vacant and occupied.
Effective July 26, 2006, real property tax abatement under Commercial Revitalization Program was extended to eligible buildings occupied or used as private elementary or secondary schools.
The income eligibility ceiling under the Disabled Homeowner Exemption Program was increased from $24,000 to $26,000 beginning July 1, 2006. The income ceiling was set to increase by $1,000 per year for the following three years, to $27,000 beginning July 1, 2007, to $28,000 beginning July 1, 2008, and to $29,000 beginning July 1, 2009. The sliding scale of exemption schedule was also revised to refl ect the increases in income eligibility.
The income eligibility ceiling under the Senior Citizen Homeowner Exemption Program was increased from $24,000 to $26,000 beginning July 1, 2006. The income ceiling was set to increase by $1,000 per year for the following three years, to $27,000 beginning July 1, 2007, to $28,000 beginning July 1, 2008, and to $29,000 beginning July 1, 2009. The sliding scale of exemption schedule was also revised to refl ect the increases in income eligibility.
The absentee landlord surcharge was originally scheduled to take effect on July 1, 2003. The effective date was later postponed to July 1, 2006 which has now been effectively repealed by reducing the
surcharge rate from 2.5 percent to zero percent as of July 1, 2006.
The income threshold limit under the Senior Citizen Rent Increase Exemption (SCRIE) program was increased from $24,000 to $25,000 beginning July 1, 2005 and by $1,000 per year for the next four years to $29,000 beginning July 1, 2009. A new benefit program referred to as Disability Rent Increase Exemption (DRIE) for disabled renters living in rent controlled or rent stabilized apartments with limited income regardless of their age allows them to qualify for a rent increase exemption if they currently receive the Supplemental Security Income (SSI), the Social Security Disability Insurance (SSDI), or medical benefits from the United States Veterans Administration on a disability-related Medicaid. The exemption applies to rent increases that would cause the eligible tenant’s rent to exceed one-third of household income. Landlords are compensated for their lost rental income by means of real estate tax abatements. The new benefit began on October 10, 2005.
Commercial rent tax special reduction under Commercial Revitalization program was expanded on August 31, 2005 to provide exemption from the commercial rent tax for all tenants in the “World Trade Center Area”. In addition, the current benefi t was liberalized for leases that commerce on or after July 1, 2005 but before July 1, 2009 with a lease term at least fi ve years.
Section 421-a of the Real Property Tax Law was amended to expand the current exclusion zone in Manhattan to parts of the far west side of Manhattan between 28th Street and 41st Street. In addition, the law created a new exclusion zone in Brooklyn, known as the Greenpoint-Williamsburg Waterfront Area effective June 21, 2005.
Commercial Expansion Program was modifi ed with a number of amendments,
2006
Appendix I-RPT
I-43
2005
retroactive to July 1, 2005.
Effective July 1, 2005, all properties with an actual assessed value of $80,000 or less were allowed to pay in quarterly installments. All other properties with actual assessed value of more than $80,000 were paid semi-annually. The actual assessed value threshold previously was $40,000.
The City enacted a three-year property tax rebate program for fi scal years 2005, 2006 and 2007 to provide owners of Class 1 properties and Class 2 cooperatives and condominiums with a $400 rebate or the annual real estate tax on the property, whichever was less. To qualify for this rebate, the dwelling unit must be the owners’ primary residence and the delinquent taxes owed must not be more than $25.
The legislation authorizing the lien sale expired on October 31, 2003 and was extended through March 1, 2006 by the City Council on March 24, 2004.
Coop/Condo abatement was extended for four more years up to June 30, 2008.
The State passed legislation in 2003 giving the City the authority to levy a 25.0 percent surcharge on Class 1 non-owner occupied properties effective July 1, 2003, the absentee landlord surcharge. This surcharge was intended to equalize the tax burden between Class 1 income-generating properties and small Class 2 properties. Local legislation passed by the City Council on April 1, 2004 delayed the effective date of the absentee landlord surcharge until July 1, 2006.
As part of the effort to balance the budget for the fiscal year 2003, a local law was adopted to increase the real property tax rates for the second half of fiscal year 2003, covering the period from January 1 to June 30, 2003. The average tax rate was raised to $12.283 from $10.366 per $100 of assessed value.
Industrial and Commercial Incentive Program was extended for four years, and the applications for the benefi ts could be fi led no later than July 1, 2007.
Single-Room-Occupancy Dwelling program extended its benefi ts period to December 31, 2007.
J-51 exemption program was extended until December 30, 2007.
Coop/Condo abatement was extended for four years through fi scal year 2004.
The public housing exemption providing the 60-year exemption period for applicable federal projects was extended for another 60 years.
Beginning with the 2001 property tax assessments roll, the progress assessment for commercial structures was extended from one to three years. This amendment applies to seven commercial structures other than hotels. Progress assessment is an exemption from taxation for increases in value resulting from new construction that remains incomplete as of the taxable status date (January 5th).
The Senior Citizen Homeowner Exemption (SCHE) program, which provides a sliding scale tax exemption to homeowners over age 65, was altered in 1999 to: (1) exclude veteran’s disability compensation from the definition of income for purposes of determining eligibility and the level of exemption benefits beginning in 2000 and (2) allow a deduction from income for unreimbursed medical and prescription drug expenses in determining eligibility.
Industrial and Commercial Incentive Program was extended for another four years until June 30, 2013.
Section 459-c of the real property tax law was amended establishing a new tax exemption for disabled homeowners with limited income. The program,
2004
2003
2001
1999
1998
Appendix I-RPT
I-44
which offers a 50.0 percent exemption to residential property owners, commenced in 2000. In addition, State legislation was passed to allow localities to expand the exemption with a property tax credit retroactive to fiscal year 1999. The credit would be applied to fiscal year 2000 tax bills of disabled homeowners who are approved for the exemption.
Co-op/Condo Abatement was increased from 16.0 percent to 25.0 percent in 1998 for properties with assessment less than $15,000 per unit. For properties with assessment more than $15,000, the tax abatements were raised from 10.75 percent to 17.5 percent.
Industrial and Commercial Incentive Program was established in 1996 and was scheduled to expire on December 31, 1998. The new law extended this program for an additional two years through December 31, 2000.
The State enacted the School Tax Relief program (STAR) legislation. A property tax exemption was phased in over four years beginning in the 1998-99 school year. The program provides property tax relief to one-, two-, and three-family homes, cooperatives and condominiums where the property serves as the primary residence of the owner. An enhanced exemption is available for senior citizens with less than $67,850 in household income.
Amendments to the administrative code allowed the City to sell real property tax liens for Class 1 and Class 2 property where real property tax component of the tax liens remained unpaid for three years and one year respectively.
Co-op/Condo Abatement was increased from 4.0 percent to 16.0 percent in 1997 for properties with assessment less than $15,000 per unit. For properties with assessment more than $15,000, the tax abatements were raised from 2.75 percent to 10.75 percent.
Co-op/Condo abatement program was enacted which was designed to reduce the disparity in property tax burden between owners of cooperatives and condominiums (Class 2) and single-family homes (Class 1). For properties with assessment less than $15,000 per unit, the tax abatements were 4.0 percent. For properties with assessment more than $15,000, the tax abatements were 2.75 percent.
Beginning with the fiscal year 1997 roll, telephone company central office and station equipment (except public telephones) installed in public rights-of-way would be exempted from real property taxation.
The assessment percentages for special franchise and REUC properties were equalized at 45.0 percent. For Class 2, assessment cap increases for cooperatives and condominiums with two to ten units were restricted to eight percent annually and 30 percent over five years including properties that were shifted either into Class 1 (if not more than three units) or into Class 2 (if more than three units). One-family homes on cooperatively-owned land (“bungalows”) were also reclassified from Class 2 to Class 1. Almost 1,500 summer cottages in Queens and The Bronx were affected by this shift.
In further reclassification, mixed-use residential/commercial buildings (with “Mom and Pop” stores), formerly in Class 4, were assessed as residential if more than 50 percent of the building was residential.
Class 3 land and buildings were transferred to Class 4, leaving in Class 3 only plant and equipment. Class 2 condominiums with no more than three residential units, provided such property had previously been classified as Class 1, were transferred back from Class 2 to Class 1.
Vacant land zoned as residential or adjacent to residential property with the same owner was transferred from Class
1997
1996
1995
1994
1992
1991
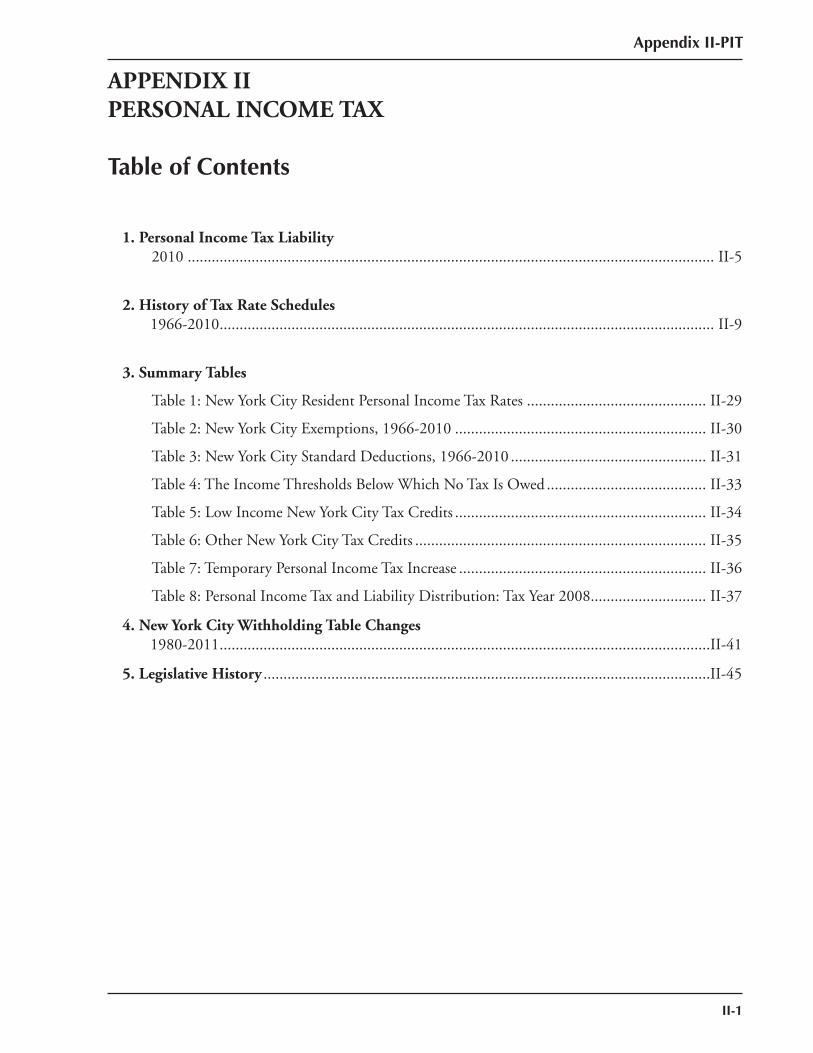
II-1
APPENDIX IIPERSONAL INCOME TAX
Table of Contents
1. Personal Income Tax Liability 2010 .................................................................................................................................... II-5
2. History of Tax Rate Schedules 1966-2010 ............................................................................................................................ II-9
3. Summary Tables
Table 1: New York City Resident Personal Income Tax Rates ............................................. II-29
Table 2: New York City Exemptions, 1966-2010 ............................................................... II-30
Table 3: New York City Standard Deductions, 1966-2010 ................................................. II-31
Table 4: The Income Thresholds Below Which No Tax Is Owed ........................................ II-33
Table 5: Low Income New York City Tax Credits ............................................................... II-34
Table 6: Other New York City Tax Credits ......................................................................... II-35
Table 7: Temporary Personal Income Tax Increase .............................................................. II-36
Table 8: Personal Income Tax and Liability Distribution: Tax Year 2008 ............................. II-37
4. New York City Withholding Table Changes 1980-2011 ...........................................................................................................................II-41
5. Legislative History ................................................................................................................II-45
Appendix II-PIT

Appendix II-PIT
II-2
Appendix II-PIT
II-3
APPENDIX IIPERSONAL INCOME TAX
1.Personal Income Tax Liability:
2010

Appendix II-PIT
II-4
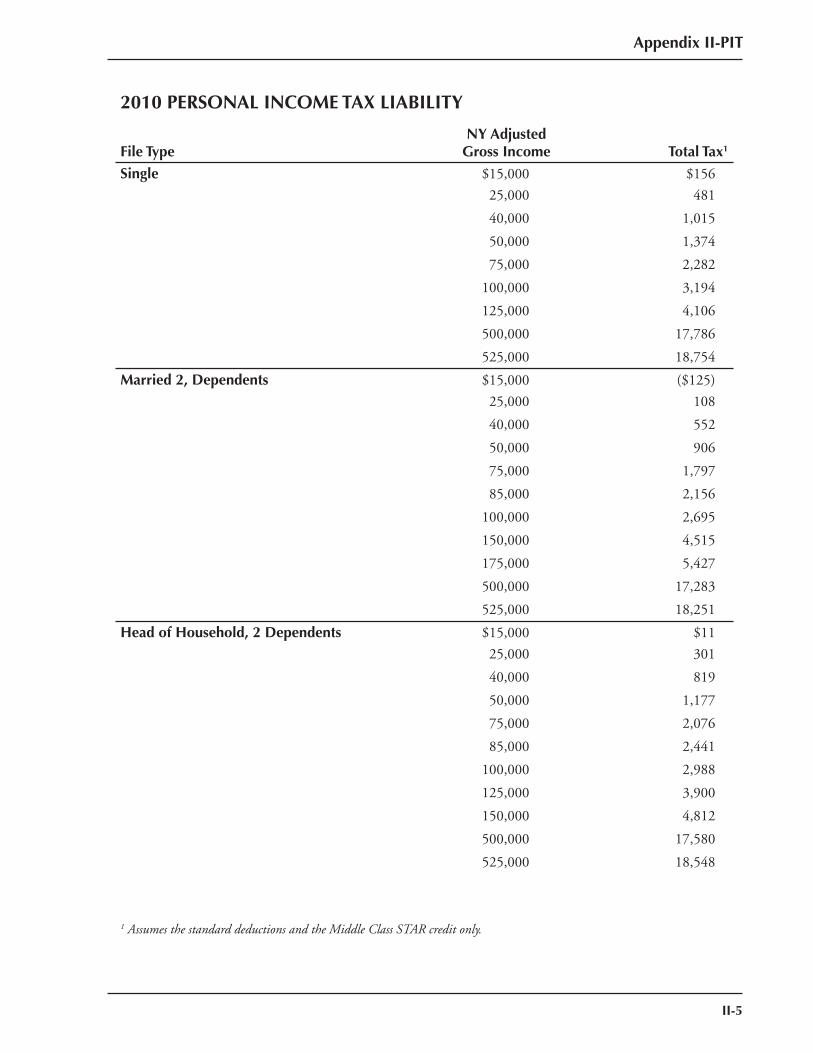
Appendix II-PIT
II-5
2010 PERSONAL INCOME TAX LIABILITY
File TypeNY Adjusted
Gross Income Total Tax1
Single $15,000 $156
25,000 481
40,000 1,015
50,000 1,374
75,000 2,282
100,000 3,194
125,000 4,106
500,000 17,786
525,000 18,754
Married 2, Dependents $15,000 ($125)
25,000 108
40,000 552
50,000 906
75,000 1,797
85,000 2,156
100,000 2,695
150,000 4,515
175,000 5,427
500,000 17,283
525,000 18,251
Head of Household, 2 Dependents $15,000 $11
25,000 301
40,000 819
50,000 1,177
75,000 2,076
85,000 2,441
100,000 2,988
125,000 3,900
150,000 4,812
500,000 17,580
525,000 18,548
1 Assumes the standard deductions and the Middle Class STAR credit only.

Appendix II-PIT
II-6
II-7
Appendix II-PIT
APPENDIX IIPERSONAL INCOME TAX
2.History of Tax Rate Schedules:
1966-2010

II-8
Appendix II-PIT
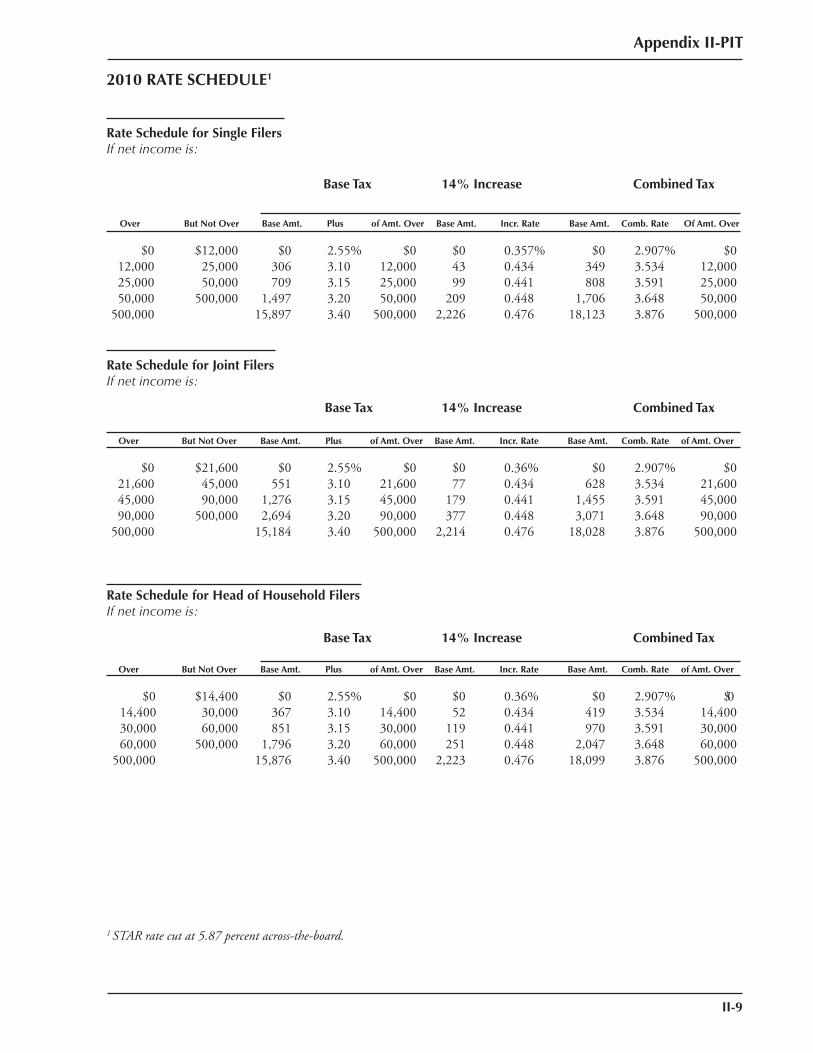
Appendix II-PIT
II-9
2010 RATE SCHEDULE1
Rate Schedule for Single FilersIf net income is:
Base Tax 14% Increase Combined Tax
Over But Not Over Base Amt. Plus of Amt. Over Base Amt. Incr. Rate Base Amt. Comb. Rate Of Amt. Over
$0 $12,000 $0 2.55% $0 $0 0.357% $0 2.907% $0 12,000 25,000 306 3.10 12,000 43 0.434 349 3.534 12,000 25,000 50,000 709 3.15 25,000 99 0.441 808 3.591 25,000 50,000 500,000 1,497 3.20 50,000 209 0.448 1,706 3.648 50,000 500,000 15,897 3.40 500,000 2,226 0.476 18,123 3.876 500,000
Rate Schedule for Joint FilersIf net income is:
Base Tax 14% Increase Combined Tax
Over But Not Over Base Amt. Plus of Amt. Over Base Amt. Incr. Rate Base Amt. Comb. Rate of Amt. Over
$0 $21,600 $0 2.55% $0 $0 0.36% $0 2.907% $0 21,600 45,000 551 3.10 21,600 77 0.434 628 3.534 21,600 45,000 90,000 1,276 3.15 45,000 179 0.441 1,455 3.591 45,000 90,000 500,000 2,694 3.20 90,000 377 0.448 3,071 3.648 90,000 500,000 15,184 3.40 500,000 2,214 0.476 18,028 3.876 500,000
Rate Schedule for Head of Household FilersIf net income is:
Base Tax 14% Increase Combined Tax
Over But Not Over Base Amt. Plus of Amt. Over Base Amt. Incr. Rate Base Amt. Comb. Rate of Amt. Over
$0 $14,400 $0 2.55% $0 $0 0.36% $0 2.907% $0 14,400 30,000 367 3.10 14,400 52 0.434 419 3.534 14,400 30,000 60,000 851 3.15 30,000 119 0.441 970 3.591 30,00060,000 500,000 1,796 3.20 60,000 251 0.448 2,047 3.648 60,000
500,000 15,876 3.40 500,000 2,223 0.476 18,099 3.876 500,000
1 STAR rate cut at 5.87 percent across-the-board.
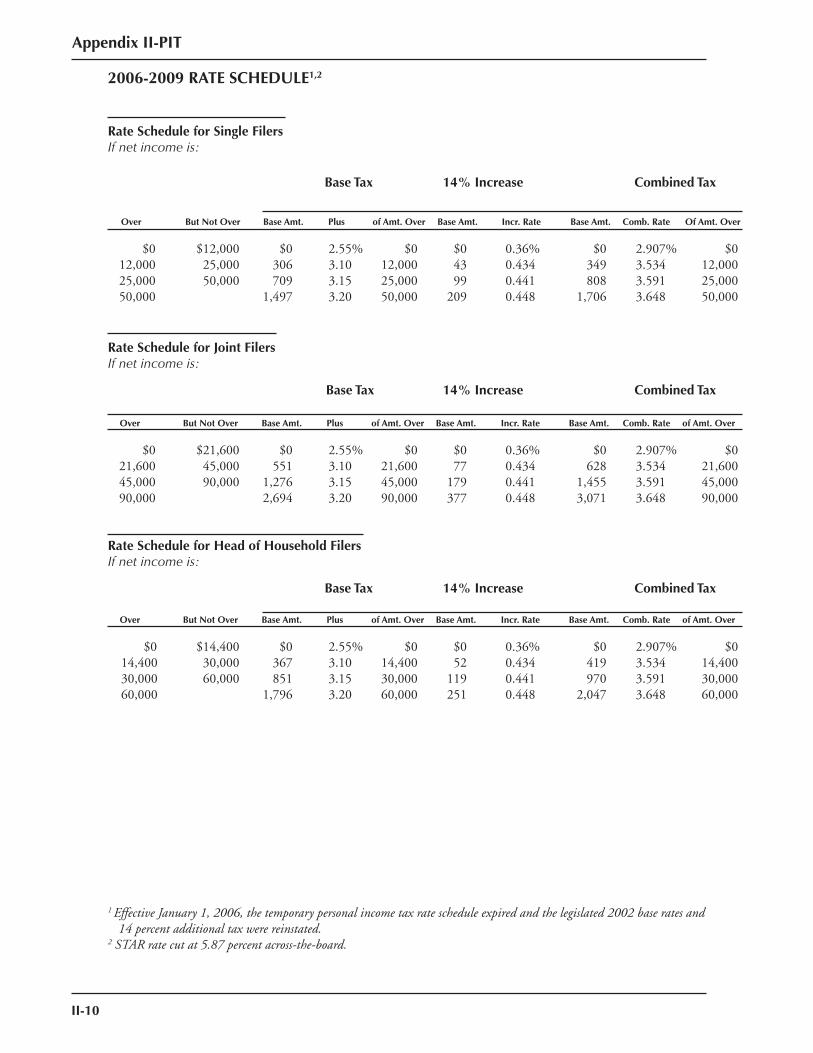
II-10
Appendix II-PIT
2006-2009 RATE SCHEDULE1,2
Rate Schedule for Single FilersIf net income is:
Base Tax 14% Increase Combined Tax
Over But Not Over Base Amt. Plus of Amt. Over Base Amt. Incr. Rate Base Amt. Comb. Rate Of Amt. Over
$0 $12,000 $0 2.55% $0 $0 0.36% $0 2.907% $0 12,000 25,000 306 3.10 12,000 43 0.434 349 3.534 12,000 25,000 50,000 709 3.15 25,000 99 0.441 808 3.591 25,000 50,000 1,497 3.20 50,000 209 0.448 1,706 3.648 50,000
Rate Schedule for Joint FilersIf net income is:
Base Tax 14% Increase Combined Tax
Over But Not Over Base Amt. Plus of Amt. Over Base Amt. Incr. Rate Base Amt. Comb. Rate of Amt. Over
$0 $21,600 $0 2.55% $0 $0 0.36% $0 2.907% $0 21,600 45,000 551 3.10 21,600 77 0.434 628 3.534 21,600 45,000 90,000 1,276 3.15 45,000 179 0.441 1,455 3.591 45,000 90,000 2,694 3.20 90,000 377 0.448 3,071 3.648 90,000
Rate Schedule for Head of Household FilersIf net income is:
Base Tax 14% Increase Combined Tax
Over But Not Over Base Amt. Plus of Amt. Over Base Amt. Incr. Rate Base Amt. Comb. Rate of Amt. Over
$0 $14,400 $0 2.55% $0 $0 0.36% $0 2.907% $0 14,400 30,000 367 3.10 14,400 52 0.434 419 3.534 14,40030,000 60,000 851 3.15 30,000 119 0.441 970 3.591 30,00060,000 1,796 3.20 60,000 251 0.448 2,047 3.648 60,000
1 Effective January 1, 2006, the temporary personal income tax rate schedule expired and the legislated 2002 base rates and 14 percent additional tax were reinstated.
2 STAR rate cut at 5.87 percent across-the-board.
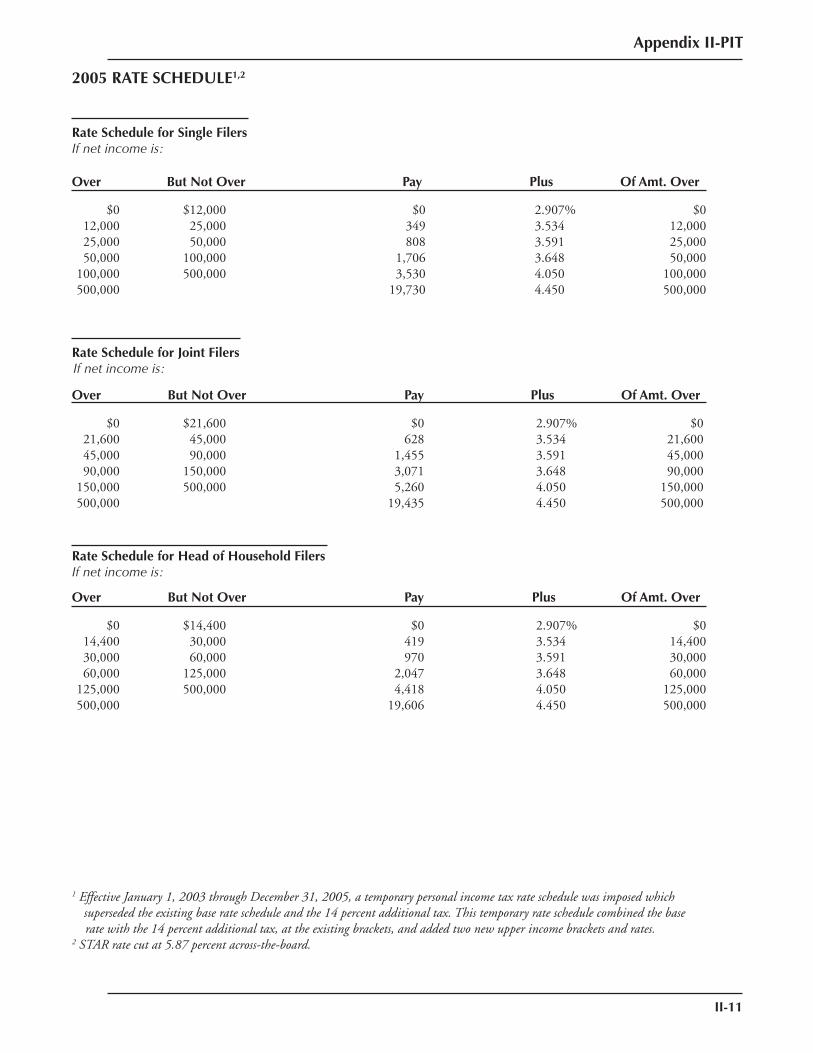
Appendix II-PIT
II-11
2005 RATE SCHEDULE1,2
Rate Schedule for Single FilersIf net income is:
Over But Not Over Pay Plus Of Amt. Over
$0 $12,000 $0 2.907% $0 12,000 25,000 349 3.534 12,000 25,000 50,000 808 3.591 25,000 50,000 100,000 1,706 3.648 50,000 100,000 500,000 3,530 4.050 100,000 500,000 19,730 4.450 500,000
Rate Schedule for Joint FilersIf net income is:
Over But Not Over Pay Plus Of Amt. Over
$0 $21,600 $0 2.907% $0 21,600 45,000 628 3.534 21,600 45,000 90,000 1,455 3.591 45,000 90,000 150,000 3,071 3.648 90,000 150,000 500,000 5,260 4.050 150,000 500,000 19,435 4.450 500,000
Rate Schedule for Head of Household FilersIf net income is:
Over But Not Over Pay Plus Of Amt. Over
$0 $14,400 $0 2.907% $0 14,400 30,000 419 3.534 14,400 30,000 60,000 970 3.591 30,000 60,000 125,000 2,047 3.648 60,000 125,000 500,000 4,418 4.050 125,000 500,000 19,606 4.450 500,000
1 Effective January 1, 2003 through December 31, 2005, a temporary personal income tax rate schedule was imposed whichsuperseded the existing base rate schedule and the 14 percent additional tax. This temporary rate schedule combined the base rate with the 14 percent additional tax, at the existing brackets, and added two new upper income brackets and rates.
2 STAR rate cut at 5.87 percent across-the-board.
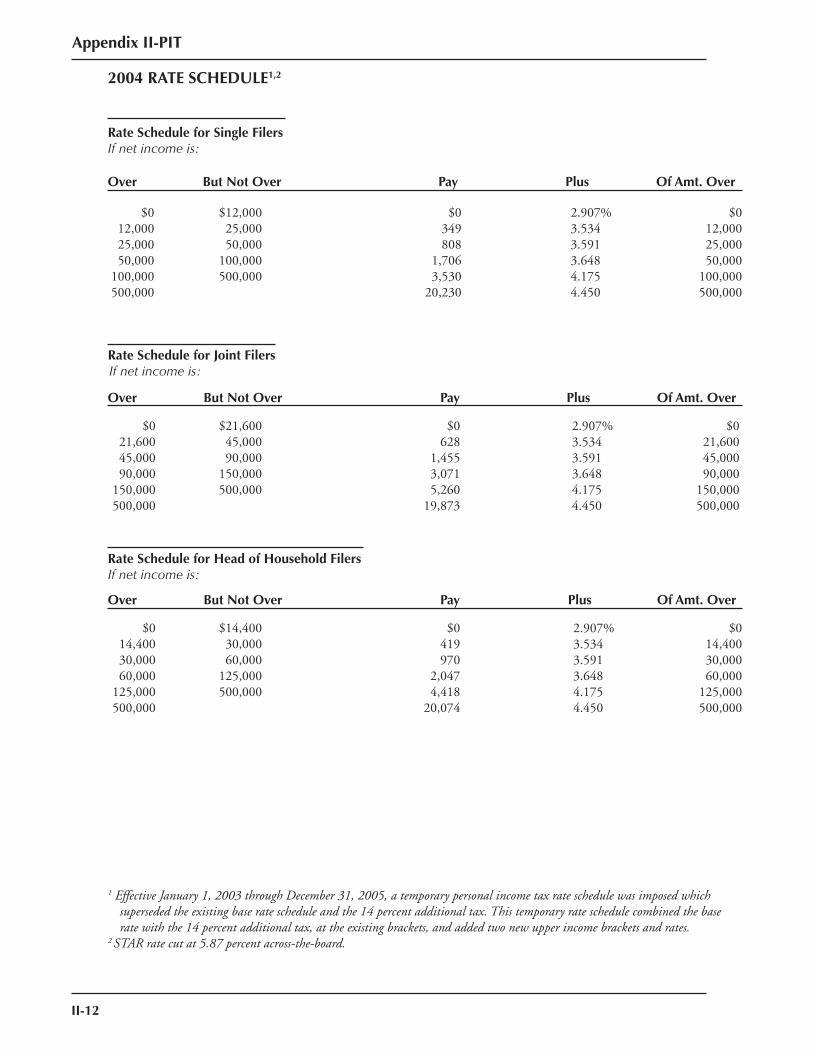
II-12
Appendix II-PIT
2004 RATE SCHEDULE1,2
Rate Schedule for Single FilersIf net income is:
Over But Not Over Pay Plus Of Amt. Over
$0 $12,000 $0 2.907% $0 12,000 25,000 349 3.534 12,000 25,000 50,000 808 3.591 25,000 50,000 100,000 1,706 3.648 50,000 100,000 500,000 3,530 4.175 100,000 500,000 20,230 4.450 500,000
Rate Schedule for Joint FilersIf net income is:
Over But Not Over Pay Plus Of Amt. Over
$0 $21,600 $0 2.907% $0 21,600 45,000 628 3.534 21,600 45,000 90,000 1,455 3.591 45,000 90,000 150,000 3,071 3.648 90,000 150,000 500,000 5,260 4.175 150,000 500,000 19,873 4.450 500,000
Rate Schedule for Head of Household FilersIf net income is:
Over But Not Over Pay Plus Of Amt. Over
$0 $14,400 $0 2.907% $0 14,400 30,000 419 3.534 14,400 30,000 60,000 970 3.591 30,000 60,000 125,000 2,047 3.648 60,000 125,000 500,000 4,418 4.175 125,000 500,000 20,074 4.450 500,000
1 Effective January 1, 2003 through December 31, 2005, a temporary personal income tax rate schedule was imposed which superseded the existing base rate schedule and the 14 percent additional tax. This temporary rate schedule combined the base
rate with the 14 percent additional tax, at the existing brackets, and added two new upper income brackets and rates.2 STAR rate cut at 5.87 percent across-the-board.
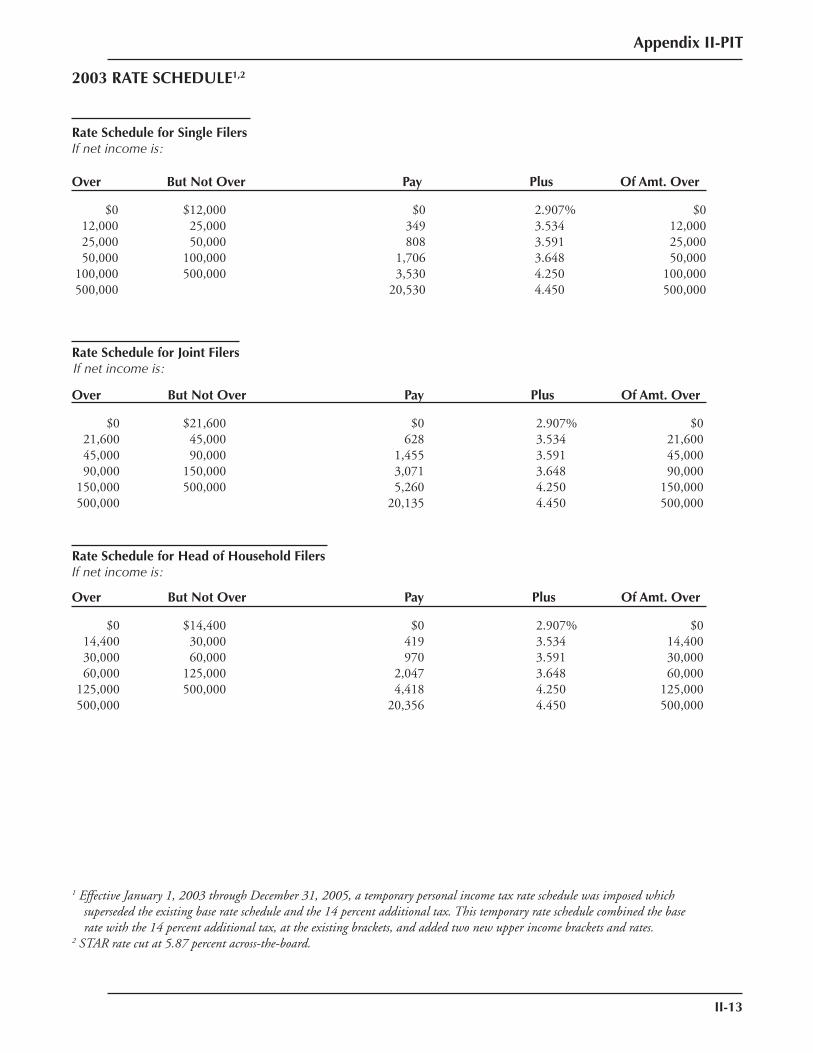
Appendix II-PIT
II-13
2003 RATE SCHEDULE1,2
Rate Schedule for Single FilersIf net income is:
Over But Not Over Pay Plus Of Amt. Over
$0 $12,000 $0 2.907% $0 12,000 25,000 349 3.534 12,000 25,000 50,000 808 3.591 25,000 50,000 100,000 1,706 3.648 50,000 100,000 500,000 3,530 4.250 100,000 500,000 20,530 4.450 500,000
Rate Schedule for Joint FilersIf net income is:
Over But Not Over Pay Plus Of Amt. Over
$0 $21,600 $0 2.907% $0 21,600 45,000 628 3.534 21,600 45,000 90,000 1,455 3.591 45,000 90,000 150,000 3,071 3.648 90,000 150,000 500,000 5,260 4.250 150,000 500,000 20,135 4.450 500,000
Rate Schedule for Head of Household FilersIf net income is:
Over But Not Over Pay Plus Of Amt. Over
$0 $14,400 $0 2.907% $0 14,400 30,000 419 3.534 14,400 30,000 60,000 970 3.591 30,000 60,000 125,000 2,047 3.648 60,000 125,000 500,000 4,418 4.250 125,000 500,000 20,356 4.450 500,000
1 Effective January 1, 2003 through December 31, 2005, a temporary personal income tax rate schedule was imposed which superseded the existing base rate schedule and the 14 percent additional tax. This temporary rate schedule combined the base
rate with the 14 percent additional tax, at the existing brackets, and added two new upper income brackets and rates.2 STAR rate cut at 5.87 percent across-the-board.
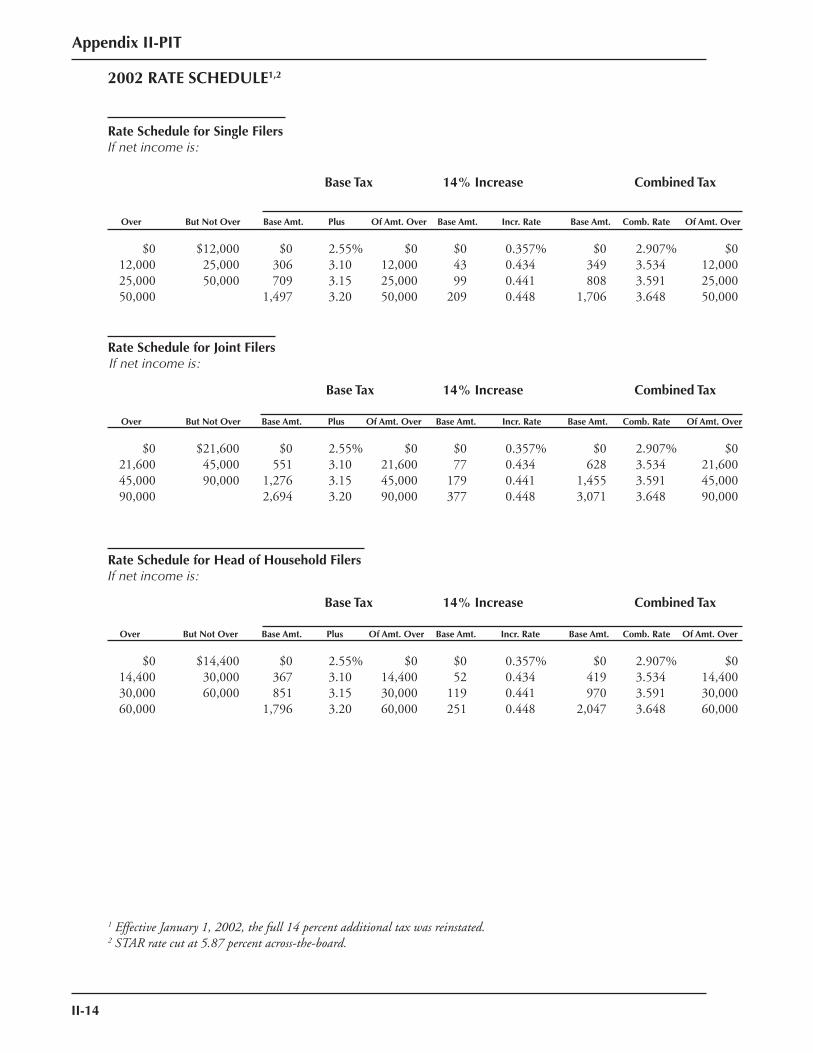
II-14
Appendix II-PIT
2002 RATE SCHEDULE1,2
Rate Schedule for Single FilersIf net income is:
Base Tax 14% Increase Combined Tax
Over But Not Over Base Amt. Plus Of Amt. Over Base Amt. Incr. Rate Base Amt. Comb. Rate Of Amt. Over
$0 $12,000 $0 2.55% $0 $0 0.357% $0 2.907% $0 12,000 25,000 306 3.10 12,000 43 0.434 349 3.534 12,000 25,000 50,000 709 3.15 25,000 99 0.441 808 3.591 25,000 50,000 1,497 3.20 50,000 209 0.448 1,706 3.648 50,000
Rate Schedule for Joint FilersIf net income is:
Base Tax 14% Increase Combined Tax
Over But Not Over Base Amt. Plus Of Amt. Over Base Amt. Incr. Rate Base Amt. Comb. Rate Of Amt. Over
$0 $21,600 $0 2.55% $0 $0 0.357% $0 2.907% $0 21,600 45,000 551 3.10 21,600 77 0.434 628 3.534 21,600 45,000 90,000 1,276 3.15 45,000 179 0.441 1,455 3.591 45,000 90,000 2,694 3.20 90,000 377 0.448 3,071 3.648 90,000
Rate Schedule for Head of Household FilersIf net income is:
Base Tax 14% Increase Combined Tax
Over But Not Over Base Amt. Plus Of Amt. Over Base Amt. Incr. Rate Base Amt. Comb. Rate Of Amt. Over
$0 $14,400 $0 2.55% $0 $0 0.357% $0 2.907% $0 14,400 30,000 367 3.10 14,400 52 0.434 419 3.534 14,400 30,000 60,000 851 3.15 30,000 119 0.441 970 3.591 30,000 60,000 1,796 3.20 60,000 251 0.448 2,047 3.648 60,000
1 Effective January 1, 2002, the full 14 percent additional tax was reinstated.2 STAR rate cut at 5.87 percent across-the-board.
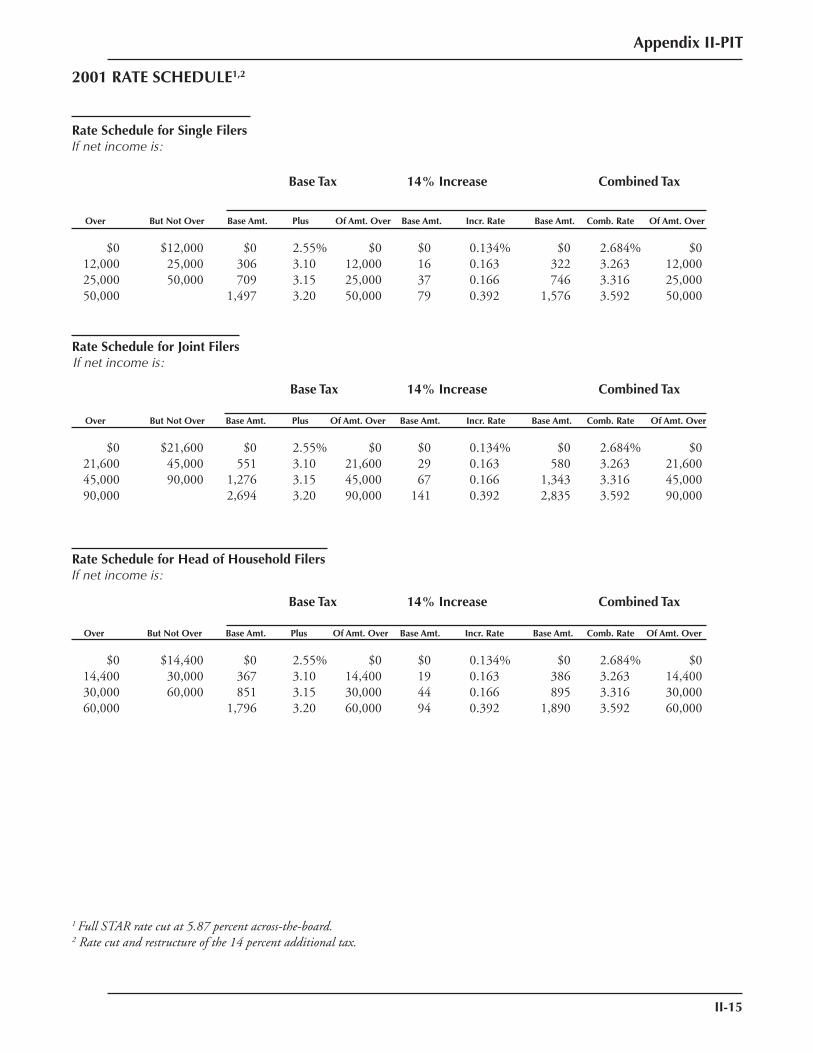
Appendix II-PIT
II-15
2001 RATE SCHEDULE1,2
Rate Schedule for Single FilersIf net income is:
Base Tax 14% Increase Combined Tax
Over But Not Over Base Amt. Plus Of Amt. Over Base Amt. Incr. Rate Base Amt. Comb. Rate Of Amt. Over
$0 $12,000 $0 2.55% $0 $0 0.134% $0 2.684% $0 12,000 25,000 306 3.10 12,000 16 0.163 322 3.263 12,000 25,000 50,000 709 3.15 25,000 37 0.166 746 3.316 25,000 50,000 1,497 3.20 50,000 79 0.392 1,576 3.592 50,000
Rate Schedule for Joint FilersIf net income is:
Base Tax 14% Increase Combined Tax
Over But Not Over Base Amt. Plus Of Amt. Over Base Amt. Incr. Rate Base Amt. Comb. Rate Of Amt. Over
$0 $21,600 $0 2.55% $0 $0 0.134% $0 2.684% $0 21,600 45,000 551 3.10 21,600 29 0.163 580 3.263 21,600 45,000 90,000 1,276 3.15 45,000 67 0.166 1,343 3.316 45,000 90,000 2,694 3.20 90,000 141 0.392 2,835 3.592 90,000
Rate Schedule for Head of Household FilersIf net income is:
Base Tax 14% Increase Combined Tax
Over But Not Over Base Amt. Plus Of Amt. Over Base Amt. Incr. Rate Base Amt. Comb. Rate Of Amt. Over
$0 $14,400 $0 2.55% $0 $0 0.134% $0 2.684% $0 14,400 30,000 367 3.10 14,400 19 0.163 386 3.263 14,400 30,000 60,000 851 3.15 30,000 44 0.166 895 3.316 30,000 60,000 1,796 3.20 60,000 94 0.392 1,890 3.592 60,000
1 Full STAR rate cut at 5.87 percent across-the-board.2 Rate cut and restructure of the 14 percent additional tax.
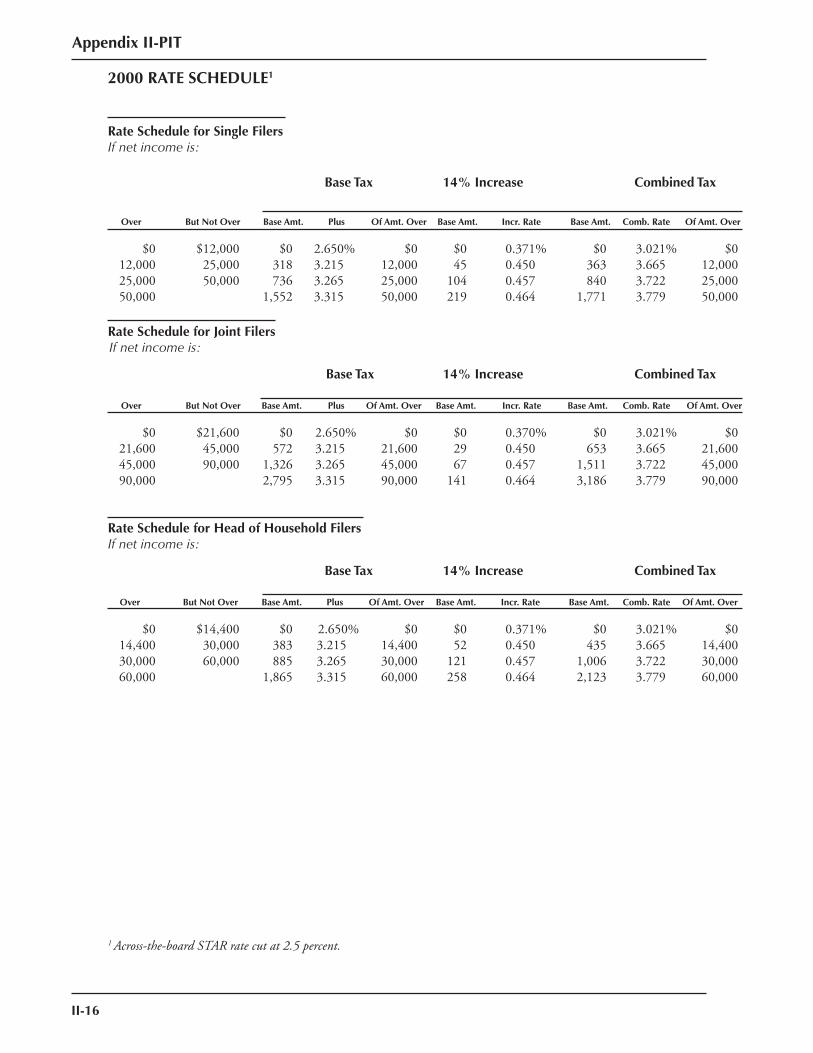
II-16
Appendix II-PIT
2000 RATE SCHEDULE1
Rate Schedule for Single FilersIf net income is:
Base Tax 14% Increase Combined Tax
Over But Not Over Base Amt. Plus Of Amt. Over Base Amt. Incr. Rate Base Amt. Comb. Rate Of Amt. Over
$0 $12,000 $0 2.650% $0 $0 0.371% $0 3.021% $0 12,000 25,000 318 3.215 12,000 45 0.450 363 3.665 12,000 25,000 50,000 736 3.265 25,000 104 0.457 840 3.722 25,000 50,000 1,552 3.315 50,000 219 0.464 1,771 3.779 50,000
Rate Schedule for Joint FilersIf net income is:
Base Tax 14% Increase Combined Tax
Over But Not Over Base Amt. Plus Of Amt. Over Base Amt. Incr. Rate Base Amt. Comb. Rate Of Amt. Over
$0 $21,600 $0 2.650% $0 $0 0.370% $0 3.021% $0 21,600 45,000 572 3.215 21,600 29 0.450 653 3.665 21,600 45,000 90,000 1,326 3.265 45,000 67 0.457 1,511 3.722 45,000 90,000 2,795 3.315 90,000 141 0.464 3,186 3.779 90,000
Rate Schedule for Head of Household FilersIf net income is:
Base Tax 14% Increase Combined Tax
Over But Not Over Base Amt. Plus Of Amt. Over Base Amt. Incr. Rate Base Amt. Comb. Rate Of Amt. Over
$0 $14,400 $0 2.650% $0 $0 0.371% $0 3.021% $0 14,400 30,000 383 3.215 14,400 52 0.450 435 3.665 14,400 30,000 60,000 885 3.265 30,000 121 0.457 1,006 3.722 30,000 60,000 1,865 3.315 60,000 258 0.464 2,123 3.779 60,000
1 Across-the-board STAR rate cut at 2.5 percent.
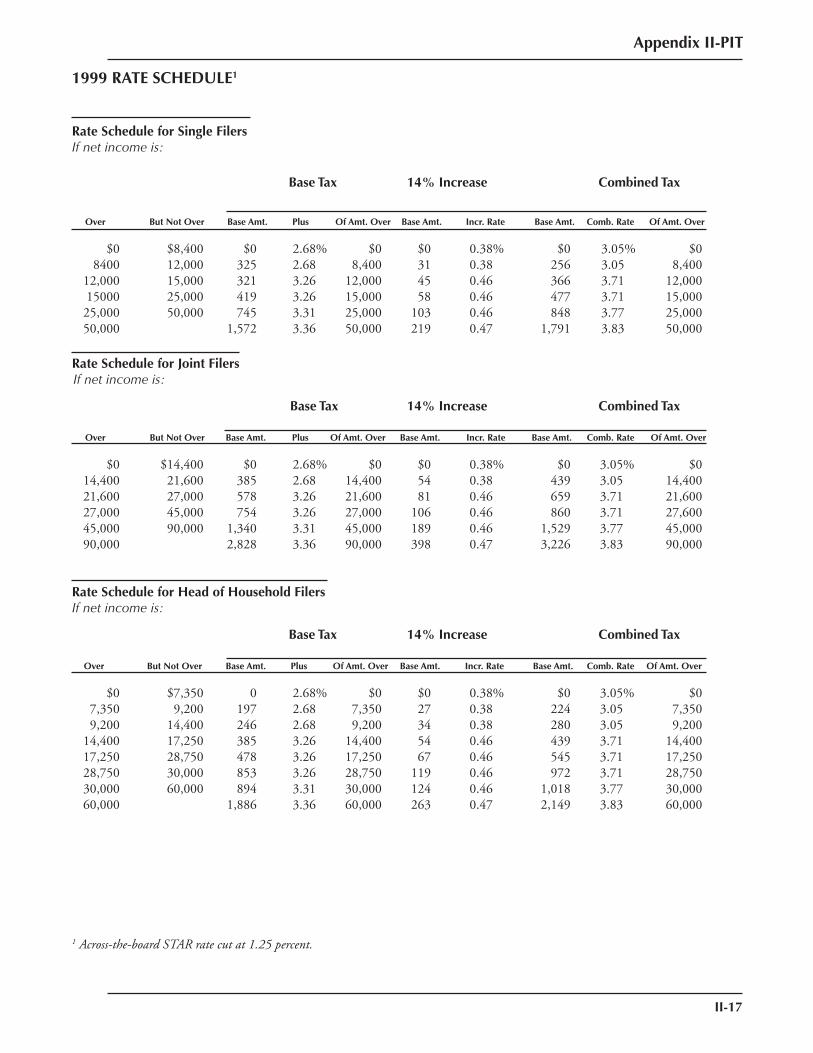
Appendix II-PIT
II-17
1999 RATE SCHEDULE1
Rate Schedule for Single FilersIf net income is:
Base Tax 14% Increase Combined Tax
Over But Not Over Base Amt. Plus Of Amt. Over Base Amt. Incr. Rate Base Amt. Comb. Rate Of Amt. Over
$0 $8,400 $0 2.68% $0 $0 0.38% $0 3.05% $0 8400 12,000 325 2.68 8,400 31 0.38 256 3.05 8,400 12,000 15,000 321 3.26 12,000 45 0.46 366 3.71 12,000 15000 25,000 419 3.26 15,000 58 0.46 477 3.71 15,000 25,000 50,000 745 3.31 25,000 103 0.46 848 3.77 25,000 50,000 1,572 3.36 50,000 219 0.47 1,791 3.83 50,000
Rate Schedule for Joint FilersIf net income is:
Base Tax 14% Increase Combined Tax
Over But Not Over Base Amt. Plus Of Amt. Over Base Amt. Incr. Rate Base Amt. Comb. Rate Of Amt. Over
$0 $14,400 $0 2.68% $0 $0 0.38% $0 3.05% $0 14,400 21,600 385 2.68 14,400 54 0.38 439 3.05 14,400 21,600 27,000 578 3.26 21,600 81 0.46 659 3.71 21,600 27,000 45,000 754 3.26 27,000 106 0.46 860 3.71 27,600 45,000 90,000 1,340 3.31 45,000 189 0.46 1,529 3.77 45,000 90,000 2,828 3.36 90,000 398 0.47 3,226 3.83 90,000
Rate Schedule for Head of Household FilersIf net income is:
Base Tax 14% Increase Combined Tax
Over But Not Over Base Amt. Plus Of Amt. Over Base Amt. Incr. Rate Base Amt. Comb. Rate Of Amt. Over
$0 $7,350 0 2.68% $0 $0 0.38% $0 3.05% $0 7,350 9,200 197 2.68 7,350 27 0.38 224 3.05 7,350 9,200 14,400 246 2.68 9,200 34 0.38 280 3.05 9,200 14,400 17,250 385 3.26 14,400 54 0.46 439 3.71 14,400 17,250 28,750 478 3.26 17,250 67 0.46 545 3.71 17,250 28,750 30,000 853 3.26 28,750 119 0.46 972 3.71 28,750 30,000 60,000 894 3.31 30,000 124 0.46 1,018 3.77 30,000 60,000 1,886 3.36 60,000 263 0.47 2,149 3.83 60,000
1 Across-the-board STAR rate cut at 1.25 percent.
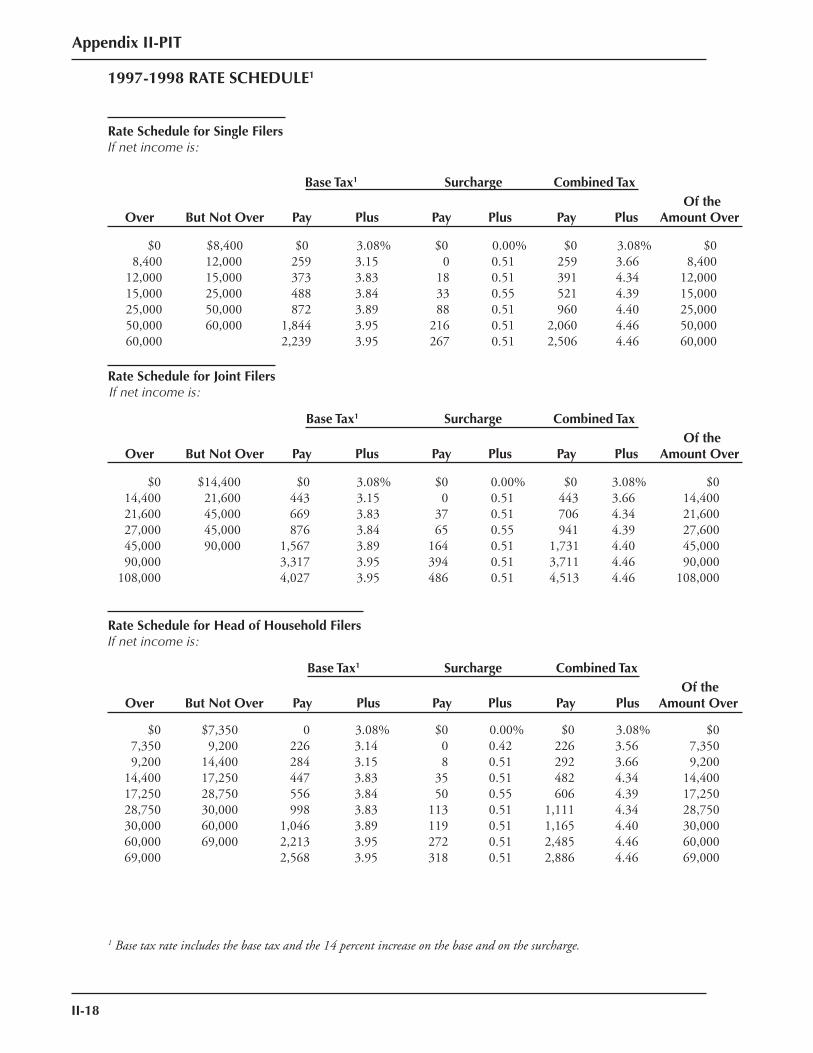
II-18
Appendix II-PIT
1997-1998 RATE SCHEDULE1
Rate Schedule for Single FilersIf net income is:
Base Tax1 Surcharge Combined Tax Of theOver But Not Over Pay Plus Pay Plus Pay Plus Amount Over
$0 $8,400 $0 3.08% $0 0.00% $0 3.08% $0 8,400 12,000 259 3.15 0 0.51 259 3.66 8,400 12,000 15,000 373 3.83 18 0.51 391 4.34 12,000 15,000 25,000 488 3.84 33 0.55 521 4.39 15,000 25,000 50,000 872 3.89 88 0.51 960 4.40 25,000 50,000 60,000 1,844 3.95 216 0.51 2,060 4.46 50,000 60,000 2,239 3.95 267 0.51 2,506 4.46 60,000
Rate Schedule for Joint FilersIf net income is:
Base Tax1 Surcharge Combined Tax Of theOver But Not Over Pay Plus Pay Plus Pay Plus Amount Over
$0 $14,400 $0 3.08% $0 0.00% $0 3.08% $0 14,400 21,600 443 3.15 0 0.51 443 3.66 14,400 21,600 45,000 669 3.83 37 0.51 706 4.34 21,600 27,000 45,000 876 3.84 65 0.55 941 4.39 27,600 45,000 90,000 1,567 3.89 164 0.51 1,731 4.40 45,000 90,000 3,317 3.95 394 0.51 3,711 4.46 90,000 108,000 4,027 3.95 486 0.51 4,513 4.46 108,000
Rate Schedule for Head of Household FilersIf net income is:
Base Tax1 Surcharge Combined Tax Of the
Over But Not Over Pay Plus Pay Plus Pay Plus Amount Over
$0 $7,350 0 3.08% $0 0.00% $0 3.08% $0 7,350 9,200 226 3.14 0 0.42 226 3.56 7,350 9,200 14,400 284 3.15 8 0.51 292 3.66 9,200 14,400 17,250 447 3.83 35 0.51 482 4.34 14,400 17,250 28,750 556 3.84 50 0.55 606 4.39 17,250 28,750 30,000 998 3.83 113 0.51 1,111 4.34 28,750 30,000 60,000 1,046 3.89 119 0.51 1,165 4.40 30,000 60,000 69,000 2,213 3.95 272 0.51 2,485 4.46 60,000 69,000 2,568 3.95 318 0.51 2,886 4.46 69,000
1 Base tax rate includes the base tax and the 14 percent increase on the base and on the surcharge.
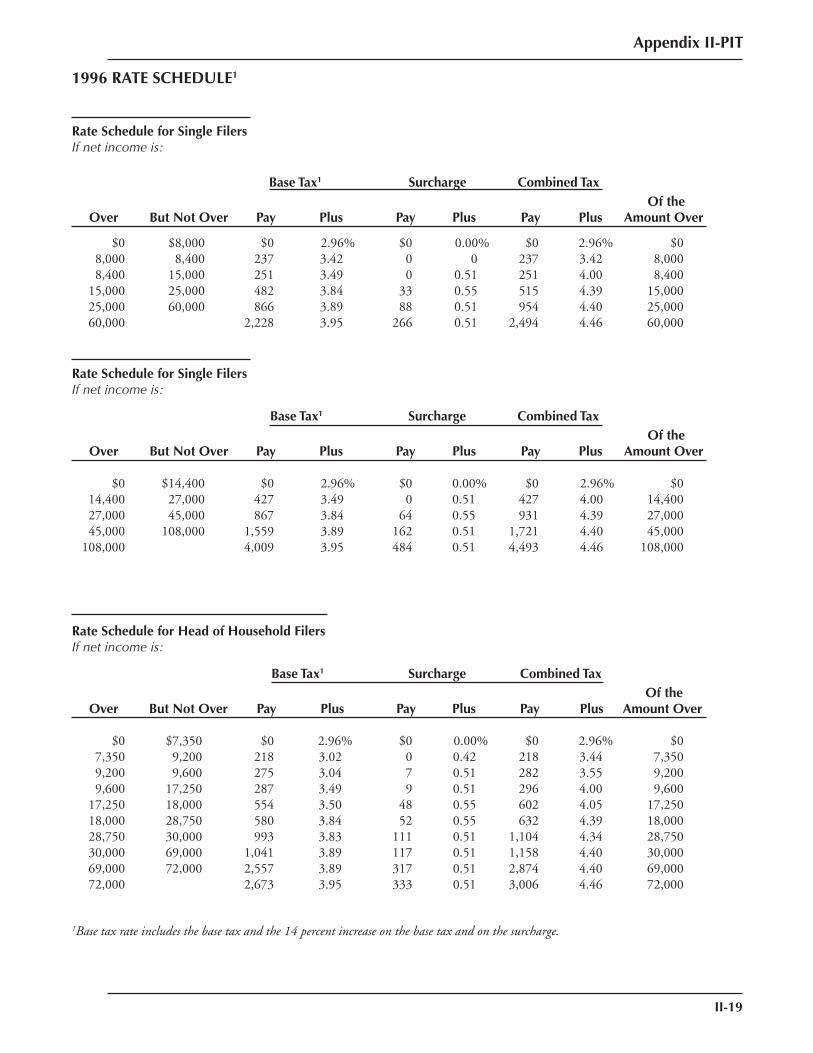
Appendix II-PIT
II-19
1996 RATE SCHEDULE1
Rate Schedule for Single FilersIf net income is:
Base Tax1 Surcharge Combined Tax Of theOver But Not Over Pay Plus Pay Plus Pay Plus Amount Over
$0 $8,000 $0 2.96% $0 0.00% $0 2.96% $0 8,000 8,400 237 3.42 0 0 237 3.42 8,000 8,400 15,000 251 3.49 0 0.51 251 4.00 8,400 15,000 25,000 482 3.84 33 0.55 515 4.39 15,000 25,000 60,000 866 3.89 88 0.51 954 4.40 25,000 60,000 2,228 3.95 266 0.51 2,494 4.46 60,000
Rate Schedule for Single FilersIf net income is:
Base Tax1 Surcharge Combined Tax Of theOver But Not Over Pay Plus Pay Plus Pay Plus Amount Over
$0 $14,400 $0 2.96% $0 0.00% $0 2.96% $0 14,400 27,000 427 3.49 0 0.51 427 4.00 14,400 27,000 45,000 867 3.84 64 0.55 931 4.39 27,000 45,000 108,000 1,559 3.89 162 0.51 1,721 4.40 45,000 108,000 4,009 3.95 484 0.51 4,493 4.46 108,000
Rate Schedule for Head of Household FilersIf net income is:
Base Tax1 Surcharge Combined Tax Of the
Over But Not Over Pay Plus Pay Plus Pay Plus Amount Over
$0 $7,350 $0 2.96% $0 0.00% $0 2.96% $0 7,350 9,200 218 3.02 0 0.42 218 3.44 7,350 9,200 9,600 275 3.04 7 0.51 282 3.55 9,200 9,600 17,250 287 3.49 9 0.51 296 4.00 9,600 17,250 18,000 554 3.50 48 0.55 602 4.05 17,250 18,000 28,750 580 3.84 52 0.55 632 4.39 18,000 28,750 30,000 993 3.83 111 0.51 1,104 4.34 28,750 30,000 69,000 1,041 3.89 117 0.51 1,158 4.40 30,000 69,000 72,000 2,557 3.89 317 0.51 2,874 4.40 69,000 72,000 2,673 3.95 333 0.51 3,006 4.46 72,000
1Base tax rate includes the base tax and the 14 percent increase on the base tax and on the surcharge.
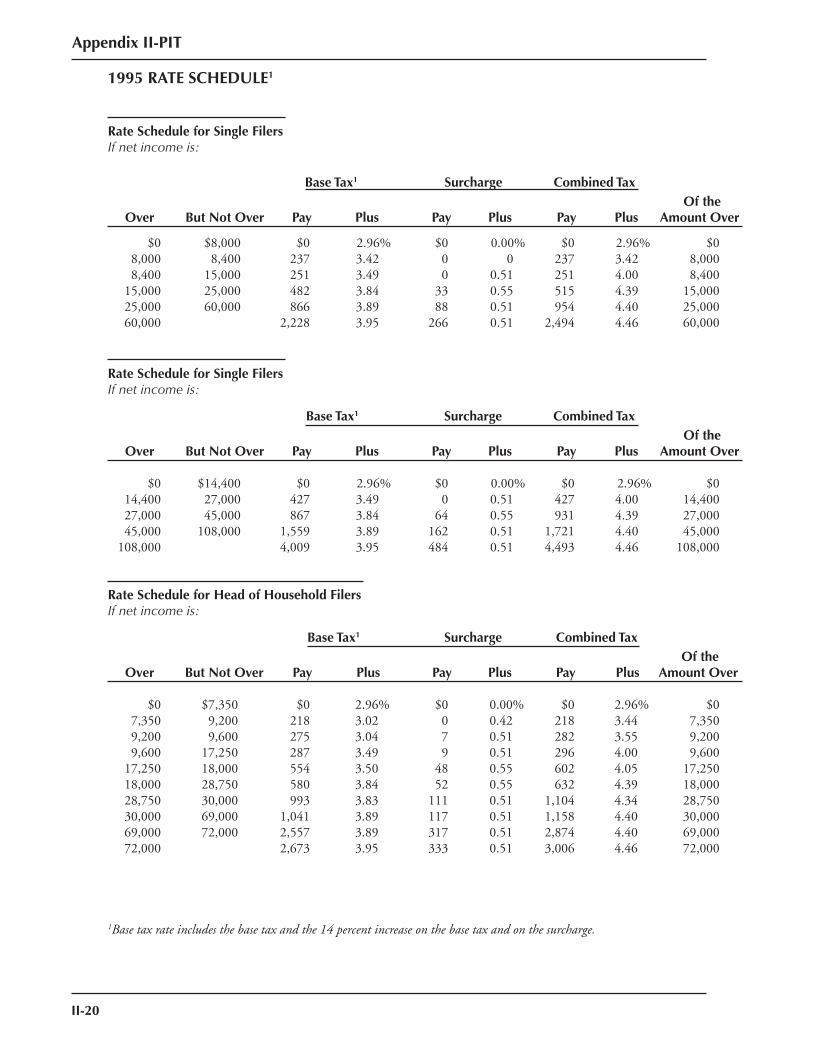
II-20
Appendix II-PIT
1995 RATE SCHEDULE1
Rate Schedule for Single FilersIf net income is:
Base Tax1 Surcharge Combined Tax Of theOver But Not Over Pay Plus Pay Plus Pay Plus Amount Over
$0 $8,000 $0 2.96% $0 0.00% $0 2.96% $0 8,000 8,400 237 3.42 0 0 237 3.42 8,000 8,400 15,000 251 3.49 0 0.51 251 4.00 8,400 15,000 25,000 482 3.84 33 0.55 515 4.39 15,000 25,000 60,000 866 3.89 88 0.51 954 4.40 25,000 60,000 2,228 3.95 266 0.51 2,494 4.46 60,000
Rate Schedule for Single FilersIf net income is:
Base Tax1 Surcharge Combined Tax Of theOver But Not Over Pay Plus Pay Plus Pay Plus Amount Over
$0 $14,400 $0 2.96% $0 0.00% $0 2.96% $0 14,400 27,000 427 3.49 0 0.51 427 4.00 14,400 27,000 45,000 867 3.84 64 0.55 931 4.39 27,000 45,000 108,000 1,559 3.89 162 0.51 1,721 4.40 45,000 108,000 4,009 3.95 484 0.51 4,493 4.46 108,000
Rate Schedule for Head of Household FilersIf net income is:
Base Tax1 Surcharge Combined Tax Of the
Over But Not Over Pay Plus Pay Plus Pay Plus Amount Over
$0 $7,350 $0 2.96% $0 0.00% $0 2.96% $0 7,350 9,200 218 3.02 0 0.42 218 3.44 7,350 9,200 9,600 275 3.04 7 0.51 282 3.55 9,200 9,600 17,250 287 3.49 9 0.51 296 4.00 9,600 17,250 18,000 554 3.50 48 0.55 602 4.05 17,250 18,000 28,750 580 3.84 52 0.55 632 4.39 18,000 28,750 30,000 993 3.83 111 0.51 1,104 4.34 28,750 30,000 69,000 1,041 3.89 117 0.51 1,158 4.40 30,000 69,000 72,000 2,557 3.89 317 0.51 2,874 4.40 69,000 72,000 2,673 3.95 333 0.51 3,006 4.46 72,000
1Base tax rate includes the base tax and the 14 percent increase on the base tax and on the surcharge.
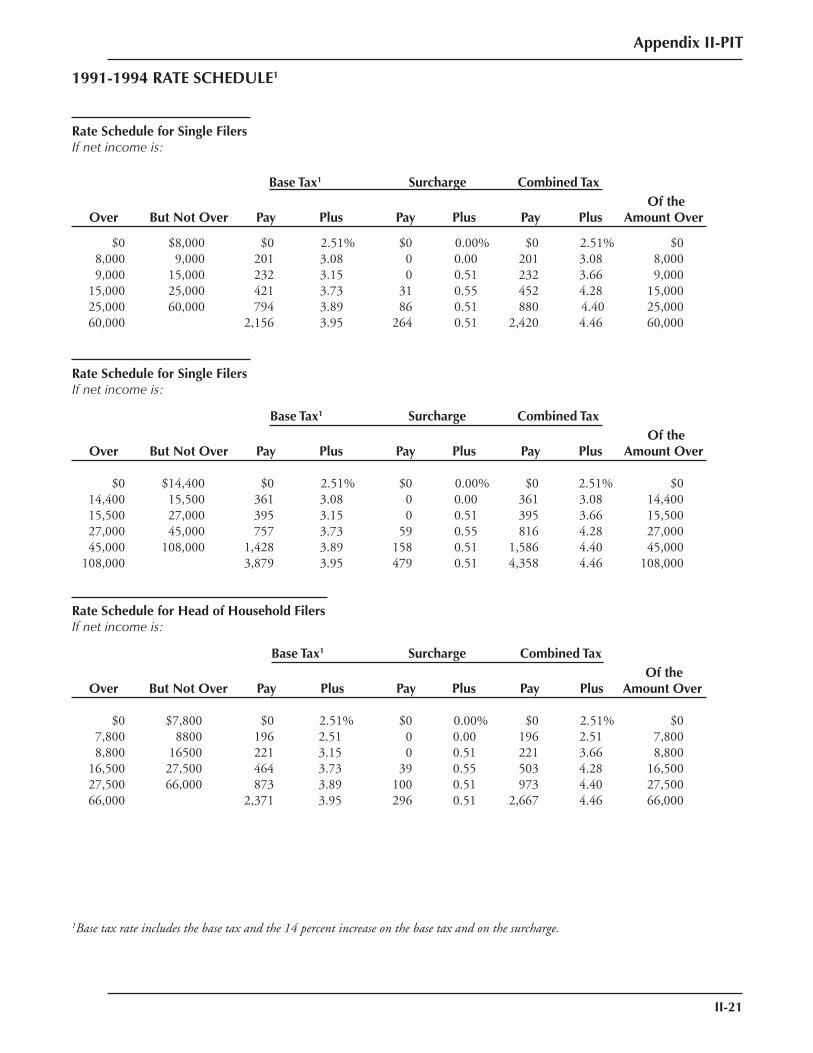
Appendix II-PIT
II-21
1991-1994 RATE SCHEDULE1
Rate Schedule for Single FilersIf net income is:
Base Tax1 Surcharge Combined Tax Of theOver But Not Over Pay Plus Pay Plus Pay Plus Amount Over
$0 $8,000 $0 2.51% $0 0.00% $0 2.51% $0 8,000 9,000 201 3.08 0 0.00 201 3.08 8,000 9,000 15,000 232 3.15 0 0.51 232 3.66 9,000 15,000 25,000 421 3.73 31 0.55 452 4.28 15,000 25,000 60,000 794 3.89 86 0.51 880 4.40 25,000 60,000 2,156 3.95 264 0.51 2,420 4.46 60,000
Rate Schedule for Single FilersIf net income is:
Base Tax1 Surcharge Combined Tax Of theOver But Not Over Pay Plus Pay Plus Pay Plus Amount Over
$0 $14,400 $0 2.51% $0 0.00% $0 2.51% $0 14,400 15,500 361 3.08 0 0.00 361 3.08 14,400 15,500 27,000 395 3.15 0 0.51 395 3.66 15,500 27,000 45,000 757 3.73 59 0.55 816 4.28 27,000 45,000 108,000 1,428 3.89 158 0.51 1,586 4.40 45,000 108,000 3,879 3.95 479 0.51 4,358 4.46 108,000
Rate Schedule for Head of Household FilersIf net income is:
Base Tax1 Surcharge Combined Tax Of the
Over But Not Over Pay Plus Pay Plus Pay Plus Amount Over
$0 $7,800 $0 2.51% $0 0.00% $0 2.51% $0 7,800 8800 196 2.51 0 0.00 196 2.51 7,800 8,800 16500 221 3.15 0 0.51 221 3.66 8,800 16,500 27,500 464 3.73 39 0.55 503 4.28 16,500 27,500 66,000 873 3.89 100 0.51 973 4.40 27,500 66,000 2,371 3.95 296 0.51 2,667 4.46 66,000
1Base tax rate includes the base tax and the 14 percent increase on the base tax and on the surcharge.
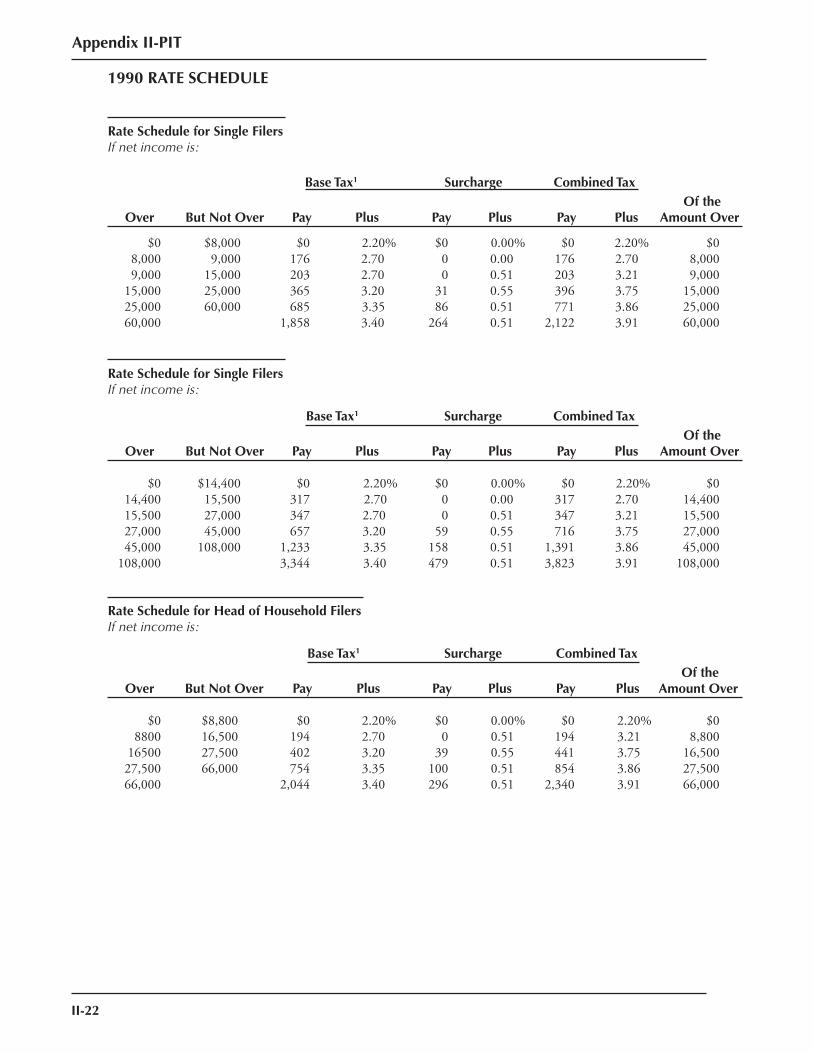
II-22
Appendix II-PIT
1990 RATE SCHEDULE
Rate Schedule for Single FilersIf net income is:
Base Tax1 Surcharge Combined Tax Of theOver But Not Over Pay Plus Pay Plus Pay Plus Amount Over
$0 $8,000 $0 2.20% $0 0.00% $0 2.20% $0 8,000 9,000 176 2.70 0 0.00 176 2.70 8,000 9,000 15,000 203 2.70 0 0.51 203 3.21 9,000 15,000 25,000 365 3.20 31 0.55 396 3.75 15,000 25,000 60,000 685 3.35 86 0.51 771 3.86 25,000 60,000 1,858 3.40 264 0.51 2,122 3.91 60,000
Rate Schedule for Single FilersIf net income is:
Base Tax1 Surcharge Combined Tax Of theOver But Not Over Pay Plus Pay Plus Pay Plus Amount Over
$0 $14,400 $0 2.20% $0 0.00% $0 2.20% $0 14,400 15,500 317 2.70 0 0.00 317 2.70 14,400 15,500 27,000 347 2.70 0 0.51 347 3.21 15,500 27,000 45,000 657 3.20 59 0.55 716 3.75 27,000 45,000 108,000 1,233 3.35 158 0.51 1,391 3.86 45,000 108,000 3,344 3.40 479 0.51 3,823 3.91 108,000
Rate Schedule for Head of Household FilersIf net income is:
Base Tax1 Surcharge Combined Tax Of the
Over But Not Over Pay Plus Pay Plus Pay Plus Amount Over
$0 $8,800 $0 2.20% $0 0.00% $0 2.20% $0 8800 16,500 194 2.70 0 0.51 194 3.21 8,800 16500 27,500 402 3.20 39 0.55 441 3.75 16,500 27,500 66,000 754 3.35 100 0.51 854 3.86 27,500 66,000 2,044 3.40 296 0.51 2,340 3.91 66,000
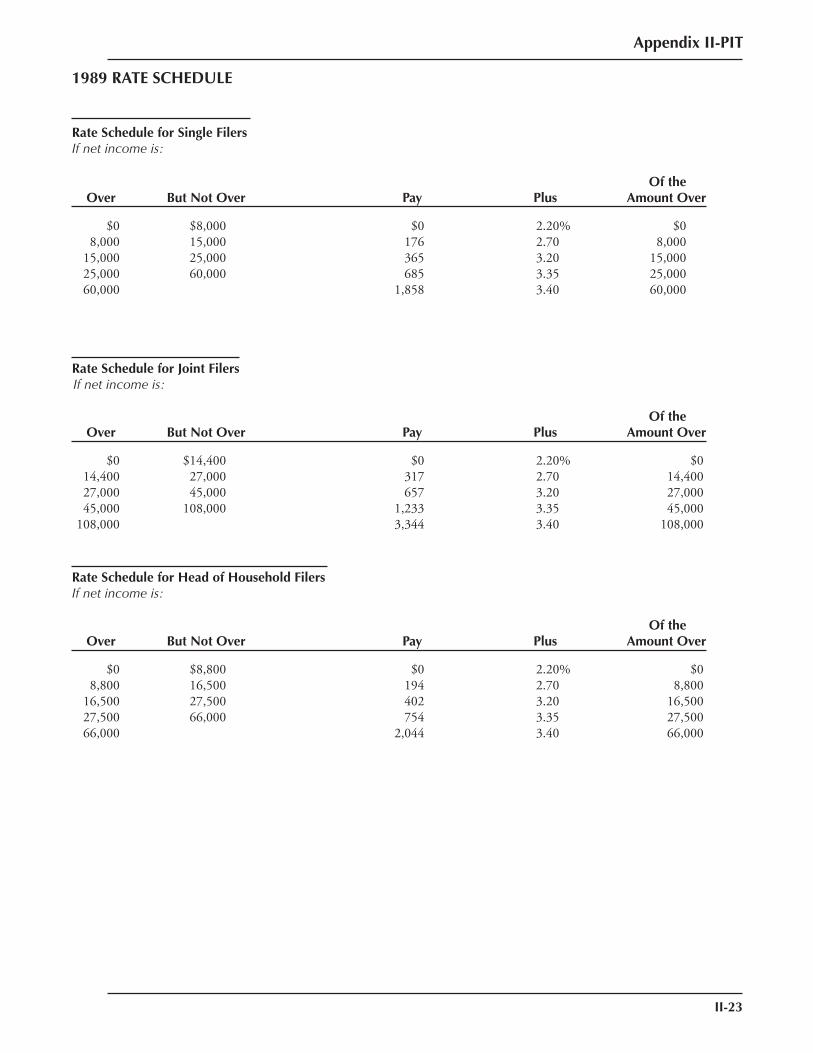
Appendix II-PIT
II-23
1989 RATE SCHEDULE
Rate Schedule for Single FilersIf net income is:
Of the Over But Not Over Pay Plus Amount Over
$0 $8,000 $0 2.20% $0 8,000 15,000 176 2.70 8,000 15,000 25,000 365 3.20 15,000 25,000 60,000 685 3.35 25,000 60,000 1,858 3.40 60,000
Rate Schedule for Joint FilersIf net income is:
Of the Over But Not Over Pay Plus Amount Over
$0 $14,400 $0 2.20% $0 14,400 27,000 317 2.70 14,400 27,000 45,000 657 3.20 27,000 45,000 108,000 1,233 3.35 45,000 108,000 3,344 3.40 108,000
Rate Schedule for Head of Household FilersIf net income is:
Of the Over But Not Over Pay Plus Amount Over
$0 $8,800 $0 2.20% $0 8,800 16,500 194 2.70 8,800 16,500 27,500 402 3.20 16,500 27,500 66,000 754 3.35 27,500 66,000 2,044 3.40 66,000
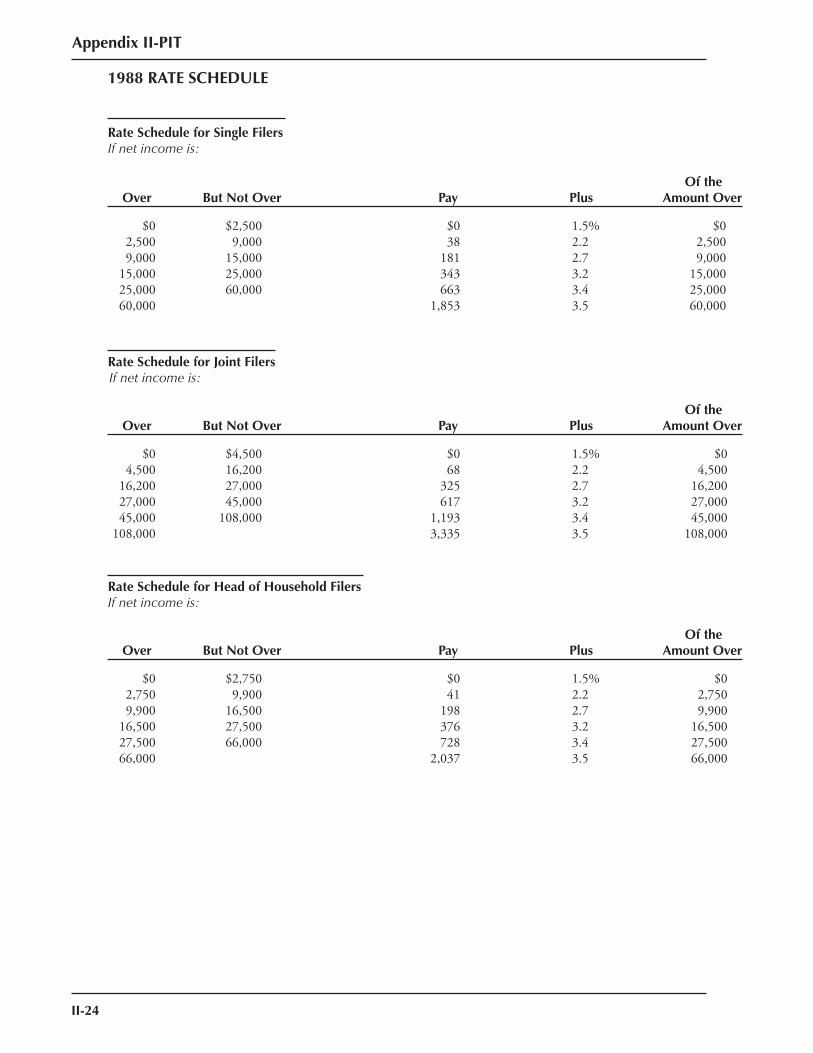
II-24
Appendix II-PIT
1988 RATE SCHEDULE
Rate Schedule for Single FilersIf net income is:
Of the Over But Not Over Pay Plus Amount Over
$0 $2,500 $0 1.5% $0 2,500 9,000 38 2.2 2,500 9,000 15,000 181 2.7 9,000 15,000 25,000 343 3.2 15,000 25,000 60,000 663 3.4 25,000 60,000 1,853 3.5 60,000
Rate Schedule for Joint FilersIf net income is:
Of the Over But Not Over Pay Plus Amount Over
$0 $4,500 $0 1.5% $0 4,500 16,200 68 2.2 4,500 16,200 27,000 325 2.7 16,200 27,000 45,000 617 3.2 27,000 45,000 108,000 1,193 3.4 45,000 108,000 3,335 3.5 108,000
Rate Schedule for Head of Household FilersIf net income is: Of the
Over But Not Over Pay Plus Amount Over
$0 $2,750 $0 1.5% $0 2,750 9,900 41 2.2 2,750 9,900 16,500 198 2.7 9,900 16,500 27,500 376 3.2 16,500 27,500 66,000 728 3.4 27,500 66,000 2,037 3.5 66,000
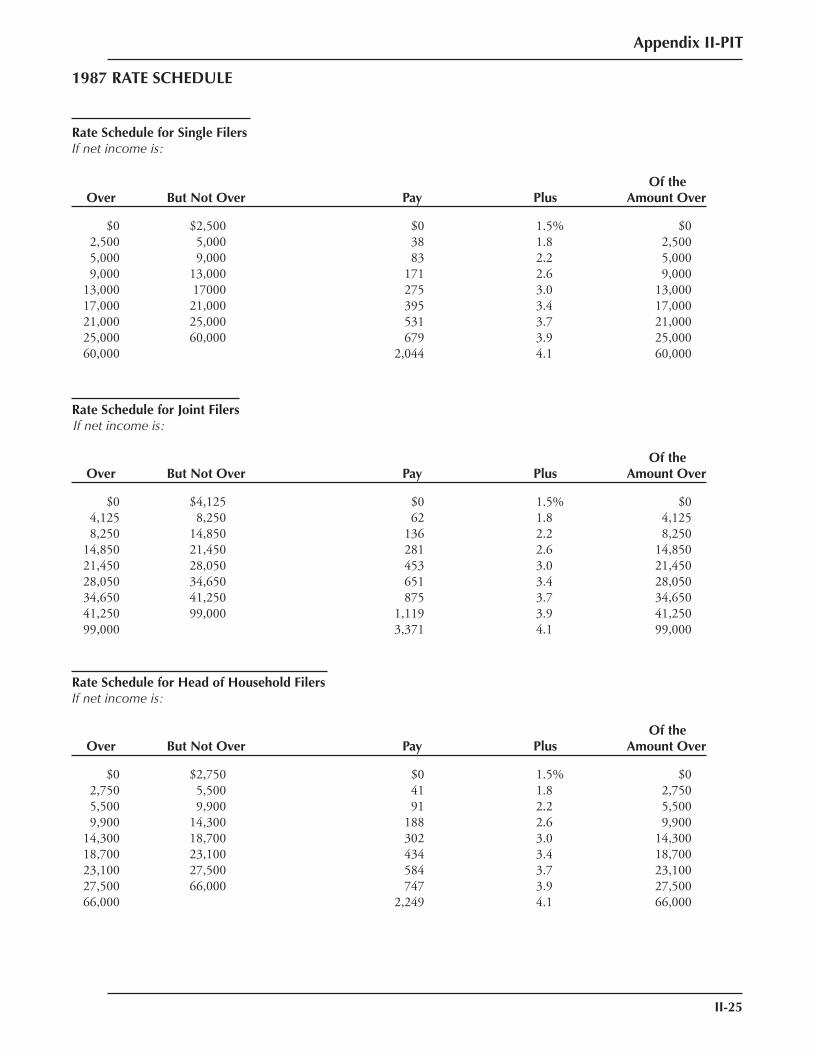
Appendix II-PIT
II-25
1987 RATE SCHEDULE
Rate Schedule for Single FilersIf net income is:
Of the Over But Not Over Pay Plus Amount Over
$0 $2,500 $0 1.5% $0 2,500 5,000 38 1.8 2,500 5,000 9,000 83 2.2 5,000 9,000 13,000 171 2.6 9,000 13,000 17000 275 3.0 13,000 17,000 21,000 395 3.4 17,000 21,000 25,000 531 3.7 21,000 25,000 60,000 679 3.9 25,000 60,000 2,044 4.1 60,000
Rate Schedule for Joint FilersIf net income is:
Of the Over But Not Over Pay Plus Amount Over
$0 $4,125 $0 1.5% $0 4,125 8,250 62 1.8 4,125 8,250 14,850 136 2.2 8,250 14,850 21,450 281 2.6 14,850 21,450 28,050 453 3.0 21,450 28,050 34,650 651 3.4 28,050 34,650 41,250 875 3.7 34,650 41,250 99,000 1,119 3.9 41,250 99,000 3,371 4.1 99,000
Rate Schedule for Head of Household FilersIf net income is: Of the
Over But Not Over Pay Plus Amount Over
$0 $2,750 $0 1.5% $0 2,750 5,500 41 1.8 2,750 5,500 9,900 91 2.2 5,500 9,900 14,300 188 2.6 9,900 14,300 18,700 302 3.0 14,300 18,700 23,100 434 3.4 18,700 23,100 27,500 584 3.7 23,100 27,500 66,000 747 3.9 27,500 66,000 2,249 4.1 66,000
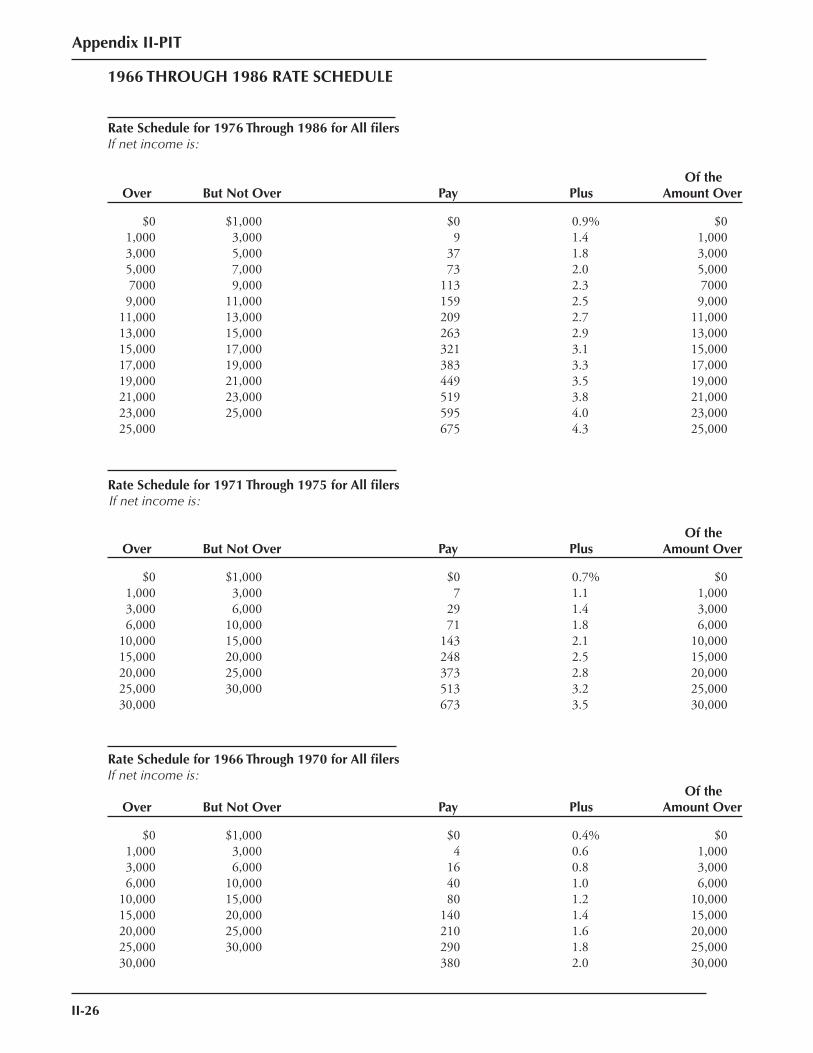
II-26
Appendix II-PIT
1966 THROUGH 1986 RATE SCHEDULE
Rate Schedule for 1976 Through 1986 for All fi lersIf net income is:
Of the Over But Not Over Pay Plus Amount Over
$0 $1,000 $0 0.9% $0 1,000 3,000 9 1.4 1,000 3,000 5,000 37 1.8 3,000 5,000 7,000 73 2.0 5,000 7000 9,000 113 2.3 7000 9,000 11,000 159 2.5 9,000 11,000 13,000 209 2.7 11,000 13,000 15,000 263 2.9 13,000 15,000 17,000 321 3.1 15,000 17,000 19,000 383 3.3 17,000 19,000 21,000 449 3.5 19,000 21,000 23,000 519 3.8 21,000 23,000 25,000 595 4.0 23,000 25,000 675 4.3 25,000
Rate Schedule for 1971 Through 1975 for All fi lersIf net income is:
Of the Over But Not Over Pay Plus Amount Over
$0 $1,000 $0 0.7% $0 1,000 3,000 7 1.1 1,000 3,000 6,000 29 1.4 3,000 6,000 10,000 71 1.8 6,000 10,000 15,000 143 2.1 10,000 15,000 20,000 248 2.5 15,000 20,000 25,000 373 2.8 20,000 25,000 30,000 513 3.2 25,000 30,000 673 3.5 30,000
Rate Schedule for 1966 Through 1970 for All fi lersIf net income is: Of the
Over But Not Over Pay Plus Amount Over
$0 $1,000 $0 0.4% $0 1,000 3,000 4 0.6 1,000 3,000 6,000 16 0.8 3,000 6,000 10,000 40 1.0 6,000 10,000 15,000 80 1.2 10,000 15,000 20,000 140 1.4 15,000 20,000 25,000 210 1.6 20,000 25,000 30,000 290 1.8 25,000 30,000 380 2.0 30,000

APPENDIX IIPERSONAL INCOME TAX
3.Summary Tables
Appendix II-PIT
II-27

II-28
II-28
Appendix II-PIT
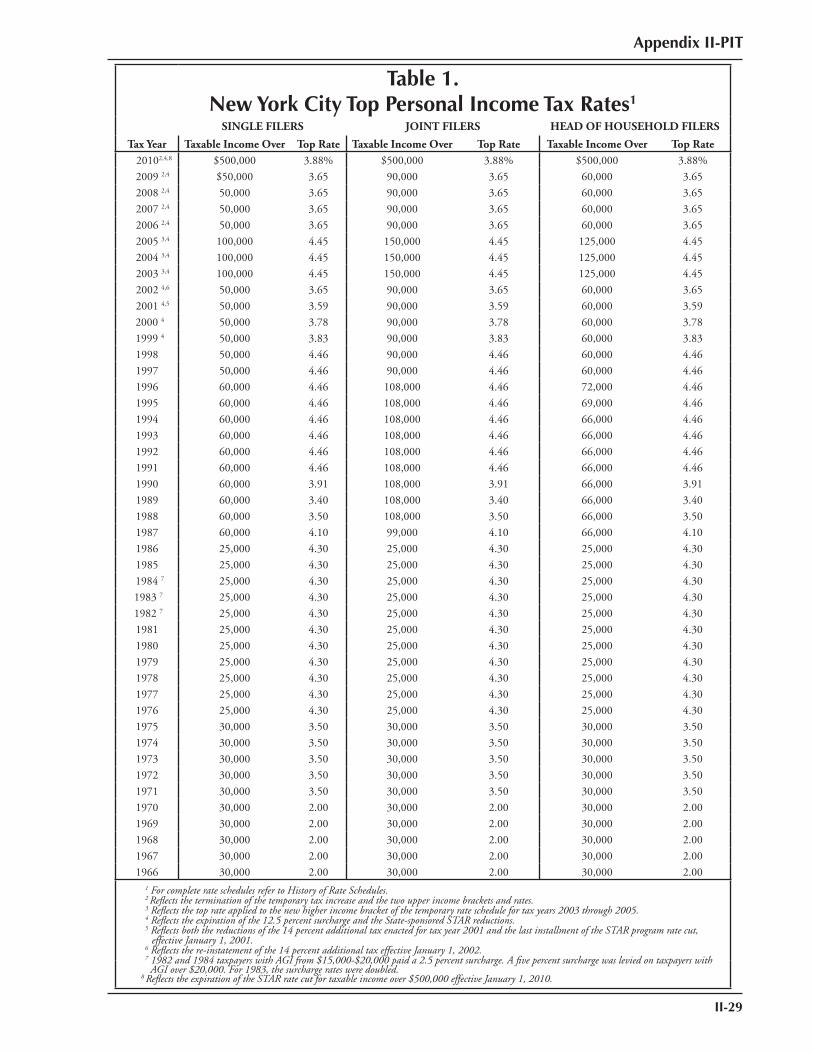
Appendix II-PIT
II-29
Table 1.New York City Top Personal Income Tax Rates1
SINGLE FILERS JOINT FILERS HEAD OF HOUSEHOLD FILERS
Tax Year Taxable Income Over Top Rate Taxable Income Over Top Rate Taxable Income Over Top Rate 20102,4,8 $500,000 3.88% $500,000 3.88% $500,000 3.88% 2009 2,4 $50,000 3.65 90,000 3.65 60,000 3.65 2008 2,4 50,000 3.65 90,000 3.65 60,000 3.65 2007 2,4 50,000 3.65 90,000 3.65 60,000 3.65 2006 2,4 50,000 3.65 90,000 3.65 60,000 3.65 2005 3,4 100,000 4.45 150,000 4.45 125,000 4.45 2004 3,4 100,000 4.45 150,000 4.45 125,000 4.45 2003 3,4 100,000 4.45 150,000 4.45 125,000 4.45 2002 4,6 50,000 3.65 90,000 3.65 60,000 3.65 2001 4,5 50,000 3.59 90,000 3.59 60,000 3.59 2000 4 50,000 3.78 90,000 3.78 60,000 3.78 1999 4 50,000 3.83 90,000 3.83 60,000 3.83
1998 50,000 4.46 90,000 4.46 60,000 4.461997 50,000 4.46 90,000 4.46 60,000 4.461996 60,000 4.46 108,000 4.46 72,000 4.461995 60,000 4.46 108,000 4.46 69,000 4.461994 60,000 4.46 108,000 4.46 66,000 4.461993 60,000 4.46 108,000 4.46 66,000 4.461992 60,000 4.46 108,000 4.46 66,000 4.461991 60,000 4.46 108,000 4.46 66,000 4.461990 60,000 3.91 108,000 3.91 66,000 3.911989 60,000 3.40 108,000 3.40 66,000 3.401988 60,000 3.50 108,000 3.50 66,000 3.501987 60,000 4.10 99,000 4.10 66,000 4.101986 25,000 4.30 25,000 4.30 25,000 4.301985 25,000 4.30 25,000 4.30 25,000 4.30
1984 7 25,000 4.30 25,000 4.30 25,000 4.30 1983 7 25,000 4.30 25,000 4.30 25,000 4.30 1982 7 25,000 4.30 25,000 4.30 25,000 4.301981 25,000 4.30 25,000 4.30 25,000 4.301980 25,000 4.30 25,000 4.30 25,000 4.301979 25,000 4.30 25,000 4.30 25,000 4.301978 25,000 4.30 25,000 4.30 25,000 4.301977 25,000 4.30 25,000 4.30 25,000 4.301976 25,000 4.30 25,000 4.30 25,000 4.301975 30,000 3.50 30,000 3.50 30,000 3.501974 30,000 3.50 30,000 3.50 30,000 3.501973 30,000 3.50 30,000 3.50 30,000 3.501972 30,000 3.50 30,000 3.50 30,000 3.501971 30,000 3.50 30,000 3.50 30,000 3.501970 30,000 2.00 30,000 2.00 30,000 2.001969 30,000 2.00 30,000 2.00 30,000 2.001968 30,000 2.00 30,000 2.00 30,000 2.001967 30,000 2.00 30,000 2.00 30,000 2.001966 30,000 2.00 30,000 2.00 30,000 2.00
1 For complete rate schedules refer to History of Rate Schedules.2 Refl ects the termination of the temporary tax increase and the two upper income brackets and rates.3 Refl ects the top rate applied to the new higher income bracket of the temporary rate schedule for tax years 2003 through 2005. 4 Refl ects the expiration of the 12.5 percent surcharge and the State-sponsored STAR reductions.5 Refl ects both the reductions of the 14 percent additional tax enacted for tax year 2001 and the last installment of the STAR program rate cut, effective January 1, 2001.6 Refl ects the re-instatement of the 14 percent additional tax effective January 1, 2002.7 1982 and 1984 taxpayers with AGI from $15,000-$20,000 paid a 2.5 percent surcharge. A fi ve percent surcharge was levied on taxpayers with AGI over $20,000. For 1983, the surcharge rates were doubled.
8 Refl ects the expiration of the STAR rate cut for taxable income over $500,000 effective January 1, 2010.
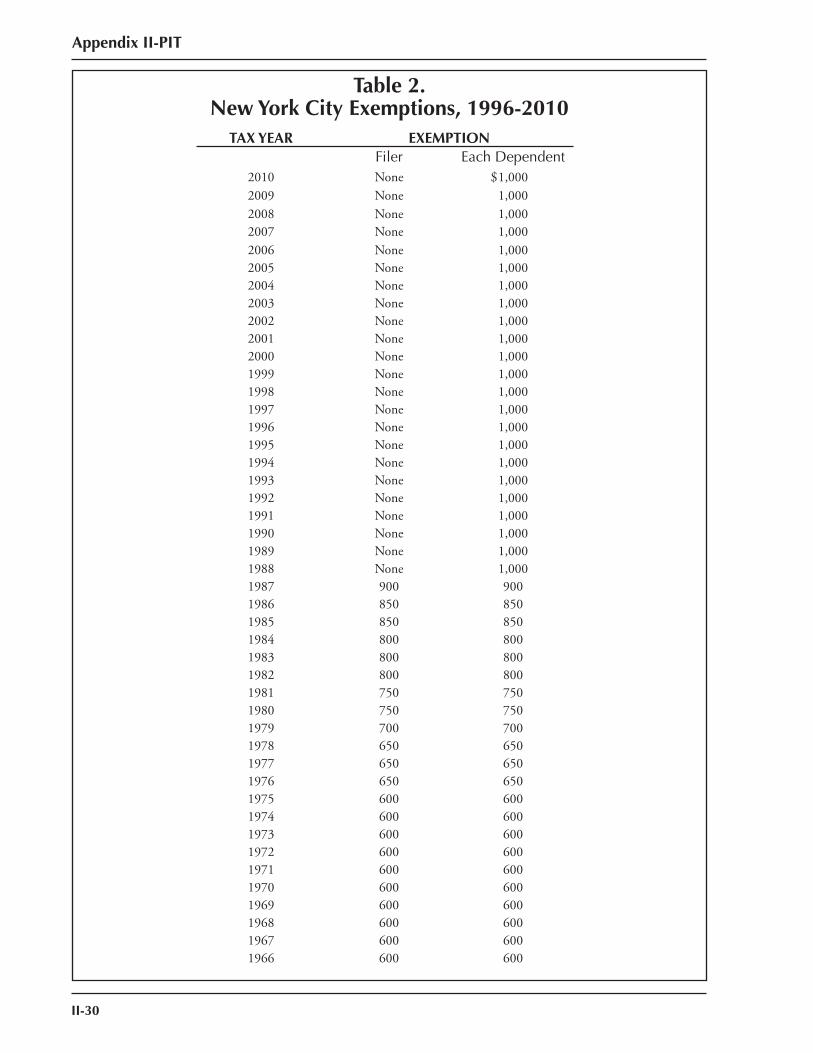
II-30
Appendix II-PIT
Table 2.New York City Exemptions, 1996-2010
TAX YEAR EXEMPTIONFiler Each Dependent
2010 None 1,0002009 None 1,000 2008 None 1,000 2007 None 1,0002006 None 1,0002005 None 1,0002004 None 1,0002003 None 1,0002002 None 1,0002001 None 1,0002000 None 1,0001999 None 1,0001998 None 1,0001997 None 1,0001996 None 1,0001995 None 1,0001994 None 1,0001993 None 1,0001992 None 1,0001991 None 1,0001990 None 1,0001989 None 1,0001988 None 1,0001987 900 9001986 850 8501985 850 8501984 800 8001983 800 8001982 800 8001981 750 7501980 750 7501979 700 7001978 650 6501977 650 6501976 650 6501975 600 6001974 600 6001973 600 6001972 600 6001971 600 6001970 600 6001969 600 6001968 600 6001967 600 6001966 600 600
$
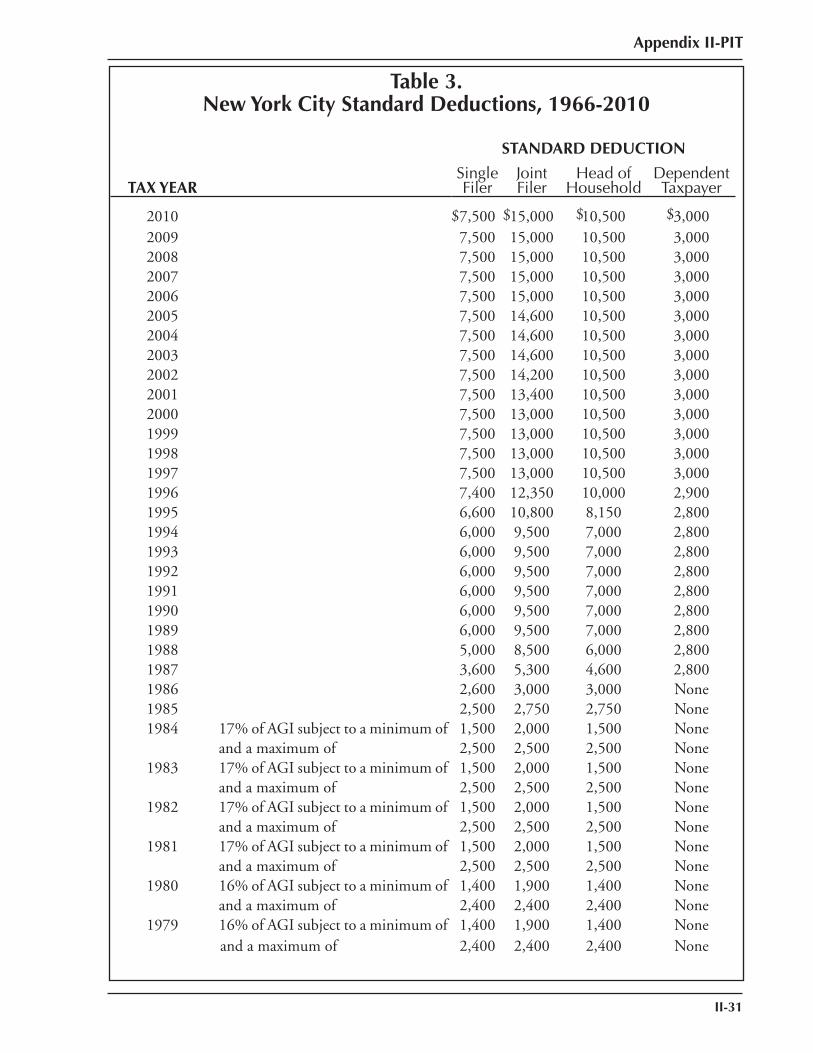
Appendix II-PIT
II-31
Table 3.New York City Standard Deductions, 1966-2010
STANDARD DEDUCTION
Single Filer
JointFiler
Head ofHousehold
DependentTaxpayerTAX YEAR
2010 7,500 15,000 10,500 3,000 2009 7,500 15,000 10,500 3,0002008 7,500 15,000 10,500 3,0002007 7,500 15,000 10,500 3,0002006 7,500 15,000 10,500 3,0002005 7,500 14,600 10,500 3,0002004 7,500 14,600 10,500 3,0002003 7,500 14,600 10,500 3,0002002 7,500 14,200 10,500 3,0002001 7,500 13,400 10,500 3,0002000 7,500 13,000 10,500 3,0001999 7,500 13,000 10,500 3,0001998 7,500 13,000 10,500 3,0001997 7,500 13,000 10,500 3,0001996 7,400 12,350 10,000 2,9001995 6,600 10,800 8,150 2,8001994 6,000 9,500 7,000 2,8001993 6,000 9,500 7,000 2,8001992 6,000 9,500 7,000 2,8001991 6,000 9,500 7,000 2,8001990 6,000 9,500 7,000 2,8001989 6,000 9,500 7,000 2,8001988 5,000 8,500 6,000 2,8001987 3,600 5,300 4,600 2,8001986 2,600 3,000 3,000 None1985 2,500 2,750 2,750 None1984 17% of AGI subject to a minimum of 1,500 2,000 1,500 None
and a maximum of 2,500 2,500 2,500 None1983 17% of AGI subject to a minimum of 1,500 2,000 1,500 None
and a maximum of 2,500 2,500 2,500 None1982 17% of AGI subject to a minimum of 1,500 2,000 1,500 None
and a maximum of 2,500 2,500 2,500 None1981 17% of AGI subject to a minimum of 1,500 2,000 1,500 None
and a maximum of 2,500 2,500 2,500 None1980 16% of AGI subject to a minimum of 1,400 1,900 1,400 None
and a maximum of 2,400 2,400 2,400 None1979 16% of AGI subject to a minimum of 1,400 1,900 1,400 None
and a maximum of 2,400 2,400 2,400 None
$ $ $ $
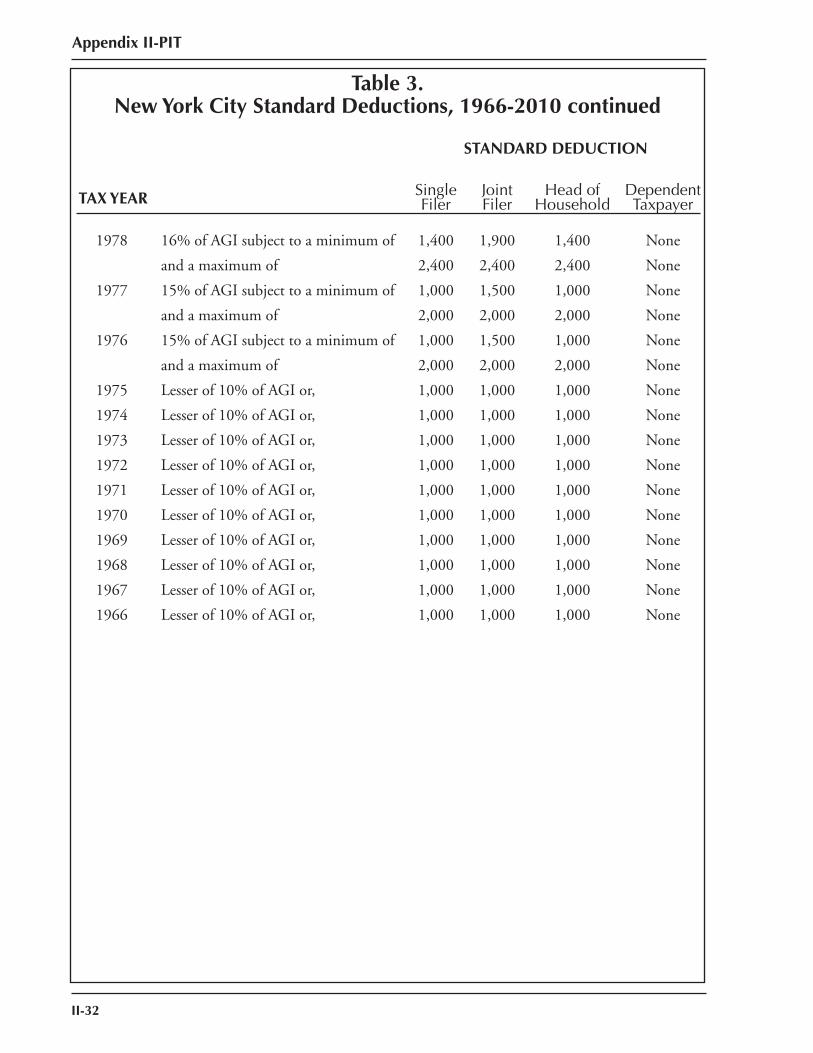
II-32
Appendix II-PIT
Table 3.New York City Standard Deductions, 1966-2010 continued
STANDARD DEDUCTION
Single Filer
JointFiler
Head ofHousehold
DependentTaxpayerTAX YEAR
1978 16% of AGI subject to a minimum of 1,400 1,900 1,400 None
and a maximum of 2,400 2,400 2,400 None
1977 15% of AGI subject to a minimum of 1,000 1,500 1,000 None
and a maximum of 2,000 2,000 2,000 None
1976 15% of AGI subject to a minimum of 1,000 1,500 1,000 None
and a maximum of 2,000 2,000 2,000 None
1975 Lesser of 10% of AGI or, 1,000 1,000 1,000 None
1974 Lesser of 10% of AGI or, 1,000 1,000 1,000 None
1973 Lesser of 10% of AGI or, 1,000 1,000 1,000 None
1972 Lesser of 10% of AGI or, 1,000 1,000 1,000 None
1971 Lesser of 10% of AGI or, 1,000 1,000 1,000 None
1970 Lesser of 10% of AGI or, 1,000 1,000 1,000 None
1969 Lesser of 10% of AGI or, 1,000 1,000 1,000 None
1968 Lesser of 10% of AGI or, 1,000 1,000 1,000 None
1967 Lesser of 10% of AGI or, 1,000 1,000 1,000 None
1966 Lesser of 10% of AGI or, 1,000 1,000 1,000 None
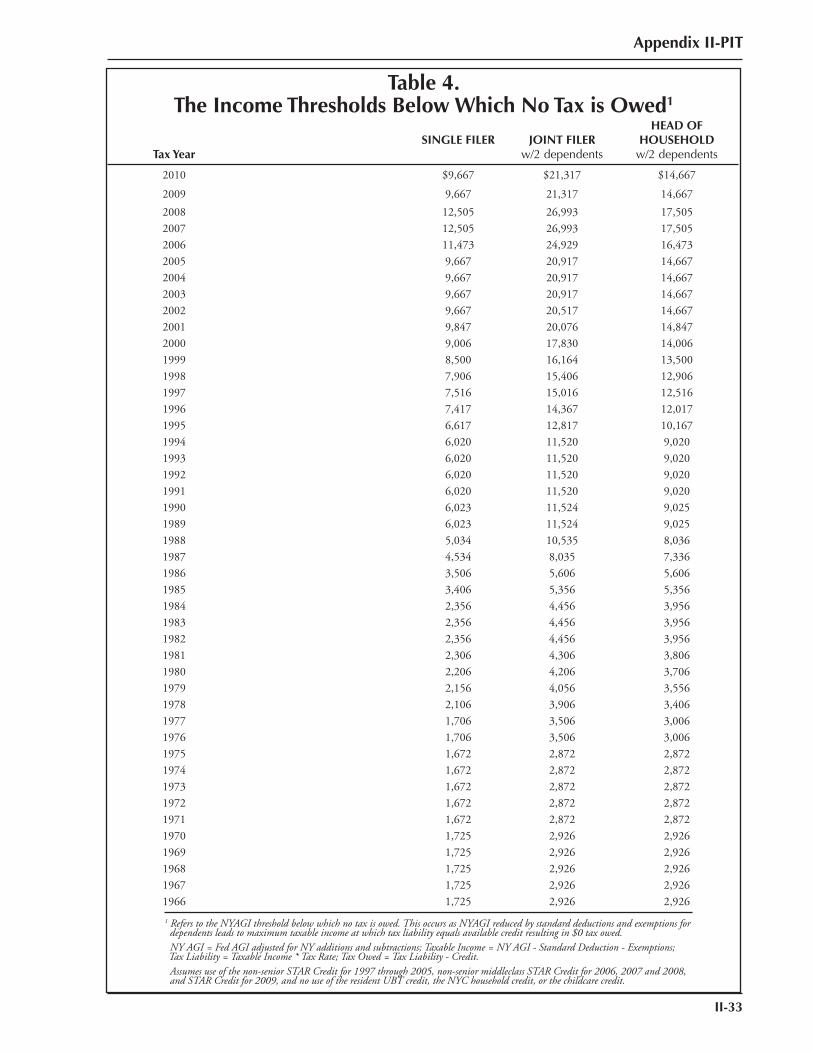
Appendix II-PIT
II-33
Table 4.The Income Thresholds Below Which No Tax is Owed1
Tax YearSINGLE FILER JOINT FILER
w/2 dependents
HEAD OF HOUSEHOLD
w/2 dependents
2010 $9,667 $21,317 $14,667
2009 9,667 21,317 14,6672008 12,505 26,993 17,5052007 12,505 26,993 17,5052006 11,473 24,929 16,4732005 9,667 20,917 14,6672004 9,667 20,917 14,6672003 9,667 20,917 14,6672002 9,667 20,517 14,6672001 9,847 20,076 14,8472000 9,006 17,830 14,0061999 8,500 16,164 13,5001998 7,906 15,406 12,9061997 7,516 15,016 12,5161996 7,417 14,367 12,0171995 6,617 12,817 10,1671994 6,020 11,520 9,0201993 6,020 11,520 9,0201992 6,020 11,520 9,0201991 6,020 11,520 9,0201990 6,023 11,524 9,0251989 6,023 11,524 9,0251988 5,034 10,535 8,0361987 4,534 8,035 7,3361986 3,506 5,606 5,6061985 3,406 5,356 5,3561984 2,356 4,456 3,9561983 2,356 4,456 3,9561982 2,356 4,456 3,9561981 2,306 4,306 3,8061980 2,206 4,206 3,7061979 2,156 4,056 3,5561978 2,106 3,906 3,4061977 1,706 3,506 3,0061976 1,706 3,506 3,0061975 1,672 2,872 2,8721974 1,672 2,872 2,8721973 1,672 2,872 2,8721972 1,672 2,872 2,8721971 1,672 2,872 2,8721970 1,725 2,926 2,9261969 1,725 2,926 2,9261968 1,725 2,926 2,9261967 1,725 2,926 2,9261966 1,725 2,926 2,9261 Refers to the NYAGI threshold below which no tax is owed. This occurs as NYAGI reduced by standard deductions and exemptions for dependents leads to maximum taxable income at which tax liability equals available credit resulting in $0 tax owed. NY AGI = Fed AGI adjusted for NY additions and subtractions; Taxable Income = NY AGI - Standard Deduction - Exemptions; Tax Liability = Taxable Income * Tax Rate; Tax Owed = Tax Liability - Credit. Assumes use of the non-senior STAR Credit for 1997 through 2005, non-senior middleclass STAR Credit for 2006, 2007 and 2008, and STAR Credit for 2009, and no use of the resident UBT credit, the NYC household credit, or the childcare credit.
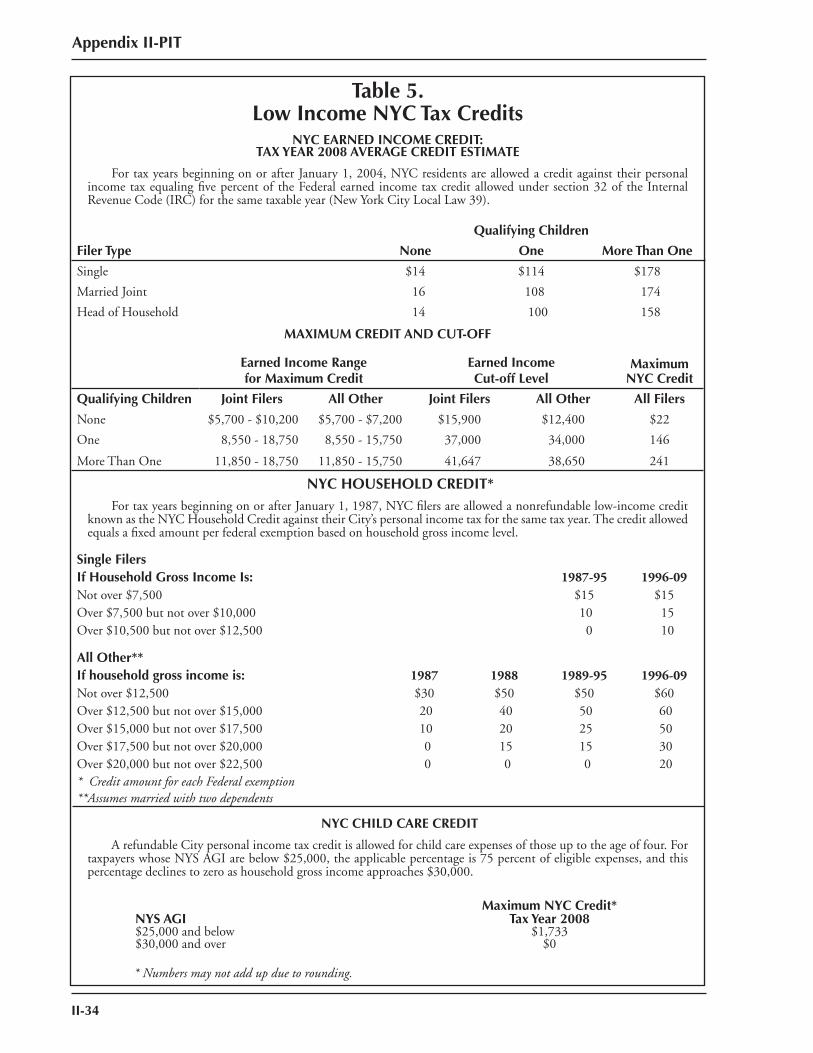
II-34
Appendix II-PIT
Table 5.Low Income NYC Tax Credits
NYC EARNED INCOME CREDIT: TAX YEAR 2008 AVERAGE CREDIT ESTIMATE
For tax years beginning on or after January 1, 2004, NYC residents are allowed a credit against their personal income tax equaling fi ve percent of the Federal earned income tax credit allowed under section 32 of the Internal Revenue Code (IRC) for the same taxable year (New York City Local Law 39).
MAXIMUM CREDIT AND CUT-OFF
NYC HOUSEHOLD CREDIT*For tax years beginning on or after January 1, 1987, NYC fi lers are allowed a nonrefundable low-income credit
known as the NYC Household Credit against their City’s personal income tax for the same tax year. The credit allowed equals a fi xed amount per federal exemption based on household gross income level.
NYC CHILD CARE CREDIT
A refundable City personal income tax credit is allowed for child care expenses of those up to the age of four. For taxpayers whose NYS AGI are below $25,000, the applicable percentage is 75 percent of eligible expenses, and this percentage declines to zero as household gross income approaches $30,000.
Qualifying Children
Filer Type None One More Than One
Single $14 $114 $178
Married Joint 16 108 174
Head of Household 14 100 158
Earned Income Rangefor Maximum Credit
Earned IncomeCut-off Level
Maximum NYC Credit
Qualifying Children Joint Filers All Other Joint Filers All Other All Filers
None $5,700 - $10,200 $5,700 - $7,200 $15,900 $12,400 $22
One 8,550 - 18,750 8,550 - 15,750 37,000 34,000 146
More Than One 11,850 - 18,750 11,850 - 15,750 41,647 38,650 241
Single FilersIf Household Gross Income Is: 1987-95 1996-09Not over $7,500 $15 $15 Over $7,500 but not over $10,000 10 15Over $10,500 but not over $12,500 0 10
All Other**If household gross income is: 1987 1988 1989-95 1996-09Not over $12,500 $30 $50 $50 $60 Over $12,500 but not over $15,000 20 40 50 60Over $15,000 but not over $17,500 10 20 25 50Over $17,500 but not over $20,000 0 15 15 30Over $20,000 but not over $22,500 0 0 0 20* Credit amount for each Federal exemption**Assumes married with two dependents
Maximum NYC Credit* NYS AGI Tax Year 2008 $25,000 and below $1,733 $30,000 and over $0
* Numbers may not add up due to rounding.
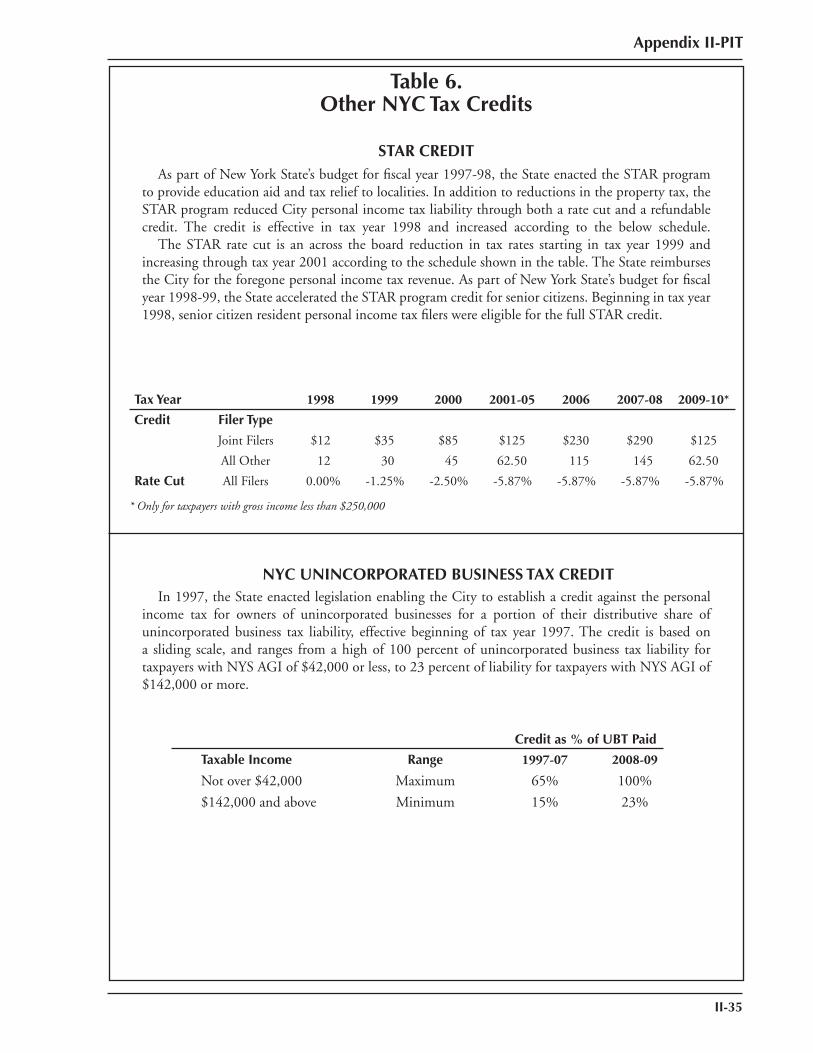
Appendix II-PIT
II-35
Table 6.Other NYC Tax Credits
STAR CREDIT As part of New York State’s budget for fi scal year 1997-98, the State enacted the STAR program to provide education aid and tax relief to localities. In addition to reductions in the property tax, the STAR program reduced City personal income tax liability through both a rate cut and a refundable credit. The credit is effective in tax year 1998 and increased according to the below schedule. The STAR rate cut is an across the board reduction in tax rates starting in tax year 1999 and increasing through tax year 2001 according to the schedule shown in the table. The State reimburses the City for the foregone personal income tax revenue. As part of New York State’s budget for fi scal year 1998-99, the State accelerated the STAR program credit for senior citizens. Beginning in tax year 1998, senior citizen resident personal income tax fi lers were eligible for the full STAR credit.
NYC UNINCORPORATED BUSINESS TAX CREDIT In 1997, the State enacted legislation enabling the City to establish a credit against the personal income tax for owners of unincorporated businesses for a portion of their distributive share of unincorporated business tax liability, effective beginning of tax year 1997. The credit is based on a sliding scale, and ranges from a high of 100 percent of unincorporated business tax liability for taxpayers with NYS AGI of $42,000 or less, to 23 percent of liability for taxpayers with NYS AGI of $142,000 or more.
Tax Year 1998 1999 2000 2001-05 2006 2007-08 2009-10*
Credit Filer Type
Joint Filers $12 $35 $85 $125 $230 $290 $125
All Other 12 30 45 62.50 115 145 62.50
Rate Cut All Filers 0.00% -1.25% -2.50% -5.87% -5.87% -5.87% -5.87%
* Only for taxpayers with gross income less than $250,000
Credit as % of UBT Paid
Taxable Income Range 1997-07 2008-09
Not over $42,000 Maximum 65% 100%
$142,000 and above Minimum 15% 23%
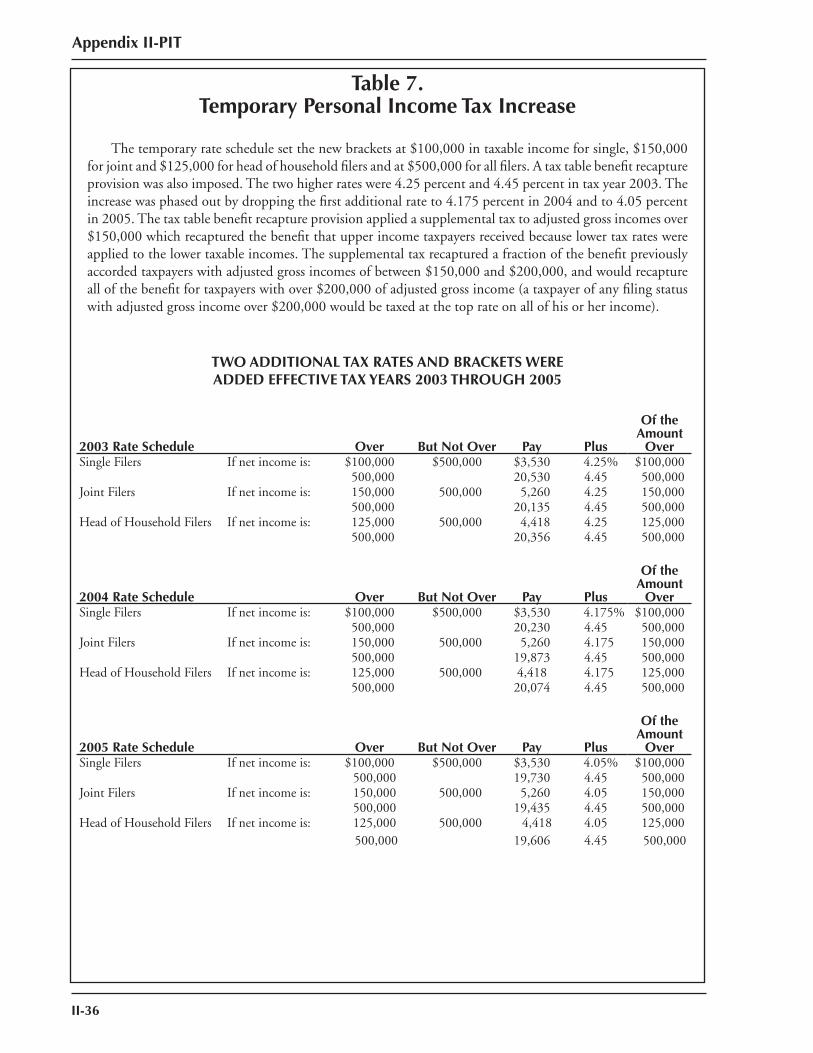
II-36
Appendix II-PIT
Table 7.Temporary Personal Income Tax Increase
The temporary rate schedule set the new brackets at $100,000 in taxable income for single, $150,000 for joint and $125,000 for head of household fi lers and at $500,000 for all fi lers. A tax table benefi t recapture provision was also imposed. The two higher rates were 4.25 percent and 4.45 percent in tax year 2003. The increase was phased out by dropping the fi rst additional rate to 4.175 percent in 2004 and to 4.05 percent in 2005. The tax table benefi t recapture provision applied a supplemental tax to adjusted gross incomes over $150,000 which recaptured the benefi t that upper income taxpayers received because lower tax rates were applied to the lower taxable incomes. The supplemental tax recaptured a fraction of the benefi t previously accorded taxpayers with adjusted gross incomes of between $150,000 and $200,000, and would recapture all of the benefi t for taxpayers with over $200,000 of adjusted gross income (a taxpayer of any fi ling status with adjusted gross income over $200,000 would be taxed at the top rate on all of his or her income).
TWO ADDITIONAL TAX RATES AND BRACKETS WERE ADDED EFFECTIVE TAX YEARS 2003 THROUGH 2005
Of the Amount
Over2003 Rate Schedule Over But Not Over Pay PlusSingle Filers If net income is: $100,000 $500,000 $3,530 4.25% $100,000
500,000 20,530 4.45 500,000Joint Filers If net income is: 150,000 500,000 5,260 4.25 150,000
500,000 20,135 4.45 500,000Head of Household Filers If net income is: 125,000 500,000 4,418 4.25 125,000
500,000 20,356 4.45 500,000
Of the Amount
Over2004 Rate Schedule Over But Not Over Pay PlusSingle Filers If net income is: $100,000 $500,000 $3,530 4.175% $100,000
500,000 20,230 4.45 500,000Joint Filers If net income is: 150,000 500,000 5,260 4.175 150,000
500,000 19,873 4.45 500,000Head of Household Filers If net income is: 125,000 500,000 4,418 4.175 125,000
500,000 20,074 4.45 500,000
Of theAmount
Over2005 Rate Schedule Over But Not Over Pay PlusSingle Filers If net income is: $100,000 $500,000 $3,530 4.05% $100,000
500,000 19,730 4.45 500,000Joint Filers If net income is: 150,000 500,000 5,260 4.05 150,000
500,000 19,435 4.45 500,000Head of Household Filers If net income is: 125,000 500,000 4,418 4.05 125,000
500,000 19,606 4.45 500,000
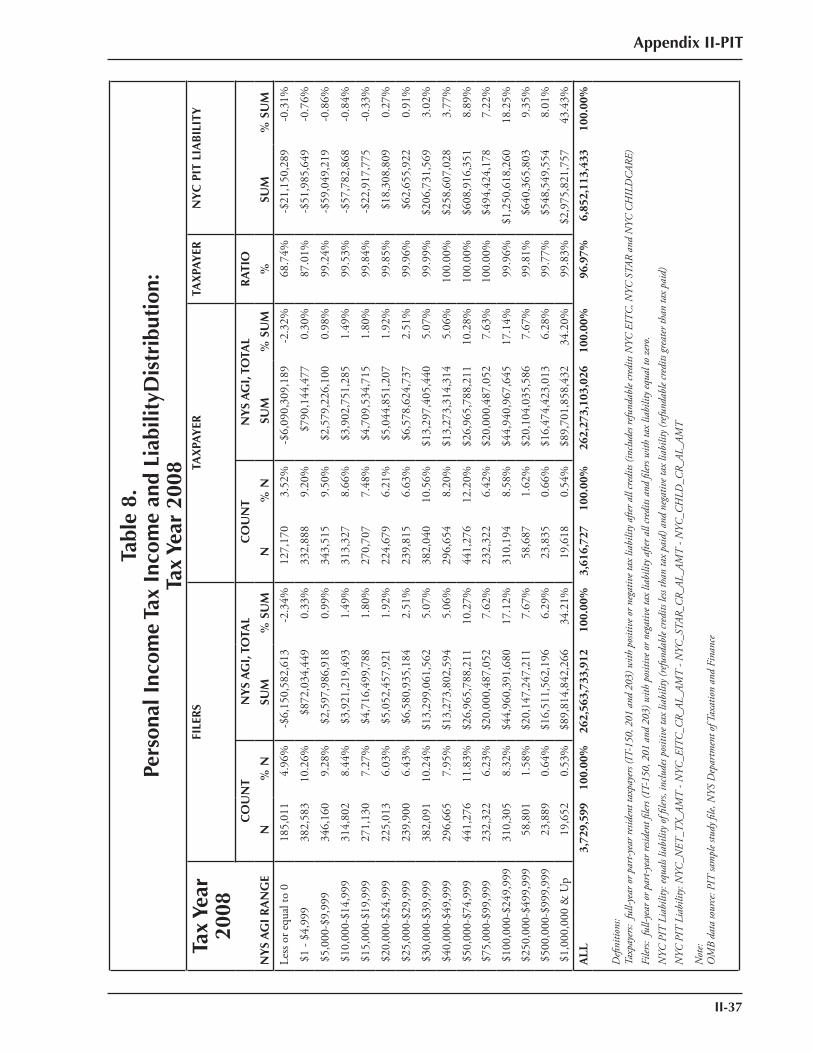
Appendix II-PIT
II-37
Tabl
e 8.
Pers
onal
Inc
ome
Tax
Inco
me
and
Liab
ility
Dis
trib
utio
n:Ta
x Ye
ar 2
008
Tax
Year
20
08FI
LER
STA
XPA
YER
TAX
PAY
ERN
YC
PIT
LIA
BIL
ITY
CO
UN
TN
YS
AG
I, T
OTA
LC
OU
NT
NY
S A
GI,
TO
TAL
RA
TIO
NY
S A
GI
RA
NG
EN
% N
SUM
% S
UM
N%
NSU
M%
SU
M%
SUM
% S
UM
Less
or e
qual
to 0
185,
011
4.96
%-$
6,15
0,58
2,61
3-2
.34%
127,
170
3.52
%-$
6,09
0,30
9,18
9-2
.32%
68.7
4%-$
21,1
50,2
89-0
.31%
$1
- $4,
999
382,
583
10.2
6%$8
72,0
34,4
490.
33%
332,
888
9.20
%$7
90,1
44,4
770.
30%
87.0
1%-$
51,9
85,6
49-0
.76%
$5,
000-
$9,9
99
346,
160
9.28
%$2
,597
,986
,918
0.99
%34
3,51
59.
50%
$2,5
79,2
26,1
000.
98%
99.2
4%-$
59,0
49,2
19-0
.86%
$10
,000
-$14
,999
31
4,80
28.
44%
$3,9
21,2
19,4
931.
49%
313,
327
8.66
%$3
,902
,751
,285
1.49
%99
.53%
-$57
,782
,868
-0.8
4%
$15
,000
-$19
,999
27
1,13
07.
27%
$4,7
16,4
99,7
881.
80%
270,
707
7.48
%$4
,709
,534
,715
1.80
%99
.84%
-$22
,917
,775
-0.3
3%
$20
,000
-$24
,999
22
5,01
36.
03%
$5,0
52,4
57,9
211.
92%
224,
679
6.21
%$5
,044
,851
,207
1.92
%99
.85%
$18,
308,
809
0.27
%
$25
,000
-$29
,999
23
9,90
06.
43%
$6,5
80,9
35,1
842.
51%
239,
815
6.63
%$6
,578
,624
,737
2.51
%99
.96%
$62,
655,
922
0.91
%
$30
,000
-$39
,999
38
2,09
110
.24%
$13,
299,
061,
562
5.07
%38
2,04
010
.56%
$13,
297,
405,
440
5.07
%99
.99%
$206
,731
,569
3.02
%
$40
,000
-$49
,999
29
6,66
57.
95%
$13,
273,
802,
594
5.06
%29
6,65
48.
20%
$13,
273,
314,
314
5.06
%10
0.00
%$2
58,6
07,0
283.
77%
$50
,000
-$74
,999
44
1,27
611
.83%
$26,
965,
788,
211
10.2
7%44
1,27
612
.20%
$26,
965,
788,
211
10.2
8%10
0.00
%$6
08,9
16,3
518.
89%
$75
,000
-$99
,999
23
2,32
26.
23%
$20,
000,
487,
052
7.62
%23
2,32
26.
42%
$20,
000,
487,
052
7.63
%10
0.00
%$4
94,4
24,1
787.
22%
$10
0,00
0-$2
49,9
99
310,
305
8.32
%$4
4,96
0,39
1,68
017
.12%
310,
194
8.58
%$4
4,94
0,96
7,64
517
.14%
99.9
6%$1
,250
,618
,260
18.2
5%
$25
0,00
0-$4
99,9
99
58,8
011.
58%
$20,
147,
247,
211
7.67
%58
,687
1.62
%$2
0,10
4,03
5,58
67.
67%
99.8
1%$6
40,3
65,8
039.
35%
$50
0,00
0-$9
99,9
99
23,8
890.
64%
$16,
511,
562,
196
6.29
%23
,835
0.66
%$1
6,47
4,42
3,01
36.
28%
99.7
7%$5
48,5
49,5
548.
01%
$1,
000,
000
& U
p 19
,652
0.53
%$8
9,81
4,84
2,26
634
.21%
19,6
180.
54%
$89,
701,
858,
432
34.2
0%99
.83%
$2,9
75,8
21,7
5743
.43%
ALL
3,72
9,59
910
0.00
%26
2,56
3,73
3,91
210
0.00
%3,
616,
727
100.
00%
262,
273,
103,
026
100.
00%
96.9
7%6,
852,
113,
433
100.
00%
Defi
nitio
ns:
Taxp
ayer
s: fu
ll-ye
ar o
r par
t-yea
r resi
dent
taxp
ayer
s (IT
-150
, 201
and
203
) with
pos
itive
or n
egat
ive t
ax li
abili
ty a
fter a
ll cr
edits
(inc
lude
s refu
ndab
le cr
edits
NYC
EIT
C, N
YC S
TAR
and
NYC
CH
ILD
CAR
E)
Filer
s: fu
ll-ye
ar o
r par
t-yea
r resi
dent
fi ler
s (IT
-150
, 201
and
203
) with
pos
itive
or n
egat
ive t
ax li
abili
ty a
fter a
ll cr
edits
and
fi ler
s with
tax
liabi
lity e
qual
to z
ero.
NYC
PIT
Lia
bilit
y: eq
uals
liabi
lity o
f fi le
rs, in
clude
s pos
itive
tax
liabi
lity (
refu
ndab
le cr
edits
less
than
tax
paid
) and
neg
ativ
e tax
liab
ility
(refu
ndab
le cr
edits
gre
ater
than
tax
paid
)
NYC
PIT
Lia
bilit
y: N
YC_N
ET_T
X_AM
T -
NYC
_EIT
C_C
R_AL
_AM
T -
NYC
_STA
R_C
R_AL
_AM
T -
NYC
_CH
LD_C
R_AL
_AM
T
Not
e: O
MB
data
sour
ce: P
IT sa
mpl
e stu
dy fi
le, N
YS D
epar
tmen
t of T
axat
ion
and
Fina
nce

II-38
Appendix II-PIT
Appendix II-PIT
II-39
APPENDIX IIPERSONAL INCOME TAX
4.New York City
Withholding Table Changes1980–2011

Appendix II-PIT
II-40
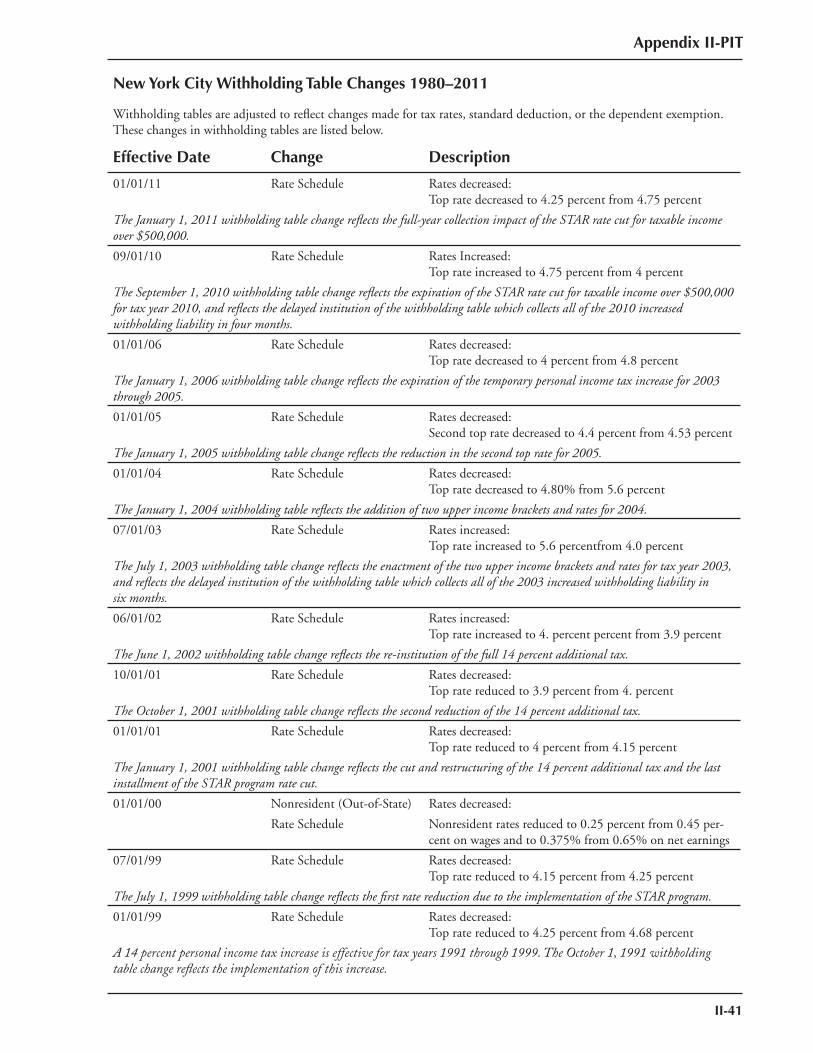
Appendix II-PIT
II-41
New York City Withholding Table Changes 1980–2011
Withholding tables are adjusted to refl ect changes made for tax rates, standard deduction, or the dependent exemption.These changes in withholding tables are listed below.
Effective Date Change Description
01/01/11 Rate Schedule Rates decreased: Top rate decreased to 4.25 percent from 4.75 percent
The January 1, 2011 withholding table change refl ects the full-year collection impact of the STAR rate cut for taxable income over $500,000.
09/01/10 Rate Schedule Rates Increased: Top rate increased to 4.75 percent from 4 percent
The September 1, 2010 withholding table change refl ects the expiration of the STAR rate cut for taxable income over $500,000 for tax year 2010, and refl ects the delayed institution of the withholding table which collects all of the 2010 increased withholding liability in four months.
01/01/06 Rate Schedule Rates decreased: Top rate decreased to 4 percent from 4.8 percent
The January 1, 2006 withholding table change refl ects the expiration of the temporary personal income tax increase for 2003 through 2005.
01/01/05 Rate Schedule Rates decreased: Second top rate decreased to 4.4 percent from 4.53 percent
The January 1, 2005 withholding table change refl ects the reduction in the second top rate for 2005.
01/01/04 Rate Schedule Rates decreased: Top rate decreased to 4.80% from 5.6 percent
The January 1, 2004 withholding table refl ects the addition of two upper income brackets and rates for 2004.
07/01/03 Rate Schedule Rates increased:Top rate increased to 5.6 percentfrom 4.0 percent
The July 1, 2003 withholding table change refl ects the enactment of the two upper income brackets and rates for tax year 2003, and refl ects the delayed institution of the withholding table which collects all of the 2003 increased withholding liability in six months.
06/01/02 Rate Schedule Rates increased: Top rate increased to 4. percent percent from 3.9 percent
The June 1, 2002 withholding table change refl ects the re-institution of the full 14 percent additional tax.
10/01/01 Rate Schedule Rates decreased: Top rate reduced to 3.9 percent from 4. percent
The October 1, 2001 withholding table change refl ects the second reduction of the 14 percent additional tax.
01/01/01 Rate Schedule Rates decreased:Top rate reduced to 4 percent from 4.15 percent
The January 1, 2001 withholding table change refl ects the cut and restructuring of the 14 percent additional tax and the last installment of the STAR program rate cut.
01/01/00 Nonresident (Out-of-State) Rates decreased:
Rate Schedule Nonresident rates reduced to 0.25 percent from 0.45 per-cent on wages and to 0.375% from 0.65% on net earnings
07/01/99 Rate Schedule Rates decreased:Top rate reduced to 4.15 percent from 4.25 percent
The July 1, 1999 withholding table change refl ects the fi rst rate reduction due to the implementation of the STAR program.
01/01/99 Rate Schedule Rates decreased:Top rate reduced to 4.25 percent from 4.68 percent
A 14 percent personal income tax increase is effective for tax years 1991 through 1999. The October 1, 1991 withholding table change refl ects the implementation of this increase.
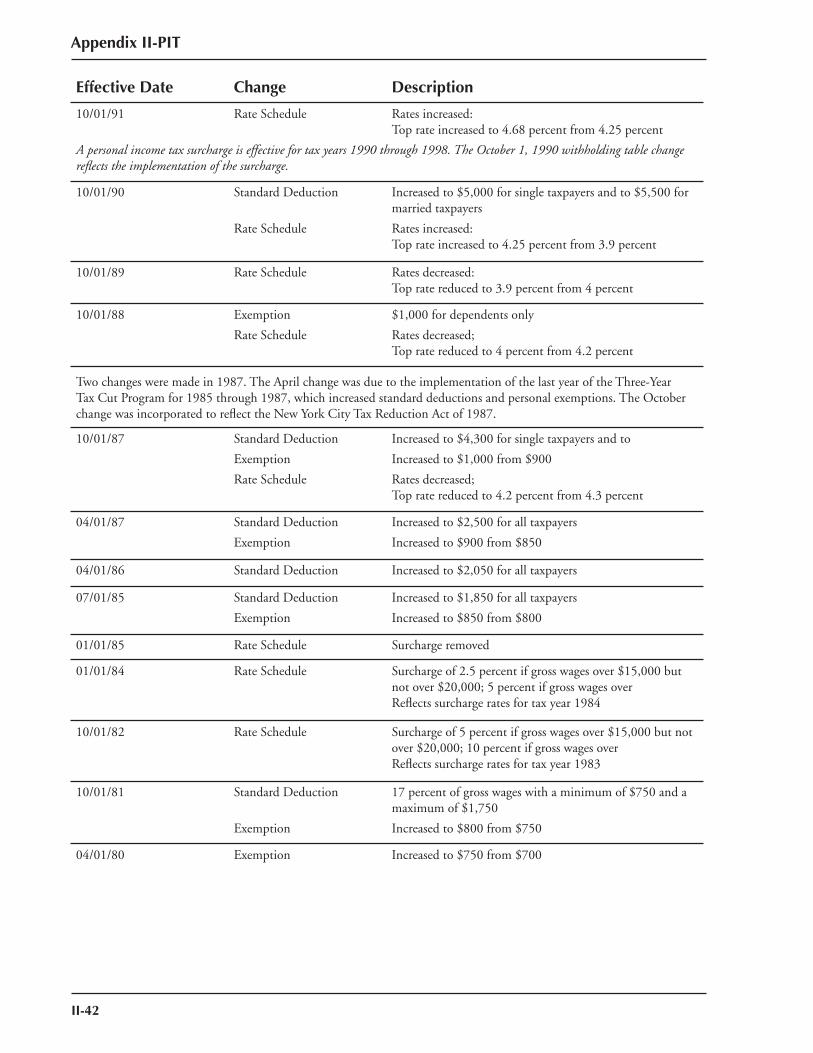
Appendix II-PIT
Effective Date Change Description
10/01/91 Rate Schedule Rates increased:Top rate increased to 4.68 percent from 4.25 percent
A personal income tax surcharge is effective for tax years 1990 through 1998. The October 1, 1990 withholding table change refl ects the implementation of the surcharge.
10/01/90 Standard Deduction Increased to $5,000 for single taxpayers and to $5,500 for married taxpayers
Rate Schedule Rates increased:Top rate increased to 4.25 percent from 3.9 percent
10/01/89 Rate Schedule Rates decreased:Top rate reduced to 3.9 percent from 4 percent
10/01/88 Exemption $1,000 for dependents only
Rate Schedule Rates decreased; Top rate reduced to 4 percent from 4.2 percent
Two changes were made in 1987. The April change was due to the implementation of the last year of the Three-Year Tax Cut Program for 1985 through 1987, which increased standard deductions and personal exemptions. The October change was incorporated to refl ect the New York City Tax Reduction Act of 1987.
10/01/87 Standard Deduction Increased to $4,300 for single taxpayers and to
Exemption Increased to $1,000 from $900
Rate Schedule Rates decreased; Top rate reduced to 4.2 percent from 4.3 percent
04/01/87 Standard Deduction Increased to $2,500 for all taxpayers
Exemption Increased to $900 from $850
04/01/86 Standard Deduction Increased to $2,050 for all taxpayers
07/01/85 Standard Deduction Increased to $1,850 for all taxpayers
Exemption Increased to $850 from $800
01/01/85 Rate Schedule Surcharge removed
01/01/84 Rate Schedule Surcharge of 2.5 percent if gross wages over $15,000 but not over $20,000; 5 percent if gross wages over Refl ects surcharge rates for tax year 1984
10/01/82 Rate Schedule Surcharge of 5 percent if gross wages over $15,000 but not over $20,000; 10 percent if gross wages over Refl ects surcharge rates for tax year 1983
10/01/81 Standard Deduction 17 percent of gross wages with a minimum of $750 and a maximum of $1,750
Exemption Increased to $800 from $750
04/01/80 Exemption Increased to $750 from $700
II-42

Appendix II-PIT
II-43
APPENDIX IIPERSONAL INCOME TAX
5.Legislative History

II-44
Appendix II-PIT
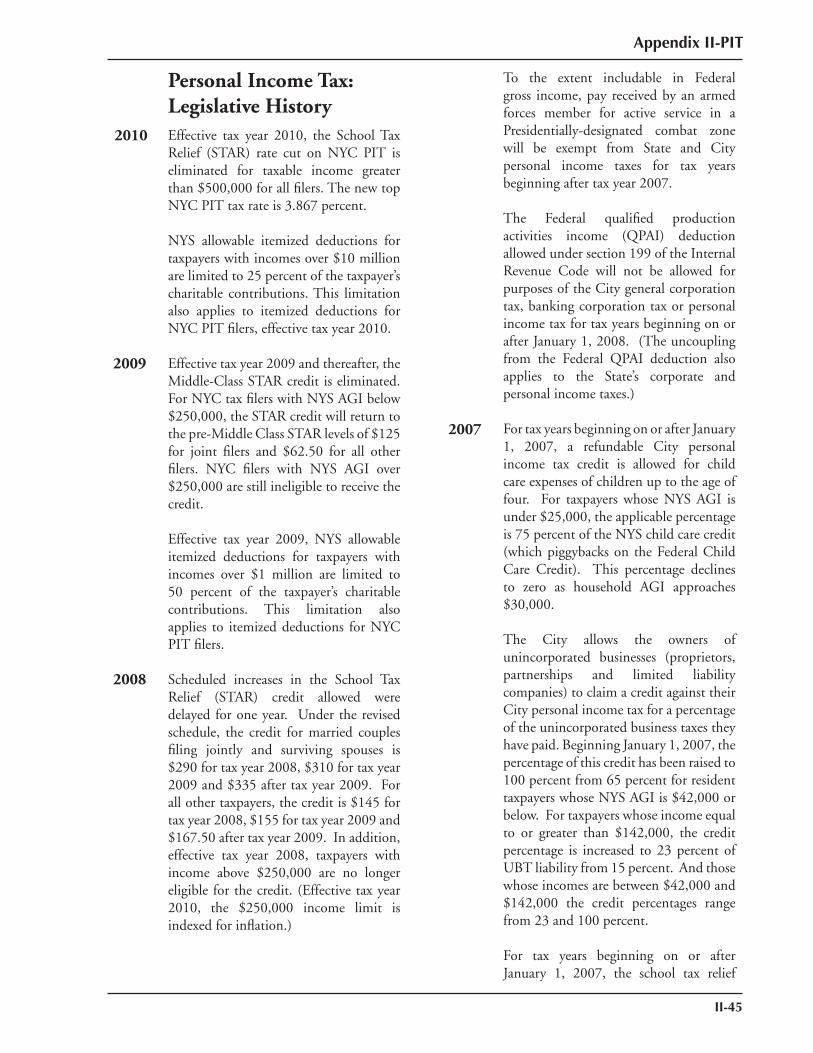
Appendix II-PIT
II-45
2009
2010
2007
2008
Personal Income Tax:Legislative HistoryEffective tax year 2010, the School Tax Relief (STAR) rate cut on NYC PIT is eliminated for taxable income greater than $500,000 for all fi lers. The new top NYC PIT tax rate is 3.867 percent.
NYS allowable itemized deductions for taxpayers with incomes over $10 million are limited to 25 percent of the taxpayer’s charitable contributions. This limitation also applies to itemized deductions for NYC PIT fi lers, effective tax year 2010.
Effective tax year 2009 and thereafter, the Middle-Class STAR credit is eliminated. For NYC tax fi lers with NYS AGI below $250,000, the STAR credit will return to the pre-Middle Class STAR levels of $125 for joint fi lers and $62.50 for all other fi lers. NYC fi lers with NYS AGI over $250,000 are still ineligible to receive the credit.
Effective tax year 2009, NYS allowable itemized deductions for taxpayers with incomes over $1 million are limited to 50 percent of the taxpayer’s charitable contributions. This limitation also applies to itemized deductions for NYC PIT fi lers.
Scheduled increases in the School Tax Relief (STAR) credit allowed were delayed for one year. Under the revised schedule, the credit for married couples filing jointly and surviving spouses is $290 for tax year 2008, $310 for tax year 2009 and $335 after tax year 2009. For all other taxpayers, the credit is $145 for tax year 2008, $155 for tax year 2009 and $167.50 after tax year 2009. In addition, effective tax year 2008, taxpayers with income above $250,000 are no longer eligible for the credit. (Effective tax year 2010, the $250,000 income limit is indexed for infl ation.)
To the extent includable in Federal gross income, pay received by an armed forces member for active service in a Presidentially-designated combat zone will be exempt from State and City personal income taxes for tax years beginning after tax year 2007.
The Federal qualified production activities income (QPAI) deduction allowed under section 199 of the Internal Revenue Code will not be allowed for purposes of the City general corporation tax, banking corporation tax or personal income tax for tax years beginning on or after January 1, 2008. (The uncoupling from the Federal QPAI deduction also applies to the State’s corporate and personal income taxes.)
For tax years beginning on or after January 1, 2007, a refundable City personal income tax credit is allowed for child care expenses of children up to the age of four. For taxpayers whose NYS AGI is under $25,000, the applicable percentage is 75 percent of the NYS child care credit (which piggybacks on the Federal Child Care Credit). This percentage declines to zero as household AGI approaches $30,000.
The City allows the owners of unincorporated businesses (proprietors, partnerships and limited liability companies) to claim a credit against their City personal income tax for a percentage of the unincorporated business taxes they have paid. Beginning January 1, 2007, the percentage of this credit has been raised to 100 percent from 65 percent for resident taxpayers whose NYS AGI is $42,000 or below. For taxpayers whose income equal to or greater than $142,000, the credit percentage is increased to 23 percent of UBT liability from 15 percent. And those whose incomes are between $42,000 and $142,000 the credit percentages range from 23 and 100 percent.
For tax years beginning on or after January 1, 2007, the school tax relief
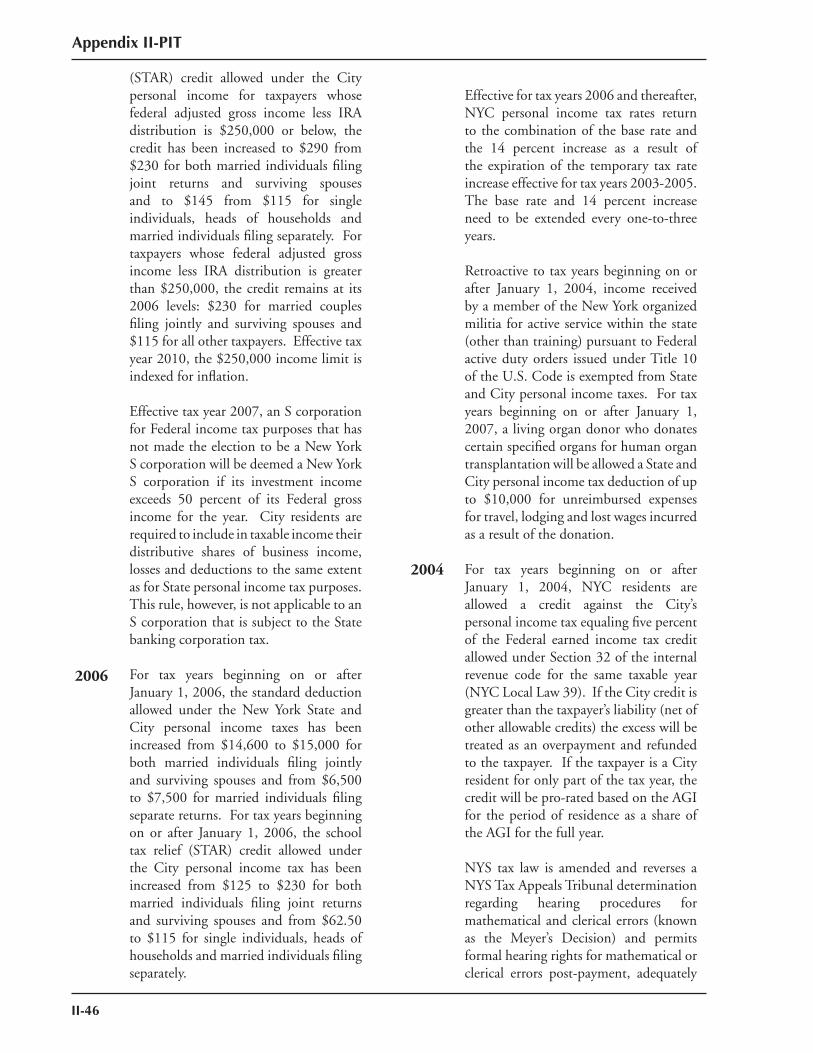
II-46
Appendix II-PIT
(STAR) credit allowed under the City personal income for taxpayers whose federal adjusted gross income less IRA distribution is $250,000 or below, the credit has been increased to $290 from $230 for both married individuals filing joint returns and surviving spouses and to $145 from $115 for single individuals, heads of households and married individuals filing separately. For taxpayers whose federal adjusted gross income less IRA distribution is greater than $250,000, the credit remains at its 2006 levels: $230 for married couples filing jointly and surviving spouses and $115 for all other taxpayers. Effective tax year 2010, the $250,000 income limit is indexed for inflation.
Effective tax year 2007, an S corporation for Federal income tax purposes that has not made the election to be a New York S corporation will be deemed a New York S corporation if its investment income exceeds 50 percent of its Federal gross income for the year. City residents are required to include in taxable income their distributive shares of business income, losses and deductions to the same extent as for State personal income tax purposes. This rule, however, is not applicable to an S corporation that is subject to the State banking corporation tax.
For tax years beginning on or after January 1, 2006, the standard deduction allowed under the New York State and City personal income taxes has been increased from $14,600 to $15,000 for both married individuals fi ling jointly and surviving spouses and from $6,500 to $7,500 for married individuals fi ling separate returns. For tax years beginning on or after January 1, 2006, the school tax relief (STAR) credit allowed under the City personal income tax has been increased from $125 to $230 for both married individuals filing joint returns and surviving spouses and from $62.50 to $115 for single individuals, heads of households and married individuals fi ling separately.
Effective for tax years 2006 and thereafter, NYC personal income tax rates return to the combination of the base rate and the 14 percent increase as a result of the expiration of the temporary tax rate increase effective for tax years 2003-2005. The base rate and 14 percent increase need to be extended every one-to-three years.
Retroactive to tax years beginning on or after January 1, 2004, income received by a member of the New York organized militia for active service within the state (other than training) pursuant to Federal active duty orders issued under Title 10 of the U.S. Code is exempted from State and City personal income taxes. For tax years beginning on or after January 1, 2007, a living organ donor who donates certain specified organs for human organ transplantation will be allowed a State and City personal income tax deduction of up to $10,000 for unreimbursed expenses for travel, lodging and lost wages incurred as a result of the donation.
For tax years beginning on or after January 1, 2004, NYC residents are allowed a credit against the City’s personal income tax equaling five percent of the Federal earned income tax credit allowed under Section 32 of the internal revenue code for the same taxable year (NYC Local Law 39). If the City credit is greater than the taxpayer’s liability (net of other allowable credits) the excess will be treated as an overpayment and refunded to the taxpayer. If the taxpayer is a City resident for only part of the tax year, the credit will be pro-rated based on the AGI for the period of residence as a share of the AGI for the full year.
NYS tax law is amended and reverses a NYS Tax Appeals Tribunal determination regarding hearing procedures for mathematical and clerical errors (known as the Meyer’s Decision) and permits formal hearing rights for mathematical or clerical errors post-payment, adequately
2006
2004
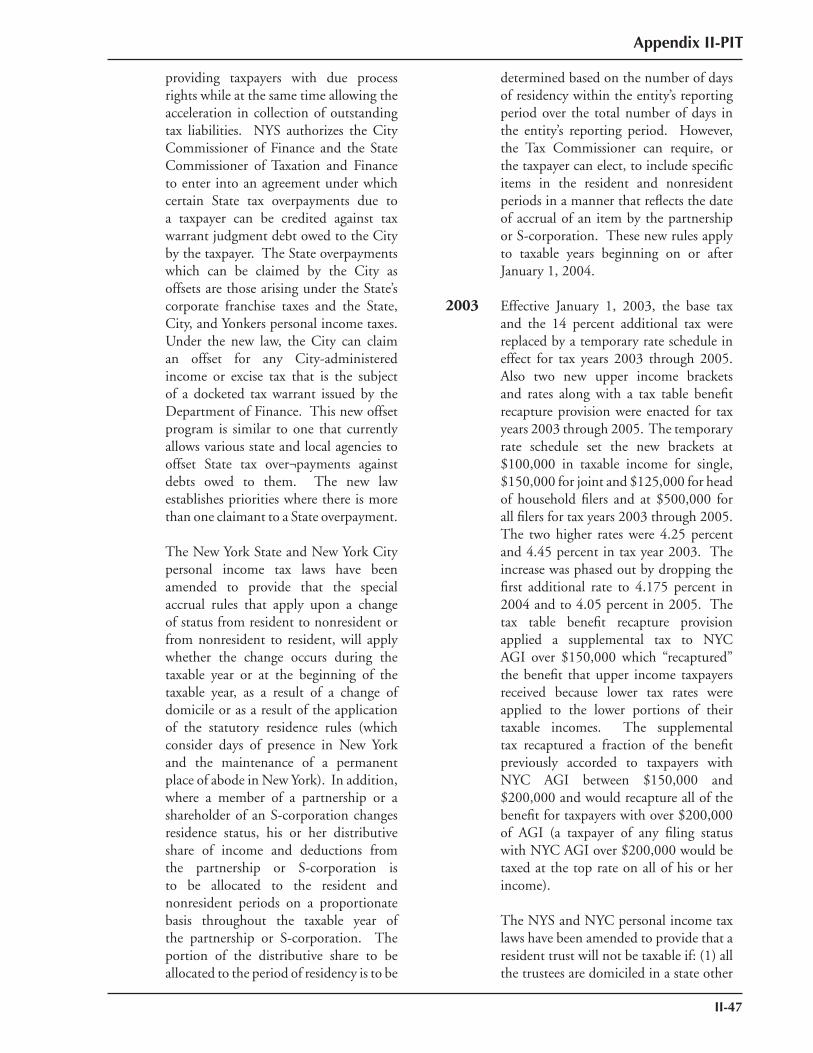
Appendix II-PIT
II-47
providing taxpayers with due process rights while at the same time allowing the acceleration in collection of outstanding tax liabilities. NYS authorizes the City Commissioner of Finance and the State Commissioner of Taxation and Finance to enter into an agreement under which certain State tax overpayments due to a taxpayer can be credited against tax warrant judgment debt owed to the City by the taxpayer. The State overpayments which can be claimed by the City as offsets are those arising under the State’s corporate franchise taxes and the State, City, and Yonkers personal income taxes. Under the new law, the City can claim an offset for any City-administered income or excise tax that is the subject of a docketed tax warrant issued by the Department of Finance. This new offset program is similar to one that currently allows various state and local agencies to offset State tax over¬payments against debts owed to them. The new law establishes priorities where there is more than one claimant to a State overpayment. The New York State and New York City personal income tax laws have been amended to provide that the special accrual rules that apply upon a change of status from resident to nonresident or from nonresident to resident, will apply whether the change occurs during the taxable year or at the beginning of the taxable year, as a result of a change of domicile or as a result of the application of the statutory residence rules (which consider days of presence in New York and the maintenance of a permanent place of abode in New York). In addition, where a member of a partnership or a shareholder of an S-corporation changes residence status, his or her distributive share of income and deductions from the partnership or S-corporation is to be allocated to the resident and nonresident periods on a proportionate basis throughout the taxable year of the partnership or S-corporation. The portion of the distributive share to be allocated to the period of residency is to be
determined based on the number of days of residency within the entity’s reporting period over the total number of days in the entity’s reporting period. However, the Tax Commissioner can require, or the taxpayer can elect, to include specific items in the resident and nonresident periods in a manner that reflects the date of accrual of an item by the partnership or S-corporation. These new rules apply to taxable years beginning on or after January 1, 2004.
Effective January 1, 2003, the base tax and the 14 percent additional tax were replaced by a temporary rate schedule in effect for tax years 2003 through 2005. Also two new upper income brackets and rates along with a tax table benefit recapture provision were enacted for tax years 2003 through 2005. The temporary rate schedule set the new brackets at $100,000 in taxable income for single, $150,000 for joint and $125,000 for head of household filers and at $500,000 for all filers for tax years 2003 through 2005. The two higher rates were 4.25 percent and 4.45 percent in tax year 2003. The increase was phased out by dropping the first additional rate to 4.175 percent in 2004 and to 4.05 percent in 2005. The tax table benefit recapture provision applied a supplemental tax to NYC AGI over $150,000 which “recaptured” the benefit that upper income taxpayers received because lower tax rates were applied to the lower portions of their taxable incomes. The supplemental tax recaptured a fraction of the benefit previously accorded to taxpayers with NYC AGI between $150,000 and $200,000 and would recapture all of the benefit for taxpayers with over $200,000 of AGI (a taxpayer of any filing status with NYC AGI over $200,000 would be taxed at the top rate on all of his or her income).
The NYS and NYC personal income tax laws have been amended to provide that a resident trust will not be taxable if: (1) all the trustees are domiciled in a state other
2003
II-48
Appendix II-PIT
than New York; (2) the entire corpus of the trust is located outside NYS; and (3) all income and gains of the trust are from sources outside NYS.
The Federal deduction under Internal Revenue Section 179 for a Sport Utility Vehicle weighing over 6,000 lbs. is not allowed (except for eligible farmers) for NYS and City tax purposes effective for tax years 2003 and thereafter.
Certain Federal bonus depreciation provisions enacted in tax years 2002 and 2003 will not apply for NYS and City personal income tax purposes, except with respect to property located in Manhattan below Houston Street.
Tax relief for the victims of the September 11, 2001 terrorist attack was provided under NYS Tax Law as part of Chapter 85 of the Laws of 2002. For tax year 2000 and after, NYS forgave the NYS, NYC and Yonkers income tax liabilities of decedents who died as a result of the attack. Income tax was forgiven for these decedents whether they were killed in the attack or rescue or recovery operations. Any forgiven tax liability owed but not paid was not required to be paid. Any forgiven tax liability that had already been paid was refunded. This tax relief is estimated to have reduced revenues by $7 million in City fiscal year 2003.
State legislation granted the City the local authority to lower by local law the 14 percent additional tax, effective July 24, 2000. Subsequently, the 14 percent additional tax was reduced, effective January 1, 2001. The reduction in the additional tax was structured as follows: for taxable income below the top tax bracket for each filing type ($50,000 for single filers, $90,000 for joint filers, $60,000 for head of household filers) the 14 percent additional tax was reduced to seven percent. For taxable income at or above the top tax bracket the additional tax remained at 14 percent. The 14 percent additional tax was again reduced
retroactive to January 1, 2001. The reduction, intended as an across-the board 3.5 percentage point cut effective for one-half year, was implemented as a retroactive 1.75 percentage point cut effective for the full year. The reductions in the 14 percent additional tax were expected to extend beyond tax year 2001. However, after September 11, 2001 the extension of the reductions in the 14 percent additional tax was no longer sought. Consequently, the full 14 percent additional tax was re-instated, effective January 1, 2002.
As part of NYS budget for fiscal year 2000-2001, the State took several actions which reduced both State and City liability. In order to reduce the marriage penalty, the State increased the standard deduction for married families fi ling jointly from $13,000 to $13,400 in tax year 2001, to $14,200 in tax year 2002, and to $14,600 thereafter.
The State also enacted a college tuition benefit granted either through a refundable credit, (which does not affect the City return) or itemized deduction, (which does) for college tuition expenses paid by taxpayers on behalf of the taxpayer, the taxpayer’s spouse, or dependents who enroll or attend a qualified institution of higher learning. The credit and deduction are available only for undergraduate study. The allowable itemized deduction is limited to $10,000 of tuition expenses and is phased in over four years. For 2001, 25 percent of the tuition expense is deductible, reaching 100 percent of the tuition expense in 2004. In addition, as a result of the September 11, 2001 terrorist attack, the filing deadline for the quarterly estimated tax payment due September 11, 2001, was extended to December 10, 2001. Additionally, allowance was made for late filing of payroll withholding until December 10, 2001.
Effective July 1, 1999, the City’s nonresident earnings tax was selectively repealed for NYS residents. Because
2002
2000
1999
2001
Appendix II-PIT
II-49
the application of the City nonresident earnings tax to only NYS nonresidents posed constitutional problems, the legislation provided for repeal of the nonresident tax on out of-state residents, effective July 1, 1999. The final determination of the legality of the selective repeal of the nonresident tax was rendered by the State’s highest court, the NYS Court of Appeals on April 4, 2000. The court’s decision overturned the selective taxation, repealing the tax for NYS nonresidents, effective July 1, 1999. As a consequence of the original selective repeal, NYS nonresidents had City non¬resident earnings tax withheld for the second half of tax year 1999 and for tax year 2000 until the Appeals decision was rendered. The rate of tax applicable to NYS nonresident commuters fell to 0.25 percent on wages and 0.375 percent on net earnings with the expiration of the higher rates on January 1, 2001 (which had been in effect since 1971).
Qualifi ed settlement amounts received from an eligible settlement fund or trust (as defined in the Internal Revenue Code) by victims or targets of Nazi persecution, including individuals, corporations, partnerships and other entities, have been exempted from all NYS and local taxes. In addition, an entity that is treated as an eligible settlement fund or trust will be exempt from all NYS and local taxes imposed on or measured by income, the City’s commercial rent tax and all NYS and local sales and use taxes.
For tax years beginning after 1998, spouses who file joint NYS/NYC personal income tax returns are eligible for the protection from joint and several liability afforded innocent spouses under the provisions of IRC section 6015. A determination by the IRS relieving an individual of Federal income tax liability will create a rebuttable presumption that he or she is entitled to equivalent relief under State/City taxes. The State Tax Commissioner is required to include in all appropriate publications and instructions
information about a taxpayer’s right to innocent spouse relief.
Various provisions found in the New York State corporate and personal income tax statutes, which denied or limited certain tax benefits to taxpayers involved in certain highly leveraged merger and acquisition transactions, have been repealed, effective for tax years beginning after 1999. One of these provisions, which partially disallowed a deduction for “acquisition-related interest,” also applied for New York City personal income tax purposes; it, too, has been repealed.
Beginning in tax year 1999, the 12.5 percent NYC PIT temporary surcharge expired, reducing the top rate from 4.46 percent to 3.83 percent.
As part of NYS’s budget for fiscal year 1997-98, the State enacted the School Tax Relief (STAR) program to provide education aid and tax relief to localities. In addition to reductions in the property tax, the STAR program reduced City personal income tax liability through both a rate cut and a refundable credit. The credit is effective in tax year 1998 and increases according to the schedule shown in Appendix II¬ PIT, Table 6.
The STAR rate cut is an across-the-board reduction in tax rates starting in tax year 1999 and increasing through tax year 2001 according to the schedule shown in the table. The State reimburses the City for the foregone personal income tax revenue. As part of NYS’s budget for fiscal year 1998-99, the State accelerated the STAR program credit for senior citizens. Beginning in tax year 1998, resident senior citizen personal income tax filers were eligible for the full credit (joint filers: $125, other filers: $62.50).
The State enacted legislation enabling the City to establish a credit against the personal income tax for owners of unincorporated businesses for a portion of their distributive share of unincorporated
1998
1997
II-50
Appendix II-PIT
business tax liability, effective beginning with tax year 1997. The credit is based on a sliding scale, and ranges from a high of 65 percent of unincorporated business tax liability for taxpayers with NYS AGI of $42,000 or less, to 15 percent of liability for taxpayers with NYS AGI of $142,000 or more. As part of NYS’s budget for fiscal year 1995-96, the State enacted an enhanced version of the 1987 tax cut, which had been on hold since 1990. In tax years 1995 through 1997, the State lowered its tax rates, increased the standard deductions and the earned income tax credit, and reduced the number of tax brackets. The City rates effective for 1996 and 1997 reflected the City Tax Reduction Act of 1987, the 12.5 percent surcharge enacted in 1990 and the 14 percent additional tax enacted in 1991.
The Omnibus Budget Reconciliation Act of 1993 revised Federal rules governing estimated tax payments and the State enacted conforming legislation for the State and City for tax year 1994. The new rules repealed the “pay as you go” requirement and allowed all taxpayers with NYS AGI over $150,000 to pay estimated taxes based on either the “safe harbor” of 110 percent of the previous year liability or 90 percent of current year liability. The legislation also reduced the period within which refunds must be made without payment of interest from 90 to 45 days after the due date for final returns.
Federal tax law change, to which the State conformed, revised rules governing payment of estimated taxes by certain high income fi lers. Beginning in tax year 1992, these taxpayers were no longer allowed the “safe harbor” of submitting the same tax paid the previous year; estimated payments needed to equal at least 90 percent of their current year liability. This required taxpayers to calculate tax liability on a quarterly basis and “pay as you go”.
Federal tax law changes, to which State law conformed, have altered the City’s income tax. Effective for tax years beginning in 1991, taxpayers with AGI exceeding $100,000 are subject to percentage reductions in their Federal itemized deductions. The $100,000 threshold is adjusted annually for inflation. Regulations issued by the State provide that the Federal limitation also applies in calculating NYS taxable income.
Beginning in tax year 1991, the City imposed a three-year additional tax equal to 14 percent of the base personal income tax (including the surcharge). The additional tax was levied on City residents only and increased the top rate from 3.91 percent to 4.46 percent. Low-income taxpayers were not exempt from the additional tax. The additional tax has since been extended four times, in 1993, 1995, 1997 and 1999. The 1999 legislation extend the increase through tax year 2001. State legislation granted local authority to lower by local law the 14 percent additional tax, effective July 24, 2000. Subsequently, the 14 percent additional tax was reduced, effective January 1, 2001. The full 14 percent additional tax was reinstated effective January 1, 2002 (see 2001 for details).
The additional tax was scheduled to expire December 31, 2003. This did not occur; instead, effective January 1, 2003, the base tax and the additional tax were replaced by a temporary rate schedule in effect for tax years 2003 through 2005.
As part of NYS budget for fiscal year 1990-91, the last two years of the five-year tax reduction program were postponed. The legislation retained the 1989 tax rate schedule, standard deductions and the household credit for 1990. The scheduled phase-in of tax rates and deductions was to be completed by 1994. In order to avoid distortions in tax burdens, which would result from coupling the City’s 1990 rate schedule with the State’s 1989
1993
1992
1991
1990
Appendix II-PIT
II-51
deductions, the City also retained its 1989 rate schedule for tax year 1990. Changes to the City rate schedules were made for tax years 1991 through 1994 in proportion to changes the State made to the standard deductions. For tax years 1991 through 1994, changes to the State’s tax rate schedule, standard deductions and household credit were deferred. Consequently, the City retained its 1990 rate schedule for tax years 1991 through 1994.
Effective for tax years 1990, 1991 and 1992, the City imposed a 12.5 percent temporary income tax surcharge on City residents. The top rate was increased to 3.91 percent from 3.4 percent. Single taxpayers with AGI below $15,000, married taxpayers with AGI below $25,000, and heads of households with AGI below $16,500 were not subject to the surcharge. In February of 1991, the “Safe Streets, Safe City” program was signed into law. Part of the funding came from the extension of this surcharge for tax years 1993 through 1996. The surcharge was subsequently extended through 1998 and expired at the end of that tax year.
Effective January 1, 1987, NYC filers are allowed a non-refundable low-income credit known as the NYC Household Credit against their City’s personal income tax for the same tax year. The credit is allowed equals a fixed amount per federal exemption based on household gross income level. Until tax year 1995, single filers with household gross income of $7,500 or under are entitled to a $15 credit, while those between $7,500 and $10,000 receive a $10 credit. There was no credit for taxpayers with income greater than $10,500. Beginning tax year 1996, the credit amount was increased to $15, for taxpayers with household of income of $7,500 or under, $15 for those with income between $7,500 and $10,000, and $10 for taxpayers above $10,500 but not over $12,500. See table 5 entitled “NYC Tax Credit: Low
Income” for the breakdown of the credit for all other filing types.
The Tax Reform Act of 1986 substantially altered the Federal personal income tax code. The definition of gross income, the deductions and exemptions allowed in the computation of taxable income, and the rates applied to such income were altered. Since State law conforms to Federal definitions of income and deductions, the State tax base was significantly broadened. In response, New York State altered its tax code in April 1987. The State legislation phased-in a tax cut and restructured the tax over five years beginning in tax year 1987. Both the Federal and State changes significantly altered the definition of City taxable income. Since the City’s personal income tax base was broadened, the City would have received a tax “windfall” if it had taken no action. The NYC Tax Reduction Act of 1987 was enacted to return this windfall to tax-payers and reduce income tax revenue for fi scal year 1988 by an additional $75 million. The City’s five-year tax cut plan was designed to conform to State actions and combined new rate schedules and a low-income credit with the modified definition of taxable income. In 1987, the City introduced new rate schedules for single, joint, and head of household filers. Each schedule had nine brackets rather than the 14 used in 1986. At the same time the top rate was reduced to 4.1 percent. By 1991 the legislation would have reduced the top rate to 3.4 percent and the number of tax brackets to four. A 0.5 percent credit for net capital gains income and a two-earner married couple deduction were transitional measures only in effect during tax year 1987. The most significant changes to the law were large increases in the standard deduction and the introduction of a household credit to replace the low-income exclusion. These measures provided relief to low-income taxpayers. The taxable income threshold below which no tax is due for various years can be seen in Summary Table 4.
1987
1986
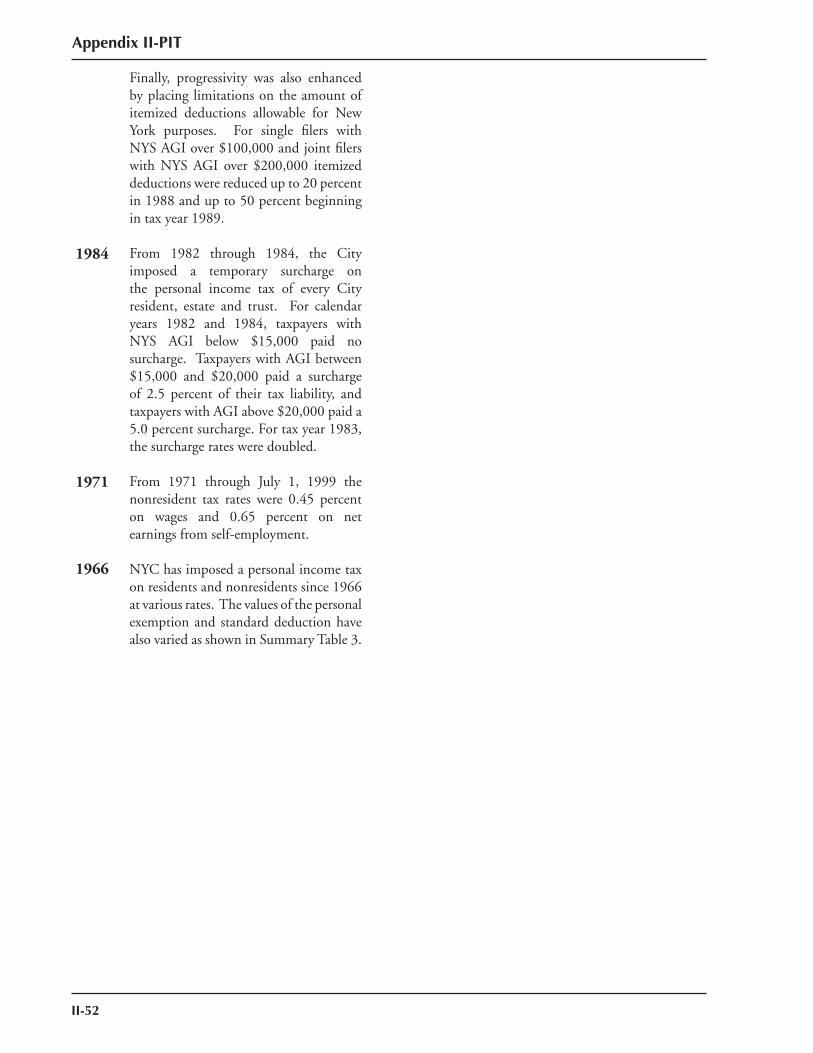
II-52
Appendix II-PIT
Finally, progressivity was also enhanced by placing limitations on the amount of itemized deductions allowable for New York purposes. For single filers with NYS AGI over $100,000 and joint filers with NYS AGI over $200,000 itemized deductions were reduced up to 20 percent in 1988 and up to 50 percent beginning in tax year 1989.
From 1982 through 1984, the City imposed a temporary surcharge on the personal income tax of every City resident, estate and trust. For calendar years 1982 and 1984, taxpayers with NYS AGI below $15,000 paid no surcharge. Taxpayers with AGI between $15,000 and $20,000 paid a surcharge of 2.5 percent of their tax liability, and taxpayers with AGI above $20,000 paid a 5.0 percent surcharge. For tax year 1983, the surcharge rates were doubled.
From 1971 through July 1, 1999 the nonresident tax rates were 0.45 percent on wages and 0.65 percent on net earnings from self-employment.
NYC has imposed a personal income tax on residents and nonresidents since 1966 at various rates. The values of the personal exemption and standard deduction have also varied as shown in Summary Table 3.
1984
1971
1966
Appendix III-STX
III-1
APPENDIX III SALES TAX
Table of Contents
1. Summary Tables
Table 1: Components of Sales Tax Base ............................................................................. III-5
Table 2: Sales Tax Rates and Clothing Exemption ............................................................. III-6 History of Sales Tax Exemptions on Clothing and Footwear ................................ III-6 Manhattan Parking Tax Rates .............................................................................. III-6
Table 3: History of Taxes on Hotel Occupancy ................................................................. III-7
Table 4: Sales Tax Activity, Payment, Filing and Distribution Dates .................................. III-8
Table 5: State Pool Quarterly Analysis ............................................................................... III-9
2. History of the Municipal Assistance Corporation ........................................................... III-11
3. Legislative History ........................................................................................................... III-15
a. Rate Changes ......................................................................................................... III-17
b. Base Expansion ....................................................................................................... III-18
c. Sales Tax on Clothing and Footwear ....................................................................... III-20
d. Exemptions ............................................................................................................ III-21
e. All Other Tax Law Changes .................................................................................... III-27

III-2
Appendix III-STX
Appendix III-STX
III-3
APPENDIX IIISALES TAX
1.Summary Tables

III-4
Appendix III-STX
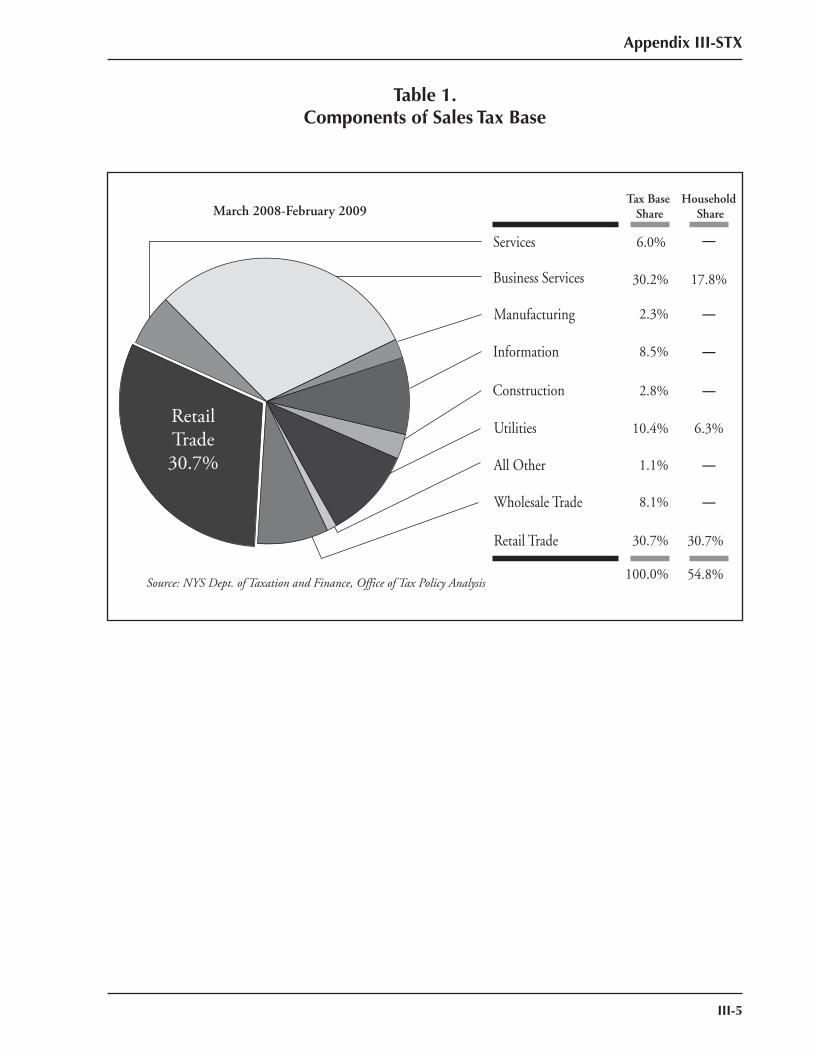
Table 1.Components of Sales Tax Base
8.1%
All Other
March 2008-February 2009
RetailTrade30.7%
Services
Business Services
Manufacturing
Information
Construction
Utilities
Wholesale Trade
6.0%
30.2%
2.3%
8.5%
2.8%
10.4%
1.1%
Source: NYS Dept. of Taxation and Finance, Office of Tax Policy Analysis
Tax Base Share
17.8%
6.3%
—
—
—
—
—
—
Household Share
30.7%Retail Trade 30.7%
100.0% 54.8%
Appendix III-STX
III-5
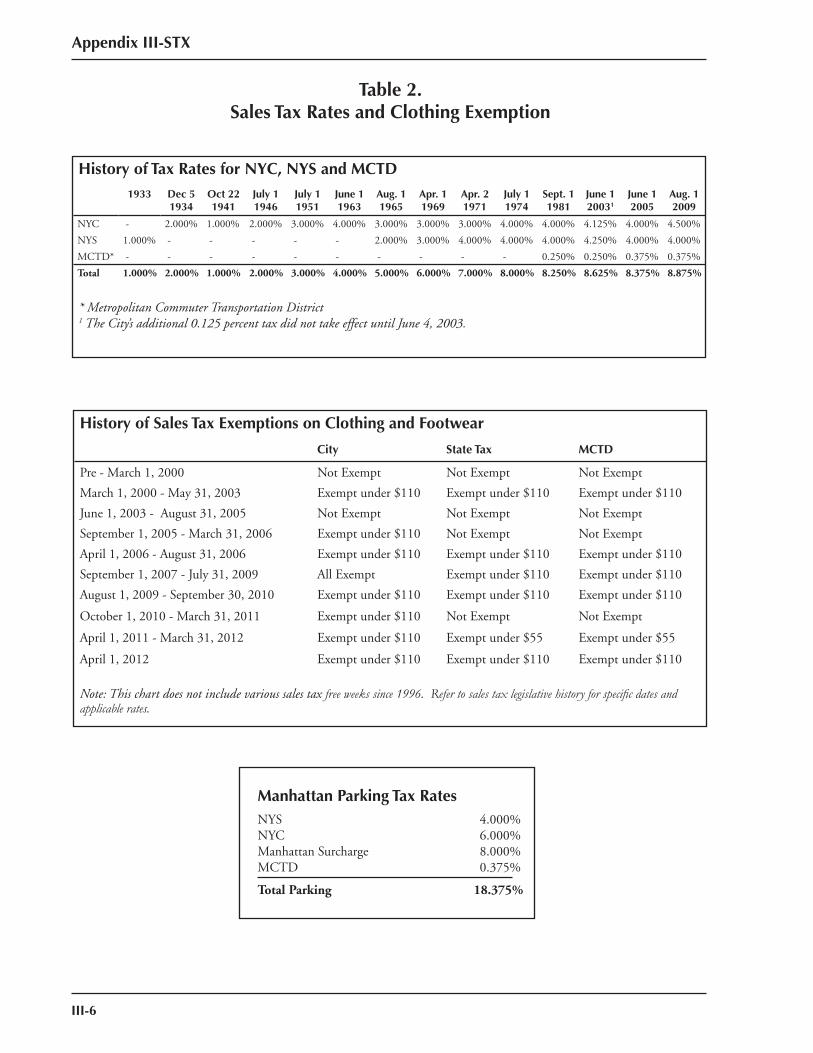
III-6
Table 2.Sales Tax Rates and Clothing Exemption
Manhattan Parking Tax Rates NYS 4.000%NYC 6.000%Manhattan Surcharge 8.000%MCTD 0.375%
Total Parking 18.375%
History of Sales Tax Exemptions on Clothing and Footwear
City State Tax MCTD
Pre - March 1, 2000 Not Exempt Not Exempt Not Exempt
March 1, 2000 - May 31, 2003 Exempt under $110 Exempt under $110 Exempt under $110
June 1, 2003 - August 31, 2005 Not Exempt Not Exempt Not Exempt
September 1, 2005 - March 31, 2006 Exempt under $110 Not Exempt Not Exempt
April 1, 2006 - August 31, 2006 Exempt under $110 Exempt under $110 Exempt under $110
September 1, 2007 - July 31, 2009 All Exempt Exempt under $110 Exempt under $110
August 1, 2009 - September 30, 2010 Exempt under $110 Exempt under $110 Exempt under $110
October 1, 2010 - March 31, 2011 Exempt under $110 Not Exempt Not Exempt
April 1, 2011 - March 31, 2012 Exempt under $110 Exempt under $55 Exempt under $55
April 1, 2012 Exempt under $110 Exempt under $110 Exempt under $110
Note: This chart does not include various sales tax free weeks since 1996. Refer to sales tax legislative history for specifi c dates and applicable rates.
History of Tax Rates for NYC, NYS and MCTD1933 Dec 5
1934Oct 221941
July 11946
July 11951
June 11963
Aug. 1 1965
Apr. 1 1969
Apr. 2 1971
July 1 1974
Sept. 1 1981
June 1 20031
June 1 2005
Aug. 1 2009
NYC - 2.000% 1.000% 2.000% 3.000% 4.000% 3.000% 3.000% 3.000% 4.000% 4.000% 4.125% 4.000% 4.500%
NYS 1.000% - - - - - 2.000% 3.000% 4.000% 4.000% 4.000% 4.250% 4.000% 4.000%
MCTD* - - - - - - - - - - 0.250% 0.250% 0.375% 0.375%
Total 1.000% 2.000% 1.000% 2.000% 3.000% 4.000% 5.000% 6.000% 7.000% 8.000% 8.250% 8.625% 8.375% 8.875%
* Metropolitan Commuter Transportation District1 The City’s additional 0.125 percent tax did not take effect until June 4, 2003.
Appendix III-STX
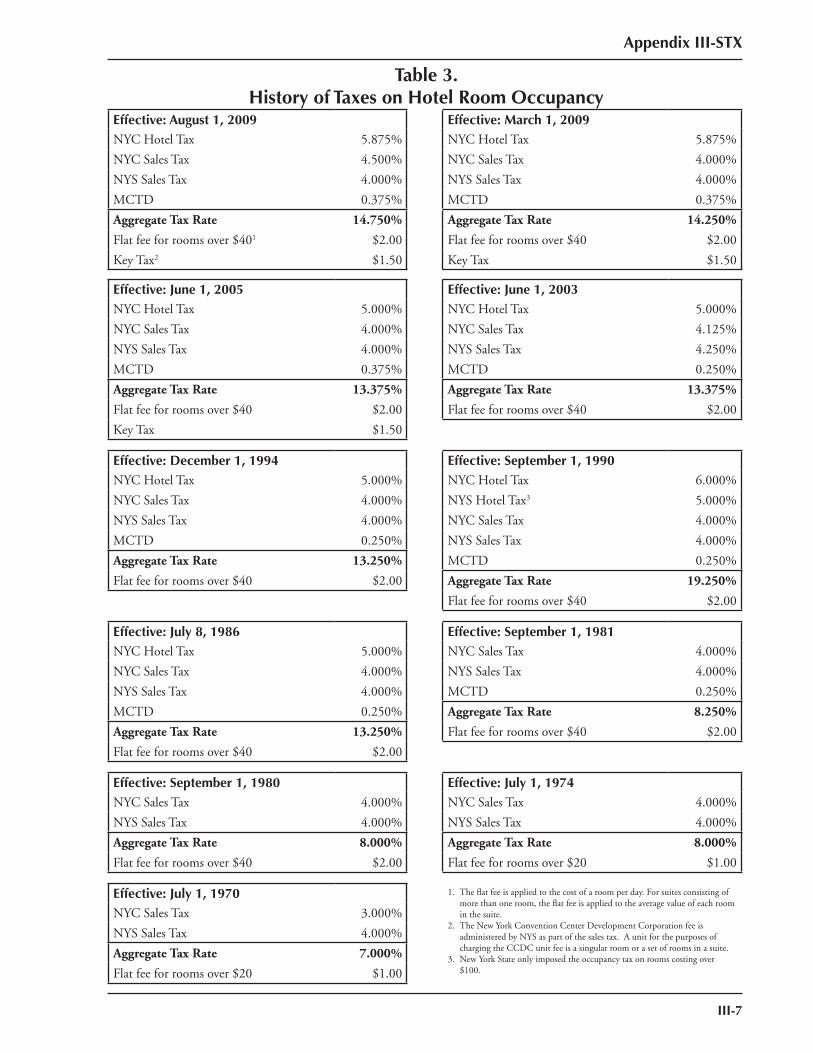
Appendix III-STX
III-7
Table 3.History of Taxes on Hotel Room Occupancy
Effective: August 1, 2009 Effective: March 1, 2009NYC Hotel Tax 5.875% NYC Hotel Tax 5.875%
NYC Sales Tax 4.500% NYC Sales Tax 4.000%
NYS Sales Tax 4.000% NYS Sales Tax 4.000%
MCTD 0.375% MCTD 0.375%
Aggregate Tax Rate 14.750% Aggregate Tax Rate 14.250%
Flat fee for rooms over $401 $2.00 Flat fee for rooms over $40 $2.00
Key Tax2 $1.50 Key Tax $1.50
Effective: June 1, 2005 Effective: June 1, 2003NYC Hotel Tax 5.000% NYC Hotel Tax 5.000%
NYC Sales Tax 4.000% NYC Sales Tax 4.125%
NYS Sales Tax 4.000% NYS Sales Tax 4.250%
MCTD 0.375% MCTD 0.250%
Aggregate Tax Rate 13.375% Aggregate Tax Rate 13.375%
Flat fee for rooms over $40 $2.00 Flat fee for rooms over $40 $2.00
Key Tax $1.50
Effective: December 1, 1994 Effective: September 1, 1990NYC Hotel Tax 5.000% NYC Hotel Tax 6.000%
NYC Sales Tax 4.000% NYS Hotel Tax3 5.000%
NYS Sales Tax 4.000% NYC Sales Tax 4.000%
MCTD 0.250% NYS Sales Tax 4.000%
Aggregate Tax Rate 13.250% MCTD 0.250%
Flat fee for rooms over $40 $2.00 Aggregate Tax Rate 19.250%
Flat fee for rooms over $40 $2.00
Effective: July 8, 1986 Effective: September 1, 1981NYC Hotel Tax 5.000% NYC Sales Tax 4.000%
NYC Sales Tax 4.000% NYS Sales Tax 4.000%
NYS Sales Tax 4.000% MCTD 0.250%
MCTD 0.250% Aggregate Tax Rate 8.250%
Aggregate Tax Rate 13.250% Flat fee for rooms over $40 $2.00
Flat fee for rooms over $40 $2.00
Effective: September 1, 1980 Effective: July 1, 1974NYC Sales Tax 4.000% NYC Sales Tax 4.000%
NYS Sales Tax 4.000% NYS Sales Tax 4.000%
Aggregate Tax Rate 8.000% Aggregate Tax Rate 8.000%
Flat fee for rooms over $40 $2.00 Flat fee for rooms over $20 $1.00
Effective: July 1, 1970 1. The fl at fee is applied to the cost of a room per day. For suites consisting of more than one room, the fl at fee is applied to the average value of each room in the suite.2. The New York Convention Center Development Corporation fee is administered by NYS as part of the sales tax. A unit for the purposes of charging the CCDC unit fee is a singular room or a set of rooms in a suite.3. New York State only imposed the occupancy tax on rooms costing over $100.
NYC Sales Tax 3.000%
NYS Sales Tax 4.000%
Aggregate Tax Rate 7.000%
Flat fee for rooms over $20 $1.00
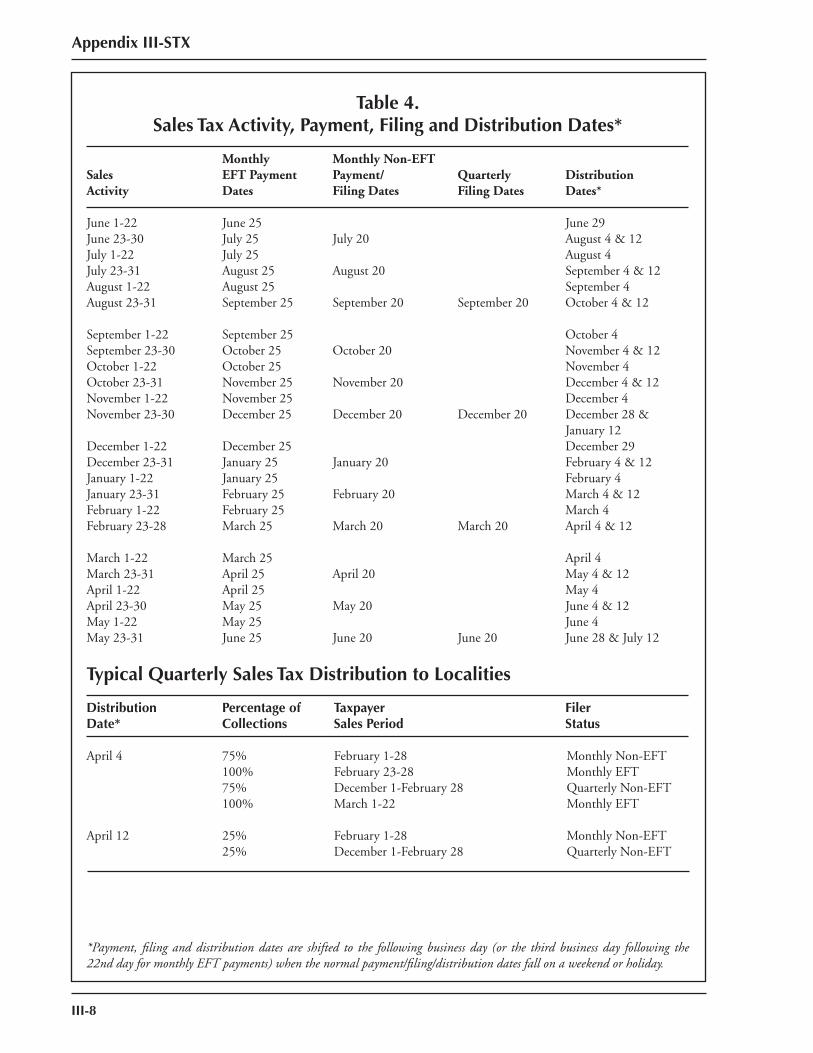
III-8
Table 4. Sales Tax Activity, Payment, Filing and Distribution Dates*
Monthly Monthly Non-EFT Sales EFT Payment Payment/ Quarterly DistributionActivity Dates Filing Dates Filing Dates Dates*
June 1-22 June 25 June 29June 23-30 July 25 July 20 August 4 & 12July 1-22 July 25 August 4July 23-31 August 25 August 20 September 4 & 12August 1-22 August 25 September 4August 23-31 September 25 September 20 September 20 October 4 & 12
September 1-22 September 25 October 4September 23-30 October 25 October 20 November 4 & 12October 1-22 October 25 November 4October 23-31 November 25 November 20 December 4 & 12November 1-22 November 25 December 4November 23-30 December 25 December 20 December 20 December 28 & January 12December 1-22 December 25 December 29December 23-31 January 25 January 20 February 4 & 12January 1-22 January 25 February 4January 23-31 February 25 February 20 March 4 & 12February 1-22 February 25 March 4February 23-28 March 25 March 20 March 20 April 4 & 12
March 1-22 March 25 April 4March 23-31 April 25 April 20 May 4 & 12April 1-22 April 25 May 4April 23-30 May 25 May 20 June 4 & 12May 1-22 May 25 June 4May 23-31 June 25 June 20 June 20 June 28 & July 12
Typical Quarterly Sales Tax Distribution to Localities
Distribution Percentage of Taxpayer FilerDate* Collections Sales Period Status
April 4 75% February 1-28 Monthly Non-EFT 100% February 23-28 Monthly EFT 75% December 1-February 28 Quarterly Non-EFT 100% March 1-22 Monthly EFT
April 12 25% February 1-28 Monthly Non-EFT 25% December 1-February 28 Quarterly Non-EFT
*Payment, fi ling and distribution dates are shifted to the following business day (or the third business day following the 22nd day for monthly EFT payments) when the normal payment/fi ling/distribution dates fall on a weekend or holiday.
Appendix III-STX
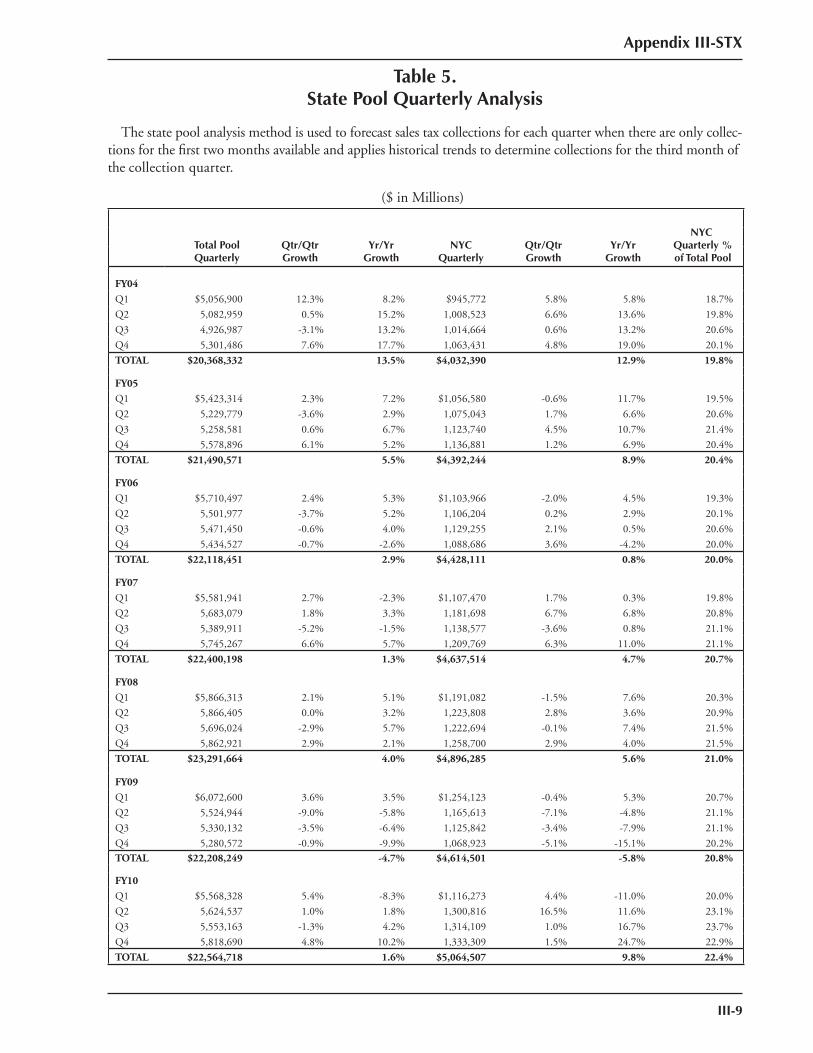
Appendix III-STX
III-9
Total PoolQuarterly
Qtr/QtrGrowth
Yr/YrGrowth
NYCQuarterly
Qtr/QtrGrowth
Yr/YrGrowth
NYC Quarterly % of Total Pool
FY04
Q1 $5,056,900 12.3% 8.2% $945,772 5.8% 5.8% 18.7%
Q2 5,082,959 0.5% 15.2% 1,008,523 6.6% 13.6% 19.8%
Q3 4,926,987 -3.1% 13.2% 1,014,664 0.6% 13.2% 20.6%
Q4 5,301,486 7.6% 17.7% 1,063,431 4.8% 19.0% 20.1%
TOTAL $20,368,332 13.5% $4,032,390 12.9% 19.8%
FY05
Q1 $5,423,314 2.3% 7.2% $1,056,580 -0.6% 11.7% 19.5%
Q2 5,229,779 -3.6% 2.9% 1,075,043 1.7% 6.6% 20.6%
Q3 5,258,581 0.6% 6.7% 1,123,740 4.5% 10.7% 21.4%
Q4 5,578,896 6.1% 5.2% 1,136,881 1.2% 6.9% 20.4%
TOTAL $21,490,571 5.5% $4,392,244 8.9% 20.4%
FY06
Q1 $5,710,497 2.4% 5.3% $1,103,966 -2.0% 4.5% 19.3%
Q2 5,501,977 -3.7% 5.2% 1,106,204 0.2% 2.9% 20.1%
Q3 5,471,450 -0.6% 4.0% 1,129,255 2.1% 0.5% 20.6%
Q4 5,434,527 -0.7% -2.6% 1,088,686 3.6% -4.2% 20.0%
TOTAL $22,118,451 2.9% $4,428,111 0.8% 20.0%
FY07
Q1 $5,581,941 2.7% -2.3% $1,107,470 1.7% 0.3% 19.8%
Q2 5,683,079 1.8% 3.3% 1,181,698 6.7% 6.8% 20.8%
Q3 5,389,911 -5.2% -1.5% 1,138,577 -3.6% 0.8% 21.1%
Q4 5,745,267 6.6% 5.7% 1,209,769 6.3% 11.0% 21.1%
TOTAL $22,400,198 1.3% $4,637,514 4.7% 20.7%
FY08
Q1 $5,866,313 2.1% 5.1% $1,191,082 -1.5% 7.6% 20.3%
Q2 5,866,405 0.0% 3.2% 1,223,808 2.8% 3.6% 20.9%
Q3 5,696,024 -2.9% 5.7% 1,222,694 -0.1% 7.4% 21.5%
Q4 5,862,921 2.9% 2.1% 1,258,700 2.9% 4.0% 21.5%
TOTAL $23,291,664 4.0% $4,896,285 5.6% 21.0%
FY09
Q1 $6,072,600 3.6% 3.5% $1,254,123 -0.4% 5.3% 20.7%
Q2 5,524,944 -9.0% -5.8% 1,165,613 -7.1% -4.8% 21.1%
Q3 5,330,132 -3.5% -6.4% 1,125,842 -3.4% -7.9% 21.1%
Q4 5,280,572 -0.9% -9.9% 1,068,923 -5.1% -15.1% 20.2%TOTAL $22,208,249 -4.7% $4,614,501 -5.8% 20.8%
FY10
Q1 $5,568,328 5.4% -8.3% $1,116,273 4.4% -11.0% 20.0%
Q2 5,624,537 1.0% 1.8% 1,300,816 16.5% 11.6% 23.1%
Q3 5,553,163 -1.3% 4.2% 1,314,109 1.0% 16.7% 23.7%
Q4 5,818,690 4.8% 10.2% 1,333,309 1.5% 24.7% 22.9%
TOTAL $22,564,718 1.6% $5,064,507 9.8% 22.4%
Table 5.State Pool Quarterly Analysis
The state pool analysis method is used to forecast sales tax collections for each quarter when there are only collec-tions for the fi rst two months available and applies historical trends to determine collections for the third month of the collection quarter.
($ in Millions)

III-10
Appendix III-STX
Appendix III-STX
III-11
APPENDIX IIISALES TAX
2.History of the
Municipal Assistance Corporation

III-12
Appendix III-STX
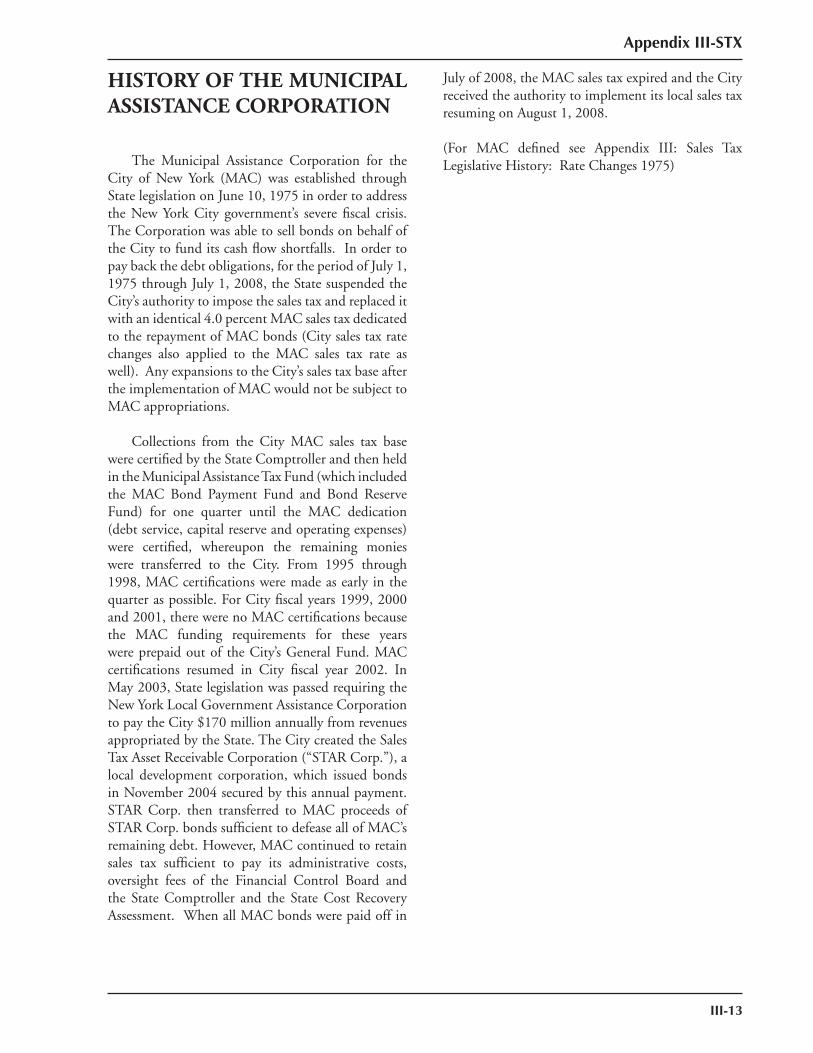
Appendix III-STX
III-13
HISTORY OF THE MUNICIPALASSISTANCE CORPORATION
The Municipal Assistance Corporation for the City of New York (MAC) was established through State legislation on June 10, 1975 in order to address the New York City government’s severe fi scal crisis. The Corporation was able to sell bonds on behalf of the City to fund its cash fl ow shortfalls. In order to pay back the debt obligations, for the period of July 1, 1975 through July 1, 2008, the State suspended the City’s authority to impose the sales tax and replaced it with an identical 4.0 percent MAC sales tax dedicated to the repayment of MAC bonds (City sales tax rate changes also applied to the MAC sales tax rate as well). Any expansions to the City’s sales tax base after the implementation of MAC would not be subject to MAC appropriations.
Collections from the City MAC sales tax base were certifi ed by the State Comptroller and then held in the Municipal Assistance Tax Fund (which included the MAC Bond Payment Fund and Bond Reserve Fund) for one quarter until the MAC dedication (debt service, capital reserve and operating expenses) were certifi ed, whereupon the remaining monies were transferred to the City. From 1995 through 1998, MAC certifi cations were made as early in the quarter as possible. For City fi scal years 1999, 2000 and 2001, there were no MAC certifi cations because the MAC funding requirements for these years were prepaid out of the City’s General Fund. MAC certifi cations resumed in City fi scal year 2002. In May 2003, State legislation was passed requiring the New York Local Government Assistance Corporation to pay the City $170 million annually from revenues appropriated by the State. The City created the Sales Tax Asset Receivable Corporation (“STAR Corp.”), a local development corporation, which issued bonds in November 2004 secured by this annual payment. STAR Corp. then transferred to MAC proceeds of STAR Corp. bonds suffi cient to defease all of MAC’s remaining debt. However, MAC continued to retain sales tax suffi cient to pay its administrative costs, oversight fees of the Financial Control Board and the State Comptroller and the State Cost Recovery Assessment. When all MAC bonds were paid off in
July of 2008, the MAC sales tax expired and the City received the authority to implement its local sales tax resuming on August 1, 2008.
(For MAC defi ned see Appendix III: Sales Tax Legislative History: Rate Changes 1975)

III-14
Appendix III-STX

Appendix III-STX
III-15
APPENDIX IIISALES TAX
3.Legislative History

III-16
Appendix III-STX
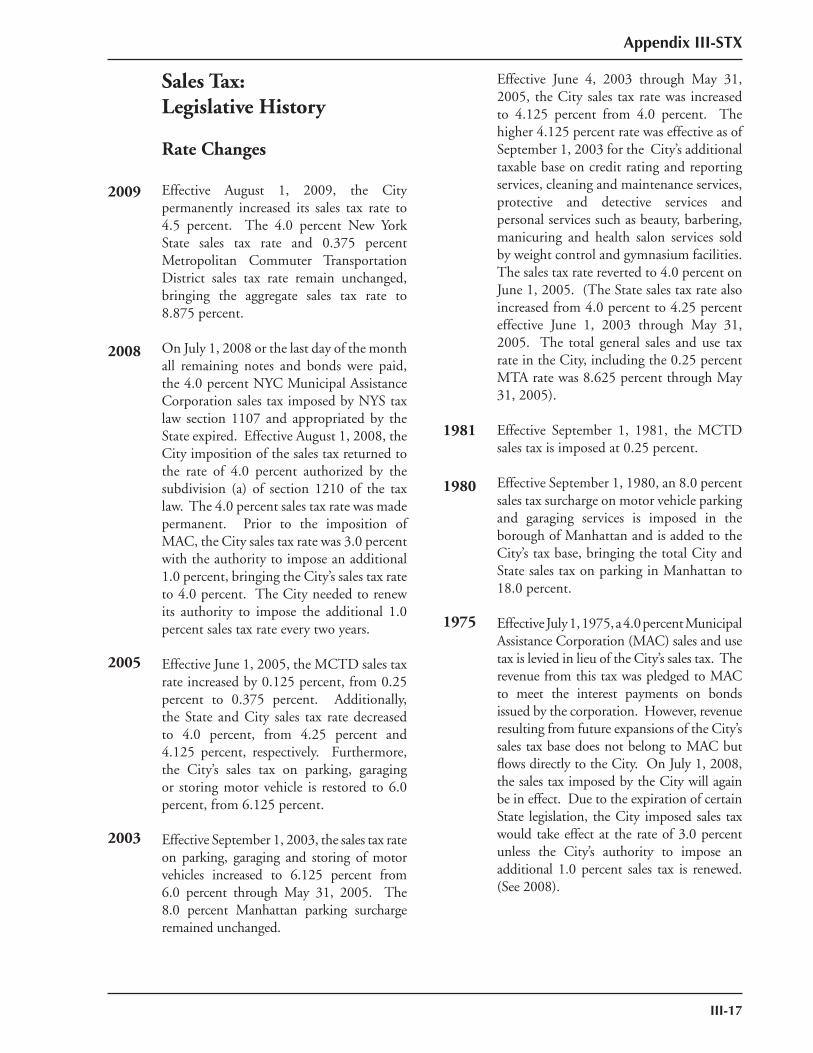
Appendix III-STX
III-17
2009
2008
2005
2003
1981
1980
1975
Sales Tax:Legislative History
Rate Changes
Effective August 1, 2009, the City permanently increased its sales tax rate to 4.5 percent. The 4.0 percent New York State sales tax rate and 0.375 percent Metropolitan Commuter Transportation District sales tax rate remain unchanged, bringing the aggregate sales tax rate to 8.875 percent.
On July 1, 2008 or the last day of the month all remaining notes and bonds were paid, the 4.0 percent NYC Municipal Assistance Corporation sales tax imposed by NYS tax law section 1107 and appropriated by the State expired. Effective August 1, 2008, the City imposition of the sales tax returned to the rate of 4.0 percent authorized by the subdivision (a) of section 1210 of the tax law. The 4.0 percent sales tax rate was made permanent. Prior to the imposition of MAC, the City sales tax rate was 3.0 percent with the authority to impose an additional 1.0 percent, bringing the City’s sales tax rate to 4.0 percent. The City needed to renew its authority to impose the additional 1.0 percent sales tax rate every two years.
Effective June 1, 2005, the MCTD sales tax rate increased by 0.125 percent, from 0.25 percent to 0.375 percent. Additionally, the State and City sales tax rate decreased to 4.0 percent, from 4.25 percent and 4.125 percent, respectively. Furthermore, the City’s sales tax on parking, garaging or storing motor vehicle is restored to 6.0 percent, from 6.125 percent.
Effective September 1, 2003, the sales tax rate on parking, garaging and storing of motor vehicles increased to 6.125 percent from 6.0 percent through May 31, 2005. The 8.0 percent Manhattan parking surcharge remained unchanged.
Effective June 4, 2003 through May 31, 2005, the City sales tax rate was increased to 4.125 percent from 4.0 percent. The higher 4.125 percent rate was effective as of September 1, 2003 for the City’s additional taxable base on credit rating and reporting services, cleaning and maintenance services, protective and detective services and personal services such as beauty, barbering, manicuring and health salon services sold by weight control and gymnasium facilities. The sales tax rate reverted to 4.0 percent on June 1, 2005. (The State sales tax rate also increased from 4.0 percent to 4.25 percent effective June 1, 2003 through May 31, 2005. The total general sales and use tax rate in the City, including the 0.25 percent MTA rate was 8.625 percent through May 31, 2005).
Effective September 1, 1981, the MCTD sales tax is imposed at 0.25 percent.
Effective September 1, 1980, an 8.0 percent sales tax surcharge on motor vehicle parking and garaging services is imposed in the borough of Manhattan and is added to the City’s tax base, bringing the total City and State sales tax on parking in Manhattan to 18.0 percent.
Effective July 1, 1975, a 4.0 percent Municipal Assistance Corporation (MAC) sales and use tax is levied in lieu of the City’s sales tax. The revenue from this tax was pledged to MAC to meet the interest payments on bonds issued by the corporation. However, revenue resulting from future expansions of the City’s sales tax base does not belong to MAC but fl ows directly to the City. On July 1, 2008, the sales tax imposed by the City will again be in effect. Due to the expiration of certain State legislation, the City imposed sales tax would take effect at the rate of 3.0 percent unless the City’s authority to impose an additional 1.0 percent sales tax is renewed. (See 2008).
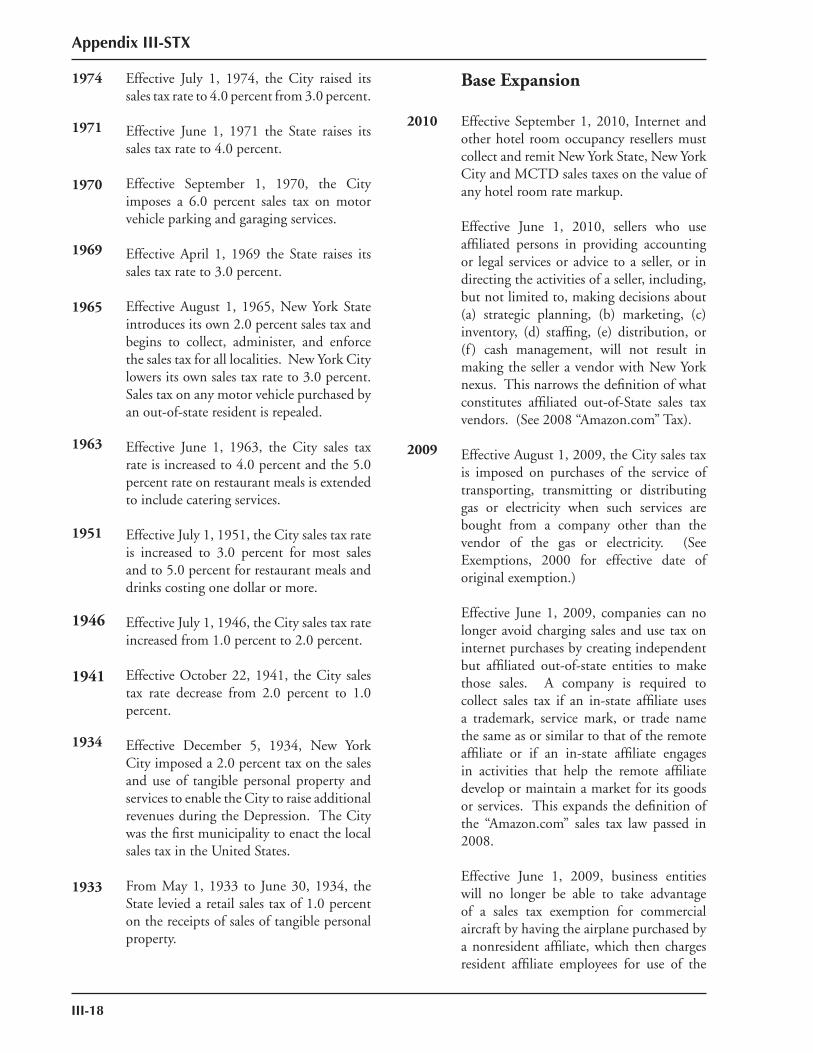
III-18
Appendix III-STX
Base Expansion
Effective September 1, 2010, Internet and other hotel room occupancy resellers must collect and remit New York State, New York City and MCTD sales taxes on the value of any hotel room rate markup.
Effective June 1, 2010, sellers who use affi liated persons in providing accounting or legal services or advice to a seller, or in directing the activities of a seller, including, but not limited to, making decisions about (a) strategic planning, (b) marketing, (c) inventory, (d) staffi ng, (e) distribution, or (f ) cash management, will not result in making the seller a vendor with New York nexus. This narrows the defi nition of what constitutes affi liated out-of-State sales tax vendors. (See 2008 “Amazon.com” Tax).
Effective August 1, 2009, the City sales tax is imposed on purchases of the service of transporting, transmitting or distributing gas or electricity when such services are bought from a company other than the vendor of the gas or electricity. (See Exemptions, 2000 for effective date of original exemption.)
Effective June 1, 2009, companies can no longer avoid charging sales and use tax on internet purchases by creating independent but affi liated out-of-state entities to make those sales. A company is required to collect sales tax if an in-state affi liate uses a trademark, service mark, or trade name the same as or similar to that of the remote affi liate or if an in-state affi liate engages in activities that help the remote affi liate develop or maintain a market for its goods or services. This expands the defi nition of the “Amazon.com” sales tax law passed in 2008.
Effective June 1, 2009, business entities will no longer be able to take advantage of a sales tax exemption for commercial aircraft by having the airplane purchased by a nonresident affi liate, which then charges resident affi liate employees for use of the
Effective July 1, 1974, the City raised its sales tax rate to 4.0 percent from 3.0 percent.
Effective June 1, 1971 the State raises its sales tax rate to 4.0 percent.
Effective September 1, 1970, the City imposes a 6.0 percent sales tax on motor vehicle parking and garaging services.
Effective April 1, 1969 the State raises its sales tax rate to 3.0 percent.
Effective August 1, 1965, New York State introduces its own 2.0 percent sales tax and begins to collect, administer, and enforce the sales tax for all localities. New York City lowers its own sales tax rate to 3.0 percent. Sales tax on any motor vehicle purchased by an out-of-state resident is repealed.
Effective June 1, 1963, the City sales tax rate is increased to 4.0 percent and the 5.0 percent rate on restaurant meals is extended to include catering services.
Effective July 1, 1951, the City sales tax rate is increased to 3.0 percent for most sales and to 5.0 percent for restaurant meals and drinks costing one dollar or more.
Effective July 1, 1946, the City sales tax rate increased from 1.0 percent to 2.0 percent.
Effective October 22, 1941, the City sales tax rate decrease from 2.0 percent to 1.0 percent.
Effective December 5, 1934, New York City imposed a 2.0 percent tax on the sales and use of tangible personal property and services to enable the City to raise additional revenues during the Depression. The City was the fi rst municipality to enact the local sales tax in the United States.
From May 1, 1933 to June 30, 1934, the State levied a retail sales tax of 1.0 percent on the receipts of sales of tangible personal property.
1974
1971
1970
1969
1965
1963
1951
1946
1941
1934
1933
2010
2009
Appendix III-STX
III-19
of the prepaid calling service does not take place at the vendor’s place of business, it will be deemed to take place at the purchaser’s shipping address or, if no item is shipped, at the purchaser’s billing address.
Effective June 1, 1999, certain “materialmen” (as defi ned in the New York State Lien Law) who sell building materials on credit to contractors or repairmen for the improvement of real property will be required to collect and pay State and local sales taxes due on such sales only as payments of the sales price are actually received. However, to the extent that the tax due on the full sales price has not been collected within one year from the date of the sale, any balance of tax due must be collected and paid with the fi rst sales tax return due from the materialman following the end of the one-year period.
Effective September 1, 1991, shipping, transportation, postage and similar delivery charges, telephone answering services, and sales of prewritten software are added to the State and City’s sales tax base.
Effective September 1, 1990, entertainment services provided or delivered by telephone or telegraph through 500, 700, 800 and 900 telephone numbers, as well as such services delivered by private telephone line, cable or channel are added to the State’s tax base and the City’s tax base.
Effective June 1, 1990, protective and detective services, and interior decorating and design, contract cleaning and maintenance services, previously taxed exclusively by the City, are added to the State’s tax base. Effective December 1, 1995, interior decorating and design is exempted from the City tax base.
Effective December 1, 1989, interior decorating, contract cleaning and maintenance services are added to the City’s tax base.
Effective June 1, 1989, service charges on fl oor covering installations are added to the State’s tax base and the City’s tax base.
aircraft. Further, New York residents will no longer be able to avoid sales tax on motor vehicles, vessels, and aircraft used in-state by forming a new corporation or a limited liability corporation that purchases the item in question out-of-state, brings the item into the State, and then allows the New York resident to use the item at will.
Effective June 1, 2009, the sales tax base is expanded to include transportation-related consumer spending such as buses, limousines and black cars. Taxis are exempt.
Effective September 1, 2008, non-profi t tax-exempt organizations are required to collect sales tax on additional retail sales including Internet mail-order catalogue and auction sales plus rentals and leases of tangible property.
Effective June 1, 2008, retailers from Internet websites, such as Amazon.com, that do not have a physical presence in New York State but enters into an agreement with a New York State resident under which the resident is compensated for referring in-state customers to the seller, whether through an Internet web link or by any other means, will be treated as a sales tax vendor with New York nexus. Internet retailers that do not have a physical presence in New York State are not considered sales tax vendors if the gross receipts generated by using in-state referrals are less than $10,000.
Effective June 1, 2000 purchases of gas and electricity from out-of-state suppliers are subject to State and local compensating use taxes.
Effective March 1, 2000, New York State and local sales and use taxes will apply to the total amount paid, at the time of sale, for “prepaid telephone calling service,” which is defi ned as the right—paid for in advance—to purchase telecommunication services that permit the origination of intrastate, interstate or international telephone calls using an access number or authorization code. The taxes will apply regardless of whether the right to use the service is evidenced by a card. If the sale
1999
1991
1990
1989
2008
2000
III-20
Appendix III-STX
York City does not have to remit half of the forgone revenue for having the clothing and footwear exemption to the MTA. The aggregate tax rate for clothing and footwear costing less than $110 during this period is 4.375 percent.
Effective August 1, 2009, the City exemption for clothing and footwear for items costing $110 and above is repealed. The exemption for clothing and purchases under $110 will remain intact.
Effective September 1, 2007, clothing and footwear purchases costing $110 and above are exempt from the City sales tax permanently. The State and MCTD taxes will remain at 4.0 percent and 0.375 percent, respectively. The exemption for clothing and footwear purchases under $110 will remain intact with the City reimbursing the MCTD half of the revenue forgone from the 0.375 percent MCTD tax, while the State reimburses the other half for purchases costing under $110.
Effective April 1, 2006, clothing and footwear purchases under $110 are exempt permanently from City, State, and MCTD sales taxes. The City will reimburse the MCTD half of the revenue forgone from the 0.375 percent MCTD tax, while the State reimburses the other half.
Effective September 1, 2005, legislation signed into law July 19, 2005 reinstated the City exemption for clothing and footwear purchases under $110.
Legislation signed into law April 12, 2005 extended the repeal of the clothing and footwear exemption for purchases under $110 through March 31, 2006 including two tax-free weeks to be held from the Tuesday immediately preceding Labor Day through Labor Day, and from the last Monday of January through the following Sunday. The bill also provided that if the SFY 2006-07 Executive Budget did not propose a new reduction in any tax, then the suspension of the year-round exemption for clothing and footwear priced under $110 would
Effective June 1, 1989, excise taxes on cigarettes and tobacco products are included in the calculation of the sales tax, and added to the State’s tax base and the City’s tax base.
Effective July 1, 1988, sales tax on sales of energy to commercial or industrial users under the Competitive Business Energy Costs Program is exempt in annual increments of 25 percent per year, reducing the City’s tax base. In 1988, the implementation of the CBECP was delayed until July 1, 1990, when it was due to resume on the original schedule (i.e. 75 percent). The implementation of the CBECP was delayed indefi nitely in 1990.
Effective March 1, 1976, barber and beauty shops and health and weight control salons are added to the City’s tax base.
Effective March 1, 1976, protective and detective services and credit reporting and collection services are added to the City’s tax base.
Sales Tax on Clothing and Footwear
Effective April 1, 2010 through March 31, 2011, New York State modifi ed the exemption for clothing and footwear to less than $55 per item for the State and MCTD. The State allowed localities to modify their clothing exemption to conform. New York City did not conform. During this period, New York City has to remit half of the forgone revenue for items costing less than $55 to the MTA. After March 31, 2011, the State and MCTD exemption for clothing and footwear will revert to the original exemption of less than $110 per item, with the City remitting half of the forgone revenue for items less than $110 to the MTA.
Effective October 1, 2010 through March 31, 2010, New York State temporarily repealed the exemption for clothing and footwear for items costing less than $110 from the State and the MCTD sales tax. New York City did not enact a repeal of the exemption. During this period, New
1988
1976
2010
2009
2007
2006
2005
Appendix III-STX
III-21
percent MCTD sales tax. The locality will reimburse the MCTD for one-half of the tax forgone and the State will reimburse the MCTD for the other half.
During the weeks of January 17-24 and September 1-7 1999, the State and City repealed their taxes on clothing and footwear purchases under $500.
During the weeks of January 17-23 and September 1-7, 1998, the State and City repealed their taxes on clothing and footwear purchases under $500.
During the week of September 1-7, 1997, the State and City repealed their taxes on clothing purchases under $100, excluding footwear.
During the week of January 18-24, 1997, the State and City repealed their taxes on clothing and footwear purchases under $500.
Exemptions
Effective June 1, 2010, affi liated for hire livery vehicles in a City of one million or more are exempt from City, State and MCTD sales tax. This narrows the defi nition of taxable transportation-related consumer spending. (See Base Expansions, 2009).
Effective December 1, 2009, the State and City temporary sales tax exemptions for aircraft charges for storing aircraft while being serviced and tangible personal property purchased and used by the service provider in performing such service, where such property becomes a physical component of the property being serviced was made permanent. (See 2004).
Effective December 1, 2006, sales of tangible personal property by a gift shop located in a veterans’ home described in Title 38 of the U.S. Code are exempt from State and local sales taxes.
extend through March 31, 2007 (including two tax-free weeks). The exemption was subsequently extended.
The repeal of the clothing and footwear exemption was extended several times: through June 30; July 31; September 30, 2004; and through May 31, 2005. During these periods, the State and City have repealed their taxes on clothing and footwear purchases under $110 during the weeks from August 31 through September 6, 2004 and from January 31 through February 6, 2005.
The State and City sales tax exemption for clothing and footwear purchases under $110 was suspended from June 1, 2003 through May 31, 2004. During this period, the State and City repealed their taxes on clothing and footwear purchases under $110 during the weeks from August 26 through September 1, 2003 and from January 26 through February 1, 2004. The permanent exemption was to be restored June 1, 2004. This did not occur; the repeal was extended several times. (See 2004).
Effective March 1, 2000, the City permanently exempted clothing and footwear purchases under $110. The exemption was originally scheduled to go into effect December 1, 1999. (See 1999).
During the week of January 15-21, 2000, the State and City repealed their taxes on clothing and footwear purchases under $500.
The State, and consequently all participating localities, delayed the permanent exemption of clothing and footwear purchases under $110 scheduled to become effective December 1, 1999 until March 1, 2000. (See below).
Effective December 1, 1999, the State permanently repealed its 4.0 percent sales tax on clothing and footwear purchases under $110, and gave local governments the option to match the repeal. If a locality within the MCTD opts for repeal, clothing will also be exempt from the 0.25
2004
2003
2000
1999
1998
1997
2010
2009
2006
III-22
Appendix III-STX
purposes. The City has not acted on this authorization.
Effective March 1, 2006, State and City tax exemptions are expanded to include metered energy services produced by a cogeneration facility owned or operated by a cooperative housing corporation with at least 1,500 apartments and is sold to its tenants or occupants.
Under federal law, federally-chartered credit unions are exempt from State and local sales taxes. Legislation has been enacted to exempt State-chartered credit unions from New York State and local sales taxes, effective March 1, 2008. As an interim measure to encourage federally-chartered institutions to convert to a New York charter, beginning March 1, 2006, Federal credit unions may convert and maintain their exempt status for State and local sales tax purposes.
Effective December 1, 2005, State and City tax exemptions are expanded to include the service of removing waste material from a transfer station or construction and demolition debris processing facility regulated by the NYS Department of Environmental Conservation, provided the waste material was not generated by the facility.
Effective December 1, 2005, the State and local sales tax exemption for coin-operated car wash services, which required that the washing, waxing or vacuuming equipment be operated by the customer, has been modifi ed to cover such services performed by automated equipment without assistance by the customer.
Effective September 1, 2005, State and City tax exemptions are expanded to include the sale and installation of residential solar energy system equipment. Localities, including the City, have the option of adopting the same exemption for local sales tax purposes. The City conformed.
Effective September 1, 2005, State and City sales tax exemptions were adopted
Effective December 1, 2006, military decorations sold to an active duty member of the military or veteran are exempt from State and local sales taxes.
Effective December 1, 2006, the portion of the charge that covers the admission to a dramatic or musical art performance at a roof garden, cabaret or similar establishments are exempt from State and local sales taxes. To qualify for the exemption, the charge for the performance must be stated separately, and charges for other items, such as food, drink and services, must meet certain tests to ensure that they are reasonable and not designed to avoid the tax.
Effective October 1, 2006, the partial State and local sales tax exemption for amusement park admission charges, which was set to expire, has been made permanent. The exemption, equal to 75 percent of the admission charge, applies where the admission fee entitles patrons to ride at least 75 percent of the park’s rides at no extra cost (See 2004).
Effective September 1, 2006 and continuing until August 31, 2011, the alternative motor vehicle fuels referred to (and defi ned in the law) as E85, compressed natural gas (CNG) and hydrogen are exempt from State and local sales taxes. The alternative motor vehicle fuel designated B20 is partially exempt from State and local sales taxes; during the above period, B20 is subject to a 20 percent sales tax reduction.
Effective September 1, 2006, State and City tax exemptions are expanded to include milk crates purchased by a dairy farmer or licensed milk distributor and used exclusively and directly for the packaging and delivery of milk to customers
On May 21, 2006, the City was authorized by the State to adopt local legislation to exempt from the City sales tax, or reduce the rate of the tax on, residential energy sources that are currently exempt from the State sales tax, which include fuel oil, gas, and electricity used for residential
2005
Appendix III-STX
III-23
A temporary exemption was allowed for tangible personal property, excluding motor vehicles, motor fuel, diesel motor fuel, cigarettes, tobacco products, alcoholic beverages, and building materials, under $500 in the Liberty and Resurgence zones of lower Manhattan for three weekends: June 9-11, July 9-11, and August 20-22, 2002. The Liberty Zone is defi ned as on or south of Canal Street, East Broadway (east of its intersection with Canal Street), or Grand Street (east of its intersection with East Broadway) in the borough of Manhattan. The Resurgence Zone is defi ned as the area between Canal Street and Houston Street.
The partial sales and use tax exemption based on the incremental cost of purchasing an alternative fuel vehicle has been extended for one year, to February 29, 2004. In addition, the eligibility requirement that the incremental cost be separately stated in the bill of sale has been made inapplicable for 2000 to 2002 model year qualifi ed hybrid vehicles (generally defi ned as a vehicle that draws power from both an internal combustion engine and an energy storage device rechargeable through a braking system that recovers waste energy). Finally, the incremental cost with respect to a qualifi ed hybrid vehicle will be deemed to be $3,000 where a comparable vehicle without special equipment does not exist for comparison purposes.
Effective March 1, 2001, purchases of tangible personal property and services used or consumed by qualifi ed enterprises located in Empire Zones are exempt from the State’s tax base for the next ten years. Localities have the option to include this exemption. The City conformed to the State exemption.
Effective March 1, 2001, State and City’s sales tax exemptions are expanded to include manufacturing and industrial pollution control, prevention, and abatement equipment and machinery.
Effective March 1, 2001, the 1965 sales tax exemption for motor vehicle purchases
for tangible personal property and related installation services purchased by a tenant or landlord, and for tangible personal property purchased by a contractor or repairperson for use directly and exclusively to furnish, equip, alter or improve leased commercial offi ce space in Lower Manhattan. To qualify for the exemption, the lease must be for at least 10 years beginning on or after September 1, 2005, and purchases must be made on or after that date but during the fi rst year of the lease. The exemption expires December 1, 2016.
Effective December 1, 2004, State and City tax exemptions are expanded to include aircraft charges for storing aircraft while being serviced and tangible personal property purchased and used by the service provider in performing such service, where such property becomes a physical component of the property being serviced. This exemption was set to expire on December 1, 2009 but was made permanent (Chapter 204 of the Laws of 2009).
Effective July 28, 2004, an amusement park, whose admission charge entitles patrons to ride at least 75 percent of its rides at no extra cost, is exempt from State and local sales taxes on 75 percent of the admission charge.
The existing sales tax exemption for the incremental cost of purchasing a hybrid or alternative fuel vehicle was extended until February 28, 2005 and the exemption amount was fi xed at $3,000. The exemption was not extended. (See 2002).
Effective December 1, 2003, an existing sales tax exemption for coin-operated motor vehicle vacuuming equipment located in car washes was expanded to cover such equipment located at facilities other than car washes. (See 1997).
Effective December 1, 2002, State and City tax exemptions are expanded to include purchases of tangible personal property and certain services (including utility services) used in the production of a fi lm for sale, regardless of the medium used to convey the fi lm to the purchaser.
2004
2003
2002
2001
III-24
Appendix III-STX
bringing City tax law into conformity with the State (See All Other Tax Law Changes, 1984).
Effective September 1, 2000, a State, local, and MCTD sales tax exemption will be phased-in, over a four-year period, on purchases of the service of transporting, transmitting or distributing gas or electricity when such services are bought from a company other than the vendor of the gas or electricity. For the one-year period, beginning September 1, 2000, the tax on such services will be reduced by 25 percent (additional 25 percent reductions will occur in the following three years) and such services will be fully exempt beginning September 1, 2003.
Effective September 1, 2000, the State and City’s sales tax exemptions are expanded to include, machinery, equipment, and certain other specifi ed tangible personal property used by an operator of an Internet data center that sells Internet website services, as well as, services to the exempt property, and certain other services used in the Internet data center.
Effective September 1, 2000, the existing narrow exemptions for telecommunications equipment is expanded to include tangible personal property used in providing telecommunications services for sale or Internet access services for sale. Additionally, machinery, equipment, parts, tools, supplies and certain related services used in upgrading cable television systems to enable them to offer digital cable TV service for sale or Internet access service for sale are exempt from the State’s tax base and, consequently, the City’s tax base (the cable TV exemption expired September 1, 2003).
Effective September 1, 2000, the State and City’s sales tax exemptions are expanded to include machinery, equipment, or other tangible personal property used by a broadcaster in the production of live or recorded programs for broadcast or in the transmission, as well as services to the exempt property .
by out-of-state residents is extended to purchases of vessels and trailers sold for use with the vessel, reducing the State’s tax base and consequently, the City’s tax base. Rules that apply to motor vehicles purchased in one New York sales tax jurisdiction by residents of another New York sales tax jurisdiction and which subject the purchase to the rules and rates of the resident’s tax jurisdiction, are amended to cover purchases of vessels and their trailers.
Effective March 1, 2001, State and City’s sales tax exemptions are expanded to include computer system hardware used or consumed directly and predominantly in providing the service, for sale, of designing and developing Internet websites.
Effective March 1, 2001, State and City’s sales tax exemptions are expanded to include machinery, equipment or apparatus used or consumed directly and predominately to upgrade cable television systems to allow for the receiving, amplifying, processing, transmitting, re-transmitting, switching or monitoring of telecommunication services for sale and communications equipment used in the transmission of Internet access.
Effective March 1, 2001, State and City’s sales tax exemptions are expanded to include tangible personal property sold to a contractor, subcontractor, or repairperson for use directly and predominately in the production phase of farming.
Effective December 1, 2000, State and City tax exemptions are expanded to include food and non-alcoholic beverages sold at dining facilities located in senior citizen residences, where use of the dining room is limited to residents and their guests, and where the food and drinks are served only in the dining room or a resident’s room.
Effective November 1, 2000, fuel, gas, electricity, refrigeration or steam used in the production of tangible personal property for sale, previously claimed as a credit against general corporation tax and unincorporated business tax, are exempt from City tax,
2000
Appendix III-STX
III-25
1999
1998
1997
Effective September 1, 1998, coin phone calls costing 25 cents or less are exempt from the State’s tax base, and consequently, the City’s tax base.
Effective September 1, 1998, the exemption for telephone central offi ce equipment or station apparatus is expanded to include equipment used directly and predominately in receiving, amplifying, processing, and transmitting telephone or telegraph signals, reducing the State’s tax base and the City’s tax base.
Effective June 1, 1998, textbooks purchased by full or part-time college students for their courses at accredited institutions are exempt from the State’s tax base and, consequently, the City’s tax base.
Effective June 1, 1998, computer system hardware used or consumed directly and predominately in designing and developing computer software for sale is exempt from the State’s tax base and, consequently, the City’s tax base.
Effective March 1, 1998, receipts from the sale of the service of installing alternative fuel refueling property (property used for storing and/or dispensing fuel) and receipts from the retail sale of alternative fuel refueling property are exempt from the State tax base and the City’s tax base (expired February 29, 2004).
Effective December 1, 1997, bus purchases and repairs, coin-operated car washes, coin-operated bulk vending machines and photocopying machines costing 50 cents or less, temporary transportation devices sold through coin-operated equipment, food or drink (except hot drinks or sandwiches) sold through coin-operated vending machines, wine or wine product furnished by the offi cial agent of a farm, winery, wholesaler, or importer at a wine tasting, and receipts from admissions to all circuses are exempt from the State’s tax base and the City’s tax base.
Effective September 1, 2000, sales taxes are repealed for candy, soda and certain fruit drinks sold for 75 cents or less through vending machines, reducing the State’s tax base and the City’s tax base.
Effective September 1, 2000, tangible personal property and building materials used in farm production, as well as utility services, and services provided to farm real property are exempt from the State’s tax base and the City’s tax base. Additionally, commercial horse boarding operations receive the same exemptions as farms.
Effective retroactive to March 1, 1997, the 1998 exemption for promotional materials is extended to prospectuses, paper, ink, mechanicals, layouts, artwork, photographs, color separations and similar property furnished to a printer for use in producing promotional materials that are then sold to the furnisher of those items.
Effective June 1, 2000, a sales tax exemption will apply to purchases of gas or electricity used in operating a gas pipeline or gas distribution line or an electric transmission or distribution line. These exemptions will reduce the State’s tax base and, consequently, the City’s tax base.
Effective December 1, 1999, the State and local sales tax exemption for hot drinks and certain food items sold from vending machines is expanded to include vending machines that accept credit or debit cards.
Effective September 12, 1998, parking charges paid to homeowners’ associations (including co-op and condominium housing) by its members, for parking space in a facility owned or operated by the association, is exempt from the 6.0 percent City sales tax and the 8.0 percent Manhattan parking surcharge. Additionally, the 1997 law that exempts parking charges from the State sales tax when the parking facility is operated by a homeowners’ association has been amended to include facilities owned by such an association even though operated by a third party (See 1997).
III-26
Appendix III-STX
processing and assembling are exempt from the City sales tax, bringing City tax law into conformity with the State.
Effective September 1, 1996, the retail sale of shopping papers to the publishers and related printing services are exempt from State and City’s sales tax base.
Effective December 1, 1995, interior decorating and design services are exempt from the City sales tax.
Effective September 1, 1995, dues paid to homeowners’ associations operating social or athletic facilities for their members are exempt from State’s sales tax base and consequently the City’s tax base.
Effective September 1, 1995, meteorological information services are exempt from the State’s sales tax base and consequently the City’s tax base.
Effective September 1, 1992, the additional cost of a new alternative fuel vehicle (AFV) above the sales price of a comparable gasoline or diesel powered vehicle and parts and labor charges related to converting a gasoline or diesel-powered vehicle to an AFV, are exempt from the State and City sales tax base. This exemption, set to expire fi ve years after the effective date was subsequently extended through February 29, 2004 and again through February 28, 2005. The exemption amount is fi xed at $3,000 per vehicle effective March 1, 2004. (Expired February 28, 2005).
Effective December 1, 1989, the City’s credit for sales tax paid on machinery and equipment used in the production of tangible personal property changed to an exemption from the City sales tax. The sales and use taxes paid was previously claimed as a credit against the City’s business and utility taxes (see All Other Tax Law Changes 1977).
Effective September 1, 1985, Manhattan residents are exempt from the 8.0 percent parking and garaging surcharge, reducing the City’s tax base.
Effective December 1, 1997 parking services sold by a homeowners’ association to its members is exempt from the State sales tax but not from the City’s 6.0 percent sales tax on parking.
Effective September 1, 1997, emissions inspection equipment purchased by an offi cial inspection station are exempt from the State’s tax base and, consequently, the City’s tax base.
Effective March 1, 1997, printed promotional materials delivered through the mail and associated shipping services are exempt from the State’s tax base and, consequently, the City’s tax base.
Effective February 1, 1997, Internet access services, defi ned as providing connection to the Internet and including the provision of communication or navigation software, an E-mail address, E-mail software, news, headlines, space for a website and website services are exempt from the State’s tax base and the City’s tax base.
Effective December 1, 1996, vehicles leased by Manhattan residents are exempt from the 8.0 percent parking and garaging surcharge, reducing the City’s tax base.
Effective December 1, 1996, parking charges paid to parking facilities owned and operated by municipal corporations, district corporations, and public benefi t corporations are exempt from State and City sales taxes. However, the 8.0 percent Manhattan parking surcharge remains in effect.
Effective September 1, 1996, certain parts, tools, supplies and services used or consumed in production processes, including fi lm production, are exempt from the City sales tax, bringing City tax law into conformity with the State. This law was amended October 1, 1997 to include live theatrical performances.
Effective September 1, 1996, the services of installing, repairing, maintaining and servicing tangible personal property used to produce a product for sale by manufacturing,
1996
1995
1992
1989
1985
Appendix III-STX
III-27
2010
2008
2007
2006
2005
with “casual” sales (those not made through a dealer) of motor vehicles that they register for the buyer. Detailed rules are prescribed concerning the duties and responsibilities of such agents with regard to collection of the sales tax.
Effective September 1, 2006, the State increased the vendor credit for quarterly and annual fi lers who fi le and fully remit their tax obligation on time by changing the calculation of the vendor credit from 3.5 percent of the quarterly State sales tax capped at a maximum credit of $150 per quarter to 5.0 percent of the quarterly State and local sales and use taxes with the maximum vendor credit capped at $200 per quarter. This increase in the vendor credit is phased in over two years as follows: (1) beginning September 1, 2006, the vendor credit will be calculated at 5.0 percent of the State and local sales taxes remitted capped at $175 per quarter; and (2) beginning March 1, 2007, the vendor credit will be calculated at 5.0 percent of the State and local sales and use taxes remitted with the maximum vendor credit capped at $200 per quarter. Only vendors who fi le quarterly or annual returns can apply for the credit.
Effective June 1, 2006, the State sales tax on motor fuel and diesel motor fuel is calculated using a cents-per-gallon rate rather than a percentage rate. The new law allows localities to conform their local sales taxes to the cents-per-gallon. The City did not conform.
Effective January 1, 2005, sellers that contract to sell to New York State agencies or public authorities goods or services valued at more than $15,000, and that make total sales delivered by any means to locations within the state of goods or taxable services valued at more than $300,000, will be required to register as sales tax vendors with the State Department of Taxation and Finance. The registration requirement may also apply to certain affi liates or subcontractors of the seller. Once registered, the seller, affi liate or subcontractor must comply with all requirements of the sales tax law. The
All Other Tax Law Changes
Effective July 1, 2010, the State closed the loophole that allowed certain vendors to claim a sale tax refund from the State for debts that are not repaid. Previously, vendors could take as a deduction the amount found worthless and charged off by the vendor.
Effective September 1, 2008, the State passed a technical correction to the upfront exemption of taxes for government entities on fuel purchases intended to ease the processing of the exemption. This technical correction gives eligibility to credit card companies and fuel distributors, which fi nance the exempt purchase of motor fuel or diesel motor fuel, to claim a refund or credit from the Department of Taxation. This eliminates the burden on government entities and retailers to fi le for the credit. The law is intended to be similar to Federal tax legislation that creates a system for credit card issuers and fuel distributors to receive refunds of the Federal excise tax on fuel purchases. Prior to the correction, fuel retailers could not “back out” the taxes at the time of sale. The exemption appeared on the credit card bill after the purchase. (Refer to Chapter 102 of the Laws of 2008).
Effective January 1, 2007, the tax law has been amended to provide that where a private label credit card account is held by a lender and all or a portion of a debt owed the lender is charged off by the lender as worthless, either the vendor or lender may claim a credit or refund for sales tax previously remitted by the vendor that is attributable to the worthless account. Prior to this amendment, only a vendor that made and fi nanced sales was eligible for the credit or refund with respect to sales tax paid on worthless accounts.
Effective December 1, 2006, registration agents (persons authorized by the Commissioner of Motor Vehicles to perform the function of registering vehicles) are authorized to collect and remit State and local sales taxes in connection
III-28
Appendix III-STX
2003, the interest rate on tax underpayments increased by two percentage points.
Cigarette stamping agents are required to prepay State and local sales taxes on the cigarettes they distribute based on a periodically adjusted base retail price established by statute. Effective September 1, 2002, the base retail price adjustment will be made using a new formula that takes into account average manufacturers’ list prices as reported to the State Department of Taxation and Finance plus the amount of the State cigarette excise tax; formerly, the adjustment was made based on changes in the U.S. Labor Department’s consumer price index for tobacco and smoking products.
Effective August 2, 2002, in order to conform to the requirements of the Federal Mobile Telecommunications Sourcing Act of 2000, State and local sales tax provisions have been amended to provide that all charges for mobile telephone service are to be taxed only at the location of the customer’s place of primary use, regardless of where the calls are actually made. “Place of primary use,” as defi ned in the Federal Act, generally means the address representative of where the customer’s use of the mobile service primarily occurs, and must be either the customer’s residential street address or the primary business street address in the case of a business customer. The sales tax provisions have also been amended to permit the unbundling of certain services sold together for a single price. For example, if taxable mobile telecommunications services are sold together with exempt wireless Internet access services for a single price, the charges for the latter, if determinable by a reasonable and verifi able standard, may be broken out and treated as separately stated, nontaxable charges.
As a result of the September 11, 2001 terrorist attack, the fi ling deadlines for the monthly and quarterly sales tax returns due after September 11, 2001 through December 10, 2001 were extended to December 10, 2001 for fi lers directly impacted by the terrorists attacks with no penalties or interest incurred.
new requirements will not apply to certain contracts, such as emergency contracts, where the seller is the only person capable of fulfi lling the contract.
Effective December 1, 2004, a refund is allowed for sales taxes paid by operators of vessels with a seating capacity greater than 20 that are used to transport passengers for hire by water. A refund is allowed for purchases of the vessels, and of parts, equipment, lubricants, diesel fuel, maintenance, servicing, or repair services related to operation of the vessels. To qualify for the refund, the vessels must be used to provide local transit service in the state pursuant to a certifi cate of public convenience and necessity or a franchise agreement with New York City.
Effective December 1, 2004, the special recordkeeping and enforcement provisions relating to parking garage operators in Manhattan to continue to ensure compliance with state and local sales taxes on parking services were made permanent. (See 1999).
Effective September 1, 2003, the City excise tax on cigarettes was added to the sales price of cigarettes on which the State and City sales and use taxes are calculated. (The NYS cigarette tax has been included in the sales and use tax base since 1989).
Effective May 24, 2003, State law requires a line on personal income tax returns for taxpayers to report use tax owed.
A New York State tax amnesty program adopted as part of the New York State budget included the State-administered City sales and use taxes. The amnesty applied to outstanding liabilities for taxable periods ending on or before December 31, 2000, or, in the case of quarterly sales tax fi lers, through tax periods ending on or before February 28, 2001. Taxpayers that qualifi ed for amnesty were eligible for a waiver of certain penalties and a two-percentage-point reduction in the otherwise applicable rate of interest. Amnesty applications were fi led during the period beginning November 18, 2002 and ending January 31, 2003. Effective April 1,
2004
2003
2002
2001
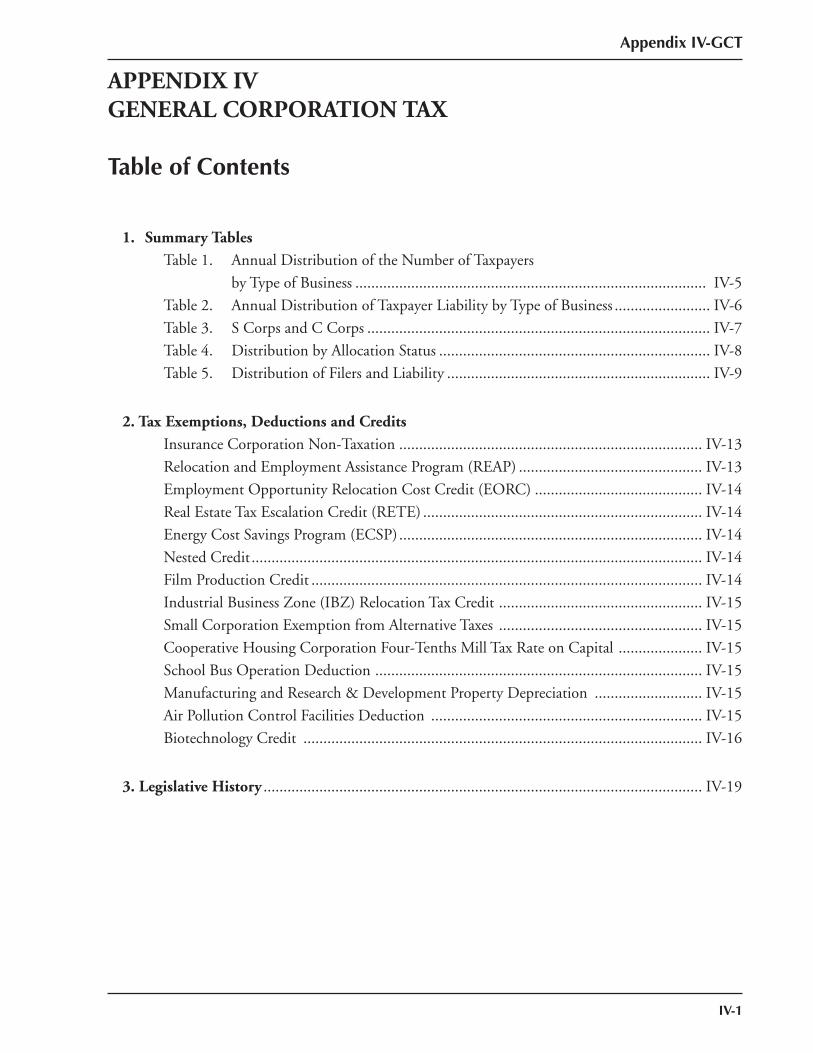
Appendix IV-GCT
IV-1
APPENDIX IVGENERAL CORPORATION TAX
Table of Contents
1. Summary Tables
Table 1. Annual Distribution of the Number of Taxpayers
by Type of Business ........................................................................................ IV-5
Table 2. Annual Distribution of Taxpayer Liability by Type of Business ........................ IV-6
Table 3. S Corps and C Corps ...................................................................................... IV-7
Table 4. Distribution by Allocation Status .................................................................... IV-8
Table 5. Distribution of Filers and Liability .................................................................. IV-9
2. Tax Exemptions, Deductions and Credits
Insurance Corporation Non-Taxation ............................................................................ IV-13
Relocation and Employment Assistance Program (REAP) .............................................. IV-13
Employment Opportunity Relocation Cost Credit (EORC) .......................................... IV-14
Real Estate Tax Escalation Credit (RETE) ...................................................................... IV-14
Energy Cost Savings Program (ECSP) ............................................................................ IV-14
Nested Credit ................................................................................................................. IV-14
Film Production Credit .................................................................................................. IV-14
Industrial Business Zone (IBZ) Relocation Tax Credit ................................................... IV-15
Small Corporation Exemption from Alternative Taxes ................................................... IV-15
Cooperative Housing Corporation Four-Tenths Mill Tax Rate on Capital ..................... IV-15
School Bus Operation Deduction .................................................................................. IV-15
Manufacturing and Research & Development Property Depreciation ........................... IV-15
Air Pollution Control Facilities Deduction .................................................................... IV-15
Biotechnology Credit .................................................................................................... IV-16
3. Legislative History .............................................................................................................. IV-19

Appendix IV-GCT
IV-2
Appendix IV-GCT
IV-3
APPENDIX IVGENERAL CORPORATION TAX
1.Summary Tables

Appendix IV-GCT
IV-4
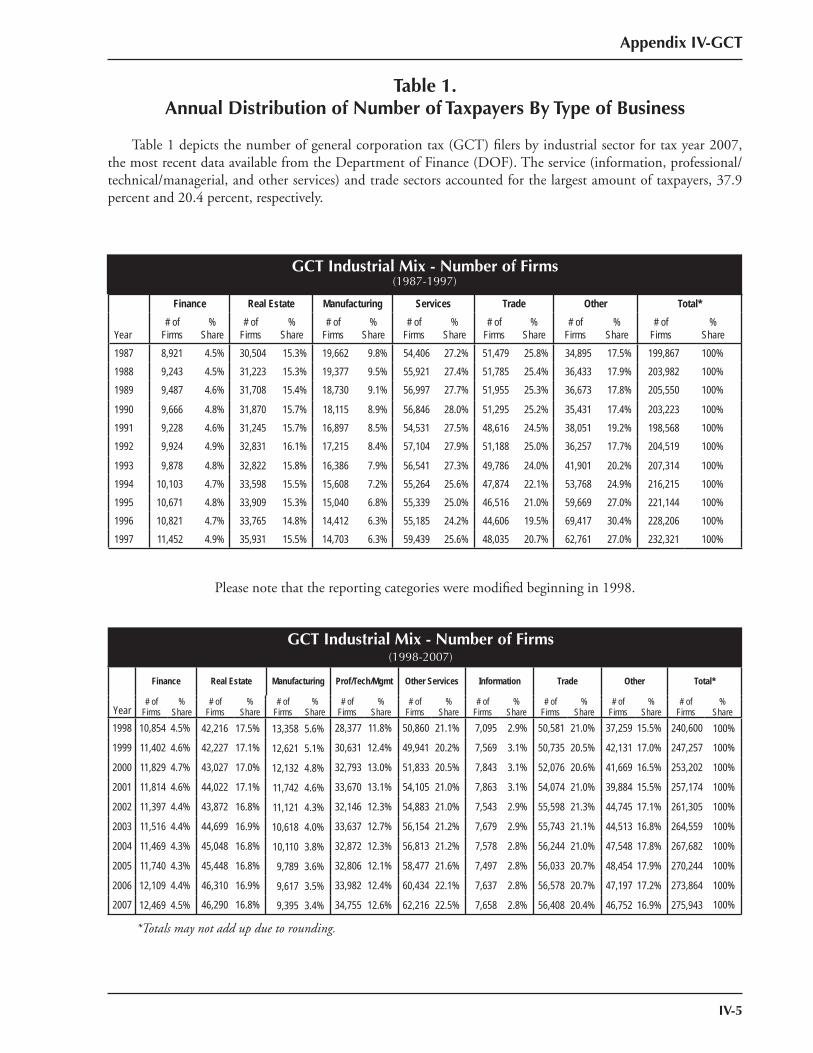
Appendix IV-GCT
IV-5
Table 1.Annual Distribution of Number of Taxpayers By Type of Business
Table 1 depicts the number of general corporation tax (GCT) fi lers by industrial sector for tax year 2007, the most recent data available from the Department of Finance (DOF). The service (information, professional/technical/managerial, and other services) and trade sectors accounted for the largest amount of taxpayers, 37.9 percent and 20.4 percent, respectively.
Year
Finance Real Estate Manufacturing Services Trade Other Total*# of
Firms%
Share# of
Firms%
Share# of
Firms%
Share# of
Firms%
Share# of
Firms%
Share# of
Firms%
Share# of
Firms%
Share1987 8,921 4.5% 30,504 15.3% 19,662 9.8% 54,406 27.2% 51,479 25.8% 34,895 17.5% 199,867 100%1988 9,243 4.5% 31,223 15.3% 19,377 9.5% 55,921 27.4% 51,785 25.4% 36,433 17.9% 203,982 100%1989 9,487 4.6% 31,708 15.4% 18,730 9.1% 56,997 27.7% 51,955 25.3% 36,673 17.8% 205,550 100%
1990 9,666 4.8% 31,870 15.7% 18,115 8.9% 56,846 28.0% 51,295 25.2% 35,431 17.4% 203,223 100%1991 9,228 4.6% 31,245 15.7% 16,897 8.5% 54,531 27.5% 48,616 24.5% 38,051 19.2% 198,568 100%1992 9,924 4.9% 32,831 16.1% 17,215 8.4% 57,104 27.9% 51,188 25.0% 36,257 17.7% 204,519 100%
1993 9,878 4.8% 32,822 15.8% 16,386 7.9% 56,541 27.3% 49,786 24.0% 41,901 20.2% 207,314 100%1994 10,103 4.7% 33,598 15.5% 15,608 7.2% 55,264 25.6% 47,874 22.1% 53,768 24.9% 216,215 100%1995 10,671 4.8% 33,909 15.3% 15,040 6.8% 55,339 25.0% 46,516 21.0% 59,669 27.0% 221,144 100%1996 10,821 4.7% 33,765 14.8% 14,412 6.3% 55,185 24.2% 44,606 19.5% 69,417 30.4% 228,206 100%1997 11,452 4.9% 35,931 15.5% 14,703 6.3% 59,439 25.6% 48,035 20.7% 62,761 27.0% 232,321 100%
GCT Industrial Mix - Number of Firms
GCT Industrial Mix - Number of Firms
(1987-1997)
(1998-2007)
Please note that the reporting categories were modifi ed beginning in 1998.
Finance Real Estate Manufacturing Prof/Tech/Mgmt Other Services Information Trade Other Total*
# ofFirms
%Share
# ofFirms
%Share
# ofFirms
%Share
# ofFirms
%Share
# ofFirms
%Share
# ofFirms
%Share
# ofFirms
%Share
# ofFirms
%Share
# ofFirms
%ShareYear
1998 10,854 4.5% 42,216 17.5% 13,358 5.6% 28,377 11.8% 50,860 21.1% 7,095 2.9% 50,581 21.0% 37,259 15.5% 240,600 100%
1999 11,402 4.6% 42,227 17.1% 12,621 5.1% 30,631 12.4% 49,941 20.2% 7,569 3.1% 50,735 20.5% 42,131 17.0% 247,257 100%
2000 11,829 4.7% 43,027 17.0% 12,132 4.8% 32,793 13.0% 51,833 20.5% 7,843 3.1% 52,076 20.6% 41,669 16.5% 253,202 100%
2001 11,814 4.6% 44,022 17.1% 11,742 4.6% 33,670 13.1% 54,105 21.0% 7,863 3.1% 54,074 21.0% 39,884 15.5% 257,174 100%
2002 11,397 4.4% 43,872 16.8% 11,121 4.3% 32,146 12.3% 54,883 21.0% 7,543 2.9% 55,598 21.3% 44,745 17.1% 261,305 100%
2003 11,516 4.4% 44,699 16.9% 10,618 4.0% 33,637 12.7% 56,154 21.2% 7,679 2.9% 55,743 21.1% 44,513 16.8% 264,559 100%
2004 11,469 4.3% 45,048 16.8% 10,110 3.8% 32,872 12.3% 56,813 21.2% 7,578 2.8% 56,244 21.0% 47,548 17.8% 267,682 100%
2005 11,740 4.3% 45,448 16.8% 9,789 3.6% 32,806 12.1% 58,477 21.6% 7,497 2.8% 56,033 20.7% 48,454 17.9% 270,244 100%
2006 12,109 4.4% 46,310 16.9% 9,617 3.5% 33,982 12.4% 60,434 22.1% 7,637 2.8% 56,578 20.7% 47,197 17.2% 273,864 100%
2007 12,469 4.5% 46,290 16.8% 9,395 3.4% 34,755 12.6% 62,216 22.5% 7,658 2.8% 56,408 20.4% 46,752 16.9% 275,943 100%
*Totals may not add up due to rounding.
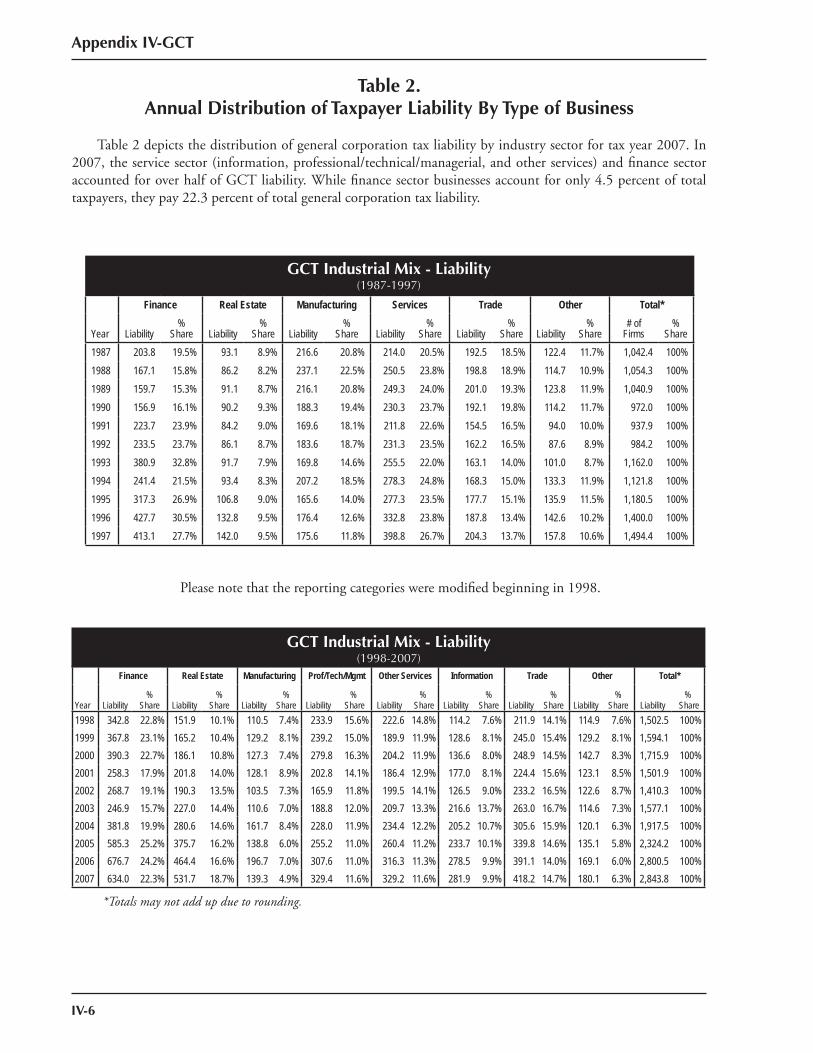
Appendix IV-GCT
IV-6
Table 2.Annual Distribution of Taxpayer Liability By Type of Business
Table 2 depicts the distribution of general corporation tax liability by industry sector for tax year 2007. In 2007, the service sector (information, professional/technical/managerial, and other services) and fi nance sector accounted for over half of GCT liability. While fi nance sector businesses account for only 4.5 percent of total taxpayers, they pay 22.3 percent of total general corporation tax liability.
GCT Industrial Mix - Liability(1987-1997)
Year
Finance Real Estate Manufacturing Services Trade Other Total*
Liability%
Share Liability%
Share Liability%
Share Liability%
Share Liability%
Share Liability%
Share# of
Firms%
Share1987 203.8 19.5% 93.1 8.9% 216.6 20.8% 214.0 20.5% 192.5 18.5% 122.4 11.7% 1,042.4 100%1988 167.1 15.8% 86.2 8.2% 237.1 22.5% 250.5 23.8% 198.8 18.9% 114.7 10.9% 1,054.3 100%1989 159.7 15.3% 91.1 8.7% 216.1 20.8% 249.3 24.0% 201.0 19.3% 123.8 11.9% 1,040.9 100%1990 156.9 16.1% 90.2 9.3% 188.3 19.4% 230.3 23.7% 192.1 19.8% 114.2 11.7% 972.0 100%1991 223.7 23.9% 84.2 9.0% 169.6 18.1% 211.8 22.6% 154.5 16.5% 94.0 10.0% 937.9 100%1992 233.5 23.7% 86.1 8.7% 183.6 18.7% 231.3 23.5% 162.2 16.5% 87.6 8.9% 984.2 100%1993 380.9 32.8% 91.7 7.9% 169.8 14.6% 255.5 22.0% 163.1 14.0% 101.0 8.7% 1,162.0 100%1994 241.4 21.5% 93.4 8.3% 207.2 18.5% 278.3 24.8% 168.3 15.0% 133.3 11.9% 1,121.8 100%1995 317.3 26.9% 106.8 9.0% 165.6 14.0% 277.3 23.5% 177.7 15.1% 135.9 11.5% 1,180.5 100%1996 427.7 30.5% 132.8 9.5% 176.4 12.6% 332.8 23.8% 187.8 13.4% 142.6 10.2% 1,400.0 100%1997 413.1 27.7% 142.0 9.5% 175.6 11.8% 398.8 26.7% 204.3 13.7% 157.8 10.6% 1,494.4 100%
Please note that the reporting categories were modifi ed beginning in 1998.
Year
Finance Real Estate Manufacturing Prof/Tech/Mgmt Other Services Information Trade Other Total*
Liability%
Share Liability%
Share Liability%
Share Liability%
Share Liability%
Share Liability%
Share Liability%
Share Liability%
Share Liability%
Share 1998 342.8 22.8% 151.9 10.1% 110.5 7.4% 233.9 15.6% 222.6 14.8% 114.2 7.6% 211.9 14.1% 114.9 7.6% 1,502.5 100%1999 367.8 23.1% 165.2 10.4% 129.2 8.1% 239.2 15.0% 189.9 11.9% 128.6 8.1% 245.0 15.4% 129.2 8.1% 1,594.1 100%2000 390.3 22.7% 186.1 10.8% 127.3 7.4% 279.8 16.3% 204.2 11.9% 136.6 8.0% 248.9 14.5% 142.7 8.3% 1,715.9 100%2001 258.3 17.9% 201.8 14.0% 128.1 8.9% 202.8 14.1% 186.4 12.9% 177.0 8.1% 224.4 15.6% 123.1 8.5% 1,501.9 100%2002 268.7 19.1% 190.3 13.5% 103.5 7.3% 165.9 11.8% 199.5 14.1% 126.5 9.0% 233.2 16.5% 122.6 8.7% 1,410.3 100%2003 246.9 15.7% 227.0 14.4% 110.6 7.0% 188.8 12.0% 209.7 13.3% 216.6 13.7% 263.0 16.7% 114.6 7.3% 1,577.1 100%2004 381.8 19.9% 280.6 14.6% 161.7 8.4% 228.0 11.9% 234.4 12.2% 205.2 10.7% 305.6 15.9% 120.1 6.3% 1,917.5 100%2005 585.3 25.2% 375.7 16.2% 138.8 6.0% 255.2 11.0% 260.4 11.2% 233.7 10.1% 339.8 14.6% 135.1 5.8% 2,324.2 100%2006 676.7 24.2% 464.4 16.6% 196.7 7.0% 307.6 11.0% 316.3 11.3% 278.5 9.9% 391.1 14.0% 169.1 6.0% 2,800.5 100%2007 634.0 22.3% 531.7 18.7% 139.3 4.9% 329.4 11.6% 329.2 11.6% 281.9 9.9% 418.2 14.7% 180.1 6.3% 2,843.8 100%
GCT Industrial Mix - Liability(1998-2007)
*Totals may not add up due to rounding.
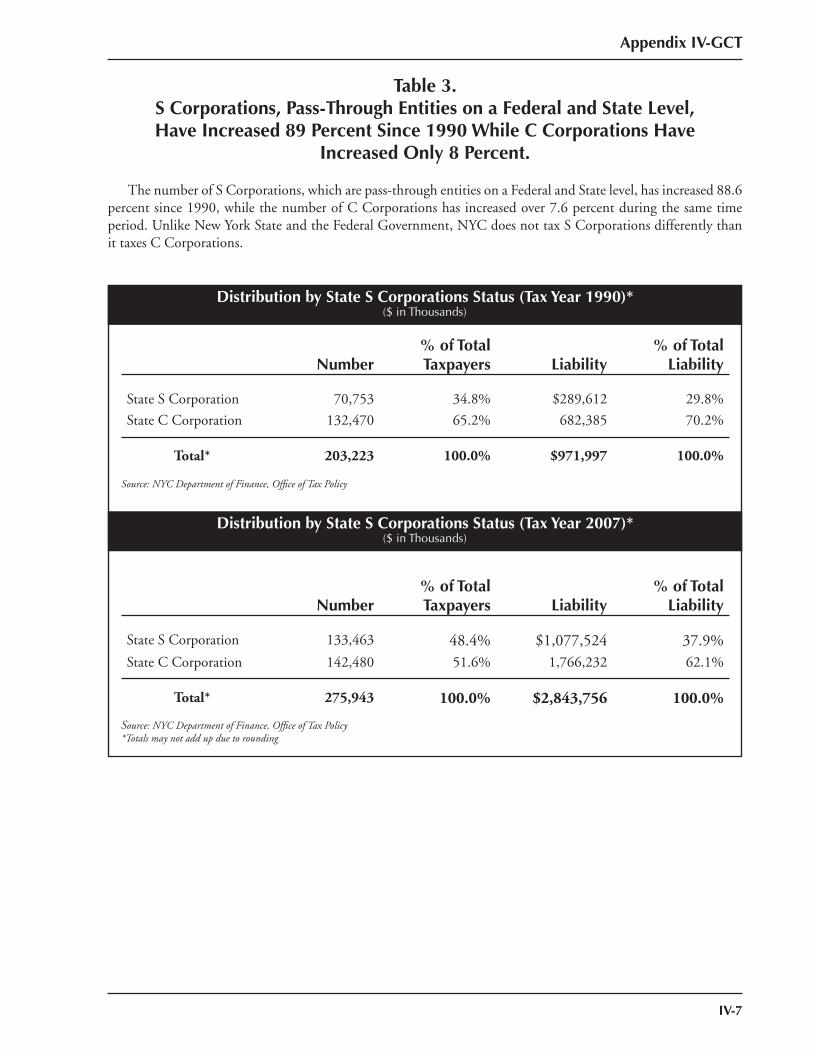
Appendix IV-GCT
IV-7
*s
Table 3.S Corporations, Pass-Through Entities on a Federal and State Level,Have Increased 89 Percent Since 1990 While C Corporations Have
Increased Only 8 Percent.
The number of S Corporations, which are pass-through entities on a Federal and State level, has increased 88.6 percent since 1990, while the number of C Corporations has increased over 7.6 percent during the same time period. Unlike New York State and the Federal Government, NYC does not tax S Corporations differently than it taxes C Corporations.
Distribution by State S Corporations Status (Tax Year 1990)*
Distribution by State S Corporations Status (Tax Year 2007)*
($ in Thousands)
($ in Thousands)
Number% of TotalTaxpayers Liability
% of Total Liability
State S Corporation 70,753 34.8% $289,612 29.8%State C Corporation 132,470 65.2% 682,385 70.2%
Total* 203,223 100.0% $971,997 100.0%
Number% of TotalTaxpayers Liability
% of Total Liability
State S Corporation 133,463 48.4% $1,077,524 37.9%State C Corporation 142,480 51.6% 1,766,232 62.1%
Total* 275,943 100.0% $2,843,756 100.0%
Source: NYC Department of Finance, Offi ce of Tax Policy
Source: NYC Department of Finance, Offi ce of Tax Policy*Totals may not add up due to rounding
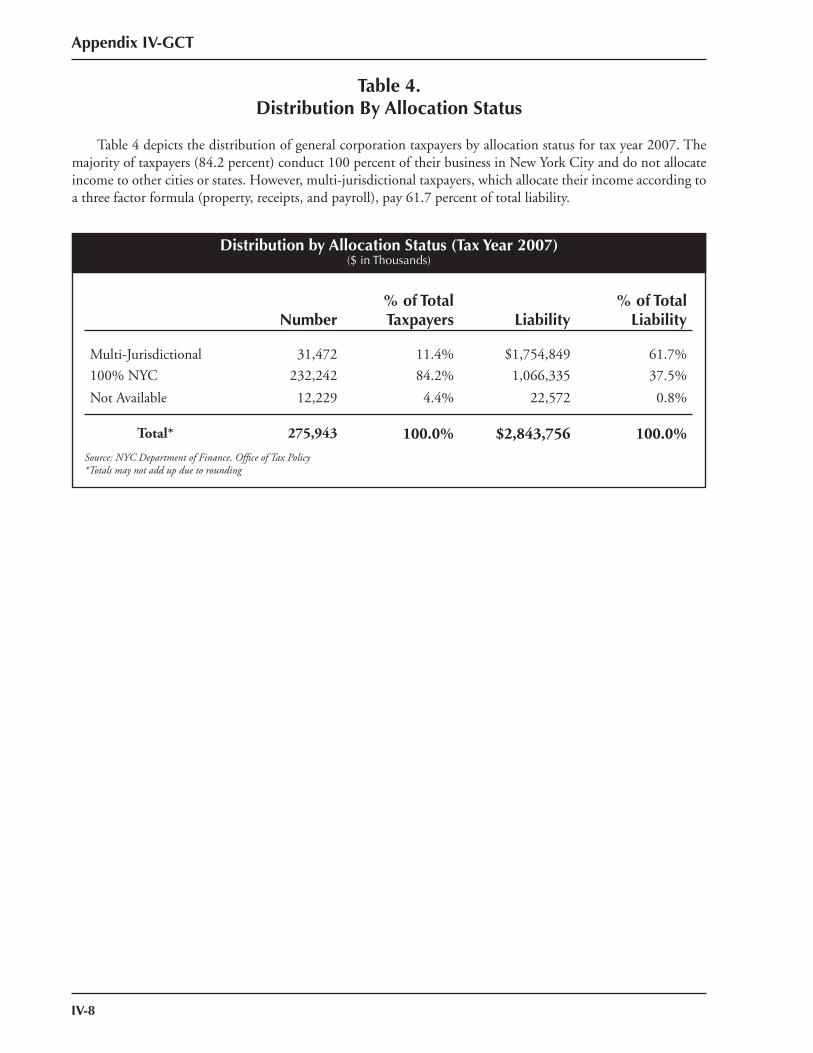
Appendix IV-GCT
IV-8
Table 4.Distribution By Allocation Status
Table 4 depicts the distribution of general corporation taxpayers by allocation status for tax year 2007. The majority of taxpayers (84.2 percent) conduct 100 percent of their business in New York City and do not allocate income to other cities or states. However, multi-jurisdictional taxpayers, which allocate their income according to a three factor formula (property, receipts, and payroll), pay 61.7 percent of total liability.
Distribution by Allocation Status (Tax Year 2007)($ in Thousands)
Number% of TotalTaxpayers Liability
% of Total Liability
Multi-Jurisdictional 31,472 11.4% $1,754,849 61.7%100% NYC 232,242 84.2% 1,066,335 37.5%Not Available 12,229 4.4% 22,572 0.8%
Total* 275,943 100.0% $2,843,756 100.0% Source: NYC Department of Finance, Offi ce of Tax Policy *Totals may not add up due to rounding
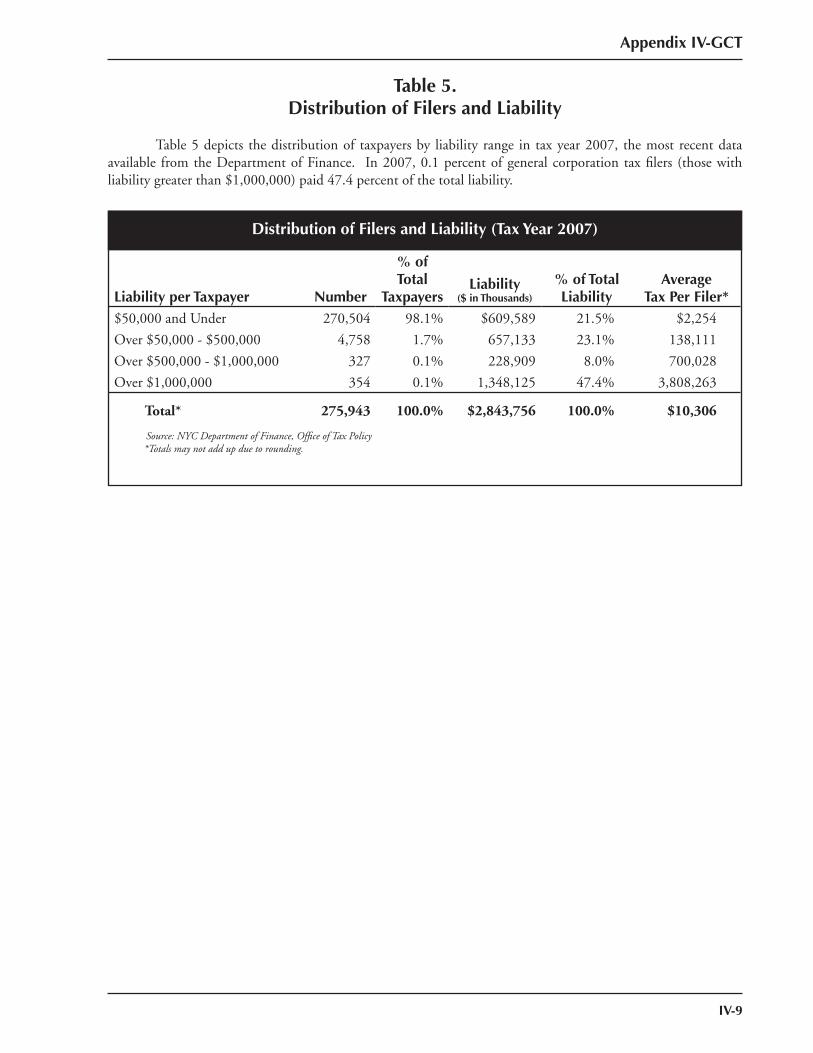
Appendix IV-GCT
IV-9
Table 5.Distribution of Filers and Liability
Table 5 depicts the distribution of taxpayers by liability range in tax year 2007, the most recent data available from the Department of Finance. In 2007, 0.1 percent of general corporation tax fi lers (those with liability greater than $1,000,000) paid 47.4 percent of the total liability.
Distribution of Filers and Liability (Tax Year 2007)
% of Total
Taxpayers% of TotalLiability
Average Tax Per Filer*Liability per Taxpayer Number
Liability($ in Thousands)
$50,000 and Under 270,504 98.1% $609,589 21.5% $2,254
Over $50,000 - $500,000 4,758 1.7% 657,133 23.1% 138,111
Over $500,000 - $1,000,000 327 0.1% 228,909 8.0% 700,028
Over $1,000,000 354 0.1% 1,348,125 47.4% 3,808,263
Total* 275,943 100.0% $2,843,756 100.0% $10,306
Source: NYC Department of Finance, Offi ce of Tax Policy * Totals may not add up due to rounding.

IV-10
Appendix IV-GCT
IV-11
Appendix IV-GCT
APPENDIX IVGENERAL CORPORATION TAX
2.Tax Exemptions, Deductions and Credits

IV-12
Appendix IV-GCT
IV-13
Appendix IV-GCT
TAX EXEMPTIONS, DEDUCTIONS AND CREDITS
Several tax exemptions and credits are available to New York City corporations. Each of the following exemptions and credits reduces total tax liability:
Insurance Corporation Non-Taxation
To promote the growth of the insurance industry in New York City, insurance fi rms operating in the City that provide insurance services, or even non-insurance activities such as real estate and fi nancial services, are exempt from taxation. However, they are liable to pay New York State’s Franchise Tax on Insurance Corporations (Article 33).
Relocation and Employment Assistance Program (REAP) The Relocation and Employment Assistance Program (REAP) was established in 1987 to encourage firms with a regular business location south of 96th Street in Manhattan to expand or relocate their business anywhere else in the City. The program originally provided a credit of $500 per relocated employee for a period of 12 years. The credit amount was subsequently increased to $1,000 in 1995 and could be carried forward for five years. As of July 1, 2000 the credit amount was raised to $3,000 and was refundable for the year of relocation and the succeeding four years. Businesses engaged in retail activity or hotel services cannot receive the REAP credit. Under a 2004 statutory amendment, firms may claim a $3,000 per relocated employee credit if they relocate to qualifying areas in Lower Manhattan (below Houston Street) from outside the City. To qualify for the credit, a firm must have been established outside the City for at least 24 months prior to relocating and must not have employed any persons in the City between January 1, 2002 and the date it leases or purchases the relocation premises. The credit is available for 12 years; if the amount of the credit exceeds a firm’s annual tax liability, the excess is refundable for the year of relocation and the next four years. Unused credits that are not refundable can be carried forward for five years. The Lower Manhattan credit has been made retroactive to
relocations occurring on or after July 1, 2003. The 2004 law also expanded and changed the pre-existing REAP by allowing leased premises to qualify for eligibility based on improvements made by the tenant to their own space rather than requiring building-wide improvements and by increasing the cap on the number of employees for which small businesses can claim the credit. Previously, firms could only claim the credit for a maximum of twice the number of employees that worked outside the eligible area in the year prior to the year of the relocation. The 2004 amendment allows firms to claim up to 100 employees for the credit. An additional provision was added permitting a discretionary reduction in the REAP benefit in instances in which a firm relocates from Lower Manhattan to another REAP-eligible area. The regular benefit will apply if the relocation involves no more than 100 employees; however, if the number of relocated employees exceeds 100, the Mayor or his or her designee can raise the number of employees eligible for the credit. In 2005, the Lower Manhattan REAP was amended so that businesses that had employees working in Manhattan between January 1, 2002 and the business’ lease or contract to purchase date receive the $3,000 per employee relocation credit. For this amendment, businesses have to relocate all or part of their business operations to Lower Manhattan on or after June 30, 2005, make improvements of at least 50 percent of the property’s assessed value or $25 per square foot to the space, and sign a three-year lease. Existing, non-New York City employees relocated to the Lower Manhattan location are eligible for the REAP credit. Additionally, in order to receive the credit, the number of relocated employees must be equal to or greater than the lesser of (1) 25 percent of the business’s pre-relocation NYC employee base or (2) 250 employees. Firms can also receive the REAP credit for new employees added during the fi rst fi ve years at the Lower Manhattan location. The Lower Manhattan REAP benefit sunsets for new applicants on July 1, 2008. The pre-existing program, which had technically expired on July 1, 2003, has been reinstated retroactive to that date and has also been extended through December 31, 2008. In 2007, applicants for REAP available in all parts of the City except the area below 96th Street in Manhattan, have been given additional time to meet certain REAP requirements. The new timetable applies to eligible premises that receives a building permit after August 1, 2007 but before December 31, 2008, extends the deadline for commencing
IV-14
improvements to December 30, 2008, and extends the deadline for filing a preliminary application for benefits to June 20, 2013. On June 30, 2008, legislation signed into law extends the general deadline for obtaining a certifi cate of eligibility for the REAP credit from July 1, 2008 to July 1, 2013. (Administrative Code. § 11-503(i), 11-604.17, 11-643.7, 11-1105.2, 22-621, 22-622 and Chapter 6-B of Title 22)
Employment Opportunity Relocation Costs Credit (EORC) The Employment Relocation Credit is available to firms relocating to New York City from outside New York State. The credit is allowed for certain costs incurred in relocating commercial or industrial jobs to New York City. To be eligible for the credit, a taxpayer must relocate a minimum of ten full-time jobs. The allowable credit is based upon relocation costs incurred by the taxpayer during the taxable year and may not exceed a maximum of $300 for each commercial job and $500 for each industrial job. With the creation of the Industrial Business Zone (IBZ) Relocation credit established in 2006 (see IV¬15), the EORC was amended so that any business located within an IBZ and in contract to purchase or lease premises on or after July 1, 2005 is not eligible for the EORC for industrial employment opportunities. (Administrative Code. § 11-503(f ), 11-604.14)
Real Estate Tax Escalation Credit (RETE) Taxpayers relocating to the City from outside of New York State who have created at least 100 full-time industrial or commercial jobs in the City are eligible for the Real Estate Tax Escalation Credit (RETE). The value of the credit is equal to the additional rent paid as a result of higher real estate taxes. (Administrative Code§ 11-503(e), 11604.13)
Energy Cost Savings Program (ECSP) Prior to November 1, 2000, an eligible commercial or industrial firm that relocated or expanded operations to Manhattan north of 96th Street, Brooklyn, the Bronx, Queens or Staten Island that purchased electricity or natural gas from a vendor or utility not under the direction of the Public Service Commission could receive a credit through the City’s Energy Cost Savings Program (ECSP) equal to 30 percent of the total electricity bill or 20 percent of the
total natural gas bill. Effective November 1, 2000, ECSP was extended and restructured. The credit mechanism was repealed and all benefits are through the utility vendor. The utility provider will be credited the forgone revenue against the City’s utility tax (See Non-Charter Mandated Taxes: Utility Tax). Additionally, the discount on energy costs is calculated as a percentage of the cost of delivery, rather than the combined costs of the delivery and purchase of the commodity. Eligible firms now will receive a 45 percent discount off the delivery portion of the electric bill and 35 percent off gas delivery costs. These changes parallel energy deregulation which enables businesses to purchase the electric or natural gas commodity on the deregulated market and realize additional savings. Also, under the new law, ECSP benefits were extended to fi rms using space in buildings in Long Island City or Fulton Ferry that are converted from manufacturing to commercial use, and benefits will only be available to utility firms directly supervised by PSC. The new law was set to sunset June 30, 2010 but was extended to July 1, 2013. (Administrative § 11-503(h), 11¬604.16, 11-643.5(c), 11-704.1, 11-1105.1 and Chapter 6 of Title 22)
Nested Credit A corporate partner in a business subject to the unincorporated business tax (UBT) may claim a credit against the corporate tax (UBT/GCT nested credit) for its share of the unincorporated business’s UBT if the corporation’s distributive share of the income, gain, loss or deductions from the partnership is subject to the GCT. In 1996, the calculation of the credit was modified to allow a carry forward of the credit to be taken against tax liability in any of seven succeeding taxable years. (NYS Tax Law § 1310(e))
Film Production Credit
For tax years beginning on or after January 1, 2005, film and television companies may claim a credit against the general corporation (or unincorporated business) tax equal to five percent of specified production costs incurred in producing a qualified film or television program in the City, in addition to the 10 percent credit they can claim against the State’s Article 9-A franchise tax or personal income tax. The total amount of City credits to be allocated per calendar year was originally $12.5 million; if the total amount of allocated credits applied exceeds
Appendix IV-GCT
IV-15
Appendix IV-GCT
the aggregate amount of credits allocated ($12.5 million), the excess is treated as having been applied for on the first day of the subsequent year. The total amount of credits to be allocated in four years was $50 million. The credit was set to expire on August 20, 2008. Effective July 11, 2006, the fi lm credit was expanded, and the credit to be allocated was increased to $30 million per calendar year, with the credit applied mostly through the GCT, but also a smaller yet signifi cant amount through the UBT. The former allocation policy was kept in place: allocated credits which exceed $30 million per calendar year can be carried over to the following year. The tax credit was also extended through December 31, 2011. State legislation also enacted a State credit for qualifying costs of producing certain TV, radio and movie theatre commercials. The City has the authorization to adopt a local law for a similar credit but has taken no action to date on that authorization. (Administrative Code. § 11-604.20)
Industrial Business Zone (IBZ) Relocation Tax Credit
For tax years beginning on or after January 1, 2006, an eligible business can receive a credit of $1,000 per full-time employee against the general corporation tax or the unincorporated business tax. In order to be eligible for the credit, a business must be involved in industrial and/or manufacturing activity and have relocated to an IBZ on or after July 1, 2005. The business must have been located in New York City or outside New York State for 24 consecutive months before relocating to an IBZ. The credit is capped at the lesser of $100,000 or the actual relocation cost. The credit is not granted to an eligible business that receives the REAP, the Lower Manhattan REAP credit, or assistance through a grant program administered by the business relocation assistance corporation or the NYC printers relocation fund grant. (Administrative Code. § 11-503(n), 11-526, 22-626)
Small Corporation Exemption From Alternative Taxes For tax years beginning on or after January 1, 2007, a small corporation, defined as having Federal gross income of less than $250,000, a 100 percent local business allocation to New York City and no investment or subsidiary capital, is exempt from the alternative income-plus-compensation tax base and the business and investment capital tax base.
Cooperative Housing Corporation Four-tenths Mill Tax Rate on Capital
Capital allocated to New York City is normally taxed at the rate of 0.15 percent. However, cooperative housing corporations are taxed at a rate of 0.04 percent on capital allocated to the City.
School Bus Operation Deduction
Income derived from the operation of school buses, where the customer is a school district, a corporation or an association organized and operated exclusively for religious, charitable or educational purposes, is excludable from taxable income.
Manufacturing and Research & Development Property Depreciation
New York City taxpayers are allowed special deductions for depreciation of certain eligible manufacturing and research-and-development property. For property acquired after December 31, 1967, the taxpayer may deduct from its allocated net income up to double the federal depreciation on qualified property, provided the deduction was not taken prior and the property is used for research and development for experimental and laboratory concerns.
Air Pollution Control Facilities Deduction
Eligible taxpayers are entitled to a special deduction for expenditures paid or incurred during the taxable year for the construction, reconstruction, erection or improvement of Air Pollution Control Facilities. Such facilities must be certified by the New York State Commissioner of Environmental Conservation or the State commissioner’s designated representative.
IV-16
Appendix IV-GCT
Biotechnology Credit
Corporations are eligible for a credit against their corporate tax liability for qualifi ed expenditures related to costs related to qualifi ed research and development of property, qualifi ed research expenses and qualifi ed high-technology training costs. To be eligible, the fi rm most not have more than 100 full-time employees, of which 75 percent must be located in the City and its annual receipts are less than $10 million. A fi rm’s total annual credit cannot exceed $250,000 if they raise employment levels by 105 percent from a base year (credit cannot exceed $125,000 if a fi rm raises employment levels by less than 105 percent from a base year), and the total cost of the credits to the City is capped at $3 million between both the GCT and UBT.

APPENDIX IVGENERAL CORPORATION TAX
3.Legislative History
Appendix IV-GCT
IV-17

Appendix IV-GCT
IV-18
Appendix IV-GCT
IV-19
20092008
2007
General Corporation Tax:Legislative HistoryMulti-jurisdiction fi rms will allocate their net business income according to a single sales factor, replacing the three-factor allocation formula between property, payroll and receipts. The new singles sale factor will be phased in over a ten year period, effective on or after January 1, 2009. Certain receipts from the services of registered brokers and dealers of securities and commodities must now be sourced using the customer’s domicile.
Effective on or after January 1, 2009, fi rms with substantial intercorporate transactions must fi le a mandatory combined return, regardless of the transfer prices charged in those transactions. Additionally, captive regulated investment companies (RIC) and captive real estate investment trusts (REIT) must be included in the tax return of a taxpayer owning more than 50 percent of the RIC or REIT. A captive REIT or RIC is defi ned as not regularly traded on an established securities market and is at least 50 percent owned by a federally taxable corporation.
Effective on or after January 1, 2009, the GCT minimum tax has been altered from $300 to a graduated minimum tax range of $25 to $5,000, based on the taxpayers annual receipts allocated to New York City.
Effective on or after January 1, 2009, the maximum amount that can be owed under the alternative general corporation tax measured by business and investment capital has been increased from $350,000 to $1 million.
Effective on or after January 1, 2009, fi rms owned by bank holding companies that relied on “grandfathered” fi ling status to pay GCT tax as part of the Gramm-Leach-Bliley transitional provision will now have to fi le under the BCT. These
companies will no longer rely on this special status and must now fi le a Banking Corporation Tax return instead.
The Federal qualifi ed production activities income (QPAI) deduction allowed under section 199 of the IRC will not be allowed for purposes of the City general corporation tax beginning on or after January 1, 2008.
Legislation signed into law in June 2008 extends the issuance of REAP certifi cates of eligibility from June 30, 2008 to June 30, 2013. For details please refer to the Tax Exemptions, Deductions and Credits section of this appendix.
The city’s higher rates for general corporate tax, currently at 8.85 percent on taxable income, 1.5 mills on business and investment capital, 0.75 mill on subsidiary capital and a $300 fi xed-dollar minimum tax are extended through tax year 2011.
General corporation tax liability is determined through four alternative calculations, with the amount due as the highest of the four. Under one of the calculations, compensation paid to greater-than-fi ve-percent stockholders is added back to entire net income, $40,000 is subtracted, and the balance is multiplied by a percentage, formerly 30 percent, to produce the alternative tax base. For tax years beginning after 2006, New York State enacted a 50 percent phase-out of the alternative tax base percentage over the next four years, scheduled as follows: for tax year 2007 the base tax rate of 8.85 percent is multiplied by 26.25 percent; for tax year 2008, the base rate is multiplied by 22.5 percent; for tax year 2009 the base rate is multiplied by 18.75 percent; and for tax years beginning after 2009, the base rate is multiplied by 15 percent.
In order to simplify tax fi ling for small businesses, for tax years beginning on 2007 and thereafter, small businesses with less than $250,000 in federal gross income,
Appendix IV-GCT
IV-20
2006
2005
2004
2003
a 100 percent business allocation to the City and no investment or subsidiary capital will be exempt from the alternative income-plus-stockholder-compensation tax base and the capital tax base. For such taxpayers, other than a New York State S corporation, they may also elect to use their New York State entire net income, including modifi cations to add back any state deductions for General Corporation Tax paid, as their New York City entire net income.
Applicants for City business tax credits under REAP available in all parts of the City except the area below 96th Street in Manhattan have been given additional time to meet certain REAP requirements. For details please refer to the Tax Exemptions, Deductions and Credits of this appendix.
Legislation enacted in 2006 extended the City’s fi lm production credit and increased annual cost cap. For details please refer to the Tax Exemptions, Deductions and Credits of this appendix.
Additional fi rms were made eligible for the Lower Manhattan Relocation and Employment Assistant Program (REAP) credit. For details please refer to the Tax Exemptions, Deductions and Credits of this appendix.
For tax years beginning after 2005, a qualifying taxpayer that relocates to an industrial business zone where its business activities are industrial or manufacturing will qualify for a credit of $1,000 for each full-time employee.
The city’s higher rates for general corporate tax, currently at 8.85 percent on taxable income, 1.5 mills on business and investment capital, 0.75 mill on subsidiary capital and a $300 fi xed-dollar minimum tax are extended through tax years 2008.
Enacted as law in 2004, the City’s Relocation and Employment Assistance
Program (REAP) was extended, providing tax credits against the general and banking corporation taxes, unincorporated business tax and utility tax for relocating and adding employees at qualifying premises in designated areas of the City. The credit was also expanded to include premises in lower Manhattan, below Houston Street. Prior to the expansion, qualifi ed premises were areas north of 96th street in Manhattan, and the outer boroughs. For details please refer to the Tax Exemptions, Deductions and Credits of this appendix.
For tax years beginning on or after January 1, 2004, a fi lm production credit is allowed against the State Article 9-A franchise tax and the State personal income tax. The City, with the authorization by the State to adopt a local law, also enacted a tax credit on fi lm production cost against GCT or UBT. For details please refer the Tax Exemptions, Deductions and Credits of this appendix.
Beginning on or after January 1, 2004, the City’s general corporation tax will decouple from certain federal depreciation and expensing provisions that allow favorable tax treatment for large sport utility vehicles.
With the passage of the Federal Jobs and Growth Tax Relief Reconciliation Act of 2003, an additional fi rst-year depreciation deduction equal to 50 percent of the adjusted basis of qualifi ed property was provided for taxpayers. This provision enhanced the 30 percent depreciation deduction enacted in 2002 by the Job Creation and Worker Assistance Act, which is only applicable to “qualifi ed property” in the New York Liberty Zone (NYLZ) and the Resurgence Zone. All of the eligibility rules that applied to the 2002 deduction apply to the 2003 deduction.
Effective on and after July 1, 2003, the fl oor on corporate tax overpayment interest was eliminated. Prior to the
Appendix IV-GCT
IV-21
2002
2001
legislative change, the interest rate on overpayment was six percent (4.0 percent on mandatory 25 percent prepayment of estimated tax). Additionally, interest charged on underpayment was increased to 5.0 percent plus the federal short-term interest rate from 3.0 percent plus the federal short-term interest rate.
In conformity with New York State, the City’s general corporation tax has been amended to disallow deduction expenses for royalty and interest payments made by a fi rm to a related entity or fi rm. The excluded payment deductions are related to expenses from the use of licenses, trademarks, copyrights, trade names and other intangible assets.
The city’s higher rates for general corporate tax, currently at 8.85 percent on taxable income, 1.5 mills on business and investment capital, 0.75 mill on subsidiary capital and a $300 fi xed-dollar minimum tax are extended through tax year 2005.
With the passage of the Federal Job Creation and Worker Assistance Act of 2002, taxpayers were allowed an additional 30 percent depreciation deduction in the fi rst year “qualifi ed property” is placed in service. A similar depreciation deduction for “qualifi ed property” in the New York Liberty Zone (NYLZ) and the Resurgence Zone became allowed. The NYLZ generally encompasses the area in the borough of Manhattan below Canal Street and the Resurgence Zone encompasses the area between Canal Street and Houston Street. Additionally, the Act also allows NYLZ leasehold improvements to be depreciated over a fi ve-year period using a straight line method as well as an additional fi rst-year expense deduction of up to $35,000 for “qualifi ed NYLZ property”. To avoid a signifi cant loss of revenue, New York City general corporation tax law was amended to limit the depreciation deductions to “qualifi ed property” within the NYLZ and the Resurgence Zone only and to
limit the additional fi rst-year expense deduction to “qualifi ed NYLZ property.”
The general corporation tax on Publishers and Broadcasters has been updated for special sourcing rules. Under the new rule, the income tax formula will apportion actual receipts from subscribers of cable television services rather than the old allocation method that sourced income based on audience location. Additionally, the sourcing rules for broadcasters were broaden to include “cable, direct or indirect satellite transmission and any other means of transmission” that parallels 1996 amendments to the UBT. These amendments are effective beginning in tax year 2002.
Under the Federal Small Business Job Protection Act of 1996, an S corporation that solely owns (100 percent) a Qualifi ed Subchapter S Subsidiary (QSSS), is allowed to treat the fi nancial assets and income of that QSSS as belonging to the parent company for federal tax purposes. The City’s general corporation tax has been amended to clarifying that QSSS are to be treated as a separate corporate entity that must determine its income for tax fi ling without regard to the Federal QSSS election. These amendments to clarify the status of QSSS apply retroactively to tax years beginning after 1996.
In an effort to remove ambiguity and clarify tax language, for City corporate tax purposes, the term “partnership” will mean any entity classifi ed as a partnership for federal tax purposes.
In an effort to promote greater uniformity between the State and City corporate income tax laws, amendments were made to the City’s tax in 2001 which include: (1) the repeal of City tax provisions enacted in 1990 that penalized certain highly leveraged mergers, consolidation and acquisitions for tax years beginning after 1999; (2) the modifi cation to the calculation of the mandatory fi rst estimated tax installment to allow
Appendix IV-GCT
IV-22
2000
1999
1998
1996
credits to be deducted in determining the amount of the prior year’s tax used to calculate the fi rst installment; and (3) the amendment of various tax provisions governing defi ciencies and overpayments attributable to net operating loss carrybacks to include defi ciencies in overpayments attributable to carrybacks of capital losses.
The higher rates of the City general corporate tax, currently 8.85 percent on taxable income, 1.5 mills on business and investment capital, 0.75 mill on subsidiary capital and a $300 fi xed dollar minimum was through tax year 2003.
As a result of the September 11, 2001 terrorist attack, the fi ling deadline for the quarterly estimated tax payment due September 17, 2001 was extended to December 17, 2001.
In the wake of the Gramm-Leach-Bliley Act of 1999, that eliminated restrictions on affi liations between banks and other fi nancial services fi rms, the City permitted certain corporations that were subject to the corporate tax or banking corporation tax to continue the same taxable status to prevent an abrupt shift in taxable status. Firms that are 65 percent or more owned by a bank or a subsidiary of a bank can fi le under either the general corporation tax or the banking corporation tax.
The City’s Economic Development Program has been expanded to enhance the benefi t of REAP. The credit has been increased to $3,000 per eligible employee from $1,000, while excess credit, beyond a taxpayers liability is allowed to be carried forward for four years, instead of fi ve years under the prior provisions of the program.
The Relocation and Employment Assistance Program (REAP) is extended for four years. A credit for $1,000 for each eligible employee relocated from Manhattan South of 96th street or from any location outside New York City is
extended to July 1, 2003. For details please refer to the Tax Exemptions, Deductions and Credits of this appendix.The State and City program includes a provision that would continue to provide a 50 percent reduction in property transfer taxes to existing REITs, with the benefi ts extended to September 1, 2002.
For taxable years beginning on or after January 1, 1998, the city general corporate tax will not apply to an alien corporation whose activities in New York City are limited solely to investing or trading stocks, securities or commodities for its own account.
For tax years beginning on or after July 1, 1996, manufacturing fi rms are allowed to “double weight” the receipts factor in the allocation formula. This enables City-located manufacturers to allocate more of their income outside the City, thus reducing their City business income taxes and aiding their competitiveness.
For tax years beginning on or after July 1, 1996, the “place of business” requirement for allocation of taxable income for the general corporation tax has been repealed. Under City tax law, a business operating in the City with a place of business outside the City is allowed to apportion its business income according to a three-factor formula based on the share of its total property, payroll and receipts in New York City. The right to apportion income was previously not available to fi rms that sold goods or services throughout the country or the world, but only had a City business location. These fi rms were required to pay tax on all taxable income. All taxpayers conducting business outside the City are now allowed to allocate income with the elimination of the “place of business” requirement.
Legislation enacted in 1996 modifi ed a 1994 legislation to promote REITs by making the 50 percent Real Property Transfer Tax (RPTT) rate reduction permanent during a two-year period for
Appendix IV-GCT
IV-23
1994
1993
1987-1988
qualifying transfers of property made in connection with the formation of a REIT, and extended the benefi t to certain transfers to preexisting REITs. Through legislative extensions, the reduced tax rate for transfer of real property into existing REITs has been continued until August 31, 2008.
New York State enacted legislation in 1994 which allowed the formation of a new type of business entity in New York State, a limited liability partnership or company (LLC). LLCs have some of the limited liability aspects of corporations and the tax treatment of partnerships for Federal, State and local tax purposes. LLCs pay a fee to the State, and those conducting business in the City are subject to the City unincorporated business tax. Over time, the number of corporations is expected to decline as new businesses increasingly opt for the LLC business form.
The general corporation tax’s income-plus-compensation alternative tax computation was modifi ed by phasing out the offi cers’ add-back requirement and by increasing the per-fi rm statutory deduction. For tax years beginning on or after July 1, 1996, 25 percent of offi cers’ compensation was exempted from the add-back requirement. For tax years beginning on or after July 1, 1997, the per-fi rm statutory deduction was raised from $15,000 to $30,000. For tax years beginning on or after July 1, 1998, 50 percent of offi cers’ compensation was exempt from the add-back requirement. The per-fi rm statutory deduction was raised from $30,000 to $40,000 effective July 1, 1998. For tax years beginning on or after July 1, 1999, offi cers’ compensation is no longer included in the base for calculating the income-plus-compensation tax base. Compensation paid to individual shareholders owning at least fi ve percent of the fi rm remains fully subject to the alternative tax. In order to promote Real Estate Investment Trusts (REITs) as investment vehicles,
legislation enacted in 1994 provided eligible REITs tax relief against the NYC Real Property Transfer Tax (RPTT). The measure was intended to encourage the purchase of NYC properties by REITs by providing a 50 percent RPTT rate reduction during a two-year period for qualifying transfers of property made in connection with the formation of a REIT. Conforming to federal tax treatment, REITs, which are subject to GCT, pays no City corporate tax on incomes pass through to shareholders. The dividend or distributed gain is taxed at the shareholder level. Any undistributed income the REIT possesses is subject to taxation. The tax liability of a REIT is determined by utilizing only the net income and fi xed dollar minimum corporate tax base. The Federal Omnibus Budget Reconciliation Act of 1993 enacted a host of tax law changes including a number of provisions affecting corporate taxes which fl ow through to the City tax. Among the major provisions was a mark-to-market inventory valuation rule change for securities dealers, a reduction in the business meals and entertainment deduction, and an increase in the capital investment limit allowed for small businesses.
Effective July 1, 1990, the general corporation tax was amended by local law to conform the fi ling schedule for estimated payments to the schedule used at the Federal and New York State levels, making estimated payments for calendar year corporations due in September and December.
The City took steps to return the “windfall” (created by the broadening of the corporate tax base through the Federal Tax Reform Act of 1986) by lowering its corporate tax rate by 0.15 percentage points, to 8.85 percent, effective for tax year 1987. In July of 1988, the State Legislature passed a bill to conform the City tax law to changes
Appendix IV-GCT
IV-24
made as part of Business Tax Reform and Rate Reduction Act (BTRRRA). As part of this legislation, which became effective in tax year 1988, the City: (1) exempted real estate mortgage investment conduits from the tax; (2) established a ceiling on the alternative capital base of $350,000; (3) amended the defi nitions of subsidiary, investment, and business capital to allow for the deduction of long-term debt; (4) required leased personal property to be included in the formula for calculating the business allocation percentage; (5) eliminated the deduction for franchise, income or similar taxes paid to other states and localities; and (6) repealed the interest add-back rule which required that 90 percent of the interest paid to a shareholder owning more than fi ve percent of issued capital stock be added back to income when computing entire net income.
The Federal Tax Reform Act of 1986 substantially broadened the State and City corporate tax base by limiting or eliminating various deductions (such as entertainment expenses and natural resource depletion allowances) and accelerating taxable income by requiring corporations to recognize income earlier than under previous law. In order to return the business tax “windfall” which was expected to result from this change, New York State passed the Business Tax Reform and Rate Reduction Act (BTRRRA) in 1987.
In response to business tax reform initiatives at the Federal level, New York City altered the general corporation tax. The Federal Economic Recovery Tax Act of 1981 and the Tax Equity and Fiscal Responsibility Act of 1982 substantially altered Federal business taxes by instituting the Accelerated Cost Recovery System (ACRS) and more liberal leaseback provisions. Under the provisions of ACRS, property could be rapidly depreciated in the fi rst few years of service. Since the general corporation tax uses the Federal defi nition of net
taxable income as the starting point in determining tax liability, fi rms depreciating property under ACRS would have been able to drastically lower their New York City tax obligation. To avoid a substantial loss of revenue, the City uncoupled from the Federal ACRS in 1982 and required fi rms to depreciate assets under the Asset Depreciation Range. In 1985, however, the City joined with New York State in allowing New York State assets to be depreciated under ACRS. In 1994, ACRS was extended to property placed in service outside the State.
Prior to 1977, the tax rate on net corporate earnings was 10.05 percent. In 1977, the rate was reduced to 9.5 and in 1978 the rate was again lowered to 9.0 percent. For tax years after 1978 the general corporation tax rate was reduced to 8.85 percent.
1986
1978
1982

1.History of Tax Collections V-3
Appendix V
APPENDIX VHISTORY OF TAX COLLECTIONS
V-1
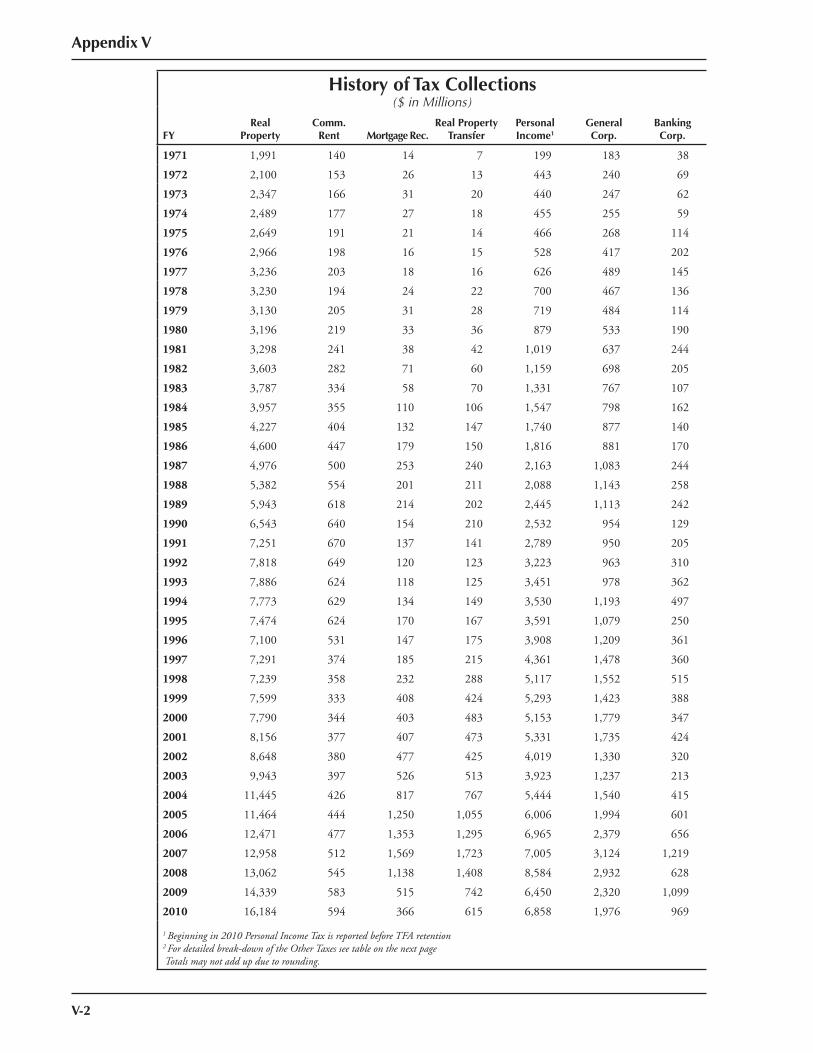
Appendix V
V-2
History of Tax Collections($ in Millions)
FYReal
PropertyComm.
Rent Mortgage Rec.Real Property
TransferPersonalIncome1
GeneralCorp.
BankingCorp.
1971 1,991 140 14 7 199 183 38
1972 2,100 153 26 13 443 240 69
1973 2,347 166 31 20 440 247 62
1974 2,489 177 27 18 455 255 59
1975 2,649 191 21 14 466 268 114
1976 2,966 198 16 15 528 417 202
1977 3,236 203 18 16 626 489 145
1978 3,230 194 24 22 700 467 136
1979 3,130 205 31 28 719 484 114
1980 3,196 219 33 36 879 533 190
1981 3,298 241 38 42 1,019 637 244
1982 3,603 282 71 60 1,159 698 205
1983 3,787 334 58 70 1,331 767 107
1984 3,957 355 110 106 1,547 798 162
1985 4,227 404 132 147 1,740 877 140
1986 4,600 447 179 150 1,816 881 170
1987 4,976 500 253 240 2,163 1,083 244
1988 5,382 554 201 211 2,088 1,143 258
1989 5,943 618 214 202 2,445 1,113 242
1990 6,543 640 154 210 2,532 954 129
1991 7,251 670 137 141 2,789 950 205
1992 7,818 649 120 123 3,223 963 310
1993 7,886 624 118 125 3,451 978 362
1994 7,773 629 134 149 3,530 1,193 497
1995 7,474 624 170 167 3,591 1,079 250
1996 7,100 531 147 175 3,908 1,209 361
1997 7,291 374 185 215 4,361 1,478 360
1998 7,239 358 232 288 5,117 1,552 515
1999 7,599 333 408 424 5,293 1,423 388
2000 7,790 344 403 483 5,153 1,779 347
2001 8,156 377 407 473 5,331 1,735 424
2002 8,648 380 477 425 4,019 1,330 320
2003 9,943 397 526 513 3,923 1,237 213
2004 11,445 426 817 767 5,444 1,540 415
2005 11,464 444 1,250 1,055 6,006 1,994 601
2006 12,471 477 1,353 1,295 6,965 2,379 656
2007 12,958 512 1,569 1,723 7,005 3,124 1,219
2008 13,062 545 1,138 1,408 8,584 2,932 628
2009 14,339 583 515 742 6,450 2,320 1,099
2010 16,184 594 366 615 6,858 1,976 969
1 Beginning in 2010 Personal Income Tax is reported before TFA retention2 For detailed break-down of the Other Taxes see table on the next page Totals may not add up due to rounding.
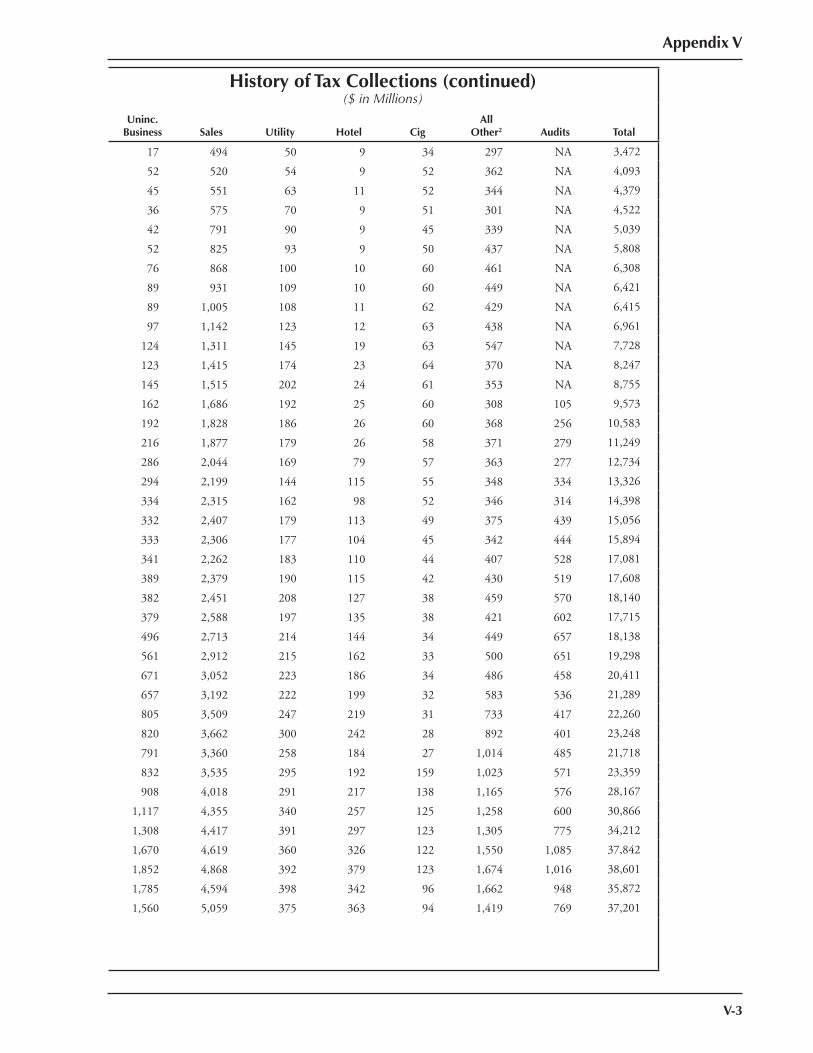
Appendix V
V-3
History of Tax Collections (continued)($ in Millions)
Uninc.Business Sales Utility Hotel Cig
AllOther2 Audits Total
17 494 50 9 34 297 NA 3,472
52 520 54 9 52 362 NA 4,093
45 551 63 11 52 344 NA 4,379
36 575 70 9 51 301 NA 4,522
42 791 90 9 45 339 NA 5,039
52 825 93 9 50 437 NA 5,808
76 868 100 10 60 461 NA 6,308
89 931 109 10 60 449 NA 6,421
89 1,005 108 11 62 429 NA 6,415
97 1,142 123 12 63 438 NA 6,961
124 1,311 145 19 63 547 NA 7,728
123 1,415 174 23 64 370 NA 8,247
145 1,515 202 24 61 353 NA 8,755
162 1,686 192 25 60 308 105 9,573
192 1,828 186 26 60 368 256 10,583
216 1,877 179 26 58 371 279 11,249
286 2,044 169 79 57 363 277 12,734
294 2,199 144 115 55 348 334 13,326
334 2,315 162 98 52 346 314 14,398
332 2,407 179 113 49 375 439 15,056
333 2,306 177 104 45 342 444 15,894
341 2,262 183 110 44 407 528 17,081
389 2,379 190 115 42 430 519 17,608
382 2,451 208 127 38 459 570 18,140
379 2,588 197 135 38 421 602 17,715
496 2,713 214 144 34 449 657 18,138
561 2,912 215 162 33 500 651 19,298
671 3,052 223 186 34 486 458 20,411
657 3,192 222 199 32 583 536 21,289
805 3,509 247 219 31 733 417 22,260
820 3,662 300 242 28 892 401 23,248
791 3,360 258 184 27 1,014 485 21,718
832 3,535 295 192 159 1,023 571 23,359
908 4,018 291 217 138 1,165 576 28,167
1,117 4,355 340 257 125 1,258 600 30,866
1,308 4,417 391 297 123 1,305 775 34,212
1,670 4,619 360 326 122 1,550 1,085 37,842
1,852 4,868 392 379 123 1,674 1,016 38,601
1,785 4,594 398 342 96 1,662 948 35,872
1,560 5,059 375 363 94 1,419 769 37,201
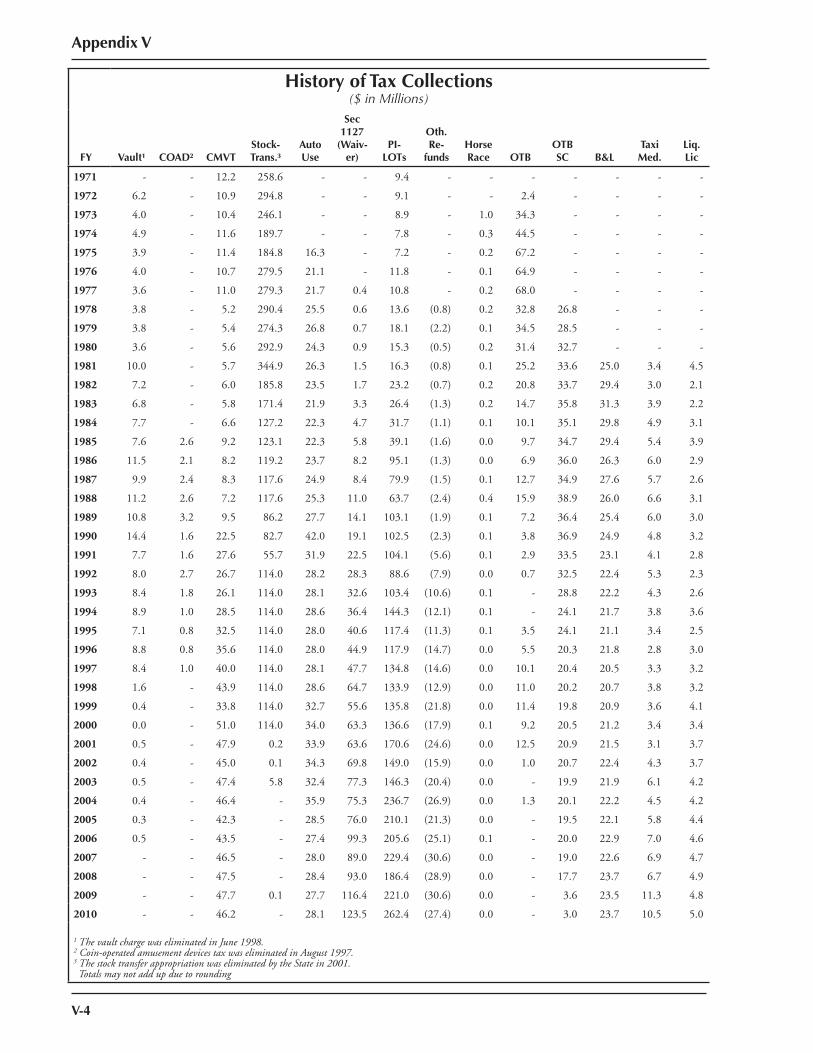
Appendix V
V-4
History of Tax Collections($ in Millions)
FY Vault¹ COAD² CMVTStock-Trans.³
Auto Use
Sec 1127
(Waiv-er)
PI-LOTs
Oth. Re-
fundsHorse Race OTB
OTB SC B&L
Taxi Med.
Liq. Lic
1971 - - 12.2 258.6 - - 9.4 - - - - - - -
1972 6.2 - 10.9 294.8 - - 9.1 - - 2.4 - - - -
1973 4.0 - 10.4 246.1 - - 8.9 - 1.0 34.3 - - - -
1974 4.9 - 11.6 189.7 - - 7.8 - 0.3 44.5 - - - -
1975 3.9 - 11.4 184.8 16.3 - 7.2 - 0.2 67.2 - - - -
1976 4.0 - 10.7 279.5 21.1 - 11.8 - 0.1 64.9 - - - -
1977 3.6 - 11.0 279.3 21.7 0.4 10.8 - 0.2 68.0 - - - -
1978 3.8 - 5.2 290.4 25.5 0.6 13.6 (0.8) 0.2 32.8 26.8 - - -
1979 3.8 - 5.4 274.3 26.8 0.7 18.1 (2.2) 0.1 34.5 28.5 - - -
1980 3.6 - 5.6 292.9 24.3 0.9 15.3 (0.5) 0.2 31.4 32.7 - - -
1981 10.0 - 5.7 344.9 26.3 1.5 16.3 (0.8) 0.1 25.2 33.6 25.0 3.4 4.5
1982 7.2 - 6.0 185.8 23.5 1.7 23.2 (0.7) 0.2 20.8 33.7 29.4 3.0 2.1
1983 6.8 - 5.8 171.4 21.9 3.3 26.4 (1.3) 0.2 14.7 35.8 31.3 3.9 2.2
1984 7.7 - 6.6 127.2 22.3 4.7 31.7 (1.1) 0.1 10.1 35.1 29.8 4.9 3.1
1985 7.6 2.6 9.2 123.1 22.3 5.8 39.1 (1.6) 0.0 9.7 34.7 29.4 5.4 3.9
1986 11.5 2.1 8.2 119.2 23.7 8.2 95.1 (1.3) 0.0 6.9 36.0 26.3 6.0 2.9
1987 9.9 2.4 8.3 117.6 24.9 8.4 79.9 (1.5) 0.1 12.7 34.9 27.6 5.7 2.6
1988 11.2 2.6 7.2 117.6 25.3 11.0 63.7 (2.4) 0.4 15.9 38.9 26.0 6.6 3.1
1989 10.8 3.2 9.5 86.2 27.7 14.1 103.1 (1.9) 0.1 7.2 36.4 25.4 6.0 3.0
1990 14.4 1.6 22.5 82.7 42.0 19.1 102.5 (2.3) 0.1 3.8 36.9 24.9 4.8 3.2
1991 7.7 1.6 27.6 55.7 31.9 22.5 104.1 (5.6) 0.1 2.9 33.5 23.1 4.1 2.8
1992 8.0 2.7 26.7 114.0 28.2 28.3 88.6 (7.9) 0.0 0.7 32.5 22.4 5.3 2.3
1993 8.4 1.8 26.1 114.0 28.1 32.6 103.4 (10.6) 0.1 - 28.8 22.2 4.3 2.6
1994 8.9 1.0 28.5 114.0 28.6 36.4 144.3 (12.1) 0.1 - 24.1 21.7 3.8 3.6
1995 7.1 0.8 32.5 114.0 28.0 40.6 117.4 (11.3) 0.1 3.5 24.1 21.1 3.4 2.5
1996 8.8 0.8 35.6 114.0 28.0 44.9 117.9 (14.7) 0.0 5.5 20.3 21.8 2.8 3.0
1997 8.4 1.0 40.0 114.0 28.1 47.7 134.8 (14.6) 0.0 10.1 20.4 20.5 3.3 3.2
1998 1.6 - 43.9 114.0 28.6 64.7 133.9 (12.9) 0.0 11.0 20.2 20.7 3.8 3.2
1999 0.4 - 33.8 114.0 32.7 55.6 135.8 (21.8) 0.0 11.4 19.8 20.9 3.6 4.1
2000 0.0 - 51.0 114.0 34.0 63.3 136.6 (17.9) 0.1 9.2 20.5 21.2 3.4 3.4
2001 0.5 - 47.9 0.2 33.9 63.6 170.6 (24.6) 0.0 12.5 20.9 21.5 3.1 3.7
2002 0.4 - 45.0 0.1 34.3 69.8 149.0 (15.9) 0.0 1.0 20.7 22.4 4.3 3.7
2003 0.5 - 47.4 5.8 32.4 77.3 146.3 (20.4) 0.0 - 19.9 21.9 6.1 4.2
2004 0.4 - 46.4 - 35.9 75.3 236.7 (26.9) 0.0 1.3 20.1 22.2 4.5 4.2
2005 0.3 - 42.3 - 28.5 76.0 210.1 (21.3) 0.0 - 19.5 22.1 5.8 4.4
2006 0.5 - 43.5 - 27.4 99.3 205.6 (25.1) 0.1 - 20.0 22.9 7.0 4.6
2007 - - 46.5 - 28.0 89.0 229.4 (30.6) 0.0 - 19.0 22.6 6.9 4.7
2008 - - 47.5 - 28.4 93.0 186.4 (28.9) 0.0 - 17.7 23.7 6.7 4.9
2009 - - 47.7 0.1 27.7 116.4 221.0 (30.6) 0.0 - 3.6 23.5 11.3 4.8
2010 - - 46.2 - 28.1 123.5 262.4 (27.4) 0.0 - 3.0 23.7 10.5 5.0
1 The vault charge was eliminated in June 1998.2 Coin-operated amusement devices tax was eliminated in August 1997.3 The stock transfer appropriation was eliminated by the State in 2001. Totals may not add up due to rounding
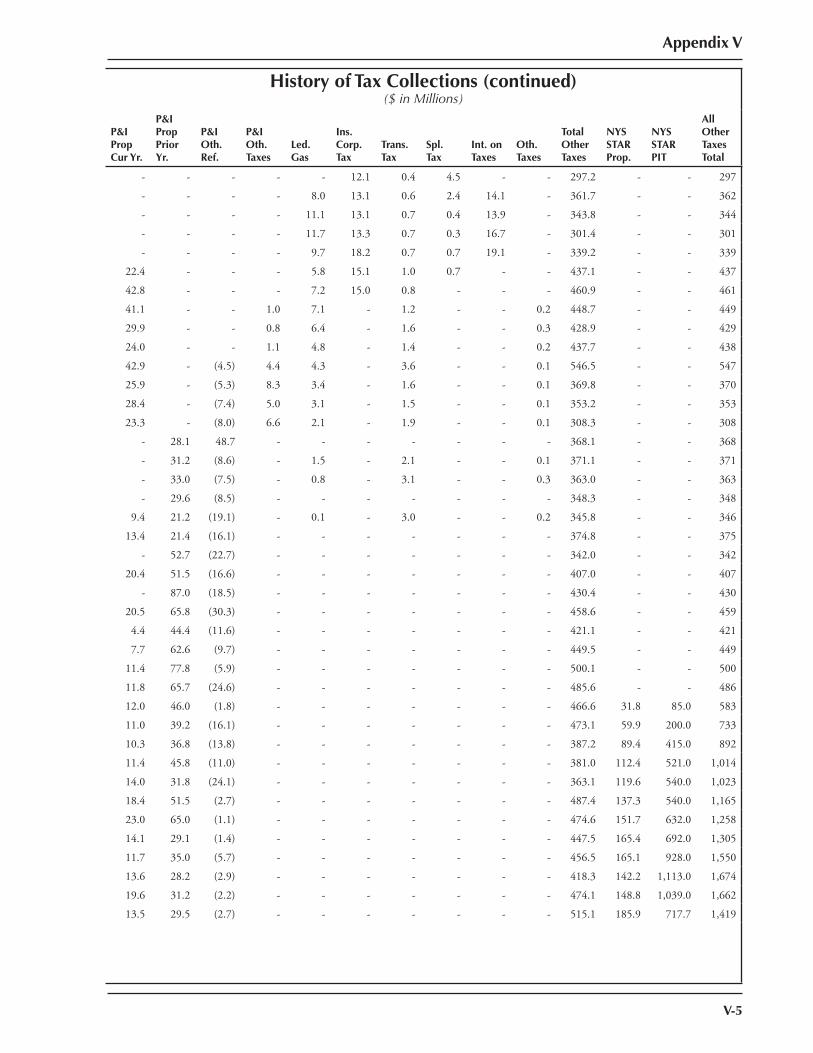
Appendix V
V-5
History of Tax Collections (continued)($ in Millions)
P&I Prop Cur Yr.
P&I Prop Prior Yr.
P&I Oth. Ref.
P&I Oth. Taxes
Led. Gas
Ins. Corp. Tax
Trans. Tax
Spl. Tax
Int. on Taxes
Oth. Taxes
Total Other Taxes
NYS STARProp.
NYS STAR PIT
All Other Taxes Total
- - - - - 12.1 0.4 4.5 - - 297.2 - - 297
- - - - 8.0 13.1 0.6 2.4 14.1 - 361.7 - - 362
- - - - 11.1 13.1 0.7 0.4 13.9 - 343.8 - - 344
- - - - 11.7 13.3 0.7 0.3 16.7 - 301.4 - - 301
- - - - 9.7 18.2 0.7 0.7 19.1 - 339.2 - - 339
22.4 - - - 5.8 15.1 1.0 0.7 - - 437.1 - - 437
42.8 - - - 7.2 15.0 0.8 - - - 460.9 - - 461
41.1 - - 1.0 7.1 - 1.2 - - 0.2 448.7 - - 449
29.9 - - 0.8 6.4 - 1.6 - - 0.3 428.9 - - 429
24.0 - - 1.1 4.8 - 1.4 - - 0.2 437.7 - - 438
42.9 - (4.5) 4.4 4.3 - 3.6 - - 0.1 546.5 - - 547
25.9 - (5.3) 8.3 3.4 - 1.6 - - 0.1 369.8 - - 370
28.4 - (7.4) 5.0 3.1 - 1.5 - - 0.1 353.2 - - 353
23.3 - (8.0) 6.6 2.1 - 1.9 - - 0.1 308.3 - - 308
- 28.1 48.7 - - - - - - - 368.1 - - 368
- 31.2 (8.6) - 1.5 - 2.1 - - 0.1 371.1 - - 371
- 33.0 (7.5) - 0.8 - 3.1 - - 0.3 363.0 - - 363
- 29.6 (8.5) - - - - - - - 348.3 - - 348
9.4 21.2 (19.1) - 0.1 - 3.0 - - 0.2 345.8 - - 346
13.4 21.4 (16.1) - - - - - - - 374.8 - - 375
- 52.7 (22.7) - - - - - - - 342.0 - - 342
20.4 51.5 (16.6) - - - - - - - 407.0 - - 407
- 87.0 (18.5) - - - - - - - 430.4 - - 430
20.5 65.8 (30.3) - - - - - - - 458.6 - - 459
4.4 44.4 (11.6) - - - - - - - 421.1 - - 421
7.7 62.6 (9.7) - - - - - - - 449.5 - - 449
11.4 77.8 (5.9) - - - - - - - 500.1 - - 500
11.8 65.7 (24.6) - - - - - - - 485.6 - - 486
12.0 46.0 (1.8) - - - - - - - 466.6 31.8 85.0 583
11.0 39.2 (16.1) - - - - - - - 473.1 59.9 200.0 733
10.3 36.8 (13.8) - - - - - - - 387.2 89.4 415.0 892
11.4 45.8 (11.0) - - - - - - - 381.0 112.4 521.0 1,014
14.0 31.8 (24.1) - - - - - - - 363.1 119.6 540.0 1,023
18.4 51.5 (2.7) - - - - - - - 487.4 137.3 540.0 1,165
23.0 65.0 (1.1) - - - - - - - 474.6 151.7 632.0 1,258
14.1 29.1 (1.4) - - - - - - - 447.5 165.4 692.0 1,305
11.7 35.0 (5.7) - - - - - - - 456.5 165.1 928.0 1,550
13.6 28.2 (2.9) - - - - - - - 418.3 142.2 1,113.0 1,674
19.6 31.2 (2.2) - - - - - - - 474.1 148.8 1,039.0 1,662
13.5 29.5 (2.7) - - - - - - - 515.1 185.9 717.7 1,419

V-6


![Undiscovered Personal Income tax Analysis and Revenue Forecasting [UPITARF]](https://img.pdfslide.us/doc/110x75/5568f256d8b42aff2e8b48a6/undiscovered-personal-income-tax-analysis-and-revenue-forecasting-upitarf.jpg)