Embed Size (px)
Citation preview
Prepared by the
April 2021
Of f i c e o f Of f i c e o f L E G I S L AT I V E S E R V I C E SL E G I S L AT I V E S E R V I C E SNew Jersey LegislatureNew Jersey Legislature
TAX AND REVENUEOUTLOOK
A N A LY S I S O F T H E N E W J E R S E Y B U D G E T
F I S C A L Y E A R 2021-2022
S E N AT E B U D G E T A N D A P P R O P R I AT I O N S C O M M I T T E E
Paul A. Sarlo (D), 36th District (Parts of Bergen and Passaic), ChairSandra B. Cunningham (D), 31st District (Part of Hudson), Vice-ChairDawn Marie Addiego (D), 8th District (Parts of Atlantic, Burlington and Camden)Nilsa Cruz-Perez (D), 5th District (Parts of Camden and Gloucester)Patrick J. Diegnan, Jr. (D), 18th District (Part of Middlesex)Linda R. Greenstein (D), 14th District (Parts of Mercer and Middlesex)Declan J. O’Scanlon, Jr. (R), 13th District (Part of Monmouth)Steven V. Oroho (R), 24th District (All of Sussex, and parts of Morris and Warren)M. Teresa Ruiz (D), 29th District (Part of Essex)Troy Singleton (D), 7th District (Part of Burlington)Michael L. Testa, Jr. (R), 1st District (All of Cape May, parts of Atlantic and Cumberland)Samuel D. Thompson (R), 12th District (Parts of Burlington, Middlesex, Monmouth and Ocean)
G E N E R A L A S S E M B LY B U D G E T C O M M I T T E E
Eliana Pintor Marin (D), 29th District (Part of Essex), ChairJohn J. Burzichelli (D), 3rd District (All of Salem, parts of Cumberland and Gloucester), Vice-ChairDaniel R. Benson (D), 14th District (Parts of Mercer and Middlesex)Robert D. Clifton (R), 12th District (Parts of Burlington, Middlesex, Monmouth and Ocean)Serena DiMaso (R), 13th District (Part of Monmouth)Gordon M. Johnson (D), 37th District (Part of Bergen)John F. McKeon (D), 27th District (Parts of Essex and Morris)Nancy F. Muñoz (R), 21st District (Parts of Morris, Somerset and Union)Carol A. Murphy (D), 7th District (Part of Burlington)Verlina Reynolds-Jackson (D), 15th District (Parts of Hunterdon and Mercer)William W. Spearman (D), 5th District (Parts of Camden and Gloucester)Benjie E. Wimberly (D), 35th District (Parts of Bergen and Passaic)Harold J. “Hal” Wirths (R), 24th District (All of Sussex, and parts of Morris and Warren)
O F F I C E O F L E G I S L AT I V E S E R V I C E S
Thomas Koenig, Legislative Budget and Finance Offi cerVacant, Assistant Legislative Budget and Finance Offi cer
Marvin W. Jiggetts, Director, Central Staff David Drescher, Section Chief, Revenue, Finance and Appropriations Section
NEW JERSEY STATE LEGISLATURENEW JERSEY STATE LEGISLATURE
This report was prepared by the Revenue, Finance and Appropriations Section of the Offi ce of Legislative Services under the direction of the Legislative Budget and Finance Offi cer. The primary author was Jordan M. DiGiovanni.
Contributors include Scott A. Brodsky, Parag Shende, and Joseph A. Pezzulo.
Questions or comments may be directed to the OLS Revenue, Finance and Appropriations Section (Tel: 609-847-3835) or the Legislative Budget and Finance Offi ce (Tel: 609-847-3105).
1
The Fiscal Year 2021 and Fiscal Year 2022 Office of Legislative Services
Tax and Revenue Outlook
Introduction
he Office of Legislative Services (OLS) has prepared this report to assist the members of the Senate Budget and Appropriations Committee and the Assembly Budget Committee as they develop the FY 2022 annual appropriations bill. The OLS revenue estimates rely on a review of
current State revenue collections, revisions to State and federal laws, historical revenue collection patterns, and a variety of economic data and forecasts, as well as professional judgment. The OLS projects that combined FY 2021 and FY 2022 revenues will be $553.2 million more than the estimates in the FY 2022 Governor's Budget Recommendation: • For FY 2021, the OLS revenue estimates are $428.3 million above the Executive budget estimates. • For FY 2022, the OLS revenue estimates are $124.9 million above the Executive budget estimates.
Contents Page Introduction ……………………………………………………………... 11 Executive’s Fiscal Year 2021 and Fiscal Year 2022 Revenue Estimates ... 12 OLS Fiscal Year 2021 and Fiscal Year 2022 Revenue Estimates ………... 13 Gross Income Tax .................................................................................... 14 Sales Tax ................................................................................................... 17 Corporation Business Tax ........................................................................ 19 Corporation Business Tax – Banking and Financial Corporations .…..... Petroleum Products Gross Receipts Tax and Motor Fuels Tax .............
11 12
Cigarette Tax ……………........................................................................ 13 Realty Transfer Fees ……………………………………………………. Transfer Inheritance Tax ……………………………………………….. Insurance Premiums Tax ……………………………………………….. Casino Revenue Fund …………………………………………………... Annual Undesignated Fund Balances – Year End ……………................
14 15 16 17 18
Appendices: Detailed Fiscal Year 2021 Revenue Estimates ..................................... A-2 Detailed Fiscal Year 2022 Revenue Estimates ..................................... A-3 Pass-Through Business Alternative Income Tax …………………..... A-4 Paycheck Protection Program Loans to New Jersey Businesses ….. A-5
T
OLS Tax and Revenue Outlook FY 2021-2022
2
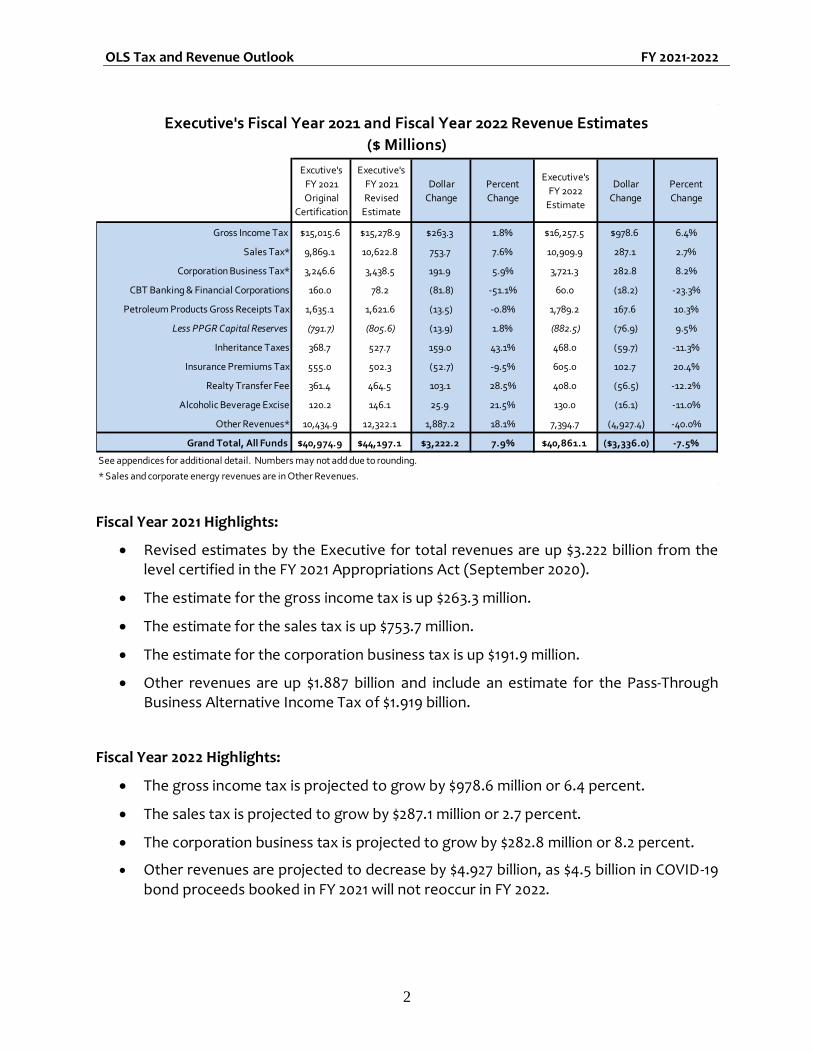
Fiscal Year 2021 Highlights:
• Revised estimates by the Executive for total revenues are up $3.222 billion from the level certified in the FY 2021 Appropriations Act (September 2020).
• The estimate for the gross income tax is up $263.3 million.
• The estimate for the sales tax is up $753.7 million.
• The estimate for the corporation business tax is up $191.9 million.
• Other revenues are up $1.887 billion and include an estimate for the Pass-Through Business Alternative Income Tax of $1.919 billion.
Fiscal Year 2022 Highlights:
• The gross income tax is projected to grow by $978.6 million or 6.4 percent.
• The sales tax is projected to grow by $287.1 million or 2.7 percent.
• The corporation business tax is projected to grow by $282.8 million or 8.2 percent.
• Other revenues are projected to decrease by $4.927 billion, as $4.5 billion in COVID-19 bond proceeds booked in FY 2021 will not reoccur in FY 2022.
Excutive's
FY 2021
Original
Certification
Executive's
FY 2021
Revised
Estimate
Dollar
Change
Percent
Change
Executive's
FY 2022
Estimate
Dollar
Change
Percent
Change
Gross Income Tax $15,015.6 $15,278.9 $263.3 1.8% $16,257.5 $978.6 6.4%
Sales Tax* 9,869.1 10,622.8 753.7 7.6% 10,909.9 287.1 2.7%
Corporation Business Tax* 3,246.6 3,438.5 191.9 5.9% 3,721.3 282.8 8.2%
CBT Banking & Financial Corporations 160.0 78.2 (81.8) -51.1% 60.0 (18.2) -23.3%
Petroleum Products Gross Receipts Tax 1,635.1 1,621.6 (13.5) -0.8% 1,789.2 167.6 10.3%
Less PPGR Capital Reserves (791.7) (805.6) (13.9) 1.8% (882.5) (76.9) 9.5%
Inheritance Taxes 368.7 527.7 159.0 43.1% 468.0 (59.7) -11.3%
Insurance Premiums Tax 555.0 502.3 (52.7) -9.5% 605.0 102.7 20.4%
Realty Transfer Fee 361.4 464.5 103.1 28.5% 408.0 (56.5) -12.2%
Alcoholic Beverage Excise 120.2 146.1 25.9 21.5% 130.0 (16.1) -11.0%
Other Revenues* 10,434.9 12,322.1 1,887.2 18.1% 7,394.7 (4,927.4) -40.0%
Grand Total, All Funds $40,974.9 $44,197.1 $3,222.2 7.9% $40,861.1 ($3,336.0) -7.5%
See appendices for additional detail. Numbers may not add due to rounding.
* Sales and corporate energy revenues are in Other Revenues.
Executive's Fiscal Year 2021 and Fiscal Year 2022 Revenue Estimates
($ Millions)
OLS Tax and Revenue Outlook FY 2021-2022
3
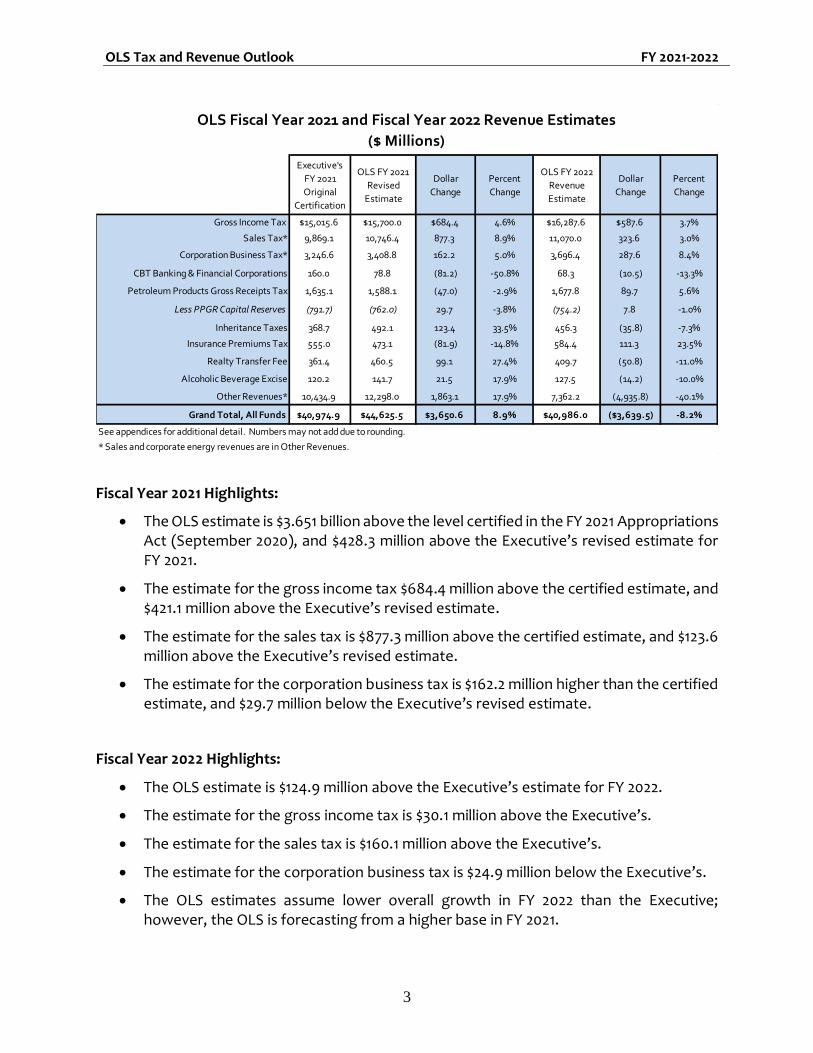
Fiscal Year 2021 Highlights:
• The OLS estimate is $3.651 billion above the level certified in the FY 2021 Appropriations Act (September 2020), and $428.3 million above the Executive’s revised estimate for FY 2021.
• The estimate for the gross income tax $684.4 million above the certified estimate, and $421.1 million above the Executive’s revised estimate.
• The estimate for the sales tax is $877.3 million above the certified estimate, and $123.6 million above the Executive’s revised estimate.
• The estimate for the corporation business tax is $162.2 million higher than the certified estimate, and $29.7 million below the Executive’s revised estimate.
Fiscal Year 2022 Highlights:
• The OLS estimate is $124.9 million above the Executive’s estimate for FY 2022.
• The estimate for the gross income tax is $30.1 million above the Executive’s.
• The estimate for the sales tax is $160.1 million above the Executive’s.
• The estimate for the corporation business tax is $24.9 million below the Executive’s.
• The OLS estimates assume lower overall growth in FY 2022 than the Executive; however, the OLS is forecasting from a higher base in FY 2021.
Executive's
FY 2021
Original
Certification
OLS FY 2021
Revised
Estimate
Dollar
Change
Percent
Change
OLS FY 2022
Revenue
Estimate
Dollar
Change
Percent
Change
Gross Income Tax $15,015.6 $15,700.0 $684.4 4.6% $16,287.6 $587.6 3.7%
Sales Tax* 9,869.1 10,746.4 877.3 8.9% 11,070.0 323.6 3.0%
Corporation Business Tax* 3,246.6 3,408.8 162.2 5.0% 3,696.4 287.6 8.4%
CBT Banking & Financial Corporations 160.0 78.8 (81.2) -50.8% 68.3 (10.5) -13.3%
Petroleum Products Gross Receipts Tax 1,635.1 1,588.1 (47.0) -2.9% 1,677.8 89.7 5.6%
Less PPGR Capital Reserves (791.7) (762.0) 29.7 -3.8% (754.2) 7.8 -1.0%
Inheritance Taxes 368.7 492.1 123.4 33.5% 456.3 (35.8) -7.3%
Insurance Premiums Tax 555.0 473.1 (81.9) -14.8% 584.4 111.3 23.5%
Realty Transfer Fee 361.4 460.5 99.1 27.4% 409.7 (50.8) -11.0%
Alcoholic Beverage Excise 120.2 141.7 21.5 17.9% 127.5 (14.2) -10.0%
Other Revenues* 10,434.9 12,298.0 1,863.1 17.9% 7,362.2 (4,935.8) -40.1%
Grand Total, All Funds $40,974.9 $44,625.5 $3,650.6 8.9% $40,986.0 ($3,639.5) -8.2%
See appendices for additional detail. Numbers may not add due to rounding.
* Sales and corporate energy revenues are in Other Revenues.
OLS Fiscal Year 2021 and Fiscal Year 2022 Revenue Estimates
($ Millions)
OLS Tax and Revenue Outlook FY 2021-2022
4
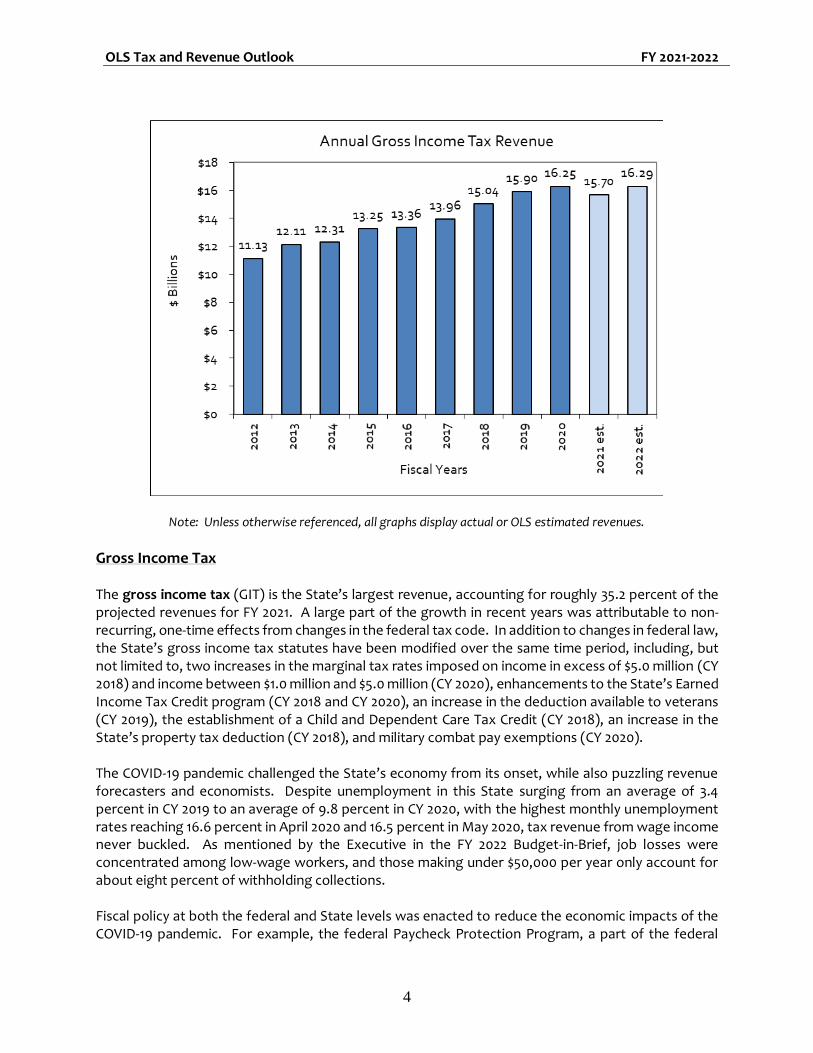
Note: Unless otherwise referenced, all graphs display actual or OLS estimated revenues.
Gross Income Tax The gross income tax (GIT) is the State’s largest revenue, accounting for roughly 35.2 percent of the projected revenues for FY 2021. A large part of the growth in recent years was attributable to non-recurring, one-time effects from changes in the federal tax code. In addition to changes in federal law, the State’s gross income tax statutes have been modified over the same time period, including, but not limited to, two increases in the marginal tax rates imposed on income in excess of $5.0 million (CY 2018) and income between $1.0 million and $5.0 million (CY 2020), enhancements to the State’s Earned Income Tax Credit program (CY 2018 and CY 2020), an increase in the deduction available to veterans (CY 2019), the establishment of a Child and Dependent Care Tax Credit (CY 2018), an increase in the State’s property tax deduction (CY 2018), and military combat pay exemptions (CY 2020). The COVID-19 pandemic challenged the State’s economy from its onset, while also puzzling revenue forecasters and economists. Despite unemployment in this State surging from an average of 3.4 percent in CY 2019 to an average of 9.8 percent in CY 2020, with the highest monthly unemployment rates reaching 16.6 percent in April 2020 and 16.5 percent in May 2020, tax revenue from wage income never buckled. As mentioned by the Executive in the FY 2022 Budget-in-Brief, job losses were concentrated among low-wage workers, and those making under $50,000 per year only account for about eight percent of withholding collections. Fiscal policy at both the federal and State levels was enacted to reduce the economic impacts of the COVID-19 pandemic. For example, the federal Paycheck Protection Program, a part of the federal
OLS Tax and Revenue Outlook FY 2021-2022
5
Coronavirus Aid, Relief, and Economic Security Act (“CARES Act”), provided financial assistance in the form of forgivable loans to businesses to retain workers, helping to mitigate the impact to withholdings. Additionally, the State extended last year’s April 15th GIT tax filing deadline to July 15th, which provided people and businesses with additional flexibility. As is true in most years, GIT collections rely, at least in part, on how the minority of taxpayers who pay the majority of the GIT fared during the prior year. Typically, high-income taxpayers derive a larger share of their annual income from more volatile sources than salaries and wages, such as capital gains. As a result, they pay the bulk of April final payments and quarterly estimated payments. On March 9, 2020, Wall Street suffered its worst day since the start of the Great Recession in 2008, as the Dow Jones Industrial Average, NASDAQ Composite, and S&P 500 all posted historical losses. However, the Dow Jones Industrial Average and S&P 500 recovered and closed at record highs at the end of the year, with the NASDAQ Composite close behind. The degree of uncertainty this fiscal year and next is unusually high, given ongoing impacts of the pandemic-induced recession on New Jersey’s economy. Further complicating revenue forecasts is the recent extension of the filing deadline for individual taxpayers. Specifically, those final returns and payments that were due on April 15, 2021, are now due by May 17, 2021. Thus, the Executive and OLS will have to wait an additional month to evaluate those important payments.
Fiscal Year 2021 GIT revenue totaled $9.282 billion through the end of February, which was $246.7 million, or 2.6 percent below the prior fiscal year. This decline is primarily because of a shift in timing of taxpayer refunds from FY 2020 to FY 2021, due to the extension of the tax year 2019 gross income tax return filing and payment deadline. Year-to-date refunds remained up by a significant $433.6 million or 64.0 percent, withholdings were up $341.3 million or 4.6 percent, final payments were down $64.0 million or 10.2 percent, and estimated payments were down $96.6 million or 4.8 percent. Withholding collections benefited from the incorporation of a higher marginal rate imposed on income in excess of $1 million and below $5 million. For FY 2021, the Executive has revised its GIT estimate upward by $263.3 million from the amount certified in September, to $15.279 billion, a 6.0 percent decline from FY 2020. The Executive’s estimate for FY 2021 anticipates $514.0 million from the extension of the increased marginal income tax rate on income between $1.0 million and $5.0 million. Two specific policy changes are expected to reduce GIT revenue in FY 2021: 1) the Pass-Through Business Alternative Income Tax (PT-BAIT); and 2) the tax benefits related to the federal Paycheck Protection Program. The Executive anticipates that PT-BAIT tax credits will reduce FY 2021 revenues under the GIT by $853.0 million. The OLS agrees with the Executive’s estimate. Likewise, recipients of Paycheck Protection Program loans are allowed to deduct business expenses that were paid with the tax-exempt loan proceeds. This is expected to reduce revenues by $150.0 million to $175.0 million in FY 2021. The FY 2021 OLS estimate of $15.7 billion is $421.1 million above the Executive’s estimate, and a decline of 3.4 percent from actual FY 2020 collections. As is the case with the Executive’s estimate, the OLS estimates fall below the FY 2020 level because of anticipated refunds from PT-BAIT credits and Paycheck Protection Program deductions. The OLS does not have the Executive’s exact component assumptions for FY 2021, but the OLS believes the main difference lies with withholding projections
OLS Tax and Revenue Outlook FY 2021-2022
6
for the remainder of the fiscal year. February withholding collections, as well as preliminary March collections, have been exceptionally strong, so the OLS is likely projecting a higher growth rate. Withholdings during these months may have benefited from the payout of Wall Street bonuses, with the average bonus up 10.0 percent, according to the New York State Comptroller.
Fiscal Year 2022 The Executive’s FY 2022 GIT estimate includes the continuous impact of the PT-BAIT credits, as well as two new policy initiatives. First, the Executive is proposing to increase and expand eligibility for the Child and Dependent Care Credit, which would reduce FY 2022 GIT revenue by an additional $17.2 million. Second, the Executive is also proposing to expand the Earned Income Tax Credit to certain senior taxpayers, which would reduce FY 2022 GIT revenue by $8.2 million. Overall, the Executive projects 6.4 percent growth for the GIT in FY 2022, yielding $16.257 billion. For purposes of this analysis, OLS accepts the Executive’s estimates for the Child and Dependent Care Credit increase and extension and the Earned Income Tax Credit expansion, which has been the historical precedent set by OLS when policy initiatives are included as part of the Executive’s original budget proposal. The OLS estimate further adjusts FY 2022 collections downward by $100 million to reflect expansions to the corresponding federal programs that flow through to the State through the operation of our own laws. However, the OLS projects a lower growth rate of 3.7 percent off the OLS’ higher FY 2021 base, yielding $16.288 billion, or $30.1 million less than the Executive. The OLS factored in an $80.0 million reduction to its FY 2022 estimate for the potential impact of Paycheck Protection Program deductions next fiscal year. The OLS’ GIT estimate for FY 2022 assumes modest growth in withholding receipts at a rate of 2.2 percent, as the labor market continues to recover after the pandemic. Withholding accounts for about three-quarters of total GIT collections each year, so this assumption is the primary driver of the OLS’ overall forecast for FY 2022. Estimated payments and final payments are projected to grow between 2.5 to 3.0 percent, while refunds are expected to decline as some refund activity from FY 2020 slipped into FY 2021, inflating refunds for the fiscal year, and the impact of the Paycheck Protection Program deductions falls off.
OLS Tax and Revenue Outlook FY 2021-2022
7
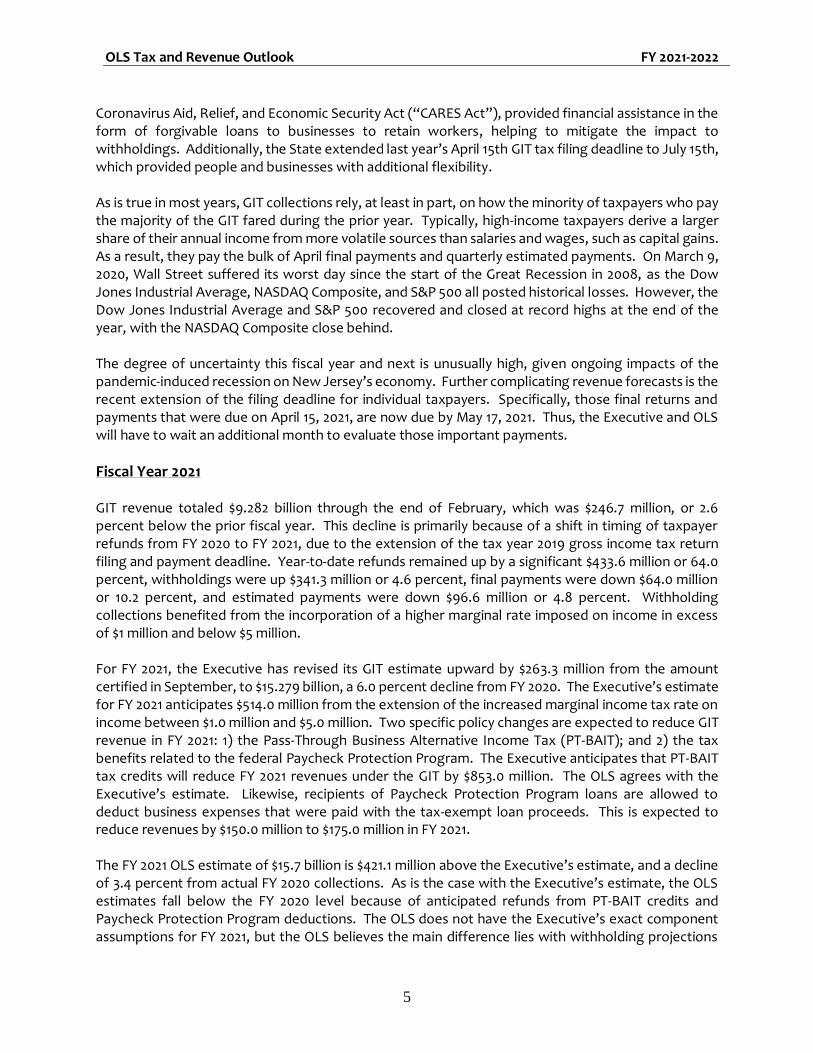
Sales and Use Tax In Spring 2020, sales and use tax revenues plunged to all-time lows. Specifically, May 2020 revenue, which reflected economic activity from April 2020, fell by 29.0 percent. This marked the largest percentage decline in sales tax revenue since the Great Recession, when June 2009 sales tax revenue fell by 18.4 percent. The impact of COVID-19 containment measures on retail sales was apparent. Consumer spending also decreased due to a combination of factors, including fewer opportunities to purchase taxable goods and services, decisions by consumers to save income instead of spending it, and many consumers shifting spending towards essential goods and services due to the COVID-19 pandemic. Many of those goods and services, such as groceries, are not subject to the State’s sales tax. By the start of FY 2021, sales tax collections benefited from the gradual easing of restrictive health and safety measures, increased expenditures by consumers of previous federal income support payments, and a shift in consumer spending from often non-taxable services to frequently taxable goods. Additionally, sales tax collections were likely buoyed by the State’s strong real estate market and the necessity to furnish and improve real property, and payments collected from remote sellers as consumers shifted to online shopping.
OLS Tax and Revenue Outlook FY 2021-2022
8
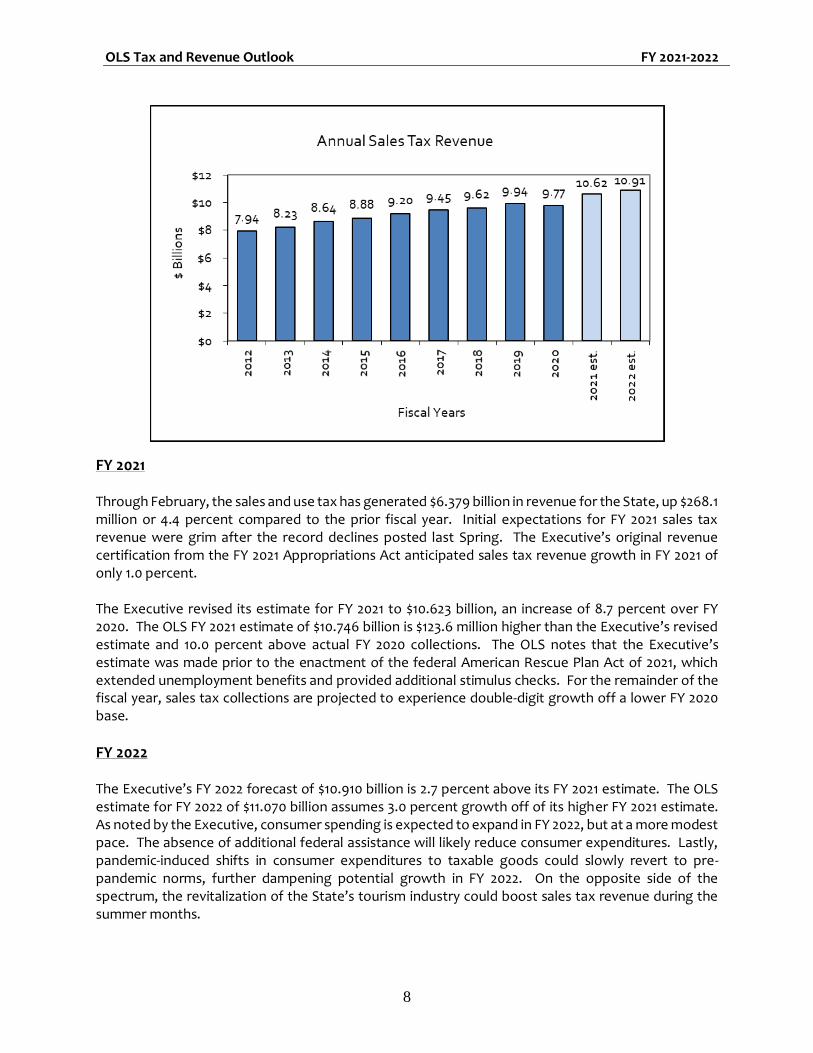
FY 2021 Through February, the sales and use tax has generated $6.379 billion in revenue for the State, up $268.1 million or 4.4 percent compared to the prior fiscal year. Initial expectations for FY 2021 sales tax revenue were grim after the record declines posted last Spring. The Executive’s original revenue certification from the FY 2021 Appropriations Act anticipated sales tax revenue growth in FY 2021 of only 1.0 percent. The Executive revised its estimate for FY 2021 to $10.623 billion, an increase of 8.7 percent over FY 2020. The OLS FY 2021 estimate of $10.746 billion is $123.6 million higher than the Executive’s revised estimate and 10.0 percent above actual FY 2020 collections. The OLS notes that the Executive’s estimate was made prior to the enactment of the federal American Rescue Plan Act of 2021, which extended unemployment benefits and provided additional stimulus checks. For the remainder of the fiscal year, sales tax collections are projected to experience double-digit growth off a lower FY 2020 base.
FY 2022 The Executive’s FY 2022 forecast of $10.910 billion is 2.7 percent above its FY 2021 estimate. The OLS estimate for FY 2022 of $11.070 billion assumes 3.0 percent growth off of its higher FY 2021 estimate. As noted by the Executive, consumer spending is expected to expand in FY 2022, but at a more modest pace. The absence of additional federal assistance will likely reduce consumer expenditures. Lastly, pandemic-induced shifts in consumer expenditures to taxable goods could slowly revert to pre-pandemic norms, further dampening potential growth in FY 2022. On the opposite side of the spectrum, the revitalization of the State’s tourism industry could boost sales tax revenue during the summer months.
OLS Tax and Revenue Outlook FY 2021-2022
9
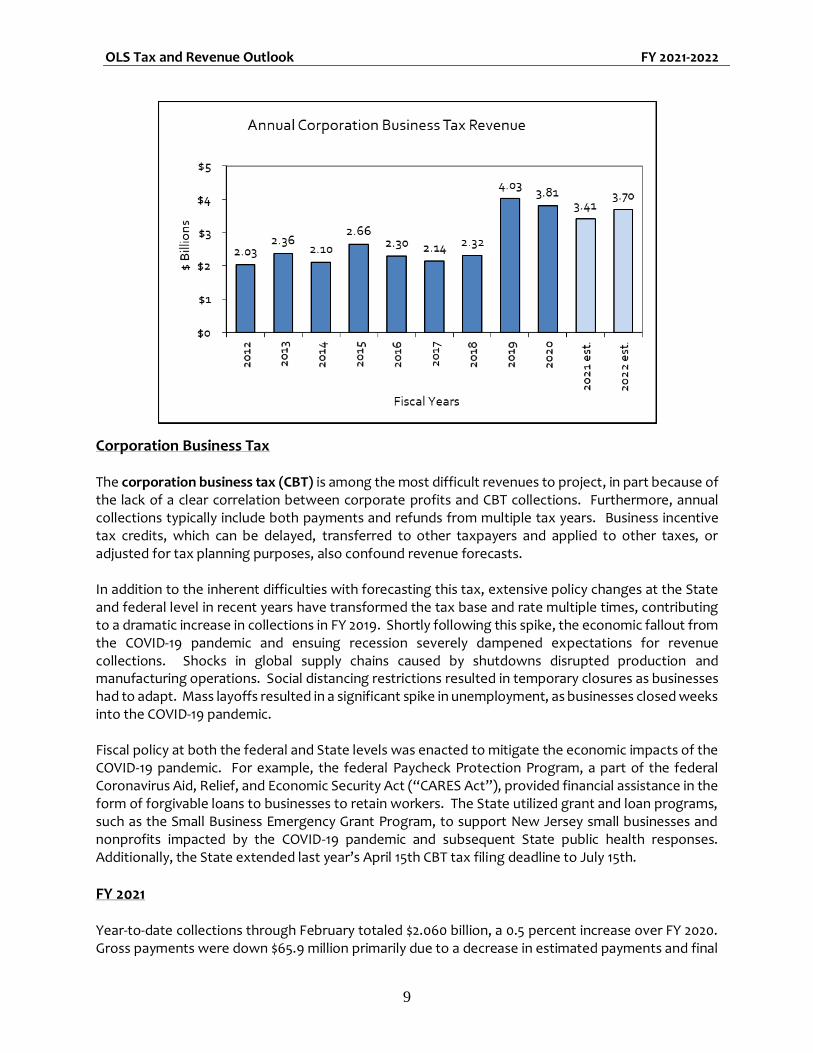
Corporation Business Tax The corporation business tax (CBT) is among the most difficult revenues to project, in part because of the lack of a clear correlation between corporate profits and CBT collections. Furthermore, annual collections typically include both payments and refunds from multiple tax years. Business incentive tax credits, which can be delayed, transferred to other taxpayers and applied to other taxes, or adjusted for tax planning purposes, also confound revenue forecasts. In addition to the inherent difficulties with forecasting this tax, extensive policy changes at the State and federal level in recent years have transformed the tax base and rate multiple times, contributing to a dramatic increase in collections in FY 2019. Shortly following this spike, the economic fallout from the COVID-19 pandemic and ensuing recession severely dampened expectations for revenue collections. Shocks in global supply chains caused by shutdowns disrupted production and manufacturing operations. Social distancing restrictions resulted in temporary closures as businesses had to adapt. Mass layoffs resulted in a significant spike in unemployment, as businesses closed weeks into the COVID-19 pandemic. Fiscal policy at both the federal and State levels was enacted to mitigate the economic impacts of the COVID-19 pandemic. For example, the federal Paycheck Protection Program, a part of the federal Coronavirus Aid, Relief, and Economic Security Act (“CARES Act”), provided financial assistance in the form of forgivable loans to businesses to retain workers. The State utilized grant and loan programs, such as the Small Business Emergency Grant Program, to support New Jersey small businesses and nonprofits impacted by the COVID-19 pandemic and subsequent State public health responses. Additionally, the State extended last year’s April 15th CBT tax filing deadline to July 15th.
FY 2021 Year-to-date collections through February totaled $2.060 billion, a 0.5 percent increase over FY 2020. Gross payments were down $65.9 million primarily due to a decrease in estimated payments and final
OLS Tax and Revenue Outlook FY 2021-2022
10
payments. CBT refunds also declined by $76.2 million, helping to position collections into positive territory. Because of the filing extension last year, payments and refunds that would have otherwise been processed in April were spread throughout the tail end of FY 2020 and likely crossed into FY 2021. FY 2021 CBT receipts also have benefited from changes to the CBT surtax. CBT taxpayers with New Jersey allocated taxable net income in excess of one million dollars are required to pay a 1.5 percent surtax on their income. The enactment of P.L.2020, c.95, in September 2020, retroactively increased the surtax from 1.5 percent to 2.5 percent effective January 1, 2020. Since the surtax increase was retroactive, payments that would have otherwise been made in FY 2020 are accounted for in FY 2021 instead. The Executive’s forecast anticipates an additional $261.0 million in CBT revenue from the change to the surtax, and the OLS concurs. Identical to the GIT, two specific policy changes are expected to reduce CBT revenue in FY 2021: 1) the Pass-Through Business Alternative Income Tax (PT-BAIT); and 2) the tax benefits related to the Paycheck Protection Program. The Executive anticipates that PT-BAIT tax credits will reduce FY 2021 revenues under the CBT by $460.0 million. The OLS agrees with the Executive’s estimate. Likewise, recipients of Paycheck Protection Program loans are allowed to deduct business expenses that were paid with the tax-exempt loan proceeds. This is expected to reduce revenues by $250.0 million to $300.0 million in FY 2021. The Executive’s revised estimate increases the certified FY 2021 projection of $3.247 billion to $3.439 billion, a 9.7 percent decrease from FY 2020. The OLS estimate of $3.416 billion is slightly below the Executive’s estimate for FY 2021. Despite being ahead for the year, CBT revenue is expected to decline once annual returns are filed and the PT-BAIT refunds are processed.
FY 2022 The economic outlook for businesses throughout CY 2021, which impacts FY 2022 collections, has improved over the past few months. Vaccine development and distribution has been underway and continues to increase in capacity. Industries impacted the hardest by the COVID-19 pandemic are expected to recover, but the permanent economic damage is still unknown. Pent-up demand could be a lifeline for some businesses most affected by pandemic restrictions. In February 2021, the Congressional Budget Office forecasted real gross domestic product to return to a pre-pandemic level by mid-2021. For FY 2022, the Executive projects $3.721 billion, an increase of 8.2 percent from FY 2021. The OLS estimate of $3.696 billion in FY 2022 anticipates near identical growth, but off a lower FY 2021 base. The OLS notes that the temporary surtax will remain at 2.5 percent for the entirety of FY 2022. The impact of PT-BAIT refunds on CBT revenues will be recurring, but may change in magnitude as more data become available. The impact of Paycheck Protection Program exemptions is expected to affect FY 2022; however, the OLS believes the impact will fall below FY 2021 amounts.
OLS Tax and Revenue Outlook FY 2021-2022
11
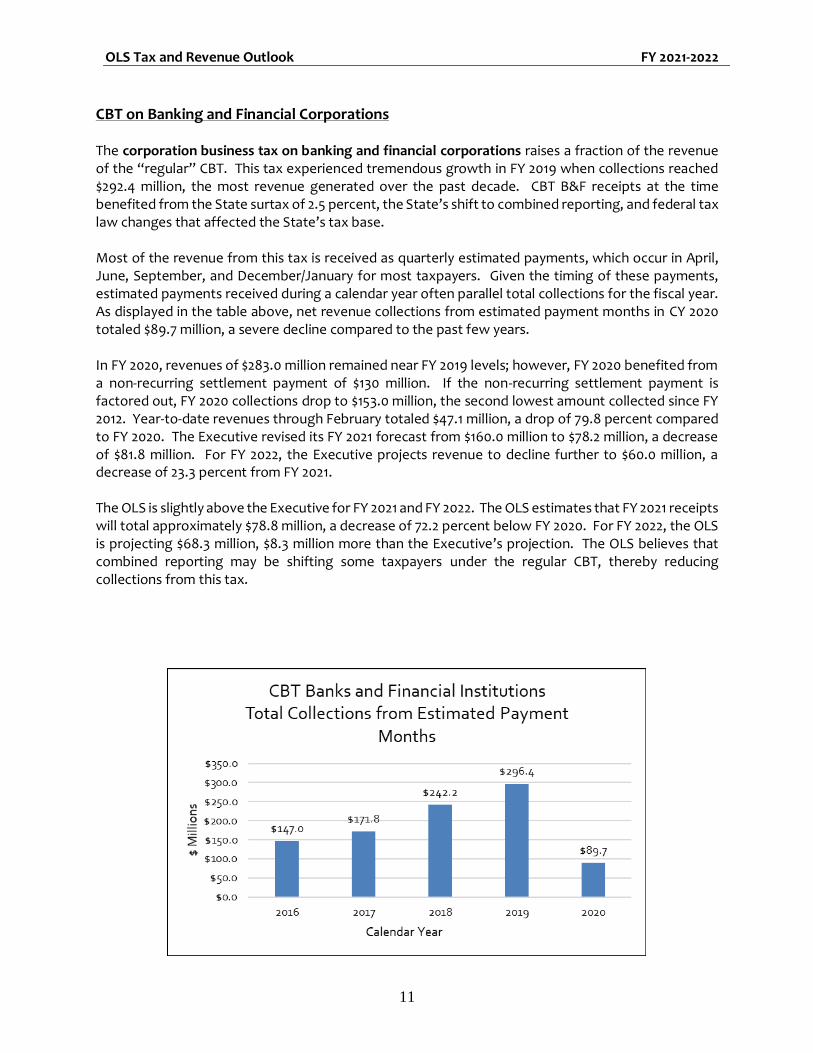
CBT on Banking and Financial Corporations The corporation business tax on banking and financial corporations raises a fraction of the revenue of the “regular” CBT. This tax experienced tremendous growth in FY 2019 when collections reached $292.4 million, the most revenue generated over the past decade. CBT B&F receipts at the time benefited from the State surtax of 2.5 percent, the State’s shift to combined reporting, and federal tax law changes that affected the State’s tax base. Most of the revenue from this tax is received as quarterly estimated payments, which occur in April, June, September, and December/January for most taxpayers. Given the timing of these payments, estimated payments received during a calendar year often parallel total collections for the fiscal year. As displayed in the table above, net revenue collections from estimated payment months in CY 2020 totaled $89.7 million, a severe decline compared to the past few years. In FY 2020, revenues of $283.0 million remained near FY 2019 levels; however, FY 2020 benefited from a non-recurring settlement payment of $130 million. If the non-recurring settlement payment is factored out, FY 2020 collections drop to $153.0 million, the second lowest amount collected since FY 2012. Year-to-date revenues through February totaled $47.1 million, a drop of 79.8 percent compared to FY 2020. The Executive revised its FY 2021 forecast from $160.0 million to $78.2 million, a decrease of $81.8 million. For FY 2022, the Executive projects revenue to decline further to $60.0 million, a decrease of 23.3 percent from FY 2021. The OLS is slightly above the Executive for FY 2021 and FY 2022. The OLS estimates that FY 2021 receipts will total approximately $78.8 million, a decrease of 72.2 percent below FY 2020. For FY 2022, the OLS is projecting $68.3 million, $8.3 million more than the Executive’s projection. The OLS believes that combined reporting may be shifting some taxpayers under the regular CBT, thereby reducing collections from this tax.
OLS Tax and Revenue Outlook FY 2021-2022
12
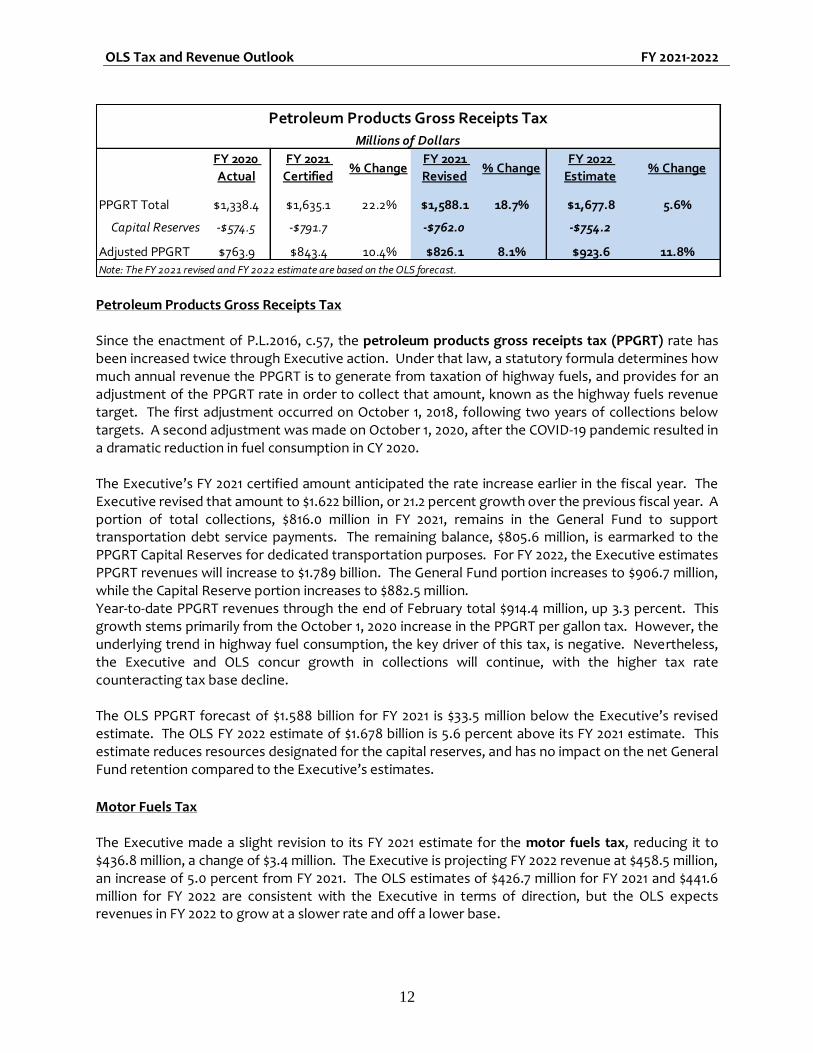
Petroleum Products Gross Receipts Tax Since the enactment of P.L.2016, c.57, the petroleum products gross receipts tax (PPGRT) rate has been increased twice through Executive action. Under that law, a statutory formula determines how much annual revenue the PPGRT is to generate from taxation of highway fuels, and provides for an adjustment of the PPGRT rate in order to collect that amount, known as the highway fuels revenue target. The first adjustment occurred on October 1, 2018, following two years of collections below targets. A second adjustment was made on October 1, 2020, after the COVID-19 pandemic resulted in a dramatic reduction in fuel consumption in CY 2020. The Executive’s FY 2021 certified amount anticipated the rate increase earlier in the fiscal year. The Executive revised that amount to $1.622 billion, or 21.2 percent growth over the previous fiscal year. A portion of total collections, $816.0 million in FY 2021, remains in the General Fund to support transportation debt service payments. The remaining balance, $805.6 million, is earmarked to the PPGRT Capital Reserves for dedicated transportation purposes. For FY 2022, the Executive estimates PPGRT revenues will increase to $1.789 billion. The General Fund portion increases to $906.7 million, while the Capital Reserve portion increases to $882.5 million. Year-to-date PPGRT revenues through the end of February total $914.4 million, up 3.3 percent. This growth stems primarily from the October 1, 2020 increase in the PPGRT per gallon tax. However, the underlying trend in highway fuel consumption, the key driver of this tax, is negative. Nevertheless, the Executive and OLS concur growth in collections will continue, with the higher tax rate counteracting tax base decline. The OLS PPGRT forecast of $1.588 billion for FY 2021 is $33.5 million below the Executive’s revised estimate. The OLS FY 2022 estimate of $1.678 billion is 5.6 percent above its FY 2021 estimate. This estimate reduces resources designated for the capital reserves, and has no impact on the net General Fund retention compared to the Executive’s estimates.
Motor Fuels Tax The Executive made a slight revision to its FY 2021 estimate for the motor fuels tax, reducing it to $436.8 million, a change of $3.4 million. The Executive is projecting FY 2022 revenue at $458.5 million, an increase of 5.0 percent from FY 2021. The OLS estimates of $426.7 million for FY 2021 and $441.6 million for FY 2022 are consistent with the Executive in terms of direction, but the OLS expects revenues in FY 2022 to grow at a slower rate and off a lower base.
FY 2020
Actual
FY 2021
Certified% Change
FY 2021
Revised% Change
FY 2022
Estimate% Change
PPGRT Total $1,338.4 $1,635.1 22.2% $1,588.1 18.7% $1,677.8 5.6%
Capital Reserves -$574.5 -$791.7 -$762.0 -$754.2
Adjusted PPGRT $763.9 $843.4 10.4% $826.1 8.1% $923.6 11.8%
Note: The FY 2021 revised and FY 2022 estimate are based on the OLS forecast.
Millions of Dollars
Petroleum Products Gross Receipts Tax
OLS Tax and Revenue Outlook FY 2021-2022
13
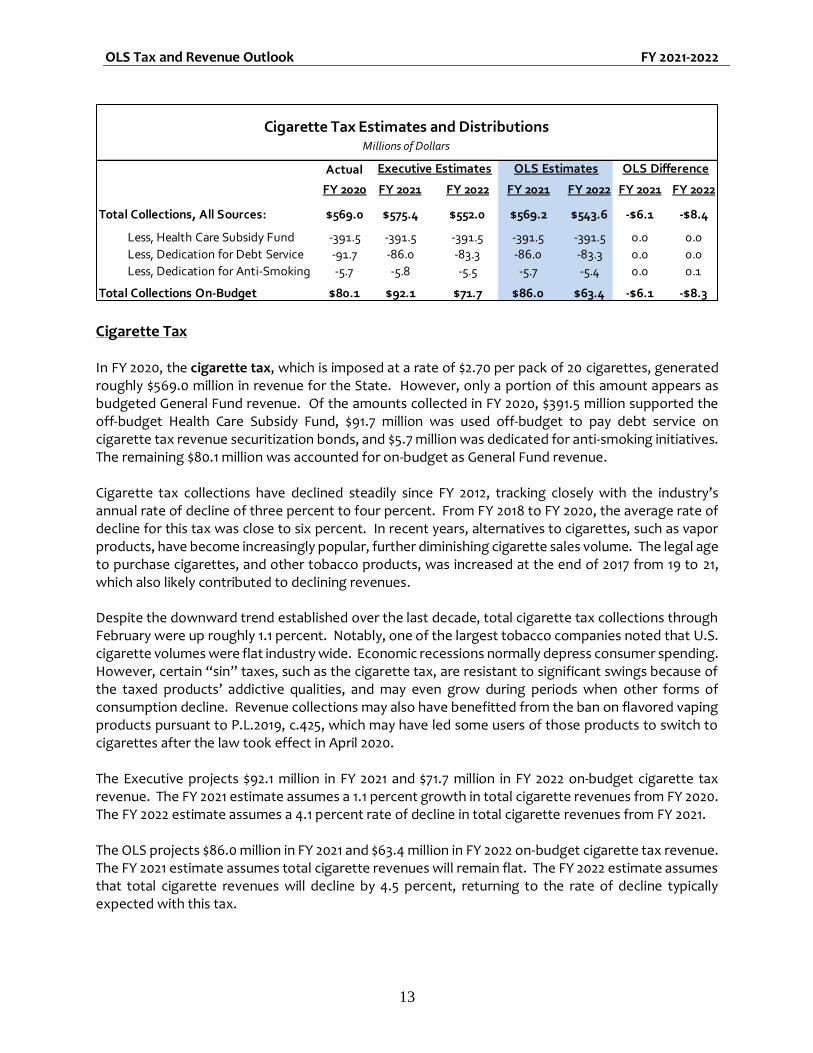
Cigarette Tax In FY 2020, the cigarette tax, which is imposed at a rate of $2.70 per pack of 20 cigarettes, generated roughly $569.0 million in revenue for the State. However, only a portion of this amount appears as budgeted General Fund revenue. Of the amounts collected in FY 2020, $391.5 million supported the off-budget Health Care Subsidy Fund, $91.7 million was used off-budget to pay debt service on cigarette tax revenue securitization bonds, and $5.7 million was dedicated for anti-smoking initiatives. The remaining $80.1 million was accounted for on-budget as General Fund revenue. Cigarette tax collections have declined steadily since FY 2012, tracking closely with the industry’s annual rate of decline of three percent to four percent. From FY 2018 to FY 2020, the average rate of decline for this tax was close to six percent. In recent years, alternatives to cigarettes, such as vapor products, have become increasingly popular, further diminishing cigarette sales volume. The legal age to purchase cigarettes, and other tobacco products, was increased at the end of 2017 from 19 to 21, which also likely contributed to declining revenues. Despite the downward trend established over the last decade, total cigarette tax collections through February were up roughly 1.1 percent. Notably, one of the largest tobacco companies noted that U.S. cigarette volumes were flat industry wide. Economic recessions normally depress consumer spending. However, certain “sin” taxes, such as the cigarette tax, are resistant to significant swings because of the taxed products’ addictive qualities, and may even grow during periods when other forms of consumption decline. Revenue collections may also have benefitted from the ban on flavored vaping products pursuant to P.L.2019, c.425, which may have led some users of those products to switch to cigarettes after the law took effect in April 2020. The Executive projects $92.1 million in FY 2021 and $71.7 million in FY 2022 on-budget cigarette tax revenue. The FY 2021 estimate assumes a 1.1 percent growth in total cigarette revenues from FY 2020. The FY 2022 estimate assumes a 4.1 percent rate of decline in total cigarette revenues from FY 2021. The OLS projects $86.0 million in FY 2021 and $63.4 million in FY 2022 on-budget cigarette tax revenue. The FY 2021 estimate assumes total cigarette revenues will remain flat. The FY 2022 estimate assumes that total cigarette revenues will decline by 4.5 percent, returning to the rate of decline typically expected with this tax.
Actual
FY 2020 FY 2021 FY 2022 FY 2021 FY 2022 FY 2021 FY 2022
Total Collections, All Sources: $569.0 $575.4 $552.0 $569.2 $543.6 -$6.1 -$8.4
Less, Health Care Subsidy Fund -391.5 -391.5 -391.5 -391.5 -391.5 0.0 0.0
Less, Dedication for Debt Service -91.7 -86.0 -83.3 -86.0 -83.3 0.0 0.0
Less, Dedication for Anti-Smoking -5.7 -5.8 -5.5 -5.7 -5.4 0.0 0.1
Total Collections On-Budget $80.1 $92.1 $71.7 $86.0 $63.4 -$6.1 -$8.3
Cigarette Tax Estimates and DistributionsMillions of Dollars
Executive Estimates OLS Estimates OLS Difference
OLS Tax and Revenue Outlook FY 2021-2022
14
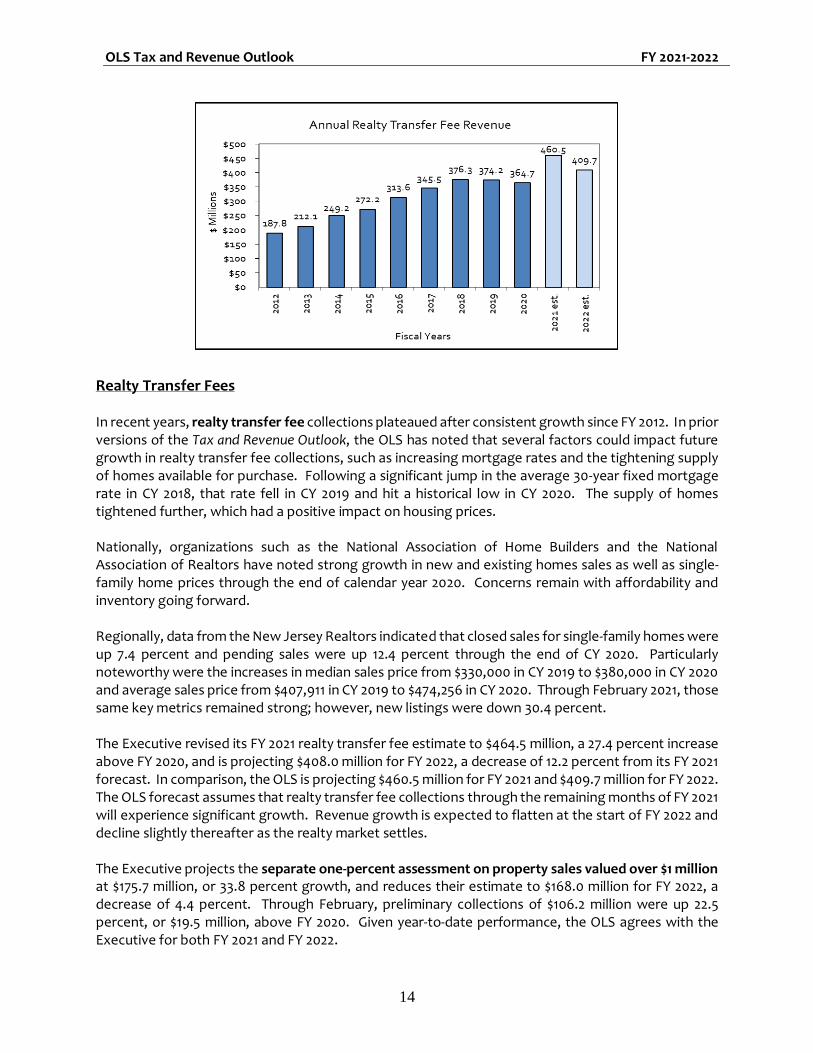
Realty Transfer Fees In recent years, realty transfer fee collections plateaued after consistent growth since FY 2012. In prior versions of the Tax and Revenue Outlook, the OLS has noted that several factors could impact future growth in realty transfer fee collections, such as increasing mortgage rates and the tightening supply of homes available for purchase. Following a significant jump in the average 30-year fixed mortgage rate in CY 2018, that rate fell in CY 2019 and hit a historical low in CY 2020. The supply of homes tightened further, which had a positive impact on housing prices. Nationally, organizations such as the National Association of Home Builders and the National Association of Realtors have noted strong growth in new and existing homes sales as well as single-family home prices through the end of calendar year 2020. Concerns remain with affordability and inventory going forward. Regionally, data from the New Jersey Realtors indicated that closed sales for single-family homes were up 7.4 percent and pending sales were up 12.4 percent through the end of CY 2020. Particularly noteworthy were the increases in median sales price from $330,000 in CY 2019 to $380,000 in CY 2020 and average sales price from $407,911 in CY 2019 to $474,256 in CY 2020. Through February 2021, those same key metrics remained strong; however, new listings were down 30.4 percent. The Executive revised its FY 2021 realty transfer fee estimate to $464.5 million, a 27.4 percent increase above FY 2020, and is projecting $408.0 million for FY 2022, a decrease of 12.2 percent from its FY 2021 forecast. In comparison, the OLS is projecting $460.5 million for FY 2021 and $409.7 million for FY 2022. The OLS forecast assumes that realty transfer fee collections through the remaining months of FY 2021 will experience significant growth. Revenue growth is expected to flatten at the start of FY 2022 and decline slightly thereafter as the realty market settles. The Executive projects the separate one-percent assessment on property sales valued over $1 million at $175.7 million, or 33.8 percent growth, and reduces their estimate to $168.0 million for FY 2022, a decrease of 4.4 percent. Through February, preliminary collections of $106.2 million were up 22.5 percent, or $19.5 million, above FY 2020. Given year-to-date performance, the OLS agrees with the Executive for both FY 2021 and FY 2022.
OLS Tax and Revenue Outlook FY 2021-2022
15
Transfer Inheritance Tax As with any wealth tax, transfer inheritance tax revenue has fluctuated widely over the years from double-digit rates of growth in some years to double-digit rates of decline shortly thereafter. The transfer inheritance tax is dependent on myriad factors, including the number of wealthy decedents during a particular year and the magnitude of their wealth. The transfer inheritance tax filing process typically takes eight months to complete, so the amounts realized during a fiscal year are, at least in part, based on factors from the past. For example, transfer inheritance tax collections in December 2020 and January 2021 were up 126.8 percent and 56.8 percent year-over-year, respectively. Based on data published by the New Jersey Department of Health, New Jersey resident deaths tripled in April 2020 and were up 57.6 percent in May 2020 compared to the same months in the prior year, as the COVID-19 pandemic reached its initial peak. The transfer inheritance tax returns and related payments for the transfer of those resident decedents’ real and personal properties were due by December 2020 and January 2021, which accounts for the spike during those months. Through February, receipts from the estate tax and the transfer inheritance tax totaled $343.0 million, up 27.2 percent in the aggregate. Of the amounts collected, $340.1 million was from the transfer inheritance tax, up 36.1 percent, and $2.9 million was attributable to the estate tax, down 84.9 percent. The Executive increased its estimate for these combined taxes in FY 2021 from the $368.7 million certified last September to $527.7 million, assuming growth of 43.1 percent above FY 2020. The OLS is also anticipating FY 2021 collections to come in above the certified amount, but lower than the Executive at $492.1 million. For FY 2022, the Executive is projecting a decline in transfer inheritance tax revenue to $468.0 million, down 11.3 percent from its FY 2021 estimate. The Executive is not anticipating revenue from the estate tax. The OLS estimate of $456.3 million, down 7.3 percent from its FY 2021 estimate, is $11.7 million less than the Executive. The OLS estimate assumes that asset values will remain strong, but the rate of death will return to pre-pandemic levels.
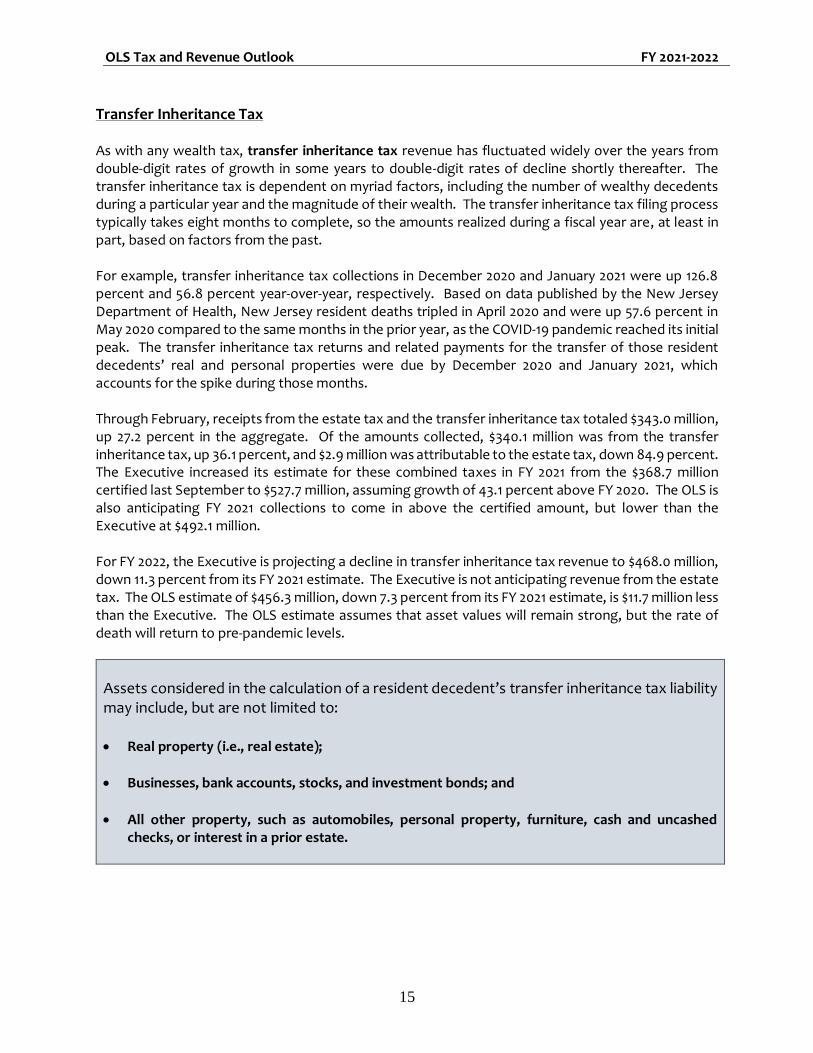
Assets considered in the calculation of a resident decedent’s transfer inheritance tax liability may include, but are not limited to: • Real property (i.e., real estate);
• Businesses, bank accounts, stocks, and investment bonds; and
• All other property, such as automobiles, personal property, furniture, cash and uncashed checks, or interest in a prior estate.
OLS Tax and Revenue Outlook FY 2021-2022
16
Insurance Premiums Tax The insurance premiums tax is imposed on the premiums collected on insurance risks in this State. Insurance premiums tax returns are filed on March 1 of each year and finalize the tax liability a taxpayer incurred during the prior calendar year. When the annual return is filed on March 1, a taxpayer is also required to make a prepayment equal to 50 percent of the preceding calendar year’s tax liability. A second prepayment is due on June 1 of each year and is equal to 50 percent of the preceding calendar year’s tax liability. Consequently, the third and fourth quarters of each fiscal year account for almost all of insurance premiums tax collections. In the past, the insurance premiums tax has experienced heightened volatility in collections attributable to tax credits. The State’s economic development incentive programs allow for taxpayers, typically those with corporation business tax liabilities, to convert their incentive awards to tax credit transfer certificates. Those tax credit transfer certificates may then be sold to another taxpayer. In most cases, this happens to be a taxpayer with an insurance premiums tax liability. Through the end of January, the insurance premiums tax carried a negative balance of $90.2 million. This has become typical, since refunds are processed earlier in the fiscal year prior to payments being received. However, in addition to refund activity that likely resulted from tax credits, the State was also required to refund Johnson & Johnson at least $56 million stemming from a New Jersey Supreme Court ruling in December 2020. Unlike the Executive, the OLS has the opportunity to evaluate preliminary collection data for March prior to forecasting revenues. Thus, the OLS can assess aggregate insurance premiums tax collections across February and March, which comprise the first prepayment required by law. These data indicate a decline in the March 1 prepayment, with year-to-date collections down roughly 37.6 percent. The Executive projects $502.3 million in FY 2021, a 19.3 percent decline from FY 2020, and $605.0 million in FY 2022, an increase of 20.4 percent from the revised FY 2021 estimate. In contrast, the OLS is projecting $473.1 million for FY 2021, a 14.8 percent decline from FY 2020, and $584.4 million for FY 2022, 23.5 percent growth above its FY 2021 estimate. The difference between the Executive’s estimate and the OLS’ estimate is presumably due to the availability of data. The OLS anticipates the fourth quarter of FY 2021 to be more in line with historical collections, since tax credits are included in the calculation of the March 1 payment. Any overpayments that remain from March 1 will likely impact the June 1 prepayment. The uncertainty and volatility surrounding tax credits always lingers, but FY 2022 will benefit from non-recurring refund activity. Lastly, the enactment of P.L.2020, c.145, which allows for the reorganization of a health service corporation, may have an impact on future insurance premiums tax revenues. However, a reorganization has not occurred yet as of this writing, so the impact of this law may not materialize during the fiscal years covered, and the estimates do not assume any impact.
OLS Tax and Revenue Outlook FY 2021-2022
17
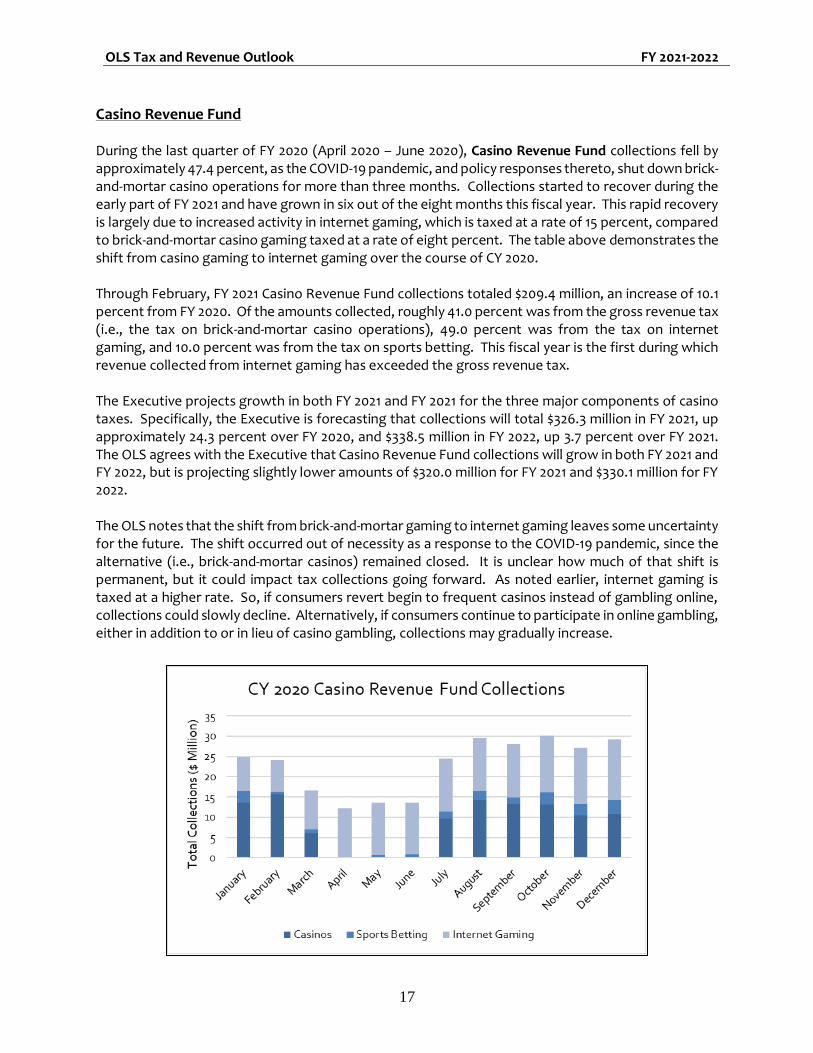
Casino Revenue Fund During the last quarter of FY 2020 (April 2020 – June 2020), Casino Revenue Fund collections fell by approximately 47.4 percent, as the COVID-19 pandemic, and policy responses thereto, shut down brick-and-mortar casino operations for more than three months. Collections started to recover during the early part of FY 2021 and have grown in six out of the eight months this fiscal year. This rapid recovery is largely due to increased activity in internet gaming, which is taxed at a rate of 15 percent, compared to brick-and-mortar casino gaming taxed at a rate of eight percent. The table above demonstrates the shift from casino gaming to internet gaming over the course of CY 2020. Through February, FY 2021 Casino Revenue Fund collections totaled $209.4 million, an increase of 10.1 percent from FY 2020. Of the amounts collected, roughly 41.0 percent was from the gross revenue tax (i.e., the tax on brick-and-mortar casino operations), 49.0 percent was from the tax on internet gaming, and 10.0 percent was from the tax on sports betting. This fiscal year is the first during which revenue collected from internet gaming has exceeded the gross revenue tax. The Executive projects growth in both FY 2021 and FY 2021 for the three major components of casino taxes. Specifically, the Executive is forecasting that collections will total $326.3 million in FY 2021, up approximately 24.3 percent over FY 2020, and $338.5 million in FY 2022, up 3.7 percent over FY 2021. The OLS agrees with the Executive that Casino Revenue Fund collections will grow in both FY 2021 and FY 2022, but is projecting slightly lower amounts of $320.0 million for FY 2021 and $330.1 million for FY 2022. The OLS notes that the shift from brick-and-mortar gaming to internet gaming leaves some uncertainty for the future. The shift occurred out of necessity as a response to the COVID-19 pandemic, since the alternative (i.e., brick-and-mortar casinos) remained closed. It is unclear how much of that shift is permanent, but it could impact tax collections going forward. As noted earlier, internet gaming is taxed at a higher rate. So, if consumers revert begin to frequent casinos instead of gambling online, collections could slowly decline. Alternatively, if consumers continue to participate in online gambling, either in addition to or in lieu of casino gambling, collections may gradually increase.
OLS Tax and Revenue Outlook FY 2021-2022
18
Annual Undesignated Fund Balances – Year End
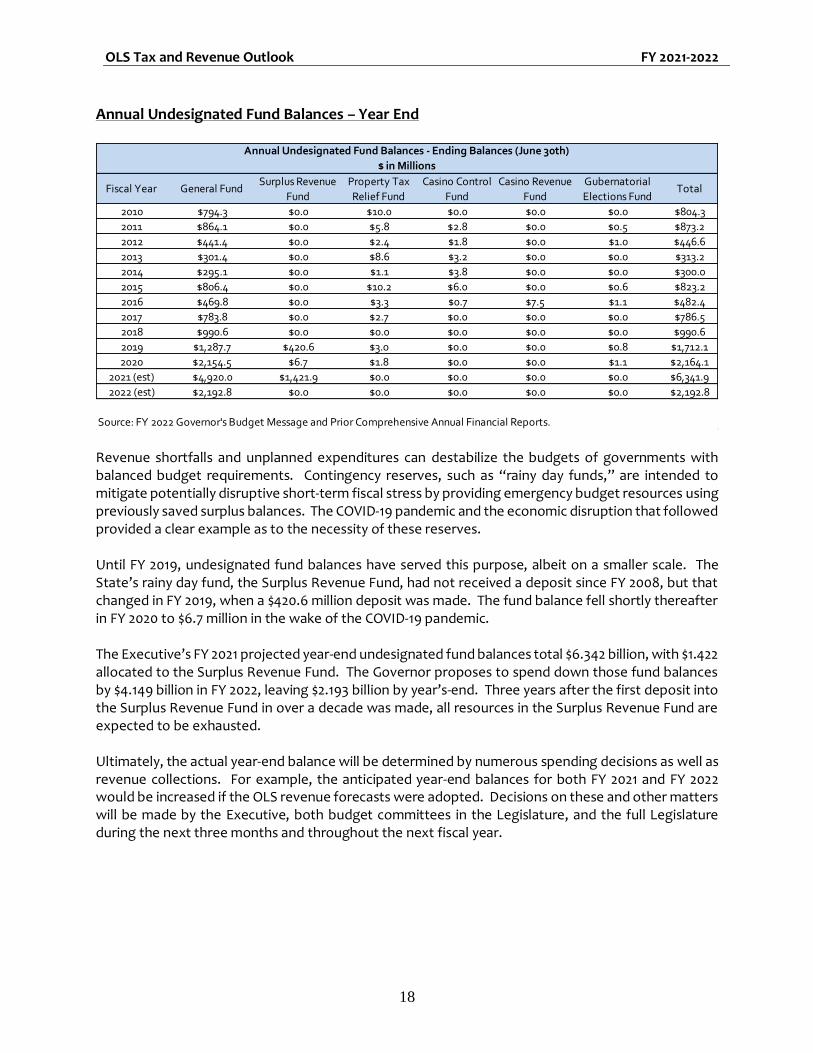
Revenue shortfalls and unplanned expenditures can destabilize the budgets of governments with balanced budget requirements. Contingency reserves, such as “rainy day funds,” are intended to mitigate potentially disruptive short-term fiscal stress by providing emergency budget resources using previously saved surplus balances. The COVID-19 pandemic and the economic disruption that followed provided a clear example as to the necessity of these reserves. Until FY 2019, undesignated fund balances have served this purpose, albeit on a smaller scale. The State’s rainy day fund, the Surplus Revenue Fund, had not received a deposit since FY 2008, but that changed in FY 2019, when a $420.6 million deposit was made. The fund balance fell shortly thereafter in FY 2020 to $6.7 million in the wake of the COVID-19 pandemic. The Executive’s FY 2021 projected year-end undesignated fund balances total $6.342 billion, with $1.422 allocated to the Surplus Revenue Fund. The Governor proposes to spend down those fund balances by $4.149 billion in FY 2022, leaving $2.193 billion by year’s-end. Three years after the first deposit into the Surplus Revenue Fund in over a decade was made, all resources in the Surplus Revenue Fund are expected to be exhausted. Ultimately, the actual year-end balance will be determined by numerous spending decisions as well as revenue collections. For example, the anticipated year-end balances for both FY 2021 and FY 2022 would be increased if the OLS revenue forecasts were adopted. Decisions on these and other matters will be made by the Executive, both budget committees in the Legislature, and the full Legislature during the next three months and throughout the next fiscal year.
Fiscal Year General FundSurplus Revenue
Fund
Property Tax
Relief Fund
Casino Control
Fund
Casino Revenue
Fund
Gubernatorial
Elections FundTotal
2010 $794.3 $0.0 $10.0 $0.0 $0.0 $0.0 $804.3
2011 $864.1 $0.0 $5.8 $2.8 $0.0 $0.5 $873.2
2012 $441.4 $0.0 $2.4 $1.8 $0.0 $1.0 $446.6
2013 $301.4 $0.0 $8.6 $3.2 $0.0 $0.0 $313.2
2014 $295.1 $0.0 $1.1 $3.8 $0.0 $0.0 $300.0
2015 $806.4 $0.0 $10.2 $6.0 $0.0 $0.6 $823.2
2016 $469.8 $0.0 $3.3 $0.7 $7.5 $1.1 $482.4
2017 $783.8 $0.0 $2.7 $0.0 $0.0 $0.0 $786.5
2018 $990.6 $0.0 $0.0 $0.0 $0.0 $0.0 $990.6
2019 $1,287.7 $420.6 $3.0 $0.0 $0.0 $0.8 $1,712.1
2020 $2,154.5 $6.7 $1.8 $0.0 $0.0 $1.1 $2,164.1
2021 (est) $4,920.0 $1,421.9 $0.0 $0.0 $0.0 $0.0 $6,341.9
2022 (est) $2,192.8 $0.0 $0.0 $0.0 $0.0 $0.0 $2,192.8
Source: FY 2022 Governor's Budget Message and Prior Comprehensive Annual Financial Reports.
Annual Undesignated Fund Balances - Ending Balances (June 30th)
$ in Millions
Appendices to OLS Tax and Revenue Outlook FY 2021-2022
A-1
Appendices Contents
Page
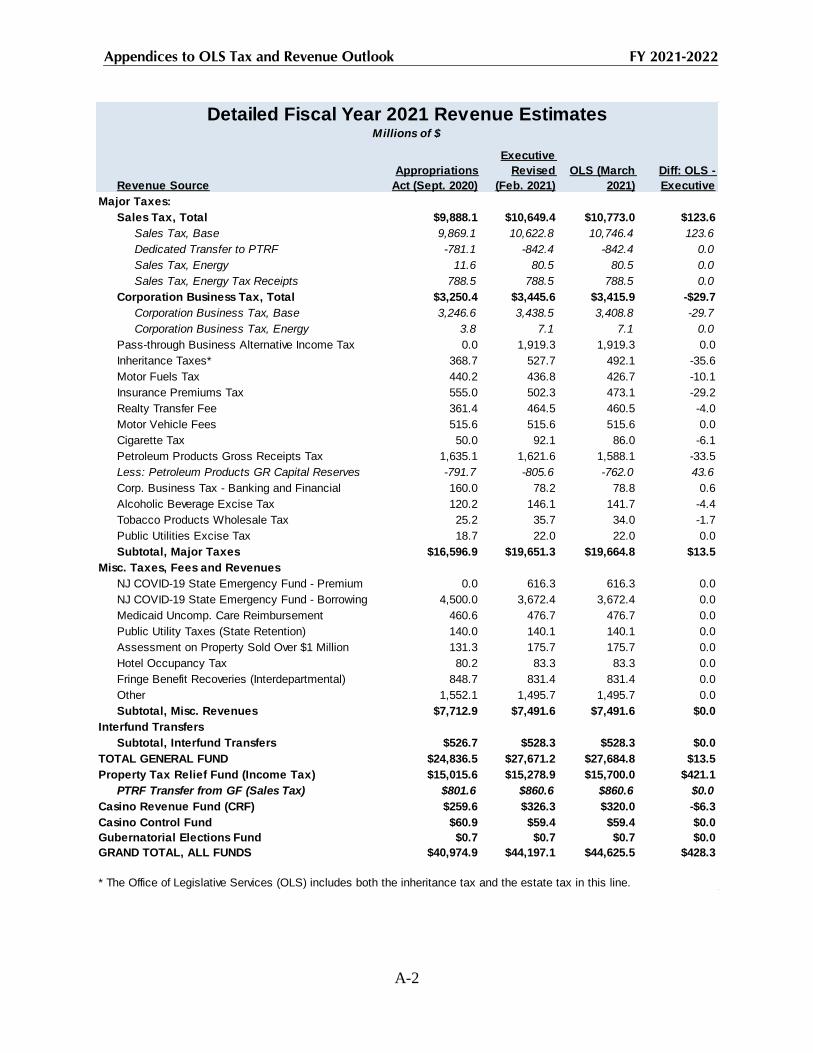
Detailed Fiscal Year 2021 Revenue Estimates ................................. A-2
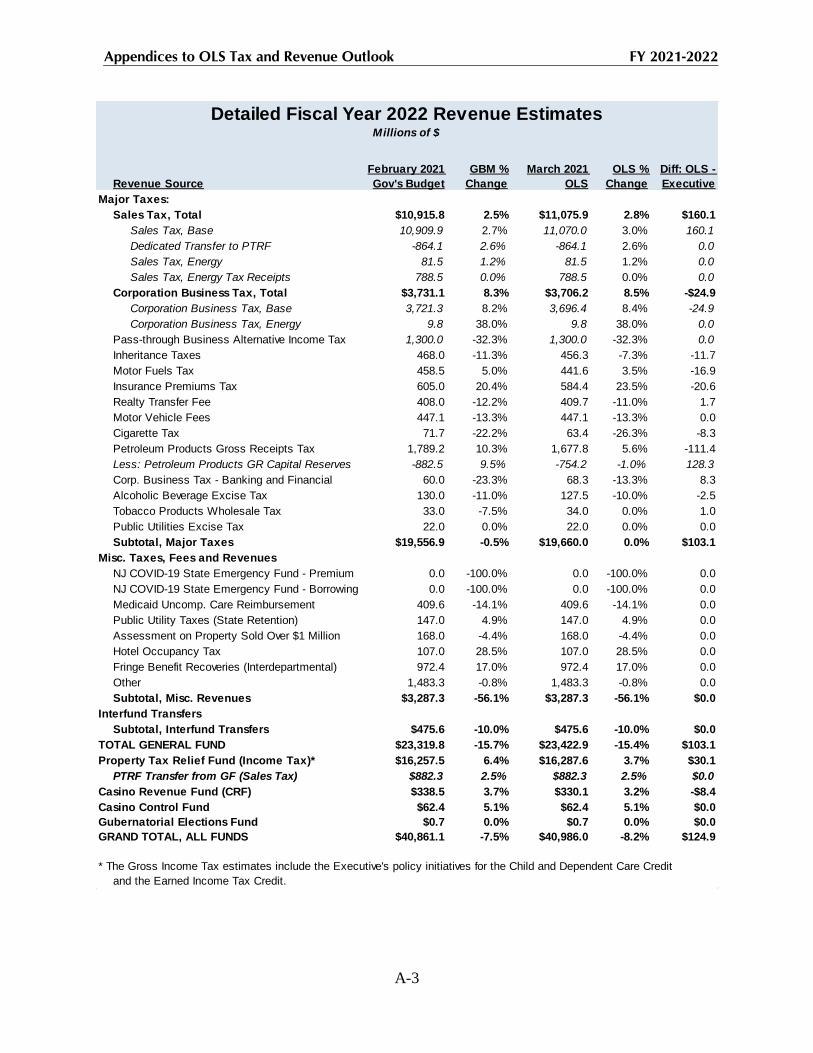
Detailed Fiscal Year 2022 Revenue Estimates ................................. A-3
Pass-Through Business Alternative Income Tax ..……...………… A-4
Paycheck Protection Program Loans to New Jersey Businesses ... A-5
Appendices to OLS Tax and Revenue Outlook FY 2021-2022
A-2
Revenue Source
Appropriations
Act (Sept. 2020)
Executive
Revised
(Feb. 2021)
OLS (March
2021)
Diff: OLS -
Executive
Major Taxes:
Sales Tax, Total $9,888.1 $10,649.4 $10,773.0 $123.6
Sales Tax, Base 9,869.1 10,622.8 10,746.4 123.6
Dedicated Transfer to PTRF -781.1 -842.4 -842.4 0.0
Sales Tax, Energy 11.6 80.5 80.5 0.0
Sales Tax, Energy Tax Receipts 788.5 788.5 788.5 0.0
Corporation Business Tax, Total $3,250.4 $3,445.6 $3,415.9 -$29.7
Corporation Business Tax, Base 3,246.6 3,438.5 3,408.8 -29.7
Corporation Business Tax, Energy 3.8 7.1 7.1 0.0
Pass-through Business Alternative Income Tax 0.0 1,919.3 1,919.3 0.0
Inheritance Taxes* 368.7 527.7 492.1 -35.6
Motor Fuels Tax 440.2 436.8 426.7 -10.1
Insurance Premiums Tax 555.0 502.3 473.1 -29.2
Realty Transfer Fee 361.4 464.5 460.5 -4.0
Motor Vehicle Fees 515.6 515.6 515.6 0.0
Cigarette Tax 50.0 92.1 86.0 -6.1
Petroleum Products Gross Receipts Tax 1,635.1 1,621.6 1,588.1 -33.5
Less: Petroleum Products GR Capital Reserves -791.7 -805.6 -762.0 43.6
Corp. Business Tax - Banking and Financial 160.0 78.2 78.8 0.6
Alcoholic Beverage Excise Tax 120.2 146.1 141.7 -4.4
Tobacco Products Wholesale Tax 25.2 35.7 34.0 -1.7
Public Utilities Excise Tax 18.7 22.0 22.0 0.0
Subtotal, Major Taxes $16,596.9 $19,651.3 $19,664.8 $13.5
Misc. Taxes, Fees and Revenues
NJ COVID-19 State Emergency Fund - Premium 0.0 616.3 616.3 0.0
NJ COVID-19 State Emergency Fund - Borrowing 4,500.0 3,672.4 3,672.4 0.0
Medicaid Uncomp. Care Reimbursement 460.6 476.7 476.7 0.0
Public Utility Taxes (State Retention) 140.0 140.1 140.1 0.0
Assessment on Property Sold Over $1 Million 131.3 175.7 175.7 0.0
Hotel Occupancy Tax 80.2 83.3 83.3 0.0
Fringe Benefit Recoveries (Interdepartmental) 848.7 831.4 831.4 0.0
Other 1,552.1 1,495.7 1,495.7 0.0
Subtotal, Misc. Revenues $7,712.9 $7,491.6 $7,491.6 $0.0
Interfund Transfers
Subtotal, Interfund Transfers $526.7 $528.3 $528.3 $0.0
TOTAL GENERAL FUND $24,836.5 $27,671.2 $27,684.8 $13.5
Property Tax Relief Fund (Income Tax) $15,015.6 $15,278.9 $15,700.0 $421.1
PTRF Transfer from GF (Sales Tax) $801.6 $860.6 $860.6 $0.0
Casino Revenue Fund (CRF) $259.6 $326.3 $320.0 -$6.3
Casino Control Fund $60.9 $59.4 $59.4 $0.0
Gubernatorial Elections Fund $0.7 $0.7 $0.7 $0.0
GRAND TOTAL, ALL FUNDS $40,974.9 $44,197.1 $44,625.5 $428.3
* The Office of Legislative Services (OLS) includes both the inheritance tax and the estate tax in this line.
Detailed Fiscal Year 2021 Revenue EstimatesMillions of $
Appendices to OLS Tax and Revenue Outlook FY 2021-2022
A-3
Revenue Source
February 2021
Gov's Budget
GBM %
Change
March 2021
OLS
OLS %
Change
Diff: OLS -
Executive
Major Taxes:
Sales Tax, Total $10,915.8 2.5% $11,075.9 2.8% $160.1
Sales Tax, Base 10,909.9 2.7% 11,070.0 3.0% 160.1
Dedicated Transfer to PTRF -864.1 2.6% -864.1 2.6% 0.0
Sales Tax, Energy 81.5 1.2% 81.5 1.2% 0.0
Sales Tax, Energy Tax Receipts 788.5 0.0% 788.5 0.0% 0.0
Corporation Business Tax, Total $3,731.1 8.3% $3,706.2 8.5% -$24.9
Corporation Business Tax, Base 3,721.3 8.2% 3,696.4 8.4% -24.9
Corporation Business Tax, Energy 9.8 38.0% 9.8 38.0% 0.0
Pass-through Business Alternative Income Tax 1,300.0 -32.3% 1,300.0 -32.3% 0.0
Inheritance Taxes 468.0 -11.3% 456.3 -7.3% -11.7
Motor Fuels Tax 458.5 5.0% 441.6 3.5% -16.9
Insurance Premiums Tax 605.0 20.4% 584.4 23.5% -20.6
Realty Transfer Fee 408.0 -12.2% 409.7 -11.0% 1.7
Motor Vehicle Fees 447.1 -13.3% 447.1 -13.3% 0.0
Cigarette Tax 71.7 -22.2% 63.4 -26.3% -8.3
Petroleum Products Gross Receipts Tax 1,789.2 10.3% 1,677.8 5.6% -111.4
Less: Petroleum Products GR Capital Reserves -882.5 9.5% -754.2 -1.0% 128.3
Corp. Business Tax - Banking and Financial 60.0 -23.3% 68.3 -13.3% 8.3
Alcoholic Beverage Excise Tax 130.0 -11.0% 127.5 -10.0% -2.5
Tobacco Products Wholesale Tax 33.0 -7.5% 34.0 0.0% 1.0
Public Utilities Excise Tax 22.0 0.0% 22.0 0.0% 0.0
Subtotal, Major Taxes $19,556.9 -0.5% $19,660.0 0.0% $103.1
Misc. Taxes, Fees and Revenues
NJ COVID-19 State Emergency Fund - Premium 0.0 -100.0% 0.0 -100.0% 0.0
NJ COVID-19 State Emergency Fund - Borrowing 0.0 -100.0% 0.0 -100.0% 0.0
Medicaid Uncomp. Care Reimbursement 409.6 -14.1% 409.6 -14.1% 0.0
Public Utility Taxes (State Retention) 147.0 4.9% 147.0 4.9% 0.0
Assessment on Property Sold Over $1 Million 168.0 -4.4% 168.0 -4.4% 0.0
Hotel Occupancy Tax 107.0 28.5% 107.0 28.5% 0.0
Fringe Benefit Recoveries (Interdepartmental) 972.4 17.0% 972.4 17.0% 0.0
Other 1,483.3 -0.8% 1,483.3 -0.8% 0.0
Subtotal, Misc. Revenues $3,287.3 -56.1% $3,287.3 -56.1% $0.0
Interfund Transfers
Subtotal, Interfund Transfers $475.6 -10.0% $475.6 -10.0% $0.0
TOTAL GENERAL FUND $23,319.8 -15.7% $23,422.9 -15.4% $103.1
Property Tax Relief Fund (Income Tax)* $16,257.5 6.4% $16,287.6 3.7% $30.1
PTRF Transfer from GF (Sales Tax) $882.3 2.5% $882.3 2.5% $0.0
Casino Revenue Fund (CRF) $338.5 3.7% $330.1 3.2% -$8.4
Casino Control Fund $62.4 5.1% $62.4 5.1% $0.0
Gubernatorial Elections Fund $0.7 0.0% $0.7 0.0% $0.0
GRAND TOTAL, ALL FUNDS $40,861.1 -7.5% $40,986.0 -8.2% $124.9
* The Gross Income Tax estimates include the Executive's policy initiatives for the Child and Dependent Care Credit
and the Earned Income Tax Credit.
Detailed Fiscal Year 2022 Revenue EstimatesMillions of $
Appendices to OLS Tax and Revenue Outlook FY 2021-2022
A-4
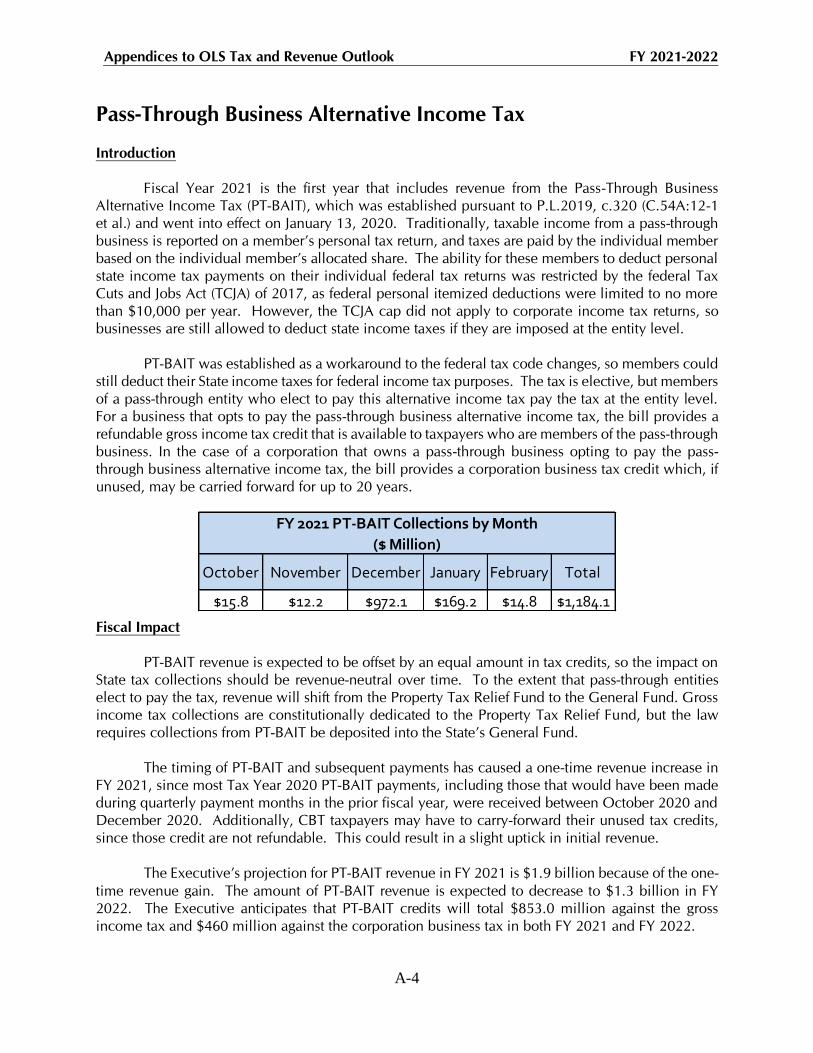
Pass-Through Business Alternative Income Tax
Introduction
Fiscal Year 2021 is the first year that includes revenue from the Pass-Through Business
Alternative Income Tax (PT-BAIT), which was established pursuant to P.L.2019, c.320 (C.54A:12-1
et al.) and went into effect on January 13, 2020. Traditionally, taxable income from a pass-through
business is reported on a member’s personal tax return, and taxes are paid by the individual member
based on the individual member’s allocated share. The ability for these members to deduct personal
state income tax payments on their individual federal tax returns was restricted by the federal Tax
Cuts and Jobs Act (TCJA) of 2017, as federal personal itemized deductions were limited to no more
than $10,000 per year. However, the TCJA cap did not apply to corporate income tax returns, so
businesses are still allowed to deduct state income taxes if they are imposed at the entity level.
PT-BAIT was established as a workaround to the federal tax code changes, so members could
still deduct their State income taxes for federal income tax purposes. The tax is elective, but members
of a pass-through entity who elect to pay this alternative income tax pay the tax at the entity level.
For a business that opts to pay the pass-through business alternative income tax, the bill provides a
refundable gross income tax credit that is available to taxpayers who are members of the pass-through
business. In the case of a corporation that owns a pass-through business opting to pay the pass-
through business alternative income tax, the bill provides a corporation business tax credit which, if
unused, may be carried forward for up to 20 years.
Fiscal Impact
PT-BAIT revenue is expected to be offset by an equal amount in tax credits, so the impact on
State tax collections should be revenue-neutral over time. To the extent that pass-through entities
elect to pay the tax, revenue will shift from the Property Tax Relief Fund to the General Fund. Gross
income tax collections are constitutionally dedicated to the Property Tax Relief Fund, but the law
requires collections from PT-BAIT be deposited into the State’s General Fund.
The timing of PT-BAIT and subsequent payments has caused a one-time revenue increase in
FY 2021, since most Tax Year 2020 PT-BAIT payments, including those that would have been made
during quarterly payment months in the prior fiscal year, were received between October 2020 and
December 2020. Additionally, CBT taxpayers may have to carry-forward their unused tax credits,
since those credit are not refundable. This could result in a slight uptick in initial revenue.
The Executive’s projection for PT-BAIT revenue in FY 2021 is $1.9 billion because of the one-
time revenue gain. The amount of PT-BAIT revenue is expected to decrease to $1.3 billion in FY
2022. The Executive anticipates that PT-BAIT credits will total $853.0 million against the gross
income tax and $460 million against the corporation business tax in both FY 2021 and FY 2022.
October November December January February Total
$15.8 $12.2 $972.1 $169.2 $14.8 $1,184.1
FY 2021 PT-BAIT Collections by Month
($ Million)
Appendices to OLS Tax and Revenue Outlook FY 2021-2022
A-5
Paycheck Protection Program Loans to New Jersey Businesses
The Paycheck Protection Program (PPP) is one of the major pillars of the federal government’s
response to the economic damage of the COVID-19 pandemic. The federal “Coronavirus Aid, Relief,
and Economic Security Act,” (or CARES Act) was enacted in March 2020 and included funding for
the Small Business Administration (SBA) to modify existing loan programs and establish a new loan
program – the PPP – to assist small businesses nationwide adversely affected by the COVID-19
emergency. This background paper examines the impact of the PPP on New Jersey small businesses
by considering the number and type of firms affected, the potential employment impact, and possible
tax implications.
By providing revenue to replace what small businesses would have earned but for the
pandemic, the PPP was intended to prop up the economic role served by those businesses. Payroll
taxes and individual income taxes on wages paid, which may have been terminated if not for the
PPP, would continue to benefit the State. The OLS does not specifically forecast these benefits, but
rather incorporates them into the baseline forecast. Special provisions of law make both the forgiven
PPP loans themselves, and any business expenses paid with those loans, exempt or deductible for
tax purposes, meaning that a forgiven PPP loan is more beneficial to a firm for tax purposes than
regular income of the same amount. The Executive and OLS have both explicitly accounted for these
reduced revenues in official forecasts.
The first round of PPP loans was supported by an original appropriation of $349 billion under
the CARES Act. This was later expanded by $320 billion under the “Paycheck Protection Program
and Health Care Enhancement Act of 2020,” for total first round funding of $670.3 billion. The
“Consolidated Appropriations Act, 2021” allocated an additional $284 billion for the second round
of PPP loans. The American Rescue Plan Act of 2021 provides an additional $7.5 billion, and
expands eligibility to additional forms of business. According to the SBA, New Jersey businesses
have received financial assistance totaling $24.1 billion through the PPP as of March 29, 2021.
PPP: The Basics
The primary goal of the PPP is to provide economic relief to small businesses and non-profit
entities that have been adversely impacted by COVID-19 and related mitigation efforts. The PPP
makes forgivable loans available to small businesses and other entities that meet certain criteria, such
as firms that: (1) have 500 or fewer employees worldwide, (2) have tangible net worth less than $15
million and average net income less than $5 million, and (3) conform to SBA size standards for their
industry.
PPP loans made to eligible borrowers qualify for full loan forgiveness if, during the 8- to 24-
week covered period, the following conditions are met: employee and compensation levels must be
maintained, loan proceeds must be spent on payroll costs and other eligible expenses1, and at least
60 percent of the proceeds must be spent on payroll costs. Second round PPP loans qualify for full
loan forgiveness during the 8- to 24-week covered period following loan disbursement: employee
and compensation levels are maintained in the same manner as required for the first round PPP loans.
1 Eligible PPP expenses include payroll, including health insurance, mortgage interest, rent, utilities, and
worker protection costs related to the COVID-19 pandemic, uninsured property damage costs caused by
looting and vandalism during 2020, and certain supplier costs and expenses for operations.
Appendices to OLS Tax and Revenue Outlook FY 2021-2022
A-6
Certain eligible borrowers are now allowed to apply for second round PPP loans. Eligibility
criteria are somewhat more restrictive, and require that the borrower received and used, or plans to
use, the full amount of the first loan. The maximum amount of loans is also less than the first. The
deadline to apply for a second round PPP loan was recently extended from March 31, 2021 to May
31, 2021.
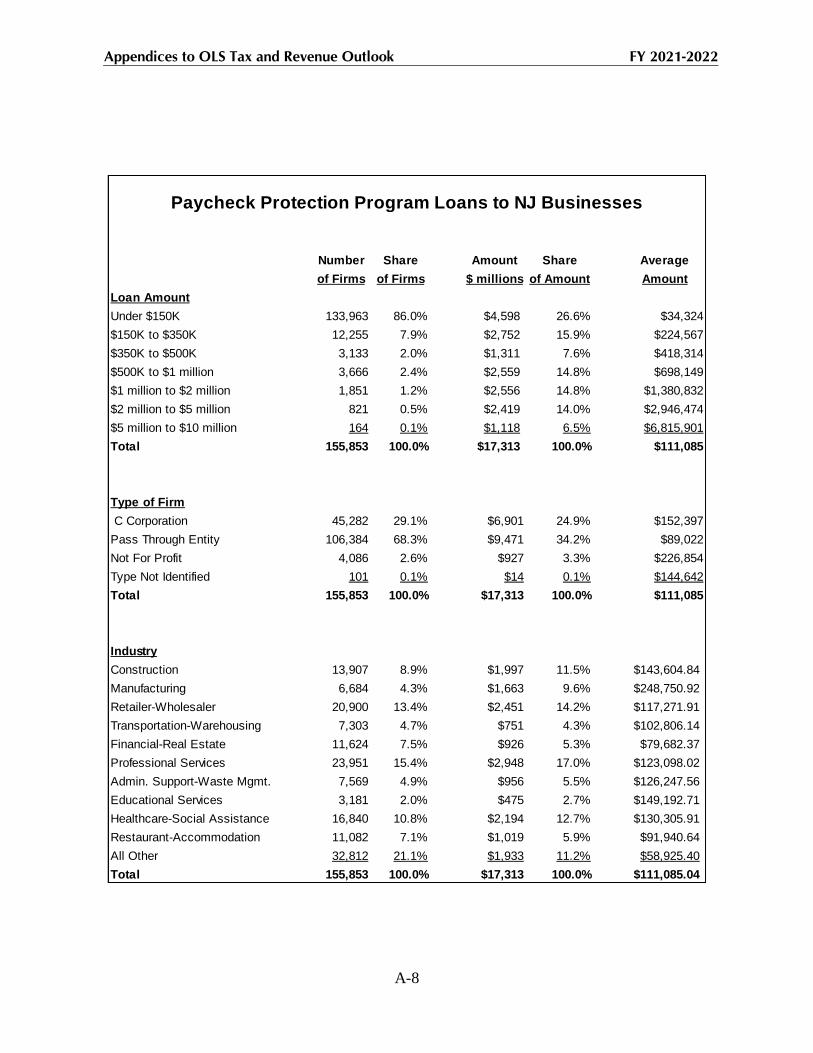
PPP Detail: Loans by Size, Type of Firm, and Sector
The SBA publishes state-specific data on its website for two groups of firms: (1) firms that
received loans under $150,000 and (2) firms that received loans that range from $150,000 up to $10
million. The table at the end of this appendix provides detail for the $17.3 billion of loans made to
New Jersey firms during the first round of PPP based on size of loan, type of firm, and sector.
Highlights include:
Firms that received a loan under $150,000 comprised 86 percent of all firms and over one-
quarter of loaned money ($4.6 billion of total loans).
There were 164 firms (0.1 percent) that received a loan between $5 million and $10 million,
and those loans comprised 6.5 percent of total loans.
Non-profit entities received 4,086 loans totaling $927 billion. This category includes schools,
social assistance organizations, and houses of worship.
Construction, healthcare professional service, and retail-wholesale firms received more than
one-half (55.4 percent) of total dollar loans. Manufacturers received the largest average loan
($248,751).
The Impact of PPP on Employment
The PPP was established to minimize job loss. However, recent research finds that the first
round of PPP loans had only a modest employment impact. The research also finds that the average
cost per job retained was higher than the average annual earnings of employees at eligible firms. For
example, recent academic studies found that (results apply to the United States and employment
gains are relative to employment that would have occurred without the program):
The PPP increased employment at small businesses by 1.3 million jobs (2.0 percent) at an
average cost of $377,700 per job for the April 2020 to August 2020 time period. By
comparison, the average annual earnings for employees at PPP-eligible firms was $45,000.2
The PPP resulted in employment gains of 3.2 million to 4.8 million jobs (4.5 percent to 6.8
percent) in its first three months, April 2020 through June 2020, at an average cost of
$109,000 to $164,000 per job.3
2 The analysis excludes firms in NAICS Sector 72, Accommodation and Food Service. Raj Chetty, John N.
Friedman, Nathaniel Hendren, and Michael Stepner, “How Did COVID-19 and Stabilization Policies Affect
Spending and Employment? A New Real-Time Economic Tracker Based on Private Sector Data,” NBER
Working Paper No. 27431 (Nov. 2020). 3 Joao Granga, Christos Makridis, Constantine Yannelis, Eric Zwick, “Did the Paycheck Protection Program
Hit the Target?” NBER Working Paper No. 27095 (Nov.2020).
Appendices to OLS Tax and Revenue Outlook FY 2021-2022
A-7
The PPP boosted employment at eligible firms by 1.4 million to 3.2 million jobs (2.0 percent
to 4.5 percent) through the first week of June 2020 at an average cost of $162,000 to
$380,000 per job.4
There are multiple factors that could have resulted in the PPP’s employment impacts. The paper
by Chetty et al. supposes that the small employment effect occurred because firms received loans but
did not intend to lay off employees. Other firms that received loans might not have incurred a
revenue reduction, or incurred only a brief, temporary revenue reduction that was recouped in
subsequent months. PPP recipients may have chosen to use the loan proceeds for other eligible
expenses, such as mortgage payments or rent, instead of maintaining higher levels of employment.
PPP: Tax Implications of Loan Forgiveness
Section 1106 of the CARES Act provided that a PPP loan that is forgiven is excludable from a
recipient’s gross income for federal tax purposes. Section 276(a) of the “COVID-related Tax Relief
Act of 2020,” now provides that any amount that otherwise would be includible in a PPP loan
recipient’s gross income by reason of forgiveness of the loan is now excluded from gross income.
On February 9, 2021, the State Department of the Treasury announced that New Jersey will
conform to the federal treatment of PPP loans for tax purposes. As a result, PPP loans that are forgiven
are excludable from income and business expenses paid for with PPP loans are deductible from
income. New Jersey’s corporate tax laws unambiguously follow federal treatment of income in most
respects, but the gross income tax laws that apply to partnerships and pass-through businesses were
less clear prior to the Treasury announcement.
Since many of the costs supported by PPP loans may already be deductible from income as
ordinarily business expenses, the loan forgiveness element will cause New Jersey to lose tax revenues
compared to a scenario in which businesses earned the same amounts through normal sales. This
forgone revenue will appear in both FY 2021 and FY 2022, depending on the timing of the loan and
its forgiveness. The Executive and OLS both estimate reductions of at least $500 million to $600
million over both FY 2021 and FY 2022. As of March 25, 2021, 2.3 million loans totaling $149.5
billion in assistance, have been forgiven; an additional 246,000 applications seeking forgiveness of
$87.8 billion are under review. State-level loan forgiveness data are not available at this time.
4 David Autor, David Cho, Leland D. Crane, Mita Goldar, Byron Lutz, Joshua Montes, William B. Peterman,
David Ratner, Daniel Villar, and Ahu Yildirmaz, “An Evaluation of the Paycheck Protection Program Using
Administrative Payroll Microdata,” MIT Working Paper (July 2020).
Appendices to OLS Tax and Revenue Outlook FY 2021-2022
A-8
Number Share Amount Share Average
of Firms of Firms $ millions of Amount Amount
Loan Amount
Under $150K 133,963 86.0% $4,598 26.6% $34,324
$150K to $350K 12,255 7.9% $2,752 15.9% $224,567
$350K to $500K 3,133 2.0% $1,311 7.6% $418,314
$500K to $1 million 3,666 2.4% $2,559 14.8% $698,149
$1 million to $2 million 1,851 1.2% $2,556 14.8% $1,380,832
$2 million to $5 million 821 0.5% $2,419 14.0% $2,946,474
$5 million to $10 million 164 0.1% $1,118 6.5% $6,815,901
Total 155,853 100.0% $17,313 100.0% $111,085
Type of Firm
C Corporation 45,282 29.1% $6,901 24.9% $152,397
Pass Through Entity 106,384 68.3% $9,471 34.2% $89,022
Not For Profit 4,086 2.6% $927 3.3% $226,854
Type Not Identified 101 0.1% $14 0.1% $144,642
Total 155,853 100.0% $17,313 100.0% $111,085
Industry
Construction 13,907 8.9% $1,997 11.5% $143,604.84
Manufacturing 6,684 4.3% $1,663 9.6% $248,750.92
Retailer-Wholesaler 20,900 13.4% $2,451 14.2% $117,271.91
Transportation-Warehousing 7,303 4.7% $751 4.3% $102,806.14
Financial-Real Estate 11,624 7.5% $926 5.3% $79,682.37
Professional Services 23,951 15.4% $2,948 17.0% $123,098.02
Admin. Support-Waste Mgmt. 7,569 4.9% $956 5.5% $126,247.56
Educational Services 3,181 2.0% $475 2.7% $149,192.71
Healthcare-Social Assistance 16,840 10.8% $2,194 12.7% $130,305.91
Restaurant-Accommodation 11,082 7.1% $1,019 5.9% $91,940.64
All Other 32,812 21.1% $1,933 11.2% $58,925.40
Total 155,853 100.0% $17,313 100.0% $111,085.04
Paycheck Protection Program Loans to NJ Businesses
The Offi ce of Legislative Services provides nonpartisan assistance to the State Legislature
in the areas of legal, fi scal, research, bill drafting, committee staffi ng and administrative
services. It operates under the jurisdiction of the Legislative Services Commission, a
bipartisan body consisting of eight members of each House. The Executive Director
supervises and directs the Offi ce of Legislative Services.
The Legislative Budget and Finance Offi cer is the chief fi scal offi cer for the Legislature.
The Legislative Budget and Finance Offi cer collects and presents fi scal information
for the Legislature; serves as Secretary to the Joint Budget Oversight Committee;
attends upon the Appropriations Committees during review of the Governor’s Budget
recommendations; reports on such matters as the committees or Legislature may direct;
administers the fi scal note process and has statutory responsibilities for the review of
appropriations transfers and other State fi scal transactions.
The Offi ce of Legislative Services Central Staff provides a variety of legal, fi scal, research
and administrative services to individual legislators, legislative offi cers, legislative
committees and commissions, and partisan staff . The central staff is organized under the
Central Management Unit into ten subject area sections. Each section, under a section
chief, includes legal, fi scal, and research staff for the standing reference committees of the
Legislature and, upon request, to special commissions created by the Legislature.
The central staff assists the Legislative Budget and Finance Offi cer in providing services
to the Appropriations Committees during the budget review process.
Individuals wishing information and committee schedules on the
FY 2022 budget are encouraged to contact:
Legislative Budget and Finance Offi ce
State House Annex
Room 140, PO Box 068
Trenton, NJ 08625
(609) 847-3105 · Fax (609) 777-2442