Embed Size (px)
Citation preview
CREATION AND VALIDATION OF THE OHIO RISK ASSESSMENT SYSTEM
FINAL REPORT
Edward Latessa Ph.D. Principle Investigator
Paula Smith, Ph.D.
Co-Principle Investigator
Richard Lemke, M.A. Research Associate
Matthew Makarios, Ph.D.
Research Associate
Christopher Lowenkamp, Ph.D. Assistant Research Professor
University of Cincinnati School of Criminal Justice
Center for Criminal Justice Research PO BOX 210389
Cincinnati, Ohio 45221
July, 2009
This research was made possible with a grant from the Ohio Department of Rehabilitation and Correction (grant numbers 2005-JG-E0R-6269 and 2005-JG-C01-T8307). Views expressed are those of the authors and do not necessarily reflect the views of ORDC.

i
ACKKNOWLEDGEMENTS A large scale research project such as this could not have been conducted with the help of many individuals and agencies. First and foremost, thanks are due to the Ohio Department of Rehabilitation and Correction and the Office of Criminal Justice Research for providing the funding. Thanks are also due to the following people and agencies: The project owes thanks to a large group of people whom conducted the structured interviews. This includes; Rebecca Schnupp, Katie Meholick, Kristin Ostrowski, Jackie Spade, Tessa Crites, Dan Lytle, Melissa Meltzer, Jordan Mansour, Doshie Piper, Lori Hilliard, Sally Miller, Kristen Swartz, Jacqueline Rohrbach, Jess Warner, Will Stadler, Amy Latessa, Jennifer Latessa, Amanda Feola, Ashley Fritz, Chris Smith, Ben Smith, Darlene Wilder, Mirlinda Ndrecka, Autumn Morris, Ashley Ballard, Ryan Randa, Bobbi Tickner, James McCafferty, Bobbi Ticknor, Sherry Tillinghast, Lindsay Morrow, and Rohit Kukreti. Additionally thanks are extended to the staff and administration of the following agencies: Warren County Pretrial Services, Cuyahoga County Pretrial Services, Summit County Pretrial Services, Butler County Pretrial Services, Hamilton County Pretrial Services, Franklin County Pretrial Services, Richland County Pretrial Services, Summit County Pretrial Services. Lorain Correctional Institution, Correctional Reception Center, Belmont Correctional Institution, Pickaway Correctional Institution, Trumbull Correctional Institution, Ross Correctional Institution, Ohio Reformatory for Women, Southeastern Correctional Institution, North Central Correctional Institution, London Correctional Institution, Lebanon Correctional Institution, and Warren Correctional Institution. River City Community Based Correctional Center, Community Correctional Center of Butler, Clermont and Warren Counties, Franklin County Community Based Correctional Facility, Western Ohio Regional Treatment and Habilitation Center, NorthWest Community Corrections Center, Summit County Community Based Correctional Facility, Community Corrections Association, Inc., Eastern Ohio Correction Center, Turtle Creek Center Halfway House and Oriana House operated facilities. Columbiana County Probation Services, Franklin County Probation, Cuyahoga County Probation Services, Hamilton County Probation Services, Warren County Probation Services, Montgomery County Probation Services, Clermont County Probation Services, Butler County Probation Services, and Wood County Probation Services.

ii
EXECUTIVE SUMMARY
This report outlines the development and validation of the Ohio Risk Assessment System.
The Ohio Department of Rehabilitation and Corrections contracted with the University of
Cincinnati, Center for Criminal Justice Research to create a risk assessment system that provided
assessments at multiple points in the criminal justice system and that was validated on an Ohio
population. A major goal of the project was to develop assessments that abided by the principles
of effective classification by constructing assessments that 1) separated Ohio offenders into risk
groups based on their likelihood to recidivate, 2) identified dynamic risk factors that can be used
to prioritize programmatic needs, and 3) identify potential barriers to treatment.
The Ohio Risk Assessment System was created using a prospective design that involved
conducting in-depth structured interviews of over 1,800 offenders at the following stages in
Ohio’s justice system: pretrial, community supervision, prison intake, and community reentry.
After interviews were conducted, offenders were tracked for approximately one year to gather
follow-up information on recidivism. Five assessment instruments were created using items that
were related to recidivism: The Pretrial Assessment Tool, The Community Supervision Tool,
The Community Supervision Screening Tool, The Prison Intake Tool, and the Reentry Tool.
Validation involved examining the predictive power of the assessment instruments. The
results reveal that all assessment instruments are able to significantly distinguish between risk
levels. Further, r values are relatively large, and depending upon the assessment instrument,
range from .22 to .44. Concurrent validity also was examined by comparing the predictive
power of each assessment tool to the LSI-R and the Wisconsin Risk / Needs instruments. These
results revealed that the instruments for the Ohio Risk Assessment System performed as well if
not better than both of the other instruments.
iii
TABLE OF CONTENTS
ACKNOWLEDGEMENTS………………………………………………………………......i
EXECUTIVE SUMMARY............................................................................................... ii
INTRODUCTION.................................................................................................................. 1
The Principles of Effective Classification………………………………………………. 1
The Advantages of a Risk Assessment System…………………………………………. 3
METHODS …………………………………………………………………………………..5
Data Collection.………………………………………………………………………......6
Participants …………………………………………………………………………….... 8
Recidivism …………………………………………………………………………….....10
Assessment Construction ……………………………………………………………...... 12
Priorities in Case Management.………………………………………………………......12
Responsivity Assessments.…………………………………………………………….... 13
VALIDATION RESULTS.…………………………………………………………………..13
The Pretrial Assessment Tool …………………………………………………………... 13
The Community Supervision Tool ……………………………………………………... 17
The Community Supervision Screening Tool.…………….…………………………..... 24
The Prison Intake Tool ……………………………........................................................ 27
The Reentry Tool ...................………………………………………………………….. 33
SUMMARY AND CONCLUSIONS………………………………………………………...38
Summary of Findings....................................................................................................... 38
Limitations..........................................................................................................................39
Recommendations...............................................................................................................40
REFERENCES……………………………………………………………………………….43
APPENDIX A………………………………………………………………………………...45
APPENDIX B......................................................................................................................... 59
1
INTRODUCTION
In 2006, the Ohio Department of Rehabilitation and Corrections (ODRC) contracted with
the University of Cincinnati, Center for Criminal Justice Research to develop a risk and needs
assessment system that improved consistency and facilitated communication across criminal
justice agencies. The goal was to develop risk/needs assessment tools that were predictive of
recidivism at multiple points in the criminal justice system. Specifically, assessment instruments
were to be developed at the following stages: 1) pretrial, 2) community supervision, 4)
institutional intake, and 4) community re-entry.
A major goal of assessment system was to conform to the principles of effective
classification. In doing so, ODRC hoped to efficiently allocate supervision resources and
structure decision-making in a manner that reduces the likelihood of recidivism. As a result, the
Ohio Risk Assessment System (ORAS) was developed to classify the risk level of offenders in
the system while also identifying both criminogenic needs and barriers to programming.
The Principles of Effective Classification
Several recent studies of correctional programming in Ohio suggest that the effectiveness
of both residential and community based programs are mitigated by the risk of level of the
clientele that they serve. For example, in 2002, Lowenkamp and Latessa evaluated the effects
of Halfway Houses and Community Based Correctional Facilities and found consistently higher
effect sizes for offenders who were moderate to high risk. Similar results were found for
Community Corrections Act funded programs that suggested that programs that targeted higher
risk offenders were produced significantly lower rates of recidivism than programs that did not
(Lowenkamp & Latessa, 2005).

2
The Ohio studies suggest that it is important to utilize risk assessment instruments in
order to efficiently allocate resources in a manner that reduces recidivism. The principles of
effective classification have been developed to guide criminal justice agencies in the use of risk
assessment systems. In short, the principles of effective classification suggest that programs
should use actuarial assessment tools to identify dynamic risk factors, especially in high risk
offenders, while also identifying potential barriers to treatment. There are four major principles
of effective classification are: the risk principle, the needs principle, the responsivity principle,
the professional discretion principle (Andrews, Bonta, & Hoge, 1990).
The risk principle suggests that correctional interventions and programs are most
effective when their intensity is matched to the risk level of the clientele (Andrews, Bonta, &
Hoge, 1990; Van Voorhis, 2007). That is, the most intensive programs should be allocated to
moderate and high risk cases, while low risk cases be allocated little if any programming.
Practically, the risk principle suggests that the majority of supervision and treatment resources be
reserved for the highest risk cases. In fact, some research indicates that when low risk cases are
targeted with intensive programs they actually perform worse than those who were left alone.
This is because programming can expose offenders to higher risk cases and disrupt prosocial
networks (for a discussion see Lowenkamp & Latessa, 2004).
A consistent finding in correctional programming is that the most effective programs
target dynamic risk factors (Andrews et al., 1990, Lowenkamp, Latessa, & Smith, 2005;
Lowenkamp & Latessa, 2004). Dynamic risk factors (also called criminogenic needs) are factors
that when changed, have been shown to result in a reduction in recidivism. Dynamic risk
factors can include substance abuse, personality characteristics, antisocial associates, and
antisocial attitudes (for a review see Gendreau, Little, & Goggin, 1996). The needs principle
3
suggests that effective classification systems should identify dynamic risk factors so that they
can be used to target programmatic needs.
The responsivity principle focuses on identifying barriers to treatment (Van Voorhis,
2007). Although dynamic risk factors are directly related to recidivism, there are other issues
that are likely to keep individuals from engaging in treatment. Some examples of responsivity
factors include intelligence, reading ability, language barriers, and cultural barriers. If left
unaddressed, it is likely that these influences can interfere with the completion of treatment and
as a result indirectly prevent a reduction in recidivism from occurring.
Although risk assessment instruments remove a degree of professional discretion from
criminal justice actors, it is important to emphasize that the judgment of practitioners should not
be overlooked (Andrews, Bonta, & Hoge, 1990). The principle of professional discretion
recognizes that case managers and counselors are responsible for processing the risk, need, and
responsivity information and making decisions based on the information provided (Andrews,
Bonta, & Hoge, 1990). Further, actuarial tools are designed to treat offenders in the aggregate
and cannot be structured to anticipate every possible case or scenario. As a result, it is important
to allow criminal justice personnel the ability to override the assessment instruments in specific
circumstances. Still, it is also important that overrides be used on a limited percentage of cases
and that measure be taken to oversee the override process.
The Advantages of a Risk Assessment System
For over a decade, many criminal justice agencies have been implementing standardized
risk classification instruments in order to efficiently and effectively manage their target
populations. Because assessment instruments are expensive to construct and validate, resource
constraints often limit the development of risk assessment instruments for specific jurisdictions

4
and populations (Jones, 1996). As a result, many criminal justice agencies often use empirically
derived tools that that have been developed on samples from a different population. Although
this is less cost restrictive, it assumes that the instrument is a valid predictor of recidivism for
each agency’s specific population (Wright, Clear, & Dickerson, 1984; Jones, 1996; Gottfredson
& Moriarty, 2006). Also, it is likely that there are different populations of offenders within
jurisdictions. For example, the population of defendants on pretrial supervision is likely
different that the population of individuals who are released from prison. Given that it is
unlikely for a single instrument to have universal applicability across various offending
populations, there is a clear necessity to validate risk assessment instruments to each specific
target population (Wright, Clear, & Dickerson, 1984). The Ohio Risk Assessment System was
thus designed to predict recidivism at different points in the Ohio criminal justice system. In all
five instruments were constructed: The Pretrial Assessment Tool (PAT), the Community
Supervision Tool (CST), the Community Supervision Screening Tool (CSST), the Prison Intake
Tool (PIT), and the Reentry Tool (RT).
Additionally, the use of a standardized assessment tool in Ohio allows consistency in the
assessment of risk across jurisdictions. Counties in Ohio were using different methods of
assessment, creating a great deal of variation in the practices for assessing the risk and needs of
offenders. Therefore, one of the purposes of ORAS was to promote consistent and objective
assessment of the risk of recidivism for offenders in Ohio.
Another advantage of using a risk assessment system that follows offenders through the
criminal justice systems is that it improves communication and avoids duplication of
information. In fact, many of the items in the individual assessments carry over into assessments
at later dates. The total number of risk items that are collected from all assessment instruments

5
is 63. Of these, 24 items are used on at least two, if not more assessment instruments. Further,
since ORAS will be automated, items that are assessed at earlier stages have the potential to
auto-populate into assessments at future dates.
METHODS
A prospective design was utilized in the creation and validation of ORAS. To
accomplish this, offenders across the Ohio criminal justice system were given extensive
interviews for potential risk factors and a subsequently followed for one year to gather official
measures of recidivism. The creation and validation of ORAS had three phases: planning, data
collection, and validation. The planning phase involved planning meetings with research and
ODRC staff regarding the logistic obstacles to gaining access to cases and data collection sites.
It also involved the creation of the structured tools used in data collection and training of data
collectors in the administration of the semi-structured interview. The planning phase occurred
throughout the early half of 2006.
The data collection phase involved site visits to all pilot counties and locations and the
extensive interviews of offenders. In all, data for 1,834 cases was gathered from 29 locations.
This process occurred from September 2006 to October 2007. Outcome measures were gathered
between May 2008 and April 2009, providing an average of a one year follow-up for recidivism.
The validation phase of the project for ORAS began in winter 2008. The first part of this
phase involved data cleaning and analyses to determine which items were predictive of
recidivism. After this, the assessment instruments were constructed using factors that were
related to recidivism. Once constructed, the instruments were validated by examining the ability
of each instrument to predict recidivism.
6
After construction and validation, interview manuals and scoring guides were constructed
for each tool. Both instruments provide detailed instructions regarding the use of each risk
assessment tool. Once the interview guides and manuals were completed, the instruments were
piloted using a group of personnel at locations in accordance with each risk assessment (i.e. local
court officials for the CST, cases managers at ODRC correctional facilities for the PIT, etc ).
Piloting the assessment tools involved acquainting the personnel on the use of the scoring guides
and manuals and allowing them to assess offenders for several weeks. After this, focus groups
for each assessment instrument were conducted with UC research staff and the pilot assessors.
The focus groups were asked to comment on the ease of use of the instruments, wording of
questions, the time it took to complete assessments, and the reliability of the self-report
questionnaire. After the focus groups were conducted changes were made to specific questions
in the manuals, items on the scoring guides, and wording on the self-report questionnaires.
Data Collection
In order to construct a risk assessment instrument, data collection tools were designed
that gathered information on potential predictors of recidivism. To create these tools, research
staff at the University of Cincinnati reviewed previous scholarly work on the correlates of
recidivism. Based on a review of the research, variables that were previously found to be related
to recidivism were incorporated into the data collection tools.
The data collection tools were designed to gather information using self-report
questionnaires, semi-structured interviews and file reviews. The purpose of the data collection
tools was to provide a large number of potential risk factors that could be used to construct each
assessment instrument. The structured interview guide consisted of a 26 page semi-structured
interview. The instrument was comprised of 113 questions on a variety of criminogenic risk

7
topics including criminal history, substance use, criminal peers, criminal thinking, employment
and education, mental health, emotional control, personality, and residential stability. The self-
report instrument was a 2 page document that used 96 questions to gather information on
criminal thinking, perspective taking, aggression, coping, empathy, emotionality, problem
solving, involvement in pro-social activities, financial stress, and employment. The overall
interview and self-report process took approximately 45-90 minutes to complete per offender.
Due to differences in access, interview availability, due process issues, and ethical
considerations, pretrial defendants were assessed using different interview protocols and data
collection tools. The initial pretrial structured interview tool was a 2 page form that gathered
information on 35 items. The self-report questionnaire was a 4 page document that covered
multiple domains including criminal thinking, drug use, medical and mental health, pro-criminal
peers and family, residential stability, and employment. Completion of both the self-report and
the structured interview took approximately 13-20 minutes to complete.
Data collection teams were comprised of trained research assistants from the University
of Cincinnati. Depending on the size of the pilot site and the availability of spare rooms, the
research staff size varied from 3 to 13 staff members. Each staff member was trained in the data
collection instrument, ethics involved research with human subjects under correctional control,
interview procedure, and interview skills. In addition to training, each interviewer was
supervised for the first 4 interviews and interviews were randomly observed by team leaders
throughout the project.
The pilot sites for the project were selected with the considerations of geographic
representation across the state, recommendations from DRC staff, and whether the site was
available and willing to participate during the data collection process. To facilitate participation
8
from the numerous pilot sites, letters were sent that informed the selected sites of the project
goals. Potential sites were also asked to both facilitate access to the cases and provide a physical
location to conduct the interviews. Although there were some logistical and scheduling issues
that arose at several sites, no site declined to participate in the project.
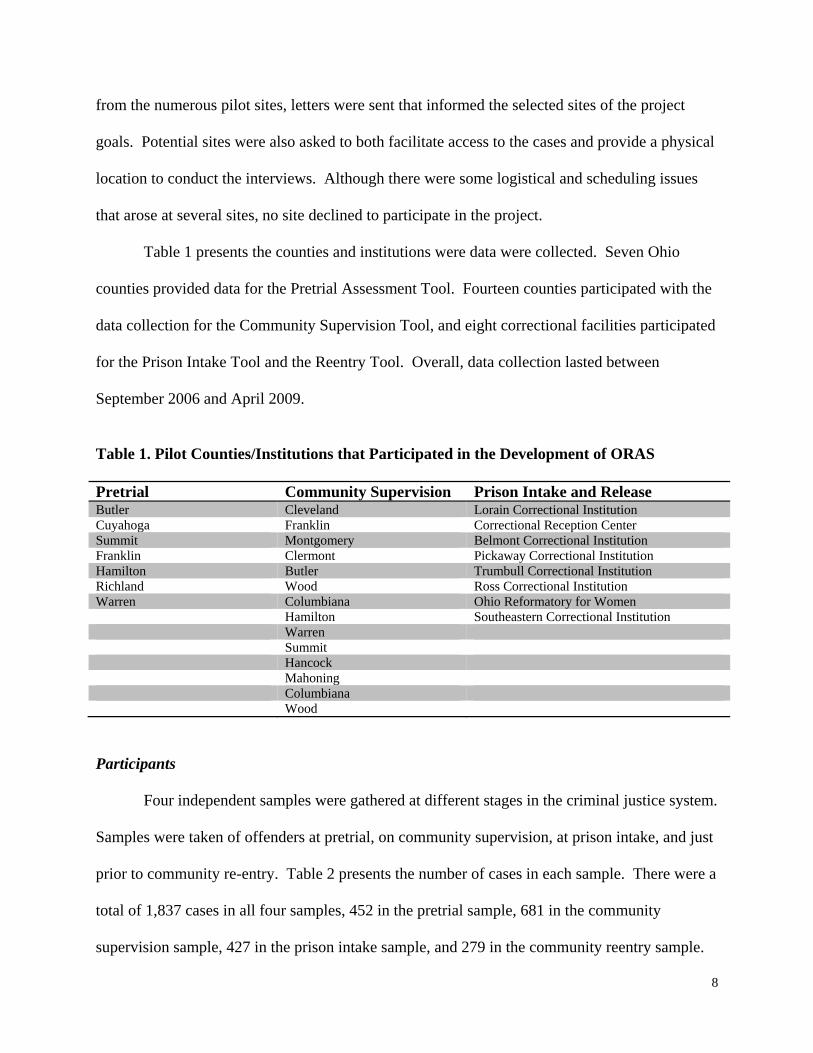
Table 1 presents the counties and institutions were data were collected. Seven Ohio
counties provided data for the Pretrial Assessment Tool. Fourteen counties participated with the
data collection for the Community Supervision Tool, and eight correctional facilities participated
for the Prison Intake Tool and the Reentry Tool. Overall, data collection lasted between
September 2006 and April 2009.
Table 1. Pilot Counties/Institutions that Participated in the Development of ORAS Pretrial Community Supervision Prison Intake and Release Butler Cleveland Lorain Correctional Institution Cuyahoga Franklin Correctional Reception Center Summit Montgomery Belmont Correctional Institution Franklin Clermont Pickaway Correctional Institution Hamilton Butler Trumbull Correctional Institution Richland Wood Ross Correctional Institution Warren Columbiana Ohio Reformatory for Women Hamilton Southeastern Correctional Institution Warren Summit Hancock Mahoning Columbiana Wood Participants
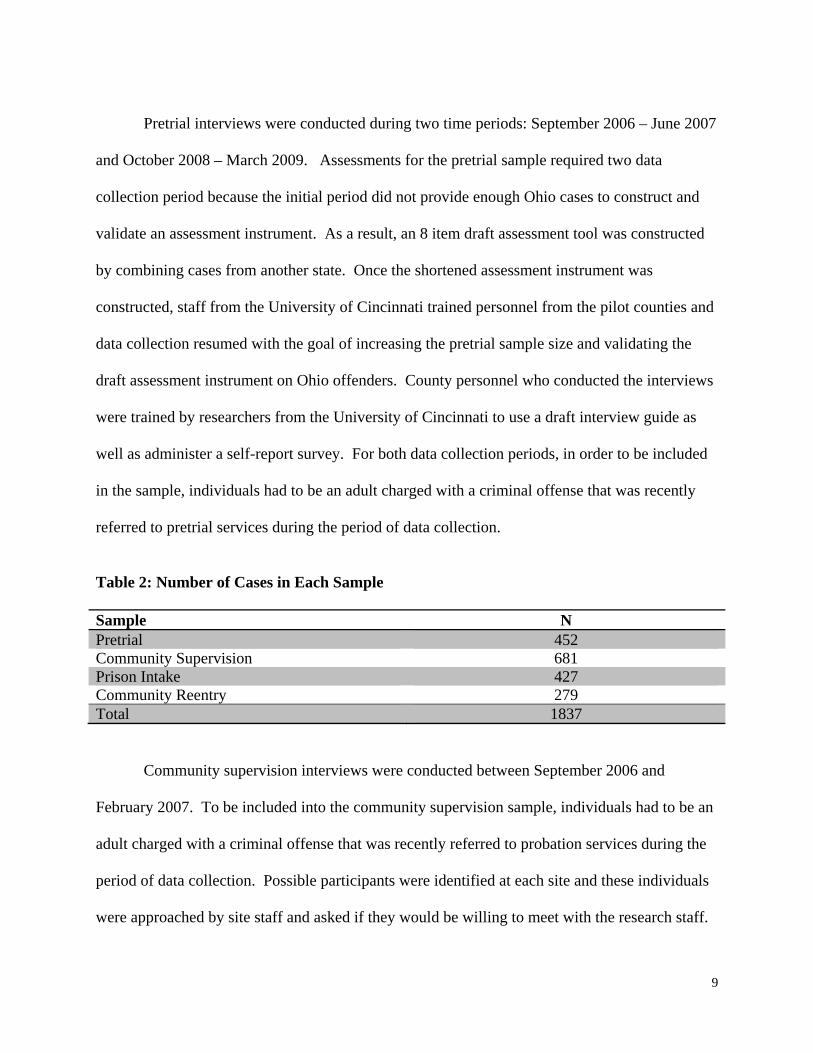
Four independent samples were gathered at different stages in the criminal justice system.
Samples were taken of offenders at pretrial, on community supervision, at prison intake, and just
prior to community re-entry. Table 2 presents the number of cases in each sample. There were a
total of 1,837 cases in all four samples, 452 in the pretrial sample, 681 in the community
supervision sample, 427 in the prison intake sample, and 279 in the community reentry sample.
9
Pretrial interviews were conducted during two time periods: September 2006 – June 2007
and October 2008 – March 2009. Assessments for the pretrial sample required two data
collection period because the initial period did not provide enough Ohio cases to construct and
validate an assessment instrument. As a result, an 8 item draft assessment tool was constructed
by combining cases from another state. Once the shortened assessment instrument was
constructed, staff from the University of Cincinnati trained personnel from the pilot counties and
data collection resumed with the goal of increasing the pretrial sample size and validating the
draft assessment instrument on Ohio offenders. County personnel who conducted the interviews
were trained by researchers from the University of Cincinnati to use a draft interview guide as
well as administer a self-report survey. For both data collection periods, in order to be included
in the sample, individuals had to be an adult charged with a criminal offense that was recently
referred to pretrial services during the period of data collection.
Table 2: Number of Cases in Each Sample
Sample N Pretrial 452 Community Supervision 681 Prison Intake 427 Community Reentry 279 Total 1837
Community supervision interviews were conducted between September 2006 and
February 2007. To be included into the community supervision sample, individuals had to be an
adult charged with a criminal offense that was recently referred to probation services during the
period of data collection. Possible participants were identified at each site and these individuals
were approached by site staff and asked if they would be willing to meet with the research staff.
10
Once the individual met with the research staff and the project was explained, individuals were
asked to participate in the research process and to sign informed consent documents.
Interviews were conducted for the both the prison intake and reentry samples between
June and October 2007. Individuals were selected for the prison intake sample if they: a) were
admitted to an intake correctional facility within the last six months, b) were unrestricted by
security concerns (e.g. solitary), c) agreed to be interviewed and d) were within six months of
release. The limited sentence length was necessary in order to provide an adequate follow-up
time for recidivism in the community. Due to the restrictive nature of a secure correctional
facility, individuals were issued movement passes prior to the arrival of the research staff.
However, since the research was voluntary, the pass may not have been granted if it interrupted
school or job duties, if the inmate declined the pass, or for security reasons. Once the research
staff and inmates met, the project was explained, participation was requested, and informed
consent obtained.
The community reentry sample consisted of individuals who: a) were within six months
of their release/discharge date, b) were unrestricted by security concerns, and c) agreed to
participate. Similar to the intake sample, these interviews were conducted within the confines of
a secured correctional facility, so individuals were issued movement passes prior to the arrival of
the research staff. Once the offenders arrived to the room designated for interviews, the project
was explained, participation was requested, and informed consent was obtained.
Recidivism
The primary measure of recidivism for this study was arrest for a new crime. Although
data was gathered regarding a variety of other potential outcome measures (e.g. conviction,
probation violation, institutional rule infraction), arrest was used for two major reasons. First,

11
measures that gather information later in the criminal justice process, such as convictions,
require a longer follow-up period than twelve months utilized in this study. Second, using
arrests in the community as an outcome allows the assessment tools to identify criminogenic
needs that are likely to result in danger to the community. Although factors that are predictive of
rule violations (e.g. probation violations or institutional violations) are of concern to criminal
justice personnel, of most concern is targeting factors that are related to criminal behavior.
Unlike the other assessment tools, the outcome used in the construction of the Pretrial
Assessment Tool was either a new arrest or failure to appear. Failure to appear was included as
an outcome because one of the major goals of the pretrial tool was to assist court actors in the
decision to release or hold the defendant prior trial. This information was gathered by the
counties from public records searches and searches of the cases file. For the community
supervision sample, county agencies gathered the arrest data on offenders under their supervision
through public records searches and file reviews. This information was verified through the
Ohio Law Enforcement Gateway (OHLEG). OHLEG is advantageous because the information it
provides is not specific to the county of supervision. Because not all inmates who were released
from correctional facilities were placed on community supervision, OHLEG was the primary
source of information for regarding new arrests for these samples.
Follow-up data for the all samples was completed approximately one year following the
conclusion of the structured interviews. Follow-up information for the pretrial cases was
completed in April 2008 and May 2009. For the community supervision sample, follow-up was
completed in April 2008. The follow-up for the prison intake and reentry samples was
completed in December 2008.

12
Assessment Construction
For each assessment, items gathered from the structured interviews and self-report
surveys that were associated with recidivism were used to create each tool. Cases were excluded
if they had missing information on four of more items1. After the items that were associated with
recidivism were identified, these items were scored to create scales that indicated increases in the
likelihood of recidivism. A modified Burgess method was used to assign point values to each
item. The Burgess method assigns a point (a score of 1) to the presence of the risk factor, and
assigns a score of zero when it is false or not present. Some items have multiple increasing
values and as a result were scored with increasing values (i.e. 0, 1, 2). The items were then
combined to create risk scales for each assessment tool. Once the risk scales were created,
cutoffs were created that divided cases into different risk categories.
Priorities in Case Management
To assist criminal justice agencies in Ohio with case management, another goal of the
development of ORAS was to provide agencies with tools to identify and prioritize specific
treatment domains. To do so, each assessment instrument is broken down by domain (e.g.
criminal associates, criminal attitudes, substance abuse) and specific categories identified that
divide offenders into groups based on their likelihood to reoffend. Stated differently, the
assessment process not only provides an overall risk level, but also provides risk levels by case
management domain. Presenting risk levels by domain provides practitioners specific
information regarding the likelihood of recidivism based on individual criminogenic needs in
order to encourage a more efficient allocation of treatment resources.
1 The number of cases excluded for each tool because they have more than four items missing were: pretrial sample = 0, community supervision sample = 3, prison intake sample = 10, reentry sample = 2.
13
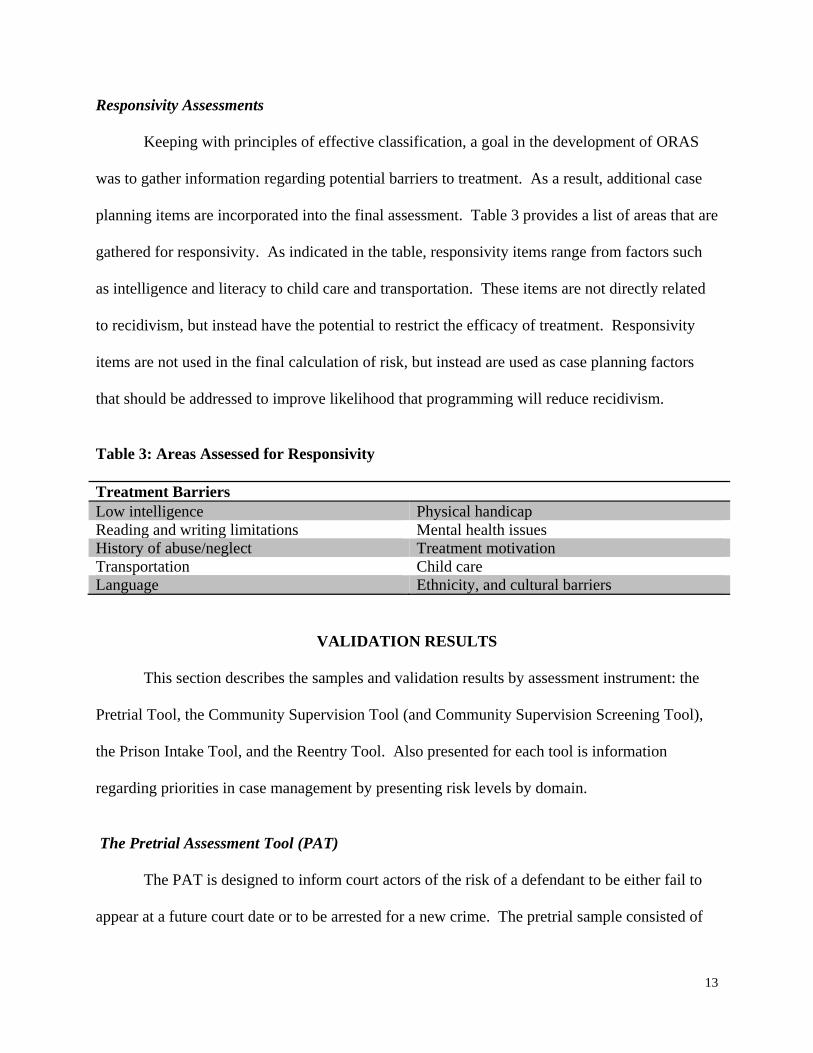
Responsivity Assessments
Keeping with principles of effective classification, a goal in the development of ORAS
was to gather information regarding potential barriers to treatment. As a result, additional case
planning items are incorporated into the final assessment. Table 3 provides a list of areas that are
gathered for responsivity. As indicated in the table, responsivity items range from factors such
as intelligence and literacy to child care and transportation. These items are not directly related
to recidivism, but instead have the potential to restrict the efficacy of treatment. Responsivity
items are not used in the final calculation of risk, but instead are used as case planning factors
that should be addressed to improve likelihood that programming will reduce recidivism.
Table 3: Areas Assessed for Responsivity
Treatment Barriers Low intelligence Physical handicap Reading and writing limitations Mental health issues History of abuse/neglect Treatment motivation Transportation Child care Language Ethnicity, and cultural barriers
VALIDATION RESULTS
This section describes the samples and validation results by assessment instrument: the
Pretrial Tool, the Community Supervision Tool (and Community Supervision Screening Tool),
the Prison Intake Tool, and the Reentry Tool. Also presented for each tool is information
regarding priorities in case management by presenting risk levels by domain.
The Pretrial Assessment Tool (PAT) The PAT is designed to inform court actors of the risk of a defendant to be either fail to
appear at a future court date or to be arrested for a new crime. The pretrial sample consisted of
14
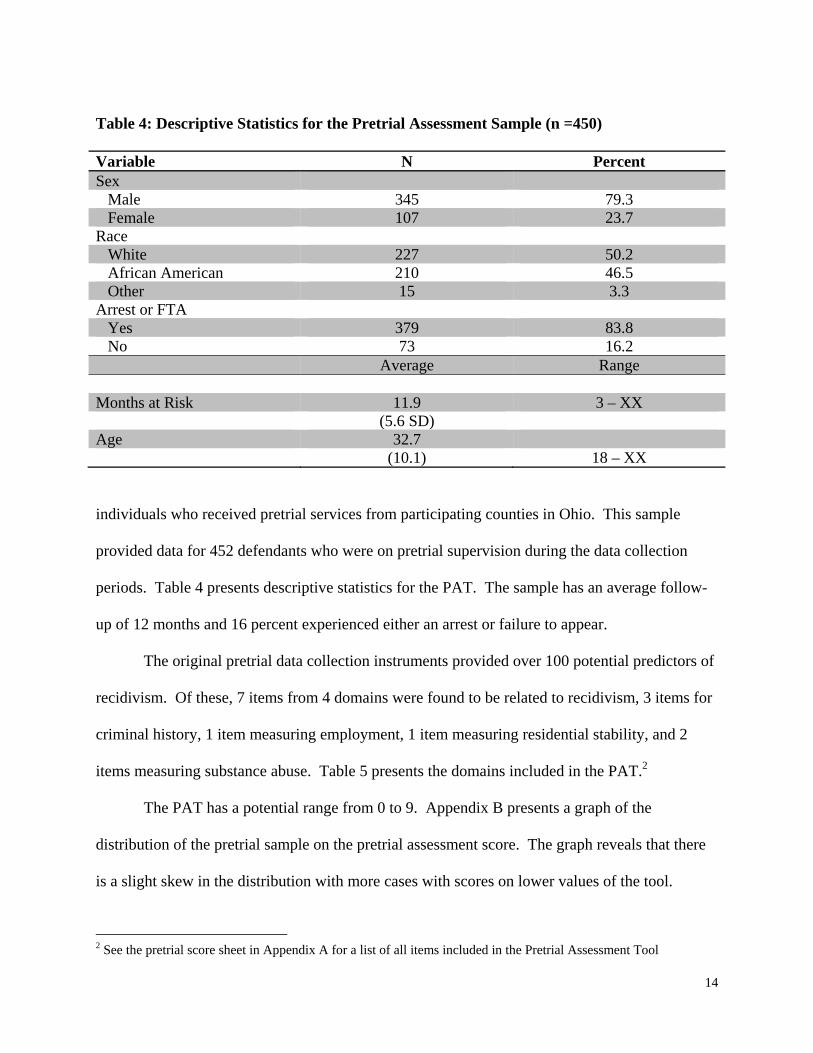
Table 4: Descriptive Statistics for the Pretrial Assessment Sample (n =450)
Variable N Percent Sex Male 345 79.3 Female 107 23.7 Race White 227 50.2 African American 210 46.5 Other 15 3.3 Arrest or FTA Yes 379 83.8 No 73 16.2 Average Range Months at Risk 11.9 3 – XX (5.6 SD) Age 32.7 (10.1) 18 – XX individuals who received pretrial services from participating counties in Ohio. This sample
provided data for 452 defendants who were on pretrial supervision during the data collection
periods. Table 4 presents descriptive statistics for the PAT. The sample has an average follow-
up of 12 months and 16 percent experienced either an arrest or failure to appear.
The original pretrial data collection instruments provided over 100 potential predictors of
recidivism. Of these, 7 items from 4 domains were found to be related to recidivism, 3 items for
criminal history, 1 item measuring employment, 1 item measuring residential stability, and 2
items measuring substance abuse. Table 5 presents the domains included in the PAT.2
The PAT has a potential range from 0 to 9. Appendix B presents a graph of the
distribution of the pretrial sample on the pretrial assessment score. The graph reveals that there
is a slight skew in the distribution with more cases with scores on lower values of the tool.
2 See the pretrial score sheet in Appendix A for a list of all items included in the Pretrial Assessment Tool
15
Table 5: Domains of the Pretrial Assessment Tool Domain Number of Items Criminal History 3 Items Employment 1 Item Residential Stability 1 Item Substance Abuse 2 Items Total 7 Items
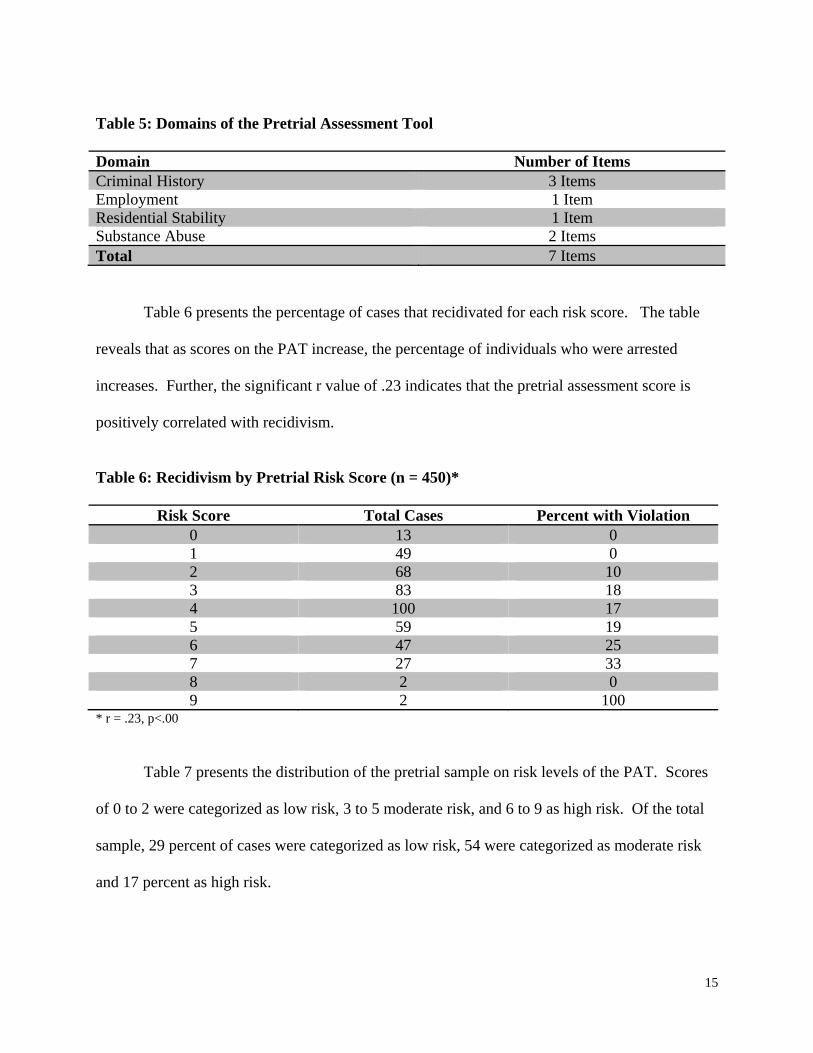
Table 6 presents the percentage of cases that recidivated for each risk score. The table
reveals that as scores on the PAT increase, the percentage of individuals who were arrested
increases. Further, the significant r value of .23 indicates that the pretrial assessment score is
positively correlated with recidivism.
Table 6: Recidivism by Pretrial Risk Score (n = 450)*
Risk Score Total Cases Percent with Violation 0 13 0 1 49 0 2 68 10 3 83 18 4 100 17 5 59 19 6 47 25 7 27 33 8 2 0 9 2 100
* r = .23, p<.00
Table 7 presents the distribution of the pretrial sample on risk levels of the PAT. Scores
of 0 to 2 were categorized as low risk, 3 to 5 moderate risk, and 6 to 9 as high risk. Of the total
sample, 29 percent of cases were categorized as low risk, 54 were categorized as moderate risk
and 17 percent as high risk.
16
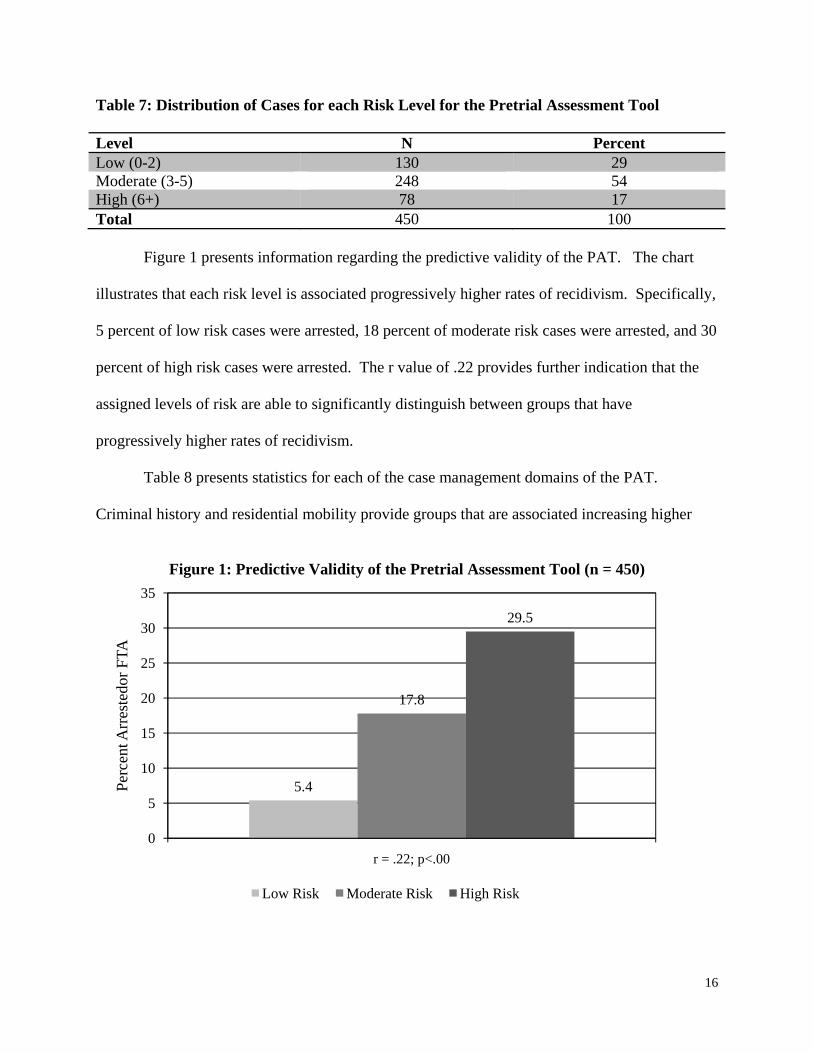
Table 7: Distribution of Cases for each Risk Level for the Pretrial Assessment Tool
Level N Percent Low (0-2) 130 29 Moderate (3-5) 248 54 High (6+) 78 17 Total 450 100
Figure 1 presents information regarding the predictive validity of the PAT. The chart
illustrates that each risk level is associated progressively higher rates of recidivism. Specifically,
5 percent of low risk cases were arrested, 18 percent of moderate risk cases were arrested, and 30
percent of high risk cases were arrested. The r value of .22 provides further indication that the
assigned levels of risk are able to significantly distinguish between groups that have
progressively higher rates of recidivism.
Table 8 presents statistics for each of the case management domains of the PAT.
Criminal history and residential mobility provide groups that are associated increasing higher
Figure 1: Predictive Validity of the Pretrial Assessment Tool (n = 450)
5.4
17.8
29.5
0
5
10
15
20
25
30
35
r = .22; p<.00
Perc
ent A
rres
tedo
r FTA
Low Risk Moderate Risk High Risk
17
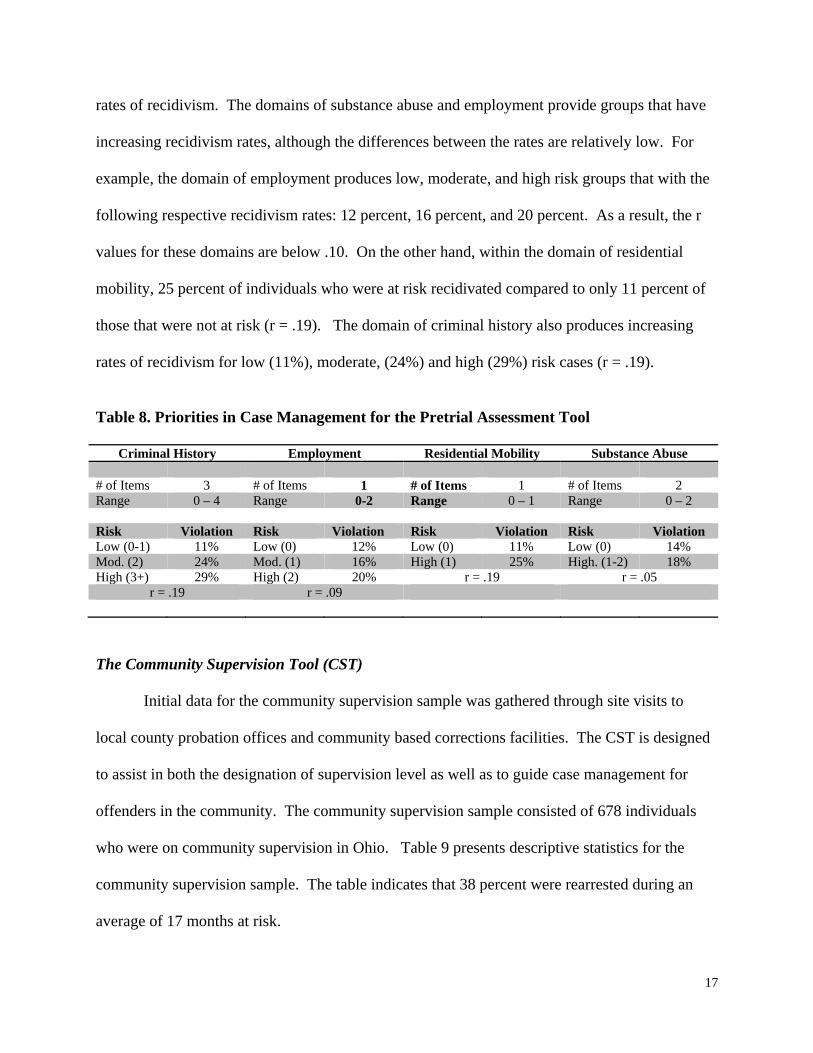
rates of recidivism. The domains of substance abuse and employment provide groups that have
increasing recidivism rates, although the differences between the rates are relatively low. For
example, the domain of employment produces low, moderate, and high risk groups that with the
following respective recidivism rates: 12 percent, 16 percent, and 20 percent. As a result, the r
values for these domains are below .10. On the other hand, within the domain of residential
mobility, 25 percent of individuals who were at risk recidivated compared to only 11 percent of
those that were not at risk (r = .19). The domain of criminal history also produces increasing
rates of recidivism for low (11%), moderate, (24%) and high (29%) risk cases (r = .19).
Table 8. Priorities in Case Management for the Pretrial Assessment Tool
Criminal History Employment Residential Mobility Substance Abuse # of Items 3 # of Items 1 # of Items 1 # of Items 2 Range 0 – 4 Range 0-2 Range 0 – 1 Range 0 – 2 Risk Violation Risk Violation Risk Violation Risk Violation Low (0-1) 11% Low (0) 12% Low (0) 11% Low (0) 14% Mod. (2) 24% Mod. (1) 16% High (1) 25% High. (1-2) 18% High (3+) 29% High (2) 20% r = .19 r = .05
r = .19 r = .09
The Community Supervision Tool (CST)
Initial data for the community supervision sample was gathered through site visits to
local county probation offices and community based corrections facilities. The CST is designed
to assist in both the designation of supervision level as well as to guide case management for
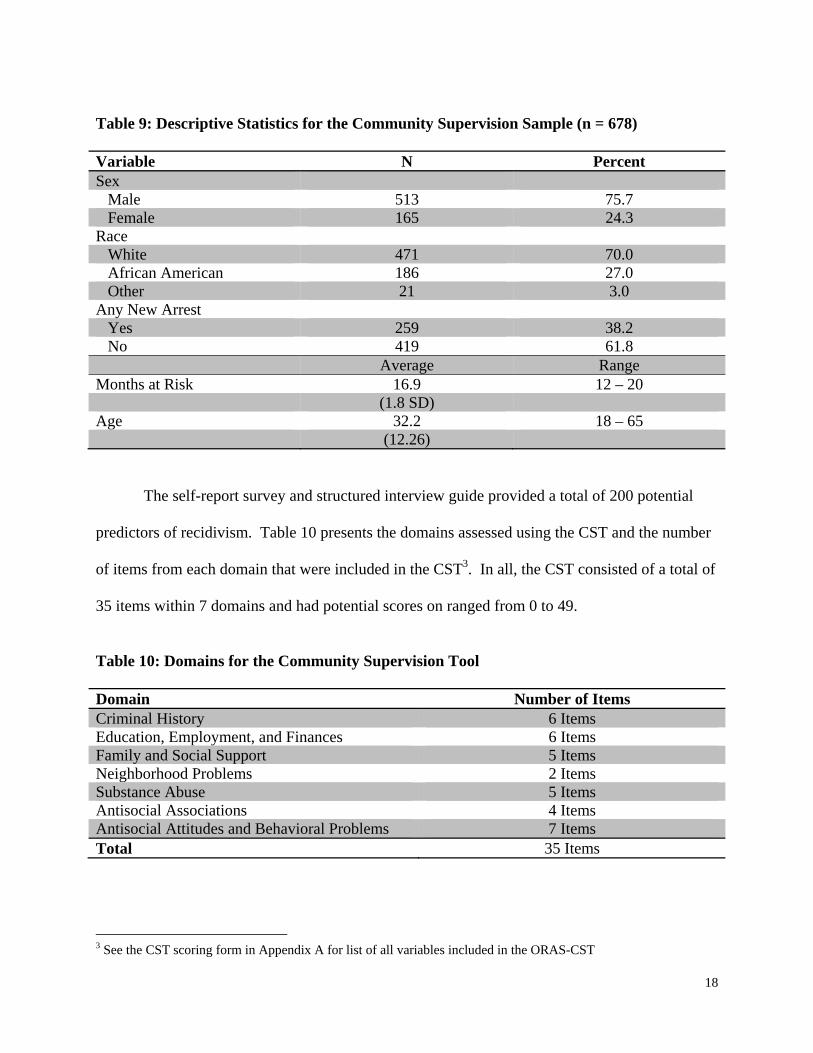
offenders in the community. The community supervision sample consisted of 678 individuals
who were on community supervision in Ohio. Table 9 presents descriptive statistics for the
community supervision sample. The table indicates that 38 percent were rearrested during an
average of 17 months at risk.
18
Table 9: Descriptive Statistics for the Community Supervision Sample (n = 678)
Variable N Percent Sex Male 513 75.7 Female 165 24.3 Race White 471 70.0 African American 186 27.0 Other 21 3.0 Any New Arrest Yes 259 38.2 No 419 61.8 Average Range Months at Risk 16.9 12 – 20 (1.8 SD) Age 32.2 18 – 65 (12.26)
The self-report survey and structured interview guide provided a total of 200 potential
predictors of recidivism. Table 10 presents the domains assessed using the CST and the number
of items from each domain that were included in the CST3. In all, the CST consisted of a total of
35 items within 7 domains and had potential scores on ranged from 0 to 49.
Table 10: Domains for the Community Supervision Tool
Domain Number of Items Criminal History 6 Items Education, Employment, and Finances 6 Items Family and Social Support 5 Items Neighborhood Problems 2 Items Substance Abuse 5 Items Antisocial Associations 4 Items Antisocial Attitudes and Behavioral Problems 7 Items Total 35 Items
3 See the CST scoring form in Appendix A for list of all variables included in the ORAS-CST
19
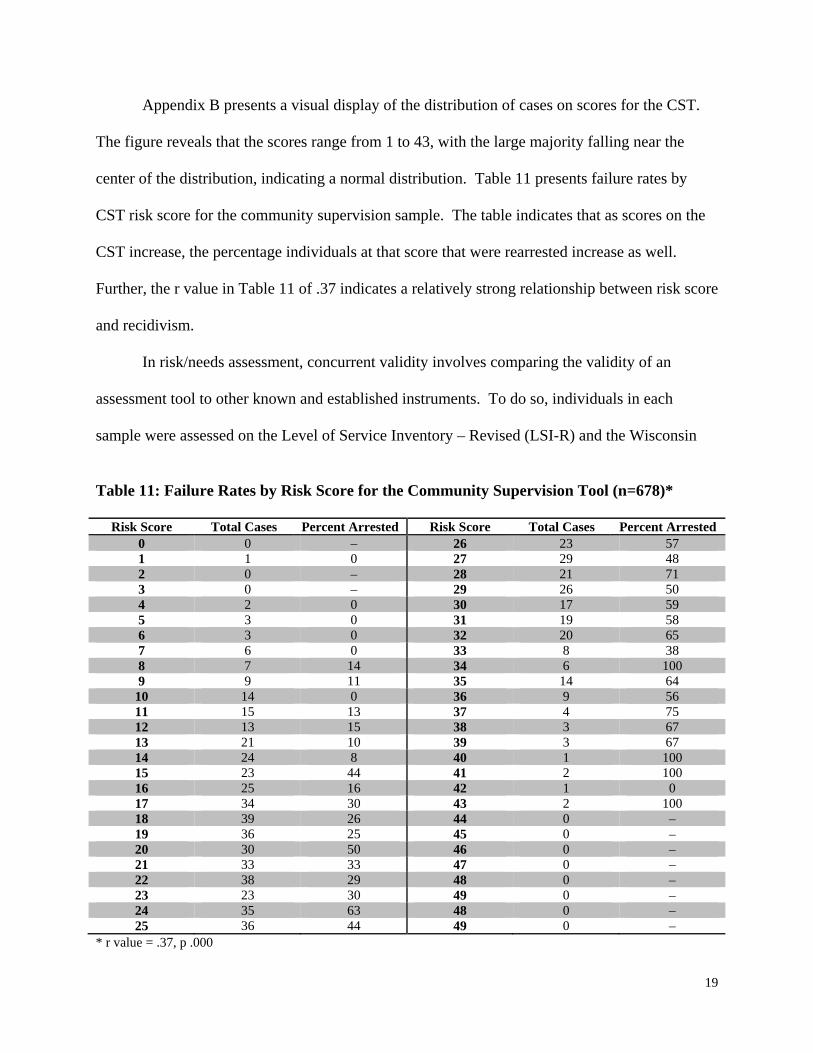
Appendix B presents a visual display of the distribution of cases on scores for the CST.
The figure reveals that the scores range from 1 to 43, with the large majority falling near the
center of the distribution, indicating a normal distribution. Table 11 presents failure rates by
CST risk score for the community supervision sample. The table indicates that as scores on the
CST increase, the percentage individuals at that score that were rearrested increase as well.
Further, the r value in Table 11 of .37 indicates a relatively strong relationship between risk score
and recidivism.
In risk/needs assessment, concurrent validity involves comparing the validity of an
assessment tool to other known and established instruments. To do so, individuals in each
sample were assessed on the Level of Service Inventory – Revised (LSI-R) and the Wisconsin
Table 11: Failure Rates by Risk Score for the Community Supervision Tool (n=678)*
Risk Score Total Cases Percent Arrested Risk Score Total Cases Percent Arrested 0 0 – 26 23 57 1 1 0 27 29 48 2 0 – 28 21 71 3 0 – 29 26 50 4 2 0 30 17 59 5 3 0 31 19 58 6 3 0 32 20 65 7 6 0 33 8 38 8 7 14 34 6 100 9 9 11 35 14 64
10 14 0 36 9 56 11 15 13 37 4 75 12 13 15 38 3 67 13 21 10 39 3 67 14 24 8 40 1 100 15 23 44 41 2 100 16 25 16 42 1 0 17 34 30 43 2 100 18 39 26 44 0 – 19 36 25 45 0 – 20 30 50 46 0 – 21 33 33 47 0 – 22 38 29 48 0 – 23 23 30 49 0 – 24 35 63 48 0 – 25 36 44 49 0 –
* r value = .37, p .000
20
Risk / Needs instrument. For consistency, scores were divided into low, moderate, and high risk
groups based on each instruments’ specified requirements.
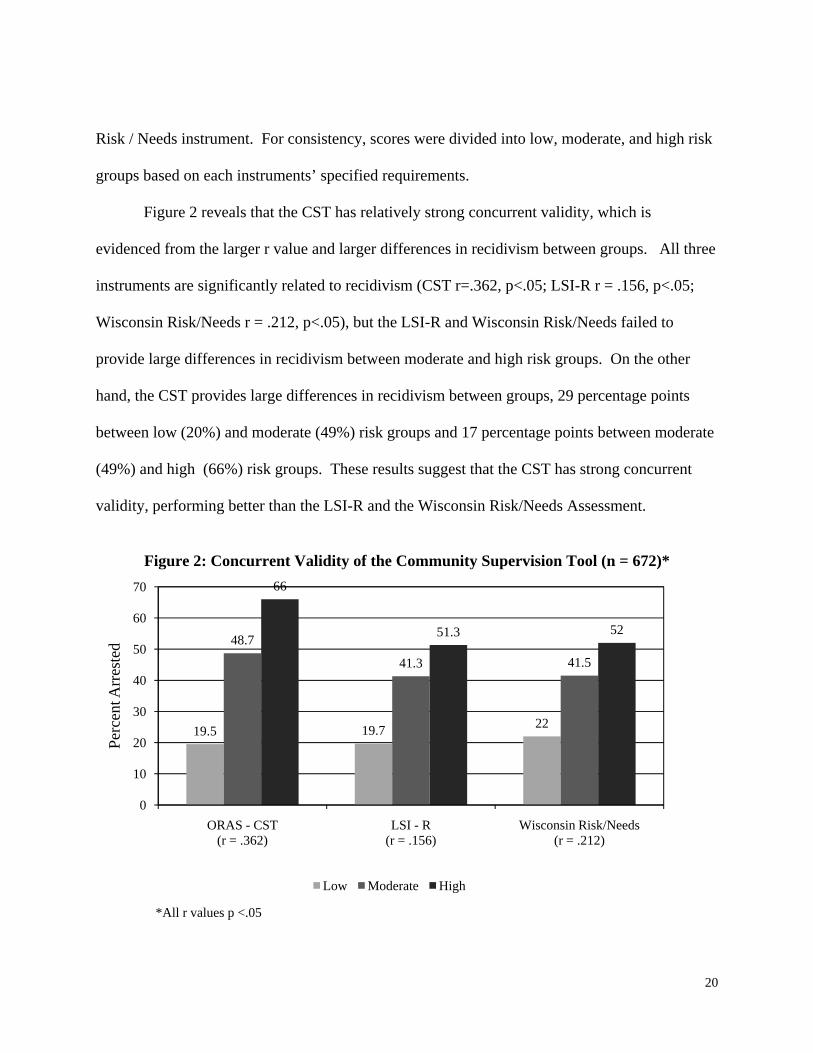
Figure 2 reveals that the CST has relatively strong concurrent validity, which is
evidenced from the larger r value and larger differences in recidivism between groups. All three
instruments are significantly related to recidivism (CST r=.362, p<.05; LSI-R r = .156, p<.05;
Wisconsin Risk/Needs r = .212, p<.05), but the LSI-R and Wisconsin Risk/Needs failed to
provide large differences in recidivism between moderate and high risk groups. On the other
hand, the CST provides large differences in recidivism between groups, 29 percentage points
between low (20%) and moderate (49%) risk groups and 17 percentage points between moderate
(49%) and high (66%) risk groups. These results suggest that the CST has strong concurrent
validity, performing better than the LSI-R and the Wisconsin Risk/Needs Assessment.
Figure 2: Concurrent Validity of the Community Supervision Tool (n = 672)*
*All r values p <.05
19.5 19.7 22
48.7
41.3 41.5
66
51.3 52
0
10
20
30
40
50
60
70
ORAS - CST (r = .362)
LSI - R (r = .156)
Wisconsin Risk/Needs (r = .212)
Perc
ent A
rres
ted
Low Moderate High
21
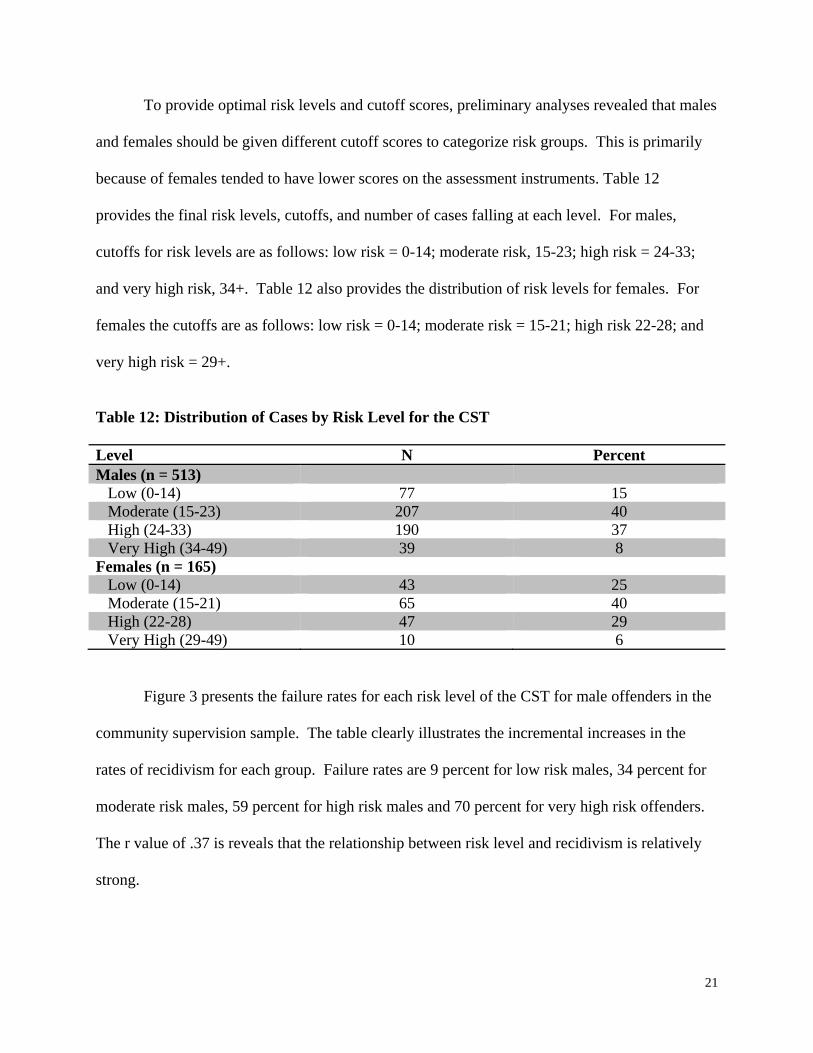
To provide optimal risk levels and cutoff scores, preliminary analyses revealed that males
and females should be given different cutoff scores to categorize risk groups. This is primarily
because of females tended to have lower scores on the assessment instruments. Table 12
provides the final risk levels, cutoffs, and number of cases falling at each level. For males,
cutoffs for risk levels are as follows: low risk = 0-14; moderate risk, 15-23; high risk = 24-33;
and very high risk, 34+. Table 12 also provides the distribution of risk levels for females. For
females the cutoffs are as follows: low risk = 0-14; moderate risk = 15-21; high risk 22-28; and
very high risk = 29+.
Table 12: Distribution of Cases by Risk Level for the CST Level N Percent Males (n = 513)
Low (0-14) 77 15 Moderate (15-23) 207 40 High (24-33) 190 37 Very High (34-49) 39 8
Females (n = 165) Low (0-14) 43 25 Moderate (15-21) 65 40 High (22-28) 47 29 Very High (29-49) 10 6
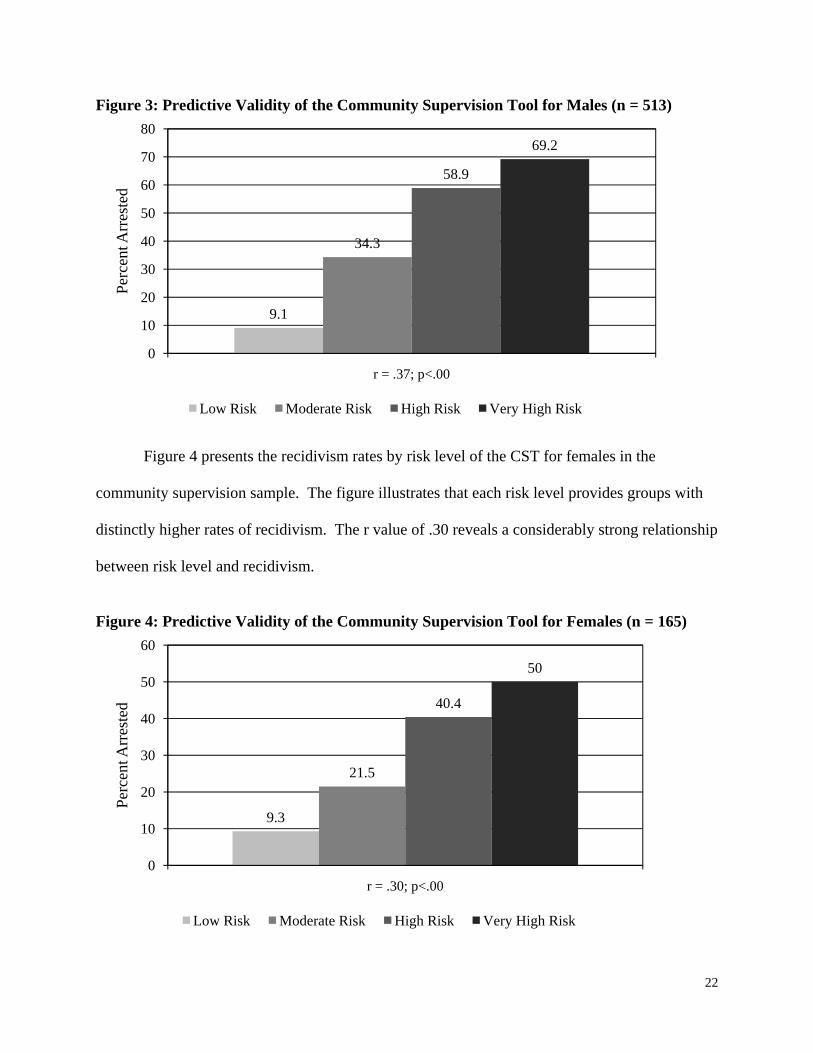
Figure 3 presents the failure rates for each risk level of the CST for male offenders in the
community supervision sample. The table clearly illustrates the incremental increases in the
rates of recidivism for each group. Failure rates are 9 percent for low risk males, 34 percent for
moderate risk males, 59 percent for high risk males and 70 percent for very high risk offenders.
The r value of .37 is reveals that the relationship between risk level and recidivism is relatively
strong.
22
Figure 3: Predictive Validity of the Community Supervision Tool for Males (n = 513)
Figure 4 presents the recidivism rates by risk level of the CST for females in the
community supervision sample. The figure illustrates that each risk level provides groups with
distinctly higher rates of recidivism. The r value of .30 reveals a considerably strong relationship
between risk level and recidivism.
Figure 4: Predictive Validity of the Community Supervision Tool for Females (n = 165)
9.1
34.3
58.9
69.2
0
10
20
30
40
50
60
70
80
r = .37; p<.00
Perc
ent A
rres
ted
Low Risk Moderate Risk High Risk Very High Risk
9.3
21.5
40.4
50
0
10
20
30
40
50
60
r = .30; p<.00
Perc
ent A
rres
ted
Low Risk Moderate Risk High Risk Very High Risk
23
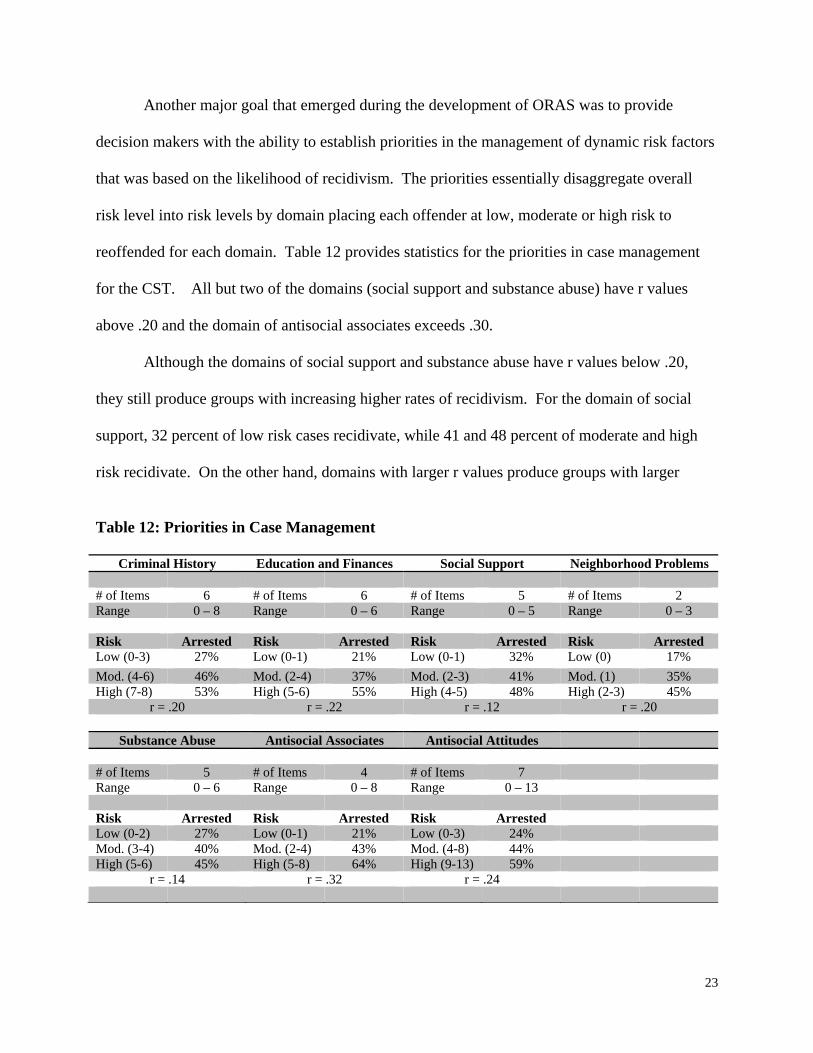
Another major goal that emerged during the development of ORAS was to provide
decision makers with the ability to establish priorities in the management of dynamic risk factors
that was based on the likelihood of recidivism. The priorities essentially disaggregate overall
risk level into risk levels by domain placing each offender at low, moderate or high risk to
reoffended for each domain. Table 12 provides statistics for the priorities in case management
for the CST. All but two of the domains (social support and substance abuse) have r values
above .20 and the domain of antisocial associates exceeds .30.
Although the domains of social support and substance abuse have r values below .20,
they still produce groups with increasing higher rates of recidivism. For the domain of social
support, 32 percent of low risk cases recidivate, while 41 and 48 percent of moderate and high
risk recidivate. On the other hand, domains with larger r values produce groups with larger
Table 12: Priorities in Case Management
Criminal History Education and Finances Social Support Neighborhood Problems # of Items 6 # of Items 6 # of Items 5 # of Items 2 Range 0 – 8 Range 0 – 6 Range 0 – 5 Range 0 – 3 Risk Arrested Risk Arrested Risk Arrested Risk Arrested Low (0-3) 27% Low (0-1) 21% Low (0-1) 32% Low (0) 17% Mod. (4-6) 46% Mod. (2-4) 37% Mod. (2-3) 41% Mod. (1) 35% High (7-8) 53% High (5-6) 55% High (4-5) 48% High (2-3) 45%
r = .20 r = .22 r = .12 r = .20
Substance Abuse Antisocial Associates Antisocial Attitudes # of Items 5 # of Items 4 # of Items 7 Range 0 – 6 Range 0 – 8 Range 0 – 13 Risk Arrested Risk Arrested Risk Arrested Low (0-2) 27% Low (0-1) 21% Low (0-3) 24% Mod. (3-4) 40% Mod. (2-4) 43% Mod. (4-8) 44% High (5-6) 45% High (5-8) 64% High (9-13) 59%
r = .14 r = .32 r = .24
24
differences between groups. For example, the domain of Antisocial Associates produces low
moderate and high risk groups that recidivate at 21 percent, 43 percent, and 64 percent
respectively.
The Community Supervision Screening Tool (CSST)
Since the CST was designed to be used as on a potentially large number of offenders
across the state of Ohio, the Community Supervision Screening Tool was developed that would
provide counties with the ability to more quickly identify moderate to high risk cases. Once
identified as moderate to high risk, counties could provide these cases with the full assessment of
criminogenic needs while avoiding the extra resources involved with assessing lower risk cases
that were not likely to need intensive treatment services.
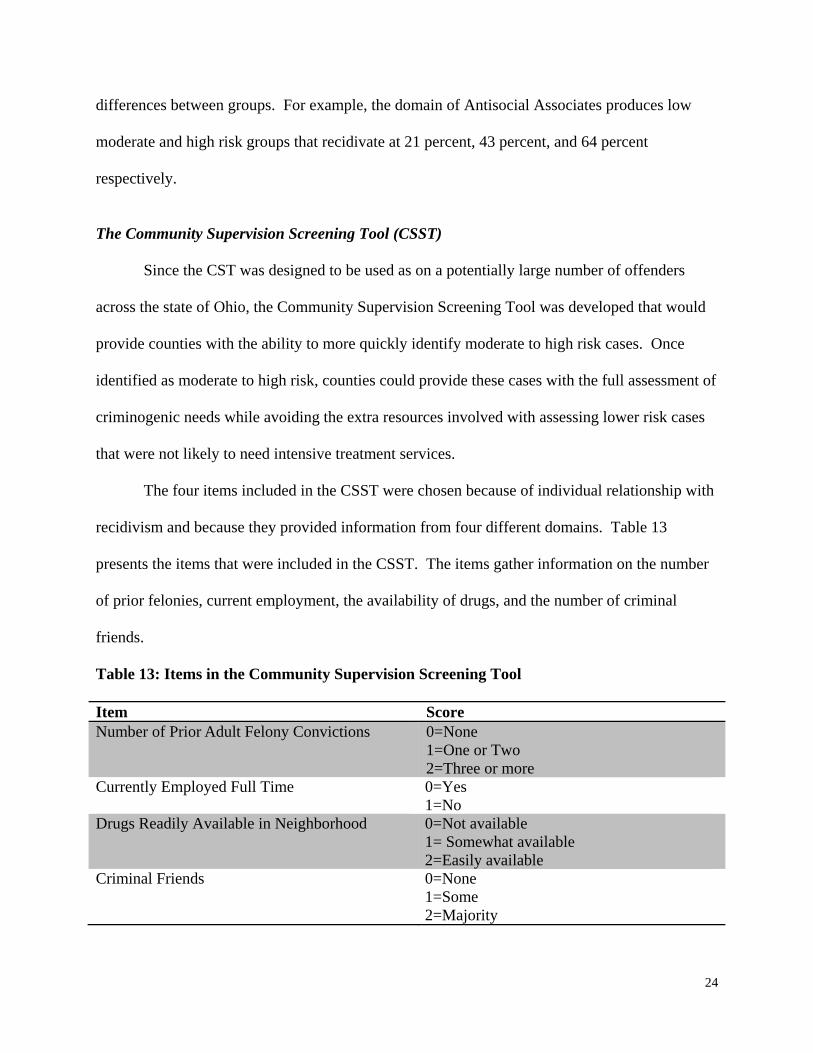
The four items included in the CSST were chosen because of individual relationship with
recidivism and because they provided information from four different domains. Table 13
presents the items that were included in the CSST. The items gather information on the number
of prior felonies, current employment, the availability of drugs, and the number of criminal
friends.
Table 13: Items in the Community Supervision Screening Tool
Item Score Number of Prior Adult Felony Convictions 0=None
1=One or Two 2=Three or more
Currently Employed Full Time 0=Yes 1=No
Drugs Readily Available in Neighborhood 0=Not available 1= Somewhat available 2=Easily available
Criminal Friends 0=None 1=Some 2=Majority
25
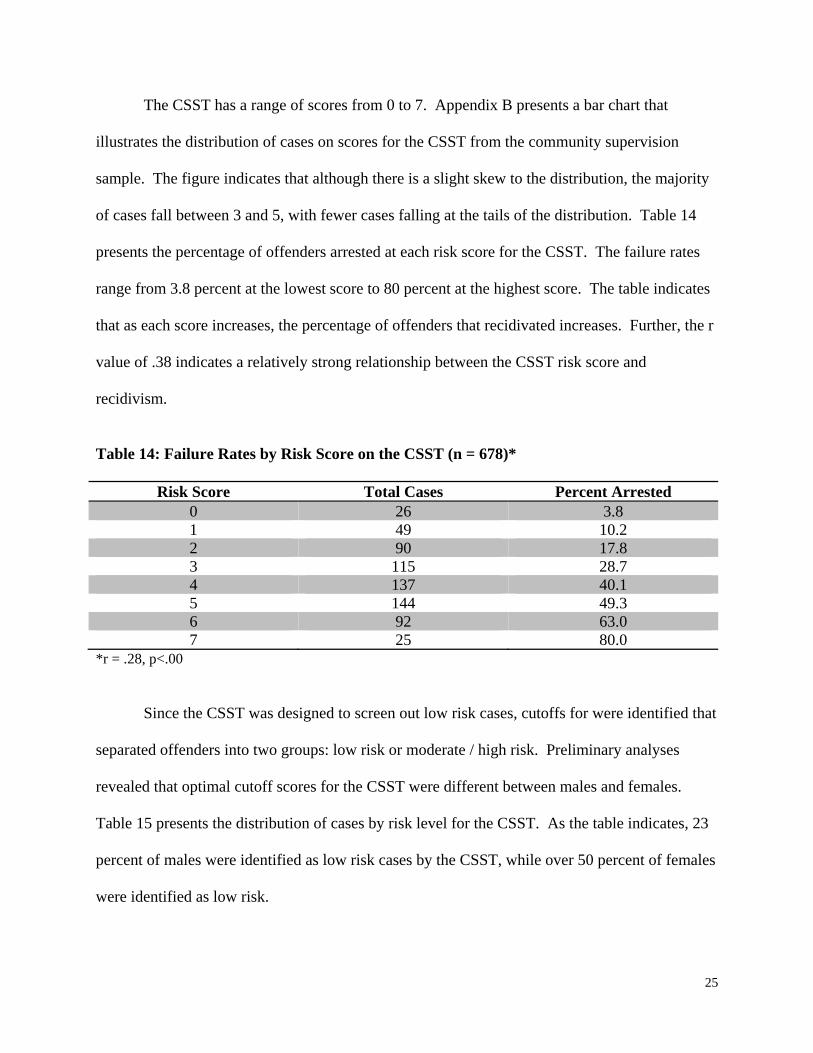
The CSST has a range of scores from 0 to 7. Appendix B presents a bar chart that
illustrates the distribution of cases on scores for the CSST from the community supervision
sample. The figure indicates that although there is a slight skew to the distribution, the majority
of cases fall between 3 and 5, with fewer cases falling at the tails of the distribution. Table 14
presents the percentage of offenders arrested at each risk score for the CSST. The failure rates
range from 3.8 percent at the lowest score to 80 percent at the highest score. The table indicates
that as each score increases, the percentage of offenders that recidivated increases. Further, the r
value of .38 indicates a relatively strong relationship between the CSST risk score and
recidivism.
Table 14: Failure Rates by Risk Score on the CSST (n = 678)*
Risk Score Total Cases Percent Arrested 0 26 3.8 1 49 10.2 2 90 17.8 3 115 28.7 4 137 40.1 5 144 49.3 6 92 63.0 7 25 80.0
*r = .28, p<.00
Since the CSST was designed to screen out low risk cases, cutoffs for were identified that
separated offenders into two groups: low risk or moderate / high risk. Preliminary analyses
revealed that optimal cutoff scores for the CSST were different between males and females.
Table 15 presents the distribution of cases by risk level for the CSST. As the table indicates, 23
percent of males were identified as low risk cases by the CSST, while over 50 percent of females
were identified as low risk.
26
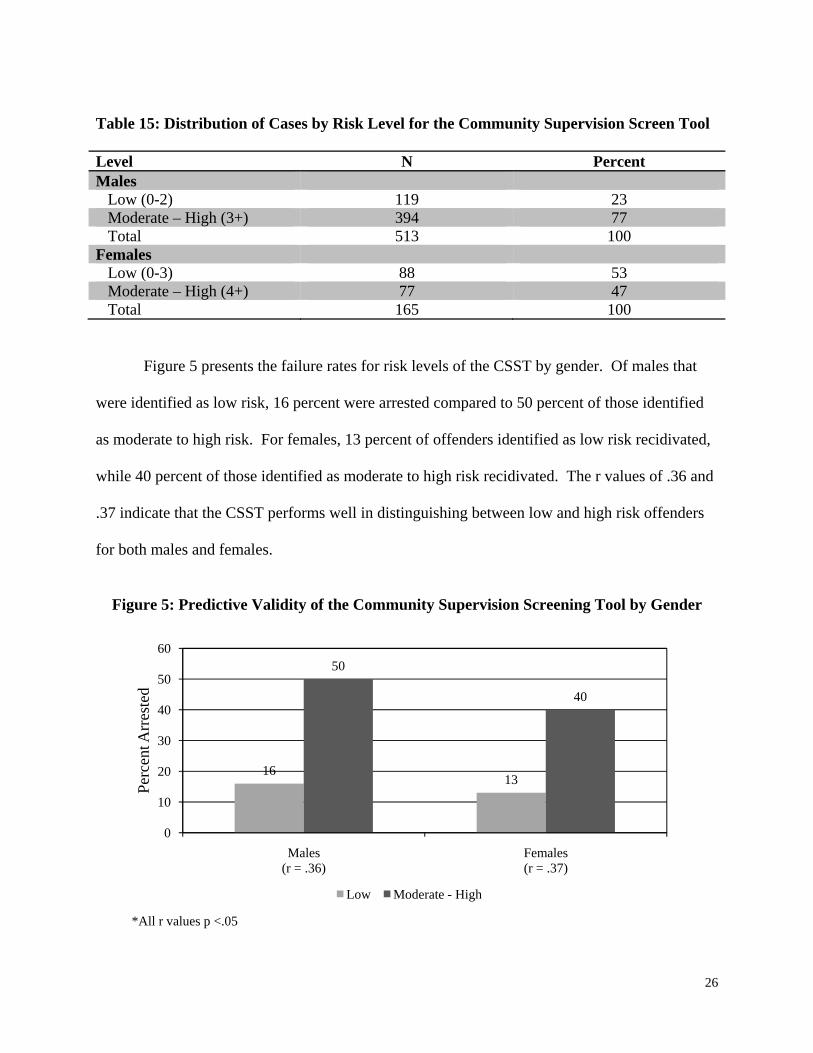
Table 15: Distribution of Cases by Risk Level for the Community Supervision Screen Tool Level N Percent Males
Low (0-2) 119 23 Moderate – High (3+) 394 77 Total 513 100
Females Low (0-3) 88 53 Moderate – High (4+) 77 47 Total 165 100
Figure 5 presents the failure rates for risk levels of the CSST by gender. Of males that
were identified as low risk, 16 percent were arrested compared to 50 percent of those identified
as moderate to high risk. For females, 13 percent of offenders identified as low risk recidivated,
while 40 percent of those identified as moderate to high risk recidivated. The r values of .36 and
.37 indicate that the CSST performs well in distinguishing between low and high risk offenders
for both males and females.
Figure 5: Predictive Validity of the Community Supervision Screening Tool by Gender
*All r values p <.05
1613
50
40
0
10
20
30
40
50
60
Males (r = .36)
Females (r = .37)
Perc
ent A
rres
ted
Low Moderate - High

27
The Prison Intake Tool (PIT) As mentioned previously, the PIT is designed to provide cases managers an assessment
instrument that can be used to prioritize prison treatment based on the likelihood of recidivism.
Interviews for the prison intake sample were conducted by staff from the University of
Cincinnati between June and October 2007 and gathered information from offenders who had
been placed in prison within six months of the interview date. This process produced a total of
423 offenders from Ohio prisons.
Table 16 presents descriptive statistics for the prison intake sample. The sample was 63
percent male, 54 percent white, and had an average age of 33. The average follow-up was 13
months and 40 percent experienced a new arrest during the follow-up period.
The self-report survey and structured interview guide provided a total of 200 potential
predictors of recidivism. Of these, only items that were related to recidivism were included in
Table 16: Descriptive Statistics for the Prison Intake Sample (n = 423)
Variable N Percent Sex Male 267 63 Female 156 37 Race White 227 54 African American 164 39 Other 32 7 Any New Arrest Yes 169 40 No 254 60 Average Range Months at Risk 13.3 7 - 18 (2.1 SD) Age 33.2 19 – 64 (9.3 SD)
28
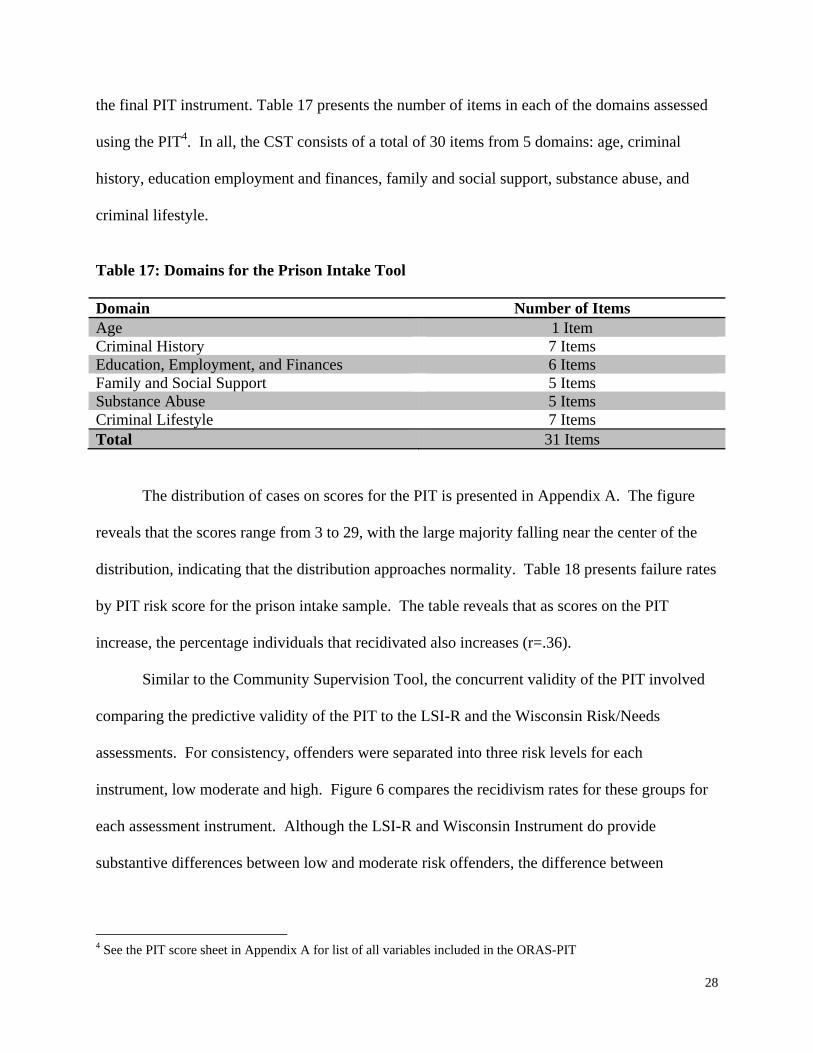
the final PIT instrument. Table 17 presents the number of items in each of the domains assessed
using the PIT4. In all, the CST consists of a total of 30 items from 5 domains: age, criminal
history, education employment and finances, family and social support, substance abuse, and
criminal lifestyle.
Table 17: Domains for the Prison Intake Tool
Domain Number of Items Age 1 Item Criminal History 7 Items Education, Employment, and Finances 6 Items Family and Social Support 5 Items Substance Abuse 5 Items Criminal Lifestyle 7 Items Total 31 Items
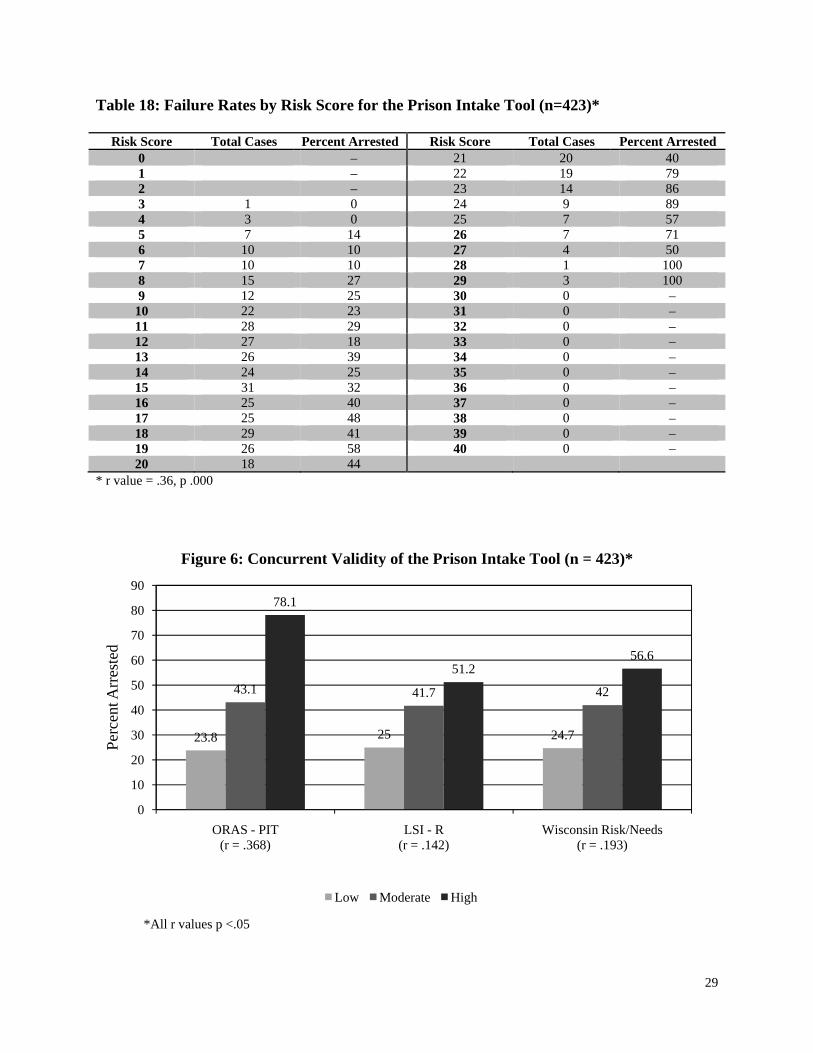
The distribution of cases on scores for the PIT is presented in Appendix A. The figure
reveals that the scores range from 3 to 29, with the large majority falling near the center of the
distribution, indicating that the distribution approaches normality. Table 18 presents failure rates
by PIT risk score for the prison intake sample. The table reveals that as scores on the PIT
increase, the percentage individuals that recidivated also increases (r=.36).
Similar to the Community Supervision Tool, the concurrent validity of the PIT involved
comparing the predictive validity of the PIT to the LSI-R and the Wisconsin Risk/Needs
assessments. For consistency, offenders were separated into three risk levels for each
instrument, low moderate and high. Figure 6 compares the recidivism rates for these groups for
each assessment instrument. Although the LSI-R and Wisconsin Instrument do provide
substantive differences between low and moderate risk offenders, the difference between
4 See the PIT score sheet in Appendix A for list of all variables included in the ORAS-PIT
29
Table 18: Failure Rates by Risk Score for the Prison Intake Tool (n=423)*
Risk Score Total Cases Percent Arrested Risk Score Total Cases Percent Arrested 0 – 21 20 40 1 – 22 19 79 2 – 23 14 86 3 1 0 24 9 89 4 3 0 25 7 57 5 7 14 26 7 71 6 10 10 27 4 50 7 10 10 28 1 100 8 15 27 29 3 100 9 12 25 30 0 –
10 22 23 31 0 – 11 28 29 32 0 – 12 27 18 33 0 – 13 26 39 34 0 – 14 24 25 35 0 – 15 31 32 36 0 – 16 25 40 37 0 – 17 25 48 38 0 – 18 29 41 39 0 – 19 26 58 40 0 – 20 18 44
* r value = .36, p .000
Figure 6: Concurrent Validity of the Prison Intake Tool (n = 423)*
*All r values p <.05
23.8 25 24.7
43.1 41.7 42
78.1
51.256.6
0
10
20
30
40
50
60
70
80
90
ORAS - PIT (r = .368)
LSI - R (r = .142)
Wisconsin Risk/Needs (r = .193)
Perc
ent A
rres
ted
Low Moderate High
30
moderate and high risk offenders is somewhat small. On the other hand, the PIT provides a 20
percentage point difference between low and moderate risk offenders and a 35 percentage point
difference between moderate and high risk offenders. The r value of .37 for the PIT also
indicates that it outperforms the LSI-R and Wisconsin Risk/Needs Assessment.
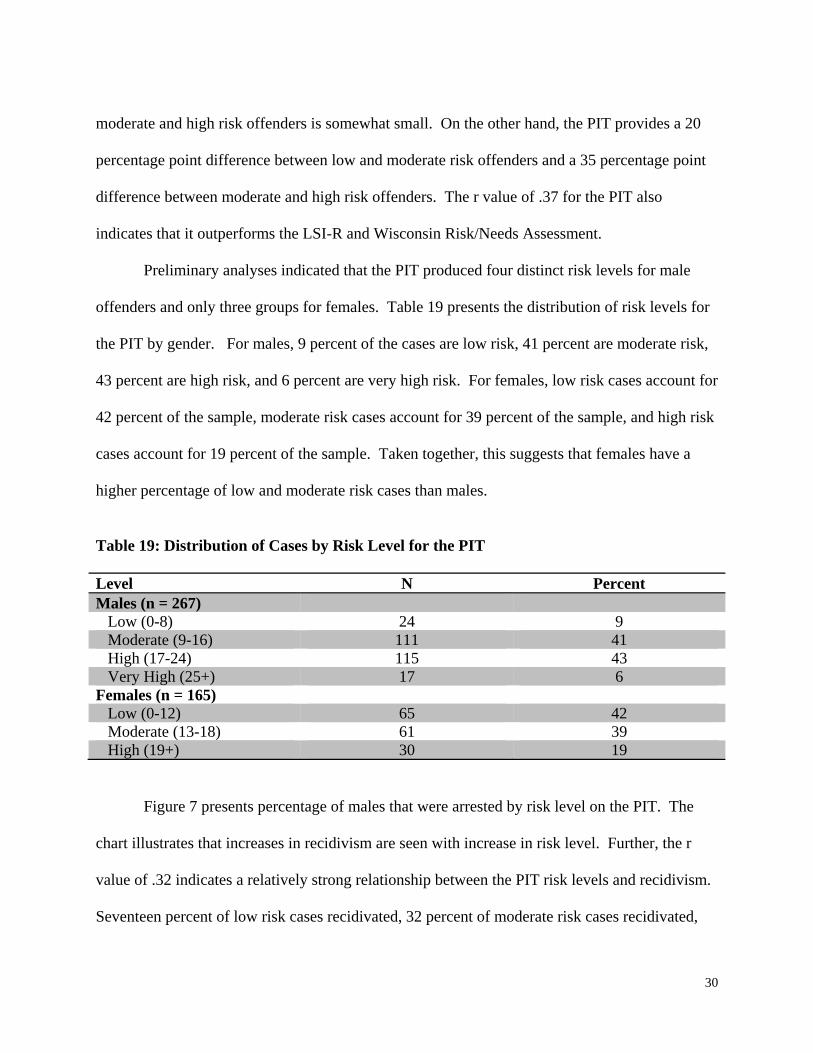
Preliminary analyses indicated that the PIT produced four distinct risk levels for male
offenders and only three groups for females. Table 19 presents the distribution of risk levels for
the PIT by gender. For males, 9 percent of the cases are low risk, 41 percent are moderate risk,
43 percent are high risk, and 6 percent are very high risk. For females, low risk cases account for
42 percent of the sample, moderate risk cases account for 39 percent of the sample, and high risk
cases account for 19 percent of the sample. Taken together, this suggests that females have a
higher percentage of low and moderate risk cases than males.
Table 19: Distribution of Cases by Risk Level for the PIT Level N Percent Males (n = 267)
Low (0-8) 24 9 Moderate (9-16) 111 41 High (17-24) 115 43 Very High (25+) 17 6
Females (n = 165) Low (0-12) 65 42 Moderate (13-18) 61 39 High (19+) 30 19
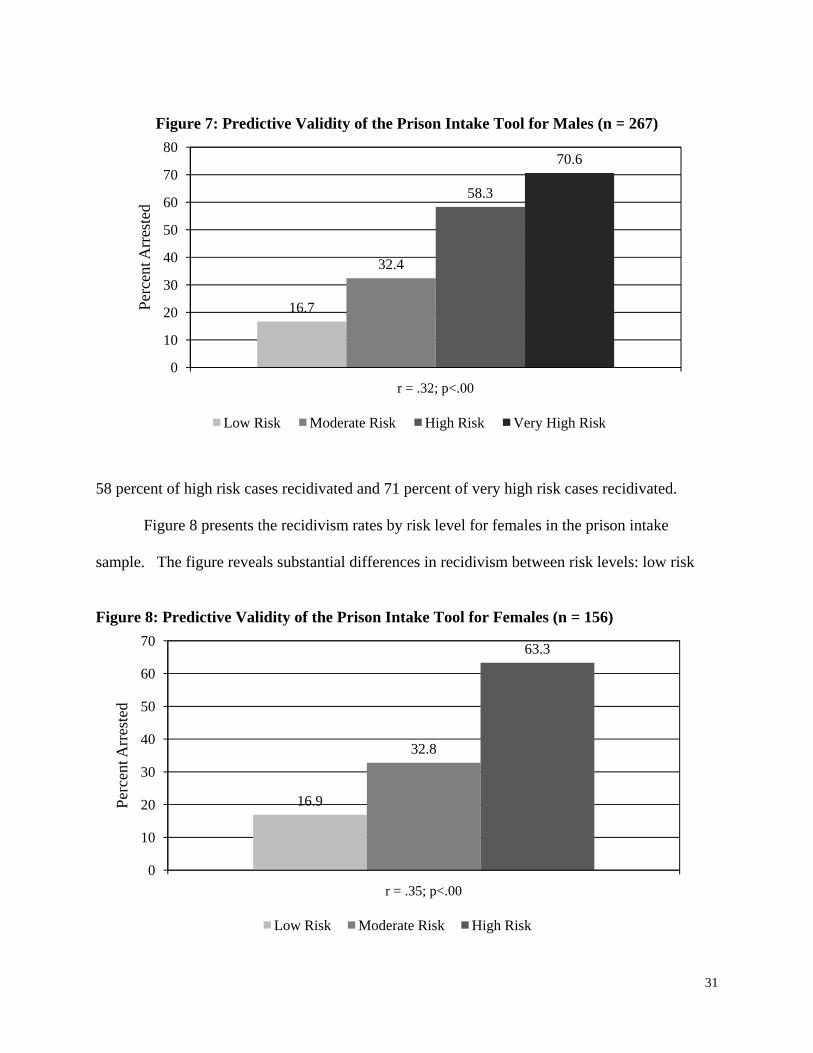
Figure 7 presents percentage of males that were arrested by risk level on the PIT. The
chart illustrates that increases in recidivism are seen with increase in risk level. Further, the r
value of .32 indicates a relatively strong relationship between the PIT risk levels and recidivism.
Seventeen percent of low risk cases recidivated, 32 percent of moderate risk cases recidivated,
31
Figure 7: Predictive Validity of the Prison Intake Tool for Males (n = 267)
58 percent of high risk cases recidivated and 71 percent of very high risk cases recidivated.
Figure 8 presents the recidivism rates by risk level for females in the prison intake
sample. The figure reveals substantial differences in recidivism between risk levels: low risk
Figure 8: Predictive Validity of the Prison Intake Tool for Females (n = 156)
16.7
32.4
58.3
70.6
0
10
20
30
40
50
60
70
80
r = .32; p<.00
Perc
ent A
rres
ted
Low Risk Moderate Risk High Risk Very High Risk
16.9
32.8
63.3
0
10
20
30
40
50
60
70
r = .35; p<.00
Perc
ent A
rres
ted
Low Risk Moderate Risk High Risk
32
cases had a recidivism rate of 17 percent, 33 percent of moderate risk cases recidivated, and 63
percent of high risk cases recidivated. These differences were significant and produced a
relatively large r value of .35.
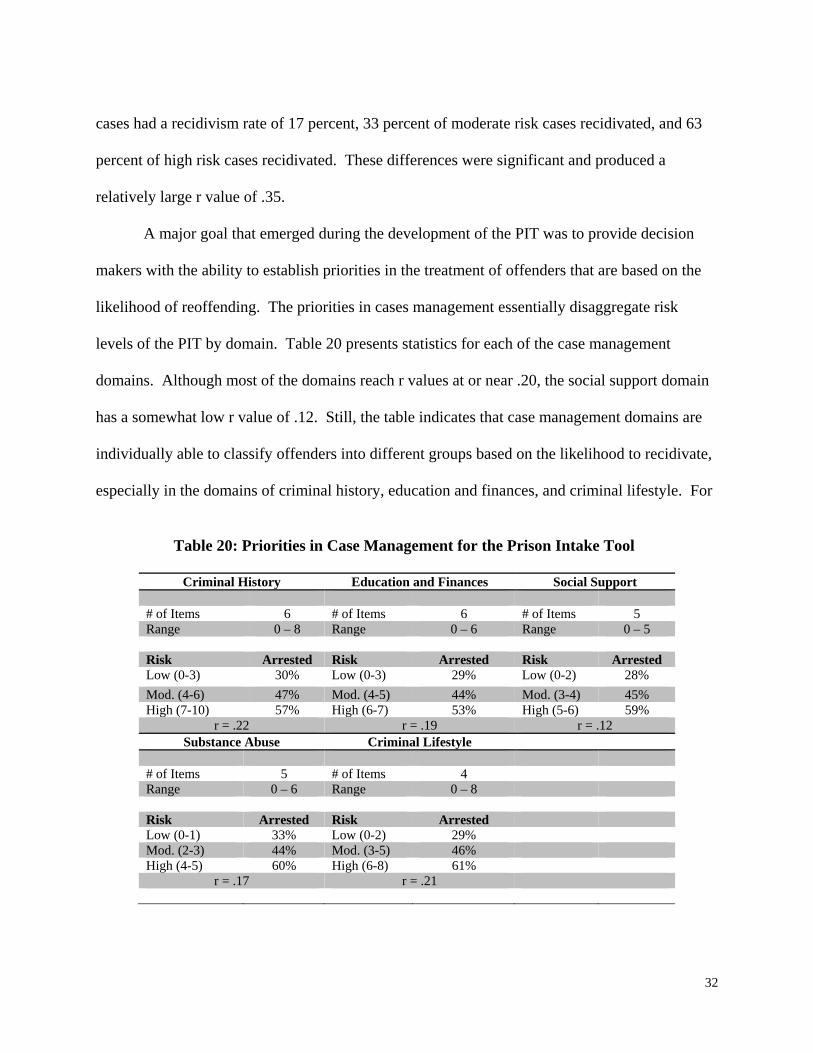
A major goal that emerged during the development of the PIT was to provide decision
makers with the ability to establish priorities in the treatment of offenders that are based on the
likelihood of reoffending. The priorities in cases management essentially disaggregate risk
levels of the PIT by domain. Table 20 presents statistics for each of the case management
domains. Although most of the domains reach r values at or near .20, the social support domain
has a somewhat low r value of .12. Still, the table indicates that case management domains are
individually able to classify offenders into different groups based on the likelihood to recidivate,
especially in the domains of criminal history, education and finances, and criminal lifestyle. For
Table 20: Priorities in Case Management for the Prison Intake Tool
Criminal History Education and Finances Social Support
# of Items 6 # of Items 6 # of Items 5 Range 0 – 8 Range 0 – 6 Range 0 – 5 Risk Arrested Risk Arrested Risk Arrested Low (0-3) 30% Low (0-3) 29% Low (0-2) 28% Mod. (4-6) 47% Mod. (4-5) 44% Mod. (3-4) 45% High (7-10) 57% High (6-7) 53% High (5-6) 59%
r = .22 r = .19 r = .12 Substance Abuse Criminal Lifestyle
# of Items 5 # of Items 4 Range 0 – 6 Range 0 – 8 Risk Arrested Risk Arrested Low (0-1) 33% Low (0-2) 29% Mod. (2-3) 44% Mod. (3-5) 46% High (4-5) 60% High (6-8) 61%
r = .17 r = .21
33
example in the education and finances domain, 29 percent of low risk cases were arrested, 44
percent of moderate risk cases were arrested, and 53 percent of high risk cases were rearrested.
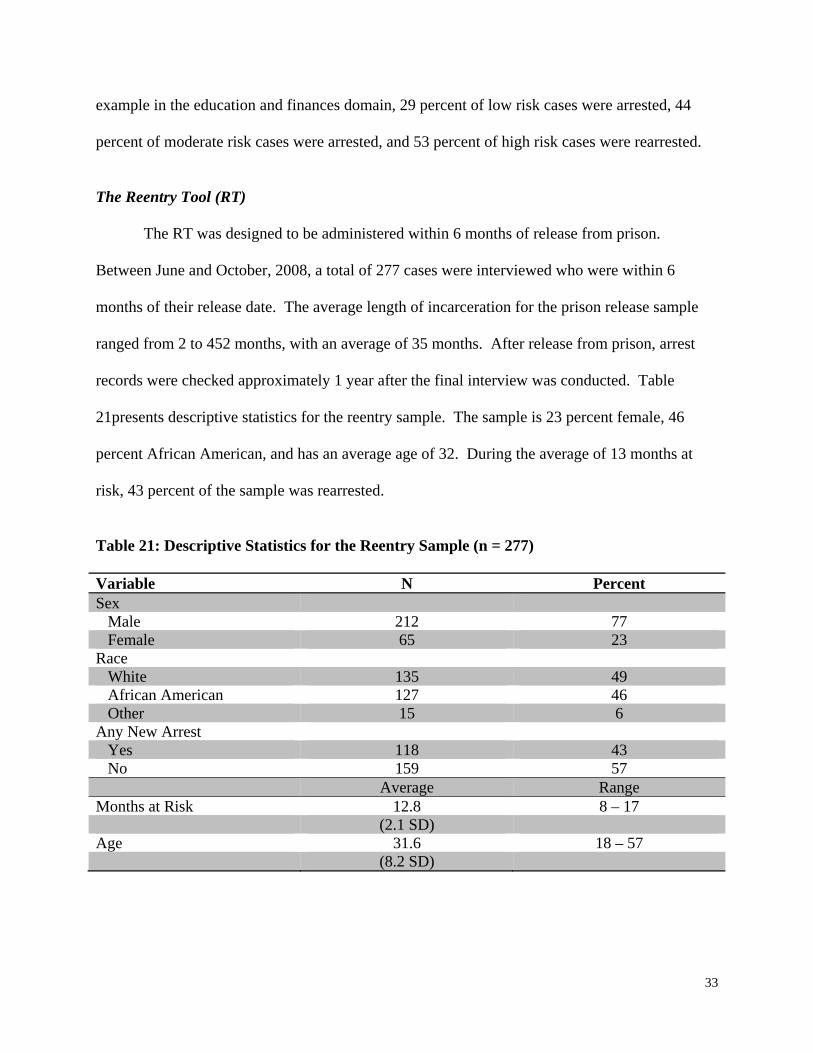
The Reentry Tool (RT) The RT was designed to be administered within 6 months of release from prison.
Between June and October, 2008, a total of 277 cases were interviewed who were within 6
months of their release date. The average length of incarceration for the prison release sample
ranged from 2 to 452 months, with an average of 35 months. After release from prison, arrest
records were checked approximately 1 year after the final interview was conducted. Table
21presents descriptive statistics for the reentry sample. The sample is 23 percent female, 46
percent African American, and has an average age of 32. During the average of 13 months at
risk, 43 percent of the sample was rearrested.
Table 21: Descriptive Statistics for the Reentry Sample (n = 277)
Variable N Percent Sex Male 212 77 Female 65 23 Race White 135 49 African American 127 46 Other 15 6 Any New Arrest Yes 118 43 No 159 57 Average Range Months at Risk 12.8 8 – 17 (2.1 SD) Age 31.6 18 – 57 (8.2 SD)
34
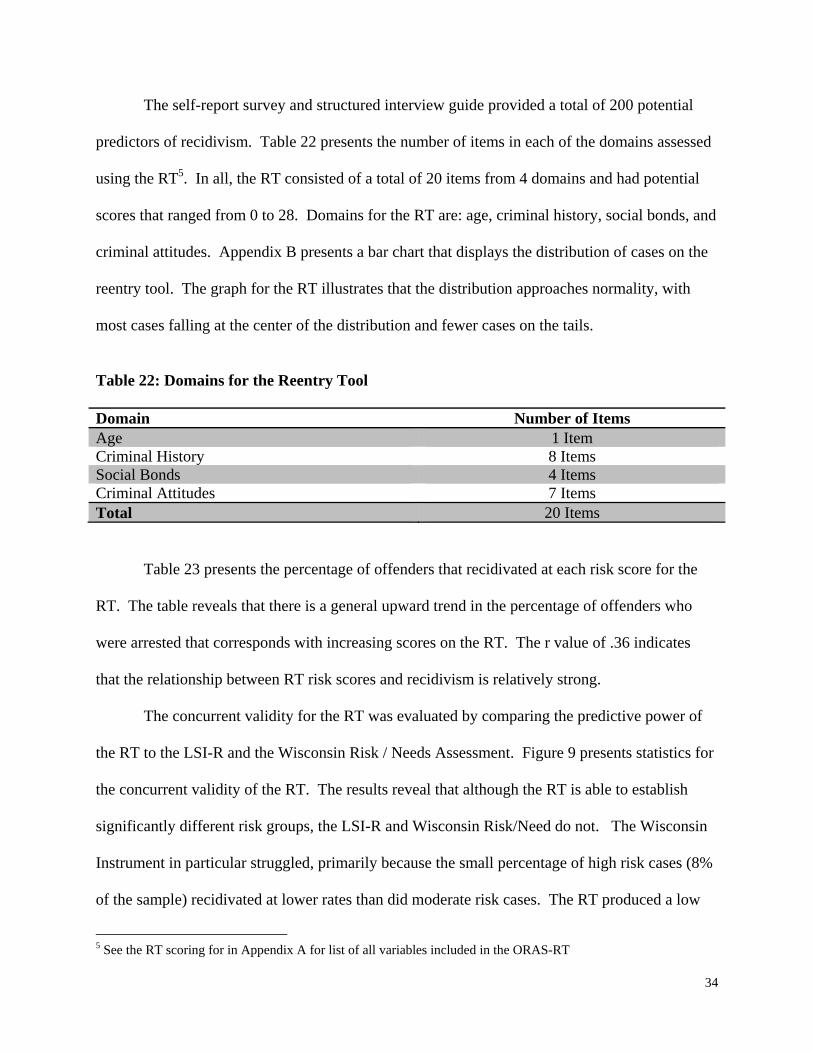
The self-report survey and structured interview guide provided a total of 200 potential
predictors of recidivism. Table 22 presents the number of items in each of the domains assessed
using the RT5. In all, the RT consisted of a total of 20 items from 4 domains and had potential
scores that ranged from 0 to 28. Domains for the RT are: age, criminal history, social bonds, and
criminal attitudes. Appendix B presents a bar chart that displays the distribution of cases on the
reentry tool. The graph for the RT illustrates that the distribution approaches normality, with
most cases falling at the center of the distribution and fewer cases on the tails.
Table 22: Domains for the Reentry Tool
Domain Number of Items Age 1 Item Criminal History 8 Items Social Bonds 4 Items Criminal Attitudes 7 Items Total 20 Items
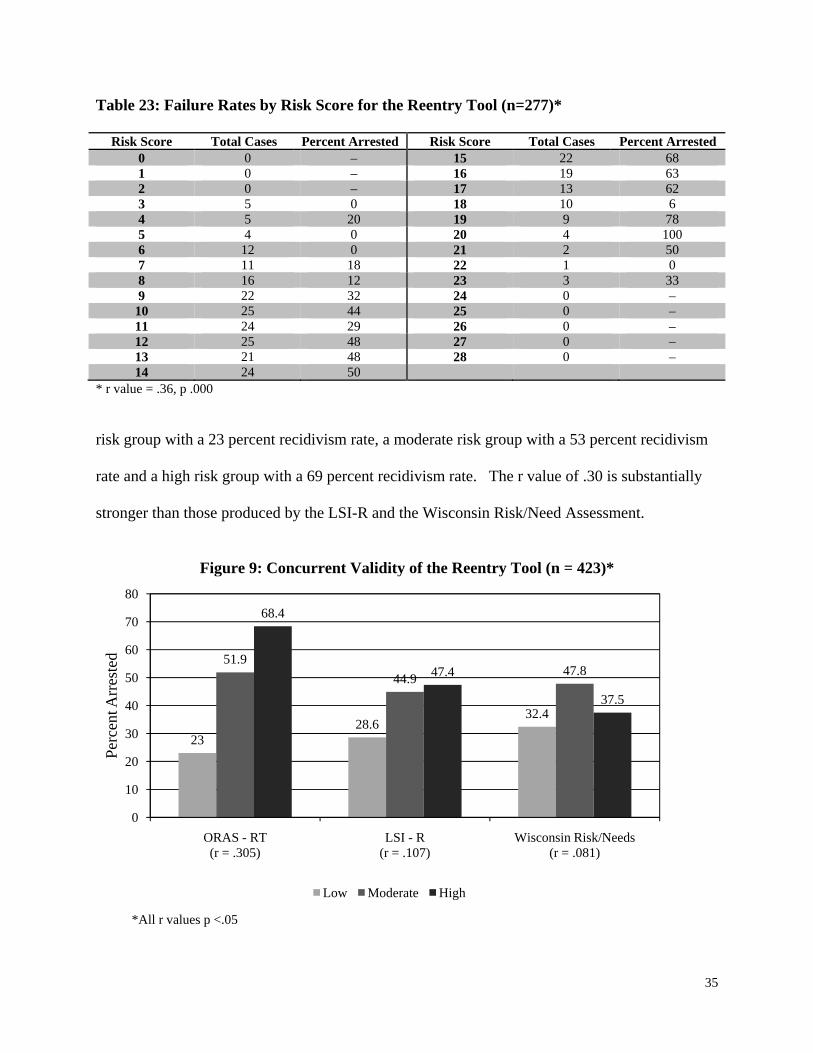
Table 23 presents the percentage of offenders that recidivated at each risk score for the
RT. The table reveals that there is a general upward trend in the percentage of offenders who
were arrested that corresponds with increasing scores on the RT. The r value of .36 indicates
that the relationship between RT risk scores and recidivism is relatively strong.
The concurrent validity for the RT was evaluated by comparing the predictive power of
the RT to the LSI-R and the Wisconsin Risk / Needs Assessment. Figure 9 presents statistics for
the concurrent validity of the RT. The results reveal that although the RT is able to establish
significantly different risk groups, the LSI-R and Wisconsin Risk/Need do not. The Wisconsin
Instrument in particular struggled, primarily because the small percentage of high risk cases (8%
of the sample) recidivated at lower rates than did moderate risk cases. The RT produced a low
5 See the RT scoring for in Appendix A for list of all variables included in the ORAS-RT
35
Table 23: Failure Rates by Risk Score for the Reentry Tool (n=277)*
Risk Score Total Cases Percent Arrested Risk Score Total Cases Percent Arrested 0 0 – 15 22 68 1 0 – 16 19 63 2 0 – 17 13 62 3 5 0 18 10 6 4 5 20 19 9 78 5 4 0 20 4 100 6 12 0 21 2 50 7 11 18 22 1 0 8 16 12 23 3 33 9 22 32 24 0 –
10 25 44 25 0 – 11 24 29 26 0 – 12 25 48 27 0 – 13 21 48 28 0 – 14 24 50
* r value = .36, p .000
risk group with a 23 percent recidivism rate, a moderate risk group with a 53 percent recidivism
rate and a high risk group with a 69 percent recidivism rate. The r value of .30 is substantially
stronger than those produced by the LSI-R and the Wisconsin Risk/Need Assessment.
Figure 9: Concurrent Validity of the Reentry Tool (n = 423)*
*All r values p <.05
2328.6
32.4
51.944.9 47.8
68.4
47.4
37.5
0
10
20
30
40
50
60
70
80
ORAS - RT (r = .305)
LSI - R (r = .107)
Wisconsin Risk/Needs (r = .081)
Perc
ent A
rres
ted
Low Moderate High
36
Preliminary analyses revealed that since females were less likely to recidivate, separate
cut off scores should be made for males and females. Table 24 presents the distribution of the
reentry sample on risk levels for the RT. For males, the majority of cases are moderate risk, with
similar percentages of cases falling at low and high risk levels. On the other hand, low risk is the
modal value for females. These findings are similar to the Prison Intake Tool and indicate that
females tend to score at lower risk levels than males on the assessment instruments.
Table 24: Distribution of Cases by Risk Level for the RT Level N Percent Males (n = 212)
Low (0-9) 47 22 Moderate (10-15) 109 51 High (16+) 56 26
Females (n = 65) Low (0-10) 31 48 Moderate (11-14) 25 39 High (15+) 9 14
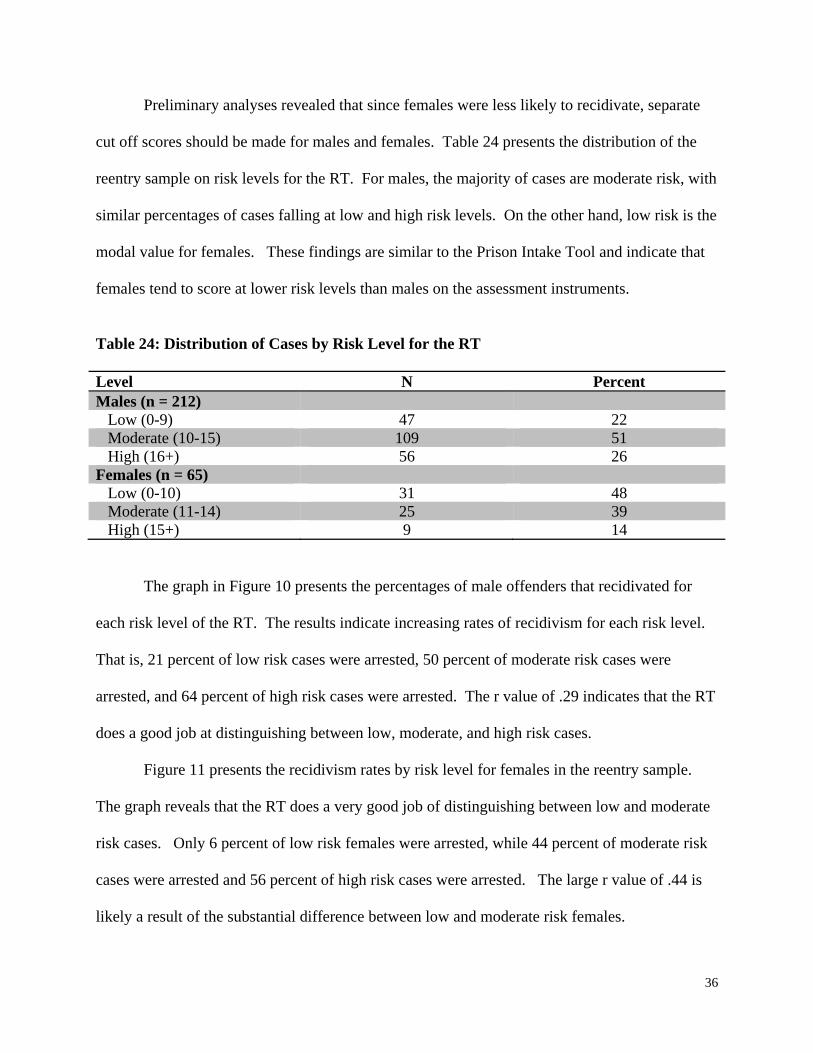
The graph in Figure 10 presents the percentages of male offenders that recidivated for
each risk level of the RT. The results indicate increasing rates of recidivism for each risk level.
That is, 21 percent of low risk cases were arrested, 50 percent of moderate risk cases were
arrested, and 64 percent of high risk cases were arrested. The r value of .29 indicates that the RT
does a good job at distinguishing between low, moderate, and high risk cases.
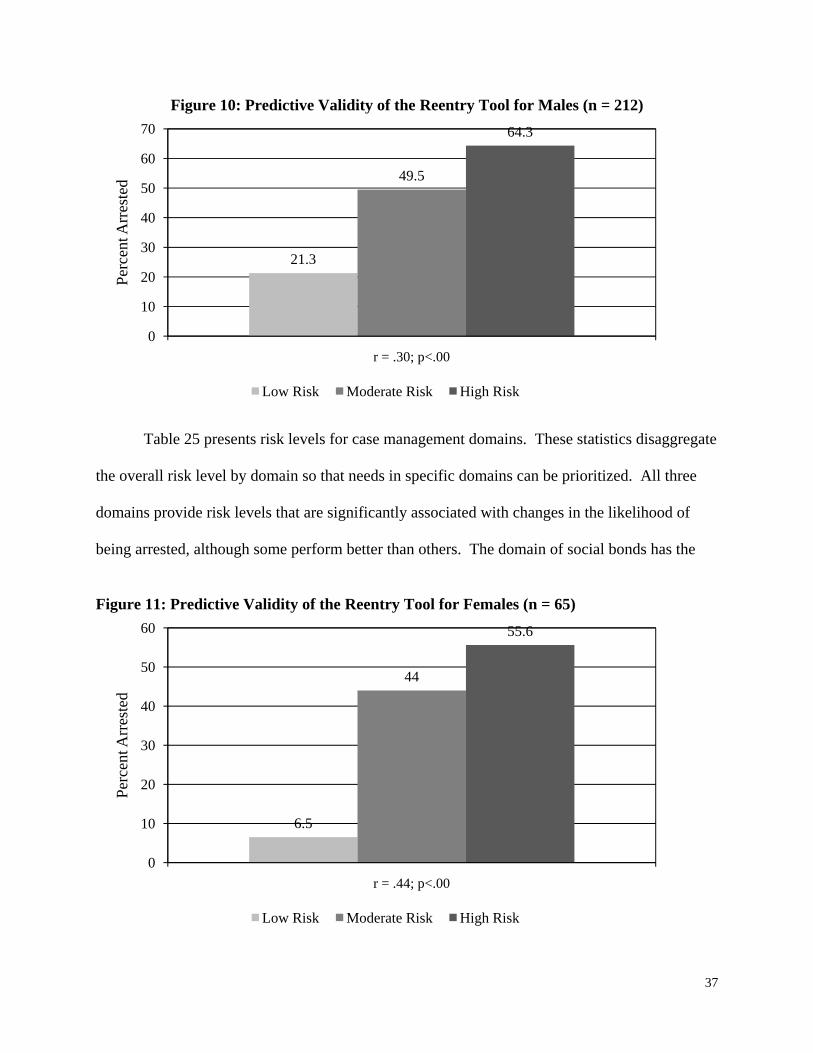
Figure 11 presents the recidivism rates by risk level for females in the reentry sample.
The graph reveals that the RT does a very good job of distinguishing between low and moderate
risk cases. Only 6 percent of low risk females were arrested, while 44 percent of moderate risk
cases were arrested and 56 percent of high risk cases were arrested. The large r value of .44 is
likely a result of the substantial difference between low and moderate risk females.
37
Figure 10: Predictive Validity of the Reentry Tool for Males (n = 212)
Table 25 presents risk levels for case management domains. These statistics disaggregate
the overall risk level by domain so that needs in specific domains can be prioritized. All three
domains provide risk levels that are significantly associated with changes in the likelihood of
being arrested, although some perform better than others. The domain of social bonds has the
Figure 11: Predictive Validity of the Reentry Tool for Females (n = 65)
21.3
49.5
64.3
0
10
20
30
40
50
60
70
r = .30; p<.00
Perc
ent A
rres
ted
Low Risk Moderate Risk High Risk
6.5
44
55.6
0
10
20
30
40
50
60
r = .44; p<.00
Perc
ent A
rres
ted
Low Risk Moderate Risk High Risk
38
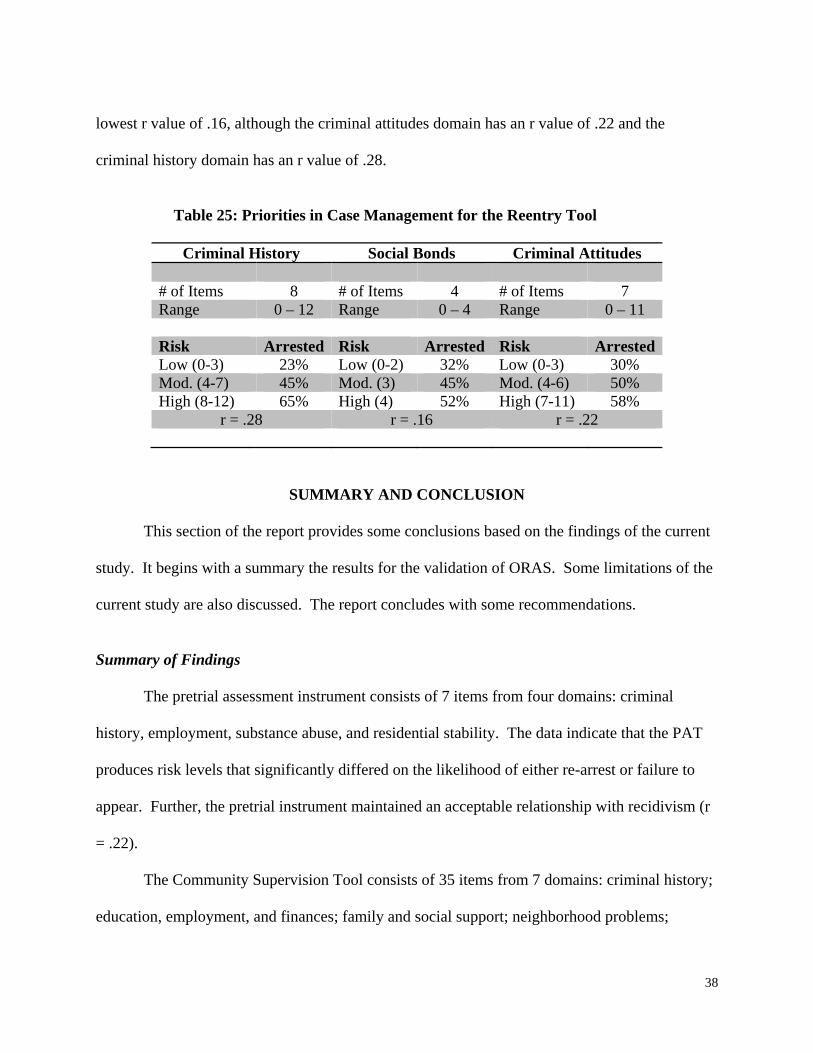
lowest r value of .16, although the criminal attitudes domain has an r value of .22 and the
criminal history domain has an r value of .28.
Table 25: Priorities in Case Management for the Reentry Tool
Criminal History Social Bonds Criminal Attitudes
# of Items 8 # of Items 4 # of Items 7 Range 0 – 12 Range 0 – 4 Range 0 – 11 Risk Arrested Risk Arrested Risk ArrestedLow (0-3) 23% Low (0-2) 32% Low (0-3) 30% Mod. (4-7) 45% Mod. (3) 45% Mod. (4-6) 50% High (8-12) 65% High (4) 52% High (7-11) 58%
r = .28 r = .16 r = .22
SUMMARY AND CONCLUSION
This section of the report provides some conclusions based on the findings of the current
study. It begins with a summary the results for the validation of ORAS. Some limitations of the
current study are also discussed. The report concludes with some recommendations.
Summary of Findings
The pretrial assessment instrument consists of 7 items from four domains: criminal
history, employment, substance abuse, and residential stability. The data indicate that the PAT
produces risk levels that significantly differed on the likelihood of either re-arrest or failure to
appear. Further, the pretrial instrument maintained an acceptable relationship with recidivism (r
= .22).
The Community Supervision Tool consists of 35 items from 7 domains: criminal history;
education, employment, and finances; family and social support; neighborhood problems;
39
substance abuse; antisocial associations; and antisocial attitudes and behavioral problems. The
validation results revealed that the risk levels on the CST displayed increasing higher rates of
recidivism for both male and females. The CST had a correlation of .37 with recidivism for
males and .30 for females. The Community Supervision Screening Tool is a four item
instrument designed to quickly identify low risk cases that do not need the full assessment. It
had a correlation of .36 with recidivism.
The Prison Intake Tool consisted of 31 items from five domains: criminal history;
education, employment, finances; family and social support; substance abuse; and criminal
lifestyle. The validation results for the PIT revealed that different cutoff scores and risk levels
were optimal for males and females. Although males had four groups and females only had 3,
the percentages of cases arrested increase as risk level increased for both genders. The
correlation between risk level and recidivism was .32 for males and .35 for females.
The Reentry Tool consisted of 20 items from 3 domains and predicted new arrest. The
three domains were criminal history, social bonds, and antisocial attitudes. The validation results
revealed that optimal cutoff scores were different for males and females. Still, risk levels are
significantly associated with increases in the recidivism rate for both genders. The r value for is
.30 for males and .44 for females.
Limitations
There were two primary limitations observed in the current study. The first limitation
revolves around the generalizability of the sample to all offenders in the Ohio criminal justice
system. Although the data collection period gathered information on over 1,800 offenders in
Ohio, it would be imprudent to assume that the findings are representative of all offenders in
Ohio. First, resource constrains limited the inclusion of cases from all counties and correctional
40
institutions. Second, although the samples were gathered from specific populations, certain
types of cases may be underrepresented in the population (e.g. sex offenders, Hispanic offenders,
female offenders). The underrepresentation in the population leads to small numbers of these
types of offenders in the sample. For example, the findings from the RT were based on a sample
size of 65 females. Although the results provide evidence that females have a distribution on the
risk levels that is different from men, the findings should be considered preliminary until data
can be collected on a larger sample of women who are released from prison.
A second limitation to the current study revolves around measurement error. The major
source of data collection for this study was the structured interview, which was undertaken by
trained research staff from the University of Cincinnati. Further, the informed consent process
identified a sample that offenders who were willing to undergo the interview process. In short,
the structured interview process utilized to gather the data will likely be somewhat different than
the process used by criminal justice officials to interview cases and assign risk once ORAS is
implemented.
Recommendations
Based on the findings and limitations discussed above, several recommendations can be
made. The first major recommendation is that revalidation studies be conducted of ORAS.
Once ORAS becomes automated, the costs and resources involved with data collection should be
reduced because assessment scores will be previously recorded by criminal justice personnel.
Instead, probability samples can be drawn for each instrument using large data bases that store
offender risk scores every time an assessment is entered.

41
Revalidation studies will provide further evidence that the instruments in ORAS are able
to predict recidivism across multiple samples from the same population. Further, the automation
and storage of ORAS data will allow researchers to gather stratified probability samples in order
to 1) provide a sample that is representative of all counties in Ohio, 2) oversample
underrepresented groups. Also, revalidation studies should seek to extend the follow-up time.
Although an average of 12 months is adequate, research suggests that 18 to 24 month follow-up
times are optimal (Jones, 1996). Finally, revalidation will also address the issues of
measurement error. That is, data can be gathered on assessments that are given by personnel
within the criminal justice system, examining the predictive validity of ORAS in a real world
setting.
Another major recommendation is that ODRC follow the protocol developed by the
University of Cincinnati for training personnel on the assessment instruments. Proper training
cannot be stressed enough because the efficacy of every assessment is heavily dependent upon
the person who conducts the interview and scores the risk level. This is especially important
because although the interview questions are structured to maximize reliability, scoring some of
the items is reliant upon the professional judgment of the interviewer. Training will also help to
minimize the differences in measurement between University research staff conducting the
interviews and criminal justice personnel. Not only is initial training important, but it is
recommended that a system be developed that lays out the process of training, provides
reliability checks for interviewers, and lays out guidelines for retraining.
In sum, the development of ORAS produced five assessment tools designed to predict the
likelihood of recidivism at different points in the criminal justice process. These tools not only
are used to assign supervision levels, but were also designed to assist case managers in targeting

42
dynamic risk factors and identifying barriers to treatment. Overall, the results from the
validation are favorable, indicating that each tool was able to clearly distinguish between groups
of offenders with escalating rates of recidivism. Some caution should be taken in generalizing
the findings from this sample to all offenders in Ohio, although the automation of ORAS makes
future revalidation studies more likely to be generalizable and less expensive to undertake.
43
REFERENCES Andrews, D., Bonta, J., and Hoge R. (1990). Classification for effective rehabilitation:
Rediscovering psychology. Criminal Justice and Behavior 17:19-52. Andrews, D. A., Zinger, I., Hoge, R., Bonta, J., Gendreau, P. and Cullen F. T. (1990). Does
correctional treatment work? A clinically relevant and psychologically informed meta-analysis. Criminology, 28: 369-404.
Bonta, J. (1996). Risk-needs assessment and treatment. in A. T. Harland (ed.), Choosing
Correctional Interventions That Work: Defining the Demand and Evaluating the Supply. Newbury Park, CA: Sage.
Bonta, J. & Law M. (1998). The prediction of criminal and violent recidivism among mentally
disordered offenders: A meta-analysis. Psychological Bulletin, 123: 123-142. Dowden, C. & Andrews D. (1999). What works for female offenders: A meta-analytic review.
Crime and Delinquency 45: 438-452. Dowden, C. and D. Andrews (1999). What works for young offender treatment: A meta-analysis.
Forum on Corrections Research 11: 21-24. Gendreau, P., Little, T. & Goggin C. (1996). A meta-analysis of the predictors of adult offender
recidivism: What works! Criminology, 34: 401-433. Gottfredson, S. and L. Moriarty (2006). Statistical risk assessment: old problems and new
applications. Crime and Delinquency 52: 178-200. Jones, D. (1996). Risk prediction in criminal justice. In A.T. Harland (Ed.). Choosing
correctional options that work. London, Sage. Lowenkamp, C. T. & Latessa E. J. (2002). Evaluation of Ohio’s community based correctional
facilities and halfway house programs: Final report. Unpublished Technical Report: University of Cincinnati.
Lowenkamp, C. T. & Latessa E. J. (2004). Understanding the risk principle: How and why
correctional interventions can harm low-risk offenders. Topics In Community Corrections, 2004. Washington, D.C.: U.S. Department of Justice, National Institute of Corrections.
Lowenkamp, C. T. & Latessa E. J. (2005). Evaluation of Ohio’s CCA funded programs: Final
report. Unpublished Technical Report: University of Cincinnati.
44
Lowenkamp, C. T. & Latessa E. J. (2005). Increasing the effectiveness of correctional programming through the risk principle: Identifying offenders for residential placement. Criminology and Public Policy, 4: 263-290.
Lowenkamp, C. T. Latessa E. J., & Smith, P. (2006). Does correctional program quality really
matter? The impact of adhering to the principles of effective intervention. Criminology and Public Policy, 5: 575-594.
Van Voorhis, P. (2007). An overview of offender classification systems. In P. Van Voorhis, D.
Lester, & M. Brasswell (Eds.) Correctional Counseling and Rehabilitation. Cincinnati, OH: Anderson Publishing.
Wright, K., Clear, T. R. & Dickerson, P. (1984). Universal application of probation risk
assessment instruments: A critique. Criminology 22: 113-134.

45
APPENDIX A: SCORING FORMS FOR EACH ASSESSMENT
OHIO RISK ASSESSMENT SYSTEM: PRETRIAL ASSESSMENT TOOL (ORAS-PAT)
Name: Date of Assessment: Case#: Name of Assessor: Pretrial Items Verified
1.1. Age at First Arrest
0=33 or older 1=Under 33
1.2. Number of Failure-to-Appear Warrants Past 24 Months
0=None 1=One Warrant for FTA 2=Two or more FTA Warrants
1.3. Three or more Prior Jail Incarcerations
0=No 1=Yes
1.4. Employed at the Time of Arrest
0= Yes Full time 1= Yes, Part-time 2= Not employed
1.5. Residential Stability
0=Lived at current residence past six months 1=Not lived at same residence
1.6. Illegal Drug Use during Past Six Month
0=No 1=Yes
1.7. Severe Drug Use Problem
0=No 1=Yes
Total Score:
Scores Rating % of Failures % of Failure to Appear % of New Arrest 0-2 Low 5% 5% 0% 3-5 Moderate 18% 12% 7% 6+ High 29% 15% 17%
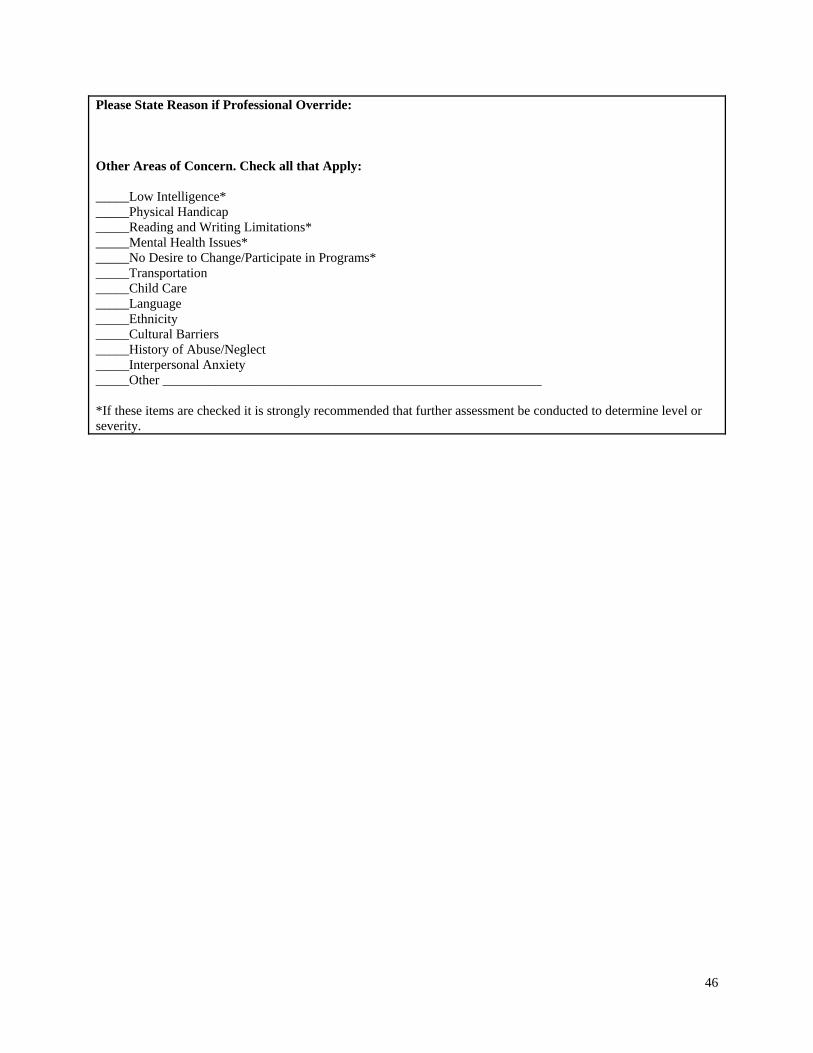
46
Please State Reason if Professional Override: Other Areas of Concern. Check all that Apply: _____Low Intelligence* _____Physical Handicap _____Reading and Writing Limitations* _____Mental Health Issues* _____No Desire to Change/Participate in Programs* _____Transportation _____Child Care _____Language _____Ethnicity _____Cultural Barriers _____History of Abuse/Neglect _____Interpersonal Anxiety _____Other _________________________________________________________ *If these items are checked it is strongly recommended that further assessment be conducted to determine level or severity.
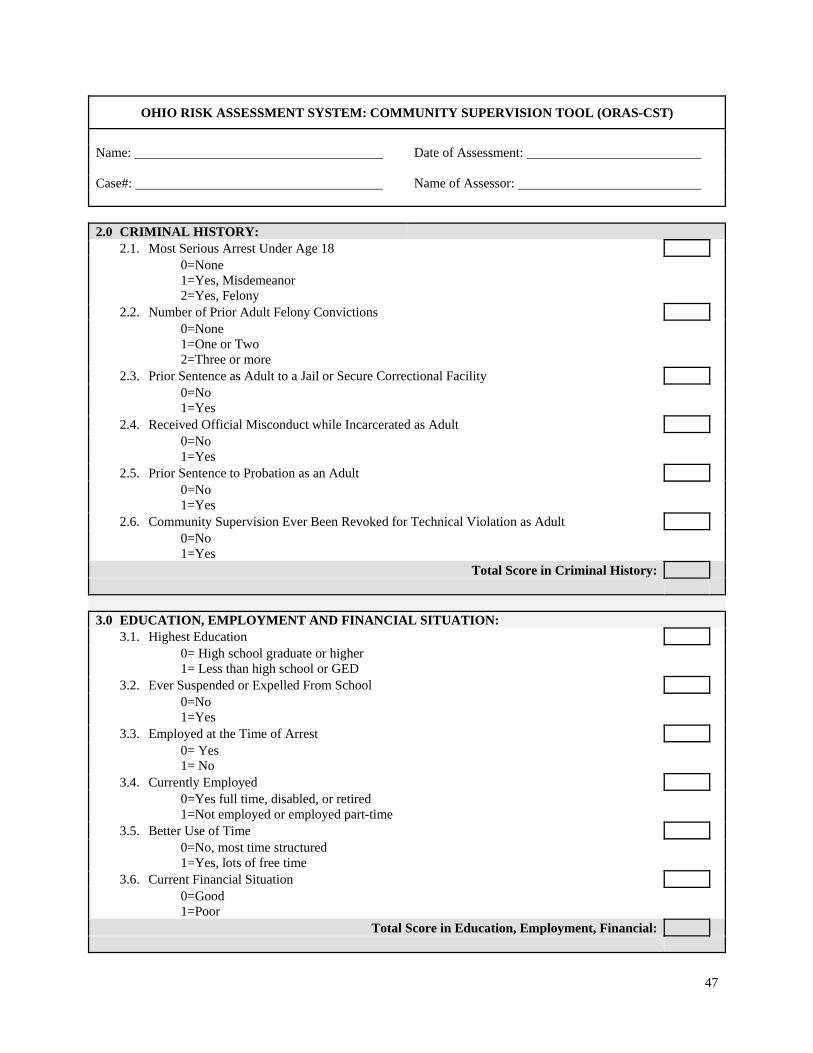
47
OHIO RISK ASSESSMENT SYSTEM: COMMUNITY SUPERVISION TOOL (ORAS-CST)
Name: Date of Assessment: Case#: Name of Assessor: 2.0 CRIMINAL HISTORY:
2.1. Most Serious Arrest Under Age 18 0=None
1=Yes, Misdemeanor 2=Yes, Felony
2.2. Number of Prior Adult Felony Convictions 0=None
1=One or Two 2=Three or more
2.3. Prior Sentence as Adult to a Jail or Secure Correctional Facility 0=No
1=Yes
2.4. Received Official Misconduct while Incarcerated as Adult 0=No
1=Yes
2.5. Prior Sentence to Probation as an Adult 0=No
1=Yes
2.6. Community Supervision Ever Been Revoked for Technical Violation as Adult 0=No
1=Yes
Total Score in Criminal History:
3.0 EDUCATION, EMPLOYMENT AND FINANCIAL SITUATION:
3.1. Highest Education 0= High school graduate or higher
1= Less than high school or GED
3.2. Ever Suspended or Expelled From School 0=No
1=Yes
3.3. Employed at the Time of Arrest 0= Yes
1= No
3.4. Currently Employed 0=Yes full time, disabled, or retired
1=Not employed or employed part-time
3.5. Better Use of Time 0=No, most time structured
1=Yes, lots of free time
3.6. Current Financial Situation 0=Good
1=Poor
Total Score in Education, Employment, Financial:
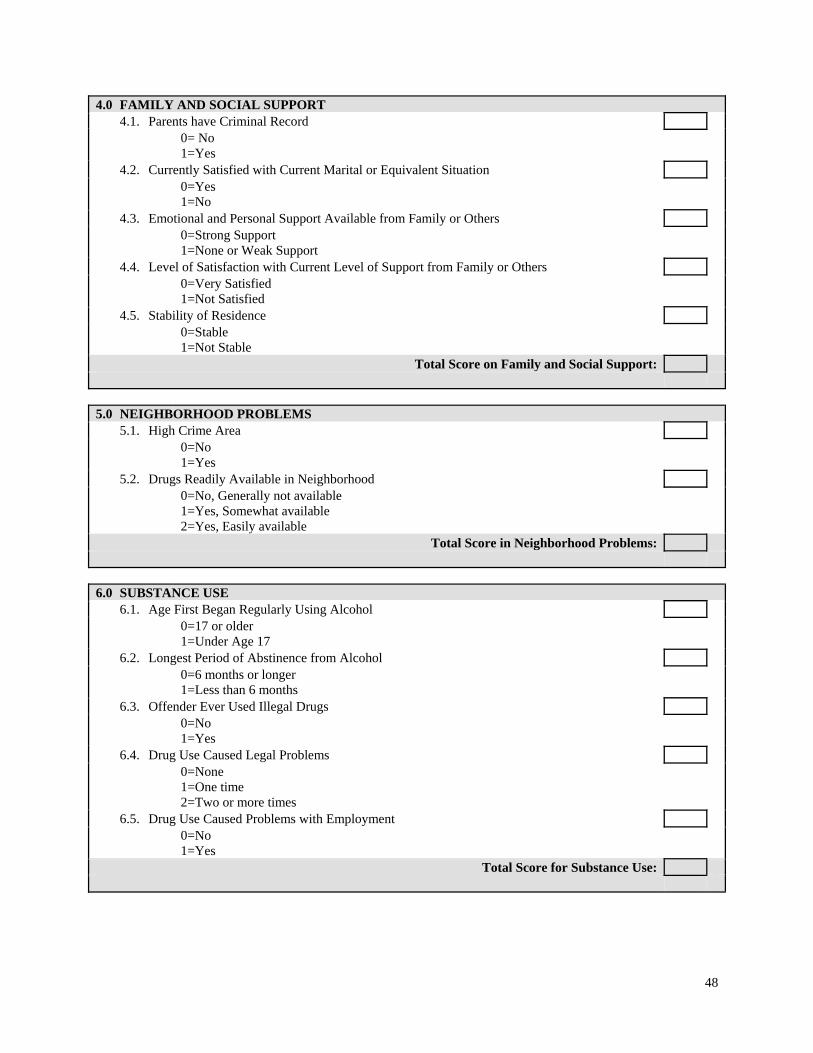
48
4.0 FAMILY AND SOCIAL SUPPORT 4.1. Parents have Criminal Record
0= No 1=Yes
4.2. Currently Satisfied with Current Marital or Equivalent Situation 0=Yes
1=No
4.3. Emotional and Personal Support Available from Family or Others 0=Strong Support
1=None or Weak Support
4.4. Level of Satisfaction with Current Level of Support from Family or Others 0=Very Satisfied
1=Not Satisfied
4.5. Stability of Residence 0=Stable
1=Not Stable
Total Score on Family and Social Support:
5.0 NEIGHBORHOOD PROBLEMS
5.1. High Crime Area 0=No
1=Yes
5.2. Drugs Readily Available in Neighborhood 0=No, Generally not available
1=Yes, Somewhat available 2=Yes, Easily available
Total Score in Neighborhood Problems:
6.0 SUBSTANCE USE
6.1. Age First Began Regularly Using Alcohol 0=17 or older
1=Under Age 17
6.2. Longest Period of Abstinence from Alcohol 0=6 months or longer
1=Less than 6 months
6.3. Offender Ever Used Illegal Drugs 0=No
1=Yes
6.4. Drug Use Caused Legal Problems 0=None
1=One time 2=Two or more times
6.5. Drug Use Caused Problems with Employment 0=No
1=Yes
Total Score for Substance Use:
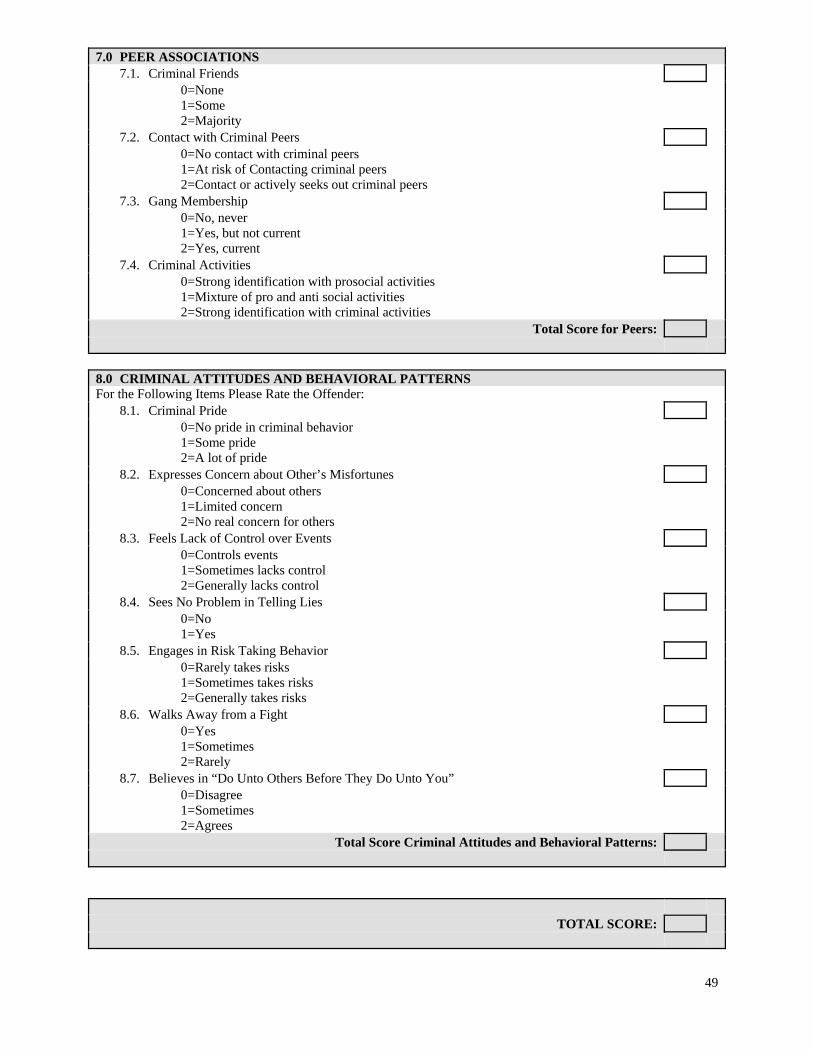
49
7.0 PEER ASSOCIATIONS 7.1. Criminal Friends
0=None 1=Some 2=Majority
7.2. Contact with Criminal Peers 0=No contact with criminal peers
1=At risk of Contacting criminal peers 2=Contact or actively seeks out criminal peers
7.3. Gang Membership 0=No, never
1=Yes, but not current 2=Yes, current
7.4. Criminal Activities 0=Strong identification with prosocial activities
1=Mixture of pro and anti social activities 2=Strong identification with criminal activities
Total Score for Peers:
8.0 CRIMINAL ATTITUDES AND BEHAVIORAL PATTERNS For the Following Items Please Rate the Offender:
8.1. Criminal Pride 0=No pride in criminal behavior
1=Some pride 2=A lot of pride
8.2. Expresses Concern about Other’s Misfortunes 0=Concerned about others
1=Limited concern 2=No real concern for others
8.3. Feels Lack of Control over Events 0=Controls events
1=Sometimes lacks control 2=Generally lacks control
8.4. Sees No Problem in Telling Lies 0=No
1=Yes
8.5. Engages in Risk Taking Behavior 0=Rarely takes risks
1=Sometimes takes risks 2=Generally takes risks
8.6. Walks Away from a Fight 0=Yes
1=Sometimes 2=Rarely
8.7. Believes in “Do Unto Others Before They Do Unto You” 0=Disagree
1=Sometimes 2=Agrees
Total Score Criminal Attitudes and Behavioral Patterns:
TOTAL SCORE:
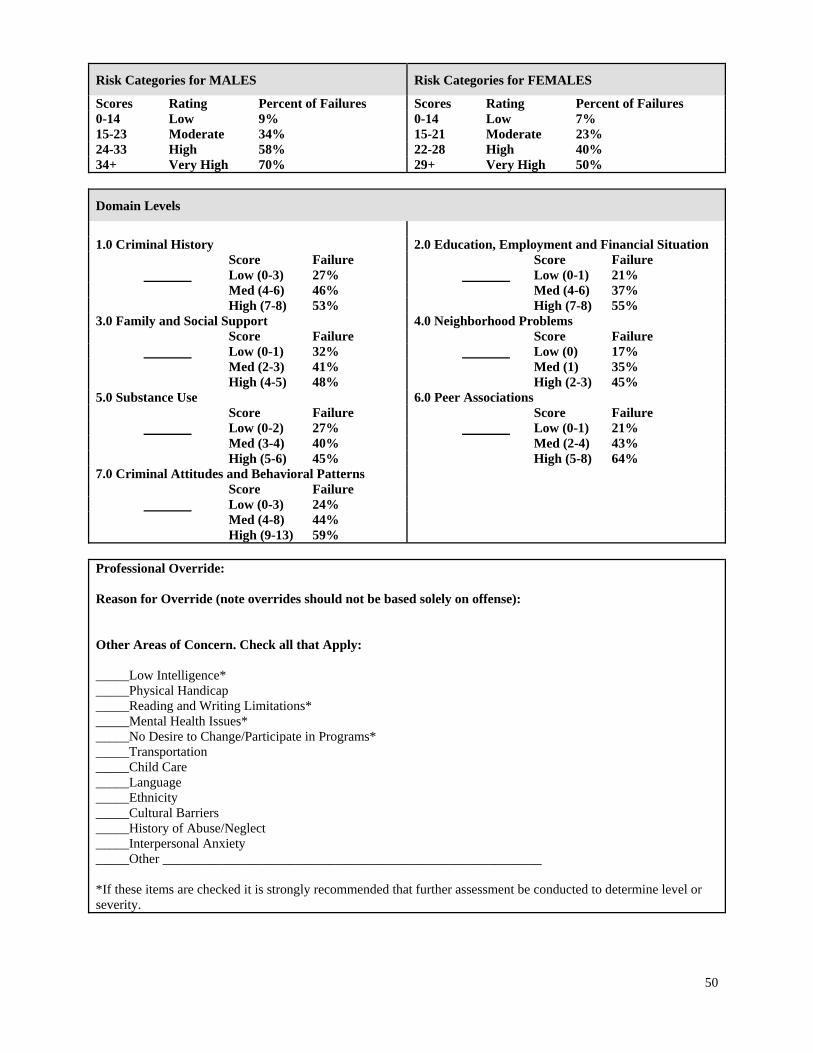
50
Risk Categories for MALES Risk Categories for FEMALES
Scores Rating Percent of Failures Scores Rating Percent of Failures0-14 Low 9% 0-14 Low 7% 15-23 Moderate 34% 15-21 Moderate 23% 24-33 High 58% 22-28 High 40% 34+ Very High 70% 29+ Very High 50%
Domain Levels
1.0 Criminal History 2.0 Education, Employment and Financial Situation Score Failure Score Failure Low (0-3) 27% Low (0-1) 21% Med (4-6) 46% Med (4-6) 37% High (7-8) 53% High (7-8) 55% 3.0 Family and Social Support 4.0 Neighborhood Problems Score Failure Score Failure Low (0-1) 32% Low (0) 17% Med (2-3) 41% Med (1) 35% High (4-5) 48% High (2-3) 45% 5.0 Substance Use 6.0 Peer Associations Score Failure Score Failure Low (0-2) 27% Low (0-1) 21% Med (3-4) 40% Med (2-4) 43% High (5-6) 45% High (5-8) 64% 7.0 Criminal Attitudes and Behavioral Patterns Score Failure Low (0-3) 24% Med (4-8) 44% High (9-13) 59% Professional Override: Reason for Override (note overrides should not be based solely on offense): Other Areas of Concern. Check all that Apply: _____Low Intelligence* _____Physical Handicap _____Reading and Writing Limitations* _____Mental Health Issues* _____No Desire to Change/Participate in Programs* _____Transportation _____Child Care _____Language _____Ethnicity _____Cultural Barriers _____History of Abuse/Neglect _____Interpersonal Anxiety _____Other _________________________________________________________ *If these items are checked it is strongly recommended that further assessment be conducted to determine level or severity.

51
OHIO RISK ASSESSMENT SYSTEM - COMMUNITY SUPERVISION
SCREENING TOOL (ORAS-CSST) Name: Date of Assessment: Case#: Name of Assessor: 1.0 Number of Prior Adult Felony Convictions 0=None
1=One or Two 2=Three or more
2.0 Currently Employed 0=Yes full time, disabled, or retired
1=Not employed or employed part-time
3.0 Drugs Readily Available in Neighborhood 0=No, Generally not available
1=Yes, Somewhat available 2=Yes, Easily available
4.0 Criminal Friends 0=None
1=Some 2=Majority
TOTAL SCORE:
Risk Categories for MALES Risk Categories for FEMALES
Scores Rating Percent of Failures Scores Rating Percent of Failures0-2 Low 15% 0-3 Low 12% 3+ High 50% 4+ High 40%

52
OHIO RISK ASSESSMENT SYSTEM – PRISON INTAKE TOOL (ORAS-PIT)
Name: Date of Assessment: Case#: Name of Assessor: Age at Time of Assessment 0=24+ 1=18-23 1.0 CRIMINAL HISTORY
1.1. Most Serious Arrest Under Age 18 0=None
1=Yes, Misdemeanor 2=Yes, Felony
1.2. Prior Commitment as a Juvenile to Department of Youth Services 0=No
1=Yes
1.3. Number of Prior Adult Felony Convictions 0=None
1=One or Two 2=Three or more
1.4. Arrests for Violent Offense as an Adult 0=No
1=Yes
1.5. Number of Prior Commitments to Prison 0=None
1=One 2=Two or More
1.6. Ever Received Official Misconduct while Incarcerated as an Adult 0=No
1=Yes
1.7. Ever Had Escape Attempts as Adult 0=No
1=Yes
Total Score in Criminal History:
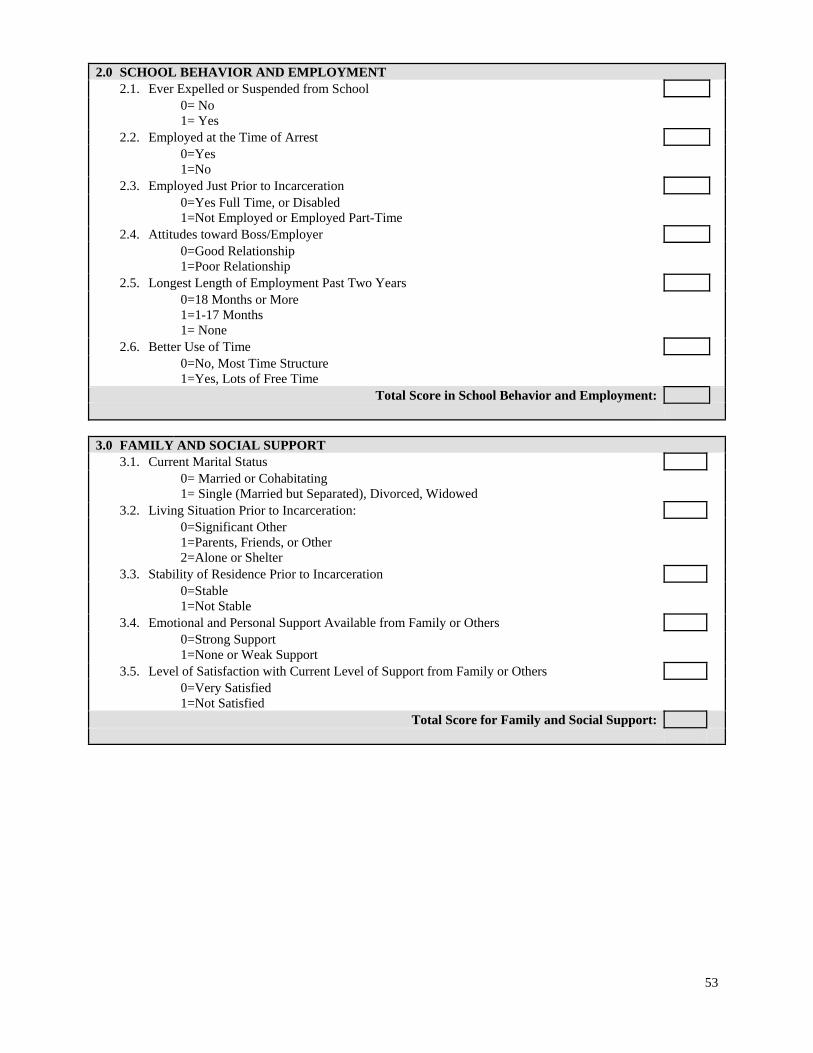
53
2.0 SCHOOL BEHAVIOR AND EMPLOYMENT
2.1. Ever Expelled or Suspended from School 0= No
1= Yes
2.2. Employed at the Time of Arrest 0=Yes
1=No
2.3. Employed Just Prior to Incarceration 0=Yes Full Time, or Disabled
1=Not Employed or Employed Part-Time
2.4. Attitudes toward Boss/Employer 0=Good Relationship
1=Poor Relationship
2.5. Longest Length of Employment Past Two Years 0=18 Months or More
1=1-17 Months 1= None
2.6. Better Use of Time 0=No, Most Time Structure
1=Yes, Lots of Free Time
Total Score in School Behavior and Employment:
3.0 FAMILY AND SOCIAL SUPPORT
3.1. Current Marital Status 0= Married or Cohabitating
1= Single (Married but Separated), Divorced, Widowed
3.2. Living Situation Prior to Incarceration: 0=Significant Other
1=Parents, Friends, or Other 2=Alone or Shelter
3.3. Stability of Residence Prior to Incarceration 0=Stable
1=Not Stable
3.4. Emotional and Personal Support Available from Family or Others 0=Strong Support
1=None or Weak Support
3.5. Level of Satisfaction with Current Level of Support from Family or Others 0=Very Satisfied
1=Not Satisfied
Total Score for Family and Social Support:
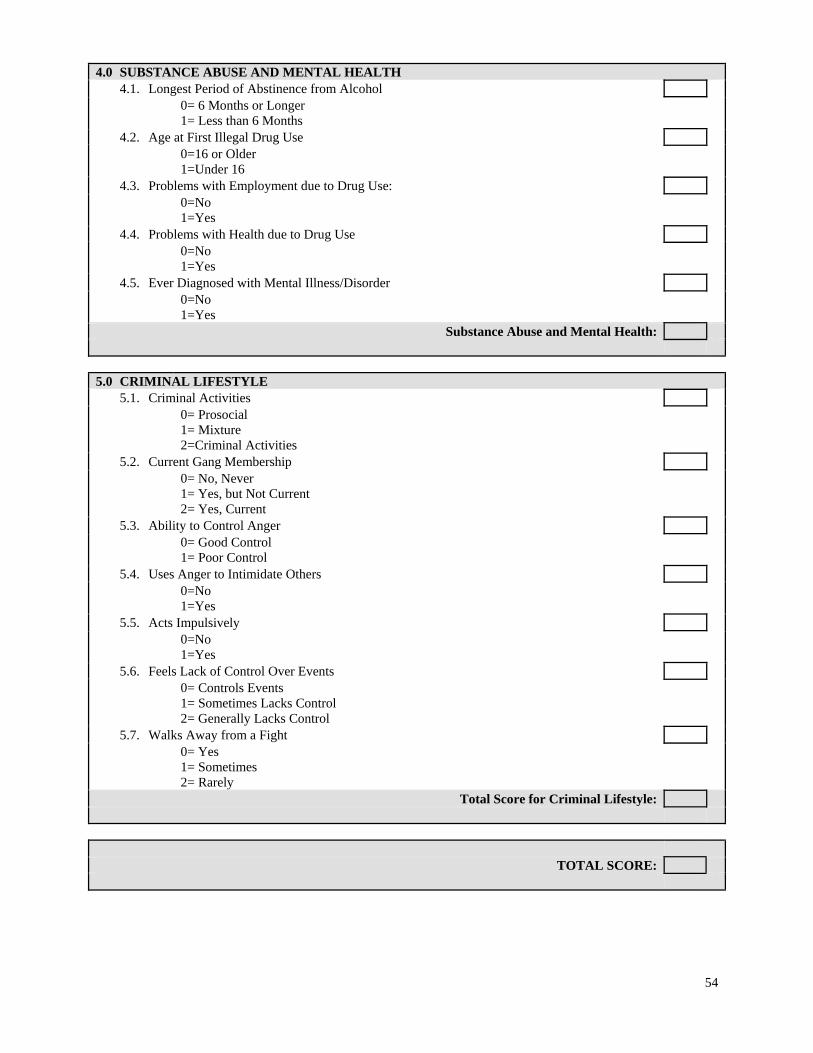
54
4.0 SUBSTANCE ABUSE AND MENTAL HEALTH
4.1. Longest Period of Abstinence from Alcohol 0= 6 Months or Longer
1= Less than 6 Months
4.2. Age at First Illegal Drug Use 0=16 or Older
1=Under 16
4.3. Problems with Employment due to Drug Use: 0=No
1=Yes
4.4. Problems with Health due to Drug Use 0=No
1=Yes
4.5. Ever Diagnosed with Mental Illness/Disorder 0=No
1=Yes
Substance Abuse and Mental Health:
5.0 CRIMINAL LIFESTYLE
5.1. Criminal Activities 0= Prosocial
1= Mixture 2=Criminal Activities
5.2. Current Gang Membership 0= No, Never
1= Yes, but Not Current 2= Yes, Current
5.3. Ability to Control Anger 0= Good Control
1= Poor Control
5.4. Uses Anger to Intimidate Others 0=No
1=Yes
5.5. Acts Impulsively 0=No
1=Yes
5.6. Feels Lack of Control Over Events 0= Controls Events
1= Sometimes Lacks Control 2= Generally Lacks Control
5.7. Walks Away from a Fight 0= Yes
1= Sometimes 2= Rarely
Total Score for Criminal Lifestyle:
TOTAL SCORE:
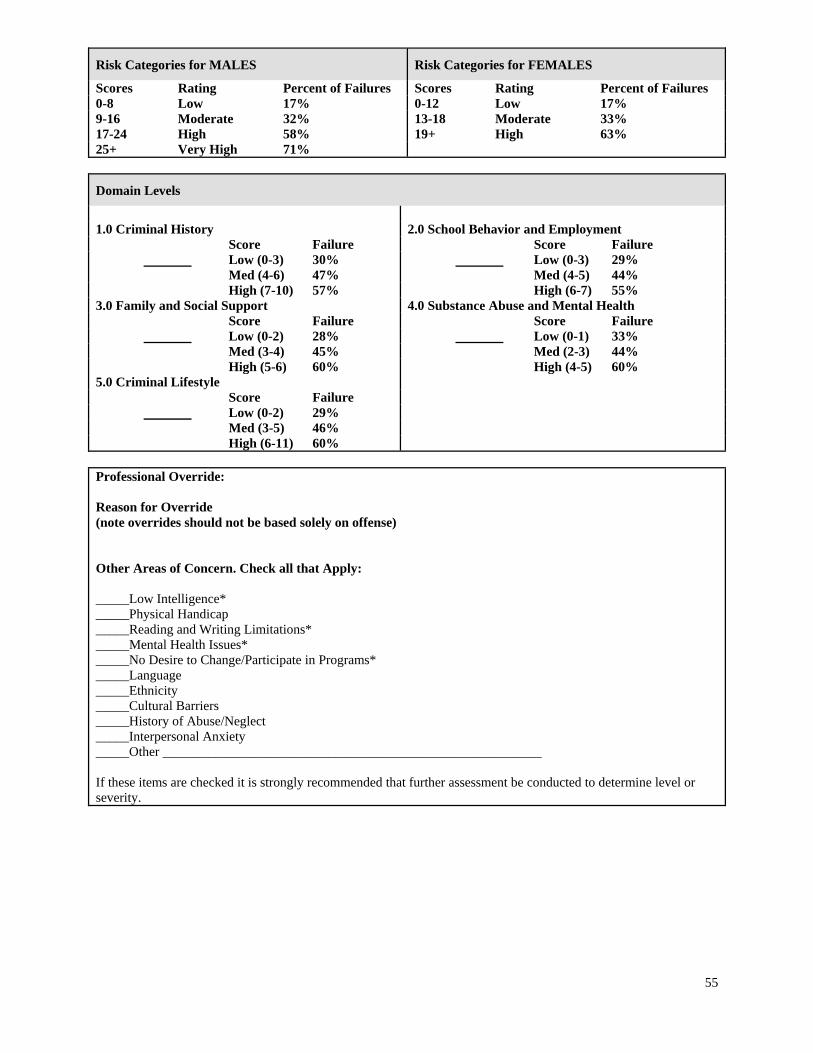
55
Risk Categories for MALES Risk Categories for FEMALES
Scores Rating Percent of Failures Scores Rating Percent of Failures0-8 Low 17% 0-12 Low 17% 9-16 Moderate 32% 13-18 Moderate 33% 17-24 High 58% 19+ High 63% 25+ Very High 71%
Domain Levels
1.0 Criminal History 2.0 School Behavior and Employment Score Failure Score Failure Low (0-3) 30% Low (0-3) 29% Med (4-6) 47% Med (4-5) 44% High (7-10) 57% High (6-7) 55% 3.0 Family and Social Support 4.0 Substance Abuse and Mental Health Score Failure Score Failure Low (0-2) 28% Low (0-1) 33% Med (3-4) 45% Med (2-3) 44% High (5-6) 60% High (4-5) 60% 5.0 Criminal Lifestyle Score Failure Low (0-2) 29% Med (3-5) 46% High (6-11) 60% Professional Override:
Reason for Override (note overrides should not be based solely on offense) Other Areas of Concern. Check all that Apply: _____Low Intelligence* _____Physical Handicap _____Reading and Writing Limitations* _____Mental Health Issues* _____No Desire to Change/Participate in Programs* _____Language _____Ethnicity _____Cultural Barriers _____History of Abuse/Neglect _____Interpersonal Anxiety _____Other _________________________________________________________ If these items are checked it is strongly recommended that further assessment be conducted to determine level or severity.
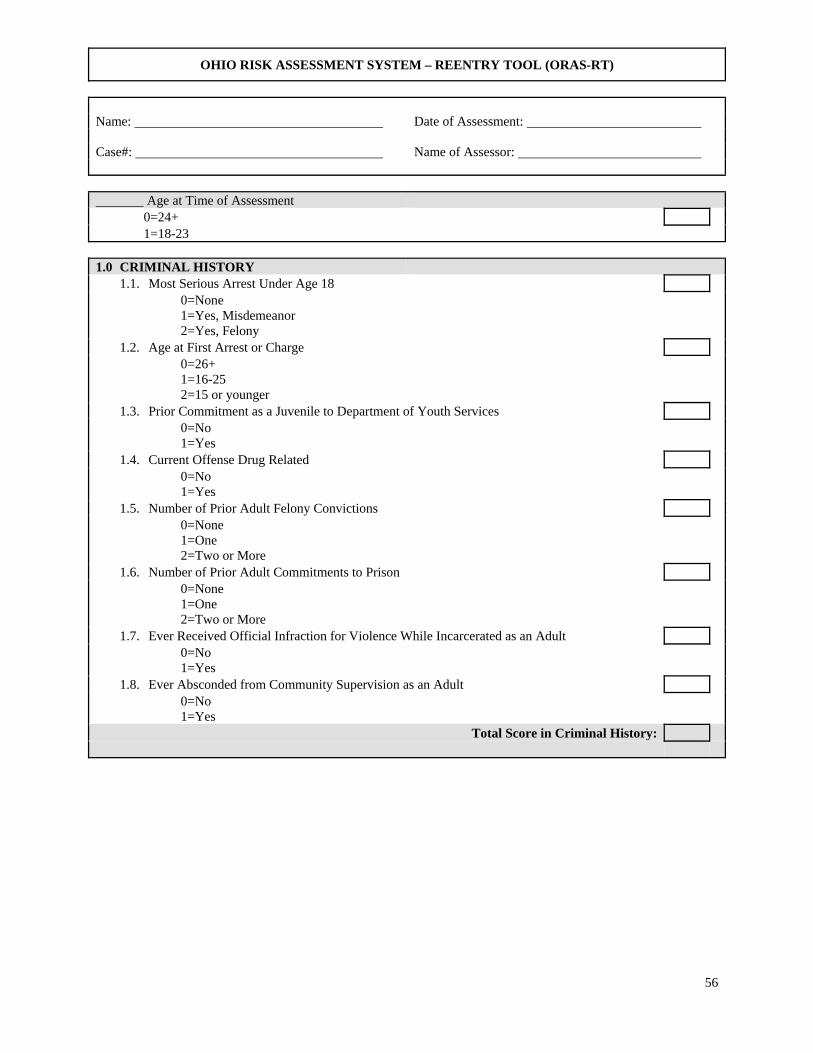
56
OHIO RISK ASSESSMENT SYSTEM – REENTRY TOOL (ORAS-RT)
Name: Date of Assessment: Case#: Name of Assessor: Age at Time of Assessment 0=24+ 1=18-23 1.0 CRIMINAL HISTORY
1.1. Most Serious Arrest Under Age 18 0=None
1=Yes, Misdemeanor 2=Yes, Felony
1.2. Age at First Arrest or Charge 0=26+
1=16-25 2=15 or younger
1.3. Prior Commitment as a Juvenile to Department of Youth Services 0=No
1=Yes
1.4. Current Offense Drug Related 0=No
1=Yes
1.5. Number of Prior Adult Felony Convictions 0=None
1=One 2=Two or More
1.6. Number of Prior Adult Commitments to Prison 0=None
1=One 2=Two or More
1.7. Ever Received Official Infraction for Violence While Incarcerated as an Adult 0=No
1=Yes
1.8. Ever Absconded from Community Supervision as an Adult 0=No
1=Yes
Total Score in Criminal History:
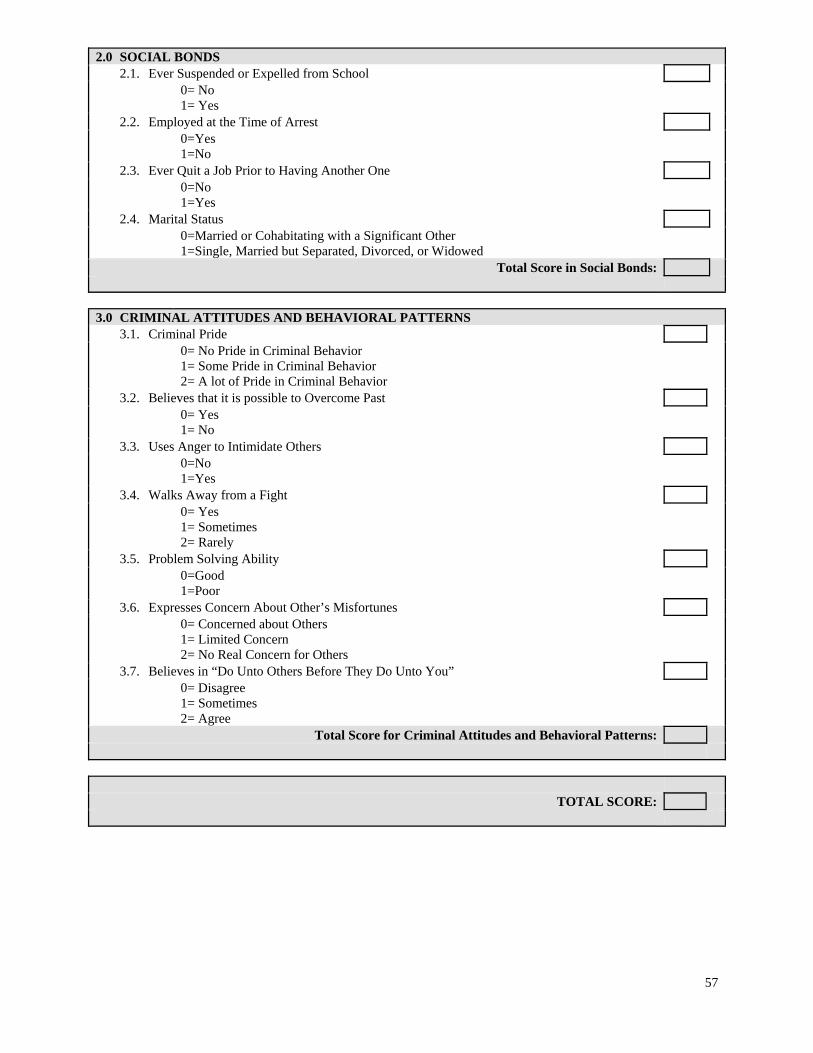
57
2.0 SOCIAL BONDS 2.1. Ever Suspended or Expelled from School
0= No 1= Yes
2.2. Employed at the Time of Arrest 0=Yes
1=No
2.3. Ever Quit a Job Prior to Having Another One 0=No
1=Yes
2.4. Marital Status 0=Married or Cohabitating with a Significant Other
1=Single, Married but Separated, Divorced, or Widowed
Total Score in Social Bonds:
3.0 CRIMINAL ATTITUDES AND BEHAVIORAL PATTERNS
3.1. Criminal Pride 0= No Pride in Criminal Behavior
1= Some Pride in Criminal Behavior 2= A lot of Pride in Criminal Behavior
3.2. Believes that it is possible to Overcome Past 0= Yes
1= No
3.3. Uses Anger to Intimidate Others 0=No
1=Yes
3.4. Walks Away from a Fight 0= Yes
1= Sometimes 2= Rarely
3.5. Problem Solving Ability 0=Good
1=Poor
3.6. Expresses Concern About Other’s Misfortunes 0= Concerned about Others
1= Limited Concern 2= No Real Concern for Others
3.7. Believes in “Do Unto Others Before They Do Unto You” 0= Disagree
1= Sometimes 2= Agree
Total Score for Criminal Attitudes and Behavioral Patterns:
TOTAL SCORE:
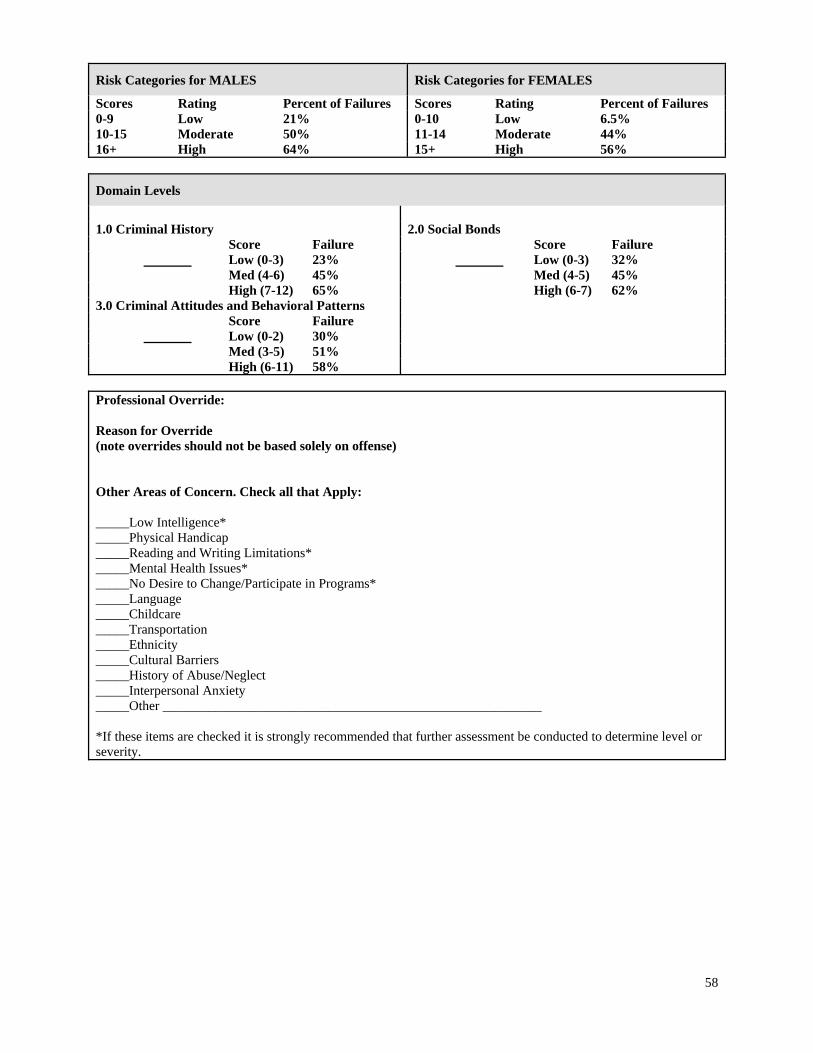
58
Risk Categories for MALES Risk Categories for FEMALES
Scores Rating Percent of Failures Scores Rating Percent of Failures0-9 Low 21% 0-10 Low 6.5% 10-15 Moderate 50% 11-14 Moderate 44% 16+ High 64% 15+ High 56%
Domain Levels
1.0 Criminal History 2.0 Social Bonds Score Failure Score Failure Low (0-3) 23% Low (0-3) 32% Med (4-6) 45% Med (4-5) 45% High (7-12) 65% High (6-7) 62% 3.0 Criminal Attitudes and Behavioral Patterns Score Failure Low (0-2) 30% Med (3-5) 51% High (6-11) 58% Professional Override:
Reason for Override (note overrides should not be based solely on offense) Other Areas of Concern. Check all that Apply: _____Low Intelligence* _____Physical Handicap _____Reading and Writing Limitations* _____Mental Health Issues* _____No Desire to Change/Participate in Programs* _____Language _____Childcare _____Transportation _____Ethnicity _____Cultural Barriers _____History of Abuse/Neglect _____Interpersonal Anxiety _____Other _________________________________________________________ *If these items are checked it is strongly recommended that further assessment be conducted to determine level or severity.
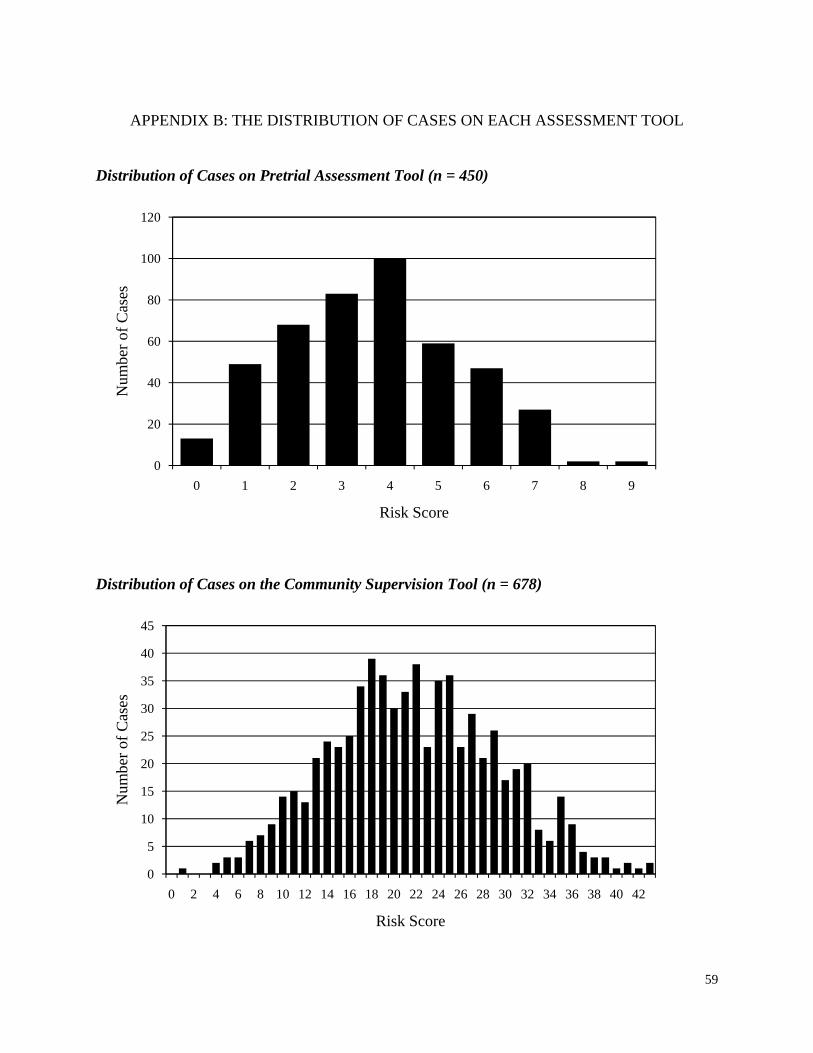
59
APPENDIX B: THE DISTRIBUTION OF CASES ON EACH ASSESSMENT TOOL
Distribution of Cases on Pretrial Assessment Tool (n = 450)
Distribution of Cases on the Community Supervision Tool (n = 678)
0
20
40
60
80
100
120
0 1 2 3 4 5 6 7 8 9
Num
ber o
f Cas
es
Risk Score
0
5
10
15
20
25
30
35
40
45
0 2 4 6 8 10 12 14 16 18 20 22 24 26 28 30 32 34 36 38 40 42
Num
ber o
f Cas
es
Risk Score
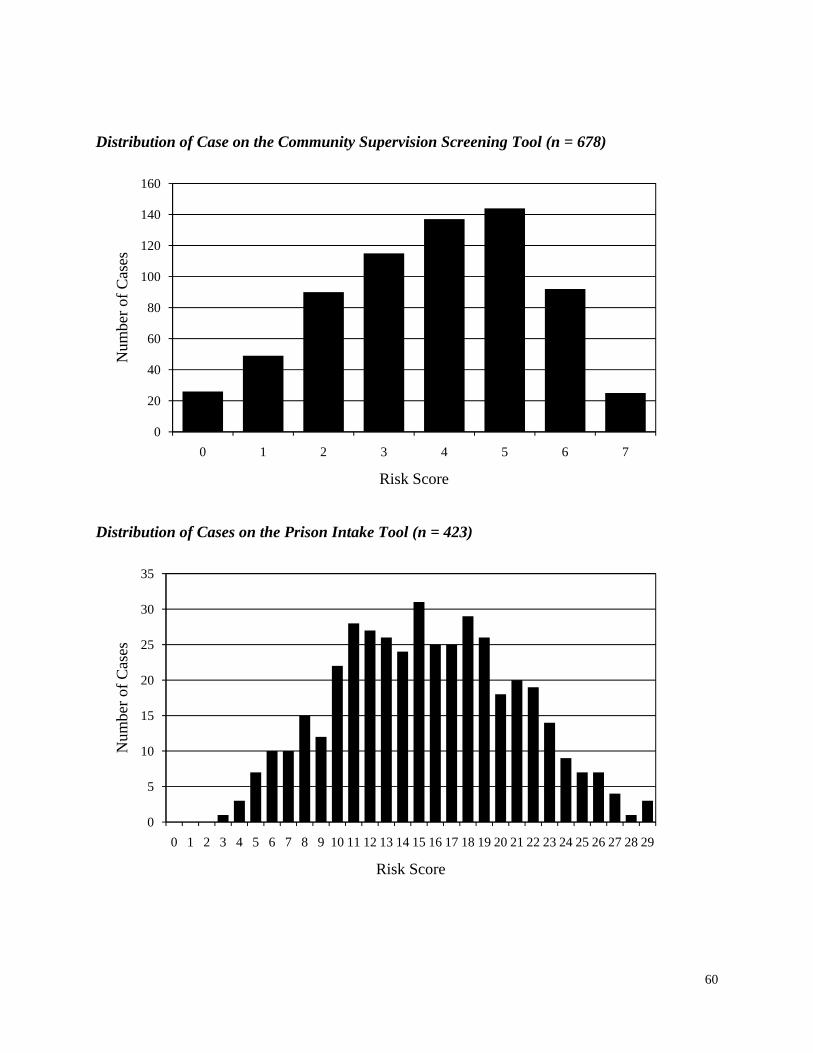
60
Distribution of Case on the Community Supervision Screening Tool (n = 678)
Distribution of Cases on the Prison Intake Tool (n = 423)
0
20
40
60
80
100
120
140
160
0 1 2 3 4 5 6 7
Num
ber o
f Cas
es
Risk Score
0
5
10
15
20
25
30
35
0 1 2 3 4 5 6 7 8 9 10 11 12 13 14 15 16 17 18 19 20 21 22 23 24 25 26 27 28 29
Num
ber o
f Cas
es
Risk Score
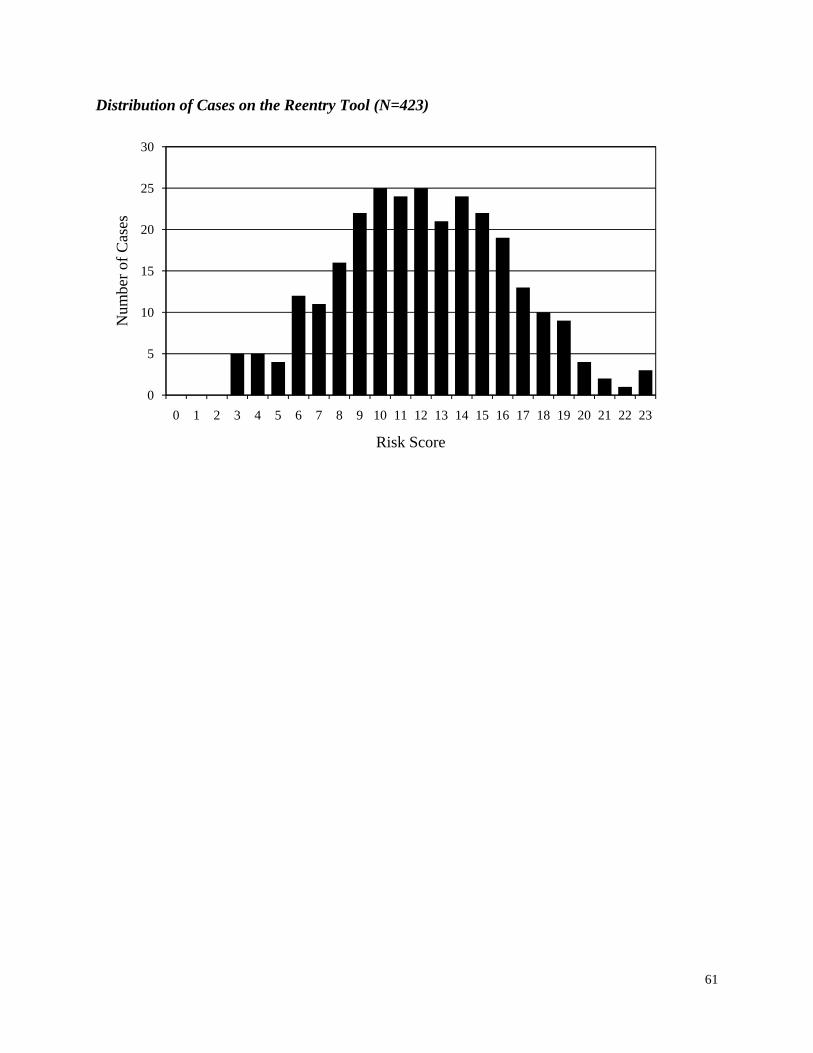
61
Distribution of Cases on the Reentry Tool (N=423)
0
5
10
15
20
25
30
0 1 2 3 4 5 6 7 8 9 10 11 12 13 14 15 16 17 18 19 20 21 22 23
Num
ber o
f Cas
es
Risk Score