Embed Size (px)
Citation preview
Oracle® Solaris Dynamic Tracing Guide
Part No: E22973November 2011 E22973_02

Copyright © 2011, 2012, Oracle and/or its affiliates. All rights reserved.
This software and related documentation are provided under a license agreement containing restrictions on use and disclosure and are protected by intellectualproperty laws. Except as expressly permitted in your license agreement or allowed by law, you may not use, copy, reproduce, translate, broadcast, modify, license,transmit, distribute, exhibit, perform, publish or display any part, in any form, or by any means. Reverse engineering, disassembly, or decompilation of this software,unless required by law for interoperability, is prohibited.
The information contained herein is subject to change without notice and is not warranted to be error-free. If you find any errors, please report them to us in writing.
If this is software or related documentation that is delivered to the U.S. Government or anyone licensing it on behalf of the U.S. Government, the following notice isapplicable:
U.S. GOVERNMENT RIGHTS
Programs, software, databases, and related documentation and technical data delivered to U.S. Government customers are "commercial computer software" or"commercial technical data" pursuant to the applicable Federal Acquisition Regulation and agency-specific supplemental regulations. As such, the use, duplication,disclosure, modification, and adaptation shall be subject to the restrictions and license terms set forth in the applicable Government contract, and, to the extentapplicable by the terms of the Government contract, the additional rights set forth in FAR 52.227-19, Commercial Computer Software License (December 2007).Oracle America, Inc., 500 Oracle Parkway, Redwood City, CA 94065.
This software or hardware is developed for general use in a variety of information management applications. It is not developed or intended for use in any inherentlydangerous applications, including applications that may create a risk of personal injury. If you use this software or hardware in dangerous applications, then you shallbe responsible to take all appropriate fail-safe, backup, redundancy, and other measures to ensure its safe use. Oracle Corporation and its affiliates disclaim anyliability for any damages caused by use of this software or hardware in dangerous applications.
Oracle and Java are registered trademarks of Oracle and/or its affiliates. Other names may be trademarks of their respective owners.
Intel and Intel Xeon are trademarks or registered trademarks of Intel Corporation. All SPARC trademarks are used under license and are trademarks or registeredtrademarks of SPARC International, Inc. AMD, Opteron, the AMD logo, and the AMD Opteron logo are trademarks or registered trademarks of Advanced MicroDevices. UNIX is a registered trademark of The Open Group.
This software or hardware and documentation may provide access to or information on content, products, and services from third parties. Oracle Corporation andits affiliates are not responsible for and expressly disclaim all warranties of any kind with respect to third-party content, products, and services. Oracle Corporationand its affiliates will not be responsible for any loss, costs, or damages incurred due to your access to or use of third-party content, products, or services.
Ce logiciel et la documentation qui l’accompagne sont protégés par les lois sur la propriété intellectuelle. Ils sont concédés sous licence et soumis à des restrictionsd’utilisation et de divulgation. Sauf disposition de votre contrat de licence ou de la loi, vous ne pouvez pas copier, reproduire, traduire, diffuser, modifier, breveter,transmettre, distribuer, exposer, exécuter, publier ou afficher le logiciel, même partiellement, sous quelque forme et par quelque procédé que ce soit. Par ailleurs, il estinterdit de procéder à toute ingénierie inverse du logiciel, de le désassembler ou de le décompiler, excepté à des fins d’interopérabilité avec des logiciels tiers ou tel queprescrit par la loi.
Les informations fournies dans ce document sont susceptibles de modification sans préavis. Par ailleurs, Oracle Corporation ne garantit pas qu’elles soient exemptesd’erreurs et vous invite, le cas échéant, à lui en faire part par écrit.
Si ce logiciel, ou la documentation qui l’accompagne, est concédé sous licence au Gouvernement des Etats-Unis, ou à toute entité qui délivre la licence de ce logicielou l’utilise pour le compte du Gouvernement des Etats-Unis, la notice suivante s’applique :
U.S. GOVERNMENT RIGHTS. Programs, software, databases, and related documentation and technical data delivered to U.S. Government customers are"commercial computer software" or "commercial technical data" pursuant to the applicable Federal Acquisition Regulation and agency-specific supplementalregulations. As such, the use, duplication, disclosure, modification, and adaptation shall be subject to the restrictions and license terms set forth in the applicableGovernment contract, and, to the extent applicable by the terms of the Government contract, the additional rights set forth in FAR 52.227-19, CommercialComputer Software License (December 2007). Oracle America, Inc., 500 Oracle Parkway, Redwood City, CA 94065.
Ce logiciel ou matériel a été développé pour un usage général dans le cadre d’applications de gestion des informations. Ce logiciel ou matériel n’est pas conçu ni n’estdestiné à être utilisé dans des applications à risque, notamment dans des applications pouvant causer des dommages corporels. Si vous utilisez ce logiciel ou matérieldans le cadre d’applications dangereuses, il est de votre responsabilité de prendre toutes les mesures de secours, de sauvegarde, de redondance et autres mesuresnécessaires à son utilisation dans des conditions optimales de sécurité. Oracle Corporation et ses affiliés déclinent toute responsabilité quant aux dommages causéspar l’utilisation de ce logiciel ou matériel pour ce type d’applications.
Oracle et Java sont des marques déposées d’Oracle Corporation et/ou de ses affiliés.Tout autre nom mentionné peut correspondre à des marques appartenant àd’autres propriétaires qu’Oracle.
AMD, Opteron, le logo AMD et le logo AMD Opteron sont des marques ou des marques déposées d’Advanced Micro Devices. Intel et Intel Xeon sont des marques oudes marques déposées d’Intel Corporation. Toutes les marques SPARC sont utilisées sous licence et sont des marques ou des marques déposées de SPARCInternational, Inc. UNIX est une marque déposée concédé sous license par X/Open Company, Ltd.
120305@25097
Contents
Preface ...................................................................................................................................................13
1 About DTrace ........................................................................................................................................17Getting Started ..................................................................................................................................... 17Providers and Probes .......................................................................................................................... 19
2 D Programming Language .................................................................................................................23D Program Structure ........................................................................................................................... 23
Probe Clauses and Declarations ................................................................................................. 23Probe Descriptions ...................................................................................................................... 24Predicates ...................................................................................................................................... 25Actions .......................................................................................................................................... 26Order of Execution ...................................................................................................................... 26Use of the C Preprocessor ........................................................................................................... 26
Compilation and Instrumentation .................................................................................................... 27Variables and Arithmetic Expressions .............................................................................................. 28Predicates ............................................................................................................................................. 31Output Formatting .............................................................................................................................. 34Arrays .................................................................................................................................................... 37External Symbols and Types .............................................................................................................. 39Types, Operators, and Expressions ................................................................................................... 40
Identifier Names and Keywords ................................................................................................. 40Data Types and Sizes ................................................................................................................... 41Constants ...................................................................................................................................... 43Arithmetic Operators .................................................................................................................. 44Relational Operators .................................................................................................................... 45Logical Operators ......................................................................................................................... 46
3
Bitwise Operators ......................................................................................................................... 47Assignment Operators ................................................................................................................ 48Increment and Decrement Operators ....................................................................................... 48Conditional Expressions ............................................................................................................. 49Type Conversions ........................................................................................................................ 50Precedence .................................................................................................................................... 51
Variables ............................................................................................................................................... 52Scalar Variables ............................................................................................................................ 53Associative Arrays ........................................................................................................................ 54Thread-Local Variables ............................................................................................................... 55Clause-Local Variables ................................................................................................................ 58Built-in Variables ......................................................................................................................... 60External Variables ........................................................................................................................ 62
Pointers and Arrays ............................................................................................................................. 63Pointers and Addresses ............................................................................................................... 63Pointer Safety ................................................................................................................................ 64Array Declarations and Storage ................................................................................................. 66Pointer and Array Relationship .................................................................................................. 67Pointer Arithmetic ....................................................................................................................... 68Generic Pointers ........................................................................................................................... 68Multi-Dimensional Arrays ......................................................................................................... 69Pointers to DTrace Objects ......................................................................................................... 69Pointers and Address Spaces ...................................................................................................... 70
Strings ................................................................................................................................................... 71String Representation .................................................................................................................. 71String Constants ........................................................................................................................... 72String Assignment ........................................................................................................................ 72String Conversion ........................................................................................................................ 72String Comparison ...................................................................................................................... 73
Structs and Unions .............................................................................................................................. 74Structs ............................................................................................................................................ 74Pointers to Structs ........................................................................................................................ 76Unions ........................................................................................................................................... 79Member Sizes and Offsets ........................................................................................................... 82Bit-Fields ....................................................................................................................................... 83
Type and Constant Definitions .......................................................................................................... 84
Contents
Oracle Solaris Dynamic Tracing Guide • November 2011 E22973_024
typedef ......................................................................................................................................... 84Enumerations ............................................................................................................................... 84Inlines ............................................................................................................................................ 86Type Namespaces ......................................................................................................................... 87
3 Aggregations ........................................................................................................................................89Aggregating Functions ........................................................................................................................ 89Aggregations ........................................................................................................................................ 90Printing Aggregations ......................................................................................................................... 98Data Normalization ............................................................................................................................ 98Clearing Aggregations ...................................................................................................................... 102Truncating aggregations ................................................................................................................... 102Minimizing Drops ............................................................................................................................. 104
4 Actions and Subroutines ..................................................................................................................105Actions ................................................................................................................................................ 105Default Action .................................................................................................................................... 105Data Recording Actions .................................................................................................................... 106
trace ........................................................................................................................................... 106tracemem ..................................................................................................................................... 107printf ......................................................................................................................................... 107printa ......................................................................................................................................... 107stack ........................................................................................................................................... 108ustack ......................................................................................................................................... 109jstack ......................................................................................................................................... 113uaddr ........................................................................................................................................... 113usym .............................................................................................................................................. 114
Destructive Actions ........................................................................................................................... 114Process Destructive Actions ..................................................................................................... 114Kernel Destructive Actions ....................................................................................................... 117
Special Actions ................................................................................................................................... 120Speculative Actions .................................................................................................................... 120exit .............................................................................................................................................. 120
Subroutines ........................................................................................................................................ 120alloca ......................................................................................................................................... 120
Contents
5
basename ..................................................................................................................................... 121bcopy ........................................................................................................................................... 121cleanpath ................................................................................................................................... 121copyin ......................................................................................................................................... 121copyinstr ................................................................................................................................... 122copyinto ..................................................................................................................................... 122dirname ....................................................................................................................................... 122inet_ntoa ................................................................................................................................... 122inet_ntoa6 ................................................................................................................................. 123inet_ntop ................................................................................................................................... 123msgdsize ..................................................................................................................................... 123msgsize ....................................................................................................................................... 123mutex_owned ............................................................................................................................... 124mutex_owner ............................................................................................................................... 124mutex_type_adaptive .............................................................................................................. 124progenyof ................................................................................................................................... 124rand .............................................................................................................................................. 124rw_iswriter ............................................................................................................................... 125rw_write_held ........................................................................................................................... 125speculation ............................................................................................................................... 125strjoin ....................................................................................................................................... 125strlen ......................................................................................................................................... 125
5 Buffers and Buffering ........................................................................................................................127Principal Buffers ................................................................................................................................ 127Principal Buffer Policies .................................................................................................................... 127
switch Policy .............................................................................................................................. 128fill Policy .................................................................................................................................. 128fill Policy and END Probes ....................................................................................................... 129ring Policy .................................................................................................................................. 129
Other Buffers ...................................................................................................................................... 130Buffer Sizes ......................................................................................................................................... 130Buffer Resizing Policy ....................................................................................................................... 131
Contents
Oracle Solaris Dynamic Tracing Guide • November 2011 E22973_026
6 Output Formatting ............................................................................................................................133printf ................................................................................................................................................. 133
Conversion Specifications ........................................................................................................ 134Flag Specifiers ............................................................................................................................. 134Width and Precision Specifiers ................................................................................................ 135Size Prefixes ................................................................................................................................ 135Conversion Formats .................................................................................................................. 136
printa ................................................................................................................................................. 139trace Default Format ....................................................................................................................... 140
7 Speculative Tracing ...........................................................................................................................141Speculation Interfaces ....................................................................................................................... 142Creating a Speculation ...................................................................................................................... 142Using a Speculation ........................................................................................................................... 142Committing a Speculation ............................................................................................................... 143Discarding a Speculation .................................................................................................................. 143Speculation Example ......................................................................................................................... 144Speculation Options and Tuning .................................................................................................... 148
8 dtrace(1M) Utility ..............................................................................................................................149Description ......................................................................................................................................... 149Options ............................................................................................................................................... 150Operands ............................................................................................................................................ 156Exit Status ........................................................................................................................................... 156
9 Scripting ............................................................................................................................................. 157Interpreter Files ................................................................................................................................. 157Macro Variables ................................................................................................................................. 158Macro Arguments ............................................................................................................................. 160Target Process ID .............................................................................................................................. 161
10 Options and Tunables .......................................................................................................................163Consumer Options ............................................................................................................................ 163Modifying Options ............................................................................................................................ 165
Contents
7
11 Providers ............................................................................................................................................ 167dtrace Provider ................................................................................................................................. 167
BEGIN Probe ................................................................................................................................ 167END Probe .................................................................................................................................... 168ERROR Probe ................................................................................................................................ 169Stability ........................................................................................................................................ 170
lockstat Provider ............................................................................................................................ 171Overview ..................................................................................................................................... 171Adaptive Lock Probes ................................................................................................................ 171Spin Lock Probes ........................................................................................................................ 172Thread Locks .............................................................................................................................. 173Readers/Writer Lock Probes .................................................................................................... 173Stability ........................................................................................................................................ 174
profile Provider ............................................................................................................................... 175profile- n probes ..................................................................................................................... 175tick- n probes ............................................................................................................................ 177Arguments .................................................................................................................................. 177Timer Resolution ....................................................................................................................... 178Probe Creation ........................................................................................................................... 179Stability ........................................................................................................................................ 179
cpc Provider ....................................................................................................................................... 180Probes .......................................................................................................................................... 180Arguments .................................................................................................................................. 181Probe Availability ....................................................................................................................... 182Probe Creation ........................................................................................................................... 182Co-existence With Existing Tools ........................................................................................... 182Examples ..................................................................................................................................... 183Stability ........................................................................................................................................ 184
fbt Provider ....................................................................................................................................... 185Probes .......................................................................................................................................... 185Probe arguments ........................................................................................................................ 186Examples ..................................................................................................................................... 186Tail-call Optimization ............................................................................................................... 191Assembly Functions ................................................................................................................... 193Instruction Set Limitations ....................................................................................................... 193Breakpoint Interaction .............................................................................................................. 193
Contents
Oracle Solaris Dynamic Tracing Guide • November 2011 E22973_028
Module Loading ......................................................................................................................... 194Stability ........................................................................................................................................ 194
syscall Provider ............................................................................................................................... 194Probes .......................................................................................................................................... 195Arguments .................................................................................................................................. 197Stability ........................................................................................................................................ 198
sdt Provider ....................................................................................................................................... 198Probes .......................................................................................................................................... 198Examples ..................................................................................................................................... 199Creating SDT Probes ................................................................................................................. 202Stability ........................................................................................................................................ 203
mib Provider ....................................................................................................................................... 204Probes .......................................................................................................................................... 204Arguments .................................................................................................................................. 218Stability ........................................................................................................................................ 219
fpuinfo Provider ............................................................................................................................... 219Probes .......................................................................................................................................... 219Arguments .................................................................................................................................. 221Stability ........................................................................................................................................ 221
pid Provider ....................................................................................................................................... 222Naming pid Probes .................................................................................................................... 222Function Boundary Probes ....................................................................................................... 223Function Offset Probes .............................................................................................................. 223Stability ........................................................................................................................................ 224
plockstat Provider .......................................................................................................................... 224Overview ..................................................................................................................................... 224Mutex Probes .............................................................................................................................. 225Reader/Writer Lock Probes ...................................................................................................... 226Stability ........................................................................................................................................ 226
fasttrap Provider ............................................................................................................................ 227Probes .......................................................................................................................................... 227Stability ........................................................................................................................................ 227
sysinfo Provider ............................................................................................................................... 227Probes .......................................................................................................................................... 227Arguments .................................................................................................................................. 230Example ....................................................................................................................................... 234
Contents
9
Stability ........................................................................................................................................ 235vminfo Provider ................................................................................................................................. 236
Probes .......................................................................................................................................... 236Arguments .................................................................................................................................. 238Example ....................................................................................................................................... 239Stability ........................................................................................................................................ 242
proc Provider ..................................................................................................................................... 242Probes .......................................................................................................................................... 242Arguments .................................................................................................................................. 244lwpsinfo_t ................................................................................................................................. 245psinfo_t ..................................................................................................................................... 248Examples ..................................................................................................................................... 249Stability ........................................................................................................................................ 254
sched Provider ................................................................................................................................... 255Probes .......................................................................................................................................... 255Arguments .................................................................................................................................. 258cpuinfo_t ................................................................................................................................... 258Examples ..................................................................................................................................... 259Stability ........................................................................................................................................ 284
io Provider ......................................................................................................................................... 284Probes .......................................................................................................................................... 284Arguments .................................................................................................................................. 285bufinfo_t structure .................................................................................................................. 286devinfo_t ................................................................................................................................... 287fileinfo_t ................................................................................................................................. 288Examples ..................................................................................................................................... 289Stability ........................................................................................................................................ 299
Protocols ............................................................................................................................................. 300ip Provider .................................................................................................................................. 300iscsi Provider ........................................................................................................................... 308nfsv3 Provider ........................................................................................................................... 314nfsv4 Provider ........................................................................................................................... 324srp Provider ................................................................................................................................ 336tcp Provider ................................................................................................................................ 343udp Provider ................................................................................................................................ 355
Contents
Oracle Solaris Dynamic Tracing Guide • November 2011 E22973_0210
12 User Process Tracing ..........................................................................................................................361copyin and copyinstr Subroutines ................................................................................................ 361
Avoiding Errors .......................................................................................................................... 362Eliminating dtrace(1M) Interference ............................................................................................ 363syscall Provider ............................................................................................................................... 363ustack Action .................................................................................................................................... 364uregs[] Array .................................................................................................................................... 366pid Provider ....................................................................................................................................... 368
User Function Boundary Tracing ............................................................................................ 368Tracing Arbitrary Instructions ................................................................................................. 370
13 Statically Defined Tracing for User Applications .......................................................................... 373Choosing the Probe Points ............................................................................................................... 373Adding Probes to an Application ..................................................................................................... 374
Defining Providers and Probes ................................................................................................. 374Adding Probes to Application Code ........................................................................................ 375Building Applications with Probes .......................................................................................... 375
14 Security ............................................................................................................................................... 377Privileges ............................................................................................................................................. 377Privileged Use of DTrace .................................................................................................................. 378dtrace_proc Privilege ...................................................................................................................... 378dtrace_user Privilege ...................................................................................................................... 379dtrace_kernel Privilege .................................................................................................................. 380Super User Privileges ........................................................................................................................ 380
15 Anonymous Tracing ...........................................................................................................................381Anonymous Enablings ..................................................................................................................... 381Claiming Anonymous State ............................................................................................................. 382Anonymous Tracing Examples ....................................................................................................... 382
16 Postmortem Tracing ..........................................................................................................................385Displaying DTrace Consumers ....................................................................................................... 385Displaying Trace Data ...................................................................................................................... 386
Contents
11
17 Performance Considerations ...........................................................................................................389Limit Enabled Probes ........................................................................................................................ 389Use Aggregations ............................................................................................................................... 390Use Cacheable Predicates ................................................................................................................. 390
18 Stability .............................................................................................................................................. 393Stability Levels ................................................................................................................................... 393Dependency Classes .......................................................................................................................... 395Interface Attributes ........................................................................................................................... 396USDT Interfaces ................................................................................................................................ 397Stability Computations and Reports ............................................................................................... 397Stability Enforcement ....................................................................................................................... 400
19 Translators ......................................................................................................................................... 401Translator Declarations .................................................................................................................... 401Translate Operator ............................................................................................................................ 403Process Model Translators ............................................................................................................... 404Stable Translations ............................................................................................................................ 405
20 Versioning .......................................................................................................................................... 407Versions and Releases ....................................................................................................................... 407Versioning Options ........................................................................................................................... 408Provider Versioning .......................................................................................................................... 409
Contents
Oracle Solaris Dynamic Tracing Guide • November 2011 E22973_0212
Preface
The Oracle Solaris Dynamic Tracing Guide describes how to use DTrace. It also describes theDTrace providers in detail. Most of the information present in this document is generic to allreleases of the Oracle Solaris operating system.
Note –
■ This Oracle Solaris release supports systems that use the SPARC and x86 families ofprocessor architectures: UltraSPARC, SPARC64, AMD64, Pentium, and Xeon EM64T. Thesupported systems appear in the Oracle Solaris 10 Hardware Compatibility List athttp://download.oracle.com/docs/cd/E19253-01/816-2419/index.html. Thisdocument cites any implementation differences between the platform types.
■ In this document the term x86 refers to 64–bit and 32–bit systems manufactured usingprocessors compatible with the AMD64 or Intel Xeon/Pentium product families. Forsupported systems, see the Oracle Solaris 10 Hardware Compatibility List.
Who Should Use This BookThis book is for any one who needs to understand the behavior of your system. DTrace allowsyou to explore your system to understand how it works, track down performance problemsacross many layers of software, or locate the cause of aberrant behavior.
DTrace allows all Oracle Solaris users to:
■ Dynamically enable and manage thousands of probes■ Dynamically associate logical predicates and actions with probes
13
■ Dynamically manage trace buffers and buffer policies■ Display and examine trace data from the live system or a crash dump
DTrace allows Oracle Solaris developers and administrators to:■ Implement custom scripts that use the DTrace facility■ Implement layered tools that use DTrace to retrieve trace data
This guide will teach you everything you need to know about using DTrace. Basic familiaritywith a programming language such as C or a scripting language such as awk(1) or perl(1) willhelp you learn DTrace and the D programming language faster, but you need not be an expertin any of these areas.
How This Book Is OrganizedThe DTrace User Guide contains the following topics:■ Chapter 1, “About DTrace,” provides an overview of DTrace.■ Chapter 2, “D Programming Language,” explains the D programming language.■ Chapter 3, “Aggregations,” explains how to aggregate the data provided by the probes.■ Chapter 4, “Actions and Subroutines,” describes the actions and subroutines supported by
DTrace.■ Chapter 5, “Buffers and Buffering,” describes the data buffering and management service
provided by DTrace.■ Chapter 6, “Output Formatting,” explains how to format the output of D programs.■ Chapter 7, “Speculative Tracing,” describes the speculative tracing facility provided by
DTrace.■ Chapter 8, “dtrace(1M) Utility,” describes the options supported by the dtrace command.■ Chapter 9, “Scripting,” explains how to create interpreter files by using D programs. The
interpreter files are similar to shell scripts that you can install as reusable interactive DTracetools.
■ Chapter 10, “Options and Tunables,” explains the options and tuning parameters supportedby the dtrace command.
■ Chapter 11, “Providers,” describes the providers supported by DTrace.■ Chapter 12, “User Process Tracing,” explains how to use DTrace to understand the behavior
of user processes.■ Chapter 13, “Statically Defined Tracing for User Applications,” explains how to develop
customized probes.■ Chapter 14, “Security,” describes the security aspects of DTrace.■ Chapter 15, “Anonymous Tracing,” describes anonymous tracing.
Preface
Oracle Solaris Dynamic Tracing Guide • November 2011 E22973_0214
■ Chapter 16, “Postmortem Tracing,” explains how to extract and process the in-kernel dataafter a system failure.
■ Chapter 17, “Performance Considerations,” explains the performance considerations thatyou need to understand when using DTrace.
■ Chapter 18, “Stability,” describes the concepts related to stability in the context of Dprograms.
■ Chapter 19, “Translators,” describes the translators supported in D programs.■ Chapter 20, “Versioning,” explains the concepts related to versioning in the context of
DTrace.
Related BooksThese books and papers are recommended and related to the tasks that you need to performwith DTrace:
■ Kernighan, Brian W. and Ritchie, Dennis M. The C Programming Language. Prentice Hall,1988. ISBN 0–13–110370–9
■ Vahalia, Uresh. UNIX Internals: The New Frontiers. Prentice Hall, 1996. ISBN0-13-101908-2
■ Mauro, Jim and McDougall, Richard. Oracle Solaris Internals: Core Kernel Components.Sun Microsystems Press, 2001. ISBN 0-13-022496-0
Access to Oracle SupportOracle customers have access to electronic support through My Oracle Support. Forinformation, visit http://www.oracle.com/pls/topic/lookup?ctx=acc&id=info or visithttp://www.oracle.com/pls/topic/lookup?ctx=acc&id=trs if you are hearing impaired.
Typographic ConventionsThe following table describes the typographic conventions that are used in this book.
TABLE P–1 Typographic Conventions
Typeface Meaning Example
AaBbCc123 The names of commands, files, and directories,and onscreen computer output
Edit your .login file.
Use ls -a to list all files.
machine_name% you have mail.
Preface
15
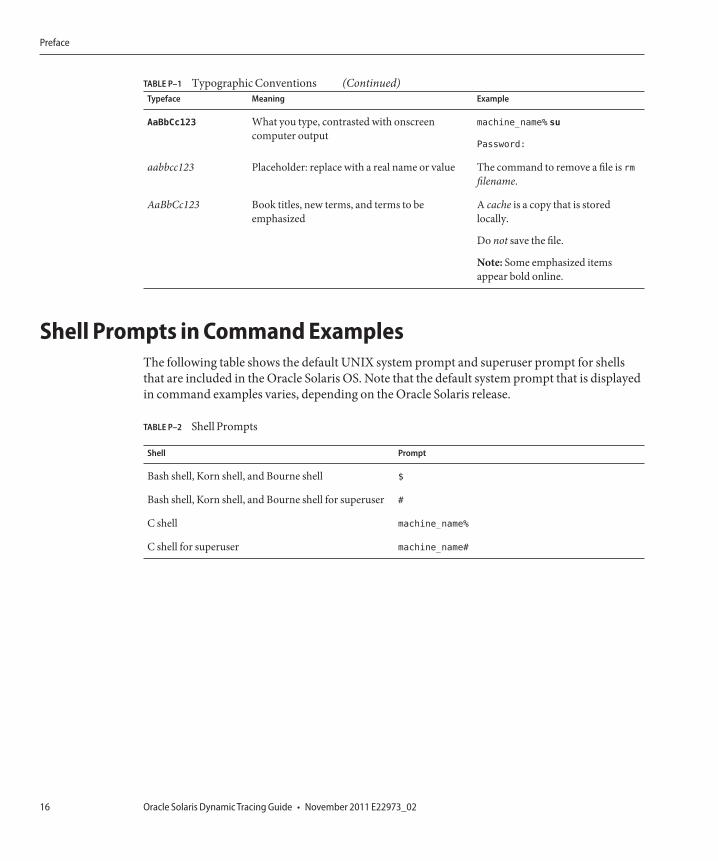
TABLE P–1 Typographic Conventions (Continued)Typeface Meaning Example
AaBbCc123 What you type, contrasted with onscreencomputer output
machine_name% su
Password:
aabbcc123 Placeholder: replace with a real name or value The command to remove a file is rmfilename.
AaBbCc123 Book titles, new terms, and terms to beemphasized
A cache is a copy that is storedlocally.
Do not save the file.
Note: Some emphasized itemsappear bold online.
Shell Prompts in Command ExamplesThe following table shows the default UNIX system prompt and superuser prompt for shellsthat are included in the Oracle Solaris OS. Note that the default system prompt that is displayedin command examples varies, depending on the Oracle Solaris release.
TABLE P–2 Shell Prompts
Shell Prompt
Bash shell, Korn shell, and Bourne shell $
Bash shell, Korn shell, and Bourne shell for superuser #
C shell machine_name%
C shell for superuser machine_name#
Preface
Oracle Solaris Dynamic Tracing Guide • November 2011 E22973_0216
About DTrace
DTrace is a comprehensive dynamic tracing facility that is built into Oracle Solaris that can beused by administrators and developers on live production systems to examine the behavior ofboth user programs and of the operating system itself. DTrace enables you to explore yoursystem to understand how it works, track down performance problems across many layers ofsoftware, or locate the cause of aberrant behavior. DTrace lets you create your own customprograms to dynamically instrument the system and provide immediate, concise answers toarbitrary questions you can formulate using the DTrace D programming language.
Getting StartedDTrace helps you understand a software system by enabling you to dynamically modify theoperating system kernel and user processes to record additional data that you specify atlocations of interest, called probes. A probe is a location or activity to which DTrace can bind arequest to perform a set of actions, like recording a stack trace, a timestamp, or the argument toa function. Probes are like programmable sensors scattered all over your Oracle Solaris systemin interesting places. If you want to figure out what's going on, you use DTrace to program theappropriate sensors to record the information that is of interest to you. Then, as each probefires, DTrace gathers the data from your probes and reports it back to you. If you don't specifyany actions for a probe, DTrace will just take note of each time the probe fires.
Every probe in DTrace has two names: a unique integer ID and a human-readable string name.We're going to start learning DTrace by building some very simple requests using the probenamed BEGIN, which fires once each time you start a new tracing request. You can use thedtrace(1M) utility's -n option to enable a probe using its string name. Type the followingcommand:
# dtrace -n BEGIN
1C H A P T E R 1
17
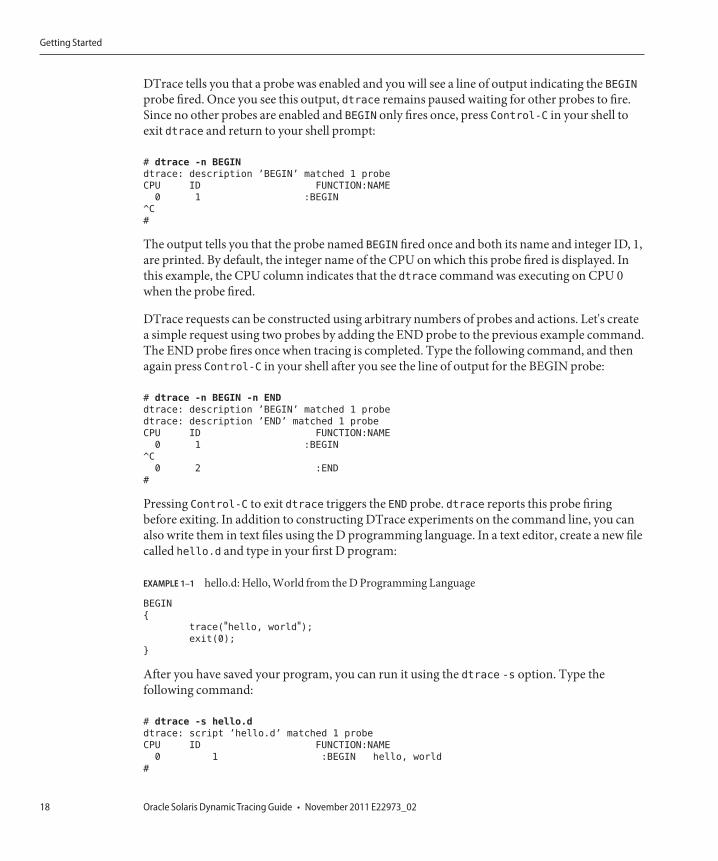
DTrace tells you that a probe was enabled and you will see a line of output indicating the BEGINprobe fired. Once you see this output, dtrace remains paused waiting for other probes to fire.Since no other probes are enabled and BEGIN only fires once, press Control-C in your shell toexit dtrace and return to your shell prompt:
# dtrace -n BEGIN
dtrace: description ’BEGIN’ matched 1 probe
CPU ID FUNCTION:NAME
0 1 :BEGIN
^C
#
The output tells you that the probe named BEGIN fired once and both its name and integer ID, 1,are printed. By default, the integer name of the CPU on which this probe fired is displayed. Inthis example, the CPU column indicates that the dtrace command was executing on CPU 0when the probe fired.
DTrace requests can be constructed using arbitrary numbers of probes and actions. Let's createa simple request using two probes by adding the END probe to the previous example command.The END probe fires once when tracing is completed. Type the following command, and thenagain press Control-C in your shell after you see the line of output for the BEGIN probe:
# dtrace -n BEGIN -n END
dtrace: description ’BEGIN’ matched 1 probe
dtrace: description ’END’ matched 1 probe
CPU ID FUNCTION:NAME
0 1 :BEGIN
^C
0 2 :END
#
Pressing Control-C to exit dtrace triggers the END probe. dtrace reports this probe firingbefore exiting. In addition to constructing DTrace experiments on the command line, you canalso write them in text files using the D programming language. In a text editor, create a new filecalled hello.d and type in your first D program:
EXAMPLE 1–1 hello.d: Hello, World from the D Programming Language
BEGIN
{
trace("hello, world");exit(0);
}
After you have saved your program, you can run it using the dtrace -s option. Type thefollowing command:
# dtrace -s hello.d
dtrace: script ’hello.d’ matched 1 probe
CPU ID FUNCTION:NAME
0 1 :BEGIN hello, world
#
Getting Started
Oracle Solaris Dynamic Tracing Guide • November 2011 E22973_0218
dtrace printed the same output as before followed by the text ”hello, world”. Unlike theprevious example, you did not have to wait and press Control-C, either. These changes were theresult of the actions you specified for your BEGIN probe in hello.d. Let's explore the structureof your D program in more detail in order to understand what happened.
Each D program consists of a series of clauses, each clause describing one or more probes toenable, and an optional set of actions to perform when the probe fires. The actions are listed as aseries of statements enclosed in braces { } following the probe name. Each statement ends with asemicolon (;). Your first statement uses the function trace to indicate that DTrace should recordthe specified argument, the string ”hello, world”, when the BEGIN probe fires, and then print itout. The second statement uses the function exit to indicate that DTrace should cease tracingand exit the dtrace command. DTrace provides a set of useful functions like trace() andexit() for you to call in your D programs. To call a function, you specify its name followed by aparenthesized list of arguments. The complete set of D functions is described in Chapter 4,“Actions and Subroutines.”
By now, if you're familiar with the C programming language, you've probably realized from thename and our examples that DTrace's D programming language is very similar to C. Indeed, Dis derived from a large subset of C combined with a special set of functions and variables to helpmake tracing easy. You'll learn more about these features in subsequent chapters. If you'vewritten a C program before, you will be able to immediately transfer most of your knowledge tobuilding tracing programs in D. If you've never written a C program before, learning D is stillvery easy. You will understand all of the syntax by the end of this chapter. But first, let's take astep back from language rules and learn more about how DTrace works, and then we'll return tolearning how to build more interesting D programs.
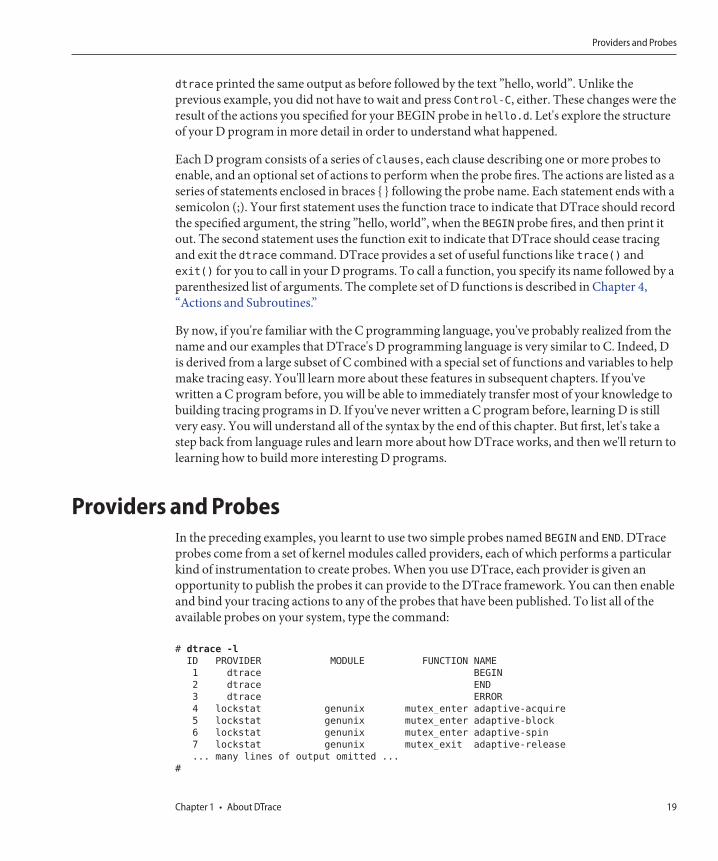
Providers and ProbesIn the preceding examples, you learnt to use two simple probes named BEGIN and END. DTraceprobes come from a set of kernel modules called providers, each of which performs a particularkind of instrumentation to create probes. When you use DTrace, each provider is given anopportunity to publish the probes it can provide to the DTrace framework. You can then enableand bind your tracing actions to any of the probes that have been published. To list all of theavailable probes on your system, type the command:
# dtrace -l
ID PROVIDER MODULE FUNCTION NAME
1 dtrace BEGIN
2 dtrace END
3 dtrace ERROR
4 lockstat genunix mutex_enter adaptive-acquire
5 lockstat genunix mutex_enter adaptive-block
6 lockstat genunix mutex_enter adaptive-spin
7 lockstat genunix mutex_exit adaptive-release
... many lines of output omitted ...
#
Providers and Probes
Chapter 1 • About DTrace 19
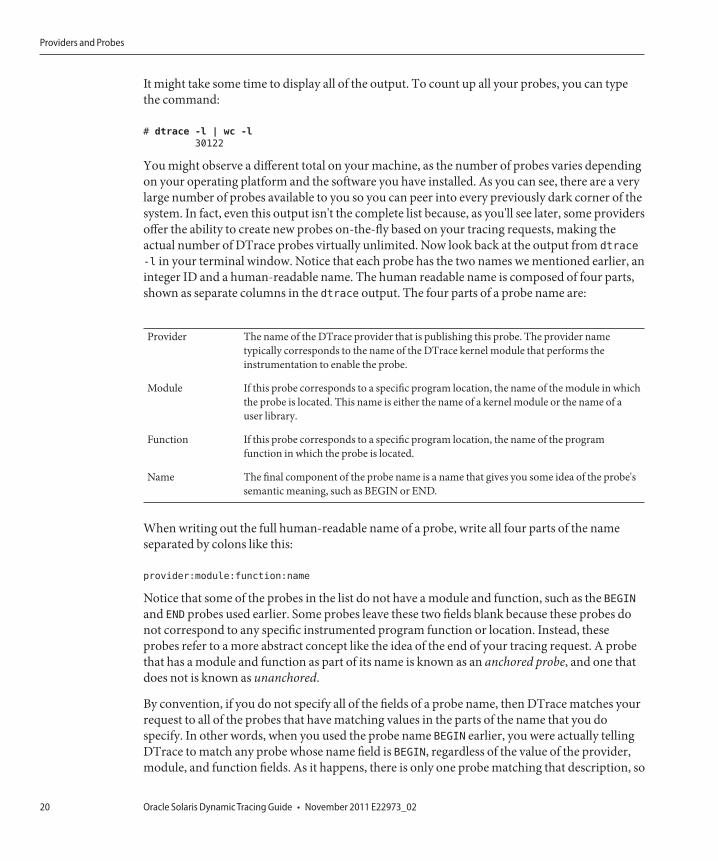
It might take some time to display all of the output. To count up all your probes, you can typethe command:
# dtrace -l | wc -l
30122
You might observe a different total on your machine, as the number of probes varies dependingon your operating platform and the software you have installed. As you can see, there are a verylarge number of probes available to you so you can peer into every previously dark corner of thesystem. In fact, even this output isn't the complete list because, as you'll see later, some providersoffer the ability to create new probes on-the-fly based on your tracing requests, making theactual number of DTrace probes virtually unlimited. Now look back at the output from dtrace
-l in your terminal window. Notice that each probe has the two names we mentioned earlier, aninteger ID and a human-readable name. The human readable name is composed of four parts,shown as separate columns in the dtrace output. The four parts of a probe name are:
Provider The name of the DTrace provider that is publishing this probe. The provider nametypically corresponds to the name of the DTrace kernel module that performs theinstrumentation to enable the probe.
Module If this probe corresponds to a specific program location, the name of the module in whichthe probe is located. This name is either the name of a kernel module or the name of auser library.
Function If this probe corresponds to a specific program location, the name of the programfunction in which the probe is located.
Name The final component of the probe name is a name that gives you some idea of the probe'ssemantic meaning, such as BEGIN or END.
When writing out the full human-readable name of a probe, write all four parts of the nameseparated by colons like this:
provider:module:function:name
Notice that some of the probes in the list do not have a module and function, such as the BEGINand END probes used earlier. Some probes leave these two fields blank because these probes donot correspond to any specific instrumented program function or location. Instead, theseprobes refer to a more abstract concept like the idea of the end of your tracing request. A probethat has a module and function as part of its name is known as an anchored probe, and one thatdoes not is known as unanchored.
By convention, if you do not specify all of the fields of a probe name, then DTrace matches yourrequest to all of the probes that have matching values in the parts of the name that you dospecify. In other words, when you used the probe name BEGIN earlier, you were actually tellingDTrace to match any probe whose name field is BEGIN, regardless of the value of the provider,module, and function fields. As it happens, there is only one probe matching that description, so
Providers and Probes
Oracle Solaris Dynamic Tracing Guide • November 2011 E22973_0220
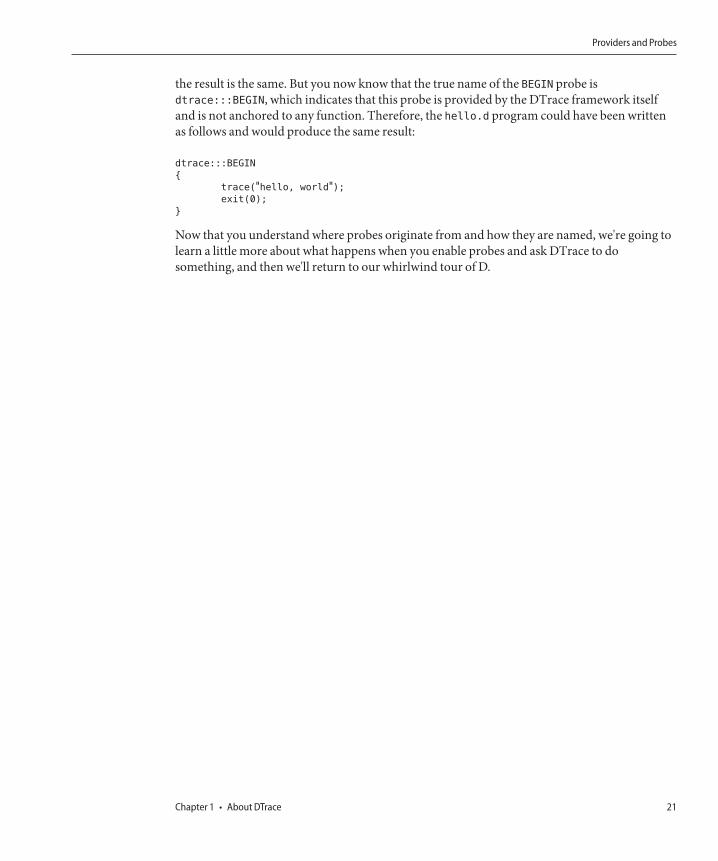
the result is the same. But you now know that the true name of the BEGIN probe isdtrace:::BEGIN, which indicates that this probe is provided by the DTrace framework itselfand is not anchored to any function. Therefore, the hello.d program could have been writtenas follows and would produce the same result:
dtrace:::BEGIN
{
trace("hello, world");exit(0);
}
Now that you understand where probes originate from and how they are named, we're going tolearn a little more about what happens when you enable probes and ask DTrace to dosomething, and then we'll return to our whirlwind tour of D.
Providers and Probes
Chapter 1 • About DTrace 21

22
D Programming Language
D is a systems programming language that allows you to interface with the operating systemAPI's and with the hardware.
D Program StructureD programs consist of a set of clauses that describe probes to enable and predicates and actionsto bind to these probes. D programs can also contain declarations of variables, as described in“Variables” on page 52, and definitions of new types, described in “Type and ConstantDefinitions” on page 84. This chapter formally describes the overall structure of a D programand features for constructing probe descriptions that match more than one probe. We'll alsodiscuss the use of the C preprocessor, cpp, with D programs.
Probe Clauses and DeclarationsAs shown in our examples so far, a D program source file consists of one or more probe clausesthat describe the instrumentation to be enabled by DTrace. Each probe clause has the generalform:
probe descriptions
/ predicate /
{
action statements
}
The predicate and list of action statements may be omitted. Any directives found outside probeclauses are referred to as declarations. Declarations may only be used outside of probe clauses.No declarations inside of the enclosing { } are permitted and declarations may not beinterspersed between the elements of the probe clause shown above. Whitespace can be used toseparate any D program elements and to indent action statements.
2C H A P T E R 2
23
Declarations can be used to declare D variables and external C symbols as discussed in“Variables” on page 52, or to define new types for use in D, as described in “Type and ConstantDefinitions” on page 84. Special D compiler directives called pragmas may also appearanywhere in a D program, including outside of probe clauses. D pragmas are specified on linesbeginning with a # character. D pragmas are used, for example, to set run-time DTrace options;see Chapter 10, “Options and Tunables,” for details.
Probe DescriptionsEvery D program clause begins with a list of one or more probe descriptions, each taking theusual form:
provider:module:function:name
If one or more fields of the probe description are omitted, the specified fields are interpretedfrom right to left by the D compiler. For example, the probe description foo:bar would match aprobe with function foo and name bar regardless of the value of the probe's provider andmodule fields. Therefore, a probe description is really more accurately viewed as a pattern thatcan be used to match one or more probes based on their names.
You should write your D probe descriptions specifying all four field delimiters so that you canspecify the desired provider on the left-hand side. If you don't specify the provider, you mightobtain unexpected results if multiple providers publish probes with the same name. Similarly,future versions of DTrace might include new providers whose probes unintentionally matchyour partially specified probe descriptions. You can specify a provider but match any of itsprobes by leaving any of the module, function, and name fields blank. For example, thedescription syscall::: can be used to match every probe published by the DTrace syscallprovider.
Probe descriptions also support a pattern matching syntax similar to the shell globbing patternmatching syntax described in sh(1). Before matching a probe to a description, DTrace scanseach description field for the characters *, ?, and [. If one of these characters appears in a probedescription field and is not preceded by a \, the field is regarded as a pattern. The descriptionpattern must match the entire corresponding field of a given probe. The complete probedescription must match on every field in order to successfully match and enable a probe. Aprobe description field that is not a pattern must exactly match the corresponding field of theprobe. A description field that is empty matches any probe.
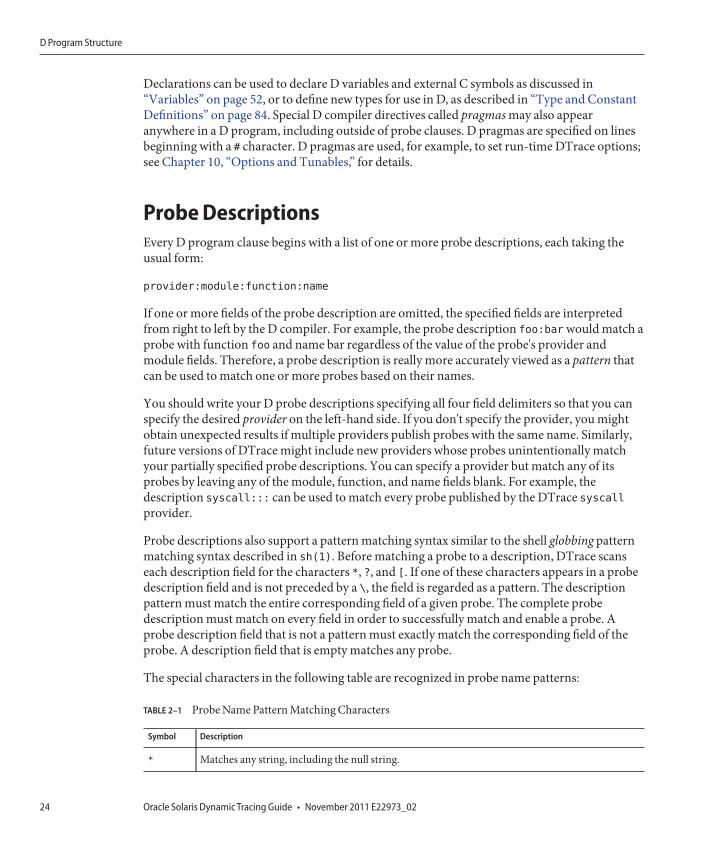
The special characters in the following table are recognized in probe name patterns:
TABLE 2–1 Probe Name Pattern Matching Characters
Symbol Description
* Matches any string, including the null string.
D Program Structure
Oracle Solaris Dynamic Tracing Guide • November 2011 E22973_0224
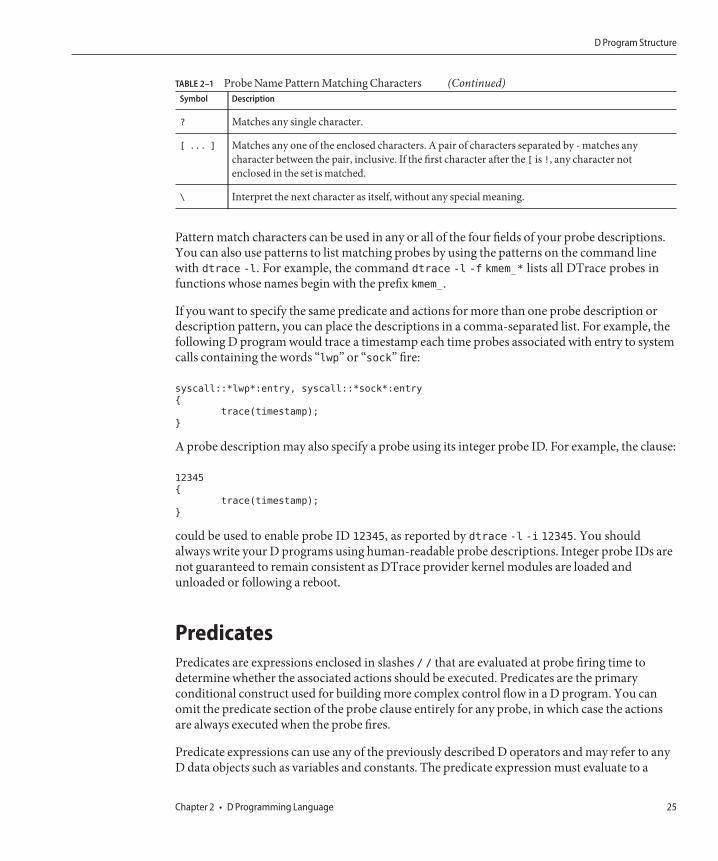
TABLE 2–1 Probe Name Pattern Matching Characters (Continued)Symbol Description
? Matches any single character.
[ ... ] Matches any one of the enclosed characters. A pair of characters separated by - matches anycharacter between the pair, inclusive. If the first character after the [ is !, any character notenclosed in the set is matched.
\ Interpret the next character as itself, without any special meaning.
Pattern match characters can be used in any or all of the four fields of your probe descriptions.You can also use patterns to list matching probes by using the patterns on the command linewith dtrace -l. For example, the command dtrace -l -f kmem_* lists all DTrace probes infunctions whose names begin with the prefix kmem_.
If you want to specify the same predicate and actions for more than one probe description ordescription pattern, you can place the descriptions in a comma-separated list. For example, thefollowing D program would trace a timestamp each time probes associated with entry to systemcalls containing the words “lwp” or “sock” fire:
syscall::*lwp*:entry, syscall::*sock*:entry
{
trace(timestamp);
}
A probe description may also specify a probe using its integer probe ID. For example, the clause:
12345
{
trace(timestamp);
}
could be used to enable probe ID 12345, as reported by dtrace -l -i 12345. You shouldalways write your D programs using human-readable probe descriptions. Integer probe IDs arenot guaranteed to remain consistent as DTrace provider kernel modules are loaded andunloaded or following a reboot.
PredicatesPredicates are expressions enclosed in slashes / / that are evaluated at probe firing time todetermine whether the associated actions should be executed. Predicates are the primaryconditional construct used for building more complex control flow in a D program. You canomit the predicate section of the probe clause entirely for any probe, in which case the actionsare always executed when the probe fires.
Predicate expressions can use any of the previously described D operators and may refer to anyD data objects such as variables and constants. The predicate expression must evaluate to a
D Program Structure
Chapter 2 • D Programming Language 25
value of integer or pointer type so that it can be considered as true or false. As with all Dexpressions, a zero value is interpreted as false and any non-zero value is interpreted as true.
ActionsProbe actions are described by a list of statements separated by semicolons (;) and enclosed inbraces { }. If you only want to note that a particular probe fired on a particular CPU withouttracing any data or performing any additional actions, you can specify an empty set of braceswith no statements inside.
Order of ExecutionEach clause is represented by its predicate, if any, and the clause's actions. When an enabledprobe fires, its actions will execute if the predicate evaluates to true or if no predicate is given.Program order determines the order in which actions are executed. Two or more clauses thatenable the same probe will also execute in program order.
Use of the C PreprocessorThe C programming language used for defining Solaris system interfaces includes apreprocessor that performs a set of initial steps in C program compilation. The C preprocessor iscommonly used to define macro substitutions where one token in a C program is replaced withanother predefined set of tokens, or to include copies of system header files. You can use the Cpreprocessor in conjunction with your D programs by specifying the dtrace -C option. Thisoption causes dtrace to first execute the cpp(1) preprocessor on your program source file andthen pass the results to the D compiler. The C preprocessor is described in more detail in The CProgramming Language.
The D compiler automatically loads the set of C type descriptions associated with the operatingsystem implementation, but you can use the preprocessor to include other type definitions suchas types used in your own C programs. You can also use the preprocessor to perform other taskssuch as creating macros that expand to chunks of D code and other program elements. If youuse the preprocessor with your D program, you may only include files that contain valid Ddeclarations. Typical C header files include only external declarations of types and symbols,which will be correctly interpreted by the D compiler. The D compiler cannot parse C headerfiles that include additional program elements like C function source code and will produce anappropriate error message.
D Program Structure
Oracle Solaris Dynamic Tracing Guide • November 2011 E22973_0226
Compilation and InstrumentationWhen you write traditional programs in Oracle Solaris, you use a compiler to convert yourprogram from source code into object code that you can execute. When you use the dtracecommand you are invoking the compiler for the D language used earlier to write the hello.dprogram. Once your program is compiled, it is sent into the operating system kernel forexecution by DTrace. There the probes that are named in your program are enabled and thecorresponding provider performs whatever instrumentation is needed to activate them.
All of the instrumentation in DTrace is completely dynamic: probes are enabled discretely onlywhen you are using them. No instrumented code is present for inactive probes, so your systemdoes not experience any kind of performance degradation when you are not using DTrace.Once your experiment is complete and the dtrace command exits, all of the probes you usedare automatically disabled and their instrumentation is removed, returning your system to itsexact original state. No effective difference exists between a system where DTrace is not activeand one where the DTrace software is not installed.
The instrumentation for each probe is performed dynamically on the live running operatingsystem or on user processes you select. The system is not quiesced or paused in any way, andinstrumentation code is added only for the probes that you enable. As a result, the probe effectof using DTrace is limited to exactly what you ask DTrace to do: no extraneous data is traced, noone big “tracing switch” is turned on in the system, and all of the DTrace instrumentation isdesigned to be as efficient as possible. These features enable you to use DTrace in production tosolve real problems in real time.
The DTrace framework also provides support for an arbitrary number of virtual clients. Youcan run as many simultaneous DTrace experiments and commands as you like, limited only byyour system's memory capacity, and the commands all operate independently using the sameunderlying instrumentation. This same capability also permits any number of distinct users onthe system to take advantage of DTrace simultaneously: developers, administrators, and servicepersonnel can all work together or on distinct problems on the same system using DTracewithout interfering with one another.
Unlike programs written in C and C++ and similar to programs written in the Javaprogramming language, DTrace D programs are compiled into a safe intermediate form that isused for execution when your probes fire. This intermediate form is validated for safety whenyour program is first examined by the DTrace kernel software. The DTrace executionenvironment also handles any run-time errors that might occur during your D program'sexecution, including dividing by zero, dereferencing invalid memory, and so on, and reportsthem to you. As a result, you can never construct an unsafe program that would cause DTrace toinadvertently damage the Oracle Solaris kernel or one of the processes running on your system.These safety features allow you to use DTrace in a production environment without worryingabout crashing or corrupting your system. If you make a programming mistake, DTrace willreport your error to you, disable your instrumentation, and you can correct your mistake andtry again. The DTrace error reporting and debugging features are described later in this book.
Compilation and Instrumentation
Chapter 2 • D Programming Language 27
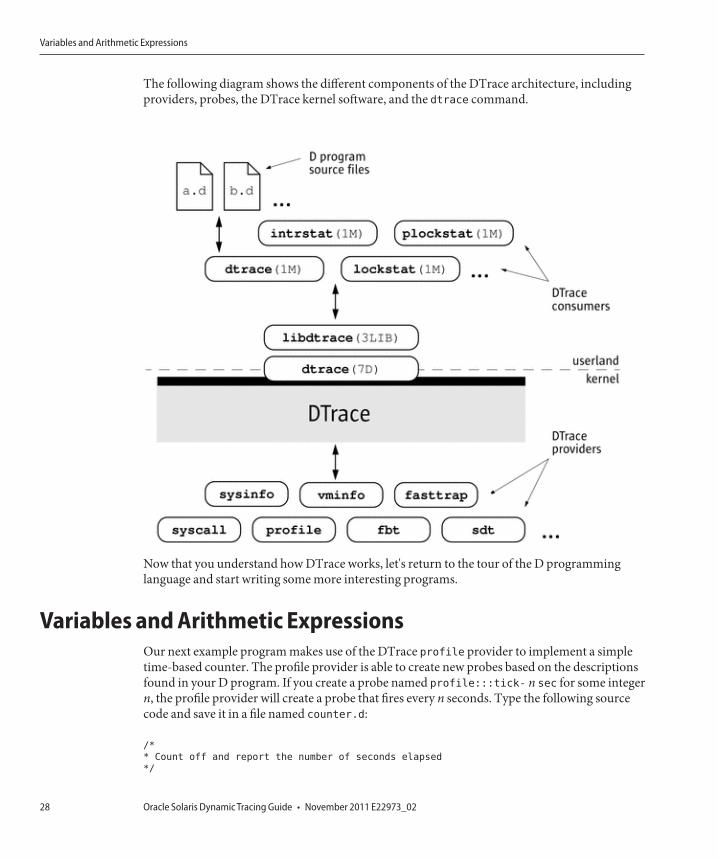
The following diagram shows the different components of the DTrace architecture, includingproviders, probes, the DTrace kernel software, and the dtrace command.
Now that you understand how DTrace works, let's return to the tour of the D programminglanguage and start writing some more interesting programs.
Variables and Arithmetic ExpressionsOur next example program makes use of the DTrace profile provider to implement a simpletime-based counter. The profile provider is able to create new probes based on the descriptionsfound in your D program. If you create a probe named profile:::tick- n sec for some integern, the profile provider will create a probe that fires every n seconds. Type the following sourcecode and save it in a file named counter.d:
/*
* Count off and report the number of seconds elapsed
*/
Variables and Arithmetic Expressions
Oracle Solaris Dynamic Tracing Guide • November 2011 E22973_0228
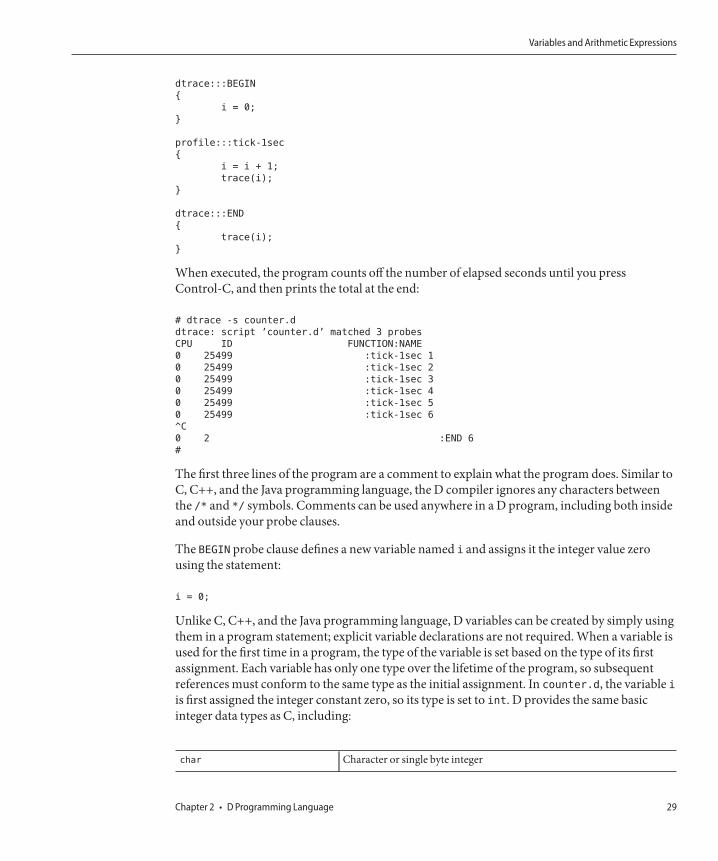
dtrace:::BEGIN
{
i = 0;
}
profile:::tick-1sec
{
i = i + 1;
trace(i);
}
dtrace:::END
{
trace(i);
}
When executed, the program counts off the number of elapsed seconds until you pressControl-C, and then prints the total at the end:
# dtrace -s counter.d
dtrace: script ’counter.d’ matched 3 probes
CPU ID FUNCTION:NAME
0 25499 :tick-1sec 1
0 25499 :tick-1sec 2
0 25499 :tick-1sec 3
0 25499 :tick-1sec 4
0 25499 :tick-1sec 5
0 25499 :tick-1sec 6
^C
0 2 :END 6
#
The first three lines of the program are a comment to explain what the program does. Similar toC, C++, and the Java programming language, the D compiler ignores any characters betweenthe /* and */ symbols. Comments can be used anywhere in a D program, including both insideand outside your probe clauses.
The BEGIN probe clause defines a new variable named i and assigns it the integer value zerousing the statement:
i = 0;
Unlike C, C++, and the Java programming language, D variables can be created by simply usingthem in a program statement; explicit variable declarations are not required. When a variable isused for the first time in a program, the type of the variable is set based on the type of its firstassignment. Each variable has only one type over the lifetime of the program, so subsequentreferences must conform to the same type as the initial assignment. In counter.d, the variable iis first assigned the integer constant zero, so its type is set to int. D provides the same basicinteger data types as C, including:
char Character or single byte integer
Variables and Arithmetic Expressions
Chapter 2 • D Programming Language 29
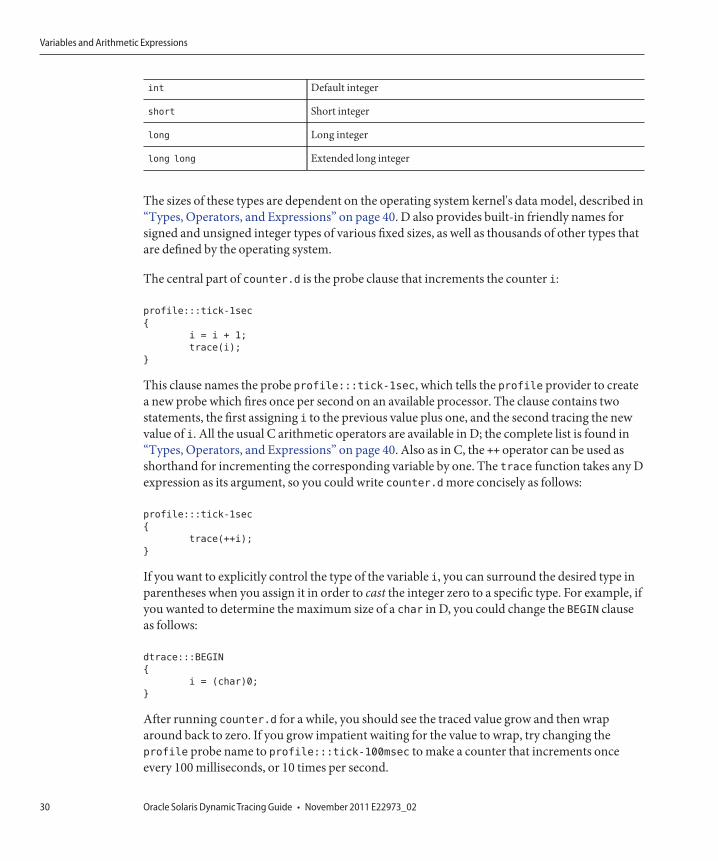
int Default integer
short Short integer
long Long integer
long long Extended long integer
The sizes of these types are dependent on the operating system kernel's data model, described in“Types, Operators, and Expressions” on page 40. D also provides built-in friendly names forsigned and unsigned integer types of various fixed sizes, as well as thousands of other types thatare defined by the operating system.
The central part of counter.d is the probe clause that increments the counter i:
profile:::tick-1sec
{
i = i + 1;
trace(i);
}
This clause names the probe profile:::tick-1sec, which tells the profile provider to createa new probe which fires once per second on an available processor. The clause contains twostatements, the first assigning i to the previous value plus one, and the second tracing the newvalue of i. All the usual C arithmetic operators are available in D; the complete list is found in“Types, Operators, and Expressions” on page 40. Also as in C, the ++ operator can be used asshorthand for incrementing the corresponding variable by one. The trace function takes any Dexpression as its argument, so you could write counter.d more concisely as follows:
profile:::tick-1sec
{
trace(++i);
}
If you want to explicitly control the type of the variable i, you can surround the desired type inparentheses when you assign it in order to cast the integer zero to a specific type. For example, ifyou wanted to determine the maximum size of a char in D, you could change the BEGIN clauseas follows:
dtrace:::BEGIN
{
i = (char)0;
}
After running counter.d for a while, you should see the traced value grow and then wraparound back to zero. If you grow impatient waiting for the value to wrap, try changing theprofile probe name to profile:::tick-100msec to make a counter that increments onceevery 100 milliseconds, or 10 times per second.
Variables and Arithmetic Expressions
Oracle Solaris Dynamic Tracing Guide • November 2011 E22973_0230
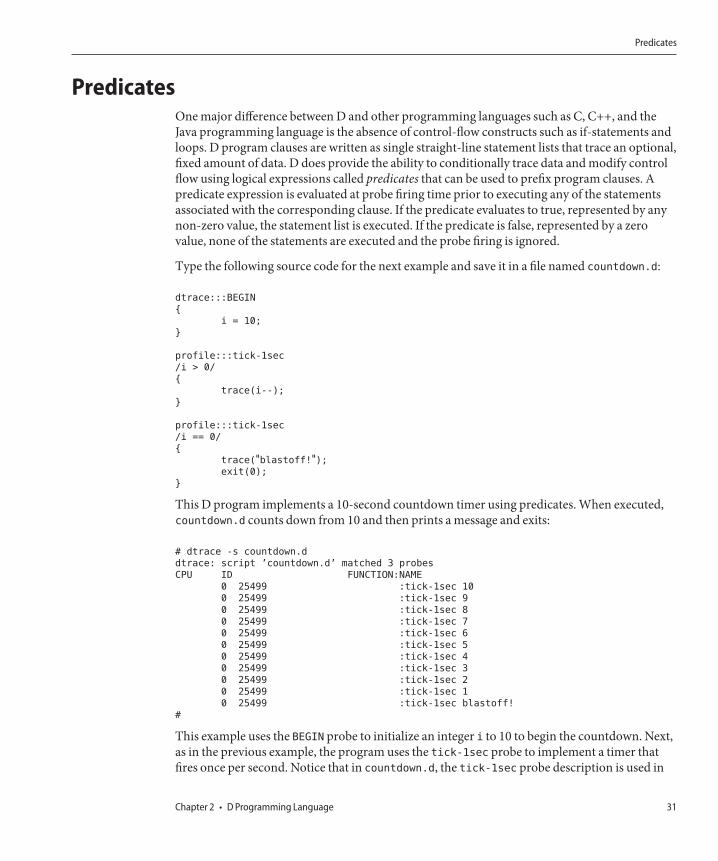
PredicatesOne major difference between D and other programming languages such as C, C++, and theJava programming language is the absence of control-flow constructs such as if-statements andloops. D program clauses are written as single straight-line statement lists that trace an optional,fixed amount of data. D does provide the ability to conditionally trace data and modify controlflow using logical expressions called predicates that can be used to prefix program clauses. Apredicate expression is evaluated at probe firing time prior to executing any of the statementsassociated with the corresponding clause. If the predicate evaluates to true, represented by anynon-zero value, the statement list is executed. If the predicate is false, represented by a zerovalue, none of the statements are executed and the probe firing is ignored.
Type the following source code for the next example and save it in a file named countdown.d:
dtrace:::BEGIN
{
i = 10;
}
profile:::tick-1sec
/i > 0/
{
trace(i--);
}
profile:::tick-1sec
/i == 0/
{
trace("blastoff!");exit(0);
}
This D program implements a 10-second countdown timer using predicates. When executed,countdown.d counts down from 10 and then prints a message and exits:
# dtrace -s countdown.d
dtrace: script ’countdown.d’ matched 3 probes
CPU ID FUNCTION:NAME
0 25499 :tick-1sec 10
0 25499 :tick-1sec 9
0 25499 :tick-1sec 8
0 25499 :tick-1sec 7
0 25499 :tick-1sec 6
0 25499 :tick-1sec 5
0 25499 :tick-1sec 4
0 25499 :tick-1sec 3
0 25499 :tick-1sec 2
0 25499 :tick-1sec 1
0 25499 :tick-1sec blastoff!
#
This example uses the BEGIN probe to initialize an integer i to 10 to begin the countdown. Next,as in the previous example, the program uses the tick-1sec probe to implement a timer thatfires once per second. Notice that in countdown.d, the tick-1sec probe description is used in
Predicates
Chapter 2 • D Programming Language 31
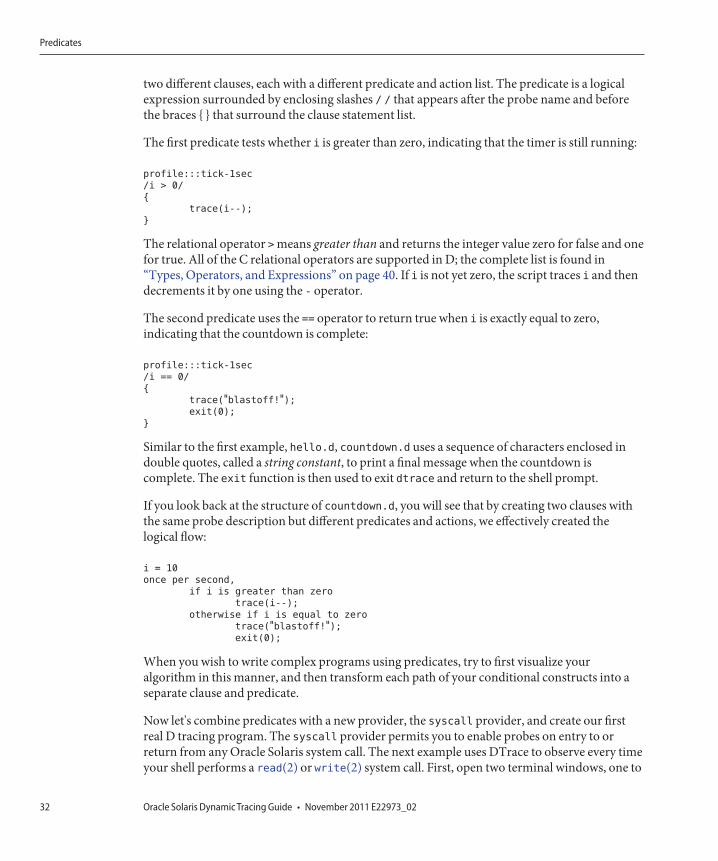
two different clauses, each with a different predicate and action list. The predicate is a logicalexpression surrounded by enclosing slashes / / that appears after the probe name and beforethe braces { } that surround the clause statement list.
The first predicate tests whether i is greater than zero, indicating that the timer is still running:
profile:::tick-1sec
/i > 0/
{
trace(i--);
}
The relational operator > means greater than and returns the integer value zero for false and onefor true. All of the C relational operators are supported in D; the complete list is found in“Types, Operators, and Expressions” on page 40. If i is not yet zero, the script traces i and thendecrements it by one using the - operator.
The second predicate uses the == operator to return true when i is exactly equal to zero,indicating that the countdown is complete:
profile:::tick-1sec
/i == 0/
{
trace("blastoff!");exit(0);
}
Similar to the first example, hello.d, countdown.d uses a sequence of characters enclosed indouble quotes, called a string constant, to print a final message when the countdown iscomplete. The exit function is then used to exit dtrace and return to the shell prompt.
If you look back at the structure of countdown.d, you will see that by creating two clauses withthe same probe description but different predicates and actions, we effectively created thelogical flow:
i = 10
once per second,
if i is greater than zero
trace(i--);
otherwise if i is equal to zero
trace("blastoff!");exit(0);
When you wish to write complex programs using predicates, try to first visualize youralgorithm in this manner, and then transform each path of your conditional constructs into aseparate clause and predicate.
Now let's combine predicates with a new provider, the syscall provider, and create our firstreal D tracing program. The syscall provider permits you to enable probes on entry to orreturn from any Oracle Solaris system call. The next example uses DTrace to observe every timeyour shell performs a read(2) or write(2) system call. First, open two terminal windows, one to
Predicates
Oracle Solaris Dynamic Tracing Guide • November 2011 E22973_0232
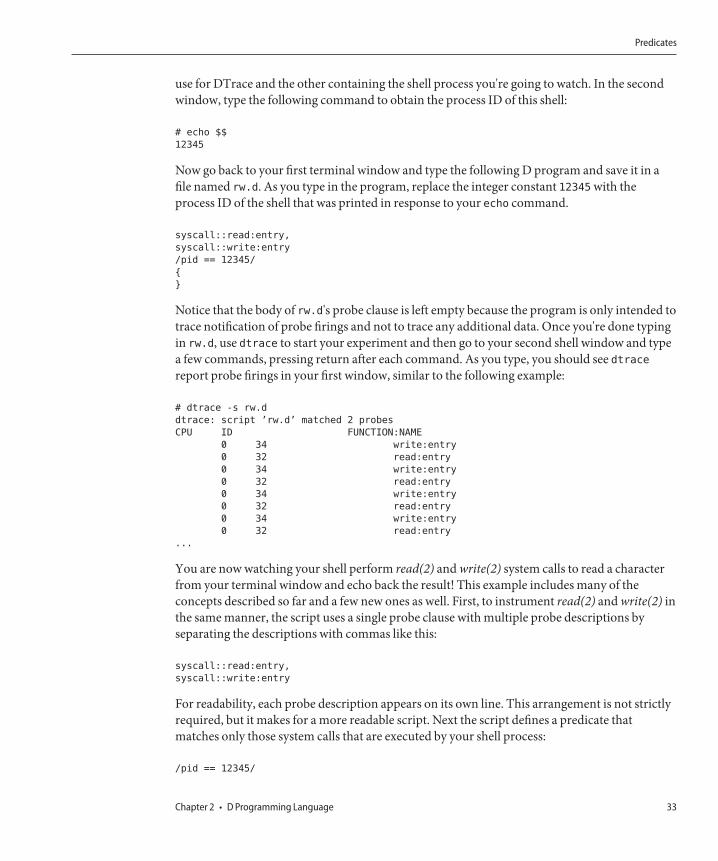
use for DTrace and the other containing the shell process you're going to watch. In the secondwindow, type the following command to obtain the process ID of this shell:
# echo $$
12345
Now go back to your first terminal window and type the following D program and save it in afile named rw.d. As you type in the program, replace the integer constant 12345 with theprocess ID of the shell that was printed in response to your echo command.
syscall::read:entry,
syscall::write:entry
/pid == 12345/
{
}
Notice that the body of rw.d's probe clause is left empty because the program is only intended totrace notification of probe firings and not to trace any additional data. Once you're done typingin rw.d, use dtrace to start your experiment and then go to your second shell window and typea few commands, pressing return after each command. As you type, you should see dtracereport probe firings in your first window, similar to the following example:
# dtrace -s rw.d
dtrace: script ’rw.d’ matched 2 probes
CPU ID FUNCTION:NAME
0 34 write:entry
0 32 read:entry
0 34 write:entry
0 32 read:entry
0 34 write:entry
0 32 read:entry
0 34 write:entry
0 32 read:entry
...
You are now watching your shell perform read(2) and write(2) system calls to read a characterfrom your terminal window and echo back the result! This example includes many of theconcepts described so far and a few new ones as well. First, to instrument read(2) and write(2) inthe same manner, the script uses a single probe clause with multiple probe descriptions byseparating the descriptions with commas like this:
syscall::read:entry,
syscall::write:entry
For readability, each probe description appears on its own line. This arrangement is not strictlyrequired, but it makes for a more readable script. Next the script defines a predicate thatmatches only those system calls that are executed by your shell process:
/pid == 12345/
Predicates
Chapter 2 • D Programming Language 33
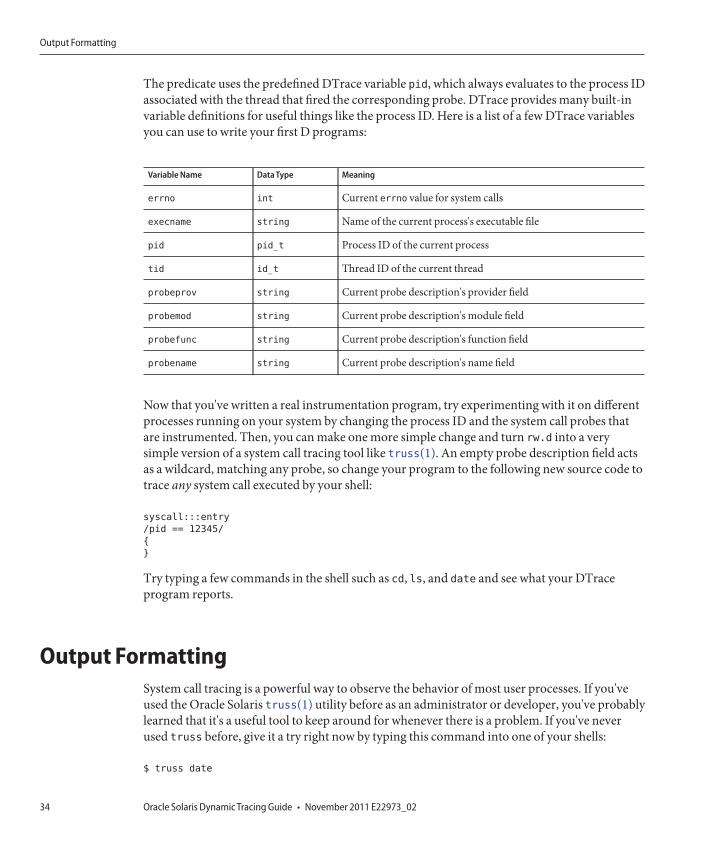
The predicate uses the predefined DTrace variable pid, which always evaluates to the process IDassociated with the thread that fired the corresponding probe. DTrace provides many built-invariable definitions for useful things like the process ID. Here is a list of a few DTrace variablesyou can use to write your first D programs:
Variable Name Data Type Meaning
errno int Current errno value for system calls
execname string Name of the current process's executable file
pid pid_t Process ID of the current process
tid id_t Thread ID of the current thread
probeprov string Current probe description's provider field
probemod string Current probe description's module field
probefunc string Current probe description's function field
probename string Current probe description's name field
Now that you've written a real instrumentation program, try experimenting with it on differentprocesses running on your system by changing the process ID and the system call probes thatare instrumented. Then, you can make one more simple change and turn rw.d into a verysimple version of a system call tracing tool like truss(1). An empty probe description field actsas a wildcard, matching any probe, so change your program to the following new source code totrace any system call executed by your shell:
syscall:::entry
/pid == 12345/
{
}
Try typing a few commands in the shell such as cd, ls, and date and see what your DTraceprogram reports.
Output FormattingSystem call tracing is a powerful way to observe the behavior of most user processes. If you'veused the Oracle Solaris truss(1) utility before as an administrator or developer, you've probablylearned that it's a useful tool to keep around for whenever there is a problem. If you've neverused truss before, give it a try right now by typing this command into one of your shells:
$ truss date
Output Formatting
Oracle Solaris Dynamic Tracing Guide • November 2011 E22973_0234
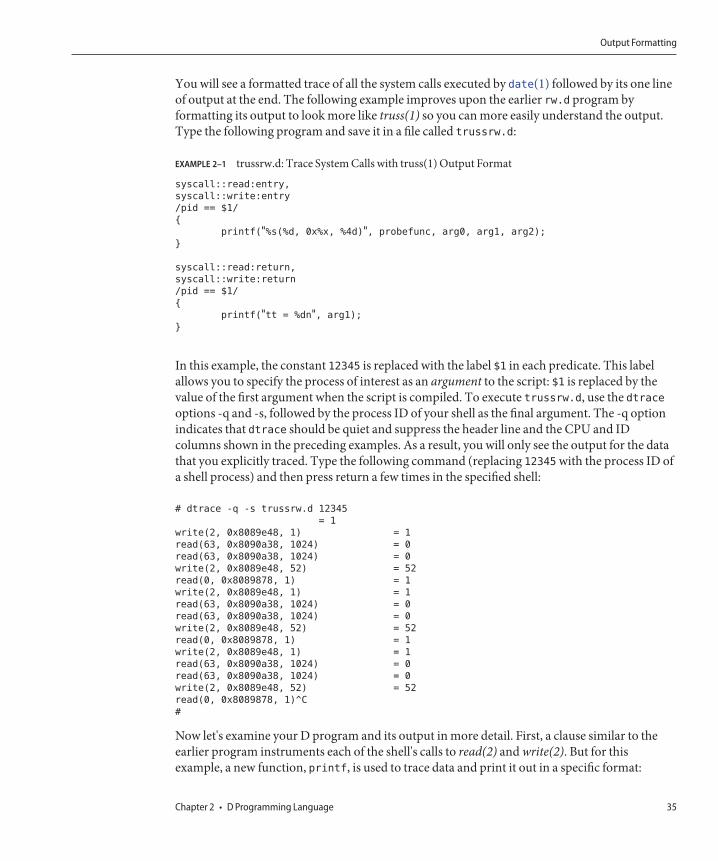
You will see a formatted trace of all the system calls executed by date(1) followed by its one lineof output at the end. The following example improves upon the earlier rw.d program byformatting its output to look more like truss(1) so you can more easily understand the output.Type the following program and save it in a file called trussrw.d:
EXAMPLE 2–1 trussrw.d: Trace System Calls with truss(1) Output Format
syscall::read:entry,
syscall::write:entry
/pid == $1/
{
printf("%s(%d, 0x%x, %4d)", probefunc, arg0, arg1, arg2);
}
syscall::read:return,
syscall::write:return
/pid == $1/
{
printf("tt = %dn", arg1);
}
In this example, the constant 12345 is replaced with the label $1 in each predicate. This labelallows you to specify the process of interest as an argument to the script: $1 is replaced by thevalue of the first argument when the script is compiled. To execute trussrw.d, use the dtraceoptions -q and -s, followed by the process ID of your shell as the final argument. The -q optionindicates that dtrace should be quiet and suppress the header line and the CPU and IDcolumns shown in the preceding examples. As a result, you will only see the output for the datathat you explicitly traced. Type the following command (replacing 12345 with the process ID ofa shell process) and then press return a few times in the specified shell:
# dtrace -q -s trussrw.d 12345
= 1
write(2, 0x8089e48, 1) = 1
read(63, 0x8090a38, 1024) = 0
read(63, 0x8090a38, 1024) = 0
write(2, 0x8089e48, 52) = 52
read(0, 0x8089878, 1) = 1
write(2, 0x8089e48, 1) = 1
read(63, 0x8090a38, 1024) = 0
read(63, 0x8090a38, 1024) = 0
write(2, 0x8089e48, 52) = 52
read(0, 0x8089878, 1) = 1
write(2, 0x8089e48, 1) = 1
read(63, 0x8090a38, 1024) = 0
read(63, 0x8090a38, 1024) = 0
write(2, 0x8089e48, 52) = 52
read(0, 0x8089878, 1)^C
#
Now let's examine your D program and its output in more detail. First, a clause similar to theearlier program instruments each of the shell's calls to read(2) and write(2). But for thisexample, a new function, printf, is used to trace data and print it out in a specific format:
Output Formatting
Chapter 2 • D Programming Language 35
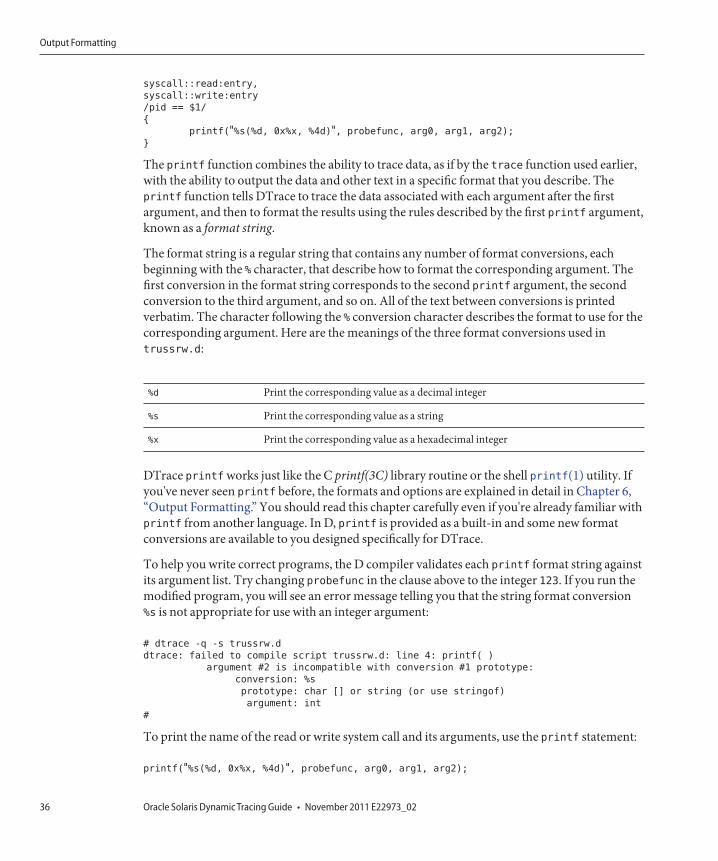
syscall::read:entry,
syscall::write:entry
/pid == $1/
{
printf("%s(%d, 0x%x, %4d)", probefunc, arg0, arg1, arg2);
}
The printf function combines the ability to trace data, as if by the trace function used earlier,with the ability to output the data and other text in a specific format that you describe. Theprintf function tells DTrace to trace the data associated with each argument after the firstargument, and then to format the results using the rules described by the first printf argument,known as a format string.
The format string is a regular string that contains any number of format conversions, eachbeginning with the % character, that describe how to format the corresponding argument. Thefirst conversion in the format string corresponds to the second printf argument, the secondconversion to the third argument, and so on. All of the text between conversions is printedverbatim. The character following the % conversion character describes the format to use for thecorresponding argument. Here are the meanings of the three format conversions used intrussrw.d:
%d Print the corresponding value as a decimal integer
%s Print the corresponding value as a string
%x Print the corresponding value as a hexadecimal integer
DTrace printf works just like the C printf(3C) library routine or the shell printf(1) utility. Ifyou've never seen printf before, the formats and options are explained in detail in Chapter 6,“Output Formatting.” You should read this chapter carefully even if you're already familiar withprintf from another language. In D, printf is provided as a built-in and some new formatconversions are available to you designed specifically for DTrace.
To help you write correct programs, the D compiler validates each printf format string againstits argument list. Try changing probefunc in the clause above to the integer 123. If you run themodified program, you will see an error message telling you that the string format conversion%s is not appropriate for use with an integer argument:
# dtrace -q -s trussrw.d
dtrace: failed to compile script trussrw.d: line 4: printf( )
argument #2 is incompatible with conversion #1 prototype:
conversion: %s
prototype: char [] or string (or use stringof)
argument: int
#
To print the name of the read or write system call and its arguments, use the printf statement:
printf("%s(%d, 0x%x, %4d)", probefunc, arg0, arg1, arg2);
Output Formatting
Oracle Solaris Dynamic Tracing Guide • November 2011 E22973_0236
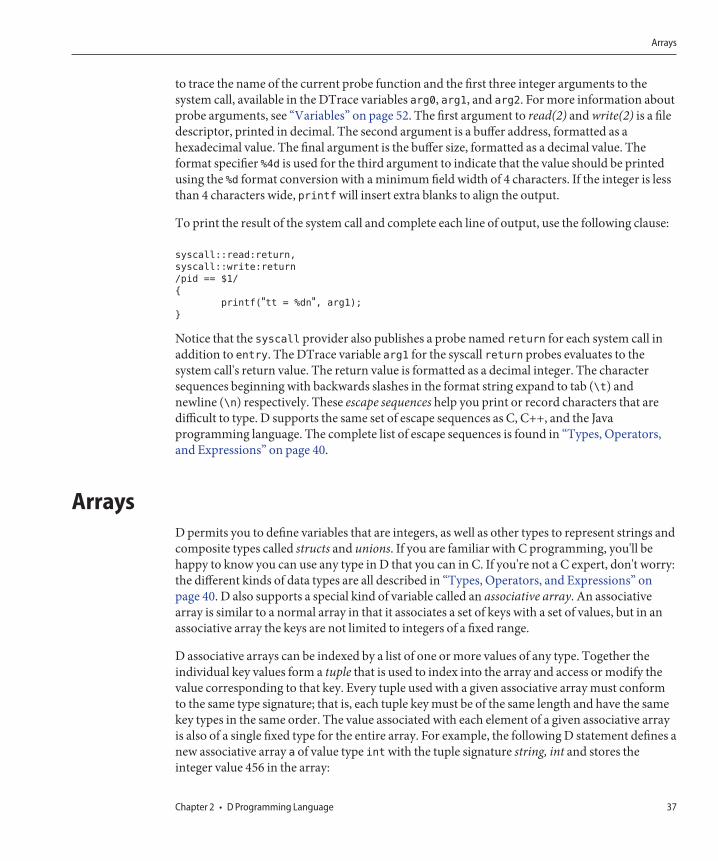
to trace the name of the current probe function and the first three integer arguments to thesystem call, available in the DTrace variables arg0, arg1, and arg2. For more information aboutprobe arguments, see “Variables” on page 52. The first argument to read(2) and write(2) is a filedescriptor, printed in decimal. The second argument is a buffer address, formatted as ahexadecimal value. The final argument is the buffer size, formatted as a decimal value. Theformat specifier %4d is used for the third argument to indicate that the value should be printedusing the %d format conversion with a minimum field width of 4 characters. If the integer is lessthan 4 characters wide, printf will insert extra blanks to align the output.
To print the result of the system call and complete each line of output, use the following clause:
syscall::read:return,
syscall::write:return
/pid == $1/
{
printf("tt = %dn", arg1);
}
Notice that the syscall provider also publishes a probe named return for each system call inaddition to entry. The DTrace variable arg1 for the syscall return probes evaluates to thesystem call's return value. The return value is formatted as a decimal integer. The charactersequences beginning with backwards slashes in the format string expand to tab (\t) andnewline (\n) respectively. These escape sequences help you print or record characters that aredifficult to type. D supports the same set of escape sequences as C, C++, and the Javaprogramming language. The complete list of escape sequences is found in “Types, Operators,and Expressions” on page 40.
ArraysD permits you to define variables that are integers, as well as other types to represent strings andcomposite types called structs and unions. If you are familiar with C programming, you'll behappy to know you can use any type in D that you can in C. If you're not a C expert, don't worry:the different kinds of data types are all described in “Types, Operators, and Expressions” onpage 40. D also supports a special kind of variable called an associative array. An associativearray is similar to a normal array in that it associates a set of keys with a set of values, but in anassociative array the keys are not limited to integers of a fixed range.
D associative arrays can be indexed by a list of one or more values of any type. Together theindividual key values form a tuple that is used to index into the array and access or modify thevalue corresponding to that key. Every tuple used with a given associative array must conformto the same type signature; that is, each tuple key must be of the same length and have the samekey types in the same order. The value associated with each element of a given associative arrayis also of a single fixed type for the entire array. For example, the following D statement defines anew associative array a of value type int with the tuple signature string, int and stores theinteger value 456 in the array:
Arrays
Chapter 2 • D Programming Language 37
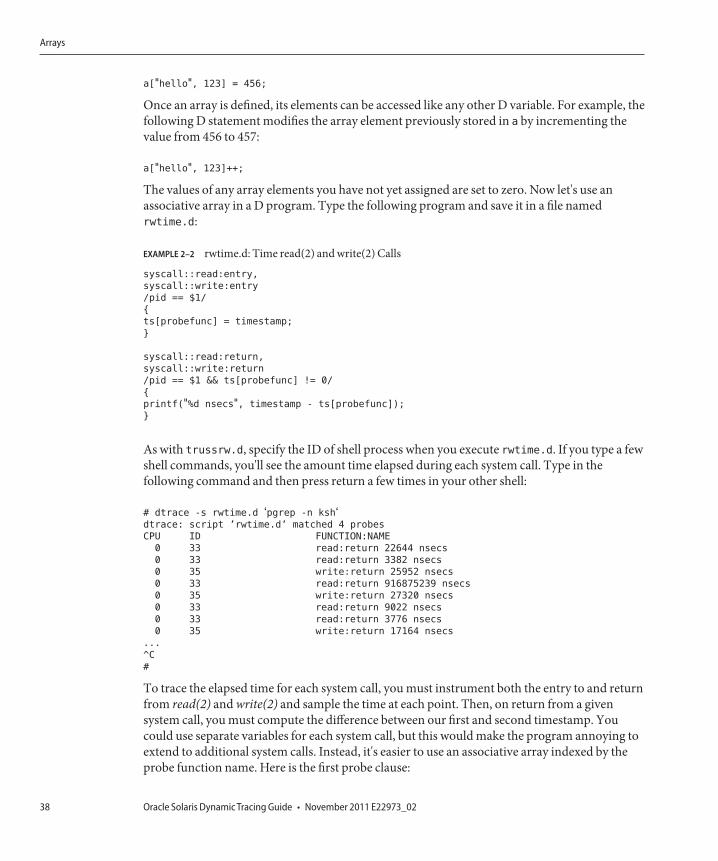
a["hello", 123] = 456;
Once an array is defined, its elements can be accessed like any other D variable. For example, thefollowing D statement modifies the array element previously stored in a by incrementing thevalue from 456 to 457:
a["hello", 123]++;
The values of any array elements you have not yet assigned are set to zero. Now let's use anassociative array in a D program. Type the following program and save it in a file namedrwtime.d:
EXAMPLE 2–2 rwtime.d: Time read(2) and write(2) Calls
syscall::read:entry,
syscall::write:entry
/pid == $1/
{
ts[probefunc] = timestamp;
}
syscall::read:return,
syscall::write:return
/pid == $1 && ts[probefunc] != 0/
{
printf("%d nsecs", timestamp - ts[probefunc]);
}
As with trussrw.d, specify the ID of shell process when you execute rwtime.d. If you type a fewshell commands, you'll see the amount time elapsed during each system call. Type in thefollowing command and then press return a few times in your other shell:
# dtrace -s rwtime.d ‘pgrep -n ksh‘dtrace: script ’rwtime.d’ matched 4 probes
CPU ID FUNCTION:NAME
0 33 read:return 22644 nsecs
0 33 read:return 3382 nsecs
0 35 write:return 25952 nsecs
0 33 read:return 916875239 nsecs
0 35 write:return 27320 nsecs
0 33 read:return 9022 nsecs
0 33 read:return 3776 nsecs
0 35 write:return 17164 nsecs
...
^C
#
To trace the elapsed time for each system call, you must instrument both the entry to and returnfrom read(2) and write(2) and sample the time at each point. Then, on return from a givensystem call, you must compute the difference between our first and second timestamp. Youcould use separate variables for each system call, but this would make the program annoying toextend to additional system calls. Instead, it's easier to use an associative array indexed by theprobe function name. Here is the first probe clause:
Arrays
Oracle Solaris Dynamic Tracing Guide • November 2011 E22973_0238
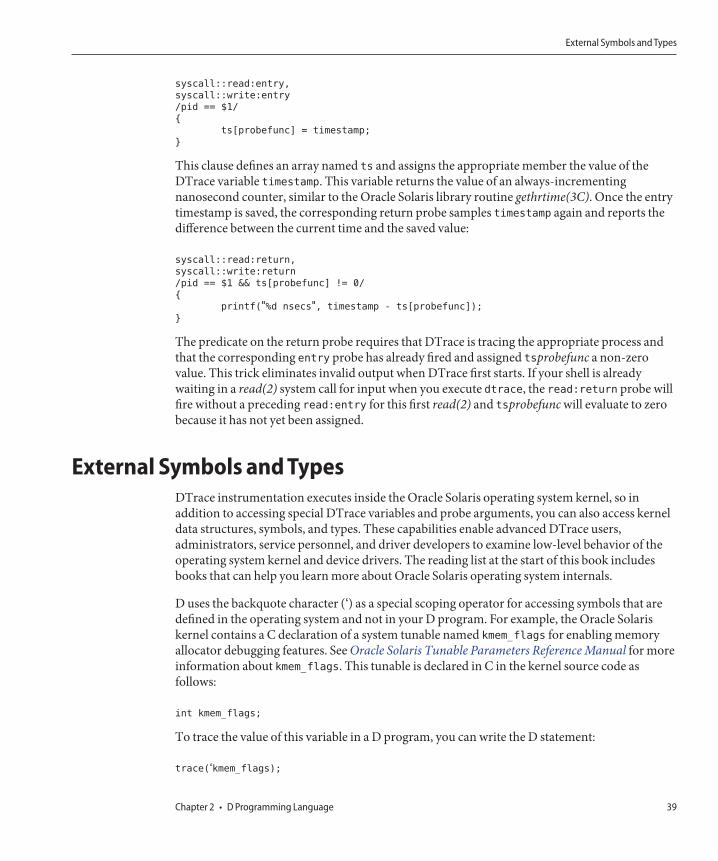
syscall::read:entry,
syscall::write:entry
/pid == $1/
{
ts[probefunc] = timestamp;
}
This clause defines an array named ts and assigns the appropriate member the value of theDTrace variable timestamp. This variable returns the value of an always-incrementingnanosecond counter, similar to the Oracle Solaris library routine gethrtime(3C). Once the entrytimestamp is saved, the corresponding return probe samples timestamp again and reports thedifference between the current time and the saved value:
syscall::read:return,
syscall::write:return
/pid == $1 && ts[probefunc] != 0/
{
printf("%d nsecs", timestamp - ts[probefunc]);
}
The predicate on the return probe requires that DTrace is tracing the appropriate process andthat the corresponding entry probe has already fired and assigned tsprobefunc a non-zerovalue. This trick eliminates invalid output when DTrace first starts. If your shell is alreadywaiting in a read(2) system call for input when you execute dtrace, the read:return probe willfire without a preceding read:entry for this first read(2) and tsprobefunc will evaluate to zerobecause it has not yet been assigned.
External Symbols and TypesDTrace instrumentation executes inside the Oracle Solaris operating system kernel, so inaddition to accessing special DTrace variables and probe arguments, you can also access kerneldata structures, symbols, and types. These capabilities enable advanced DTrace users,administrators, service personnel, and driver developers to examine low-level behavior of theoperating system kernel and device drivers. The reading list at the start of this book includesbooks that can help you learn more about Oracle Solaris operating system internals.
D uses the backquote character (‘) as a special scoping operator for accessing symbols that aredefined in the operating system and not in your D program. For example, the Oracle Solariskernel contains a C declaration of a system tunable named kmem_flags for enabling memoryallocator debugging features. See Oracle Solaris Tunable Parameters Reference Manual for moreinformation about kmem_flags. This tunable is declared in C in the kernel source code asfollows:
int kmem_flags;
To trace the value of this variable in a D program, you can write the D statement:
trace(‘kmem_flags);
External Symbols and Types
Chapter 2 • D Programming Language 39
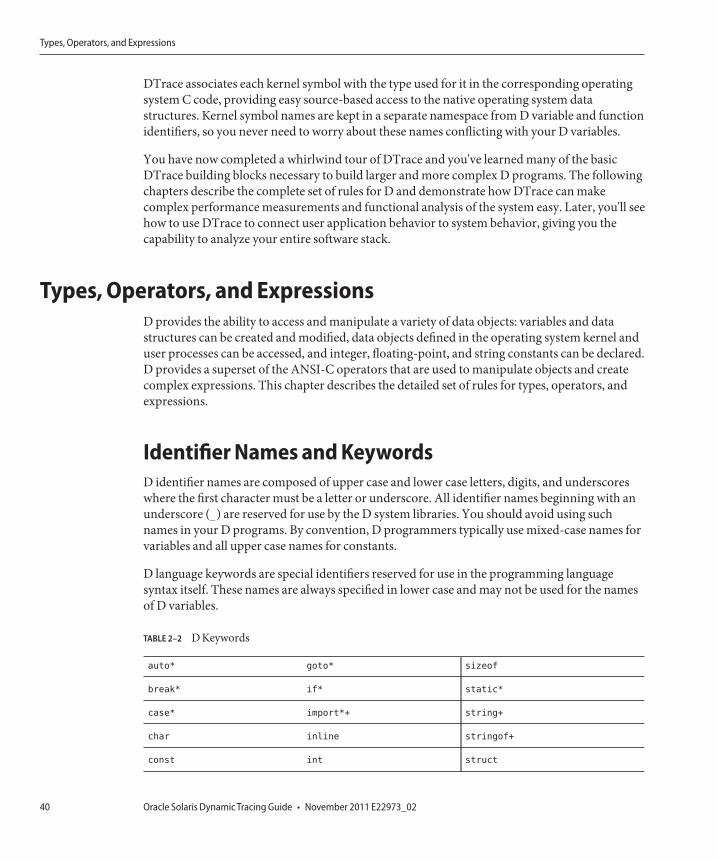
DTrace associates each kernel symbol with the type used for it in the corresponding operatingsystem C code, providing easy source-based access to the native operating system datastructures. Kernel symbol names are kept in a separate namespace from D variable and functionidentifiers, so you never need to worry about these names conflicting with your D variables.
You have now completed a whirlwind tour of DTrace and you've learned many of the basicDTrace building blocks necessary to build larger and more complex D programs. The followingchapters describe the complete set of rules for D and demonstrate how DTrace can makecomplex performance measurements and functional analysis of the system easy. Later, you'll seehow to use DTrace to connect user application behavior to system behavior, giving you thecapability to analyze your entire software stack.
Types, Operators, and ExpressionsD provides the ability to access and manipulate a variety of data objects: variables and datastructures can be created and modified, data objects defined in the operating system kernel anduser processes can be accessed, and integer, floating-point, and string constants can be declared.D provides a superset of the ANSI-C operators that are used to manipulate objects and createcomplex expressions. This chapter describes the detailed set of rules for types, operators, andexpressions.
Identifier Names and KeywordsD identifier names are composed of upper case and lower case letters, digits, and underscoreswhere the first character must be a letter or underscore. All identifier names beginning with anunderscore (_) are reserved for use by the D system libraries. You should avoid using suchnames in your D programs. By convention, D programmers typically use mixed-case names forvariables and all upper case names for constants.
D language keywords are special identifiers reserved for use in the programming languagesyntax itself. These names are always specified in lower case and may not be used for the namesof D variables.
TABLE 2–2 D Keywords
auto* goto* sizeof
break* if* static*
case* import*+ string+
char inline stringof+
const int struct
Types, Operators, and Expressions
Oracle Solaris Dynamic Tracing Guide • November 2011 E22973_0240
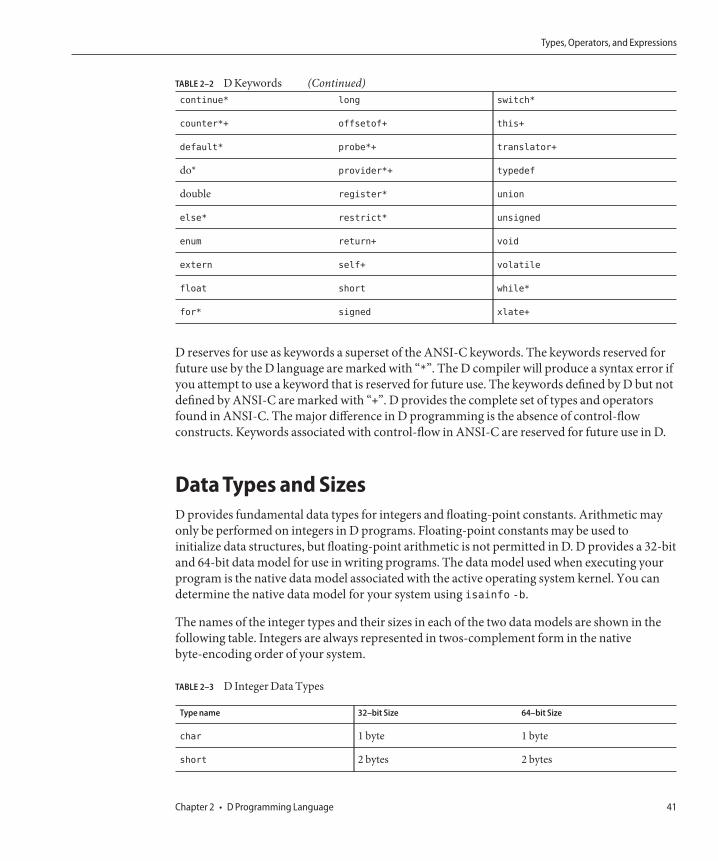
TABLE 2–2 D Keywords (Continued)continue* long switch*
counter*+ offsetof+ this+
default* probe*+ translator+
do* provider*+ typedef
double register* union
else* restrict* unsigned
enum return+ void
extern self+ volatile
float short while*
for* signed xlate+
D reserves for use as keywords a superset of the ANSI-C keywords. The keywords reserved forfuture use by the D language are marked with “*”. The D compiler will produce a syntax error ifyou attempt to use a keyword that is reserved for future use. The keywords defined by D but notdefined by ANSI-C are marked with “+”. D provides the complete set of types and operatorsfound in ANSI-C. The major difference in D programming is the absence of control-flowconstructs. Keywords associated with control-flow in ANSI-C are reserved for future use in D.
Data Types and SizesD provides fundamental data types for integers and floating-point constants. Arithmetic mayonly be performed on integers in D programs. Floating-point constants may be used toinitialize data structures, but floating-point arithmetic is not permitted in D. D provides a 32-bitand 64-bit data model for use in writing programs. The data model used when executing yourprogram is the native data model associated with the active operating system kernel. You candetermine the native data model for your system using isainfo -b.
The names of the integer types and their sizes in each of the two data models are shown in thefollowing table. Integers are always represented in twos-complement form in the nativebyte-encoding order of your system.
TABLE 2–3 D Integer Data Types
Type name 32–bit Size 64–bit Size
char 1 byte 1 byte
short 2 bytes 2 bytes
Types, Operators, and Expressions
Chapter 2 • D Programming Language 41
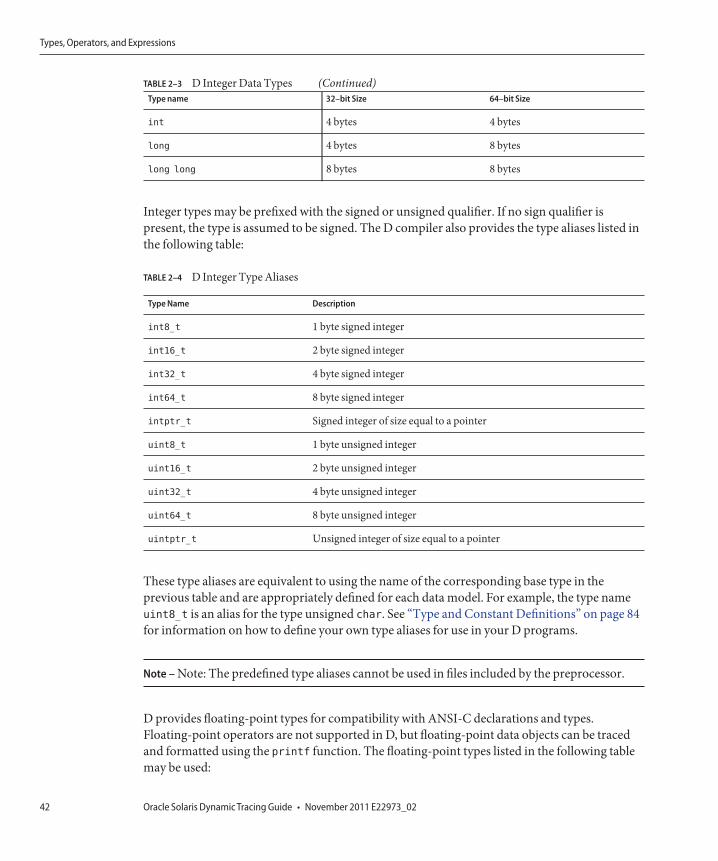
TABLE 2–3 D Integer Data Types (Continued)Type name 32–bit Size 64–bit Size
int 4 bytes 4 bytes
long 4 bytes 8 bytes
long long 8 bytes 8 bytes
Integer types may be prefixed with the signed or unsigned qualifier. If no sign qualifier ispresent, the type is assumed to be signed. The D compiler also provides the type aliases listed inthe following table:
TABLE 2–4 D Integer Type Aliases
Type Name Description
int8_t 1 byte signed integer
int16_t 2 byte signed integer
int32_t 4 byte signed integer
int64_t 8 byte signed integer
intptr_t Signed integer of size equal to a pointer
uint8_t 1 byte unsigned integer
uint16_t 2 byte unsigned integer
uint32_t 4 byte unsigned integer
uint64_t 8 byte unsigned integer
uintptr_t Unsigned integer of size equal to a pointer
These type aliases are equivalent to using the name of the corresponding base type in theprevious table and are appropriately defined for each data model. For example, the type nameuint8_t is an alias for the type unsigned char. See “Type and Constant Definitions” on page 84for information on how to define your own type aliases for use in your D programs.
Note – Note: The predefined type aliases cannot be used in files included by the preprocessor.
D provides floating-point types for compatibility with ANSI-C declarations and types.Floating-point operators are not supported in D, but floating-point data objects can be tracedand formatted using the printf function. The floating-point types listed in the following tablemay be used:
Types, Operators, and Expressions
Oracle Solaris Dynamic Tracing Guide • November 2011 E22973_0242
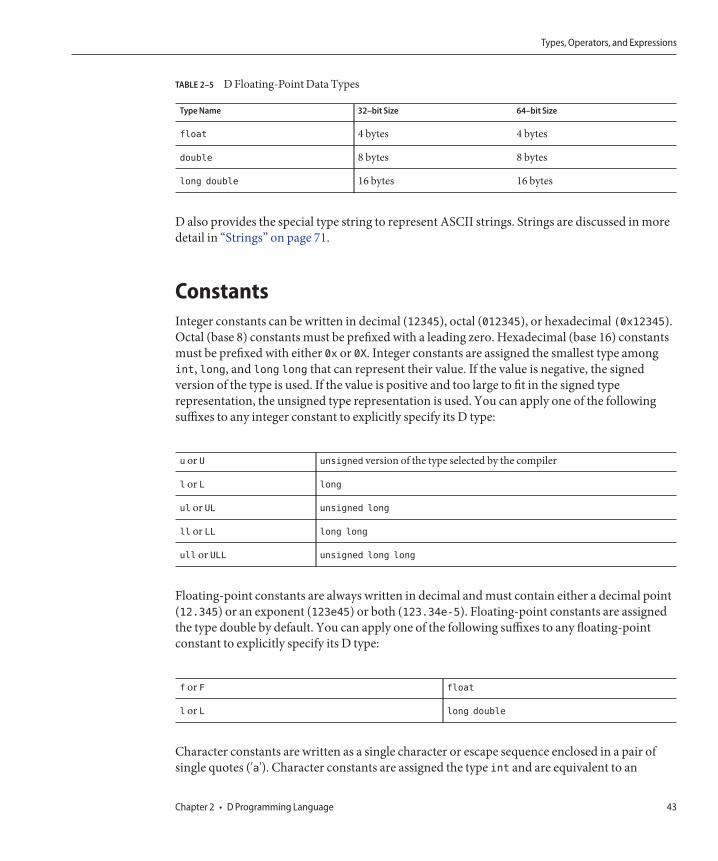
TABLE 2–5 D Floating-Point Data Types
Type Name 32–bit Size 64–bit Size
float 4 bytes 4 bytes
double 8 bytes 8 bytes
long double 16 bytes 16 bytes
D also provides the special type string to represent ASCII strings. Strings are discussed in moredetail in “Strings” on page 71.
ConstantsInteger constants can be written in decimal (12345), octal (012345), or hexadecimal (0x12345).Octal (base 8) constants must be prefixed with a leading zero. Hexadecimal (base 16) constantsmust be prefixed with either 0x or 0X. Integer constants are assigned the smallest type amongint, long, and long long that can represent their value. If the value is negative, the signedversion of the type is used. If the value is positive and too large to fit in the signed typerepresentation, the unsigned type representation is used. You can apply one of the followingsuffixes to any integer constant to explicitly specify its D type:
u or U unsigned version of the type selected by the compiler
l or L long
ul or UL unsigned long
ll or LL long long
ull or ULL unsigned long long
Floating-point constants are always written in decimal and must contain either a decimal point(12.345) or an exponent (123e45) or both (123.34e-5). Floating-point constants are assignedthe type double by default. You can apply one of the following suffixes to any floating-pointconstant to explicitly specify its D type:
f or F float
l or L long double
Character constants are written as a single character or escape sequence enclosed in a pair ofsingle quotes ('a'). Character constants are assigned the type int and are equivalent to an
Types, Operators, and Expressions
Chapter 2 • D Programming Language 43
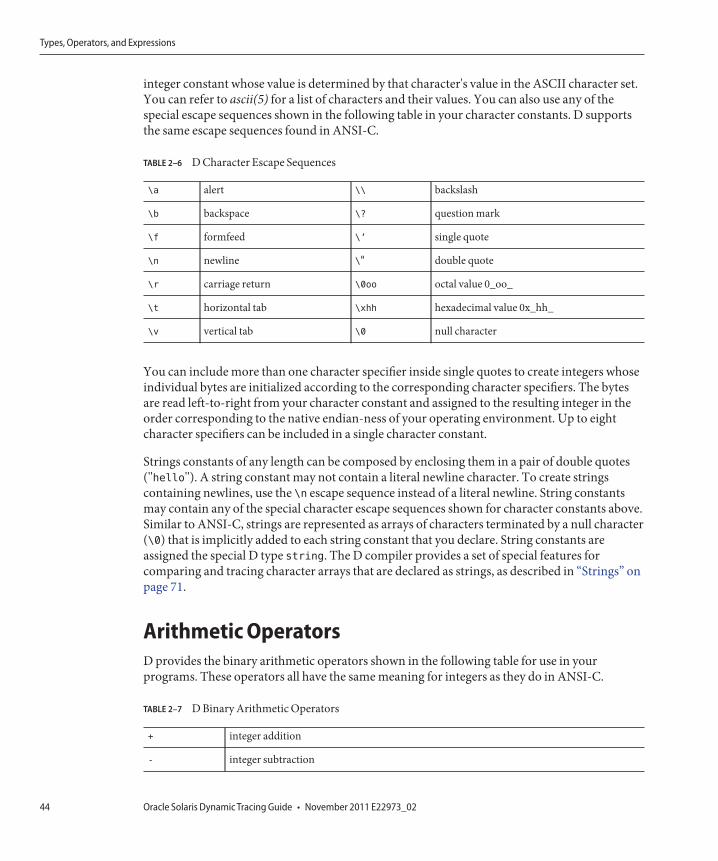
integer constant whose value is determined by that character's value in the ASCII character set.You can refer to ascii(5) for a list of characters and their values. You can also use any of thespecial escape sequences shown in the following table in your character constants. D supportsthe same escape sequences found in ANSI-C.
TABLE 2–6 D Character Escape Sequences
\a alert \\ backslash
\b backspace \? question mark
\f formfeed \’ single quote
\n newline \" double quote
\r carriage return \0oo octal value 0_oo_
\t horizontal tab \xhh hexadecimal value 0x_hh_
\v vertical tab \0 null character
You can include more than one character specifier inside single quotes to create integers whoseindividual bytes are initialized according to the corresponding character specifiers. The bytesare read left-to-right from your character constant and assigned to the resulting integer in theorder corresponding to the native endian-ness of your operating environment. Up to eightcharacter specifiers can be included in a single character constant.
Strings constants of any length can be composed by enclosing them in a pair of double quotes("hello"). A string constant may not contain a literal newline character. To create stringscontaining newlines, use the \n escape sequence instead of a literal newline. String constantsmay contain any of the special character escape sequences shown for character constants above.Similar to ANSI-C, strings are represented as arrays of characters terminated by a null character(\0) that is implicitly added to each string constant that you declare. String constants areassigned the special D type string. The D compiler provides a set of special features forcomparing and tracing character arrays that are declared as strings, as described in “Strings” onpage 71.
Arithmetic OperatorsD provides the binary arithmetic operators shown in the following table for use in yourprograms. These operators all have the same meaning for integers as they do in ANSI-C.
TABLE 2–7 D Binary Arithmetic Operators
+ integer addition
- integer subtraction
Types, Operators, and Expressions
Oracle Solaris Dynamic Tracing Guide • November 2011 E22973_0244
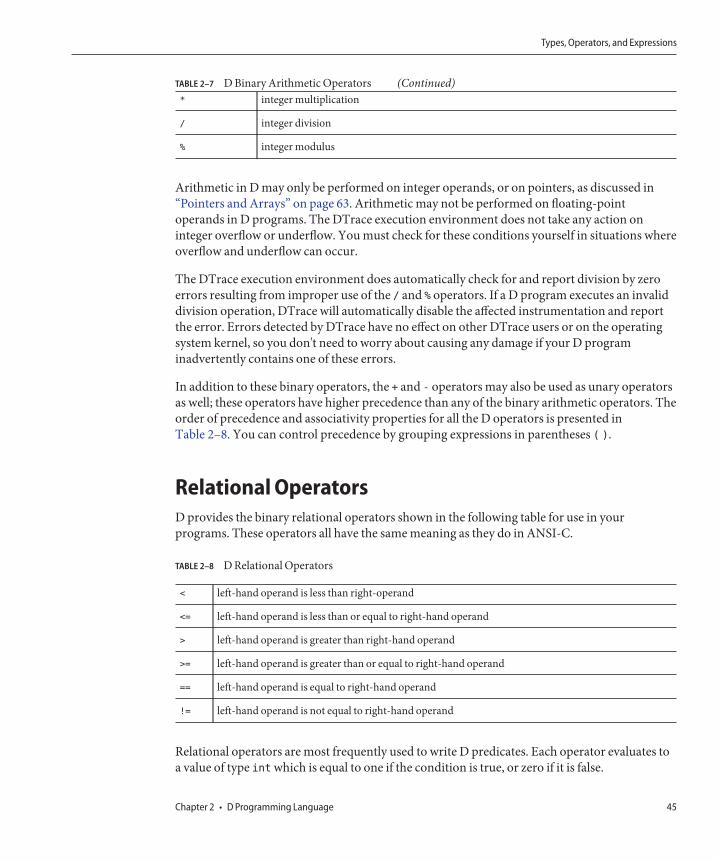
TABLE 2–7 D Binary Arithmetic Operators (Continued)* integer multiplication
/ integer division
% integer modulus
Arithmetic in D may only be performed on integer operands, or on pointers, as discussed in“Pointers and Arrays” on page 63. Arithmetic may not be performed on floating-pointoperands in D programs. The DTrace execution environment does not take any action oninteger overflow or underflow. You must check for these conditions yourself in situations whereoverflow and underflow can occur.
The DTrace execution environment does automatically check for and report division by zeroerrors resulting from improper use of the / and % operators. If a D program executes an invaliddivision operation, DTrace will automatically disable the affected instrumentation and reportthe error. Errors detected by DTrace have no effect on other DTrace users or on the operatingsystem kernel, so you don't need to worry about causing any damage if your D programinadvertently contains one of these errors.
In addition to these binary operators, the + and - operators may also be used as unary operatorsas well; these operators have higher precedence than any of the binary arithmetic operators. Theorder of precedence and associativity properties for all the D operators is presented inTable 2–8. You can control precedence by grouping expressions in parentheses ( ).
Relational OperatorsD provides the binary relational operators shown in the following table for use in yourprograms. These operators all have the same meaning as they do in ANSI-C.
TABLE 2–8 D Relational Operators
< left-hand operand is less than right-operand
<= left-hand operand is less than or equal to right-hand operand
> left-hand operand is greater than right-hand operand
>= left-hand operand is greater than or equal to right-hand operand
== left-hand operand is equal to right-hand operand
!= left-hand operand is not equal to right-hand operand
Relational operators are most frequently used to write D predicates. Each operator evaluates toa value of type int which is equal to one if the condition is true, or zero if it is false.
Types, Operators, and Expressions
Chapter 2 • D Programming Language 45
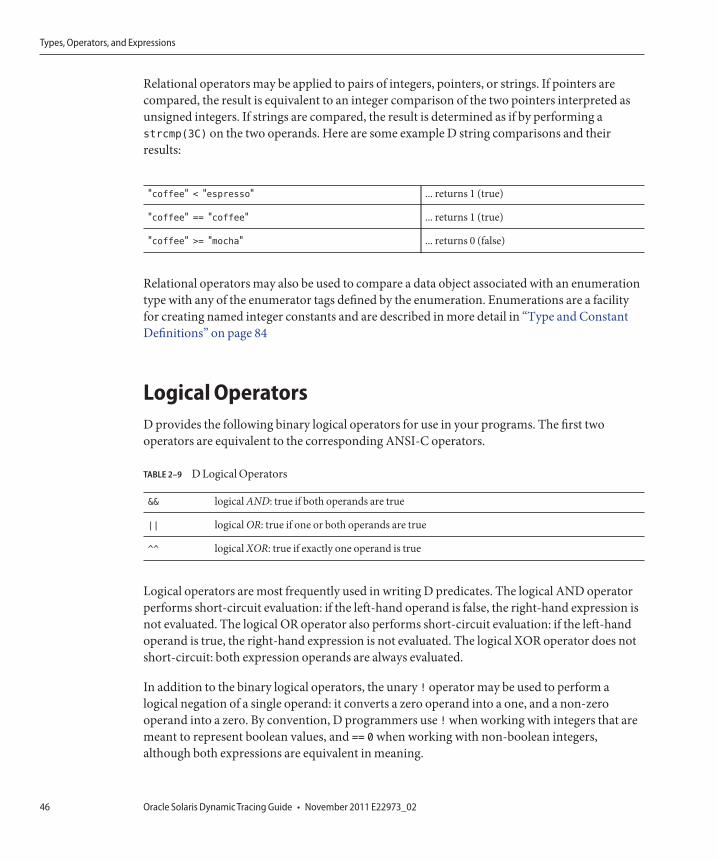
Relational operators may be applied to pairs of integers, pointers, or strings. If pointers arecompared, the result is equivalent to an integer comparison of the two pointers interpreted asunsigned integers. If strings are compared, the result is determined as if by performing astrcmp(3C) on the two operands. Here are some example D string comparisons and theirresults:
"coffee" < "espresso" ... returns 1 (true)
"coffee" == "coffee" ... returns 1 (true)
"coffee" >= "mocha" ... returns 0 (false)
Relational operators may also be used to compare a data object associated with an enumerationtype with any of the enumerator tags defined by the enumeration. Enumerations are a facilityfor creating named integer constants and are described in more detail in “Type and ConstantDefinitions” on page 84
Logical OperatorsD provides the following binary logical operators for use in your programs. The first twooperators are equivalent to the corresponding ANSI-C operators.
TABLE 2–9 D Logical Operators
&& logical AND: true if both operands are true
|| logical OR: true if one or both operands are true
^^ logical XOR: true if exactly one operand is true
Logical operators are most frequently used in writing D predicates. The logical AND operatorperforms short-circuit evaluation: if the left-hand operand is false, the right-hand expression isnot evaluated. The logical OR operator also performs short-circuit evaluation: if the left-handoperand is true, the right-hand expression is not evaluated. The logical XOR operator does notshort-circuit: both expression operands are always evaluated.
In addition to the binary logical operators, the unary ! operator may be used to perform alogical negation of a single operand: it converts a zero operand into a one, and a non-zerooperand into a zero. By convention, D programmers use ! when working with integers that aremeant to represent boolean values, and == 0 when working with non-boolean integers,although both expressions are equivalent in meaning.
Types, Operators, and Expressions
Oracle Solaris Dynamic Tracing Guide • November 2011 E22973_0246
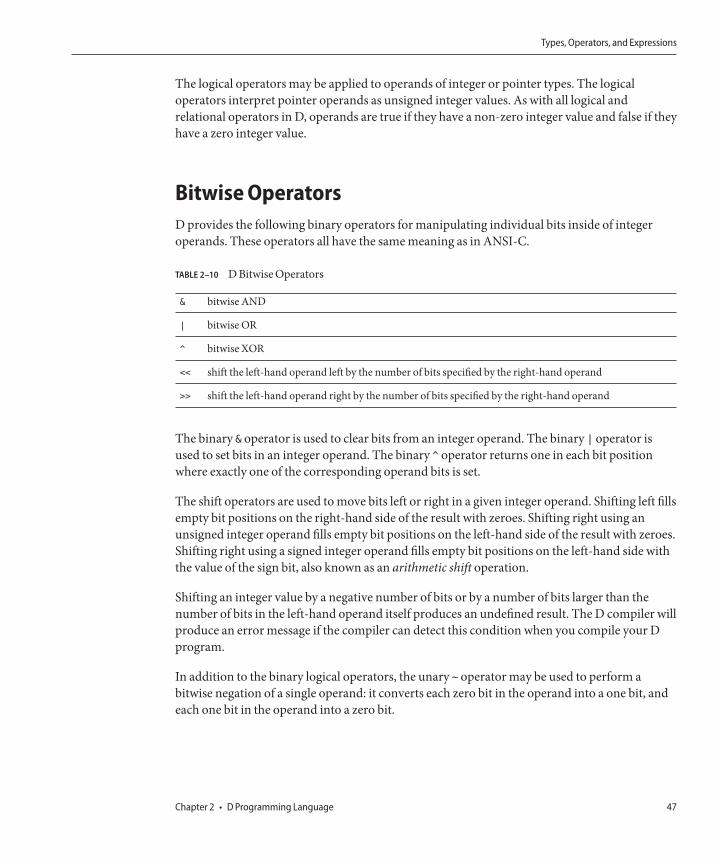
The logical operators may be applied to operands of integer or pointer types. The logicaloperators interpret pointer operands as unsigned integer values. As with all logical andrelational operators in D, operands are true if they have a non-zero integer value and false if theyhave a zero integer value.
Bitwise OperatorsD provides the following binary operators for manipulating individual bits inside of integeroperands. These operators all have the same meaning as in ANSI-C.
TABLE 2–10 D Bitwise Operators
& bitwise AND
| bitwise OR
^ bitwise XOR
<< shift the left-hand operand left by the number of bits specified by the right-hand operand
>> shift the left-hand operand right by the number of bits specified by the right-hand operand
The binary & operator is used to clear bits from an integer operand. The binary | operator isused to set bits in an integer operand. The binary ^ operator returns one in each bit positionwhere exactly one of the corresponding operand bits is set.
The shift operators are used to move bits left or right in a given integer operand. Shifting left fillsempty bit positions on the right-hand side of the result with zeroes. Shifting right using anunsigned integer operand fills empty bit positions on the left-hand side of the result with zeroes.Shifting right using a signed integer operand fills empty bit positions on the left-hand side withthe value of the sign bit, also known as an arithmetic shift operation.
Shifting an integer value by a negative number of bits or by a number of bits larger than thenumber of bits in the left-hand operand itself produces an undefined result. The D compiler willproduce an error message if the compiler can detect this condition when you compile your Dprogram.
In addition to the binary logical operators, the unary ~ operator may be used to perform abitwise negation of a single operand: it converts each zero bit in the operand into a one bit, andeach one bit in the operand into a zero bit.
Types, Operators, and Expressions
Chapter 2 • D Programming Language 47
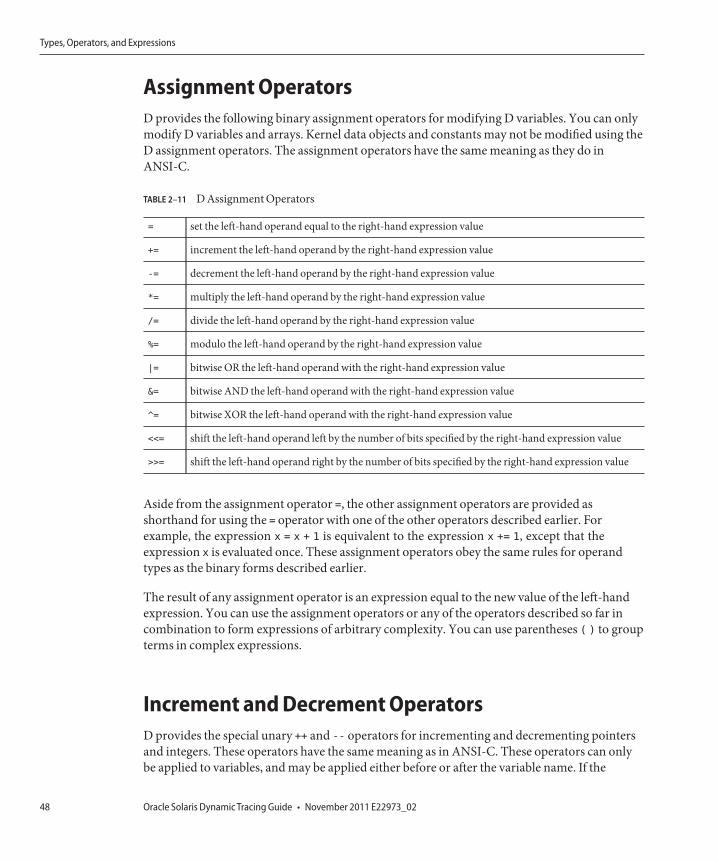
Assignment OperatorsD provides the following binary assignment operators for modifying D variables. You can onlymodify D variables and arrays. Kernel data objects and constants may not be modified using theD assignment operators. The assignment operators have the same meaning as they do inANSI-C.
TABLE 2–11 D Assignment Operators
= set the left-hand operand equal to the right-hand expression value
+= increment the left-hand operand by the right-hand expression value
-= decrement the left-hand operand by the right-hand expression value
*= multiply the left-hand operand by the right-hand expression value
/= divide the left-hand operand by the right-hand expression value
%= modulo the left-hand operand by the right-hand expression value
|= bitwise OR the left-hand operand with the right-hand expression value
&= bitwise AND the left-hand operand with the right-hand expression value
^= bitwise XOR the left-hand operand with the right-hand expression value
<<= shift the left-hand operand left by the number of bits specified by the right-hand expression value
>>= shift the left-hand operand right by the number of bits specified by the right-hand expression value
Aside from the assignment operator =, the other assignment operators are provided asshorthand for using the = operator with one of the other operators described earlier. Forexample, the expression x = x + 1 is equivalent to the expression x += 1, except that theexpression x is evaluated once. These assignment operators obey the same rules for operandtypes as the binary forms described earlier.
The result of any assignment operator is an expression equal to the new value of the left-handexpression. You can use the assignment operators or any of the operators described so far incombination to form expressions of arbitrary complexity. You can use parentheses ( ) to groupterms in complex expressions.
Increment and Decrement OperatorsD provides the special unary ++ and -- operators for incrementing and decrementing pointersand integers. These operators have the same meaning as in ANSI-C. These operators can onlybe applied to variables, and may be applied either before or after the variable name. If the
Types, Operators, and Expressions
Oracle Solaris Dynamic Tracing Guide • November 2011 E22973_0248
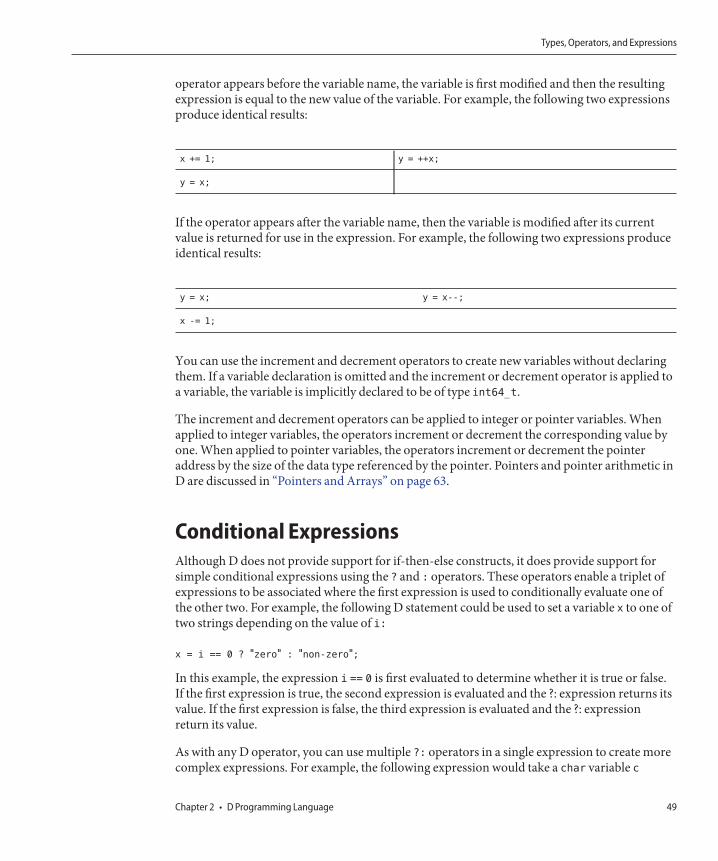
operator appears before the variable name, the variable is first modified and then the resultingexpression is equal to the new value of the variable. For example, the following two expressionsproduce identical results:
x += 1; y = ++x;
y = x;
If the operator appears after the variable name, then the variable is modified after its currentvalue is returned for use in the expression. For example, the following two expressions produceidentical results:
y = x; y = x--;
x -= 1;
You can use the increment and decrement operators to create new variables without declaringthem. If a variable declaration is omitted and the increment or decrement operator is applied toa variable, the variable is implicitly declared to be of type int64_t.
The increment and decrement operators can be applied to integer or pointer variables. Whenapplied to integer variables, the operators increment or decrement the corresponding value byone. When applied to pointer variables, the operators increment or decrement the pointeraddress by the size of the data type referenced by the pointer. Pointers and pointer arithmetic inD are discussed in “Pointers and Arrays” on page 63.
Conditional ExpressionsAlthough D does not provide support for if-then-else constructs, it does provide support forsimple conditional expressions using the ? and : operators. These operators enable a triplet ofexpressions to be associated where the first expression is used to conditionally evaluate one ofthe other two. For example, the following D statement could be used to set a variable x to one oftwo strings depending on the value of i:
x = i == 0 ? "zero" : "non-zero";
In this example, the expression i == 0 is first evaluated to determine whether it is true or false.If the first expression is true, the second expression is evaluated and the ?: expression returns itsvalue. If the first expression is false, the third expression is evaluated and the ?: expressionreturn its value.
As with any D operator, you can use multiple ?: operators in a single expression to create morecomplex expressions. For example, the following expression would take a char variable c
Types, Operators, and Expressions
Chapter 2 • D Programming Language 49
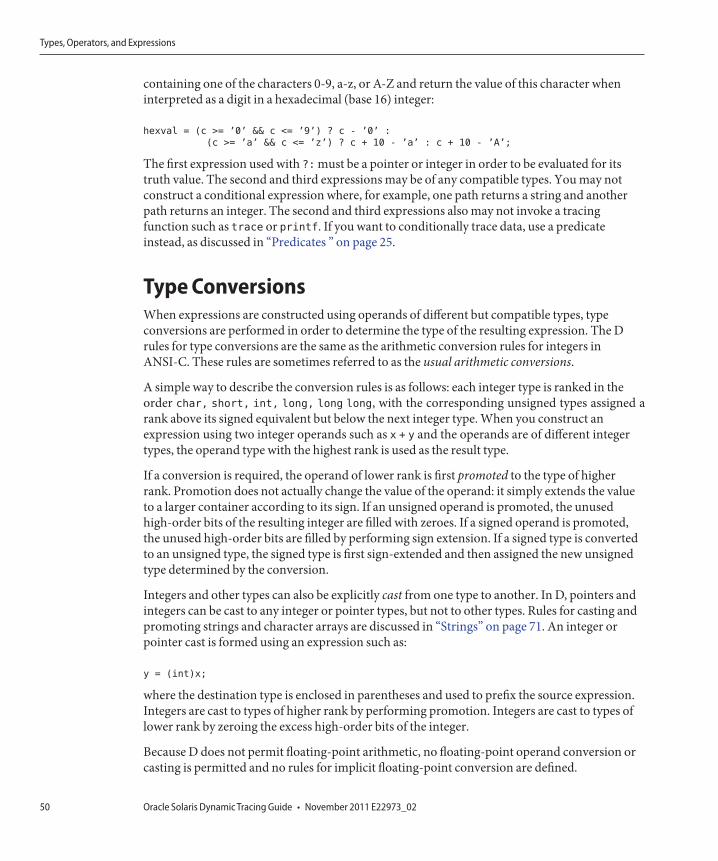
containing one of the characters 0-9, a-z, or A-Z and return the value of this character wheninterpreted as a digit in a hexadecimal (base 16) integer:
hexval = (c >= ’0’ && c <= ’9’) ? c - ’0’ :
(c >= ’a’ && c <= ’z’) ? c + 10 - ’a’ : c + 10 - ’A’;
The first expression used with ?: must be a pointer or integer in order to be evaluated for itstruth value. The second and third expressions may be of any compatible types. You may notconstruct a conditional expression where, for example, one path returns a string and anotherpath returns an integer. The second and third expressions also may not invoke a tracingfunction such as trace or printf. If you want to conditionally trace data, use a predicateinstead, as discussed in “Predicates ” on page 25.
Type ConversionsWhen expressions are constructed using operands of different but compatible types, typeconversions are performed in order to determine the type of the resulting expression. The Drules for type conversions are the same as the arithmetic conversion rules for integers inANSI-C. These rules are sometimes referred to as the usual arithmetic conversions.
A simple way to describe the conversion rules is as follows: each integer type is ranked in theorder char, short, int, long, long long, with the corresponding unsigned types assigned arank above its signed equivalent but below the next integer type. When you construct anexpression using two integer operands such as x + y and the operands are of different integertypes, the operand type with the highest rank is used as the result type.
If a conversion is required, the operand of lower rank is first promoted to the type of higherrank. Promotion does not actually change the value of the operand: it simply extends the valueto a larger container according to its sign. If an unsigned operand is promoted, the unusedhigh-order bits of the resulting integer are filled with zeroes. If a signed operand is promoted,the unused high-order bits are filled by performing sign extension. If a signed type is convertedto an unsigned type, the signed type is first sign-extended and then assigned the new unsignedtype determined by the conversion.
Integers and other types can also be explicitly cast from one type to another. In D, pointers andintegers can be cast to any integer or pointer types, but not to other types. Rules for casting andpromoting strings and character arrays are discussed in “Strings” on page 71. An integer orpointer cast is formed using an expression such as:
y = (int)x;
where the destination type is enclosed in parentheses and used to prefix the source expression.Integers are cast to types of higher rank by performing promotion. Integers are cast to types oflower rank by zeroing the excess high-order bits of the integer.
Because D does not permit floating-point arithmetic, no floating-point operand conversion orcasting is permitted and no rules for implicit floating-point conversion are defined.
Types, Operators, and Expressions
Oracle Solaris Dynamic Tracing Guide • November 2011 E22973_0250
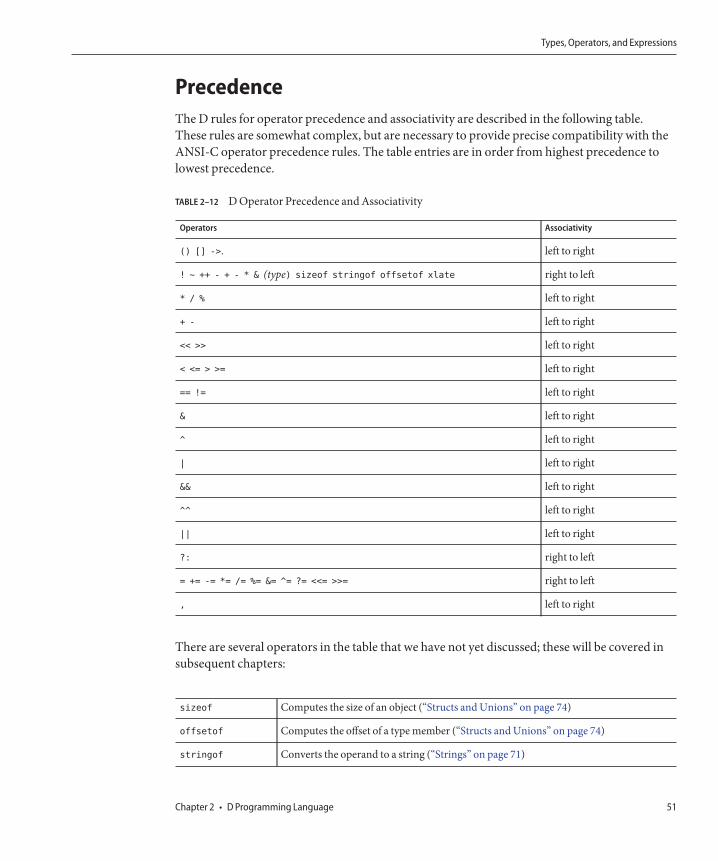
PrecedenceThe D rules for operator precedence and associativity are described in the following table.These rules are somewhat complex, but are necessary to provide precise compatibility with theANSI-C operator precedence rules. The table entries are in order from highest precedence tolowest precedence.
TABLE 2–12 D Operator Precedence and Associativity
Operators Associativity
() [] ->. left to right
! ~ ++ - + - * & (type) sizeof stringof offsetof xlate right to left
* / % left to right
+ - left to right
<< >> left to right
< <= > >= left to right
== != left to right
& left to right
^ left to right
| left to right
&& left to right
^^ left to right
|| left to right
?: right to left
= += -= *= /= %= &= ^= ?= <<= >>= right to left
, left to right
There are several operators in the table that we have not yet discussed; these will be covered insubsequent chapters:
sizeof Computes the size of an object (“Structs and Unions” on page 74)
offsetof Computes the offset of a type member (“Structs and Unions” on page 74)
stringof Converts the operand to a string (“Strings” on page 71)
Types, Operators, and Expressions
Chapter 2 • D Programming Language 51
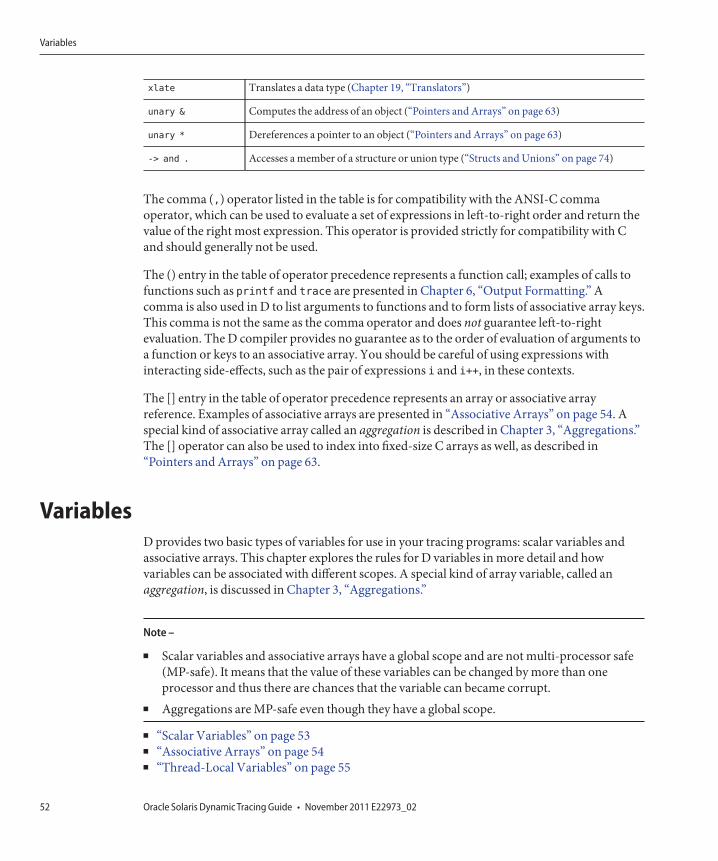
xlate Translates a data type (Chapter 19, “Translators”)
unary & Computes the address of an object (“Pointers and Arrays” on page 63)
unary * Dereferences a pointer to an object (“Pointers and Arrays” on page 63)
-> and . Accesses a member of a structure or union type (“Structs and Unions” on page 74)
The comma (,) operator listed in the table is for compatibility with the ANSI-C commaoperator, which can be used to evaluate a set of expressions in left-to-right order and return thevalue of the right most expression. This operator is provided strictly for compatibility with Cand should generally not be used.
The () entry in the table of operator precedence represents a function call; examples of calls tofunctions such as printf and trace are presented in Chapter 6, “Output Formatting.” Acomma is also used in D to list arguments to functions and to form lists of associative array keys.This comma is not the same as the comma operator and does not guarantee left-to-rightevaluation. The D compiler provides no guarantee as to the order of evaluation of arguments toa function or keys to an associative array. You should be careful of using expressions withinteracting side-effects, such as the pair of expressions i and i++, in these contexts.
The [] entry in the table of operator precedence represents an array or associative arrayreference. Examples of associative arrays are presented in “Associative Arrays” on page 54. Aspecial kind of associative array called an aggregation is described in Chapter 3, “Aggregations.”The [] operator can also be used to index into fixed-size C arrays as well, as described in“Pointers and Arrays” on page 63.
VariablesD provides two basic types of variables for use in your tracing programs: scalar variables andassociative arrays. This chapter explores the rules for D variables in more detail and howvariables can be associated with different scopes. A special kind of array variable, called anaggregation, is discussed in Chapter 3, “Aggregations.”
Note –
■ Scalar variables and associative arrays have a global scope and are not multi-processor safe(MP-safe). It means that the value of these variables can be changed by more than oneprocessor and thus there are chances that the variable can became corrupt.
■ Aggregations are MP-safe even though they have a global scope.
■ “Scalar Variables” on page 53■ “Associative Arrays” on page 54■ “Thread-Local Variables” on page 55
Variables
Oracle Solaris Dynamic Tracing Guide • November 2011 E22973_0252
■ “Clause-Local Variables” on page 58■ “Built-in Variables” on page 60■ “External Variables” on page 62
Scalar VariablesScalar variables are used to represent individual fixed-size data objects, such as integers andpointers. Scalar variables can also be used for fixed-size objects that are composed of one ormore primitive or composite types. D provides the ability to create both arrays of objects as wellas composite structures. DTrace also represents strings as fixed-size scalars by permitting themto grow up to a predefined maximum length. Control over string length in your D program isdiscussed further in “Strings” on page 71.
Scalar variables are created automatically the first time you assign a value to a previouslyundefined identifier in your D program. For example, to create a scalar variable named x of typeint, you can simply assign it a value of type int in any probe clause:
BEGIN
{
x = 123;
}
Scalar variables created in this manner are global variables: their name and data storage locationis defined once and is visible in every clause of your D program. Any time you reference theidentifier x, you are referring to a single storage location associated with this variable.
Unlike ANSI-C, D does not require explicit variable declarations. If you do want to declare aglobal variable to assign its name and type explicitly before using it, you can place a declarationoutside of the probe clauses in your program as shown in the following example. Explicitvariable declarations are not necessary in most D programs, but are sometimes useful when youwant to carefully control your variable types or when you want to begin your program with a setof declarations and comments documenting your program's variables and their meanings.
int x; /* declare an integer x for later use */
BEGIN
{
x = 123;
...
}
Unlike ANSI-C declarations, D variable declarations may not assign initial values. You mustuse a BEGIN probe clause to assign any initial values. All global variable storage is filled withzeroes by DTrace before you first reference the variable.
The D language definition places no limit on the size and number of D variables, but limits aredefined by the DTrace implementation and by the memory available on your system. The D
Variables
Chapter 2 • D Programming Language 53
compiler will enforce any of the limitations that can be applied at the time you compile yourprogram. You can learn more about how to tune options related to program limits inChapter 10, “Options and Tunables.”
Associative ArraysAssociative arrays are used to represent collections of data elements that can be retrieved byspecifying a name called a key. D associative array keys are formed by a list of scalar expressionvalues called a tuple. You can think of the array tuple itself as an imaginary parameter list to afunction that is called to retrieve the corresponding array value when you reference the array.Each D associative array has a fixed key signature consisting of a fixed number of tuple elementswhere each element has a given, fixed type. You can define different key signatures for eacharray in your D program.
Associative arrays differ from normal, fixed-size arrays in that they have no predefined limit onthe number of elements, the elements can be indexed by any tuple as opposed to just usingintegers as keys, and the elements are not stored in preallocated consecutive storage locations.Associative arrays are useful in situations where you would use a hash table or other simpledictionary data structure in a C, C++, or Java language program. Associative arrays give you theability to create a dynamic history of events and state captured in your D program that you canuse to create more complex control flows.
To define an associative array, you write an assignment expression of the form:
name [ key ] = expression ;
where name is any valid D identifier and key is a comma-separated list of one or moreexpressions. For example, the following statement defines an associative array a with keysignature [ int, string ] and stores the integer value 456 in a location named by the tuple [123, "hello" ]:
a[123, "hello"] = 456;
The type of each object contained in the array is also fixed for all elements in a given array.Because a was first assigned using the integer 456, every subsequent value stored in the arraywill also be of type int. You can use any of the assignment operators defined in “Types,Operators, and Expressions” on page 40 to modify associative array elements, subject to theoperand rules defined for each operator. The D compiler will produce an appropriate errormessage if you attempt an incompatible assignment. You can use any type with an associativearray key or value that you can use with a scalar variable. You cannot nest an associative arraywithin another associative array as a key or value.
You can reference an associative array using any tuple that is compatible with the array keysignature. The rules for tuple compatibility are similar to those for function calls and variable
Variables
Oracle Solaris Dynamic Tracing Guide • November 2011 E22973_0254
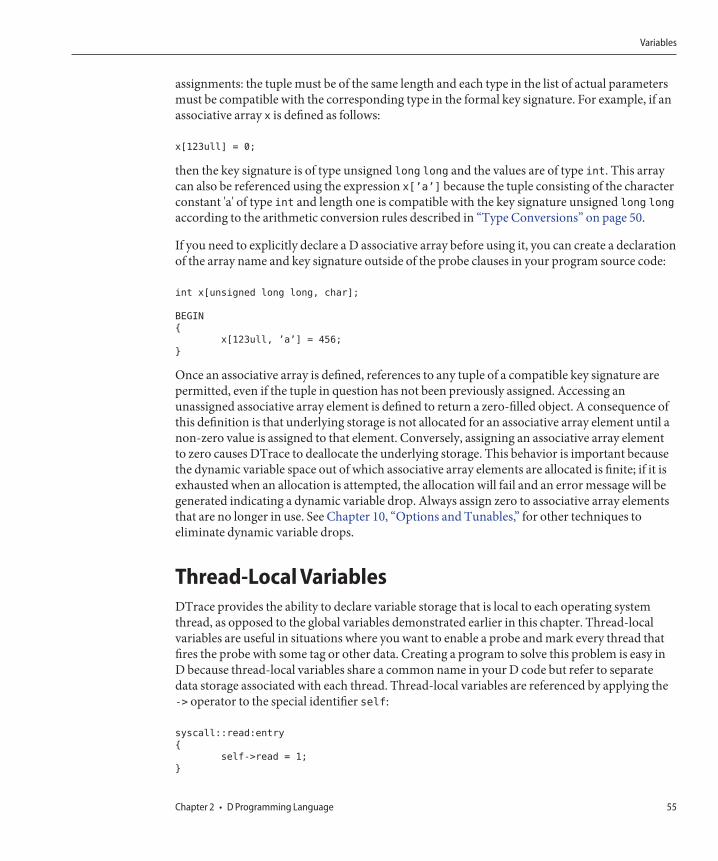
assignments: the tuple must be of the same length and each type in the list of actual parametersmust be compatible with the corresponding type in the formal key signature. For example, if anassociative array x is defined as follows:
x[123ull] = 0;
then the key signature is of type unsigned long long and the values are of type int. This arraycan also be referenced using the expression x[’a’] because the tuple consisting of the characterconstant 'a' of type int and length one is compatible with the key signature unsigned long long
according to the arithmetic conversion rules described in “Type Conversions” on page 50.
If you need to explicitly declare a D associative array before using it, you can create a declarationof the array name and key signature outside of the probe clauses in your program source code:
int x[unsigned long long, char];
BEGIN
{
x[123ull, ’a’] = 456;
}
Once an associative array is defined, references to any tuple of a compatible key signature arepermitted, even if the tuple in question has not been previously assigned. Accessing anunassigned associative array element is defined to return a zero-filled object. A consequence ofthis definition is that underlying storage is not allocated for an associative array element until anon-zero value is assigned to that element. Conversely, assigning an associative array elementto zero causes DTrace to deallocate the underlying storage. This behavior is important becausethe dynamic variable space out of which associative array elements are allocated is finite; if it isexhausted when an allocation is attempted, the allocation will fail and an error message will begenerated indicating a dynamic variable drop. Always assign zero to associative array elementsthat are no longer in use. See Chapter 10, “Options and Tunables,” for other techniques toeliminate dynamic variable drops.
Thread-Local VariablesDTrace provides the ability to declare variable storage that is local to each operating systemthread, as opposed to the global variables demonstrated earlier in this chapter. Thread-localvariables are useful in situations where you want to enable a probe and mark every thread thatfires the probe with some tag or other data. Creating a program to solve this problem is easy inD because thread-local variables share a common name in your D code but refer to separatedata storage associated with each thread. Thread-local variables are referenced by applying the-> operator to the special identifier self:
syscall::read:entry
{
self->read = 1;
}
Variables
Chapter 2 • D Programming Language 55
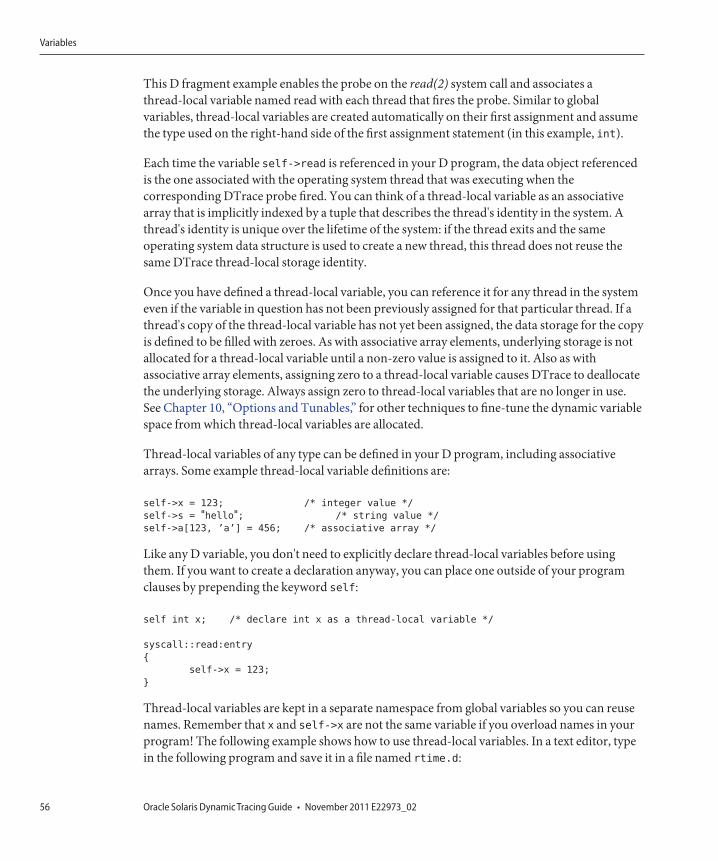
This D fragment example enables the probe on the read(2) system call and associates athread-local variable named read with each thread that fires the probe. Similar to globalvariables, thread-local variables are created automatically on their first assignment and assumethe type used on the right-hand side of the first assignment statement (in this example, int).
Each time the variable self->read is referenced in your D program, the data object referencedis the one associated with the operating system thread that was executing when thecorresponding DTrace probe fired. You can think of a thread-local variable as an associativearray that is implicitly indexed by a tuple that describes the thread's identity in the system. Athread's identity is unique over the lifetime of the system: if the thread exits and the sameoperating system data structure is used to create a new thread, this thread does not reuse thesame DTrace thread-local storage identity.
Once you have defined a thread-local variable, you can reference it for any thread in the systemeven if the variable in question has not been previously assigned for that particular thread. If athread's copy of the thread-local variable has not yet been assigned, the data storage for the copyis defined to be filled with zeroes. As with associative array elements, underlying storage is notallocated for a thread-local variable until a non-zero value is assigned to it. Also as withassociative array elements, assigning zero to a thread-local variable causes DTrace to deallocatethe underlying storage. Always assign zero to thread-local variables that are no longer in use.See Chapter 10, “Options and Tunables,” for other techniques to fine-tune the dynamic variablespace from which thread-local variables are allocated.
Thread-local variables of any type can be defined in your D program, including associativearrays. Some example thread-local variable definitions are:
self->x = 123; /* integer value */
self->s = "hello"; /* string value */
self->a[123, ’a’] = 456; /* associative array */
Like any D variable, you don't need to explicitly declare thread-local variables before usingthem. If you want to create a declaration anyway, you can place one outside of your programclauses by prepending the keyword self:
self int x; /* declare int x as a thread-local variable */
syscall::read:entry
{
self->x = 123;
}
Thread-local variables are kept in a separate namespace from global variables so you can reusenames. Remember that x and self->x are not the same variable if you overload names in yourprogram! The following example shows how to use thread-local variables. In a text editor, typein the following program and save it in a file named rtime.d:
Variables
Oracle Solaris Dynamic Tracing Guide • November 2011 E22973_0256
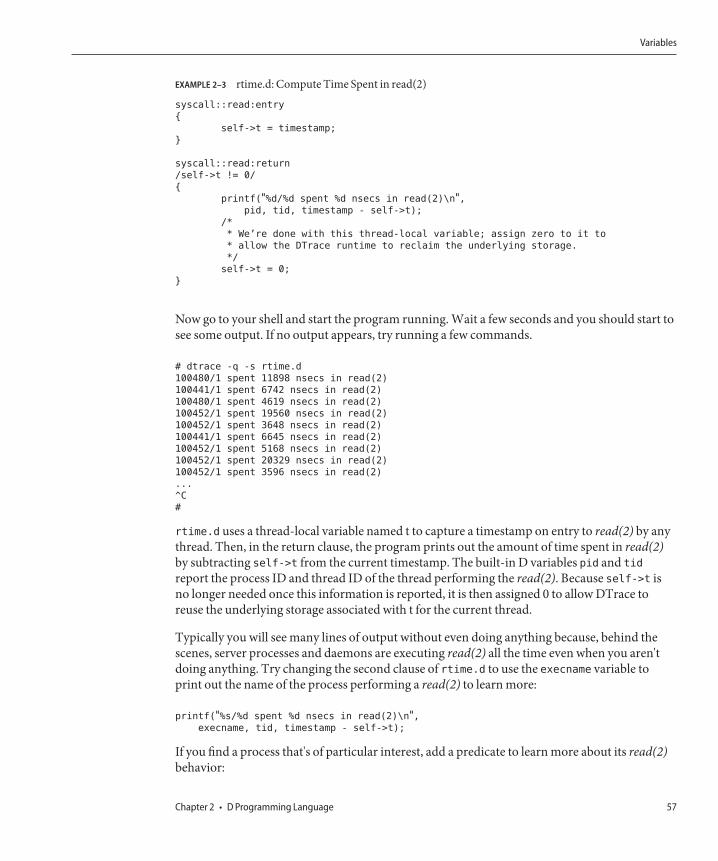
EXAMPLE 2–3 rtime.d: Compute Time Spent in read(2)
syscall::read:entry
{
self->t = timestamp;
}
syscall::read:return
/self->t != 0/
{
printf("%d/%d spent %d nsecs in read(2)\n",pid, tid, timestamp - self->t);
/*
* We’re done with this thread-local variable; assign zero to it to
* allow the DTrace runtime to reclaim the underlying storage.
*/
self->t = 0;
}
Now go to your shell and start the program running. Wait a few seconds and you should start tosee some output. If no output appears, try running a few commands.
# dtrace -q -s rtime.d
100480/1 spent 11898 nsecs in read(2)
100441/1 spent 6742 nsecs in read(2)
100480/1 spent 4619 nsecs in read(2)
100452/1 spent 19560 nsecs in read(2)
100452/1 spent 3648 nsecs in read(2)
100441/1 spent 6645 nsecs in read(2)
100452/1 spent 5168 nsecs in read(2)
100452/1 spent 20329 nsecs in read(2)
100452/1 spent 3596 nsecs in read(2)
...
^C
#
rtime.d uses a thread-local variable named t to capture a timestamp on entry to read(2) by anythread. Then, in the return clause, the program prints out the amount of time spent in read(2)by subtracting self->t from the current timestamp. The built-in D variables pid and tid
report the process ID and thread ID of the thread performing the read(2). Because self->t isno longer needed once this information is reported, it is then assigned 0 to allow DTrace toreuse the underlying storage associated with t for the current thread.
Typically you will see many lines of output without even doing anything because, behind thescenes, server processes and daemons are executing read(2) all the time even when you aren'tdoing anything. Try changing the second clause of rtime.d to use the execname variable toprint out the name of the process performing a read(2) to learn more:
printf("%s/%d spent %d nsecs in read(2)\n",execname, tid, timestamp - self->t);
If you find a process that's of particular interest, add a predicate to learn more about its read(2)behavior:
Variables
Chapter 2 • D Programming Language 57
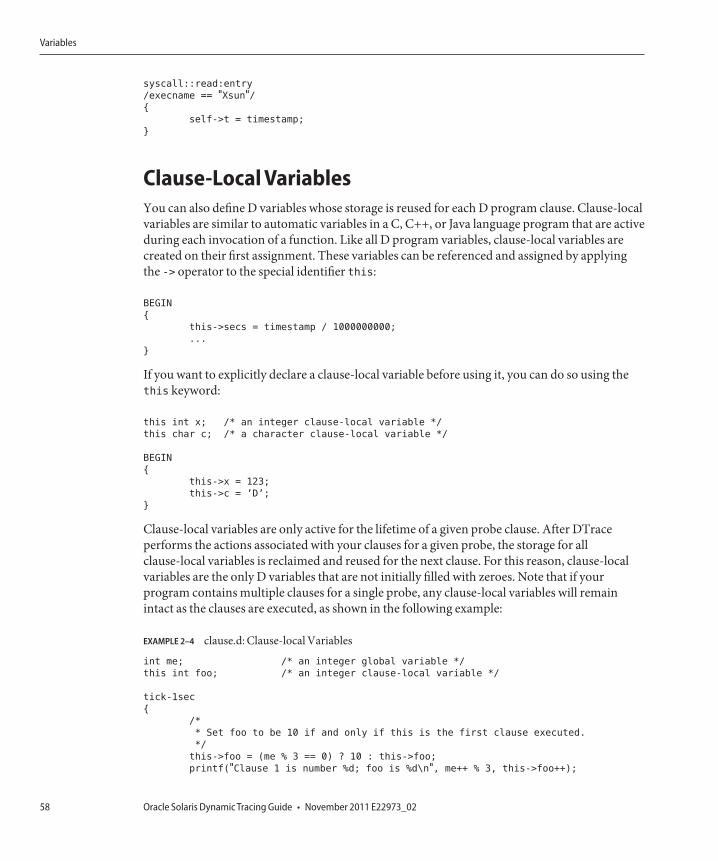
syscall::read:entry
/execname == "Xsun"/{
self->t = timestamp;
}
Clause-Local VariablesYou can also define D variables whose storage is reused for each D program clause. Clause-localvariables are similar to automatic variables in a C, C++, or Java language program that are activeduring each invocation of a function. Like all D program variables, clause-local variables arecreated on their first assignment. These variables can be referenced and assigned by applyingthe -> operator to the special identifier this:
BEGIN
{
this->secs = timestamp / 1000000000;
...
}
If you want to explicitly declare a clause-local variable before using it, you can do so using thethis keyword:
this int x; /* an integer clause-local variable */
this char c; /* a character clause-local variable */
BEGIN
{
this->x = 123;
this->c = ’D’;
}
Clause-local variables are only active for the lifetime of a given probe clause. After DTraceperforms the actions associated with your clauses for a given probe, the storage for allclause-local variables is reclaimed and reused for the next clause. For this reason, clause-localvariables are the only D variables that are not initially filled with zeroes. Note that if yourprogram contains multiple clauses for a single probe, any clause-local variables will remainintact as the clauses are executed, as shown in the following example:
EXAMPLE 2–4 clause.d: Clause-local Variables
int me; /* an integer global variable */
this int foo; /* an integer clause-local variable */
tick-1sec
{
/*
* Set foo to be 10 if and only if this is the first clause executed.
*/
this->foo = (me % 3 == 0) ? 10 : this->foo;
printf("Clause 1 is number %d; foo is %d\n", me++ % 3, this->foo++);
Variables
Oracle Solaris Dynamic Tracing Guide • November 2011 E22973_0258
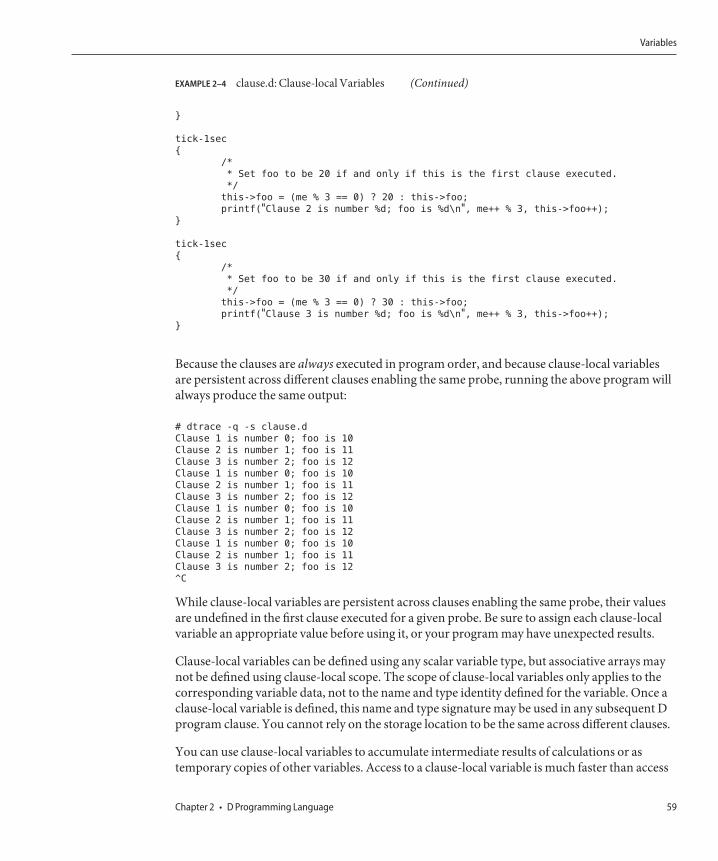
EXAMPLE 2–4 clause.d: Clause-local Variables (Continued)
}
tick-1sec
{
/*
* Set foo to be 20 if and only if this is the first clause executed.
*/
this->foo = (me % 3 == 0) ? 20 : this->foo;
printf("Clause 2 is number %d; foo is %d\n", me++ % 3, this->foo++);
}
tick-1sec
{
/*
* Set foo to be 30 if and only if this is the first clause executed.
*/
this->foo = (me % 3 == 0) ? 30 : this->foo;
printf("Clause 3 is number %d; foo is %d\n", me++ % 3, this->foo++);
}
Because the clauses are always executed in program order, and because clause-local variablesare persistent across different clauses enabling the same probe, running the above program willalways produce the same output:
# dtrace -q -s clause.d
Clause 1 is number 0; foo is 10
Clause 2 is number 1; foo is 11
Clause 3 is number 2; foo is 12
Clause 1 is number 0; foo is 10
Clause 2 is number 1; foo is 11
Clause 3 is number 2; foo is 12
Clause 1 is number 0; foo is 10
Clause 2 is number 1; foo is 11
Clause 3 is number 2; foo is 12
Clause 1 is number 0; foo is 10
Clause 2 is number 1; foo is 11
Clause 3 is number 2; foo is 12
^C
While clause-local variables are persistent across clauses enabling the same probe, their valuesare undefined in the first clause executed for a given probe. Be sure to assign each clause-localvariable an appropriate value before using it, or your program may have unexpected results.
Clause-local variables can be defined using any scalar variable type, but associative arrays maynot be defined using clause-local scope. The scope of clause-local variables only applies to thecorresponding variable data, not to the name and type identity defined for the variable. Once aclause-local variable is defined, this name and type signature may be used in any subsequent Dprogram clause. You cannot rely on the storage location to be the same across different clauses.
You can use clause-local variables to accumulate intermediate results of calculations or astemporary copies of other variables. Access to a clause-local variable is much faster than access
Variables
Chapter 2 • D Programming Language 59
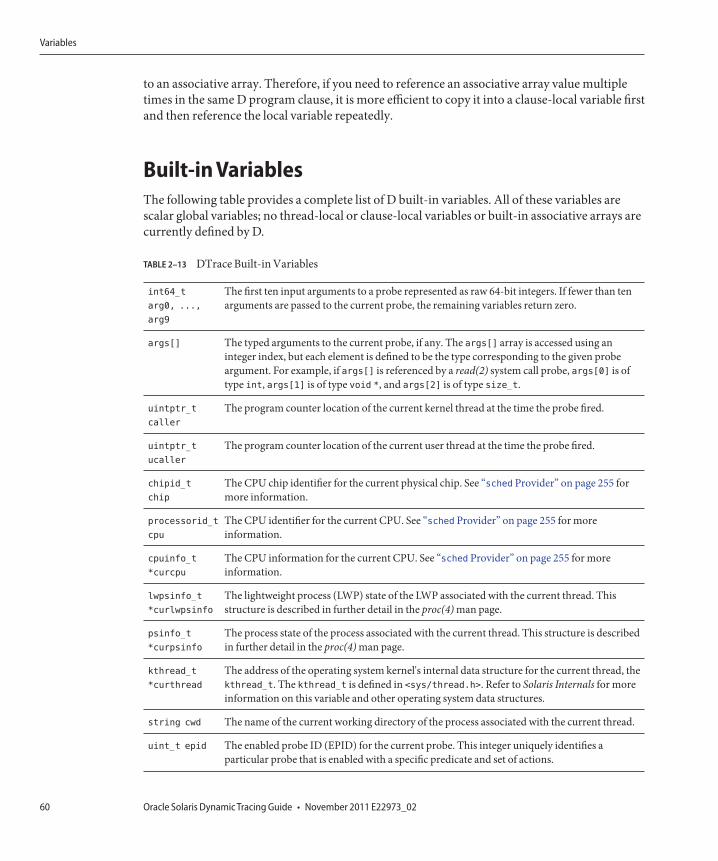
to an associative array. Therefore, if you need to reference an associative array value multipletimes in the same D program clause, it is more efficient to copy it into a clause-local variable firstand then reference the local variable repeatedly.
Built-in VariablesThe following table provides a complete list of D built-in variables. All of these variables arescalar global variables; no thread-local or clause-local variables or built-in associative arrays arecurrently defined by D.
TABLE 2–13 DTrace Built-in Variables
int64_t
arg0, ...,
arg9
The first ten input arguments to a probe represented as raw 64-bit integers. If fewer than tenarguments are passed to the current probe, the remaining variables return zero.
args[] The typed arguments to the current probe, if any. The args[] array is accessed using aninteger index, but each element is defined to be the type corresponding to the given probeargument. For example, if args[] is referenced by a read(2) system call probe, args[0] is oftype int, args[1] is of type void *, and args[2] is of type size_t.
uintptr_t
caller
The program counter location of the current kernel thread at the time the probe fired.
uintptr_t
ucaller
The program counter location of the current user thread at the time the probe fired.
chipid_t
chip
The CPU chip identifier for the current physical chip. See “sched Provider” on page 255 formore information.
processorid_t
cpu
The CPU identifier for the current CPU. See “sched Provider” on page 255 for moreinformation.
cpuinfo_t
*curcpu
The CPU information for the current CPU. See “sched Provider” on page 255 for moreinformation.
lwpsinfo_t
*curlwpsinfo
The lightweight process (LWP) state of the LWP associated with the current thread. Thisstructure is described in further detail in the proc(4) man page.
psinfo_t
*curpsinfo
The process state of the process associated with the current thread. This structure is describedin further detail in the proc(4) man page.
kthread_t
*curthread
The address of the operating system kernel's internal data structure for the current thread, thekthread_t. The kthread_t is defined in <sys/thread.h>. Refer to Solaris Internals for moreinformation on this variable and other operating system data structures.
string cwd The name of the current working directory of the process associated with the current thread.
uint_t epid The enabled probe ID (EPID) for the current probe. This integer uniquely identifies aparticular probe that is enabled with a specific predicate and set of actions.
Variables
Oracle Solaris Dynamic Tracing Guide • November 2011 E22973_0260
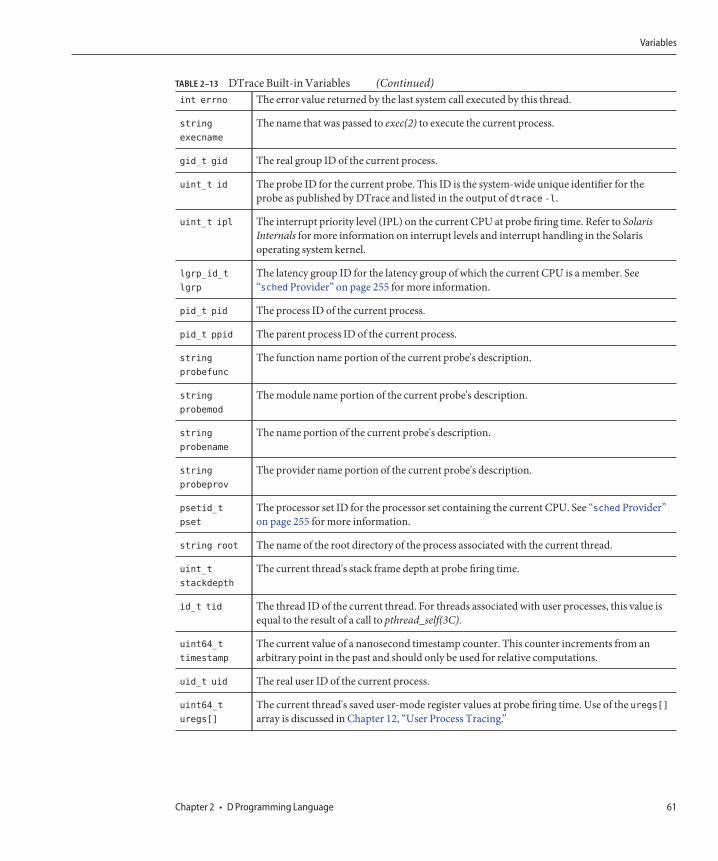
TABLE 2–13 DTrace Built-in Variables (Continued)int errno The error value returned by the last system call executed by this thread.
string
execname
The name that was passed to exec(2) to execute the current process.
gid_t gid The real group ID of the current process.
uint_t id The probe ID for the current probe. This ID is the system-wide unique identifier for theprobe as published by DTrace and listed in the output of dtrace -l.
uint_t ipl The interrupt priority level (IPL) on the current CPU at probe firing time. Refer to SolarisInternals for more information on interrupt levels and interrupt handling in the Solarisoperating system kernel.
lgrp_id_t
lgrp
The latency group ID for the latency group of which the current CPU is a member. See“sched Provider” on page 255 for more information.
pid_t pid The process ID of the current process.
pid_t ppid The parent process ID of the current process.
string
probefunc
The function name portion of the current probe's description.
string
probemod
The module name portion of the current probe's description.
string
probename
The name portion of the current probe's description.
string
probeprov
The provider name portion of the current probe's description.
psetid_t
pset
The processor set ID for the processor set containing the current CPU. See “sched Provider”on page 255 for more information.
string root The name of the root directory of the process associated with the current thread.
uint_t
stackdepth
The current thread's stack frame depth at probe firing time.
id_t tid The thread ID of the current thread. For threads associated with user processes, this value isequal to the result of a call to pthread_self(3C).
uint64_t
timestamp
The current value of a nanosecond timestamp counter. This counter increments from anarbitrary point in the past and should only be used for relative computations.
uid_t uid The real user ID of the current process.
uint64_t
uregs[]
The current thread's saved user-mode register values at probe firing time. Use of the uregs[]array is discussed in Chapter 12, “User Process Tracing.”
Variables
Chapter 2 • D Programming Language 61
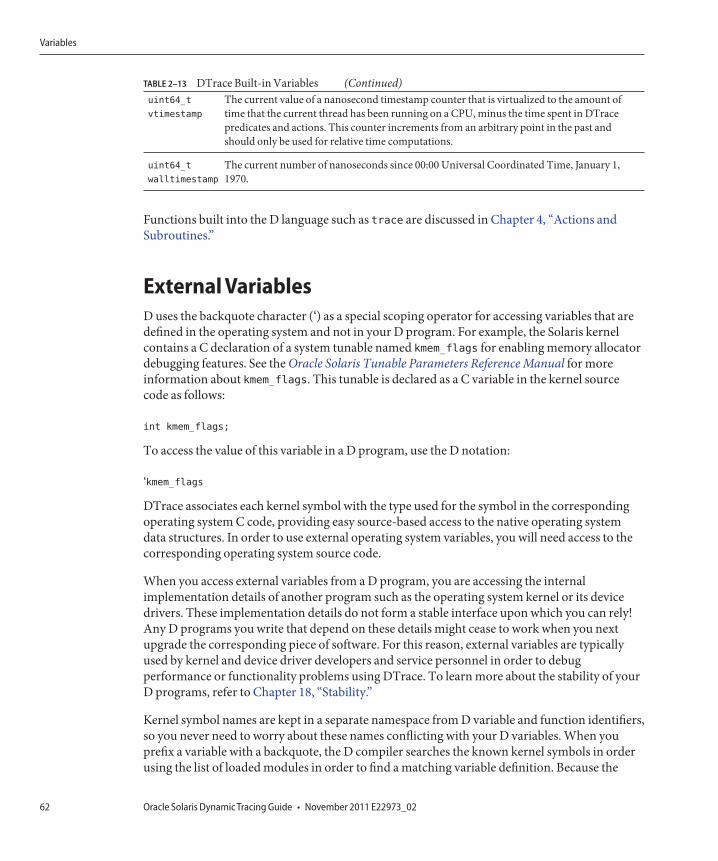
TABLE 2–13 DTrace Built-in Variables (Continued)uint64_t
vtimestamp
The current value of a nanosecond timestamp counter that is virtualized to the amount oftime that the current thread has been running on a CPU, minus the time spent in DTracepredicates and actions. This counter increments from an arbitrary point in the past andshould only be used for relative time computations.
uint64_t
walltimestamp
The current number of nanoseconds since 00:00 Universal Coordinated Time, January 1,1970.
Functions built into the D language such as trace are discussed in Chapter 4, “Actions andSubroutines.”
External VariablesD uses the backquote character (‘) as a special scoping operator for accessing variables that aredefined in the operating system and not in your D program. For example, the Solaris kernelcontains a C declaration of a system tunable named kmem_flags for enabling memory allocatordebugging features. See the Oracle Solaris Tunable Parameters Reference Manual for moreinformation about kmem_flags. This tunable is declared as a C variable in the kernel sourcecode as follows:
int kmem_flags;
To access the value of this variable in a D program, use the D notation:
‘kmem_flags
DTrace associates each kernel symbol with the type used for the symbol in the correspondingoperating system C code, providing easy source-based access to the native operating systemdata structures. In order to use external operating system variables, you will need access to thecorresponding operating system source code.
When you access external variables from a D program, you are accessing the internalimplementation details of another program such as the operating system kernel or its devicedrivers. These implementation details do not form a stable interface upon which you can rely!Any D programs you write that depend on these details might cease to work when you nextupgrade the corresponding piece of software. For this reason, external variables are typicallyused by kernel and device driver developers and service personnel in order to debugperformance or functionality problems using DTrace. To learn more about the stability of yourD programs, refer to Chapter 18, “Stability.”
Kernel symbol names are kept in a separate namespace from D variable and function identifiers,so you never need to worry about these names conflicting with your D variables. When youprefix a variable with a backquote, the D compiler searches the known kernel symbols in orderusing the list of loaded modules in order to find a matching variable definition. Because the
Variables
Oracle Solaris Dynamic Tracing Guide • November 2011 E22973_0262
Solaris kernel supports dynamically loaded modules with separate symbol namespaces, thesame variable name might be used more than once in the active operating system kernel. Youcan resolve these name conflicts by specifying the name of the kernel module whose variableshould be accessed prior to the backquote in the symbol name. For example, each loadablekernel module typically provides a _fini(9E) function, so to refer to the address of the _finifunction provided by a kernel module named foo, you would write:
foo‘_fini
You can apply any of the D operators to external variables, except those that modify values,subject to the usual rules for operand types. When you launch DTrace, the D compiler loads theset of variable names corresponding to the active kernel modules, so declarations of thesevariables are not required. You may not apply any operator to an external variable that modifiesits value, such as = or +=. For safety reasons, DTrace prevents you from damaging or corruptingthe state of the software you are observing.
Pointers and ArraysPointers are memory addresses of data objects in the operating system kernel or in the addressspace of a user process. D provides the ability to create and manipulate pointers and store themin variables and associative arrays. This chapter describes the D syntax for pointers, operatorsthat can be applied to create or access pointers, and the relationship between pointers andfixed-size scalar arrays. Also discussed are issues relating to the use of pointers in differentaddress spaces.
Note – If you are an experienced C or C++ programmer, you can skim most of this chapter as theD pointer syntax is the same as the corresponding ANSI-C syntax. You should read “Pointers toDTrace Objects” on page 69 and “Pointers and Addresses” on page 63 as they describe featuresand issues specific to DTrace.
Pointers and AddressesThe Oracle Solaris Operating System uses a technique called virtual memory to provide eachuser process with its own virtual view of the memory resources on your system. A virtual viewon memory resources is referred to as an address space, which associates a range of addressvalues (either [0 ... 0xffffffff] for a 32-bit address space or [0 ... 0xffffffffffffffff]
for a 64-bit address space) with a set of translations that the operating system and hardware useto convert each virtual address to a corresponding physical memory location. Pointers in D aredata objects that store an integer virtual address value and associate it with a D type thatdescribes the format of the data stored at the corresponding memory location.
Pointers and Arrays
Chapter 2 • D Programming Language 63
You can declare a D variable to be of pointer type by first specifying the type of the referenceddata and then appending an asterisk (*) to the type name to indicate you want to declare apointer type. For example, the declaration:
int *p;
declares a D global variable named p that is a pointer to an integer. This declaration means thatp itself is an integer of size 32 or 64-bits whose value is the address of another integer locatedsomewhere in memory. Because the compiled form of your D code is executed at probe firingtime inside the operating system kernel itself, D pointers are typically pointers associated withthe kernel's address space. You can use the isainfo(1) -b command to determine the numberof bits used for pointers by the active operating system kernel.
If you want to create a pointer to a data object inside of the kernel, you can compute its addressusing the & operator. For example, the operating system kernel source code declares an int
kmem_flags tunable. You could trace the address of this int by tracing the result of applying the& operator to the name of that object in D:
trace(&‘kmem_flags);
The * operator can be used to refer to the object addressed by the pointer, and acts as the inverseof the & operator. For example, the following two D code fragments are equivalent in meaning:
p = &‘kmem_flags; trace(‘kmem_flags);trace(*p);
The left-hand fragment creates a D global variable pointer p. Because the kmem_flags object isof type int, the type of the result of &‘kmem_flags is int * (that is, pointer to int). Theleft-hand fragment traces the value of *p, which follows the pointer back to the data objectkmem_flags. This fragment is therefore the same as the right-hand fragment, which simplytraces the value of the data object directly using its name.
Pointer SafetyIf you are a C or C++ programmer, you may be a bit frightened after reading the previoussection because you know that misuse of pointers in your programs can cause your programs tocrash. DTrace is a robust, safe environment for executing your D programs where thesemistakes cannot cause program crashes. You may indeed write a buggy D program, but invalidD pointer accesses will not cause DTrace or the operating system kernel to fail or crash in anyway. Instead, the DTrace software will detect any invalid pointer accesses, disable yourinstrumentation, and report the problem back to you for debugging.
If you have programmed in the Java programming language, you probably know that the Javalanguage does not support pointers for precisely the same reasons of safety. Pointers are neededin D because they are an intrinsic part of the operating system's implementation in C, butDTrace implements the same kind of safety mechanisms found in the Java programming
Pointers and Arrays
Oracle Solaris Dynamic Tracing Guide • November 2011 E22973_0264
language that prevent buggy programs from damaging themselves or each other. DTrace's errorreporting is similar to the run-time environment for the Java programming language thatdetects a programming error and reports an exception back to you.
To see DTrace's error handling and reporting, write a deliberately bad D program usingpointers. In an editor, type the following D program and save it in a file named badptr.d:
EXAMPLE 2–5 badptr.d: Demonstration of DTrace Error Handling
BEGIN
{
x = (int *)NULL;
y = *x;
trace(y);
}
The badptr.d program creates a D pointer named x that is a pointer to int. The programassigns this pointer the special invalid pointer value NULL, which is a built-in alias for address 0.By convention, address 0 is always defined to be invalid so that NULL can be used as a sentinelvalue in C and D programs. The program uses a cast expression to convert NULL to be a pointerto an integer. The program then dereferences the pointer using the expression *x, and assignsthe result to another variable y, and then attempts to trace y. When the D program is executed,DTrace detects an invalid pointer access when the statement y = *x is executed and reports theerror:
# dtrace -s badptr.d
dtrace: script ’/dev/stdin’ matched 1 probe
CPU ID FUNCTION:NAME
dtrace: error on enabled probe ID 1 (ID 1: dtrace:::BEGIN): invalid address
(0x0) in action #2 at DIF offset 4
dtrace: 1 error on CPU 0
^C
#
The other problem that can arise from programs that use invalid pointers is an alignment error.By architectural convention, fundamental data objects such as integers are aligned in memoryaccording to their size. For example, 2-byte integers are aligned on addresses that are multiplesof 2, 4-byte integers on multiples of 4, and so on. If you dereference a pointer to a 4-byte integerand your pointer address is an invalid value that is not a multiple of 4, your access will fail withan alignment error. Alignment errors in D almost always indicate that your pointer has aninvalid or corrupt value due to a bug in your D program. You can create an example alignmenterror by changing the source code of badptr.d to use the address (int *)2 instead of NULL.Because int is 4 bytes and 2 is not a multiple of 4, the expression *x results in a DTracealignment error.
For details about the DTrace error mechanism, see “ERROR Probe” on page 169.
Pointers and Arrays
Chapter 2 • D Programming Language 65
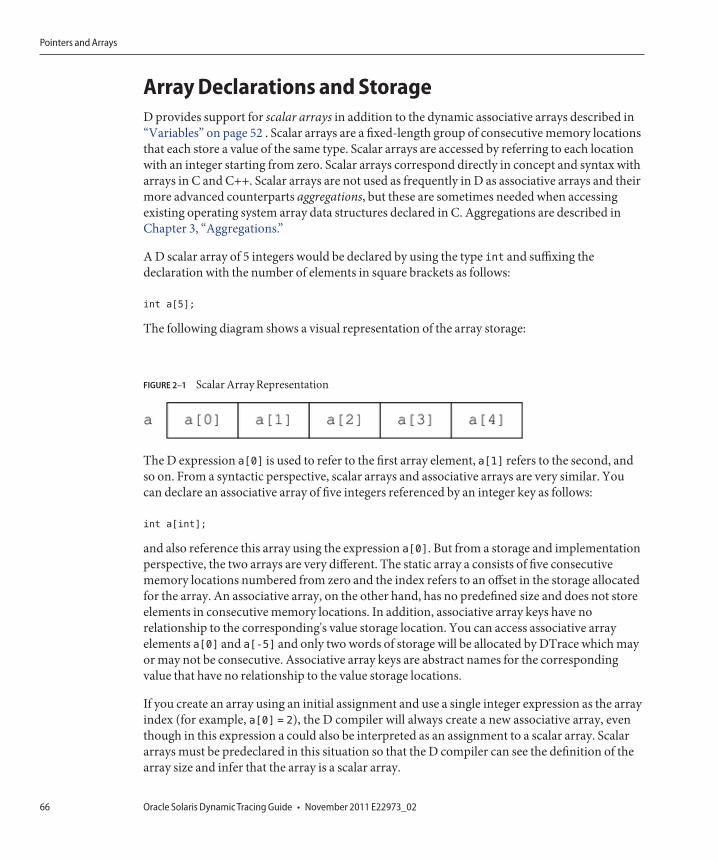
Array Declarations and StorageD provides support for scalar arrays in addition to the dynamic associative arrays described in“Variables” on page 52 . Scalar arrays are a fixed-length group of consecutive memory locationsthat each store a value of the same type. Scalar arrays are accessed by referring to each locationwith an integer starting from zero. Scalar arrays correspond directly in concept and syntax witharrays in C and C++. Scalar arrays are not used as frequently in D as associative arrays and theirmore advanced counterparts aggregations, but these are sometimes needed when accessingexisting operating system array data structures declared in C. Aggregations are described inChapter 3, “Aggregations.”
A D scalar array of 5 integers would be declared by using the type int and suffixing thedeclaration with the number of elements in square brackets as follows:
int a[5];
The following diagram shows a visual representation of the array storage:
The D expression a[0] is used to refer to the first array element, a[1] refers to the second, andso on. From a syntactic perspective, scalar arrays and associative arrays are very similar. Youcan declare an associative array of five integers referenced by an integer key as follows:
int a[int];
and also reference this array using the expression a[0]. But from a storage and implementationperspective, the two arrays are very different. The static array a consists of five consecutivememory locations numbered from zero and the index refers to an offset in the storage allocatedfor the array. An associative array, on the other hand, has no predefined size and does not storeelements in consecutive memory locations. In addition, associative array keys have norelationship to the corresponding's value storage location. You can access associative arrayelements a[0] and a[-5] and only two words of storage will be allocated by DTrace which mayor may not be consecutive. Associative array keys are abstract names for the correspondingvalue that have no relationship to the value storage locations.
If you create an array using an initial assignment and use a single integer expression as the arrayindex (for example, a[0] = 2), the D compiler will always create a new associative array, eventhough in this expression a could also be interpreted as an assignment to a scalar array. Scalararrays must be predeclared in this situation so that the D compiler can see the definition of thearray size and infer that the array is a scalar array.
FIGURE 2–1 Scalar Array Representation
Pointers and Arrays
Oracle Solaris Dynamic Tracing Guide • November 2011 E22973_0266
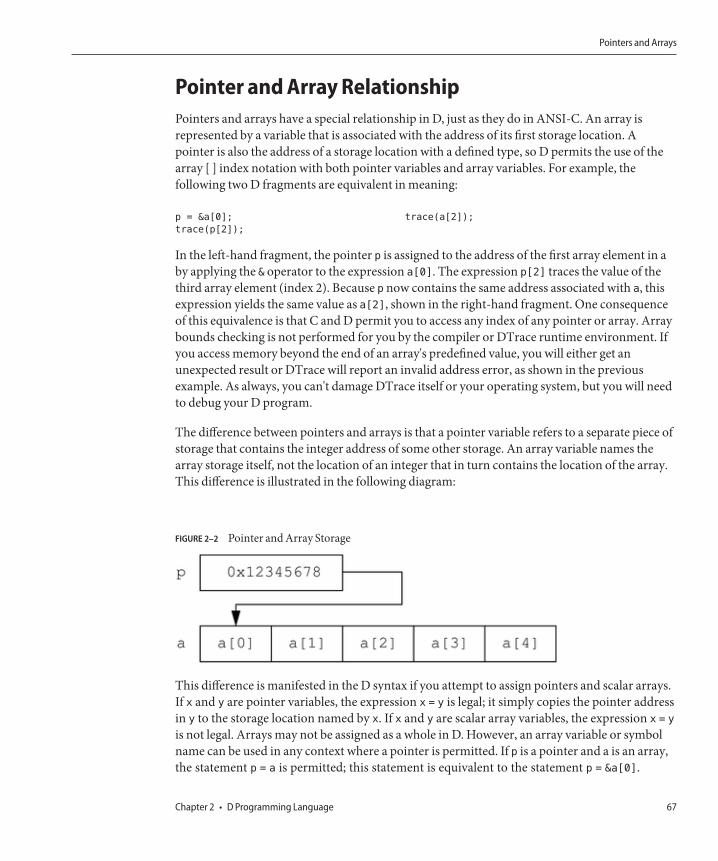
Pointer and Array RelationshipPointers and arrays have a special relationship in D, just as they do in ANSI-C. An array isrepresented by a variable that is associated with the address of its first storage location. Apointer is also the address of a storage location with a defined type, so D permits the use of thearray [ ] index notation with both pointer variables and array variables. For example, thefollowing two D fragments are equivalent in meaning:
p = &a[0]; trace(a[2]);
trace(p[2]);
In the left-hand fragment, the pointer p is assigned to the address of the first array element in aby applying the & operator to the expression a[0]. The expression p[2] traces the value of thethird array element (index 2). Because p now contains the same address associated with a, thisexpression yields the same value as a[2], shown in the right-hand fragment. One consequenceof this equivalence is that C and D permit you to access any index of any pointer or array. Arraybounds checking is not performed for you by the compiler or DTrace runtime environment. Ifyou access memory beyond the end of an array's predefined value, you will either get anunexpected result or DTrace will report an invalid address error, as shown in the previousexample. As always, you can't damage DTrace itself or your operating system, but you will needto debug your D program.
The difference between pointers and arrays is that a pointer variable refers to a separate piece ofstorage that contains the integer address of some other storage. An array variable names thearray storage itself, not the location of an integer that in turn contains the location of the array.This difference is illustrated in the following diagram:
This difference is manifested in the D syntax if you attempt to assign pointers and scalar arrays.If x and y are pointer variables, the expression x = y is legal; it simply copies the pointer addressin y to the storage location named by x. If x and y are scalar array variables, the expression x = y
is not legal. Arrays may not be assigned as a whole in D. However, an array variable or symbolname can be used in any context where a pointer is permitted. If p is a pointer and a is an array,the statement p = a is permitted; this statement is equivalent to the statement p = &a[0].
FIGURE 2–2 Pointer and Array Storage
Pointers and Arrays
Chapter 2 • D Programming Language 67
Pointer ArithmeticSince pointers are just integers used as addresses of other objects in memory, D provides a set offeatures for performing arithmetic on pointers. However, pointer arithmetic is not identical tointeger arithmetic. Pointer arithmetic implicitly adjusts the underlying address by multiplyingor dividing the operands by the size of the type referenced by the pointer. The following Dfragment illustrates this property:
int *x;
BEGIN
{
trace(x);
trace(x + 1);
trace(x + 2);
}
This fragment creates an integer pointer x and then trace its value, its value incremented by one,and its value incremented by two. If you create and execute this program, DTrace reports theinteger values 0, 4, and 8.
Since x is a pointer to an int (size 4 bytes), incrementing x adds 4 to the underlying pointervalue. This property is useful when using pointers to refer to consecutive storage locations suchas arrays. For example, if x were assigned to the address of an array a like the one shown inFigure 2–2, the expression x + 1 would be equivalent to the expression &a[1]. Similarly, theexpression *(x + 1) would refer to the value a[1]. Pointer arithmetic is implemented by the Dcompiler whenever a pointer value is incremented using the =+, +, or ++ operators. Pointerarithmetic is also applied when an integer is subtracted from a pointer on the left-hand side,when a pointer is subtracted from another pointer, or when the -- operator is applied to apointer. For example, the following D program would trace the result 2:
int *x, *y;
int a[5];
BEGIN
{
x = &a[0];
y = &a[2];
trace(y - x);
}
Generic PointersSometimes it is useful to represent or manipulate a generic pointer address in a D programwithout specifying the type of data referred to by the pointer. Generic pointers can be specifiedusing the type void *, where the keyword void represents the absence of specific typeinformation, or using the built-in type alias uintptr_t which is aliased to an unsigned integertype of size appropriate for a pointer in the current data model. You may not apply pointer
Pointers and Arrays
Oracle Solaris Dynamic Tracing Guide • November 2011 E22973_0268
arithmetic to an object of type void *, and these pointers cannot be dereferenced withoutcasting them to another type first. You can cast a pointer to the uintptr_t type when you needto perform integer arithmetic on the pointer value.
Pointers to void may be used in any context where a pointer to another data type is required,such as an associative array tuple expression or the right-hand side of an assignment statement.Similarly, a pointer to any data type may be used in a context where a pointer to void isrequired. To use a pointer to a non-void type in place of another non-void pointer type, anexplicit cast is required. You must always use explicit casts to convert pointers to integer typessuch as uintptr_t, or to convert these integers back to the appropriate pointer type.
Multi-Dimensional ArraysMulti-dimensional scalar arrays are used infrequently in D, but are provided for compatibilitywith ANSI-C and for observing and accessing operating system data structures created usingthis capability in C. A multi-dimensional array is declared as a consecutive series of scalar arraysizes enclosed in square brackets [] following the base type. For example, to declare a fixed-sizetwo-dimensional rectangular array of integers of dimensions 12 rows by 34 columns, you wouldwrite the declaration:
int a[12][34];
A multi-dimensional scalar array is accessed using similar notation. For example, to access thevalue stored at row 0 column 1 you would write the D expression:
a[0][1]
Storage locations for multi-dimensional scalar array values are computed by multiplying therow number by the total number of columns declared, and then adding the column number.
You should be careful not to confuse the multi-dimensional array syntax with the D syntax forassociative array accesses (that is, a[0][1] is not the same as a[0,1]). If you use anincompatible tuple with an associative array or attempt an associative array access of a scalararray, the D compiler will report an appropriate error message and refuse to compile yourprogram.
Pointers to DTrace ObjectsThe D compiler prohibits you from using the & operator to obtain pointers to DTrace objectssuch as associative arrays, built-in functions, and variables. You are prohibited from obtainingthe address of these variables so that the DTrace runtime environment is free to relocate themas needed between probe firings in order to more efficiently manage the memory required foryour programs. If you create composite structures, it is possible to construct expressions that do
Pointers and Arrays
Chapter 2 • D Programming Language 69
retrieve the kernel address of your DTrace object storage. You should avoid creating suchexpressions in your D programs. If you need to use such an expression, be sure not to cache theaddress across probe firings.
In ANSI-C, pointers can also be used to perform indirect function calls or to performassignments, such as placing an expression using the unary * dereference operator on theleft-hand side of an assignment operator. In D, these types of expressions using pointers are notpermitted. You may only assign values directly to D variables using their name or by applyingthe array index operator [] to a D scalar or associative array. You may only call functionsdefined by the DTrace environment by name as specified in Chapter 4, “Actions andSubroutines.” Indirect function calls using pointers are not permitted in D.
Pointers and Address SpacesA pointer is an address that provides a translation within some virtual address space to a piece ofphysical memory. DTrace executes your D programs within the address space of the operatingsystem kernel itself. Your entire Oracle Solaris system manages many address spaces: one forthe operating system kernel, and one for each user process. Since each address space providesthe illusion that it can access all of the memory on the system, the same virtual address pointervalue can be reused across address spaces but translate to different physical memory. Therefore,when writing D programs that use pointers, you must be aware of the address spacecorresponding to the pointers you intend to use.
For example, if you use the syscall provider to instrument entry to a system call that takes apointer to an integer or array of integers as an argument (for example, pipe(2)), it would not bevalid to dereference that pointer or array using the * or [] operators because the address inquestion is an address in the address space of the user process that performed the system call.Applying the * or [] operators to this address in D would result in a kernel address space access,which would result in an invalid address error or in returning unexpected data to your Dprogram depending upon whether the address happened to match a valid kernel address.
To access user process memory from a DTrace probe, you must apply one of the copyin,copyinstr, or copyinto functions described in Chapter 4, “Actions and Subroutines,” to theuser address space pointer. Take care when writing your D programs to name and commentvariables storing user addresses appropriately to avoid confusion. You can also store useraddresses as uintptr_t so you don't accidentally compile D code that dereferences them.Techniques for using DTrace on user processes are described in Chapter 12, “User ProcessTracing.”
Pointers and Arrays
Oracle Solaris Dynamic Tracing Guide • November 2011 E22973_0270
StringsDTrace provides support for tracing and manipulating strings. This chapter describes thecomplete set of D language features for declaring and manipulating strings. Unlike ANSI-C,strings in D have their own built-in type and operator support so you can easily andunambiguously use them in your tracing programs.
String RepresentationStrings are represented in DTrace as an array of characters terminated by a null byte (that is, abyte whose value is zero, usually written as ’\0’). The visible part of the string is of variablelength, depending on the location of the null byte, but DTrace stores each string in a fixed-sizearray so that each probe traces a consistent amount of data. Strings may not exceed the length ofthis predefined string limit, but the limit can be modified in your D program or on the dtracecommand line by tuning the strsize option. Refer to Chapter 10, “Options and Tunables,” formore information on tunable DTrace options. The default string limit is 256 bytes.
The D language provides an explicit string type rather than using the type char * to refer tostrings. The string type is equivalent to a char * in that it is the address of a sequence ofcharacters, but the D compiler and D functions like trace provide enhanced capabilities whenapplied to expressions of type string. For example, the string type removes the ambiguity of thetype char * when you need to trace the actual bytes of a string. In the D statement:
trace(s);
if s is of type char *, DTrace will trace the value of the pointer s (that is, it will trace an integeraddress value). In the D statement:
trace(*s);
by definition of the * operator, the D compiler will dereference the pointer s and trace the singlecharacter at that location. These behaviors are essential to permitting you to manipulatecharacter pointers that by design refer to either single characters, or to arrays of byte-sizedintegers that are not strings and do not end with a null byte. In the D statement:
trace(s);
if s is of type string, the string type indicates to the D compiler that you want DTrace to trace anull terminated string of characters whose address is stored in the variable s. You can alsoperform lexical comparison of expressions of type string, as described in “String Comparison ”on page 73.
Strings
Chapter 2 • D Programming Language 71
String ConstantsString constants are enclosed in double quotes (") and are automatically assigned the type stringby the D compiler. You can define string constants of any length, limited only by the amount ofmemory DTrace is permitted to consume on your system. The terminating null byte (\0) isadded automatically by the D compiler to any string constants that you declare. The size of astring constant object is the number of bytes associated with the string plus one additional bytefor the terminating null byte.
A string constant may not contain a literal newline character. To create strings containingnewlines, use the \n escape sequence instead of a literal newline. String constants may alsocontain any of the special character escape sequences defined for character constants inTable 2–6.
String AssignmentUnlike assignment of char * variables, strings are copied by value, not by reference. Stringassignment is performed using the = operator and copies the actual bytes of the string from thesource operand up to and including the null byte to the variable on the left-hand side, whichmust be of type string. You can create a new variable of type string by assigning it anexpression of type string. For example, the D statement:
s = "hello";
would create a new variable s of type string and copy the 6 bytes of the string "hello" into it (5printable characters plus the null byte). String assignment is analogous to the C library functionstrcpy(3C), except that if the source string exceeds the limit of the storage of the destinationstring, the resulting string is automatically truncated at this limit.
You can also assign to a string variable an expression of a type that is compatible with strings. Inthis case, the D compiler automatically promotes the source expression to the string type andperforms a string assignment. The D compiler permits any expression of type char * or of typechar[n] (that is, a scalar array of char of any size), to be promoted to a string.
String ConversionExpressions of other types may be explicitly converted to type string by using a cast expressionor by applying the special stringof operator, which are equivalent in meaning:
s = (string) expression s = stringof ( expression )
The stringof operator binds very tightly to the operand on its right-hand side. Typically,parentheses are used to surround the expression for clarity, although they are not strictlynecessary.
Strings
Oracle Solaris Dynamic Tracing Guide • November 2011 E22973_0272
Any expression that is a scalar type such as a pointer or integer or a scalar array address may beconverted to string. Expressions of other types such as void may not be converted to string. Ifyou erroneously convert an invalid address to a string, the DTrace safety features will preventyou from damaging the system or DTrace, but you might end up tracing a sequence ofundecipherable characters.
String ComparisonD overloads the binary relational operators and permits them to be used for string comparisonsas well as integer comparisons. The relational operators perform string comparison wheneverboth operands are of type string, or when one operand is of type string and the other operandcan be promoted to type string, as described in “String Assignment ” on page 72. All of therelational operators can be used to compare strings:
TABLE 2–14 D Relational Operators for Strings
< left-hand operand is less than right-operand
<= left-hand operand is less than or equal to right-hand operand
> left-hand operand is greater than right-hand operand
>= left-hand operand is greater than or equal to right-hand operand
== left-hand operand is equal to right-hand operand
!= left-hand operand is not equal to right-hand operand
As with integers, each operator evaluates to a value of type int which is equal to one if thecondition is true, or zero if it is false.
The relational operators compare the two input strings byte-by-byte, similar to the C libraryroutine strcmp(3C). Each byte is compared using its corresponding integer value in the ASCIIcharacter set, as shown in ascii(5), until a null byte is read or the maximum string length isreached. Some example D string comparisons and their results are:
"coffee" < "espresso" ... returns 1 (true)
"coffee" == "coffee" ... returns 1 (true)
"coffee" >= "mocha" ... returns 0 (false)
Strings
Chapter 2 • D Programming Language 73
Structs and UnionsCollections of related variables can be grouped together into composite data objects calledstructs and unions. You can define these objects in D by creating new type definitions for them.You can use your new types for any D variables, including associative array values. This chapterexplores the syntax and semantics for creating and manipulating these composite types and theD operators that interact with them. The syntax for structs and unions is illustrated usingseveral example programs that demonstrate the use of the DTrace fbt and pid providers.
StructsThe D keyword struct, short for structure, is used to introduce a new type composed of agroup of other types. The new struct type can be used as the type for D variables and arrays,enabling you to define groups of related variables under a single name. D structs are the same asthe corresponding construct in C and C++. If you have programmed in the Java programminglanguage, think of a D struct as a class, but one with data members only and no methods.
Suppose you want to create a more sophisticated system call tracing program in D that records anumber of things about each read(2) and write(2) system call executed by your shell, such as theelapsed time, number of calls, and the largest byte count passed as an argument. You couldwrite a D clause to record these properties in three separate associative arrays as shown in thefollowing example:
int maxbytes; /* declare maxbytes */
syscall::read:entry, syscall::write:entry
/pid == 12345/
{
ts[probefunc] = timestamp;
calls[probefunc]++;
maxbytes[probefunc] = arg2 > maxbytes[probefunc] ?
arg2 : maxbytes[probefunc];
}
However, this clause is inefficient because DTrace must create three separate associative arraysand store separate copies of the identical tuple values corresponding to probefunc for each one.Instead, you can conserve space and make your program easier to read and maintain by using astruct. First, declare a new struct type at the top of the program source file:
struct callinfo {
uint64_t ts; /* timestamp of last syscall entry */
uint64_t elapsed; /* total elapsed time in nanoseconds */
uint64_t calls; /* number of calls made */
size_t maxbytes; /* maximum byte count argument */
};
The struct keyword is followed by an optional identifier used to refer back to our new type,which is now known as struct callinfo. The struct members are then enclosed in a set of
Structs and Unions
Oracle Solaris Dynamic Tracing Guide • November 2011 E22973_0274
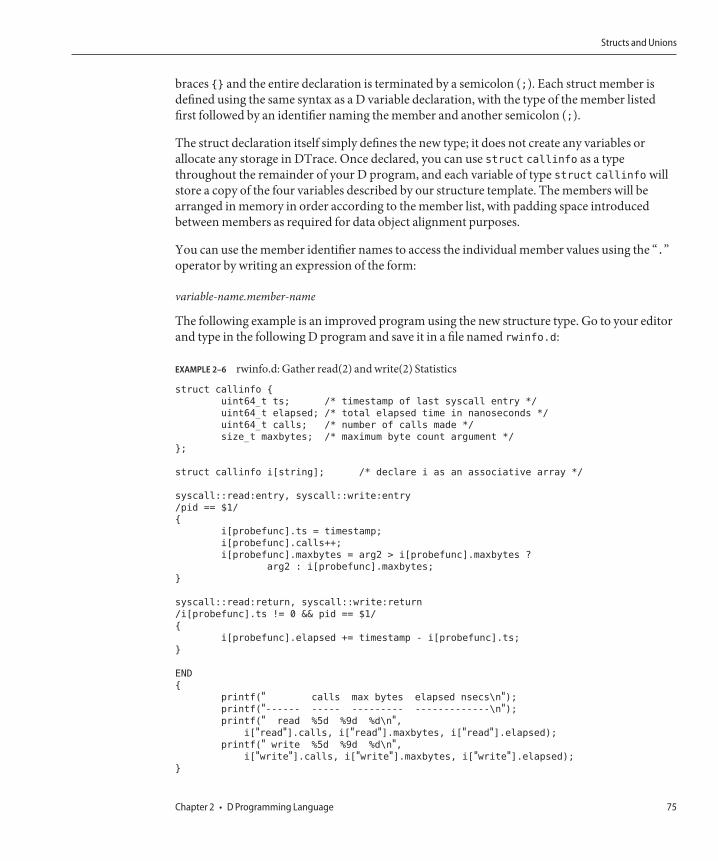
braces {} and the entire declaration is terminated by a semicolon (;). Each struct member isdefined using the same syntax as a D variable declaration, with the type of the member listedfirst followed by an identifier naming the member and another semicolon (;).
The struct declaration itself simply defines the new type; it does not create any variables orallocate any storage in DTrace. Once declared, you can use struct callinfo as a typethroughout the remainder of your D program, and each variable of type struct callinfo willstore a copy of the four variables described by our structure template. The members will bearranged in memory in order according to the member list, with padding space introducedbetween members as required for data object alignment purposes.
You can use the member identifier names to access the individual member values using the “.”operator by writing an expression of the form:
variable-name.member-name
The following example is an improved program using the new structure type. Go to your editorand type in the following D program and save it in a file named rwinfo.d:
EXAMPLE 2–6 rwinfo.d: Gather read(2) and write(2) Statistics
struct callinfo {
uint64_t ts; /* timestamp of last syscall entry */
uint64_t elapsed; /* total elapsed time in nanoseconds */
uint64_t calls; /* number of calls made */
size_t maxbytes; /* maximum byte count argument */
};
struct callinfo i[string]; /* declare i as an associative array */
syscall::read:entry, syscall::write:entry
/pid == $1/
{
i[probefunc].ts = timestamp;
i[probefunc].calls++;
i[probefunc].maxbytes = arg2 > i[probefunc].maxbytes ?
arg2 : i[probefunc].maxbytes;
}
syscall::read:return, syscall::write:return
/i[probefunc].ts != 0 && pid == $1/
{
i[probefunc].elapsed += timestamp - i[probefunc].ts;
}
END
{
printf(" calls max bytes elapsed nsecs\n");printf("------ ----- --------- -------------\n");printf(" read %5d %9d %d\n",
i["read"].calls, i["read"].maxbytes, i["read"].elapsed);printf(" write %5d %9d %d\n",
i["write"].calls, i["write"].maxbytes, i["write"].elapsed);}
Structs and Unions
Chapter 2 • D Programming Language 75
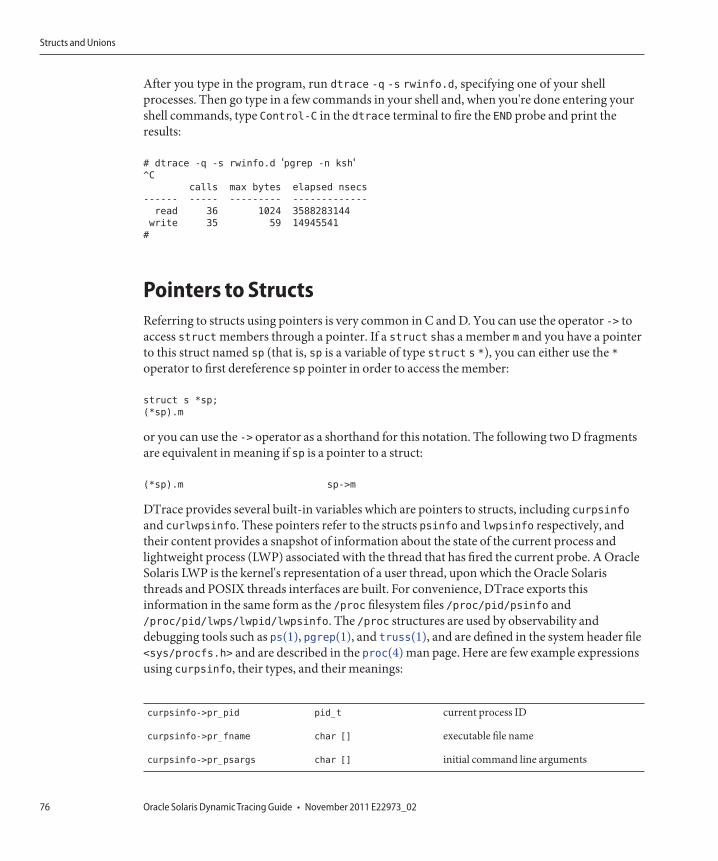
After you type in the program, run dtrace -q -s rwinfo.d, specifying one of your shellprocesses. Then go type in a few commands in your shell and, when you're done entering yourshell commands, type Control-C in the dtrace terminal to fire the END probe and print theresults:
# dtrace -q -s rwinfo.d ‘pgrep -n ksh‘^C
calls max bytes elapsed nsecs
------ ----- --------- -------------
read 36 1024 3588283144
write 35 59 14945541
#
Pointers to StructsReferring to structs using pointers is very common in C and D. You can use the operator -> toaccess struct members through a pointer. If a struct shas a member m and you have a pointerto this struct named sp (that is, sp is a variable of type struct s *), you can either use the *operator to first dereference sp pointer in order to access the member:
struct s *sp;
(*sp).m
or you can use the -> operator as a shorthand for this notation. The following two D fragmentsare equivalent in meaning if sp is a pointer to a struct:
(*sp).m sp->m
DTrace provides several built-in variables which are pointers to structs, including curpsinfoand curlwpsinfo. These pointers refer to the structs psinfo and lwpsinfo respectively, andtheir content provides a snapshot of information about the state of the current process andlightweight process (LWP) associated with the thread that has fired the current probe. A OracleSolaris LWP is the kernel's representation of a user thread, upon which the Oracle Solaristhreads and POSIX threads interfaces are built. For convenience, DTrace exports thisinformation in the same form as the /proc filesystem files /proc/pid/psinfo and/proc/pid/lwps/lwpid/lwpsinfo. The /proc structures are used by observability anddebugging tools such as ps(1), pgrep(1), and truss(1), and are defined in the system header file<sys/procfs.h> and are described in the proc(4) man page. Here are few example expressionsusing curpsinfo, their types, and their meanings:
curpsinfo->pr_pid pid_t current process ID
curpsinfo->pr_fname char [] executable file name
curpsinfo->pr_psargs char [] initial command line arguments
Structs and Unions
Oracle Solaris Dynamic Tracing Guide • November 2011 E22973_0276
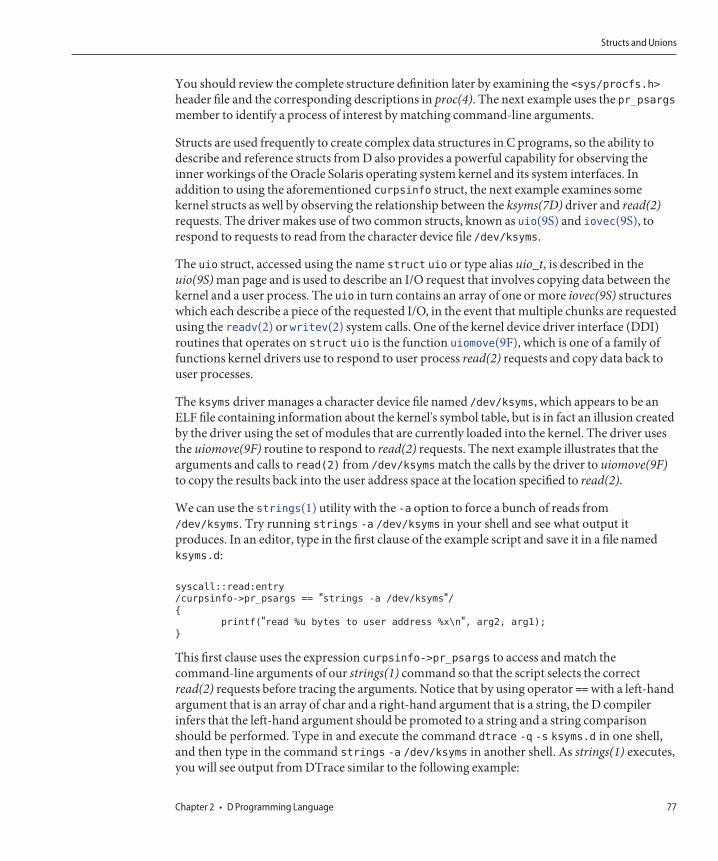
You should review the complete structure definition later by examining the <sys/procfs.h>header file and the corresponding descriptions in proc(4). The next example uses the pr_psargsmember to identify a process of interest by matching command-line arguments.
Structs are used frequently to create complex data structures in C programs, so the ability todescribe and reference structs from D also provides a powerful capability for observing theinner workings of the Oracle Solaris operating system kernel and its system interfaces. Inaddition to using the aforementioned curpsinfo struct, the next example examines somekernel structs as well by observing the relationship between the ksyms(7D) driver and read(2)requests. The driver makes use of two common structs, known as uio(9S) and iovec(9S), torespond to requests to read from the character device file /dev/ksyms.
The uio struct, accessed using the name struct uio or type alias uio_t, is described in theuio(9S) man page and is used to describe an I/O request that involves copying data between thekernel and a user process. The uio in turn contains an array of one or more iovec(9S) structureswhich each describe a piece of the requested I/O, in the event that multiple chunks are requestedusing the readv(2) or writev(2) system calls. One of the kernel device driver interface (DDI)routines that operates on struct uio is the function uiomove(9F), which is one of a family offunctions kernel drivers use to respond to user process read(2) requests and copy data back touser processes.
The ksyms driver manages a character device file named /dev/ksyms, which appears to be anELF file containing information about the kernel's symbol table, but is in fact an illusion createdby the driver using the set of modules that are currently loaded into the kernel. The driver usesthe uiomove(9F) routine to respond to read(2) requests. The next example illustrates that thearguments and calls to read(2) from /dev/ksyms match the calls by the driver to uiomove(9F)to copy the results back into the user address space at the location specified to read(2).
We can use the strings(1) utility with the -a option to force a bunch of reads from/dev/ksyms. Try running strings -a /dev/ksyms in your shell and see what output itproduces. In an editor, type in the first clause of the example script and save it in a file namedksyms.d:
syscall::read:entry
/curpsinfo->pr_psargs == "strings -a /dev/ksyms"/{
printf("read %u bytes to user address %x\n", arg2, arg1);
}
This first clause uses the expression curpsinfo->pr_psargs to access and match thecommand-line arguments of our strings(1) command so that the script selects the correctread(2) requests before tracing the arguments. Notice that by using operator == with a left-handargument that is an array of char and a right-hand argument that is a string, the D compilerinfers that the left-hand argument should be promoted to a string and a string comparisonshould be performed. Type in and execute the command dtrace -q -s ksyms.d in one shell,and then type in the command strings -a /dev/ksyms in another shell. As strings(1) executes,you will see output from DTrace similar to the following example:
Structs and Unions
Chapter 2 • D Programming Language 77
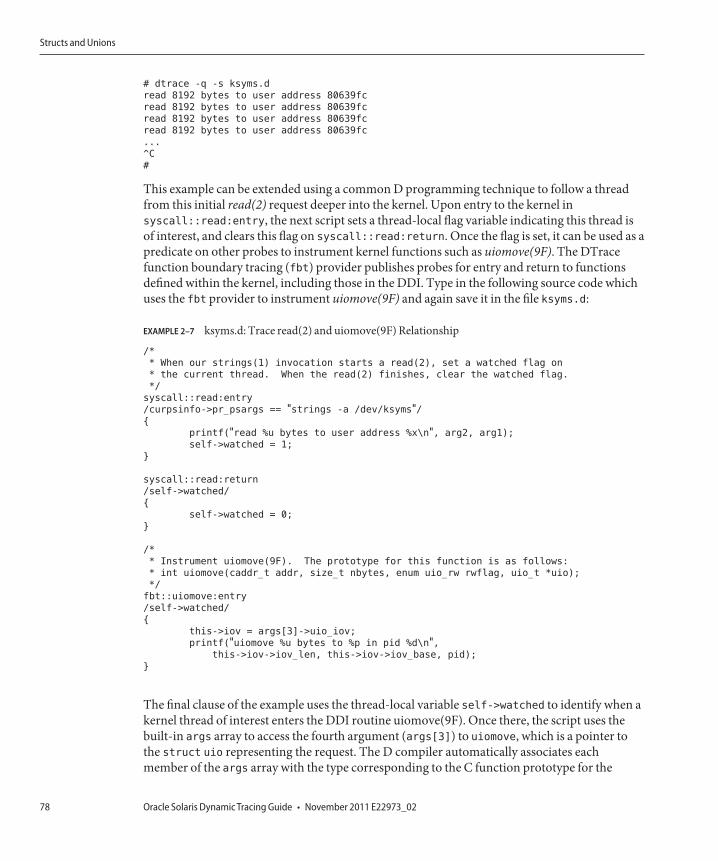
# dtrace -q -s ksyms.d
read 8192 bytes to user address 80639fc
read 8192 bytes to user address 80639fc
read 8192 bytes to user address 80639fc
read 8192 bytes to user address 80639fc
...
^C
#
This example can be extended using a common D programming technique to follow a threadfrom this initial read(2) request deeper into the kernel. Upon entry to the kernel insyscall::read:entry, the next script sets a thread-local flag variable indicating this thread isof interest, and clears this flag on syscall::read:return. Once the flag is set, it can be used as apredicate on other probes to instrument kernel functions such as uiomove(9F). The DTracefunction boundary tracing (fbt) provider publishes probes for entry and return to functionsdefined within the kernel, including those in the DDI. Type in the following source code whichuses the fbt provider to instrument uiomove(9F) and again save it in the file ksyms.d:
EXAMPLE 2–7 ksyms.d: Trace read(2) and uiomove(9F) Relationship
/*
* When our strings(1) invocation starts a read(2), set a watched flag on
* the current thread. When the read(2) finishes, clear the watched flag.
*/
syscall::read:entry
/curpsinfo->pr_psargs == "strings -a /dev/ksyms"/{
printf("read %u bytes to user address %x\n", arg2, arg1);
self->watched = 1;
}
syscall::read:return
/self->watched/
{
self->watched = 0;
}
/*
* Instrument uiomove(9F). The prototype for this function is as follows:
* int uiomove(caddr_t addr, size_t nbytes, enum uio_rw rwflag, uio_t *uio);
*/
fbt::uiomove:entry
/self->watched/
{
this->iov = args[3]->uio_iov;
printf("uiomove %u bytes to %p in pid %d\n",this->iov->iov_len, this->iov->iov_base, pid);
}
The final clause of the example uses the thread-local variable self->watched to identify when akernel thread of interest enters the DDI routine uiomove(9F). Once there, the script uses thebuilt-in args array to access the fourth argument (args[3]) to uiomove, which is a pointer tothe struct uio representing the request. The D compiler automatically associates eachmember of the args array with the type corresponding to the C function prototype for the
Structs and Unions
Oracle Solaris Dynamic Tracing Guide • November 2011 E22973_0278
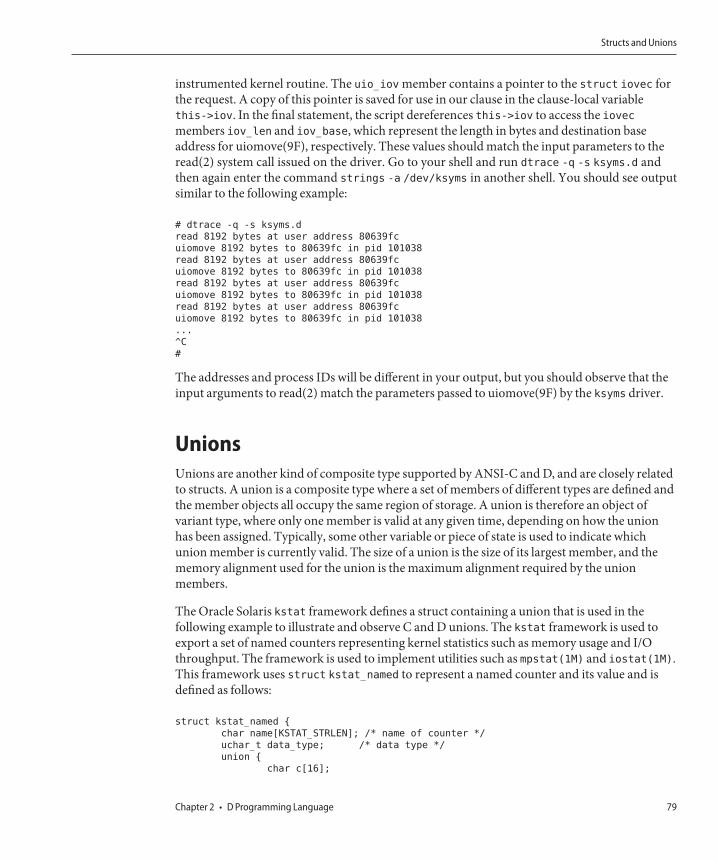
instrumented kernel routine. The uio_iov member contains a pointer to the struct iovec forthe request. A copy of this pointer is saved for use in our clause in the clause-local variablethis->iov. In the final statement, the script dereferences this->iov to access the iovecmembers iov_len and iov_base, which represent the length in bytes and destination baseaddress for uiomove(9F), respectively. These values should match the input parameters to theread(2) system call issued on the driver. Go to your shell and run dtrace -q -s ksyms.d andthen again enter the command strings -a /dev/ksyms in another shell. You should see outputsimilar to the following example:
# dtrace -q -s ksyms.d
read 8192 bytes at user address 80639fc
uiomove 8192 bytes to 80639fc in pid 101038
read 8192 bytes at user address 80639fc
uiomove 8192 bytes to 80639fc in pid 101038
read 8192 bytes at user address 80639fc
uiomove 8192 bytes to 80639fc in pid 101038
read 8192 bytes at user address 80639fc
uiomove 8192 bytes to 80639fc in pid 101038
...
^C
#
The addresses and process IDs will be different in your output, but you should observe that theinput arguments to read(2) match the parameters passed to uiomove(9F) by the ksyms driver.
UnionsUnions are another kind of composite type supported by ANSI-C and D, and are closely relatedto structs. A union is a composite type where a set of members of different types are defined andthe member objects all occupy the same region of storage. A union is therefore an object ofvariant type, where only one member is valid at any given time, depending on how the unionhas been assigned. Typically, some other variable or piece of state is used to indicate whichunion member is currently valid. The size of a union is the size of its largest member, and thememory alignment used for the union is the maximum alignment required by the unionmembers.
The Oracle Solaris kstat framework defines a struct containing a union that is used in thefollowing example to illustrate and observe C and D unions. The kstat framework is used toexport a set of named counters representing kernel statistics such as memory usage and I/Othroughput. The framework is used to implement utilities such as mpstat(1M) and iostat(1M).This framework uses struct kstat_named to represent a named counter and its value and isdefined as follows:
struct kstat_named {
char name[KSTAT_STRLEN]; /* name of counter */
uchar_t data_type; /* data type */
union {
char c[16];
Structs and Unions
Chapter 2 • D Programming Language 79
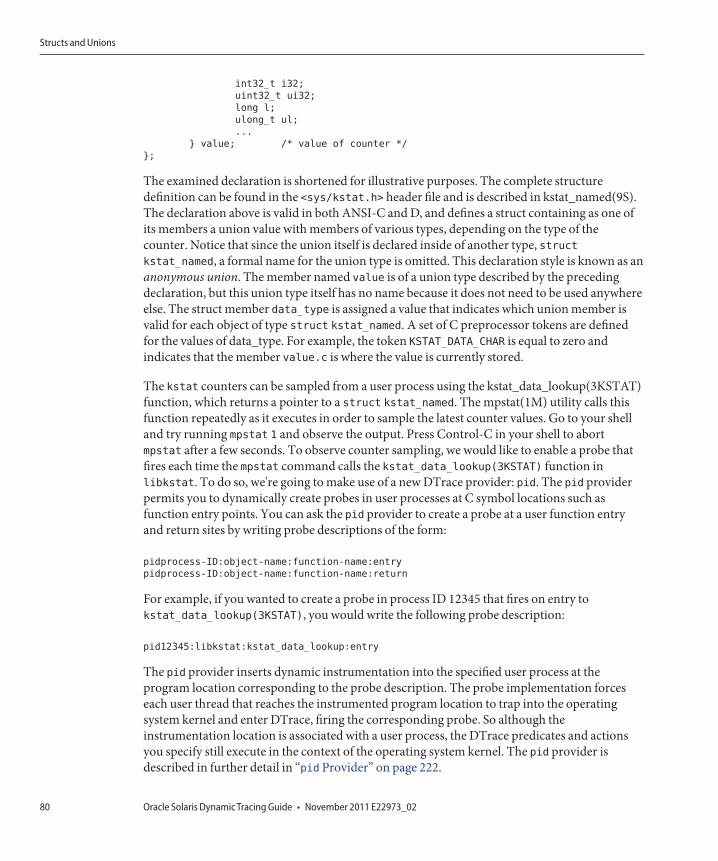
int32_t i32;
uint32_t ui32;
long l;
ulong_t ul;
...
} value; /* value of counter */
};
The examined declaration is shortened for illustrative purposes. The complete structuredefinition can be found in the <sys/kstat.h> header file and is described in kstat_named(9S).The declaration above is valid in both ANSI-C and D, and defines a struct containing as one ofits members a union value with members of various types, depending on the type of thecounter. Notice that since the union itself is declared inside of another type, structkstat_named, a formal name for the union type is omitted. This declaration style is known as ananonymous union. The member named value is of a union type described by the precedingdeclaration, but this union type itself has no name because it does not need to be used anywhereelse. The struct member data_type is assigned a value that indicates which union member isvalid for each object of type struct kstat_named. A set of C preprocessor tokens are definedfor the values of data_type. For example, the token KSTAT_DATA_CHAR is equal to zero andindicates that the member value.c is where the value is currently stored.
The kstat counters can be sampled from a user process using the kstat_data_lookup(3KSTAT)function, which returns a pointer to a struct kstat_named. The mpstat(1M) utility calls thisfunction repeatedly as it executes in order to sample the latest counter values. Go to your shelland try running mpstat 1 and observe the output. Press Control-C in your shell to abortmpstat after a few seconds. To observe counter sampling, we would like to enable a probe thatfires each time the mpstat command calls the kstat_data_lookup(3KSTAT) function inlibkstat. To do so, we're going to make use of a new DTrace provider: pid. The pid providerpermits you to dynamically create probes in user processes at C symbol locations such asfunction entry points. You can ask the pid provider to create a probe at a user function entryand return sites by writing probe descriptions of the form:
pidprocess-ID:object-name:function-name:entry
pidprocess-ID:object-name:function-name:return
For example, if you wanted to create a probe in process ID 12345 that fires on entry tokstat_data_lookup(3KSTAT), you would write the following probe description:
pid12345:libkstat:kstat_data_lookup:entry
The pid provider inserts dynamic instrumentation into the specified user process at theprogram location corresponding to the probe description. The probe implementation forceseach user thread that reaches the instrumented program location to trap into the operatingsystem kernel and enter DTrace, firing the corresponding probe. So although theinstrumentation location is associated with a user process, the DTrace predicates and actionsyou specify still execute in the context of the operating system kernel. The pid provider isdescribed in further detail in “pid Provider” on page 222.
Structs and Unions
Oracle Solaris Dynamic Tracing Guide • November 2011 E22973_0280
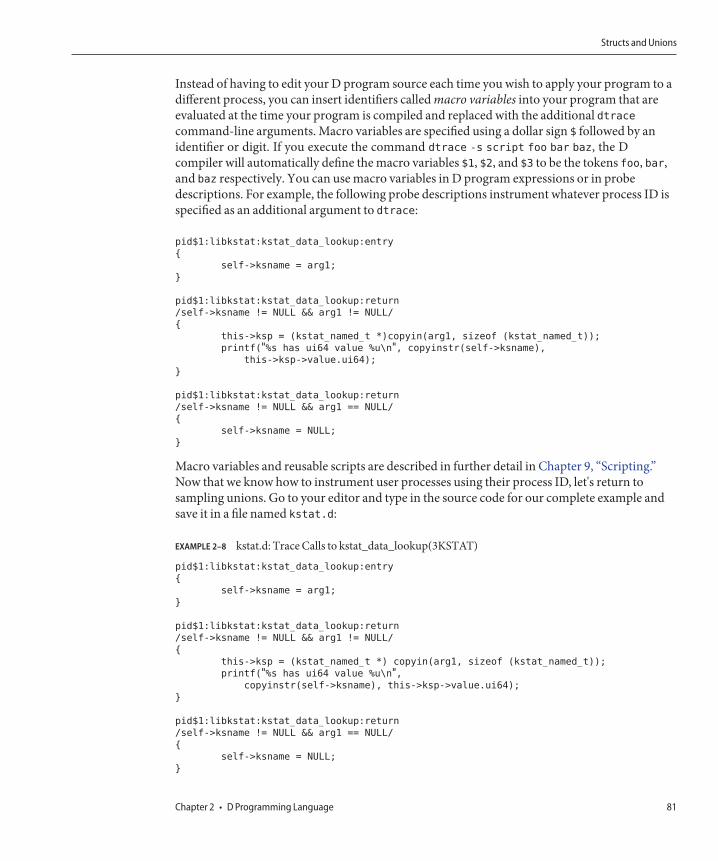
Instead of having to edit your D program source each time you wish to apply your program to adifferent process, you can insert identifiers called macro variables into your program that areevaluated at the time your program is compiled and replaced with the additional dtracecommand-line arguments. Macro variables are specified using a dollar sign $ followed by anidentifier or digit. If you execute the command dtrace -s script foo bar baz, the Dcompiler will automatically define the macro variables $1, $2, and $3 to be the tokens foo, bar,and baz respectively. You can use macro variables in D program expressions or in probedescriptions. For example, the following probe descriptions instrument whatever process ID isspecified as an additional argument to dtrace:
pid$1:libkstat:kstat_data_lookup:entry
{
self->ksname = arg1;
}
pid$1:libkstat:kstat_data_lookup:return
/self->ksname != NULL && arg1 != NULL/
{
this->ksp = (kstat_named_t *)copyin(arg1, sizeof (kstat_named_t));
printf("%s has ui64 value %u\n", copyinstr(self->ksname),
this->ksp->value.ui64);
}
pid$1:libkstat:kstat_data_lookup:return
/self->ksname != NULL && arg1 == NULL/
{
self->ksname = NULL;
}
Macro variables and reusable scripts are described in further detail in Chapter 9, “Scripting.”Now that we know how to instrument user processes using their process ID, let's return tosampling unions. Go to your editor and type in the source code for our complete example andsave it in a file named kstat.d:
EXAMPLE 2–8 kstat.d: Trace Calls to kstat_data_lookup(3KSTAT)
pid$1:libkstat:kstat_data_lookup:entry
{
self->ksname = arg1;
}
pid$1:libkstat:kstat_data_lookup:return
/self->ksname != NULL && arg1 != NULL/
{
this->ksp = (kstat_named_t *) copyin(arg1, sizeof (kstat_named_t));
printf("%s has ui64 value %u\n",copyinstr(self->ksname), this->ksp->value.ui64);
}
pid$1:libkstat:kstat_data_lookup:return
/self->ksname != NULL && arg1 == NULL/
{
self->ksname = NULL;
}
Structs and Unions
Chapter 2 • D Programming Language 81
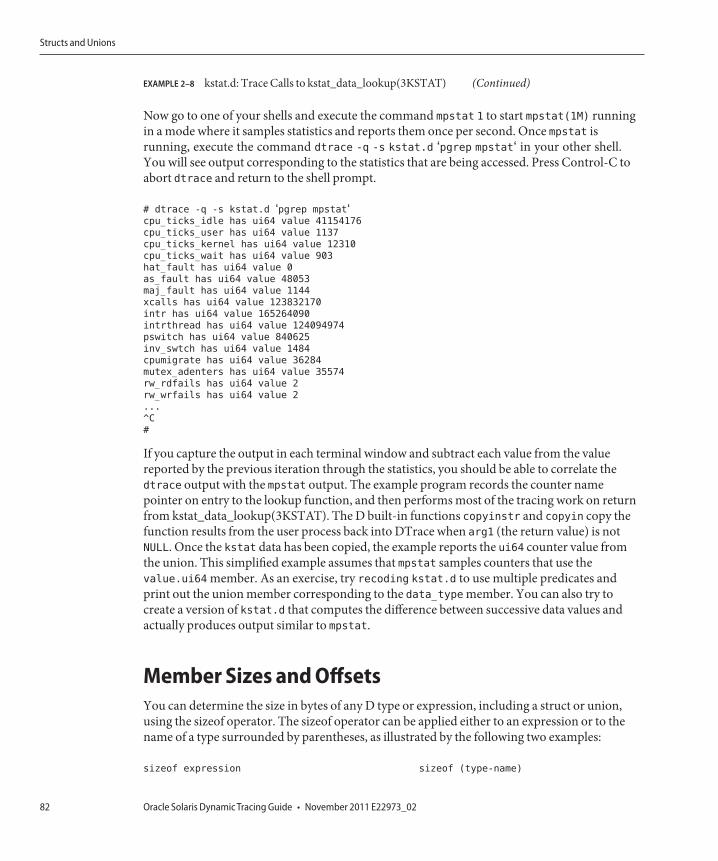
EXAMPLE 2–8 kstat.d: Trace Calls to kstat_data_lookup(3KSTAT) (Continued)
Now go to one of your shells and execute the command mpstat 1 to start mpstat(1M) runningin a mode where it samples statistics and reports them once per second. Once mpstat isrunning, execute the command dtrace -q -s kstat.d ‘pgrep mpstat‘ in your other shell.You will see output corresponding to the statistics that are being accessed. Press Control-C toabort dtrace and return to the shell prompt.
# dtrace -q -s kstat.d ‘pgrep mpstat‘cpu_ticks_idle has ui64 value 41154176
cpu_ticks_user has ui64 value 1137
cpu_ticks_kernel has ui64 value 12310
cpu_ticks_wait has ui64 value 903
hat_fault has ui64 value 0
as_fault has ui64 value 48053
maj_fault has ui64 value 1144
xcalls has ui64 value 123832170
intr has ui64 value 165264090
intrthread has ui64 value 124094974
pswitch has ui64 value 840625
inv_swtch has ui64 value 1484
cpumigrate has ui64 value 36284
mutex_adenters has ui64 value 35574
rw_rdfails has ui64 value 2
rw_wrfails has ui64 value 2
...
^C
#
If you capture the output in each terminal window and subtract each value from the valuereported by the previous iteration through the statistics, you should be able to correlate thedtrace output with the mpstat output. The example program records the counter namepointer on entry to the lookup function, and then performs most of the tracing work on returnfrom kstat_data_lookup(3KSTAT). The D built-in functions copyinstr and copyin copy thefunction results from the user process back into DTrace when arg1 (the return value) is notNULL. Once the kstat data has been copied, the example reports the ui64 counter value fromthe union. This simplified example assumes that mpstat samples counters that use thevalue.ui64 member. As an exercise, try recoding kstat.d to use multiple predicates andprint out the union member corresponding to the data_type member. You can also try tocreate a version of kstat.d that computes the difference between successive data values andactually produces output similar to mpstat.
Member Sizes and OffsetsYou can determine the size in bytes of any D type or expression, including a struct or union,using the sizeof operator. The sizeof operator can be applied either to an expression or to thename of a type surrounded by parentheses, as illustrated by the following two examples:
sizeof expression sizeof (type-name)
Structs and Unions
Oracle Solaris Dynamic Tracing Guide • November 2011 E22973_0282
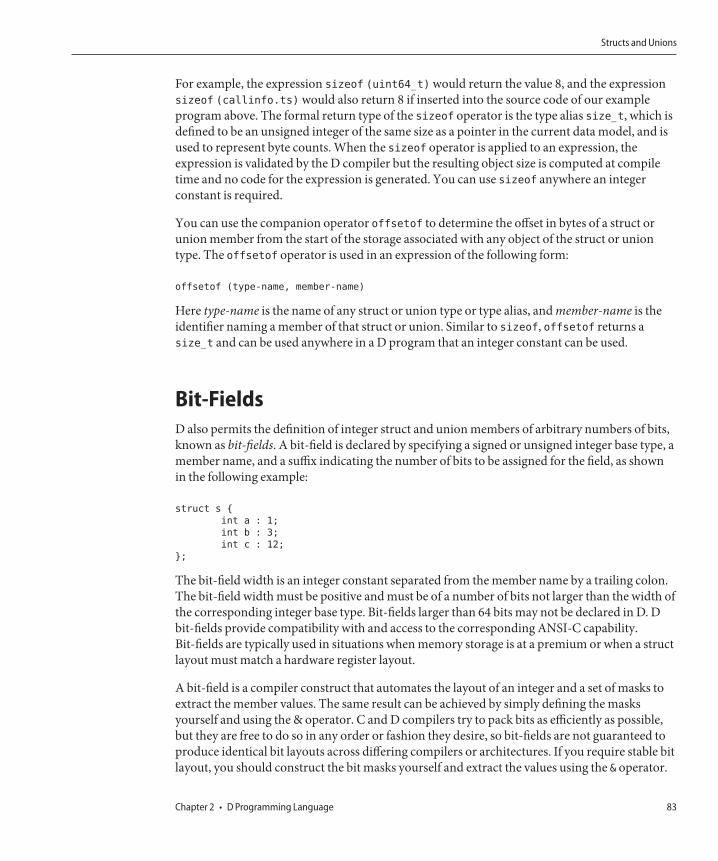
For example, the expression sizeof (uint64_t) would return the value 8, and the expressionsizeof (callinfo.ts) would also return 8 if inserted into the source code of our exampleprogram above. The formal return type of the sizeof operator is the type alias size_t, which isdefined to be an unsigned integer of the same size as a pointer in the current data model, and isused to represent byte counts. When the sizeof operator is applied to an expression, theexpression is validated by the D compiler but the resulting object size is computed at compiletime and no code for the expression is generated. You can use sizeof anywhere an integerconstant is required.
You can use the companion operator offsetof to determine the offset in bytes of a struct orunion member from the start of the storage associated with any object of the struct or uniontype. The offsetof operator is used in an expression of the following form:
offsetof (type-name, member-name)
Here type-name is the name of any struct or union type or type alias, and member-name is theidentifier naming a member of that struct or union. Similar to sizeof, offsetof returns asize_t and can be used anywhere in a D program that an integer constant can be used.
Bit-FieldsD also permits the definition of integer struct and union members of arbitrary numbers of bits,known as bit-fields. A bit-field is declared by specifying a signed or unsigned integer base type, amember name, and a suffix indicating the number of bits to be assigned for the field, as shownin the following example:
struct s {
int a : 1;
int b : 3;
int c : 12;
};
The bit-field width is an integer constant separated from the member name by a trailing colon.The bit-field width must be positive and must be of a number of bits not larger than the width ofthe corresponding integer base type. Bit-fields larger than 64 bits may not be declared in D. Dbit-fields provide compatibility with and access to the corresponding ANSI-C capability.Bit-fields are typically used in situations when memory storage is at a premium or when a structlayout must match a hardware register layout.
A bit-field is a compiler construct that automates the layout of an integer and a set of masks toextract the member values. The same result can be achieved by simply defining the masksyourself and using the & operator. C and D compilers try to pack bits as efficiently as possible,but they are free to do so in any order or fashion they desire, so bit-fields are not guaranteed toproduce identical bit layouts across differing compilers or architectures. If you require stable bitlayout, you should construct the bit masks yourself and extract the values using the & operator.
Structs and Unions
Chapter 2 • D Programming Language 83
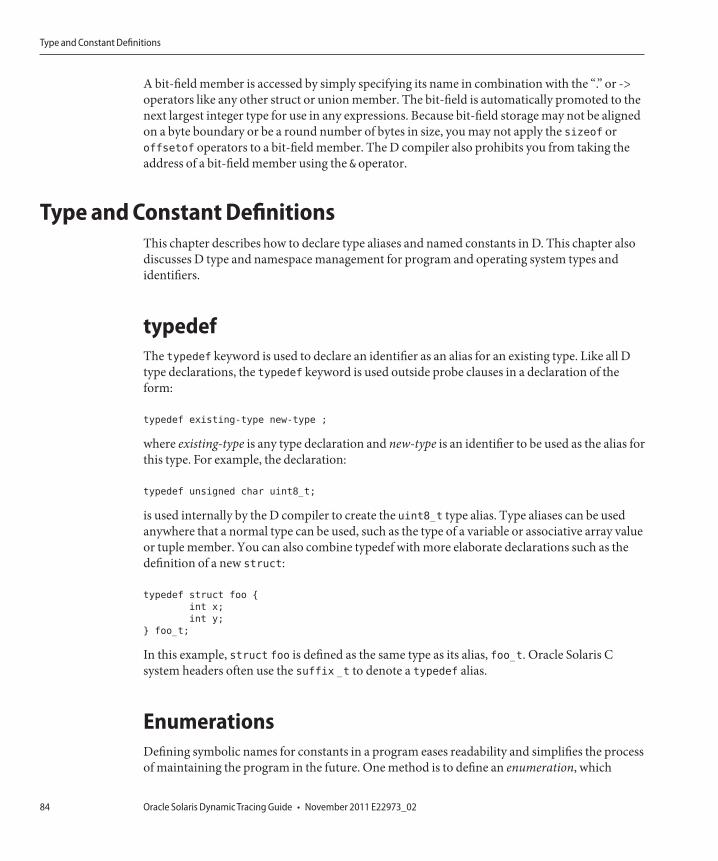
A bit-field member is accessed by simply specifying its name in combination with the “.” or ->operators like any other struct or union member. The bit-field is automatically promoted to thenext largest integer type for use in any expressions. Because bit-field storage may not be alignedon a byte boundary or be a round number of bytes in size, you may not apply the sizeof oroffsetof operators to a bit-field member. The D compiler also prohibits you from taking theaddress of a bit-field member using the & operator.
Type and Constant DefinitionsThis chapter describes how to declare type aliases and named constants in D. This chapter alsodiscusses D type and namespace management for program and operating system types andidentifiers.
typedefThe typedef keyword is used to declare an identifier as an alias for an existing type. Like all Dtype declarations, the typedef keyword is used outside probe clauses in a declaration of theform:
typedef existing-type new-type ;
where existing-type is any type declaration and new-type is an identifier to be used as the alias forthis type. For example, the declaration:
typedef unsigned char uint8_t;
is used internally by the D compiler to create the uint8_t type alias. Type aliases can be usedanywhere that a normal type can be used, such as the type of a variable or associative array valueor tuple member. You can also combine typedef with more elaborate declarations such as thedefinition of a new struct:
typedef struct foo {
int x;
int y;
} foo_t;
In this example, struct foo is defined as the same type as its alias, foo_t. Oracle Solaris Csystem headers often use the suffix _t to denote a typedef alias.
EnumerationsDefining symbolic names for constants in a program eases readability and simplifies the processof maintaining the program in the future. One method is to define an enumeration, which
Type and Constant Definitions
Oracle Solaris Dynamic Tracing Guide • November 2011 E22973_0284
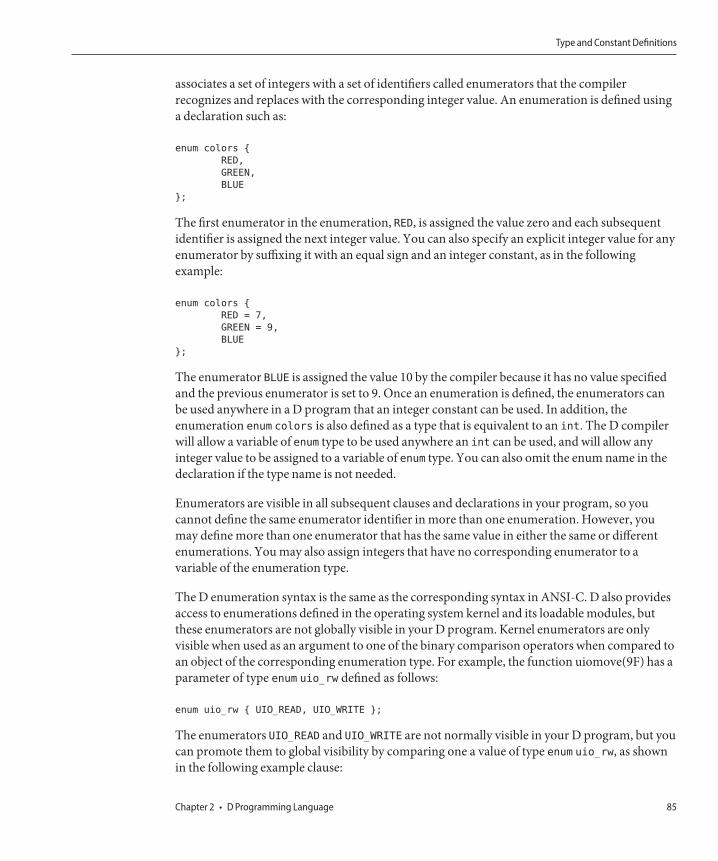
associates a set of integers with a set of identifiers called enumerators that the compilerrecognizes and replaces with the corresponding integer value. An enumeration is defined usinga declaration such as:
enum colors {
RED,
GREEN,
BLUE
};
The first enumerator in the enumeration, RED, is assigned the value zero and each subsequentidentifier is assigned the next integer value. You can also specify an explicit integer value for anyenumerator by suffixing it with an equal sign and an integer constant, as in the followingexample:
enum colors {
RED = 7,
GREEN = 9,
BLUE
};
The enumerator BLUE is assigned the value 10 by the compiler because it has no value specifiedand the previous enumerator is set to 9. Once an enumeration is defined, the enumerators canbe used anywhere in a D program that an integer constant can be used. In addition, theenumeration enum colors is also defined as a type that is equivalent to an int. The D compilerwill allow a variable of enum type to be used anywhere an int can be used, and will allow anyinteger value to be assigned to a variable of enum type. You can also omit the enum name in thedeclaration if the type name is not needed.
Enumerators are visible in all subsequent clauses and declarations in your program, so youcannot define the same enumerator identifier in more than one enumeration. However, youmay define more than one enumerator that has the same value in either the same or differentenumerations. You may also assign integers that have no corresponding enumerator to avariable of the enumeration type.
The D enumeration syntax is the same as the corresponding syntax in ANSI-C. D also providesaccess to enumerations defined in the operating system kernel and its loadable modules, butthese enumerators are not globally visible in your D program. Kernel enumerators are onlyvisible when used as an argument to one of the binary comparison operators when compared toan object of the corresponding enumeration type. For example, the function uiomove(9F) has aparameter of type enum uio_rw defined as follows:
enum uio_rw { UIO_READ, UIO_WRITE };
The enumerators UIO_READ and UIO_WRITE are not normally visible in your D program, but youcan promote them to global visibility by comparing one a value of type enum uio_rw, as shownin the following example clause:
Type and Constant Definitions
Chapter 2 • D Programming Language 85
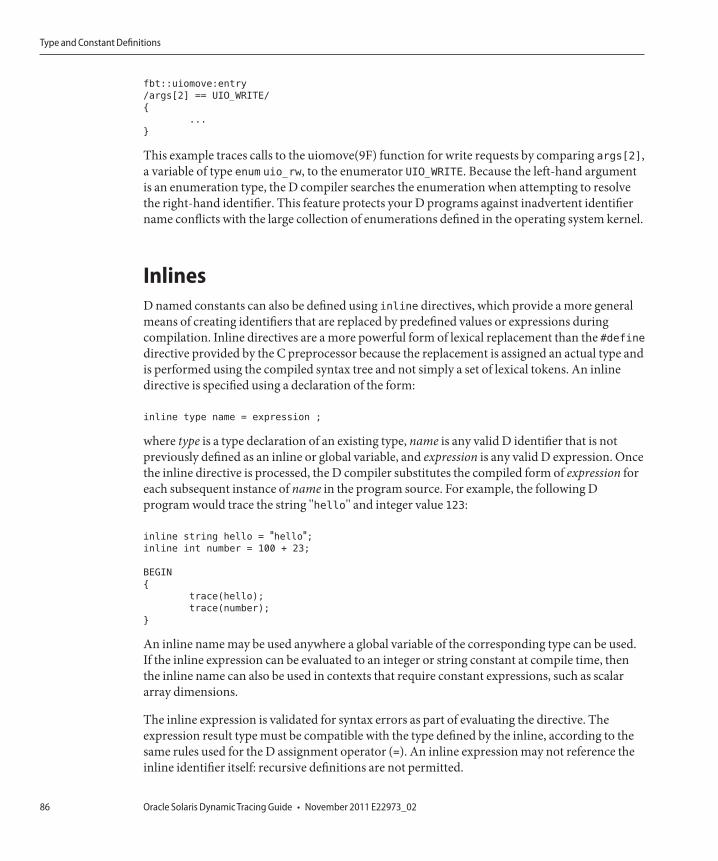
fbt::uiomove:entry
/args[2] == UIO_WRITE/
{
...
}
This example traces calls to the uiomove(9F) function for write requests by comparing args[2],a variable of type enum uio_rw, to the enumerator UIO_WRITE. Because the left-hand argumentis an enumeration type, the D compiler searches the enumeration when attempting to resolvethe right-hand identifier. This feature protects your D programs against inadvertent identifiername conflicts with the large collection of enumerations defined in the operating system kernel.
InlinesD named constants can also be defined using inline directives, which provide a more generalmeans of creating identifiers that are replaced by predefined values or expressions duringcompilation. Inline directives are a more powerful form of lexical replacement than the #definedirective provided by the C preprocessor because the replacement is assigned an actual type andis performed using the compiled syntax tree and not simply a set of lexical tokens. An inlinedirective is specified using a declaration of the form:
inline type name = expression ;
where type is a type declaration of an existing type, name is any valid D identifier that is notpreviously defined as an inline or global variable, and expression is any valid D expression. Oncethe inline directive is processed, the D compiler substitutes the compiled form of expression foreach subsequent instance of name in the program source. For example, the following Dprogram would trace the string "hello" and integer value 123:
inline string hello = "hello";inline int number = 100 + 23;
BEGIN
{
trace(hello);
trace(number);
}
An inline name may be used anywhere a global variable of the corresponding type can be used.If the inline expression can be evaluated to an integer or string constant at compile time, thenthe inline name can also be used in contexts that require constant expressions, such as scalararray dimensions.
The inline expression is validated for syntax errors as part of evaluating the directive. Theexpression result type must be compatible with the type defined by the inline, according to thesame rules used for the D assignment operator (=). An inline expression may not reference theinline identifier itself: recursive definitions are not permitted.
Type and Constant Definitions
Oracle Solaris Dynamic Tracing Guide • November 2011 E22973_0286
The DTrace software packages install a number of D source files in the system directory/usr/lib/dtrace that contain inline directives you can use in your D programs. For example,the signal.d library includes directives of the form:
inline int SIGHUP = 1;
inline int SIGINT = 2;
inline int SIGQUIT = 3;
...
These inline definitions provide you access to the current set of Oracle Solaris signal namesdescribed in signal(3HEAD). Similarly, the errno.d library contains inline directives for the Cerrno constants described in Intro(2).
By default, the D compiler includes all of the provided D library files automatically so you canuse these definitions in any D program.
Type NamespacesThis section discusses D namespaces and namespace issues related to types. In traditionallanguages such as ANSI-C, type visibility is determined by whether a type is nested inside of afunction or other declaration. Types declared at the outer scope of a C program are associatedwith a single global namespace and are visible throughout the entire program. Types defined inC header files are typically included in this outer scope. Unlike these languages, D providesaccess to types from multiple outer scopes.
D is a language that facilitates dynamic observability across multiple layers of a software stack,including the operating system kernel, an associated set of loadable kernel modules, and userprocesses running on the system. A single D program may instantiate probes to gather datafrom multiple kernel modules or other software entities that are compiled into independentbinary objects. Therefore, more than one data type of the same name, perhaps with differentdefinitions, might be present in the universe of types available to DTrace and the D compiler.To manage this situation, the D compiler associates each type with a namespace identified bythe containing program object. Types from a particular program object can be accessed byspecifying the object name and backquote (‘) scoping operator in any type name.
For example, if a kernel module named foo contains the following C type declaration:
typedef struct bar {
int x;
} bar_t;
then the types struct bar and bar_t could be accessed from D using the type names:
struct foo‘bar foo‘bar_t
The backquote operator can be used in any context where a type name is appropriate, includingwhen specifying the type for D variable declarations or cast expressions in D probe clauses.
Type and Constant Definitions
Chapter 2 • D Programming Language 87
The D compiler also provides two special built-in type namespaces that use the names C and Drespectively. The C type namespace is initially populated with the standard ANSI-C intrinsictypes such as int. In addition, type definitions acquired using the C preprocessor cpp(1) usingthe dtrace -C option will be processed by and added to the C scope. As a result, you can includeC header files containing type declarations which are already visible in another type namespacewithout causing a compilation error.
The D type namespace is initially populated with the D type intrinsics such as int and string aswell as the built-in D type aliases such as uint32_t. Any new type declarations that appear inthe D program source are automatically added to the D type namespace. If you create a complextype such as a struct in your D program consisting of member types from other namespaces,the member types will be copied into the D namespace by the declaration.
When the D compiler encounters a type declaration that does not specify an explicit namespaceusing the backquote operator, the compiler searches the set of active type namespaces to find amatch using the specified type name. The C namespace is always searched first, followed by theD namespace. If the type name is not found in either the C or D namespace, the typenamespaces of the active kernel modules are searched in ascending order by kernel module ID.This ordering guarantees that the binary objects that form the core kernel are searched beforeany loadable kernel modules, but does not guarantee any ordering properties among theloadable modules. You should use the scoping operator when accessing types defined inloadable kernel modules to avoid type name conflicts with other kernel modules.
The D compiler uses compressed ANSI-C debugging information provided with the coreOracle Solaris kernel modules in order to automatically access the types associated with theoperating system source code without the need for accessing the corresponding C include files.This symbolic debugging information might not be available for all kernel modules on yoursystem. The D compiler will report an error if you attempt to access a type within thenamespace of a module that lacks compressed C debugging information intended for use withDTrace.
Type and Constant Definitions
Oracle Solaris Dynamic Tracing Guide • November 2011 E22973_0288
Aggregations
When instrumenting the system to answer performance-related questions, it is useful toconsider how data can be aggregated to answer a specific question rather than thinking in termsof data gathered by individual probes. For example, if you wanted to know the number ofsystem calls by user ID, you would not necessarily care about the datum collected at each systemcall. You simply want to see a table of user IDs and system calls. Historically, you would answerthis question by gathering data at each system call, and postprocessing the data using a tool likeawk(1) or perl(1). However, in DTrace the aggregating of data is a first-class operation. Thischapter describes the DTrace facilities for manipulating aggregations.
Aggregating FunctionsAn aggregating function is one that has the following property:
f(f(x0) U f(x1) U ... U f(xn)) = f(x0 U x1 U ... U xn)
where x{_}{_}{~}n{~} is a set of arbitrary data. That is, applying an aggregating function tosubsets of the whole and then applying it again to the results gives the same result as applying itto the whole itself. For example, consider a function SUM that yields the summation of a givendata set. If the raw data consists of {2, 1, 2, 5, 4, 3, 6, 4, 2}, the result of applying SUM to the entireset is {29}. Similarly, the result of applying SUM to the subset consisting of the first three elementsis {5}, the result of applying SUM to the set consisting of the subsequent three elements is {12},and the result of of applying SUM to the remaining three elements is also {12}. SUM is anaggregating function because applying it to the set of these results, {5, 12, 12}, yields the sameresult, {29}, as applying SUM to the original data.
Not all functions are aggregating functions. An example of a non-aggregating function is thefunction MEDIAN that determines the median element of the set. (The median is defined to bethat element of a set for which as many elements in the set are greater than it as are less than it.)The MEDIAN is derived by sorting the set and selecting the middle element. Returning to theoriginal raw data, if MEDIAN is applied to the set consisting of the first three elements, the result is
3C H A P T E R 3
89
{2}. (The sorted set is {1, 2, 2}; {2} is the set consisting of the middle element.) Likewise, applyingMEDIAN to the next three elements yields {4} and applying MEDIAN to the final three elementsyields {4}. Applying MEDIAN to each of the subsets thus yields the set {2, 4, 4}. Applying MEDIAN tothis set yields the result {4}. However, sorting the original set yields {1, 2, 2, 2, 3, 4, 4, 5, 6}.Applying MEDIAN to this set thus yields {3}. Because these results do not match, MEDIAN is not anaggregating function.
Many common functions for understanding a set of data are aggregating functions. Thesefunctions include counting the number of elements in the set, computing the minimum value ofthe set, computing the maximum value of the set, and summing all elements in the set.Determining the arithmetic mean of the set can be constructed from the function to count thenumber of elements in the set and the function to sum the number the elements in the set.
However, several useful functions are not aggregating functions. These functions includecomputing the mode (the most common element) of a set, the median value of the set, or thestandard deviation of the set.
Applying aggregating functions to data as it is traced has a number of advantages:
■ The entire data set need not be stored. Whenever a new element is to be added to the set, theaggregating function is calculated given the set consisting of the current intermediate resultand the new element. After the new result is calculated, the new element may be discarded.This process reduces the amount of storage required by a factor of the number of datapoints, which is often quite large.
■ Data collection does not induce pathological scalability problems. Aggregating functionsenable intermediate results to be kept per-CPU instead of in a shared data structure. DTracethen applies the aggregating function to the set consisting of the per-CPU intermediateresults to produce the final system-wide result.
AggregationsDTrace stores the results of aggregating functions in objects called aggregations. Theaggregation results are indexed using a tuple of expressions similar to those used for associativearrays. In D, the syntax for an aggregation is:
@name[ keys ] = aggfunc ( args );
where name is the name of the aggregation, keys is a comma-separated list of D expressions,aggfunc is one of the DTrace aggregating functions, and args is a comma-separated list ofarguments appropriate for the aggregating function. The aggregation name is a D identifier thatis prefixed with the special character @. All aggregations named in your D programs are globalvariables; there are no thread- or clause-local aggregations. The aggregation names are kept in aseparate identifier namespace from other D global variables. Remember that a and @a are not
Aggregations
Oracle Solaris Dynamic Tracing Guide • November 2011 E22973_0290
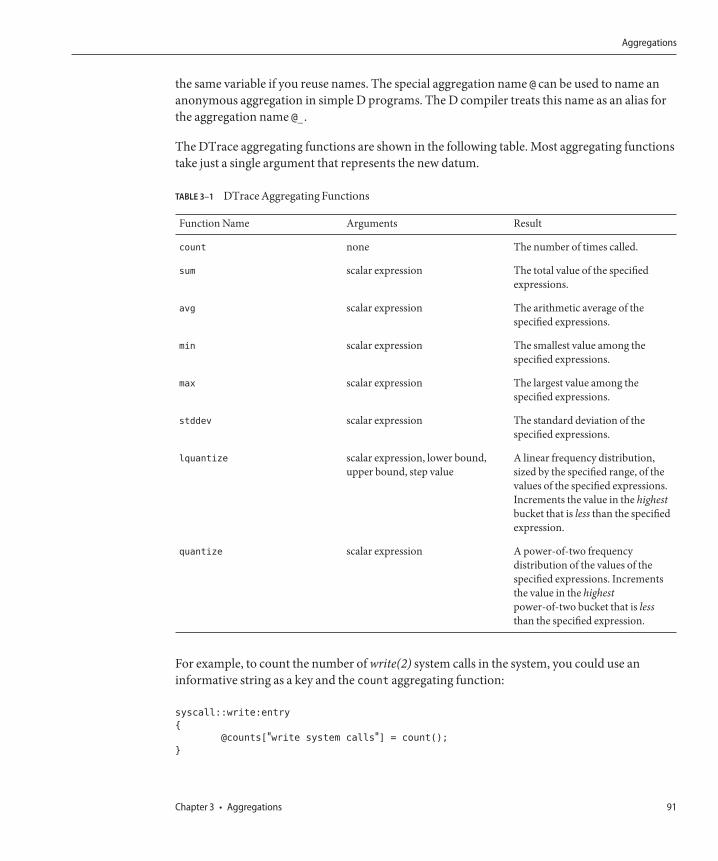
the same variable if you reuse names. The special aggregation name @ can be used to name ananonymous aggregation in simple D programs. The D compiler treats this name as an alias forthe aggregation name @_.
The DTrace aggregating functions are shown in the following table. Most aggregating functionstake just a single argument that represents the new datum.
TABLE 3–1 DTrace Aggregating Functions
Function Name Arguments Result
count none The number of times called.
sum scalar expression The total value of the specifiedexpressions.
avg scalar expression The arithmetic average of thespecified expressions.
min scalar expression The smallest value among thespecified expressions.
max scalar expression The largest value among thespecified expressions.
stddev scalar expression The standard deviation of thespecified expressions.
lquantize scalar expression, lower bound,upper bound, step value
A linear frequency distribution,sized by the specified range, of thevalues of the specified expressions.Increments the value in the highestbucket that is less than the specifiedexpression.
quantize scalar expression A power-of-two frequencydistribution of the values of thespecified expressions. Incrementsthe value in the highestpower-of-two bucket that is lessthan the specified expression.
For example, to count the number of write(2) system calls in the system, you could use aninformative string as a key and the count aggregating function:
syscall::write:entry
{
@counts["write system calls"] = count();
}
Aggregations
Chapter 3 • Aggregations 91
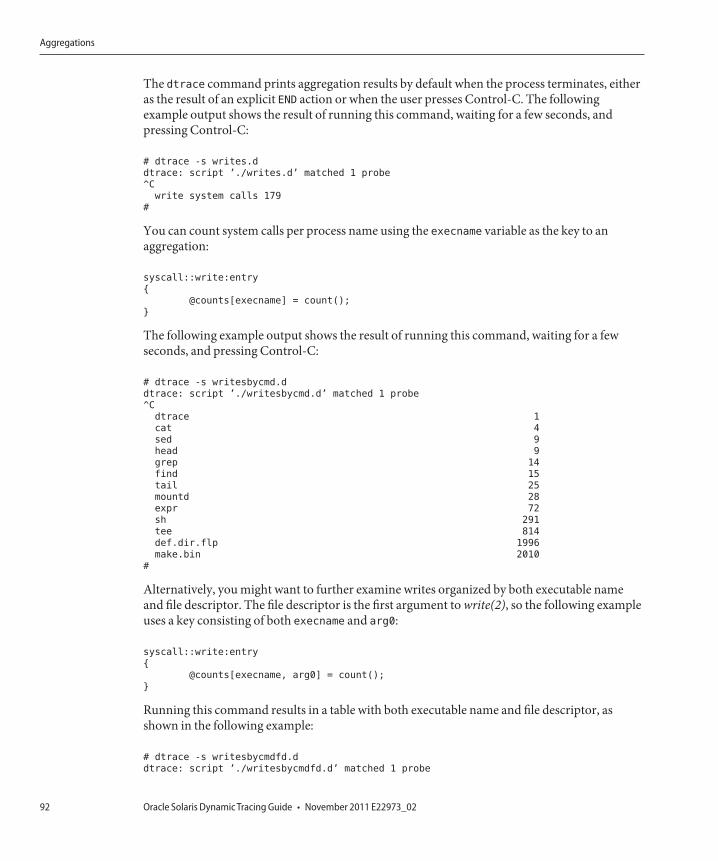
The dtrace command prints aggregation results by default when the process terminates, eitheras the result of an explicit END action or when the user presses Control-C. The followingexample output shows the result of running this command, waiting for a few seconds, andpressing Control-C:
# dtrace -s writes.d
dtrace: script ’./writes.d’ matched 1 probe
^C
write system calls 179
#
You can count system calls per process name using the execname variable as the key to anaggregation:
syscall::write:entry
{
@counts[execname] = count();
}
The following example output shows the result of running this command, waiting for a fewseconds, and pressing Control-C:
# dtrace -s writesbycmd.d
dtrace: script ’./writesbycmd.d’ matched 1 probe
^C
dtrace 1
cat 4
sed 9
head 9
grep 14
find 15
tail 25
mountd 28
expr 72
sh 291
tee 814
def.dir.flp 1996
make.bin 2010
#
Alternatively, you might want to further examine writes organized by both executable nameand file descriptor. The file descriptor is the first argument to write(2), so the following exampleuses a key consisting of both execname and arg0:
syscall::write:entry
{
@counts[execname, arg0] = count();
}
Running this command results in a table with both executable name and file descriptor, asshown in the following example:
# dtrace -s writesbycmdfd.d
dtrace: script ’./writesbycmdfd.d’ matched 1 probe
Aggregations
Oracle Solaris Dynamic Tracing Guide • November 2011 E22973_0292
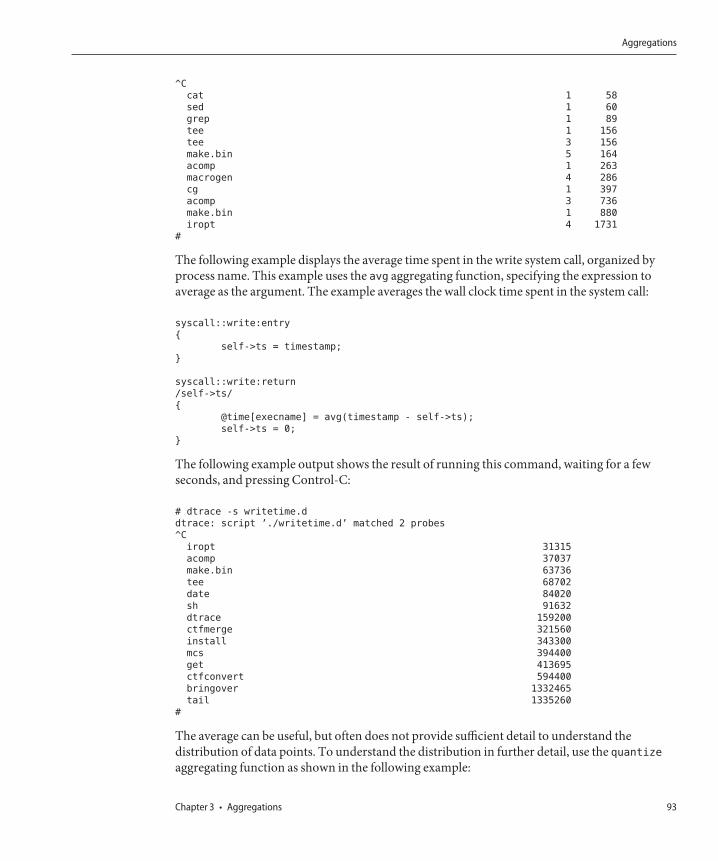
^C
cat 1 58
sed 1 60
grep 1 89
tee 1 156
tee 3 156
make.bin 5 164
acomp 1 263
macrogen 4 286
cg 1 397
acomp 3 736
make.bin 1 880
iropt 4 1731
#
The following example displays the average time spent in the write system call, organized byprocess name. This example uses the avg aggregating function, specifying the expression toaverage as the argument. The example averages the wall clock time spent in the system call:
syscall::write:entry
{
self->ts = timestamp;
}
syscall::write:return
/self->ts/
{
@time[execname] = avg(timestamp - self->ts);
self->ts = 0;
}
The following example output shows the result of running this command, waiting for a fewseconds, and pressing Control-C:
# dtrace -s writetime.d
dtrace: script ’./writetime.d’ matched 2 probes
^C
iropt 31315
acomp 37037
make.bin 63736
tee 68702
date 84020
sh 91632
dtrace 159200
ctfmerge 321560
install 343300
mcs 394400
get 413695
ctfconvert 594400
bringover 1332465
tail 1335260
#
The average can be useful, but often does not provide sufficient detail to understand thedistribution of data points. To understand the distribution in further detail, use the quantizeaggregating function as shown in the following example:
Aggregations
Chapter 3 • Aggregations 93
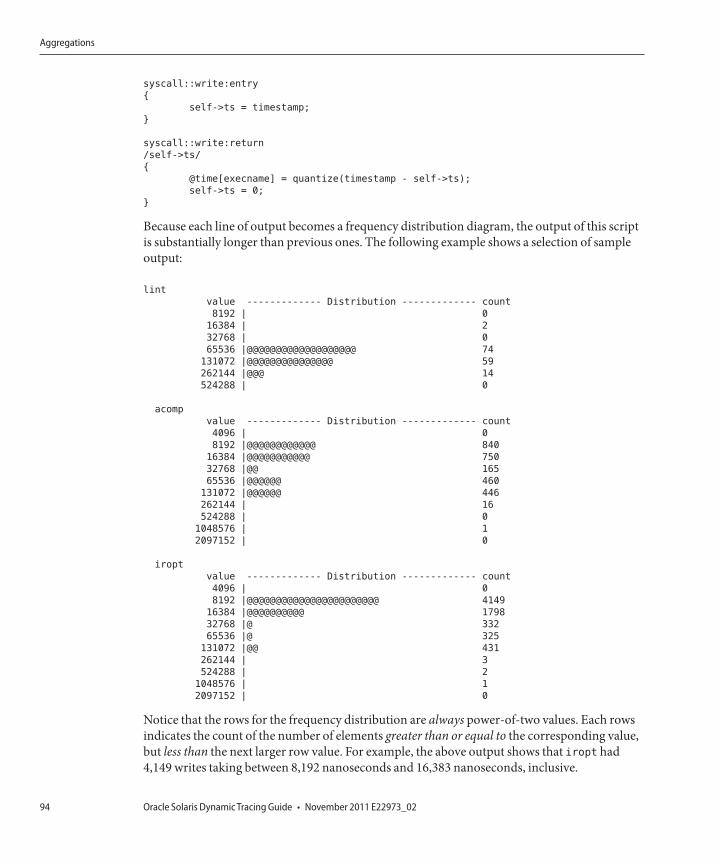
syscall::write:entry
{
self->ts = timestamp;
}
syscall::write:return
/self->ts/
{
@time[execname] = quantize(timestamp - self->ts);
self->ts = 0;
}
Because each line of output becomes a frequency distribution diagram, the output of this scriptis substantially longer than previous ones. The following example shows a selection of sampleoutput:
lint
value ------------- Distribution ------------- count
8192 | 0
16384 | 2
32768 | 0
65536 |@@@@@@@@@@@@@@@@@@@ 74
131072 |@@@@@@@@@@@@@@@ 59
262144 |@@@ 14
524288 | 0
acomp
value ------------- Distribution ------------- count
4096 | 0
8192 |@@@@@@@@@@@@ 840
16384 |@@@@@@@@@@@ 750
32768 |@@ 165
65536 |@@@@@@ 460
131072 |@@@@@@ 446
262144 | 16
524288 | 0
1048576 | 1
2097152 | 0
iropt
value ------------- Distribution ------------- count
4096 | 0
8192 |@@@@@@@@@@@@@@@@@@@@@@@ 4149
16384 |@@@@@@@@@@ 1798
32768 |@ 332
65536 |@ 325
131072 |@@ 431
262144 | 3
524288 | 2
1048576 | 1
2097152 | 0
Notice that the rows for the frequency distribution are always power-of-two values. Each rowsindicates the count of the number of elements greater than or equal to the corresponding value,but less than the next larger row value. For example, the above output shows that iropt had4,149 writes taking between 8,192 nanoseconds and 16,383 nanoseconds, inclusive.
Aggregations
Oracle Solaris Dynamic Tracing Guide • November 2011 E22973_0294
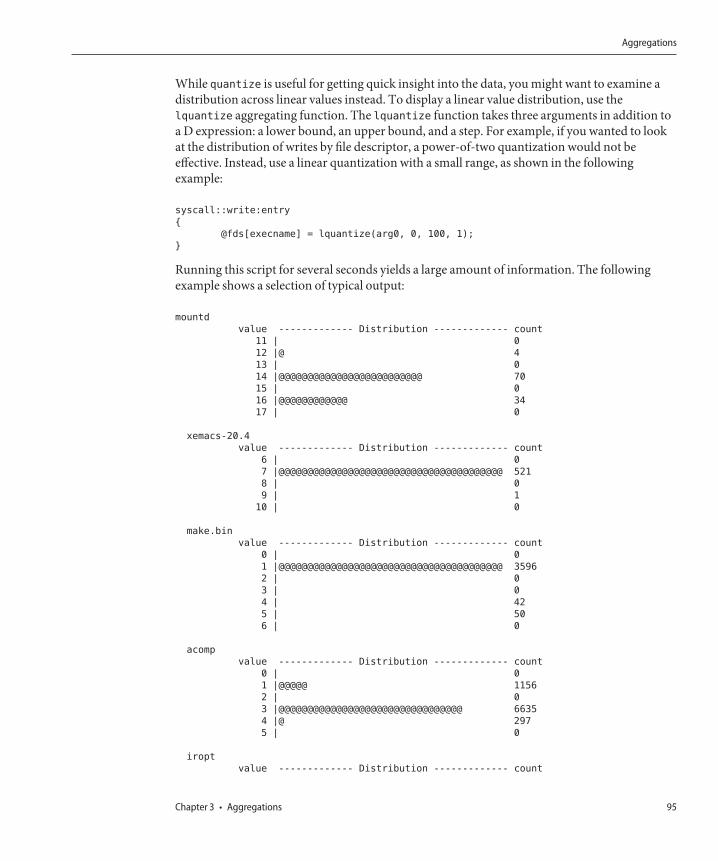
While quantize is useful for getting quick insight into the data, you might want to examine adistribution across linear values instead. To display a linear value distribution, use thelquantize aggregating function. The lquantize function takes three arguments in addition toa D expression: a lower bound, an upper bound, and a step. For example, if you wanted to lookat the distribution of writes by file descriptor, a power-of-two quantization would not beeffective. Instead, use a linear quantization with a small range, as shown in the followingexample:
syscall::write:entry
{
@fds[execname] = lquantize(arg0, 0, 100, 1);
}
Running this script for several seconds yields a large amount of information. The followingexample shows a selection of typical output:
mountd
value ------------- Distribution ------------- count
11 | 0
12 |@ 4
13 | 0
14 |@@@@@@@@@@@@@@@@@@@@@@@@@ 70
15 | 0
16 |@@@@@@@@@@@@ 34
17 | 0
xemacs-20.4
value ------------- Distribution ------------- count
6 | 0
7 |@@@@@@@@@@@@@@@@@@@@@@@@@@@@@@@@@@@@@@@ 521
8 | 0
9 | 1
10 | 0
make.bin
value ------------- Distribution ------------- count
0 | 0
1 |@@@@@@@@@@@@@@@@@@@@@@@@@@@@@@@@@@@@@@@ 3596
2 | 0
3 | 0
4 | 42
5 | 50
6 | 0
acomp
value ------------- Distribution ------------- count
0 | 0
1 |@@@@@ 1156
2 | 0
3 |@@@@@@@@@@@@@@@@@@@@@@@@@@@@@@@@ 6635
4 |@ 297
5 | 0
iropt
value ------------- Distribution ------------- count
Aggregations
Chapter 3 • Aggregations 95
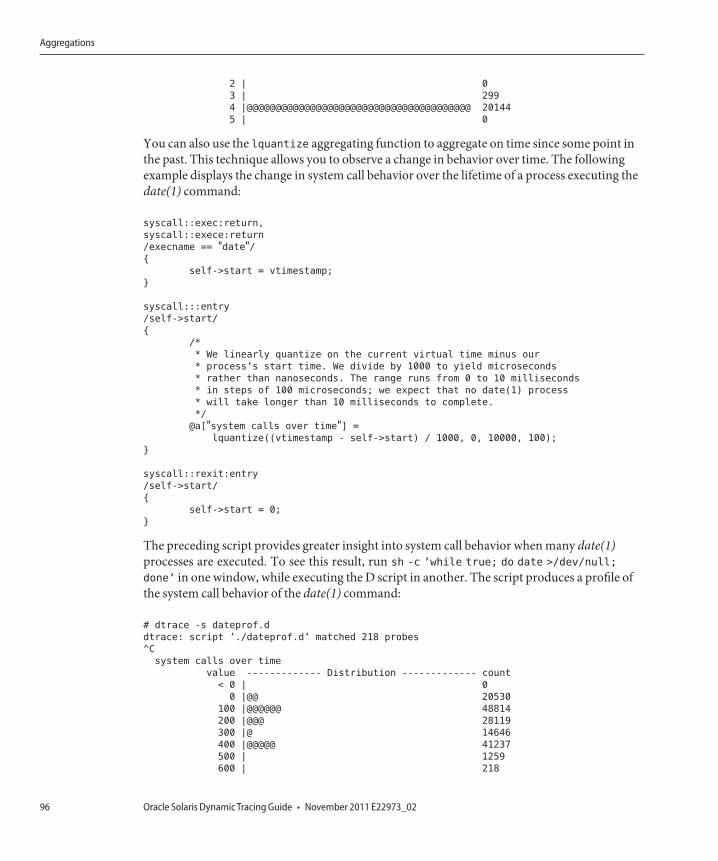
2 | 0
3 | 299
4 |@@@@@@@@@@@@@@@@@@@@@@@@@@@@@@@@@@@@@@@ 20144
5 | 0
You can also use the lquantize aggregating function to aggregate on time since some point inthe past. This technique allows you to observe a change in behavior over time. The followingexample displays the change in system call behavior over the lifetime of a process executing thedate(1) command:
syscall::exec:return,
syscall::exece:return
/execname == "date"/{
self->start = vtimestamp;
}
syscall:::entry
/self->start/
{
/*
* We linearly quantize on the current virtual time minus our
* process’s start time. We divide by 1000 to yield microseconds
* rather than nanoseconds. The range runs from 0 to 10 milliseconds
* in steps of 100 microseconds; we expect that no date(1) process
* will take longer than 10 milliseconds to complete.
*/
@a["system calls over time"] =
lquantize((vtimestamp - self->start) / 1000, 0, 10000, 100);
}
syscall::rexit:entry
/self->start/
{
self->start = 0;
}
The preceding script provides greater insight into system call behavior when many date(1)processes are executed. To see this result, run sh -c ’while true; do date >/dev/null;
done’ in one window, while executing the D script in another. The script produces a profile ofthe system call behavior of the date(1) command:
# dtrace -s dateprof.d
dtrace: script ’./dateprof.d’ matched 218 probes
^C
system calls over time
value ------------- Distribution ------------- count
< 0 | 0
0 |@@ 20530
100 |@@@@@@ 48814
200 |@@@ 28119
300 |@ 14646
400 |@@@@@ 41237
500 | 1259
600 | 218
Aggregations
Oracle Solaris Dynamic Tracing Guide • November 2011 E22973_0296
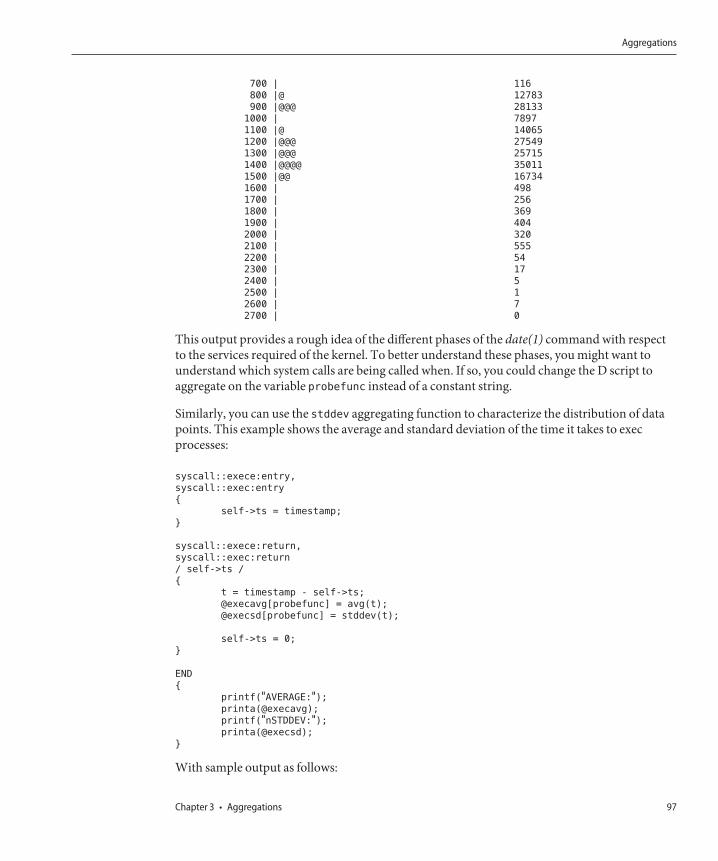
700 | 116
800 |@ 12783
900 |@@@ 28133
1000 | 7897
1100 |@ 14065
1200 |@@@ 27549
1300 |@@@ 25715
1400 |@@@@ 35011
1500 |@@ 16734
1600 | 498
1700 | 256
1800 | 369
1900 | 404
2000 | 320
2100 | 555
2200 | 54
2300 | 17
2400 | 5
2500 | 1
2600 | 7
2700 | 0
This output provides a rough idea of the different phases of the date(1) command with respectto the services required of the kernel. To better understand these phases, you might want tounderstand which system calls are being called when. If so, you could change the D script toaggregate on the variable probefunc instead of a constant string.
Similarly, you can use the stddev aggregating function to characterize the distribution of datapoints. This example shows the average and standard deviation of the time it takes to execprocesses:
syscall::exece:entry,
syscall::exec:entry
{
self->ts = timestamp;
}
syscall::exece:return,
syscall::exec:return
/ self->ts /
{
t = timestamp - self->ts;
@execavg[probefunc] = avg(t);
@execsd[probefunc] = stddev(t);
self->ts = 0;
}
END
{
printf("AVERAGE:");printa(@execavg);
printf("nSTDDEV:");printa(@execsd);
}
With sample output as follows:
Aggregations
Chapter 3 • Aggregations 97
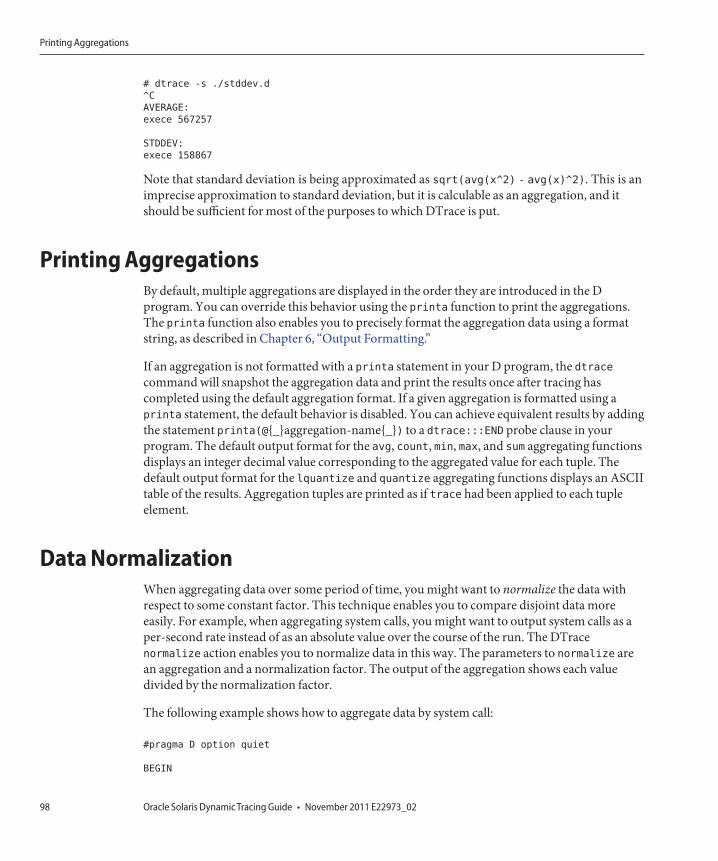
# dtrace -s ./stddev.d
^C
AVERAGE:
exece 567257
STDDEV:
exece 158867
Note that standard deviation is being approximated as sqrt(avg(x^2) - avg(x)^2). This is animprecise approximation to standard deviation, but it is calculable as an aggregation, and itshould be sufficient for most of the purposes to which DTrace is put.
Printing AggregationsBy default, multiple aggregations are displayed in the order they are introduced in the Dprogram. You can override this behavior using the printa function to print the aggregations.The printa function also enables you to precisely format the aggregation data using a formatstring, as described in Chapter 6, “Output Formatting.”
If an aggregation is not formatted with a printa statement in your D program, the dtracecommand will snapshot the aggregation data and print the results once after tracing hascompleted using the default aggregation format. If a given aggregation is formatted using aprinta statement, the default behavior is disabled. You can achieve equivalent results by addingthe statement printa(@{_}aggregation-name{_}) to a dtrace:::END probe clause in yourprogram. The default output format for the avg, count, min, max, and sum aggregating functionsdisplays an integer decimal value corresponding to the aggregated value for each tuple. Thedefault output format for the lquantize and quantize aggregating functions displays an ASCIItable of the results. Aggregation tuples are printed as if trace had been applied to each tupleelement.
Data NormalizationWhen aggregating data over some period of time, you might want to normalize the data withrespect to some constant factor. This technique enables you to compare disjoint data moreeasily. For example, when aggregating system calls, you might want to output system calls as aper-second rate instead of as an absolute value over the course of the run. The DTracenormalize action enables you to normalize data in this way. The parameters to normalize arean aggregation and a normalization factor. The output of the aggregation shows each valuedivided by the normalization factor.
The following example shows how to aggregate data by system call:
#pragma D option quiet
BEGIN
Printing Aggregations
Oracle Solaris Dynamic Tracing Guide • November 2011 E22973_0298
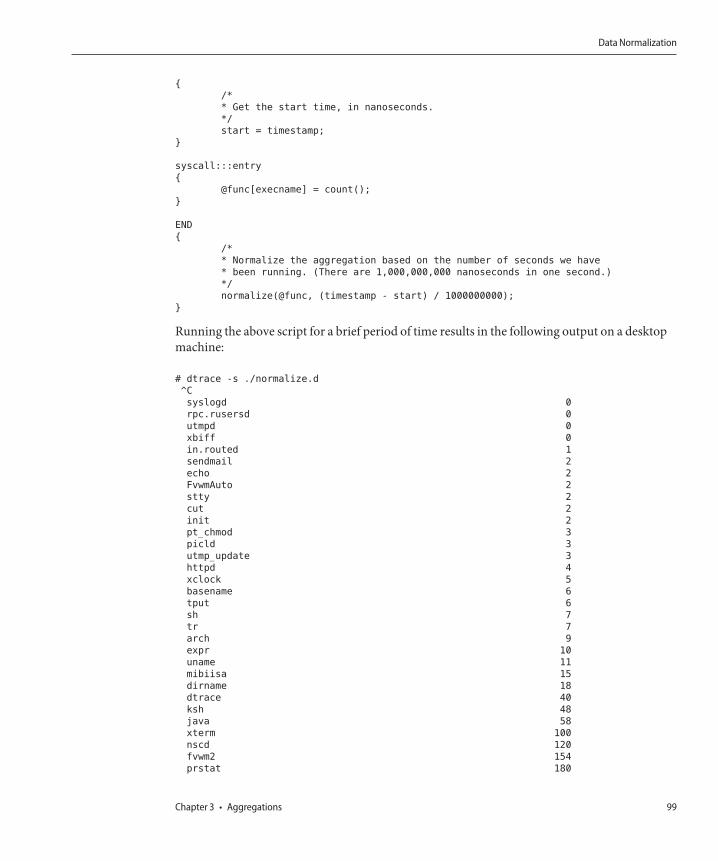
{
/*
* Get the start time, in nanoseconds.
*/
start = timestamp;
}
syscall:::entry
{
@func[execname] = count();
}
END
{
/*
* Normalize the aggregation based on the number of seconds we have
* been running. (There are 1,000,000,000 nanoseconds in one second.)
*/
normalize(@func, (timestamp - start) / 1000000000);
}
Running the above script for a brief period of time results in the following output on a desktopmachine:
# dtrace -s ./normalize.d
^C
syslogd 0
rpc.rusersd 0
utmpd 0
xbiff 0
in.routed 1
sendmail 2
echo 2
FvwmAuto 2
stty 2
cut 2
init 2
pt_chmod 3
picld 3
utmp_update 3
httpd 4
xclock 5
basename 6
tput 6
sh 7
tr 7
arch 9
expr 10
uname 11
mibiisa 15
dirname 18
dtrace 40
ksh 48
java 58
xterm 100
nscd 120
fvwm2 154
prstat 180
Data Normalization
Chapter 3 • Aggregations 99
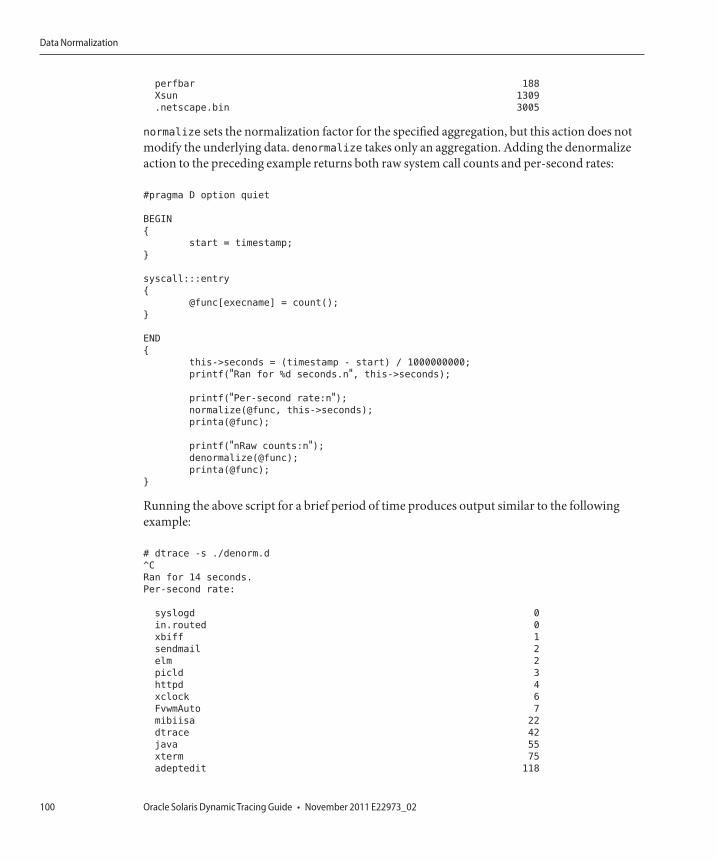
perfbar 188
Xsun 1309
.netscape.bin 3005
normalize sets the normalization factor for the specified aggregation, but this action does notmodify the underlying data. denormalize takes only an aggregation. Adding the denormalizeaction to the preceding example returns both raw system call counts and per-second rates:
#pragma D option quiet
BEGIN
{
start = timestamp;
}
syscall:::entry
{
@func[execname] = count();
}
END
{
this->seconds = (timestamp - start) / 1000000000;
printf("Ran for %d seconds.n", this->seconds);
printf("Per-second rate:n");normalize(@func, this->seconds);
printa(@func);
printf("nRaw counts:n");denormalize(@func);
printa(@func);
}
Running the above script for a brief period of time produces output similar to the followingexample:
# dtrace -s ./denorm.d
^C
Ran for 14 seconds.
Per-second rate:
syslogd 0
in.routed 0
xbiff 1
sendmail 2
elm 2
picld 3
httpd 4
xclock 6
FvwmAuto 7
mibiisa 22
dtrace 42
java 55
xterm 75
adeptedit 118
Data Normalization
Oracle Solaris Dynamic Tracing Guide • November 2011 E22973_02100
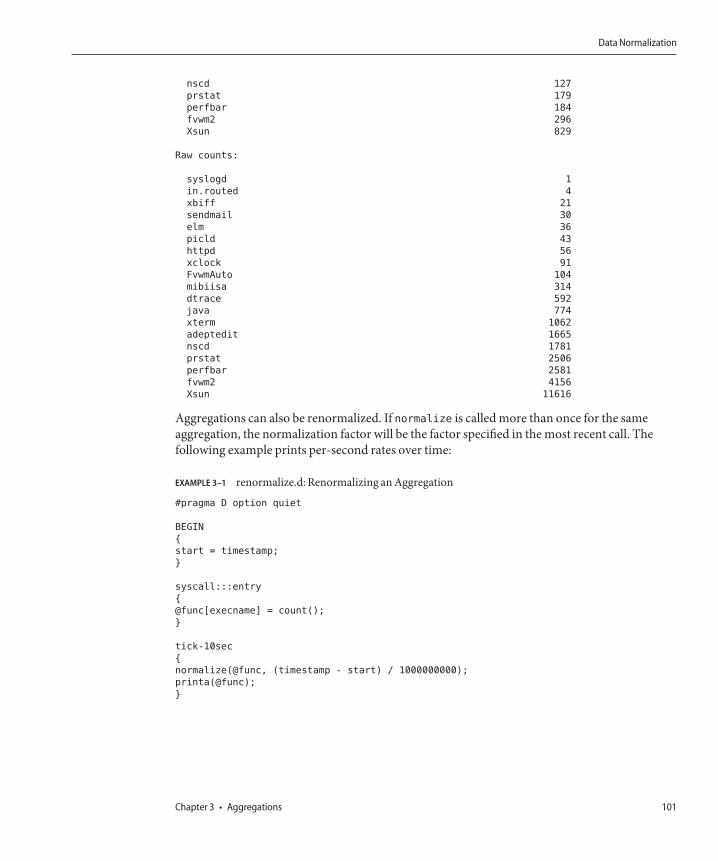
nscd 127
prstat 179
perfbar 184
fvwm2 296
Xsun 829
Raw counts:
syslogd 1
in.routed 4
xbiff 21
sendmail 30
elm 36
picld 43
httpd 56
xclock 91
FvwmAuto 104
mibiisa 314
dtrace 592
java 774
xterm 1062
adeptedit 1665
nscd 1781
prstat 2506
perfbar 2581
fvwm2 4156
Xsun 11616
Aggregations can also be renormalized. If normalize is called more than once for the sameaggregation, the normalization factor will be the factor specified in the most recent call. Thefollowing example prints per-second rates over time:
EXAMPLE 3–1 renormalize.d: Renormalizing an Aggregation
#pragma D option quiet
BEGIN
{
start = timestamp;
}
syscall:::entry
{
@func[execname] = count();
}
tick-10sec
{
normalize(@func, (timestamp - start) / 1000000000);
printa(@func);
}
Data Normalization
Chapter 3 • Aggregations 101
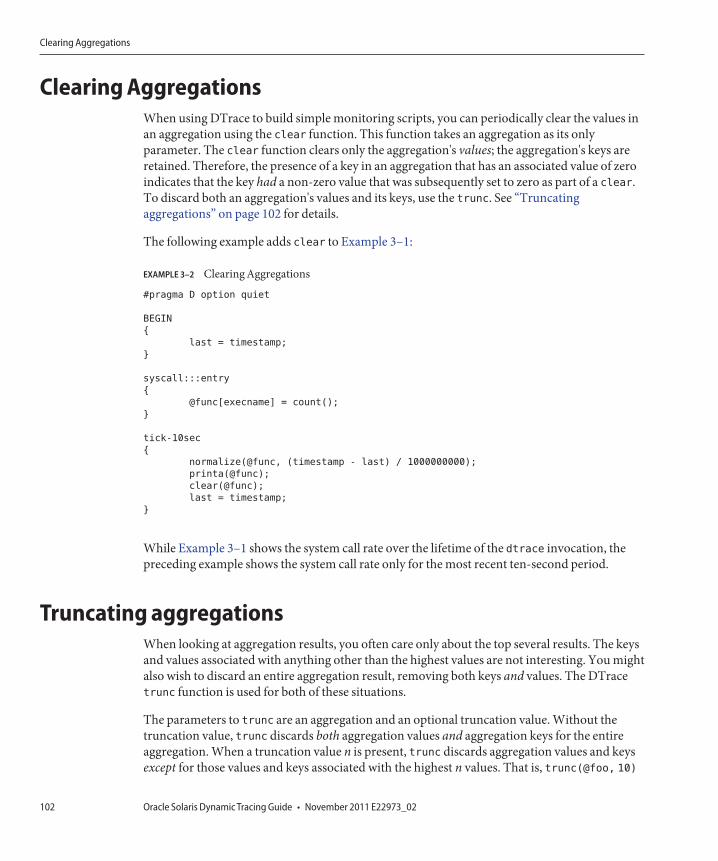
Clearing AggregationsWhen using DTrace to build simple monitoring scripts, you can periodically clear the values inan aggregation using the clear function. This function takes an aggregation as its onlyparameter. The clear function clears only the aggregation's values; the aggregation's keys areretained. Therefore, the presence of a key in an aggregation that has an associated value of zeroindicates that the key had a non-zero value that was subsequently set to zero as part of a clear.To discard both an aggregation's values and its keys, use the trunc. See “Truncatingaggregations” on page 102 for details.
The following example adds clear to Example 3–1:
EXAMPLE 3–2 Clearing Aggregations
#pragma D option quiet
BEGIN
{
last = timestamp;
}
syscall:::entry
{
@func[execname] = count();
}
tick-10sec
{
normalize(@func, (timestamp - last) / 1000000000);
printa(@func);
clear(@func);
last = timestamp;
}
While Example 3–1 shows the system call rate over the lifetime of the dtrace invocation, thepreceding example shows the system call rate only for the most recent ten-second period.
Truncating aggregationsWhen looking at aggregation results, you often care only about the top several results. The keysand values associated with anything other than the highest values are not interesting. You mightalso wish to discard an entire aggregation result, removing both keys and values. The DTracetrunc function is used for both of these situations.
The parameters to trunc are an aggregation and an optional truncation value. Without thetruncation value, trunc discards both aggregation values and aggregation keys for the entireaggregation. When a truncation value n is present, trunc discards aggregation values and keysexcept for those values and keys associated with the highest n values. That is, trunc(@foo, 10)
Clearing Aggregations
Oracle Solaris Dynamic Tracing Guide • November 2011 E22973_02102
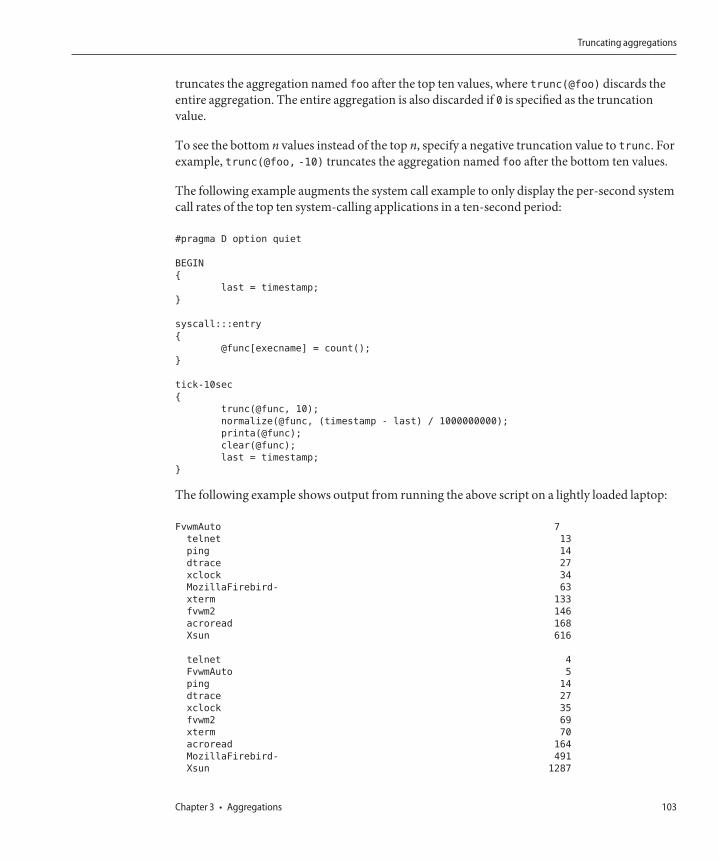
truncates the aggregation named foo after the top ten values, where trunc(@foo) discards theentire aggregation. The entire aggregation is also discarded if 0 is specified as the truncationvalue.
To see the bottom n values instead of the top n, specify a negative truncation value to trunc. Forexample, trunc(@foo, -10) truncates the aggregation named foo after the bottom ten values.
The following example augments the system call example to only display the per-second systemcall rates of the top ten system-calling applications in a ten-second period:
#pragma D option quiet
BEGIN
{
last = timestamp;
}
syscall:::entry
{
@func[execname] = count();
}
tick-10sec
{
trunc(@func, 10);
normalize(@func, (timestamp - last) / 1000000000);
printa(@func);
clear(@func);
last = timestamp;
}
The following example shows output from running the above script on a lightly loaded laptop:
FvwmAuto 7
telnet 13
ping 14
dtrace 27
xclock 34
MozillaFirebird- 63
xterm 133
fvwm2 146
acroread 168
Xsun 616
telnet 4
FvwmAuto 5
ping 14
dtrace 27
xclock 35
fvwm2 69
xterm 70
acroread 164
MozillaFirebird- 491
Xsun 1287
Truncating aggregations
Chapter 3 • Aggregations 103
Minimizing DropsBecause DTrace buffers some aggregation data in the kernel, space might not be available whena new key is added to an aggregation. In this case, the data will be dropped, a counter will beincremented, and dtrace will generate a message indicating an aggregation drop. This situationrarely occurs because DTrace keeps long-running state (consisting of the aggregation's key andintermediate result) at user-level where space may grow dynamically. In the unlikely event thataggregation drops occur, you can increase the aggregation buffer size with the aggsize optionto reduce the likelihood of drops. You can also use this option to minimize the memoryfootprint of DTrace. As with any size option, aggsize may be specified with any size suffix. Theresizing policy of this buffer is dictated by the bufresize option. For more details on buffering,see Chapter 5, “Buffers and Buffering.” For more details on options, see Chapter 10, “Optionsand Tunables.”
An alternative method to eliminate aggregation drops is to increase the rate at whichaggregation data is consumed at user-level. This rate defaults to once per second, and may beexplicitly tuned with the aggrate option. As with any rate option, aggrate may be specifiedwith any time suffix, but defaults to rate-per-second. For more details on the aggsize option,see Chapter 10, “Options and Tunables.”
Minimizing Drops
Oracle Solaris Dynamic Tracing Guide • November 2011 E22973_02104
Actions and Subroutines
You can use D function calls such as trace and printf to invoke two different kinds of servicesprovided by DTrace: actions that trace data or modify state external to DTrace, and subroutinesthat affect only internal DTrace state. This chapter defines the actions and subroutines anddescribes their syntax and semantics.
ActionsActions enable your DTrace programs to interact with the system outside of DTrace. The mostcommon actions record data to a DTrace buffer. Other actions are available, such as stoppingthe current process, raising a specific signal on the current process, or ceasing tracingaltogether. Some of these actions are destructive in that they change the system, albeit in awell-defined way. These actions may only be used if destructive actions have been explicitlyenabled. By default, data recording actions record data to the principal buffer. For more detailson the principal buffer and buffer policies, see Chapter 5, “Buffers and Buffering.”
Default ActionA clause can contain any number of actions and variable manipulations. If a clause is left empty,the default action is taken. The default action is to trace the enabled probe identifier (EPID) tothe principal buffer. The EPID identifies a particular enabling of a particular probe with aparticular predicate and actions. From the EPID, DTrace consumers can determine the probethat induced the action. Indeed, whenever any data is traced, it must be accompanied by theEPID to enable the consumer to make sense of the data. Therefore, the default action is to tracethe EPID and nothing else.
Using the default action allows for simple use of dtrace(1M). For example, the followingexample command enables all probes in the TS timeshare scheduling module with the defaultaction:
# dtrace -m TS
4C H A P T E R 4
105
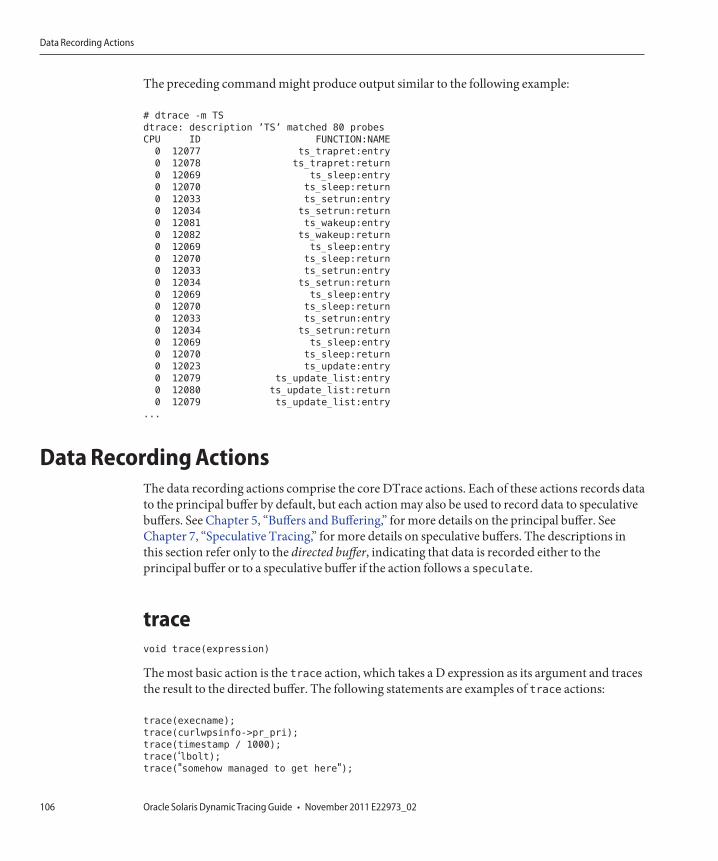
The preceding command might produce output similar to the following example:
# dtrace -m TS
dtrace: description ’TS’ matched 80 probes
CPU ID FUNCTION:NAME
0 12077 ts_trapret:entry
0 12078 ts_trapret:return
0 12069 ts_sleep:entry
0 12070 ts_sleep:return
0 12033 ts_setrun:entry
0 12034 ts_setrun:return
0 12081 ts_wakeup:entry
0 12082 ts_wakeup:return
0 12069 ts_sleep:entry
0 12070 ts_sleep:return
0 12033 ts_setrun:entry
0 12034 ts_setrun:return
0 12069 ts_sleep:entry
0 12070 ts_sleep:return
0 12033 ts_setrun:entry
0 12034 ts_setrun:return
0 12069 ts_sleep:entry
0 12070 ts_sleep:return
0 12023 ts_update:entry
0 12079 ts_update_list:entry
0 12080 ts_update_list:return
0 12079 ts_update_list:entry
...
Data Recording ActionsThe data recording actions comprise the core DTrace actions. Each of these actions records datato the principal buffer by default, but each action may also be used to record data to speculativebuffers. See Chapter 5, “Buffers and Buffering,” for more details on the principal buffer. SeeChapter 7, “Speculative Tracing,” for more details on speculative buffers. The descriptions inthis section refer only to the directed buffer, indicating that data is recorded either to theprincipal buffer or to a speculative buffer if the action follows a speculate.
tracevoid trace(expression)
The most basic action is the trace action, which takes a D expression as its argument and tracesthe result to the directed buffer. The following statements are examples of trace actions:
trace(execname);
trace(curlwpsinfo->pr_pri);
trace(timestamp / 1000);
trace(‘lbolt);trace("somehow managed to get here");
Data Recording Actions
Oracle Solaris Dynamic Tracing Guide • November 2011 E22973_02106
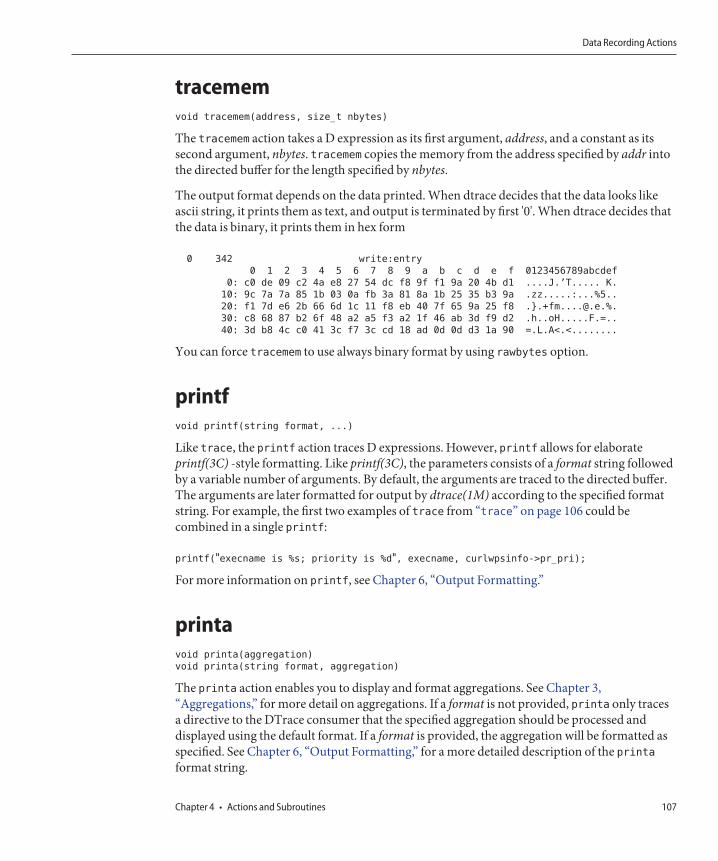
tracememvoid tracemem(address, size_t nbytes)
The tracemem action takes a D expression as its first argument, address, and a constant as itssecond argument, nbytes. tracemem copies the memory from the address specified by addr intothe directed buffer for the length specified by nbytes.
The output format depends on the data printed. When dtrace decides that the data looks likeascii string, it prints them as text, and output is terminated by first '0'. When dtrace decides thatthe data is binary, it prints them in hex form
0 342 write:entry
0 1 2 3 4 5 6 7 8 9 a b c d e f 0123456789abcdef
0: c0 de 09 c2 4a e8 27 54 dc f8 9f f1 9a 20 4b d1 ....J.’T..... K.
10: 9c 7a 7a 85 1b 03 0a fb 3a 81 8a 1b 25 35 b3 9a .zz.....:...%5..
20: f1 7d e6 2b 66 6d 1c 11 f8 eb 40 7f 65 9a 25 f8 .}[email protected].%.
30: c8 68 87 b2 6f 48 a2 a5 f3 a2 1f 46 ab 3d f9 d2 .h..oH.....F.=..
40: 3d b8 4c c0 41 3c f7 3c cd 18 ad 0d 0d d3 1a 90 =.L.A<.<........
You can force tracemem to use always binary format by using rawbytes option.
printfvoid printf(string format, ...)
Like trace, the printf action traces D expressions. However, printf allows for elaborateprintf(3C) -style formatting. Like printf(3C), the parameters consists of a format string followedby a variable number of arguments. By default, the arguments are traced to the directed buffer.The arguments are later formatted for output by dtrace(1M) according to the specified formatstring. For example, the first two examples of trace from “trace” on page 106 could becombined in a single printf:
printf("execname is %s; priority is %d", execname, curlwpsinfo->pr_pri);
For more information on printf, see Chapter 6, “Output Formatting.”
printavoid printa(aggregation)
void printa(string format, aggregation)
The printa action enables you to display and format aggregations. See Chapter 3,“Aggregations,” for more detail on aggregations. If a format is not provided, printa only tracesa directive to the DTrace consumer that the specified aggregation should be processed anddisplayed using the default format. If a format is provided, the aggregation will be formatted asspecified. See Chapter 6, “Output Formatting,” for a more detailed description of the printaformat string.
Data Recording Actions
Chapter 4 • Actions and Subroutines 107
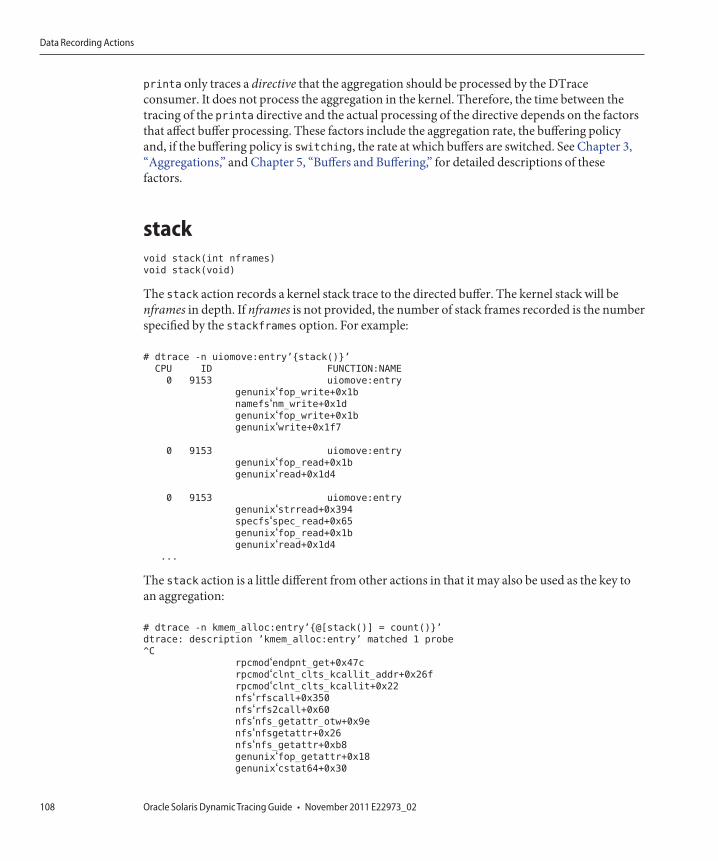
printa only traces a directive that the aggregation should be processed by the DTraceconsumer. It does not process the aggregation in the kernel. Therefore, the time between thetracing of the printa directive and the actual processing of the directive depends on the factorsthat affect buffer processing. These factors include the aggregation rate, the buffering policyand, if the buffering policy is switching, the rate at which buffers are switched. See Chapter 3,“Aggregations,” and Chapter 5, “Buffers and Buffering,” for detailed descriptions of thesefactors.
stackvoid stack(int nframes)
void stack(void)
The stack action records a kernel stack trace to the directed buffer. The kernel stack will benframes in depth. If nframes is not provided, the number of stack frames recorded is the numberspecified by the stackframes option. For example:
# dtrace -n uiomove:entry’{stack()}’
CPU ID FUNCTION:NAME
0 9153 uiomove:entry
genunix‘fop_write+0x1bnamefs‘nm_write+0x1dgenunix‘fop_write+0x1bgenunix‘write+0x1f7
0 9153 uiomove:entry
genunix‘fop_read+0x1bgenunix‘read+0x1d4
0 9153 uiomove:entry
genunix‘strread+0x394specfs‘spec_read+0x65genunix‘fop_read+0x1bgenunix‘read+0x1d4
...
The stack action is a little different from other actions in that it may also be used as the key toan aggregation:
# dtrace -n kmem_alloc:entry’{@[stack()] = count()}’
dtrace: description ’kmem_alloc:entry’ matched 1 probe
^C
rpcmod‘endpnt_get+0x47crpcmod‘clnt_clts_kcallit_addr+0x26frpcmod‘clnt_clts_kcallit+0x22nfs‘rfscall+0x350nfs‘rfs2call+0x60nfs‘nfs_getattr_otw+0x9enfs‘nfsgetattr+0x26nfs‘nfs_getattr+0xb8genunix‘fop_getattr+0x18genunix‘cstat64+0x30
Data Recording Actions
Oracle Solaris Dynamic Tracing Guide • November 2011 E22973_02108
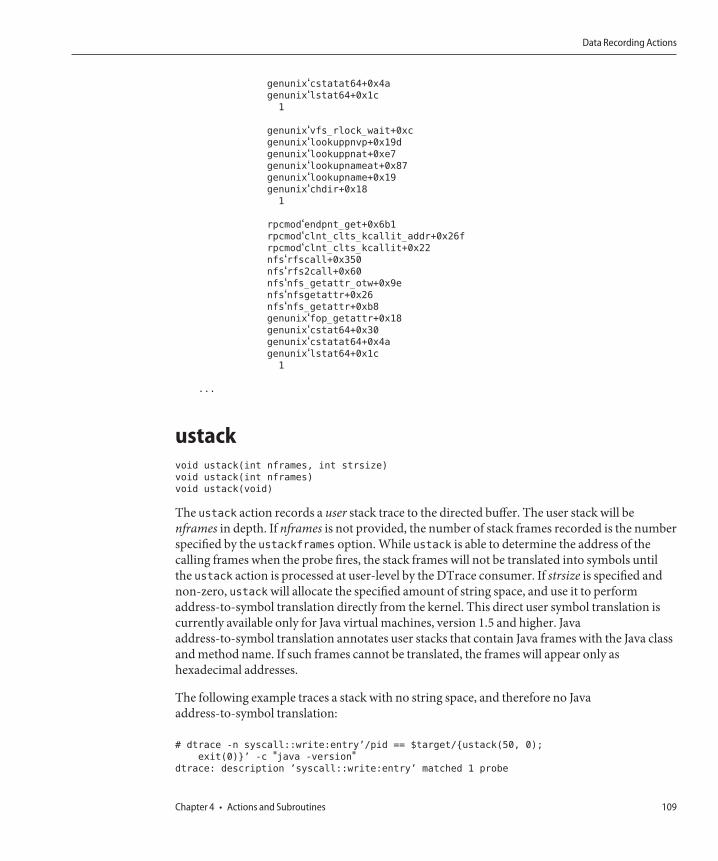
genunix‘cstatat64+0x4agenunix‘lstat64+0x1c1
genunix‘vfs_rlock_wait+0xcgenunix‘lookuppnvp+0x19dgenunix‘lookuppnat+0xe7genunix‘lookupnameat+0x87genunix‘lookupname+0x19genunix‘chdir+0x181
rpcmod‘endpnt_get+0x6b1rpcmod‘clnt_clts_kcallit_addr+0x26frpcmod‘clnt_clts_kcallit+0x22nfs‘rfscall+0x350nfs‘rfs2call+0x60nfs‘nfs_getattr_otw+0x9enfs‘nfsgetattr+0x26nfs‘nfs_getattr+0xb8genunix‘fop_getattr+0x18genunix‘cstat64+0x30genunix‘cstatat64+0x4agenunix‘lstat64+0x1c1
...
ustackvoid ustack(int nframes, int strsize)
void ustack(int nframes)
void ustack(void)
The ustack action records a user stack trace to the directed buffer. The user stack will benframes in depth. If nframes is not provided, the number of stack frames recorded is the numberspecified by the ustackframes option. While ustack is able to determine the address of thecalling frames when the probe fires, the stack frames will not be translated into symbols untilthe ustack action is processed at user-level by the DTrace consumer. If strsize is specified andnon-zero, ustack will allocate the specified amount of string space, and use it to performaddress-to-symbol translation directly from the kernel. This direct user symbol translation iscurrently available only for Java virtual machines, version 1.5 and higher. Javaaddress-to-symbol translation annotates user stacks that contain Java frames with the Java classand method name. If such frames cannot be translated, the frames will appear only ashexadecimal addresses.
The following example traces a stack with no string space, and therefore no Javaaddress-to-symbol translation:
# dtrace -n syscall::write:entry’/pid == $target/{ustack(50, 0);
exit(0)}’ -c "java -version"dtrace: description ’syscall::write:entry’ matched 1 probe
Data Recording Actions
Chapter 4 • Actions and Subroutines 109
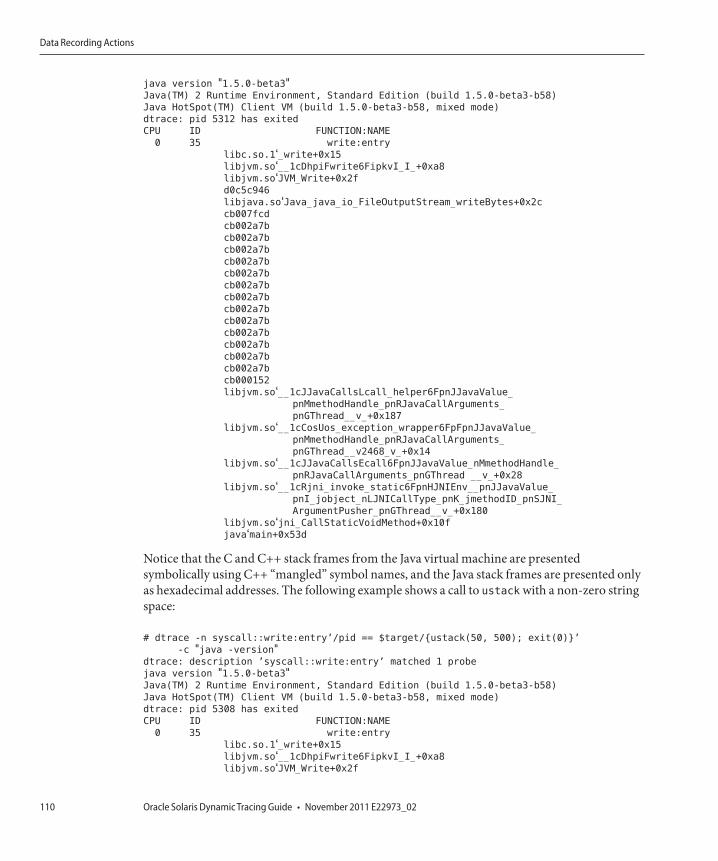
java version "1.5.0-beta3"Java(TM) 2 Runtime Environment, Standard Edition (build 1.5.0-beta3-b58)
Java HotSpot(TM) Client VM (build 1.5.0-beta3-b58, mixed mode)
dtrace: pid 5312 has exited
CPU ID FUNCTION:NAME
0 35 write:entry
libc.so.1‘_write+0x15libjvm.so‘__1cDhpiFwrite6FipkvI_I_+0xa8libjvm.so‘JVM_Write+0x2fd0c5c946
libjava.so‘Java_java_io_FileOutputStream_writeBytes+0x2ccb007fcd
cb002a7b
cb002a7b
cb002a7b
cb002a7b
cb002a7b
cb002a7b
cb002a7b
cb002a7b
cb002a7b
cb002a7b
cb002a7b
cb002a7b
cb002a7b
cb000152
libjvm.so‘__1cJJavaCallsLcall_helper6FpnJJavaValue_pnMmethodHandle_pnRJavaCallArguments_
pnGThread__v_+0x187
libjvm.so‘__1cCosUos_exception_wrapper6FpFpnJJavaValue_pnMmethodHandle_pnRJavaCallArguments_
pnGThread__v2468_v_+0x14
libjvm.so‘__1cJJavaCallsEcall6FpnJJavaValue_nMmethodHandle_pnRJavaCallArguments_pnGThread __v_+0x28
libjvm.so‘__1cRjni_invoke_static6FpnHJNIEnv__pnJJavaValue_pnI_jobject_nLJNICallType_pnK_jmethodID_pnSJNI_
ArgumentPusher_pnGThread__v_+0x180
libjvm.so‘jni_CallStaticVoidMethod+0x10fjava‘main+0x53d
Notice that the C and C++ stack frames from the Java virtual machine are presentedsymbolically using C++ “mangled” symbol names, and the Java stack frames are presented onlyas hexadecimal addresses. The following example shows a call to ustack with a non-zero stringspace:
# dtrace -n syscall::write:entry’/pid == $target/{ustack(50, 500); exit(0)}’
-c "java -version"dtrace: description ’syscall::write:entry’ matched 1 probe
java version "1.5.0-beta3"Java(TM) 2 Runtime Environment, Standard Edition (build 1.5.0-beta3-b58)
Java HotSpot(TM) Client VM (build 1.5.0-beta3-b58, mixed mode)
dtrace: pid 5308 has exited
CPU ID FUNCTION:NAME
0 35 write:entry
libc.so.1‘_write+0x15libjvm.so‘__1cDhpiFwrite6FipkvI_I_+0xa8libjvm.so‘JVM_Write+0x2f
Data Recording Actions
Oracle Solaris Dynamic Tracing Guide • November 2011 E22973_02110
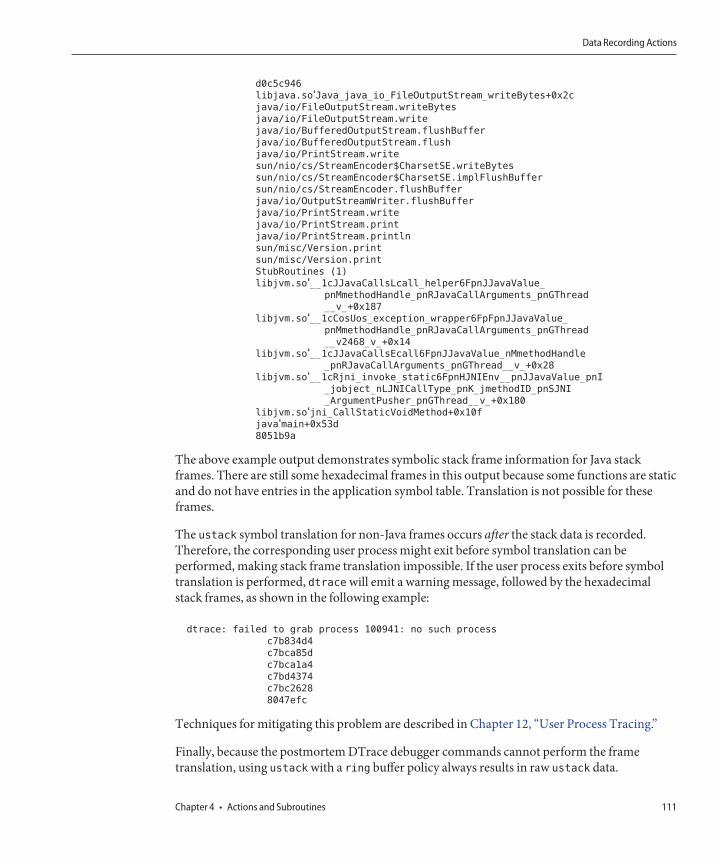
d0c5c946
libjava.so‘Java_java_io_FileOutputStream_writeBytes+0x2cjava/io/FileOutputStream.writeBytes
java/io/FileOutputStream.write
java/io/BufferedOutputStream.flushBuffer
java/io/BufferedOutputStream.flush
java/io/PrintStream.write
sun/nio/cs/StreamEncoder$CharsetSE.writeBytes
sun/nio/cs/StreamEncoder$CharsetSE.implFlushBuffer
sun/nio/cs/StreamEncoder.flushBuffer
java/io/OutputStreamWriter.flushBuffer
java/io/PrintStream.write
java/io/PrintStream.print
java/io/PrintStream.println
sun/misc/Version.print
sun/misc/Version.print
StubRoutines (1)
libjvm.so‘__1cJJavaCallsLcall_helper6FpnJJavaValue_pnMmethodHandle_pnRJavaCallArguments_pnGThread
__v_+0x187
libjvm.so‘__1cCosUos_exception_wrapper6FpFpnJJavaValue_pnMmethodHandle_pnRJavaCallArguments_pnGThread
__v2468_v_+0x14
libjvm.so‘__1cJJavaCallsEcall6FpnJJavaValue_nMmethodHandle_pnRJavaCallArguments_pnGThread__v_+0x28
libjvm.so‘__1cRjni_invoke_static6FpnHJNIEnv__pnJJavaValue_pnI_jobject_nLJNICallType_pnK_jmethodID_pnSJNI
_ArgumentPusher_pnGThread__v_+0x180
libjvm.so‘jni_CallStaticVoidMethod+0x10fjava‘main+0x53d8051b9a
The above example output demonstrates symbolic stack frame information for Java stackframes. There are still some hexadecimal frames in this output because some functions are staticand do not have entries in the application symbol table. Translation is not possible for theseframes.
The ustack symbol translation for non-Java frames occurs after the stack data is recorded.Therefore, the corresponding user process might exit before symbol translation can beperformed, making stack frame translation impossible. If the user process exits before symboltranslation is performed, dtrace will emit a warning message, followed by the hexadecimalstack frames, as shown in the following example:
dtrace: failed to grab process 100941: no such process
c7b834d4
c7bca85d
c7bca1a4
c7bd4374
c7bc2628
8047efc
Techniques for mitigating this problem are described in Chapter 12, “User Process Tracing.”
Finally, because the postmortem DTrace debugger commands cannot perform the frametranslation, using ustack with a ring buffer policy always results in raw ustack data.
Data Recording Actions
Chapter 4 • Actions and Subroutines 111
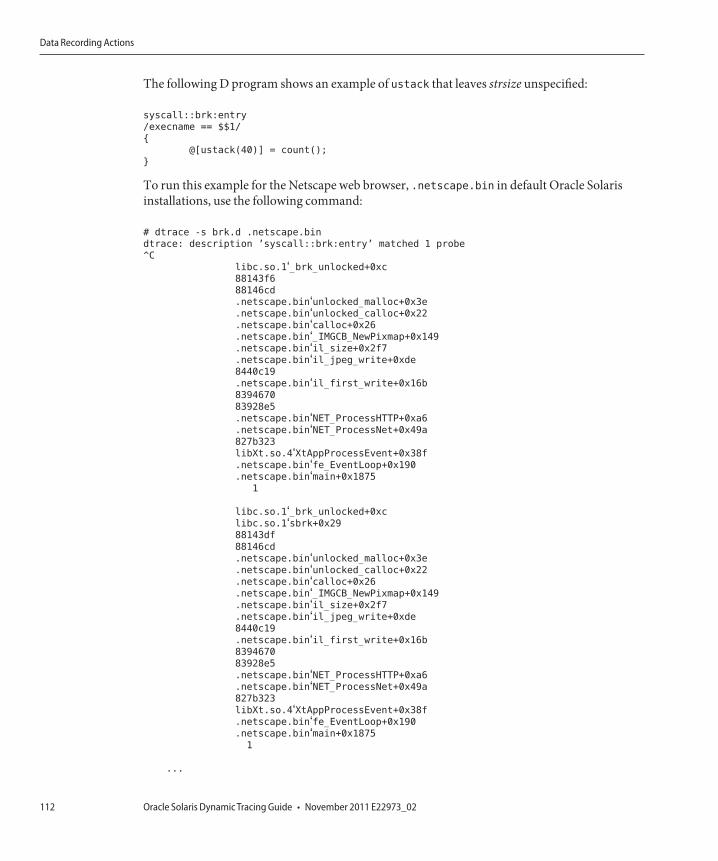
The following D program shows an example of ustack that leaves strsize unspecified:
syscall::brk:entry
/execname == $$1/
{
@[ustack(40)] = count();
}
To run this example for the Netscape web browser, .netscape.bin in default Oracle Solarisinstallations, use the following command:
# dtrace -s brk.d .netscape.bin
dtrace: description ’syscall::brk:entry’ matched 1 probe
^C
libc.so.1‘_brk_unlocked+0xc88143f6
88146cd
.netscape.bin‘unlocked_malloc+0x3e
.netscape.bin‘unlocked_calloc+0x22
.netscape.bin‘calloc+0x26
.netscape.bin‘_IMGCB_NewPixmap+0x149
.netscape.bin‘il_size+0x2f7
.netscape.bin‘il_jpeg_write+0xde8440c19
.netscape.bin‘il_first_write+0x16b8394670
83928e5
.netscape.bin‘NET_ProcessHTTP+0xa6
.netscape.bin‘NET_ProcessNet+0x49a827b323
libXt.so.4‘XtAppProcessEvent+0x38f.netscape.bin‘fe_EventLoop+0x190.netscape.bin‘main+0x1875
1
libc.so.1‘_brk_unlocked+0xclibc.so.1‘sbrk+0x2988143df
88146cd
.netscape.bin‘unlocked_malloc+0x3e
.netscape.bin‘unlocked_calloc+0x22
.netscape.bin‘calloc+0x26
.netscape.bin‘_IMGCB_NewPixmap+0x149
.netscape.bin‘il_size+0x2f7
.netscape.bin‘il_jpeg_write+0xde8440c19
.netscape.bin‘il_first_write+0x16b8394670
83928e5
.netscape.bin‘NET_ProcessHTTP+0xa6
.netscape.bin‘NET_ProcessNet+0x49a827b323
libXt.so.4‘XtAppProcessEvent+0x38f.netscape.bin‘fe_EventLoop+0x190.netscape.bin‘main+0x18751
...
Data Recording Actions
Oracle Solaris Dynamic Tracing Guide • November 2011 E22973_02112
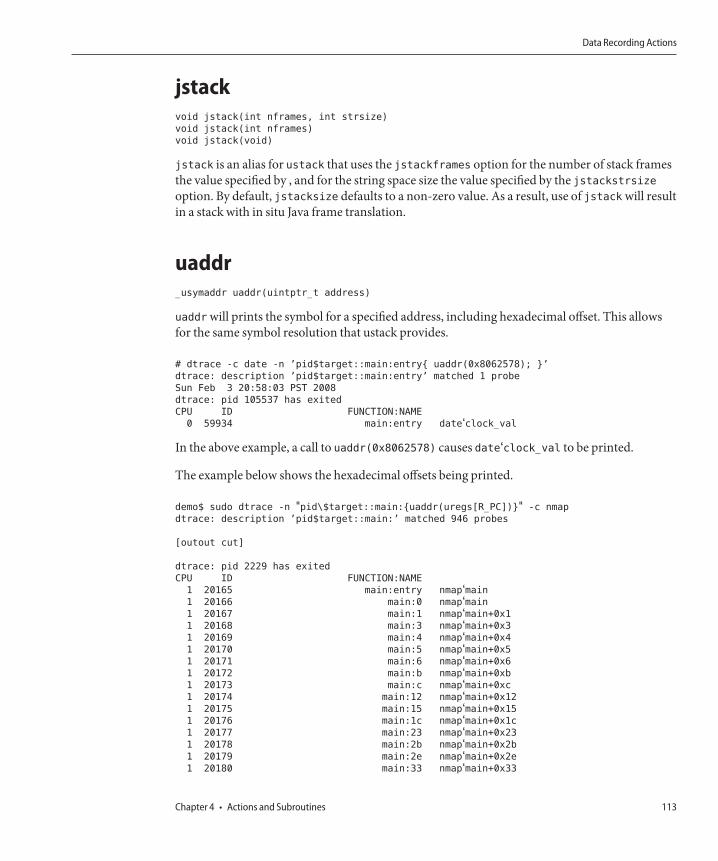
jstackvoid jstack(int nframes, int strsize)
void jstack(int nframes)
void jstack(void)
jstack is an alias for ustack that uses the jstackframes option for the number of stack framesthe value specified by , and for the string space size the value specified by the jstackstrsizeoption. By default, jstacksize defaults to a non-zero value. As a result, use of jstack will resultin a stack with in situ Java frame translation.
uaddr_usymaddr uaddr(uintptr_t address)
uaddr will prints the symbol for a specified address, including hexadecimal offset. This allowsfor the same symbol resolution that ustack provides.
# dtrace -c date -n ’pid$target::main:entry{ uaddr(0x8062578); }’
dtrace: description ’pid$target::main:entry’ matched 1 probe
Sun Feb 3 20:58:03 PST 2008
dtrace: pid 105537 has exited
CPU ID FUNCTION:NAME
0 59934 main:entry date‘clock_val
In the above example, a call to uaddr(0x8062578) causes date‘clock_val to be printed.
The example below shows the hexadecimal offsets being printed.
demo$ sudo dtrace -n "pid\$target::main:{uaddr(uregs[R_PC])}" -c nmap
dtrace: description ’pid$target::main:’ matched 946 probes
[outout cut]
dtrace: pid 2229 has exited
CPU ID FUNCTION:NAME
1 20165 main:entry nmap‘main1 20166 main:0 nmap‘main1 20167 main:1 nmap‘main+0x11 20168 main:3 nmap‘main+0x31 20169 main:4 nmap‘main+0x41 20170 main:5 nmap‘main+0x51 20171 main:6 nmap‘main+0x61 20172 main:b nmap‘main+0xb1 20173 main:c nmap‘main+0xc1 20174 main:12 nmap‘main+0x121 20175 main:15 nmap‘main+0x151 20176 main:1c nmap‘main+0x1c1 20177 main:23 nmap‘main+0x231 20178 main:2b nmap‘main+0x2b1 20179 main:2e nmap‘main+0x2e1 20180 main:33 nmap‘main+0x33
Data Recording Actions
Chapter 4 • Actions and Subroutines 113
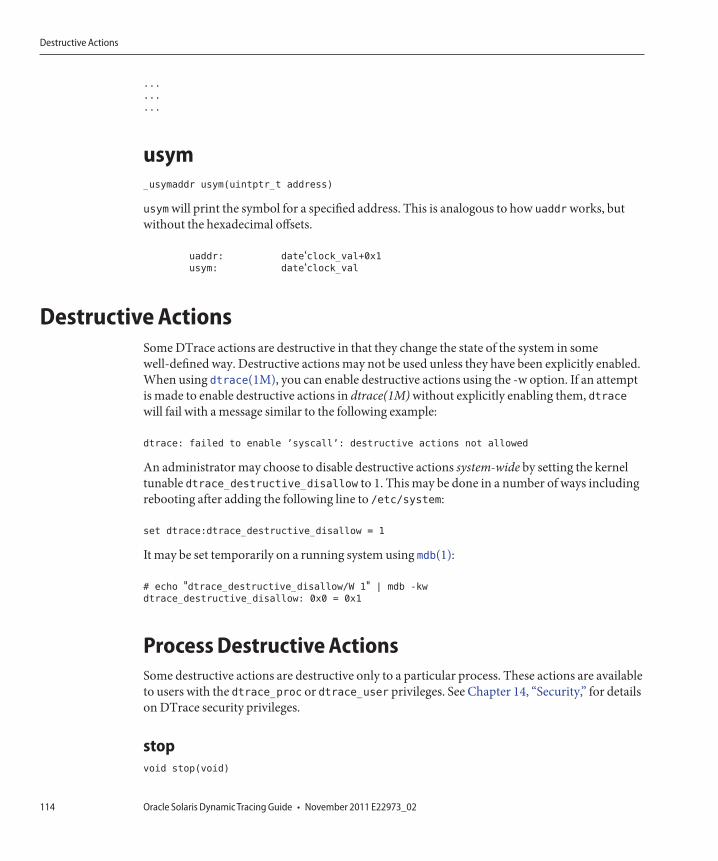
...
...
...
usym_usymaddr usym(uintptr_t address)
usym will print the symbol for a specified address. This is analogous to how uaddr works, butwithout the hexadecimal offsets.
uaddr: date‘clock_val+0x1usym: date‘clock_val
Destructive ActionsSome DTrace actions are destructive in that they change the state of the system in somewell-defined way. Destructive actions may not be used unless they have been explicitly enabled.When using dtrace(1M), you can enable destructive actions using the -w option. If an attemptis made to enable destructive actions in dtrace(1M) without explicitly enabling them, dtracewill fail with a message similar to the following example:
dtrace: failed to enable ’syscall’: destructive actions not allowed
An administrator may choose to disable destructive actions system-wide by setting the kerneltunable dtrace_destructive_disallow to 1. This may be done in a number of ways includingrebooting after adding the following line to /etc/system:
set dtrace:dtrace_destructive_disallow = 1
It may be set temporarily on a running system using mdb(1):
# echo "dtrace_destructive_disallow/W 1" | mdb -kw
dtrace_destructive_disallow: 0x0 = 0x1
Process Destructive ActionsSome destructive actions are destructive only to a particular process. These actions are availableto users with the dtrace_proc or dtrace_user privileges. See Chapter 14, “Security,” for detailson DTrace security privileges.
stopvoid stop(void)
Destructive Actions
Oracle Solaris Dynamic Tracing Guide • November 2011 E22973_02114
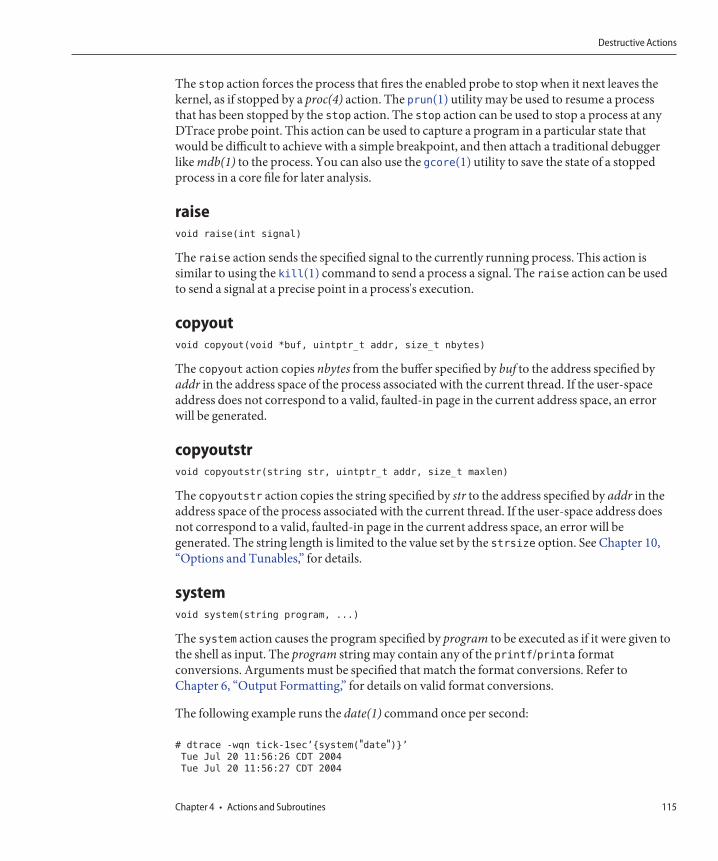
The stop action forces the process that fires the enabled probe to stop when it next leaves thekernel, as if stopped by a proc(4) action. The prun(1) utility may be used to resume a processthat has been stopped by the stop action. The stop action can be used to stop a process at anyDTrace probe point. This action can be used to capture a program in a particular state thatwould be difficult to achieve with a simple breakpoint, and then attach a traditional debuggerlike mdb(1) to the process. You can also use the gcore(1) utility to save the state of a stoppedprocess in a core file for later analysis.
raisevoid raise(int signal)
The raise action sends the specified signal to the currently running process. This action issimilar to using the kill(1) command to send a process a signal. The raise action can be usedto send a signal at a precise point in a process's execution.
copyoutvoid copyout(void *buf, uintptr_t addr, size_t nbytes)
The copyout action copies nbytes from the buffer specified by buf to the address specified byaddr in the address space of the process associated with the current thread. If the user-spaceaddress does not correspond to a valid, faulted-in page in the current address space, an errorwill be generated.
copyoutstrvoid copyoutstr(string str, uintptr_t addr, size_t maxlen)
The copyoutstr action copies the string specified by str to the address specified by addr in theaddress space of the process associated with the current thread. If the user-space address doesnot correspond to a valid, faulted-in page in the current address space, an error will begenerated. The string length is limited to the value set by the strsize option. See Chapter 10,“Options and Tunables,” for details.
systemvoid system(string program, ...)
The system action causes the program specified by program to be executed as if it were given tothe shell as input. The program string may contain any of the printf/printa formatconversions. Arguments must be specified that match the format conversions. Refer toChapter 6, “Output Formatting,” for details on valid format conversions.
The following example runs the date(1) command once per second:
# dtrace -wqn tick-1sec’{system("date")}’Tue Jul 20 11:56:26 CDT 2004
Tue Jul 20 11:56:27 CDT 2004
Destructive Actions
Chapter 4 • Actions and Subroutines 115
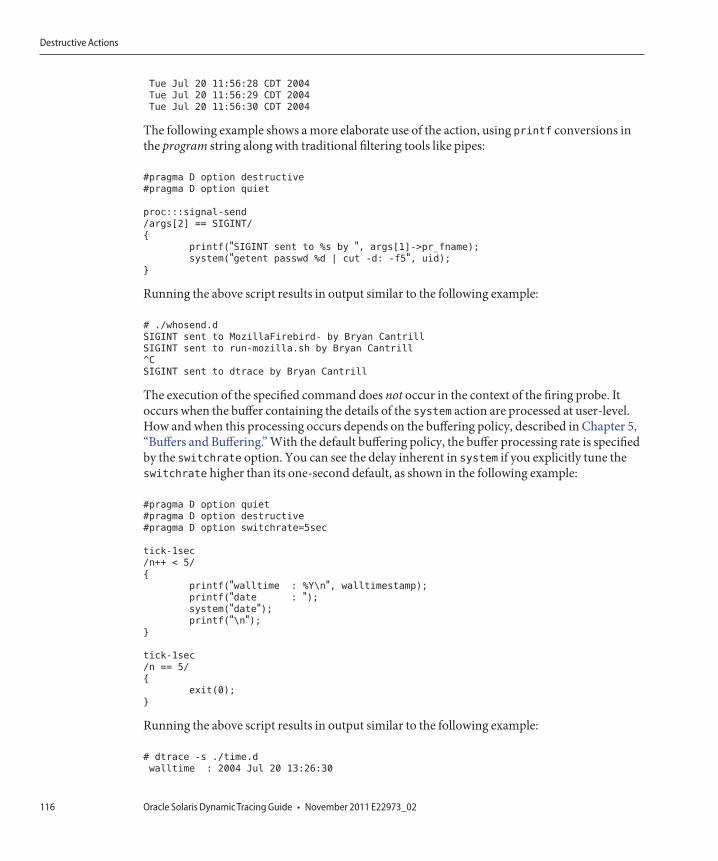
Tue Jul 20 11:56:28 CDT 2004
Tue Jul 20 11:56:29 CDT 2004
Tue Jul 20 11:56:30 CDT 2004
The following example shows a more elaborate use of the action, using printf conversions inthe program string along with traditional filtering tools like pipes:
#pragma D option destructive
#pragma D option quiet
proc:::signal-send
/args[2] == SIGINT/
{
printf("SIGINT sent to %s by ", args[1]->pr_fname);
system("getent passwd %d | cut -d: -f5", uid);
}
Running the above script results in output similar to the following example:
# ./whosend.d
SIGINT sent to MozillaFirebird- by Bryan Cantrill
SIGINT sent to run-mozilla.sh by Bryan Cantrill
^C
SIGINT sent to dtrace by Bryan Cantrill
The execution of the specified command does not occur in the context of the firing probe. Itoccurs when the buffer containing the details of the system action are processed at user-level.How and when this processing occurs depends on the buffering policy, described in Chapter 5,“Buffers and Buffering.” With the default buffering policy, the buffer processing rate is specifiedby the switchrate option. You can see the delay inherent in system if you explicitly tune theswitchrate higher than its one-second default, as shown in the following example:
#pragma D option quiet
#pragma D option destructive
#pragma D option switchrate=5sec
tick-1sec
/n++ < 5/
{
printf("walltime : %Y\n", walltimestamp);
printf("date : ");system("date");printf("\n");
}
tick-1sec
/n == 5/
{
exit(0);
}
Running the above script results in output similar to the following example:
# dtrace -s ./time.d
walltime : 2004 Jul 20 13:26:30
Destructive Actions
Oracle Solaris Dynamic Tracing Guide • November 2011 E22973_02116
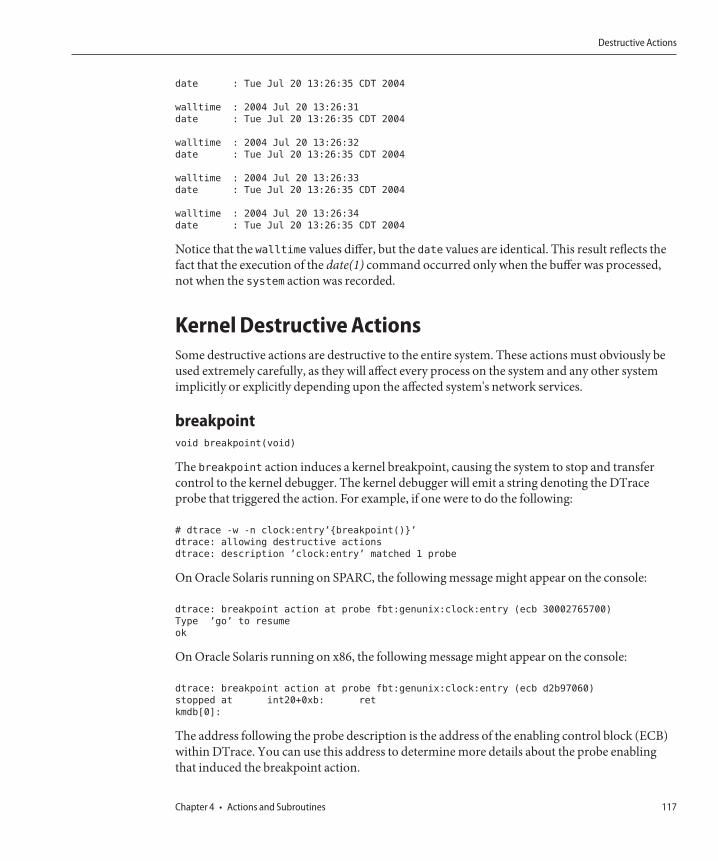
date : Tue Jul 20 13:26:35 CDT 2004
walltime : 2004 Jul 20 13:26:31
date : Tue Jul 20 13:26:35 CDT 2004
walltime : 2004 Jul 20 13:26:32
date : Tue Jul 20 13:26:35 CDT 2004
walltime : 2004 Jul 20 13:26:33
date : Tue Jul 20 13:26:35 CDT 2004
walltime : 2004 Jul 20 13:26:34
date : Tue Jul 20 13:26:35 CDT 2004
Notice that the walltime values differ, but the date values are identical. This result reflects thefact that the execution of the date(1) command occurred only when the buffer was processed,not when the system action was recorded.
Kernel Destructive ActionsSome destructive actions are destructive to the entire system. These actions must obviously beused extremely carefully, as they will affect every process on the system and any other systemimplicitly or explicitly depending upon the affected system's network services.
breakpointvoid breakpoint(void)
The breakpoint action induces a kernel breakpoint, causing the system to stop and transfercontrol to the kernel debugger. The kernel debugger will emit a string denoting the DTraceprobe that triggered the action. For example, if one were to do the following:
# dtrace -w -n clock:entry’{breakpoint()}’
dtrace: allowing destructive actions
dtrace: description ’clock:entry’ matched 1 probe
On Oracle Solaris running on SPARC, the following message might appear on the console:
dtrace: breakpoint action at probe fbt:genunix:clock:entry (ecb 30002765700)
Type ’go’ to resume
ok
On Oracle Solaris running on x86, the following message might appear on the console:
dtrace: breakpoint action at probe fbt:genunix:clock:entry (ecb d2b97060)
stopped at int20+0xb: ret
kmdb[0]:
The address following the probe description is the address of the enabling control block (ECB)within DTrace. You can use this address to determine more details about the probe enablingthat induced the breakpoint action.
Destructive Actions
Chapter 4 • Actions and Subroutines 117
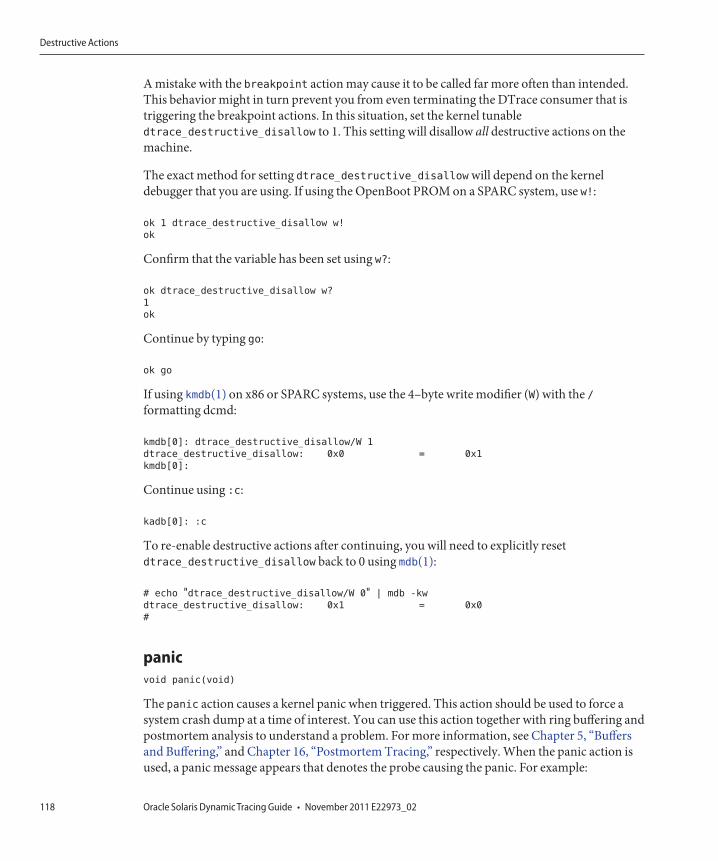
A mistake with the breakpoint action may cause it to be called far more often than intended.This behavior might in turn prevent you from even terminating the DTrace consumer that istriggering the breakpoint actions. In this situation, set the kernel tunabledtrace_destructive_disallow to 1. This setting will disallow all destructive actions on themachine.
The exact method for setting dtrace_destructive_disallow will depend on the kerneldebugger that you are using. If using the OpenBoot PROM on a SPARC system, use w!:
ok 1 dtrace_destructive_disallow w!
ok
Confirm that the variable has been set using w?:
ok dtrace_destructive_disallow w?
1
ok
Continue by typing go:
ok go
If using kmdb(1) on x86 or SPARC systems, use the 4–byte write modifier (W) with the /formatting dcmd:
kmdb[0]: dtrace_destructive_disallow/W 1
dtrace_destructive_disallow: 0x0 = 0x1
kmdb[0]:
Continue using :c:
kadb[0]: :c
To re-enable destructive actions after continuing, you will need to explicitly resetdtrace_destructive_disallow back to 0 using mdb(1):
# echo "dtrace_destructive_disallow/W 0" | mdb -kw
dtrace_destructive_disallow: 0x1 = 0x0
#
panicvoid panic(void)
The panic action causes a kernel panic when triggered. This action should be used to force asystem crash dump at a time of interest. You can use this action together with ring buffering andpostmortem analysis to understand a problem. For more information, see Chapter 5, “Buffersand Buffering,” and Chapter 16, “Postmortem Tracing,” respectively. When the panic action isused, a panic message appears that denotes the probe causing the panic. For example:
Destructive Actions
Oracle Solaris Dynamic Tracing Guide • November 2011 E22973_02118
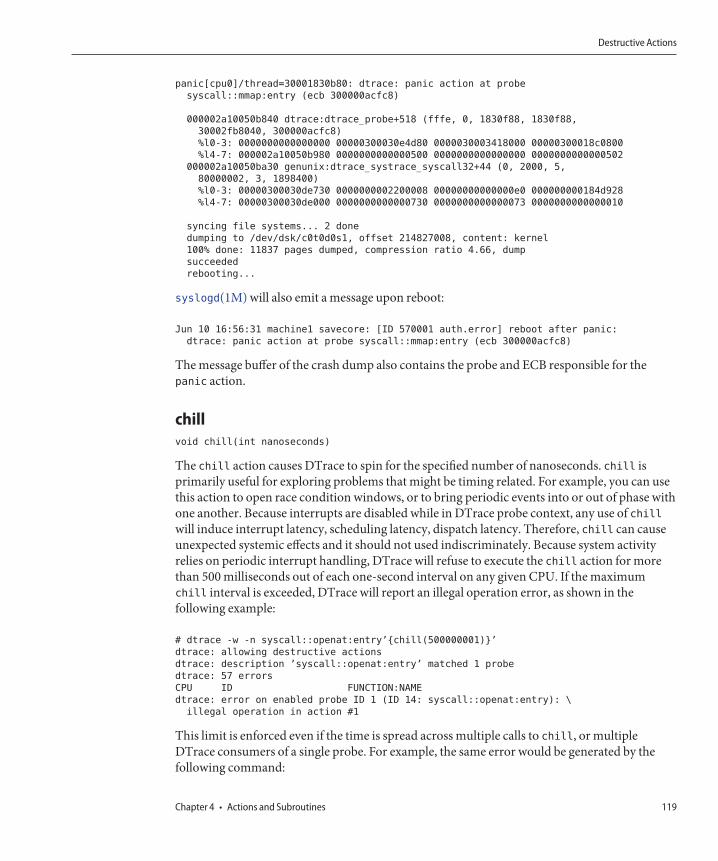
panic[cpu0]/thread=30001830b80: dtrace: panic action at probe
syscall::mmap:entry (ecb 300000acfc8)
000002a10050b840 dtrace:dtrace_probe+518 (fffe, 0, 1830f88, 1830f88,
30002fb8040, 300000acfc8)
%l0-3: 0000000000000000 00000300030e4d80 0000030003418000 00000300018c0800
%l4-7: 000002a10050b980 0000000000000500 0000000000000000 0000000000000502
000002a10050ba30 genunix:dtrace_systrace_syscall32+44 (0, 2000, 5,
80000002, 3, 1898400)
%l0-3: 00000300030de730 0000000002200008 00000000000000e0 000000000184d928
%l4-7: 00000300030de000 0000000000000730 0000000000000073 0000000000000010
syncing file systems... 2 done
dumping to /dev/dsk/c0t0d0s1, offset 214827008, content: kernel
100% done: 11837 pages dumped, compression ratio 4.66, dump
succeeded
rebooting...
syslogd(1M) will also emit a message upon reboot:
Jun 10 16:56:31 machine1 savecore: [ID 570001 auth.error] reboot after panic:
dtrace: panic action at probe syscall::mmap:entry (ecb 300000acfc8)
The message buffer of the crash dump also contains the probe and ECB responsible for thepanic action.
chillvoid chill(int nanoseconds)
The chill action causes DTrace to spin for the specified number of nanoseconds. chill isprimarily useful for exploring problems that might be timing related. For example, you can usethis action to open race condition windows, or to bring periodic events into or out of phase withone another. Because interrupts are disabled while in DTrace probe context, any use of chillwill induce interrupt latency, scheduling latency, dispatch latency. Therefore, chill can causeunexpected systemic effects and it should not used indiscriminately. Because system activityrelies on periodic interrupt handling, DTrace will refuse to execute the chill action for morethan 500 milliseconds out of each one-second interval on any given CPU. If the maximumchill interval is exceeded, DTrace will report an illegal operation error, as shown in thefollowing example:
# dtrace -w -n syscall::openat:entry’{chill(500000001)}’
dtrace: allowing destructive actions
dtrace: description ’syscall::openat:entry’ matched 1 probe
dtrace: 57 errors
CPU ID FUNCTION:NAME
dtrace: error on enabled probe ID 1 (ID 14: syscall::openat:entry): \
illegal operation in action #1
This limit is enforced even if the time is spread across multiple calls to chill, or multipleDTrace consumers of a single probe. For example, the same error would be generated by thefollowing command:
Destructive Actions
Chapter 4 • Actions and Subroutines 119
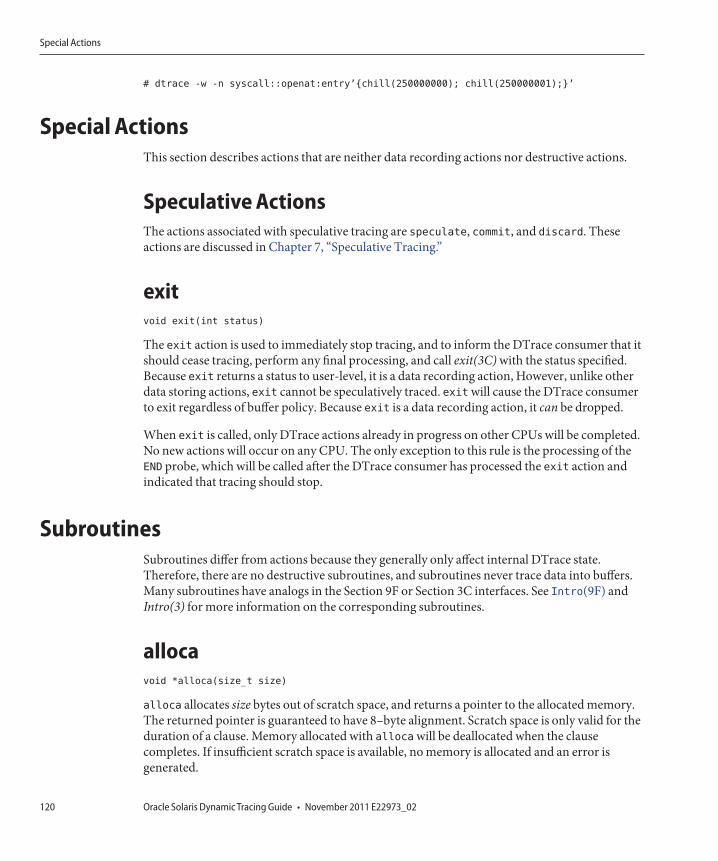
# dtrace -w -n syscall::openat:entry’{chill(250000000); chill(250000001);}’
Special ActionsThis section describes actions that are neither data recording actions nor destructive actions.
Speculative ActionsThe actions associated with speculative tracing are speculate, commit, and discard. Theseactions are discussed in Chapter 7, “Speculative Tracing.”
exitvoid exit(int status)
The exit action is used to immediately stop tracing, and to inform the DTrace consumer that itshould cease tracing, perform any final processing, and call exit(3C) with the status specified.Because exit returns a status to user-level, it is a data recording action, However, unlike otherdata storing actions, exit cannot be speculatively traced. exit will cause the DTrace consumerto exit regardless of buffer policy. Because exit is a data recording action, it can be dropped.
When exit is called, only DTrace actions already in progress on other CPUs will be completed.No new actions will occur on any CPU. The only exception to this rule is the processing of theEND probe, which will be called after the DTrace consumer has processed the exit action andindicated that tracing should stop.
SubroutinesSubroutines differ from actions because they generally only affect internal DTrace state.Therefore, there are no destructive subroutines, and subroutines never trace data into buffers.Many subroutines have analogs in the Section 9F or Section 3C interfaces. See Intro(9F) andIntro(3) for more information on the corresponding subroutines.
allocavoid *alloca(size_t size)
alloca allocates size bytes out of scratch space, and returns a pointer to the allocated memory.The returned pointer is guaranteed to have 8–byte alignment. Scratch space is only valid for theduration of a clause. Memory allocated with alloca will be deallocated when the clausecompletes. If insufficient scratch space is available, no memory is allocated and an error isgenerated.
Special Actions
Oracle Solaris Dynamic Tracing Guide • November 2011 E22973_02120
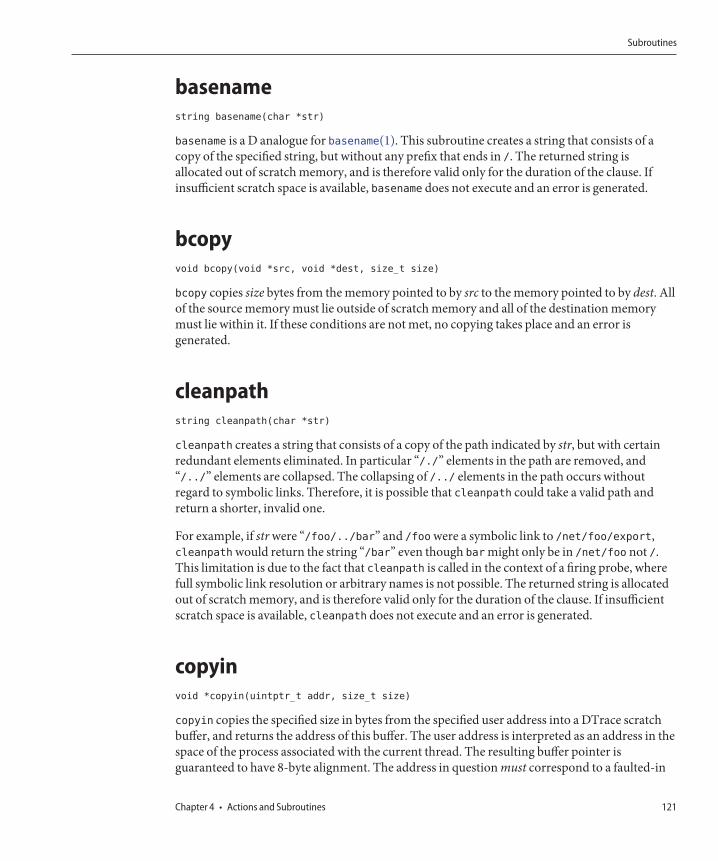
basenamestring basename(char *str)
basename is a D analogue for basename(1). This subroutine creates a string that consists of acopy of the specified string, but without any prefix that ends in /. The returned string isallocated out of scratch memory, and is therefore valid only for the duration of the clause. Ifinsufficient scratch space is available, basename does not execute and an error is generated.
bcopyvoid bcopy(void *src, void *dest, size_t size)
bcopy copies size bytes from the memory pointed to by src to the memory pointed to by dest. Allof the source memory must lie outside of scratch memory and all of the destination memorymust lie within it. If these conditions are not met, no copying takes place and an error isgenerated.
cleanpathstring cleanpath(char *str)
cleanpath creates a string that consists of a copy of the path indicated by str, but with certainredundant elements eliminated. In particular “/./” elements in the path are removed, and“/../” elements are collapsed. The collapsing of /../ elements in the path occurs withoutregard to symbolic links. Therefore, it is possible that cleanpath could take a valid path andreturn a shorter, invalid one.
For example, if str were “/foo/../bar” and /foo were a symbolic link to /net/foo/export,cleanpath would return the string “/bar” even though bar might only be in /net/foo not /.This limitation is due to the fact that cleanpath is called in the context of a firing probe, wherefull symbolic link resolution or arbitrary names is not possible. The returned string is allocatedout of scratch memory, and is therefore valid only for the duration of the clause. If insufficientscratch space is available, cleanpath does not execute and an error is generated.
copyinvoid *copyin(uintptr_t addr, size_t size)
copyin copies the specified size in bytes from the specified user address into a DTrace scratchbuffer, and returns the address of this buffer. The user address is interpreted as an address in thespace of the process associated with the current thread. The resulting buffer pointer isguaranteed to have 8-byte alignment. The address in question must correspond to a faulted-in
Subroutines
Chapter 4 • Actions and Subroutines 121
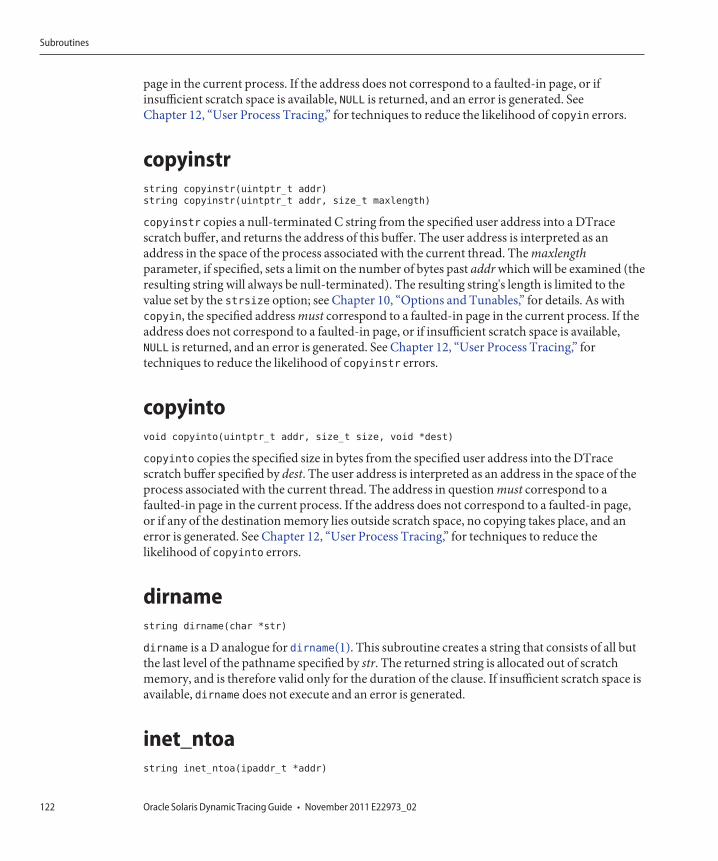
page in the current process. If the address does not correspond to a faulted-in page, or ifinsufficient scratch space is available, NULL is returned, and an error is generated. SeeChapter 12, “User Process Tracing,” for techniques to reduce the likelihood of copyin errors.
copyinstrstring copyinstr(uintptr_t addr)
string copyinstr(uintptr_t addr, size_t maxlength)
copyinstr copies a null-terminated C string from the specified user address into a DTracescratch buffer, and returns the address of this buffer. The user address is interpreted as anaddress in the space of the process associated with the current thread. The maxlengthparameter, if specified, sets a limit on the number of bytes past addr which will be examined (theresulting string will always be null-terminated). The resulting string's length is limited to thevalue set by the strsize option; see Chapter 10, “Options and Tunables,” for details. As withcopyin, the specified address must correspond to a faulted-in page in the current process. If theaddress does not correspond to a faulted-in page, or if insufficient scratch space is available,NULL is returned, and an error is generated. See Chapter 12, “User Process Tracing,” fortechniques to reduce the likelihood of copyinstr errors.
copyintovoid copyinto(uintptr_t addr, size_t size, void *dest)
copyinto copies the specified size in bytes from the specified user address into the DTracescratch buffer specified by dest. The user address is interpreted as an address in the space of theprocess associated with the current thread. The address in question must correspond to afaulted-in page in the current process. If the address does not correspond to a faulted-in page,or if any of the destination memory lies outside scratch space, no copying takes place, and anerror is generated. See Chapter 12, “User Process Tracing,” for techniques to reduce thelikelihood of copyinto errors.
dirnamestring dirname(char *str)
dirname is a D analogue for dirname(1). This subroutine creates a string that consists of all butthe last level of the pathname specified by str. The returned string is allocated out of scratchmemory, and is therefore valid only for the duration of the clause. If insufficient scratch space isavailable, dirname does not execute and an error is generated.
inet_ntoastring inet_ntoa(ipaddr_t *addr)
Subroutines
Oracle Solaris Dynamic Tracing Guide • November 2011 E22973_02122
inet_ntoa takes a pointer to an IPv4 address and returns it as a dotted quad decimal string.This is similar to inet_ntoa() from libnsl as described in inet(3SOCKET), however this Dversion takes a pointer to the IPv4 address rather than the address itself. The returned string isallocated out of scratch memory, and is therefore valid only for the duration of the clause. Ifinsufficient scratch space is available, inet_ntoa does not execute and an error is generated.
inet_ntoa6string inet_ntoa6(in6_addr_t *addr)
inet_ntoa6 takes a pointer to an IPv6 address and returns it as an RFC 1884 convention 2string, with lower case hexadecimal digits. The returned string is allocated out of scratchmemory, and is therefore valid only for the duration of the clause. If insufficient scratch space isavailable, inet_ntoa6 does not execute and an error is generated.
inet_ntopstring inet_ntop(int af, void *addr)
inet_ntop takes a pointer to an IP address and returns a string version depending on theprovided address family. This is similar to inet_ntop() from libnsl as described ininet(3SOCKET). Supported address families are AF_INET and AF_INET6, both of which havebeen defined for use in D programs. The returned string is allocated out of scratch memory, andis therefore valid only for the duration of the clause. If insufficient scratch space is available,inet_ntop does not execute and an error is generated.
msgdsizesize_t msgdsize(mblk_t *mp)
msgdsize returns the number of bytes in the data message pointed to by mp. See msgdsize(9F)for details. msgdsize only includes data blocks of type M_DATA in the count.
msgsizesize_t msgsize(mblk_t *mp)
msgsize returns the number of bytes in the message pointed to by mp. Unlike msgdsize, whichreturns only the number of data bytes, msgsize returns the total number of bytes in themessage.
Subroutines
Chapter 4 • Actions and Subroutines 123
mutex_ownedint mutex_owned(kmutex_t *mutex)
mutex_owned is an implementation of mutex_owned(9F). mutex_owned returns non-zero if thecalling thread currently holds the specified kernel mutex, or zero if the specified adaptive mutexis currently unowned.
Top
mutex_ownerkthread_t *mutex_owner(kmutex_t *mutex)
mutex_owner returns the thread pointer of the current owner of the specified adaptive kernelmutex. mutex_owner returns NULL if the specified adaptive mutex is currently unowned, or if thespecified mutex is a spin mutex. See mutex_owned(9F).
mutex_type_adaptiveint mutex_type_adaptive(kmutex_t *mutex)
mutex_type_adaptive returns non-zero if the specified kernel mutex is of typeMUTEX_ADAPTIVE, or zero if it is not. Mutexes are adaptive if they meet one or more of thefollowing conditions:■ The mutex is declared statically■ The mutex is created with an interrupt block cookie of NULL■ The mutex is created with an interrupt block cookie that does not correspond to a high-level
interrupt
See mutex_init(9F) for more details on mutexes. The majority of mutexes in the Oracle Solariskernel are adaptive.
progenyofint progenyof(pid_t pid)
progenyof returns non-zero if the calling process (the process associated with the thread that iscurrently triggering the matched probe) is among the progeny of the specified process ID.
randint rand(void)
Subroutines
Oracle Solaris Dynamic Tracing Guide • November 2011 E22973_02124
rand returns a pseudo-random integer. The number returned is a weak pseudo-randomnumber, and should not be used for any cryptographic application.
rw_iswriterint rw_iswriter(krwlock_t *rwlock)
rw_iswriter returns non-zero if the specified reader-writer lock is either held or desired by awriter. If the lock is held only by readers and no writer is blocked, or if the lock is not held at all,rw_iswriter returns zero. See rw_init(9F).
rw_write_heldint rw_write_held(krwlock_t *rwlock)
rw_write_held returns non-zero if the specified reader-writer lock is currently held by a writer.If the lock is held only by readers or not held at all, rw_write_held returns zero. Seerw_init(9F).
speculationint speculation(void)
speculation reserves a speculative trace buffer for use with speculate and returns an identifierfor this buffer. See Chapter 7, “Speculative Tracing,” for details.
strjoinstring strjoin(char *str1, char *str2)
strjoin creates a string that consists of str1 concatenated with str2. The returned string isallocated out of scratch memory, and is therefore valid only for the duration of the clause. Ifinsufficient scratch space is available, strjoin does not execute and an error is generated.
strlensize_t strlen(string str)
strlen returns the length of the specified string in bytes, excluding the terminating null byte.
Subroutines
Chapter 4 • Actions and Subroutines 125

126
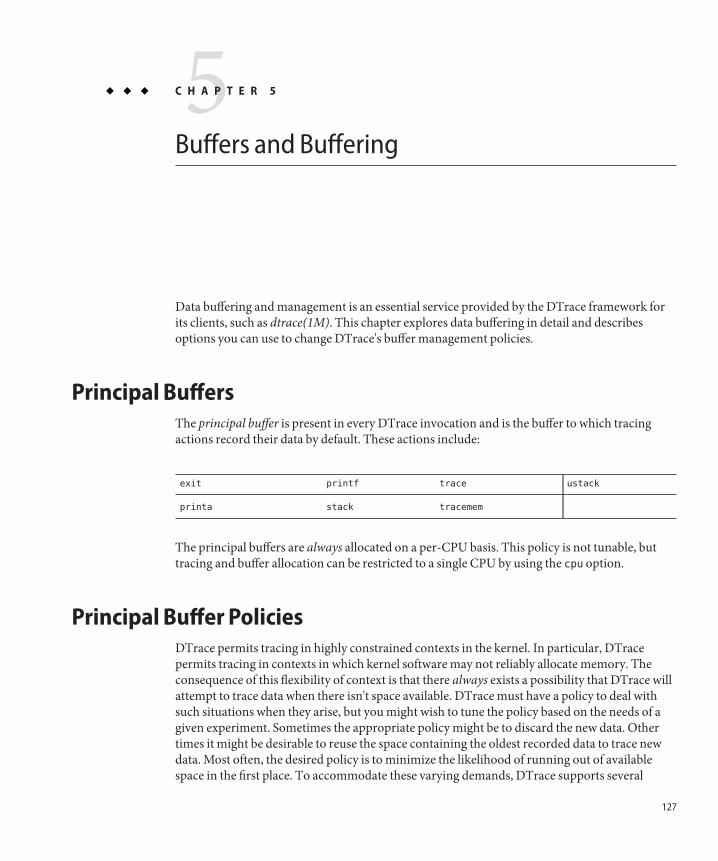
Buffers and Buffering
Data buffering and management is an essential service provided by the DTrace framework forits clients, such as dtrace(1M). This chapter explores data buffering in detail and describesoptions you can use to change DTrace's buffer management policies.
Principal BuffersThe principal buffer is present in every DTrace invocation and is the buffer to which tracingactions record their data by default. These actions include:
exit printf trace ustack
printa stack tracemem
The principal buffers are always allocated on a per-CPU basis. This policy is not tunable, buttracing and buffer allocation can be restricted to a single CPU by using the cpu option.
Principal Buffer PoliciesDTrace permits tracing in highly constrained contexts in the kernel. In particular, DTracepermits tracing in contexts in which kernel software may not reliably allocate memory. Theconsequence of this flexibility of context is that there always exists a possibility that DTrace willattempt to trace data when there isn't space available. DTrace must have a policy to deal withsuch situations when they arise, but you might wish to tune the policy based on the needs of agiven experiment. Sometimes the appropriate policy might be to discard the new data. Othertimes it might be desirable to reuse the space containing the oldest recorded data to trace newdata. Most often, the desired policy is to minimize the likelihood of running out of availablespace in the first place. To accommodate these varying demands, DTrace supports several
5C H A P T E R 5
127
different buffer policies. This support is implemented with the bufpolicy option, and can be seton a per-consumer basis. See Chapter 10, “Options and Tunables,” for more details on settingoptions.
switch PolicyBy default, the principal buffer has a switch buffer policy. Under this policy, per-CPU buffersare allocated in pairs: one buffer is active and the other buffer is inactive. When a DTraceconsumer attempts to read a buffer, the kernel firsts switches the inactive and active buffers.Buffer switching is done in such a manner that there is no window in which tracing data may belost. Once the buffers are switched, the newly inactive buffer is copied out to the DTraceconsumer. This policy assures that the consumer always sees a self-consistent buffer: a buffer isnever simultaneously traced to and copied out. This technique also avoids introducing awindow in which tracing is paused or otherwise prevented. The rate at which the buffer isswitched and read out is controlled by the consumer with the switchrate option. As with anyrate option, switchrate may be specified with any time suffix, but defaults to rate-per-second.For more details on switchrate and other options, see Chapter 10, “Options and Tunables.”
Under the switch policy, if a given enabled probe would trace more data than there is spaceavailable in the active principal buffer, the data is dropped and a per-CPU drop count isincremented. In the event of one or more drops, dtrace(1M) displays a message similar to thefollowing example:
dtrace: 11 drops on CPU 0
If a given record is larger than the total buffer size, the record will be dropped regardless ofbuffer policy. You can reduce or eliminate drops by either increasing the size of the principalbuffer with the bufsize option or by increasing the switching rate with the switchrate option.
Under the switch policy, scratch space for copyin, copyinstr, and alloca is allocated out ofthe active buffer.
fill PolicyFor some problems, you might wish to use a single in-kernel buffer. While this approach can beimplemented with the switch policy and appropriate D constructs by incrementing a variablein D and predicating an exit action appropriately, such an implementation does not eliminatethe possibility of drops. To request a single, large in-kernel buffer, and continue tracing untilone or more of the per-CPU buffers has filled, use the fill buffer policy. Under this policy,tracing continues until an enabled probe attempts to trace more data than can fit in theremaining principal buffer space. When insufficient space remains, the buffer is marked as filledand the consumer is notified that at least one of its per-CPU buffers has filled. Once dtrace(1M)detects a single filled buffer, tracing is stopped, all buffers are processed and dtrace exits. Nofurther data will be traced to a filled buffer even if the data would fit in the buffer.
Principal Buffer Policies
Oracle Solaris Dynamic Tracing Guide • November 2011 E22973_02128
To use the fill policy, set the bufpolicy option to fill. For example, the following commandtraces every system call entry into a per-CPU 2K buffer with the buffer policy set to fill:
# dtrace -n syscall:::entry -b 2k -x bufpolicy=fill
fill Policy and END ProbesEND probes normally do not fire until tracing has been explicitly stopped by the DTraceconsumer. END probes are guaranteed to only fire on one CPU, but the CPU on which the probefires is undefined. With fill buffers, tracing is explicitly stopped when at least one of theper-CPU principal buffers has been marked as filled. If the fill policy is selected, the END probemay fire on a CPU that has a filled buffer. To accommodate END tracing in fill buffers, DTracecalculates the amount of space potentially consumed by END probes and subtracts this spacefrom the size of the principal buffer. If the net size is negative, DTrace will refuse to start, anddtrace(1M) will output a corresponding error message:
dtrace: END enablings exceed size of principal buffer
The reservation mechanism ensures that a full buffer always has sufficient space for any ENDprobes.
ring PolicyThe DTrace ring buffer policy helps you trace the events leading up to a failure. If reproducingthe failure takes hours or days, you might wish to keep only the most recent data. Once aprincipal buffer has filled, tracing wraps around to the first entry, thereby overwriting oldertracing data. You establish the ring buffer by setting the bufpolicy option to the string ring:
# dtrace -s foo.d -x bufpolicy=ring
When used to create a ring buffer, dtrace(1M) will not display any output until the process isterminated. At that time, the ring buffer is consumed and processed. dtrace processes each ringbuffer in CPU order. Within a CPU's buffer, trace records will be displayed in order from oldestto youngest. Just as with the switch buffering policy, no ordering exists between records fromdifferent CPUs are made. If such an ordering is required, you should trace the timestampvariable as part of your tracing request.
The following example demonstrates the use of a #pragma option directive to enable ringbuffering:
#pragma D option bufpolicy=ring
#pragma D option bufsize=16k
syscall:::entry
/execname == $1/
Principal Buffer Policies
Chapter 5 • Buffers and Buffering 129
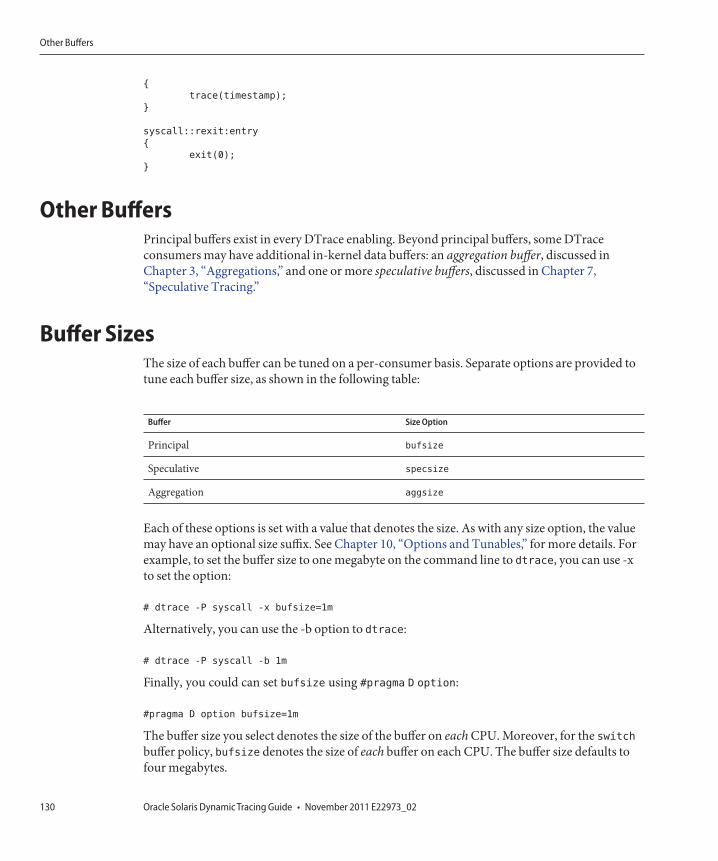
{
trace(timestamp);
}
syscall::rexit:entry
{
exit(0);
}
Other BuffersPrincipal buffers exist in every DTrace enabling. Beyond principal buffers, some DTraceconsumers may have additional in-kernel data buffers: an aggregation buffer, discussed inChapter 3, “Aggregations,” and one or more speculative buffers, discussed in Chapter 7,“Speculative Tracing.”
Buffer SizesThe size of each buffer can be tuned on a per-consumer basis. Separate options are provided totune each buffer size, as shown in the following table:
Buffer Size Option
Principal bufsize
Speculative specsize
Aggregation aggsize
Each of these options is set with a value that denotes the size. As with any size option, the valuemay have an optional size suffix. See Chapter 10, “Options and Tunables,” for more details. Forexample, to set the buffer size to one megabyte on the command line to dtrace, you can use -xto set the option:
# dtrace -P syscall -x bufsize=1m
Alternatively, you can use the -b option to dtrace:
# dtrace -P syscall -b 1m
Finally, you could can set bufsize using #pragma D option:
#pragma D option bufsize=1m
The buffer size you select denotes the size of the buffer on each CPU. Moreover, for the switchbuffer policy, bufsize denotes the size of each buffer on each CPU. The buffer size defaults tofour megabytes.
Other Buffers
Oracle Solaris Dynamic Tracing Guide • November 2011 E22973_02130
Buffer Resizing PolicyOccasionally, the system might not have adequate free kernel memory to allocate a buffer ofdesired size either because not enough memory is available or because the DTrace consumerhas exceeded one of the tunable limits described in Chapter 10, “Options and Tunables.” Youcan configure the policy for buffer allocation failure using bufresize option, which defaults toauto. Under the auto buffer resize policy, the size of a buffer is halved until a successfulallocation occurs. dtrace(1M) generates a message if a buffer as allocated is smaller than therequested size:
# dtrace -P syscall -b 4g
dtrace: description ’syscall’ matched 430 probes
dtrace: buffer size lowered to 128m
...
or:
# dtrace -P syscall’{@a[probefunc] = count()}’ -x aggsize=1g
dtrace: description ’syscall’ matched 430 probes
dtrace: aggregation size lowered to 128m
...
Alternatively, you can require manual intervention after buffer allocation failure by settingbufresize to manual. Under this policy, a failure to allocate will cause DTrace to fail to start:
# dtrace -P syscall -x bufsize=1g -x bufresize=manual
dtrace: description ’syscall’ matched 430 probes
dtrace: could not enable tracing: Not enough space
#
The buffer resizing policy of all buffers, principal, speculative and aggregation, is dictated by thebufresize option.
Buffer Resizing Policy
Chapter 5 • Buffers and Buffering 131

132
Output Formatting
DTrace provides built-in formatting functions printf and printa that you can use from yourD programs to format output. The D compiler provides features not found in the printf(3C)library routine, so you should read this chapter even if you are already familiar with printf.This chapter also discusses the formatting behavior of the trace function and the default outputformat used by dtrace(1M) to display aggregations.
printfThe printf function combines the ability to trace data, as if by the trace function, with theability to output the data and other text in a specific format that you describe. The printffunction tells DTrace to trace the data associated with each argument after the first argument,and then to format the results using the rules described by the first printf argument, known asa format string. The format string is a regular string that contains any number of formatconversions, each beginning with the % character, that describe how to format thecorresponding argument. The first conversion in the format string corresponds to the secondprintf argument, the second conversion to the third argument, and so on. All of the textbetween conversions is printed verbatim. The character following the % conversion characterdescribes the format to use for the corresponding argument.
Unlike printf(3C), DTrace printf is a built-in function that is recognized by the D compiler.The D compiler provides several useful services for DTrace printf that are not found in the Clibrary printf:
■ The D compiler compares the arguments to the conversions in the format string. If anargument's type is incompatible with the format conversion, the D compiler provides anerror message explaining the problem.
■ The D compiler does not require the use of size prefixes with printf format conversions. TheC printf routine requires that you indicate the size of arguments by adding prefixes such as%ld for long or %lld for long long. The D compiler knows the size and type of yourarguments, so these prefixes are not required in your D printf statements.
6C H A P T E R 6
133
■ DTrace provides additional format characters that are useful for debugging andobservability. For example, the %a format conversion can be used to print a pointer as asymbol name and offset.
In order to implement these features, the format string in the DTrace printf function must bespecified as a string constant in your D program. Format strings may not be dynamic variablesof type string.
Conversion SpecificationsEach conversion specification in the format string is introduced by the % character, after whichthe following information appears in sequence:
■ Zero or more flags (in any order), that modify the meaning of the conversion specification asdescribed in the next section.
■ An optional minimum field width. If the converted value has fewer bytes than the fieldwidth, the value will be padded with spaces on the left by default, or on the right if theleft-adjustment flag (-) is specified. The field width can also be specified as an asterisk (*), inwhich case the field width is set dynamically based on the value of an additional argument oftype int.
■ An optional precision that indicates the minimum number of digits to appear for the d, i, o,u, x, and X conversions (the field is padded with leading zeroes); the number of digits toappear after the radix character for the e, E, and f conversions, the maximum number ofsignificant digits for the g and G conversions; or the maximum number of bytes to be printedfrom a string by the s conversion. The precision takes the form of a period (.) followed byeither an asterisk (*), described below, or a decimal digit string.
■ An optional sequence of size prefixes that indicate the size of the corresponding argument,described in “Overview” on page 224. The size prefixes are not necessary in D and areprovided for compatibility with the C printf function.
■ A conversion specifier that indicates the type of conversion to be applied to the argument.
The printf(3C) function also supports conversion specifications of the form %n$ where n is adecimal integer; DTrace printf does not support this type of conversion specification.
Flag SpecifiersThe printf conversion flags are enabled by specifying one or more of the following characters,which may appear in any order:
’ The integer portion of the result of a decimal conversion (%i, %d, %u, %f, %g, or %G) isformatted with thousands grouping characters using the non-monetary groupingcharacter. Some locales, including the POSIX C locale, do not provide non-monetarygrouping characters for use with this flag.
printf
Oracle Solaris Dynamic Tracing Guide • November 2011 E22973_02134
- The result of the conversion is left-justified within the field. The conversion isright-justified if this flag is not specified.
+ The result of signed conversion always begins with a sign (+ or -). If this flag is notspecified, the conversion begins with a sign only when a negative value is converted.
space If the first character of a signed conversion is not a sign or if a signed conversionresults in no characters, a space is placed before the result. If the space and + flagsboth appear, the space flag is ignored.
# The value is converted to an alternate form if an alternate form is defined for theselected conversion. The alternate formats for conversions are described along withthe corresponding conversion.
0 For d, i, o, u, x, X, e, E, f, g, and G conversions, leading zeroes (following anyindication of sign or base) are used to pad to the field width. No space padding isperformed. If the 0 and - flags both appear, the 0 flag is ignored. For d, i, o, u, x and X
conversions, if a precision is specified, the 0 flag is ignored. If the 0 and ’ flags bothappear, the grouping characters are inserted before the zero padding.
Width and Precision SpecifiersThe minimum field width can be specified as a decimal digit string following any flag specifier,in which case the field width is set to the specified number of columns. The field width can alsobe specified as asterisk (*) in which case an additional argument of type int is accessed todetermine the field width. For example, to print an integer x in a field width determined by thevalue of the int variable w, you would write the D statement:
printf("%*d", w, x);
The field width can also be specified using a ? character to indicate that the field width should beset based on the number of characters required to format an address in hexadecimal in the datamodel of the operating system kernel. The width is set to 8 if the kernel is using the 32-bit datamodel, or to 16 if the kernel is using the 64-bit data model. The precision for the conversion canbe specified as a decimal digit string following a period (.) or by an asterisk (*) following aperiod. If an asterisk is used to specify the precision, an additional argument of type int prior tothe conversion argument is accessed to determine the precision. If both width and precision arespecified as asterisks, the order of arguments to printf for the conversion should appear in thefollowing order: width, precision, value.
Size PrefixesSize prefixes are required in ANSI-C programs that use printf(3C) in order to indicate the sizeand type of the conversion argument. The D compiler performs this processing for your printf
printf
Chapter 6 • Output Formatting 135
calls automatically, so size prefixes are not required. Although size prefixes are provided for Ccompatibility, their use is explicitly discouraged in D programs because they bind your code to aparticular data model when using derived types. For example, if a typedef is redefined todifferent integer base types depending on the data model, it is not possible to use a single Cconversion that works in both data models without explicitly knowing the two underlying typesand including a cast expression, or defining multiple format strings. The D compiler solves thisproblem automatically by allowing you to omit size prefixes and automatically determining theargument size.
The size prefixes can be placed just prior to the format conversion name and after any flags,widths, and precision specifiers. The size prefixes are as follows:
■ An optional h specifies that a following d, i, o, u, x, or X conversion applies to a short orunsigned short.
■ An optional l specifies that a following d, i, o, u, x, or X conversion applies to a long orunsigned long.
■ An optional ll specifies that a following d, i, o, u, x, or X conversion applies to a long long orunsigned long long.
■ An optional L specifies that a following e, E, f, g, or G conversion applies to a long double.■ An optional l specifies that a following c conversion applies to a wint_t argument, and that
a following s conversion character applies to a pointer to a wchar_t argument.
Conversion FormatsEach conversion character sequence results in fetching zero or more arguments. If insufficientarguments are provided for the format string, or if the format string is exhausted and argumentsremain, the D compiler issues an appropriate error message. If an undefined conversion formatis specified, the D compiler issues an appropriate error message. The conversion charactersequences are:
a The pointer or uintptr_t argument is printed as a kernel symbol name in the formmodule‘symbol-name plus an optional hexadecimal byte offset. If the value does not fallwithin the range defined by a known kernel symbol, the value is printed as ahexadecimal integer.
A Exactly like %a, but for user symbols.
c The char, short, or int argument is printed as an ASCII character.
C The char, short, or int argument is printed as an ASCII character if the character is aprintable ASCII character. If the character is not a printable character, it is printedusing the corresponding escape sequence as shown in Table 2–6.
printf
Oracle Solaris Dynamic Tracing Guide • November 2011 E22973_02136
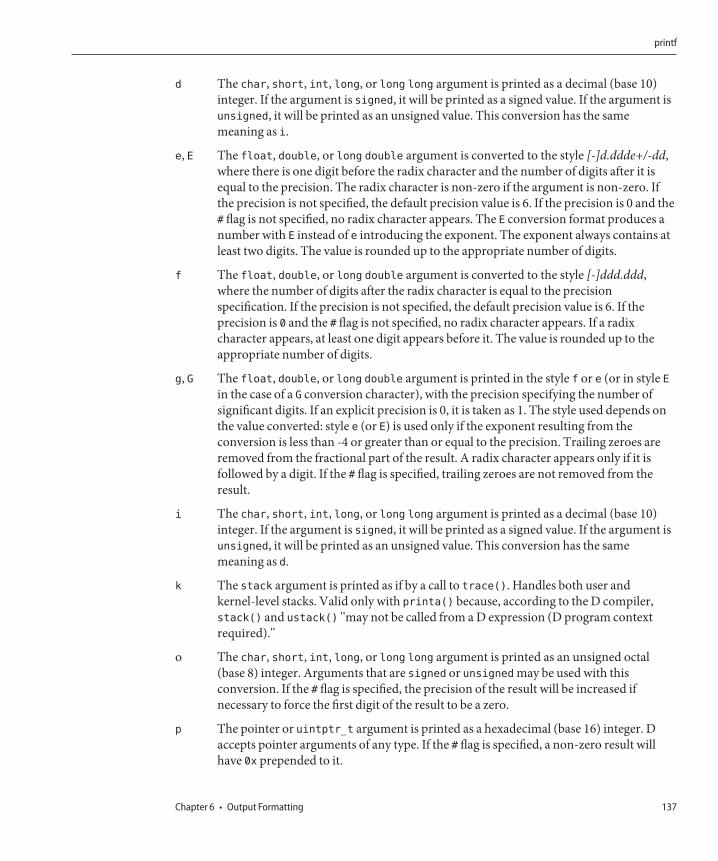
d The char, short, int, long, or long long argument is printed as a decimal (base 10)integer. If the argument is signed, it will be printed as a signed value. If the argument isunsigned, it will be printed as an unsigned value. This conversion has the samemeaning as i.
e, E The float, double, or long double argument is converted to the style [-]d.ddde+/-dd,where there is one digit before the radix character and the number of digits after it isequal to the precision. The radix character is non-zero if the argument is non-zero. Ifthe precision is not specified, the default precision value is 6. If the precision is 0 and the# flag is not specified, no radix character appears. The E conversion format produces anumber with E instead of e introducing the exponent. The exponent always contains atleast two digits. The value is rounded up to the appropriate number of digits.
f The float, double, or long double argument is converted to the style [-]ddd.ddd,where the number of digits after the radix character is equal to the precisionspecification. If the precision is not specified, the default precision value is 6. If theprecision is 0 and the # flag is not specified, no radix character appears. If a radixcharacter appears, at least one digit appears before it. The value is rounded up to theappropriate number of digits.
g, G The float, double, or long double argument is printed in the style f or e (or in style Ein the case of a G conversion character), with the precision specifying the number ofsignificant digits. If an explicit precision is 0, it is taken as 1. The style used depends onthe value converted: style e (or E) is used only if the exponent resulting from theconversion is less than -4 or greater than or equal to the precision. Trailing zeroes areremoved from the fractional part of the result. A radix character appears only if it isfollowed by a digit. If the # flag is specified, trailing zeroes are not removed from theresult.
i The char, short, int, long, or long long argument is printed as a decimal (base 10)integer. If the argument is signed, it will be printed as a signed value. If the argument isunsigned, it will be printed as an unsigned value. This conversion has the samemeaning as d.
k The stack argument is printed as if by a call to trace(). Handles both user andkernel-level stacks. Valid only with printa() because, according to the D compiler,stack() and ustack() "may not be called from a D expression (D program contextrequired)."
o The char, short, int, long, or long long argument is printed as an unsigned octal(base 8) integer. Arguments that are signed or unsigned may be used with thisconversion. If the # flag is specified, the precision of the result will be increased ifnecessary to force the first digit of the result to be a zero.
p The pointer or uintptr_t argument is printed as a hexadecimal (base 16) integer. Daccepts pointer arguments of any type. If the # flag is specified, a non-zero result willhave 0x prepended to it.
printf
Chapter 6 • Output Formatting 137
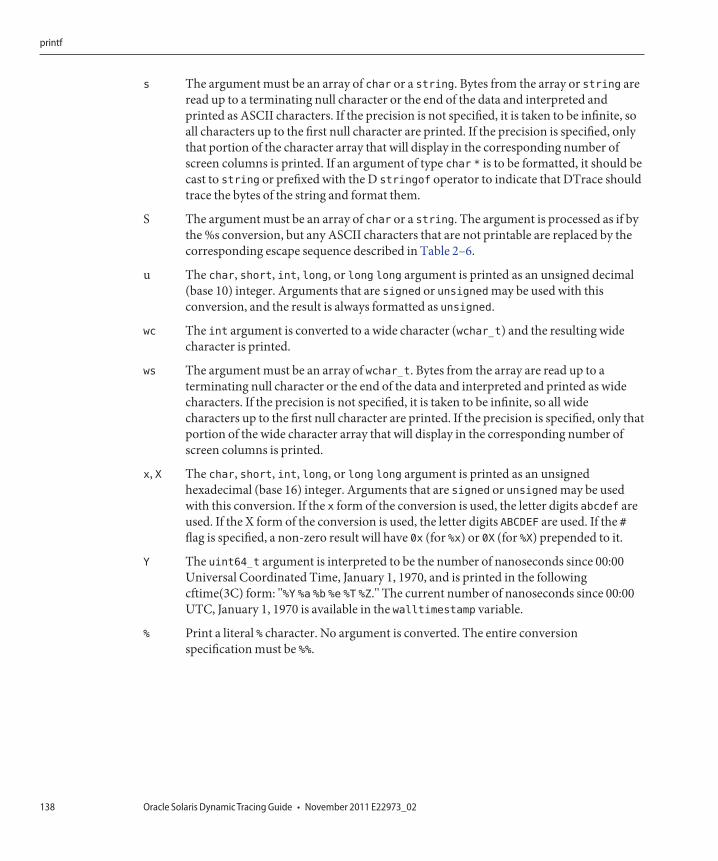
s The argument must be an array of char or a string. Bytes from the array or string areread up to a terminating null character or the end of the data and interpreted andprinted as ASCII characters. If the precision is not specified, it is taken to be infinite, soall characters up to the first null character are printed. If the precision is specified, onlythat portion of the character array that will display in the corresponding number ofscreen columns is printed. If an argument of type char * is to be formatted, it should becast to string or prefixed with the D stringof operator to indicate that DTrace shouldtrace the bytes of the string and format them.
S The argument must be an array of char or a string. The argument is processed as if bythe %s conversion, but any ASCII characters that are not printable are replaced by thecorresponding escape sequence described in Table 2–6.
u The char, short, int, long, or long long argument is printed as an unsigned decimal(base 10) integer. Arguments that are signed or unsigned may be used with thisconversion, and the result is always formatted as unsigned.
wc The int argument is converted to a wide character (wchar_t) and the resulting widecharacter is printed.
ws The argument must be an array of wchar_t. Bytes from the array are read up to aterminating null character or the end of the data and interpreted and printed as widecharacters. If the precision is not specified, it is taken to be infinite, so all widecharacters up to the first null character are printed. If the precision is specified, only thatportion of the wide character array that will display in the corresponding number ofscreen columns is printed.
x, X The char, short, int, long, or long long argument is printed as an unsignedhexadecimal (base 16) integer. Arguments that are signed or unsigned may be usedwith this conversion. If the x form of the conversion is used, the letter digits abcdef areused. If the X form of the conversion is used, the letter digits ABCDEF are used. If the #flag is specified, a non-zero result will have 0x (for %x) or 0X (for %X) prepended to it.
Y The uint64_t argument is interpreted to be the number of nanoseconds since 00:00Universal Coordinated Time, January 1, 1970, and is printed in the followingcftime(3C) form: "%Y %a %b %e %T %Z." The current number of nanoseconds since 00:00UTC, January 1, 1970 is available in the walltimestamp variable.
% Print a literal % character. No argument is converted. The entire conversionspecification must be %%.
printf
Oracle Solaris Dynamic Tracing Guide • November 2011 E22973_02138
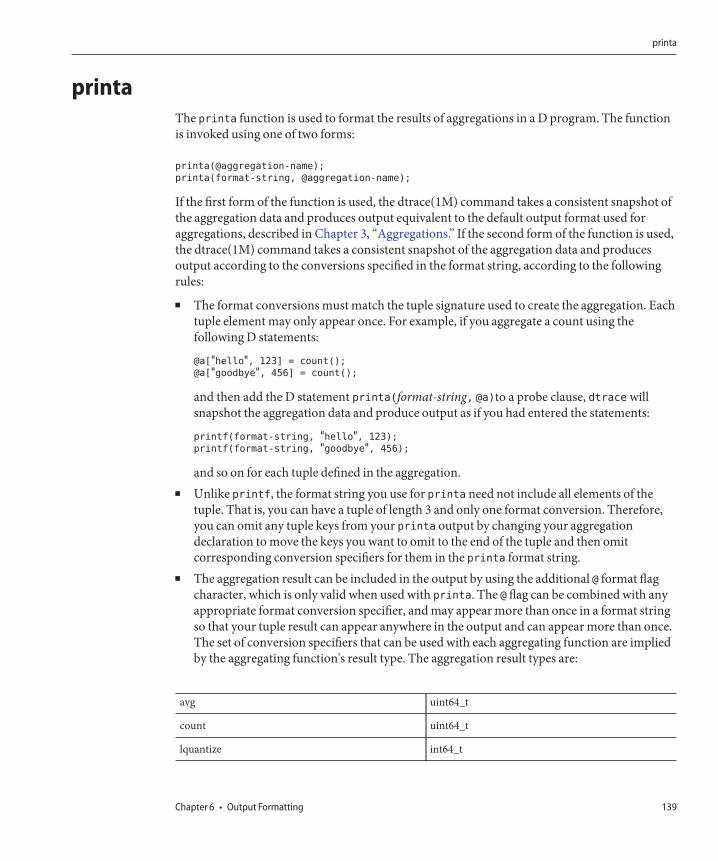
printaThe printa function is used to format the results of aggregations in a D program. The functionis invoked using one of two forms:
printa(@aggregation-name);
printa(format-string, @aggregation-name);
If the first form of the function is used, the dtrace(1M) command takes a consistent snapshot ofthe aggregation data and produces output equivalent to the default output format used foraggregations, described in Chapter 3, “Aggregations.” If the second form of the function is used,the dtrace(1M) command takes a consistent snapshot of the aggregation data and producesoutput according to the conversions specified in the format string, according to the followingrules:
■ The format conversions must match the tuple signature used to create the aggregation. Eachtuple element may only appear once. For example, if you aggregate a count using thefollowing D statements:
@a["hello", 123] = count();
@a["goodbye", 456] = count();
and then add the D statement printa(format-string, @a)to a probe clause, dtrace willsnapshot the aggregation data and produce output as if you had entered the statements:
printf(format-string, "hello", 123);
printf(format-string, "goodbye", 456);
and so on for each tuple defined in the aggregation.■ Unlike printf, the format string you use for printa need not include all elements of the
tuple. That is, you can have a tuple of length 3 and only one format conversion. Therefore,you can omit any tuple keys from your printa output by changing your aggregationdeclaration to move the keys you want to omit to the end of the tuple and then omitcorresponding conversion specifiers for them in the printa format string.
■ The aggregation result can be included in the output by using the additional @ format flagcharacter, which is only valid when used with printa. The @ flag can be combined with anyappropriate format conversion specifier, and may appear more than once in a format stringso that your tuple result can appear anywhere in the output and can appear more than once.The set of conversion specifiers that can be used with each aggregating function are impliedby the aggregating function's result type. The aggregation result types are:
avg uint64_t
count uint64_t
lquantize int64_t
printa
Chapter 6 • Output Formatting 139
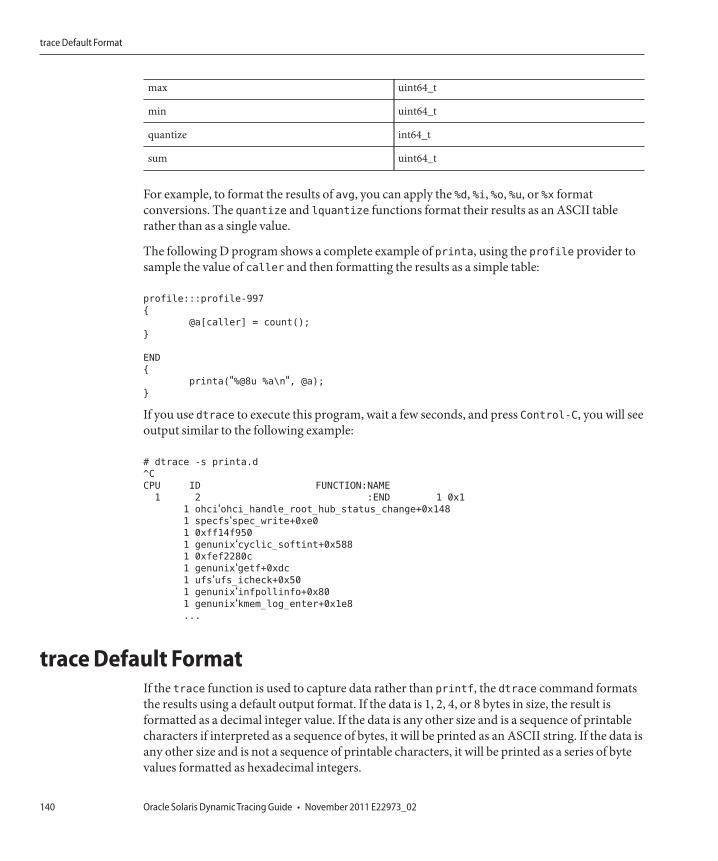
max uint64_t
min uint64_t
quantize int64_t
sum uint64_t
For example, to format the results of avg, you can apply the %d, %i, %o, %u, or %x formatconversions. The quantize and lquantize functions format their results as an ASCII tablerather than as a single value.
The following D program shows a complete example of printa, using the profile provider tosample the value of caller and then formatting the results as a simple table:
profile:::profile-997
{
@a[caller] = count();
}
END
{
printa("%@8u %a\n", @a);
}
If you use dtrace to execute this program, wait a few seconds, and press Control-C, you will seeoutput similar to the following example:
# dtrace -s printa.d
^C
CPU ID FUNCTION:NAME
1 2 :END 1 0x1
1 ohci‘ohci_handle_root_hub_status_change+0x1481 specfs‘spec_write+0xe01 0xff14f950
1 genunix‘cyclic_softint+0x5881 0xfef2280c
1 genunix‘getf+0xdc1 ufs‘ufs_icheck+0x501 genunix‘infpollinfo+0x801 genunix‘kmem_log_enter+0x1e8...
trace Default FormatIf the trace function is used to capture data rather than printf, the dtrace command formatsthe results using a default output format. If the data is 1, 2, 4, or 8 bytes in size, the result isformatted as a decimal integer value. If the data is any other size and is a sequence of printablecharacters if interpreted as a sequence of bytes, it will be printed as an ASCII string. If the data isany other size and is not a sequence of printable characters, it will be printed as a series of bytevalues formatted as hexadecimal integers.
trace Default Format
Oracle Solaris Dynamic Tracing Guide • November 2011 E22973_02140
Speculative Tracing
This chapter discusses the DTrace facility for speculative tracing, the ability to tentatively tracedata and then later decide whether to commit the data to a tracing buffer or discard it. InDTrace, the primary mechanism for filtering out uninteresting events is the predicatemechanism, discussed in “D Program Structure” on page 23. Predicates are useful when youknow at the time that a probe fires whether or not the probe event is of interest. For example, ifyou are only interested in activity associated with a certain process or a certain file descriptor,you know when the probe fires if it is associated with the process or file descriptor of interest.However, in other situations, you might not know whether a given probe event is of interestuntil some time after the probe fires.
For example, if a system call is occasionally failing with a common error code (for example, EIOor EINVAL), you might want to examine the code path leading to the error condition. To capturethe code path, you could enable every probe — but only if the failing call can be isolated in sucha way that a meaningful predicate can be constructed. If the failures are sporadic ornondeterministic, you would be forced to trace all events that might be interesting, and laterpostprocess the data to filter out the ones that were not associated with the failing code path. Inthis case, even though the number of interesting events may be reasonably small, the number ofevents that must be traced is very large, making postprocessing difficult.
You can use the speculative tracing facility in these situations to tentatively trace data at one ormore probe locations, and then decide to commit the data to the principal buffer at anotherprobe location. As a result, your trace data contains only the output of interest, nopostprocessing is required, and the DTrace overhead is minimized.
7C H A P T E R 7
141
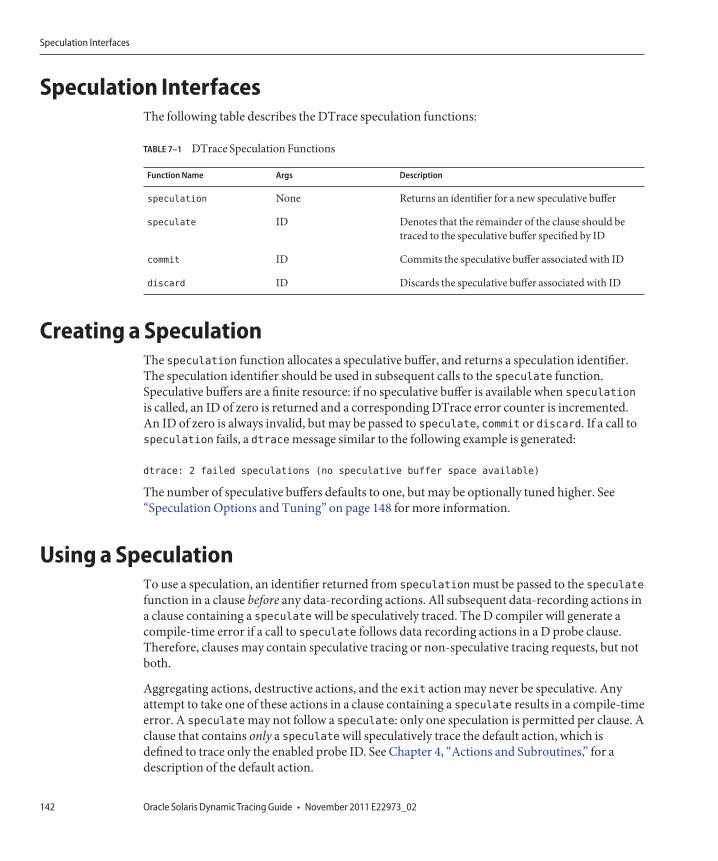
Speculation InterfacesThe following table describes the DTrace speculation functions:
TABLE 7–1 DTrace Speculation Functions
Function Name Args Description
speculation None Returns an identifier for a new speculative buffer
speculate ID Denotes that the remainder of the clause should betraced to the speculative buffer specified by ID
commit ID Commits the speculative buffer associated with ID
discard ID Discards the speculative buffer associated with ID
Creating a SpeculationThe speculation function allocates a speculative buffer, and returns a speculation identifier.The speculation identifier should be used in subsequent calls to the speculate function.Speculative buffers are a finite resource: if no speculative buffer is available when speculation
is called, an ID of zero is returned and a corresponding DTrace error counter is incremented.An ID of zero is always invalid, but may be passed to speculate, commit or discard. If a call tospeculation fails, a dtrace message similar to the following example is generated:
dtrace: 2 failed speculations (no speculative buffer space available)
The number of speculative buffers defaults to one, but may be optionally tuned higher. See“Speculation Options and Tuning” on page 148 for more information.
Using a SpeculationTo use a speculation, an identifier returned from speculation must be passed to the speculatefunction in a clause before any data-recording actions. All subsequent data-recording actions ina clause containing a speculate will be speculatively traced. The D compiler will generate acompile-time error if a call to speculate follows data recording actions in a D probe clause.Therefore, clauses may contain speculative tracing or non-speculative tracing requests, but notboth.
Aggregating actions, destructive actions, and the exit action may never be speculative. Anyattempt to take one of these actions in a clause containing a speculate results in a compile-timeerror. A speculate may not follow a speculate: only one speculation is permitted per clause. Aclause that contains only a speculate will speculatively trace the default action, which isdefined to trace only the enabled probe ID. See Chapter 4, “Actions and Subroutines,” for adescription of the default action.
Speculation Interfaces
Oracle Solaris Dynamic Tracing Guide • November 2011 E22973_02142
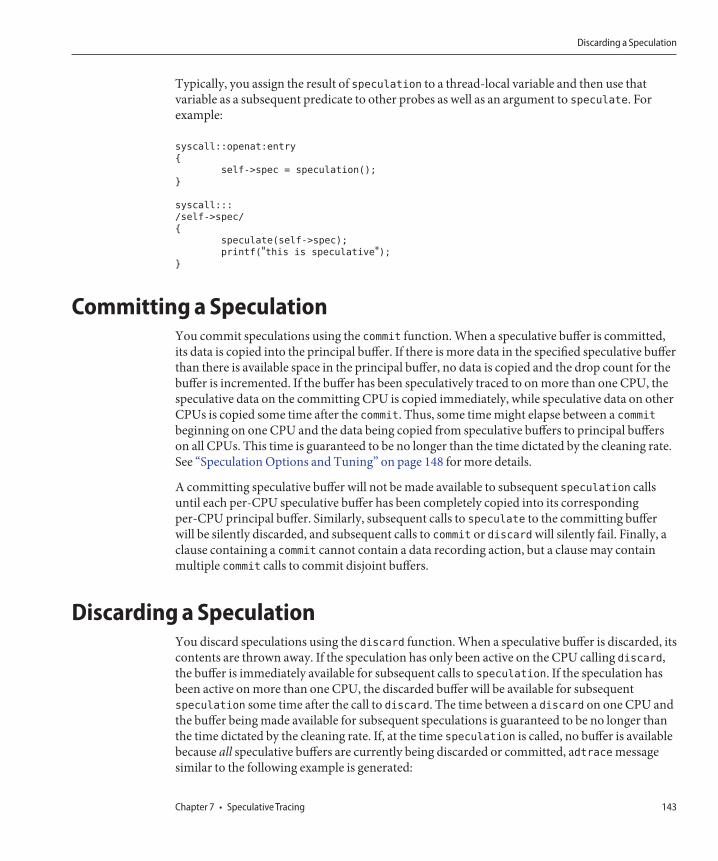
Typically, you assign the result of speculation to a thread-local variable and then use thatvariable as a subsequent predicate to other probes as well as an argument to speculate. Forexample:
syscall::openat:entry
{
self->spec = speculation();
}
syscall:::
/self->spec/
{
speculate(self->spec);
printf("this is speculative");}
Committing a SpeculationYou commit speculations using the commit function. When a speculative buffer is committed,its data is copied into the principal buffer. If there is more data in the specified speculative bufferthan there is available space in the principal buffer, no data is copied and the drop count for thebuffer is incremented. If the buffer has been speculatively traced to on more than one CPU, thespeculative data on the committing CPU is copied immediately, while speculative data on otherCPUs is copied some time after the commit. Thus, some time might elapse between a commitbeginning on one CPU and the data being copied from speculative buffers to principal bufferson all CPUs. This time is guaranteed to be no longer than the time dictated by the cleaning rate.See “Speculation Options and Tuning” on page 148 for more details.
A committing speculative buffer will not be made available to subsequent speculation callsuntil each per-CPU speculative buffer has been completely copied into its correspondingper-CPU principal buffer. Similarly, subsequent calls to speculate to the committing bufferwill be silently discarded, and subsequent calls to commit or discard will silently fail. Finally, aclause containing a commit cannot contain a data recording action, but a clause may containmultiple commit calls to commit disjoint buffers.
Discarding a SpeculationYou discard speculations using the discard function. When a speculative buffer is discarded, itscontents are thrown away. If the speculation has only been active on the CPU calling discard,the buffer is immediately available for subsequent calls to speculation. If the speculation hasbeen active on more than one CPU, the discarded buffer will be available for subsequentspeculation some time after the call to discard. The time between a discard on one CPU andthe buffer being made available for subsequent speculations is guaranteed to be no longer thanthe time dictated by the cleaning rate. If, at the time speculation is called, no buffer is availablebecause all speculative buffers are currently being discarded or committed, adtrace messagesimilar to the following example is generated:
Discarding a Speculation
Chapter 7 • Speculative Tracing 143
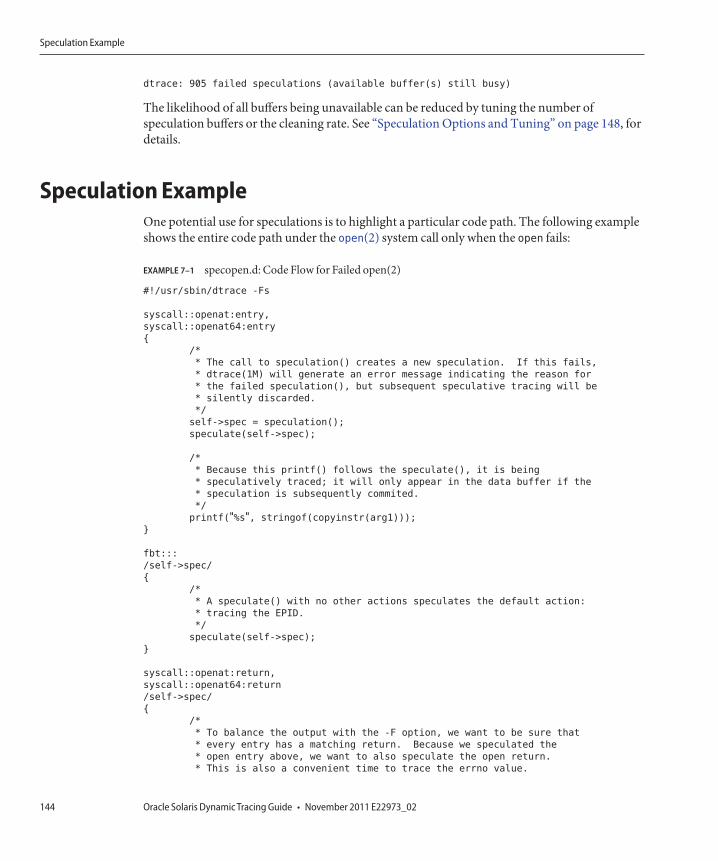
dtrace: 905 failed speculations (available buffer(s) still busy)
The likelihood of all buffers being unavailable can be reduced by tuning the number ofspeculation buffers or the cleaning rate. See “Speculation Options and Tuning” on page 148, fordetails.
Speculation ExampleOne potential use for speculations is to highlight a particular code path. The following exampleshows the entire code path under the open(2) system call only when the open fails:
EXAMPLE 7–1 specopen.d: Code Flow for Failed open(2)
#!/usr/sbin/dtrace -Fs
syscall::openat:entry,
syscall::openat64:entry
{
/*
* The call to speculation() creates a new speculation. If this fails,
* dtrace(1M) will generate an error message indicating the reason for
* the failed speculation(), but subsequent speculative tracing will be
* silently discarded.
*/
self->spec = speculation();
speculate(self->spec);
/*
* Because this printf() follows the speculate(), it is being
* speculatively traced; it will only appear in the data buffer if the
* speculation is subsequently commited.
*/
printf("%s", stringof(copyinstr(arg1)));
}
fbt:::
/self->spec/
{
/*
* A speculate() with no other actions speculates the default action:
* tracing the EPID.
*/
speculate(self->spec);
}
syscall::openat:return,
syscall::openat64:return
/self->spec/
{
/*
* To balance the output with the -F option, we want to be sure that
* every entry has a matching return. Because we speculated the
* open entry above, we want to also speculate the open return.
* This is also a convenient time to trace the errno value.
Speculation Example
Oracle Solaris Dynamic Tracing Guide • November 2011 E22973_02144
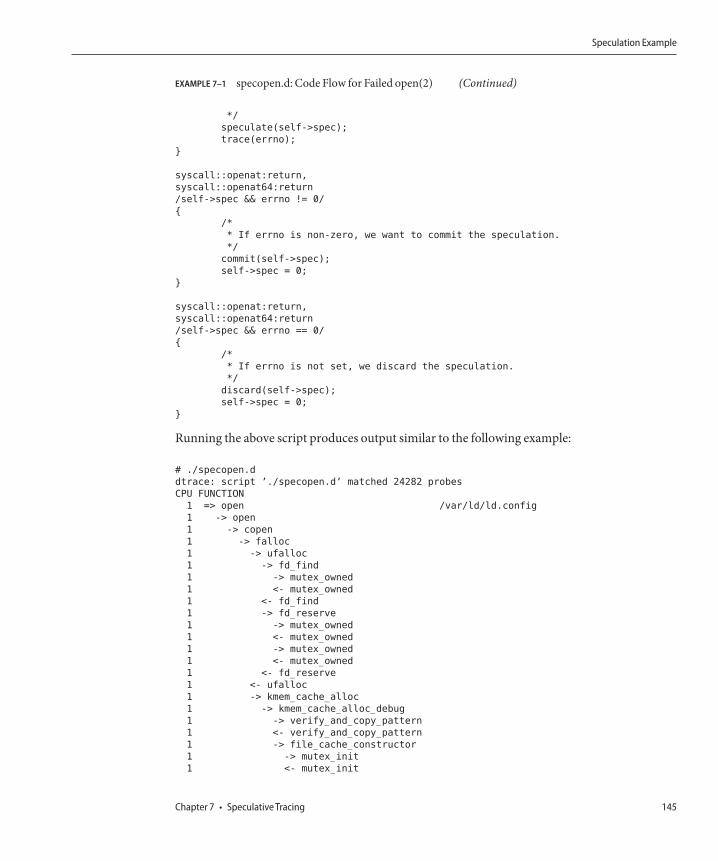
EXAMPLE 7–1 specopen.d: Code Flow for Failed open(2) (Continued)
*/
speculate(self->spec);
trace(errno);
}
syscall::openat:return,
syscall::openat64:return
/self->spec && errno != 0/
{
/*
* If errno is non-zero, we want to commit the speculation.
*/
commit(self->spec);
self->spec = 0;
}
syscall::openat:return,
syscall::openat64:return
/self->spec && errno == 0/
{
/*
* If errno is not set, we discard the speculation.
*/
discard(self->spec);
self->spec = 0;
}
Running the above script produces output similar to the following example:
# ./specopen.d
dtrace: script ’./specopen.d’ matched 24282 probes
CPU FUNCTION
1 => open /var/ld/ld.config
1 -> open
1 -> copen
1 -> falloc
1 -> ufalloc
1 -> fd_find
1 -> mutex_owned
1 <- mutex_owned
1 <- fd_find
1 -> fd_reserve
1 -> mutex_owned
1 <- mutex_owned
1 -> mutex_owned
1 <- mutex_owned
1 <- fd_reserve
1 <- ufalloc
1 -> kmem_cache_alloc
1 -> kmem_cache_alloc_debug
1 -> verify_and_copy_pattern
1 <- verify_and_copy_pattern
1 -> file_cache_constructor
1 -> mutex_init
1 <- mutex_init
Speculation Example
Chapter 7 • Speculative Tracing 145
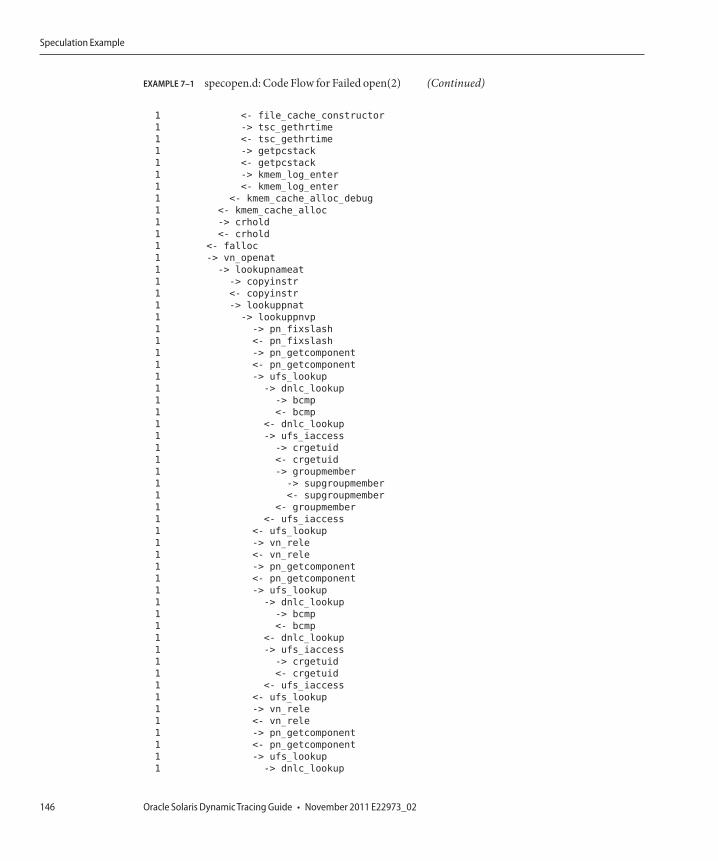
EXAMPLE 7–1 specopen.d: Code Flow for Failed open(2) (Continued)
1 <- file_cache_constructor
1 -> tsc_gethrtime
1 <- tsc_gethrtime
1 -> getpcstack
1 <- getpcstack
1 -> kmem_log_enter
1 <- kmem_log_enter
1 <- kmem_cache_alloc_debug
1 <- kmem_cache_alloc
1 -> crhold
1 <- crhold
1 <- falloc
1 -> vn_openat
1 -> lookupnameat
1 -> copyinstr
1 <- copyinstr
1 -> lookuppnat
1 -> lookuppnvp
1 -> pn_fixslash
1 <- pn_fixslash
1 -> pn_getcomponent
1 <- pn_getcomponent
1 -> ufs_lookup
1 -> dnlc_lookup
1 -> bcmp
1 <- bcmp
1 <- dnlc_lookup
1 -> ufs_iaccess
1 -> crgetuid
1 <- crgetuid
1 -> groupmember
1 -> supgroupmember
1 <- supgroupmember
1 <- groupmember
1 <- ufs_iaccess
1 <- ufs_lookup
1 -> vn_rele
1 <- vn_rele
1 -> pn_getcomponent
1 <- pn_getcomponent
1 -> ufs_lookup
1 -> dnlc_lookup
1 -> bcmp
1 <- bcmp
1 <- dnlc_lookup
1 -> ufs_iaccess
1 -> crgetuid
1 <- crgetuid
1 <- ufs_iaccess
1 <- ufs_lookup
1 -> vn_rele
1 <- vn_rele
1 -> pn_getcomponent
1 <- pn_getcomponent
1 -> ufs_lookup
1 -> dnlc_lookup
Speculation Example
Oracle Solaris Dynamic Tracing Guide • November 2011 E22973_02146
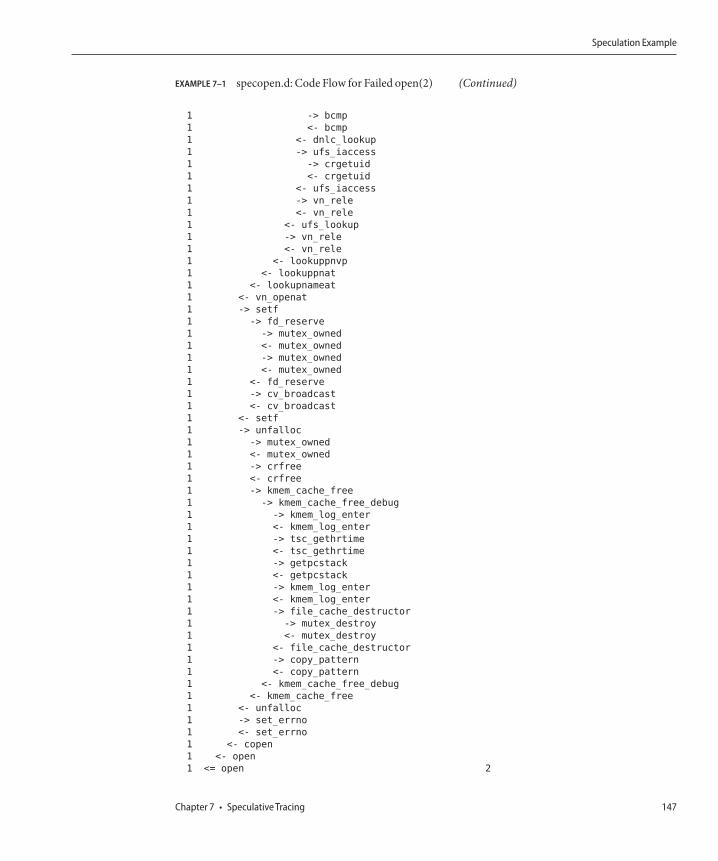
EXAMPLE 7–1 specopen.d: Code Flow for Failed open(2) (Continued)
1 -> bcmp
1 <- bcmp
1 <- dnlc_lookup
1 -> ufs_iaccess
1 -> crgetuid
1 <- crgetuid
1 <- ufs_iaccess
1 -> vn_rele
1 <- vn_rele
1 <- ufs_lookup
1 -> vn_rele
1 <- vn_rele
1 <- lookuppnvp
1 <- lookuppnat
1 <- lookupnameat
1 <- vn_openat
1 -> setf
1 -> fd_reserve
1 -> mutex_owned
1 <- mutex_owned
1 -> mutex_owned
1 <- mutex_owned
1 <- fd_reserve
1 -> cv_broadcast
1 <- cv_broadcast
1 <- setf
1 -> unfalloc
1 -> mutex_owned
1 <- mutex_owned
1 -> crfree
1 <- crfree
1 -> kmem_cache_free
1 -> kmem_cache_free_debug
1 -> kmem_log_enter
1 <- kmem_log_enter
1 -> tsc_gethrtime
1 <- tsc_gethrtime
1 -> getpcstack
1 <- getpcstack
1 -> kmem_log_enter
1 <- kmem_log_enter
1 -> file_cache_destructor
1 -> mutex_destroy
1 <- mutex_destroy
1 <- file_cache_destructor
1 -> copy_pattern
1 <- copy_pattern
1 <- kmem_cache_free_debug
1 <- kmem_cache_free
1 <- unfalloc
1 -> set_errno
1 <- set_errno
1 <- copen
1 <- open
1 <= open 2
Speculation Example
Chapter 7 • Speculative Tracing 147
Speculation Options and TuningIf a speculative buffer is full when a speculative tracing action is attempted, no data is stored inthe buffer and a drop count is incremented. If this situation, a dtrace message similar to thefollowing example is generated:
dtrace: 38 speculative drops
Speculative drops will not prevent the full speculative buffer from being copied into theprincipal buffer when the buffer is committed. Similarly, speculative drops can occur even ifdrops were experienced on a speculative buffer that was ultimately discarded. Speculative dropscan be reduced by increasing the speculative buffer size, which is tuned using the specsizeoption. The specsize option may be specified with any size suffix. The resizing policy of thisbuffer is dictated by the bufresize option.
Speculative buffers might be unavailable when speculation is called. If buffers exist that havenot yet been committed or discarded, a dtrace message similar to the following example isgenerated:
dtrace: 1 failed speculation (no speculative buffer available)
You can reduce the likelihood of failed speculations of this nature by increasing the number ofspeculative buffers with the nspec option. The value of nspec defaults to one.
Alternatively, speculation may fail because all speculative buffers are busy. In this case, adtrace message similar to the following example is generated:
dtrace: 1 failed speculation (available buffer(s) still busy)
This message indicates that speculation was called after commit was called for a speculativebuffer, but before that buffer was actually committed on all CPUs. You can reduce thelikelihood of failed speculations of this nature by increasing the rate at which CPUs are cleanedwith the cleanrate option. The value of cleanrate defaults to 101.
Speculation Options and Tuning
Oracle Solaris Dynamic Tracing Guide • November 2011 E22973_02148
dtrace(1M) Utility
The dtrace(1M) command is a generic front-end to the DTrace facility. The commandimplements a simple interface to invoke the D language compiler, the ability to retrieve bufferedtrace data from the DTrace kernel facility, and a set of basic routines to format and print traceddata. This chapter provides a complete reference for the dtrace command.
DescriptionThe dtrace command provides a generic interface to all of the essential services provided by theDTrace facility, including:
■ Options to list the set of probes and providers currently published by DTrace■ Options to enable probes directly using any of the probe description specifiers (provider,
module, function, name)■ Options to run the D compiler and compile one or more D program files or programs
written directly on the command-line■ Options to generate anonymous tracing programs (see Chapter 15, “Anonymous Tracing”)■ Options to generate program stability reports (see Chapter 18, “Stability”)■ Options to modify DTrace tracing and buffering behavior and enable additional D compiler
features (see Chapter 10, “Options and Tunables”)
dtrace can also be used to create D scripts by using it in a #! declaration to create an interpreterfile (see Chapter 9, “Scripting”). Finally, you can use dtrace to attempt to compile D programsand determine their properties without actually enabling any tracing using the -e option,described below.
8C H A P T E R 8
149
OptionsThe dtrace command accepts the following options:
dtrace[-32| -64][-aACeFGHlqSvVwZ][-b bufsz][-c cmd][-D name[=def]][-I path][-L path][-ooutput][-p pid][-s script][-U name][-x arg[=val]][-X[a| c| s| t]][-Pprovider[[predicate]action]][-m [[provider:]module[[predicate]action]]][-f[[provider:]module:]func[[predicate]action]][-n[[[provider:]module:]func:]name[[predicate]action]][-i probe-id[[predicate]action]]
where predicate is any D predicate enclosed in slashes / / and action is any D statement listenclosed in braces { } according to the previously described D language syntax. If D programcode is provided as an argument to the -P, -m, -f, -n, or -i options this text must be appropriatelyquoted to avoid interpretation by the shell. The options are as follows:
-32, -64
The D compiler produces programs using the native data model of the operating system kernel.You can use the isainfo(1) -b command to determine the current operating system datamodel. If the -32 option is specified, dtrace will force the D compiler to compile a D programusing the 32-bit data model. If the -64 option is specified, dtrace will force the D compiler tocompile a D program using the 64-bit data model. These options are typically not required asdtrace selects the native data model as the default. The data model affects the sizes of integertypes and other language properties. D programs compiled for either data model may beexecuted on both 32-bit and 64-bit kernels. The -32 and -64 options also determine the ELF fileformat (ELF32 or ELF64) produced by the -G option.
-a
Claim anonymous tracing state and display the traced data. You can combine the -a option withthe -e option to force dtrace to exit immediately after consuming the anonymous tracing staterather than continuing to wait for new data. See Chapter 15, “Anonymous Tracing,” for moreinformation about anonymous tracing.
-A
Generate driver.conf(4) directives for anonymous tracing. If the -A option is specified,dtrace compiles any D programs specified using the -s option or on the command-line andconstructs a set of dtrace(7D) configuration file directives to enable the specified probes foranonymous tracing (see Chapter 15, “Anonymous Tracing”) and then exits. By default, dtraceattempts to store the directives to the file /kernel/drv/dtrace.conf. This behavior can bemodified using the -o option to specify an alternate output file.
-b
Options
Oracle Solaris Dynamic Tracing Guide • November 2011 E22973_02150
Set principal trace buffer size. The trace buffer size can include any of the size suffixes k, m, g, or tas described in Chapter 15, “Anonymous Tracing.” If the buffer space cannot be allocated,dtrace attempts to reduce the buffer size or exit depending on the setting of the bufresizeproperty.
-c
Run the specified command cmd and exit upon its completion. If more than one -c option ispresent on the command line, dtrace exits when all commands have exited, reporting the exitstatus for each child process as it terminates. The process-ID of the first command is madeavailable to any D programs specified on the command line or using the -s option through the$target macro variable. Refer to Chapter 9, “Scripting,” for more information on macrovariables.
-C
Run the C preprocessor cpp(1) over D programs before compiling them. Options can be passedto the C preprocessor using the -D, -U, -I, and -H options. The degree of C standardconformance can be selected using the -X option. Refer to the description of the -X option for adescription of the set of tokens defined by the D compiler when invoking the C preprocessor.
-D
Define the specified name when invoking cpp(1) (enabled using the -C option). If an equals sign(=) and additional value are specified, the name is assigned the corresponding value. Thisoption passes the -D option to each cpp invocation.
-e
Exit after compiling any requests and consuming anonymous tracing state (-a option) but priorto enabling any probes. This option can be combined with the -a option to print anonymoustracing data and exit, or it can be combined with D compiler options to verify that the programscompile without actually executing them and enabling the corresponding instrumentation.
-f
Specify function name to trace or list (-l option). The corresponding argument can include anyof the probe description forms provider:module:function, module:function, or function.Unspecified probe description fields are left blank and match any probes regardless of the valuesin those fields. If no qualifiers other than function are specified in the description, all probeswith the corresponding function are matched. The -f argument can be suffixed with an optionalD probe clause. More than one -f option may be specified on the command-line at a time.
-F
Coalesce trace output by identifying function entry and return. Function entry probe reportsare indented and their output is prefixed with ->. Function return probe reports are unindentedand their output is prefixed with <-.
Options
Chapter 8 • dtrace(1M) Utility 151
-G
Generate an ELF file containing an embedded DTrace program. The DTrace probes specified inthe program are saved inside of a relocatable ELF object that can be linked into anotherprogram. If the -o option is present, the ELF file is saved using the pathname specified as theargument for this operand. If the -o option is not present and the DTrace program is containedwith a file whose name is filename .s, then the ELF file is saved using the name file .o; otherwisethe ELF file is saved using the name d.out.
-H
Print the pathnames of included files when invoking cpp(1) (enabled using the -C option). Thisoption passes the -H option to each cpp invocation, causing it to display the list of pathnames,one per line, to stderr.
-i
Specify probe identifier to trace or list (-l option). Probe IDs are specified using decimal integersas shown by dtrace -l. The -i argument can be suffixed with an optional D probe clause. Morethan one -i option may be specified on the command-line at a time.
-I
Add the specified directory path to the search path for #include files when invoking cpp(1)(enabled using the -C option). This option passes the -I option to each cpp invocation. Thespecified directory is inserted into the search path ahead of the default directory list.
-l
List probes instead of enabling them. If the -l option is specified, dtrace produces a report ofthe probes matching the descriptions given using the -P, -m, -f, -n, -i, and -s options. If none ofthese options are specified, all probes are listed.
-L
Add the specified directory path to the search path for DTrace libraries. DTrace libraries areused to contain common definitions that may be used when writing D programs. The specifiedpath is added after the default library search path.
-m
Specify module name to trace or list (-l option). The corresponding argument can include anyof the probe description forms provider:module or module. Unspecified probe description fieldsare left blank and match any probes regardless of the values in those fields. If no qualifiers otherthan module are specified in the description, all probes with a corresponding module arematched. The -m argument can be suffixed with an optional D probe clause. More than one -moption may be specified on the command-line at a time.
-n
Options
Oracle Solaris Dynamic Tracing Guide • November 2011 E22973_02152
Specify probe name to trace or list (-l option). The corresponding argument can include any ofthe probe description forms provider:module:function:name, module:function:name,function:name, or name. Unspecified probe description fields are left blank and match anyprobes regardless of the values in those fields. If no qualifiers other than name are specified inthe description, all probes with a corresponding name are matched. The -n argument can besuffixed with an optional D probe clause. More than one -n option may be specified on thecommand-line at a time.
-o
Specify the output file for the -A , -G, and -l options, or for the traced data. If the -A option ispresent and -o is not present, the default output file is /kernel/drv/dtrace.conf. If the -Goption is present and the -s option's argument is of the form filename .d and -o is not present,the default output file is filename .o; otherwise the default output file is d.out.
-p
Grab the specified process-ID pid, cache its symbol tables, and exit upon its completion. If morethan one -p option is present on the command line, dtrace exits when all commands haveexited, reporting the exit status for each process as it terminates. The first process-ID is madeavailable to any D programs specified on the command line or using the -s option through the$target macro variable. Refer to Chapter 9, “Scripting,” for more information on macrovariables.
-P
Specify provider name to trace or list (-l option). The remaining probe description fieldsmodule, function, and name are left blank and match any probes regardless of the values inthose fields. The -P argument can be suffixed with an optional D probe clause. More than one -Poption may be specified on the command-line at a time.
-q
Set quiet mode. dtrace will suppress messages such as the number of probes matched by thespecified options and D programs and will not print column headers, the CPU ID, the probe ID,or insert newlines into the output. Only data traced and formatted by D program statementssuch as trace and printf will be displayed to stdout.
-s
Compile the specified D program source file. If the -e option is present, the program is compiledbut no instrumentation is enabled. If the -l option is present, the program is compiled and theset of probes matched by it is listed, but no instrumentation will be enabled. If neither -e nor -lare present, the instrumentation specified by the D program is enabled and tracing begins.
-S
Show D compiler intermediate code. The D compiler will produce a report of the intermediatecode generated for each D program to stderr.
Options
Chapter 8 • dtrace(1M) Utility 153
-U
Undefine the specified name when invoking cpp(1) (enabled using the -C option). This optionpasses the -U option to each cpp invocation.
-v
Set verbose mode. If the -v option is specified, dtrace produces a program stability reportshowing the minimum interface stability and dependency level for the specified D programs.DTrace stability levels are explained in further detail in Chapter 18, “Stability.”
-V
Report the highest D programming interface version supported by dtrace. The versioninformation is printed to stdout and the dtrace command exits. See Chapter 20, “Versioning,”for more information about DTrace versioning features.
-w
Permit destructive actions in D programs specified using the -s, -P, -m, -f, -n, or -i options. If the-w option is not specified, dtrace will not permit the compilation or enabling of a D programthat contains destructive actions. Destructive actions are described in further detail inChapter 4, “Actions and Subroutines.”
-x
Enable or modify a DTrace runtime option or D compiler option. The options are listed inChapter 10, “Options and Tunables.” Boolean options are enabled by specifying their name.Options with values are set by separating the option name and value with an equals sign (=).
-X
Specify the degree of conformance to the ISO C standard that should be selected when invokingcpp(1) (enabled using the -C option). The -X option argument affects the value and presence ofthe __STDC__ macro depending upon the value of the argument letter:
a (default)
ISO C plus K&R compatibility extensions, with semantic changes required by ISO C. This modeis the default mode if -X is not specified. The predefined macro __STDC__ has a value of 0 whencpp is invoked in conjunction with the -Xa option.
c (conformance)
Strictly conformant ISO C, without K&R C compatibility extensions. The predefined macro__STDC__ has a value of 1 when cpp is invoked in conjunction with the -Xc option.
s (K&R C)
Options
Oracle Solaris Dynamic Tracing Guide • November 2011 E22973_02154
K&R C only. The macro __STDC__ is not defined when cpp is invoked in conjunction with the-Xs option.
t (transition)
ISO C plus K&R C compatibility extensions, without semantic changes required by ISO C. Thepredefined macro __STDC__ has a value of 0 when cpp is invoked in conjunction with the -Xtoption.
Because the -X option affects only how the D compiler invokes the C preprocessor, the -Xa and-Xt options are equivalent from the perspective of D. Both options are provided to ease re-use ofsettings from a C build environment.
Regardless of the -X mode, the following additional C preprocessor definitions are alwaysspecified and valid in all modes:
■ __sun
■ __unix
■ __SVR4
■ __sparc (on SPARC systems only)■ __sparcv9 (on SPARC systems only when 64–bit programs are compiled)■ __i386 (on x86 systems only when 32–bit programs are compiled)■ __amd64 (on x86 systems only when 64–bit programs are compiled)■ ___‘uname -s‘_‘uname -r‘_ (for example, __SunOS_5_10)■ __SUNW_D=1
■ __SUNW_D_VERSION=0x_MMmmmuuu_ (where _MM_ is the Major release value inhexadecimal, _mmm_ is the Minor release value in hexadecimal, and _uuu_ is the Microrelease value in hexadecimal; see Chapter 20, “Versioning,” for more information aboutDTrace versioning)
-Z
Permit probe descriptions that match zero probes. If the -Z option is not specified, dtrace willreport an error and exit if any probe descriptions specified in D program files (-s option) or onthe command-line (-P, -m, -f, -n, or -i options) contain descriptions that do not match anyknown probes.
Options
Chapter 8 • dtrace(1M) Utility 155
OperandsZero or more additional arguments may be specified on the dtrace command line to define aset of macro variables ($1, $2, and so on) to be used in any D programs specified using the -soption or on the command-line. The use of macro variables is described further in Chapter 9,“Scripting.”
Exit StatusThe following exit values are returned by the dtrace utility:
0
The specified requests were completed successfully. For D program requests, the 0 exit statusindicates that programs were successfully compiled, probes were successfully enabled, oranonymous state was successfully retrieved. dtrace returns 0 even if the specified tracingrequests encounted errors or drops.
1
A fatal error occurred. For D program requests, the 1 exit status indicates that programcompilation failed or that the specified request could not be satisfied.
2
Invalid command-line options or arguments were specified.
Operands
Oracle Solaris Dynamic Tracing Guide • November 2011 E22973_02156
Scripting
You can use the dtrace(1M) utility to create interpreter files out of D programs similar to shellscripts that you can install as reusable interactive DTrace tools. The D compiler and dtracecommand provide a set of macro variables that are expanded by the D compiler that make iteasy to create DTrace scripts. This chapter provides a reference for the macro variable facilityand tips for creating persistent scripts.
Interpreter FilesSimilar to your shell and utilities such as awk(1) and perl(1), dtrace(1M) can be used to createexecutable interpreter files. An interpreter file begins with a line of the form:
#! pathname [arg]
where pathname is the path of the interpreter and arg is a single optional argument. When aninterpreter file is executed, the system invokes the specified interpreter. If arg was specified inthe interpreter file, it is passed as an argument to the interpreter. The path to the interpreter fileitself and any additional arguments specified when it was executed are then appended to theinterpreter argument list. Therefore, you will always need to create DTrace interpreter files withat least these arguments:
#!/usr/sbin/dtrace -s
When your interpreter file is executed, the argument to the -s option will therefore be thepathname of the interpreter file itself. dtrace will then read, compile, and execute this file as ifyou had typed the following command in your shell:
# dtrace -s interpreter-file
The following example shows how to create and execute a dtrace interpreter file. Type thefollowing D source code and save it in a file named interp.d:
9C H A P T E R 9
157
#!/usr/sbin/dtrace -s
BEGIN
{
trace("hello");exit(0);
}
Mark the interp.d file as executable and execute it as follows:
# chmod a+rx interp.d
# ./interp.d
dtrace: script ’./interp.d’ matched 1 probe
CPU ID FUNCTION:NAME
1 1 :BEGIN hello
#
Remember that the #! directive must comprise the first two characters of your file with nointervening or preceding whitespace. The D compiler knows to automatically ignore this linewhen it processes the interpreter file.
dtrace uses getopt(3C) to process command-line options, so you can combine multipleoptions in your single interpreter argument. For example, to add the -q option to the precedingexample you could change the interpreter directive to:
#!/usr/sbin/dtrace -qs
If you specify multiple option letters, the -s option must always end the list of boolean optionsso that the next argument (the interpreter file name) is processed as the argumentcorresponding to the -s option.
If you need to specify more than one option that requires an argument in your interpreter file,you will not be able to fit all your options and arguments into the single interpreter argument.Instead, use the #pragma D option directive syntax to set your options. All of the dtracecommand-line options have #pragma equivalents that you can use, as shown in Chapter 10,“Options and Tunables.”
Macro VariablesThe D compiler defines a set of built-in macro variables that you can use when writing Dprograms or interpreter files. Macro variables are identifiers that are prefixed with a dollar sign($) and are expanded once by the D compiler when processing your input file. The D compilerprovides the following macro variables:
Macro Variables
Oracle Solaris Dynamic Tracing Guide • November 2011 E22973_02158
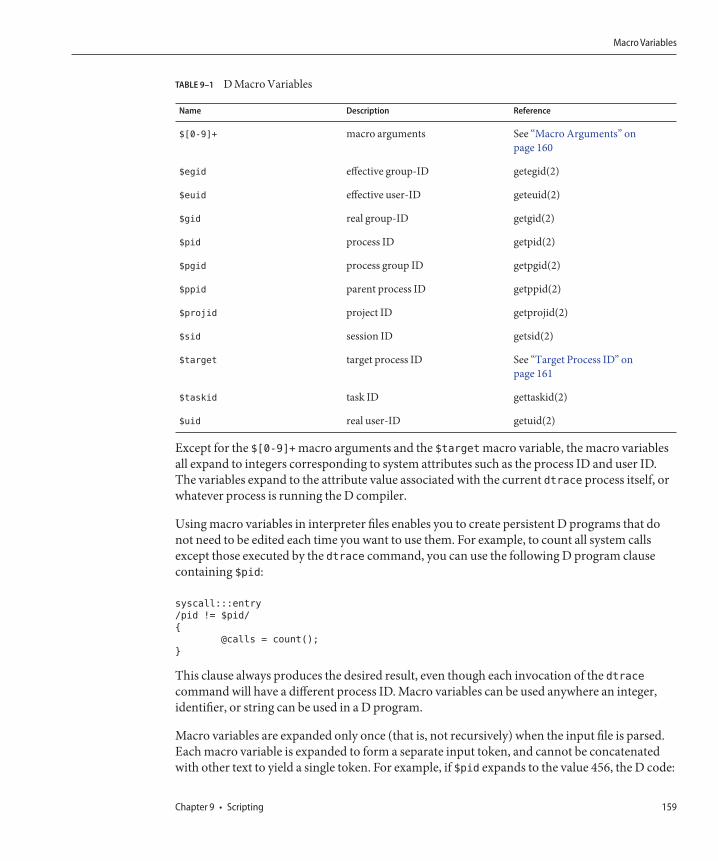
TABLE 9–1 D Macro Variables
Name Description Reference
$[0-9]+ macro arguments See “Macro Arguments” onpage 160
$egid effective group-ID getegid(2)
$euid effective user-ID geteuid(2)
$gid real group-ID getgid(2)
$pid process ID getpid(2)
$pgid process group ID getpgid(2)
$ppid parent process ID getppid(2)
$projid project ID getprojid(2)
$sid session ID getsid(2)
$target target process ID See “Target Process ID” onpage 161
$taskid task ID gettaskid(2)
$uid real user-ID getuid(2)
Except for the $[0-9]+ macro arguments and the $target macro variable, the macro variablesall expand to integers corresponding to system attributes such as the process ID and user ID.The variables expand to the attribute value associated with the current dtrace process itself, orwhatever process is running the D compiler.
Using macro variables in interpreter files enables you to create persistent D programs that donot need to be edited each time you want to use them. For example, to count all system callsexcept those executed by the dtrace command, you can use the following D program clausecontaining $pid:
syscall:::entry
/pid != $pid/
{
@calls = count();
}
This clause always produces the desired result, even though each invocation of the dtracecommand will have a different process ID. Macro variables can be used anywhere an integer,identifier, or string can be used in a D program.
Macro variables are expanded only once (that is, not recursively) when the input file is parsed.Each macro variable is expanded to form a separate input token, and cannot be concatenatedwith other text to yield a single token. For example, if $pid expands to the value 456, the D code:
Macro Variables
Chapter 9 • Scripting 159
123$pid
would expand to the two adjacent tokens 123 and 456, resulting in a syntax error, rather thanthe single integer token 123456.
Macro variables are expanded and concatenated with adjacent text inside of D probedescriptions at the start of your program clauses. For example, the following clause uses theDTrace pid provider to instrument the dtrace command:
pid$pid:libc.so:printf:entry
{
...
}
Macro variables are only expanded once within each probe description field; they may notcontain probe description delimiters (:).
Macro ArgumentsThe D compiler also provides a set of macro variables corresponding to any additionalargument operands specified as part of the dtrace command invocation. These macroarguments are accessed using the built-in names $0 for name of the D program file or dtracecommand, $1 for the first additional operand,$2 for the second operand, and so on. If you usethe dtrace -s option, $0 expands to the value of the name of the input file used with thisoption. For D programs specified on the command-line, $0 expands to the value of argv[0]used to exec dtrace itself.
Macro arguments can expand to integers, identifiers, or strings, depending on the form of thecorresponding text. As with all macro variables, macro arguments can be used anywhereinteger, identifier, and string tokens can be used in a D program. All of the following examplescould form valid D expressions assuming appropriate macro argument values:
execname == $1 /* with a string macro argument */
x += $1 /* with an integer macro argument */
trace(x->$1) /* with an identifier macro argument */
Macro arguments can be used to create dtrace interpreter files that act like real Oracle Solariscommands and use information specified by a user or by another tool to modify their behavior.For example, the following D interpreter file traces write(2) system calls executed by a particularprocess ID:
#!/usr/sbin/dtrace -s
syscall::write:entry
/pid == $1/
{
}
If you make this interpreter file executable, you can specify the value of $1 using an additionalcommand-line argument to your interpreter file:
Macro Arguments
Oracle Solaris Dynamic Tracing Guide • November 2011 E22973_02160
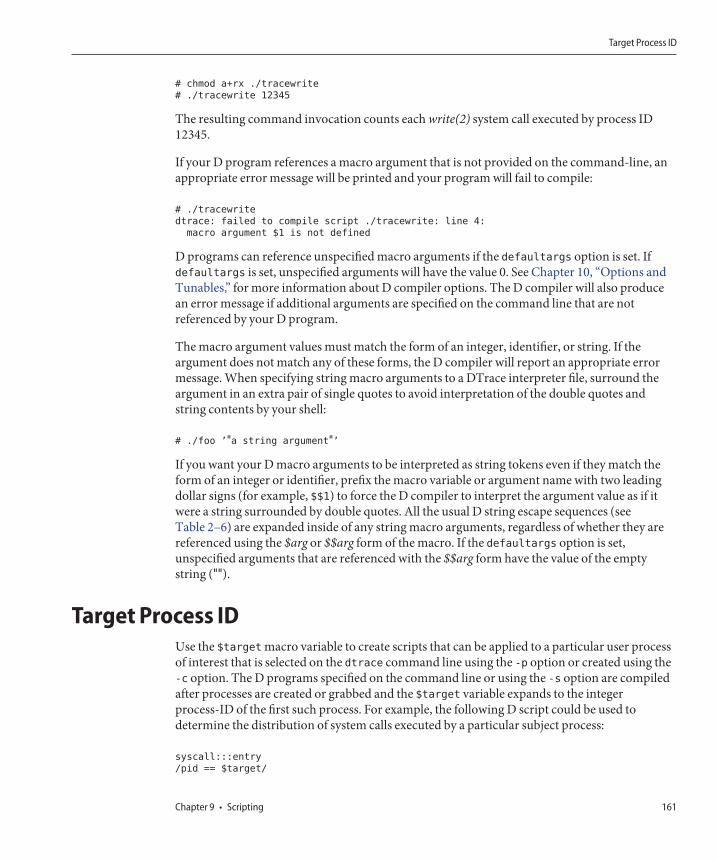
# chmod a+rx ./tracewrite
# ./tracewrite 12345
The resulting command invocation counts each write(2) system call executed by process ID12345.
If your D program references a macro argument that is not provided on the command-line, anappropriate error message will be printed and your program will fail to compile:
# ./tracewrite
dtrace: failed to compile script ./tracewrite: line 4:
macro argument $1 is not defined
D programs can reference unspecified macro arguments if the defaultargs option is set. Ifdefaultargs is set, unspecified arguments will have the value 0. See Chapter 10, “Options andTunables,” for more information about D compiler options. The D compiler will also producean error message if additional arguments are specified on the command line that are notreferenced by your D program.
The macro argument values must match the form of an integer, identifier, or string. If theargument does not match any of these forms, the D compiler will report an appropriate errormessage. When specifying string macro arguments to a DTrace interpreter file, surround theargument in an extra pair of single quotes to avoid interpretation of the double quotes andstring contents by your shell:
# ./foo ’"a string argument"’
If you want your D macro arguments to be interpreted as string tokens even if they match theform of an integer or identifier, prefix the macro variable or argument name with two leadingdollar signs (for example, $$1) to force the D compiler to interpret the argument value as if itwere a string surrounded by double quotes. All the usual D string escape sequences (seeTable 2–6) are expanded inside of any string macro arguments, regardless of whether they arereferenced using the $arg or $$arg form of the macro. If the defaultargs option is set,unspecified arguments that are referenced with the $$arg form have the value of the emptystring ("").
Target Process IDUse the $target macro variable to create scripts that can be applied to a particular user processof interest that is selected on the dtrace command line using the -p option or created using the-c option. The D programs specified on the command line or using the -s option are compiledafter processes are created or grabbed and the $target variable expands to the integerprocess-ID of the first such process. For example, the following D script could be used todetermine the distribution of system calls executed by a particular subject process:
syscall:::entry
/pid == $target/
Target Process ID
Chapter 9 • Scripting 161
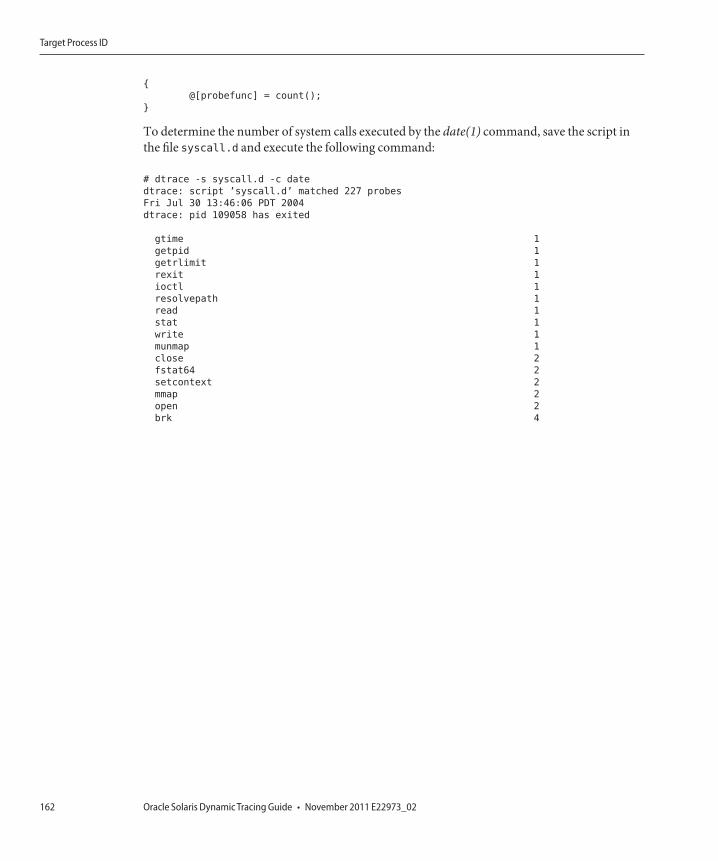
{
@[probefunc] = count();
}
To determine the number of system calls executed by the date(1) command, save the script inthe file syscall.d and execute the following command:
# dtrace -s syscall.d -c date
dtrace: script ’syscall.d’ matched 227 probes
Fri Jul 30 13:46:06 PDT 2004
dtrace: pid 109058 has exited
gtime 1
getpid 1
getrlimit 1
rexit 1
ioctl 1
resolvepath 1
read 1
stat 1
write 1
munmap 1
close 2
fstat64 2
setcontext 2
mmap 2
open 2
brk 4
Target Process ID
Oracle Solaris Dynamic Tracing Guide • November 2011 E22973_02162
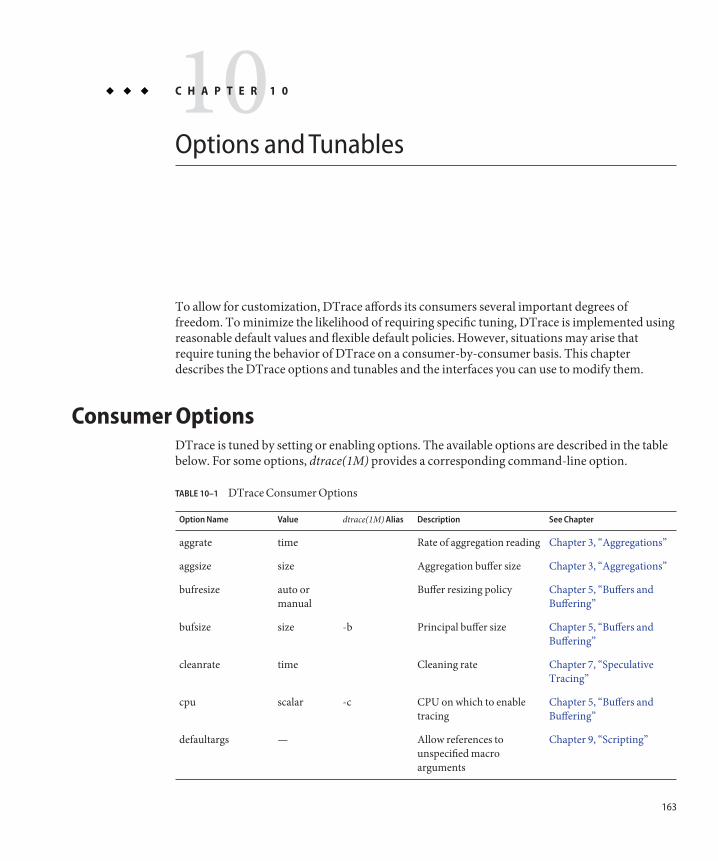
Options and Tunables
To allow for customization, DTrace affords its consumers several important degrees offreedom. To minimize the likelihood of requiring specific tuning, DTrace is implemented usingreasonable default values and flexible default policies. However, situations may arise thatrequire tuning the behavior of DTrace on a consumer-by-consumer basis. This chapterdescribes the DTrace options and tunables and the interfaces you can use to modify them.
Consumer OptionsDTrace is tuned by setting or enabling options. The available options are described in the tablebelow. For some options, dtrace(1M) provides a corresponding command-line option.
TABLE 10–1 DTrace Consumer Options
Option Name Value dtrace(1M) Alias Description See Chapter
aggrate time Rate of aggregation reading Chapter 3, “Aggregations”
aggsize size Aggregation buffer size Chapter 3, “Aggregations”
bufresize auto ormanual
Buffer resizing policy Chapter 5, “Buffers andBuffering”
bufsize size -b Principal buffer size Chapter 5, “Buffers andBuffering”
cleanrate time Cleaning rate Chapter 7, “SpeculativeTracing”
cpu scalar -c CPU on which to enabletracing
Chapter 5, “Buffers andBuffering”
defaultargs — Allow references tounspecified macroarguments
Chapter 9, “Scripting”
10C H A P T E R 1 0
163
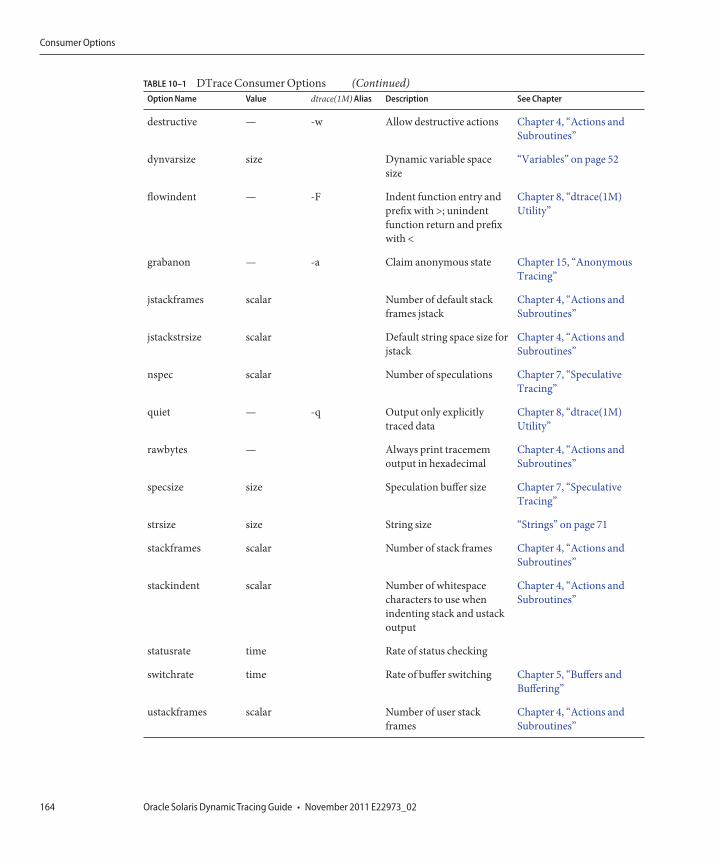
TABLE 10–1 DTrace Consumer Options (Continued)Option Name Value dtrace(1M) Alias Description See Chapter
destructive — -w Allow destructive actions Chapter 4, “Actions andSubroutines”
dynvarsize size Dynamic variable spacesize
“Variables” on page 52
flowindent — -F Indent function entry andprefix with >; unindentfunction return and prefixwith <
Chapter 8, “dtrace(1M)Utility”
grabanon — -a Claim anonymous state Chapter 15, “AnonymousTracing”
jstackframes scalar Number of default stackframes jstack
Chapter 4, “Actions andSubroutines”
jstackstrsize scalar Default string space size forjstack
Chapter 4, “Actions andSubroutines”
nspec scalar Number of speculations Chapter 7, “SpeculativeTracing”
quiet — -q Output only explicitlytraced data
Chapter 8, “dtrace(1M)Utility”
rawbytes — Always print tracememoutput in hexadecimal
Chapter 4, “Actions andSubroutines”
specsize size Speculation buffer size Chapter 7, “SpeculativeTracing”
strsize size String size “Strings” on page 71
stackframes scalar Number of stack frames Chapter 4, “Actions andSubroutines”
stackindent scalar Number of whitespacecharacters to use whenindenting stack and ustackoutput
Chapter 4, “Actions andSubroutines”
statusrate time Rate of status checking
switchrate time Rate of buffer switching Chapter 5, “Buffers andBuffering”
ustackframes scalar Number of user stackframes
Chapter 4, “Actions andSubroutines”
Consumer Options
Oracle Solaris Dynamic Tracing Guide • November 2011 E22973_02164
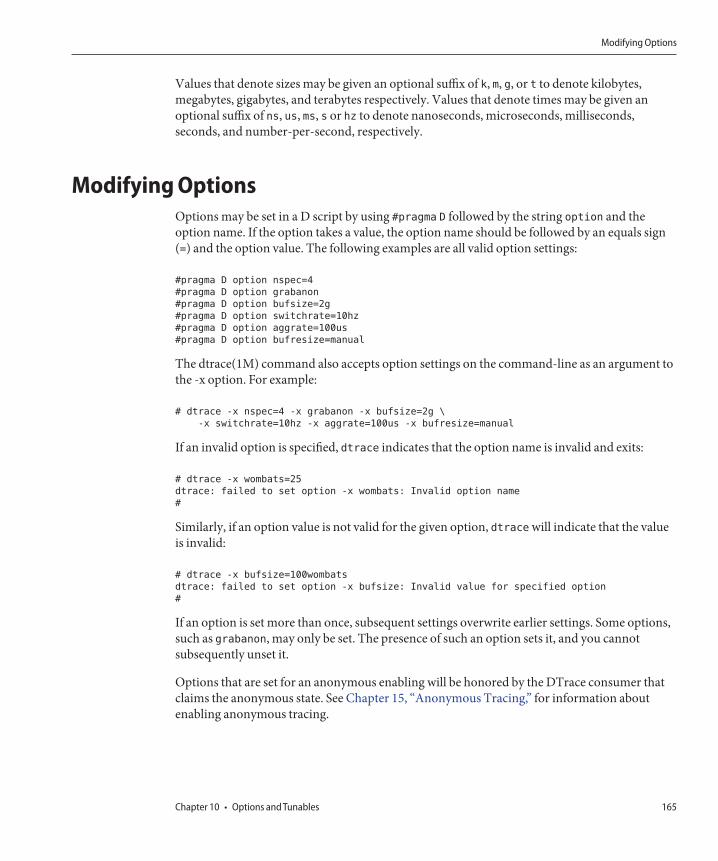
Values that denote sizes may be given an optional suffix of k, m, g, or t to denote kilobytes,megabytes, gigabytes, and terabytes respectively. Values that denote times may be given anoptional suffix of ns, us, ms, s or hz to denote nanoseconds, microseconds, milliseconds,seconds, and number-per-second, respectively.
Modifying OptionsOptions may be set in a D script by using #pragma D followed by the string option and theoption name. If the option takes a value, the option name should be followed by an equals sign(=) and the option value. The following examples are all valid option settings:
#pragma D option nspec=4
#pragma D option grabanon
#pragma D option bufsize=2g
#pragma D option switchrate=10hz
#pragma D option aggrate=100us
#pragma D option bufresize=manual
The dtrace(1M) command also accepts option settings on the command-line as an argument tothe -x option. For example:
# dtrace -x nspec=4 -x grabanon -x bufsize=2g \
-x switchrate=10hz -x aggrate=100us -x bufresize=manual
If an invalid option is specified, dtrace indicates that the option name is invalid and exits:
# dtrace -x wombats=25
dtrace: failed to set option -x wombats: Invalid option name
#
Similarly, if an option value is not valid for the given option, dtrace will indicate that the valueis invalid:
# dtrace -x bufsize=100wombats
dtrace: failed to set option -x bufsize: Invalid value for specified option
#
If an option is set more than once, subsequent settings overwrite earlier settings. Some options,such as grabanon, may only be set. The presence of such an option sets it, and you cannotsubsequently unset it.
Options that are set for an anonymous enabling will be honored by the DTrace consumer thatclaims the anonymous state. See Chapter 15, “Anonymous Tracing,” for information aboutenabling anonymous tracing.
Modifying Options
Chapter 10 • Options and Tunables 165

166
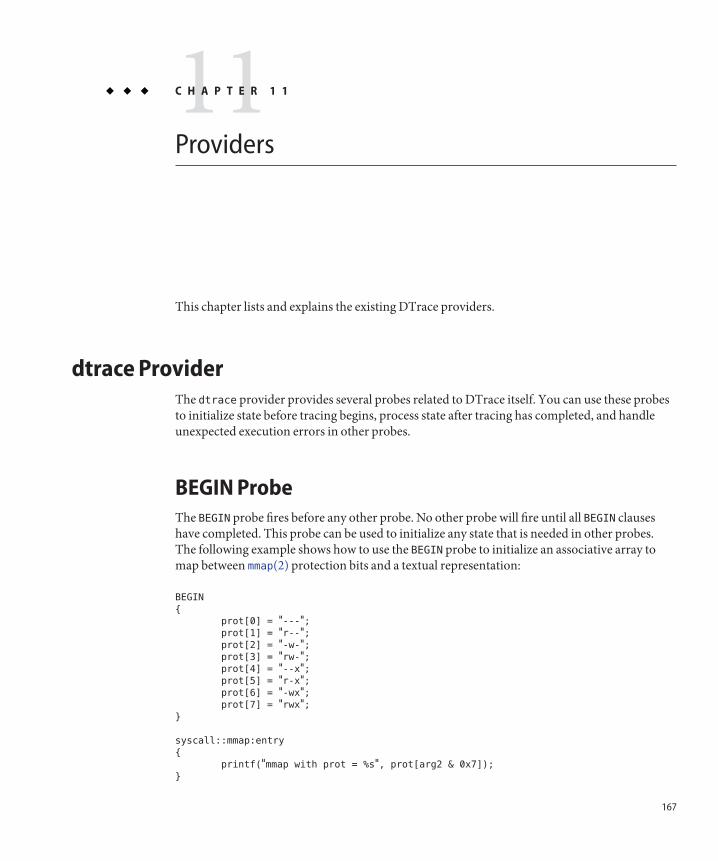
Providers
This chapter lists and explains the existing DTrace providers.
dtrace ProviderThe dtrace provider provides several probes related to DTrace itself. You can use these probesto initialize state before tracing begins, process state after tracing has completed, and handleunexpected execution errors in other probes.
BEGIN ProbeThe BEGIN probe fires before any other probe. No other probe will fire until all BEGIN clauseshave completed. This probe can be used to initialize any state that is needed in other probes.The following example shows how to use the BEGIN probe to initialize an associative array tomap between mmap(2) protection bits and a textual representation:
BEGIN
{
prot[0] = "---";prot[1] = "r--";prot[2] = "-w-";prot[3] = "rw-";prot[4] = "--x";prot[5] = "r-x";prot[6] = "-wx";prot[7] = "rwx";
}
syscall::mmap:entry
{
printf("mmap with prot = %s", prot[arg2 & 0x7]);
}
11C H A P T E R 1 1
167
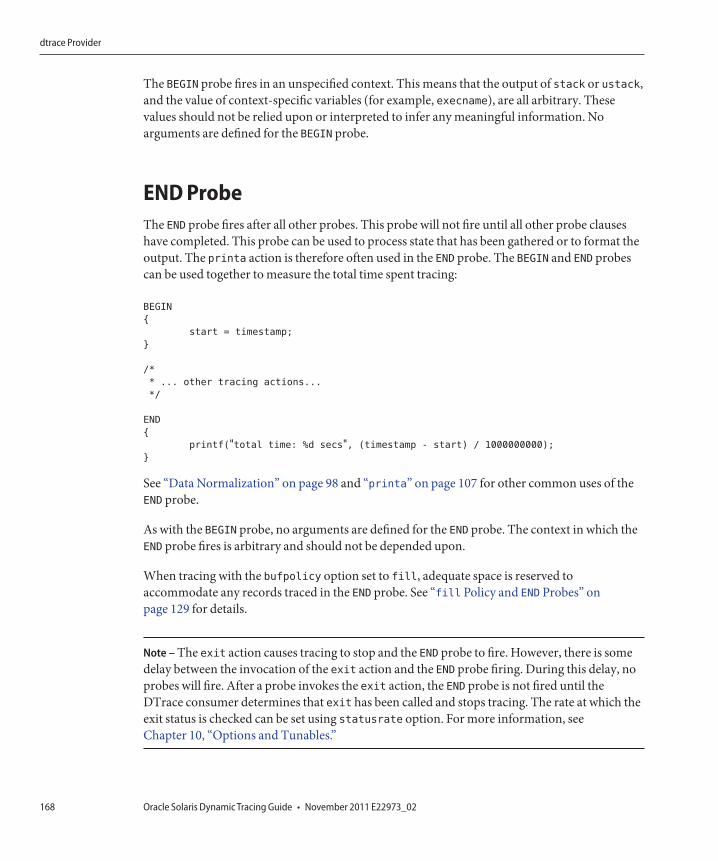
The BEGIN probe fires in an unspecified context. This means that the output of stack or ustack,and the value of context-specific variables (for example, execname), are all arbitrary. Thesevalues should not be relied upon or interpreted to infer any meaningful information. Noarguments are defined for the BEGIN probe.
END ProbeThe END probe fires after all other probes. This probe will not fire until all other probe clauseshave completed. This probe can be used to process state that has been gathered or to format theoutput. The printa action is therefore often used in the END probe. The BEGIN and END probescan be used together to measure the total time spent tracing:
BEGIN
{
start = timestamp;
}
/*
* ... other tracing actions...
*/
END
{
printf("total time: %d secs", (timestamp - start) / 1000000000);
}
See “Data Normalization” on page 98 and “printa” on page 107 for other common uses of theEND probe.
As with the BEGIN probe, no arguments are defined for the END probe. The context in which theEND probe fires is arbitrary and should not be depended upon.
When tracing with the bufpolicy option set to fill, adequate space is reserved toaccommodate any records traced in the END probe. See “fill Policy and END Probes” onpage 129 for details.
Note – The exit action causes tracing to stop and the END probe to fire. However, there is somedelay between the invocation of the exit action and the END probe firing. During this delay, noprobes will fire. After a probe invokes the exit action, the END probe is not fired until theDTrace consumer determines that exit has been called and stops tracing. The rate at which theexit status is checked can be set using statusrate option. For more information, seeChapter 10, “Options and Tunables.”
dtrace Provider
Oracle Solaris Dynamic Tracing Guide • November 2011 E22973_02168
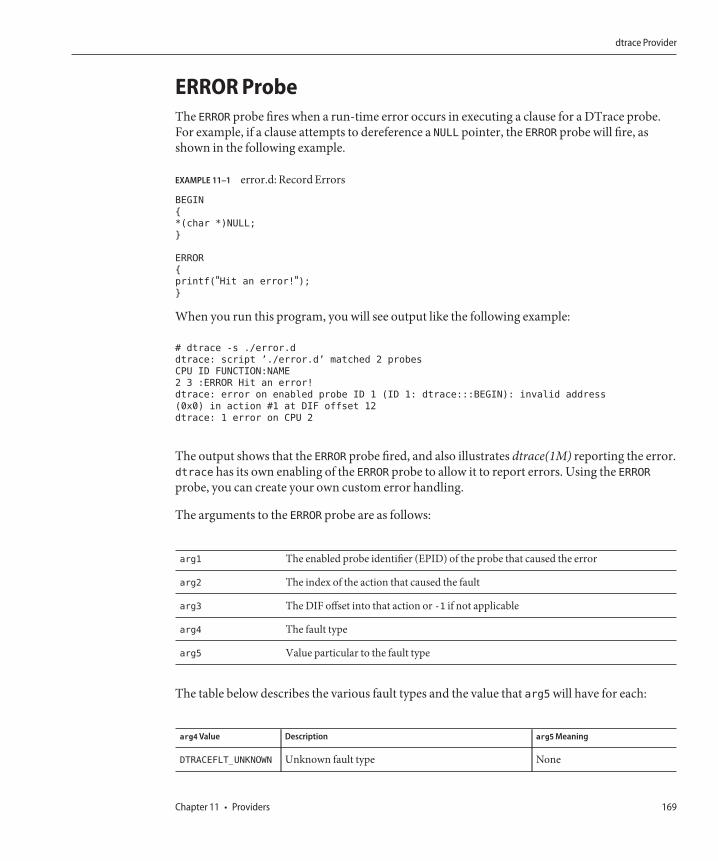
ERROR ProbeThe ERROR probe fires when a run-time error occurs in executing a clause for a DTrace probe.For example, if a clause attempts to dereference a NULL pointer, the ERROR probe will fire, asshown in the following example.
EXAMPLE 11–1 error.d: Record Errors
BEGIN
{
*(char *)NULL;
}
ERROR
{
printf("Hit an error!");}
When you run this program, you will see output like the following example:
# dtrace -s ./error.d
dtrace: script ’./error.d’ matched 2 probes
CPU ID FUNCTION:NAME
2 3 :ERROR Hit an error!
dtrace: error on enabled probe ID 1 (ID 1: dtrace:::BEGIN): invalid address
(0x0) in action #1 at DIF offset 12
dtrace: 1 error on CPU 2
The output shows that the ERROR probe fired, and also illustrates dtrace(1M) reporting the error.dtrace has its own enabling of the ERROR probe to allow it to report errors. Using the ERRORprobe, you can create your own custom error handling.
The arguments to the ERROR probe are as follows:
arg1 The enabled probe identifier (EPID) of the probe that caused the error
arg2 The index of the action that caused the fault
arg3 The DIF offset into that action or -1 if not applicable
arg4 The fault type
arg5 Value particular to the fault type
The table below describes the various fault types and the value that arg5 will have for each:
arg4Value Description arg5Meaning
DTRACEFLT_UNKNOWN Unknown fault type None
dtrace Provider
Chapter 11 • Providers 169
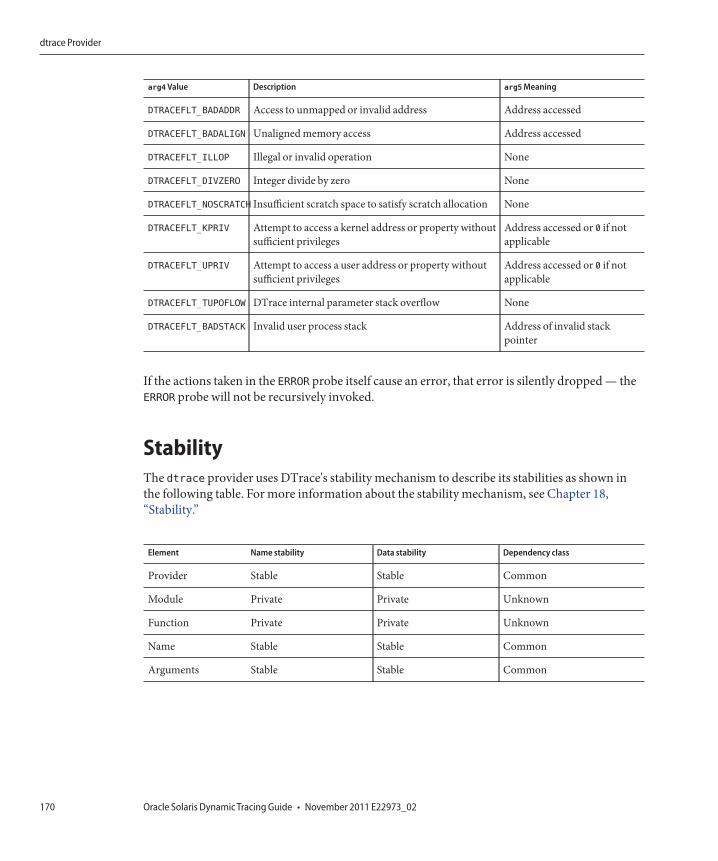
arg4Value Description arg5Meaning
DTRACEFLT_BADADDR Access to unmapped or invalid address Address accessed
DTRACEFLT_BADALIGN Unaligned memory access Address accessed
DTRACEFLT_ILLOP Illegal or invalid operation None
DTRACEFLT_DIVZERO Integer divide by zero None
DTRACEFLT_NOSCRATCH Insufficient scratch space to satisfy scratch allocation None
DTRACEFLT_KPRIV Attempt to access a kernel address or property withoutsufficient privileges
Address accessed or 0 if notapplicable
DTRACEFLT_UPRIV Attempt to access a user address or property withoutsufficient privileges
Address accessed or 0 if notapplicable
DTRACEFLT_TUPOFLOW DTrace internal parameter stack overflow None
DTRACEFLT_BADSTACK Invalid user process stack Address of invalid stackpointer
If the actions taken in the ERROR probe itself cause an error, that error is silently dropped — theERROR probe will not be recursively invoked.
StabilityThe dtrace provider uses DTrace's stability mechanism to describe its stabilities as shown inthe following table. For more information about the stability mechanism, see Chapter 18,“Stability.”
Element Name stability Data stability Dependency class
Provider Stable Stable Common
Module Private Private Unknown
Function Private Private Unknown
Name Stable Stable Common
Arguments Stable Stable Common
dtrace Provider
Oracle Solaris Dynamic Tracing Guide • November 2011 E22973_02170
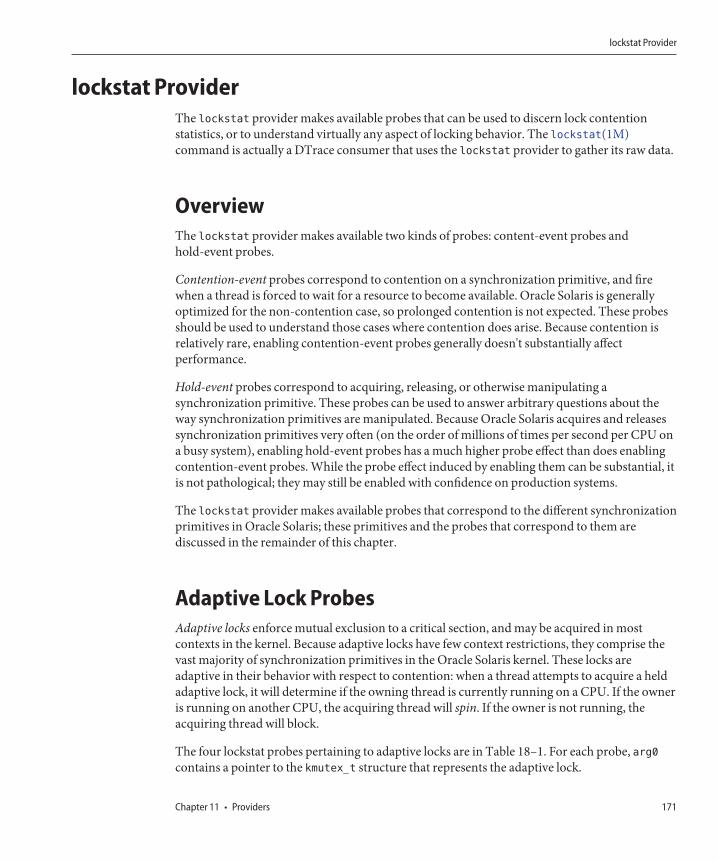
lockstat ProviderThe lockstat provider makes available probes that can be used to discern lock contentionstatistics, or to understand virtually any aspect of locking behavior. The lockstat(1M)command is actually a DTrace consumer that uses the lockstat provider to gather its raw data.
OverviewThe lockstat provider makes available two kinds of probes: content-event probes andhold-event probes.
Contention-event probes correspond to contention on a synchronization primitive, and firewhen a thread is forced to wait for a resource to become available. Oracle Solaris is generallyoptimized for the non-contention case, so prolonged contention is not expected. These probesshould be used to understand those cases where contention does arise. Because contention isrelatively rare, enabling contention-event probes generally doesn't substantially affectperformance.
Hold-event probes correspond to acquiring, releasing, or otherwise manipulating asynchronization primitive. These probes can be used to answer arbitrary questions about theway synchronization primitives are manipulated. Because Oracle Solaris acquires and releasessynchronization primitives very often (on the order of millions of times per second per CPU ona busy system), enabling hold-event probes has a much higher probe effect than does enablingcontention-event probes. While the probe effect induced by enabling them can be substantial, itis not pathological; they may still be enabled with confidence on production systems.
The lockstat provider makes available probes that correspond to the different synchronizationprimitives in Oracle Solaris; these primitives and the probes that correspond to them arediscussed in the remainder of this chapter.
Adaptive Lock ProbesAdaptive locks enforce mutual exclusion to a critical section, and may be acquired in mostcontexts in the kernel. Because adaptive locks have few context restrictions, they comprise thevast majority of synchronization primitives in the Oracle Solaris kernel. These locks areadaptive in their behavior with respect to contention: when a thread attempts to acquire a heldadaptive lock, it will determine if the owning thread is currently running on a CPU. If the owneris running on another CPU, the acquiring thread will spin. If the owner is not running, theacquiring thread will block.
The four lockstat probes pertaining to adaptive locks are in Table 18–1. For each probe, arg0contains a pointer to the kmutex_t structure that represents the adaptive lock.
lockstat Provider
Chapter 11 • Providers 171
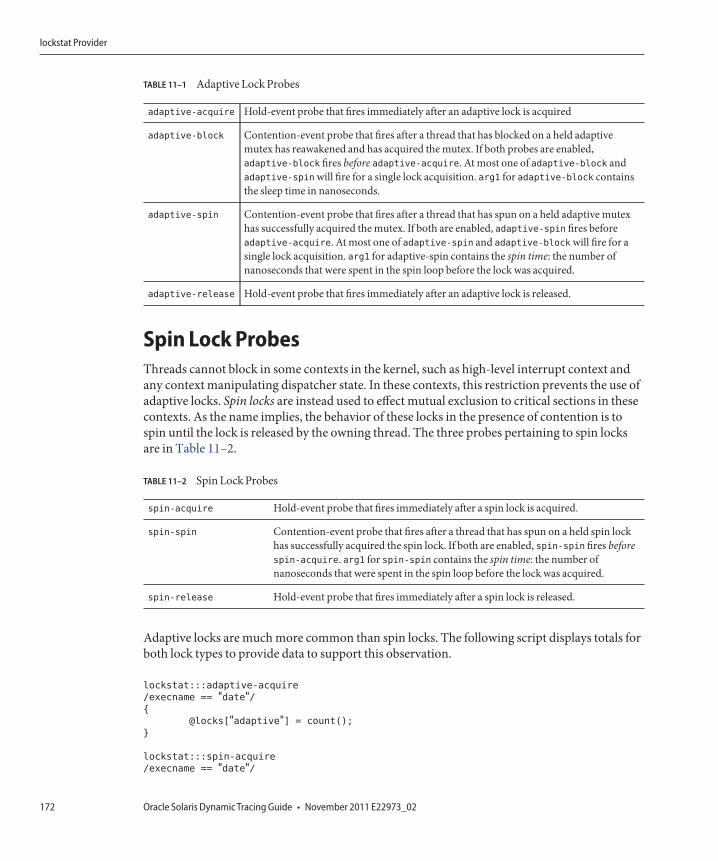
TABLE 11–1 Adaptive Lock Probes
adaptive-acquire Hold-event probe that fires immediately after an adaptive lock is acquired
adaptive-block Contention-event probe that fires after a thread that has blocked on a held adaptivemutex has reawakened and has acquired the mutex. If both probes are enabled,adaptive-block fires before adaptive-acquire. At most one of adaptive-block andadaptive-spin will fire for a single lock acquisition. arg1 for adaptive-block containsthe sleep time in nanoseconds.
adaptive-spin Contention-event probe that fires after a thread that has spun on a held adaptive mutexhas successfully acquired the mutex. If both are enabled, adaptive-spin fires beforeadaptive-acquire. At most one of adaptive-spin and adaptive-block will fire for asingle lock acquisition. arg1 for adaptive-spin contains the spin time: the number ofnanoseconds that were spent in the spin loop before the lock was acquired.
adaptive-release Hold-event probe that fires immediately after an adaptive lock is released.
Spin Lock ProbesThreads cannot block in some contexts in the kernel, such as high-level interrupt context andany context manipulating dispatcher state. In these contexts, this restriction prevents the use ofadaptive locks. Spin locks are instead used to effect mutual exclusion to critical sections in thesecontexts. As the name implies, the behavior of these locks in the presence of contention is tospin until the lock is released by the owning thread. The three probes pertaining to spin locksare in Table 11–2.
TABLE 11–2 Spin Lock Probes
spin-acquire Hold-event probe that fires immediately after a spin lock is acquired.
spin-spin Contention-event probe that fires after a thread that has spun on a held spin lockhas successfully acquired the spin lock. If both are enabled, spin-spin fires beforespin-acquire. arg1 for spin-spin contains the spin time: the number ofnanoseconds that were spent in the spin loop before the lock was acquired.
spin-release Hold-event probe that fires immediately after a spin lock is released.
Adaptive locks are much more common than spin locks. The following script displays totals forboth lock types to provide data to support this observation.
lockstat:::adaptive-acquire
/execname == "date"/{
@locks["adaptive"] = count();
}
lockstat:::spin-acquire
/execname == "date"/
lockstat Provider
Oracle Solaris Dynamic Tracing Guide • November 2011 E22973_02172
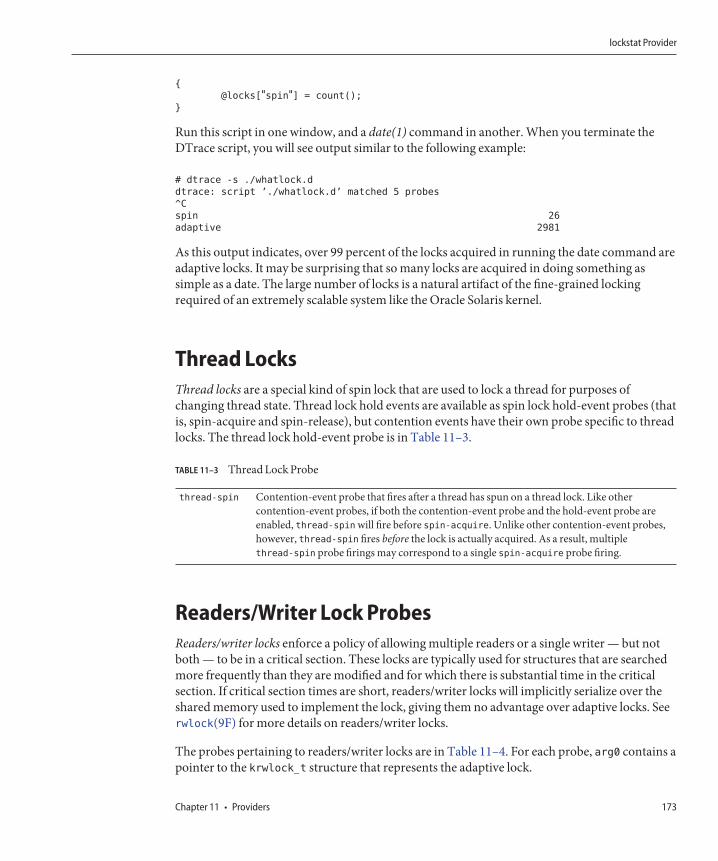
{
@locks["spin"] = count();
}
Run this script in one window, and a date(1) command in another. When you terminate theDTrace script, you will see output similar to the following example:
# dtrace -s ./whatlock.d
dtrace: script ’./whatlock.d’ matched 5 probes
^C
spin 26
adaptive 2981
As this output indicates, over 99 percent of the locks acquired in running the date command areadaptive locks. It may be surprising that so many locks are acquired in doing something assimple as a date. The large number of locks is a natural artifact of the fine-grained lockingrequired of an extremely scalable system like the Oracle Solaris kernel.
Thread LocksThread locks are a special kind of spin lock that are used to lock a thread for purposes ofchanging thread state. Thread lock hold events are available as spin lock hold-event probes (thatis, spin-acquire and spin-release), but contention events have their own probe specific to threadlocks. The thread lock hold-event probe is in Table 11–3.
TABLE 11–3 Thread Lock Probe
thread-spin Contention-event probe that fires after a thread has spun on a thread lock. Like othercontention-event probes, if both the contention-event probe and the hold-event probe areenabled, thread-spin will fire before spin-acquire. Unlike other contention-event probes,however, thread-spin fires before the lock is actually acquired. As a result, multiplethread-spin probe firings may correspond to a single spin-acquire probe firing.
Readers/Writer Lock ProbesReaders/writer locks enforce a policy of allowing multiple readers or a single writer — but notboth — to be in a critical section. These locks are typically used for structures that are searchedmore frequently than they are modified and for which there is substantial time in the criticalsection. If critical section times are short, readers/writer locks will implicitly serialize over theshared memory used to implement the lock, giving them no advantage over adaptive locks. Seerwlock(9F) for more details on readers/writer locks.
The probes pertaining to readers/writer locks are in Table 11–4. For each probe, arg0 contains apointer to the krwlock_t structure that represents the adaptive lock.
lockstat Provider
Chapter 11 • Providers 173
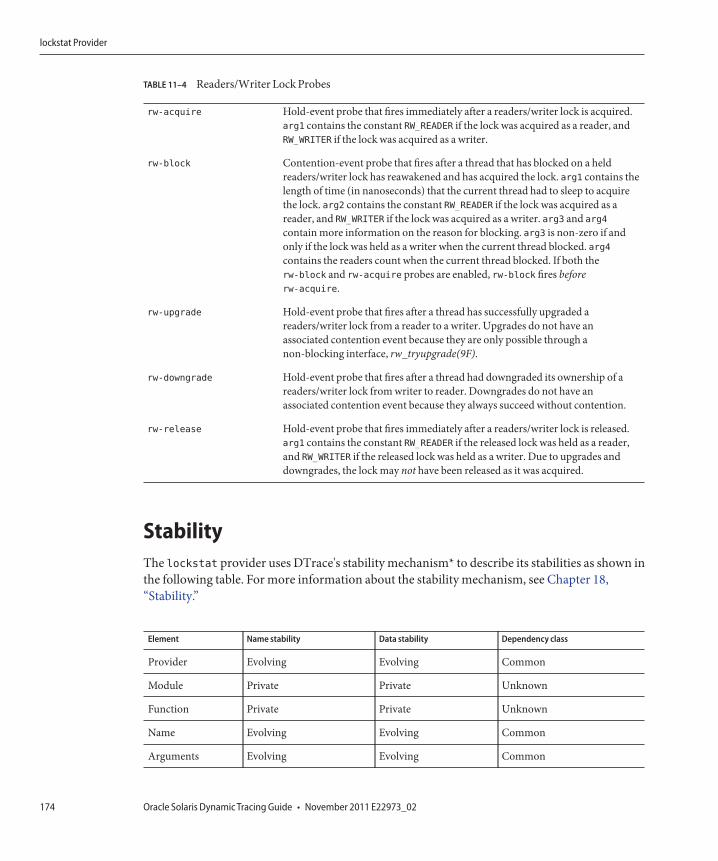
TABLE 11–4 Readers/Writer Lock Probes
rw-acquire Hold-event probe that fires immediately after a readers/writer lock is acquired.arg1 contains the constant RW_READER if the lock was acquired as a reader, andRW_WRITER if the lock was acquired as a writer.
rw-block Contention-event probe that fires after a thread that has blocked on a heldreaders/writer lock has reawakened and has acquired the lock. arg1 contains thelength of time (in nanoseconds) that the current thread had to sleep to acquirethe lock. arg2 contains the constant RW_READER if the lock was acquired as areader, and RW_WRITER if the lock was acquired as a writer. arg3 and arg4
contain more information on the reason for blocking. arg3 is non-zero if andonly if the lock was held as a writer when the current thread blocked. arg4contains the readers count when the current thread blocked. If both therw-block and rw-acquire probes are enabled, rw-block fires beforerw-acquire.
rw-upgrade Hold-event probe that fires after a thread has successfully upgraded areaders/writer lock from a reader to a writer. Upgrades do not have anassociated contention event because they are only possible through anon-blocking interface, rw_tryupgrade(9F).
rw-downgrade Hold-event probe that fires after a thread had downgraded its ownership of areaders/writer lock from writer to reader. Downgrades do not have anassociated contention event because they always succeed without contention.
rw-release Hold-event probe that fires immediately after a readers/writer lock is released.arg1 contains the constant RW_READER if the released lock was held as a reader,and RW_WRITER if the released lock was held as a writer. Due to upgrades anddowngrades, the lock may not have been released as it was acquired.
StabilityThe lockstat provider uses DTrace's stability mechanism* to describe its stabilities as shown inthe following table. For more information about the stability mechanism, see Chapter 18,“Stability.”
Element Name stability Data stability Dependency class
Provider Evolving Evolving Common
Module Private Private Unknown
Function Private Private Unknown
Name Evolving Evolving Common
Arguments Evolving Evolving Common
lockstat Provider
Oracle Solaris Dynamic Tracing Guide • November 2011 E22973_02174
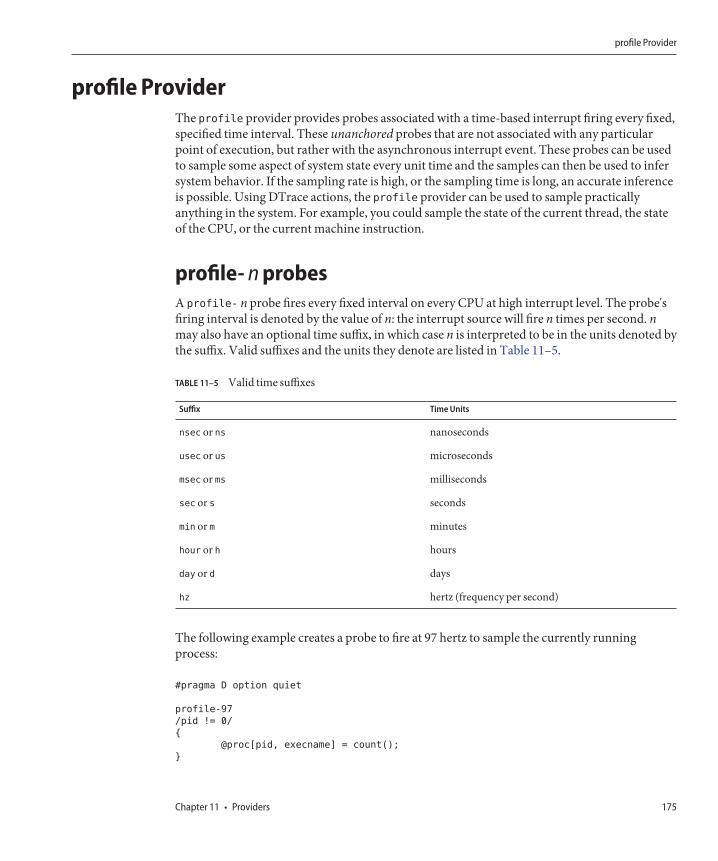
profile ProviderThe profile provider provides probes associated with a time-based interrupt firing every fixed,specified time interval. These unanchored probes that are not associated with any particularpoint of execution, but rather with the asynchronous interrupt event. These probes can be usedto sample some aspect of system state every unit time and the samples can then be used to infersystem behavior. If the sampling rate is high, or the sampling time is long, an accurate inferenceis possible. Using DTrace actions, the profile provider can be used to sample practicallyanything in the system. For example, you could sample the state of the current thread, the stateof the CPU, or the current machine instruction.
profile- n probesA profile- n probe fires every fixed interval on every CPU at high interrupt level. The probe'sfiring interval is denoted by the value of n: the interrupt source will fire n times per second. nmay also have an optional time suffix, in which case n is interpreted to be in the units denoted bythe suffix. Valid suffixes and the units they denote are listed in Table 11–5.
TABLE 11–5 Valid time suffixes
Suffix Time Units
nsec or ns nanoseconds
usec or us microseconds
msec or ms milliseconds
sec or s seconds
min or m minutes
hour or h hours
day or d days
hz hertz (frequency per second)
The following example creates a probe to fire at 97 hertz to sample the currently runningprocess:
#pragma D option quiet
profile-97
/pid != 0/
{
@proc[pid, execname] = count();
}
profile Provider
Chapter 11 • Providers 175
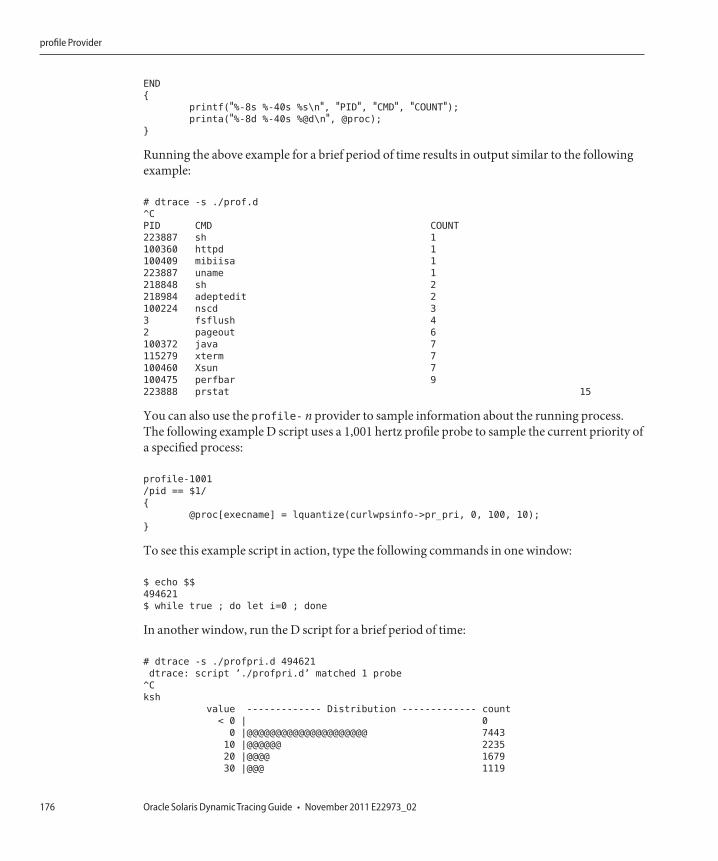
END
{
printf("%-8s %-40s %s\n", "PID", "CMD", "COUNT");printa("%-8d %-40s %@d\n", @proc);
}
Running the above example for a brief period of time results in output similar to the followingexample:
# dtrace -s ./prof.d
^C
PID CMD COUNT
223887 sh 1
100360 httpd 1
100409 mibiisa 1
223887 uname 1
218848 sh 2
218984 adeptedit 2
100224 nscd 3
3 fsflush 4
2 pageout 6
100372 java 7
115279 xterm 7
100460 Xsun 7
100475 perfbar 9
223888 prstat 15
You can also use the profile- n provider to sample information about the running process.The following example D script uses a 1,001 hertz profile probe to sample the current priority ofa specified process:
profile-1001
/pid == $1/
{
@proc[execname] = lquantize(curlwpsinfo->pr_pri, 0, 100, 10);
}
To see this example script in action, type the following commands in one window:
$ echo $$
494621
$ while true ; do let i=0 ; done
In another window, run the D script for a brief period of time:
# dtrace -s ./profpri.d 494621
dtrace: script ’./profpri.d’ matched 1 probe
^C
ksh
value ------------- Distribution ------------- count
< 0 | 0
0 |@@@@@@@@@@@@@@@@@@@@@ 7443
10 |@@@@@@ 2235
20 |@@@@ 1679
30 |@@@ 1119
profile Provider
Oracle Solaris Dynamic Tracing Guide • November 2011 E22973_02176
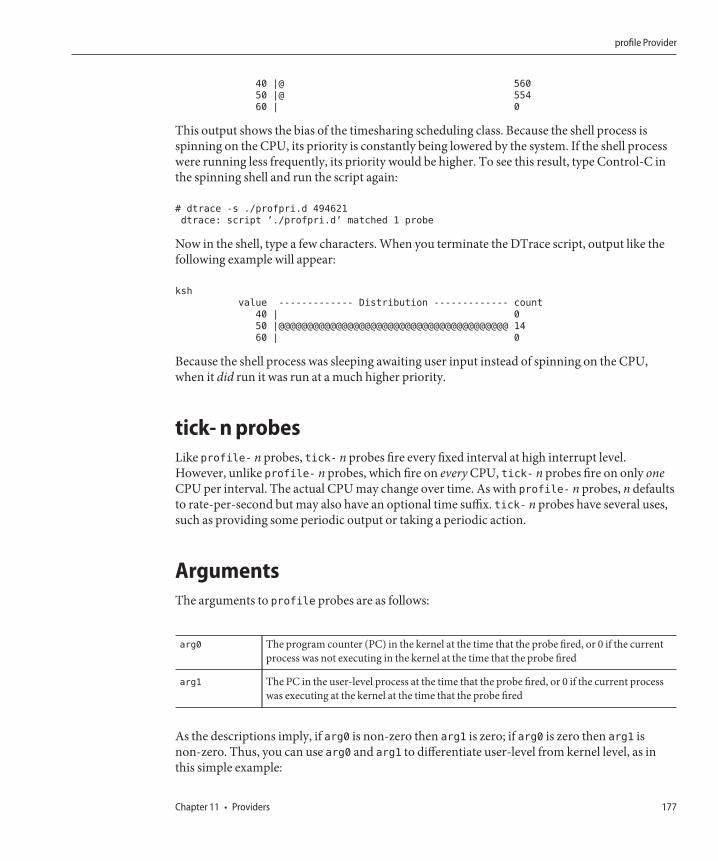
40 |@ 560
50 |@ 554
60 | 0
This output shows the bias of the timesharing scheduling class. Because the shell process isspinning on the CPU, its priority is constantly being lowered by the system. If the shell processwere running less frequently, its priority would be higher. To see this result, type Control-C inthe spinning shell and run the script again:
# dtrace -s ./profpri.d 494621
dtrace: script ’./profpri.d’ matched 1 probe
Now in the shell, type a few characters. When you terminate the DTrace script, output like thefollowing example will appear:
ksh
value ------------- Distribution ------------- count
40 | 0
50 |@@@@@@@@@@@@@@@@@@@@@@@@@@@@@@@@@@@@@@@@ 14
60 | 0
Because the shell process was sleeping awaiting user input instead of spinning on the CPU,when it did run it was run at a much higher priority.
tick- n probesLike profile- n probes, tick- n probes fire every fixed interval at high interrupt level.However, unlike profile- n probes, which fire on every CPU, tick- n probes fire on only oneCPU per interval. The actual CPU may change over time. As with profile- n probes, n defaultsto rate-per-second but may also have an optional time suffix. tick- n probes have several uses,such as providing some periodic output or taking a periodic action.
ArgumentsThe arguments to profile probes are as follows:
arg0 The program counter (PC) in the kernel at the time that the probe fired, or 0 if the currentprocess was not executing in the kernel at the time that the probe fired
arg1 The PC in the user-level process at the time that the probe fired, or 0 if the current processwas executing at the kernel at the time that the probe fired
As the descriptions imply, if arg0 is non-zero then arg1 is zero; if arg0 is zero then arg1 isnon-zero. Thus, you can use arg0 and arg1 to differentiate user-level from kernel level, as inthis simple example:
profile Provider
Chapter 11 • Providers 177
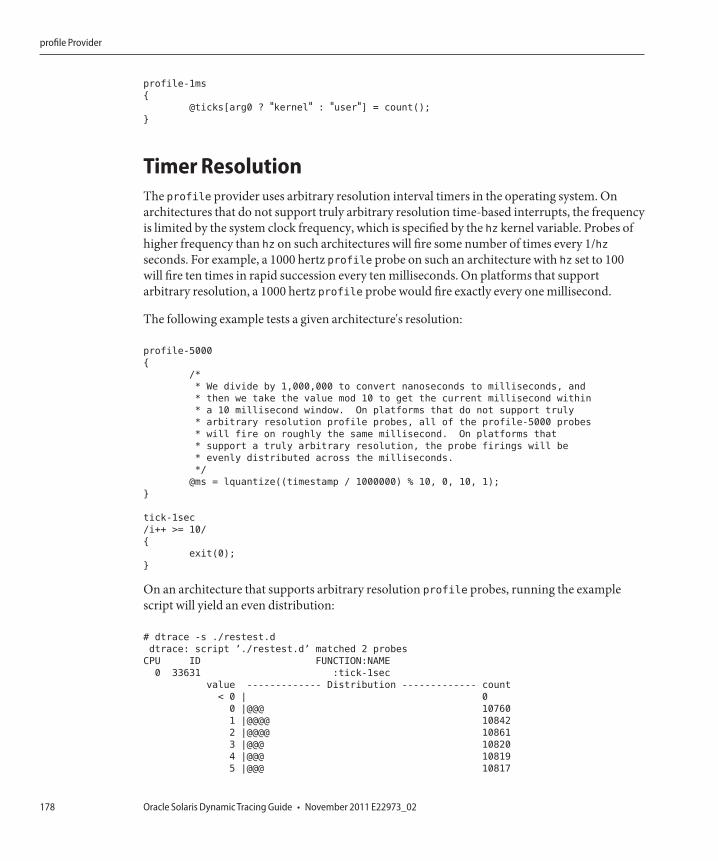
profile-1ms
{
@ticks[arg0 ? "kernel" : "user"] = count();
}
Timer ResolutionThe profile provider uses arbitrary resolution interval timers in the operating system. Onarchitectures that do not support truly arbitrary resolution time-based interrupts, the frequencyis limited by the system clock frequency, which is specified by the hz kernel variable. Probes ofhigher frequency than hz on such architectures will fire some number of times every 1/hzseconds. For example, a 1000 hertz profile probe on such an architecture with hz set to 100will fire ten times in rapid succession every ten milliseconds. On platforms that supportarbitrary resolution, a 1000 hertz profile probe would fire exactly every one millisecond.
The following example tests a given architecture's resolution:
profile-5000
{
/*
* We divide by 1,000,000 to convert nanoseconds to milliseconds, and
* then we take the value mod 10 to get the current millisecond within
* a 10 millisecond window. On platforms that do not support truly
* arbitrary resolution profile probes, all of the profile-5000 probes
* will fire on roughly the same millisecond. On platforms that
* support a truly arbitrary resolution, the probe firings will be
* evenly distributed across the milliseconds.
*/
@ms = lquantize((timestamp / 1000000) % 10, 0, 10, 1);
}
tick-1sec
/i++ >= 10/
{
exit(0);
}
On an architecture that supports arbitrary resolution profile probes, running the examplescript will yield an even distribution:
# dtrace -s ./restest.d
dtrace: script ’./restest.d’ matched 2 probes
CPU ID FUNCTION:NAME
0 33631 :tick-1sec
value ------------- Distribution ------------- count
< 0 | 0
0 |@@@ 10760
1 |@@@@ 10842
2 |@@@@ 10861
3 |@@@ 10820
4 |@@@ 10819
5 |@@@ 10817
profile Provider
Oracle Solaris Dynamic Tracing Guide • November 2011 E22973_02178
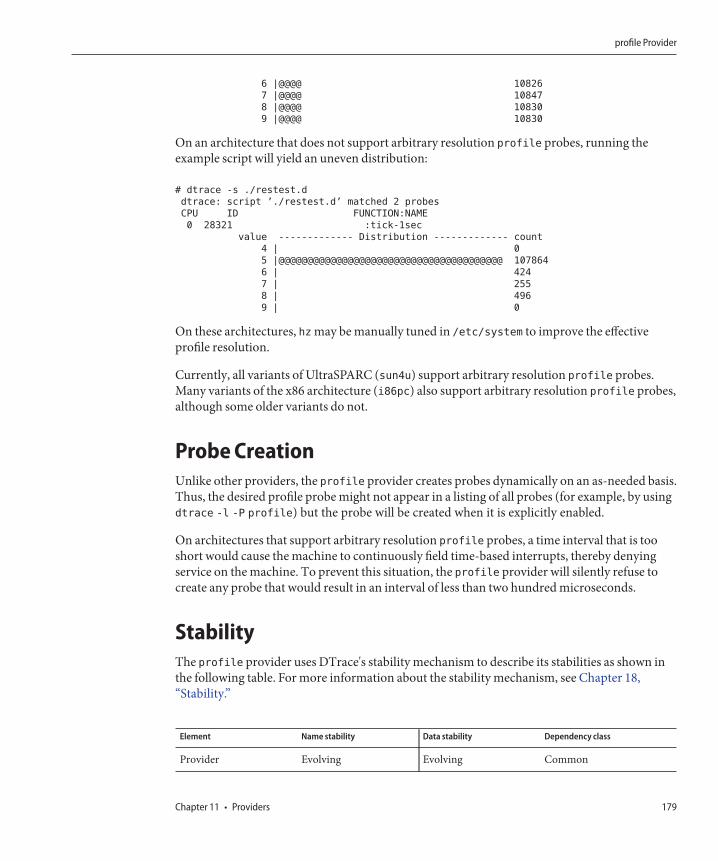
6 |@@@@ 10826
7 |@@@@ 10847
8 |@@@@ 10830
9 |@@@@ 10830
On an architecture that does not support arbitrary resolution profile probes, running theexample script will yield an uneven distribution:
# dtrace -s ./restest.d
dtrace: script ’./restest.d’ matched 2 probes
CPU ID FUNCTION:NAME
0 28321 :tick-1sec
value ------------- Distribution ------------- count
4 | 0
5 |@@@@@@@@@@@@@@@@@@@@@@@@@@@@@@@@@@@@@@@ 107864
6 | 424
7 | 255
8 | 496
9 | 0
On these architectures, hz may be manually tuned in /etc/system to improve the effectiveprofile resolution.
Currently, all variants of UltraSPARC (sun4u) support arbitrary resolution profile probes.Many variants of the x86 architecture (i86pc) also support arbitrary resolution profile probes,although some older variants do not.
Probe CreationUnlike other providers, the profile provider creates probes dynamically on an as-needed basis.Thus, the desired profile probe might not appear in a listing of all probes (for example, by usingdtrace -l -P profile) but the probe will be created when it is explicitly enabled.
On architectures that support arbitrary resolution profile probes, a time interval that is tooshort would cause the machine to continuously field time-based interrupts, thereby denyingservice on the machine. To prevent this situation, the profile provider will silently refuse tocreate any probe that would result in an interval of less than two hundred microseconds.
StabilityThe profile provider uses DTrace's stability mechanism to describe its stabilities as shown inthe following table. For more information about the stability mechanism, see Chapter 18,“Stability.”
Element Name stability Data stability Dependency class
Provider Evolving Evolving Common
profile Provider
Chapter 11 • Providers 179
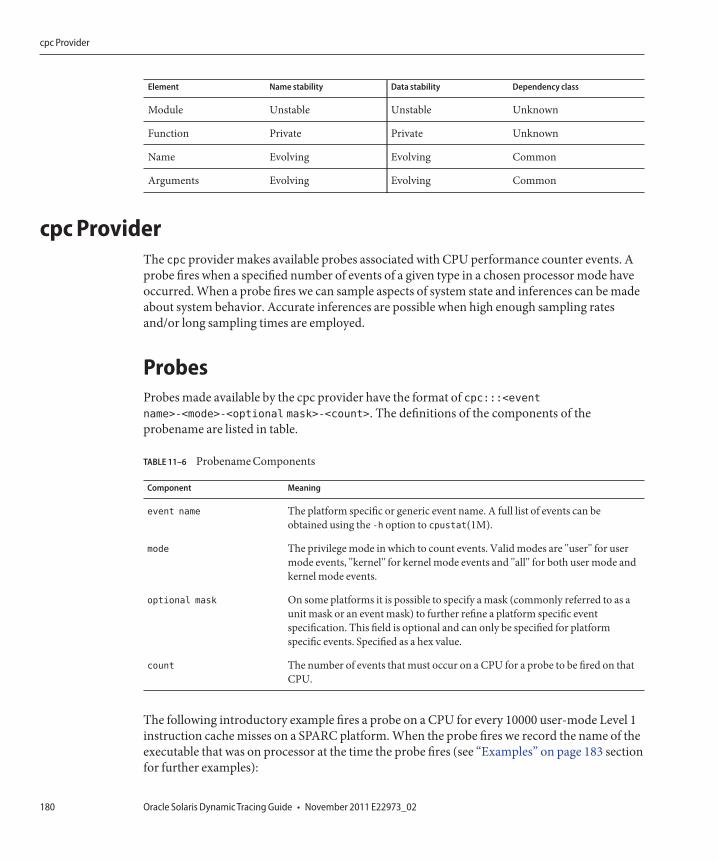
Element Name stability Data stability Dependency class
Module Unstable Unstable Unknown
Function Private Private Unknown
Name Evolving Evolving Common
Arguments Evolving Evolving Common
cpc ProviderThe cpc provider makes available probes associated with CPU performance counter events. Aprobe fires when a specified number of events of a given type in a chosen processor mode haveoccurred. When a probe fires we can sample aspects of system state and inferences can be madeabout system behavior. Accurate inferences are possible when high enough sampling ratesand/or long sampling times are employed.
ProbesProbes made available by the cpc provider have the format of cpc:::<eventname>-<mode>-<optional mask>-<count>. The definitions of the components of theprobename are listed in table.
TABLE 11–6 Probename Components
Component Meaning
event name The platform specific or generic event name. A full list of events can beobtained using the -h option to cpustat(1M).
mode The privilege mode in which to count events. Valid modes are "user" for usermode events, "kernel" for kernel mode events and "all" for both user mode andkernel mode events.
optional mask On some platforms it is possible to specify a mask (commonly referred to as aunit mask or an event mask) to further refine a platform specific eventspecification. This field is optional and can only be specified for platformspecific events. Specified as a hex value.
count The number of events that must occur on a CPU for a probe to be fired on thatCPU.
The following introductory example fires a probe on a CPU for every 10000 user-mode Level 1instruction cache misses on a SPARC platform. When the probe fires we record the name of theexecutable that was on processor at the time the probe fires (see “Examples” on page 183 sectionfor further examples):
cpc Provider
Oracle Solaris Dynamic Tracing Guide • November 2011 E22973_02180
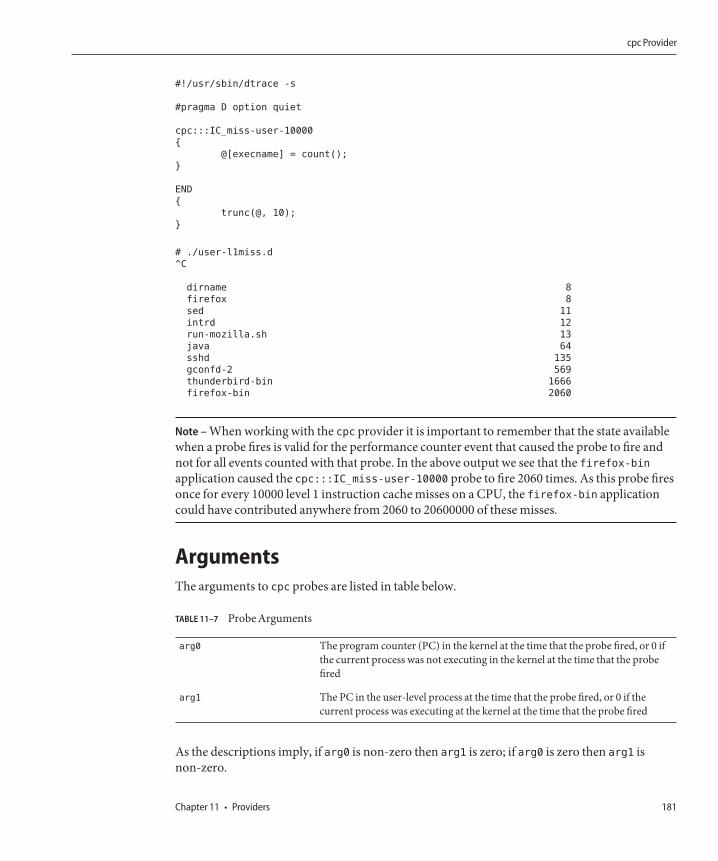
#!/usr/sbin/dtrace -s
#pragma D option quiet
cpc:::IC_miss-user-10000
{
@[execname] = count();
}
END
{
trunc(@, 10);
}
# ./user-l1miss.d
^C
dirname 8
firefox 8
sed 11
intrd 12
run-mozilla.sh 13
java 64
sshd 135
gconfd-2 569
thunderbird-bin 1666
firefox-bin 2060
Note – When working with the cpc provider it is important to remember that the state availablewhen a probe fires is valid for the performance counter event that caused the probe to fire andnot for all events counted with that probe. In the above output we see that the firefox-binapplication caused the cpc:::IC_miss-user-10000 probe to fire 2060 times. As this probe firesonce for every 10000 level 1 instruction cache misses on a CPU, the firefox-bin applicationcould have contributed anywhere from 2060 to 20600000 of these misses.
ArgumentsThe arguments to cpc probes are listed in table below.
TABLE 11–7 Probe Arguments
arg0 The program counter (PC) in the kernel at the time that the probe fired, or 0 ifthe current process was not executing in the kernel at the time that the probefired
arg1 The PC in the user-level process at the time that the probe fired, or 0 if thecurrent process was executing at the kernel at the time that the probe fired
As the descriptions imply, if arg0 is non-zero then arg1 is zero; if arg0 is zero then arg1 isnon-zero.
cpc Provider
Chapter 11 • Providers 181
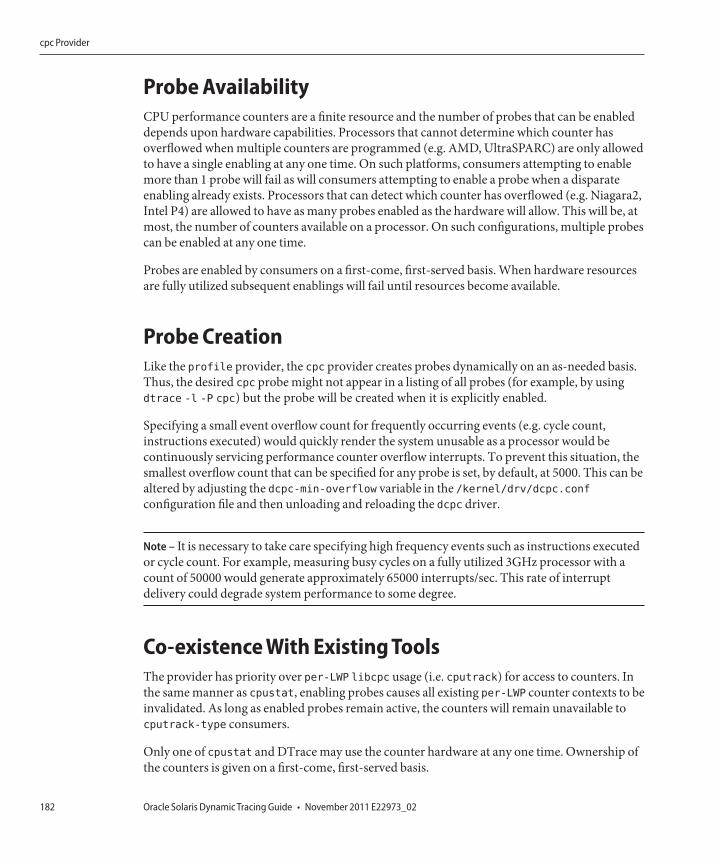
Probe AvailabilityCPU performance counters are a finite resource and the number of probes that can be enableddepends upon hardware capabilities. Processors that cannot determine which counter hasoverflowed when multiple counters are programmed (e.g. AMD, UltraSPARC) are only allowedto have a single enabling at any one time. On such platforms, consumers attempting to enablemore than 1 probe will fail as will consumers attempting to enable a probe when a disparateenabling already exists. Processors that can detect which counter has overflowed (e.g. Niagara2,Intel P4) are allowed to have as many probes enabled as the hardware will allow. This will be, atmost, the number of counters available on a processor. On such configurations, multiple probescan be enabled at any one time.
Probes are enabled by consumers on a first-come, first-served basis. When hardware resourcesare fully utilized subsequent enablings will fail until resources become available.
Probe CreationLike the profile provider, the cpc provider creates probes dynamically on an as-needed basis.Thus, the desired cpc probe might not appear in a listing of all probes (for example, by usingdtrace -l -P cpc) but the probe will be created when it is explicitly enabled.
Specifying a small event overflow count for frequently occurring events (e.g. cycle count,instructions executed) would quickly render the system unusable as a processor would becontinuously servicing performance counter overflow interrupts. To prevent this situation, thesmallest overflow count that can be specified for any probe is set, by default, at 5000. This can bealtered by adjusting the dcpc-min-overflow variable in the /kernel/drv/dcpc.confconfiguration file and then unloading and reloading the dcpc driver.
Note – It is necessary to take care specifying high frequency events such as instructions executedor cycle count. For example, measuring busy cycles on a fully utilized 3GHz processor with acount of 50000 would generate approximately 65000 interrupts/sec. This rate of interruptdelivery could degrade system performance to some degree.
Co-existence With Existing ToolsThe provider has priority over per-LWP libcpc usage (i.e. cputrack) for access to counters. Inthe same manner as cpustat, enabling probes causes all existing per-LWP counter contexts to beinvalidated. As long as enabled probes remain active, the counters will remain unavailable tocputrack-type consumers.
Only one of cpustat and DTrace may use the counter hardware at any one time. Ownership ofthe counters is given on a first-come, first-served basis.
cpc Provider
Oracle Solaris Dynamic Tracing Guide • November 2011 E22973_02182
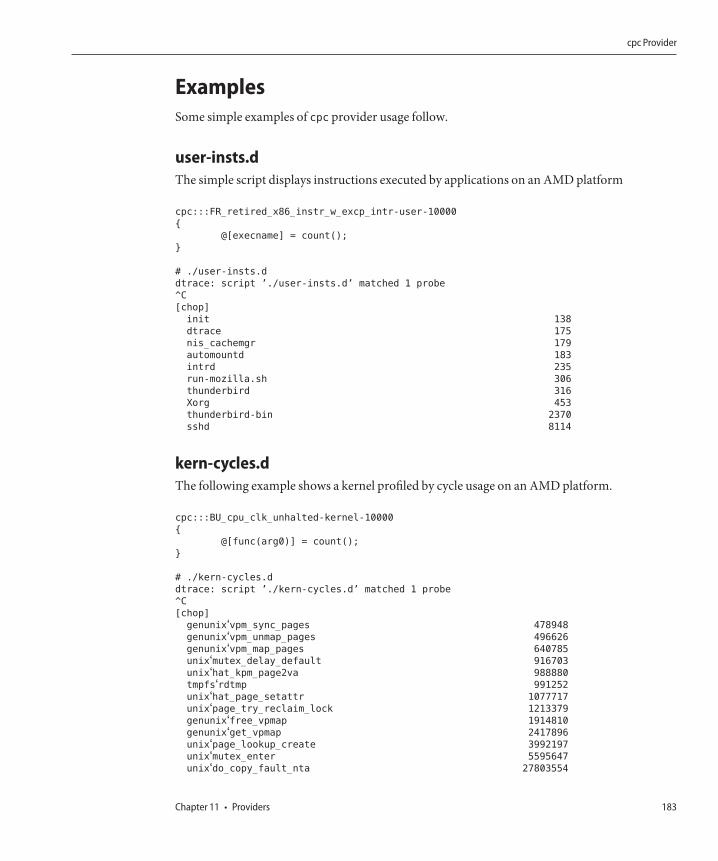
ExamplesSome simple examples of cpc provider usage follow.
user-insts.dThe simple script displays instructions executed by applications on an AMD platform
cpc:::FR_retired_x86_instr_w_excp_intr-user-10000
{
@[execname] = count();
}
# ./user-insts.d
dtrace: script ’./user-insts.d’ matched 1 probe
^C
[chop]
init 138
dtrace 175
nis_cachemgr 179
automountd 183
intrd 235
run-mozilla.sh 306
thunderbird 316
Xorg 453
thunderbird-bin 2370
sshd 8114
kern-cycles.dThe following example shows a kernel profiled by cycle usage on an AMD platform.
cpc:::BU_cpu_clk_unhalted-kernel-10000
{
@[func(arg0)] = count();
}
# ./kern-cycles.d
dtrace: script ’./kern-cycles.d’ matched 1 probe
^C
[chop]
genunix‘vpm_sync_pages 478948
genunix‘vpm_unmap_pages 496626
genunix‘vpm_map_pages 640785
unix‘mutex_delay_default 916703
unix‘hat_kpm_page2va 988880
tmpfs‘rdtmp 991252
unix‘hat_page_setattr 1077717
unix‘page_try_reclaim_lock 1213379
genunix‘free_vpmap 1914810
genunix‘get_vpmap 2417896
unix‘page_lookup_create 3992197
unix‘mutex_enter 5595647
unix‘do_copy_fault_nta 27803554
cpc Provider
Chapter 11 • Providers 183
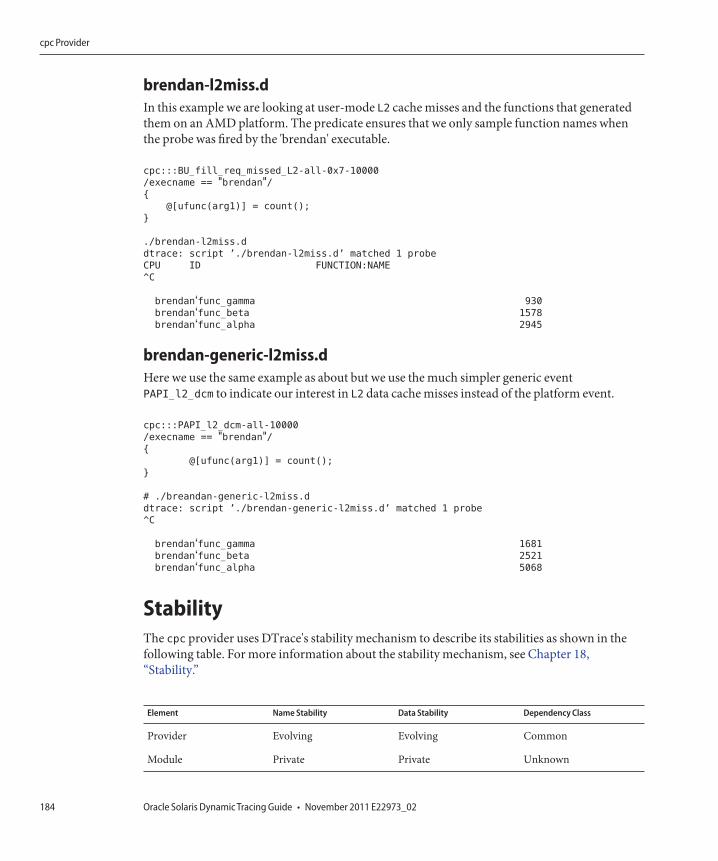
brendan-l2miss.dIn this example we are looking at user-mode L2 cache misses and the functions that generatedthem on an AMD platform. The predicate ensures that we only sample function names whenthe probe was fired by the 'brendan' executable.
cpc:::BU_fill_req_missed_L2-all-0x7-10000
/execname == "brendan"/{
@[ufunc(arg1)] = count();
}
./brendan-l2miss.d
dtrace: script ’./brendan-l2miss.d’ matched 1 probe
CPU ID FUNCTION:NAME
^C
brendan‘func_gamma 930
brendan‘func_beta 1578
brendan‘func_alpha 2945
brendan-generic-l2miss.dHere we use the same example as about but we use the much simpler generic eventPAPI_l2_dcm to indicate our interest in L2 data cache misses instead of the platform event.
cpc:::PAPI_l2_dcm-all-10000
/execname == "brendan"/{
@[ufunc(arg1)] = count();
}
# ./breandan-generic-l2miss.d
dtrace: script ’./brendan-generic-l2miss.d’ matched 1 probe
^C
brendan‘func_gamma 1681
brendan‘func_beta 2521
brendan‘func_alpha 5068
StabilityThe cpc provider uses DTrace's stability mechanism to describe its stabilities as shown in thefollowing table. For more information about the stability mechanism, see Chapter 18,“Stability.”
Element Name Stability Data Stability Dependency Class
Provider Evolving Evolving Common
Module Private Private Unknown
cpc Provider
Oracle Solaris Dynamic Tracing Guide • November 2011 E22973_02184
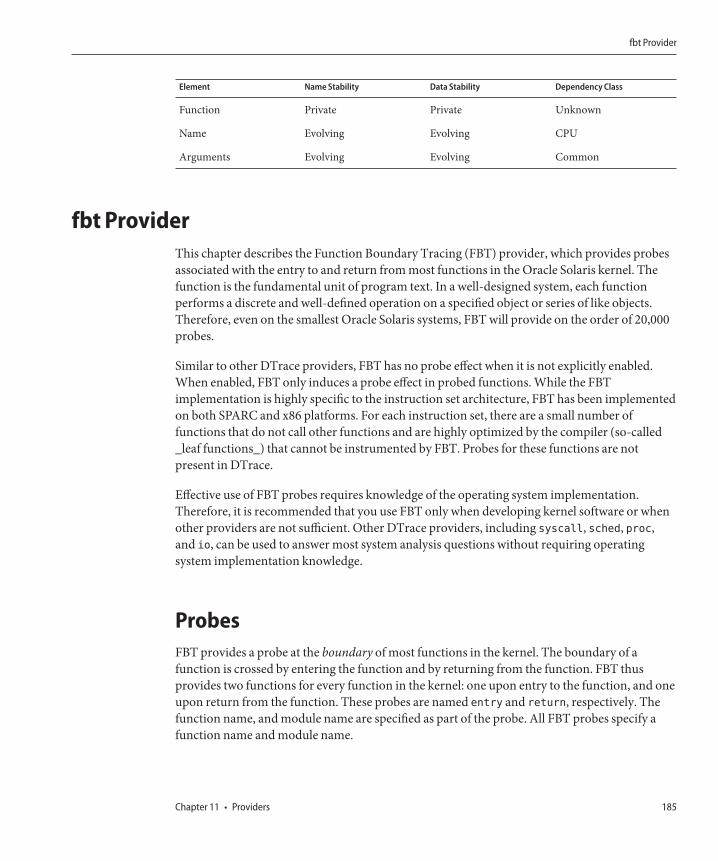
Element Name Stability Data Stability Dependency Class
Function Private Private Unknown
Name Evolving Evolving CPU
Arguments Evolving Evolving Common
fbt ProviderThis chapter describes the Function Boundary Tracing (FBT) provider, which provides probesassociated with the entry to and return from most functions in the Oracle Solaris kernel. Thefunction is the fundamental unit of program text. In a well-designed system, each functionperforms a discrete and well-defined operation on a specified object or series of like objects.Therefore, even on the smallest Oracle Solaris systems, FBT will provide on the order of 20,000probes.
Similar to other DTrace providers, FBT has no probe effect when it is not explicitly enabled.When enabled, FBT only induces a probe effect in probed functions. While the FBTimplementation is highly specific to the instruction set architecture, FBT has been implementedon both SPARC and x86 platforms. For each instruction set, there are a small number offunctions that do not call other functions and are highly optimized by the compiler (so-called_leaf functions_) that cannot be instrumented by FBT. Probes for these functions are notpresent in DTrace.
Effective use of FBT probes requires knowledge of the operating system implementation.Therefore, it is recommended that you use FBT only when developing kernel software or whenother providers are not sufficient. Other DTrace providers, including syscall, sched, proc,and io, can be used to answer most system analysis questions without requiring operatingsystem implementation knowledge.
ProbesFBT provides a probe at the boundary of most functions in the kernel. The boundary of afunction is crossed by entering the function and by returning from the function. FBT thusprovides two functions for every function in the kernel: one upon entry to the function, and oneupon return from the function. These probes are named entry and return, respectively. Thefunction name, and module name are specified as part of the probe. All FBT probes specify afunction name and module name.
fbt Provider
Chapter 11 • Providers 185
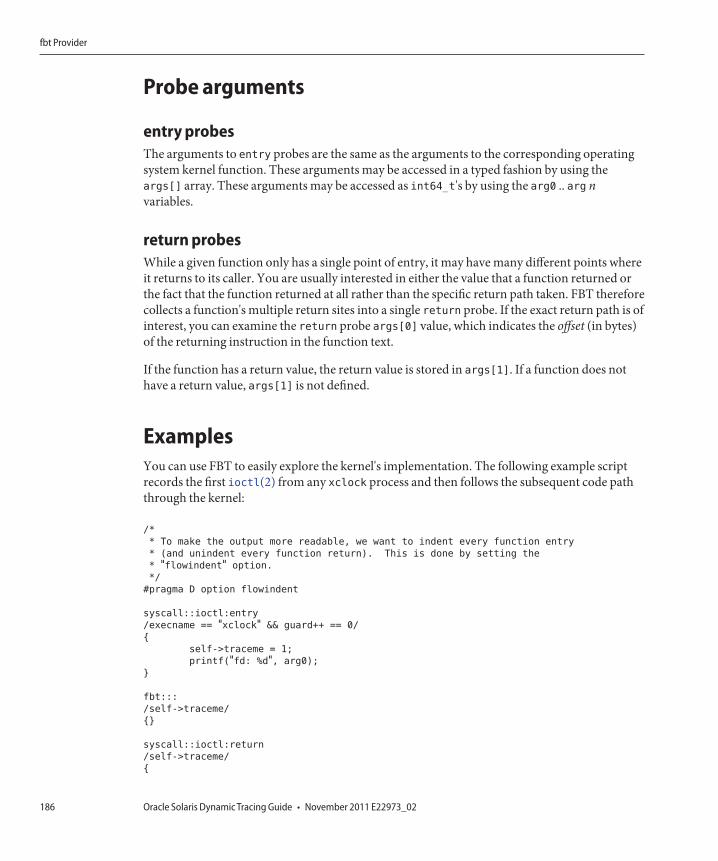
Probe arguments
entry probesThe arguments to entry probes are the same as the arguments to the corresponding operatingsystem kernel function. These arguments may be accessed in a typed fashion by using theargs[] array. These arguments may be accessed as int64_t's by using the arg0 .. arg nvariables.
return probesWhile a given function only has a single point of entry, it may have many different points whereit returns to its caller. You are usually interested in either the value that a function returned orthe fact that the function returned at all rather than the specific return path taken. FBT thereforecollects a function's multiple return sites into a single return probe. If the exact return path is ofinterest, you can examine the return probe args[0] value, which indicates the offset (in bytes)of the returning instruction in the function text.
If the function has a return value, the return value is stored in args[1]. If a function does nothave a return value, args[1] is not defined.
ExamplesYou can use FBT to easily explore the kernel's implementation. The following example scriptrecords the first ioctl(2) from any xclock process and then follows the subsequent code paththrough the kernel:
/*
* To make the output more readable, we want to indent every function entry
* (and unindent every function return). This is done by setting the
* "flowindent" option.
*/
#pragma D option flowindent
syscall::ioctl:entry
/execname == "xclock" && guard++ == 0/
{
self->traceme = 1;
printf("fd: %d", arg0);
}
fbt:::
/self->traceme/
{}
syscall::ioctl:return
/self->traceme/
{
fbt Provider
Oracle Solaris Dynamic Tracing Guide • November 2011 E22973_02186
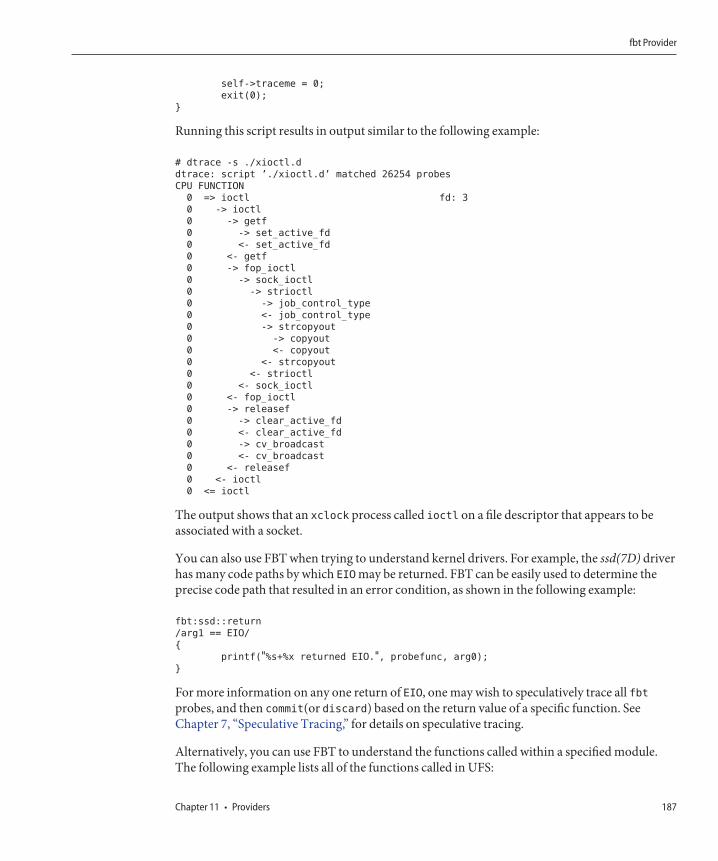
self->traceme = 0;
exit(0);
}
Running this script results in output similar to the following example:
# dtrace -s ./xioctl.d
dtrace: script ’./xioctl.d’ matched 26254 probes
CPU FUNCTION
0 => ioctl fd: 3
0 -> ioctl
0 -> getf
0 -> set_active_fd
0 <- set_active_fd
0 <- getf
0 -> fop_ioctl
0 -> sock_ioctl
0 -> strioctl
0 -> job_control_type
0 <- job_control_type
0 -> strcopyout
0 -> copyout
0 <- copyout
0 <- strcopyout
0 <- strioctl
0 <- sock_ioctl
0 <- fop_ioctl
0 -> releasef
0 -> clear_active_fd
0 <- clear_active_fd
0 -> cv_broadcast
0 <- cv_broadcast
0 <- releasef
0 <- ioctl
0 <= ioctl
The output shows that an xclock process called ioctl on a file descriptor that appears to beassociated with a socket.
You can also use FBT when trying to understand kernel drivers. For example, the ssd(7D) driverhas many code paths by which EIO may be returned. FBT can be easily used to determine theprecise code path that resulted in an error condition, as shown in the following example:
fbt:ssd::return
/arg1 == EIO/
{
printf("%s+%x returned EIO.", probefunc, arg0);
}
For more information on any one return of EIO, one may wish to speculatively trace all fbtprobes, and then commit(or discard) based on the return value of a specific function. SeeChapter 7, “Speculative Tracing,” for details on speculative tracing.
Alternatively, you can use FBT to understand the functions called within a specified module.The following example lists all of the functions called in UFS:
fbt Provider
Chapter 11 • Providers 187
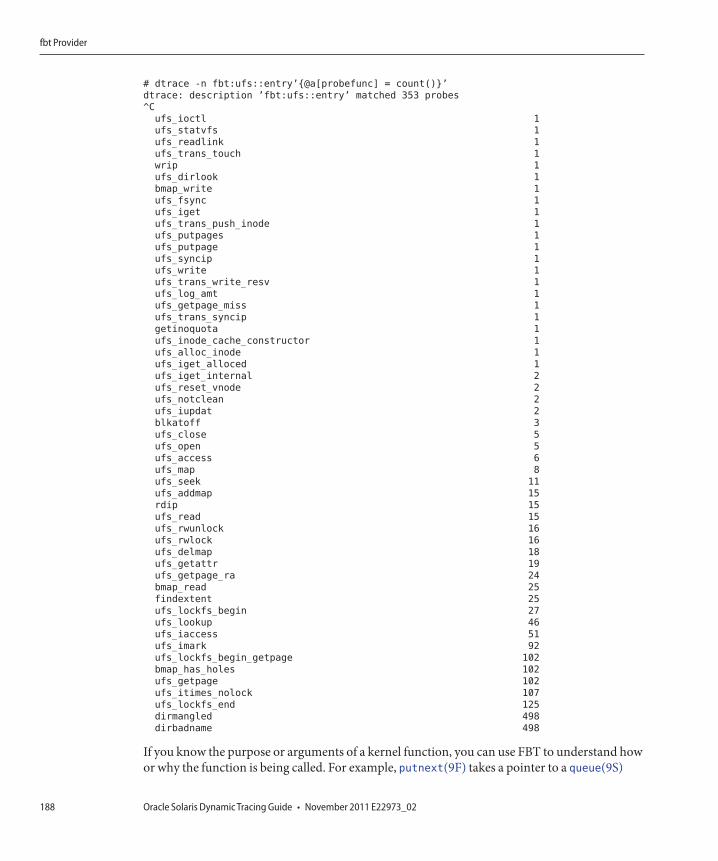
# dtrace -n fbt:ufs::entry’{@a[probefunc] = count()}’
dtrace: description ’fbt:ufs::entry’ matched 353 probes
^C
ufs_ioctl 1
ufs_statvfs 1
ufs_readlink 1
ufs_trans_touch 1
wrip 1
ufs_dirlook 1
bmap_write 1
ufs_fsync 1
ufs_iget 1
ufs_trans_push_inode 1
ufs_putpages 1
ufs_putpage 1
ufs_syncip 1
ufs_write 1
ufs_trans_write_resv 1
ufs_log_amt 1
ufs_getpage_miss 1
ufs_trans_syncip 1
getinoquota 1
ufs_inode_cache_constructor 1
ufs_alloc_inode 1
ufs_iget_alloced 1
ufs_iget_internal 2
ufs_reset_vnode 2
ufs_notclean 2
ufs_iupdat 2
blkatoff 3
ufs_close 5
ufs_open 5
ufs_access 6
ufs_map 8
ufs_seek 11
ufs_addmap 15
rdip 15
ufs_read 15
ufs_rwunlock 16
ufs_rwlock 16
ufs_delmap 18
ufs_getattr 19
ufs_getpage_ra 24
bmap_read 25
findextent 25
ufs_lockfs_begin 27
ufs_lookup 46
ufs_iaccess 51
ufs_imark 92
ufs_lockfs_begin_getpage 102
bmap_has_holes 102
ufs_getpage 102
ufs_itimes_nolock 107
ufs_lockfs_end 125
dirmangled 498
dirbadname 498
If you know the purpose or arguments of a kernel function, you can use FBT to understand howor why the function is being called. For example, putnext(9F) takes a pointer to a queue(9S)
fbt Provider
Oracle Solaris Dynamic Tracing Guide • November 2011 E22973_02188
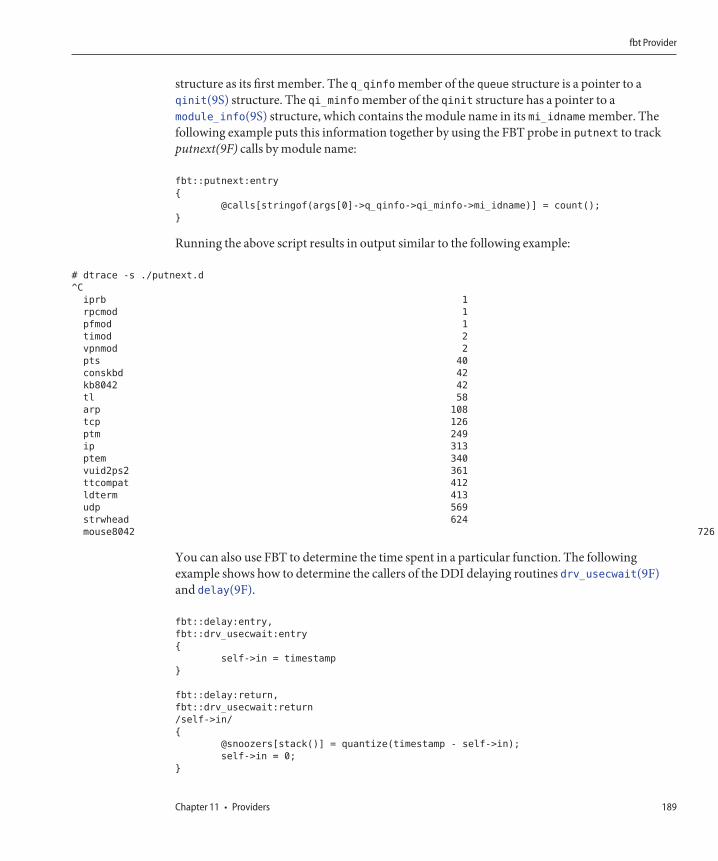
structure as its first member. The q_qinfo member of the queue structure is a pointer to aqinit(9S) structure. The qi_minfo member of the qinit structure has a pointer to amodule_info(9S) structure, which contains the module name in its mi_idname member. Thefollowing example puts this information together by using the FBT probe in putnext to trackputnext(9F) calls by module name:
fbt::putnext:entry
{
@calls[stringof(args[0]->q_qinfo->qi_minfo->mi_idname)] = count();
}
Running the above script results in output similar to the following example:
# dtrace -s ./putnext.d
^C
iprb 1
rpcmod 1
pfmod 1
timod 2
vpnmod 2
pts 40
conskbd 42
kb8042 42
tl 58
arp 108
tcp 126
ptm 249
ip 313
ptem 340
vuid2ps2 361
ttcompat 412
ldterm 413
udp 569
strwhead 624
mouse8042 726
You can also use FBT to determine the time spent in a particular function. The followingexample shows how to determine the callers of the DDI delaying routines drv_usecwait(9F)and delay(9F).
fbt::delay:entry,
fbt::drv_usecwait:entry
{
self->in = timestamp
}
fbt::delay:return,
fbt::drv_usecwait:return
/self->in/
{
@snoozers[stack()] = quantize(timestamp - self->in);
self->in = 0;
}
fbt Provider
Chapter 11 • Providers 189
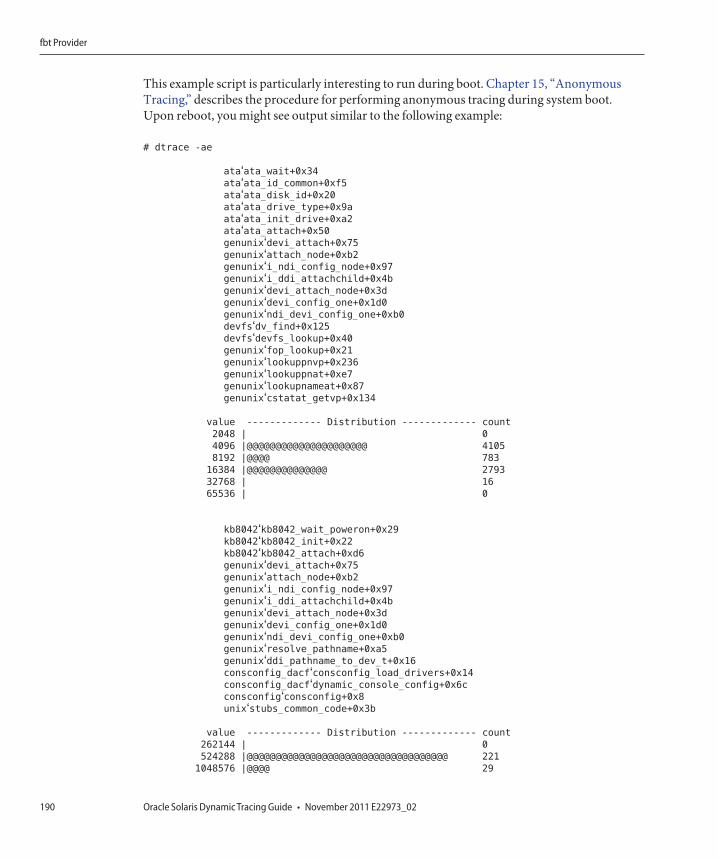
This example script is particularly interesting to run during boot. Chapter 15, “AnonymousTracing,” describes the procedure for performing anonymous tracing during system boot.Upon reboot, you might see output similar to the following example:
# dtrace -ae
ata‘ata_wait+0x34ata‘ata_id_common+0xf5ata‘ata_disk_id+0x20ata‘ata_drive_type+0x9aata‘ata_init_drive+0xa2ata‘ata_attach+0x50genunix‘devi_attach+0x75genunix‘attach_node+0xb2genunix‘i_ndi_config_node+0x97genunix‘i_ddi_attachchild+0x4bgenunix‘devi_attach_node+0x3dgenunix‘devi_config_one+0x1d0genunix‘ndi_devi_config_one+0xb0devfs‘dv_find+0x125devfs‘devfs_lookup+0x40genunix‘fop_lookup+0x21genunix‘lookuppnvp+0x236genunix‘lookuppnat+0xe7genunix‘lookupnameat+0x87genunix‘cstatat_getvp+0x134
value ------------- Distribution ------------- count
2048 | 0
4096 |@@@@@@@@@@@@@@@@@@@@@ 4105
8192 |@@@@ 783
16384 |@@@@@@@@@@@@@@ 2793
32768 | 16
65536 | 0
kb8042‘kb8042_wait_poweron+0x29kb8042‘kb8042_init+0x22kb8042‘kb8042_attach+0xd6genunix‘devi_attach+0x75genunix‘attach_node+0xb2genunix‘i_ndi_config_node+0x97genunix‘i_ddi_attachchild+0x4bgenunix‘devi_attach_node+0x3dgenunix‘devi_config_one+0x1d0genunix‘ndi_devi_config_one+0xb0genunix‘resolve_pathname+0xa5genunix‘ddi_pathname_to_dev_t+0x16consconfig_dacf‘consconfig_load_drivers+0x14consconfig_dacf‘dynamic_console_config+0x6cconsconfig‘consconfig+0x8unix‘stubs_common_code+0x3b
value ------------- Distribution ------------- count
262144 | 0
524288 |@@@@@@@@@@@@@@@@@@@@@@@@@@@@@@@@@@@ 221
1048576 |@@@@ 29
fbt Provider
Oracle Solaris Dynamic Tracing Guide • November 2011 E22973_02190
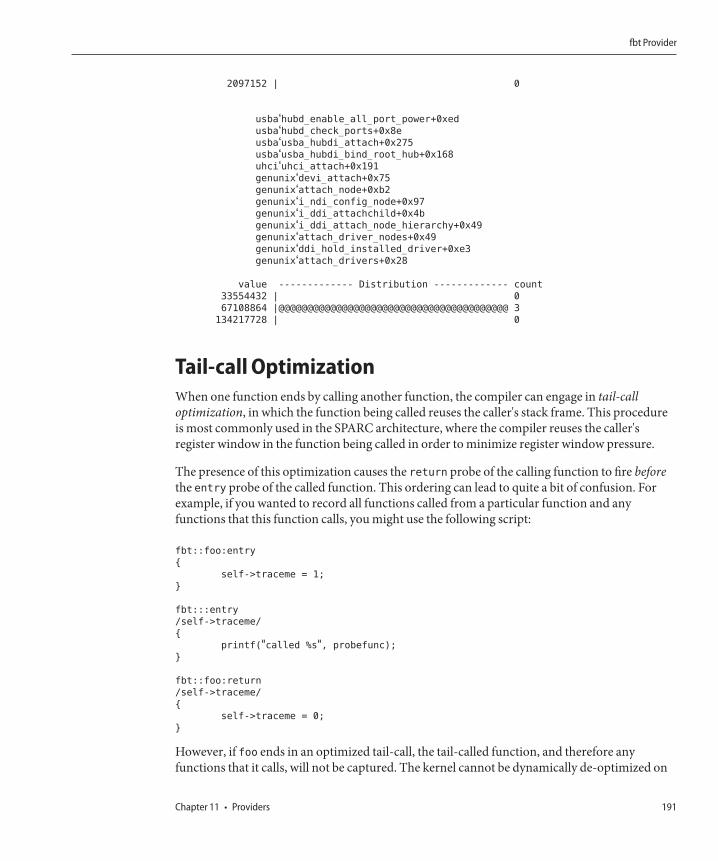
2097152 | 0
usba‘hubd_enable_all_port_power+0xedusba‘hubd_check_ports+0x8eusba‘usba_hubdi_attach+0x275usba‘usba_hubdi_bind_root_hub+0x168uhci‘uhci_attach+0x191genunix‘devi_attach+0x75genunix‘attach_node+0xb2genunix‘i_ndi_config_node+0x97genunix‘i_ddi_attachchild+0x4bgenunix‘i_ddi_attach_node_hierarchy+0x49genunix‘attach_driver_nodes+0x49genunix‘ddi_hold_installed_driver+0xe3genunix‘attach_drivers+0x28
value ------------- Distribution ------------- count
33554432 | 0
67108864 |@@@@@@@@@@@@@@@@@@@@@@@@@@@@@@@@@@@@@@@@ 3
134217728 | 0
Tail-call OptimizationWhen one function ends by calling another function, the compiler can engage in tail-calloptimization, in which the function being called reuses the caller's stack frame. This procedureis most commonly used in the SPARC architecture, where the compiler reuses the caller'sregister window in the function being called in order to minimize register window pressure.
The presence of this optimization causes the return probe of the calling function to fire beforethe entry probe of the called function. This ordering can lead to quite a bit of confusion. Forexample, if you wanted to record all functions called from a particular function and anyfunctions that this function calls, you might use the following script:
fbt::foo:entry
{
self->traceme = 1;
}
fbt:::entry
/self->traceme/
{
printf("called %s", probefunc);
}
fbt::foo:return
/self->traceme/
{
self->traceme = 0;
}
However, if foo ends in an optimized tail-call, the tail-called function, and therefore anyfunctions that it calls, will not be captured. The kernel cannot be dynamically de-optimized on
fbt Provider
Chapter 11 • Providers 191
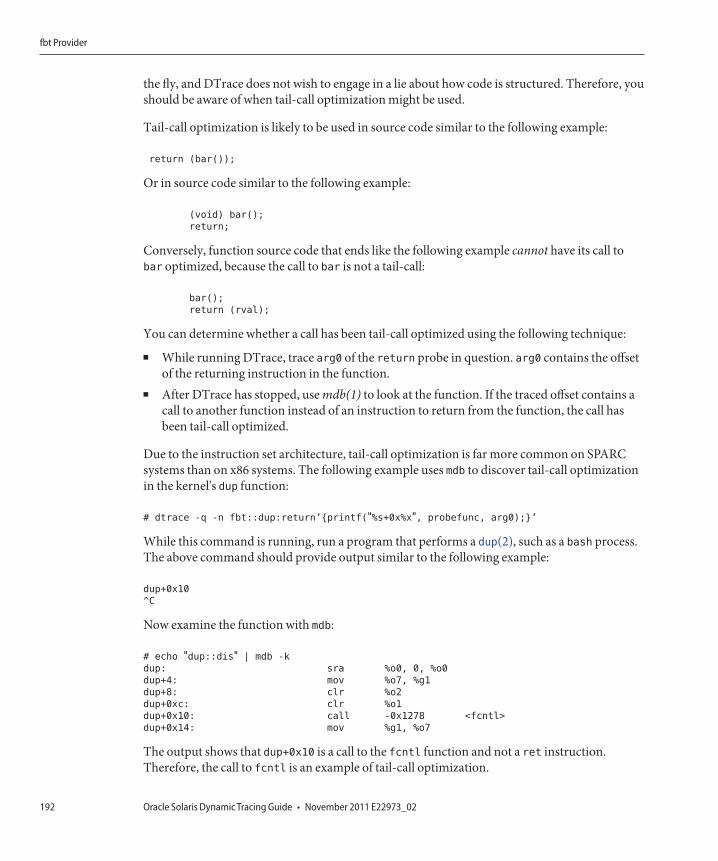
the fly, and DTrace does not wish to engage in a lie about how code is structured. Therefore, youshould be aware of when tail-call optimization might be used.
Tail-call optimization is likely to be used in source code similar to the following example:
return (bar());
Or in source code similar to the following example:
(void) bar();
return;
Conversely, function source code that ends like the following example cannot have its call tobar optimized, because the call to bar is not a tail-call:
bar();
return (rval);
You can determine whether a call has been tail-call optimized using the following technique:
■ While running DTrace, trace arg0 of the return probe in question. arg0 contains the offsetof the returning instruction in the function.
■ After DTrace has stopped, use mdb(1) to look at the function. If the traced offset contains acall to another function instead of an instruction to return from the function, the call hasbeen tail-call optimized.
Due to the instruction set architecture, tail-call optimization is far more common on SPARCsystems than on x86 systems. The following example uses mdb to discover tail-call optimizationin the kernel's dup function:
# dtrace -q -n fbt::dup:return’{printf("%s+0x%x", probefunc, arg0);}’
While this command is running, run a program that performs a dup(2), such as a bash process.The above command should provide output similar to the following example:
dup+0x10
^C
Now examine the function with mdb:
# echo "dup::dis" | mdb -k
dup: sra %o0, 0, %o0
dup+4: mov %o7, %g1
dup+8: clr %o2
dup+0xc: clr %o1
dup+0x10: call -0x1278 <fcntl>
dup+0x14: mov %g1, %o7
The output shows that dup+0x10 is a call to the fcntl function and not a ret instruction.Therefore, the call to fcntl is an example of tail-call optimization.
fbt Provider
Oracle Solaris Dynamic Tracing Guide • November 2011 E22973_02192
Assembly FunctionsYou might observe functions that seem to enter but never return or vice versa. Such rarefunctions are generally hand-coded assembly routines that branch to the middle of otherhand-coded assembly functions. These functions should not impede analysis: the branched-tofunction must still return to the caller of the branched-from function. That is, if you enable allFBT probes, you should see the entry to one function and the return from another function atthe same stack depth.
Instruction Set LimitationsSome functions cannot be instrumented by FBT. The exact nature of uninstrumentablefunctions is specific to the instruction set architecture.
x86 LimitationsFunctions that do not create a stack frame on x86 systems cannot be instrumented by FBT.Because the register set for x86 is extraordinarily small, most functions must put data on thestack and therefore create a stack frame. However, some x86 functions do not create a stackframe and therefore cannot be instrumented. Actual numbers vary, but typically fewer than fivepercent of functions cannot be instrumented on the x86 platform.
SPARC LimitationsLeaf routines hand-coded in assembly language on SPARC systems cannot be instrumented byFBT. The majority of the kernel is written in C, and all functions written in C can beinstrumented by FBT. Actual numbers vary, but typically fewer cannot be instrumented on theSPARC platform.
Breakpoint InteractionFBT works by dynamically modifying kernel text. Because kernel breakpoints also work bymodifying kernel text, if a kernel breakpoint is placed at an entry or return site before loadingDTrace, FBT will refuse to provide a probe for the function, even if the kernel breakpoint issubsequently removed. If the kernel breakpoint is placed after loading DTrace, both the kernelbreakpoint and the DTrace probe will correspond to the same point in text. In this situation, thebreakpoint will trigger first, and then the probe will fire when the debugger resumes the kernel.It is recommended that kernel breakpoints not be used concurrently with DTrace. Ifbreakpoints are required, use the DTrace breakpoint action instead.
fbt Provider
Chapter 11 • Providers 193
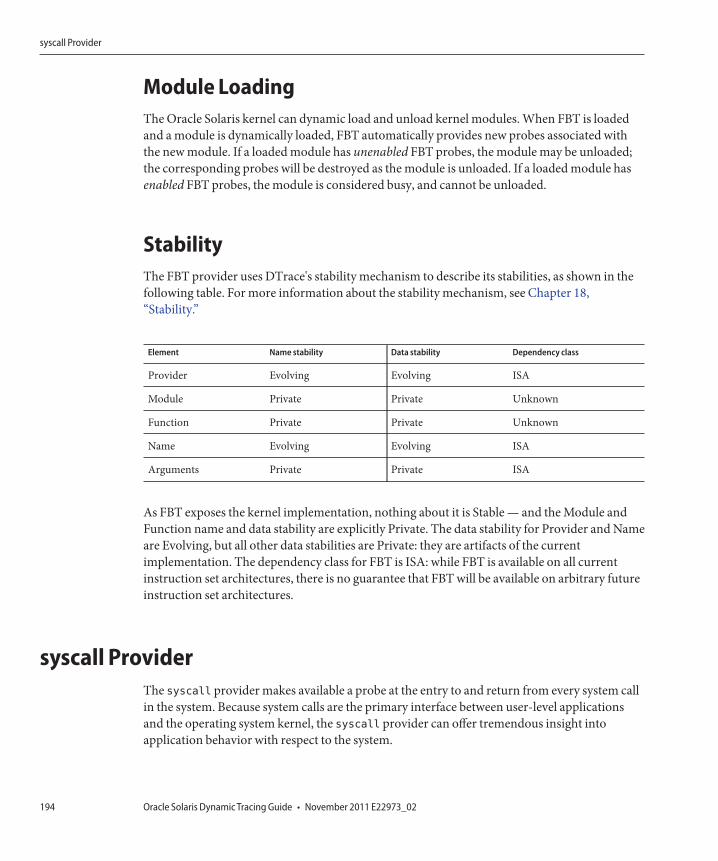
Module LoadingThe Oracle Solaris kernel can dynamic load and unload kernel modules. When FBT is loadedand a module is dynamically loaded, FBT automatically provides new probes associated withthe new module. If a loaded module has unenabled FBT probes, the module may be unloaded;the corresponding probes will be destroyed as the module is unloaded. If a loaded module hasenabled FBT probes, the module is considered busy, and cannot be unloaded.
StabilityThe FBT provider uses DTrace's stability mechanism to describe its stabilities, as shown in thefollowing table. For more information about the stability mechanism, see Chapter 18,“Stability.”
Element Name stability Data stability Dependency class
Provider Evolving Evolving ISA
Module Private Private Unknown
Function Private Private Unknown
Name Evolving Evolving ISA
Arguments Private Private ISA
As FBT exposes the kernel implementation, nothing about it is Stable — and the Module andFunction name and data stability are explicitly Private. The data stability for Provider and Nameare Evolving, but all other data stabilities are Private: they are artifacts of the currentimplementation. The dependency class for FBT is ISA: while FBT is available on all currentinstruction set architectures, there is no guarantee that FBT will be available on arbitrary futureinstruction set architectures.
syscall ProviderThe syscall provider makes available a probe at the entry to and return from every system callin the system. Because system calls are the primary interface between user-level applicationsand the operating system kernel, the syscall provider can offer tremendous insight intoapplication behavior with respect to the system.
syscall Provider
Oracle Solaris Dynamic Tracing Guide • November 2011 E22973_02194
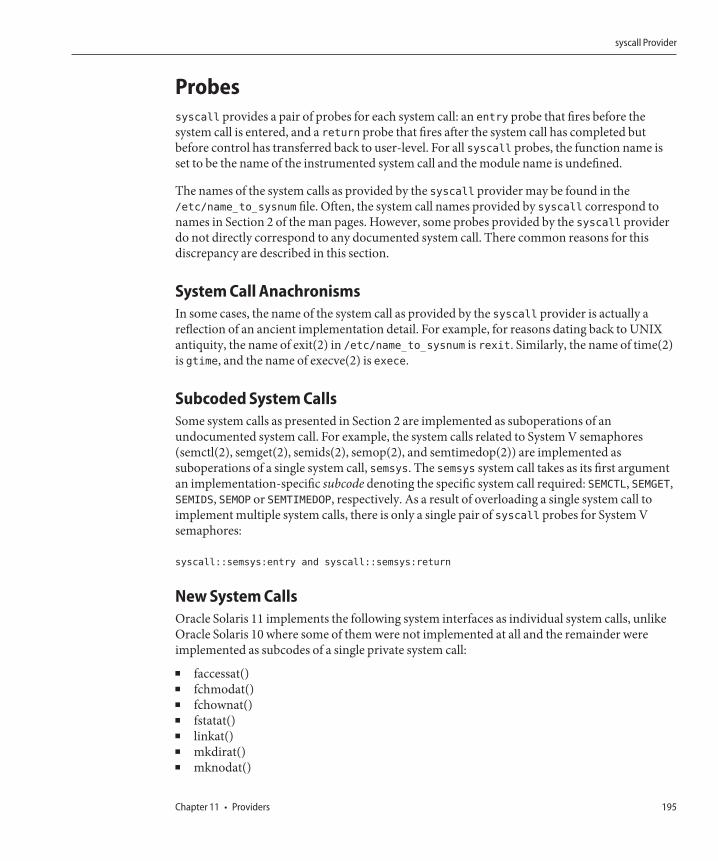
Probessyscall provides a pair of probes for each system call: an entry probe that fires before thesystem call is entered, and a return probe that fires after the system call has completed butbefore control has transferred back to user-level. For all syscall probes, the function name isset to be the name of the instrumented system call and the module name is undefined.
The names of the system calls as provided by the syscall provider may be found in the/etc/name_to_sysnum file. Often, the system call names provided by syscall correspond tonames in Section 2 of the man pages. However, some probes provided by the syscall providerdo not directly correspond to any documented system call. There common reasons for thisdiscrepancy are described in this section.
System Call AnachronismsIn some cases, the name of the system call as provided by the syscall provider is actually areflection of an ancient implementation detail. For example, for reasons dating back to UNIXantiquity, the name of exit(2) in /etc/name_to_sysnum is rexit. Similarly, the name of time(2)is gtime, and the name of execve(2) is exece.
Subcoded System CallsSome system calls as presented in Section 2 are implemented as suboperations of anundocumented system call. For example, the system calls related to System V semaphores(semctl(2), semget(2), semids(2), semop(2), and semtimedop(2)) are implemented assuboperations of a single system call, semsys. The semsys system call takes as its first argumentan implementation-specific subcode denoting the specific system call required: SEMCTL, SEMGET,SEMIDS, SEMOP or SEMTIMEDOP, respectively. As a result of overloading a single system call toimplement multiple system calls, there is only a single pair of syscall probes for System Vsemaphores:
syscall::semsys:entry and syscall::semsys:return
New System CallsOracle Solaris 11 implements the following system interfaces as individual system calls, unlikeOracle Solaris 10 where some of them were not implemented at all and the remainder wereimplemented as subcodes of a single private system call:■ faccessat()■ fchmodat()■ fchownat()■ fstatat()■ linkat()■ mkdirat()■ mknodat()
syscall Provider
Chapter 11 • Providers 195
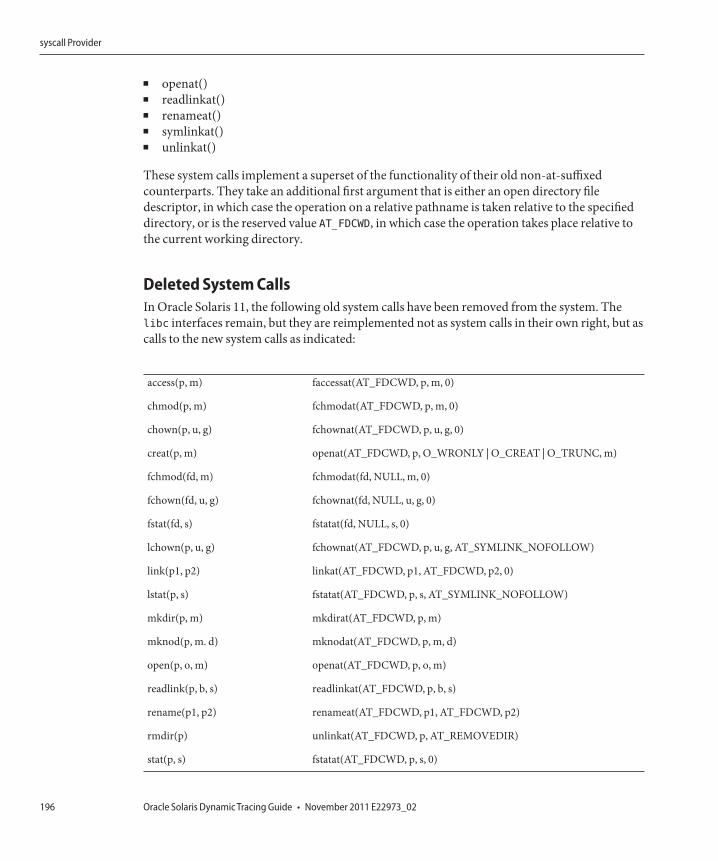
■ openat()■ readlinkat()■ renameat()■ symlinkat()■ unlinkat()
These system calls implement a superset of the functionality of their old non-at-suffixedcounterparts. They take an additional first argument that is either an open directory filedescriptor, in which case the operation on a relative pathname is taken relative to the specifieddirectory, or is the reserved value AT_FDCWD, in which case the operation takes place relative tothe current working directory.
Deleted System CallsIn Oracle Solaris 11, the following old system calls have been removed from the system. Thelibc interfaces remain, but they are reimplemented not as system calls in their own right, but ascalls to the new system calls as indicated:
access(p, m) faccessat(AT_FDCWD, p, m, 0)
chmod(p, m) fchmodat(AT_FDCWD, p, m, 0)
chown(p, u, g) fchownat(AT_FDCWD, p, u, g, 0)
creat(p, m) openat(AT_FDCWD, p, O_WRONLY | O_CREAT | O_TRUNC, m)
fchmod(fd, m) fchmodat(fd, NULL, m, 0)
fchown(fd, u, g) fchownat(fd, NULL, u, g, 0)
fstat(fd, s) fstatat(fd, NULL, s, 0)
lchown(p, u, g) fchownat(AT_FDCWD, p, u, g, AT_SYMLINK_NOFOLLOW)
link(p1, p2) linkat(AT_FDCWD, p1, AT_FDCWD, p2, 0)
lstat(p, s) fstatat(AT_FDCWD, p, s, AT_SYMLINK_NOFOLLOW)
mkdir(p, m) mkdirat(AT_FDCWD, p, m)
mknod(p, m. d) mknodat(AT_FDCWD, p, m, d)
open(p, o, m) openat(AT_FDCWD, p, o, m)
readlink(p, b, s) readlinkat(AT_FDCWD, p, b, s)
rename(p1, p2) renameat(AT_FDCWD, p1, AT_FDCWD, p2)
rmdir(p) unlinkat(AT_FDCWD, p, AT_REMOVEDIR)
stat(p, s) fstatat(AT_FDCWD, p, s, 0)
syscall Provider
Oracle Solaris Dynamic Tracing Guide • November 2011 E22973_02196
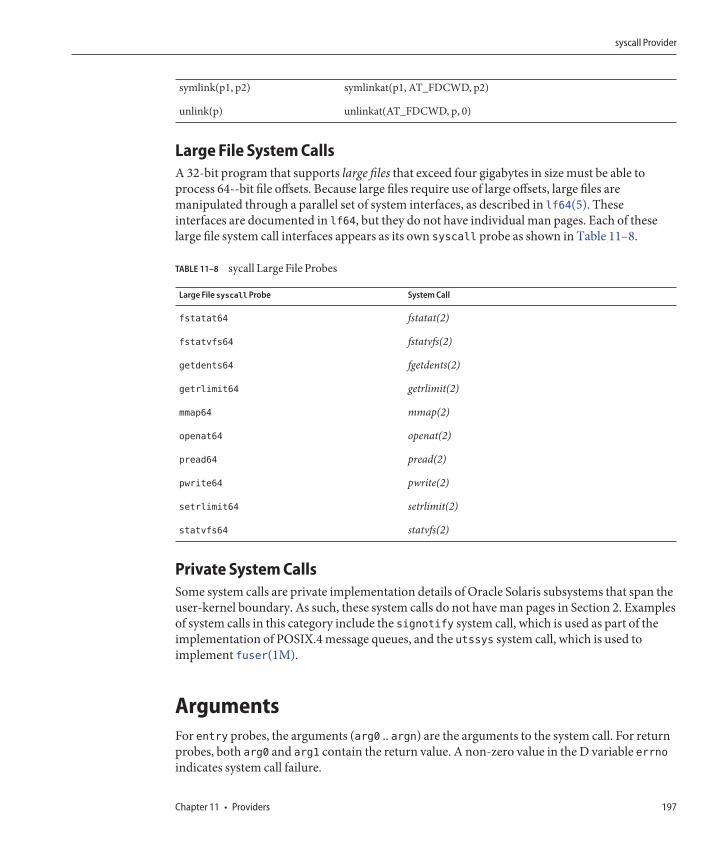
symlink(p1, p2) symlinkat(p1, AT_FDCWD, p2)
unlink(p) unlinkat(AT_FDCWD, p, 0)
Large File System CallsA 32-bit program that supports large files that exceed four gigabytes in size must be able toprocess 64--bit file offsets. Because large files require use of large offsets, large files aremanipulated through a parallel set of system interfaces, as described in lf64(5). Theseinterfaces are documented in lf64, but they do not have individual man pages. Each of theselarge file system call interfaces appears as its own syscall probe as shown in Table 11–8.
TABLE 11–8 sycall Large File Probes
Large File syscall Probe System Call
fstatat64 fstatat(2)
fstatvfs64 fstatvfs(2)
getdents64 fgetdents(2)
getrlimit64 getrlimit(2)
mmap64 mmap(2)
openat64 openat(2)
pread64 pread(2)
pwrite64 pwrite(2)
setrlimit64 setrlimit(2)
statvfs64 statvfs(2)
Private System CallsSome system calls are private implementation details of Oracle Solaris subsystems that span theuser-kernel boundary. As such, these system calls do not have man pages in Section 2. Examplesof system calls in this category include the signotify system call, which is used as part of theimplementation of POSIX.4 message queues, and the utssys system call, which is used toimplement fuser(1M).
ArgumentsFor entry probes, the arguments (arg0 .. argn) are the arguments to the system call. For returnprobes, both arg0 and arg1 contain the return value. A non-zero value in the D variable errnoindicates system call failure.
syscall Provider
Chapter 11 • Providers 197
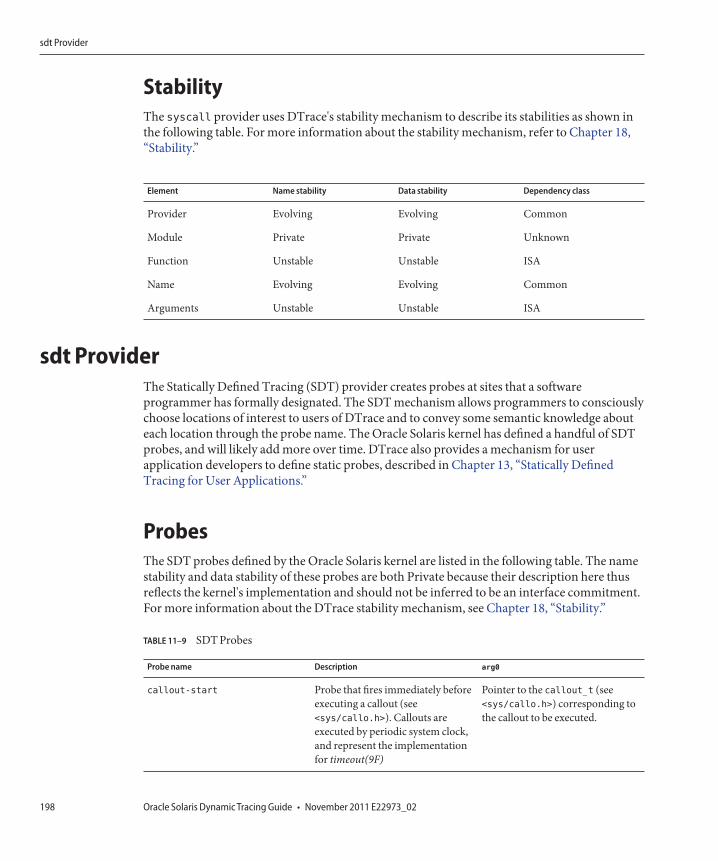
StabilityThe syscall provider uses DTrace's stability mechanism to describe its stabilities as shown inthe following table. For more information about the stability mechanism, refer to Chapter 18,“Stability.”
Element Name stability Data stability Dependency class
Provider Evolving Evolving Common
Module Private Private Unknown
Function Unstable Unstable ISA
Name Evolving Evolving Common
Arguments Unstable Unstable ISA
sdt ProviderThe Statically Defined Tracing (SDT) provider creates probes at sites that a softwareprogrammer has formally designated. The SDT mechanism allows programmers to consciouslychoose locations of interest to users of DTrace and to convey some semantic knowledge abouteach location through the probe name. The Oracle Solaris kernel has defined a handful of SDTprobes, and will likely add more over time. DTrace also provides a mechanism for userapplication developers to define static probes, described in Chapter 13, “Statically DefinedTracing for User Applications.”
ProbesThe SDT probes defined by the Oracle Solaris kernel are listed in the following table. The namestability and data stability of these probes are both Private because their description here thusreflects the kernel's implementation and should not be inferred to be an interface commitment.For more information about the DTrace stability mechanism, see Chapter 18, “Stability.”
TABLE 11–9 SDT Probes
Probe name Description arg0
callout-start Probe that fires immediately beforeexecuting a callout (see<sys/callo.h>). Callouts areexecuted by periodic system clock,and represent the implementationfor timeout(9F)
Pointer to the callout_t (see<sys/callo.h>) corresponding tothe callout to be executed.
sdt Provider
Oracle Solaris Dynamic Tracing Guide • November 2011 E22973_02198
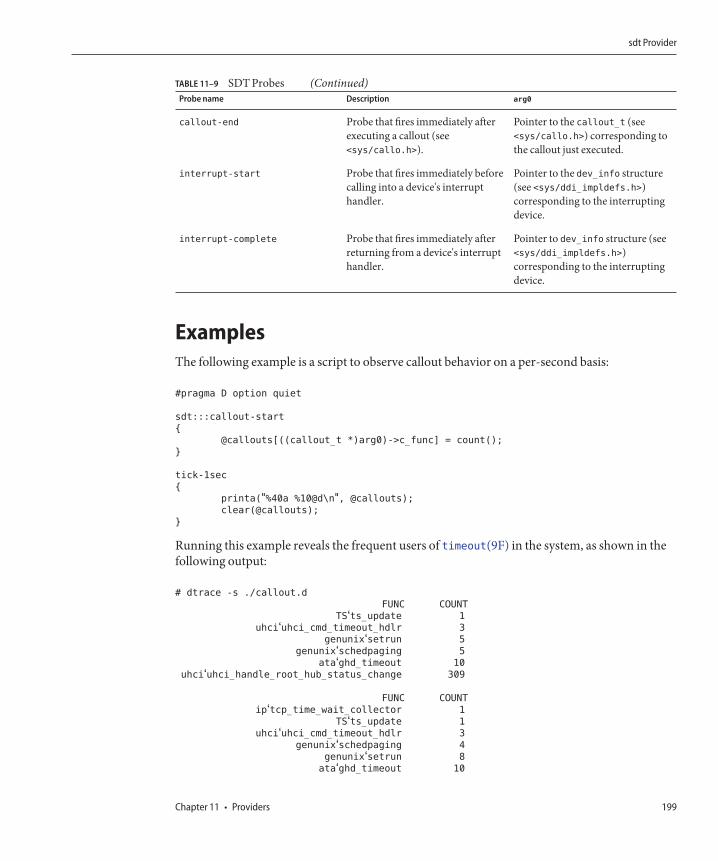
TABLE 11–9 SDT Probes (Continued)Probe name Description arg0
callout-end Probe that fires immediately afterexecuting a callout (see<sys/callo.h>).
Pointer to the callout_t (see<sys/callo.h>) corresponding tothe callout just executed.
interrupt-start Probe that fires immediately beforecalling into a device's interrupthandler.
Pointer to the dev_info structure(see <sys/ddi_impldefs.h>)corresponding to the interruptingdevice.
interrupt-complete Probe that fires immediately afterreturning from a device's interrupthandler.
Pointer to dev_info structure (see<sys/ddi_impldefs.h>)corresponding to the interruptingdevice.
ExamplesThe following example is a script to observe callout behavior on a per-second basis:
#pragma D option quiet
sdt:::callout-start
{
@callouts[((callout_t *)arg0)->c_func] = count();
}
tick-1sec
{
printa("%40a %10@d\n", @callouts);
clear(@callouts);
}
Running this example reveals the frequent users of timeout(9F) in the system, as shown in thefollowing output:
# dtrace -s ./callout.d
FUNC COUNT
TS‘ts_update 1
uhci‘uhci_cmd_timeout_hdlr 3
genunix‘setrun 5
genunix‘schedpaging 5
ata‘ghd_timeout 10
uhci‘uhci_handle_root_hub_status_change 309
FUNC COUNT
ip‘tcp_time_wait_collector 1
TS‘ts_update 1
uhci‘uhci_cmd_timeout_hdlr 3
genunix‘schedpaging 4
genunix‘setrun 8
ata‘ghd_timeout 10
sdt Provider
Chapter 11 • Providers 199
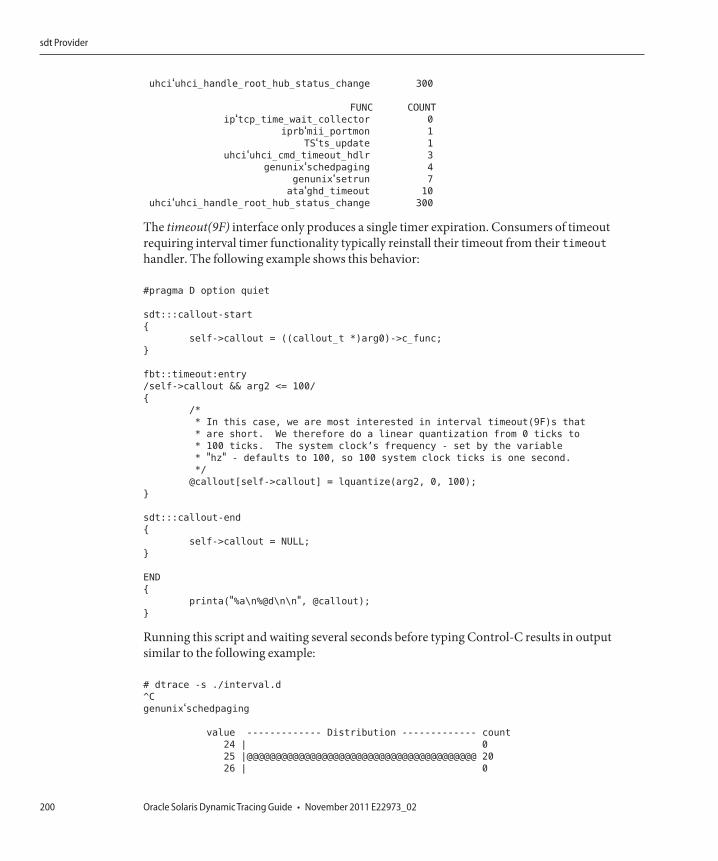
uhci‘uhci_handle_root_hub_status_change 300
FUNC COUNT
ip‘tcp_time_wait_collector 0
iprb‘mii_portmon 1
TS‘ts_update 1
uhci‘uhci_cmd_timeout_hdlr 3
genunix‘schedpaging 4
genunix‘setrun 7
ata‘ghd_timeout 10
uhci‘uhci_handle_root_hub_status_change 300
The timeout(9F) interface only produces a single timer expiration. Consumers of timeoutrequiring interval timer functionality typically reinstall their timeout from their timeouthandler. The following example shows this behavior:
#pragma D option quiet
sdt:::callout-start
{
self->callout = ((callout_t *)arg0)->c_func;
}
fbt::timeout:entry
/self->callout && arg2 <= 100/
{
/*
* In this case, we are most interested in interval timeout(9F)s that
* are short. We therefore do a linear quantization from 0 ticks to
* 100 ticks. The system clock’s frequency - set by the variable
* "hz" - defaults to 100, so 100 system clock ticks is one second.
*/
@callout[self->callout] = lquantize(arg2, 0, 100);
}
sdt:::callout-end
{
self->callout = NULL;
}
END
{
printa("%a\n%@d\n\n", @callout);
}
Running this script and waiting several seconds before typing Control-C results in outputsimilar to the following example:
# dtrace -s ./interval.d
^C
genunix‘schedpaging
value ------------- Distribution ------------- count
24 | 0
25 |@@@@@@@@@@@@@@@@@@@@@@@@@@@@@@@@@@@@@@@@ 20
26 | 0
sdt Provider
Oracle Solaris Dynamic Tracing Guide • November 2011 E22973_02200
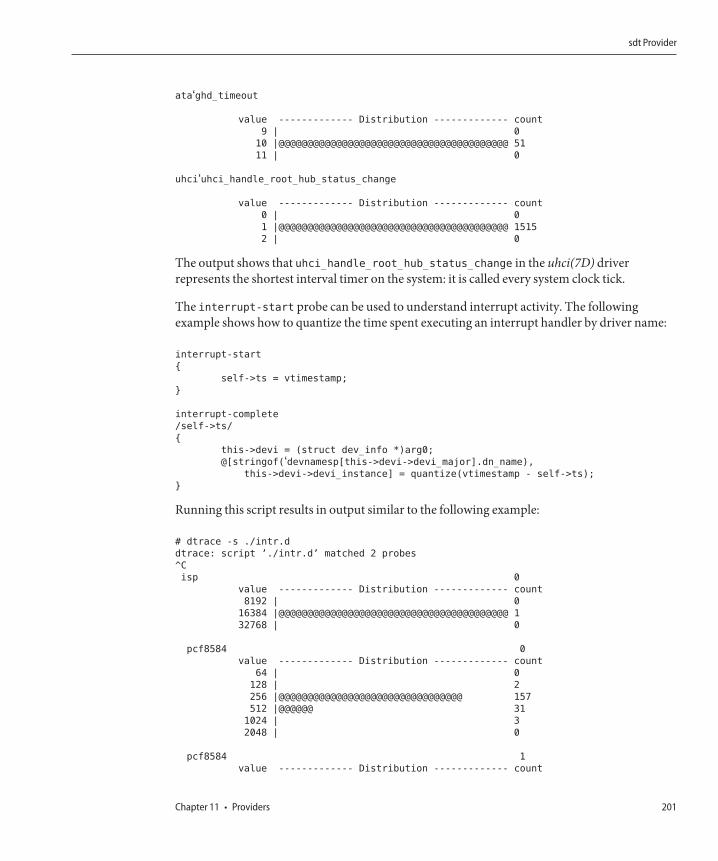
ata‘ghd_timeout
value ------------- Distribution ------------- count
9 | 0
10 |@@@@@@@@@@@@@@@@@@@@@@@@@@@@@@@@@@@@@@@@ 51
11 | 0
uhci‘uhci_handle_root_hub_status_change
value ------------- Distribution ------------- count
0 | 0
1 |@@@@@@@@@@@@@@@@@@@@@@@@@@@@@@@@@@@@@@@@ 1515
2 | 0
The output shows that uhci_handle_root_hub_status_change in the uhci(7D) driverrepresents the shortest interval timer on the system: it is called every system clock tick.
The interrupt-start probe can be used to understand interrupt activity. The followingexample shows how to quantize the time spent executing an interrupt handler by driver name:
interrupt-start
{
self->ts = vtimestamp;
}
interrupt-complete
/self->ts/
{
this->devi = (struct dev_info *)arg0;
@[stringof(‘devnamesp[this->devi->devi_major].dn_name),this->devi->devi_instance] = quantize(vtimestamp - self->ts);
}
Running this script results in output similar to the following example:
# dtrace -s ./intr.d
dtrace: script ’./intr.d’ matched 2 probes
^C
isp 0
value ------------- Distribution ------------- count
8192 | 0
16384 |@@@@@@@@@@@@@@@@@@@@@@@@@@@@@@@@@@@@@@@@ 1
32768 | 0
pcf8584 0
value ------------- Distribution ------------- count
64 | 0
128 | 2
256 |@@@@@@@@@@@@@@@@@@@@@@@@@@@@@@@@ 157
512 |@@@@@@ 31
1024 | 3
2048 | 0
pcf8584 1
value ------------- Distribution ------------- count
sdt Provider
Chapter 11 • Providers 201
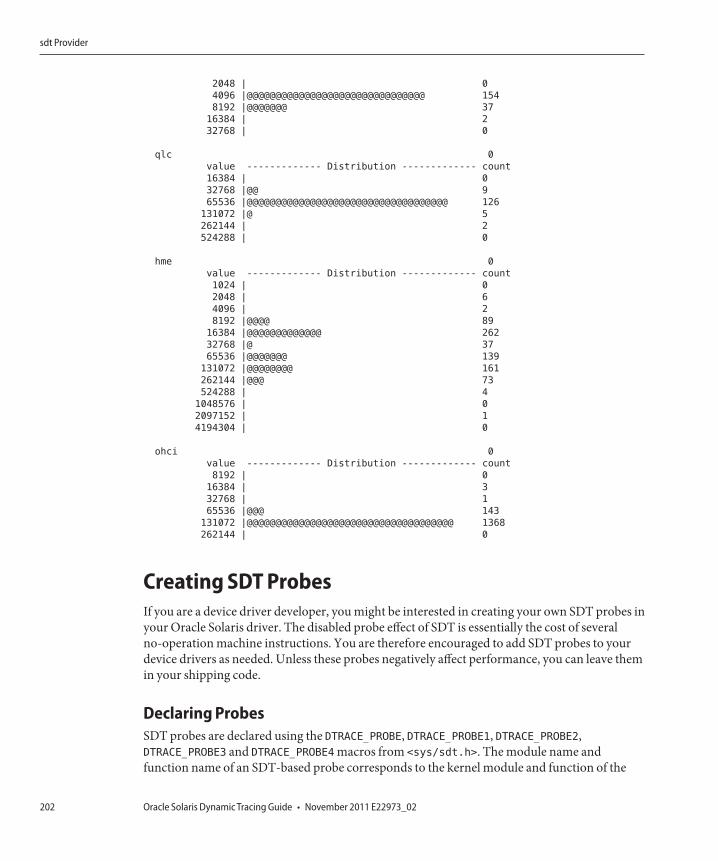
2048 | 0
4096 |@@@@@@@@@@@@@@@@@@@@@@@@@@@@@@@ 154
8192 |@@@@@@@ 37
16384 | 2
32768 | 0
qlc 0
value ------------- Distribution ------------- count
16384 | 0
32768 |@@ 9
65536 |@@@@@@@@@@@@@@@@@@@@@@@@@@@@@@@@@@@ 126
131072 |@ 5
262144 | 2
524288 | 0
hme 0
value ------------- Distribution ------------- count
1024 | 0
2048 | 6
4096 | 2
8192 |@@@@ 89
16384 |@@@@@@@@@@@@@ 262
32768 |@ 37
65536 |@@@@@@@ 139
131072 |@@@@@@@@ 161
262144 |@@@ 73
524288 | 4
1048576 | 0
2097152 | 1
4194304 | 0
ohci 0
value ------------- Distribution ------------- count
8192 | 0
16384 | 3
32768 | 1
65536 |@@@ 143
131072 |@@@@@@@@@@@@@@@@@@@@@@@@@@@@@@@@@@@@ 1368
262144 | 0
Creating SDT ProbesIf you are a device driver developer, you might be interested in creating your own SDT probes inyour Oracle Solaris driver. The disabled probe effect of SDT is essentially the cost of severalno-operation machine instructions. You are therefore encouraged to add SDT probes to yourdevice drivers as needed. Unless these probes negatively affect performance, you can leave themin your shipping code.
Declaring ProbesSDT probes are declared using the DTRACE_PROBE, DTRACE_PROBE1, DTRACE_PROBE2,DTRACE_PROBE3 and DTRACE_PROBE4 macros from <sys/sdt.h>. The module name andfunction name of an SDT-based probe corresponds to the kernel module and function of the
sdt Provider
Oracle Solaris Dynamic Tracing Guide • November 2011 E22973_02202
probe. The name of the probe depends on the name given in the DTRACE_PROBEn macro. If thename contains no two consecutive underbars (_), the name of the probe is as written in themacro. If the name contains any two consecutive underbars, the probe name converts theconsecutive underbars to a single dash (-). For example, if a DTRACE_PROBE macro specifiestransaction_start, the SDT probe will be named transaction-start. This substitutionallows C code to provide macro names that are not valid C identifiers without specifying astring.
DTrace includes the kernel module name and function name as part of the tuple identifying aprobe, so you do not need to include this information in the probe name to prevent name spacecollisions. You can use the command dtrace -l -P sdt -m module on your driver module tolist the probes you have installed and the full names that will be seen by users of DTrace.
Probe ArgumentsThe arguments for each SDT probe are the arguments specified in the correspondingDTRACE_PROBEn macro reference. The number of arguments depends on which macro was usedto create the probe: DTRACE_PROBE1 specifies one argument, DTRACE_PROBE2 specifies twoarguments, and so on. When declaring your SDT probes, you can minimize their disabledprobe effect by not dereferencing pointers and not loading from global variables in the probearguments. Both pointer dereferencing and global variable loading may be done safely in Dactions that enable probes, so DTrace users can request these actions only when they areneeded.
StabilityThe SDT provider uses DTrace's stability mechanism to describe its stabilities, as shown in thefollowing table. For more information about the stability mechanism, see Chapter 18,“Stability.”
Element Name stability Data stability Dependency class
Provider Evolving Evolving ISA
Module Private Private Unknown
Function Private Private Unknown
Nam Private Private ISA
Arguments Private Private ISA
sdt Provider
Chapter 11 • Providers 203
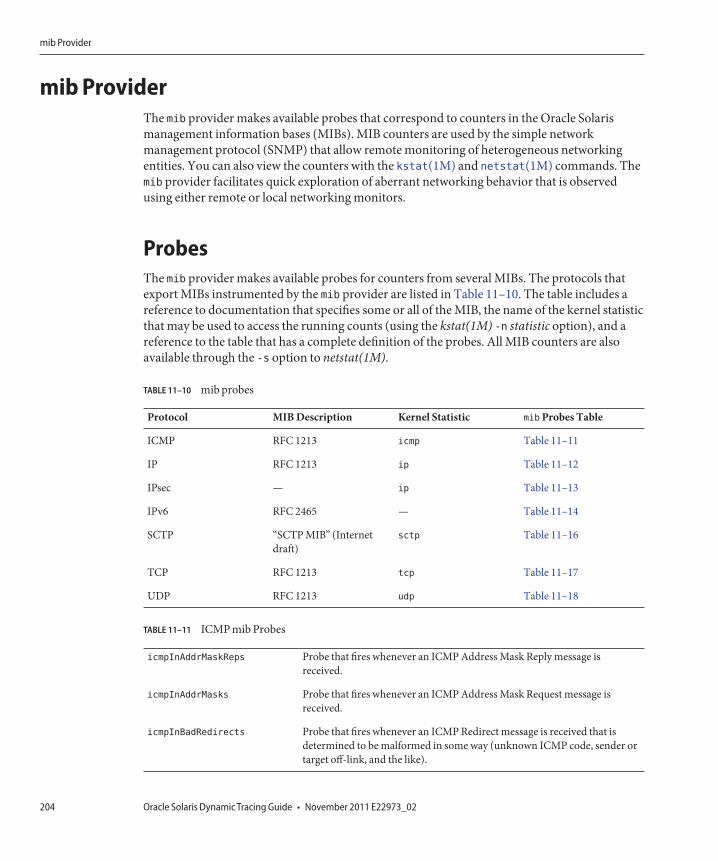
mib ProviderThe mib provider makes available probes that correspond to counters in the Oracle Solarismanagement information bases (MIBs). MIB counters are used by the simple networkmanagement protocol (SNMP) that allow remote monitoring of heterogeneous networkingentities. You can also view the counters with the kstat(1M) and netstat(1M) commands. Themib provider facilitates quick exploration of aberrant networking behavior that is observedusing either remote or local networking monitors.
ProbesThe mib provider makes available probes for counters from several MIBs. The protocols thatexport MIBs instrumented by the mib provider are listed in Table 11–10. The table includes areference to documentation that specifies some or all of the MIB, the name of the kernel statisticthat may be used to access the running counts (using the kstat(1M) -n statistic option), and areference to the table that has a complete definition of the probes. All MIB counters are alsoavailable through the -s option to netstat(1M).
TABLE 11–10 mib probes
Protocol MIB Description Kernel Statistic mib Probes Table
ICMP RFC 1213 icmp Table 11–11
IP RFC 1213 ip Table 11–12
IPsec — ip Table 11–13
IPv6 RFC 2465 — Table 11–14
SCTP “SCTP MIB” (Internetdraft)
sctp Table 11–16
TCP RFC 1213 tcp Table 11–17
UDP RFC 1213 udp Table 11–18
TABLE 11–11 ICMP mib Probes
icmpInAddrMaskReps Probe that fires whenever an ICMP Address Mask Reply message isreceived.
icmpInAddrMasks Probe that fires whenever an ICMP Address Mask Request message isreceived.
icmpInBadRedirects Probe that fires whenever an ICMP Redirect message is received that isdetermined to be malformed in some way (unknown ICMP code, sender ortarget off-link, and the like).
mib Provider
Oracle Solaris Dynamic Tracing Guide • November 2011 E22973_02204
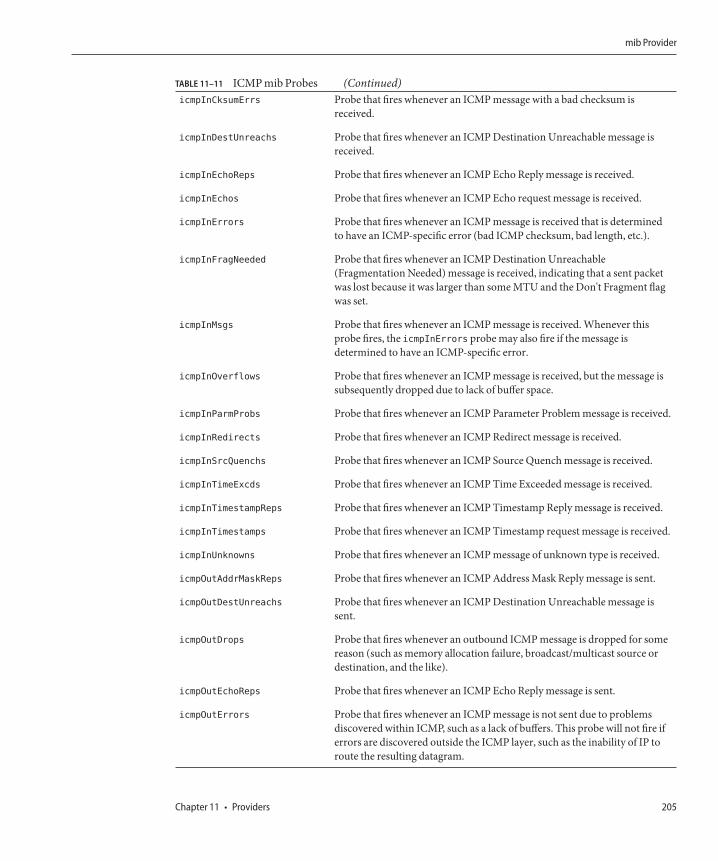
TABLE 11–11 ICMP mib Probes (Continued)icmpInCksumErrs Probe that fires whenever an ICMP message with a bad checksum is
received.
icmpInDestUnreachs Probe that fires whenever an ICMP Destination Unreachable message isreceived.
icmpInEchoReps Probe that fires whenever an ICMP Echo Reply message is received.
icmpInEchos Probe that fires whenever an ICMP Echo request message is received.
icmpInErrors Probe that fires whenever an ICMP message is received that is determinedto have an ICMP-specific error (bad ICMP checksum, bad length, etc.).
icmpInFragNeeded Probe that fires whenever an ICMP Destination Unreachable(Fragmentation Needed) message is received, indicating that a sent packetwas lost because it was larger than some MTU and the Don't Fragment flagwas set.
icmpInMsgs Probe that fires whenever an ICMP message is received. Whenever thisprobe fires, the icmpInErrors probe may also fire if the message isdetermined to have an ICMP-specific error.
icmpInOverflows Probe that fires whenever an ICMP message is received, but the message issubsequently dropped due to lack of buffer space.
icmpInParmProbs Probe that fires whenever an ICMP Parameter Problem message is received.
icmpInRedirects Probe that fires whenever an ICMP Redirect message is received.
icmpInSrcQuenchs Probe that fires whenever an ICMP Source Quench message is received.
icmpInTimeExcds Probe that fires whenever an ICMP Time Exceeded message is received.
icmpInTimestampReps Probe that fires whenever an ICMP Timestamp Reply message is received.
icmpInTimestamps Probe that fires whenever an ICMP Timestamp request message is received.
icmpInUnknowns Probe that fires whenever an ICMP message of unknown type is received.
icmpOutAddrMaskReps Probe that fires whenever an ICMP Address Mask Reply message is sent.
icmpOutDestUnreachs Probe that fires whenever an ICMP Destination Unreachable message issent.
icmpOutDrops Probe that fires whenever an outbound ICMP message is dropped for somereason (such as memory allocation failure, broadcast/multicast source ordestination, and the like).
icmpOutEchoReps Probe that fires whenever an ICMP Echo Reply message is sent.
icmpOutErrors Probe that fires whenever an ICMP message is not sent due to problemsdiscovered within ICMP, such as a lack of buffers. This probe will not fire iferrors are discovered outside the ICMP layer, such as the inability of IP toroute the resulting datagram.
mib Provider
Chapter 11 • Providers 205
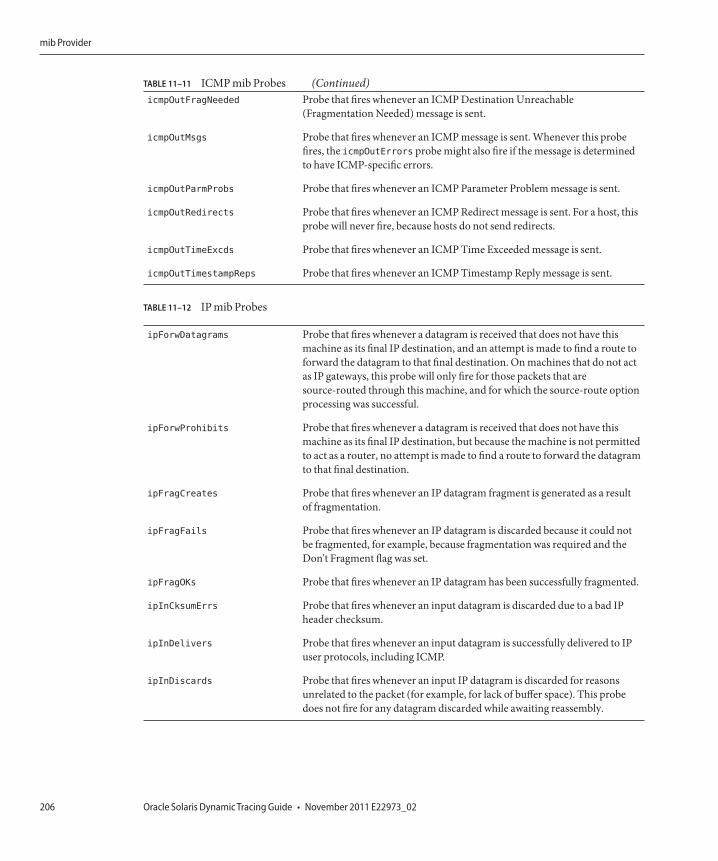
TABLE 11–11 ICMP mib Probes (Continued)icmpOutFragNeeded Probe that fires whenever an ICMP Destination Unreachable
(Fragmentation Needed) message is sent.
icmpOutMsgs Probe that fires whenever an ICMP message is sent. Whenever this probefires, the icmpOutErrors probe might also fire if the message is determinedto have ICMP-specific errors.
icmpOutParmProbs Probe that fires whenever an ICMP Parameter Problem message is sent.
icmpOutRedirects Probe that fires whenever an ICMP Redirect message is sent. For a host, thisprobe will never fire, because hosts do not send redirects.
icmpOutTimeExcds Probe that fires whenever an ICMP Time Exceeded message is sent.
icmpOutTimestampReps Probe that fires whenever an ICMP Timestamp Reply message is sent.
TABLE 11–12 IP mib Probes
ipForwDatagrams Probe that fires whenever a datagram is received that does not have thismachine as its final IP destination, and an attempt is made to find a route toforward the datagram to that final destination. On machines that do not actas IP gateways, this probe will only fire for those packets that aresource-routed through this machine, and for which the source-route optionprocessing was successful.
ipForwProhibits Probe that fires whenever a datagram is received that does not have thismachine as its final IP destination, but because the machine is not permittedto act as a router, no attempt is made to find a route to forward the datagramto that final destination.
ipFragCreates Probe that fires whenever an IP datagram fragment is generated as a resultof fragmentation.
ipFragFails Probe that fires whenever an IP datagram is discarded because it could notbe fragmented, for example, because fragmentation was required and theDon't Fragment flag was set.
ipFragOKs Probe that fires whenever an IP datagram has been successfully fragmented.
ipInCksumErrs Probe that fires whenever an input datagram is discarded due to a bad IPheader checksum.
ipInDelivers Probe that fires whenever an input datagram is successfully delivered to IPuser protocols, including ICMP.
ipInDiscards Probe that fires whenever an input IP datagram is discarded for reasonsunrelated to the packet (for example, for lack of buffer space). This probedoes not fire for any datagram discarded while awaiting reassembly.
mib Provider
Oracle Solaris Dynamic Tracing Guide • November 2011 E22973_02206
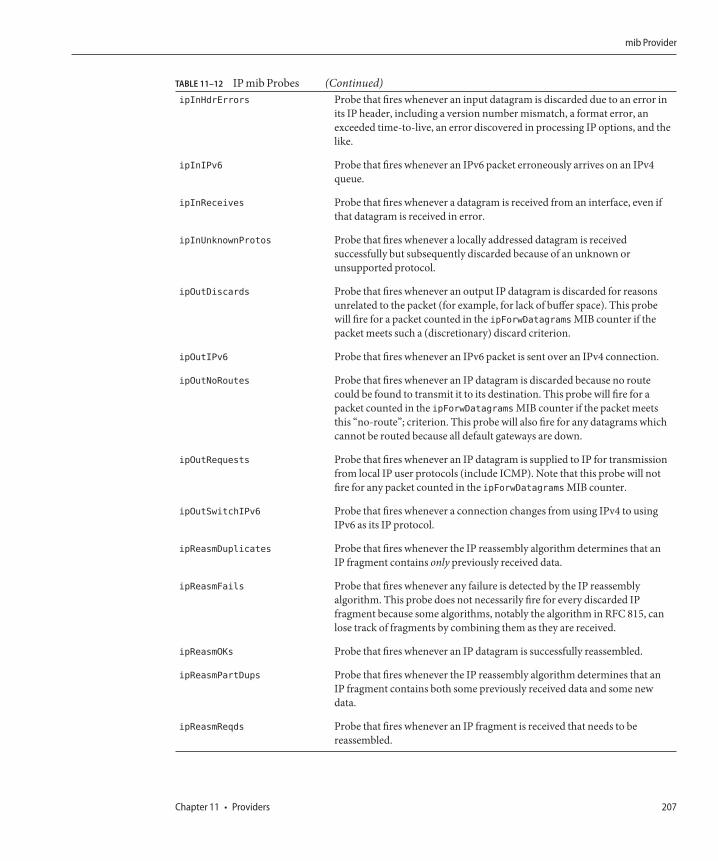
TABLE 11–12 IP mib Probes (Continued)ipInHdrErrors Probe that fires whenever an input datagram is discarded due to an error in
its IP header, including a version number mismatch, a format error, anexceeded time-to-live, an error discovered in processing IP options, and thelike.
ipInIPv6 Probe that fires whenever an IPv6 packet erroneously arrives on an IPv4queue.
ipInReceives Probe that fires whenever a datagram is received from an interface, even ifthat datagram is received in error.
ipInUnknownProtos Probe that fires whenever a locally addressed datagram is receivedsuccessfully but subsequently discarded because of an unknown orunsupported protocol.
ipOutDiscards Probe that fires whenever an output IP datagram is discarded for reasonsunrelated to the packet (for example, for lack of buffer space). This probewill fire for a packet counted in the ipForwDatagrams MIB counter if thepacket meets such a (discretionary) discard criterion.
ipOutIPv6 Probe that fires whenever an IPv6 packet is sent over an IPv4 connection.
ipOutNoRoutes Probe that fires whenever an IP datagram is discarded because no routecould be found to transmit it to its destination. This probe will fire for apacket counted in the ipForwDatagrams MIB counter if the packet meetsthis “no-route”; criterion. This probe will also fire for any datagrams whichcannot be routed because all default gateways are down.
ipOutRequests Probe that fires whenever an IP datagram is supplied to IP for transmissionfrom local IP user protocols (include ICMP). Note that this probe will notfire for any packet counted in the ipForwDatagrams MIB counter.
ipOutSwitchIPv6 Probe that fires whenever a connection changes from using IPv4 to usingIPv6 as its IP protocol.
ipReasmDuplicates Probe that fires whenever the IP reassembly algorithm determines that anIP fragment contains only previously received data.
ipReasmFails Probe that fires whenever any failure is detected by the IP reassemblyalgorithm. This probe does not necessarily fire for every discarded IPfragment because some algorithms, notably the algorithm in RFC 815, canlose track of fragments by combining them as they are received.
ipReasmOKs Probe that fires whenever an IP datagram is successfully reassembled.
ipReasmPartDups Probe that fires whenever the IP reassembly algorithm determines that anIP fragment contains both some previously received data and some newdata.
ipReasmReqds Probe that fires whenever an IP fragment is received that needs to bereassembled.
mib Provider
Chapter 11 • Providers 207
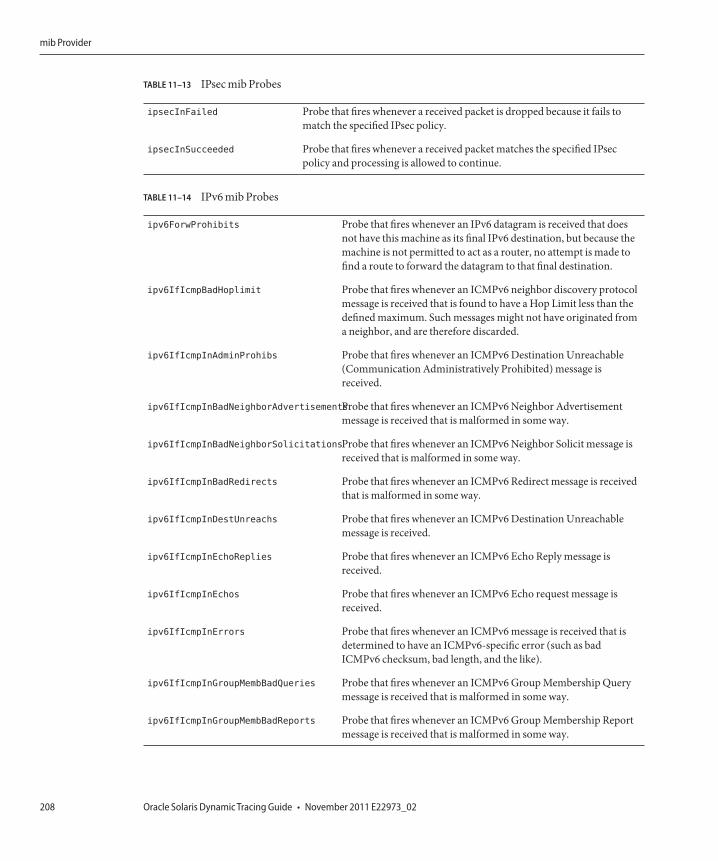
TABLE 11–13 IPsec mib Probes
ipsecInFailed Probe that fires whenever a received packet is dropped because it fails tomatch the specified IPsec policy.
ipsecInSucceeded Probe that fires whenever a received packet matches the specified IPsecpolicy and processing is allowed to continue.
TABLE 11–14 IPv6 mib Probes
ipv6ForwProhibits Probe that fires whenever an IPv6 datagram is received that doesnot have this machine as its final IPv6 destination, but because themachine is not permitted to act as a router, no attempt is made tofind a route to forward the datagram to that final destination.
ipv6IfIcmpBadHoplimit Probe that fires whenever an ICMPv6 neighbor discovery protocolmessage is received that is found to have a Hop Limit less than thedefined maximum. Such messages might not have originated froma neighbor, and are therefore discarded.
ipv6IfIcmpInAdminProhibs Probe that fires whenever an ICMPv6 Destination Unreachable(Communication Administratively Prohibited) message isreceived.
ipv6IfIcmpInBadNeighborAdvertisementsProbe that fires whenever an ICMPv6 Neighbor Advertisementmessage is received that is malformed in some way.
ipv6IfIcmpInBadNeighborSolicitationsProbe that fires whenever an ICMPv6 Neighbor Solicit message isreceived that is malformed in some way.
ipv6IfIcmpInBadRedirects Probe that fires whenever an ICMPv6 Redirect message is receivedthat is malformed in some way.
ipv6IfIcmpInDestUnreachs Probe that fires whenever an ICMPv6 Destination Unreachablemessage is received.
ipv6IfIcmpInEchoReplies Probe that fires whenever an ICMPv6 Echo Reply message isreceived.
ipv6IfIcmpInEchos Probe that fires whenever an ICMPv6 Echo request message isreceived.
ipv6IfIcmpInErrors Probe that fires whenever an ICMPv6 message is received that isdetermined to have an ICMPv6-specific error (such as badICMPv6 checksum, bad length, and the like).
ipv6IfIcmpInGroupMembBadQueries Probe that fires whenever an ICMPv6 Group Membership Querymessage is received that is malformed in some way.
ipv6IfIcmpInGroupMembBadReports Probe that fires whenever an ICMPv6 Group Membership Reportmessage is received that is malformed in some way.
mib Provider
Oracle Solaris Dynamic Tracing Guide • November 2011 E22973_02208
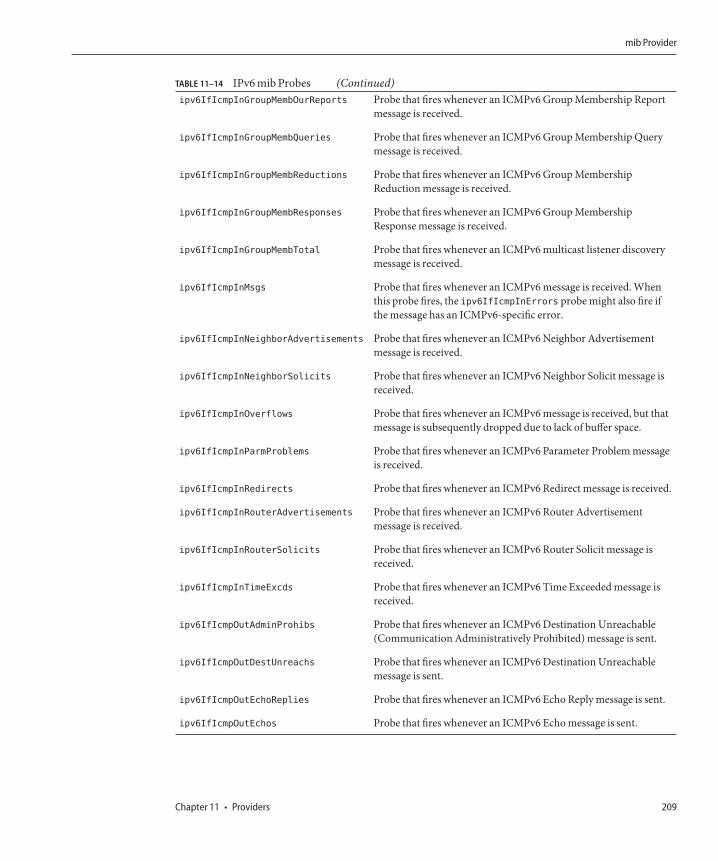
TABLE 11–14 IPv6 mib Probes (Continued)ipv6IfIcmpInGroupMembOurReports Probe that fires whenever an ICMPv6 Group Membership Report
message is received.
ipv6IfIcmpInGroupMembQueries Probe that fires whenever an ICMPv6 Group Membership Querymessage is received.
ipv6IfIcmpInGroupMembReductions Probe that fires whenever an ICMPv6 Group MembershipReduction message is received.
ipv6IfIcmpInGroupMembResponses Probe that fires whenever an ICMPv6 Group MembershipResponse message is received.
ipv6IfIcmpInGroupMembTotal Probe that fires whenever an ICMPv6 multicast listener discoverymessage is received.
ipv6IfIcmpInMsgs Probe that fires whenever an ICMPv6 message is received. Whenthis probe fires, the ipv6IfIcmpInErrors probe might also fire ifthe message has an ICMPv6-specific error.
ipv6IfIcmpInNeighborAdvertisements Probe that fires whenever an ICMPv6 Neighbor Advertisementmessage is received.
ipv6IfIcmpInNeighborSolicits Probe that fires whenever an ICMPv6 Neighbor Solicit message isreceived.
ipv6IfIcmpInOverflows Probe that fires whenever an ICMPv6 message is received, but thatmessage is subsequently dropped due to lack of buffer space.
ipv6IfIcmpInParmProblems Probe that fires whenever an ICMPv6 Parameter Problem messageis received.
ipv6IfIcmpInRedirects Probe that fires whenever an ICMPv6 Redirect message is received.
ipv6IfIcmpInRouterAdvertisements Probe that fires whenever an ICMPv6 Router Advertisementmessage is received.
ipv6IfIcmpInRouterSolicits Probe that fires whenever an ICMPv6 Router Solicit message isreceived.
ipv6IfIcmpInTimeExcds Probe that fires whenever an ICMPv6 Time Exceeded message isreceived.
ipv6IfIcmpOutAdminProhibs Probe that fires whenever an ICMPv6 Destination Unreachable(Communication Administratively Prohibited) message is sent.
ipv6IfIcmpOutDestUnreachs Probe that fires whenever an ICMPv6 Destination Unreachablemessage is sent.
ipv6IfIcmpOutEchoReplies Probe that fires whenever an ICMPv6 Echo Reply message is sent.
ipv6IfIcmpOutEchos Probe that fires whenever an ICMPv6 Echo message is sent.
mib Provider
Chapter 11 • Providers 209
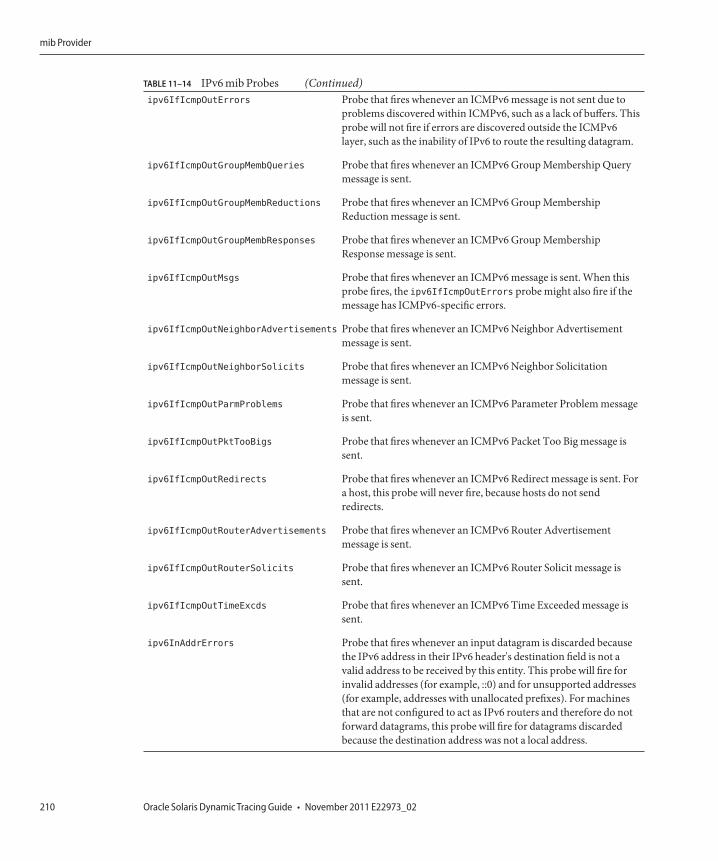
TABLE 11–14 IPv6 mib Probes (Continued)ipv6IfIcmpOutErrors Probe that fires whenever an ICMPv6 message is not sent due to
problems discovered within ICMPv6, such as a lack of buffers. Thisprobe will not fire if errors are discovered outside the ICMPv6layer, such as the inability of IPv6 to route the resulting datagram.
ipv6IfIcmpOutGroupMembQueries Probe that fires whenever an ICMPv6 Group Membership Querymessage is sent.
ipv6IfIcmpOutGroupMembReductions Probe that fires whenever an ICMPv6 Group MembershipReduction message is sent.
ipv6IfIcmpOutGroupMembResponses Probe that fires whenever an ICMPv6 Group MembershipResponse message is sent.
ipv6IfIcmpOutMsgs Probe that fires whenever an ICMPv6 message is sent. When thisprobe fires, the ipv6IfIcmpOutErrors probe might also fire if themessage has ICMPv6-specific errors.
ipv6IfIcmpOutNeighborAdvertisements Probe that fires whenever an ICMPv6 Neighbor Advertisementmessage is sent.
ipv6IfIcmpOutNeighborSolicits Probe that fires whenever an ICMPv6 Neighbor Solicitationmessage is sent.
ipv6IfIcmpOutParmProblems Probe that fires whenever an ICMPv6 Parameter Problem messageis sent.
ipv6IfIcmpOutPktTooBigs Probe that fires whenever an ICMPv6 Packet Too Big message issent.
ipv6IfIcmpOutRedirects Probe that fires whenever an ICMPv6 Redirect message is sent. Fora host, this probe will never fire, because hosts do not sendredirects.
ipv6IfIcmpOutRouterAdvertisements Probe that fires whenever an ICMPv6 Router Advertisementmessage is sent.
ipv6IfIcmpOutRouterSolicits Probe that fires whenever an ICMPv6 Router Solicit message issent.
ipv6IfIcmpOutTimeExcds Probe that fires whenever an ICMPv6 Time Exceeded message issent.
ipv6InAddrErrors Probe that fires whenever an input datagram is discarded becausethe IPv6 address in their IPv6 header's destination field is not avalid address to be received by this entity. This probe will fire forinvalid addresses (for example, ::0) and for unsupported addresses(for example, addresses with unallocated prefixes). For machinesthat are not configured to act as IPv6 routers and therefore do notforward datagrams, this probe will fire for datagrams discardedbecause the destination address was not a local address.
mib Provider
Oracle Solaris Dynamic Tracing Guide • November 2011 E22973_02210
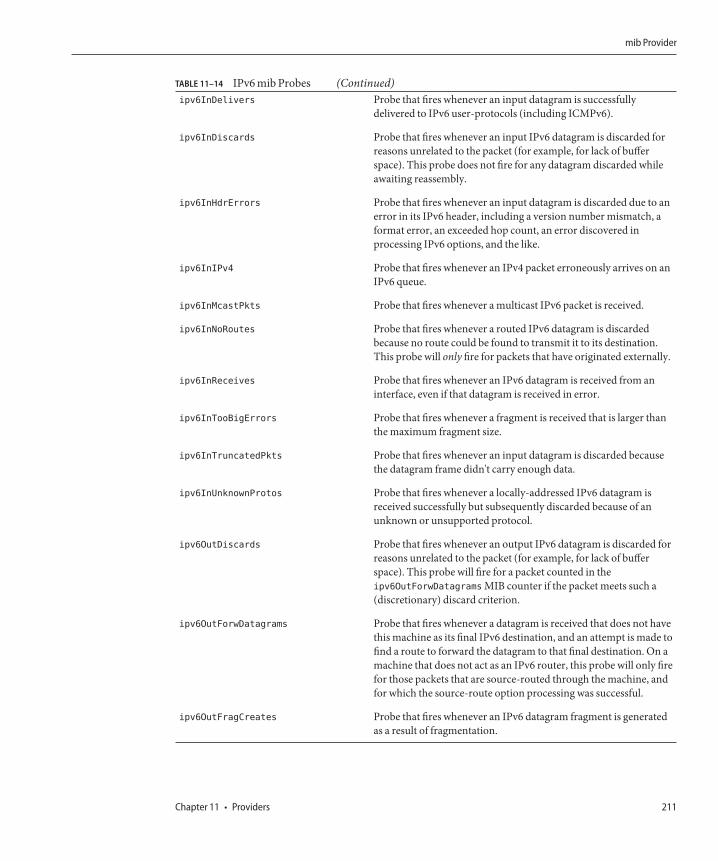
TABLE 11–14 IPv6 mib Probes (Continued)ipv6InDelivers Probe that fires whenever an input datagram is successfully
delivered to IPv6 user-protocols (including ICMPv6).
ipv6InDiscards Probe that fires whenever an input IPv6 datagram is discarded forreasons unrelated to the packet (for example, for lack of bufferspace). This probe does not fire for any datagram discarded whileawaiting reassembly.
ipv6InHdrErrors Probe that fires whenever an input datagram is discarded due to anerror in its IPv6 header, including a version number mismatch, aformat error, an exceeded hop count, an error discovered inprocessing IPv6 options, and the like.
ipv6InIPv4 Probe that fires whenever an IPv4 packet erroneously arrives on anIPv6 queue.
ipv6InMcastPkts Probe that fires whenever a multicast IPv6 packet is received.
ipv6InNoRoutes Probe that fires whenever a routed IPv6 datagram is discardedbecause no route could be found to transmit it to its destination.This probe will only fire for packets that have originated externally.
ipv6InReceives Probe that fires whenever an IPv6 datagram is received from aninterface, even if that datagram is received in error.
ipv6InTooBigErrors Probe that fires whenever a fragment is received that is larger thanthe maximum fragment size.
ipv6InTruncatedPkts Probe that fires whenever an input datagram is discarded becausethe datagram frame didn't carry enough data.
ipv6InUnknownProtos Probe that fires whenever a locally-addressed IPv6 datagram isreceived successfully but subsequently discarded because of anunknown or unsupported protocol.
ipv6OutDiscards Probe that fires whenever an output IPv6 datagram is discarded forreasons unrelated to the packet (for example, for lack of bufferspace). This probe will fire for a packet counted in theipv6OutForwDatagrams MIB counter if the packet meets such a(discretionary) discard criterion.
ipv6OutForwDatagrams Probe that fires whenever a datagram is received that does not havethis machine as its final IPv6 destination, and an attempt is made tofind a route to forward the datagram to that final destination. On amachine that does not act as an IPv6 router, this probe will only firefor those packets that are source-routed through the machine, andfor which the source-route option processing was successful.
ipv6OutFragCreates Probe that fires whenever an IPv6 datagram fragment is generatedas a result of fragmentation.
mib Provider
Chapter 11 • Providers 211
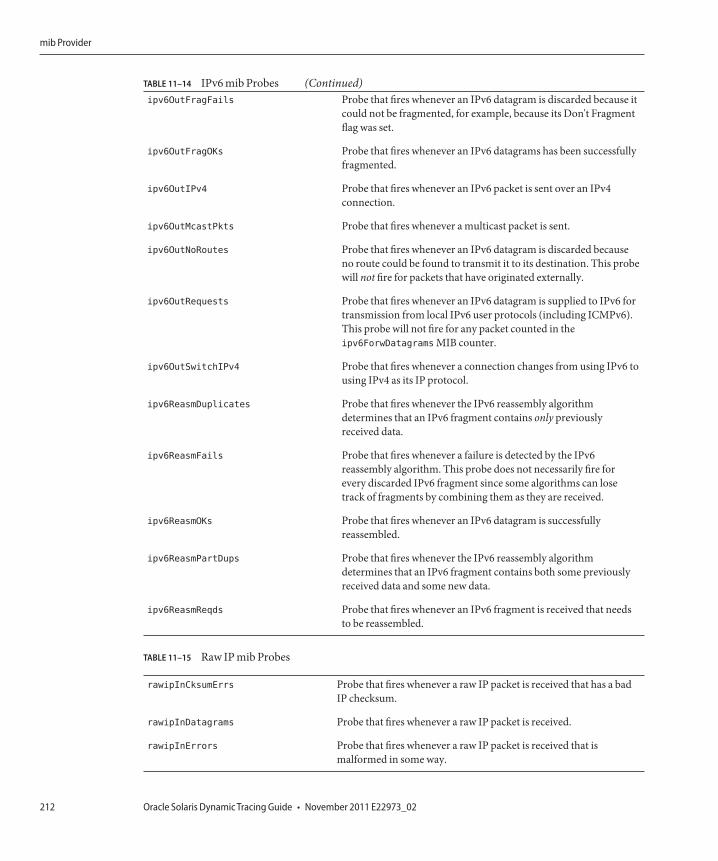
TABLE 11–14 IPv6 mib Probes (Continued)ipv6OutFragFails Probe that fires whenever an IPv6 datagram is discarded because it
could not be fragmented, for example, because its Don't Fragmentflag was set.
ipv6OutFragOKs Probe that fires whenever an IPv6 datagrams has been successfullyfragmented.
ipv6OutIPv4 Probe that fires whenever an IPv6 packet is sent over an IPv4connection.
ipv6OutMcastPkts Probe that fires whenever a multicast packet is sent.
ipv6OutNoRoutes Probe that fires whenever an IPv6 datagram is discarded becauseno route could be found to transmit it to its destination. This probewill not fire for packets that have originated externally.
ipv6OutRequests Probe that fires whenever an IPv6 datagram is supplied to IPv6 fortransmission from local IPv6 user protocols (including ICMPv6).This probe will not fire for any packet counted in theipv6ForwDatagrams MIB counter.
ipv6OutSwitchIPv4 Probe that fires whenever a connection changes from using IPv6 tousing IPv4 as its IP protocol.
ipv6ReasmDuplicates Probe that fires whenever the IPv6 reassembly algorithmdetermines that an IPv6 fragment contains only previouslyreceived data.
ipv6ReasmFails Probe that fires whenever a failure is detected by the IPv6reassembly algorithm. This probe does not necessarily fire forevery discarded IPv6 fragment since some algorithms can losetrack of fragments by combining them as they are received.
ipv6ReasmOKs Probe that fires whenever an IPv6 datagram is successfullyreassembled.
ipv6ReasmPartDups Probe that fires whenever the IPv6 reassembly algorithmdetermines that an IPv6 fragment contains both some previouslyreceived data and some new data.
ipv6ReasmReqds Probe that fires whenever an IPv6 fragment is received that needsto be reassembled.
TABLE 11–15 Raw IP mib Probes
rawipInCksumErrs Probe that fires whenever a raw IP packet is received that has a badIP checksum.
rawipInDatagrams Probe that fires whenever a raw IP packet is received.
rawipInErrors Probe that fires whenever a raw IP packet is received that ismalformed in some way.
mib Provider
Oracle Solaris Dynamic Tracing Guide • November 2011 E22973_02212
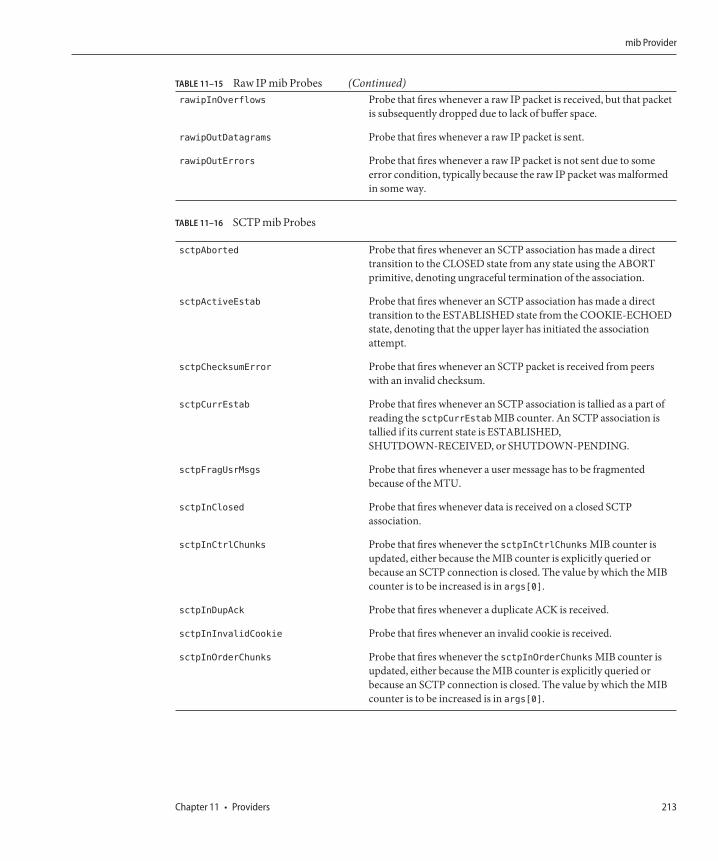
TABLE 11–15 Raw IP mib Probes (Continued)rawipInOverflows Probe that fires whenever a raw IP packet is received, but that packet
is subsequently dropped due to lack of buffer space.
rawipOutDatagrams Probe that fires whenever a raw IP packet is sent.
rawipOutErrors Probe that fires whenever a raw IP packet is not sent due to someerror condition, typically because the raw IP packet was malformedin some way.
TABLE 11–16 SCTP mib Probes
sctpAborted Probe that fires whenever an SCTP association has made a directtransition to the CLOSED state from any state using the ABORTprimitive, denoting ungraceful termination of the association.
sctpActiveEstab Probe that fires whenever an SCTP association has made a directtransition to the ESTABLISHED state from the COOKIE-ECHOEDstate, denoting that the upper layer has initiated the associationattempt.
sctpChecksumError Probe that fires whenever an SCTP packet is received from peerswith an invalid checksum.
sctpCurrEstab Probe that fires whenever an SCTP association is tallied as a part ofreading the sctpCurrEstab MIB counter. An SCTP association istallied if its current state is ESTABLISHED,SHUTDOWN-RECEIVED, or SHUTDOWN-PENDING.
sctpFragUsrMsgs Probe that fires whenever a user message has to be fragmentedbecause of the MTU.
sctpInClosed Probe that fires whenever data is received on a closed SCTPassociation.
sctpInCtrlChunks Probe that fires whenever the sctpInCtrlChunks MIB counter isupdated, either because the MIB counter is explicitly queried orbecause an SCTP connection is closed. The value by which the MIBcounter is to be increased is in args[0].
sctpInDupAck Probe that fires whenever a duplicate ACK is received.
sctpInInvalidCookie Probe that fires whenever an invalid cookie is received.
sctpInOrderChunks Probe that fires whenever the sctpInOrderChunks MIB counter isupdated, either because the MIB counter is explicitly queried orbecause an SCTP connection is closed. The value by which the MIBcounter is to be increased is in args[0].
mib Provider
Chapter 11 • Providers 213
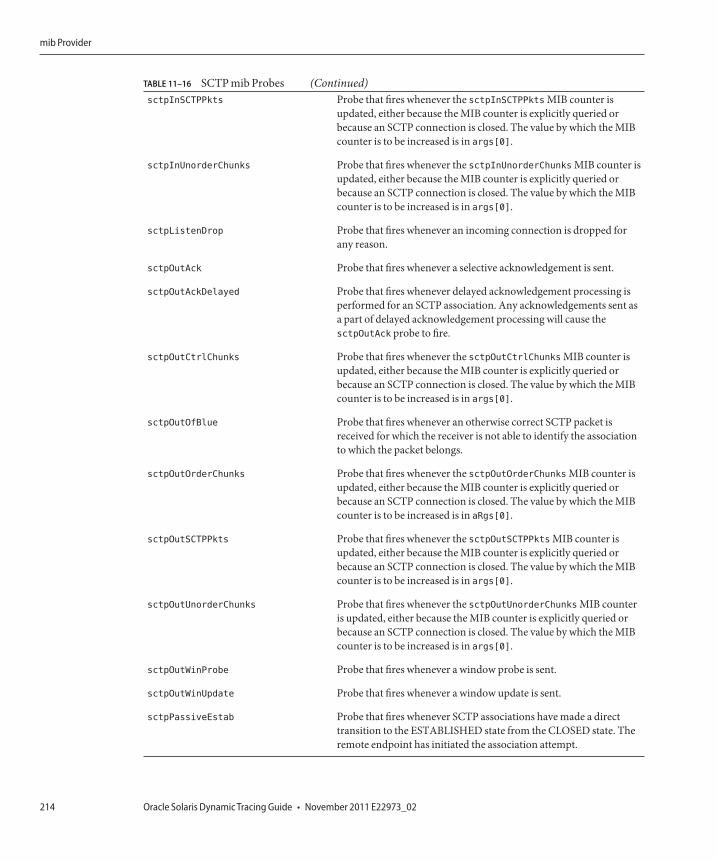
TABLE 11–16 SCTP mib Probes (Continued)sctpInSCTPPkts Probe that fires whenever the sctpInSCTPPkts MIB counter is
updated, either because the MIB counter is explicitly queried orbecause an SCTP connection is closed. The value by which the MIBcounter is to be increased is in args[0].
sctpInUnorderChunks Probe that fires whenever the sctpInUnorderChunks MIB counter isupdated, either because the MIB counter is explicitly queried orbecause an SCTP connection is closed. The value by which the MIBcounter is to be increased is in args[0].
sctpListenDrop Probe that fires whenever an incoming connection is dropped forany reason.
sctpOutAck Probe that fires whenever a selective acknowledgement is sent.
sctpOutAckDelayed Probe that fires whenever delayed acknowledgement processing isperformed for an SCTP association. Any acknowledgements sent asa part of delayed acknowledgement processing will cause thesctpOutAck probe to fire.
sctpOutCtrlChunks Probe that fires whenever the sctpOutCtrlChunks MIB counter isupdated, either because the MIB counter is explicitly queried orbecause an SCTP connection is closed. The value by which the MIBcounter is to be increased is in args[0].
sctpOutOfBlue Probe that fires whenever an otherwise correct SCTP packet isreceived for which the receiver is not able to identify the associationto which the packet belongs.
sctpOutOrderChunks Probe that fires whenever the sctpOutOrderChunks MIB counter isupdated, either because the MIB counter is explicitly queried orbecause an SCTP connection is closed. The value by which the MIBcounter is to be increased is in aRgs[0].
sctpOutSCTPPkts Probe that fires whenever the sctpOutSCTPPkts MIB counter isupdated, either because the MIB counter is explicitly queried orbecause an SCTP connection is closed. The value by which the MIBcounter is to be increased is in args[0].
sctpOutUnorderChunks Probe that fires whenever the sctpOutUnorderChunks MIB counteris updated, either because the MIB counter is explicitly queried orbecause an SCTP connection is closed. The value by which the MIBcounter is to be increased is in args[0].
sctpOutWinProbe Probe that fires whenever a window probe is sent.
sctpOutWinUpdate Probe that fires whenever a window update is sent.
sctpPassiveEstab Probe that fires whenever SCTP associations have made a directtransition to the ESTABLISHED state from the CLOSED state. Theremote endpoint has initiated the association attempt.
mib Provider
Oracle Solaris Dynamic Tracing Guide • November 2011 E22973_02214
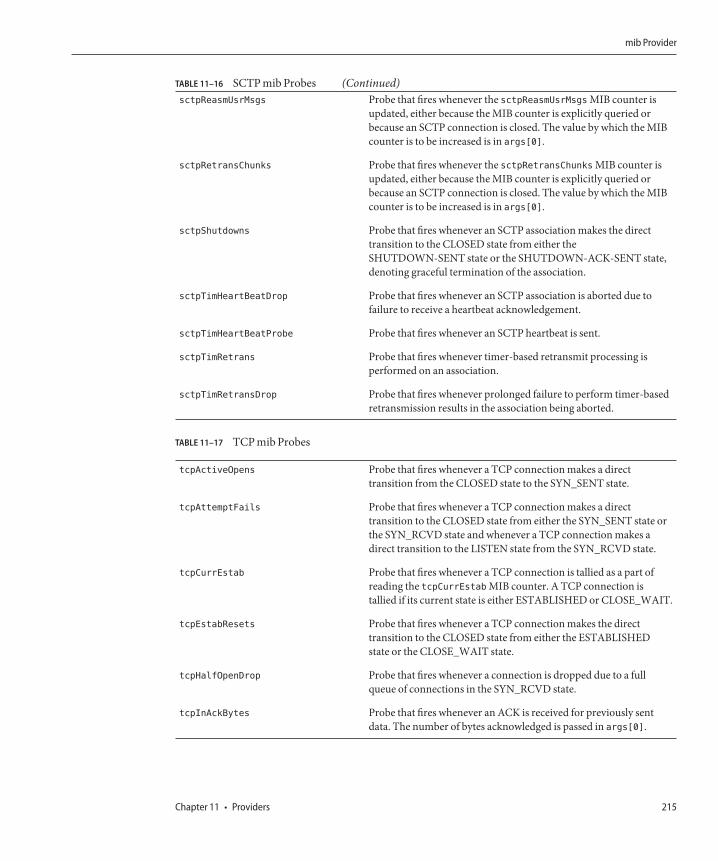
TABLE 11–16 SCTP mib Probes (Continued)sctpReasmUsrMsgs Probe that fires whenever the sctpReasmUsrMsgs MIB counter is
updated, either because the MIB counter is explicitly queried orbecause an SCTP connection is closed. The value by which the MIBcounter is to be increased is in args[0].
sctpRetransChunks Probe that fires whenever the sctpRetransChunks MIB counter isupdated, either because the MIB counter is explicitly queried orbecause an SCTP connection is closed. The value by which the MIBcounter is to be increased is in args[0].
sctpShutdowns Probe that fires whenever an SCTP association makes the directtransition to the CLOSED state from either theSHUTDOWN-SENT state or the SHUTDOWN-ACK-SENT state,denoting graceful termination of the association.
sctpTimHeartBeatDrop Probe that fires whenever an SCTP association is aborted due tofailure to receive a heartbeat acknowledgement.
sctpTimHeartBeatProbe Probe that fires whenever an SCTP heartbeat is sent.
sctpTimRetrans Probe that fires whenever timer-based retransmit processing isperformed on an association.
sctpTimRetransDrop Probe that fires whenever prolonged failure to perform timer-basedretransmission results in the association being aborted.
TABLE 11–17 TCP mib Probes
tcpActiveOpens Probe that fires whenever a TCP connection makes a directtransition from the CLOSED state to the SYN_SENT state.
tcpAttemptFails Probe that fires whenever a TCP connection makes a directtransition to the CLOSED state from either the SYN_SENT state orthe SYN_RCVD state and whenever a TCP connection makes adirect transition to the LISTEN state from the SYN_RCVD state.
tcpCurrEstab Probe that fires whenever a TCP connection is tallied as a part ofreading the tcpCurrEstab MIB counter. A TCP connection istallied if its current state is either ESTABLISHED or CLOSE_WAIT.
tcpEstabResets Probe that fires whenever a TCP connection makes the directtransition to the CLOSED state from either the ESTABLISHEDstate or the CLOSE_WAIT state.
tcpHalfOpenDrop Probe that fires whenever a connection is dropped due to a fullqueue of connections in the SYN_RCVD state.
tcpInAckBytes Probe that fires whenever an ACK is received for previously sentdata. The number of bytes acknowledged is passed in args[0].
mib Provider
Chapter 11 • Providers 215
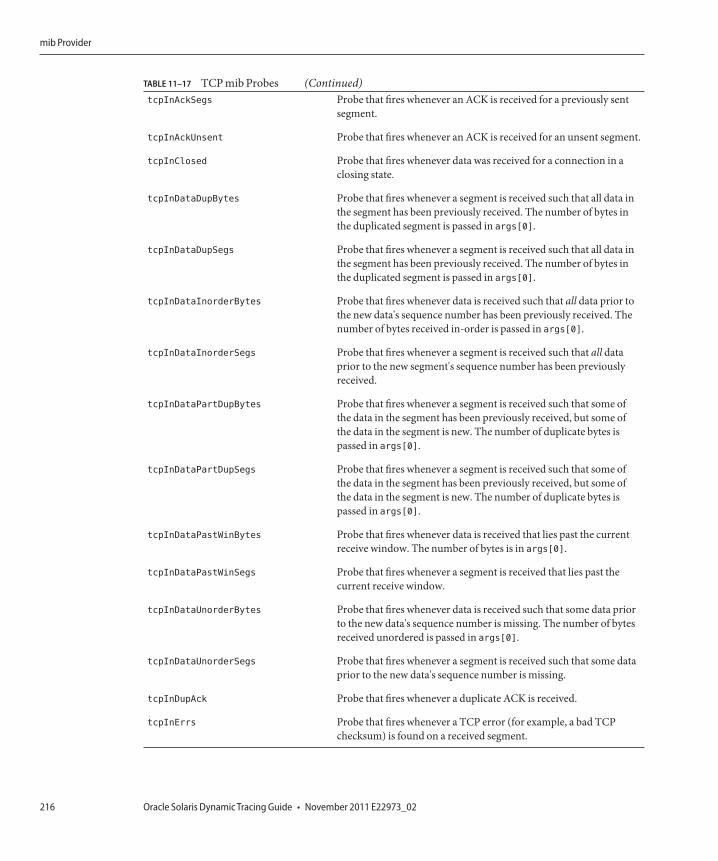
TABLE 11–17 TCP mib Probes (Continued)tcpInAckSegs Probe that fires whenever an ACK is received for a previously sent
segment.
tcpInAckUnsent Probe that fires whenever an ACK is received for an unsent segment.
tcpInClosed Probe that fires whenever data was received for a connection in aclosing state.
tcpInDataDupBytes Probe that fires whenever a segment is received such that all data inthe segment has been previously received. The number of bytes inthe duplicated segment is passed in args[0].
tcpInDataDupSegs Probe that fires whenever a segment is received such that all data inthe segment has been previously received. The number of bytes inthe duplicated segment is passed in args[0].
tcpInDataInorderBytes Probe that fires whenever data is received such that all data prior tothe new data's sequence number has been previously received. Thenumber of bytes received in-order is passed in args[0].
tcpInDataInorderSegs Probe that fires whenever a segment is received such that all dataprior to the new segment's sequence number has been previouslyreceived.
tcpInDataPartDupBytes Probe that fires whenever a segment is received such that some ofthe data in the segment has been previously received, but some ofthe data in the segment is new. The number of duplicate bytes ispassed in args[0].
tcpInDataPartDupSegs Probe that fires whenever a segment is received such that some ofthe data in the segment has been previously received, but some ofthe data in the segment is new. The number of duplicate bytes ispassed in args[0].
tcpInDataPastWinBytes Probe that fires whenever data is received that lies past the currentreceive window. The number of bytes is in args[0].
tcpInDataPastWinSegs Probe that fires whenever a segment is received that lies past thecurrent receive window.
tcpInDataUnorderBytes Probe that fires whenever data is received such that some data priorto the new data's sequence number is missing. The number of bytesreceived unordered is passed in args[0].
tcpInDataUnorderSegs Probe that fires whenever a segment is received such that some dataprior to the new data's sequence number is missing.
tcpInDupAck Probe that fires whenever a duplicate ACK is received.
tcpInErrs Probe that fires whenever a TCP error (for example, a bad TCPchecksum) is found on a received segment.
mib Provider
Oracle Solaris Dynamic Tracing Guide • November 2011 E22973_02216
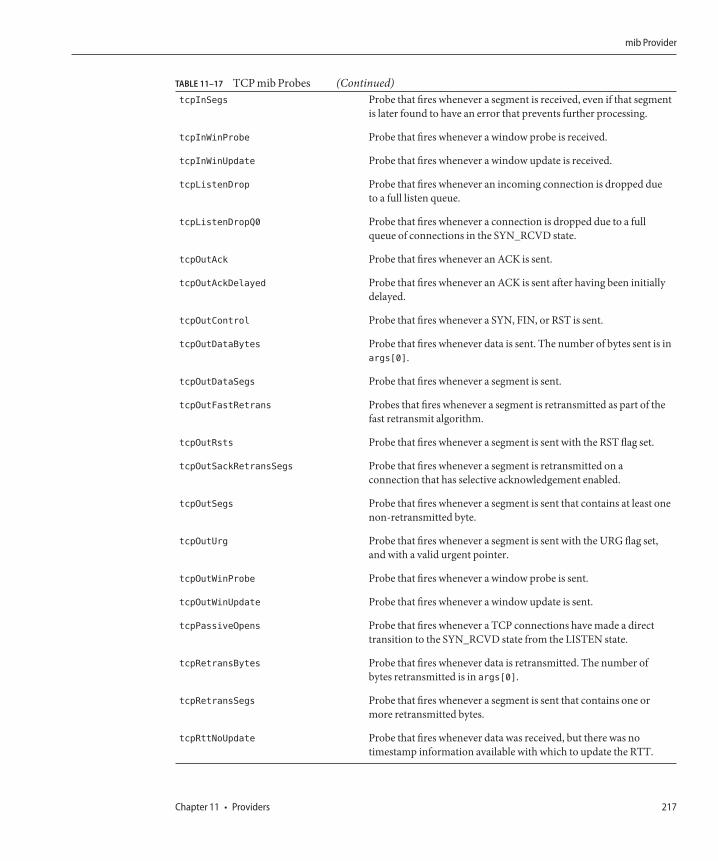
TABLE 11–17 TCP mib Probes (Continued)tcpInSegs Probe that fires whenever a segment is received, even if that segment
is later found to have an error that prevents further processing.
tcpInWinProbe Probe that fires whenever a window probe is received.
tcpInWinUpdate Probe that fires whenever a window update is received.
tcpListenDrop Probe that fires whenever an incoming connection is dropped dueto a full listen queue.
tcpListenDropQ0 Probe that fires whenever a connection is dropped due to a fullqueue of connections in the SYN_RCVD state.
tcpOutAck Probe that fires whenever an ACK is sent.
tcpOutAckDelayed Probe that fires whenever an ACK is sent after having been initiallydelayed.
tcpOutControl Probe that fires whenever a SYN, FIN, or RST is sent.
tcpOutDataBytes Probe that fires whenever data is sent. The number of bytes sent is inargs[0].
tcpOutDataSegs Probe that fires whenever a segment is sent.
tcpOutFastRetrans Probes that fires whenever a segment is retransmitted as part of thefast retransmit algorithm.
tcpOutRsts Probe that fires whenever a segment is sent with the RST flag set.
tcpOutSackRetransSegs Probe that fires whenever a segment is retransmitted on aconnection that has selective acknowledgement enabled.
tcpOutSegs Probe that fires whenever a segment is sent that contains at least onenon-retransmitted byte.
tcpOutUrg Probe that fires whenever a segment is sent with the URG flag set,and with a valid urgent pointer.
tcpOutWinProbe Probe that fires whenever a window probe is sent.
tcpOutWinUpdate Probe that fires whenever a window update is sent.
tcpPassiveOpens Probe that fires whenever a TCP connections have made a directtransition to the SYN_RCVD state from the LISTEN state.
tcpRetransBytes Probe that fires whenever data is retransmitted. The number ofbytes retransmitted is in args[0].
tcpRetransSegs Probe that fires whenever a segment is sent that contains one ormore retransmitted bytes.
tcpRttNoUpdate Probe that fires whenever data was received, but there was notimestamp information available with which to update the RTT.
mib Provider
Chapter 11 • Providers 217
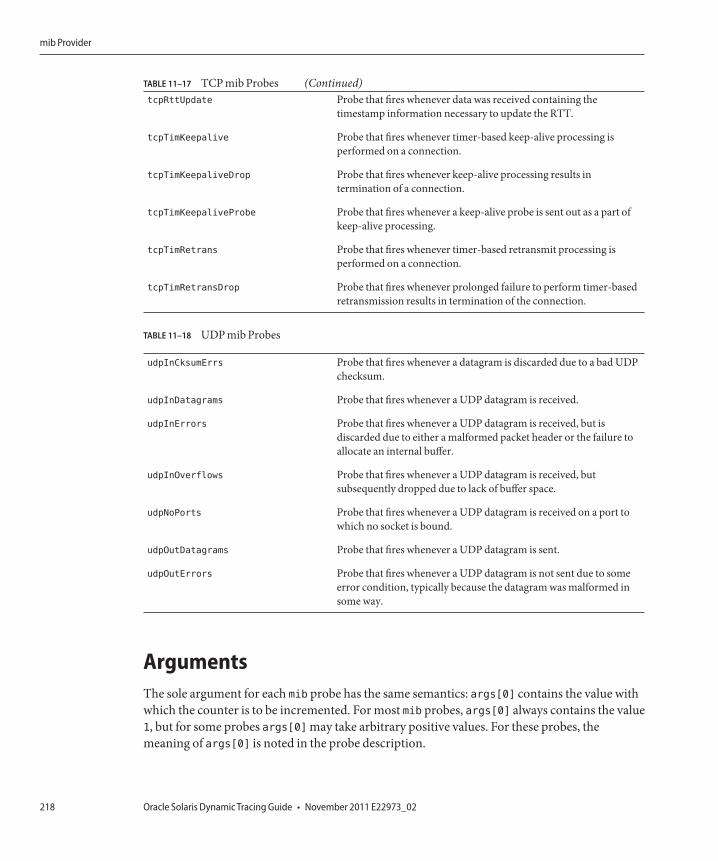
TABLE 11–17 TCP mib Probes (Continued)tcpRttUpdate Probe that fires whenever data was received containing the
timestamp information necessary to update the RTT.
tcpTimKeepalive Probe that fires whenever timer-based keep-alive processing isperformed on a connection.
tcpTimKeepaliveDrop Probe that fires whenever keep-alive processing results intermination of a connection.
tcpTimKeepaliveProbe Probe that fires whenever a keep-alive probe is sent out as a part ofkeep-alive processing.
tcpTimRetrans Probe that fires whenever timer-based retransmit processing isperformed on a connection.
tcpTimRetransDrop Probe that fires whenever prolonged failure to perform timer-basedretransmission results in termination of the connection.
TABLE 11–18 UDP mib Probes
udpInCksumErrs Probe that fires whenever a datagram is discarded due to a bad UDPchecksum.
udpInDatagrams Probe that fires whenever a UDP datagram is received.
udpInErrors Probe that fires whenever a UDP datagram is received, but isdiscarded due to either a malformed packet header or the failure toallocate an internal buffer.
udpInOverflows Probe that fires whenever a UDP datagram is received, butsubsequently dropped due to lack of buffer space.
udpNoPorts Probe that fires whenever a UDP datagram is received on a port towhich no socket is bound.
udpOutDatagrams Probe that fires whenever a UDP datagram is sent.
udpOutErrors Probe that fires whenever a UDP datagram is not sent due to someerror condition, typically because the datagram was malformed insome way.
ArgumentsThe sole argument for each mib probe has the same semantics: args[0] contains the value withwhich the counter is to be incremented. For most mib probes, args[0] always contains the value1, but for some probes args[0] may take arbitrary positive values. For these probes, themeaning of args[0] is noted in the probe description.
mib Provider
Oracle Solaris Dynamic Tracing Guide • November 2011 E22973_02218
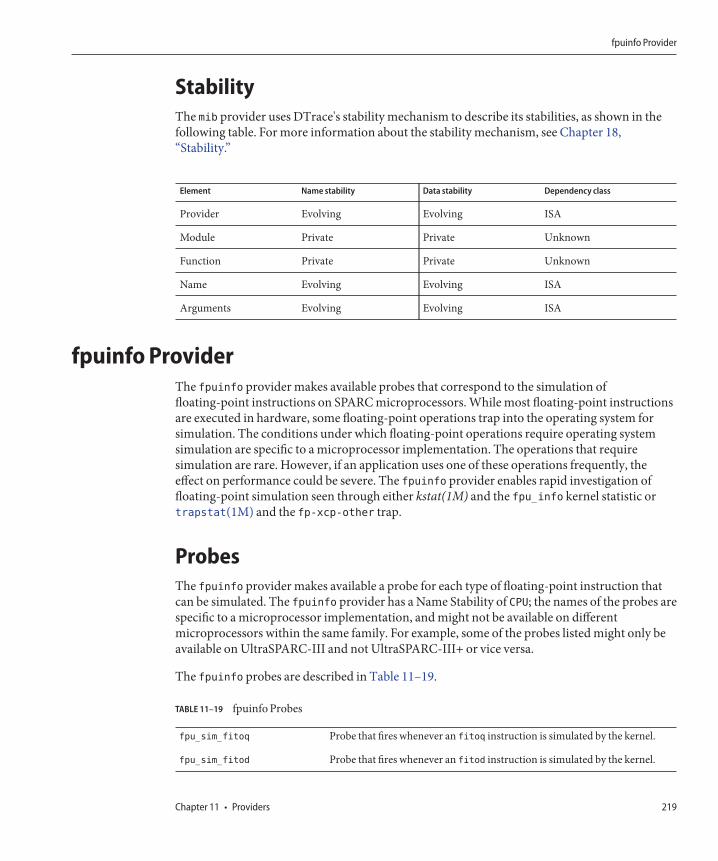
StabilityThe mib provider uses DTrace's stability mechanism to describe its stabilities, as shown in thefollowing table. For more information about the stability mechanism, see Chapter 18,“Stability.”
Element Name stability Data stability Dependency class
Provider Evolving Evolving ISA
Module Private Private Unknown
Function Private Private Unknown
Name Evolving Evolving ISA
Arguments Evolving Evolving ISA
fpuinfo ProviderThe fpuinfo provider makes available probes that correspond to the simulation offloating-point instructions on SPARC microprocessors. While most floating-point instructionsare executed in hardware, some floating-point operations trap into the operating system forsimulation. The conditions under which floating-point operations require operating systemsimulation are specific to a microprocessor implementation. The operations that requiresimulation are rare. However, if an application uses one of these operations frequently, theeffect on performance could be severe. The fpuinfo provider enables rapid investigation offloating-point simulation seen through either kstat(1M) and the fpu_info kernel statistic ortrapstat(1M) and the fp-xcp-other trap.
ProbesThe fpuinfo provider makes available a probe for each type of floating-point instruction thatcan be simulated. The fpuinfo provider has a Name Stability of CPU; the names of the probes arespecific to a microprocessor implementation, and might not be available on differentmicroprocessors within the same family. For example, some of the probes listed might only beavailable on UltraSPARC-III and not UltraSPARC-III+ or vice versa.
The fpuinfo probes are described in Table 11–19.
TABLE 11–19 fpuinfo Probes
fpu_sim_fitoq Probe that fires whenever an fitoq instruction is simulated by the kernel.
fpu_sim_fitod Probe that fires whenever an fitod instruction is simulated by the kernel.
fpuinfo Provider
Chapter 11 • Providers 219
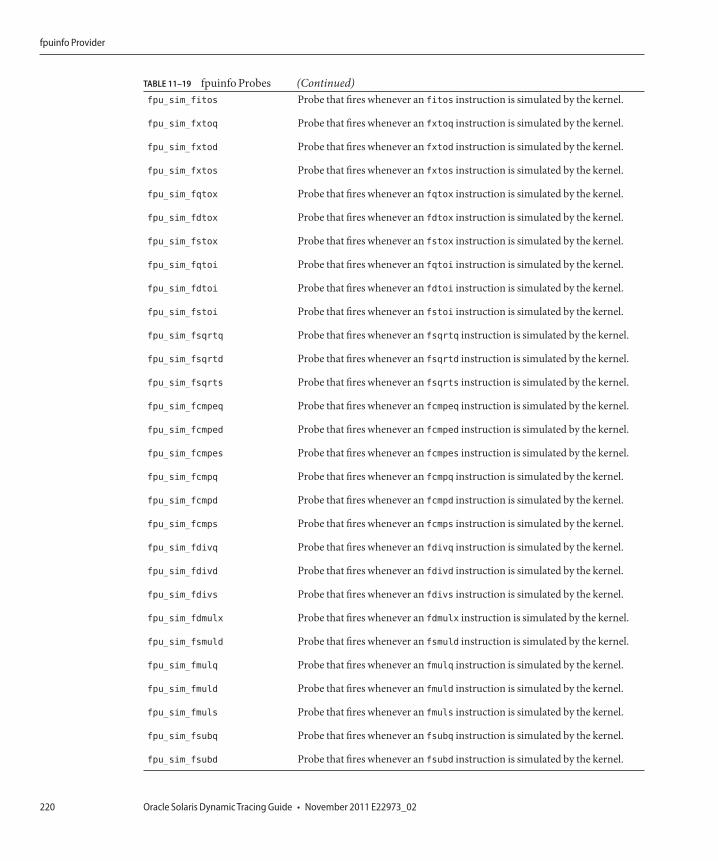
TABLE 11–19 fpuinfo Probes (Continued)fpu_sim_fitos Probe that fires whenever an fitos instruction is simulated by the kernel.
fpu_sim_fxtoq Probe that fires whenever an fxtoq instruction is simulated by the kernel.
fpu_sim_fxtod Probe that fires whenever an fxtod instruction is simulated by the kernel.
fpu_sim_fxtos Probe that fires whenever an fxtos instruction is simulated by the kernel.
fpu_sim_fqtox Probe that fires whenever an fqtox instruction is simulated by the kernel.
fpu_sim_fdtox Probe that fires whenever an fdtox instruction is simulated by the kernel.
fpu_sim_fstox Probe that fires whenever an fstox instruction is simulated by the kernel.
fpu_sim_fqtoi Probe that fires whenever an fqtoi instruction is simulated by the kernel.
fpu_sim_fdtoi Probe that fires whenever an fdtoi instruction is simulated by the kernel.
fpu_sim_fstoi Probe that fires whenever an fstoi instruction is simulated by the kernel.
fpu_sim_fsqrtq Probe that fires whenever an fsqrtq instruction is simulated by the kernel.
fpu_sim_fsqrtd Probe that fires whenever an fsqrtd instruction is simulated by the kernel.
fpu_sim_fsqrts Probe that fires whenever an fsqrts instruction is simulated by the kernel.
fpu_sim_fcmpeq Probe that fires whenever an fcmpeq instruction is simulated by the kernel.
fpu_sim_fcmped Probe that fires whenever an fcmped instruction is simulated by the kernel.
fpu_sim_fcmpes Probe that fires whenever an fcmpes instruction is simulated by the kernel.
fpu_sim_fcmpq Probe that fires whenever an fcmpq instruction is simulated by the kernel.
fpu_sim_fcmpd Probe that fires whenever an fcmpd instruction is simulated by the kernel.
fpu_sim_fcmps Probe that fires whenever an fcmps instruction is simulated by the kernel.
fpu_sim_fdivq Probe that fires whenever an fdivq instruction is simulated by the kernel.
fpu_sim_fdivd Probe that fires whenever an fdivd instruction is simulated by the kernel.
fpu_sim_fdivs Probe that fires whenever an fdivs instruction is simulated by the kernel.
fpu_sim_fdmulx Probe that fires whenever an fdmulx instruction is simulated by the kernel.
fpu_sim_fsmuld Probe that fires whenever an fsmuld instruction is simulated by the kernel.
fpu_sim_fmulq Probe that fires whenever an fmulq instruction is simulated by the kernel.
fpu_sim_fmuld Probe that fires whenever an fmuld instruction is simulated by the kernel.
fpu_sim_fmuls Probe that fires whenever an fmuls instruction is simulated by the kernel.
fpu_sim_fsubq Probe that fires whenever an fsubq instruction is simulated by the kernel.
fpu_sim_fsubd Probe that fires whenever an fsubd instruction is simulated by the kernel.
fpuinfo Provider
Oracle Solaris Dynamic Tracing Guide • November 2011 E22973_02220
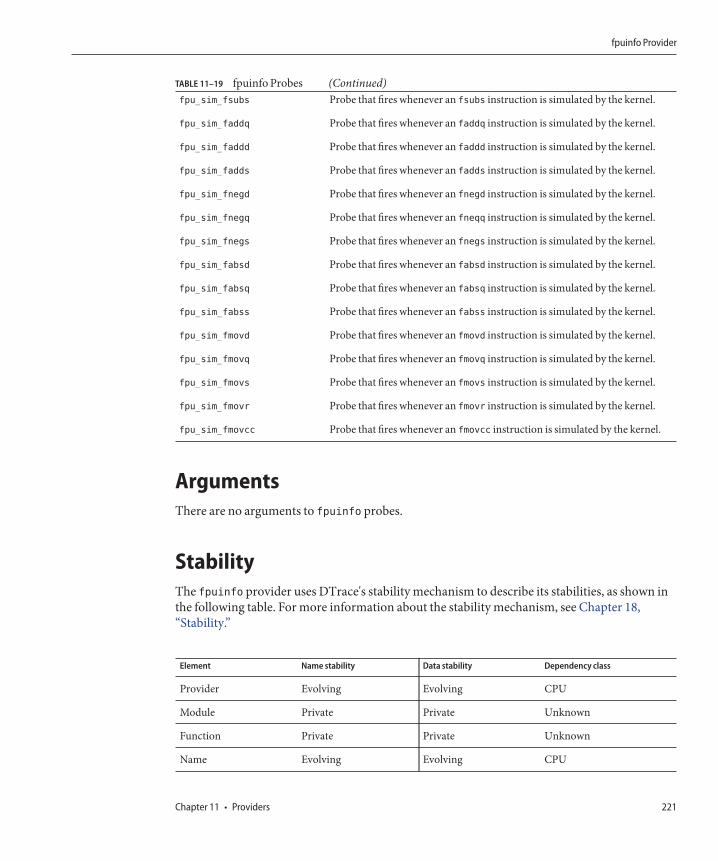
TABLE 11–19 fpuinfo Probes (Continued)fpu_sim_fsubs Probe that fires whenever an fsubs instruction is simulated by the kernel.
fpu_sim_faddq Probe that fires whenever an faddq instruction is simulated by the kernel.
fpu_sim_faddd Probe that fires whenever an faddd instruction is simulated by the kernel.
fpu_sim_fadds Probe that fires whenever an fadds instruction is simulated by the kernel.
fpu_sim_fnegd Probe that fires whenever an fnegd instruction is simulated by the kernel.
fpu_sim_fnegq Probe that fires whenever an fneqq instruction is simulated by the kernel.
fpu_sim_fnegs Probe that fires whenever an fnegs instruction is simulated by the kernel.
fpu_sim_fabsd Probe that fires whenever an fabsd instruction is simulated by the kernel.
fpu_sim_fabsq Probe that fires whenever an fabsq instruction is simulated by the kernel.
fpu_sim_fabss Probe that fires whenever an fabss instruction is simulated by the kernel.
fpu_sim_fmovd Probe that fires whenever an fmovd instruction is simulated by the kernel.
fpu_sim_fmovq Probe that fires whenever an fmovq instruction is simulated by the kernel.
fpu_sim_fmovs Probe that fires whenever an fmovs instruction is simulated by the kernel.
fpu_sim_fmovr Probe that fires whenever an fmovr instruction is simulated by the kernel.
fpu_sim_fmovcc Probe that fires whenever an fmovcc instruction is simulated by the kernel.
ArgumentsThere are no arguments to fpuinfo probes.
StabilityThe fpuinfo provider uses DTrace's stability mechanism to describe its stabilities, as shown inthe following table. For more information about the stability mechanism, see Chapter 18,“Stability.”
Element Name stability Data stability Dependency class
Provider Evolving Evolving CPU
Module Private Private Unknown
Function Private Private Unknown
Name Evolving Evolving CPU
fpuinfo Provider
Chapter 11 • Providers 221
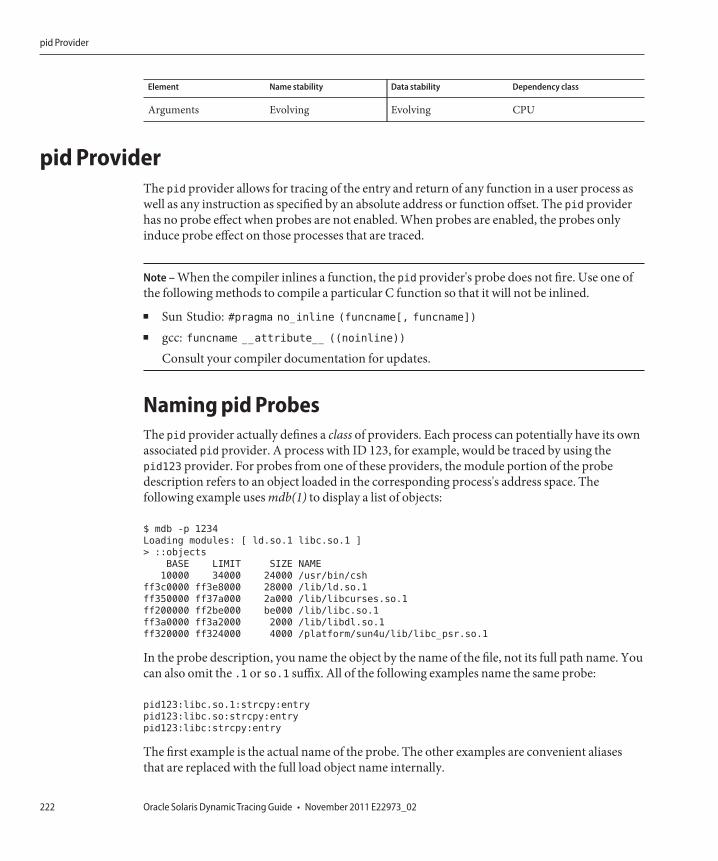
Element Name stability Data stability Dependency class
Arguments Evolving Evolving CPU
pid ProviderThe pid provider allows for tracing of the entry and return of any function in a user process aswell as any instruction as specified by an absolute address or function offset. The pid providerhas no probe effect when probes are not enabled. When probes are enabled, the probes onlyinduce probe effect on those processes that are traced.
Note – When the compiler inlines a function, the pid provider's probe does not fire. Use one ofthe following methods to compile a particular C function so that it will not be inlined.■ Sun Studio: #pragma no_inline (funcname[, funcname])
■ gcc: funcname __attribute__ ((noinline))
Consult your compiler documentation for updates.
Naming pid ProbesThe pid provider actually defines a class of providers. Each process can potentially have its ownassociated pid provider. A process with ID 123, for example, would be traced by using thepid123 provider. For probes from one of these providers, the module portion of the probedescription refers to an object loaded in the corresponding process's address space. Thefollowing example uses mdb(1) to display a list of objects:
$ mdb -p 1234
Loading modules: [ ld.so.1 libc.so.1 ]
> ::objects
BASE LIMIT SIZE NAME
10000 34000 24000 /usr/bin/csh
ff3c0000 ff3e8000 28000 /lib/ld.so.1
ff350000 ff37a000 2a000 /lib/libcurses.so.1
ff200000 ff2be000 be000 /lib/libc.so.1
ff3a0000 ff3a2000 2000 /lib/libdl.so.1
ff320000 ff324000 4000 /platform/sun4u/lib/libc_psr.so.1
In the probe description, you name the object by the name of the file, not its full path name. Youcan also omit the .1 or so.1 suffix. All of the following examples name the same probe:
pid123:libc.so.1:strcpy:entry
pid123:libc.so:strcpy:entry
pid123:libc:strcpy:entry
The first example is the actual name of the probe. The other examples are convenient aliasesthat are replaced with the full load object name internally.
pid Provider
Oracle Solaris Dynamic Tracing Guide • November 2011 E22973_02222
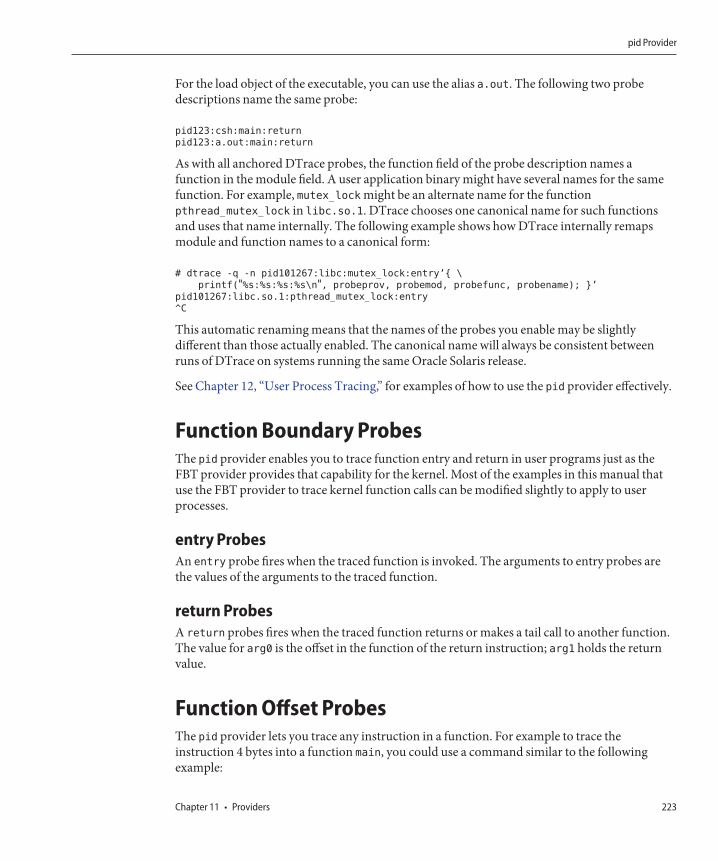
For the load object of the executable, you can use the alias a.out. The following two probedescriptions name the same probe:
pid123:csh:main:return
pid123:a.out:main:return
As with all anchored DTrace probes, the function field of the probe description names afunction in the module field. A user application binary might have several names for the samefunction. For example, mutex_lock might be an alternate name for the functionpthread_mutex_lock in libc.so.1. DTrace chooses one canonical name for such functionsand uses that name internally. The following example shows how DTrace internally remapsmodule and function names to a canonical form:
# dtrace -q -n pid101267:libc:mutex_lock:entry’{ \
printf("%s:%s:%s:%s\n", probeprov, probemod, probefunc, probename); }’
pid101267:libc.so.1:pthread_mutex_lock:entry
^C
This automatic renaming means that the names of the probes you enable may be slightlydifferent than those actually enabled. The canonical name will always be consistent betweenruns of DTrace on systems running the same Oracle Solaris release.
See Chapter 12, “User Process Tracing,” for examples of how to use the pid provider effectively.
Function Boundary ProbesThe pid provider enables you to trace function entry and return in user programs just as theFBT provider provides that capability for the kernel. Most of the examples in this manual thatuse the FBT provider to trace kernel function calls can be modified slightly to apply to userprocesses.
entry ProbesAn entry probe fires when the traced function is invoked. The arguments to entry probes arethe values of the arguments to the traced function.
return ProbesA return probes fires when the traced function returns or makes a tail call to another function.The value for arg0 is the offset in the function of the return instruction; arg1 holds the returnvalue.
Function Offset ProbesThe pid provider lets you trace any instruction in a function. For example to trace theinstruction 4 bytes into a function main, you could use a command similar to the followingexample:
pid Provider
Chapter 11 • Providers 223
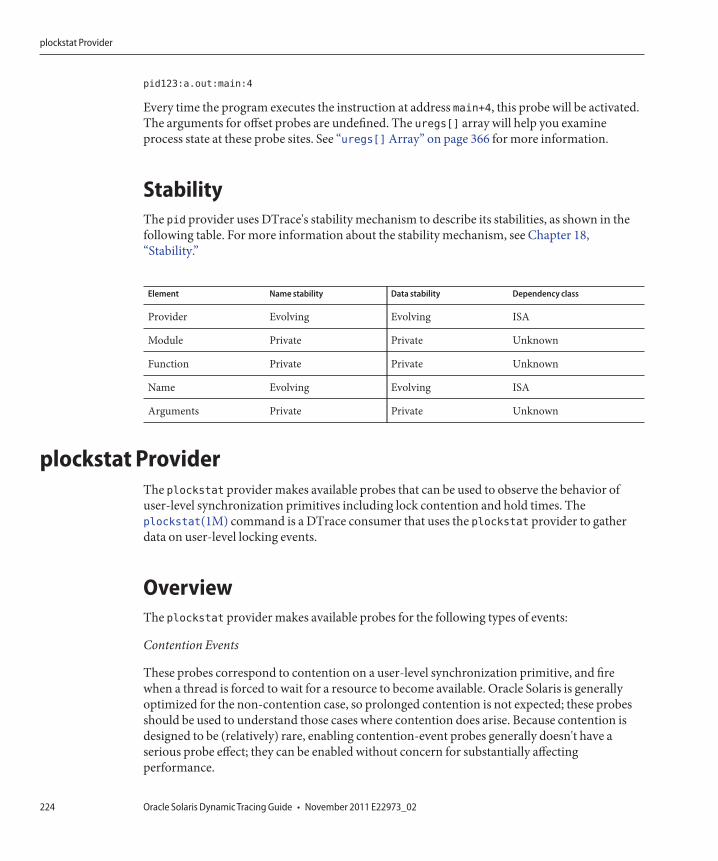
pid123:a.out:main:4
Every time the program executes the instruction at address main+4, this probe will be activated.The arguments for offset probes are undefined. The uregs[] array will help you examineprocess state at these probe sites. See “uregs[] Array” on page 366 for more information.
StabilityThe pid provider uses DTrace's stability mechanism to describe its stabilities, as shown in thefollowing table. For more information about the stability mechanism, see Chapter 18,“Stability.”
Element Name stability Data stability Dependency class
Provider Evolving Evolving ISA
Module Private Private Unknown
Function Private Private Unknown
Name Evolving Evolving ISA
Arguments Private Private Unknown
plockstat ProviderThe plockstat provider makes available probes that can be used to observe the behavior ofuser-level synchronization primitives including lock contention and hold times. Theplockstat(1M) command is a DTrace consumer that uses the plockstat provider to gatherdata on user-level locking events.
OverviewThe plockstat provider makes available probes for the following types of events:
Contention Events
These probes correspond to contention on a user-level synchronization primitive, and firewhen a thread is forced to wait for a resource to become available. Oracle Solaris is generallyoptimized for the non-contention case, so prolonged contention is not expected; these probesshould be used to understand those cases where contention does arise. Because contention isdesigned to be (relatively) rare, enabling contention-event probes generally doesn't have aserious probe effect; they can be enabled without concern for substantially affectingperformance.
plockstat Provider
Oracle Solaris Dynamic Tracing Guide • November 2011 E22973_02224
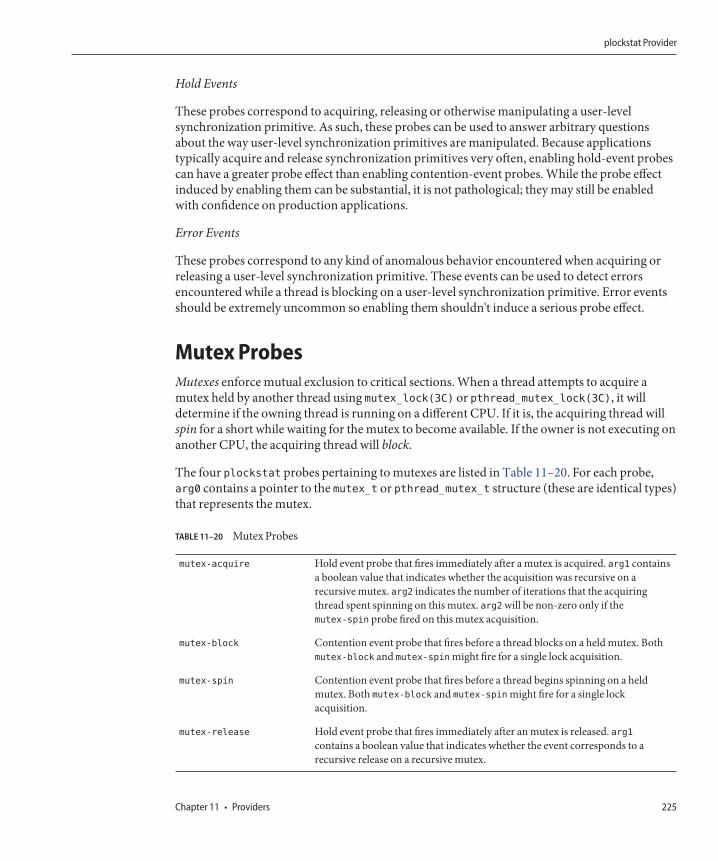
Hold Events
These probes correspond to acquiring, releasing or otherwise manipulating a user-levelsynchronization primitive. As such, these probes can be used to answer arbitrary questionsabout the way user-level synchronization primitives are manipulated. Because applicationstypically acquire and release synchronization primitives very often, enabling hold-event probescan have a greater probe effect than enabling contention-event probes. While the probe effectinduced by enabling them can be substantial, it is not pathological; they may still be enabledwith confidence on production applications.
Error Events
These probes correspond to any kind of anomalous behavior encountered when acquiring orreleasing a user-level synchronization primitive. These events can be used to detect errorsencountered while a thread is blocking on a user-level synchronization primitive. Error eventsshould be extremely uncommon so enabling them shouldn't induce a serious probe effect.
Mutex ProbesMutexes enforce mutual exclusion to critical sections. When a thread attempts to acquire amutex held by another thread using mutex_lock(3C) or pthread_mutex_lock(3C), it willdetermine if the owning thread is running on a different CPU. If it is, the acquiring thread willspin for a short while waiting for the mutex to become available. If the owner is not executing onanother CPU, the acquiring thread will block.
The four plockstat probes pertaining to mutexes are listed in Table 11–20. For each probe,arg0 contains a pointer to the mutex_t or pthread_mutex_t structure (these are identical types)that represents the mutex.
TABLE 11–20 Mutex Probes
mutex-acquire Hold event probe that fires immediately after a mutex is acquired. arg1 containsa boolean value that indicates whether the acquisition was recursive on arecursive mutex. arg2 indicates the number of iterations that the acquiringthread spent spinning on this mutex. arg2 will be non-zero only if themutex-spin probe fired on this mutex acquisition.
mutex-block Contention event probe that fires before a thread blocks on a held mutex. Bothmutex-block and mutex-spin might fire for a single lock acquisition.
mutex-spin Contention event probe that fires before a thread begins spinning on a heldmutex. Both mutex-block and mutex-spin might fire for a single lockacquisition.
mutex-release Hold event probe that fires immediately after an mutex is released. arg1contains a boolean value that indicates whether the event corresponds to arecursive release on a recursive mutex.
plockstat Provider
Chapter 11 • Providers 225
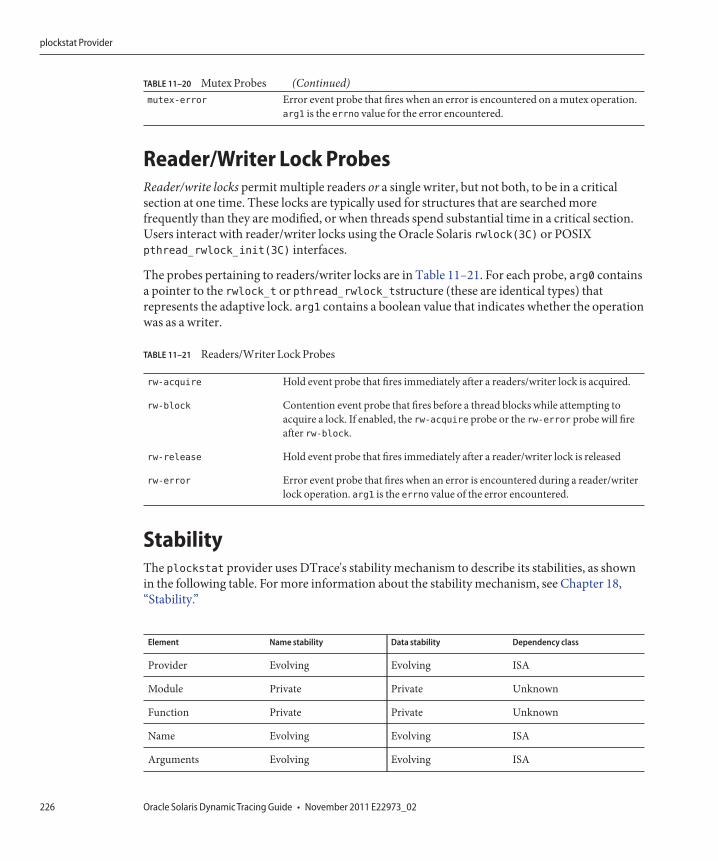
TABLE 11–20 Mutex Probes (Continued)mutex-error Error event probe that fires when an error is encountered on a mutex operation.
arg1 is the errno value for the error encountered.
Reader/Writer Lock ProbesReader/write locks permit multiple readers or a single writer, but not both, to be in a criticalsection at one time. These locks are typically used for structures that are searched morefrequently than they are modified, or when threads spend substantial time in a critical section.Users interact with reader/writer locks using the Oracle Solaris rwlock(3C) or POSIXpthread_rwlock_init(3C) interfaces.
The probes pertaining to readers/writer locks are in Table 11–21. For each probe, arg0 containsa pointer to the rwlock_t or pthread_rwlock_tstructure (these are identical types) thatrepresents the adaptive lock. arg1 contains a boolean value that indicates whether the operationwas as a writer.
TABLE 11–21 Readers/Writer Lock Probes
rw-acquire Hold event probe that fires immediately after a readers/writer lock is acquired.
rw-block Contention event probe that fires before a thread blocks while attempting toacquire a lock. If enabled, the rw-acquire probe or the rw-error probe will fireafter rw-block.
rw-release Hold event probe that fires immediately after a reader/writer lock is released
rw-error Error event probe that fires when an error is encountered during a reader/writerlock operation. arg1 is the errno value of the error encountered.
StabilityThe plockstat provider uses DTrace's stability mechanism to describe its stabilities, as shownin the following table. For more information about the stability mechanism, see Chapter 18,“Stability.”
Element Name stability Data stability Dependency class
Provider Evolving Evolving ISA
Module Private Private Unknown
Function Private Private Unknown
Name Evolving Evolving ISA
Arguments Evolving Evolving ISA
plockstat Provider
Oracle Solaris Dynamic Tracing Guide • November 2011 E22973_02226
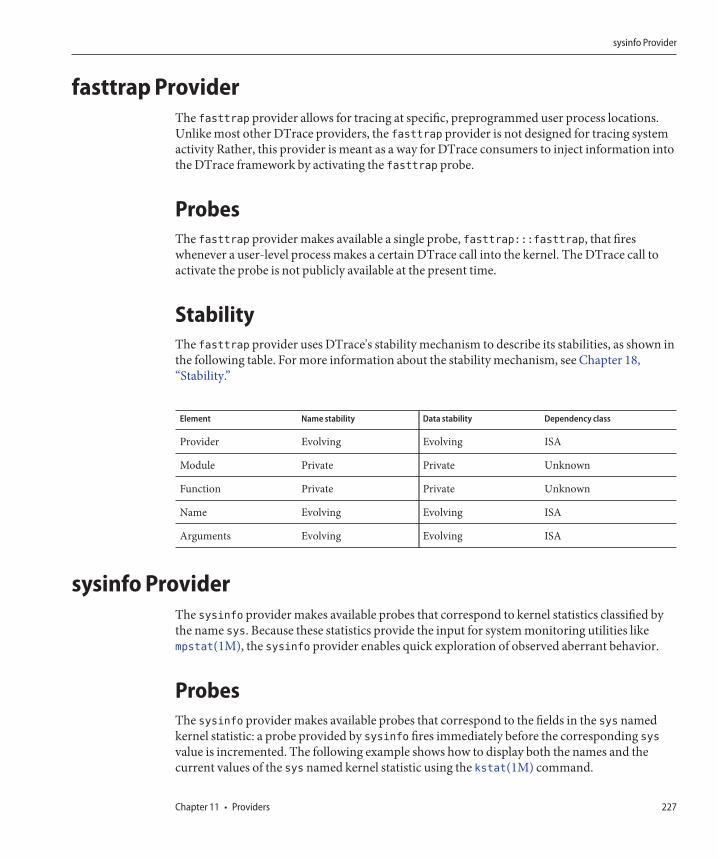
fasttrap ProviderThe fasttrap provider allows for tracing at specific, preprogrammed user process locations.Unlike most other DTrace providers, the fasttrap provider is not designed for tracing systemactivity Rather, this provider is meant as a way for DTrace consumers to inject information intothe DTrace framework by activating the fasttrap probe.
ProbesThe fasttrap provider makes available a single probe, fasttrap:::fasttrap, that fireswhenever a user-level process makes a certain DTrace call into the kernel. The DTrace call toactivate the probe is not publicly available at the present time.
StabilityThe fasttrap provider uses DTrace's stability mechanism to describe its stabilities, as shown inthe following table. For more information about the stability mechanism, see Chapter 18,“Stability.”
Element Name stability Data stability Dependency class
Provider Evolving Evolving ISA
Module Private Private Unknown
Function Private Private Unknown
Name Evolving Evolving ISA
Arguments Evolving Evolving ISA
sysinfo ProviderThe sysinfo provider makes available probes that correspond to kernel statistics classified bythe name sys. Because these statistics provide the input for system monitoring utilities likempstat(1M), the sysinfo provider enables quick exploration of observed aberrant behavior.
ProbesThe sysinfo provider makes available probes that correspond to the fields in the sys namedkernel statistic: a probe provided by sysinfo fires immediately before the corresponding sysvalue is incremented. The following example shows how to display both the names and thecurrent values of the sys named kernel statistic using the kstat(1M) command.
sysinfo Provider
Chapter 11 • Providers 227
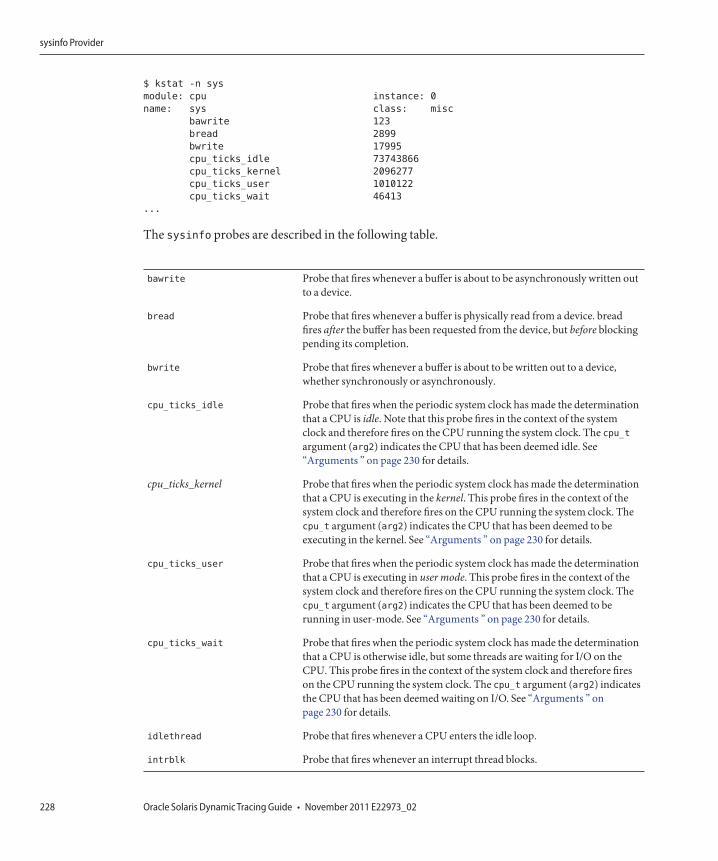
$ kstat -n sys
module: cpu instance: 0
name: sys class: misc
bawrite 123
bread 2899
bwrite 17995
cpu_ticks_idle 73743866
cpu_ticks_kernel 2096277
cpu_ticks_user 1010122
cpu_ticks_wait 46413
...
The sysinfo probes are described in the following table.
bawrite Probe that fires whenever a buffer is about to be asynchronously written outto a device.
bread Probe that fires whenever a buffer is physically read from a device. breadfires after the buffer has been requested from the device, but before blockingpending its completion.
bwrite Probe that fires whenever a buffer is about to be written out to a device,whether synchronously or asynchronously.
cpu_ticks_idle Probe that fires when the periodic system clock has made the determinationthat a CPU is idle. Note that this probe fires in the context of the systemclock and therefore fires on the CPU running the system clock. The cpu_targument (arg2) indicates the CPU that has been deemed idle. See“Arguments ” on page 230 for details.
cpu_ticks_kernel Probe that fires when the periodic system clock has made the determinationthat a CPU is executing in the kernel. This probe fires in the context of thesystem clock and therefore fires on the CPU running the system clock. Thecpu_t argument (arg2) indicates the CPU that has been deemed to beexecuting in the kernel. See “Arguments ” on page 230 for details.
cpu_ticks_user Probe that fires when the periodic system clock has made the determinationthat a CPU is executing in user mode. This probe fires in the context of thesystem clock and therefore fires on the CPU running the system clock. Thecpu_t argument (arg2) indicates the CPU that has been deemed to berunning in user-mode. See “Arguments ” on page 230 for details.
cpu_ticks_wait Probe that fires when the periodic system clock has made the determinationthat a CPU is otherwise idle, but some threads are waiting for I/O on theCPU. This probe fires in the context of the system clock and therefore fireson the CPU running the system clock. The cpu_t argument (arg2) indicatesthe CPU that has been deemed waiting on I/O. See “Arguments ” onpage 230 for details.
idlethread Probe that fires whenever a CPU enters the idle loop.
intrblk Probe that fires whenever an interrupt thread blocks.
sysinfo Provider
Oracle Solaris Dynamic Tracing Guide • November 2011 E22973_02228
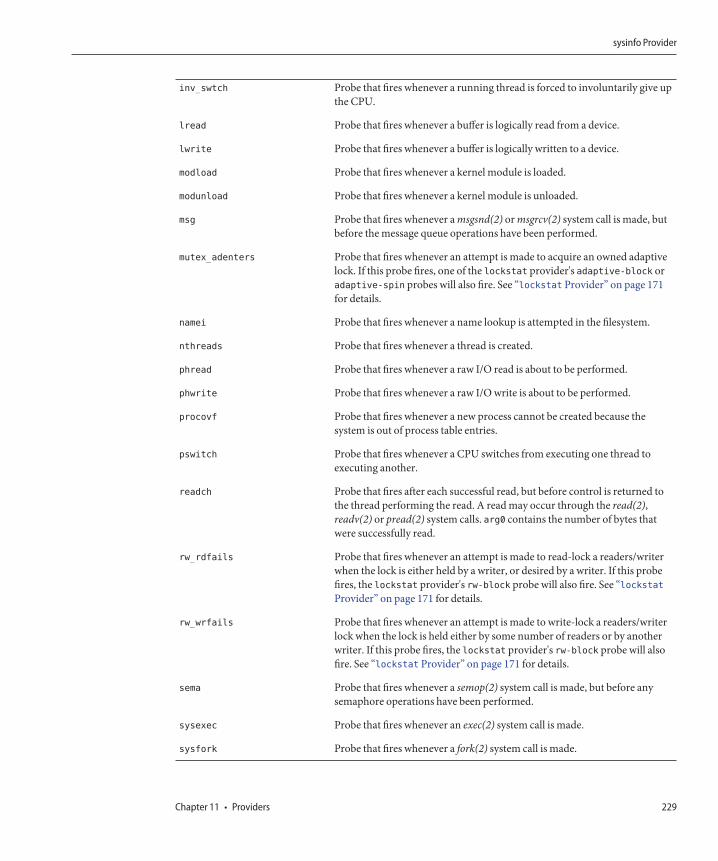
inv_swtch Probe that fires whenever a running thread is forced to involuntarily give upthe CPU.
lread Probe that fires whenever a buffer is logically read from a device.
lwrite Probe that fires whenever a buffer is logically written to a device.
modload Probe that fires whenever a kernel module is loaded.
modunload Probe that fires whenever a kernel module is unloaded.
msg Probe that fires whenever a msgsnd(2) or msgrcv(2) system call is made, butbefore the message queue operations have been performed.
mutex_adenters Probe that fires whenever an attempt is made to acquire an owned adaptivelock. If this probe fires, one of the lockstat provider's adaptive-block oradaptive-spin probes will also fire. See “lockstat Provider” on page 171for details.
namei Probe that fires whenever a name lookup is attempted in the filesystem.
nthreads Probe that fires whenever a thread is created.
phread Probe that fires whenever a raw I/O read is about to be performed.
phwrite Probe that fires whenever a raw I/O write is about to be performed.
procovf Probe that fires whenever a new process cannot be created because thesystem is out of process table entries.
pswitch Probe that fires whenever a CPU switches from executing one thread toexecuting another.
readch Probe that fires after each successful read, but before control is returned tothe thread performing the read. A read may occur through the read(2),readv(2) or pread(2) system calls. arg0 contains the number of bytes thatwere successfully read.
rw_rdfails Probe that fires whenever an attempt is made to read-lock a readers/writerwhen the lock is either held by a writer, or desired by a writer. If this probefires, the lockstat provider's rw-block probe will also fire. See “lockstatProvider” on page 171 for details.
rw_wrfails Probe that fires whenever an attempt is made to write-lock a readers/writerlock when the lock is held either by some number of readers or by anotherwriter. If this probe fires, the lockstat provider's rw-block probe will alsofire. See “lockstat Provider” on page 171 for details.
sema Probe that fires whenever a semop(2) system call is made, but before anysemaphore operations have been performed.
sysexec Probe that fires whenever an exec(2) system call is made.
sysfork Probe that fires whenever a fork(2) system call is made.
sysinfo Provider
Chapter 11 • Providers 229
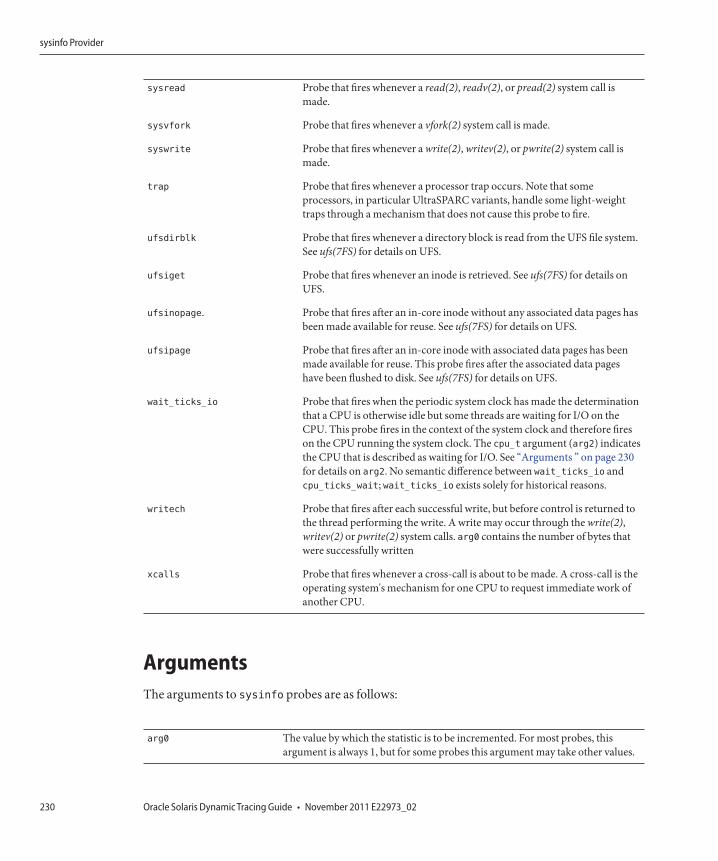
sysread Probe that fires whenever a read(2), readv(2), or pread(2) system call ismade.
sysvfork Probe that fires whenever a vfork(2) system call is made.
syswrite Probe that fires whenever a write(2), writev(2), or pwrite(2) system call ismade.
trap Probe that fires whenever a processor trap occurs. Note that someprocessors, in particular UltraSPARC variants, handle some light-weighttraps through a mechanism that does not cause this probe to fire.
ufsdirblk Probe that fires whenever a directory block is read from the UFS file system.See ufs(7FS) for details on UFS.
ufsiget Probe that fires whenever an inode is retrieved. See ufs(7FS) for details onUFS.
ufsinopage. Probe that fires after an in-core inode without any associated data pages hasbeen made available for reuse. See ufs(7FS) for details on UFS.
ufsipage Probe that fires after an in-core inode with associated data pages has beenmade available for reuse. This probe fires after the associated data pageshave been flushed to disk. See ufs(7FS) for details on UFS.
wait_ticks_io Probe that fires when the periodic system clock has made the determinationthat a CPU is otherwise idle but some threads are waiting for I/O on theCPU. This probe fires in the context of the system clock and therefore fireson the CPU running the system clock. The cpu_t argument (arg2) indicatesthe CPU that is described as waiting for I/O. See “Arguments ” on page 230for details on arg2. No semantic difference between wait_ticks_io andcpu_ticks_wait; wait_ticks_io exists solely for historical reasons.
writech Probe that fires after each successful write, but before control is returned tothe thread performing the write. A write may occur through the write(2),writev(2) or pwrite(2) system calls. arg0 contains the number of bytes thatwere successfully written
xcalls Probe that fires whenever a cross-call is about to be made. A cross-call is theoperating system's mechanism for one CPU to request immediate work ofanother CPU.
ArgumentsThe arguments to sysinfo probes are as follows:
arg0 The value by which the statistic is to be incremented. For most probes, thisargument is always 1, but for some probes this argument may take other values.
sysinfo Provider
Oracle Solaris Dynamic Tracing Guide • November 2011 E22973_02230
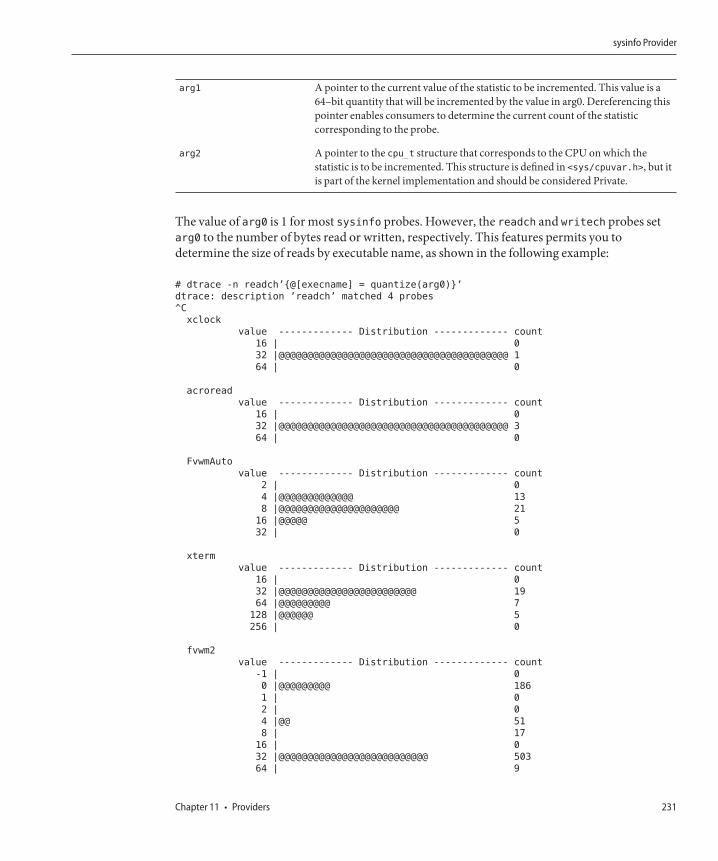
arg1 A pointer to the current value of the statistic to be incremented. This value is a64–bit quantity that will be incremented by the value in arg0. Dereferencing thispointer enables consumers to determine the current count of the statisticcorresponding to the probe.
arg2 A pointer to the cpu_t structure that corresponds to the CPU on which thestatistic is to be incremented. This structure is defined in <sys/cpuvar.h>, but itis part of the kernel implementation and should be considered Private.
The value of arg0 is 1 for most sysinfo probes. However, the readch and writech probes setarg0 to the number of bytes read or written, respectively. This features permits you todetermine the size of reads by executable name, as shown in the following example:
# dtrace -n readch’{@[execname] = quantize(arg0)}’
dtrace: description ’readch’ matched 4 probes
^C
xclock
value ------------- Distribution ------------- count
16 | 0
32 |@@@@@@@@@@@@@@@@@@@@@@@@@@@@@@@@@@@@@@@@ 1
64 | 0
acroread
value ------------- Distribution ------------- count
16 | 0
32 |@@@@@@@@@@@@@@@@@@@@@@@@@@@@@@@@@@@@@@@@ 3
64 | 0
FvwmAuto
value ------------- Distribution ------------- count
2 | 0
4 |@@@@@@@@@@@@@ 13
8 |@@@@@@@@@@@@@@@@@@@@@ 21
16 |@@@@@ 5
32 | 0
xterm
value ------------- Distribution ------------- count
16 | 0
32 |@@@@@@@@@@@@@@@@@@@@@@@@ 19
64 |@@@@@@@@@ 7
128 |@@@@@@ 5
256 | 0
fvwm2
value ------------- Distribution ------------- count
-1 | 0
0 |@@@@@@@@@ 186
1 | 0
2 | 0
4 |@@ 51
8 | 17
16 | 0
32 |@@@@@@@@@@@@@@@@@@@@@@@@@@ 503
64 | 9
sysinfo Provider
Chapter 11 • Providers 231
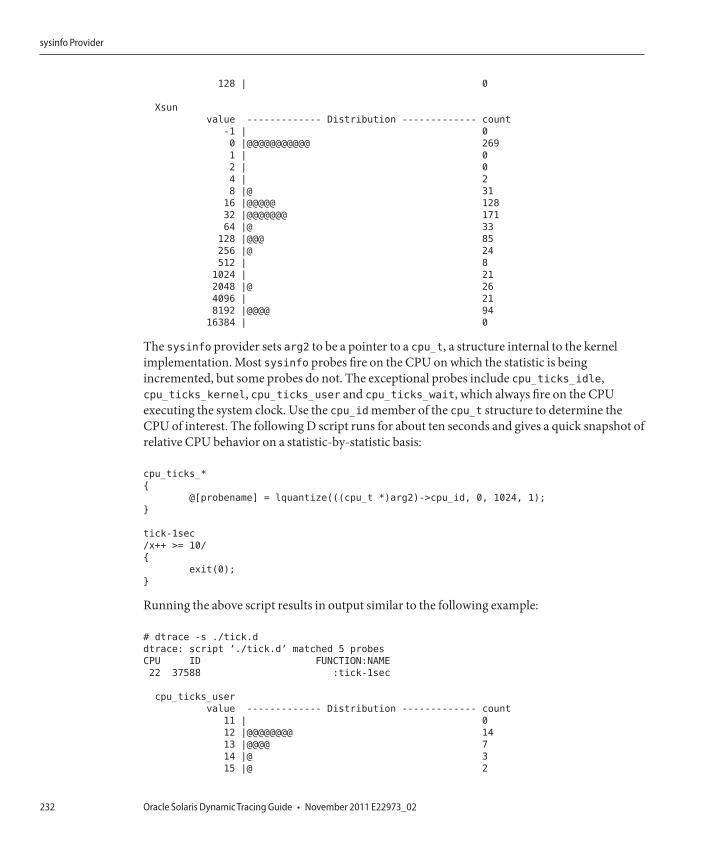
128 | 0
Xsun
value ------------- Distribution ------------- count
-1 | 0
0 |@@@@@@@@@@@ 269
1 | 0
2 | 0
4 | 2
8 |@ 31
16 |@@@@@ 128
32 |@@@@@@@ 171
64 |@ 33
128 |@@@ 85
256 |@ 24
512 | 8
1024 | 21
2048 |@ 26
4096 | 21
8192 |@@@@ 94
16384 | 0
The sysinfo provider sets arg2 to be a pointer to a cpu_t, a structure internal to the kernelimplementation. Most sysinfo probes fire on the CPU on which the statistic is beingincremented, but some probes do not. The exceptional probes include cpu_ticks_idle,cpu_ticks_kernel, cpu_ticks_user and cpu_ticks_wait, which always fire on the CPUexecuting the system clock. Use the cpu_id member of the cpu_t structure to determine theCPU of interest. The following D script runs for about ten seconds and gives a quick snapshot ofrelative CPU behavior on a statistic-by-statistic basis:
cpu_ticks_*
{
@[probename] = lquantize(((cpu_t *)arg2)->cpu_id, 0, 1024, 1);
}
tick-1sec
/x++ >= 10/
{
exit(0);
}
Running the above script results in output similar to the following example:
# dtrace -s ./tick.d
dtrace: script ’./tick.d’ matched 5 probes
CPU ID FUNCTION:NAME
22 37588 :tick-1sec
cpu_ticks_user
value ------------- Distribution ------------- count
11 | 0
12 |@@@@@@@@ 14
13 |@@@@ 7
14 |@ 3
15 |@ 2
sysinfo Provider
Oracle Solaris Dynamic Tracing Guide • November 2011 E22973_02232
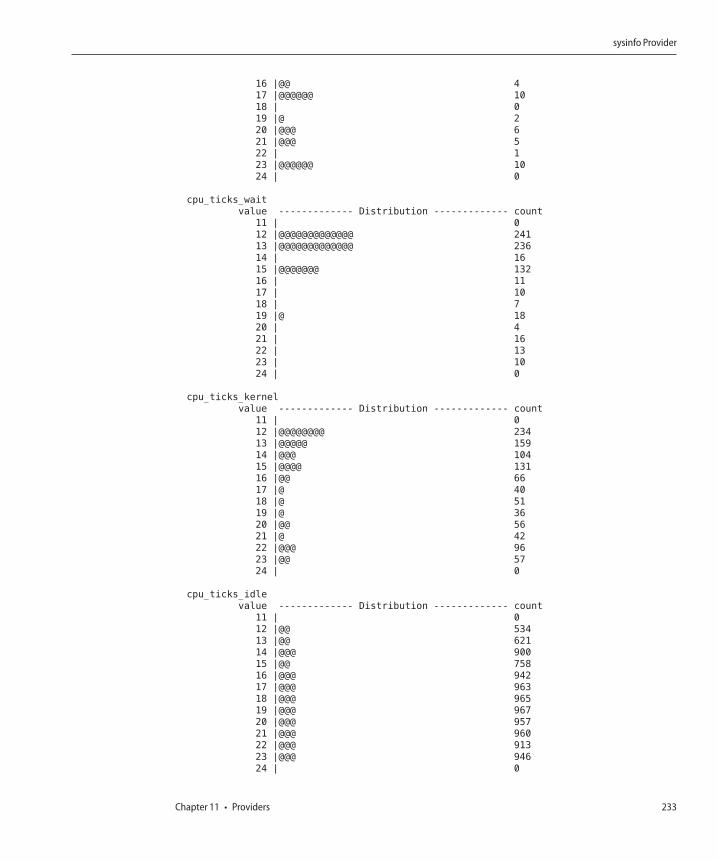
16 |@@ 4
17 |@@@@@@ 10
18 | 0
19 |@ 2
20 |@@@ 6
21 |@@@ 5
22 | 1
23 |@@@@@@ 10
24 | 0
cpu_ticks_wait
value ------------- Distribution ------------- count
11 | 0
12 |@@@@@@@@@@@@@ 241
13 |@@@@@@@@@@@@@ 236
14 | 16
15 |@@@@@@@ 132
16 | 11
17 | 10
18 | 7
19 |@ 18
20 | 4
21 | 16
22 | 13
23 | 10
24 | 0
cpu_ticks_kernel
value ------------- Distribution ------------- count
11 | 0
12 |@@@@@@@@ 234
13 |@@@@@ 159
14 |@@@ 104
15 |@@@@ 131
16 |@@ 66
17 |@ 40
18 |@ 51
19 |@ 36
20 |@@ 56
21 |@ 42
22 |@@@ 96
23 |@@ 57
24 | 0
cpu_ticks_idle
value ------------- Distribution ------------- count
11 | 0
12 |@@ 534
13 |@@ 621
14 |@@@ 900
15 |@@ 758
16 |@@@ 942
17 |@@@ 963
18 |@@@ 965
19 |@@@ 967
20 |@@@ 957
21 |@@@ 960
22 |@@@ 913
23 |@@@ 946
24 | 0
sysinfo Provider
Chapter 11 • Providers 233
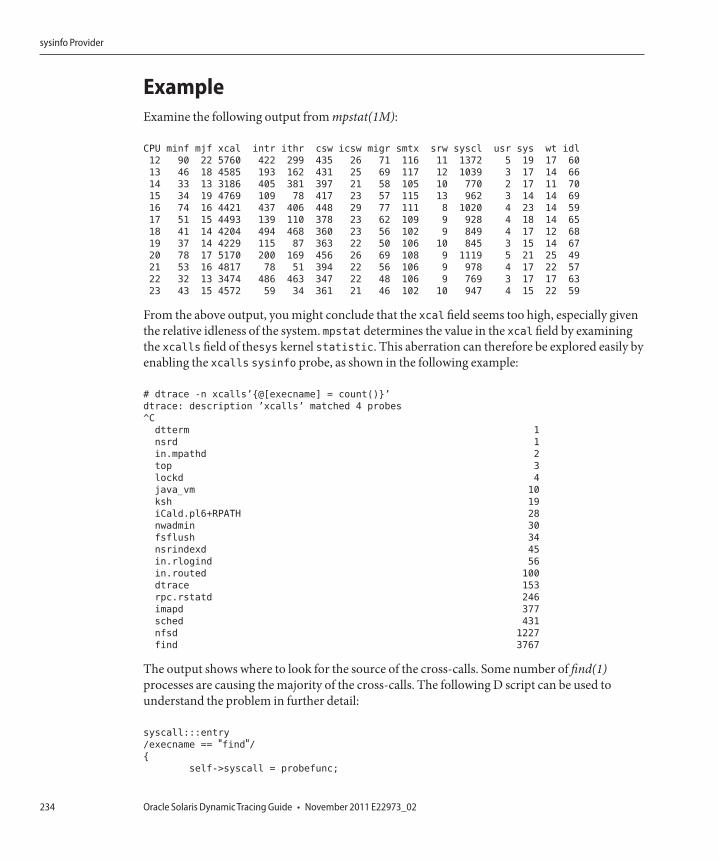
ExampleExamine the following output from mpstat(1M):
CPU minf mjf xcal intr ithr csw icsw migr smtx srw syscl usr sys wt idl
12 90 22 5760 422 299 435 26 71 116 11 1372 5 19 17 60
13 46 18 4585 193 162 431 25 69 117 12 1039 3 17 14 66
14 33 13 3186 405 381 397 21 58 105 10 770 2 17 11 70
15 34 19 4769 109 78 417 23 57 115 13 962 3 14 14 69
16 74 16 4421 437 406 448 29 77 111 8 1020 4 23 14 59
17 51 15 4493 139 110 378 23 62 109 9 928 4 18 14 65
18 41 14 4204 494 468 360 23 56 102 9 849 4 17 12 68
19 37 14 4229 115 87 363 22 50 106 10 845 3 15 14 67
20 78 17 5170 200 169 456 26 69 108 9 1119 5 21 25 49
21 53 16 4817 78 51 394 22 56 106 9 978 4 17 22 57
22 32 13 3474 486 463 347 22 48 106 9 769 3 17 17 63
23 43 15 4572 59 34 361 21 46 102 10 947 4 15 22 59
From the above output, you might conclude that the xcal field seems too high, especially giventhe relative idleness of the system. mpstat determines the value in the xcal field by examiningthe xcalls field of thesys kernel statistic. This aberration can therefore be explored easily byenabling the xcalls sysinfo probe, as shown in the following example:
# dtrace -n xcalls’{@[execname] = count()}’
dtrace: description ’xcalls’ matched 4 probes
^C
dtterm 1
nsrd 1
in.mpathd 2
top 3
lockd 4
java_vm 10
ksh 19
iCald.pl6+RPATH 28
nwadmin 30
fsflush 34
nsrindexd 45
in.rlogind 56
in.routed 100
dtrace 153
rpc.rstatd 246
imapd 377
sched 431
nfsd 1227
find 3767
The output shows where to look for the source of the cross-calls. Some number of find(1)processes are causing the majority of the cross-calls. The following D script can be used tounderstand the problem in further detail:
syscall:::entry
/execname == "find"/{
self->syscall = probefunc;
sysinfo Provider
Oracle Solaris Dynamic Tracing Guide • November 2011 E22973_02234
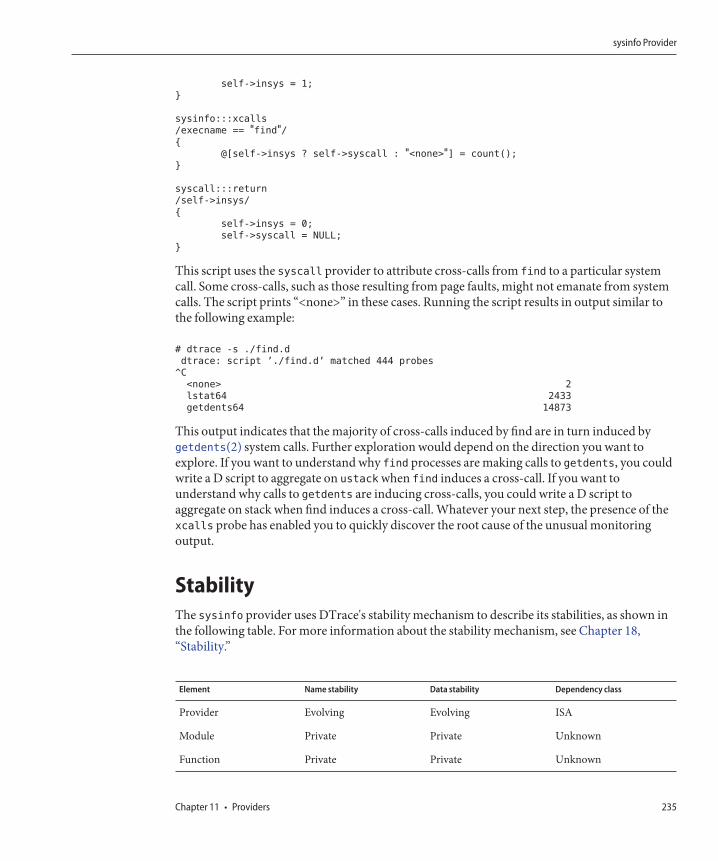
self->insys = 1;
}
sysinfo:::xcalls
/execname == "find"/{
@[self->insys ? self->syscall : "<none>"] = count();
}
syscall:::return
/self->insys/
{
self->insys = 0;
self->syscall = NULL;
}
This script uses the syscall provider to attribute cross-calls from find to a particular systemcall. Some cross-calls, such as those resulting from page faults, might not emanate from systemcalls. The script prints “<none>” in these cases. Running the script results in output similar tothe following example:
# dtrace -s ./find.d
dtrace: script ’./find.d’ matched 444 probes
^C
<none> 2
lstat64 2433
getdents64 14873
This output indicates that the majority of cross-calls induced by find are in turn induced bygetdents(2) system calls. Further exploration would depend on the direction you want toexplore. If you want to understand why find processes are making calls to getdents, you couldwrite a D script to aggregate on ustack when find induces a cross-call. If you want tounderstand why calls to getdents are inducing cross-calls, you could write a D script toaggregate on stack when find induces a cross-call. Whatever your next step, the presence of thexcalls probe has enabled you to quickly discover the root cause of the unusual monitoringoutput.
StabilityThe sysinfo provider uses DTrace's stability mechanism to describe its stabilities, as shown inthe following table. For more information about the stability mechanism, see Chapter 18,“Stability.”
Element Name stability Data stability Dependency class
Provider Evolving Evolving ISA
Module Private Private Unknown
Function Private Private Unknown
sysinfo Provider
Chapter 11 • Providers 235
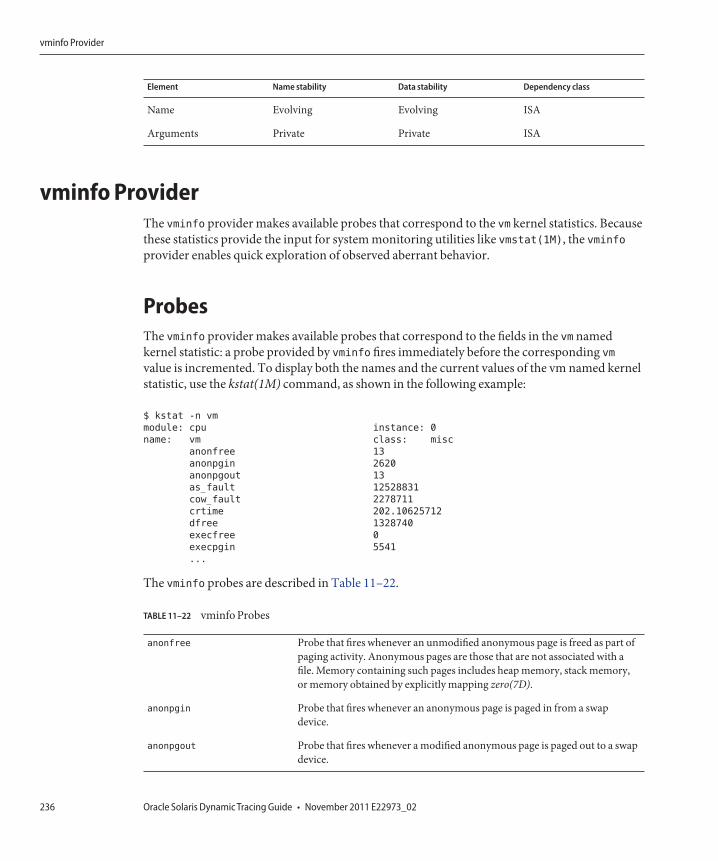
Element Name stability Data stability Dependency class
Name Evolving Evolving ISA
Arguments Private Private ISA
vminfo ProviderThe vminfo provider makes available probes that correspond to the vm kernel statistics. Becausethese statistics provide the input for system monitoring utilities like vmstat(1M), the vminfoprovider enables quick exploration of observed aberrant behavior.
ProbesThe vminfo provider makes available probes that correspond to the fields in the vm namedkernel statistic: a probe provided by vminfo fires immediately before the corresponding vmvalue is incremented. To display both the names and the current values of the vm named kernelstatistic, use the kstat(1M) command, as shown in the following example:
$ kstat -n vm
module: cpu instance: 0
name: vm class: misc
anonfree 13
anonpgin 2620
anonpgout 13
as_fault 12528831
cow_fault 2278711
crtime 202.10625712
dfree 1328740
execfree 0
execpgin 5541
...
The vminfo probes are described in Table 11–22.
TABLE 11–22 vminfo Probes
anonfree Probe that fires whenever an unmodified anonymous page is freed as part ofpaging activity. Anonymous pages are those that are not associated with afile. Memory containing such pages includes heap memory, stack memory,or memory obtained by explicitly mapping zero(7D).
anonpgin Probe that fires whenever an anonymous page is paged in from a swapdevice.
anonpgout Probe that fires whenever a modified anonymous page is paged out to a swapdevice.
vminfo Provider
Oracle Solaris Dynamic Tracing Guide • November 2011 E22973_02236
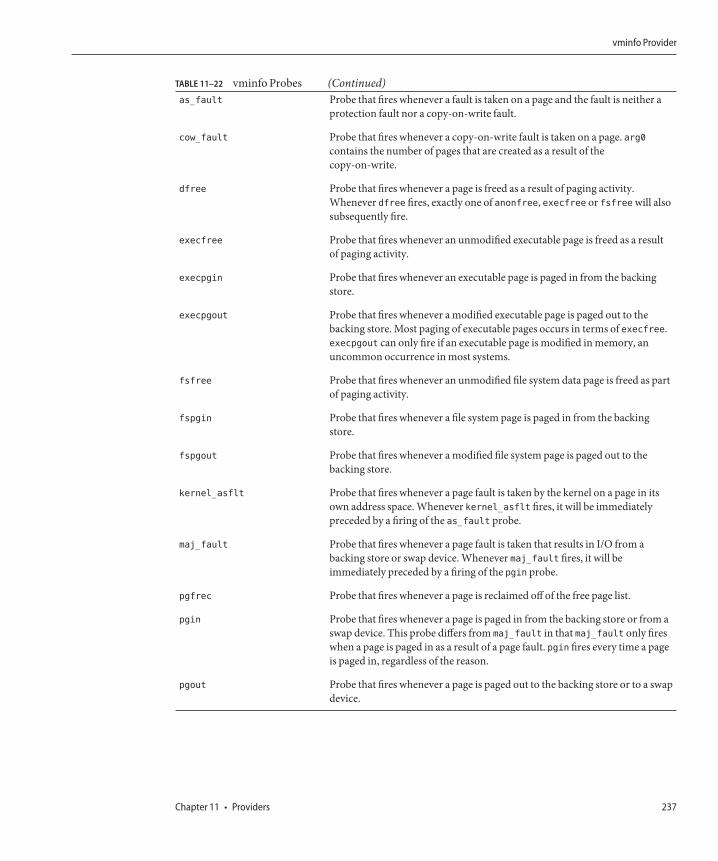
TABLE 11–22 vminfo Probes (Continued)as_fault Probe that fires whenever a fault is taken on a page and the fault is neither a
protection fault nor a copy-on-write fault.
cow_fault Probe that fires whenever a copy-on-write fault is taken on a page. arg0contains the number of pages that are created as a result of thecopy-on-write.
dfree Probe that fires whenever a page is freed as a result of paging activity.Whenever dfree fires, exactly one of anonfree, execfree or fsfree will alsosubsequently fire.
execfree Probe that fires whenever an unmodified executable page is freed as a resultof paging activity.
execpgin Probe that fires whenever an executable page is paged in from the backingstore.
execpgout Probe that fires whenever a modified executable page is paged out to thebacking store. Most paging of executable pages occurs in terms of execfree.execpgout can only fire if an executable page is modified in memory, anuncommon occurrence in most systems.
fsfree Probe that fires whenever an unmodified file system data page is freed as partof paging activity.
fspgin Probe that fires whenever a file system page is paged in from the backingstore.
fspgout Probe that fires whenever a modified file system page is paged out to thebacking store.
kernel_asflt Probe that fires whenever a page fault is taken by the kernel on a page in itsown address space. Whenever kernel_asflt fires, it will be immediatelypreceded by a firing of the as_fault probe.
maj_fault Probe that fires whenever a page fault is taken that results in I/O from abacking store or swap device. Whenever maj_fault fires, it will beimmediately preceded by a firing of the pgin probe.
pgfrec Probe that fires whenever a page is reclaimed off of the free page list.
pgin Probe that fires whenever a page is paged in from the backing store or from aswap device. This probe differs from maj_fault in that maj_fault only fireswhen a page is paged in as a result of a page fault. pgin fires every time a pageis paged in, regardless of the reason.
pgout Probe that fires whenever a page is paged out to the backing store or to a swapdevice.
vminfo Provider
Chapter 11 • Providers 237
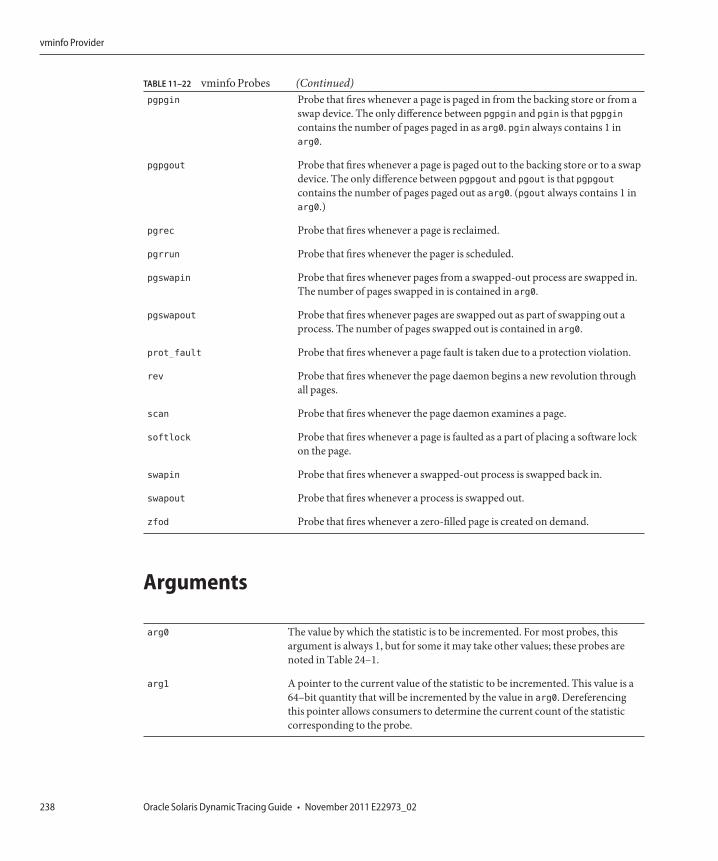
TABLE 11–22 vminfo Probes (Continued)pgpgin Probe that fires whenever a page is paged in from the backing store or from a
swap device. The only difference between pgpgin and pgin is that pgpgincontains the number of pages paged in as arg0. pgin always contains 1 inarg0.
pgpgout Probe that fires whenever a page is paged out to the backing store or to a swapdevice. The only difference between pgpgout and pgout is that pgpgoutcontains the number of pages paged out as arg0. (pgout always contains 1 inarg0.)
pgrec Probe that fires whenever a page is reclaimed.
pgrrun Probe that fires whenever the pager is scheduled.
pgswapin Probe that fires whenever pages from a swapped-out process are swapped in.The number of pages swapped in is contained in arg0.
pgswapout Probe that fires whenever pages are swapped out as part of swapping out aprocess. The number of pages swapped out is contained in arg0.
prot_fault Probe that fires whenever a page fault is taken due to a protection violation.
rev Probe that fires whenever the page daemon begins a new revolution throughall pages.
scan Probe that fires whenever the page daemon examines a page.
softlock Probe that fires whenever a page is faulted as a part of placing a software lockon the page.
swapin Probe that fires whenever a swapped-out process is swapped back in.
swapout Probe that fires whenever a process is swapped out.
zfod Probe that fires whenever a zero-filled page is created on demand.
Arguments
arg0 The value by which the statistic is to be incremented. For most probes, thisargument is always 1, but for some it may take other values; these probes arenoted in Table 24–1.
arg1 A pointer to the current value of the statistic to be incremented. This value is a64–bit quantity that will be incremented by the value in arg0. Dereferencingthis pointer allows consumers to determine the current count of the statisticcorresponding to the probe.
vminfo Provider
Oracle Solaris Dynamic Tracing Guide • November 2011 E22973_02238
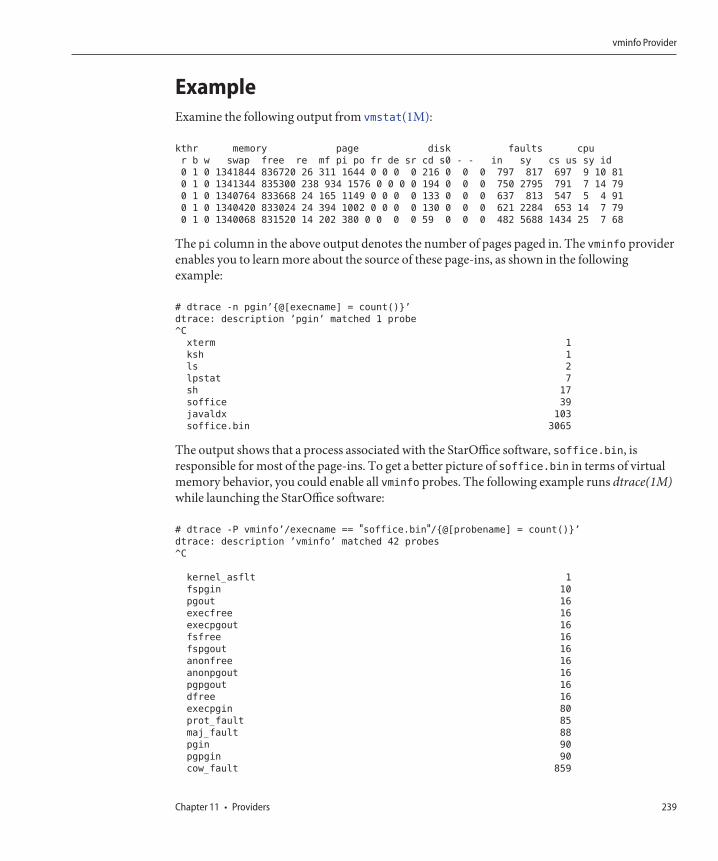
ExampleExamine the following output from vmstat(1M):
kthr memory page disk faults cpu
r b w swap free re mf pi po fr de sr cd s0 - - in sy cs us sy id
0 1 0 1341844 836720 26 311 1644 0 0 0 0 216 0 0 0 797 817 697 9 10 81
0 1 0 1341344 835300 238 934 1576 0 0 0 0 194 0 0 0 750 2795 791 7 14 79
0 1 0 1340764 833668 24 165 1149 0 0 0 0 133 0 0 0 637 813 547 5 4 91
0 1 0 1340420 833024 24 394 1002 0 0 0 0 130 0 0 0 621 2284 653 14 7 79
0 1 0 1340068 831520 14 202 380 0 0 0 0 59 0 0 0 482 5688 1434 25 7 68
The pi column in the above output denotes the number of pages paged in. The vminfo providerenables you to learn more about the source of these page-ins, as shown in the followingexample:
# dtrace -n pgin’{@[execname] = count()}’
dtrace: description ’pgin’ matched 1 probe
^C
xterm 1
ksh 1
ls 2
lpstat 7
sh 17
soffice 39
javaldx 103
soffice.bin 3065
The output shows that a process associated with the StarOffice software, soffice.bin, isresponsible for most of the page-ins. To get a better picture of soffice.bin in terms of virtualmemory behavior, you could enable all vminfo probes. The following example runs dtrace(1M)while launching the StarOffice software:
# dtrace -P vminfo’/execname == "soffice.bin"/{@[probename] = count()}’
dtrace: description ’vminfo’ matched 42 probes
^C
kernel_asflt 1
fspgin 10
pgout 16
execfree 16
execpgout 16
fsfree 16
fspgout 16
anonfree 16
anonpgout 16
pgpgout 16
dfree 16
execpgin 80
prot_fault 85
maj_fault 88
pgin 90
pgpgin 90
cow_fault 859
vminfo Provider
Chapter 11 • Providers 239
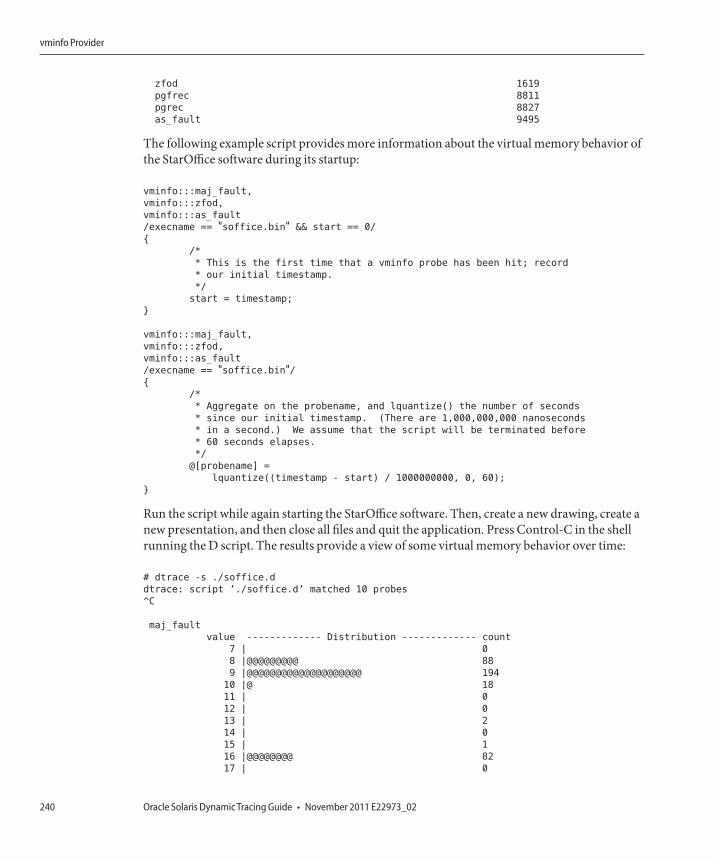
zfod 1619
pgfrec 8811
pgrec 8827
as_fault 9495
The following example script provides more information about the virtual memory behavior ofthe StarOffice software during its startup:
vminfo:::maj_fault,
vminfo:::zfod,
vminfo:::as_fault
/execname == "soffice.bin" && start == 0/
{
/*
* This is the first time that a vminfo probe has been hit; record
* our initial timestamp.
*/
start = timestamp;
}
vminfo:::maj_fault,
vminfo:::zfod,
vminfo:::as_fault
/execname == "soffice.bin"/{
/*
* Aggregate on the probename, and lquantize() the number of seconds
* since our initial timestamp. (There are 1,000,000,000 nanoseconds
* in a second.) We assume that the script will be terminated before
* 60 seconds elapses.
*/
@[probename] =
lquantize((timestamp - start) / 1000000000, 0, 60);
}
Run the script while again starting the StarOffice software. Then, create a new drawing, create anew presentation, and then close all files and quit the application. Press Control-C in the shellrunning the D script. The results provide a view of some virtual memory behavior over time:
# dtrace -s ./soffice.d
dtrace: script ’./soffice.d’ matched 10 probes
^C
maj_fault
value ------------- Distribution ------------- count
7 | 0
8 |@@@@@@@@@ 88
9 |@@@@@@@@@@@@@@@@@@@@ 194
10 |@ 18
11 | 0
12 | 0
13 | 2
14 | 0
15 | 1
16 |@@@@@@@@ 82
17 | 0
vminfo Provider
Oracle Solaris Dynamic Tracing Guide • November 2011 E22973_02240
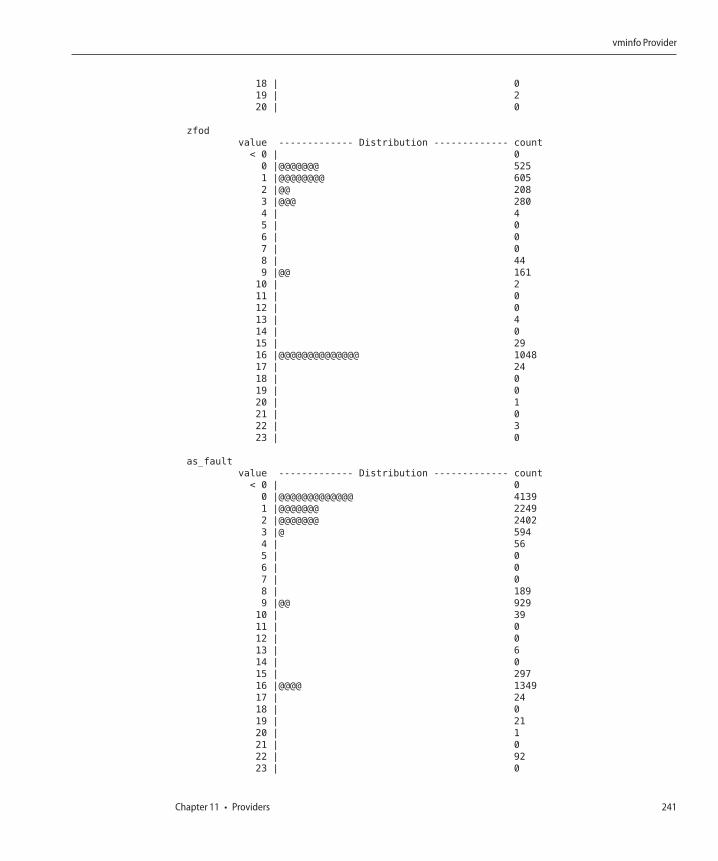
18 | 0
19 | 2
20 | 0
zfod
value ------------- Distribution ------------- count
< 0 | 0
0 |@@@@@@@ 525
1 |@@@@@@@@ 605
2 |@@ 208
3 |@@@ 280
4 | 4
5 | 0
6 | 0
7 | 0
8 | 44
9 |@@ 161
10 | 2
11 | 0
12 | 0
13 | 4
14 | 0
15 | 29
16 |@@@@@@@@@@@@@@ 1048
17 | 24
18 | 0
19 | 0
20 | 1
21 | 0
22 | 3
23 | 0
as_fault
value ------------- Distribution ------------- count
< 0 | 0
0 |@@@@@@@@@@@@@ 4139
1 |@@@@@@@ 2249
2 |@@@@@@@ 2402
3 |@ 594
4 | 56
5 | 0
6 | 0
7 | 0
8 | 189
9 |@@ 929
10 | 39
11 | 0
12 | 0
13 | 6
14 | 0
15 | 297
16 |@@@@ 1349
17 | 24
18 | 0
19 | 21
20 | 1
21 | 0
22 | 92
23 | 0
vminfo Provider
Chapter 11 • Providers 241
The output shows some StarOffice behavior with respect to the virtual memory system. Forexample, the maj_fault probe didn't fire until a new instance of the application was started. Asyou would hope, a “warm start” of StarOffice did not result in new major faults. The as_faultoutput shows an initial burst of activity, latency while the user located the menu to create a newdrawing, another period of idleness, and a final burst of activity when the user clicked on a newpresentation. The zfod output shows that creating the new presentation induced significantpressure for zero-filled pages, but only for a short period of time.
The next iteration of DTrace investigation in this example would depend on the direction youwant to explore. If you want to understand the source of the demand for zero-filled pages, youcould aggregate on ustack in a zfod enabling. You might want to establish a threshold forzero-filled pages and use the stop destructive action to stop the offending process when thethreshold is exceeded. This approach would enable you to use more traditional debugging toolslike truss(1) or mdb(1). The vminfo provider enables you to associate statistics seen in theoutput of conventional tools like vmstat(1M) with the applications that are inducing thesystemic behavior.
StabilityThe vminfo provider uses DTrace's stability mechanism to describe its stabilities, as shown inthe following table. For more information about the stability mechanism, see Chapter 18,“Stability.”
Element Name stability Data stability Dependency class
Provider Evolving Evolving ISA
Module Private Private Unknown
Function Private Private Unknown
Name Evolving Evolving ISA
Arguments Private Private ISA
proc ProviderThe proc provider makes available probes pertaining to the following activities: processcreation and termination, LWP creation and termination, executing new program images, andsending and handling signals.
ProbesThe proc probes are described in Table 11–23.
proc Provider
Oracle Solaris Dynamic Tracing Guide • November 2011 E22973_02242
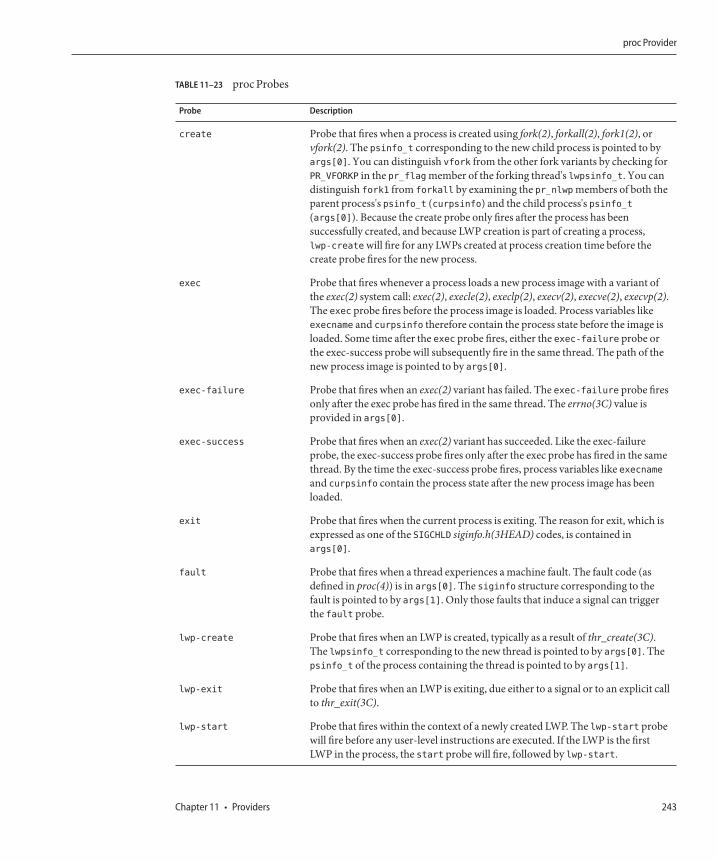
TABLE 11–23 proc Probes
Probe Description
create Probe that fires when a process is created using fork(2), forkall(2), fork1(2), orvfork(2). The psinfo_t corresponding to the new child process is pointed to byargs[0]. You can distinguish vfork from the other fork variants by checking forPR_VFORKP in the pr_flag member of the forking thread's lwpsinfo_t. You candistinguish fork1 from forkall by examining the pr_nlwp members of both theparent process's psinfo_t (curpsinfo) and the child process's psinfo_t(args[0]). Because the create probe only fires after the process has beensuccessfully created, and because LWP creation is part of creating a process,lwp-create will fire for any LWPs created at process creation time before thecreate probe fires for the new process.
exec Probe that fires whenever a process loads a new process image with a variant ofthe exec(2) system call: exec(2), execle(2), execlp(2), execv(2), execve(2), execvp(2).The exec probe fires before the process image is loaded. Process variables likeexecname and curpsinfo therefore contain the process state before the image isloaded. Some time after the exec probe fires, either the exec-failure probe orthe exec-success probe will subsequently fire in the same thread. The path of thenew process image is pointed to by args[0].
exec-failure Probe that fires when an exec(2) variant has failed. The exec-failure probe firesonly after the exec probe has fired in the same thread. The errno(3C) value isprovided in args[0].
exec-success Probe that fires when an exec(2) variant has succeeded. Like the exec-failureprobe, the exec-success probe fires only after the exec probe has fired in the samethread. By the time the exec-success probe fires, process variables like execnameand curpsinfo contain the process state after the new process image has beenloaded.
exit Probe that fires when the current process is exiting. The reason for exit, which isexpressed as one of the SIGCHLD siginfo.h(3HEAD) codes, is contained inargs[0].
fault Probe that fires when a thread experiences a machine fault. The fault code (asdefined in proc(4)) is in args[0]. The siginfo structure corresponding to thefault is pointed to by args[1]. Only those faults that induce a signal can triggerthe fault probe.
lwp-create Probe that fires when an LWP is created, typically as a result of thr_create(3C).The lwpsinfo_t corresponding to the new thread is pointed to by args[0]. Thepsinfo_t of the process containing the thread is pointed to by args[1].
lwp-exit Probe that fires when an LWP is exiting, due either to a signal or to an explicit callto thr_exit(3C).
lwp-start Probe that fires within the context of a newly created LWP. The lwp-start probewill fire before any user-level instructions are executed. If the LWP is the firstLWP in the process, the start probe will fire, followed by lwp-start.
proc Provider
Chapter 11 • Providers 243
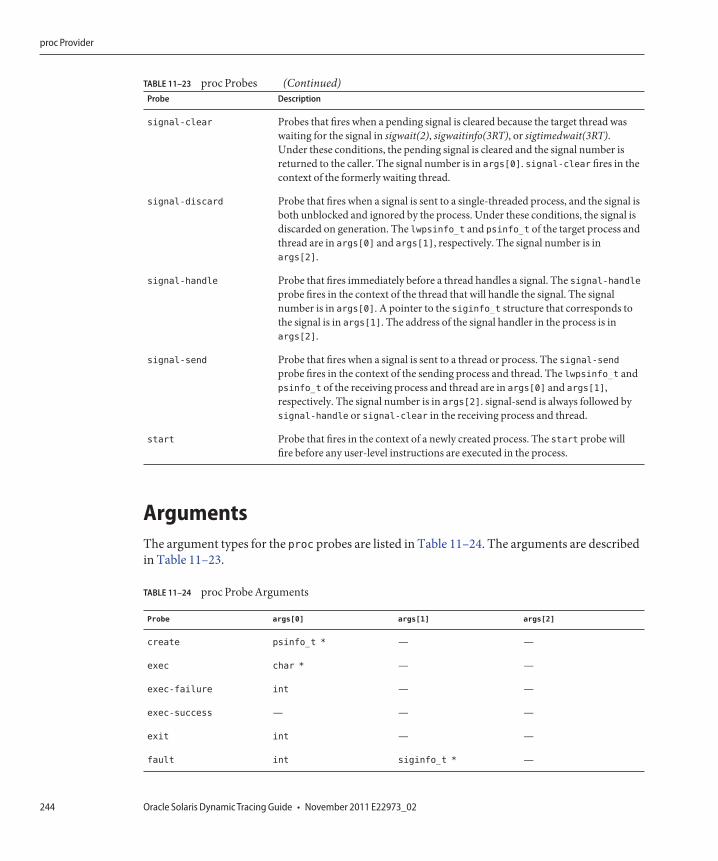
TABLE 11–23 proc Probes (Continued)Probe Description
signal-clear Probes that fires when a pending signal is cleared because the target thread waswaiting for the signal in sigwait(2), sigwaitinfo(3RT), or sigtimedwait(3RT).Under these conditions, the pending signal is cleared and the signal number isreturned to the caller. The signal number is in args[0]. signal-clear fires in thecontext of the formerly waiting thread.
signal-discard Probe that fires when a signal is sent to a single-threaded process, and the signal isboth unblocked and ignored by the process. Under these conditions, the signal isdiscarded on generation. The lwpsinfo_t and psinfo_t of the target process andthread are in args[0] and args[1], respectively. The signal number is inargs[2].
signal-handle Probe that fires immediately before a thread handles a signal. The signal-handleprobe fires in the context of the thread that will handle the signal. The signalnumber is in args[0]. A pointer to the siginfo_t structure that corresponds tothe signal is in args[1]. The address of the signal handler in the process is inargs[2].
signal-send Probe that fires when a signal is sent to a thread or process. The signal-sendprobe fires in the context of the sending process and thread. The lwpsinfo_t andpsinfo_t of the receiving process and thread are in args[0] and args[1],respectively. The signal number is in args[2]. signal-send is always followed bysignal-handle or signal-clear in the receiving process and thread.
start Probe that fires in the context of a newly created process. The start probe willfire before any user-level instructions are executed in the process.
ArgumentsThe argument types for the proc probes are listed in Table 11–24. The arguments are describedin Table 11–23.
TABLE 11–24 proc Probe Arguments
Probe args[0] args[1] args[2]
create psinfo_t * — —
exec char * — —
exec-failure int — —
exec-success — — —
exit int — —
fault int siginfo_t * —
proc Provider
Oracle Solaris Dynamic Tracing Guide • November 2011 E22973_02244
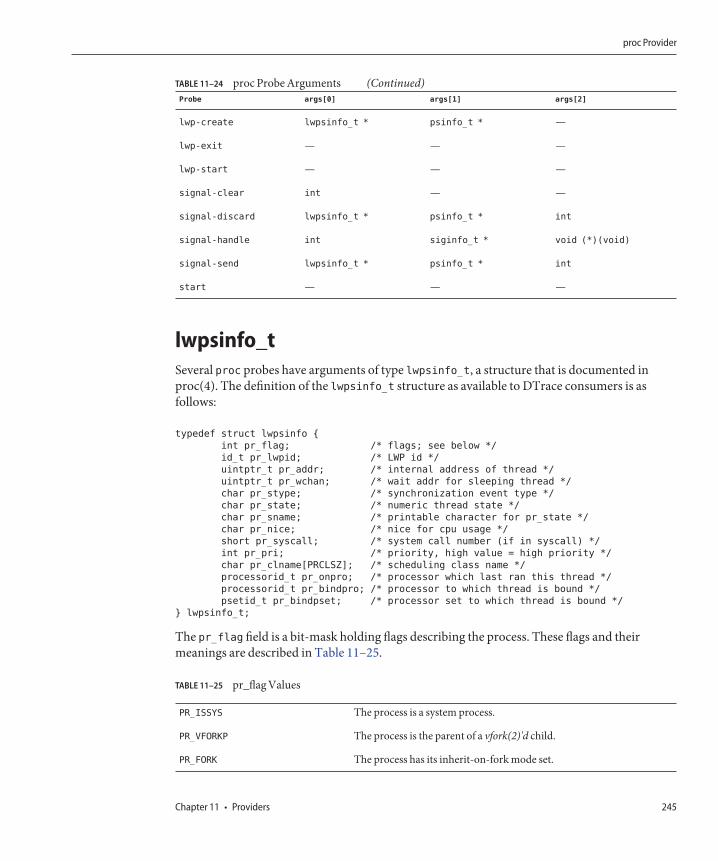
TABLE 11–24 proc Probe Arguments (Continued)Probe args[0] args[1] args[2]
lwp-create lwpsinfo_t * psinfo_t * —
lwp-exit — — —
lwp-start — — —
signal-clear int — —
signal-discard lwpsinfo_t * psinfo_t * int
signal-handle int siginfo_t * void (*)(void)
signal-send lwpsinfo_t * psinfo_t * int
start — — —
lwpsinfo_tSeveral proc probes have arguments of type lwpsinfo_t, a structure that is documented inproc(4). The definition of the lwpsinfo_t structure as available to DTrace consumers is asfollows:
typedef struct lwpsinfo {
int pr_flag; /* flags; see below */
id_t pr_lwpid; /* LWP id */
uintptr_t pr_addr; /* internal address of thread */
uintptr_t pr_wchan; /* wait addr for sleeping thread */
char pr_stype; /* synchronization event type */
char pr_state; /* numeric thread state */
char pr_sname; /* printable character for pr_state */
char pr_nice; /* nice for cpu usage */
short pr_syscall; /* system call number (if in syscall) */
int pr_pri; /* priority, high value = high priority */
char pr_clname[PRCLSZ]; /* scheduling class name */
processorid_t pr_onpro; /* processor which last ran this thread */
processorid_t pr_bindpro; /* processor to which thread is bound */
psetid_t pr_bindpset; /* processor set to which thread is bound */
} lwpsinfo_t;
The pr_flag field is a bit-mask holding flags describing the process. These flags and theirmeanings are described in Table 11–25.
TABLE 11–25 pr_flag Values
PR_ISSYS The process is a system process.
PR_VFORKP The process is the parent of a vfork(2)'d child.
PR_FORK The process has its inherit-on-fork mode set.
proc Provider
Chapter 11 • Providers 245
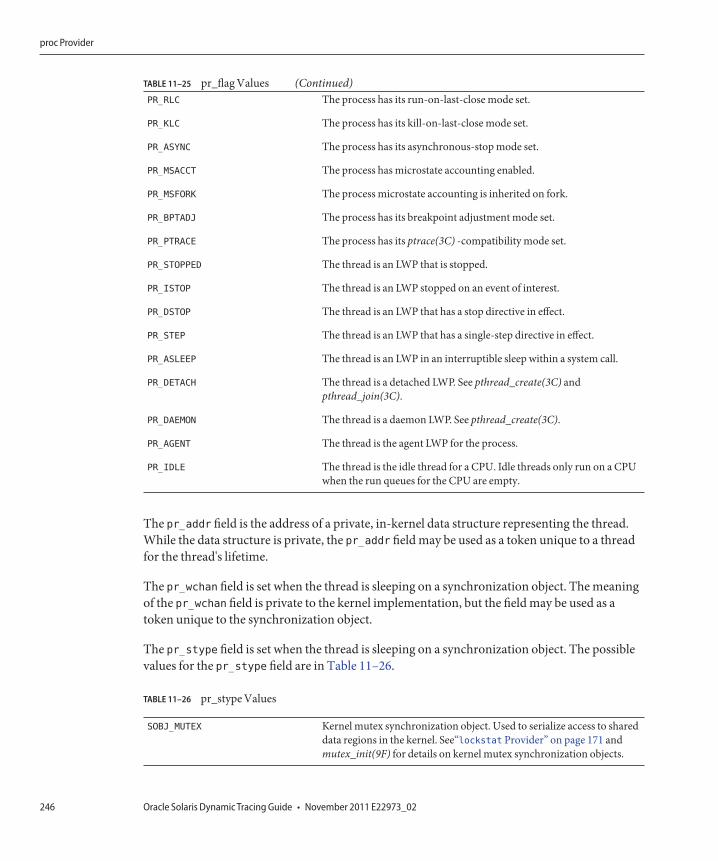
TABLE 11–25 pr_flag Values (Continued)PR_RLC The process has its run-on-last-close mode set.
PR_KLC The process has its kill-on-last-close mode set.
PR_ASYNC The process has its asynchronous-stop mode set.
PR_MSACCT The process has microstate accounting enabled.
PR_MSFORK The process microstate accounting is inherited on fork.
PR_BPTADJ The process has its breakpoint adjustment mode set.
PR_PTRACE The process has its ptrace(3C) -compatibility mode set.
PR_STOPPED The thread is an LWP that is stopped.
PR_ISTOP The thread is an LWP stopped on an event of interest.
PR_DSTOP The thread is an LWP that has a stop directive in effect.
PR_STEP The thread is an LWP that has a single-step directive in effect.
PR_ASLEEP The thread is an LWP in an interruptible sleep within a system call.
PR_DETACH The thread is a detached LWP. See pthread_create(3C) andpthread_join(3C).
PR_DAEMON The thread is a daemon LWP. See pthread_create(3C).
PR_AGENT The thread is the agent LWP for the process.
PR_IDLE The thread is the idle thread for a CPU. Idle threads only run on a CPUwhen the run queues for the CPU are empty.
The pr_addr field is the address of a private, in-kernel data structure representing the thread.While the data structure is private, the pr_addr field may be used as a token unique to a threadfor the thread's lifetime.
The pr_wchan field is set when the thread is sleeping on a synchronization object. The meaningof the pr_wchan field is private to the kernel implementation, but the field may be used as atoken unique to the synchronization object.
The pr_stype field is set when the thread is sleeping on a synchronization object. The possiblevalues for the pr_stype field are in Table 11–26.
TABLE 11–26 pr_stype Values
SOBJ_MUTEX Kernel mutex synchronization object. Used to serialize access to shareddata regions in the kernel. See“lockstat Provider” on page 171 andmutex_init(9F) for details on kernel mutex synchronization objects.
proc Provider
Oracle Solaris Dynamic Tracing Guide • November 2011 E22973_02246
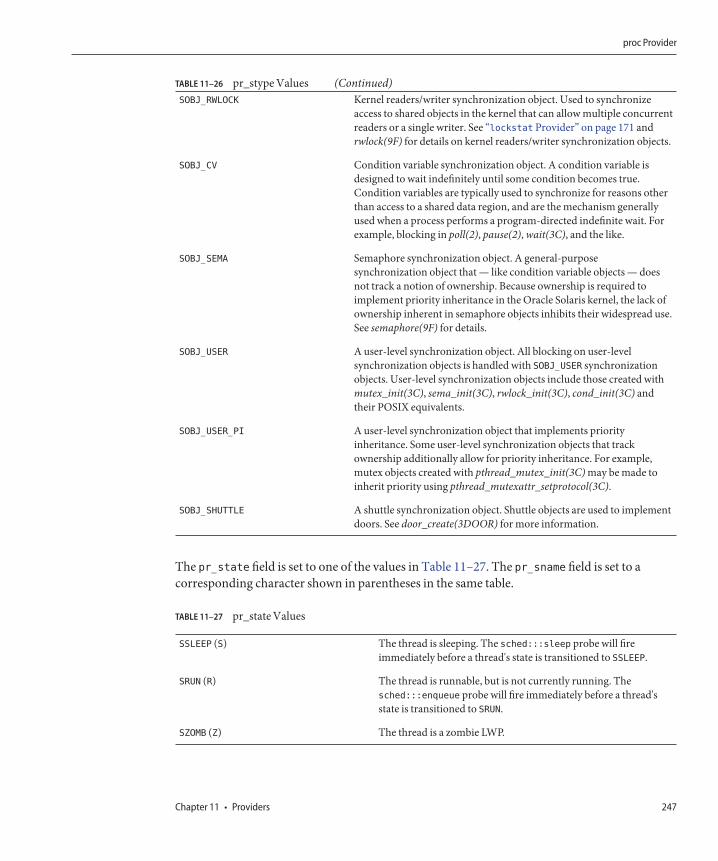
TABLE 11–26 pr_stype Values (Continued)SOBJ_RWLOCK Kernel readers/writer synchronization object. Used to synchronize
access to shared objects in the kernel that can allow multiple concurrentreaders or a single writer. See “lockstat Provider” on page 171 andrwlock(9F) for details on kernel readers/writer synchronization objects.
SOBJ_CV Condition variable synchronization object. A condition variable isdesigned to wait indefinitely until some condition becomes true.Condition variables are typically used to synchronize for reasons otherthan access to a shared data region, and are the mechanism generallyused when a process performs a program-directed indefinite wait. Forexample, blocking in poll(2), pause(2), wait(3C), and the like.
SOBJ_SEMA Semaphore synchronization object. A general-purposesynchronization object that — like condition variable objects — doesnot track a notion of ownership. Because ownership is required toimplement priority inheritance in the Oracle Solaris kernel, the lack ofownership inherent in semaphore objects inhibits their widespread use.See semaphore(9F) for details.
SOBJ_USER A user-level synchronization object. All blocking on user-levelsynchronization objects is handled with SOBJ_USER synchronizationobjects. User-level synchronization objects include those created withmutex_init(3C), sema_init(3C), rwlock_init(3C), cond_init(3C) andtheir POSIX equivalents.
SOBJ_USER_PI A user-level synchronization object that implements priorityinheritance. Some user-level synchronization objects that trackownership additionally allow for priority inheritance. For example,mutex objects created with pthread_mutex_init(3C) may be made toinherit priority using pthread_mutexattr_setprotocol(3C).
SOBJ_SHUTTLE A shuttle synchronization object. Shuttle objects are used to implementdoors. See door_create(3DOOR) for more information.
The pr_state field is set to one of the values in Table 11–27. The pr_sname field is set to acorresponding character shown in parentheses in the same table.
TABLE 11–27 pr_state Values
SSLEEP (S) The thread is sleeping. The sched:::sleep probe will fireimmediately before a thread's state is transitioned to SSLEEP.
SRUN (R) The thread is runnable, but is not currently running. Thesched:::enqueue probe will fire immediately before a thread'sstate is transitioned to SRUN.
SZOMB (Z) The thread is a zombie LWP.
proc Provider
Chapter 11 • Providers 247
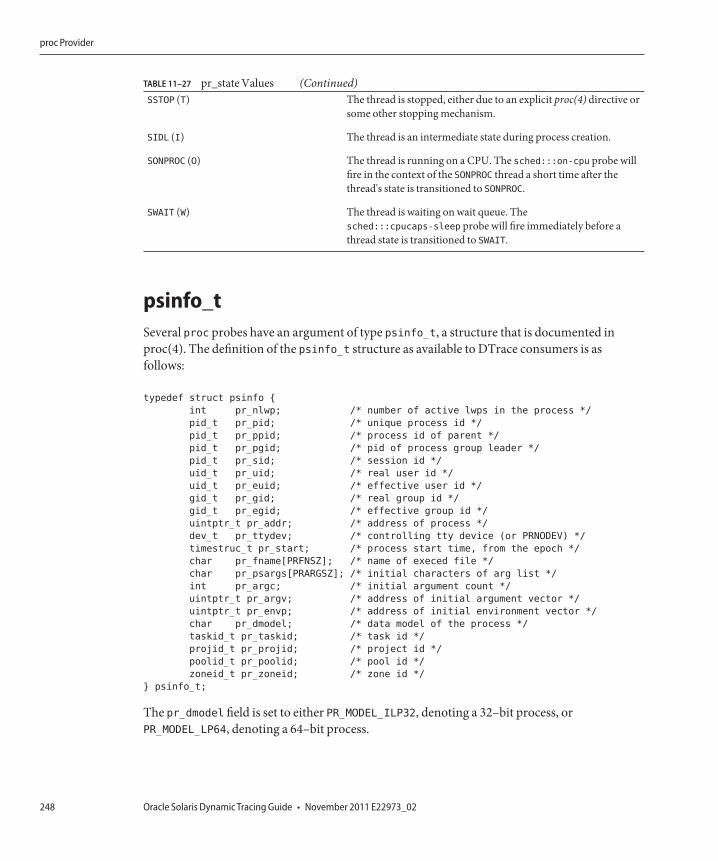
TABLE 11–27 pr_state Values (Continued)SSTOP (T) The thread is stopped, either due to an explicit proc(4) directive or
some other stopping mechanism.
SIDL (I) The thread is an intermediate state during process creation.
SONPROC (O) The thread is running on a CPU. The sched:::on-cpu probe willfire in the context of the SONPROC thread a short time after thethread's state is transitioned to SONPROC.
SWAIT (W) The thread is waiting on wait queue. Thesched:::cpucaps-sleep probe will fire immediately before athread state is transitioned to SWAIT.
psinfo_tSeveral proc probes have an argument of type psinfo_t, a structure that is documented inproc(4). The definition of the psinfo_t structure as available to DTrace consumers is asfollows:
typedef struct psinfo {
int pr_nlwp; /* number of active lwps in the process */
pid_t pr_pid; /* unique process id */
pid_t pr_ppid; /* process id of parent */
pid_t pr_pgid; /* pid of process group leader */
pid_t pr_sid; /* session id */
uid_t pr_uid; /* real user id */
uid_t pr_euid; /* effective user id */
gid_t pr_gid; /* real group id */
gid_t pr_egid; /* effective group id */
uintptr_t pr_addr; /* address of process */
dev_t pr_ttydev; /* controlling tty device (or PRNODEV) */
timestruc_t pr_start; /* process start time, from the epoch */
char pr_fname[PRFNSZ]; /* name of execed file */
char pr_psargs[PRARGSZ]; /* initial characters of arg list */
int pr_argc; /* initial argument count */
uintptr_t pr_argv; /* address of initial argument vector */
uintptr_t pr_envp; /* address of initial environment vector */
char pr_dmodel; /* data model of the process */
taskid_t pr_taskid; /* task id */
projid_t pr_projid; /* project id */
poolid_t pr_poolid; /* pool id */
zoneid_t pr_zoneid; /* zone id */
} psinfo_t;
The pr_dmodel field is set to either PR_MODEL_ILP32, denoting a 32–bit process, orPR_MODEL_LP64, denoting a 64–bit process.
proc Provider
Oracle Solaris Dynamic Tracing Guide • November 2011 E22973_02248
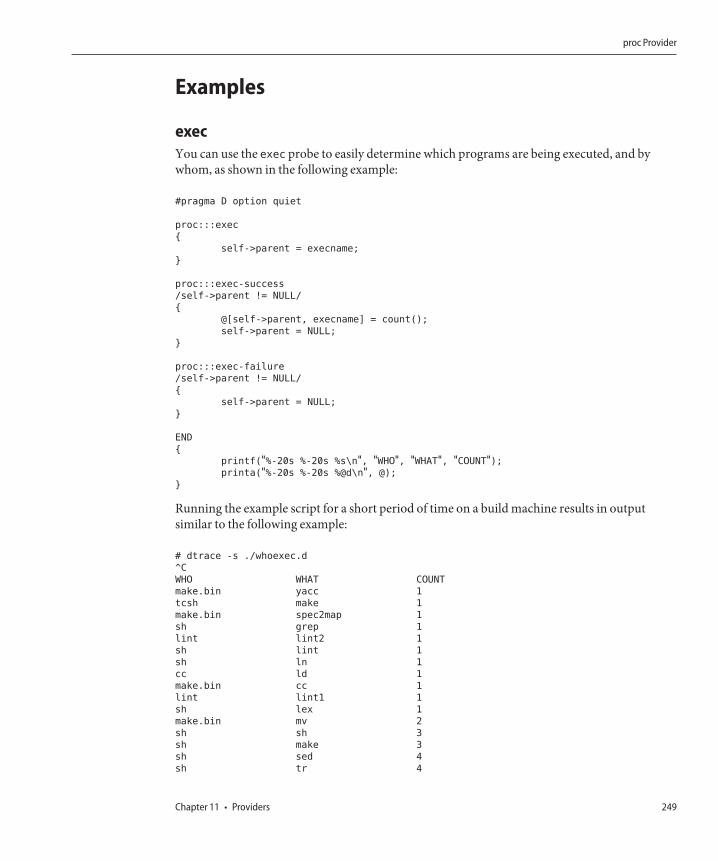
Examples
execYou can use the exec probe to easily determine which programs are being executed, and bywhom, as shown in the following example:
#pragma D option quiet
proc:::exec
{
self->parent = execname;
}
proc:::exec-success
/self->parent != NULL/
{
@[self->parent, execname] = count();
self->parent = NULL;
}
proc:::exec-failure
/self->parent != NULL/
{
self->parent = NULL;
}
END
{
printf("%-20s %-20s %s\n", "WHO", "WHAT", "COUNT");printa("%-20s %-20s %@d\n", @);
}
Running the example script for a short period of time on a build machine results in outputsimilar to the following example:
# dtrace -s ./whoexec.d
^C
WHO WHAT COUNT
make.bin yacc 1
tcsh make 1
make.bin spec2map 1
sh grep 1
lint lint2 1
sh lint 1
sh ln 1
cc ld 1
make.bin cc 1
lint lint1 1
sh lex 1
make.bin mv 2
sh sh 3
sh make 3
sh sed 4
sh tr 4
proc Provider
Chapter 11 • Providers 249
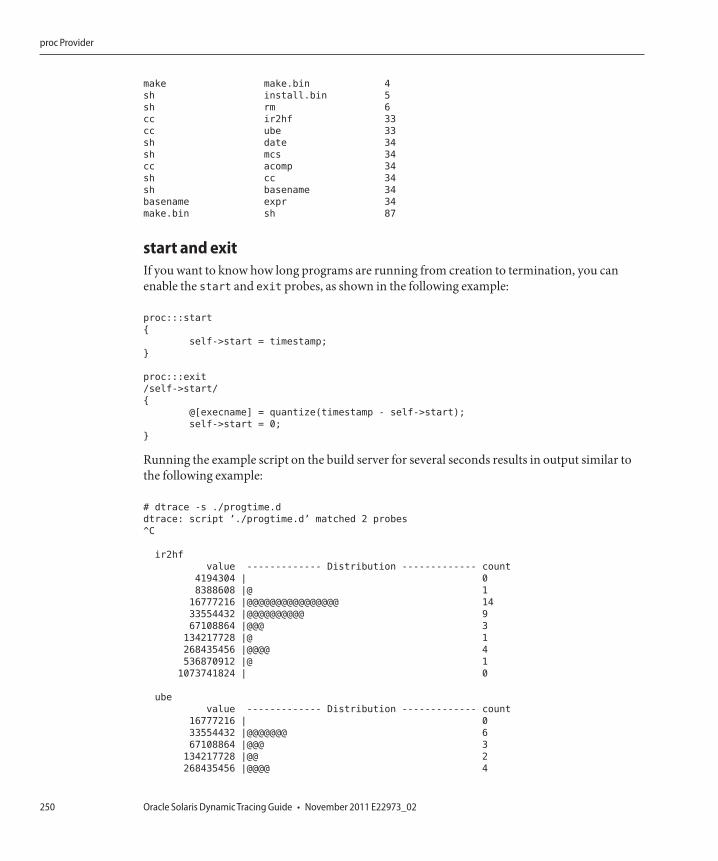
make make.bin 4
sh install.bin 5
sh rm 6
cc ir2hf 33
cc ube 33
sh date 34
sh mcs 34
cc acomp 34
sh cc 34
sh basename 34
basename expr 34
make.bin sh 87
start and exitIf you want to know how long programs are running from creation to termination, you canenable the start and exit probes, as shown in the following example:
proc:::start
{
self->start = timestamp;
}
proc:::exit
/self->start/
{
@[execname] = quantize(timestamp - self->start);
self->start = 0;
}
Running the example script on the build server for several seconds results in output similar tothe following example:
# dtrace -s ./progtime.d
dtrace: script ’./progtime.d’ matched 2 probes
^C
ir2hf
value ------------- Distribution ------------- count
4194304 | 0
8388608 |@ 1
16777216 |@@@@@@@@@@@@@@@@ 14
33554432 |@@@@@@@@@@ 9
67108864 |@@@ 3
134217728 |@ 1
268435456 |@@@@ 4
536870912 |@ 1
1073741824 | 0
ube
value ------------- Distribution ------------- count
16777216 | 0
33554432 |@@@@@@@ 6
67108864 |@@@ 3
134217728 |@@ 2
268435456 |@@@@ 4
proc Provider
Oracle Solaris Dynamic Tracing Guide • November 2011 E22973_02250
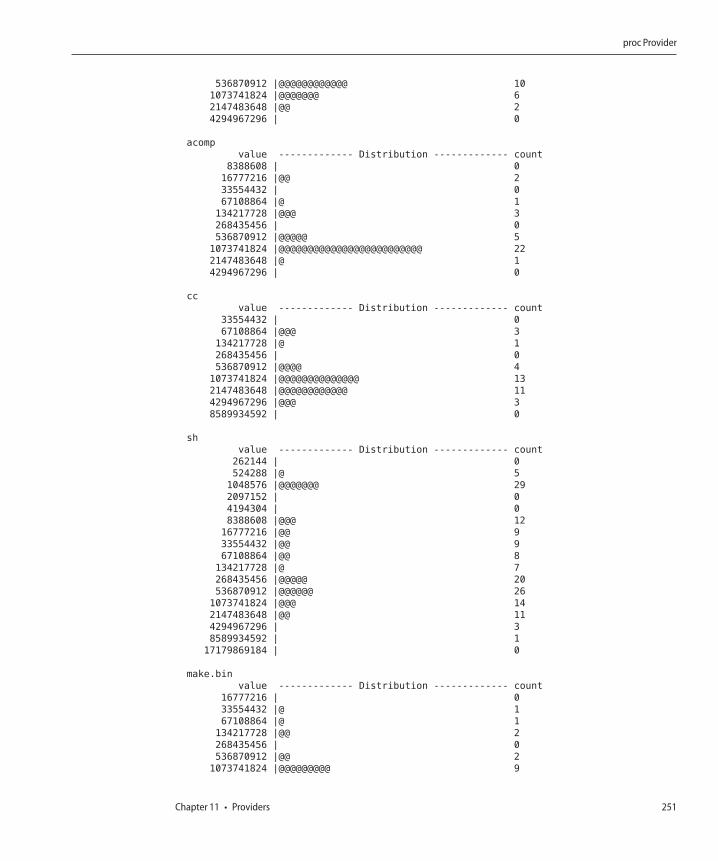
536870912 |@@@@@@@@@@@@ 10
1073741824 |@@@@@@@ 6
2147483648 |@@ 2
4294967296 | 0
acomp
value ------------- Distribution ------------- count
8388608 | 0
16777216 |@@ 2
33554432 | 0
67108864 |@ 1
134217728 |@@@ 3
268435456 | 0
536870912 |@@@@@ 5
1073741824 |@@@@@@@@@@@@@@@@@@@@@@@@@ 22
2147483648 |@ 1
4294967296 | 0
cc
value ------------- Distribution ------------- count
33554432 | 0
67108864 |@@@ 3
134217728 |@ 1
268435456 | 0
536870912 |@@@@ 4
1073741824 |@@@@@@@@@@@@@@ 13
2147483648 |@@@@@@@@@@@@ 11
4294967296 |@@@ 3
8589934592 | 0
sh
value ------------- Distribution ------------- count
262144 | 0
524288 |@ 5
1048576 |@@@@@@@ 29
2097152 | 0
4194304 | 0
8388608 |@@@ 12
16777216 |@@ 9
33554432 |@@ 9
67108864 |@@ 8
134217728 |@ 7
268435456 |@@@@@ 20
536870912 |@@@@@@ 26
1073741824 |@@@ 14
2147483648 |@@ 11
4294967296 | 3
8589934592 | 1
17179869184 | 0
make.bin
value ------------- Distribution ------------- count
16777216 | 0
33554432 |@ 1
67108864 |@ 1
134217728 |@@ 2
268435456 | 0
536870912 |@@ 2
1073741824 |@@@@@@@@@ 9
proc Provider
Chapter 11 • Providers 251
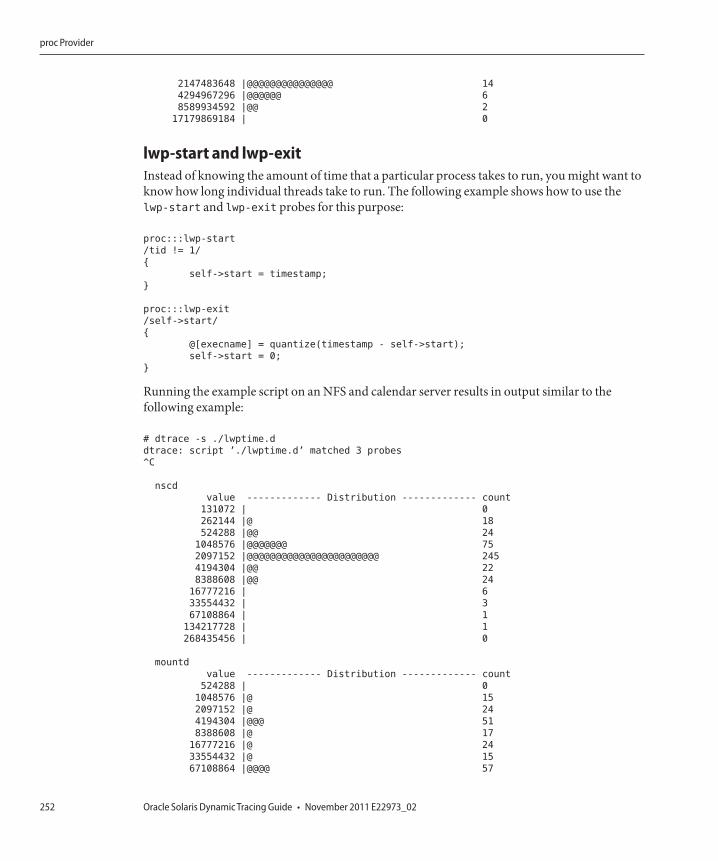
2147483648 |@@@@@@@@@@@@@@@ 14
4294967296 |@@@@@@ 6
8589934592 |@@ 2
17179869184 | 0
lwp-start and lwp-exitInstead of knowing the amount of time that a particular process takes to run, you might want toknow how long individual threads take to run. The following example shows how to use thelwp-start and lwp-exit probes for this purpose:
proc:::lwp-start
/tid != 1/
{
self->start = timestamp;
}
proc:::lwp-exit
/self->start/
{
@[execname] = quantize(timestamp - self->start);
self->start = 0;
}
Running the example script on an NFS and calendar server results in output similar to thefollowing example:
# dtrace -s ./lwptime.d
dtrace: script ’./lwptime.d’ matched 3 probes
^C
nscd
value ------------- Distribution ------------- count
131072 | 0
262144 |@ 18
524288 |@@ 24
1048576 |@@@@@@@ 75
2097152 |@@@@@@@@@@@@@@@@@@@@@@@ 245
4194304 |@@ 22
8388608 |@@ 24
16777216 | 6
33554432 | 3
67108864 | 1
134217728 | 1
268435456 | 0
mountd
value ------------- Distribution ------------- count
524288 | 0
1048576 |@ 15
2097152 |@ 24
4194304 |@@@ 51
8388608 |@ 17
16777216 |@ 24
33554432 |@ 15
67108864 |@@@@ 57
proc Provider
Oracle Solaris Dynamic Tracing Guide • November 2011 E22973_02252
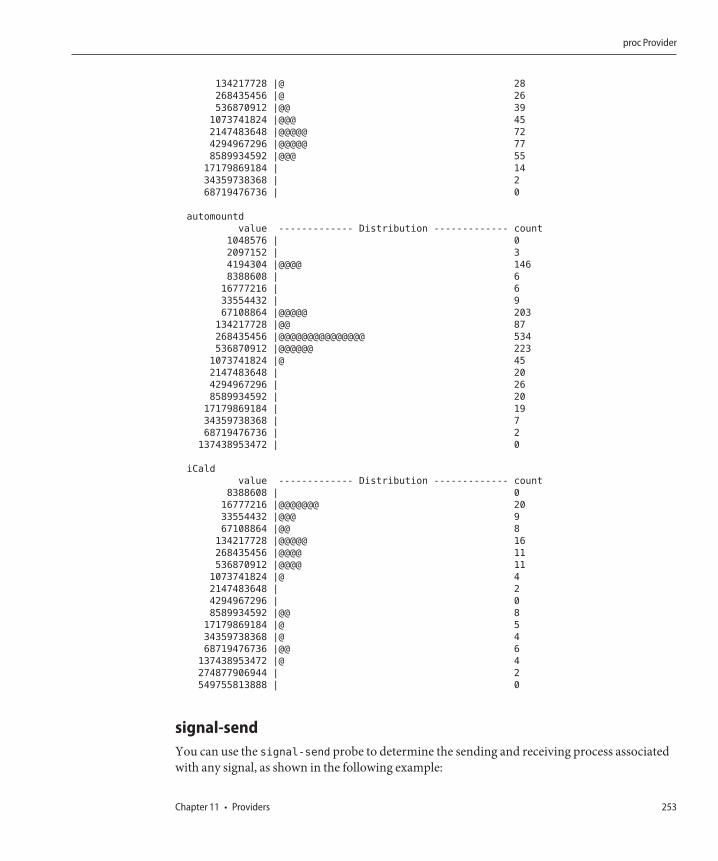
134217728 |@ 28
268435456 |@ 26
536870912 |@@ 39
1073741824 |@@@ 45
2147483648 |@@@@@ 72
4294967296 |@@@@@ 77
8589934592 |@@@ 55
17179869184 | 14
34359738368 | 2
68719476736 | 0
automountd
value ------------- Distribution ------------- count
1048576 | 0
2097152 | 3
4194304 |@@@@ 146
8388608 | 6
16777216 | 6
33554432 | 9
67108864 |@@@@@ 203
134217728 |@@ 87
268435456 |@@@@@@@@@@@@@@@ 534
536870912 |@@@@@@ 223
1073741824 |@ 45
2147483648 | 20
4294967296 | 26
8589934592 | 20
17179869184 | 19
34359738368 | 7
68719476736 | 2
137438953472 | 0
iCald
value ------------- Distribution ------------- count
8388608 | 0
16777216 |@@@@@@@ 20
33554432 |@@@ 9
67108864 |@@ 8
134217728 |@@@@@ 16
268435456 |@@@@ 11
536870912 |@@@@ 11
1073741824 |@ 4
2147483648 | 2
4294967296 | 0
8589934592 |@@ 8
17179869184 |@ 5
34359738368 |@ 4
68719476736 |@@ 6
137438953472 |@ 4
274877906944 | 2
549755813888 | 0
signal-sendYou can use the signal-send probe to determine the sending and receiving process associatedwith any signal, as shown in the following example:
proc Provider
Chapter 11 • Providers 253
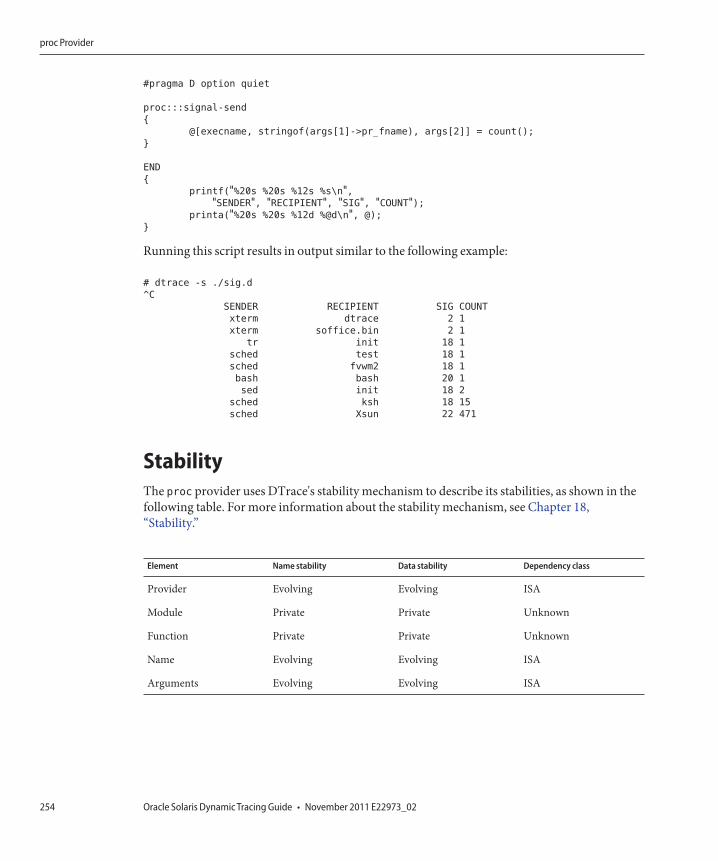
#pragma D option quiet
proc:::signal-send
{
@[execname, stringof(args[1]->pr_fname), args[2]] = count();
}
END
{
printf("%20s %20s %12s %s\n","SENDER", "RECIPIENT", "SIG", "COUNT");
printa("%20s %20s %12d %@d\n", @);
}
Running this script results in output similar to the following example:
# dtrace -s ./sig.d
^C
SENDER RECIPIENT SIG COUNT
xterm dtrace 2 1
xterm soffice.bin 2 1
tr init 18 1
sched test 18 1
sched fvwm2 18 1
bash bash 20 1
sed init 18 2
sched ksh 18 15
sched Xsun 22 471
StabilityThe proc provider uses DTrace's stability mechanism to describe its stabilities, as shown in thefollowing table. For more information about the stability mechanism, see Chapter 18,“Stability.”
Element Name stability Data stability Dependency class
Provider Evolving Evolving ISA
Module Private Private Unknown
Function Private Private Unknown
Name Evolving Evolving ISA
Arguments Evolving Evolving ISA
proc Provider
Oracle Solaris Dynamic Tracing Guide • November 2011 E22973_02254
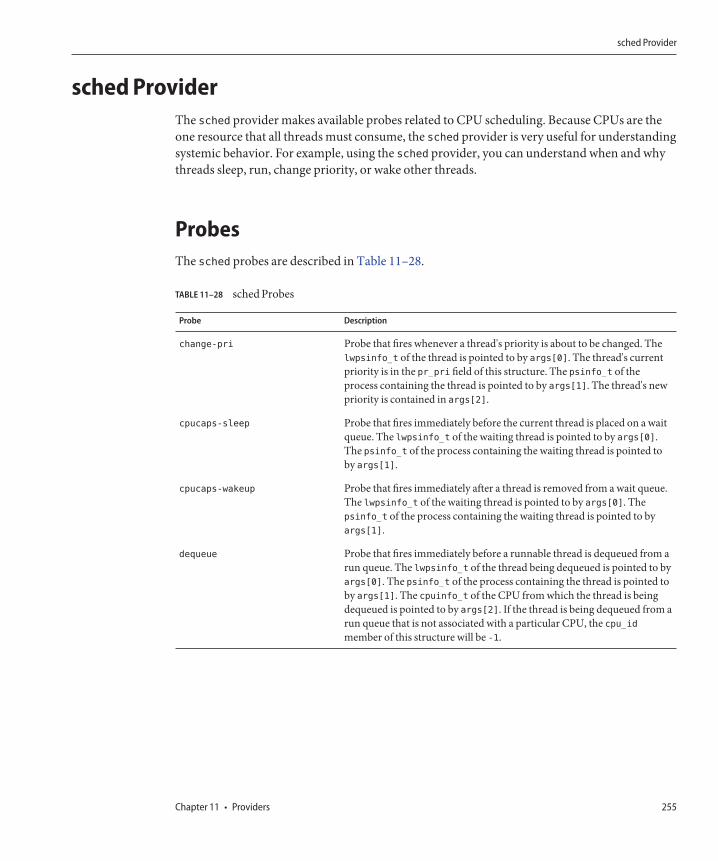
sched ProviderThe sched provider makes available probes related to CPU scheduling. Because CPUs are theone resource that all threads must consume, the sched provider is very useful for understandingsystemic behavior. For example, using the sched provider, you can understand when and whythreads sleep, run, change priority, or wake other threads.
ProbesThe sched probes are described in Table 11–28.
TABLE 11–28 sched Probes
Probe Description
change-pri Probe that fires whenever a thread's priority is about to be changed. Thelwpsinfo_t of the thread is pointed to by args[0]. The thread's currentpriority is in the pr_pri field of this structure. The psinfo_t of theprocess containing the thread is pointed to by args[1]. The thread's newpriority is contained in args[2].
cpucaps-sleep Probe that fires immediately before the current thread is placed on a waitqueue. The lwpsinfo_t of the waiting thread is pointed to by args[0].The psinfo_t of the process containing the waiting thread is pointed toby args[1].
cpucaps-wakeup Probe that fires immediately after a thread is removed from a wait queue.The lwpsinfo_t of the waiting thread is pointed to by args[0]. Thepsinfo_t of the process containing the waiting thread is pointed to byargs[1].
dequeue Probe that fires immediately before a runnable thread is dequeued from arun queue. The lwpsinfo_t of the thread being dequeued is pointed to byargs[0]. The psinfo_t of the process containing the thread is pointed toby args[1]. The cpuinfo_t of the CPU from which the thread is beingdequeued is pointed to by args[2]. If the thread is being dequeued from arun queue that is not associated with a particular CPU, the cpu_idmember of this structure will be -1.
sched Provider
Chapter 11 • Providers 255
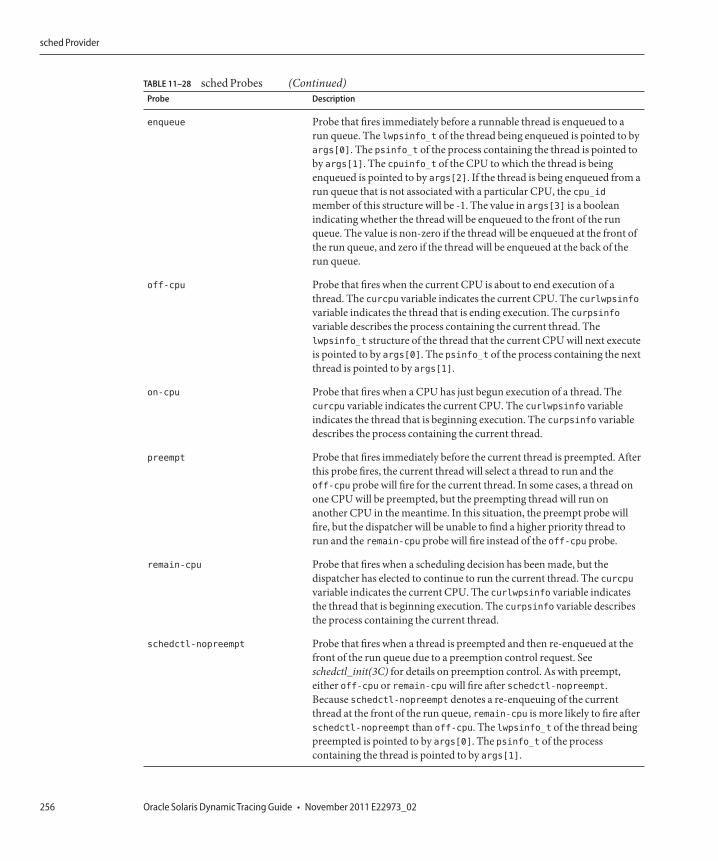
TABLE 11–28 sched Probes (Continued)Probe Description
enqueue Probe that fires immediately before a runnable thread is enqueued to arun queue. The lwpsinfo_t of the thread being enqueued is pointed to byargs[0]. The psinfo_t of the process containing the thread is pointed toby args[1]. The cpuinfo_t of the CPU to which the thread is beingenqueued is pointed to by args[2]. If the thread is being enqueued from arun queue that is not associated with a particular CPU, the cpu_idmember of this structure will be -1. The value in args[3] is a booleanindicating whether the thread will be enqueued to the front of the runqueue. The value is non-zero if the thread will be enqueued at the front ofthe run queue, and zero if the thread will be enqueued at the back of therun queue.
off-cpu Probe that fires when the current CPU is about to end execution of athread. The curcpu variable indicates the current CPU. The curlwpsinfovariable indicates the thread that is ending execution. The curpsinfovariable describes the process containing the current thread. Thelwpsinfo_t structure of the thread that the current CPU will next executeis pointed to by args[0]. The psinfo_t of the process containing the nextthread is pointed to by args[1].
on-cpu Probe that fires when a CPU has just begun execution of a thread. Thecurcpu variable indicates the current CPU. The curlwpsinfo variableindicates the thread that is beginning execution. The curpsinfo variabledescribes the process containing the current thread.
preempt Probe that fires immediately before the current thread is preempted. Afterthis probe fires, the current thread will select a thread to run and theoff-cpu probe will fire for the current thread. In some cases, a thread onone CPU will be preempted, but the preempting thread will run onanother CPU in the meantime. In this situation, the preempt probe willfire, but the dispatcher will be unable to find a higher priority thread torun and the remain-cpu probe will fire instead of the off-cpu probe.
remain-cpu Probe that fires when a scheduling decision has been made, but thedispatcher has elected to continue to run the current thread. The curcpuvariable indicates the current CPU. The curlwpsinfo variable indicatesthe thread that is beginning execution. The curpsinfo variable describesthe process containing the current thread.
schedctl-nopreempt Probe that fires when a thread is preempted and then re-enqueued at thefront of the run queue due to a preemption control request. Seeschedctl_init(3C) for details on preemption control. As with preempt,either off-cpu or remain-cpu will fire after schedctl-nopreempt.Because schedctl-nopreempt denotes a re-enqueuing of the currentthread at the front of the run queue, remain-cpu is more likely to fire afterschedctl-nopreempt than off-cpu. The lwpsinfo_t of the thread beingpreempted is pointed to by args[0]. The psinfo_t of the processcontaining the thread is pointed to by args[1].
sched Provider
Oracle Solaris Dynamic Tracing Guide • November 2011 E22973_02256
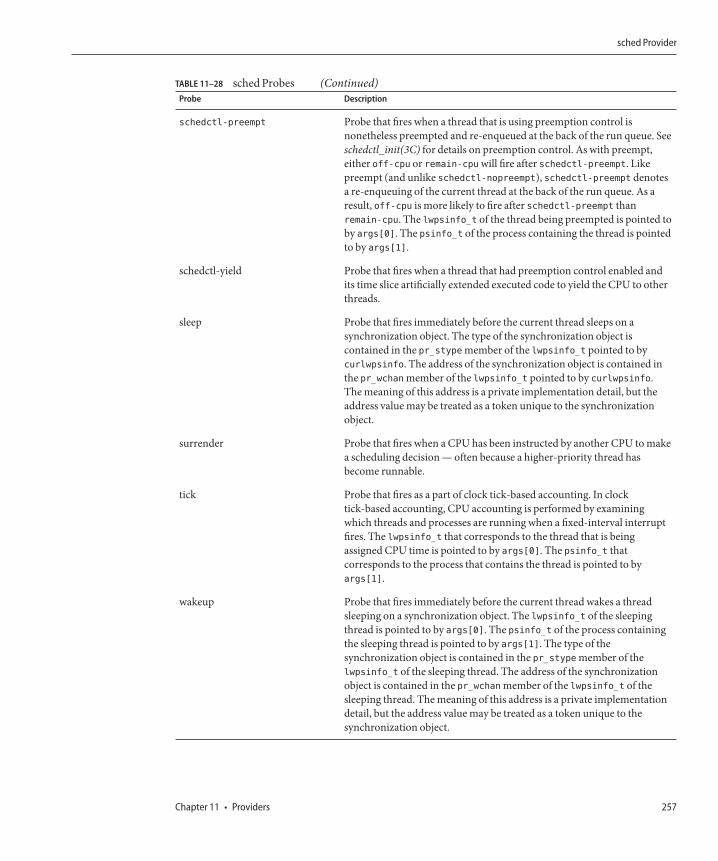
TABLE 11–28 sched Probes (Continued)Probe Description
schedctl-preempt Probe that fires when a thread that is using preemption control isnonetheless preempted and re-enqueued at the back of the run queue. Seeschedctl_init(3C) for details on preemption control. As with preempt,either off-cpu or remain-cpu will fire after schedctl-preempt. Likepreempt (and unlike schedctl-nopreempt), schedctl-preempt denotesa re-enqueuing of the current thread at the back of the run queue. As aresult, off-cpu is more likely to fire after schedctl-preempt thanremain-cpu. The lwpsinfo_t of the thread being preempted is pointed toby args[0]. The psinfo_t of the process containing the thread is pointedto by args[1].
schedctl-yield Probe that fires when a thread that had preemption control enabled andits time slice artificially extended executed code to yield the CPU to otherthreads.
sleep Probe that fires immediately before the current thread sleeps on asynchronization object. The type of the synchronization object iscontained in the pr_stype member of the lwpsinfo_t pointed to bycurlwpsinfo. The address of the synchronization object is contained inthe pr_wchan member of the lwpsinfo_t pointed to by curlwpsinfo.The meaning of this address is a private implementation detail, but theaddress value may be treated as a token unique to the synchronizationobject.
surrender Probe that fires when a CPU has been instructed by another CPU to makea scheduling decision — often because a higher-priority thread hasbecome runnable.
tick Probe that fires as a part of clock tick-based accounting. In clocktick-based accounting, CPU accounting is performed by examiningwhich threads and processes are running when a fixed-interval interruptfires. The lwpsinfo_t that corresponds to the thread that is beingassigned CPU time is pointed to by args[0]. The psinfo_t thatcorresponds to the process that contains the thread is pointed to byargs[1].
wakeup Probe that fires immediately before the current thread wakes a threadsleeping on a synchronization object. The lwpsinfo_t of the sleepingthread is pointed to by args[0]. The psinfo_t of the process containingthe sleeping thread is pointed to by args[1]. The type of thesynchronization object is contained in the pr_stype member of thelwpsinfo_t of the sleeping thread. The address of the synchronizationobject is contained in the pr_wchan member of the lwpsinfo_t of thesleeping thread. The meaning of this address is a private implementationdetail, but the address value may be treated as a token unique to thesynchronization object.
sched Provider
Chapter 11 • Providers 257
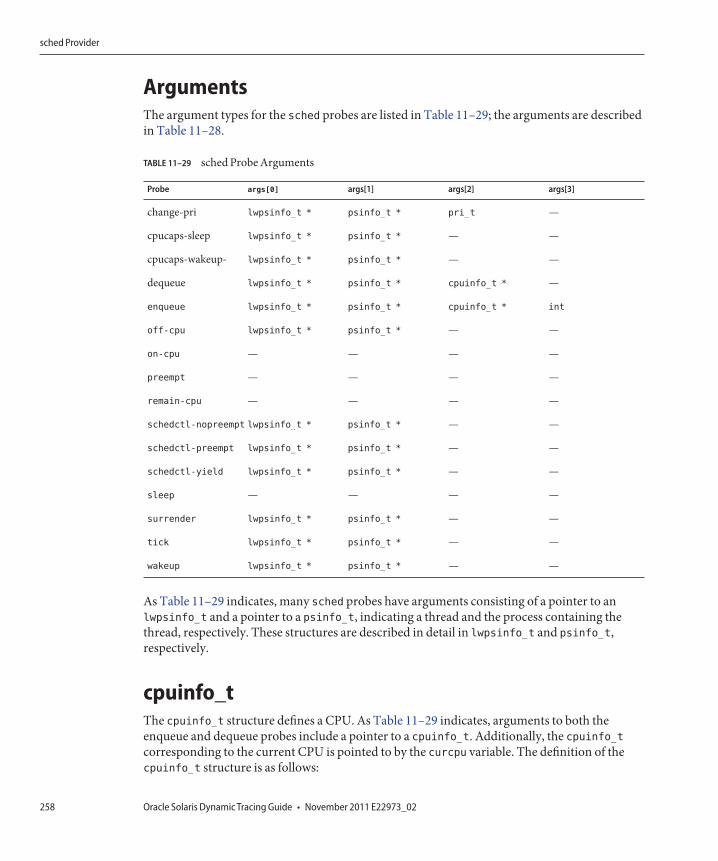
ArgumentsThe argument types for the sched probes are listed in Table 11–29; the arguments are describedin Table 11–28.
TABLE 11–29 sched Probe Arguments
Probe args[0] args[1] args[2] args[3]
change-pri lwpsinfo_t * psinfo_t * pri_t —
cpucaps-sleep lwpsinfo_t * psinfo_t * — —
cpucaps-wakeup- lwpsinfo_t * psinfo_t * — —
dequeue lwpsinfo_t * psinfo_t * cpuinfo_t * —
enqueue lwpsinfo_t * psinfo_t * cpuinfo_t * int
off-cpu lwpsinfo_t * psinfo_t * — —
on-cpu — — — —
preempt — — — —
remain-cpu — — — —
schedctl-nopreempt lwpsinfo_t * psinfo_t * — —
schedctl-preempt lwpsinfo_t * psinfo_t * — —
schedctl-yield lwpsinfo_t * psinfo_t * — —
sleep — — — —
surrender lwpsinfo_t * psinfo_t * — —
tick lwpsinfo_t * psinfo_t * — —
wakeup lwpsinfo_t * psinfo_t * — —
As Table 11–29 indicates, many sched probes have arguments consisting of a pointer to anlwpsinfo_t and a pointer to a psinfo_t, indicating a thread and the process containing thethread, respectively. These structures are described in detail in lwpsinfo_t and psinfo_t,respectively.
cpuinfo_tThe cpuinfo_t structure defines a CPU. As Table 11–29 indicates, arguments to both theenqueue and dequeue probes include a pointer to a cpuinfo_t. Additionally, the cpuinfo_tcorresponding to the current CPU is pointed to by the curcpu variable. The definition of thecpuinfo_t structure is as follows:
sched Provider
Oracle Solaris Dynamic Tracing Guide • November 2011 E22973_02258
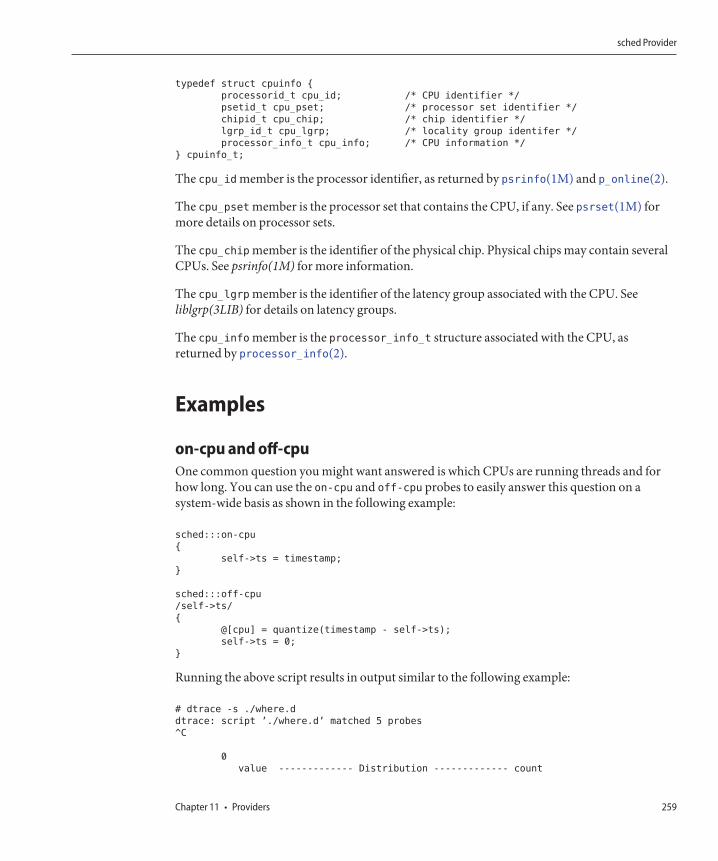
typedef struct cpuinfo {
processorid_t cpu_id; /* CPU identifier */
psetid_t cpu_pset; /* processor set identifier */
chipid_t cpu_chip; /* chip identifier */
lgrp_id_t cpu_lgrp; /* locality group identifer */
processor_info_t cpu_info; /* CPU information */
} cpuinfo_t;
The cpu_id member is the processor identifier, as returned by psrinfo(1M) and p_online(2).
The cpu_pset member is the processor set that contains the CPU, if any. See psrset(1M) formore details on processor sets.
The cpu_chip member is the identifier of the physical chip. Physical chips may contain severalCPUs. See psrinfo(1M) for more information.
The cpu_lgrp member is the identifier of the latency group associated with the CPU. Seeliblgrp(3LIB) for details on latency groups.
The cpu_info member is the processor_info_t structure associated with the CPU, asreturned by processor_info(2).
Examples
on-cpu and off-cpuOne common question you might want answered is which CPUs are running threads and forhow long. You can use the on-cpu and off-cpu probes to easily answer this question on asystem-wide basis as shown in the following example:
sched:::on-cpu
{
self->ts = timestamp;
}
sched:::off-cpu
/self->ts/
{
@[cpu] = quantize(timestamp - self->ts);
self->ts = 0;
}
Running the above script results in output similar to the following example:
# dtrace -s ./where.d
dtrace: script ’./where.d’ matched 5 probes
^C
0
value ------------- Distribution ------------- count
sched Provider
Chapter 11 • Providers 259
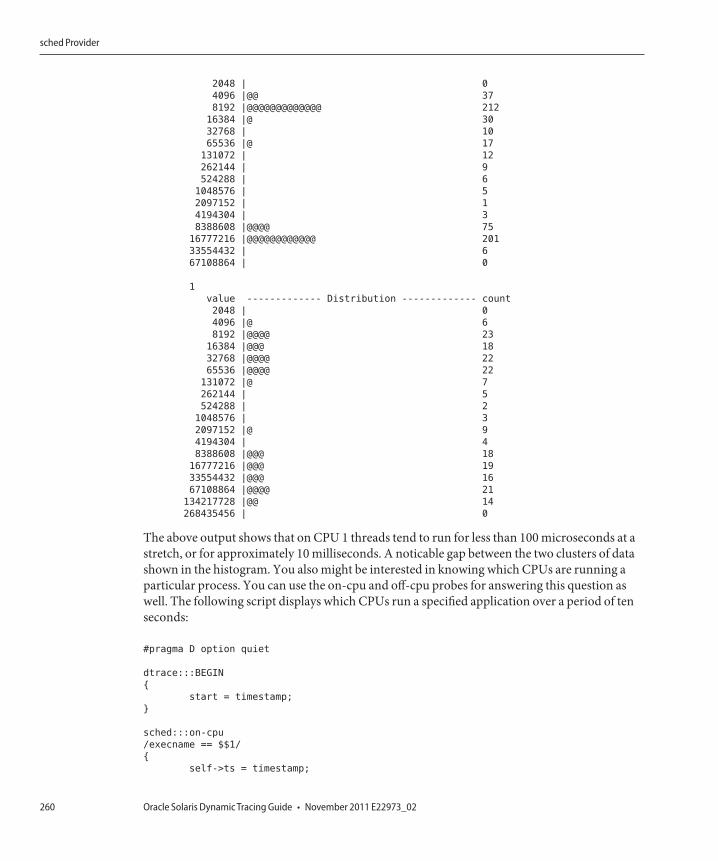
2048 | 0
4096 |@@ 37
8192 |@@@@@@@@@@@@@ 212
16384 |@ 30
32768 | 10
65536 |@ 17
131072 | 12
262144 | 9
524288 | 6
1048576 | 5
2097152 | 1
4194304 | 3
8388608 |@@@@ 75
16777216 |@@@@@@@@@@@@ 201
33554432 | 6
67108864 | 0
1
value ------------- Distribution ------------- count
2048 | 0
4096 |@ 6
8192 |@@@@ 23
16384 |@@@ 18
32768 |@@@@ 22
65536 |@@@@ 22
131072 |@ 7
262144 | 5
524288 | 2
1048576 | 3
2097152 |@ 9
4194304 | 4
8388608 |@@@ 18
16777216 |@@@ 19
33554432 |@@@ 16
67108864 |@@@@ 21
134217728 |@@ 14
268435456 | 0
The above output shows that on CPU 1 threads tend to run for less than 100 microseconds at astretch, or for approximately 10 milliseconds. A noticable gap between the two clusters of datashown in the histogram. You also might be interested in knowing which CPUs are running aparticular process. You can use the on-cpu and off-cpu probes for answering this question aswell. The following script displays which CPUs run a specified application over a period of tenseconds:
#pragma D option quiet
dtrace:::BEGIN
{
start = timestamp;
}
sched:::on-cpu
/execname == $$1/
{
self->ts = timestamp;
sched Provider
Oracle Solaris Dynamic Tracing Guide • November 2011 E22973_02260
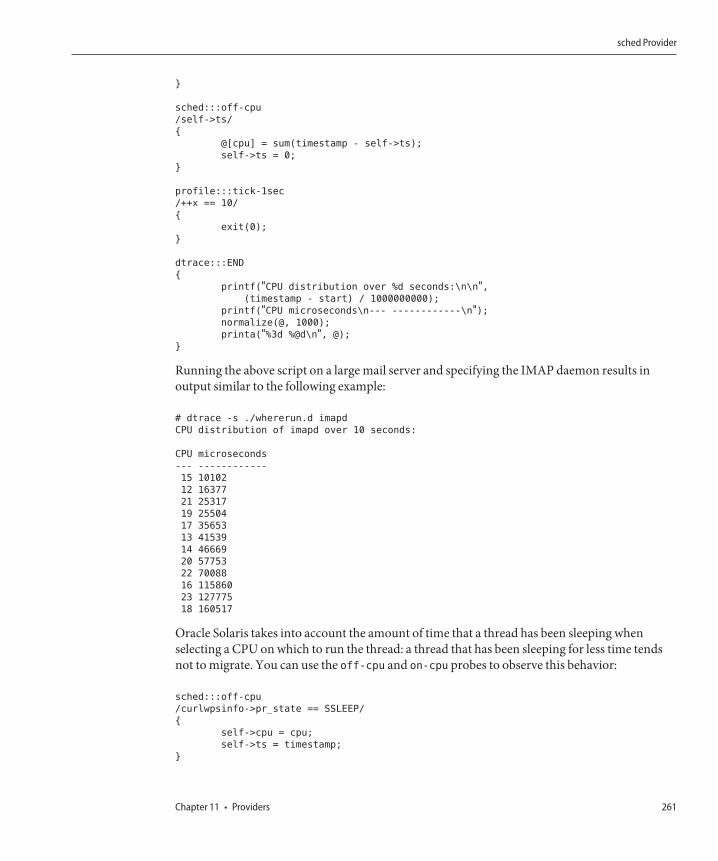
}
sched:::off-cpu
/self->ts/
{
@[cpu] = sum(timestamp - self->ts);
self->ts = 0;
}
profile:::tick-1sec
/++x == 10/
{
exit(0);
}
dtrace:::END
{
printf("CPU distribution over %d seconds:\n\n",(timestamp - start) / 1000000000);
printf("CPU microseconds\n--- ------------\n");normalize(@, 1000);
printa("%3d %@d\n", @);
}
Running the above script on a large mail server and specifying the IMAP daemon results inoutput similar to the following example:
# dtrace -s ./whererun.d imapd
CPU distribution of imapd over 10 seconds:
CPU microseconds
--- ------------
15 10102
12 16377
21 25317
19 25504
17 35653
13 41539
14 46669
20 57753
22 70088
16 115860
23 127775
18 160517
Oracle Solaris takes into account the amount of time that a thread has been sleeping whenselecting a CPU on which to run the thread: a thread that has been sleeping for less time tendsnot to migrate. You can use the off-cpu and on-cpu probes to observe this behavior:
sched:::off-cpu
/curlwpsinfo->pr_state == SSLEEP/
{
self->cpu = cpu;
self->ts = timestamp;
}
sched Provider
Chapter 11 • Providers 261
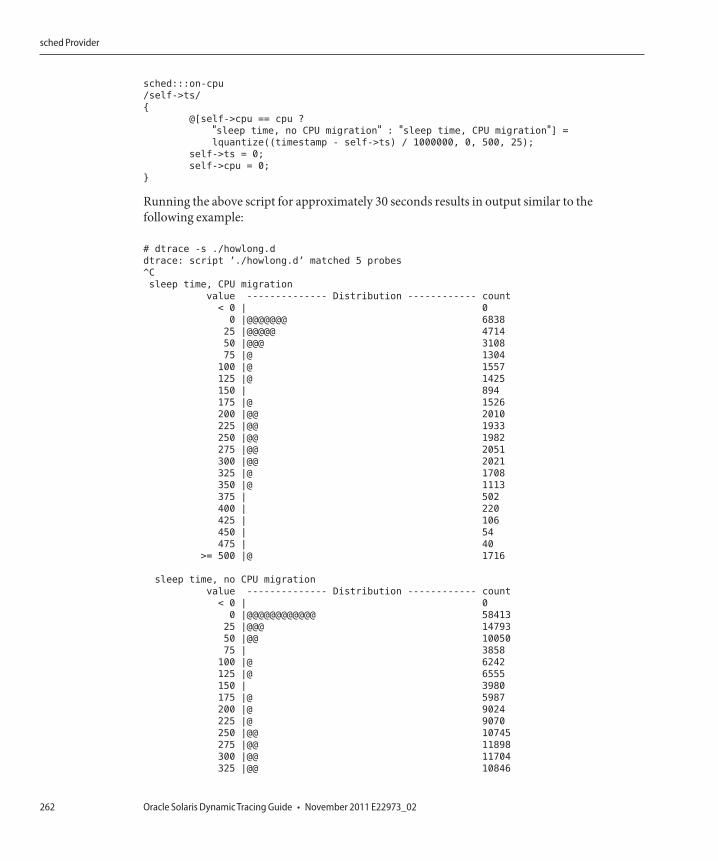
sched:::on-cpu
/self->ts/
{
@[self->cpu == cpu ?
"sleep time, no CPU migration" : "sleep time, CPU migration"] =
lquantize((timestamp - self->ts) / 1000000, 0, 500, 25);
self->ts = 0;
self->cpu = 0;
}
Running the above script for approximately 30 seconds results in output similar to thefollowing example:
# dtrace -s ./howlong.d
dtrace: script ’./howlong.d’ matched 5 probes
^C
sleep time, CPU migration
value -------------- Distribution ------------ count
< 0 | 0
0 |@@@@@@@ 6838
25 |@@@@@ 4714
50 |@@@ 3108
75 |@ 1304
100 |@ 1557
125 |@ 1425
150 | 894
175 |@ 1526
200 |@@ 2010
225 |@@ 1933
250 |@@ 1982
275 |@@ 2051
300 |@@ 2021
325 |@ 1708
350 |@ 1113
375 | 502
400 | 220
425 | 106
450 | 54
475 | 40
>= 500 |@ 1716
sleep time, no CPU migration
value -------------- Distribution ------------ count
< 0 | 0
0 |@@@@@@@@@@@@ 58413
25 |@@@ 14793
50 |@@ 10050
75 | 3858
100 |@ 6242
125 |@ 6555
150 | 3980
175 |@ 5987
200 |@ 9024
225 |@ 9070
250 |@@ 10745
275 |@@ 11898
300 |@@ 11704
325 |@@ 10846
sched Provider
Oracle Solaris Dynamic Tracing Guide • November 2011 E22973_02262
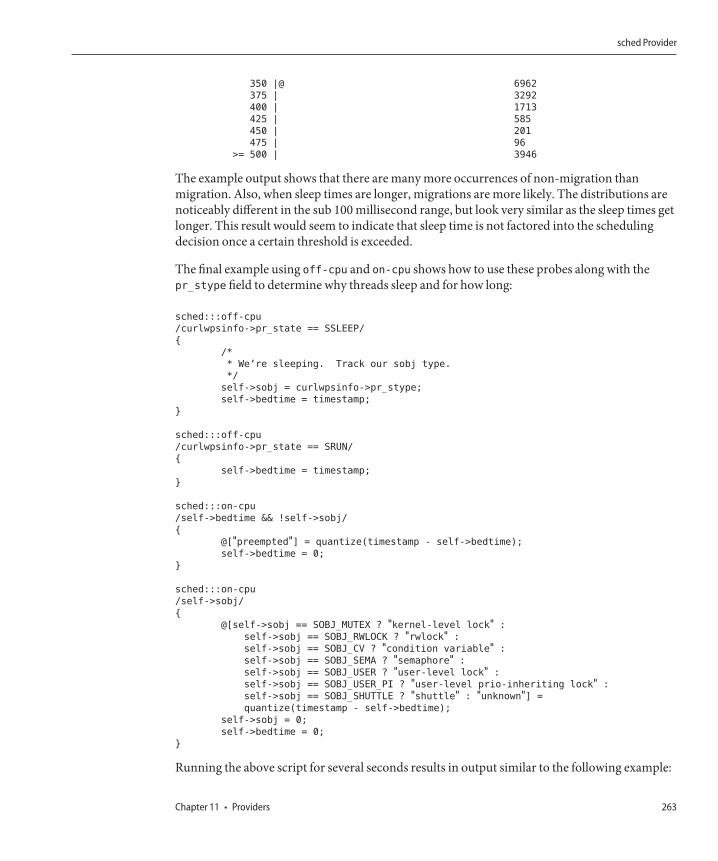
350 |@ 6962
375 | 3292
400 | 1713
425 | 585
450 | 201
475 | 96
>= 500 | 3946
The example output shows that there are many more occurrences of non-migration thanmigration. Also, when sleep times are longer, migrations are more likely. The distributions arenoticeably different in the sub 100 millisecond range, but look very similar as the sleep times getlonger. This result would seem to indicate that sleep time is not factored into the schedulingdecision once a certain threshold is exceeded.
The final example using off-cpu and on-cpu shows how to use these probes along with thepr_stype field to determine why threads sleep and for how long:
sched:::off-cpu
/curlwpsinfo->pr_state == SSLEEP/
{
/*
* We’re sleeping. Track our sobj type.
*/
self->sobj = curlwpsinfo->pr_stype;
self->bedtime = timestamp;
}
sched:::off-cpu
/curlwpsinfo->pr_state == SRUN/
{
self->bedtime = timestamp;
}
sched:::on-cpu
/self->bedtime && !self->sobj/
{
@["preempted"] = quantize(timestamp - self->bedtime);
self->bedtime = 0;
}
sched:::on-cpu
/self->sobj/
{
@[self->sobj == SOBJ_MUTEX ? "kernel-level lock" :
self->sobj == SOBJ_RWLOCK ? "rwlock" :
self->sobj == SOBJ_CV ? "condition variable" :
self->sobj == SOBJ_SEMA ? "semaphore" :
self->sobj == SOBJ_USER ? "user-level lock" :
self->sobj == SOBJ_USER_PI ? "user-level prio-inheriting lock" :
self->sobj == SOBJ_SHUTTLE ? "shuttle" : "unknown"] =
quantize(timestamp - self->bedtime);
self->sobj = 0;
self->bedtime = 0;
}
Running the above script for several seconds results in output similar to the following example:
sched Provider
Chapter 11 • Providers 263
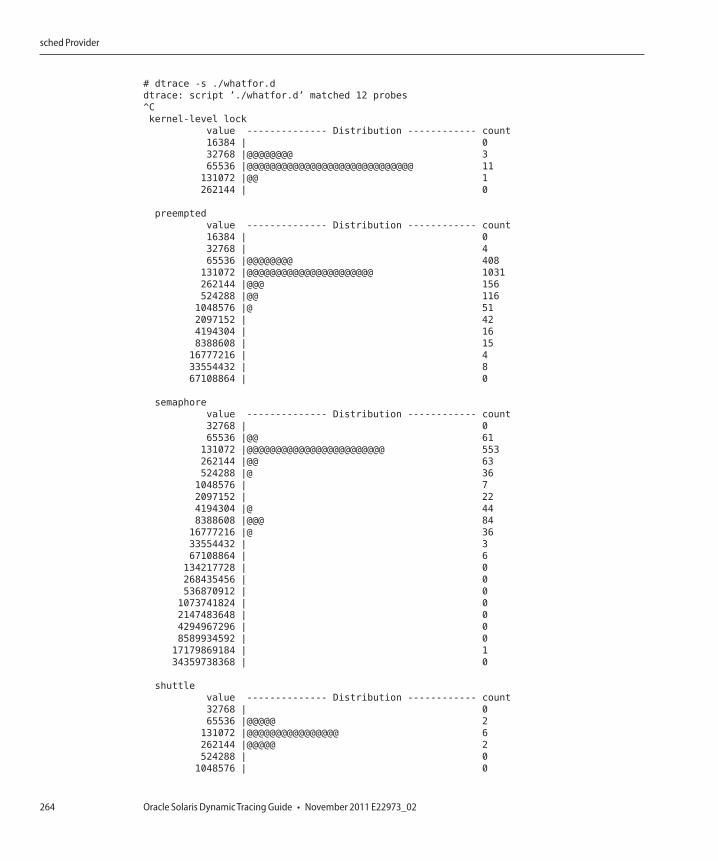
# dtrace -s ./whatfor.d
dtrace: script ’./whatfor.d’ matched 12 probes
^C
kernel-level lock
value -------------- Distribution ------------ count
16384 | 0
32768 |@@@@@@@@ 3
65536 |@@@@@@@@@@@@@@@@@@@@@@@@@@@@@ 11
131072 |@@ 1
262144 | 0
preempted
value -------------- Distribution ------------ count
16384 | 0
32768 | 4
65536 |@@@@@@@@ 408
131072 |@@@@@@@@@@@@@@@@@@@@@@ 1031
262144 |@@@ 156
524288 |@@ 116
1048576 |@ 51
2097152 | 42
4194304 | 16
8388608 | 15
16777216 | 4
33554432 | 8
67108864 | 0
semaphore
value -------------- Distribution ------------ count
32768 | 0
65536 |@@ 61
131072 |@@@@@@@@@@@@@@@@@@@@@@@@ 553
262144 |@@ 63
524288 |@ 36
1048576 | 7
2097152 | 22
4194304 |@ 44
8388608 |@@@ 84
16777216 |@ 36
33554432 | 3
67108864 | 6
134217728 | 0
268435456 | 0
536870912 | 0
1073741824 | 0
2147483648 | 0
4294967296 | 0
8589934592 | 0
17179869184 | 1
34359738368 | 0
shuttle
value -------------- Distribution ------------ count
32768 | 0
65536 |@@@@@ 2
131072 |@@@@@@@@@@@@@@@@ 6
262144 |@@@@@ 2
524288 | 0
1048576 | 0
sched Provider
Oracle Solaris Dynamic Tracing Guide • November 2011 E22973_02264
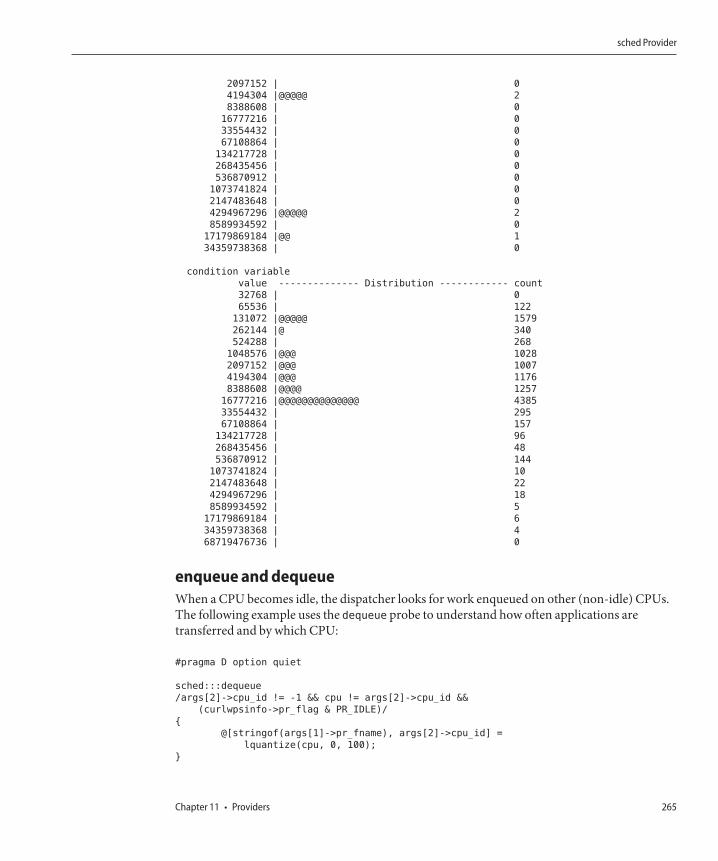
2097152 | 0
4194304 |@@@@@ 2
8388608 | 0
16777216 | 0
33554432 | 0
67108864 | 0
134217728 | 0
268435456 | 0
536870912 | 0
1073741824 | 0
2147483648 | 0
4294967296 |@@@@@ 2
8589934592 | 0
17179869184 |@@ 1
34359738368 | 0
condition variable
value -------------- Distribution ------------ count
32768 | 0
65536 | 122
131072 |@@@@@ 1579
262144 |@ 340
524288 | 268
1048576 |@@@ 1028
2097152 |@@@ 1007
4194304 |@@@ 1176
8388608 |@@@@ 1257
16777216 |@@@@@@@@@@@@@@ 4385
33554432 | 295
67108864 | 157
134217728 | 96
268435456 | 48
536870912 | 144
1073741824 | 10
2147483648 | 22
4294967296 | 18
8589934592 | 5
17179869184 | 6
34359738368 | 4
68719476736 | 0
enqueue and dequeueWhen a CPU becomes idle, the dispatcher looks for work enqueued on other (non-idle) CPUs.The following example uses the dequeue probe to understand how often applications aretransferred and by which CPU:
#pragma D option quiet
sched:::dequeue
/args[2]->cpu_id != -1 && cpu != args[2]->cpu_id &&
(curlwpsinfo->pr_flag & PR_IDLE)/
{
@[stringof(args[1]->pr_fname), args[2]->cpu_id] =
lquantize(cpu, 0, 100);
}
sched Provider
Chapter 11 • Providers 265
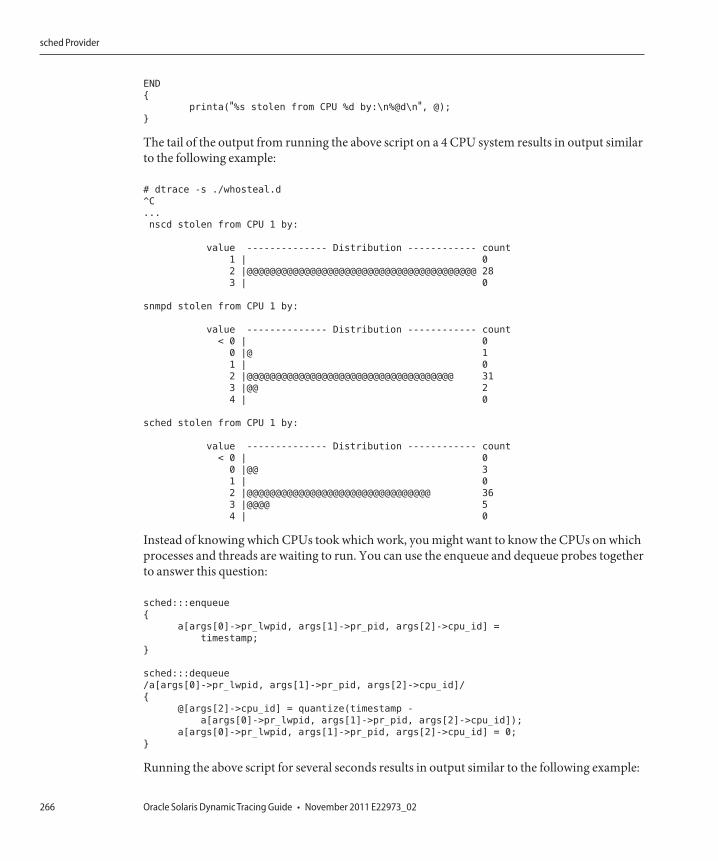
END
{
printa("%s stolen from CPU %d by:\n%@d\n", @);
}
The tail of the output from running the above script on a 4 CPU system results in output similarto the following example:
# dtrace -s ./whosteal.d
^C
...
nscd stolen from CPU 1 by:
value -------------- Distribution ------------ count
1 | 0
2 |@@@@@@@@@@@@@@@@@@@@@@@@@@@@@@@@@@@@@@@@ 28
3 | 0
snmpd stolen from CPU 1 by:
value -------------- Distribution ------------ count
< 0 | 0
0 |@ 1
1 | 0
2 |@@@@@@@@@@@@@@@@@@@@@@@@@@@@@@@@@@@@ 31
3 |@@ 2
4 | 0
sched stolen from CPU 1 by:
value -------------- Distribution ------------ count
< 0 | 0
0 |@@ 3
1 | 0
2 |@@@@@@@@@@@@@@@@@@@@@@@@@@@@@@@@ 36
3 |@@@@ 5
4 | 0
Instead of knowing which CPUs took which work, you might want to know the CPUs on whichprocesses and threads are waiting to run. You can use the enqueue and dequeue probes togetherto answer this question:
sched:::enqueue
{
a[args[0]->pr_lwpid, args[1]->pr_pid, args[2]->cpu_id] =
timestamp;
}
sched:::dequeue
/a[args[0]->pr_lwpid, args[1]->pr_pid, args[2]->cpu_id]/
{
@[args[2]->cpu_id] = quantize(timestamp -
a[args[0]->pr_lwpid, args[1]->pr_pid, args[2]->cpu_id]);
a[args[0]->pr_lwpid, args[1]->pr_pid, args[2]->cpu_id] = 0;
}
Running the above script for several seconds results in output similar to the following example:
sched Provider
Oracle Solaris Dynamic Tracing Guide • November 2011 E22973_02266
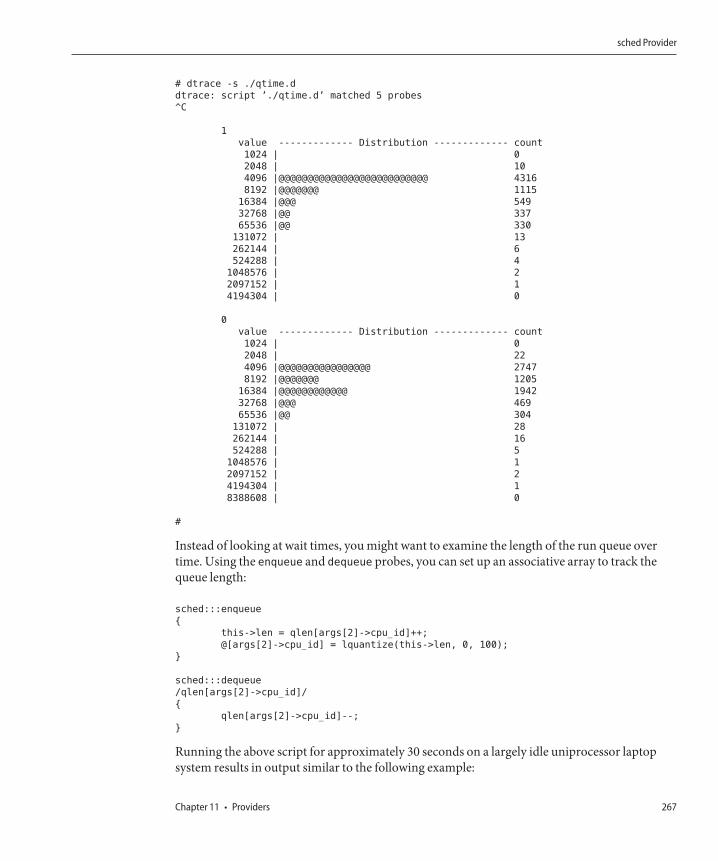
# dtrace -s ./qtime.d
dtrace: script ’./qtime.d’ matched 5 probes
^C
1
value ------------- Distribution ------------- count
1024 | 0
2048 | 10
4096 |@@@@@@@@@@@@@@@@@@@@@@@@@@ 4316
8192 |@@@@@@@ 1115
16384 |@@@ 549
32768 |@@ 337
65536 |@@ 330
131072 | 13
262144 | 6
524288 | 4
1048576 | 2
2097152 | 1
4194304 | 0
0
value ------------- Distribution ------------- count
1024 | 0
2048 | 22
4096 |@@@@@@@@@@@@@@@@ 2747
8192 |@@@@@@@ 1205
16384 |@@@@@@@@@@@@ 1942
32768 |@@@ 469
65536 |@@ 304
131072 | 28
262144 | 16
524288 | 5
1048576 | 1
2097152 | 2
4194304 | 1
8388608 | 0
#
Instead of looking at wait times, you might want to examine the length of the run queue overtime. Using the enqueue and dequeue probes, you can set up an associative array to track thequeue length:
sched:::enqueue
{
this->len = qlen[args[2]->cpu_id]++;
@[args[2]->cpu_id] = lquantize(this->len, 0, 100);
}
sched:::dequeue
/qlen[args[2]->cpu_id]/
{
qlen[args[2]->cpu_id]--;
}
Running the above script for approximately 30 seconds on a largely idle uniprocessor laptopsystem results in output similar to the following example:
sched Provider
Chapter 11 • Providers 267
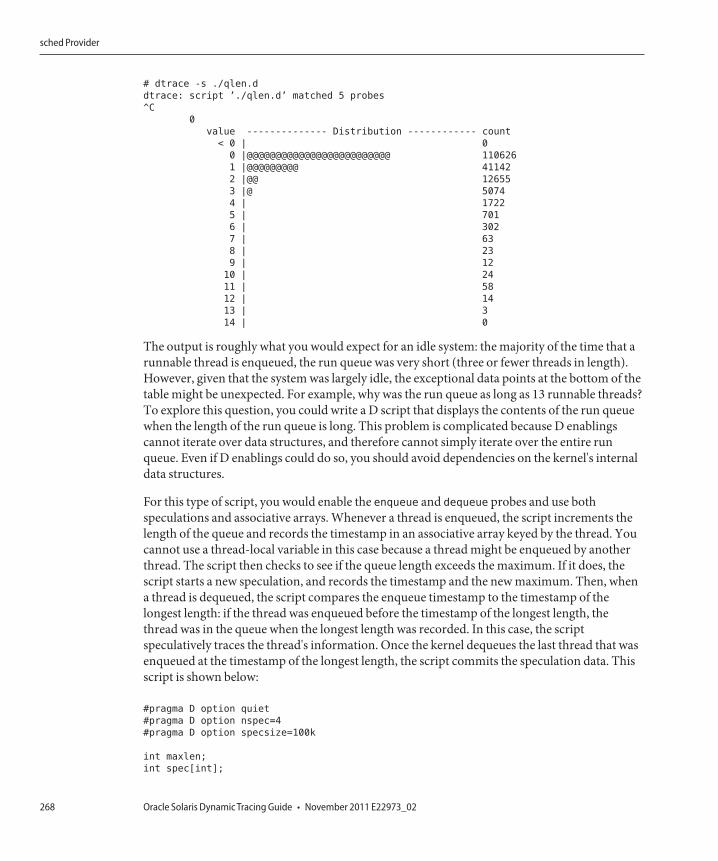
# dtrace -s ./qlen.d
dtrace: script ’./qlen.d’ matched 5 probes
^C
0
value -------------- Distribution ------------ count
< 0 | 0
0 |@@@@@@@@@@@@@@@@@@@@@@@@@ 110626
1 |@@@@@@@@@ 41142
2 |@@ 12655
3 |@ 5074
4 | 1722
5 | 701
6 | 302
7 | 63
8 | 23
9 | 12
10 | 24
11 | 58
12 | 14
13 | 3
14 | 0
The output is roughly what you would expect for an idle system: the majority of the time that arunnable thread is enqueued, the run queue was very short (three or fewer threads in length).However, given that the system was largely idle, the exceptional data points at the bottom of thetable might be unexpected. For example, why was the run queue as long as 13 runnable threads?To explore this question, you could write a D script that displays the contents of the run queuewhen the length of the run queue is long. This problem is complicated because D enablingscannot iterate over data structures, and therefore cannot simply iterate over the entire runqueue. Even if D enablings could do so, you should avoid dependencies on the kernel's internaldata structures.
For this type of script, you would enable the enqueue and dequeue probes and use bothspeculations and associative arrays. Whenever a thread is enqueued, the script increments thelength of the queue and records the timestamp in an associative array keyed by the thread. Youcannot use a thread-local variable in this case because a thread might be enqueued by anotherthread. The script then checks to see if the queue length exceeds the maximum. If it does, thescript starts a new speculation, and records the timestamp and the new maximum. Then, whena thread is dequeued, the script compares the enqueue timestamp to the timestamp of thelongest length: if the thread was enqueued before the timestamp of the longest length, thethread was in the queue when the longest length was recorded. In this case, the scriptspeculatively traces the thread's information. Once the kernel dequeues the last thread that wasenqueued at the timestamp of the longest length, the script commits the speculation data. Thisscript is shown below:
#pragma D option quiet
#pragma D option nspec=4
#pragma D option specsize=100k
int maxlen;
int spec[int];
sched Provider
Oracle Solaris Dynamic Tracing Guide • November 2011 E22973_02268
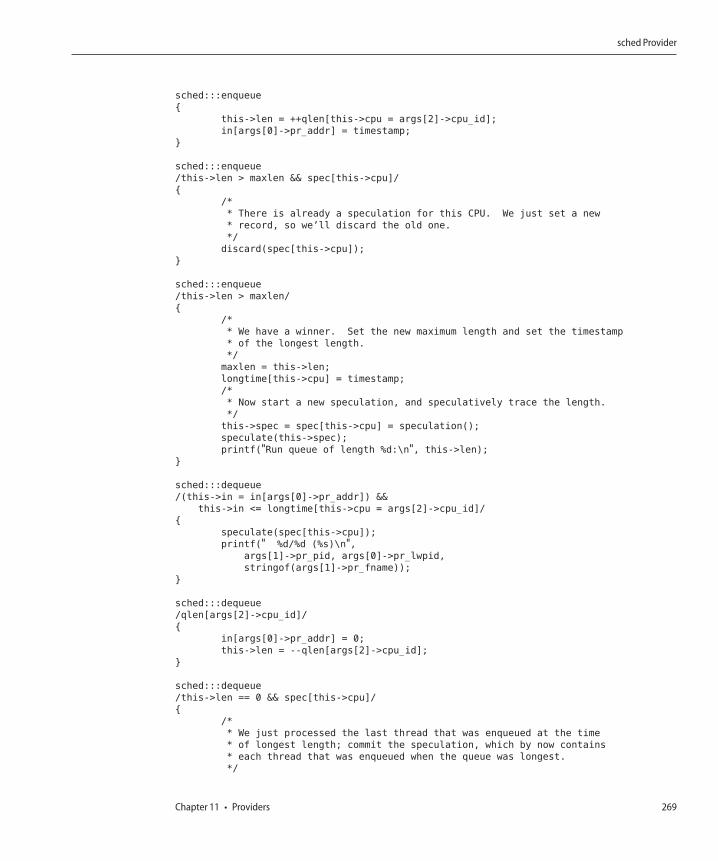
sched:::enqueue
{
this->len = ++qlen[this->cpu = args[2]->cpu_id];
in[args[0]->pr_addr] = timestamp;
}
sched:::enqueue
/this->len > maxlen && spec[this->cpu]/
{
/*
* There is already a speculation for this CPU. We just set a new
* record, so we’ll discard the old one.
*/
discard(spec[this->cpu]);
}
sched:::enqueue
/this->len > maxlen/
{
/*
* We have a winner. Set the new maximum length and set the timestamp
* of the longest length.
*/
maxlen = this->len;
longtime[this->cpu] = timestamp;
/*
* Now start a new speculation, and speculatively trace the length.
*/
this->spec = spec[this->cpu] = speculation();
speculate(this->spec);
printf("Run queue of length %d:\n", this->len);
}
sched:::dequeue
/(this->in = in[args[0]->pr_addr]) &&
this->in <= longtime[this->cpu = args[2]->cpu_id]/
{
speculate(spec[this->cpu]);
printf(" %d/%d (%s)\n",args[1]->pr_pid, args[0]->pr_lwpid,
stringof(args[1]->pr_fname));
}
sched:::dequeue
/qlen[args[2]->cpu_id]/
{
in[args[0]->pr_addr] = 0;
this->len = --qlen[args[2]->cpu_id];
}
sched:::dequeue
/this->len == 0 && spec[this->cpu]/
{
/*
* We just processed the last thread that was enqueued at the time
* of longest length; commit the speculation, which by now contains
* each thread that was enqueued when the queue was longest.
*/
sched Provider
Chapter 11 • Providers 269
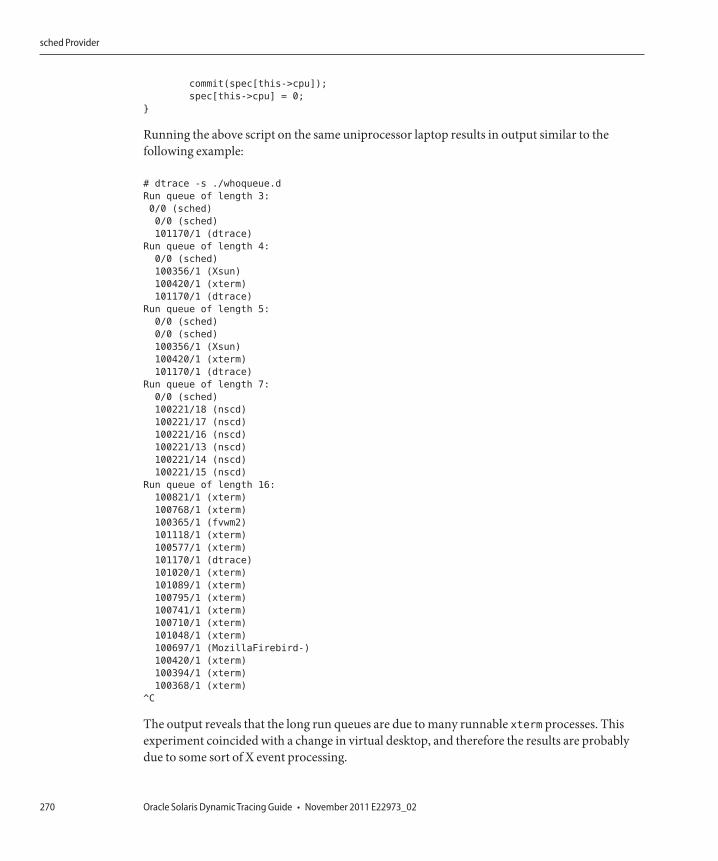
commit(spec[this->cpu]);
spec[this->cpu] = 0;
}
Running the above script on the same uniprocessor laptop results in output similar to thefollowing example:
# dtrace -s ./whoqueue.d
Run queue of length 3:
0/0 (sched)
0/0 (sched)
101170/1 (dtrace)
Run queue of length 4:
0/0 (sched)
100356/1 (Xsun)
100420/1 (xterm)
101170/1 (dtrace)
Run queue of length 5:
0/0 (sched)
0/0 (sched)
100356/1 (Xsun)
100420/1 (xterm)
101170/1 (dtrace)
Run queue of length 7:
0/0 (sched)
100221/18 (nscd)
100221/17 (nscd)
100221/16 (nscd)
100221/13 (nscd)
100221/14 (nscd)
100221/15 (nscd)
Run queue of length 16:
100821/1 (xterm)
100768/1 (xterm)
100365/1 (fvwm2)
101118/1 (xterm)
100577/1 (xterm)
101170/1 (dtrace)
101020/1 (xterm)
101089/1 (xterm)
100795/1 (xterm)
100741/1 (xterm)
100710/1 (xterm)
101048/1 (xterm)
100697/1 (MozillaFirebird-)
100420/1 (xterm)
100394/1 (xterm)
100368/1 (xterm)
^C
The output reveals that the long run queues are due to many runnable xterm processes. Thisexperiment coincided with a change in virtual desktop, and therefore the results are probablydue to some sort of X event processing.
sched Provider
Oracle Solaris Dynamic Tracing Guide • November 2011 E22973_02270
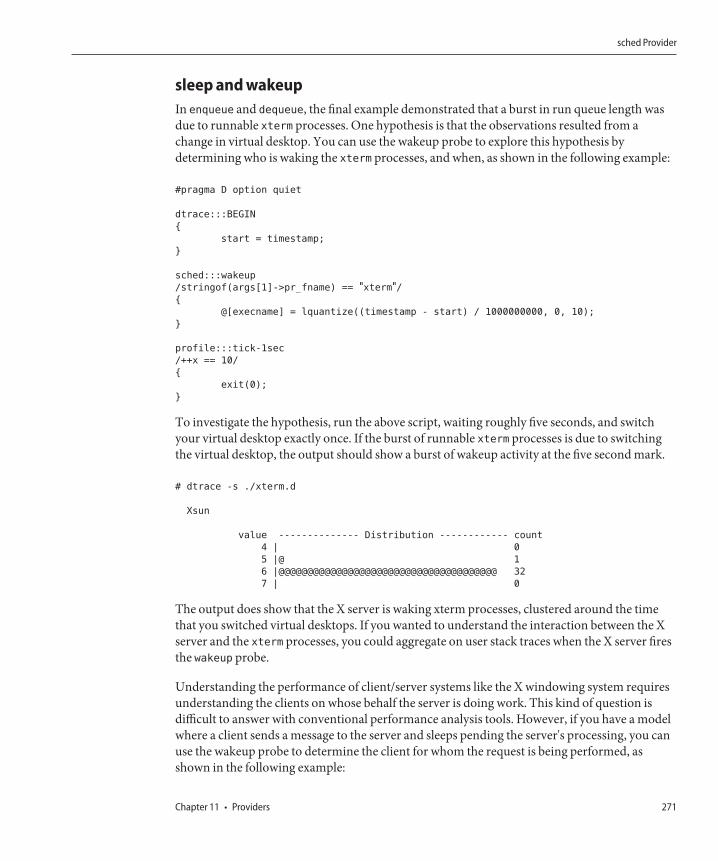
sleep and wakeupIn enqueue and dequeue, the final example demonstrated that a burst in run queue length wasdue to runnable xterm processes. One hypothesis is that the observations resulted from achange in virtual desktop. You can use the wakeup probe to explore this hypothesis bydetermining who is waking the xterm processes, and when, as shown in the following example:
#pragma D option quiet
dtrace:::BEGIN
{
start = timestamp;
}
sched:::wakeup
/stringof(args[1]->pr_fname) == "xterm"/{
@[execname] = lquantize((timestamp - start) / 1000000000, 0, 10);
}
profile:::tick-1sec
/++x == 10/
{
exit(0);
}
To investigate the hypothesis, run the above script, waiting roughly five seconds, and switchyour virtual desktop exactly once. If the burst of runnable xterm processes is due to switchingthe virtual desktop, the output should show a burst of wakeup activity at the five second mark.
# dtrace -s ./xterm.d
Xsun
value -------------- Distribution ------------ count
4 | 0
5 |@ 1
6 |@@@@@@@@@@@@@@@@@@@@@@@@@@@@@@@@@@@@@@ 32
7 | 0
The output does show that the X server is waking xterm processes, clustered around the timethat you switched virtual desktops. If you wanted to understand the interaction between the Xserver and the xterm processes, you could aggregate on user stack traces when the X server firesthe wakeup probe.
Understanding the performance of client/server systems like the X windowing system requiresunderstanding the clients on whose behalf the server is doing work. This kind of question isdifficult to answer with conventional performance analysis tools. However, if you have a modelwhere a client sends a message to the server and sleeps pending the server's processing, you canuse the wakeup probe to determine the client for whom the request is being performed, asshown in the following example:
sched Provider
Chapter 11 • Providers 271
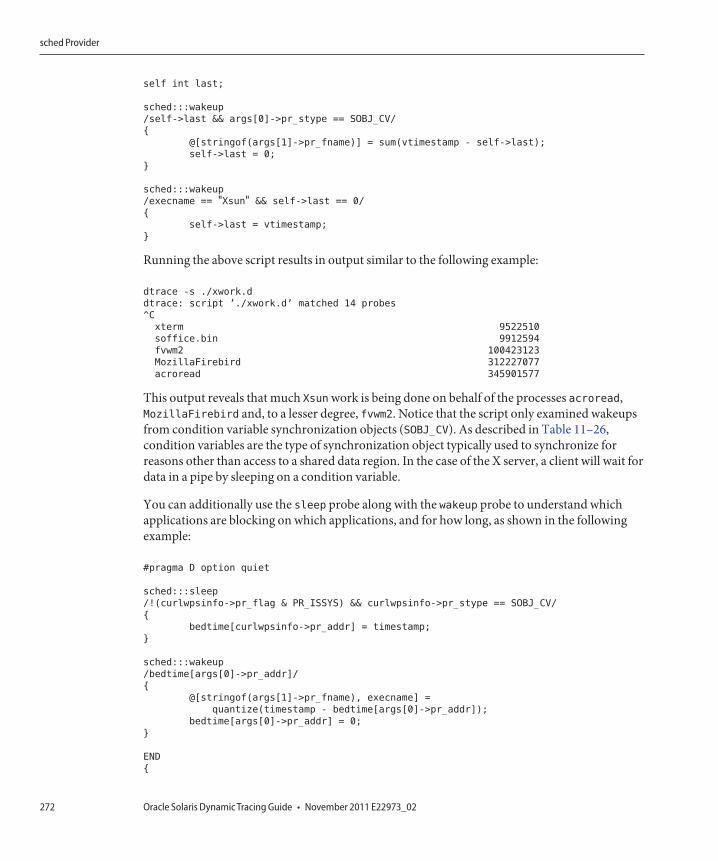
self int last;
sched:::wakeup
/self->last && args[0]->pr_stype == SOBJ_CV/
{
@[stringof(args[1]->pr_fname)] = sum(vtimestamp - self->last);
self->last = 0;
}
sched:::wakeup
/execname == "Xsun" && self->last == 0/
{
self->last = vtimestamp;
}
Running the above script results in output similar to the following example:
dtrace -s ./xwork.d
dtrace: script ’./xwork.d’ matched 14 probes
^C
xterm 9522510
soffice.bin 9912594
fvwm2 100423123
MozillaFirebird 312227077
acroread 345901577
This output reveals that much Xsun work is being done on behalf of the processes acroread,MozillaFirebird and, to a lesser degree, fvwm2. Notice that the script only examined wakeupsfrom condition variable synchronization objects (SOBJ_CV). As described in Table 11–26,condition variables are the type of synchronization object typically used to synchronize forreasons other than access to a shared data region. In the case of the X server, a client will wait fordata in a pipe by sleeping on a condition variable.
You can additionally use the sleep probe along with the wakeup probe to understand whichapplications are blocking on which applications, and for how long, as shown in the followingexample:
#pragma D option quiet
sched:::sleep
/!(curlwpsinfo->pr_flag & PR_ISSYS) && curlwpsinfo->pr_stype == SOBJ_CV/
{
bedtime[curlwpsinfo->pr_addr] = timestamp;
}
sched:::wakeup
/bedtime[args[0]->pr_addr]/
{
@[stringof(args[1]->pr_fname), execname] =
quantize(timestamp - bedtime[args[0]->pr_addr]);
bedtime[args[0]->pr_addr] = 0;
}
END
{
sched Provider
Oracle Solaris Dynamic Tracing Guide • November 2011 E22973_02272
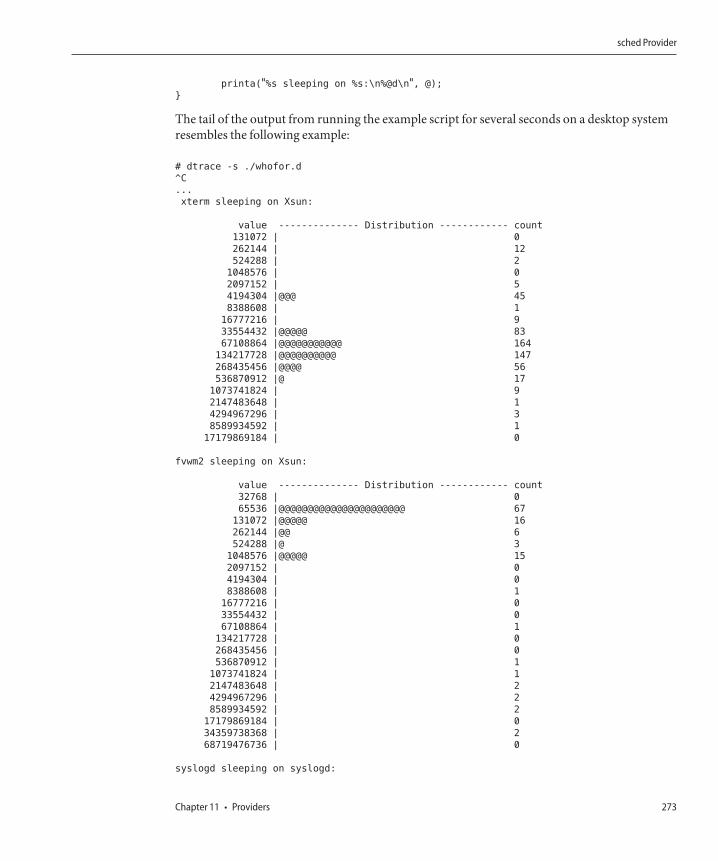
printa("%s sleeping on %s:\n%@d\n", @);
}
The tail of the output from running the example script for several seconds on a desktop systemresembles the following example:
# dtrace -s ./whofor.d
^C
...
xterm sleeping on Xsun:
value -------------- Distribution ------------ count
131072 | 0
262144 | 12
524288 | 2
1048576 | 0
2097152 | 5
4194304 |@@@ 45
8388608 | 1
16777216 | 9
33554432 |@@@@@ 83
67108864 |@@@@@@@@@@@ 164
134217728 |@@@@@@@@@@ 147
268435456 |@@@@ 56
536870912 |@ 17
1073741824 | 9
2147483648 | 1
4294967296 | 3
8589934592 | 1
17179869184 | 0
fvwm2 sleeping on Xsun:
value -------------- Distribution ------------ count
32768 | 0
65536 |@@@@@@@@@@@@@@@@@@@@@@ 67
131072 |@@@@@ 16
262144 |@@ 6
524288 |@ 3
1048576 |@@@@@ 15
2097152 | 0
4194304 | 0
8388608 | 1
16777216 | 0
33554432 | 0
67108864 | 1
134217728 | 0
268435456 | 0
536870912 | 1
1073741824 | 1
2147483648 | 2
4294967296 | 2
8589934592 | 2
17179869184 | 0
34359738368 | 2
68719476736 | 0
syslogd sleeping on syslogd:
sched Provider
Chapter 11 • Providers 273
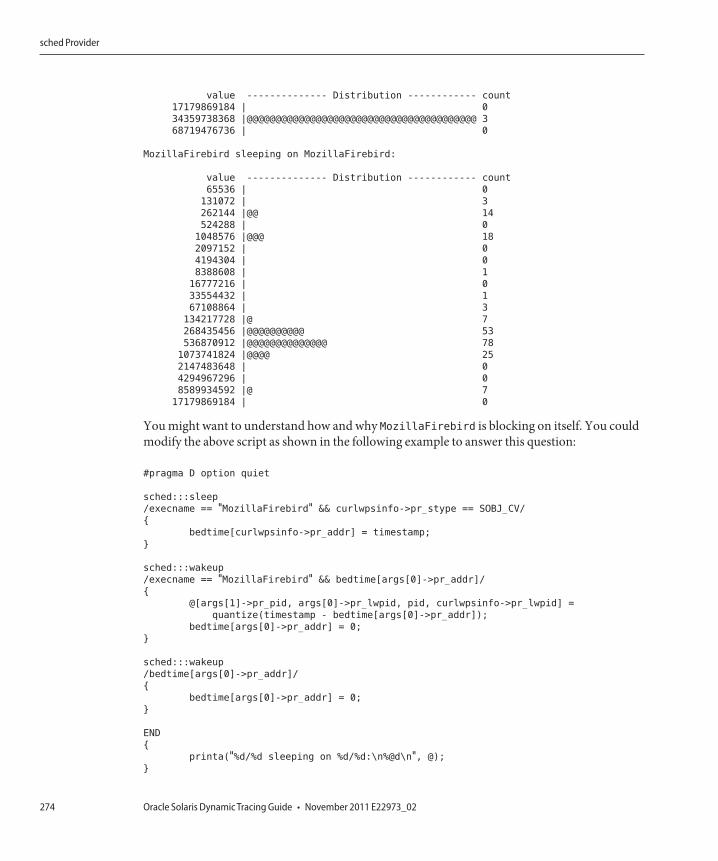
value -------------- Distribution ------------ count
17179869184 | 0
34359738368 |@@@@@@@@@@@@@@@@@@@@@@@@@@@@@@@@@@@@@@@@ 3
68719476736 | 0
MozillaFirebird sleeping on MozillaFirebird:
value -------------- Distribution ------------ count
65536 | 0
131072 | 3
262144 |@@ 14
524288 | 0
1048576 |@@@ 18
2097152 | 0
4194304 | 0
8388608 | 1
16777216 | 0
33554432 | 1
67108864 | 3
134217728 |@ 7
268435456 |@@@@@@@@@@ 53
536870912 |@@@@@@@@@@@@@@ 78
1073741824 |@@@@ 25
2147483648 | 0
4294967296 | 0
8589934592 |@ 7
17179869184 | 0
You might want to understand how and why MozillaFirebird is blocking on itself. You couldmodify the above script as shown in the following example to answer this question:
#pragma D option quiet
sched:::sleep
/execname == "MozillaFirebird" && curlwpsinfo->pr_stype == SOBJ_CV/
{
bedtime[curlwpsinfo->pr_addr] = timestamp;
}
sched:::wakeup
/execname == "MozillaFirebird" && bedtime[args[0]->pr_addr]/
{
@[args[1]->pr_pid, args[0]->pr_lwpid, pid, curlwpsinfo->pr_lwpid] =
quantize(timestamp - bedtime[args[0]->pr_addr]);
bedtime[args[0]->pr_addr] = 0;
}
sched:::wakeup
/bedtime[args[0]->pr_addr]/
{
bedtime[args[0]->pr_addr] = 0;
}
END
{
printa("%d/%d sleeping on %d/%d:\n%@d\n", @);
}
sched Provider
Oracle Solaris Dynamic Tracing Guide • November 2011 E22973_02274
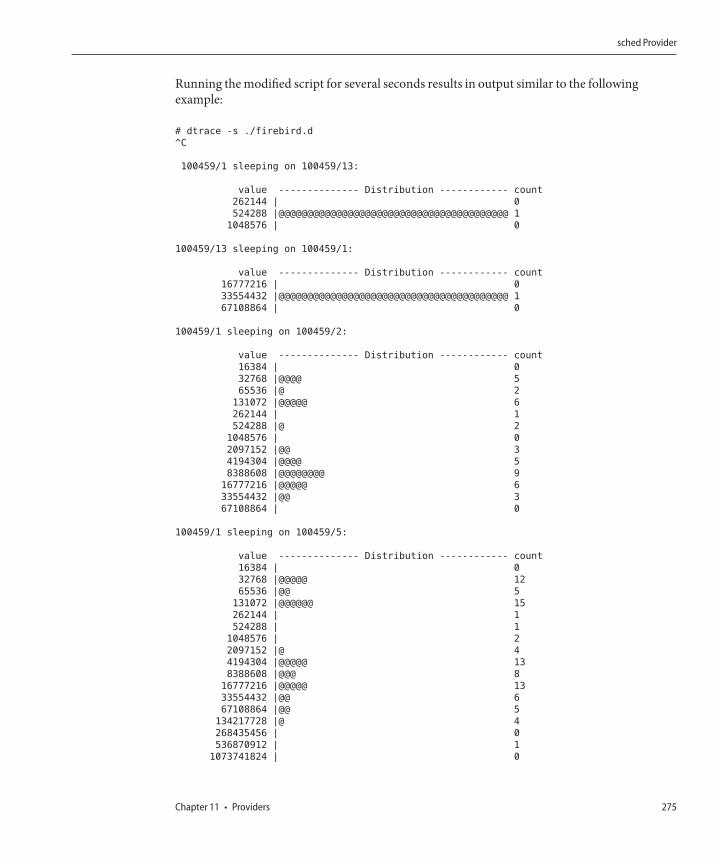
Running the modified script for several seconds results in output similar to the followingexample:
# dtrace -s ./firebird.d
^C
100459/1 sleeping on 100459/13:
value -------------- Distribution ------------ count
262144 | 0
524288 |@@@@@@@@@@@@@@@@@@@@@@@@@@@@@@@@@@@@@@@@ 1
1048576 | 0
100459/13 sleeping on 100459/1:
value -------------- Distribution ------------ count
16777216 | 0
33554432 |@@@@@@@@@@@@@@@@@@@@@@@@@@@@@@@@@@@@@@@@ 1
67108864 | 0
100459/1 sleeping on 100459/2:
value -------------- Distribution ------------ count
16384 | 0
32768 |@@@@ 5
65536 |@ 2
131072 |@@@@@ 6
262144 | 1
524288 |@ 2
1048576 | 0
2097152 |@@ 3
4194304 |@@@@ 5
8388608 |@@@@@@@@ 9
16777216 |@@@@@ 6
33554432 |@@ 3
67108864 | 0
100459/1 sleeping on 100459/5:
value -------------- Distribution ------------ count
16384 | 0
32768 |@@@@@ 12
65536 |@@ 5
131072 |@@@@@@ 15
262144 | 1
524288 | 1
1048576 | 2
2097152 |@ 4
4194304 |@@@@@ 13
8388608 |@@@ 8
16777216 |@@@@@ 13
33554432 |@@ 6
67108864 |@@ 5
134217728 |@ 4
268435456 | 0
536870912 | 1
1073741824 | 0
sched Provider
Chapter 11 • Providers 275
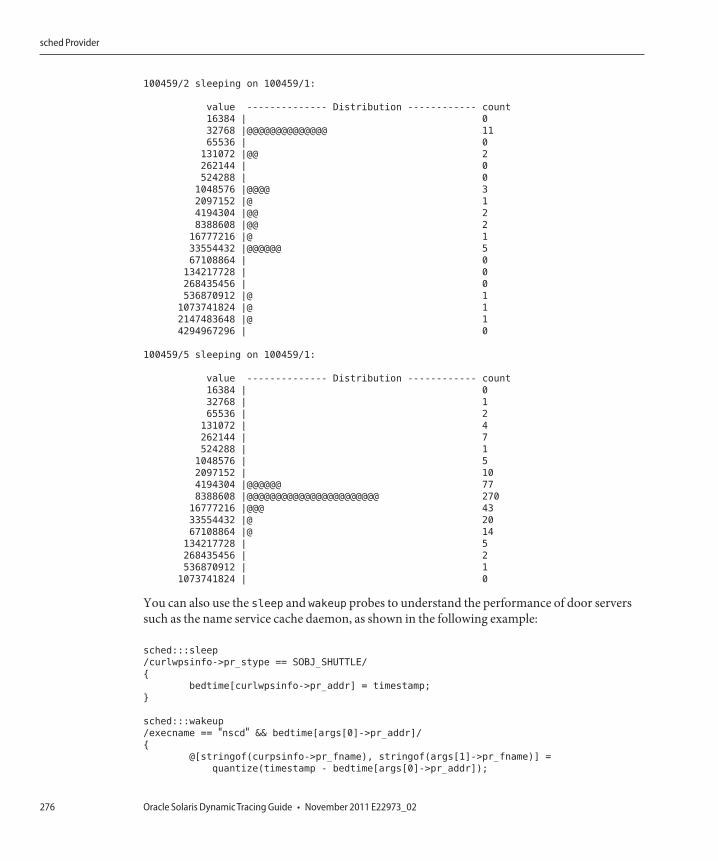
100459/2 sleeping on 100459/1:
value -------------- Distribution ------------ count
16384 | 0
32768 |@@@@@@@@@@@@@@ 11
65536 | 0
131072 |@@ 2
262144 | 0
524288 | 0
1048576 |@@@@ 3
2097152 |@ 1
4194304 |@@ 2
8388608 |@@ 2
16777216 |@ 1
33554432 |@@@@@@ 5
67108864 | 0
134217728 | 0
268435456 | 0
536870912 |@ 1
1073741824 |@ 1
2147483648 |@ 1
4294967296 | 0
100459/5 sleeping on 100459/1:
value -------------- Distribution ------------ count
16384 | 0
32768 | 1
65536 | 2
131072 | 4
262144 | 7
524288 | 1
1048576 | 5
2097152 | 10
4194304 |@@@@@@ 77
8388608 |@@@@@@@@@@@@@@@@@@@@@@@ 270
16777216 |@@@ 43
33554432 |@ 20
67108864 |@ 14
134217728 | 5
268435456 | 2
536870912 | 1
1073741824 | 0
You can also use the sleep and wakeup probes to understand the performance of door serverssuch as the name service cache daemon, as shown in the following example:
sched:::sleep
/curlwpsinfo->pr_stype == SOBJ_SHUTTLE/
{
bedtime[curlwpsinfo->pr_addr] = timestamp;
}
sched:::wakeup
/execname == "nscd" && bedtime[args[0]->pr_addr]/
{
@[stringof(curpsinfo->pr_fname), stringof(args[1]->pr_fname)] =
quantize(timestamp - bedtime[args[0]->pr_addr]);
sched Provider
Oracle Solaris Dynamic Tracing Guide • November 2011 E22973_02276
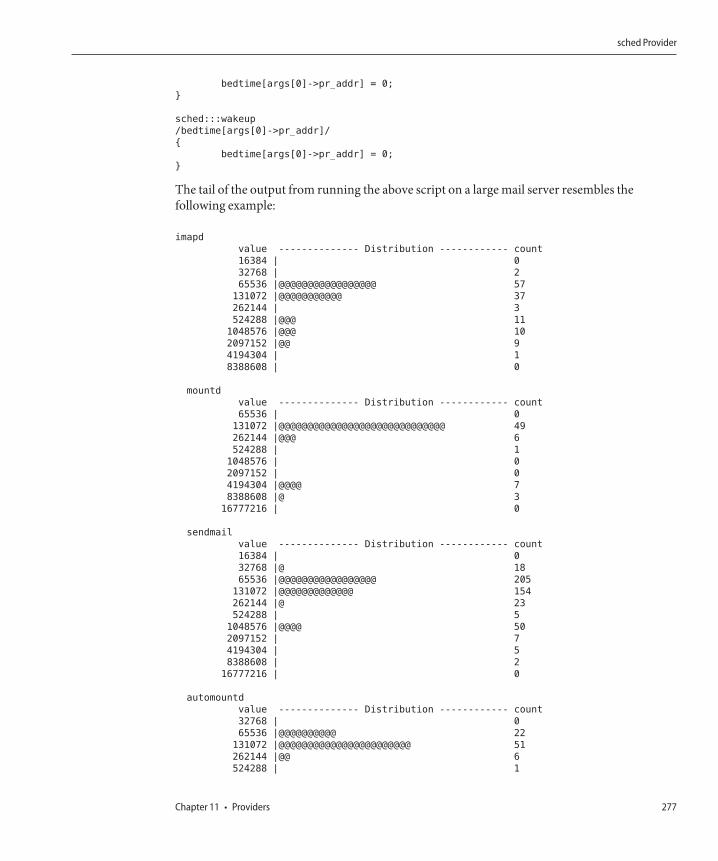
bedtime[args[0]->pr_addr] = 0;
}
sched:::wakeup
/bedtime[args[0]->pr_addr]/
{
bedtime[args[0]->pr_addr] = 0;
}
The tail of the output from running the above script on a large mail server resembles thefollowing example:
imapd
value -------------- Distribution ------------ count
16384 | 0
32768 | 2
65536 |@@@@@@@@@@@@@@@@@ 57
131072 |@@@@@@@@@@@ 37
262144 | 3
524288 |@@@ 11
1048576 |@@@ 10
2097152 |@@ 9
4194304 | 1
8388608 | 0
mountd
value -------------- Distribution ------------ count
65536 | 0
131072 |@@@@@@@@@@@@@@@@@@@@@@@@@@@@@ 49
262144 |@@@ 6
524288 | 1
1048576 | 0
2097152 | 0
4194304 |@@@@ 7
8388608 |@ 3
16777216 | 0
sendmail
value -------------- Distribution ------------ count
16384 | 0
32768 |@ 18
65536 |@@@@@@@@@@@@@@@@@ 205
131072 |@@@@@@@@@@@@@ 154
262144 |@ 23
524288 | 5
1048576 |@@@@ 50
2097152 | 7
4194304 | 5
8388608 | 2
16777216 | 0
automountd
value -------------- Distribution ------------ count
32768 | 0
65536 |@@@@@@@@@@ 22
131072 |@@@@@@@@@@@@@@@@@@@@@@@ 51
262144 |@@ 6
524288 | 1
sched Provider
Chapter 11 • Providers 277
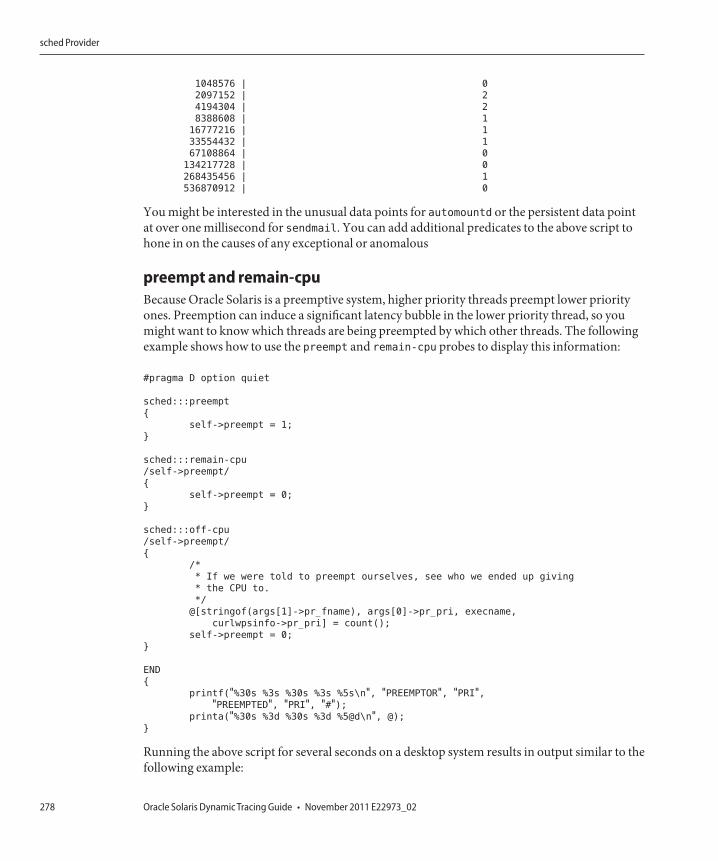
1048576 | 0
2097152 | 2
4194304 | 2
8388608 | 1
16777216 | 1
33554432 | 1
67108864 | 0
134217728 | 0
268435456 | 1
536870912 | 0
You might be interested in the unusual data points for automountd or the persistent data pointat over one millisecond for sendmail. You can add additional predicates to the above script tohone in on the causes of any exceptional or anomalous
preempt and remain-cpuBecause Oracle Solaris is a preemptive system, higher priority threads preempt lower priorityones. Preemption can induce a significant latency bubble in the lower priority thread, so youmight want to know which threads are being preempted by which other threads. The followingexample shows how to use the preempt and remain-cpu probes to display this information:
#pragma D option quiet
sched:::preempt
{
self->preempt = 1;
}
sched:::remain-cpu
/self->preempt/
{
self->preempt = 0;
}
sched:::off-cpu
/self->preempt/
{
/*
* If we were told to preempt ourselves, see who we ended up giving
* the CPU to.
*/
@[stringof(args[1]->pr_fname), args[0]->pr_pri, execname,
curlwpsinfo->pr_pri] = count();
self->preempt = 0;
}
END
{
printf("%30s %3s %30s %3s %5s\n", "PREEMPTOR", "PRI","PREEMPTED", "PRI", "#");
printa("%30s %3d %30s %3d %5@d\n", @);
}
Running the above script for several seconds on a desktop system results in output similar to thefollowing example:
sched Provider
Oracle Solaris Dynamic Tracing Guide • November 2011 E22973_02278
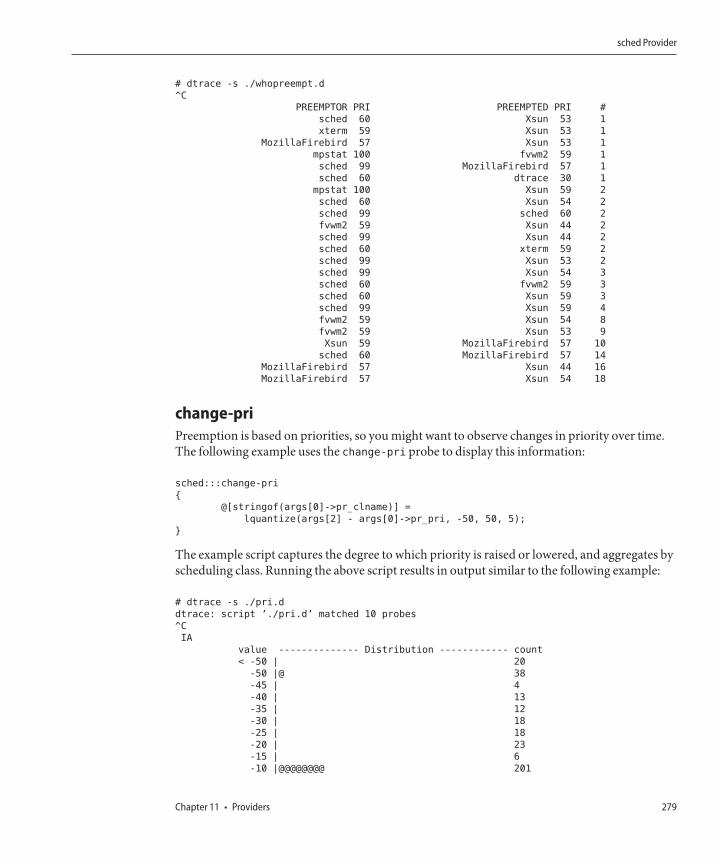
# dtrace -s ./whopreempt.d
^C
PREEMPTOR PRI PREEMPTED PRI #
sched 60 Xsun 53 1
xterm 59 Xsun 53 1
MozillaFirebird 57 Xsun 53 1
mpstat 100 fvwm2 59 1
sched 99 MozillaFirebird 57 1
sched 60 dtrace 30 1
mpstat 100 Xsun 59 2
sched 60 Xsun 54 2
sched 99 sched 60 2
fvwm2 59 Xsun 44 2
sched 99 Xsun 44 2
sched 60 xterm 59 2
sched 99 Xsun 53 2
sched 99 Xsun 54 3
sched 60 fvwm2 59 3
sched 60 Xsun 59 3
sched 99 Xsun 59 4
fvwm2 59 Xsun 54 8
fvwm2 59 Xsun 53 9
Xsun 59 MozillaFirebird 57 10
sched 60 MozillaFirebird 57 14
MozillaFirebird 57 Xsun 44 16
MozillaFirebird 57 Xsun 54 18
change-priPreemption is based on priorities, so you might want to observe changes in priority over time.The following example uses the change-pri probe to display this information:
sched:::change-pri
{
@[stringof(args[0]->pr_clname)] =
lquantize(args[2] - args[0]->pr_pri, -50, 50, 5);
}
The example script captures the degree to which priority is raised or lowered, and aggregates byscheduling class. Running the above script results in output similar to the following example:
# dtrace -s ./pri.d
dtrace: script ’./pri.d’ matched 10 probes
^C
IA
value -------------- Distribution ------------ count
< -50 | 20
-50 |@ 38
-45 | 4
-40 | 13
-35 | 12
-30 | 18
-25 | 18
-20 | 23
-15 | 6
-10 |@@@@@@@@ 201
sched Provider
Chapter 11 • Providers 279
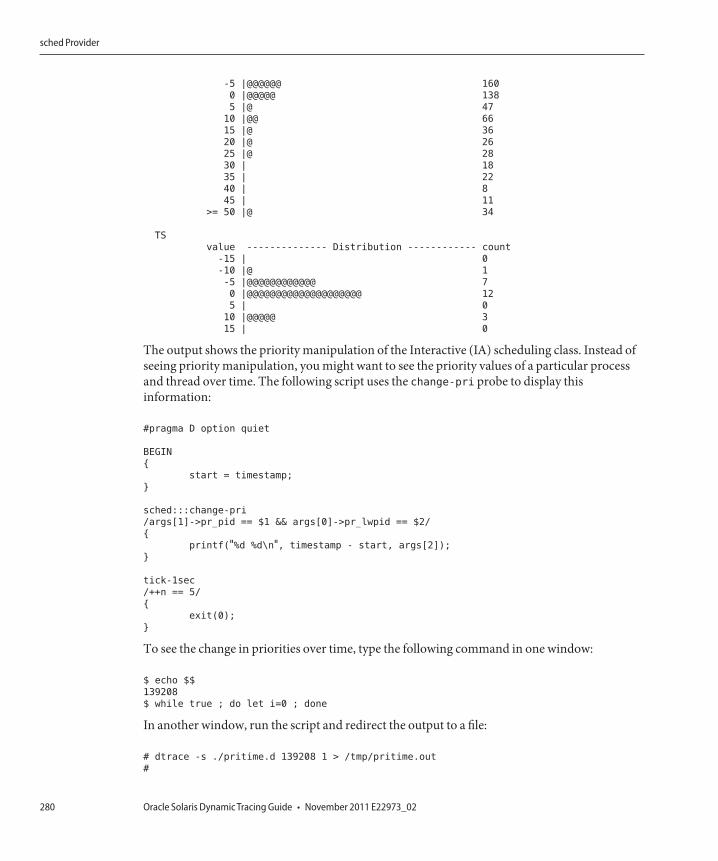
-5 |@@@@@@ 160
0 |@@@@@ 138
5 |@ 47
10 |@@ 66
15 |@ 36
20 |@ 26
25 |@ 28
30 | 18
35 | 22
40 | 8
45 | 11
>= 50 |@ 34
TS
value -------------- Distribution ------------ count
-15 | 0
-10 |@ 1
-5 |@@@@@@@@@@@@ 7
0 |@@@@@@@@@@@@@@@@@@@@ 12
5 | 0
10 |@@@@@ 3
15 | 0
The output shows the priority manipulation of the Interactive (IA) scheduling class. Instead ofseeing priority manipulation, you might want to see the priority values of a particular processand thread over time. The following script uses the change-pri probe to display thisinformation:
#pragma D option quiet
BEGIN
{
start = timestamp;
}
sched:::change-pri
/args[1]->pr_pid == $1 && args[0]->pr_lwpid == $2/
{
printf("%d %d\n", timestamp - start, args[2]);
}
tick-1sec
/++n == 5/
{
exit(0);
}
To see the change in priorities over time, type the following command in one window:
$ echo $$
139208
$ while true ; do let i=0 ; done
In another window, run the script and redirect the output to a file:
# dtrace -s ./pritime.d 139208 1 > /tmp/pritime.out
#
sched Provider
Oracle Solaris Dynamic Tracing Guide • November 2011 E22973_02280
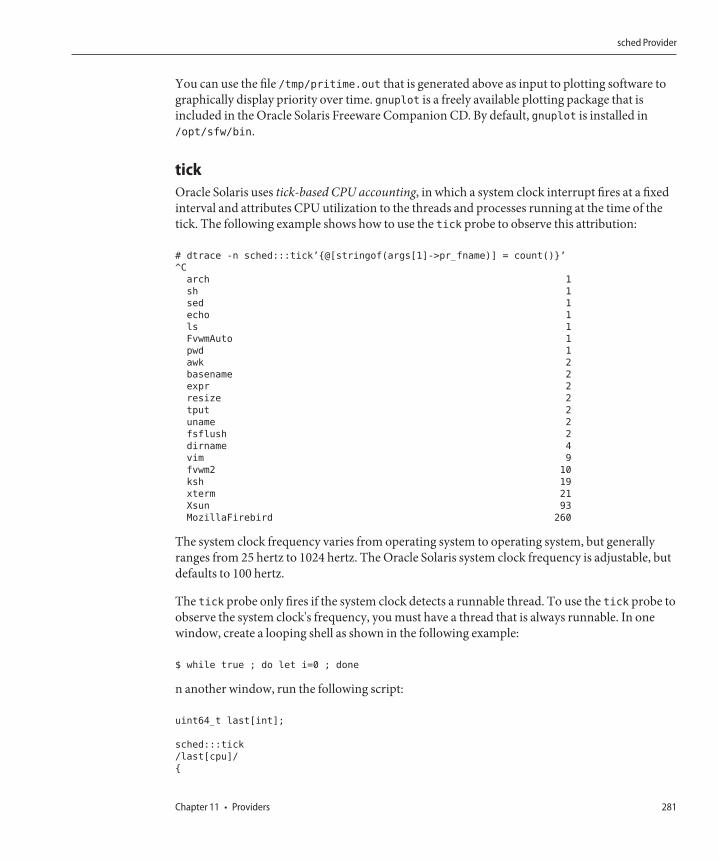
You can use the file /tmp/pritime.out that is generated above as input to plotting software tographically display priority over time. gnuplot is a freely available plotting package that isincluded in the Oracle Solaris Freeware Companion CD. By default, gnuplot is installed in/opt/sfw/bin.
tickOracle Solaris uses tick-based CPU accounting, in which a system clock interrupt fires at a fixedinterval and attributes CPU utilization to the threads and processes running at the time of thetick. The following example shows how to use the tick probe to observe this attribution:
# dtrace -n sched:::tick’{@[stringof(args[1]->pr_fname)] = count()}’
^C
arch 1
sh 1
sed 1
echo 1
ls 1
FvwmAuto 1
pwd 1
awk 2
basename 2
expr 2
resize 2
tput 2
uname 2
fsflush 2
dirname 4
vim 9
fvwm2 10
ksh 19
xterm 21
Xsun 93
MozillaFirebird 260
The system clock frequency varies from operating system to operating system, but generallyranges from 25 hertz to 1024 hertz. The Oracle Solaris system clock frequency is adjustable, butdefaults to 100 hertz.
The tick probe only fires if the system clock detects a runnable thread. To use the tick probe toobserve the system clock's frequency, you must have a thread that is always runnable. In onewindow, create a looping shell as shown in the following example:
$ while true ; do let i=0 ; done
n another window, run the following script:
uint64_t last[int];
sched:::tick
/last[cpu]/
{
sched Provider
Chapter 11 • Providers 281
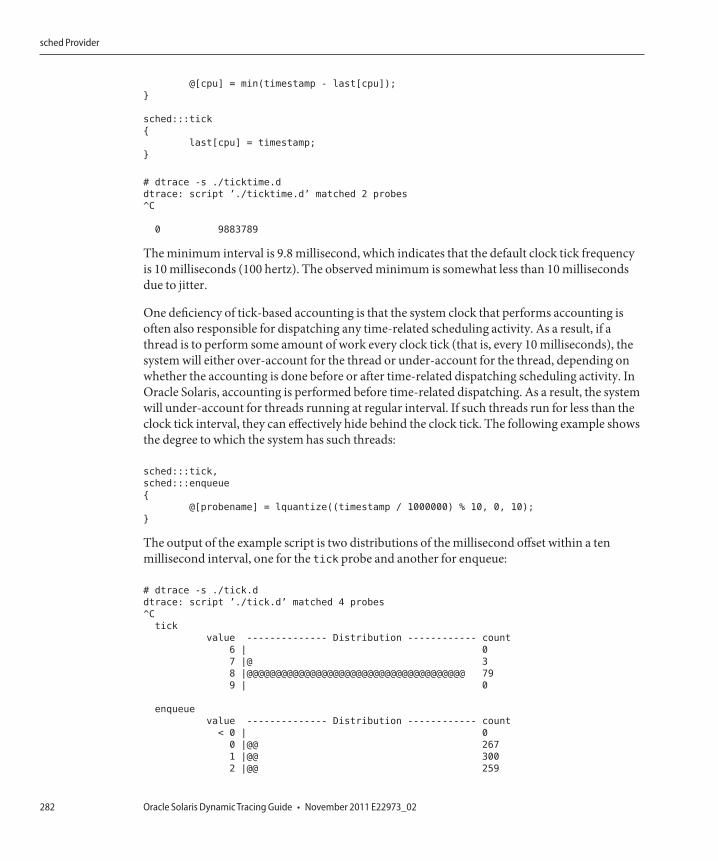
@[cpu] = min(timestamp - last[cpu]);
}
sched:::tick
{
last[cpu] = timestamp;
}
# dtrace -s ./ticktime.d
dtrace: script ’./ticktime.d’ matched 2 probes
^C
0 9883789
The minimum interval is 9.8 millisecond, which indicates that the default clock tick frequencyis 10 milliseconds (100 hertz). The observed minimum is somewhat less than 10 millisecondsdue to jitter.
One deficiency of tick-based accounting is that the system clock that performs accounting isoften also responsible for dispatching any time-related scheduling activity. As a result, if athread is to perform some amount of work every clock tick (that is, every 10 milliseconds), thesystem will either over-account for the thread or under-account for the thread, depending onwhether the accounting is done before or after time-related dispatching scheduling activity. InOracle Solaris, accounting is performed before time-related dispatching. As a result, the systemwill under-account for threads running at regular interval. If such threads run for less than theclock tick interval, they can effectively hide behind the clock tick. The following example showsthe degree to which the system has such threads:
sched:::tick,
sched:::enqueue
{
@[probename] = lquantize((timestamp / 1000000) % 10, 0, 10);
}
The output of the example script is two distributions of the millisecond offset within a tenmillisecond interval, one for the tick probe and another for enqueue:
# dtrace -s ./tick.d
dtrace: script ’./tick.d’ matched 4 probes
^C
tick
value -------------- Distribution ------------ count
6 | 0
7 |@ 3
8 |@@@@@@@@@@@@@@@@@@@@@@@@@@@@@@@@@@@@@@ 79
9 | 0
enqueue
value -------------- Distribution ------------ count
< 0 | 0
0 |@@ 267
1 |@@ 300
2 |@@ 259
sched Provider
Oracle Solaris Dynamic Tracing Guide • November 2011 E22973_02282
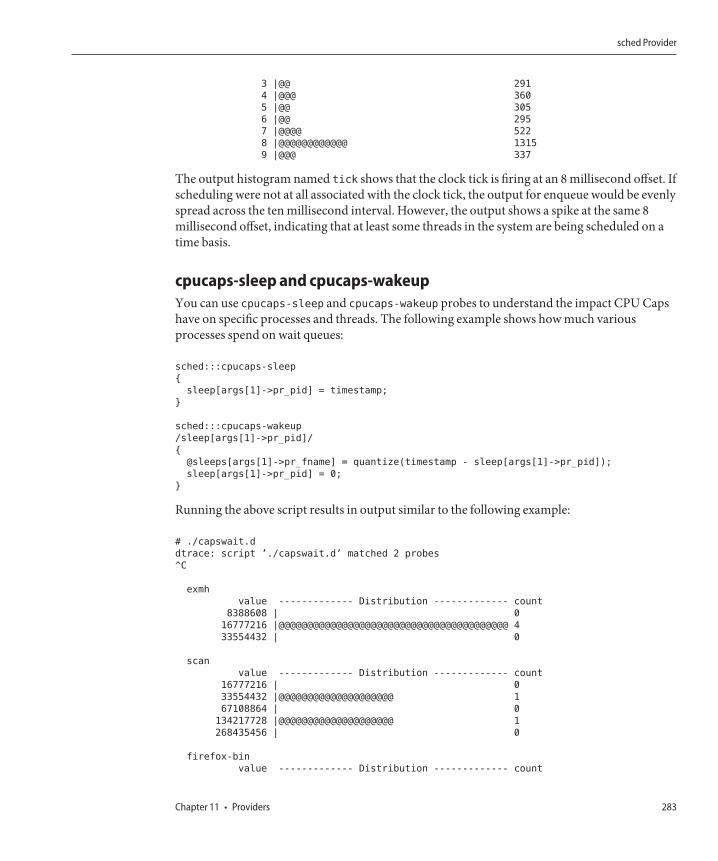
3 |@@ 291
4 |@@@ 360
5 |@@ 305
6 |@@ 295
7 |@@@@ 522
8 |@@@@@@@@@@@@ 1315
9 |@@@ 337
The output histogram named tick shows that the clock tick is firing at an 8 millisecond offset. Ifscheduling were not at all associated with the clock tick, the output for enqueue would be evenlyspread across the ten millisecond interval. However, the output shows a spike at the same 8millisecond offset, indicating that at least some threads in the system are being scheduled on atime basis.
cpucaps-sleep and cpucaps-wakeupYou can use cpucaps-sleep and cpucaps-wakeup probes to understand the impact CPU Capshave on specific processes and threads. The following example shows how much variousprocesses spend on wait queues:
sched:::cpucaps-sleep
{
sleep[args[1]->pr_pid] = timestamp;
}
sched:::cpucaps-wakeup
/sleep[args[1]->pr_pid]/
{
@sleeps[args[1]->pr_fname] = quantize(timestamp - sleep[args[1]->pr_pid]);
sleep[args[1]->pr_pid] = 0;
}
Running the above script results in output similar to the following example:
# ./capswait.d
dtrace: script ’./capswait.d’ matched 2 probes
^C
exmh
value ------------- Distribution ------------- count
8388608 | 0
16777216 |@@@@@@@@@@@@@@@@@@@@@@@@@@@@@@@@@@@@@@@@ 4
33554432 | 0
scan
value ------------- Distribution ------------- count
16777216 | 0
33554432 |@@@@@@@@@@@@@@@@@@@@ 1
67108864 | 0
134217728 |@@@@@@@@@@@@@@@@@@@@ 1
268435456 | 0
firefox-bin
value ------------- Distribution ------------- count
sched Provider
Chapter 11 • Providers 283
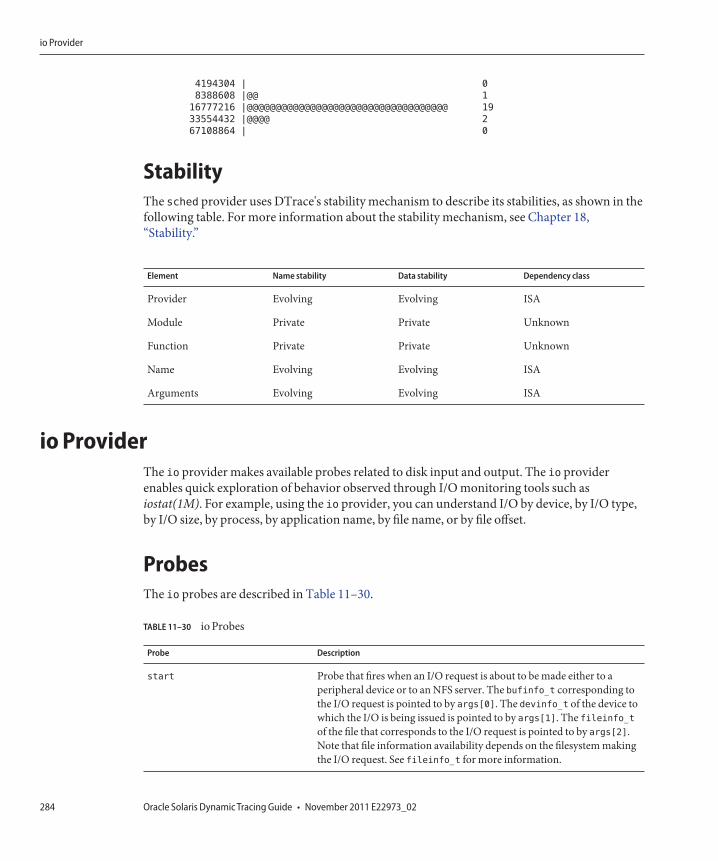
4194304 | 0
8388608 |@@ 1
16777216 |@@@@@@@@@@@@@@@@@@@@@@@@@@@@@@@@@@@ 19
33554432 |@@@@ 2
67108864 | 0
StabilityThe sched provider uses DTrace's stability mechanism to describe its stabilities, as shown in thefollowing table. For more information about the stability mechanism, see Chapter 18,“Stability.”
Element Name stability Data stability Dependency class
Provider Evolving Evolving ISA
Module Private Private Unknown
Function Private Private Unknown
Name Evolving Evolving ISA
Arguments Evolving Evolving ISA
io ProviderThe io provider makes available probes related to disk input and output. The io providerenables quick exploration of behavior observed through I/O monitoring tools such asiostat(1M). For example, using the io provider, you can understand I/O by device, by I/O type,by I/O size, by process, by application name, by file name, or by file offset.
ProbesThe io probes are described in Table 11–30.
TABLE 11–30 io Probes
Probe Description
start Probe that fires when an I/O request is about to be made either to aperipheral device or to an NFS server. The bufinfo_t corresponding tothe I/O request is pointed to by args[0]. The devinfo_t of the device towhich the I/O is being issued is pointed to by args[1]. The fileinfo_tof the file that corresponds to the I/O request is pointed to by args[2].Note that file information availability depends on the filesystem makingthe I/O request. See fileinfo_t for more information.
io Provider
Oracle Solaris Dynamic Tracing Guide • November 2011 E22973_02284
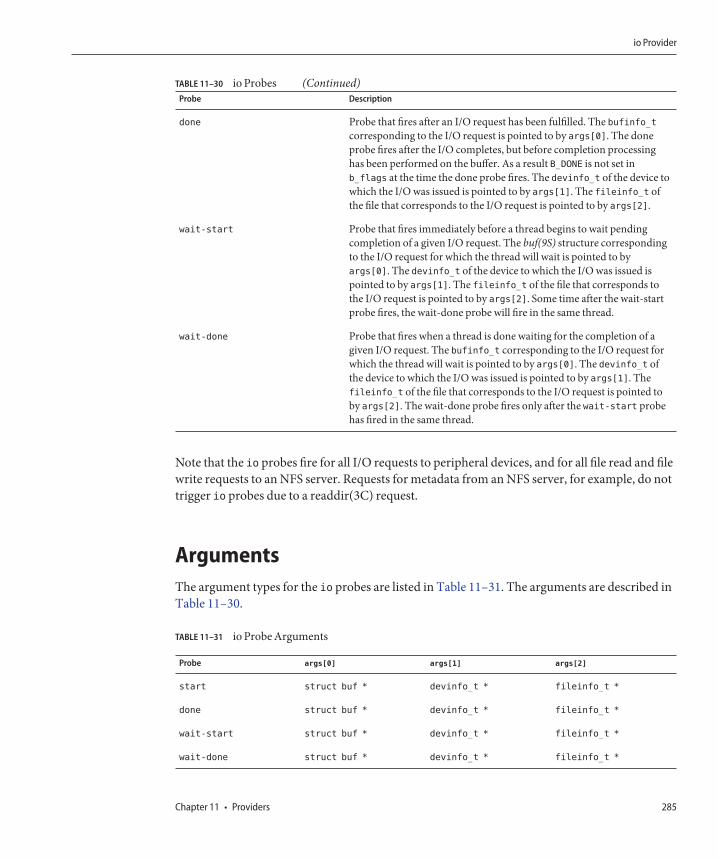
TABLE 11–30 io Probes (Continued)Probe Description
done Probe that fires after an I/O request has been fulfilled. The bufinfo_tcorresponding to the I/O request is pointed to by args[0]. The doneprobe fires after the I/O completes, but before completion processinghas been performed on the buffer. As a result B_DONE is not set inb_flags at the time the done probe fires. The devinfo_t of the device towhich the I/O was issued is pointed to by args[1]. The fileinfo_t ofthe file that corresponds to the I/O request is pointed to by args[2].
wait-start Probe that fires immediately before a thread begins to wait pendingcompletion of a given I/O request. The buf(9S) structure correspondingto the I/O request for which the thread will wait is pointed to byargs[0]. The devinfo_t of the device to which the I/O was issued ispointed to by args[1]. The fileinfo_t of the file that corresponds tothe I/O request is pointed to by args[2]. Some time after the wait-startprobe fires, the wait-done probe will fire in the same thread.
wait-done Probe that fires when a thread is done waiting for the completion of agiven I/O request. The bufinfo_t corresponding to the I/O request forwhich the thread will wait is pointed to by args[0]. The devinfo_t ofthe device to which the I/O was issued is pointed to by args[1]. Thefileinfo_t of the file that corresponds to the I/O request is pointed toby args[2]. The wait-done probe fires only after the wait-start probehas fired in the same thread.
Note that the io probes fire for all I/O requests to peripheral devices, and for all file read and filewrite requests to an NFS server. Requests for metadata from an NFS server, for example, do nottrigger io probes due to a readdir(3C) request.
ArgumentsThe argument types for the io probes are listed in Table 11–31. The arguments are described inTable 11–30.
TABLE 11–31 io Probe Arguments
Probe args[0] args[1] args[2]
start struct buf * devinfo_t * fileinfo_t *
done struct buf * devinfo_t * fileinfo_t *
wait-start struct buf * devinfo_t * fileinfo_t *
wait-done struct buf * devinfo_t * fileinfo_t *
io Provider
Chapter 11 • Providers 285
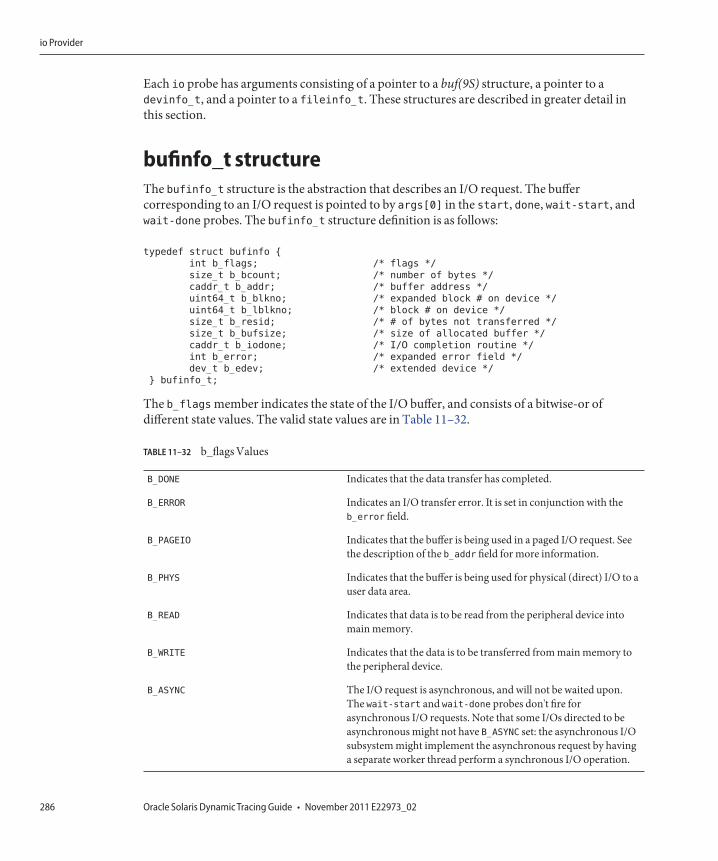
Each io probe has arguments consisting of a pointer to a buf(9S) structure, a pointer to adevinfo_t, and a pointer to a fileinfo_t. These structures are described in greater detail inthis section.
bufinfo_t structureThe bufinfo_t structure is the abstraction that describes an I/O request. The buffercorresponding to an I/O request is pointed to by args[0] in the start, done, wait-start, andwait-done probes. The bufinfo_t structure definition is as follows:
typedef struct bufinfo {
int b_flags; /* flags */
size_t b_bcount; /* number of bytes */
caddr_t b_addr; /* buffer address */
uint64_t b_blkno; /* expanded block # on device */
uint64_t b_lblkno; /* block # on device */
size_t b_resid; /* # of bytes not transferred */
size_t b_bufsize; /* size of allocated buffer */
caddr_t b_iodone; /* I/O completion routine */
int b_error; /* expanded error field */
dev_t b_edev; /* extended device */
} bufinfo_t;
The b_flags member indicates the state of the I/O buffer, and consists of a bitwise-or ofdifferent state values. The valid state values are in Table 11–32.
TABLE 11–32 b_flags Values
B_DONE Indicates that the data transfer has completed.
B_ERROR Indicates an I/O transfer error. It is set in conjunction with theb_error field.
B_PAGEIO Indicates that the buffer is being used in a paged I/O request. Seethe description of the b_addr field for more information.
B_PHYS Indicates that the buffer is being used for physical (direct) I/O to auser data area.
B_READ Indicates that data is to be read from the peripheral device intomain memory.
B_WRITE Indicates that the data is to be transferred from main memory tothe peripheral device.
B_ASYNC The I/O request is asynchronous, and will not be waited upon.The wait-start and wait-done probes don't fire forasynchronous I/O requests. Note that some I/Os directed to beasynchronous might not have B_ASYNC set: the asynchronous I/Osubsystem might implement the asynchronous request by havinga separate worker thread perform a synchronous I/O operation.
io Provider
Oracle Solaris Dynamic Tracing Guide • November 2011 E22973_02286
The b_bcount field is the number of bytes to be transferred as part of the I/O request.
The b_addr field is the virtual address of the I/O request, unless B_PAGEIO is set. The address is akernel virtual address unless B_PHYS is set, in which case it is a user virtual address. If B_PAGEIOis set, the b_addr field contains kernel private data. Exactly one of B_PHYS and B_PAGEIO can beset, or neither flag will be set.
The b_lblkno field identifies which logical block on the device is to be accessed. The mappingfrom a logical block to a physical block (such as the cylinder, track, and so on) is defined by thedevice.
The b_resid field is set to the number of bytes not transferred because of an error.
The b_bufsize field contains the size of the allocated buffer.
The b_iodone field identifies a specific routine in the kernel that is called when the I/O iscomplete.
The b_error field may hold an error code returned from the driver in the event of an I/O error.b_error is set in conjunction with the B_ERROR bit set in the b_flags member.
The b_edev field contains the major and minor device numbers of the device accessed.Consumers may use the D subroutines getmajor and getminor to extract the major and minordevice numbers from the b_edev field.
devinfo_tThe devinfo_t structure provides information about a device. The devinfo_t structurecorresponding to the destination device of an I/O is pointed to by args[1] in the start, done,wait-start, and wait-done probes. The members of devinfo_t are as follows:
typedef struct devinfo {
int dev_major; /* major number */
int dev_minor; /* minor number */
int dev_instance; /* instance number */
string dev_name; /* name of device */
string dev_statname; /* name of device + instance/minor */
string dev_pathname; /* pathname of device */
} devinfo_t;
The dev_major field is the major number of the device. See getmajor(9F) for more information.
The dev_minor field is the minor number of the device. See getminor(9F) for more information.
The dev_instance field is the instance number of the device. The instance of a device isdifferent from the minor number. The minor number is an abstraction managed by the devicedriver. The instance number is a property of the device node. You can display device nodeinstance numbers with prtconf(1M).
io Provider
Chapter 11 • Providers 287
The dev_name field is the name of the device driver that manages the device. You can displaydevice driver names with the -D option to prtconf(1M).
The dev_statname field is the name of the device as reported by iostat(1M). This name alsocorresponds to the name of a kernel statistic as reported by kstat(1M). This field is provided sothat aberrant iostat or kstat output can be quickly correlated to actual I/O activity.
The dev_pathname field is the full path of the device. This path may be specified as an argumentto prtconf(1M) to obtain detailed device information. The path specified by dev_pathnameincludes components expressing the device node, the instance number, and the minor node.However, all three of these elements aren't necessarily expressed in the statistics name. For somedevices, the statistics name consists of the device name and the instance number. For otherdevices, the name consists of the device name and the number of the minor node. As a result,two devices that have the same dev_statname may differ in dev_pathname.
fileinfo_tThe fileinfo_t structure provides information about a file. The file to which an I/Ocorresponds is pointed to by args[2] in the start, done, wait-start, and wait-done probes.The presence of file information is contingent upon the filesystem providing this informationwhen dispatching I/O requests. Some filesystems, especially third-party filesystems, might notprovide this information. Also, I/O requests might emanate from a filesystem for which no fileinformation exists. For example, any I/O to filesystem metadata will not be associated with anyone file. Finally, some highly optimized filesystems might aggregate I/O from disjoint files into asingle I/O request. In this case, the filesystem might provide the file information either for thefile that represents the majority of the I/O or for the file that represents some of the I/O.Alternately, the filesystem might provide no file information at all in this case.
The definition of the fileinfo_t structure is as follows:
typedef struct fileinfo {
string fi_name; /* name (basename of fi_pathname) */
string fi_dirname; /* directory (dirname of fi_pathname) */
string fi_pathname; /* full pathname */
offset_t fi_offset; /* offset within file */
string fi_fs; /* filesystem */
string fi_mount; /* mount point of file system */
} fileinfo_t;
The fi_name field contains the name of the file but does not include any directory components.If no file information is associated with an I/O, the fi_name field will be set to the string <none>.In some rare cases, the pathname associated with a file might be unknown. In this case, thefi_name field will be set to the string <unknown>.
The fi_dirname field contains only the directory component of the file name. As with fi_name,this string may be set to <none> if no file information is present, or <unknown> if the pathnameassociated with the file is not known.
io Provider
Oracle Solaris Dynamic Tracing Guide • November 2011 E22973_02288
The fi_pathname field contains the full pathname to the file. As with fi_name, this string maybe set to <none> if no file information is present, or <unknown> if the pathname associated withthe file is not known.
The fi_offset field contains the offset within the file , or -1 if either file information is notpresent or if the offset is otherwise unspecified by the filesystem.
ExamplesThe following example script displays pertinent information for every I/O as it's issued:
#pragma D option quiet
BEGIN
{
printf("%10s %58s %2s\n", "DEVICE", "FILE", "RW");}
io:::start
{
printf("%10s %58s %2s\n", args[1]->dev_statname,
args[2]->fi_pathname, args[0]->b_flags & B_READ ? "R" : "W");}
The output of the example when cold-starting Acrobat Reader on an x86 laptop systemresembles the following example:
# dtrace -s ./iosnoop.d
DEVICE FILE RW
cmdk0 /opt/Acrobat4/bin/acroread R
cmdk0 /opt/Acrobat4/bin/acroread R
cmdk0 <unknown> R
cmdk0 /opt/Acrobat4/Reader/AcroVersion R
cmdk0 <unknown> R
cmdk0 <unknown> R
cmdk0 <none> R
cmdk0 <unknown> R
cmdk0 <none> R
cmdk0 /usr/lib/locale/iso_8859_1/iso_8859_1.so.3 R
cmdk0 /usr/lib/locale/iso_8859_1/iso_8859_1.so.3 R
cmdk0 /usr/lib/locale/iso_8859_1/iso_8859_1.so.3 R
cmdk0 <none> R
cmdk0 <unknown> R
cmdk0 <unknown> R
cmdk0 <unknown> R
cmdk0 /opt/Acrobat4/Reader/intelsolaris/bin/acroread R
cmdk0 /opt/Acrobat4/Reader/intelsolaris/bin/acroread R
cmdk0 <none> R
cmdk0 /opt/Acrobat4/Reader/intelsolaris/bin/acroread R
cmdk0 /opt/Acrobat4/Reader/intelsolaris/bin/acroread R
cmdk0 /opt/Acrobat4/Reader/intelsolaris/bin/acroread R
cmdk0 /opt/Acrobat4/Reader/intelsolaris/bin/acroread R
cmdk0 /opt/Acrobat4/Reader/intelsolaris/bin/acroread R
io Provider
Chapter 11 • Providers 289
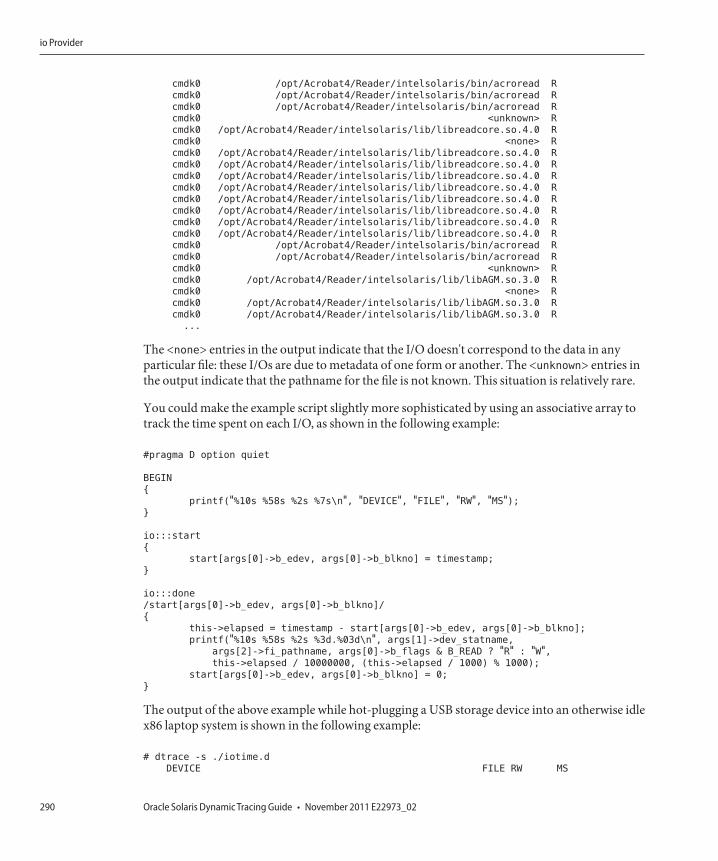
cmdk0 /opt/Acrobat4/Reader/intelsolaris/bin/acroread R
cmdk0 /opt/Acrobat4/Reader/intelsolaris/bin/acroread R
cmdk0 /opt/Acrobat4/Reader/intelsolaris/bin/acroread R
cmdk0 <unknown> R
cmdk0 /opt/Acrobat4/Reader/intelsolaris/lib/libreadcore.so.4.0 R
cmdk0 <none> R
cmdk0 /opt/Acrobat4/Reader/intelsolaris/lib/libreadcore.so.4.0 R
cmdk0 /opt/Acrobat4/Reader/intelsolaris/lib/libreadcore.so.4.0 R
cmdk0 /opt/Acrobat4/Reader/intelsolaris/lib/libreadcore.so.4.0 R
cmdk0 /opt/Acrobat4/Reader/intelsolaris/lib/libreadcore.so.4.0 R
cmdk0 /opt/Acrobat4/Reader/intelsolaris/lib/libreadcore.so.4.0 R
cmdk0 /opt/Acrobat4/Reader/intelsolaris/lib/libreadcore.so.4.0 R
cmdk0 /opt/Acrobat4/Reader/intelsolaris/lib/libreadcore.so.4.0 R
cmdk0 /opt/Acrobat4/Reader/intelsolaris/lib/libreadcore.so.4.0 R
cmdk0 /opt/Acrobat4/Reader/intelsolaris/bin/acroread R
cmdk0 /opt/Acrobat4/Reader/intelsolaris/bin/acroread R
cmdk0 <unknown> R
cmdk0 /opt/Acrobat4/Reader/intelsolaris/lib/libAGM.so.3.0 R
cmdk0 <none> R
cmdk0 /opt/Acrobat4/Reader/intelsolaris/lib/libAGM.so.3.0 R
cmdk0 /opt/Acrobat4/Reader/intelsolaris/lib/libAGM.so.3.0 R
...
The <none> entries in the output indicate that the I/O doesn't correspond to the data in anyparticular file: these I/Os are due to metadata of one form or another. The <unknown> entries inthe output indicate that the pathname for the file is not known. This situation is relatively rare.
You could make the example script slightly more sophisticated by using an associative array totrack the time spent on each I/O, as shown in the following example:
#pragma D option quiet
BEGIN
{
printf("%10s %58s %2s %7s\n", "DEVICE", "FILE", "RW", "MS");}
io:::start
{
start[args[0]->b_edev, args[0]->b_blkno] = timestamp;
}
io:::done
/start[args[0]->b_edev, args[0]->b_blkno]/
{
this->elapsed = timestamp - start[args[0]->b_edev, args[0]->b_blkno];
printf("%10s %58s %2s %3d.%03d\n", args[1]->dev_statname,
args[2]->fi_pathname, args[0]->b_flags & B_READ ? "R" : "W",this->elapsed / 10000000, (this->elapsed / 1000) % 1000);
start[args[0]->b_edev, args[0]->b_blkno] = 0;
}
The output of the above example while hot-plugging a USB storage device into an otherwise idlex86 laptop system is shown in the following example:
# dtrace -s ./iotime.d
DEVICE FILE RW MS
io Provider
Oracle Solaris Dynamic Tracing Guide • November 2011 E22973_02290
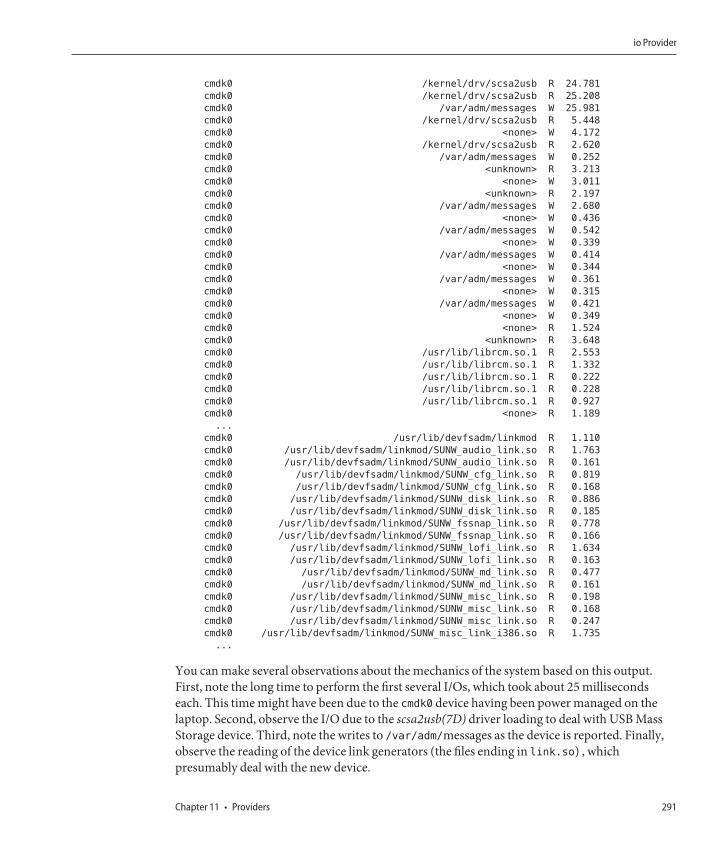
cmdk0 /kernel/drv/scsa2usb R 24.781
cmdk0 /kernel/drv/scsa2usb R 25.208
cmdk0 /var/adm/messages W 25.981
cmdk0 /kernel/drv/scsa2usb R 5.448
cmdk0 <none> W 4.172
cmdk0 /kernel/drv/scsa2usb R 2.620
cmdk0 /var/adm/messages W 0.252
cmdk0 <unknown> R 3.213
cmdk0 <none> W 3.011
cmdk0 <unknown> R 2.197
cmdk0 /var/adm/messages W 2.680
cmdk0 <none> W 0.436
cmdk0 /var/adm/messages W 0.542
cmdk0 <none> W 0.339
cmdk0 /var/adm/messages W 0.414
cmdk0 <none> W 0.344
cmdk0 /var/adm/messages W 0.361
cmdk0 <none> W 0.315
cmdk0 /var/adm/messages W 0.421
cmdk0 <none> W 0.349
cmdk0 <none> R 1.524
cmdk0 <unknown> R 3.648
cmdk0 /usr/lib/librcm.so.1 R 2.553
cmdk0 /usr/lib/librcm.so.1 R 1.332
cmdk0 /usr/lib/librcm.so.1 R 0.222
cmdk0 /usr/lib/librcm.so.1 R 0.228
cmdk0 /usr/lib/librcm.so.1 R 0.927
cmdk0 <none> R 1.189
...
cmdk0 /usr/lib/devfsadm/linkmod R 1.110
cmdk0 /usr/lib/devfsadm/linkmod/SUNW_audio_link.so R 1.763
cmdk0 /usr/lib/devfsadm/linkmod/SUNW_audio_link.so R 0.161
cmdk0 /usr/lib/devfsadm/linkmod/SUNW_cfg_link.so R 0.819
cmdk0 /usr/lib/devfsadm/linkmod/SUNW_cfg_link.so R 0.168
cmdk0 /usr/lib/devfsadm/linkmod/SUNW_disk_link.so R 0.886
cmdk0 /usr/lib/devfsadm/linkmod/SUNW_disk_link.so R 0.185
cmdk0 /usr/lib/devfsadm/linkmod/SUNW_fssnap_link.so R 0.778
cmdk0 /usr/lib/devfsadm/linkmod/SUNW_fssnap_link.so R 0.166
cmdk0 /usr/lib/devfsadm/linkmod/SUNW_lofi_link.so R 1.634
cmdk0 /usr/lib/devfsadm/linkmod/SUNW_lofi_link.so R 0.163
cmdk0 /usr/lib/devfsadm/linkmod/SUNW_md_link.so R 0.477
cmdk0 /usr/lib/devfsadm/linkmod/SUNW_md_link.so R 0.161
cmdk0 /usr/lib/devfsadm/linkmod/SUNW_misc_link.so R 0.198
cmdk0 /usr/lib/devfsadm/linkmod/SUNW_misc_link.so R 0.168
cmdk0 /usr/lib/devfsadm/linkmod/SUNW_misc_link.so R 0.247
cmdk0 /usr/lib/devfsadm/linkmod/SUNW_misc_link_i386.so R 1.735
...
You can make several observations about the mechanics of the system based on this output.First, note the long time to perform the first several I/Os, which took about 25 millisecondseach. This time might have been due to the cmdk0 device having been power managed on thelaptop. Second, observe the I/O due to the scsa2usb(7D) driver loading to deal with USB MassStorage device. Third, note the writes to /var/adm/messages as the device is reported. Finally,observe the reading of the device link generators (the files ending in link.so) , whichpresumably deal with the new device.
io Provider
Chapter 11 • Providers 291
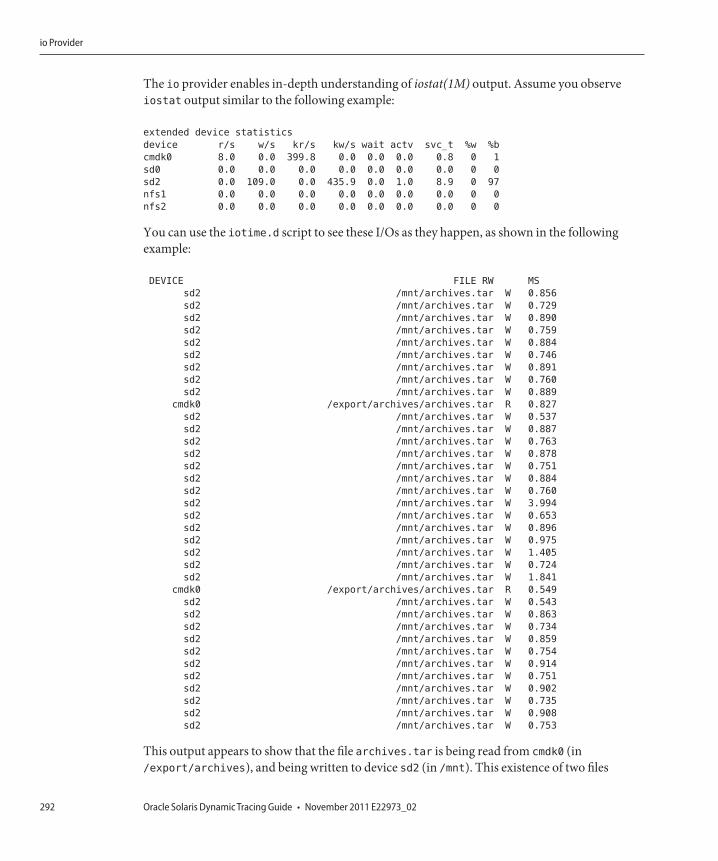
The io provider enables in-depth understanding of iostat(1M) output. Assume you observeiostat output similar to the following example:
extended device statistics
device r/s w/s kr/s kw/s wait actv svc_t %w %b
cmdk0 8.0 0.0 399.8 0.0 0.0 0.0 0.8 0 1
sd0 0.0 0.0 0.0 0.0 0.0 0.0 0.0 0 0
sd2 0.0 109.0 0.0 435.9 0.0 1.0 8.9 0 97
nfs1 0.0 0.0 0.0 0.0 0.0 0.0 0.0 0 0
nfs2 0.0 0.0 0.0 0.0 0.0 0.0 0.0 0 0
You can use the iotime.d script to see these I/Os as they happen, as shown in the followingexample:
DEVICE FILE RW MS
sd2 /mnt/archives.tar W 0.856
sd2 /mnt/archives.tar W 0.729
sd2 /mnt/archives.tar W 0.890
sd2 /mnt/archives.tar W 0.759
sd2 /mnt/archives.tar W 0.884
sd2 /mnt/archives.tar W 0.746
sd2 /mnt/archives.tar W 0.891
sd2 /mnt/archives.tar W 0.760
sd2 /mnt/archives.tar W 0.889
cmdk0 /export/archives/archives.tar R 0.827
sd2 /mnt/archives.tar W 0.537
sd2 /mnt/archives.tar W 0.887
sd2 /mnt/archives.tar W 0.763
sd2 /mnt/archives.tar W 0.878
sd2 /mnt/archives.tar W 0.751
sd2 /mnt/archives.tar W 0.884
sd2 /mnt/archives.tar W 0.760
sd2 /mnt/archives.tar W 3.994
sd2 /mnt/archives.tar W 0.653
sd2 /mnt/archives.tar W 0.896
sd2 /mnt/archives.tar W 0.975
sd2 /mnt/archives.tar W 1.405
sd2 /mnt/archives.tar W 0.724
sd2 /mnt/archives.tar W 1.841
cmdk0 /export/archives/archives.tar R 0.549
sd2 /mnt/archives.tar W 0.543
sd2 /mnt/archives.tar W 0.863
sd2 /mnt/archives.tar W 0.734
sd2 /mnt/archives.tar W 0.859
sd2 /mnt/archives.tar W 0.754
sd2 /mnt/archives.tar W 0.914
sd2 /mnt/archives.tar W 0.751
sd2 /mnt/archives.tar W 0.902
sd2 /mnt/archives.tar W 0.735
sd2 /mnt/archives.tar W 0.908
sd2 /mnt/archives.tar W 0.753
This output appears to show that the file archives.tar is being read from cmdk0 (in/export/archives), and being written to device sd2 (in /mnt). This existence of two files
io Provider
Oracle Solaris Dynamic Tracing Guide • November 2011 E22973_02292
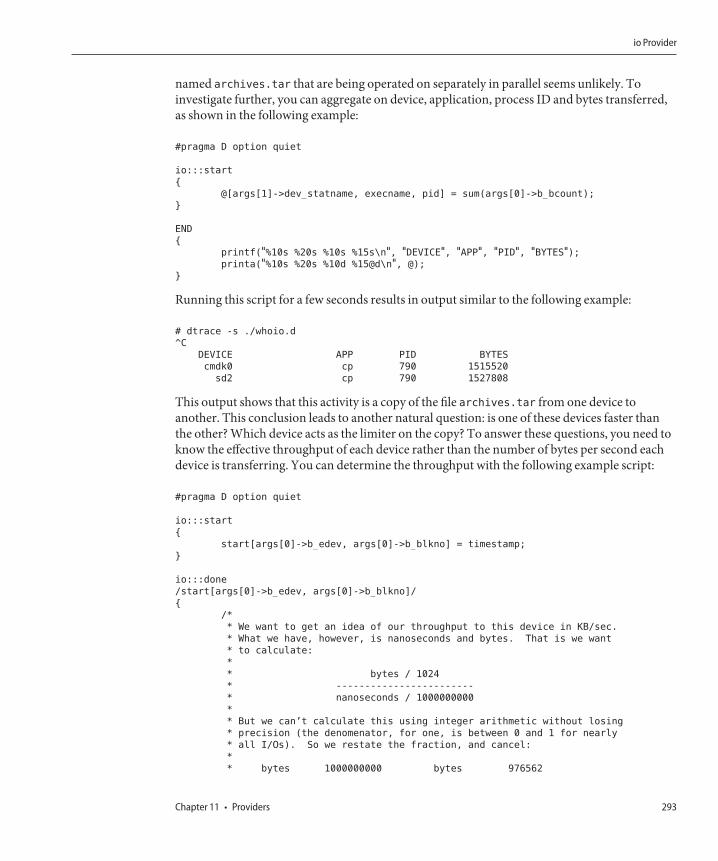
named archives.tar that are being operated on separately in parallel seems unlikely. Toinvestigate further, you can aggregate on device, application, process ID and bytes transferred,as shown in the following example:
#pragma D option quiet
io:::start
{
@[args[1]->dev_statname, execname, pid] = sum(args[0]->b_bcount);
}
END
{
printf("%10s %20s %10s %15s\n", "DEVICE", "APP", "PID", "BYTES");printa("%10s %20s %10d %15@d\n", @);
}
Running this script for a few seconds results in output similar to the following example:
# dtrace -s ./whoio.d
^C
DEVICE APP PID BYTES
cmdk0 cp 790 1515520
sd2 cp 790 1527808
This output shows that this activity is a copy of the file archives.tar from one device toanother. This conclusion leads to another natural question: is one of these devices faster thanthe other? Which device acts as the limiter on the copy? To answer these questions, you need toknow the effective throughput of each device rather than the number of bytes per second eachdevice is transferring. You can determine the throughput with the following example script:
#pragma D option quiet
io:::start
{
start[args[0]->b_edev, args[0]->b_blkno] = timestamp;
}
io:::done
/start[args[0]->b_edev, args[0]->b_blkno]/
{
/*
* We want to get an idea of our throughput to this device in KB/sec.
* What we have, however, is nanoseconds and bytes. That is we want
* to calculate:
*
* bytes / 1024
* ------------------------
* nanoseconds / 1000000000
*
* But we can’t calculate this using integer arithmetic without losing
* precision (the denomenator, for one, is between 0 and 1 for nearly
* all I/Os). So we restate the fraction, and cancel:
*
* bytes 1000000000 bytes 976562
io Provider
Chapter 11 • Providers 293
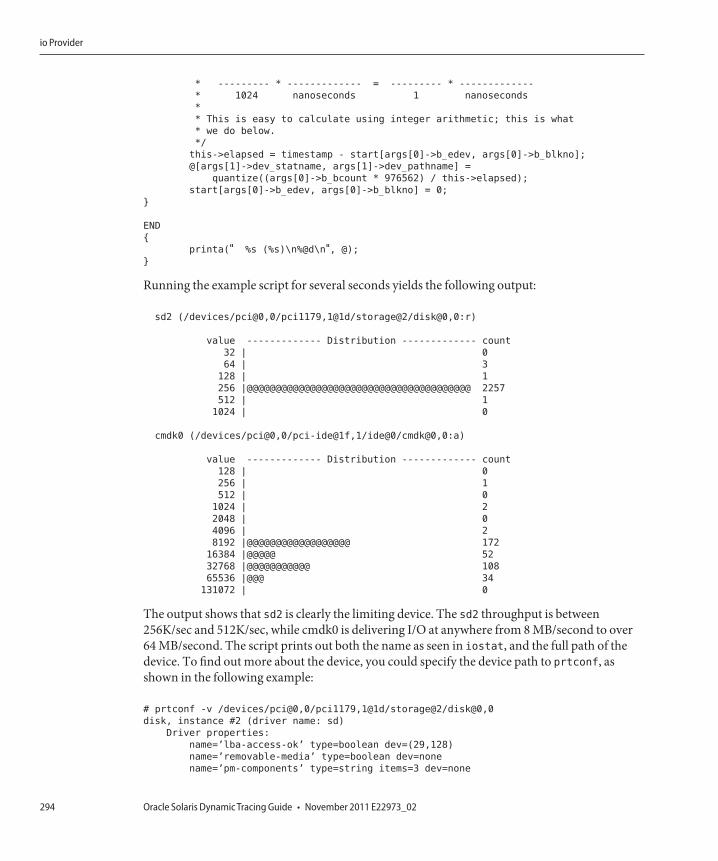
* --------- * ------------- = --------- * -------------
* 1024 nanoseconds 1 nanoseconds
*
* This is easy to calculate using integer arithmetic; this is what
* we do below.
*/
this->elapsed = timestamp - start[args[0]->b_edev, args[0]->b_blkno];
@[args[1]->dev_statname, args[1]->dev_pathname] =
quantize((args[0]->b_bcount * 976562) / this->elapsed);
start[args[0]->b_edev, args[0]->b_blkno] = 0;
}
END
{
printa(" %s (%s)\n%@d\n", @);
}
Running the example script for several seconds yields the following output:
sd2 (/devices/pci@0,0/pci1179,1@1d/storage@2/disk@0,0:r)
value ------------- Distribution ------------- count
32 | 0
64 | 3
128 | 1
256 |@@@@@@@@@@@@@@@@@@@@@@@@@@@@@@@@@@@@@@@ 2257
512 | 1
1024 | 0
cmdk0 (/devices/pci@0,0/pci-ide@1f,1/ide@0/cmdk@0,0:a)
value ------------- Distribution ------------- count
128 | 0
256 | 1
512 | 0
1024 | 2
2048 | 0
4096 | 2
8192 |@@@@@@@@@@@@@@@@@@ 172
16384 |@@@@@ 52
32768 |@@@@@@@@@@@ 108
65536 |@@@ 34
131072 | 0
The output shows that sd2 is clearly the limiting device. The sd2 throughput is between256K/sec and 512K/sec, while cmdk0 is delivering I/O at anywhere from 8 MB/second to over64 MB/second. The script prints out both the name as seen in iostat, and the full path of thedevice. To find out more about the device, you could specify the device path to prtconf, asshown in the following example:
# prtconf -v /devices/pci@0,0/pci1179,1@1d/storage@2/disk@0,0
disk, instance #2 (driver name: sd)
Driver properties:
name=’lba-access-ok’ type=boolean dev=(29,128)
name=’removable-media’ type=boolean dev=none
name=’pm-components’ type=string items=3 dev=none
io Provider
Oracle Solaris Dynamic Tracing Guide • November 2011 E22973_02294
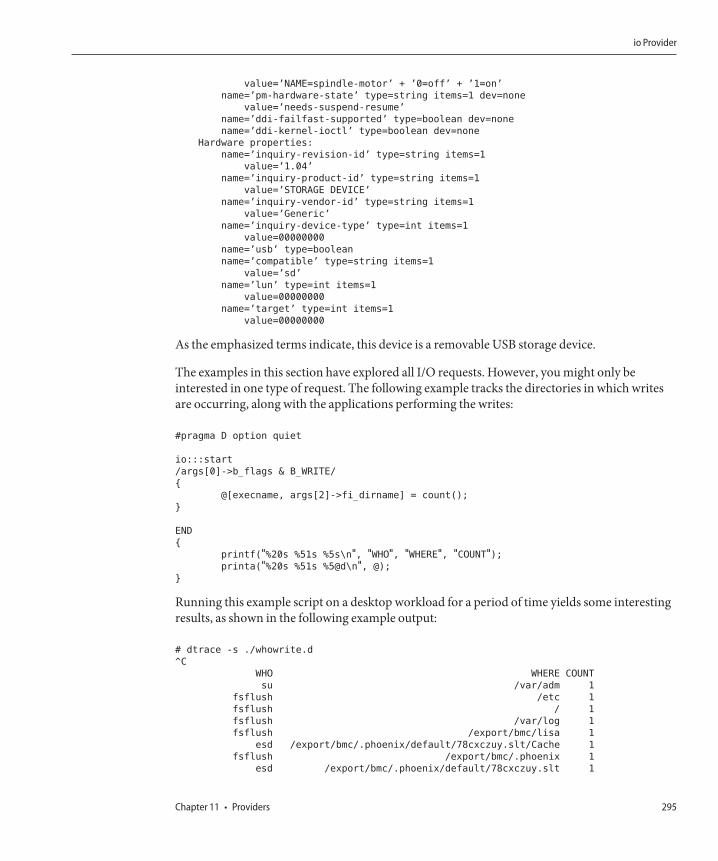
value=’NAME=spindle-motor’ + ’0=off’ + ’1=on’
name=’pm-hardware-state’ type=string items=1 dev=none
value=’needs-suspend-resume’
name=’ddi-failfast-supported’ type=boolean dev=none
name=’ddi-kernel-ioctl’ type=boolean dev=none
Hardware properties:
name=’inquiry-revision-id’ type=string items=1
value=’1.04’
name=’inquiry-product-id’ type=string items=1
value=’STORAGE DEVICE’
name=’inquiry-vendor-id’ type=string items=1
value=’Generic’
name=’inquiry-device-type’ type=int items=1
value=00000000
name=’usb’ type=boolean
name=’compatible’ type=string items=1
value=’sd’
name=’lun’ type=int items=1
value=00000000
name=’target’ type=int items=1
value=00000000
As the emphasized terms indicate, this device is a removable USB storage device.
The examples in this section have explored all I/O requests. However, you might only beinterested in one type of request. The following example tracks the directories in which writesare occurring, along with the applications performing the writes:
#pragma D option quiet
io:::start
/args[0]->b_flags & B_WRITE/
{
@[execname, args[2]->fi_dirname] = count();
}
END
{
printf("%20s %51s %5s\n", "WHO", "WHERE", "COUNT");printa("%20s %51s %5@d\n", @);
}
Running this example script on a desktop workload for a period of time yields some interestingresults, as shown in the following example output:
# dtrace -s ./whowrite.d
^C
WHO WHERE COUNT
su /var/adm 1
fsflush /etc 1
fsflush / 1
fsflush /var/log 1
fsflush /export/bmc/lisa 1
esd /export/bmc/.phoenix/default/78cxczuy.slt/Cache 1
fsflush /export/bmc/.phoenix 1
esd /export/bmc/.phoenix/default/78cxczuy.slt 1
io Provider
Chapter 11 • Providers 295
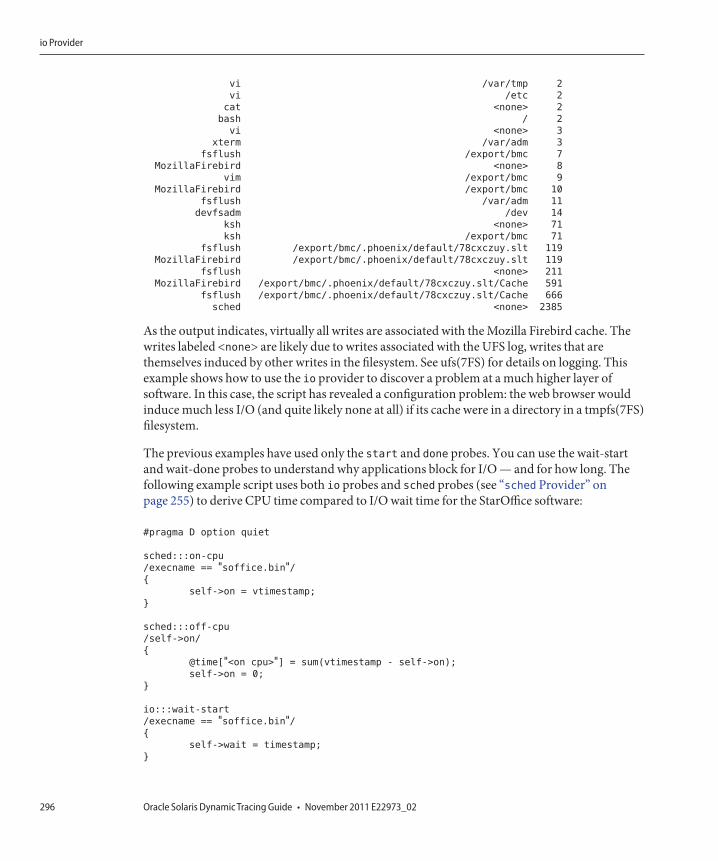
vi /var/tmp 2
vi /etc 2
cat <none> 2
bash / 2
vi <none> 3
xterm /var/adm 3
fsflush /export/bmc 7
MozillaFirebird <none> 8
vim /export/bmc 9
MozillaFirebird /export/bmc 10
fsflush /var/adm 11
devfsadm /dev 14
ksh <none> 71
ksh /export/bmc 71
fsflush /export/bmc/.phoenix/default/78cxczuy.slt 119
MozillaFirebird /export/bmc/.phoenix/default/78cxczuy.slt 119
fsflush <none> 211
MozillaFirebird /export/bmc/.phoenix/default/78cxczuy.slt/Cache 591
fsflush /export/bmc/.phoenix/default/78cxczuy.slt/Cache 666
sched <none> 2385
As the output indicates, virtually all writes are associated with the Mozilla Firebird cache. Thewrites labeled <none> are likely due to writes associated with the UFS log, writes that arethemselves induced by other writes in the filesystem. See ufs(7FS) for details on logging. Thisexample shows how to use the io provider to discover a problem at a much higher layer ofsoftware. In this case, the script has revealed a configuration problem: the web browser wouldinduce much less I/O (and quite likely none at all) if its cache were in a directory in a tmpfs(7FS)filesystem.
The previous examples have used only the start and done probes. You can use the wait-startand wait-done probes to understand why applications block for I/O — and for how long. Thefollowing example script uses both io probes and sched probes (see “sched Provider” onpage 255) to derive CPU time compared to I/O wait time for the StarOffice software:
#pragma D option quiet
sched:::on-cpu
/execname == "soffice.bin"/{
self->on = vtimestamp;
}
sched:::off-cpu
/self->on/
{
@time["<on cpu>"] = sum(vtimestamp - self->on);
self->on = 0;
}
io:::wait-start
/execname == "soffice.bin"/{
self->wait = timestamp;
}
io Provider
Oracle Solaris Dynamic Tracing Guide • November 2011 E22973_02296
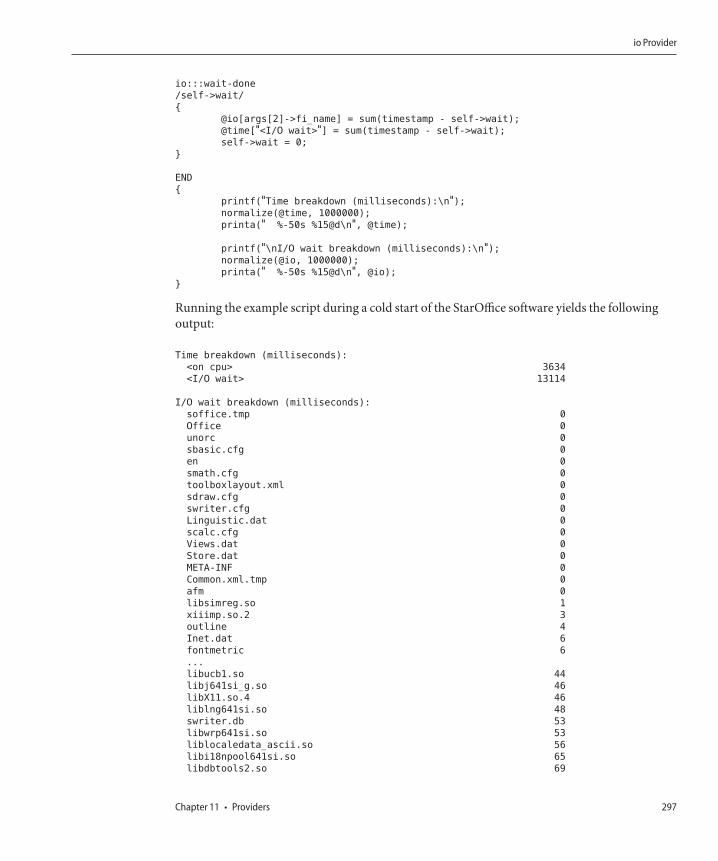
io:::wait-done
/self->wait/
{
@io[args[2]->fi_name] = sum(timestamp - self->wait);
@time["<I/O wait>"] = sum(timestamp - self->wait);
self->wait = 0;
}
END
{
printf("Time breakdown (milliseconds):\n");normalize(@time, 1000000);
printa(" %-50s %15@d\n", @time);
printf("\nI/O wait breakdown (milliseconds):\n");normalize(@io, 1000000);
printa(" %-50s %15@d\n", @io);
}
Running the example script during a cold start of the StarOffice software yields the followingoutput:
Time breakdown (milliseconds):
<on cpu> 3634
<I/O wait> 13114
I/O wait breakdown (milliseconds):
soffice.tmp 0
Office 0
unorc 0
sbasic.cfg 0
en 0
smath.cfg 0
toolboxlayout.xml 0
sdraw.cfg 0
swriter.cfg 0
Linguistic.dat 0
scalc.cfg 0
Views.dat 0
Store.dat 0
META-INF 0
Common.xml.tmp 0
afm 0
libsimreg.so 1
xiiimp.so.2 3
outline 4
Inet.dat 6
fontmetric 6
...
libucb1.so 44
libj641si_g.so 46
libX11.so.4 46
liblng641si.so 48
swriter.db 53
libwrp641si.so 53
liblocaledata_ascii.so 56
libi18npool641si.so 65
libdbtools2.so 69
io Provider
Chapter 11 • Providers 297
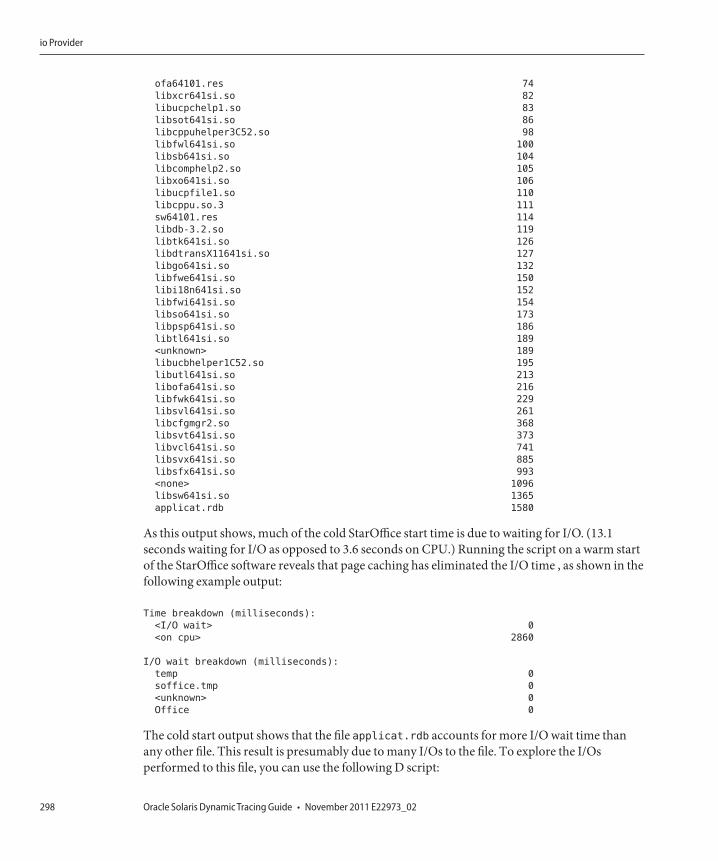
ofa64101.res 74
libxcr641si.so 82
libucpchelp1.so 83
libsot641si.so 86
libcppuhelper3C52.so 98
libfwl641si.so 100
libsb641si.so 104
libcomphelp2.so 105
libxo641si.so 106
libucpfile1.so 110
libcppu.so.3 111
sw64101.res 114
libdb-3.2.so 119
libtk641si.so 126
libdtransX11641si.so 127
libgo641si.so 132
libfwe641si.so 150
libi18n641si.so 152
libfwi641si.so 154
libso641si.so 173
libpsp641si.so 186
libtl641si.so 189
<unknown> 189
libucbhelper1C52.so 195
libutl641si.so 213
libofa641si.so 216
libfwk641si.so 229
libsvl641si.so 261
libcfgmgr2.so 368
libsvt641si.so 373
libvcl641si.so 741
libsvx641si.so 885
libsfx641si.so 993
<none> 1096
libsw641si.so 1365
applicat.rdb 1580
As this output shows, much of the cold StarOffice start time is due to waiting for I/O. (13.1seconds waiting for I/O as opposed to 3.6 seconds on CPU.) Running the script on a warm startof the StarOffice software reveals that page caching has eliminated the I/O time , as shown in thefollowing example output:
Time breakdown (milliseconds):
<I/O wait> 0
<on cpu> 2860
I/O wait breakdown (milliseconds):
temp 0
soffice.tmp 0
<unknown> 0
Office 0
The cold start output shows that the file applicat.rdb accounts for more I/O wait time thanany other file. This result is presumably due to many I/Os to the file. To explore the I/Osperformed to this file, you can use the following D script:
io Provider
Oracle Solaris Dynamic Tracing Guide • November 2011 E22973_02298
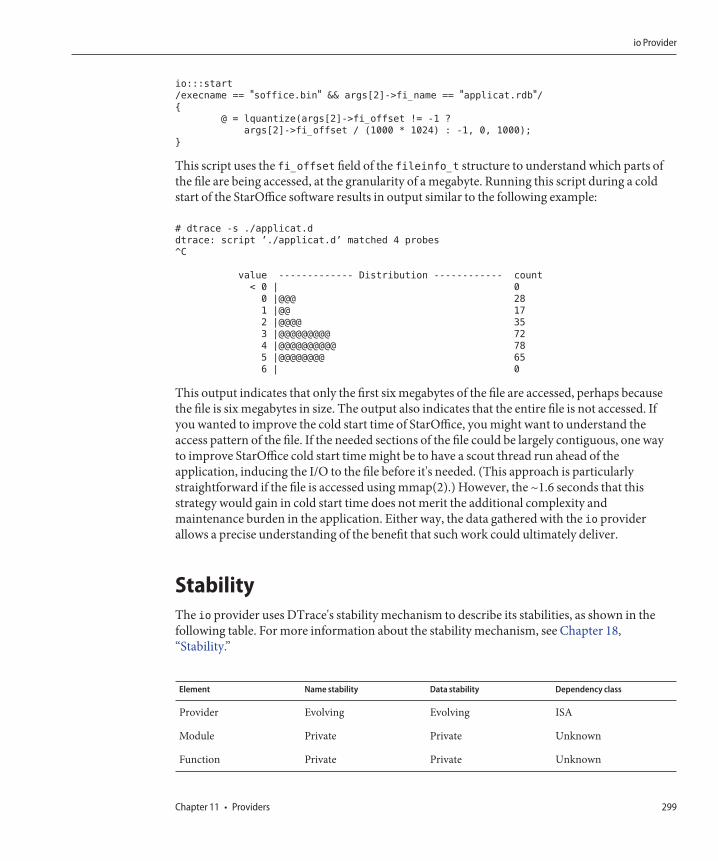
io:::start
/execname == "soffice.bin" && args[2]->fi_name == "applicat.rdb"/{
@ = lquantize(args[2]->fi_offset != -1 ?
args[2]->fi_offset / (1000 * 1024) : -1, 0, 1000);
}
This script uses the fi_offset field of the fileinfo_t structure to understand which parts ofthe file are being accessed, at the granularity of a megabyte. Running this script during a coldstart of the StarOffice software results in output similar to the following example:
# dtrace -s ./applicat.d
dtrace: script ’./applicat.d’ matched 4 probes
^C
value ------------- Distribution ------------ count
< 0 | 0
0 |@@@ 28
1 |@@ 17
2 |@@@@ 35
3 |@@@@@@@@@ 72
4 |@@@@@@@@@@ 78
5 |@@@@@@@@ 65
6 | 0
This output indicates that only the first six megabytes of the file are accessed, perhaps becausethe file is six megabytes in size. The output also indicates that the entire file is not accessed. Ifyou wanted to improve the cold start time of StarOffice, you might want to understand theaccess pattern of the file. If the needed sections of the file could be largely contiguous, one wayto improve StarOffice cold start time might be to have a scout thread run ahead of theapplication, inducing the I/O to the file before it's needed. (This approach is particularlystraightforward if the file is accessed using mmap(2).) However, the ~1.6 seconds that thisstrategy would gain in cold start time does not merit the additional complexity andmaintenance burden in the application. Either way, the data gathered with the io providerallows a precise understanding of the benefit that such work could ultimately deliver.
StabilityThe io provider uses DTrace's stability mechanism to describe its stabilities, as shown in thefollowing table. For more information about the stability mechanism, see Chapter 18,“Stability.”
Element Name stability Data stability Dependency class
Provider Evolving Evolving ISA
Module Private Private Unknown
Function Private Private Unknown
io Provider
Chapter 11 • Providers 299
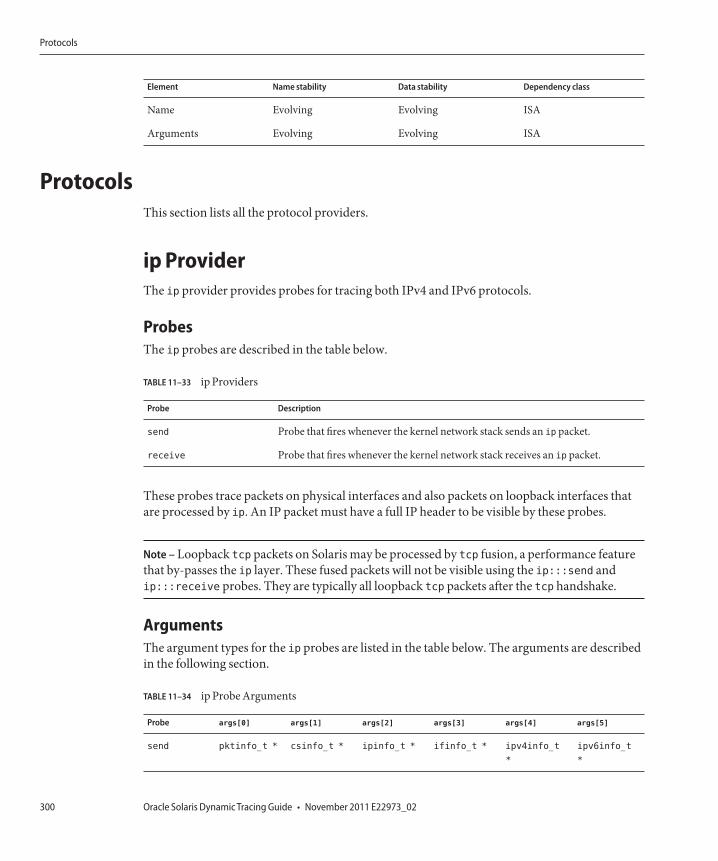
Element Name stability Data stability Dependency class
Name Evolving Evolving ISA
Arguments Evolving Evolving ISA
ProtocolsThis section lists all the protocol providers.
ip ProviderThe ip provider provides probes for tracing both IPv4 and IPv6 protocols.
ProbesThe ip probes are described in the table below.
TABLE 11–33 ip Providers
Probe Description
send Probe that fires whenever the kernel network stack sends an ip packet.
receive Probe that fires whenever the kernel network stack receives an ip packet.
These probes trace packets on physical interfaces and also packets on loopback interfaces thatare processed by ip. An IP packet must have a full IP header to be visible by these probes.
Note – Loopback tcp packets on Solaris may be processed by tcp fusion, a performance featurethat by-passes the ip layer. These fused packets will not be visible using the ip:::send andip:::receive probes. They are typically all loopback tcp packets after the tcp handshake.
ArgumentsThe argument types for the ip probes are listed in the table below. The arguments are describedin the following section.
TABLE 11–34 ip Probe Arguments
Probe args[0] args[1] args[2] args[3] args[4] args[5]
send pktinfo_t * csinfo_t * ipinfo_t * ifinfo_t * ipv4info_t
*
ipv6info_t
*
Protocols
Oracle Solaris Dynamic Tracing Guide • November 2011 E22973_02300
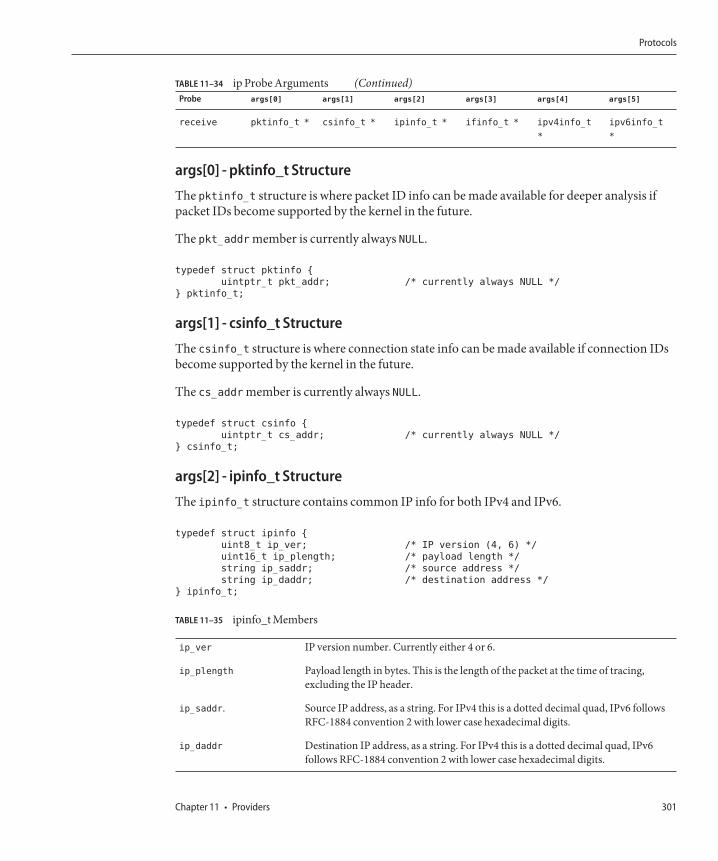
TABLE 11–34 ip Probe Arguments (Continued)Probe args[0] args[1] args[2] args[3] args[4] args[5]
receive pktinfo_t * csinfo_t * ipinfo_t * ifinfo_t * ipv4info_t
*
ipv6info_t
*
args[0] - pktinfo_t Structure
The pktinfo_t structure is where packet ID info can be made available for deeper analysis ifpacket IDs become supported by the kernel in the future.
The pkt_addr member is currently always NULL.
typedef struct pktinfo {
uintptr_t pkt_addr; /* currently always NULL */
} pktinfo_t;
args[1] - csinfo_t Structure
The csinfo_t structure is where connection state info can be made available if connection IDsbecome supported by the kernel in the future.
The cs_addr member is currently always NULL.
typedef struct csinfo {
uintptr_t cs_addr; /* currently always NULL */
} csinfo_t;
args[2] - ipinfo_t Structure
The ipinfo_t structure contains common IP info for both IPv4 and IPv6.
typedef struct ipinfo {
uint8_t ip_ver; /* IP version (4, 6) */
uint16_t ip_plength; /* payload length */
string ip_saddr; /* source address */
string ip_daddr; /* destination address */
} ipinfo_t;
TABLE 11–35 ipinfo_t Members
ip_ver IP version number. Currently either 4 or 6.
ip_plength Payload length in bytes. This is the length of the packet at the time of tracing,excluding the IP header.
ip_saddr. Source IP address, as a string. For IPv4 this is a dotted decimal quad, IPv6 followsRFC-1884 convention 2 with lower case hexadecimal digits.
ip_daddr Destination IP address, as a string. For IPv4 this is a dotted decimal quad, IPv6follows RFC-1884 convention 2 with lower case hexadecimal digits.
Protocols
Chapter 11 • Providers 301
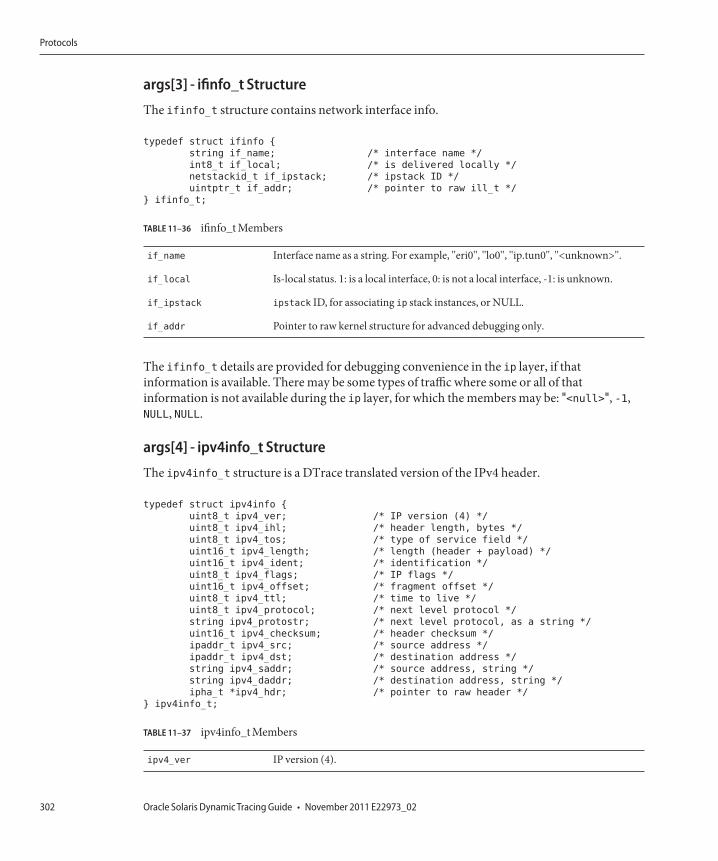
args[3] - ifinfo_t Structure
The ifinfo_t structure contains network interface info.
typedef struct ifinfo {
string if_name; /* interface name */
int8_t if_local; /* is delivered locally */
netstackid_t if_ipstack; /* ipstack ID */
uintptr_t if_addr; /* pointer to raw ill_t */
} ifinfo_t;
TABLE 11–36 ifinfo_t Members
if_name Interface name as a string. For example, "eri0", "lo0", "ip.tun0", "<unknown>".
if_local Is-local status. 1: is a local interface, 0: is not a local interface, -1: is unknown.
if_ipstack ipstack ID, for associating ip stack instances, or NULL.
if_addr Pointer to raw kernel structure for advanced debugging only.
The ifinfo_t details are provided for debugging convenience in the ip layer, if thatinformation is available. There may be some types of traffic where some or all of thatinformation is not available during the ip layer, for which the members may be: "<null>", -1,NULL, NULL.
args[4] - ipv4info_t Structure
The ipv4info_t structure is a DTrace translated version of the IPv4 header.
typedef struct ipv4info {
uint8_t ipv4_ver; /* IP version (4) */
uint8_t ipv4_ihl; /* header length, bytes */
uint8_t ipv4_tos; /* type of service field */
uint16_t ipv4_length; /* length (header + payload) */
uint16_t ipv4_ident; /* identification */
uint8_t ipv4_flags; /* IP flags */
uint16_t ipv4_offset; /* fragment offset */
uint8_t ipv4_ttl; /* time to live */
uint8_t ipv4_protocol; /* next level protocol */
string ipv4_protostr; /* next level protocol, as a string */
uint16_t ipv4_checksum; /* header checksum */
ipaddr_t ipv4_src; /* source address */
ipaddr_t ipv4_dst; /* destination address */
string ipv4_saddr; /* source address, string */
string ipv4_daddr; /* destination address, string */
ipha_t *ipv4_hdr; /* pointer to raw header */
} ipv4info_t;
TABLE 11–37 ipv4info_t Members
ipv4_ver IP version (4).
Protocols
Oracle Solaris Dynamic Tracing Guide • November 2011 E22973_02302
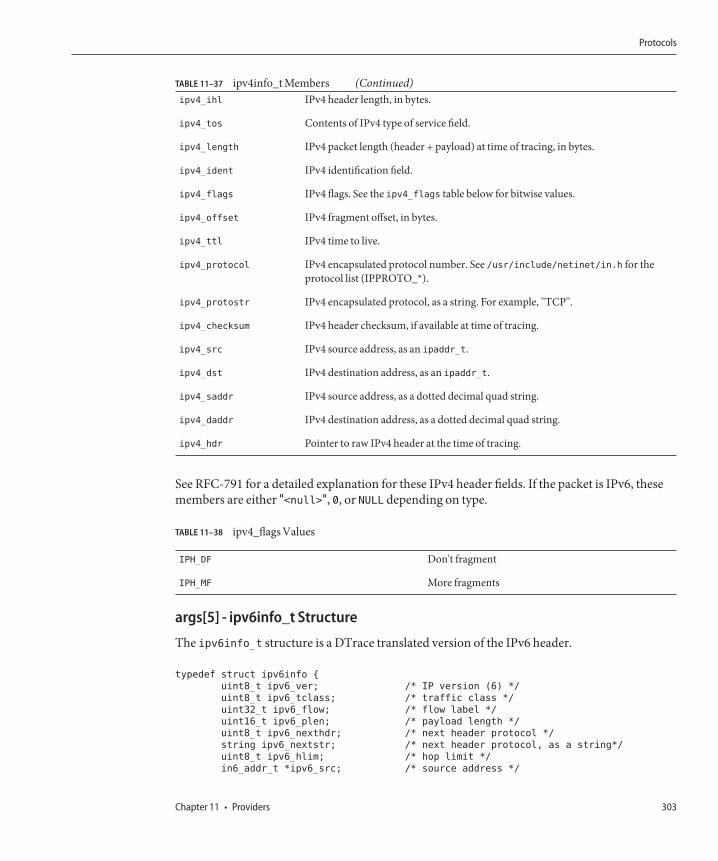
TABLE 11–37 ipv4info_t Members (Continued)ipv4_ihl IPv4 header length, in bytes.
ipv4_tos Contents of IPv4 type of service field.
ipv4_length IPv4 packet length (header + payload) at time of tracing, in bytes.
ipv4_ident IPv4 identification field.
ipv4_flags IPv4 flags. See the ipv4_flags table below for bitwise values.
ipv4_offset IPv4 fragment offset, in bytes.
ipv4_ttl IPv4 time to live.
ipv4_protocol IPv4 encapsulated protocol number. See /usr/include/netinet/in.h for theprotocol list (IPPROTO_*).
ipv4_protostr IPv4 encapsulated protocol, as a string. For example, "TCP".
ipv4_checksum IPv4 header checksum, if available at time of tracing.
ipv4_src IPv4 source address, as an ipaddr_t.
ipv4_dst IPv4 destination address, as an ipaddr_t.
ipv4_saddr IPv4 source address, as a dotted decimal quad string.
ipv4_daddr IPv4 destination address, as a dotted decimal quad string.
ipv4_hdr Pointer to raw IPv4 header at the time of tracing.
See RFC-791 for a detailed explanation for these IPv4 header fields. If the packet is IPv6, thesemembers are either "<null>", 0, or NULL depending on type.
TABLE 11–38 ipv4_flags Values
IPH_DF Don't fragment
IPH_MF More fragments
args[5] - ipv6info_t Structure
The ipv6info_t structure is a DTrace translated version of the IPv6 header.
typedef struct ipv6info {
uint8_t ipv6_ver; /* IP version (6) */
uint8_t ipv6_tclass; /* traffic class */
uint32_t ipv6_flow; /* flow label */
uint16_t ipv6_plen; /* payload length */
uint8_t ipv6_nexthdr; /* next header protocol */
string ipv6_nextstr; /* next header protocol, as a string*/
uint8_t ipv6_hlim; /* hop limit */
in6_addr_t *ipv6_src; /* source address */
Protocols
Chapter 11 • Providers 303
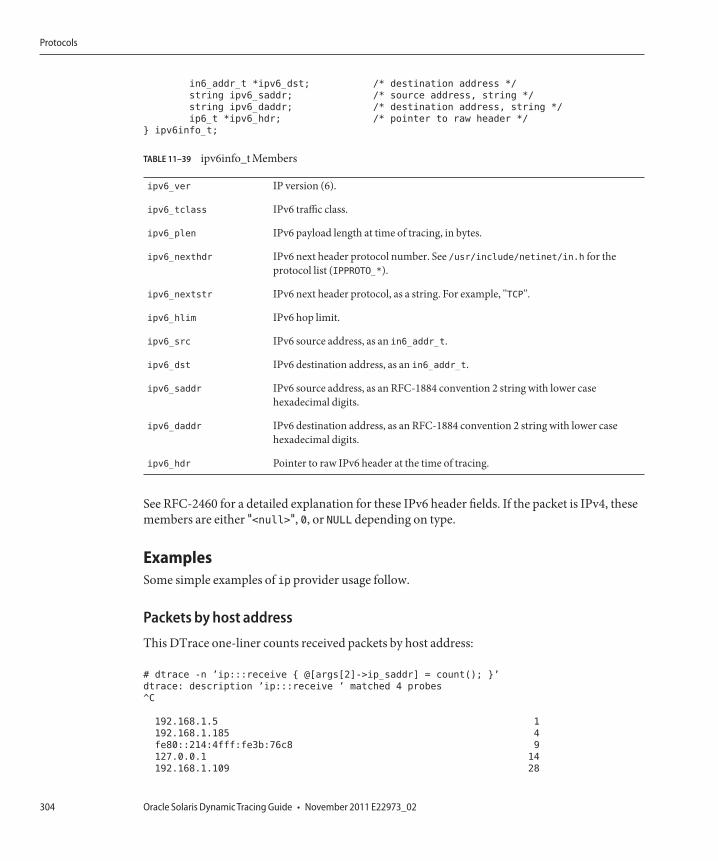
in6_addr_t *ipv6_dst; /* destination address */
string ipv6_saddr; /* source address, string */
string ipv6_daddr; /* destination address, string */
ip6_t *ipv6_hdr; /* pointer to raw header */
} ipv6info_t;
TABLE 11–39 ipv6info_t Members
ipv6_ver IP version (6).
ipv6_tclass IPv6 traffic class.
ipv6_plen IPv6 payload length at time of tracing, in bytes.
ipv6_nexthdr IPv6 next header protocol number. See /usr/include/netinet/in.h for theprotocol list (IPPROTO_*).
ipv6_nextstr IPv6 next header protocol, as a string. For example, "TCP".
ipv6_hlim IPv6 hop limit.
ipv6_src IPv6 source address, as an in6_addr_t.
ipv6_dst IPv6 destination address, as an in6_addr_t.
ipv6_saddr IPv6 source address, as an RFC-1884 convention 2 string with lower casehexadecimal digits.
ipv6_daddr IPv6 destination address, as an RFC-1884 convention 2 string with lower casehexadecimal digits.
ipv6_hdr Pointer to raw IPv6 header at the time of tracing.
See RFC-2460 for a detailed explanation for these IPv6 header fields. If the packet is IPv4, thesemembers are either "<null>", 0, or NULL depending on type.
ExamplesSome simple examples of ip provider usage follow.
Packets by host address
This DTrace one-liner counts received packets by host address:
# dtrace -n ’ip:::receive { @[args[2]->ip_saddr] = count(); }’
dtrace: description ’ip:::receive ’ matched 4 probes
^C
192.168.1.5 1
192.168.1.185 4
fe80::214:4fff:fe3b:76c8 9
127.0.0.1 14
192.168.1.109 28
Protocols
Oracle Solaris Dynamic Tracing Guide • November 2011 E22973_02304
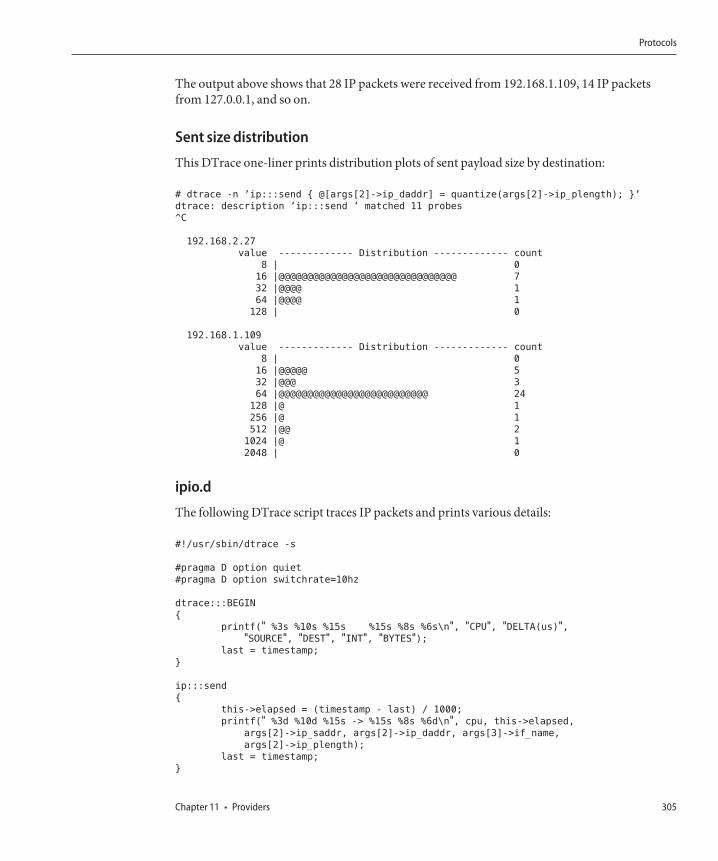
The output above shows that 28 IP packets were received from 192.168.1.109, 14 IP packetsfrom 127.0.0.1, and so on.
Sent size distribution
This DTrace one-liner prints distribution plots of sent payload size by destination:
# dtrace -n ’ip:::send { @[args[2]->ip_daddr] = quantize(args[2]->ip_plength); }’
dtrace: description ’ip:::send ’ matched 11 probes
^C
192.168.2.27
value ------------- Distribution ------------- count
8 | 0
16 |@@@@@@@@@@@@@@@@@@@@@@@@@@@@@@@ 7
32 |@@@@ 1
64 |@@@@ 1
128 | 0
192.168.1.109
value ------------- Distribution ------------- count
8 | 0
16 |@@@@@ 5
32 |@@@ 3
64 |@@@@@@@@@@@@@@@@@@@@@@@@@@ 24
128 |@ 1
256 |@ 1
512 |@@ 2
1024 |@ 1
2048 | 0
ipio.d
The following DTrace script traces IP packets and prints various details:
#!/usr/sbin/dtrace -s
#pragma D option quiet
#pragma D option switchrate=10hz
dtrace:::BEGIN
{
printf(" %3s %10s %15s %15s %8s %6s\n", "CPU", "DELTA(us)","SOURCE", "DEST", "INT", "BYTES");
last = timestamp;
}
ip:::send
{
this->elapsed = (timestamp - last) / 1000;
printf(" %3d %10d %15s -> %15s %8s %6d\n", cpu, this->elapsed,
args[2]->ip_saddr, args[2]->ip_daddr, args[3]->if_name,
args[2]->ip_plength);
last = timestamp;
}
Protocols
Chapter 11 • Providers 305
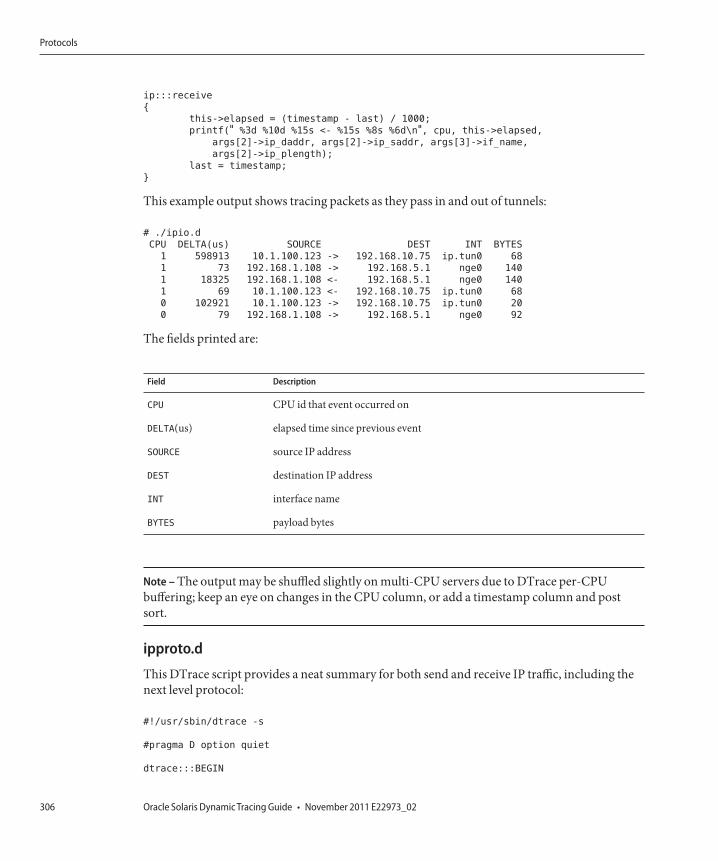
ip:::receive
{
this->elapsed = (timestamp - last) / 1000;
printf(" %3d %10d %15s <- %15s %8s %6d\n", cpu, this->elapsed,
args[2]->ip_daddr, args[2]->ip_saddr, args[3]->if_name,
args[2]->ip_plength);
last = timestamp;
}
This example output shows tracing packets as they pass in and out of tunnels:
# ./ipio.d
CPU DELTA(us) SOURCE DEST INT BYTES
1 598913 10.1.100.123 -> 192.168.10.75 ip.tun0 68
1 73 192.168.1.108 -> 192.168.5.1 nge0 140
1 18325 192.168.1.108 <- 192.168.5.1 nge0 140
1 69 10.1.100.123 <- 192.168.10.75 ip.tun0 68
0 102921 10.1.100.123 -> 192.168.10.75 ip.tun0 20
0 79 192.168.1.108 -> 192.168.5.1 nge0 92
The fields printed are:
Field Description
CPU CPU id that event occurred on
DELTA(us) elapsed time since previous event
SOURCE source IP address
DEST destination IP address
INT interface name
BYTES payload bytes
Note – The output may be shuffled slightly on multi-CPU servers due to DTrace per-CPUbuffering; keep an eye on changes in the CPU column, or add a timestamp column and postsort.
ipproto.d
This DTrace script provides a neat summary for both send and receive IP traffic, including thenext level protocol:
#!/usr/sbin/dtrace -s
#pragma D option quiet
dtrace:::BEGIN
Protocols
Oracle Solaris Dynamic Tracing Guide • November 2011 E22973_02306
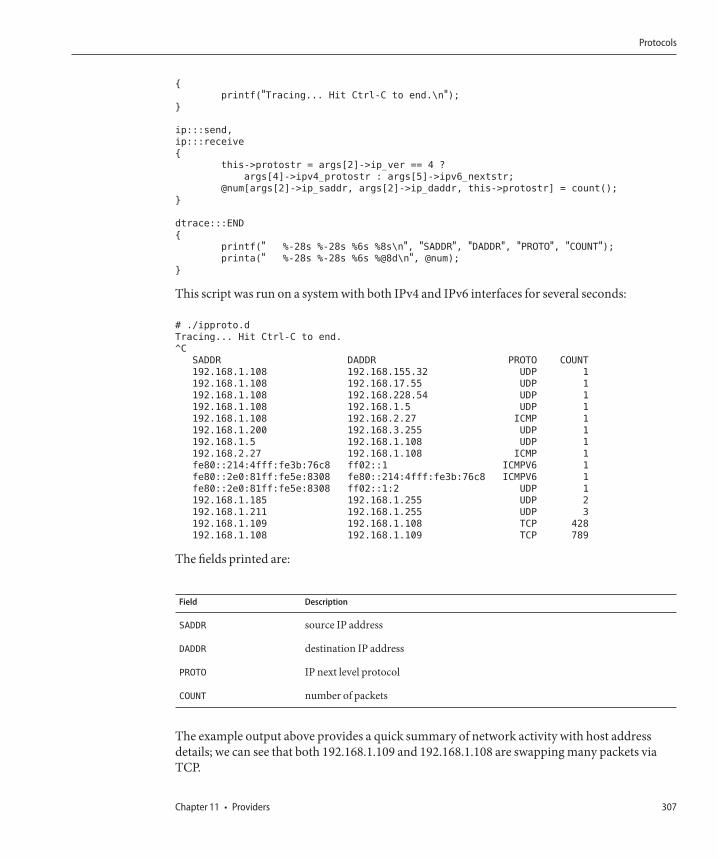
{
printf("Tracing... Hit Ctrl-C to end.\n");}
ip:::send,
ip:::receive
{
this->protostr = args[2]->ip_ver == 4 ?
args[4]->ipv4_protostr : args[5]->ipv6_nextstr;
@num[args[2]->ip_saddr, args[2]->ip_daddr, this->protostr] = count();
}
dtrace:::END
{
printf(" %-28s %-28s %6s %8s\n", "SADDR", "DADDR", "PROTO", "COUNT");printa(" %-28s %-28s %6s %@8d\n", @num);
}
This script was run on a system with both IPv4 and IPv6 interfaces for several seconds:
# ./ipproto.d
Tracing... Hit Ctrl-C to end.
^C
SADDR DADDR PROTO COUNT
192.168.1.108 192.168.155.32 UDP 1
192.168.1.108 192.168.17.55 UDP 1
192.168.1.108 192.168.228.54 UDP 1
192.168.1.108 192.168.1.5 UDP 1
192.168.1.108 192.168.2.27 ICMP 1
192.168.1.200 192.168.3.255 UDP 1
192.168.1.5 192.168.1.108 UDP 1
192.168.2.27 192.168.1.108 ICMP 1
fe80::214:4fff:fe3b:76c8 ff02::1 ICMPV6 1
fe80::2e0:81ff:fe5e:8308 fe80::214:4fff:fe3b:76c8 ICMPV6 1
fe80::2e0:81ff:fe5e:8308 ff02::1:2 UDP 1
192.168.1.185 192.168.1.255 UDP 2
192.168.1.211 192.168.1.255 UDP 3
192.168.1.109 192.168.1.108 TCP 428
192.168.1.108 192.168.1.109 TCP 789
The fields printed are:
Field Description
SADDR source IP address
DADDR destination IP address
PROTO IP next level protocol
COUNT number of packets
The example output above provides a quick summary of network activity with host addressdetails; we can see that both 192.168.1.109 and 192.168.1.108 are swapping many packets viaTCP.
Protocols
Chapter 11 • Providers 307
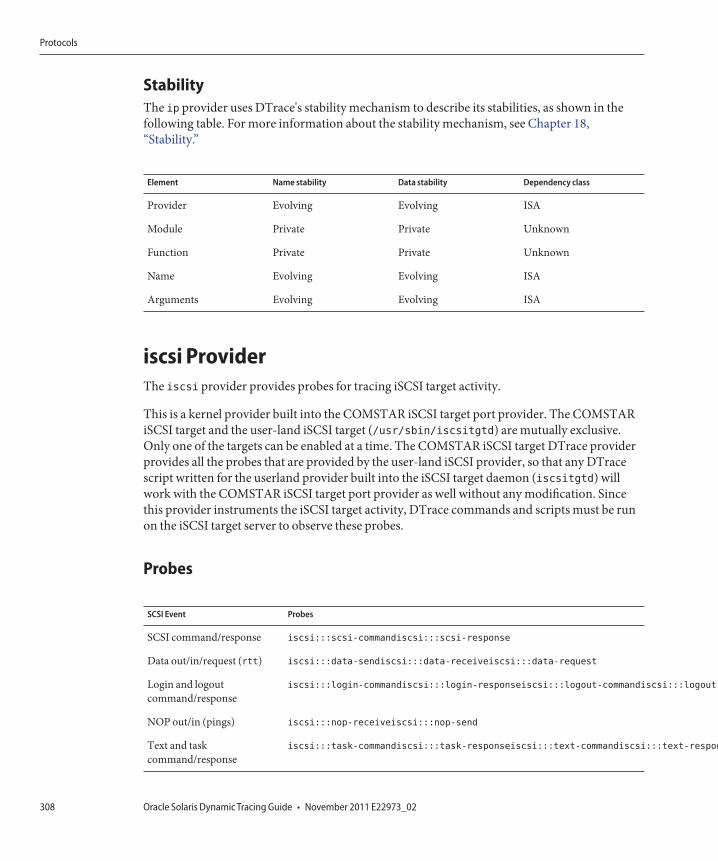
StabilityThe ip provider uses DTrace's stability mechanism to describe its stabilities, as shown in thefollowing table. For more information about the stability mechanism, see Chapter 18,“Stability.”
Element Name stability Data stability Dependency class
Provider Evolving Evolving ISA
Module Private Private Unknown
Function Private Private Unknown
Name Evolving Evolving ISA
Arguments Evolving Evolving ISA
iscsi ProviderThe iscsi provider provides probes for tracing iSCSI target activity.
This is a kernel provider built into the COMSTAR iSCSI target port provider. The COMSTARiSCSI target and the user-land iSCSI target (/usr/sbin/iscsitgtd) are mutually exclusive.Only one of the targets can be enabled at a time. The COMSTAR iSCSI target DTrace providerprovides all the probes that are provided by the user-land iSCSI provider, so that any DTracescript written for the userland provider built into the iSCSI target daemon (iscsitgtd) willwork with the COMSTAR iSCSI target port provider as well without any modification. Sincethis provider instruments the iSCSI target activity, DTrace commands and scripts must be runon the iSCSI target server to observe these probes.
Probes
SCSI Event Probes
SCSI command/response iscsi:::scsi-commandiscsi:::scsi-response
Data out/in/request (rtt) iscsi:::data-sendiscsi:::data-receiveiscsi:::data-request
Login and logoutcommand/response
iscsi:::login-commandiscsi:::login-responseiscsi:::logout-commandiscsi:::logout-response
NOP out/in (pings) iscsi:::nop-receiveiscsi:::nop-send
Text and taskcommand/response
iscsi:::task-commandiscsi:::task-responseiscsi:::text-commandiscsi:::text-response
Protocols
Oracle Solaris Dynamic Tracing Guide • November 2011 E22973_02308
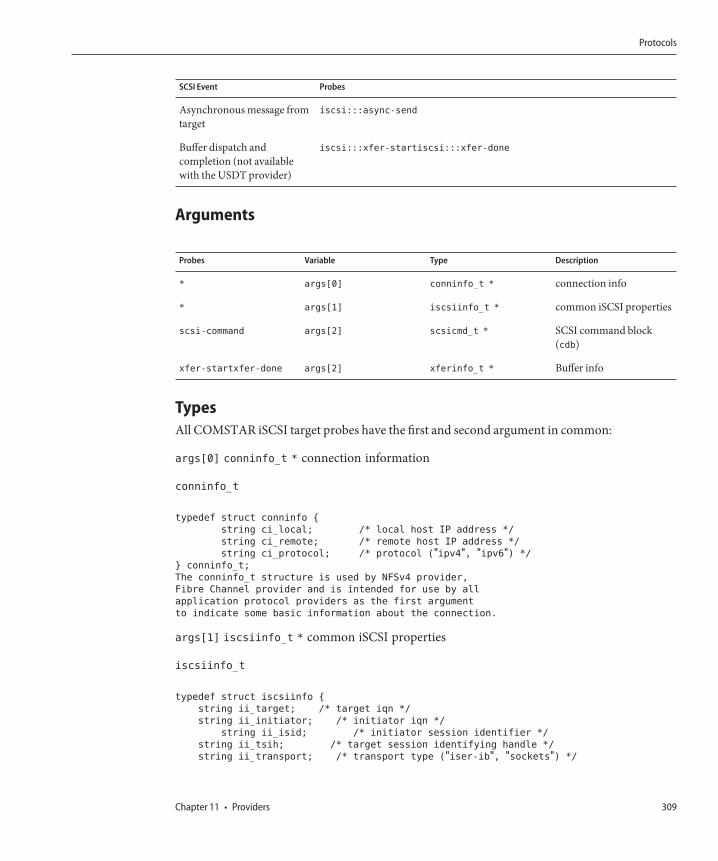
SCSI Event Probes
Asynchronous message fromtarget
iscsi:::async-send
Buffer dispatch andcompletion (not availablewith the USDT provider)
iscsi:::xfer-startiscsi:::xfer-done
Arguments
Probes Variable Type Description
* args[0] conninfo_t * connection info
* args[1] iscsiinfo_t * common iSCSI properties
scsi-command args[2] scsicmd_t * SCSI command block(cdb)
xfer-startxfer-done args[2] xferinfo_t * Buffer info
TypesAll COMSTAR iSCSI target probes have the first and second argument in common:
args[0] conninfo_t * connection information
conninfo_t
typedef struct conninfo {
string ci_local; /* local host IP address */
string ci_remote; /* remote host IP address */
string ci_protocol; /* protocol ("ipv4", "ipv6") */
} conninfo_t;
The conninfo_t structure is used by NFSv4 provider,
Fibre Channel provider and is intended for use by all
application protocol providers as the first argument
to indicate some basic information about the connection.
args[1] iscsiinfo_t * common iSCSI properties
iscsiinfo_t
typedef struct iscsiinfo {
string ii_target; /* target iqn */
string ii_initiator; /* initiator iqn */
string ii_isid; /* initiator session identifier */
string ii_tsih; /* target session identifying handle */
string ii_transport; /* transport type ("iser-ib", "sockets") */
Protocols
Chapter 11 • Providers 309
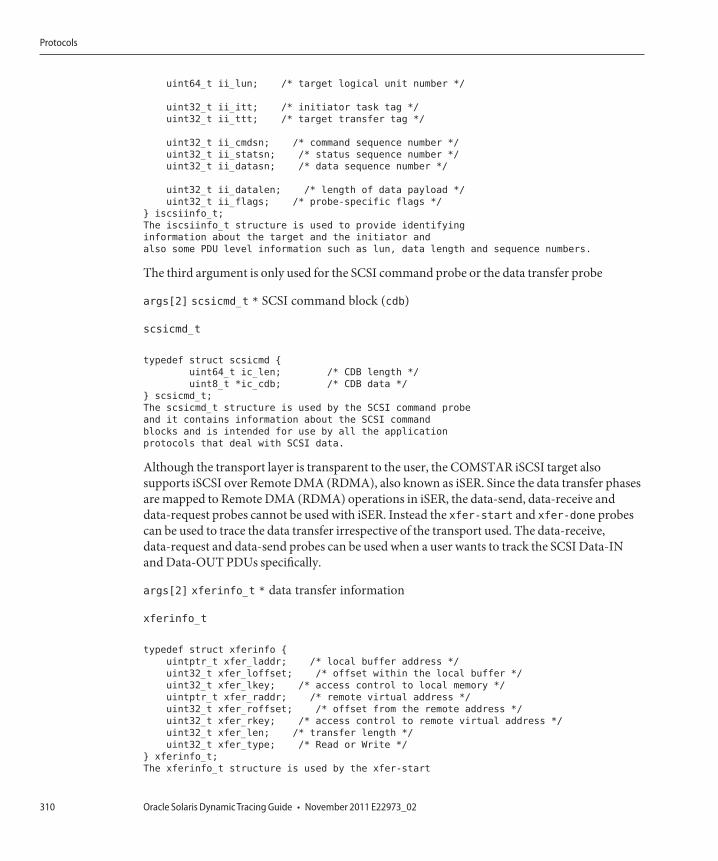
uint64_t ii_lun; /* target logical unit number */
uint32_t ii_itt; /* initiator task tag */
uint32_t ii_ttt; /* target transfer tag */
uint32_t ii_cmdsn; /* command sequence number */
uint32_t ii_statsn; /* status sequence number */
uint32_t ii_datasn; /* data sequence number */
uint32_t ii_datalen; /* length of data payload */
uint32_t ii_flags; /* probe-specific flags */
} iscsiinfo_t;
The iscsiinfo_t structure is used to provide identifying
information about the target and the initiator and
also some PDU level information such as lun, data length and sequence numbers.
The third argument is only used for the SCSI command probe or the data transfer probe
args[2] scsicmd_t * SCSI command block (cdb)
scsicmd_t
typedef struct scsicmd {
uint64_t ic_len; /* CDB length */
uint8_t *ic_cdb; /* CDB data */
} scsicmd_t;
The scsicmd_t structure is used by the SCSI command probe
and it contains information about the SCSI command
blocks and is intended for use by all the application
protocols that deal with SCSI data.
Although the transport layer is transparent to the user, the COMSTAR iSCSI target alsosupports iSCSI over Remote DMA (RDMA), also known as iSER. Since the data transfer phasesare mapped to Remote DMA (RDMA) operations in iSER, the data-send, data-receive anddata-request probes cannot be used with iSER. Instead the xfer-start and xfer-done probescan be used to trace the data transfer irrespective of the transport used. The data-receive,data-request and data-send probes can be used when a user wants to track the SCSI Data-INand Data-OUT PDUs specifically.
args[2] xferinfo_t * data transfer information
xferinfo_t
typedef struct xferinfo {
uintptr_t xfer_laddr; /* local buffer address */
uint32_t xfer_loffset; /* offset within the local buffer */
uint32_t xfer_lkey; /* access control to local memory */
uintptr_t xfer_raddr; /* remote virtual address */
uint32_t xfer_roffset; /* offset from the remote address */
uint32_t xfer_rkey; /* access control to remote virtual address */
uint32_t xfer_len; /* transfer length */
uint32_t xfer_type; /* Read or Write */
} xferinfo_t;
The xferinfo_t structure is used by the xfer-start
Protocols
Oracle Solaris Dynamic Tracing Guide • November 2011 E22973_02310
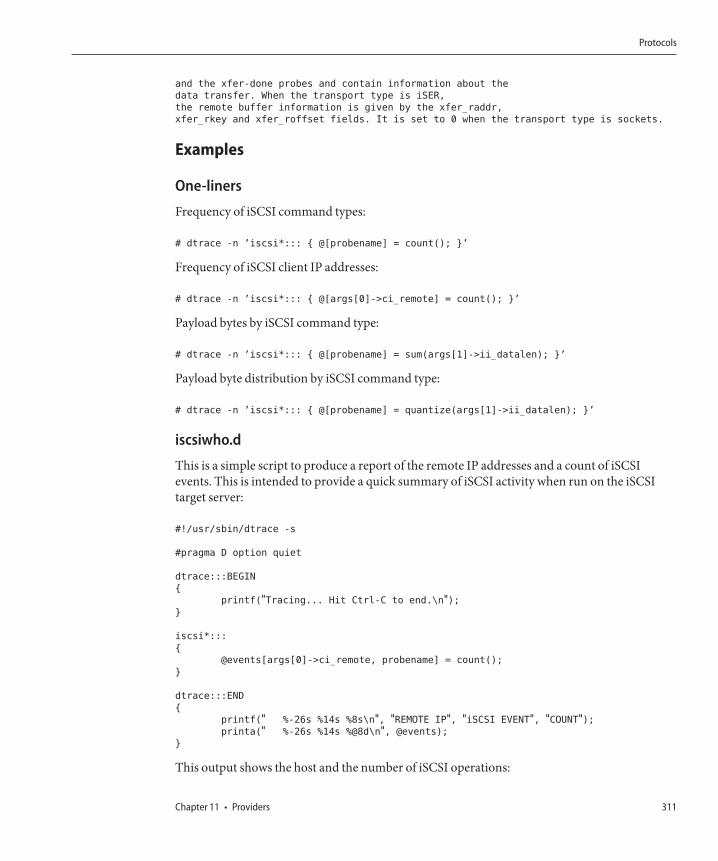
and the xfer-done probes and contain information about the
data transfer. When the transport type is iSER,
the remote buffer information is given by the xfer_raddr,
xfer_rkey and xfer_roffset fields. It is set to 0 when the transport type is sockets.
Examples
One-liners
Frequency of iSCSI command types:
# dtrace -n ’iscsi*::: { @[probename] = count(); }’
Frequency of iSCSI client IP addresses:
# dtrace -n ’iscsi*::: { @[args[0]->ci_remote] = count(); }’
Payload bytes by iSCSI command type:
# dtrace -n ’iscsi*::: { @[probename] = sum(args[1]->ii_datalen); }’
Payload byte distribution by iSCSI command type:
# dtrace -n ’iscsi*::: { @[probename] = quantize(args[1]->ii_datalen); }’
iscsiwho.d
This is a simple script to produce a report of the remote IP addresses and a count of iSCSIevents. This is intended to provide a quick summary of iSCSI activity when run on the iSCSItarget server:
#!/usr/sbin/dtrace -s
#pragma D option quiet
dtrace:::BEGIN
{
printf("Tracing... Hit Ctrl-C to end.\n");}
iscsi*:::
{
@events[args[0]->ci_remote, probename] = count();
}
dtrace:::END
{
printf(" %-26s %14s %8s\n", "REMOTE IP", "iSCSI EVENT", "COUNT");printa(" %-26s %14s %@8d\n", @events);
}
This output shows the host and the number of iSCSI operations:
Protocols
Chapter 11 • Providers 311
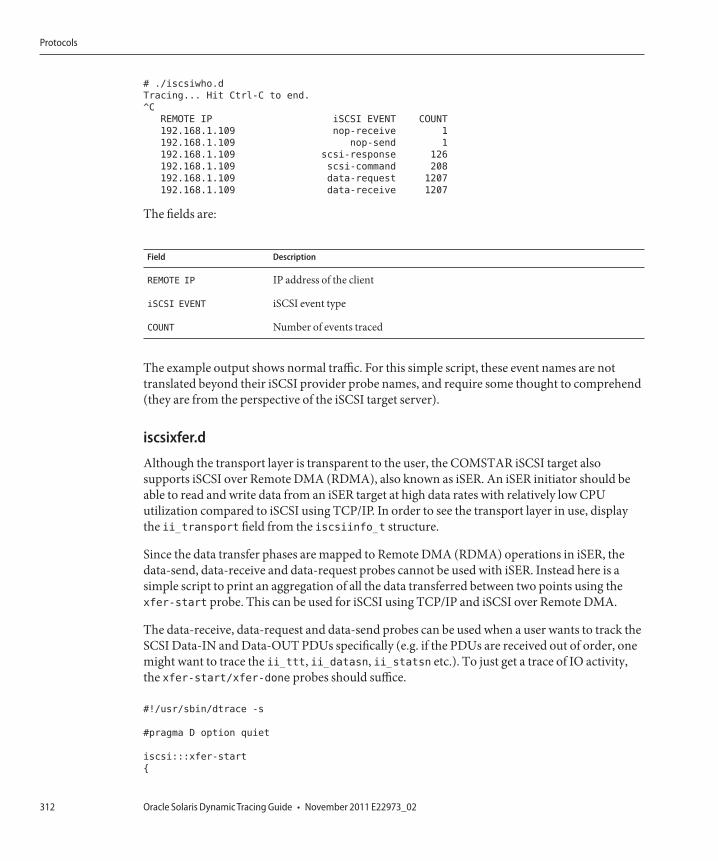
# ./iscsiwho.d
Tracing... Hit Ctrl-C to end.
^C
REMOTE IP iSCSI EVENT COUNT
192.168.1.109 nop-receive 1
192.168.1.109 nop-send 1
192.168.1.109 scsi-response 126
192.168.1.109 scsi-command 208
192.168.1.109 data-request 1207
192.168.1.109 data-receive 1207
The fields are:
Field Description
REMOTE IP IP address of the client
iSCSI EVENT iSCSI event type
COUNT Number of events traced
The example output shows normal traffic. For this simple script, these event names are nottranslated beyond their iSCSI provider probe names, and require some thought to comprehend(they are from the perspective of the iSCSI target server).
iscsixfer.d
Although the transport layer is transparent to the user, the COMSTAR iSCSI target alsosupports iSCSI over Remote DMA (RDMA), also known as iSER. An iSER initiator should beable to read and write data from an iSER target at high data rates with relatively low CPUutilization compared to iSCSI using TCP/IP. In order to see the transport layer in use, displaythe ii_transport field from the iscsiinfo_t structure.
Since the data transfer phases are mapped to Remote DMA (RDMA) operations in iSER, thedata-send, data-receive and data-request probes cannot be used with iSER. Instead here is asimple script to print an aggregation of all the data transferred between two points using thexfer-start probe. This can be used for iSCSI using TCP/IP and iSCSI over Remote DMA.
The data-receive, data-request and data-send probes can be used when a user wants to track theSCSI Data-IN and Data-OUT PDUs specifically (e.g. if the PDUs are received out of order, onemight want to trace the ii_ttt, ii_datasn, ii_statsn etc.). To just get a trace of IO activity,the xfer-start/xfer-done probes should suffice.
#!/usr/sbin/dtrace -s
#pragma D option quiet
iscsi:::xfer-start
{
Protocols
Oracle Solaris Dynamic Tracing Guide • November 2011 E22973_02312
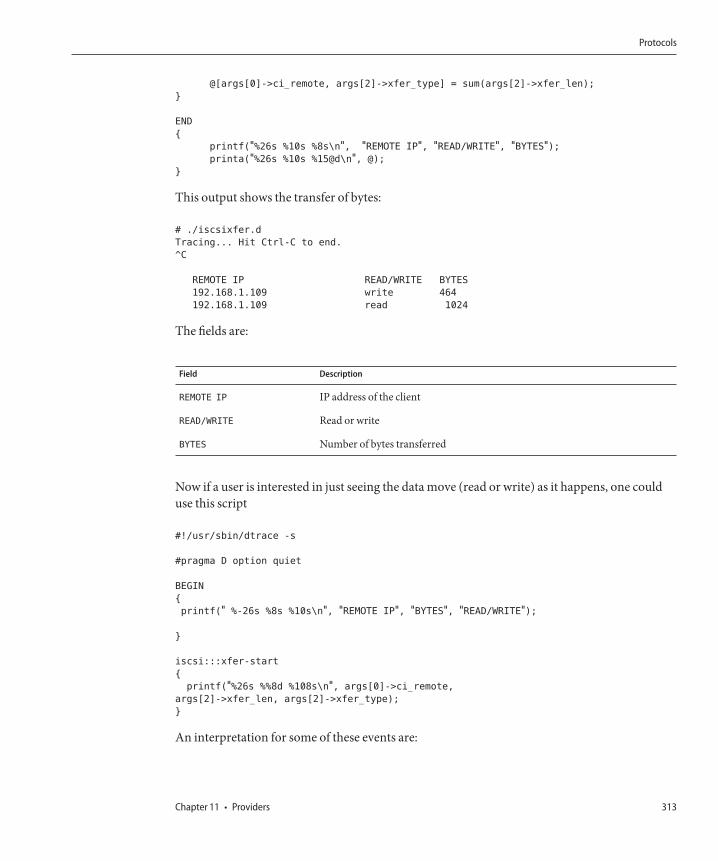
@[args[0]->ci_remote, args[2]->xfer_type] = sum(args[2]->xfer_len);
}
END
{
printf("%26s %10s %8s\n", "REMOTE IP", "READ/WRITE", "BYTES");printa("%26s %10s %15@d\n", @);
}
This output shows the transfer of bytes:
# ./iscsixfer.d
Tracing... Hit Ctrl-C to end.
^C
REMOTE IP READ/WRITE BYTES
192.168.1.109 write 464
192.168.1.109 read 1024
The fields are:
Field Description
REMOTE IP IP address of the client
READ/WRITE Read or write
BYTES Number of bytes transferred
Now if a user is interested in just seeing the data move (read or write) as it happens, one coulduse this script
#!/usr/sbin/dtrace -s
#pragma D option quiet
BEGIN
{
printf(" %-26s %8s %10s\n", "REMOTE IP", "BYTES", "READ/WRITE");
}
iscsi:::xfer-start
{
printf("%26s %%8d %108s\n", args[0]->ci_remote,
args[2]->xfer_len, args[2]->xfer_type);
}
An interpretation for some of these events are:
Protocols
Chapter 11 • Providers 313
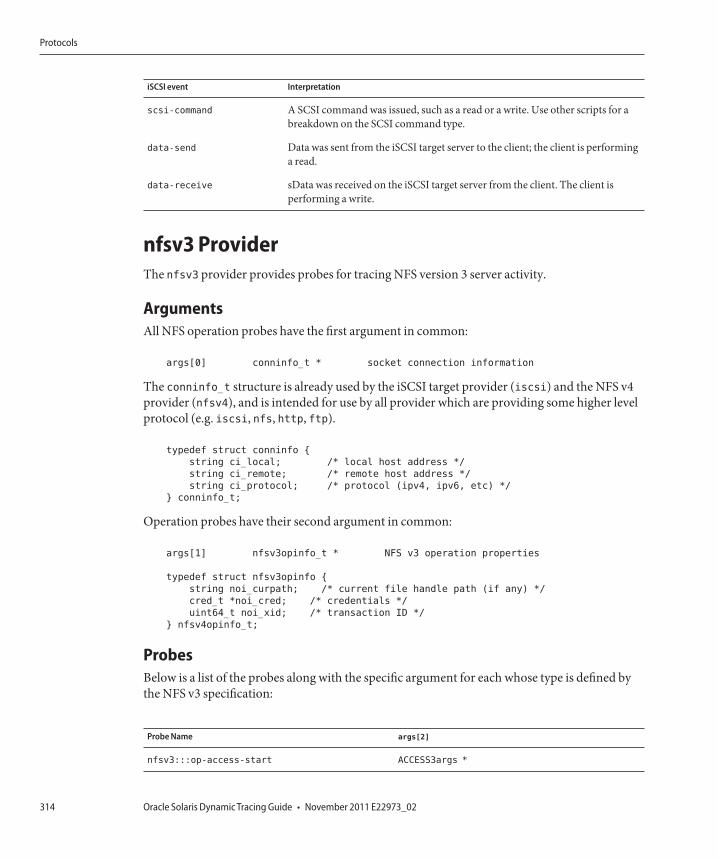
iSCSI event Interpretation
scsi-command A SCSI command was issued, such as a read or a write. Use other scripts for abreakdown on the SCSI command type.
data-send Data was sent from the iSCSI target server to the client; the client is performinga read.
data-receive sData was received on the iSCSI target server from the client. The client isperforming a write.
nfsv3 ProviderThe nfsv3 provider provides probes for tracing NFS version 3 server activity.
ArgumentsAll NFS operation probes have the first argument in common:
args[0] conninfo_t * socket connection information
The conninfo_t structure is already used by the iSCSI target provider (iscsi) and the NFS v4provider (nfsv4), and is intended for use by all provider which are providing some higher levelprotocol (e.g. iscsi, nfs, http, ftp).
typedef struct conninfo {
string ci_local; /* local host address */
string ci_remote; /* remote host address */
string ci_protocol; /* protocol (ipv4, ipv6, etc) */
} conninfo_t;
Operation probes have their second argument in common:
args[1] nfsv3opinfo_t * NFS v3 operation properties
typedef struct nfsv3opinfo {
string noi_curpath; /* current file handle path (if any) */
cred_t *noi_cred; /* credentials */
uint64_t noi_xid; /* transaction ID */
} nfsv4opinfo_t;
ProbesBelow is a list of the probes along with the specific argument for each whose type is defined bythe NFS v3 specification:
Probe Name args[2]
nfsv3:::op-access-start ACCESS3args *
Protocols
Oracle Solaris Dynamic Tracing Guide • November 2011 E22973_02314
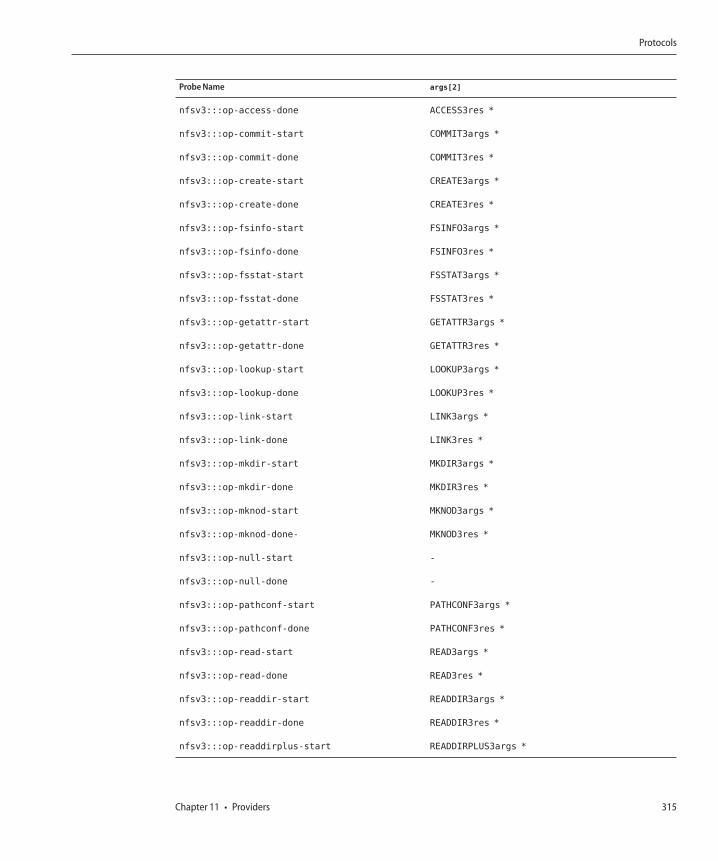
Probe Name args[2]
nfsv3:::op-access-done ACCESS3res *
nfsv3:::op-commit-start COMMIT3args *
nfsv3:::op-commit-done COMMIT3res *
nfsv3:::op-create-start CREATE3args *
nfsv3:::op-create-done CREATE3res *
nfsv3:::op-fsinfo-start FSINFO3args *
nfsv3:::op-fsinfo-done FSINFO3res *
nfsv3:::op-fsstat-start FSSTAT3args *
nfsv3:::op-fsstat-done FSSTAT3res *
nfsv3:::op-getattr-start GETATTR3args *
nfsv3:::op-getattr-done GETATTR3res *
nfsv3:::op-lookup-start LOOKUP3args *
nfsv3:::op-lookup-done LOOKUP3res *
nfsv3:::op-link-start LINK3args *
nfsv3:::op-link-done LINK3res *
nfsv3:::op-mkdir-start MKDIR3args *
nfsv3:::op-mkdir-done MKDIR3res *
nfsv3:::op-mknod-start MKNOD3args *
nfsv3:::op-mknod-done- MKNOD3res *
nfsv3:::op-null-start -
nfsv3:::op-null-done -
nfsv3:::op-pathconf-start PATHCONF3args *
nfsv3:::op-pathconf-done PATHCONF3res *
nfsv3:::op-read-start READ3args *
nfsv3:::op-read-done READ3res *
nfsv3:::op-readdir-start READDIR3args *
nfsv3:::op-readdir-done READDIR3res *
nfsv3:::op-readdirplus-start READDIRPLUS3args *
Protocols
Chapter 11 • Providers 315
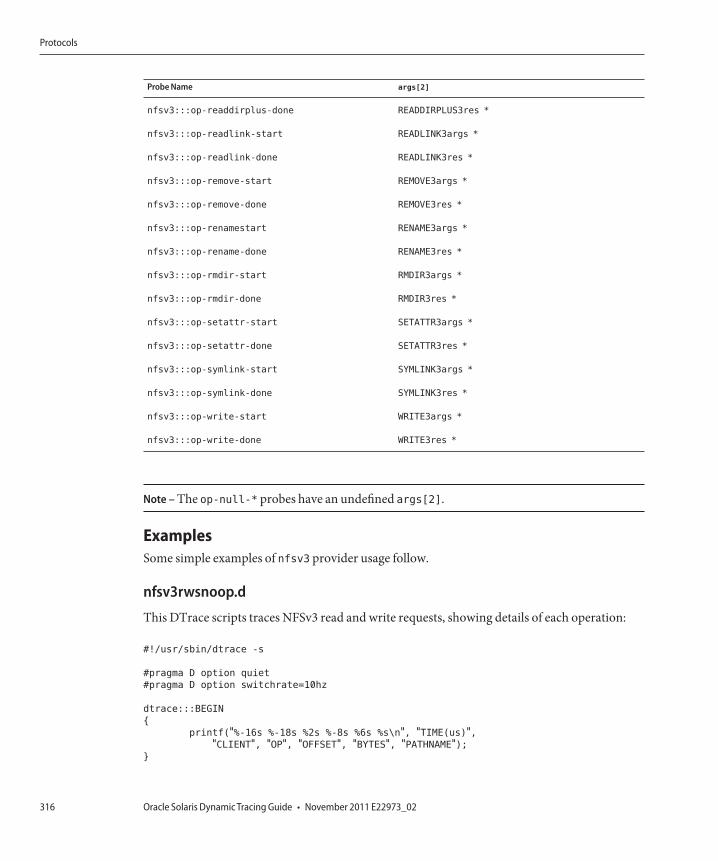
Probe Name args[2]
nfsv3:::op-readdirplus-done READDIRPLUS3res *
nfsv3:::op-readlink-start READLINK3args *
nfsv3:::op-readlink-done READLINK3res *
nfsv3:::op-remove-start REMOVE3args *
nfsv3:::op-remove-done REMOVE3res *
nfsv3:::op-renamestart RENAME3args *
nfsv3:::op-rename-done RENAME3res *
nfsv3:::op-rmdir-start RMDIR3args *
nfsv3:::op-rmdir-done RMDIR3res *
nfsv3:::op-setattr-start SETATTR3args *
nfsv3:::op-setattr-done SETATTR3res *
nfsv3:::op-symlink-start SYMLINK3args *
nfsv3:::op-symlink-done SYMLINK3res *
nfsv3:::op-write-start WRITE3args *
nfsv3:::op-write-done WRITE3res *
Note – The op-null-* probes have an undefined args[2].
ExamplesSome simple examples of nfsv3 provider usage follow.
nfsv3rwsnoop.d
This DTrace scripts traces NFSv3 read and write requests, showing details of each operation:
#!/usr/sbin/dtrace -s
#pragma D option quiet
#pragma D option switchrate=10hz
dtrace:::BEGIN
{
printf("%-16s %-18s %2s %-8s %6s %s\n", "TIME(us)","CLIENT", "OP", "OFFSET", "BYTES", "PATHNAME");
}
Protocols
Oracle Solaris Dynamic Tracing Guide • November 2011 E22973_02316
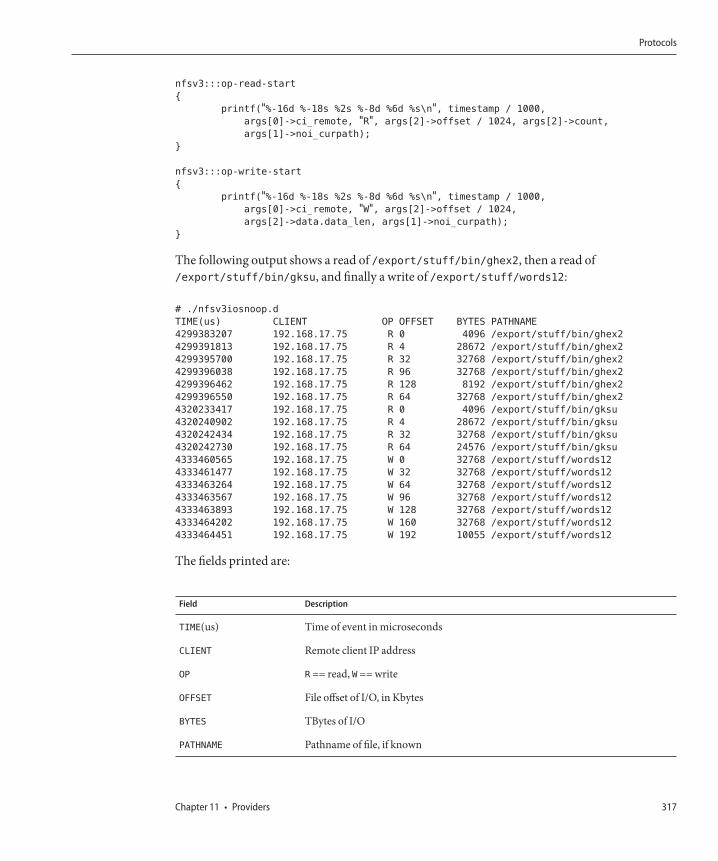
nfsv3:::op-read-start
{
printf("%-16d %-18s %2s %-8d %6d %s\n", timestamp / 1000,
args[0]->ci_remote, "R", args[2]->offset / 1024, args[2]->count,
args[1]->noi_curpath);
}
nfsv3:::op-write-start
{
printf("%-16d %-18s %2s %-8d %6d %s\n", timestamp / 1000,
args[0]->ci_remote, "W", args[2]->offset / 1024,
args[2]->data.data_len, args[1]->noi_curpath);
}
The following output shows a read of /export/stuff/bin/ghex2, then a read of/export/stuff/bin/gksu, and finally a write of /export/stuff/words12:
# ./nfsv3iosnoop.d
TIME(us) CLIENT OP OFFSET BYTES PATHNAME
4299383207 192.168.17.75 R 0 4096 /export/stuff/bin/ghex2
4299391813 192.168.17.75 R 4 28672 /export/stuff/bin/ghex2
4299395700 192.168.17.75 R 32 32768 /export/stuff/bin/ghex2
4299396038 192.168.17.75 R 96 32768 /export/stuff/bin/ghex2
4299396462 192.168.17.75 R 128 8192 /export/stuff/bin/ghex2
4299396550 192.168.17.75 R 64 32768 /export/stuff/bin/ghex2
4320233417 192.168.17.75 R 0 4096 /export/stuff/bin/gksu
4320240902 192.168.17.75 R 4 28672 /export/stuff/bin/gksu
4320242434 192.168.17.75 R 32 32768 /export/stuff/bin/gksu
4320242730 192.168.17.75 R 64 24576 /export/stuff/bin/gksu
4333460565 192.168.17.75 W 0 32768 /export/stuff/words12
4333461477 192.168.17.75 W 32 32768 /export/stuff/words12
4333463264 192.168.17.75 W 64 32768 /export/stuff/words12
4333463567 192.168.17.75 W 96 32768 /export/stuff/words12
4333463893 192.168.17.75 W 128 32768 /export/stuff/words12
4333464202 192.168.17.75 W 160 32768 /export/stuff/words12
4333464451 192.168.17.75 W 192 10055 /export/stuff/words12
The fields printed are:
Field Description
TIME(us) Time of event in microseconds
CLIENT Remote client IP address
OP R == read, W == write
OFFSET File offset of I/O, in Kbytes
BYTES TBytes of I/O
PATHNAME Pathname of file, if known
Protocols
Chapter 11 • Providers 317
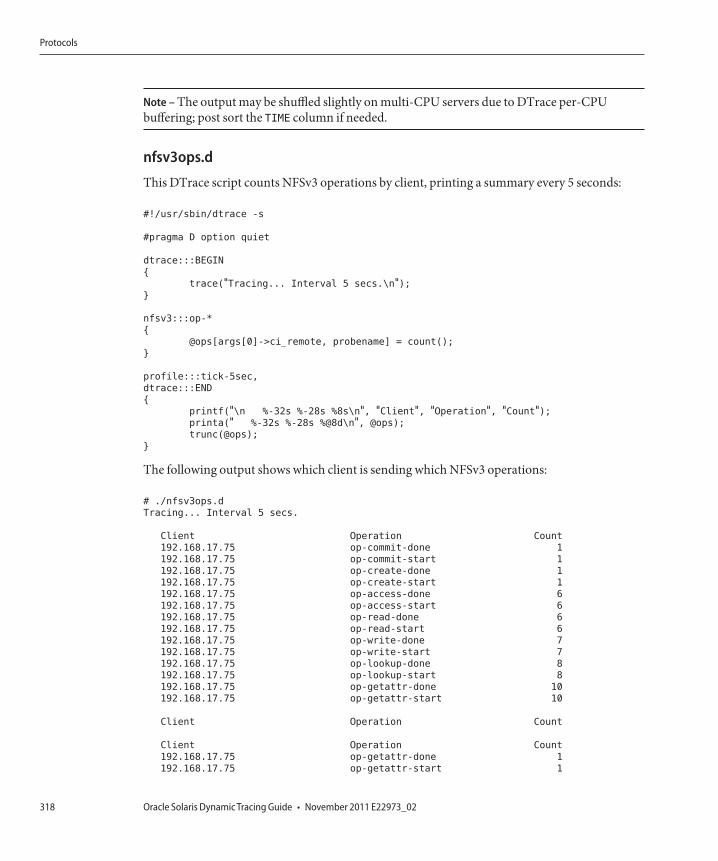
Note – The output may be shuffled slightly on multi-CPU servers due to DTrace per-CPUbuffering; post sort the TIME column if needed.
nfsv3ops.d
This DTrace script counts NFSv3 operations by client, printing a summary every 5 seconds:
#!/usr/sbin/dtrace -s
#pragma D option quiet
dtrace:::BEGIN
{
trace("Tracing... Interval 5 secs.\n");}
nfsv3:::op-*
{
@ops[args[0]->ci_remote, probename] = count();
}
profile:::tick-5sec,
dtrace:::END
{
printf("\n %-32s %-28s %8s\n", "Client", "Operation", "Count");printa(" %-32s %-28s %@8d\n", @ops);
trunc(@ops);
}
The following output shows which client is sending which NFSv3 operations:
# ./nfsv3ops.d
Tracing... Interval 5 secs.
Client Operation Count
192.168.17.75 op-commit-done 1
192.168.17.75 op-commit-start 1
192.168.17.75 op-create-done 1
192.168.17.75 op-create-start 1
192.168.17.75 op-access-done 6
192.168.17.75 op-access-start 6
192.168.17.75 op-read-done 6
192.168.17.75 op-read-start 6
192.168.17.75 op-write-done 7
192.168.17.75 op-write-start 7
192.168.17.75 op-lookup-done 8
192.168.17.75 op-lookup-start 8
192.168.17.75 op-getattr-done 10
192.168.17.75 op-getattr-start 10
Client Operation Count
Client Operation Count
192.168.17.75 op-getattr-done 1
192.168.17.75 op-getattr-start 1
Protocols
Oracle Solaris Dynamic Tracing Guide • November 2011 E22973_02318
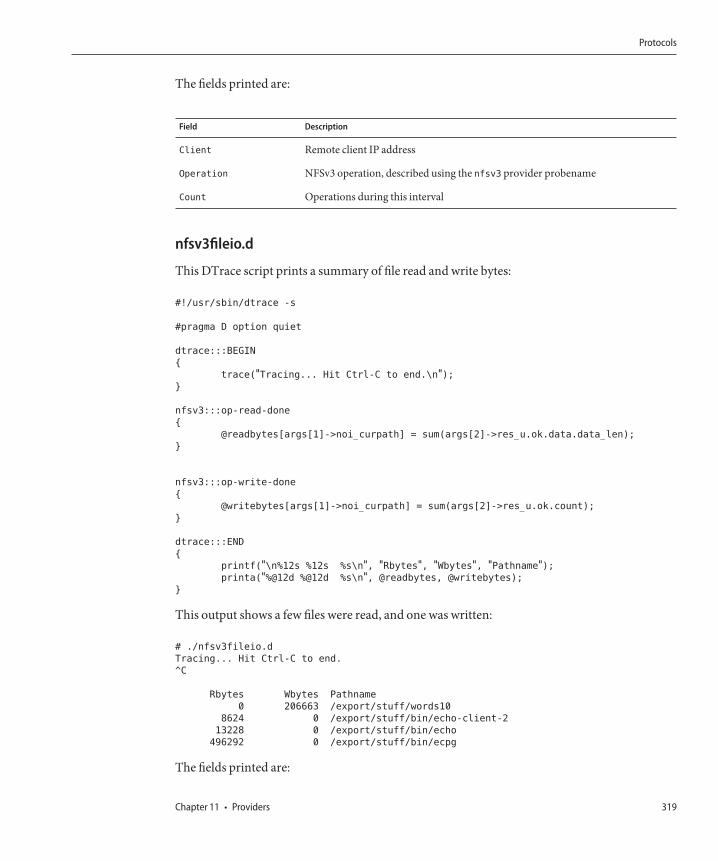
The fields printed are:
Field Description
Client Remote client IP address
Operation NFSv3 operation, described using the nfsv3 provider probename
Count Operations during this interval
nfsv3fileio.d
This DTrace script prints a summary of file read and write bytes:
#!/usr/sbin/dtrace -s
#pragma D option quiet
dtrace:::BEGIN
{
trace("Tracing... Hit Ctrl-C to end.\n");}
nfsv3:::op-read-done
{
@readbytes[args[1]->noi_curpath] = sum(args[2]->res_u.ok.data.data_len);
}
nfsv3:::op-write-done
{
@writebytes[args[1]->noi_curpath] = sum(args[2]->res_u.ok.count);
}
dtrace:::END
{
printf("\n%12s %12s %s\n", "Rbytes", "Wbytes", "Pathname");printa("%@12d %@12d %s\n", @readbytes, @writebytes);
}
This output shows a few files were read, and one was written:
# ./nfsv3fileio.d
Tracing... Hit Ctrl-C to end.
^C
Rbytes Wbytes Pathname
0 206663 /export/stuff/words10
8624 0 /export/stuff/bin/echo-client-2
13228 0 /export/stuff/bin/echo
496292 0 /export/stuff/bin/ecpg
The fields printed are:
Protocols
Chapter 11 • Providers 319
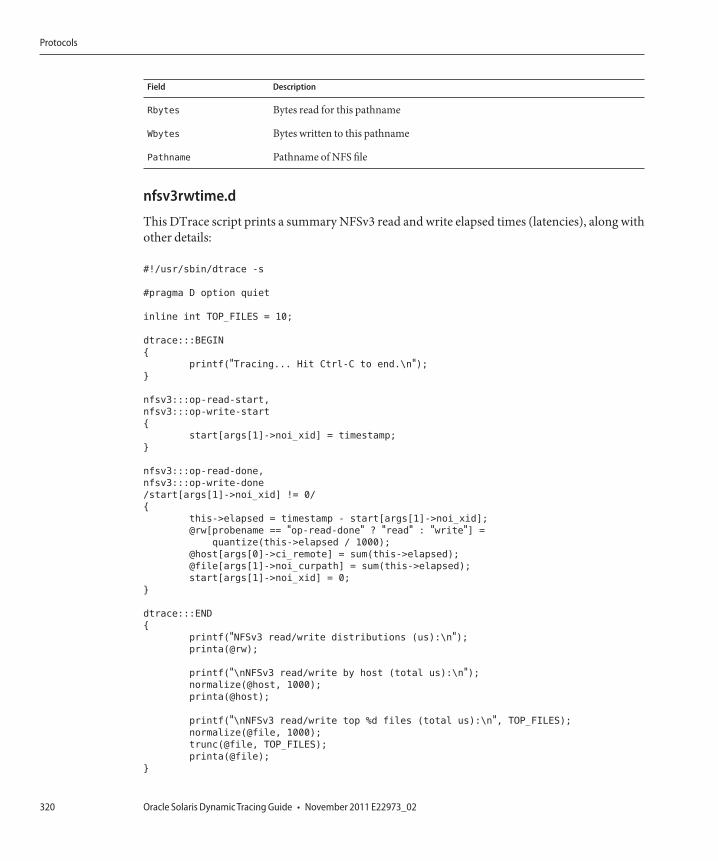
Field Description
Rbytes Bytes read for this pathname
Wbytes Bytes written to this pathname
Pathname Pathname of NFS file
nfsv3rwtime.d
This DTrace script prints a summary NFSv3 read and write elapsed times (latencies), along withother details:
#!/usr/sbin/dtrace -s
#pragma D option quiet
inline int TOP_FILES = 10;
dtrace:::BEGIN
{
printf("Tracing... Hit Ctrl-C to end.\n");}
nfsv3:::op-read-start,
nfsv3:::op-write-start
{
start[args[1]->noi_xid] = timestamp;
}
nfsv3:::op-read-done,
nfsv3:::op-write-done
/start[args[1]->noi_xid] != 0/
{
this->elapsed = timestamp - start[args[1]->noi_xid];
@rw[probename == "op-read-done" ? "read" : "write"] =
quantize(this->elapsed / 1000);
@host[args[0]->ci_remote] = sum(this->elapsed);
@file[args[1]->noi_curpath] = sum(this->elapsed);
start[args[1]->noi_xid] = 0;
}
dtrace:::END
{
printf("NFSv3 read/write distributions (us):\n");printa(@rw);
printf("\nNFSv3 read/write by host (total us):\n");normalize(@host, 1000);
printa(@host);
printf("\nNFSv3 read/write top %d files (total us):\n", TOP_FILES);
normalize(@file, 1000);
trunc(@file, TOP_FILES);
printa(@file);
}
Protocols
Oracle Solaris Dynamic Tracing Guide • November 2011 E22973_02320
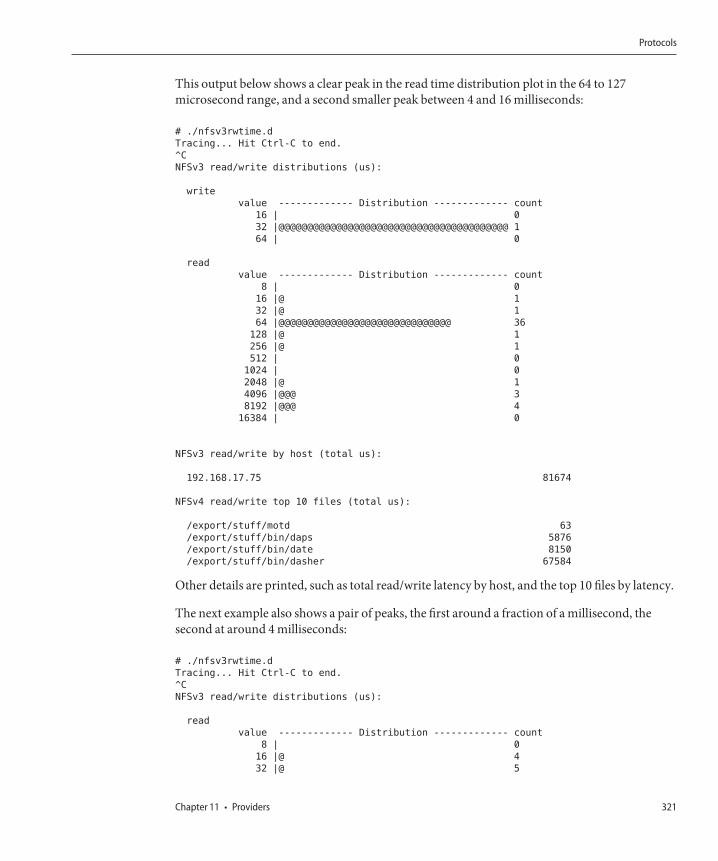
This output below shows a clear peak in the read time distribution plot in the 64 to 127microsecond range, and a second smaller peak between 4 and 16 milliseconds:
# ./nfsv3rwtime.d
Tracing... Hit Ctrl-C to end.
^C
NFSv3 read/write distributions (us):
write
value ------------- Distribution ------------- count
16 | 0
32 |@@@@@@@@@@@@@@@@@@@@@@@@@@@@@@@@@@@@@@@@ 1
64 | 0
read
value ------------- Distribution ------------- count
8 | 0
16 |@ 1
32 |@ 1
64 |@@@@@@@@@@@@@@@@@@@@@@@@@@@@@@ 36
128 |@ 1
256 |@ 1
512 | 0
1024 | 0
2048 |@ 1
4096 |@@@ 3
8192 |@@@ 4
16384 | 0
NFSv3 read/write by host (total us):
192.168.17.75 81674
NFSv4 read/write top 10 files (total us):
/export/stuff/motd 63
/export/stuff/bin/daps 5876
/export/stuff/bin/date 8150
/export/stuff/bin/dasher 67584
Other details are printed, such as total read/write latency by host, and the top 10 files by latency.
The next example also shows a pair of peaks, the first around a fraction of a millisecond, thesecond at around 4 milliseconds:
# ./nfsv3rwtime.d
Tracing... Hit Ctrl-C to end.
^C
NFSv3 read/write distributions (us):
read
value ------------- Distribution ------------- count
8 | 0
16 |@ 4
32 |@ 5
Protocols
Chapter 11 • Providers 321
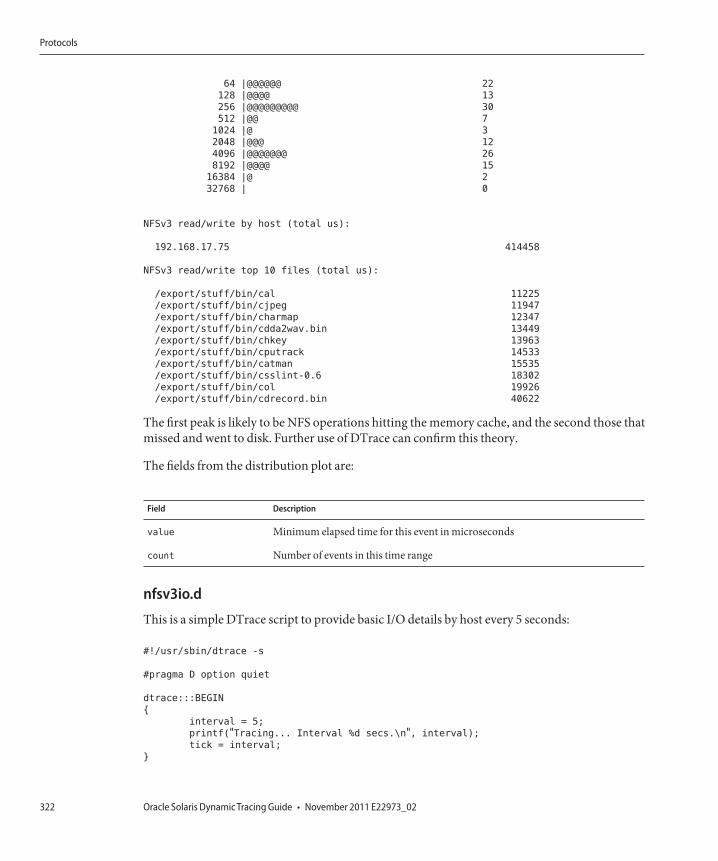
64 |@@@@@@ 22
128 |@@@@ 13
256 |@@@@@@@@@ 30
512 |@@ 7
1024 |@ 3
2048 |@@@ 12
4096 |@@@@@@@ 26
8192 |@@@@ 15
16384 |@ 2
32768 | 0
NFSv3 read/write by host (total us):
192.168.17.75 414458
NFSv3 read/write top 10 files (total us):
/export/stuff/bin/cal 11225
/export/stuff/bin/cjpeg 11947
/export/stuff/bin/charmap 12347
/export/stuff/bin/cdda2wav.bin 13449
/export/stuff/bin/chkey 13963
/export/stuff/bin/cputrack 14533
/export/stuff/bin/catman 15535
/export/stuff/bin/csslint-0.6 18302
/export/stuff/bin/col 19926
/export/stuff/bin/cdrecord.bin 40622
The first peak is likely to be NFS operations hitting the memory cache, and the second those thatmissed and went to disk. Further use of DTrace can confirm this theory.
The fields from the distribution plot are:
Field Description
value Minimum elapsed time for this event in microseconds
count Number of events in this time range
nfsv3io.d
This is a simple DTrace script to provide basic I/O details by host every 5 seconds:
#!/usr/sbin/dtrace -s
#pragma D option quiet
dtrace:::BEGIN
{
interval = 5;
printf("Tracing... Interval %d secs.\n", interval);
tick = interval;
}
Protocols
Oracle Solaris Dynamic Tracing Guide • November 2011 E22973_02322
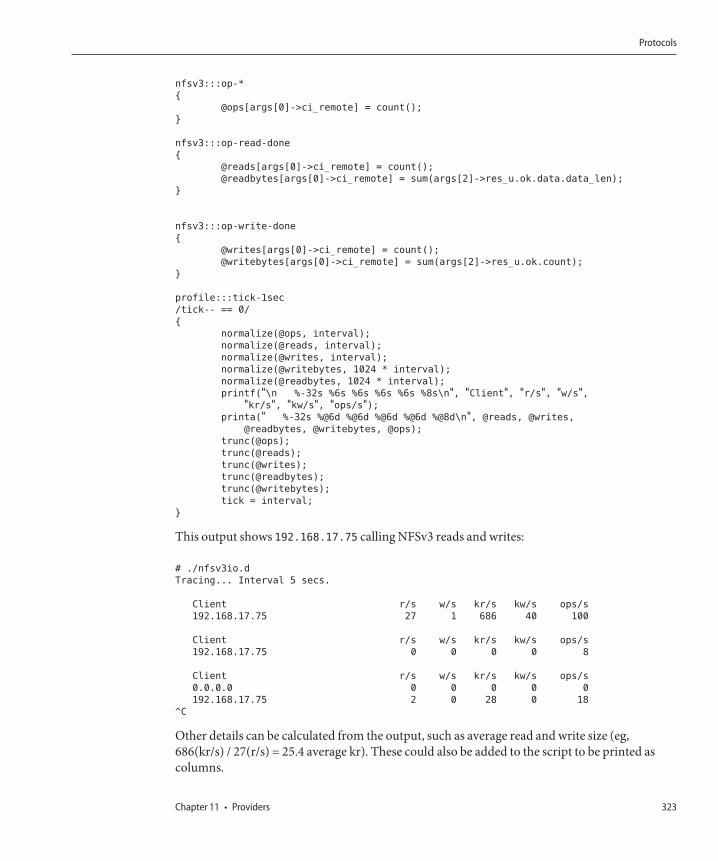
nfsv3:::op-*
{
@ops[args[0]->ci_remote] = count();
}
nfsv3:::op-read-done
{
@reads[args[0]->ci_remote] = count();
@readbytes[args[0]->ci_remote] = sum(args[2]->res_u.ok.data.data_len);
}
nfsv3:::op-write-done
{
@writes[args[0]->ci_remote] = count();
@writebytes[args[0]->ci_remote] = sum(args[2]->res_u.ok.count);
}
profile:::tick-1sec
/tick-- == 0/
{
normalize(@ops, interval);
normalize(@reads, interval);
normalize(@writes, interval);
normalize(@writebytes, 1024 * interval);
normalize(@readbytes, 1024 * interval);
printf("\n %-32s %6s %6s %6s %6s %8s\n", "Client", "r/s", "w/s","kr/s", "kw/s", "ops/s");
printa(" %-32s %@6d %@6d %@6d %@6d %@8d\n", @reads, @writes,
@readbytes, @writebytes, @ops);
trunc(@ops);
trunc(@reads);
trunc(@writes);
trunc(@readbytes);
trunc(@writebytes);
tick = interval;
}
This output shows 192.168.17.75 calling NFSv3 reads and writes:
# ./nfsv3io.d
Tracing... Interval 5 secs.
Client r/s w/s kr/s kw/s ops/s
192.168.17.75 27 1 686 40 100
Client r/s w/s kr/s kw/s ops/s
192.168.17.75 0 0 0 0 8
Client r/s w/s kr/s kw/s ops/s
0.0.0.0 0 0 0 0 0
192.168.17.75 2 0 28 0 18
^C
Other details can be calculated from the output, such as average read and write size (eg,686(kr/s) / 27(r/s) = 25.4 average kr). These could also be added to the script to be printed ascolumns.
Protocols
Chapter 11 • Providers 323
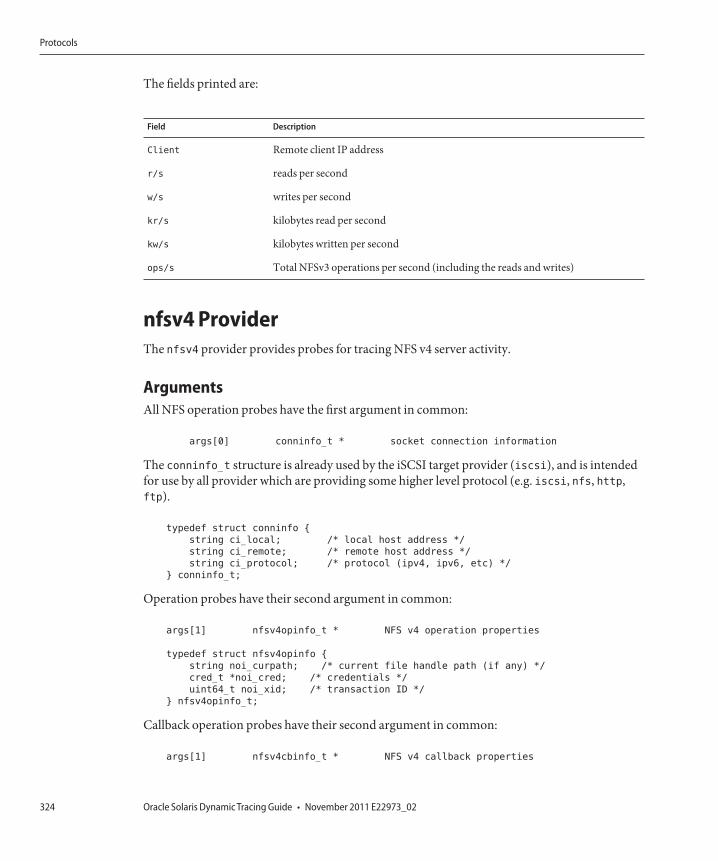
The fields printed are:
Field Description
Client Remote client IP address
r/s reads per second
w/s writes per second
kr/s kilobytes read per second
kw/s kilobytes written per second
ops/s Total NFSv3 operations per second (including the reads and writes)
nfsv4 ProviderThe nfsv4 provider provides probes for tracing NFS v4 server activity.
ArgumentsAll NFS operation probes have the first argument in common:
args[0] conninfo_t * socket connection information
The conninfo_t structure is already used by the iSCSI target provider (iscsi), and is intendedfor use by all provider which are providing some higher level protocol (e.g. iscsi, nfs, http,ftp).
typedef struct conninfo {
string ci_local; /* local host address */
string ci_remote; /* remote host address */
string ci_protocol; /* protocol (ipv4, ipv6, etc) */
} conninfo_t;
Operation probes have their second argument in common:
args[1] nfsv4opinfo_t * NFS v4 operation properties
typedef struct nfsv4opinfo {
string noi_curpath; /* current file handle path (if any) */
cred_t *noi_cred; /* credentials */
uint64_t noi_xid; /* transaction ID */
} nfsv4opinfo_t;
Callback operation probes have their second argument in common:
args[1] nfsv4cbinfo_t * NFS v4 callback properties
Protocols
Oracle Solaris Dynamic Tracing Guide • November 2011 E22973_02324
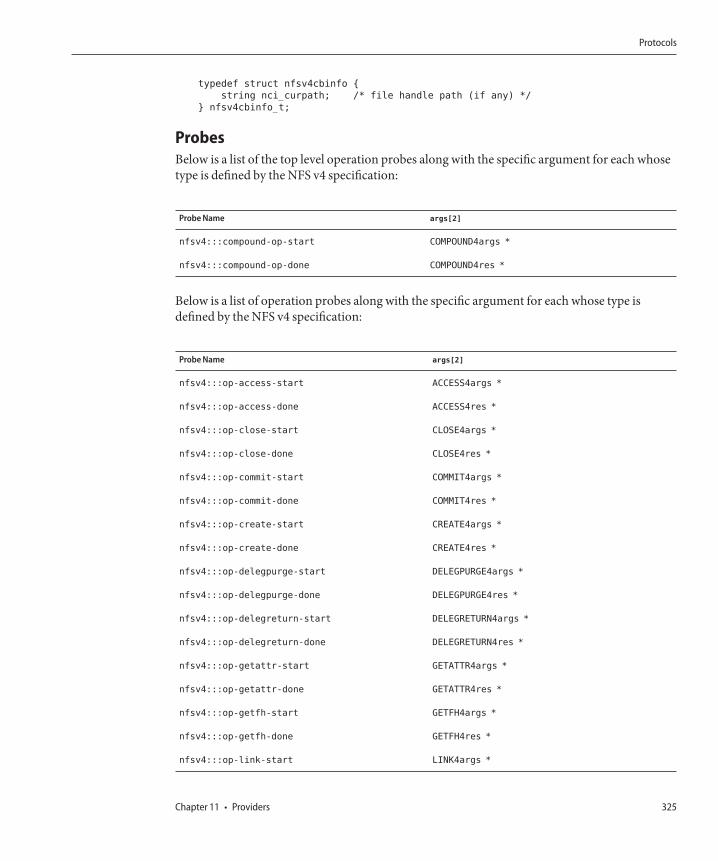
typedef struct nfsv4cbinfo {
string nci_curpath; /* file handle path (if any) */
} nfsv4cbinfo_t;
ProbesBelow is a list of the top level operation probes along with the specific argument for each whosetype is defined by the NFS v4 specification:
Probe Name args[2]
nfsv4:::compound-op-start COMPOUND4args *
nfsv4:::compound-op-done COMPOUND4res *
Below is a list of operation probes along with the specific argument for each whose type isdefined by the NFS v4 specification:
Probe Name args[2]
nfsv4:::op-access-start ACCESS4args *
nfsv4:::op-access-done ACCESS4res *
nfsv4:::op-close-start CLOSE4args *
nfsv4:::op-close-done CLOSE4res *
nfsv4:::op-commit-start COMMIT4args *
nfsv4:::op-commit-done COMMIT4res *
nfsv4:::op-create-start CREATE4args *
nfsv4:::op-create-done CREATE4res *
nfsv4:::op-delegpurge-start DELEGPURGE4args *
nfsv4:::op-delegpurge-done DELEGPURGE4res *
nfsv4:::op-delegreturn-start DELEGRETURN4args *
nfsv4:::op-delegreturn-done DELEGRETURN4res *
nfsv4:::op-getattr-start GETATTR4args *
nfsv4:::op-getattr-done GETATTR4res *
nfsv4:::op-getfh-start GETFH4args *
nfsv4:::op-getfh-done GETFH4res *
nfsv4:::op-link-start LINK4args *
Protocols
Chapter 11 • Providers 325
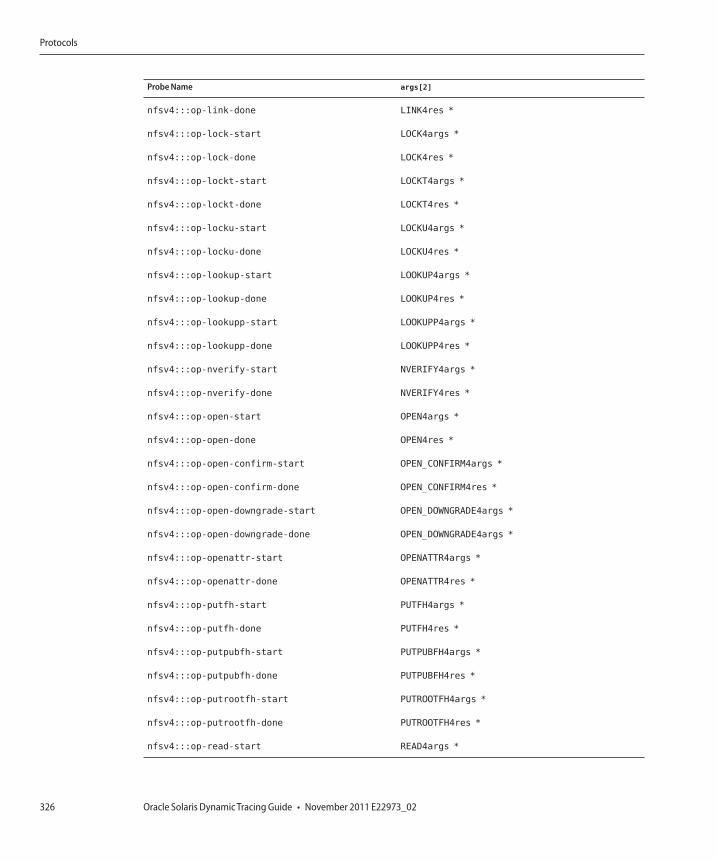
Probe Name args[2]
nfsv4:::op-link-done LINK4res *
nfsv4:::op-lock-start LOCK4args *
nfsv4:::op-lock-done LOCK4res *
nfsv4:::op-lockt-start LOCKT4args *
nfsv4:::op-lockt-done LOCKT4res *
nfsv4:::op-locku-start LOCKU4args *
nfsv4:::op-locku-done LOCKU4res *
nfsv4:::op-lookup-start LOOKUP4args *
nfsv4:::op-lookup-done LOOKUP4res *
nfsv4:::op-lookupp-start LOOKUPP4args *
nfsv4:::op-lookupp-done LOOKUPP4res *
nfsv4:::op-nverify-start NVERIFY4args *
nfsv4:::op-nverify-done NVERIFY4res *
nfsv4:::op-open-start OPEN4args *
nfsv4:::op-open-done OPEN4res *
nfsv4:::op-open-confirm-start OPEN_CONFIRM4args *
nfsv4:::op-open-confirm-done OPEN_CONFIRM4res *
nfsv4:::op-open-downgrade-start OPEN_DOWNGRADE4args *
nfsv4:::op-open-downgrade-done OPEN_DOWNGRADE4args *
nfsv4:::op-openattr-start OPENATTR4args *
nfsv4:::op-openattr-done OPENATTR4res *
nfsv4:::op-putfh-start PUTFH4args *
nfsv4:::op-putfh-done PUTFH4res *
nfsv4:::op-putpubfh-start PUTPUBFH4args *
nfsv4:::op-putpubfh-done PUTPUBFH4res *
nfsv4:::op-putrootfh-start PUTROOTFH4args *
nfsv4:::op-putrootfh-done PUTROOTFH4res *
nfsv4:::op-read-start READ4args *
Protocols
Oracle Solaris Dynamic Tracing Guide • November 2011 E22973_02326
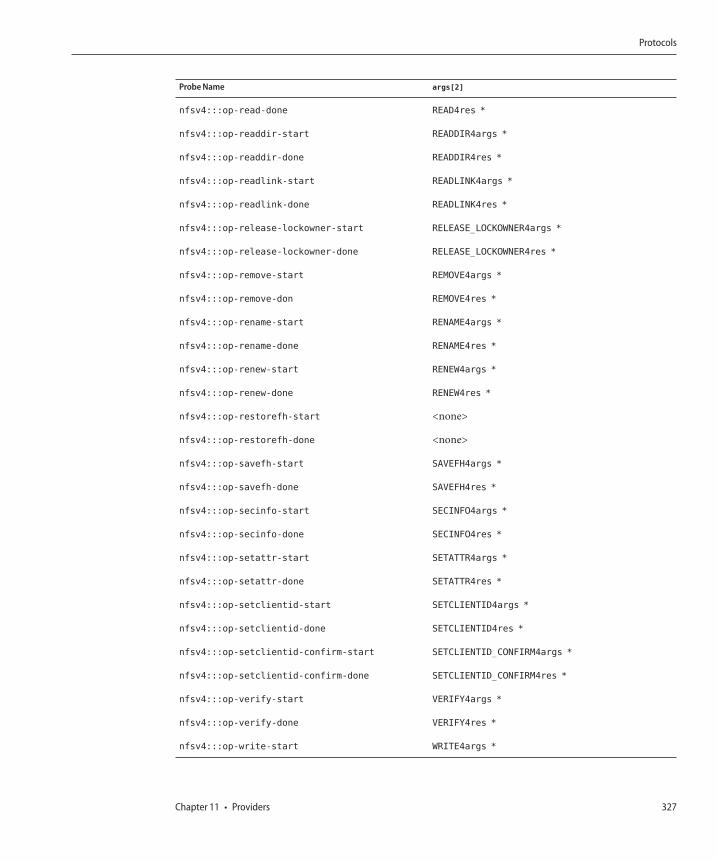
Probe Name args[2]
nfsv4:::op-read-done READ4res *
nfsv4:::op-readdir-start READDIR4args *
nfsv4:::op-readdir-done READDIR4res *
nfsv4:::op-readlink-start READLINK4args *
nfsv4:::op-readlink-done READLINK4res *
nfsv4:::op-release-lockowner-start RELEASE_LOCKOWNER4args *
nfsv4:::op-release-lockowner-done RELEASE_LOCKOWNER4res *
nfsv4:::op-remove-start REMOVE4args *
nfsv4:::op-remove-don REMOVE4res *
nfsv4:::op-rename-start RENAME4args *
nfsv4:::op-rename-done RENAME4res *
nfsv4:::op-renew-start RENEW4args *
nfsv4:::op-renew-done RENEW4res *
nfsv4:::op-restorefh-start <none>
nfsv4:::op-restorefh-done <none>
nfsv4:::op-savefh-start SAVEFH4args *
nfsv4:::op-savefh-done SAVEFH4res *
nfsv4:::op-secinfo-start SECINFO4args *
nfsv4:::op-secinfo-done SECINFO4res *
nfsv4:::op-setattr-start SETATTR4args *
nfsv4:::op-setattr-done SETATTR4res *
nfsv4:::op-setclientid-start SETCLIENTID4args *
nfsv4:::op-setclientid-done SETCLIENTID4res *
nfsv4:::op-setclientid-confirm-start SETCLIENTID_CONFIRM4args *
nfsv4:::op-setclientid-confirm-done SETCLIENTID_CONFIRM4res *
nfsv4:::op-verify-start VERIFY4args *
nfsv4:::op-verify-done VERIFY4res *
nfsv4:::op-write-start WRITE4args *
Protocols
Chapter 11 • Providers 327
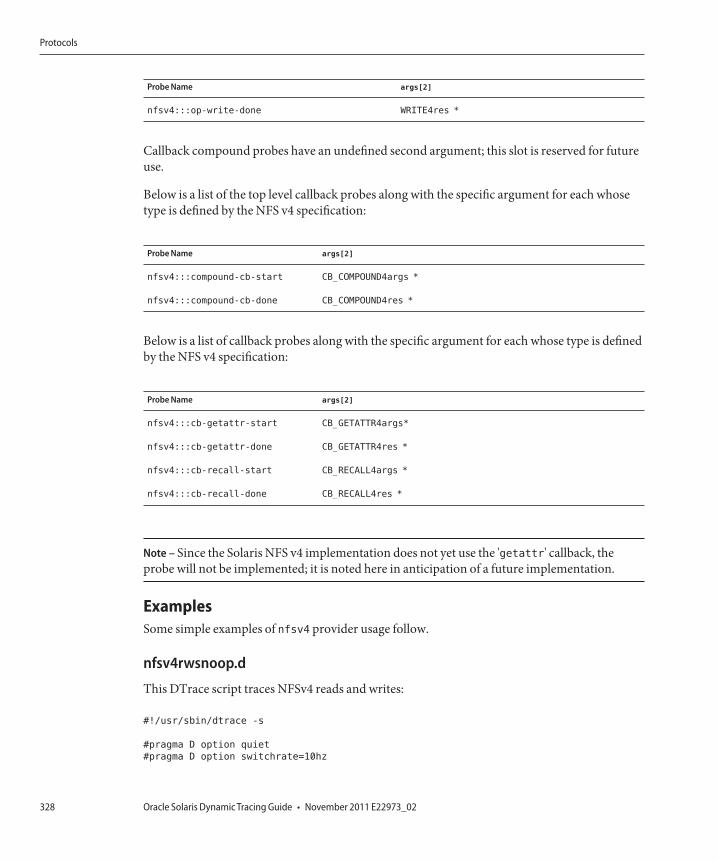
Probe Name args[2]
nfsv4:::op-write-done WRITE4res *
Callback compound probes have an undefined second argument; this slot is reserved for futureuse.
Below is a list of the top level callback probes along with the specific argument for each whosetype is defined by the NFS v4 specification:
Probe Name args[2]
nfsv4:::compound-cb-start CB_COMPOUND4args *
nfsv4:::compound-cb-done CB_COMPOUND4res *
Below is a list of callback probes along with the specific argument for each whose type is definedby the NFS v4 specification:
Probe Name args[2]
nfsv4:::cb-getattr-start CB_GETATTR4args*
nfsv4:::cb-getattr-done CB_GETATTR4res *
nfsv4:::cb-recall-start CB_RECALL4args *
nfsv4:::cb-recall-done CB_RECALL4res *
Note – Since the Solaris NFS v4 implementation does not yet use the 'getattr' callback, theprobe will not be implemented; it is noted here in anticipation of a future implementation.
ExamplesSome simple examples of nfsv4 provider usage follow.
nfsv4rwsnoop.d
This DTrace script traces NFSv4 reads and writes:
#!/usr/sbin/dtrace -s
#pragma D option quiet
#pragma D option switchrate=10hz
Protocols
Oracle Solaris Dynamic Tracing Guide • November 2011 E22973_02328
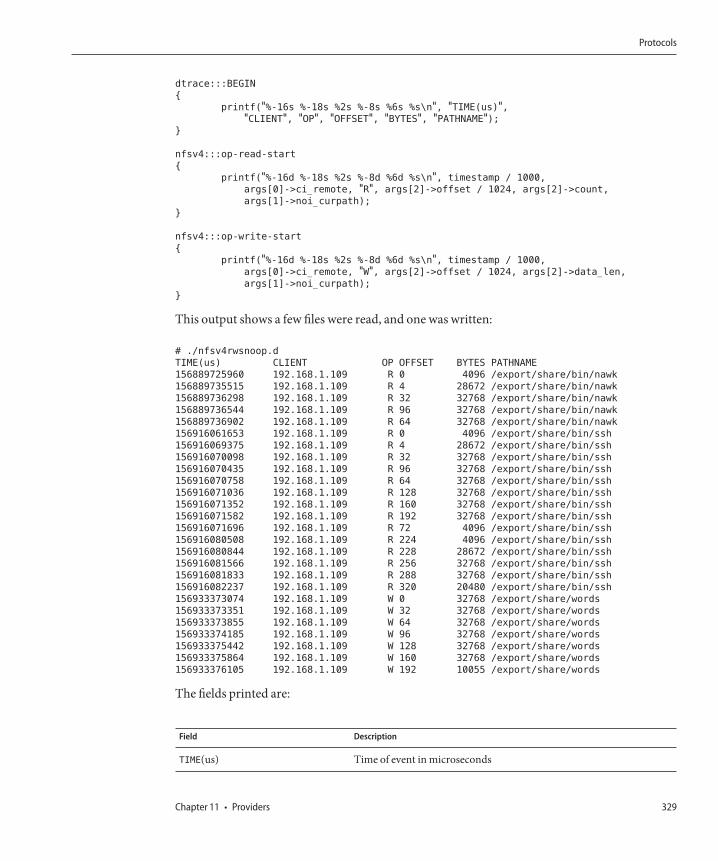
dtrace:::BEGIN
{
printf("%-16s %-18s %2s %-8s %6s %s\n", "TIME(us)","CLIENT", "OP", "OFFSET", "BYTES", "PATHNAME");
}
nfsv4:::op-read-start
{
printf("%-16d %-18s %2s %-8d %6d %s\n", timestamp / 1000,
args[0]->ci_remote, "R", args[2]->offset / 1024, args[2]->count,
args[1]->noi_curpath);
}
nfsv4:::op-write-start
{
printf("%-16d %-18s %2s %-8d %6d %s\n", timestamp / 1000,
args[0]->ci_remote, "W", args[2]->offset / 1024, args[2]->data_len,
args[1]->noi_curpath);
}
This output shows a few files were read, and one was written:
# ./nfsv4rwsnoop.d
TIME(us) CLIENT OP OFFSET BYTES PATHNAME
156889725960 192.168.1.109 R 0 4096 /export/share/bin/nawk
156889735515 192.168.1.109 R 4 28672 /export/share/bin/nawk
156889736298 192.168.1.109 R 32 32768 /export/share/bin/nawk
156889736544 192.168.1.109 R 96 32768 /export/share/bin/nawk
156889736902 192.168.1.109 R 64 32768 /export/share/bin/nawk
156916061653 192.168.1.109 R 0 4096 /export/share/bin/ssh
156916069375 192.168.1.109 R 4 28672 /export/share/bin/ssh
156916070098 192.168.1.109 R 32 32768 /export/share/bin/ssh
156916070435 192.168.1.109 R 96 32768 /export/share/bin/ssh
156916070758 192.168.1.109 R 64 32768 /export/share/bin/ssh
156916071036 192.168.1.109 R 128 32768 /export/share/bin/ssh
156916071352 192.168.1.109 R 160 32768 /export/share/bin/ssh
156916071582 192.168.1.109 R 192 32768 /export/share/bin/ssh
156916071696 192.168.1.109 R 72 4096 /export/share/bin/ssh
156916080508 192.168.1.109 R 224 4096 /export/share/bin/ssh
156916080844 192.168.1.109 R 228 28672 /export/share/bin/ssh
156916081566 192.168.1.109 R 256 32768 /export/share/bin/ssh
156916081833 192.168.1.109 R 288 32768 /export/share/bin/ssh
156916082237 192.168.1.109 R 320 20480 /export/share/bin/ssh
156933373074 192.168.1.109 W 0 32768 /export/share/words
156933373351 192.168.1.109 W 32 32768 /export/share/words
156933373855 192.168.1.109 W 64 32768 /export/share/words
156933374185 192.168.1.109 W 96 32768 /export/share/words
156933375442 192.168.1.109 W 128 32768 /export/share/words
156933375864 192.168.1.109 W 160 32768 /export/share/words
156933376105 192.168.1.109 W 192 10055 /export/share/words
The fields printed are:
Field Description
TIME(us) Time of event in microseconds
Protocols
Chapter 11 • Providers 329
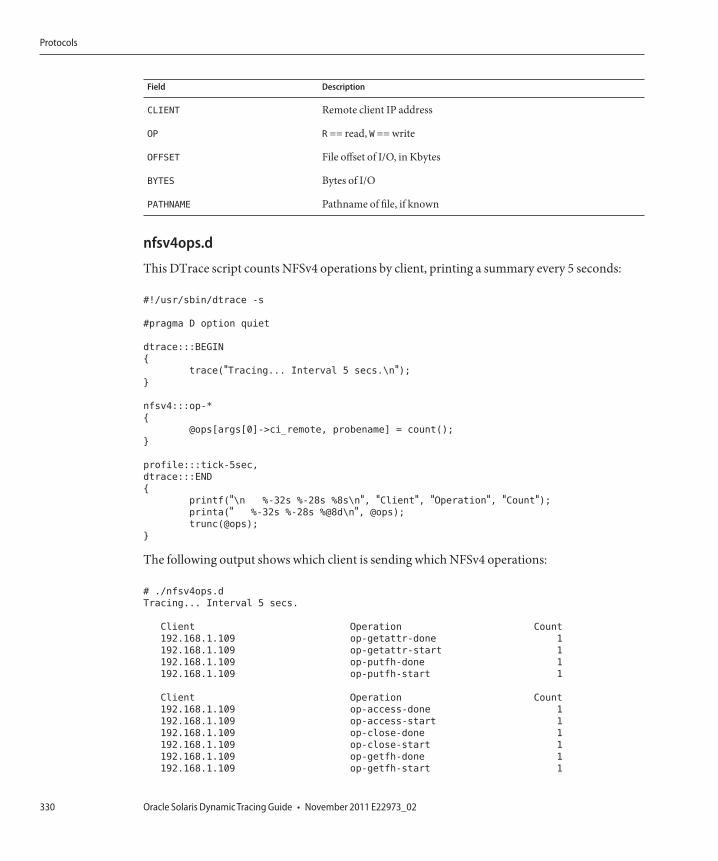
Field Description
CLIENT Remote client IP address
OP R == read, W == write
OFFSET File offset of I/O, in Kbytes
BYTES Bytes of I/O
PATHNAME Pathname of file, if known
nfsv4ops.d
This DTrace script counts NFSv4 operations by client, printing a summary every 5 seconds:
#!/usr/sbin/dtrace -s
#pragma D option quiet
dtrace:::BEGIN
{
trace("Tracing... Interval 5 secs.\n");}
nfsv4:::op-*
{
@ops[args[0]->ci_remote, probename] = count();
}
profile:::tick-5sec,
dtrace:::END
{
printf("\n %-32s %-28s %8s\n", "Client", "Operation", "Count");printa(" %-32s %-28s %@8d\n", @ops);
trunc(@ops);
}
The following output shows which client is sending which NFSv4 operations:
# ./nfsv4ops.d
Tracing... Interval 5 secs.
Client Operation Count
192.168.1.109 op-getattr-done 1
192.168.1.109 op-getattr-start 1
192.168.1.109 op-putfh-done 1
192.168.1.109 op-putfh-start 1
Client Operation Count
192.168.1.109 op-access-done 1
192.168.1.109 op-access-start 1
192.168.1.109 op-close-done 1
192.168.1.109 op-close-start 1
192.168.1.109 op-getfh-done 1
192.168.1.109 op-getfh-start 1
Protocols
Oracle Solaris Dynamic Tracing Guide • November 2011 E22973_02330
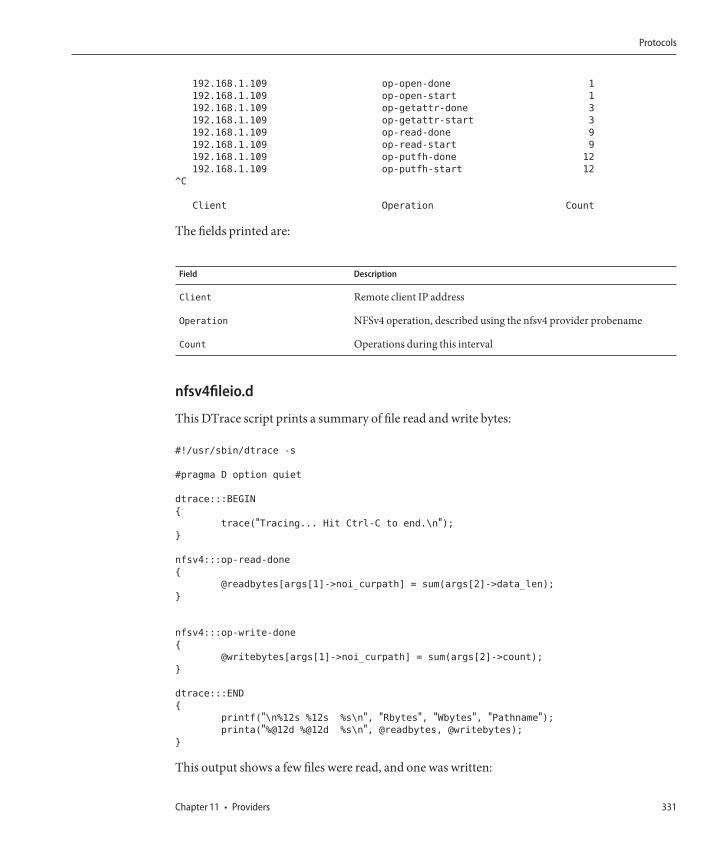
192.168.1.109 op-open-done 1
192.168.1.109 op-open-start 1
192.168.1.109 op-getattr-done 3
192.168.1.109 op-getattr-start 3
192.168.1.109 op-read-done 9
192.168.1.109 op-read-start 9
192.168.1.109 op-putfh-done 12
192.168.1.109 op-putfh-start 12
^C
Client Operation Count
The fields printed are:
Field Description
Client Remote client IP address
Operation NFSv4 operation, described using the nfsv4 provider probename
Count Operations during this interval
nfsv4fileio.d
This DTrace script prints a summary of file read and write bytes:
#!/usr/sbin/dtrace -s
#pragma D option quiet
dtrace:::BEGIN
{
trace("Tracing... Hit Ctrl-C to end.\n");}
nfsv4:::op-read-done
{
@readbytes[args[1]->noi_curpath] = sum(args[2]->data_len);
}
nfsv4:::op-write-done
{
@writebytes[args[1]->noi_curpath] = sum(args[2]->count);
}
dtrace:::END
{
printf("\n%12s %12s %s\n", "Rbytes", "Wbytes", "Pathname");printa("%@12d %@12d %s\n", @readbytes, @writebytes);
}
This output shows a few files were read, and one was written:
Protocols
Chapter 11 • Providers 331
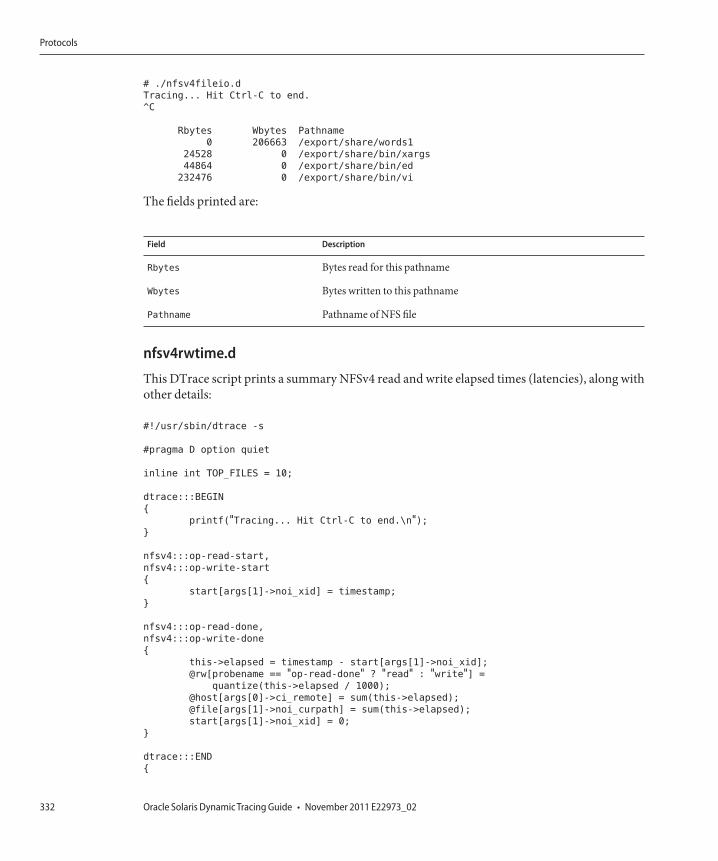
# ./nfsv4fileio.d
Tracing... Hit Ctrl-C to end.
^C
Rbytes Wbytes Pathname
0 206663 /export/share/words1
24528 0 /export/share/bin/xargs
44864 0 /export/share/bin/ed
232476 0 /export/share/bin/vi
The fields printed are:
Field Description
Rbytes Bytes read for this pathname
Wbytes Bytes written to this pathname
Pathname Pathname of NFS file
nfsv4rwtime.d
This DTrace script prints a summary NFSv4 read and write elapsed times (latencies), along withother details:
#!/usr/sbin/dtrace -s
#pragma D option quiet
inline int TOP_FILES = 10;
dtrace:::BEGIN
{
printf("Tracing... Hit Ctrl-C to end.\n");}
nfsv4:::op-read-start,
nfsv4:::op-write-start
{
start[args[1]->noi_xid] = timestamp;
}
nfsv4:::op-read-done,
nfsv4:::op-write-done
{
this->elapsed = timestamp - start[args[1]->noi_xid];
@rw[probename == "op-read-done" ? "read" : "write"] =
quantize(this->elapsed / 1000);
@host[args[0]->ci_remote] = sum(this->elapsed);
@file[args[1]->noi_curpath] = sum(this->elapsed);
start[args[1]->noi_xid] = 0;
}
dtrace:::END
{
Protocols
Oracle Solaris Dynamic Tracing Guide • November 2011 E22973_02332
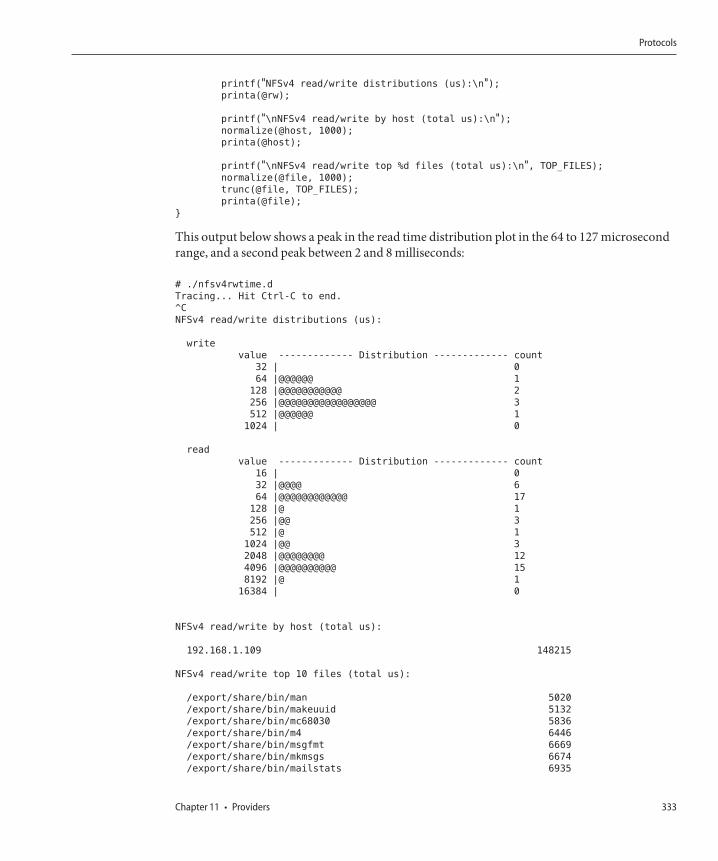
printf("NFSv4 read/write distributions (us):\n");printa(@rw);
printf("\nNFSv4 read/write by host (total us):\n");normalize(@host, 1000);
printa(@host);
printf("\nNFSv4 read/write top %d files (total us):\n", TOP_FILES);
normalize(@file, 1000);
trunc(@file, TOP_FILES);
printa(@file);
}
This output below shows a peak in the read time distribution plot in the 64 to 127 microsecondrange, and a second peak between 2 and 8 milliseconds:
# ./nfsv4rwtime.d
Tracing... Hit Ctrl-C to end.
^C
NFSv4 read/write distributions (us):
write
value ------------- Distribution ------------- count
32 | 0
64 |@@@@@@ 1
128 |@@@@@@@@@@@ 2
256 |@@@@@@@@@@@@@@@@@ 3
512 |@@@@@@ 1
1024 | 0
read
value ------------- Distribution ------------- count
16 | 0
32 |@@@@ 6
64 |@@@@@@@@@@@@ 17
128 |@ 1
256 |@@ 3
512 |@ 1
1024 |@@ 3
2048 |@@@@@@@@ 12
4096 |@@@@@@@@@@ 15
8192 |@ 1
16384 | 0
NFSv4 read/write by host (total us):
192.168.1.109 148215
NFSv4 read/write top 10 files (total us):
/export/share/bin/man 5020
/export/share/bin/makeuuid 5132
/export/share/bin/mc68030 5836
/export/share/bin/m4 6446
/export/share/bin/msgfmt 6669
/export/share/bin/mkmsgs 6674
/export/share/bin/mailstats 6935
Protocols
Chapter 11 • Providers 333
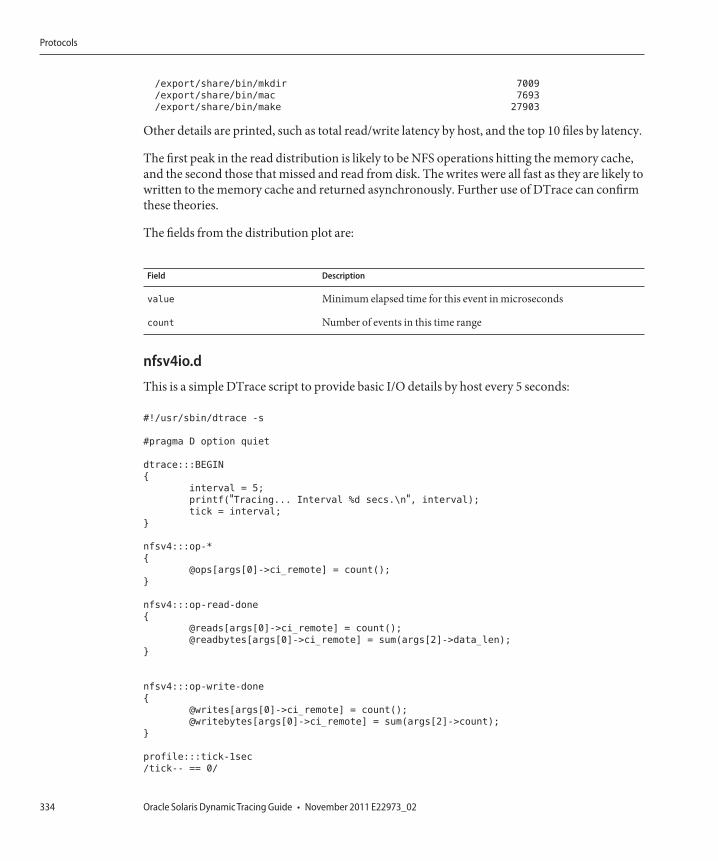
/export/share/bin/mkdir 7009
/export/share/bin/mac 7693
/export/share/bin/make 27903
Other details are printed, such as total read/write latency by host, and the top 10 files by latency.
The first peak in the read distribution is likely to be NFS operations hitting the memory cache,and the second those that missed and read from disk. The writes were all fast as they are likely towritten to the memory cache and returned asynchronously. Further use of DTrace can confirmthese theories.
The fields from the distribution plot are:
Field Description
value Minimum elapsed time for this event in microseconds
count Number of events in this time range
nfsv4io.d
This is a simple DTrace script to provide basic I/O details by host every 5 seconds:
#!/usr/sbin/dtrace -s
#pragma D option quiet
dtrace:::BEGIN
{
interval = 5;
printf("Tracing... Interval %d secs.\n", interval);
tick = interval;
}
nfsv4:::op-*
{
@ops[args[0]->ci_remote] = count();
}
nfsv4:::op-read-done
{
@reads[args[0]->ci_remote] = count();
@readbytes[args[0]->ci_remote] = sum(args[2]->data_len);
}
nfsv4:::op-write-done
{
@writes[args[0]->ci_remote] = count();
@writebytes[args[0]->ci_remote] = sum(args[2]->count);
}
profile:::tick-1sec
/tick-- == 0/
Protocols
Oracle Solaris Dynamic Tracing Guide • November 2011 E22973_02334
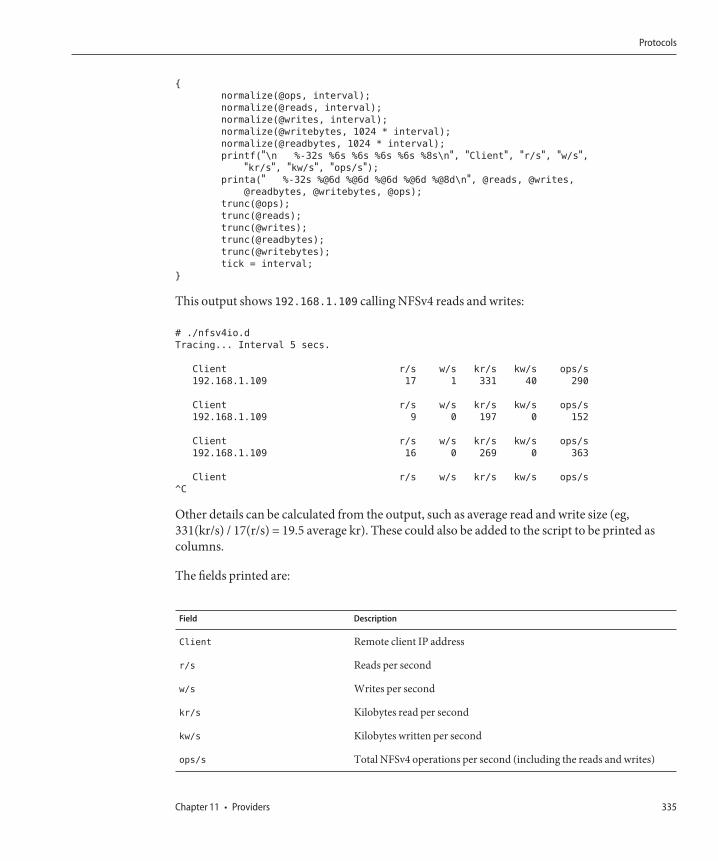
{
normalize(@ops, interval);
normalize(@reads, interval);
normalize(@writes, interval);
normalize(@writebytes, 1024 * interval);
normalize(@readbytes, 1024 * interval);
printf("\n %-32s %6s %6s %6s %6s %8s\n", "Client", "r/s", "w/s","kr/s", "kw/s", "ops/s");
printa(" %-32s %@6d %@6d %@6d %@6d %@8d\n", @reads, @writes,
@readbytes, @writebytes, @ops);
trunc(@ops);
trunc(@reads);
trunc(@writes);
trunc(@readbytes);
trunc(@writebytes);
tick = interval;
}
This output shows 192.168.1.109 calling NFSv4 reads and writes:
# ./nfsv4io.d
Tracing... Interval 5 secs.
Client r/s w/s kr/s kw/s ops/s
192.168.1.109 17 1 331 40 290
Client r/s w/s kr/s kw/s ops/s
192.168.1.109 9 0 197 0 152
Client r/s w/s kr/s kw/s ops/s
192.168.1.109 16 0 269 0 363
Client r/s w/s kr/s kw/s ops/s
^C
Other details can be calculated from the output, such as average read and write size (eg,331(kr/s) / 17(r/s) = 19.5 average kr). These could also be added to the script to be printed ascolumns.
The fields printed are:
Field Description
Client Remote client IP address
r/s Reads per second
w/s Writes per second
kr/s Kilobytes read per second
kw/s Kilobytes written per second
ops/s Total NFSv4 operations per second (including the reads and writes)
Protocols
Chapter 11 • Providers 335
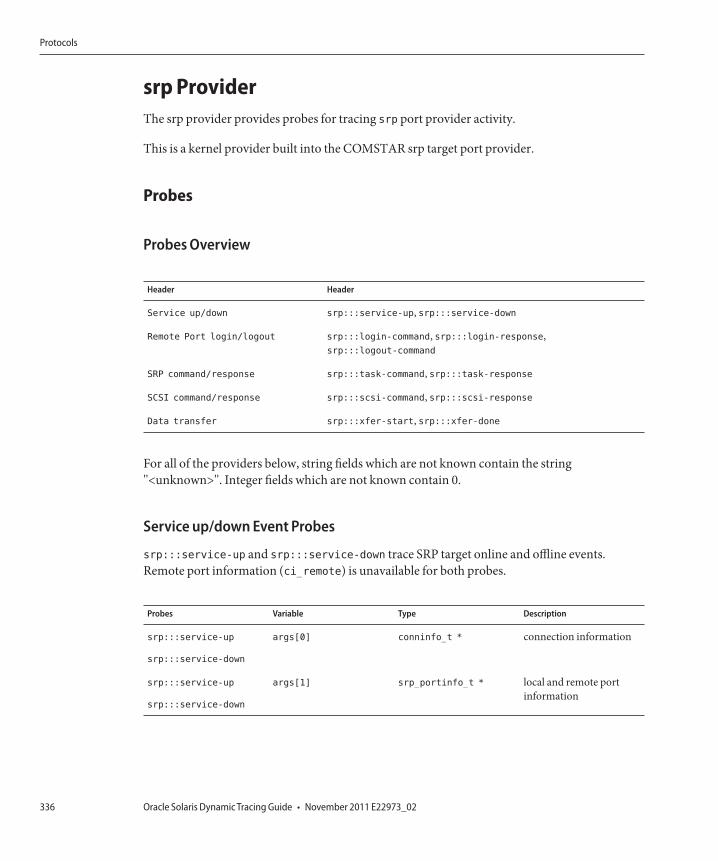
srp ProviderThe srp provider provides probes for tracing srp port provider activity.
This is a kernel provider built into the COMSTAR srp target port provider.
Probes
Probes Overview
Header Header
Service up/down srp:::service-up, srp:::service-down
Remote Port login/logout srp:::login-command, srp:::login-response,srp:::logout-command
SRP command/response srp:::task-command, srp:::task-response
SCSI command/response srp:::scsi-command, srp:::scsi-response
Data transfer srp:::xfer-start, srp:::xfer-done
For all of the providers below, string fields which are not known contain the string"<unknown>". Integer fields which are not known contain 0.
Service up/down Event Probes
srp:::service-up and srp:::service-down trace SRP target online and offline events.Remote port information (ci_remote) is unavailable for both probes.
Probes Variable Type Description
srp:::service-up
srp:::service-down
args[0] conninfo_t * connection information
srp:::service-up
srp:::service-down
args[1] srp_portinfo_t * local and remote portinformation
Protocols
Oracle Solaris Dynamic Tracing Guide • November 2011 E22973_02336
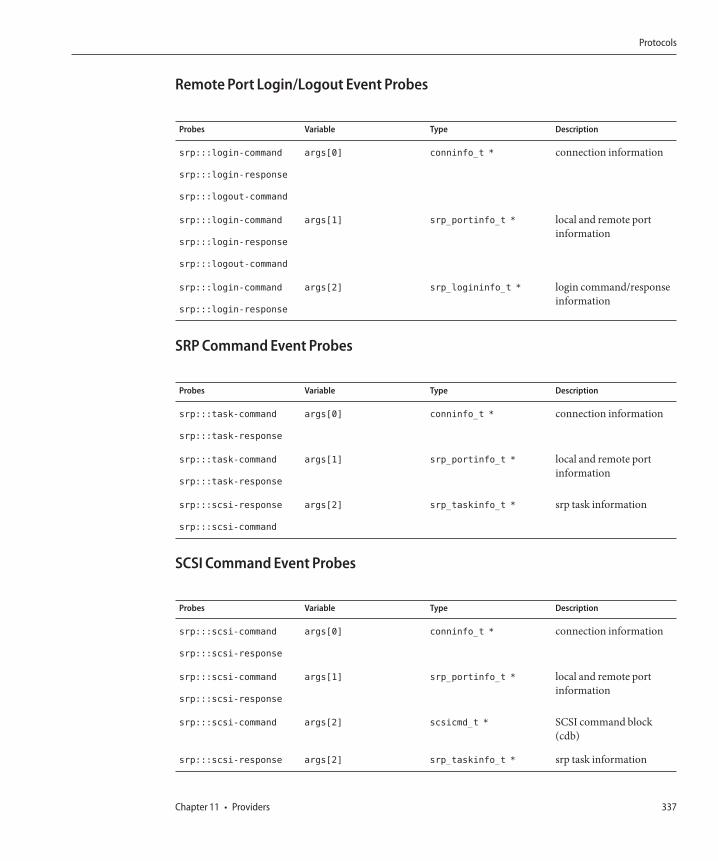
Remote Port Login/Logout Event Probes
Probes Variable Type Description
srp:::login-command
srp:::login-response
srp:::logout-command
args[0] conninfo_t * connection information
srp:::login-command
srp:::login-response
srp:::logout-command
args[1] srp_portinfo_t * local and remote portinformation
srp:::login-command
srp:::login-response
args[2] srp_logininfo_t * login command/responseinformation
SRP Command Event Probes
Probes Variable Type Description
srp:::task-command
srp:::task-response
args[0] conninfo_t * connection information
srp:::task-command
srp:::task-response
args[1] srp_portinfo_t * local and remote portinformation
srp:::scsi-response
srp:::scsi-command
args[2] srp_taskinfo_t * srp task information
SCSI Command Event Probes
Probes Variable Type Description
srp:::scsi-command
srp:::scsi-response
args[0] conninfo_t * connection information
srp:::scsi-command
srp:::scsi-response
args[1] srp_portinfo_t * local and remote portinformation
srp:::scsi-command args[2] scsicmd_t * SCSI command block(cdb)
srp:::scsi-response args[2] srp_taskinfo_t * srp task information
Protocols
Chapter 11 • Providers 337
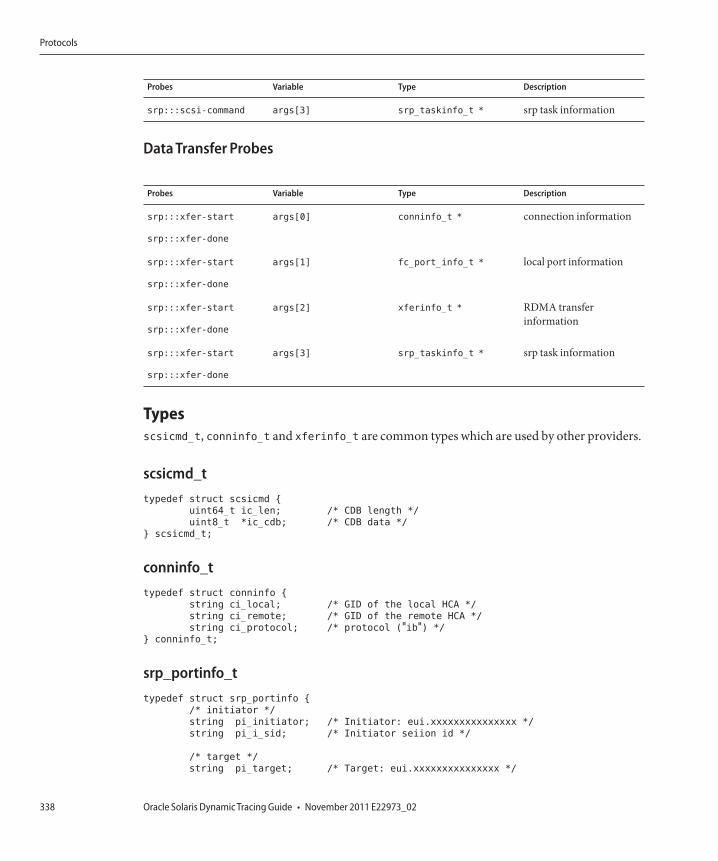
Probes Variable Type Description
srp:::scsi-command args[3] srp_taskinfo_t * srp task information
Data Transfer Probes
Probes Variable Type Description
srp:::xfer-start
srp:::xfer-done
args[0] conninfo_t * connection information
srp:::xfer-start
srp:::xfer-done
args[1] fc_port_info_t * local port information
srp:::xfer-start
srp:::xfer-done
args[2] xferinfo_t * RDMA transferinformation
srp:::xfer-start
srp:::xfer-done
args[3] srp_taskinfo_t * srp task information
Typesscsicmd_t, conninfo_t and xferinfo_t are common types which are used by other providers.
scsicmd_ttypedef struct scsicmd {
uint64_t ic_len; /* CDB length */
uint8_t *ic_cdb; /* CDB data */
} scsicmd_t;
conninfo_ttypedef struct conninfo {
string ci_local; /* GID of the local HCA */
string ci_remote; /* GID of the remote HCA */
string ci_protocol; /* protocol ("ib") */
} conninfo_t;
srp_portinfo_ttypedef struct srp_portinfo {
/* initiator */
string pi_initiator; /* Initiator: eui.xxxxxxxxxxxxxxx */
string pi_i_sid; /* Initiator seiion id */
/* target */
string pi_target; /* Target: eui.xxxxxxxxxxxxxxx */
Protocols
Oracle Solaris Dynamic Tracing Guide • November 2011 E22973_02338
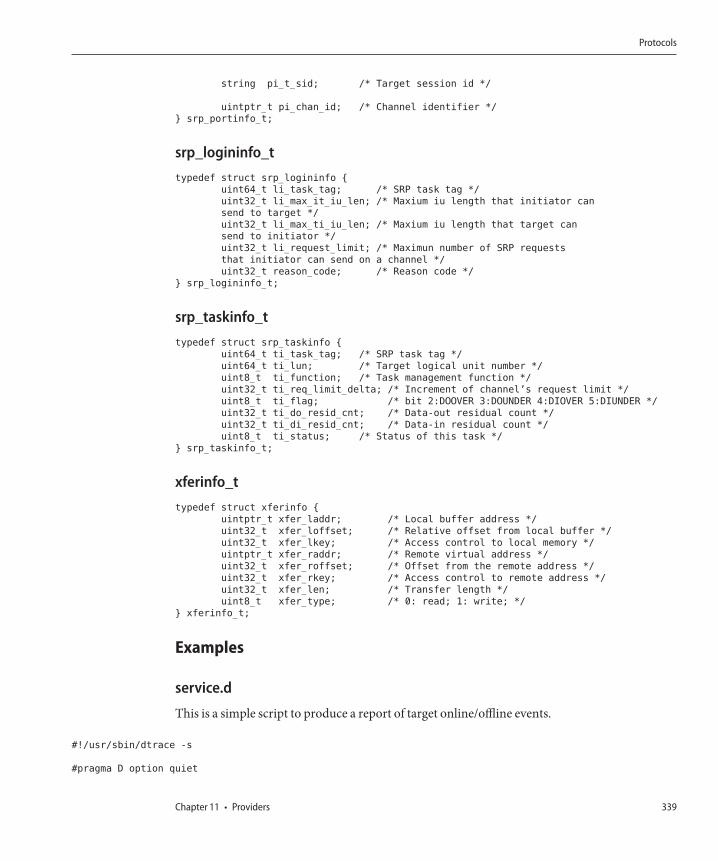
string pi_t_sid; /* Target session id */
uintptr_t pi_chan_id; /* Channel identifier */
} srp_portinfo_t;
srp_logininfo_ttypedef struct srp_logininfo {
uint64_t li_task_tag; /* SRP task tag */
uint32_t li_max_it_iu_len; /* Maxium iu length that initiator can
send to target */
uint32_t li_max_ti_iu_len; /* Maxium iu length that target can
send to initiator */
uint32_t li_request_limit; /* Maximun number of SRP requests
that initiator can send on a channel */
uint32_t reason_code; /* Reason code */
} srp_logininfo_t;
srp_taskinfo_ttypedef struct srp_taskinfo {
uint64_t ti_task_tag; /* SRP task tag */
uint64_t ti_lun; /* Target logical unit number */
uint8_t ti_function; /* Task management function */
uint32_t ti_req_limit_delta; /* Increment of channel’s request limit */
uint8_t ti_flag; /* bit 2:DOOVER 3:DOUNDER 4:DIOVER 5:DIUNDER */
uint32_t ti_do_resid_cnt; /* Data-out residual count */
uint32_t ti_di_resid_cnt; /* Data-in residual count */
uint8_t ti_status; /* Status of this task */
} srp_taskinfo_t;
xferinfo_ttypedef struct xferinfo {
uintptr_t xfer_laddr; /* Local buffer address */
uint32_t xfer_loffset; /* Relative offset from local buffer */
uint32_t xfer_lkey; /* Access control to local memory */
uintptr_t xfer_raddr; /* Remote virtual address */
uint32_t xfer_roffset; /* Offset from the remote address */
uint32_t xfer_rkey; /* Access control to remote address */
uint32_t xfer_len; /* Transfer length */
uint8_t xfer_type; /* 0: read; 1: write; */
} xferinfo_t;
Examples
service.d
This is a simple script to produce a report of target online/offline events.
#!/usr/sbin/dtrace -s
#pragma D option quiet
Protocols
Chapter 11 • Providers 339
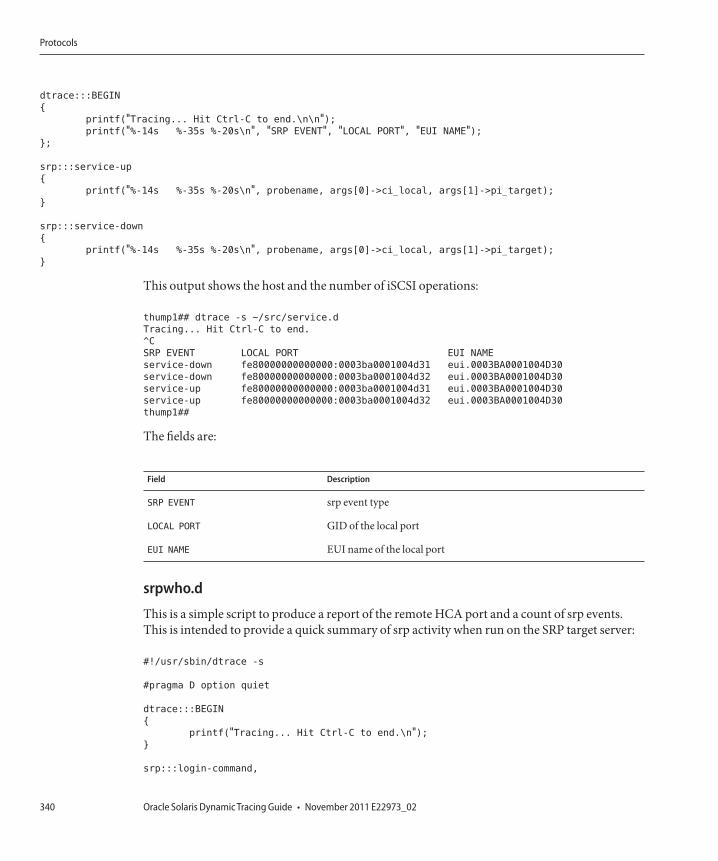
dtrace:::BEGIN
{
printf("Tracing... Hit Ctrl-C to end.\n\n");printf("%-14s %-35s %-20s\n", "SRP EVENT", "LOCAL PORT", "EUI NAME");
};
srp:::service-up
{
printf("%-14s %-35s %-20s\n", probename, args[0]->ci_local, args[1]->pi_target);
}
srp:::service-down
{
printf("%-14s %-35s %-20s\n", probename, args[0]->ci_local, args[1]->pi_target);
}
This output shows the host and the number of iSCSI operations:
thump1## dtrace -s ~/src/service.d
Tracing... Hit Ctrl-C to end.
^C
SRP EVENT LOCAL PORT EUI NAME
service-down fe80000000000000:0003ba0001004d31 eui.0003BA0001004D30
service-down fe80000000000000:0003ba0001004d32 eui.0003BA0001004D30
service-up fe80000000000000:0003ba0001004d31 eui.0003BA0001004D30
service-up fe80000000000000:0003ba0001004d32 eui.0003BA0001004D30
thump1##
The fields are:
Field Description
SRP EVENT srp event type
LOCAL PORT GID of the local port
EUI NAME EUI name of the local port
srpwho.d
This is a simple script to produce a report of the remote HCA port and a count of srp events.This is intended to provide a quick summary of srp activity when run on the SRP target server:
#!/usr/sbin/dtrace -s
#pragma D option quiet
dtrace:::BEGIN
{
printf("Tracing... Hit Ctrl-C to end.\n");}
srp:::login-command,
Protocols
Oracle Solaris Dynamic Tracing Guide • November 2011 E22973_02340
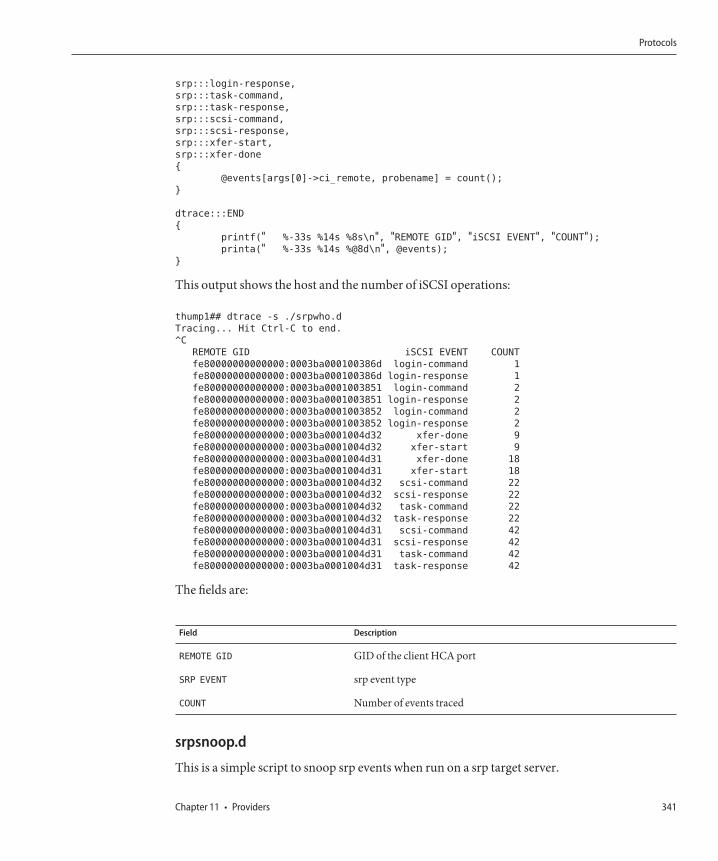
srp:::login-response,
srp:::task-command,
srp:::task-response,
srp:::scsi-command,
srp:::scsi-response,
srp:::xfer-start,
srp:::xfer-done
{
@events[args[0]->ci_remote, probename] = count();
}
dtrace:::END
{
printf(" %-33s %14s %8s\n", "REMOTE GID", "iSCSI EVENT", "COUNT");printa(" %-33s %14s %@8d\n", @events);
}
This output shows the host and the number of iSCSI operations:
thump1## dtrace -s ./srpwho.d
Tracing... Hit Ctrl-C to end.
^C
REMOTE GID iSCSI EVENT COUNT
fe80000000000000:0003ba000100386d login-command 1
fe80000000000000:0003ba000100386d login-response 1
fe80000000000000:0003ba0001003851 login-command 2
fe80000000000000:0003ba0001003851 login-response 2
fe80000000000000:0003ba0001003852 login-command 2
fe80000000000000:0003ba0001003852 login-response 2
fe80000000000000:0003ba0001004d32 xfer-done 9
fe80000000000000:0003ba0001004d32 xfer-start 9
fe80000000000000:0003ba0001004d31 xfer-done 18
fe80000000000000:0003ba0001004d31 xfer-start 18
fe80000000000000:0003ba0001004d32 scsi-command 22
fe80000000000000:0003ba0001004d32 scsi-response 22
fe80000000000000:0003ba0001004d32 task-command 22
fe80000000000000:0003ba0001004d32 task-response 22
fe80000000000000:0003ba0001004d31 scsi-command 42
fe80000000000000:0003ba0001004d31 scsi-response 42
fe80000000000000:0003ba0001004d31 task-command 42
fe80000000000000:0003ba0001004d31 task-response 42
The fields are:
Field Description
REMOTE GID GID of the client HCA port
SRP EVENT srp event type
COUNT Number of events traced
srpsnoop.d
This is a simple script to snoop srp events when run on a srp target server.
Protocols
Chapter 11 • Providers 341
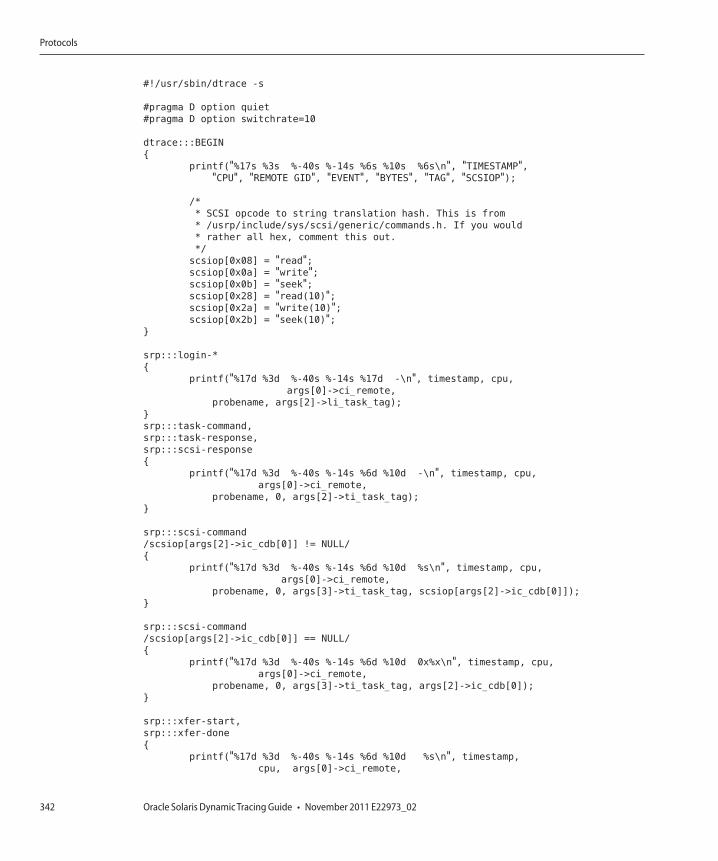
#!/usr/sbin/dtrace -s
#pragma D option quiet
#pragma D option switchrate=10
dtrace:::BEGIN
{
printf("%17s %3s %-40s %-14s %6s %10s %6s\n", "TIMESTAMP","CPU", "REMOTE GID", "EVENT", "BYTES", "TAG", "SCSIOP");
/*
* SCSI opcode to string translation hash. This is from
* /usrp/include/sys/scsi/generic/commands.h. If you would
* rather all hex, comment this out.
*/
scsiop[0x08] = "read";scsiop[0x0a] = "write";scsiop[0x0b] = "seek";scsiop[0x28] = "read(10)";scsiop[0x2a] = "write(10)";scsiop[0x2b] = "seek(10)";
}
srp:::login-*
{
printf("%17d %3d %-40s %-14s %17d -\n", timestamp, cpu,
args[0]->ci_remote,
probename, args[2]->li_task_tag);
}
srp:::task-command,
srp:::task-response,
srp:::scsi-response
{
printf("%17d %3d %-40s %-14s %6d %10d -\n", timestamp, cpu,
args[0]->ci_remote,
probename, 0, args[2]->ti_task_tag);
}
srp:::scsi-command
/scsiop[args[2]->ic_cdb[0]] != NULL/
{
printf("%17d %3d %-40s %-14s %6d %10d %s\n", timestamp, cpu,
args[0]->ci_remote,
probename, 0, args[3]->ti_task_tag, scsiop[args[2]->ic_cdb[0]]);
}
srp:::scsi-command
/scsiop[args[2]->ic_cdb[0]] == NULL/
{
printf("%17d %3d %-40s %-14s %6d %10d 0x%x\n", timestamp, cpu,
args[0]->ci_remote,
probename, 0, args[3]->ti_task_tag, args[2]->ic_cdb[0]);
}
srp:::xfer-start,
srp:::xfer-done
{
printf("%17d %3d %-40s %-14s %6d %10d %s\n", timestamp,
cpu, args[0]->ci_remote,
Protocols
Oracle Solaris Dynamic Tracing Guide • November 2011 E22973_02342
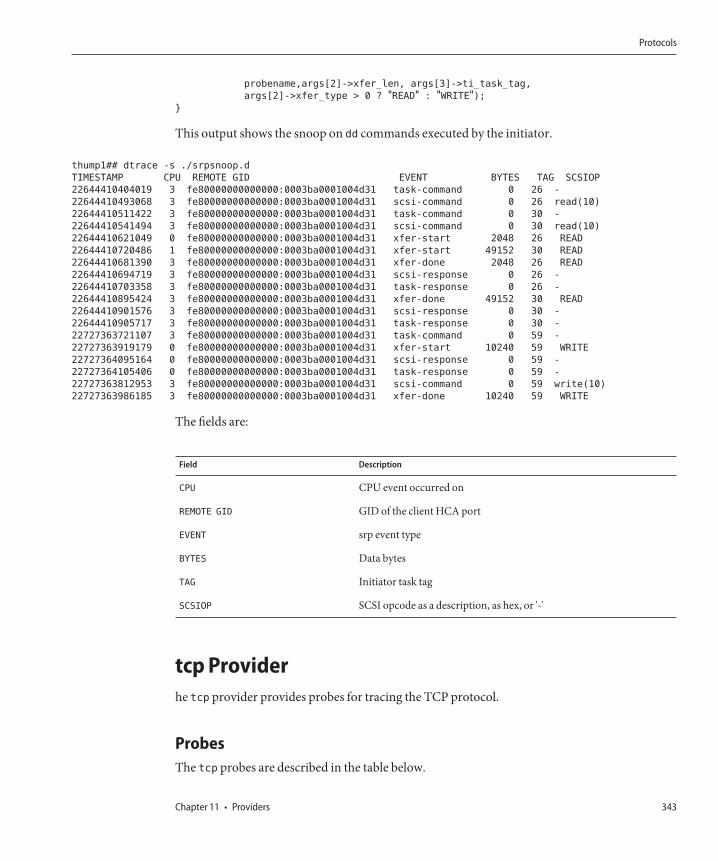
probename,args[2]->xfer_len, args[3]->ti_task_tag,
args[2]->xfer_type > 0 ? "READ" : "WRITE");}
This output shows the snoop on dd commands executed by the initiator.
thump1## dtrace -s ./srpsnoop.d
TIMESTAMP CPU REMOTE GID EVENT BYTES TAG SCSIOP
22644410404019 3 fe80000000000000:0003ba0001004d31 task-command 0 26 -
22644410493068 3 fe80000000000000:0003ba0001004d31 scsi-command 0 26 read(10)
22644410511422 3 fe80000000000000:0003ba0001004d31 task-command 0 30 -
22644410541494 3 fe80000000000000:0003ba0001004d31 scsi-command 0 30 read(10)
22644410621049 0 fe80000000000000:0003ba0001004d31 xfer-start 2048 26 READ
22644410720486 1 fe80000000000000:0003ba0001004d31 xfer-start 49152 30 READ
22644410681390 3 fe80000000000000:0003ba0001004d31 xfer-done 2048 26 READ
22644410694719 3 fe80000000000000:0003ba0001004d31 scsi-response 0 26 -
22644410703358 3 fe80000000000000:0003ba0001004d31 task-response 0 26 -
22644410895424 3 fe80000000000000:0003ba0001004d31 xfer-done 49152 30 READ
22644410901576 3 fe80000000000000:0003ba0001004d31 scsi-response 0 30 -
22644410905717 3 fe80000000000000:0003ba0001004d31 task-response 0 30 -
22727363721107 3 fe80000000000000:0003ba0001004d31 task-command 0 59 -
22727363919179 0 fe80000000000000:0003ba0001004d31 xfer-start 10240 59 WRITE
22727364095164 0 fe80000000000000:0003ba0001004d31 scsi-response 0 59 -
22727364105406 0 fe80000000000000:0003ba0001004d31 task-response 0 59 -
22727363812953 3 fe80000000000000:0003ba0001004d31 scsi-command 0 59 write(10)
22727363986185 3 fe80000000000000:0003ba0001004d31 xfer-done 10240 59 WRITE
The fields are:
Field Description
CPU CPU event occurred on
REMOTE GID GID of the client HCA port
EVENT srp event type
BYTES Data bytes
TAG Initiator task tag
SCSIOP SCSI opcode as a description, as hex, or '-'
tcp Providerhe tcp provider provides probes for tracing the TCP protocol.
ProbesThe tcp probes are described in the table below.
Protocols
Chapter 11 • Providers 343
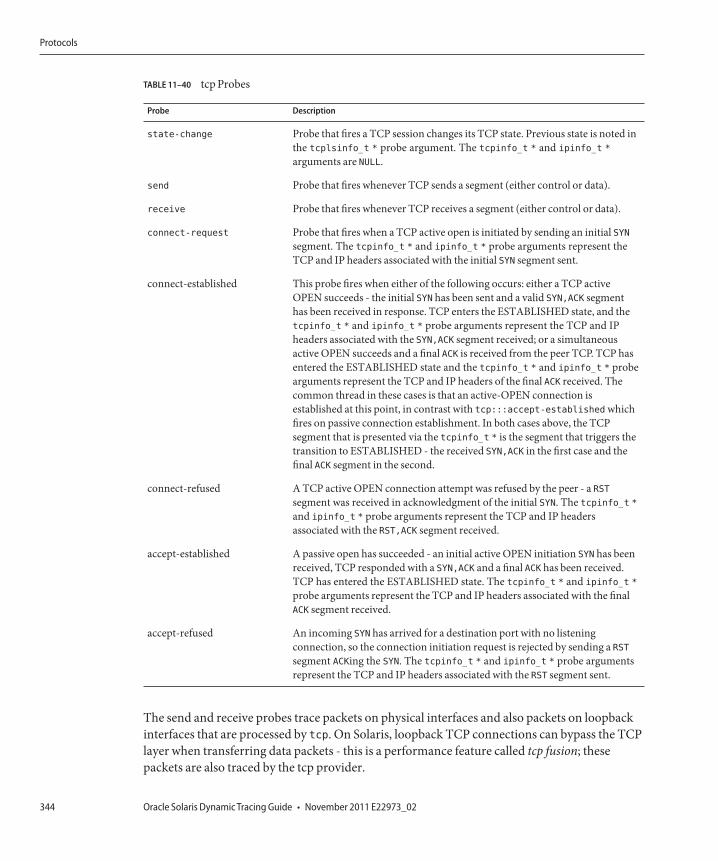
TABLE 11–40 tcp Probes
Probe Description
state-change Probe that fires a TCP session changes its TCP state. Previous state is noted inthe tcplsinfo_t * probe argument. The tcpinfo_t * and ipinfo_t *
arguments are NULL.
send Probe that fires whenever TCP sends a segment (either control or data).
receive Probe that fires whenever TCP receives a segment (either control or data).
connect-request Probe that fires when a TCP active open is initiated by sending an initial SYNsegment. The tcpinfo_t * and ipinfo_t * probe arguments represent theTCP and IP headers associated with the initial SYN segment sent.
connect-established This probe fires when either of the following occurs: either a TCP activeOPEN succeeds - the initial SYN has been sent and a valid SYN,ACK segmenthas been received in response. TCP enters the ESTABLISHED state, and thetcpinfo_t * and ipinfo_t * probe arguments represent the TCP and IPheaders associated with the SYN,ACK segment received; or a simultaneousactive OPEN succeeds and a final ACK is received from the peer TCP. TCP hasentered the ESTABLISHED state and the tcpinfo_t * and ipinfo_t * probearguments represent the TCP and IP headers of the final ACK received. Thecommon thread in these cases is that an active-OPEN connection isestablished at this point, in contrast with tcp:::accept-established whichfires on passive connection establishment. In both cases above, the TCPsegment that is presented via the tcpinfo_t * is the segment that triggers thetransition to ESTABLISHED - the received SYN,ACK in the first case and thefinal ACK segment in the second.
connect-refused A TCP active OPEN connection attempt was refused by the peer - a RSTsegment was received in acknowledgment of the initial SYN. The tcpinfo_t *and ipinfo_t * probe arguments represent the TCP and IP headersassociated with the RST,ACK segment received.
accept-established A passive open has succeeded - an initial active OPEN initiation SYN has beenreceived, TCP responded with a SYN,ACK and a final ACK has been received.TCP has entered the ESTABLISHED state. The tcpinfo_t * and ipinfo_t *
probe arguments represent the TCP and IP headers associated with the finalACK segment received.
accept-refused An incoming SYN has arrived for a destination port with no listeningconnection, so the connection initiation request is rejected by sending a RSTsegment ACKing the SYN. The tcpinfo_t * and ipinfo_t * probe argumentsrepresent the TCP and IP headers associated with the RST segment sent.
The send and receive probes trace packets on physical interfaces and also packets on loopbackinterfaces that are processed by tcp. On Solaris, loopback TCP connections can bypass the TCPlayer when transferring data packets - this is a performance feature called tcp fusion; thesepackets are also traced by the tcp provider.
Protocols
Oracle Solaris Dynamic Tracing Guide • November 2011 E22973_02344
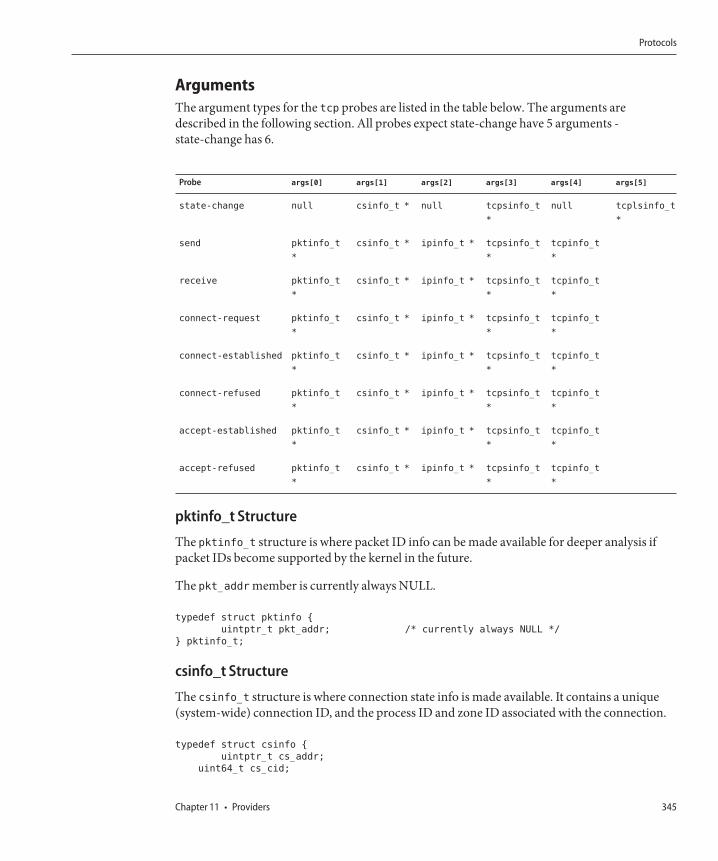
ArgumentsThe argument types for the tcp probes are listed in the table below. The arguments aredescribed in the following section. All probes expect state-change have 5 arguments -state-change has 6.
Probe args[0] args[1] args[2] args[3] args[4] args[5]
state-change null csinfo_t * null tcpsinfo_t
*
null tcplsinfo_t
*
send pktinfo_t
*
csinfo_t * ipinfo_t * tcpsinfo_t
*
tcpinfo_t
*
receive pktinfo_t
*
csinfo_t * ipinfo_t * tcpsinfo_t
*
tcpinfo_t
*
connect-request pktinfo_t
*
csinfo_t * ipinfo_t * tcpsinfo_t
*
tcpinfo_t
*
connect-established pktinfo_t
*
csinfo_t * ipinfo_t * tcpsinfo_t
*
tcpinfo_t
*
connect-refused pktinfo_t
*
csinfo_t * ipinfo_t * tcpsinfo_t
*
tcpinfo_t
*
accept-established pktinfo_t
*
csinfo_t * ipinfo_t * tcpsinfo_t
*
tcpinfo_t
*
accept-refused pktinfo_t
*
csinfo_t * ipinfo_t * tcpsinfo_t
*
tcpinfo_t
*
pktinfo_t Structure
The pktinfo_t structure is where packet ID info can be made available for deeper analysis ifpacket IDs become supported by the kernel in the future.
The pkt_addr member is currently always NULL.
typedef struct pktinfo {
uintptr_t pkt_addr; /* currently always NULL */
} pktinfo_t;
csinfo_t Structure
The csinfo_t structure is where connection state info is made available. It contains a unique(system-wide) connection ID, and the process ID and zone ID associated with the connection.
typedef struct csinfo {
uintptr_t cs_addr;
uint64_t cs_cid;
Protocols
Chapter 11 • Providers 345
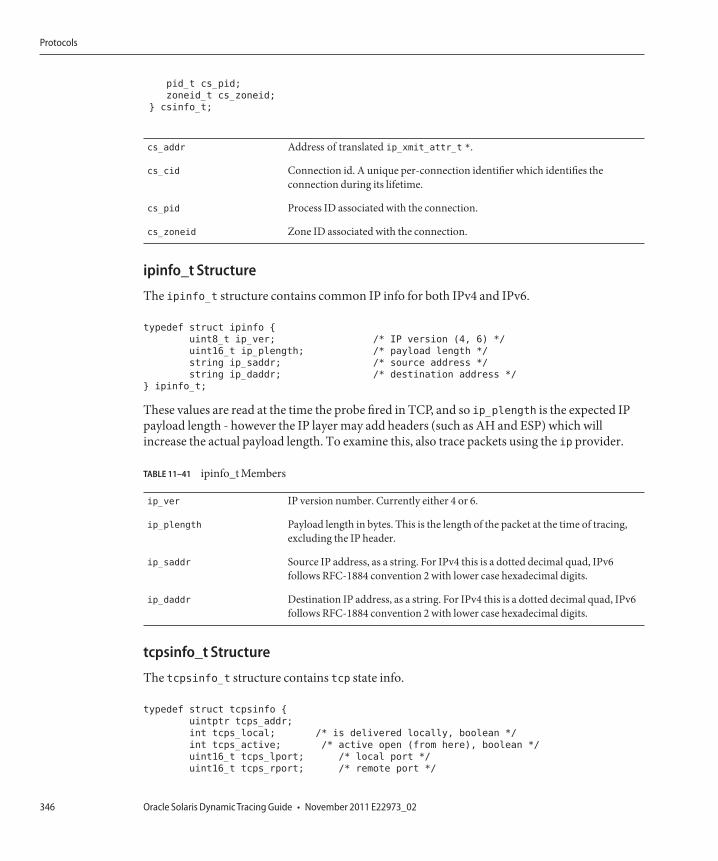
pid_t cs_pid;
zoneid_t cs_zoneid;
} csinfo_t;
cs_addr Address of translated ip_xmit_attr_t *.
cs_cid Connection id. A unique per-connection identifier which identifies theconnection during its lifetime.
cs_pid Process ID associated with the connection.
cs_zoneid Zone ID associated with the connection.
ipinfo_t Structure
The ipinfo_t structure contains common IP info for both IPv4 and IPv6.
typedef struct ipinfo {
uint8_t ip_ver; /* IP version (4, 6) */
uint16_t ip_plength; /* payload length */
string ip_saddr; /* source address */
string ip_daddr; /* destination address */
} ipinfo_t;
These values are read at the time the probe fired in TCP, and so ip_plength is the expected IPpayload length - however the IP layer may add headers (such as AH and ESP) which willincrease the actual payload length. To examine this, also trace packets using the ip provider.
TABLE 11–41 ipinfo_t Members
ip_ver IP version number. Currently either 4 or 6.
ip_plength Payload length in bytes. This is the length of the packet at the time of tracing,excluding the IP header.
ip_saddr Source IP address, as a string. For IPv4 this is a dotted decimal quad, IPv6follows RFC-1884 convention 2 with lower case hexadecimal digits.
ip_daddr Destination IP address, as a string. For IPv4 this is a dotted decimal quad, IPv6follows RFC-1884 convention 2 with lower case hexadecimal digits.
tcpsinfo_t Structure
The tcpsinfo_t structure contains tcp state info.
typedef struct tcpsinfo {
uintptr tcps_addr;
int tcps_local; /* is delivered locally, boolean */
int tcps_active; /* active open (from here), boolean */
uint16_t tcps_lport; /* local port */
uint16_t tcps_rport; /* remote port */
Protocols
Oracle Solaris Dynamic Tracing Guide • November 2011 E22973_02346
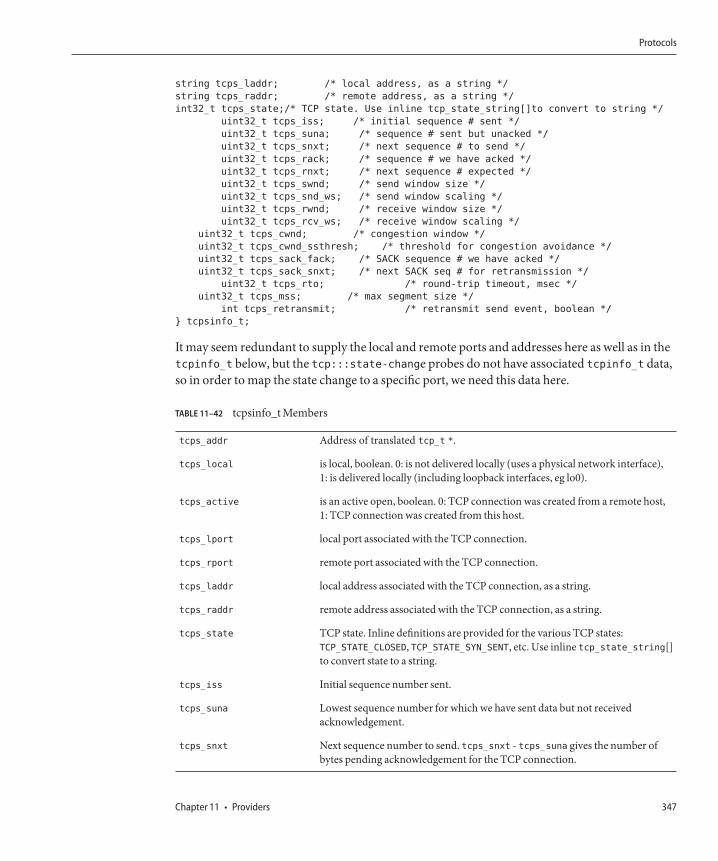
string tcps_laddr; /* local address, as a string */
string tcps_raddr; /* remote address, as a string */
int32_t tcps_state;/* TCP state. Use inline tcp_state_string[]to convert to string */
uint32_t tcps_iss; /* initial sequence # sent */
uint32_t tcps_suna; /* sequence # sent but unacked */
uint32_t tcps_snxt; /* next sequence # to send */
uint32_t tcps_rack; /* sequence # we have acked */
uint32_t tcps_rnxt; /* next sequence # expected */
uint32_t tcps_swnd; /* send window size */
uint32_t tcps_snd_ws; /* send window scaling */
uint32_t tcps_rwnd; /* receive window size */
uint32_t tcps_rcv_ws; /* receive window scaling */
uint32_t tcps_cwnd; /* congestion window */
uint32_t tcps_cwnd_ssthresh; /* threshold for congestion avoidance */
uint32_t tcps_sack_fack; /* SACK sequence # we have acked */
uint32_t tcps_sack_snxt; /* next SACK seq # for retransmission */
uint32_t tcps_rto; /* round-trip timeout, msec */
uint32_t tcps_mss; /* max segment size */
int tcps_retransmit; /* retransmit send event, boolean */
} tcpsinfo_t;
It may seem redundant to supply the local and remote ports and addresses here as well as in thetcpinfo_t below, but the tcp:::state-change probes do not have associated tcpinfo_t data,so in order to map the state change to a specific port, we need this data here.
TABLE 11–42 tcpsinfo_t Members
tcps_addr Address of translated tcp_t *.
tcps_local is local, boolean. 0: is not delivered locally (uses a physical network interface),1: is delivered locally (including loopback interfaces, eg lo0).
tcps_active is an active open, boolean. 0: TCP connection was created from a remote host,1: TCP connection was created from this host.
tcps_lport local port associated with the TCP connection.
tcps_rport remote port associated with the TCP connection.
tcps_laddr local address associated with the TCP connection, as a string.
tcps_raddr remote address associated with the TCP connection, as a string.
tcps_state TCP state. Inline definitions are provided for the various TCP states:TCP_STATE_CLOSED, TCP_STATE_SYN_SENT, etc. Use inline tcp_state_string[]to convert state to a string.
tcps_iss Initial sequence number sent.
tcps_suna Lowest sequence number for which we have sent data but not receivedacknowledgement.
tcps_snxt Next sequence number to send. tcps_snxt - tcps_suna gives the number ofbytes pending acknowledgement for the TCP connection.
Protocols
Chapter 11 • Providers 347
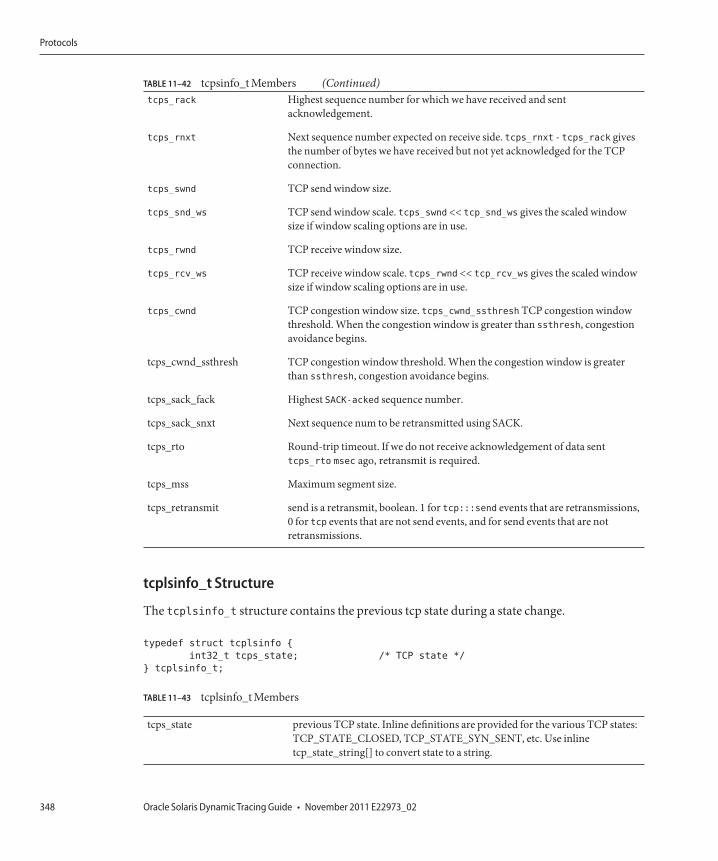
TABLE 11–42 tcpsinfo_t Members (Continued)tcps_rack Highest sequence number for which we have received and sent
acknowledgement.
tcps_rnxt Next sequence number expected on receive side. tcps_rnxt - tcps_rack givesthe number of bytes we have received but not yet acknowledged for the TCPconnection.
tcps_swnd TCP send window size.
tcps_snd_ws TCP send window scale. tcps_swnd << tcp_snd_ws gives the scaled windowsize if window scaling options are in use.
tcps_rwnd TCP receive window size.
tcps_rcv_ws TCP receive window scale. tcps_rwnd << tcp_rcv_ws gives the scaled windowsize if window scaling options are in use.
tcps_cwnd TCP congestion window size. tcps_cwnd_ssthresh TCP congestion windowthreshold. When the congestion window is greater than ssthresh, congestionavoidance begins.
tcps_cwnd_ssthresh TCP congestion window threshold. When the congestion window is greaterthan ssthresh, congestion avoidance begins.
tcps_sack_fack Highest SACK-acked sequence number.
tcps_sack_snxt Next sequence num to be retransmitted using SACK.
tcps_rto Round-trip timeout. If we do not receive acknowledgement of data senttcps_rto msec ago, retransmit is required.
tcps_mss Maximum segment size.
tcps_retransmit send is a retransmit, boolean. 1 for tcp:::send events that are retransmissions,0 for tcp events that are not send events, and for send events that are notretransmissions.
tcplsinfo_t Structure
The tcplsinfo_t structure contains the previous tcp state during a state change.
typedef struct tcplsinfo {
int32_t tcps_state; /* TCP state */
} tcplsinfo_t;
TABLE 11–43 tcplsinfo_t Members
tcps_state previous TCP state. Inline definitions are provided for the various TCP states:TCP_STATE_CLOSED, TCP_STATE_SYN_SENT, etc. Use inlinetcp_state_string[] to convert state to a string.
Protocols
Oracle Solaris Dynamic Tracing Guide • November 2011 E22973_02348
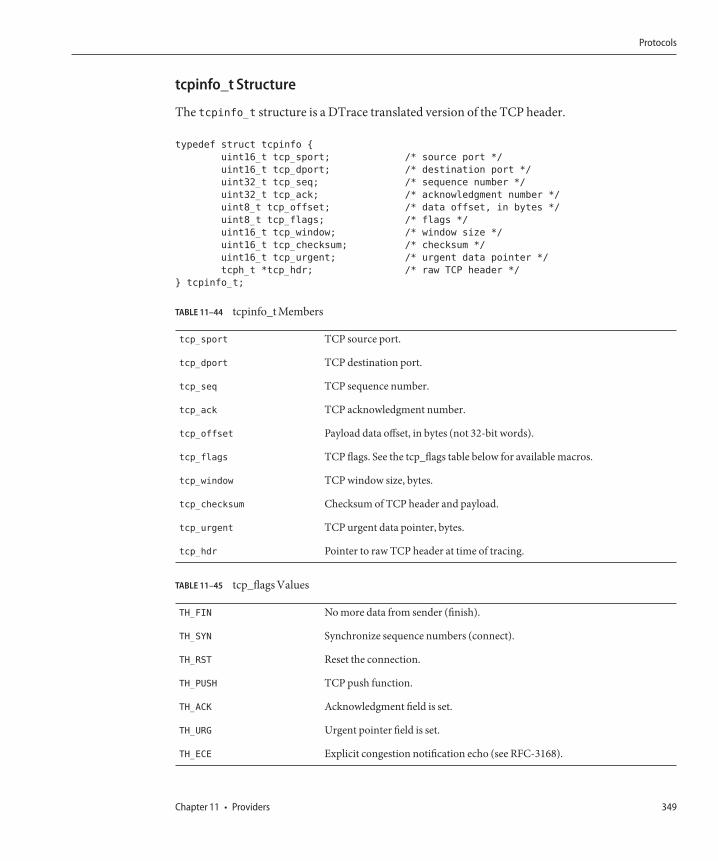
tcpinfo_t Structure
The tcpinfo_t structure is a DTrace translated version of the TCP header.
typedef struct tcpinfo {
uint16_t tcp_sport; /* source port */
uint16_t tcp_dport; /* destination port */
uint32_t tcp_seq; /* sequence number */
uint32_t tcp_ack; /* acknowledgment number */
uint8_t tcp_offset; /* data offset, in bytes */
uint8_t tcp_flags; /* flags */
uint16_t tcp_window; /* window size */
uint16_t tcp_checksum; /* checksum */
uint16_t tcp_urgent; /* urgent data pointer */
tcph_t *tcp_hdr; /* raw TCP header */
} tcpinfo_t;
TABLE 11–44 tcpinfo_t Members
tcp_sport TCP source port.
tcp_dport TCP destination port.
tcp_seq TCP sequence number.
tcp_ack TCP acknowledgment number.
tcp_offset Payload data offset, in bytes (not 32-bit words).
tcp_flags TCP flags. See the tcp_flags table below for available macros.
tcp_window TCP window size, bytes.
tcp_checksum Checksum of TCP header and payload.
tcp_urgent TCP urgent data pointer, bytes.
tcp_hdr Pointer to raw TCP header at time of tracing.
TABLE 11–45 tcp_flags Values
TH_FIN No more data from sender (finish).
TH_SYN Synchronize sequence numbers (connect).
TH_RST Reset the connection.
TH_PUSH TCP push function.
TH_ACK Acknowledgment field is set.
TH_URG Urgent pointer field is set.
TH_ECE Explicit congestion notification echo (see RFC-3168).
Protocols
Chapter 11 • Providers 349
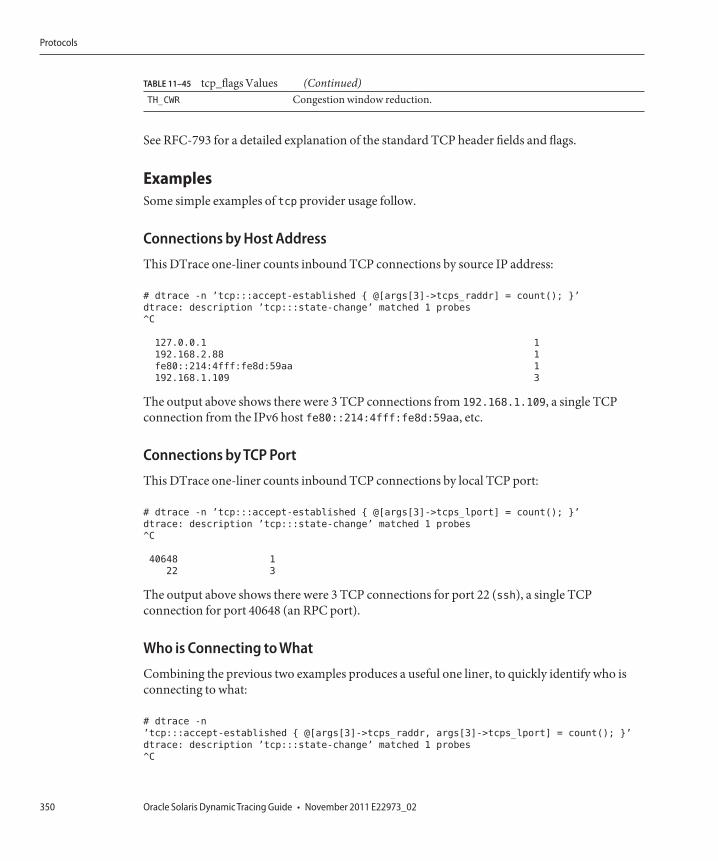
TABLE 11–45 tcp_flags Values (Continued)TH_CWR Congestion window reduction.
See RFC-793 for a detailed explanation of the standard TCP header fields and flags.
ExamplesSome simple examples of tcp provider usage follow.
Connections by Host Address
This DTrace one-liner counts inbound TCP connections by source IP address:
# dtrace -n ’tcp:::accept-established { @[args[3]->tcps_raddr] = count(); }’
dtrace: description ’tcp:::state-change’ matched 1 probes
^C
127.0.0.1 1
192.168.2.88 1
fe80::214:4fff:fe8d:59aa 1
192.168.1.109 3
The output above shows there were 3 TCP connections from 192.168.1.109, a single TCPconnection from the IPv6 host fe80::214:4fff:fe8d:59aa, etc.
Connections by TCP Port
This DTrace one-liner counts inbound TCP connections by local TCP port:
# dtrace -n ’tcp:::accept-established { @[args[3]->tcps_lport] = count(); }’
dtrace: description ’tcp:::state-change’ matched 1 probes
^C
40648 1
22 3
The output above shows there were 3 TCP connections for port 22 (ssh), a single TCPconnection for port 40648 (an RPC port).
Who is Connecting to What
Combining the previous two examples produces a useful one liner, to quickly identify who isconnecting to what:
# dtrace -n
’tcp:::accept-established { @[args[3]->tcps_raddr, args[3]->tcps_lport] = count(); }’
dtrace: description ’tcp:::state-change’ matched 1 probes
^C
Protocols
Oracle Solaris Dynamic Tracing Guide • November 2011 E22973_02350
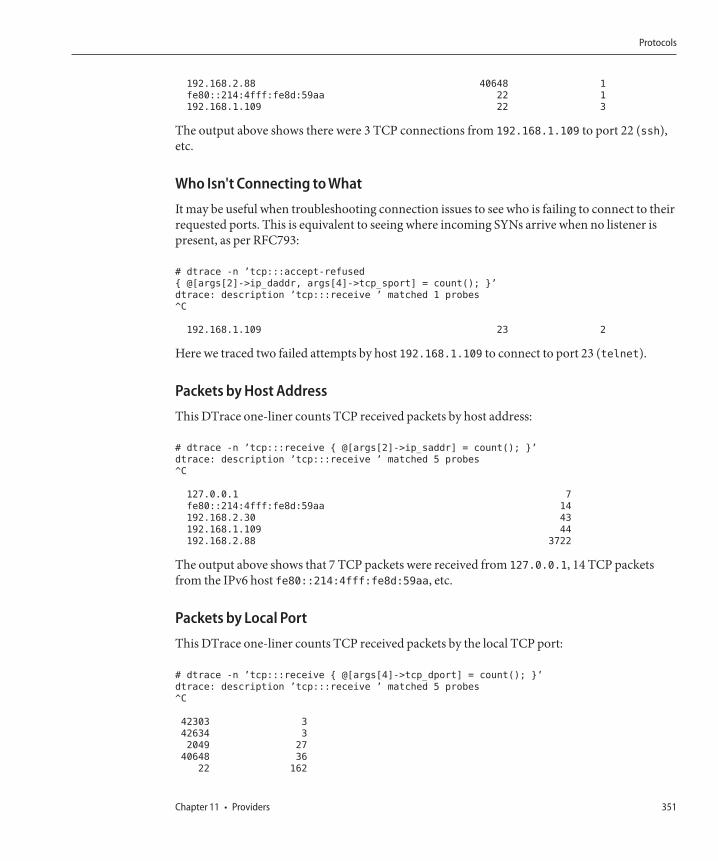
192.168.2.88 40648 1
fe80::214:4fff:fe8d:59aa 22 1
192.168.1.109 22 3
The output above shows there were 3 TCP connections from 192.168.1.109 to port 22 (ssh),etc.
Who Isn't Connecting to What
It may be useful when troubleshooting connection issues to see who is failing to connect to theirrequested ports. This is equivalent to seeing where incoming SYNs arrive when no listener ispresent, as per RFC793:
# dtrace -n ’tcp:::accept-refused
{ @[args[2]->ip_daddr, args[4]->tcp_sport] = count(); }’
dtrace: description ’tcp:::receive ’ matched 1 probes
^C
192.168.1.109 23 2
Here we traced two failed attempts by host 192.168.1.109 to connect to port 23 (telnet).
Packets by Host Address
This DTrace one-liner counts TCP received packets by host address:
# dtrace -n ’tcp:::receive { @[args[2]->ip_saddr] = count(); }’
dtrace: description ’tcp:::receive ’ matched 5 probes
^C
127.0.0.1 7
fe80::214:4fff:fe8d:59aa 14
192.168.2.30 43
192.168.1.109 44
192.168.2.88 3722
The output above shows that 7 TCP packets were received from 127.0.0.1, 14 TCP packetsfrom the IPv6 host fe80::214:4fff:fe8d:59aa, etc.
Packets by Local Port
This DTrace one-liner counts TCP received packets by the local TCP port:
# dtrace -n ’tcp:::receive { @[args[4]->tcp_dport] = count(); }’
dtrace: description ’tcp:::receive ’ matched 5 probes
^C
42303 3
42634 3
2049 27
40648 36
22 162
Protocols
Chapter 11 • Providers 351
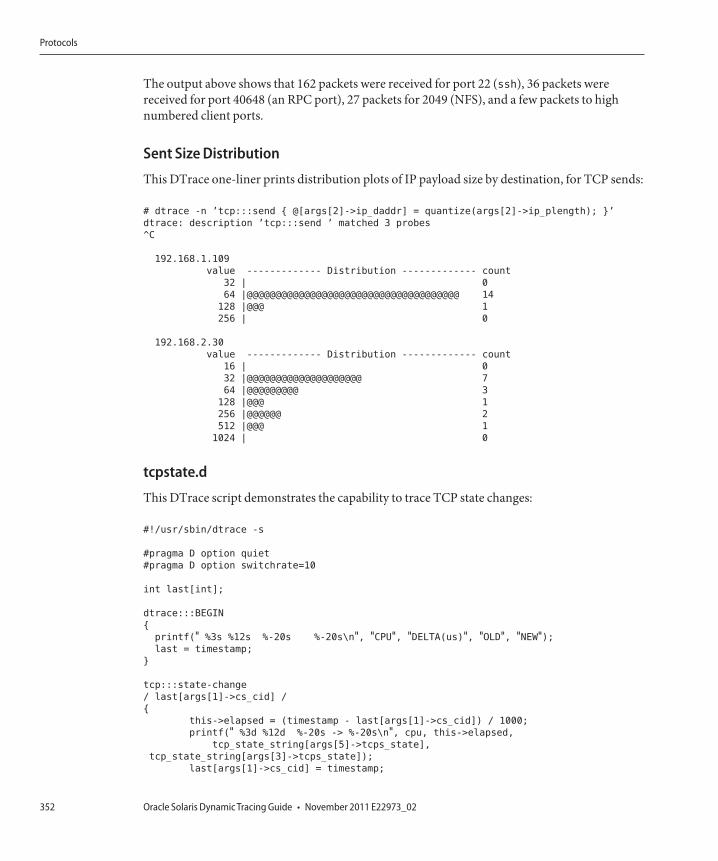
The output above shows that 162 packets were received for port 22 (ssh), 36 packets werereceived for port 40648 (an RPC port), 27 packets for 2049 (NFS), and a few packets to highnumbered client ports.
Sent Size Distribution
This DTrace one-liner prints distribution plots of IP payload size by destination, for TCP sends:
# dtrace -n ’tcp:::send { @[args[2]->ip_daddr] = quantize(args[2]->ip_plength); }’
dtrace: description ’tcp:::send ’ matched 3 probes
^C
192.168.1.109
value ------------- Distribution ------------- count
32 | 0
64 |@@@@@@@@@@@@@@@@@@@@@@@@@@@@@@@@@@@@@ 14
128 |@@@ 1
256 | 0
192.168.2.30
value ------------- Distribution ------------- count
16 | 0
32 |@@@@@@@@@@@@@@@@@@@@ 7
64 |@@@@@@@@@ 3
128 |@@@ 1
256 |@@@@@@ 2
512 |@@@ 1
1024 | 0
tcpstate.d
This DTrace script demonstrates the capability to trace TCP state changes:
#!/usr/sbin/dtrace -s
#pragma D option quiet
#pragma D option switchrate=10
int last[int];
dtrace:::BEGIN
{
printf(" %3s %12s %-20s %-20s\n", "CPU", "DELTA(us)", "OLD", "NEW");last = timestamp;
}
tcp:::state-change
/ last[args[1]->cs_cid] /
{
this->elapsed = (timestamp - last[args[1]->cs_cid]) / 1000;
printf(" %3d %12d %-20s -> %-20s\n", cpu, this->elapsed,
tcp_state_string[args[5]->tcps_state],
tcp_state_string[args[3]->tcps_state]);
last[args[1]->cs_cid] = timestamp;
Protocols
Oracle Solaris Dynamic Tracing Guide • November 2011 E22973_02352
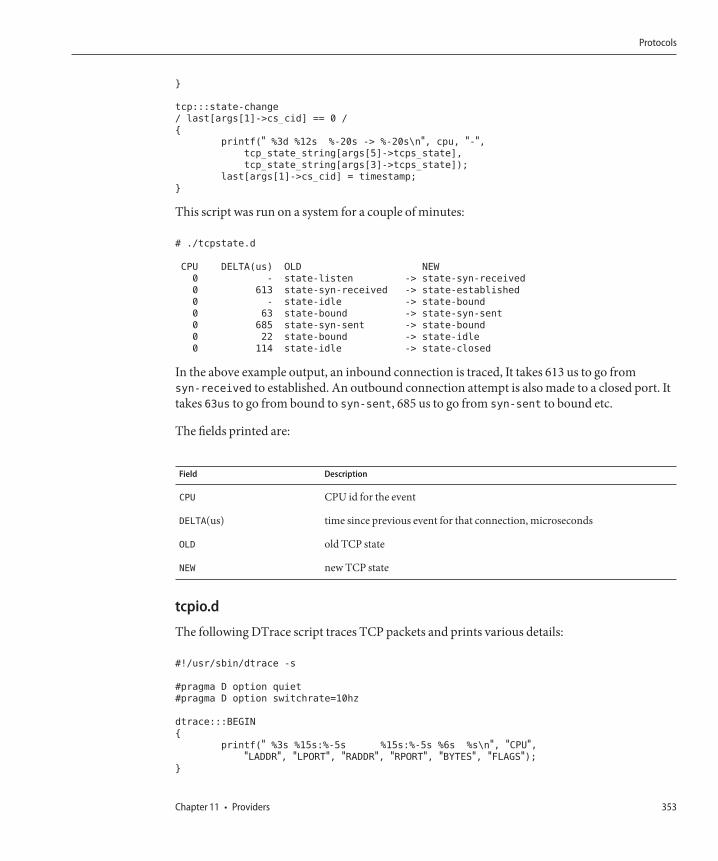
}
tcp:::state-change
/ last[args[1]->cs_cid] == 0 /
{
printf(" %3d %12s %-20s -> %-20s\n", cpu, "-",tcp_state_string[args[5]->tcps_state],
tcp_state_string[args[3]->tcps_state]);
last[args[1]->cs_cid] = timestamp;
}
This script was run on a system for a couple of minutes:
# ./tcpstate.d
CPU DELTA(us) OLD NEW
0 - state-listen -> state-syn-received
0 613 state-syn-received -> state-established
0 - state-idle -> state-bound
0 63 state-bound -> state-syn-sent
0 685 state-syn-sent -> state-bound
0 22 state-bound -> state-idle
0 114 state-idle -> state-closed
In the above example output, an inbound connection is traced, It takes 613 us to go fromsyn-received to established. An outbound connection attempt is also made to a closed port. Ittakes 63us to go from bound to syn-sent, 685 us to go from syn-sent to bound etc.
The fields printed are:
Field Description
CPU CPU id for the event
DELTA(us) time since previous event for that connection, microseconds
OLD old TCP state
NEW new TCP state
tcpio.d
The following DTrace script traces TCP packets and prints various details:
#!/usr/sbin/dtrace -s
#pragma D option quiet
#pragma D option switchrate=10hz
dtrace:::BEGIN
{
printf(" %3s %15s:%-5s %15s:%-5s %6s %s\n", "CPU","LADDR", "LPORT", "RADDR", "RPORT", "BYTES", "FLAGS");
}
Protocols
Chapter 11 • Providers 353
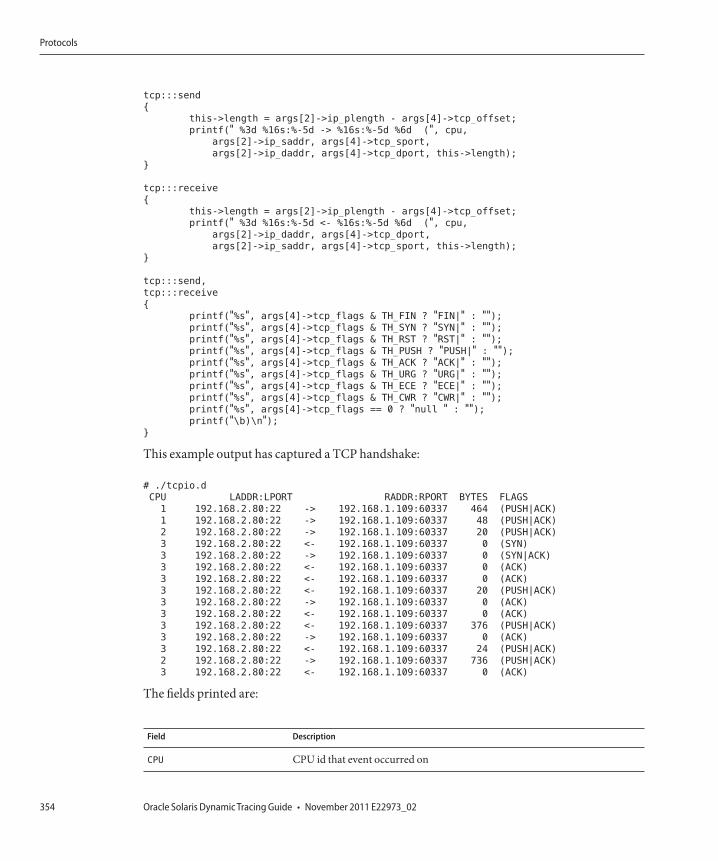
tcp:::send
{
this->length = args[2]->ip_plength - args[4]->tcp_offset;
printf(" %3d %16s:%-5d -> %16s:%-5d %6d (", cpu,
args[2]->ip_saddr, args[4]->tcp_sport,
args[2]->ip_daddr, args[4]->tcp_dport, this->length);
}
tcp:::receive
{
this->length = args[2]->ip_plength - args[4]->tcp_offset;
printf(" %3d %16s:%-5d <- %16s:%-5d %6d (", cpu,
args[2]->ip_daddr, args[4]->tcp_dport,
args[2]->ip_saddr, args[4]->tcp_sport, this->length);
}
tcp:::send,
tcp:::receive
{
printf("%s", args[4]->tcp_flags & TH_FIN ? "FIN|" : "");printf("%s", args[4]->tcp_flags & TH_SYN ? "SYN|" : "");printf("%s", args[4]->tcp_flags & TH_RST ? "RST|" : "");printf("%s", args[4]->tcp_flags & TH_PUSH ? "PUSH|" : "");printf("%s", args[4]->tcp_flags & TH_ACK ? "ACK|" : "");printf("%s", args[4]->tcp_flags & TH_URG ? "URG|" : "");printf("%s", args[4]->tcp_flags & TH_ECE ? "ECE|" : "");printf("%s", args[4]->tcp_flags & TH_CWR ? "CWR|" : "");printf("%s", args[4]->tcp_flags == 0 ? "null " : "");printf("\b)\n");
}
This example output has captured a TCP handshake:
# ./tcpio.d
CPU LADDR:LPORT RADDR:RPORT BYTES FLAGS
1 192.168.2.80:22 -> 192.168.1.109:60337 464 (PUSH|ACK)
1 192.168.2.80:22 -> 192.168.1.109:60337 48 (PUSH|ACK)
2 192.168.2.80:22 -> 192.168.1.109:60337 20 (PUSH|ACK)
3 192.168.2.80:22 <- 192.168.1.109:60337 0 (SYN)
3 192.168.2.80:22 -> 192.168.1.109:60337 0 (SYN|ACK)
3 192.168.2.80:22 <- 192.168.1.109:60337 0 (ACK)
3 192.168.2.80:22 <- 192.168.1.109:60337 0 (ACK)
3 192.168.2.80:22 <- 192.168.1.109:60337 20 (PUSH|ACK)
3 192.168.2.80:22 -> 192.168.1.109:60337 0 (ACK)
3 192.168.2.80:22 <- 192.168.1.109:60337 0 (ACK)
3 192.168.2.80:22 <- 192.168.1.109:60337 376 (PUSH|ACK)
3 192.168.2.80:22 -> 192.168.1.109:60337 0 (ACK)
3 192.168.2.80:22 <- 192.168.1.109:60337 24 (PUSH|ACK)
2 192.168.2.80:22 -> 192.168.1.109:60337 736 (PUSH|ACK)
3 192.168.2.80:22 <- 192.168.1.109:60337 0 (ACK)
The fields printed are:
Field Description
CPU CPU id that event occurred on
Protocols
Oracle Solaris Dynamic Tracing Guide • November 2011 E22973_02354
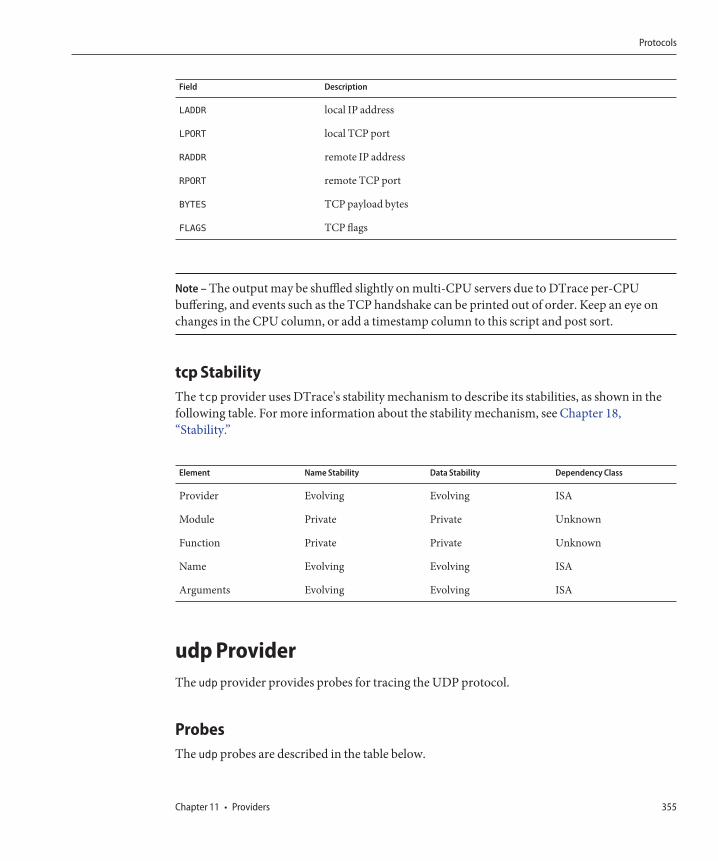
Field Description
LADDR local IP address
LPORT local TCP port
RADDR remote IP address
RPORT remote TCP port
BYTES TCP payload bytes
FLAGS TCP flags
Note – The output may be shuffled slightly on multi-CPU servers due to DTrace per-CPUbuffering, and events such as the TCP handshake can be printed out of order. Keep an eye onchanges in the CPU column, or add a timestamp column to this script and post sort.
tcp StabilityThe tcp provider uses DTrace's stability mechanism to describe its stabilities, as shown in thefollowing table. For more information about the stability mechanism, see Chapter 18,“Stability.”
Element Name Stability Data Stability Dependency Class
Provider Evolving Evolving ISA
Module Private Private Unknown
Function Private Private Unknown
Name Evolving Evolving ISA
Arguments Evolving Evolving ISA
udp ProviderThe udp provider provides probes for tracing the UDP protocol.
ProbesThe udp probes are described in the table below.
Protocols
Chapter 11 • Providers 355
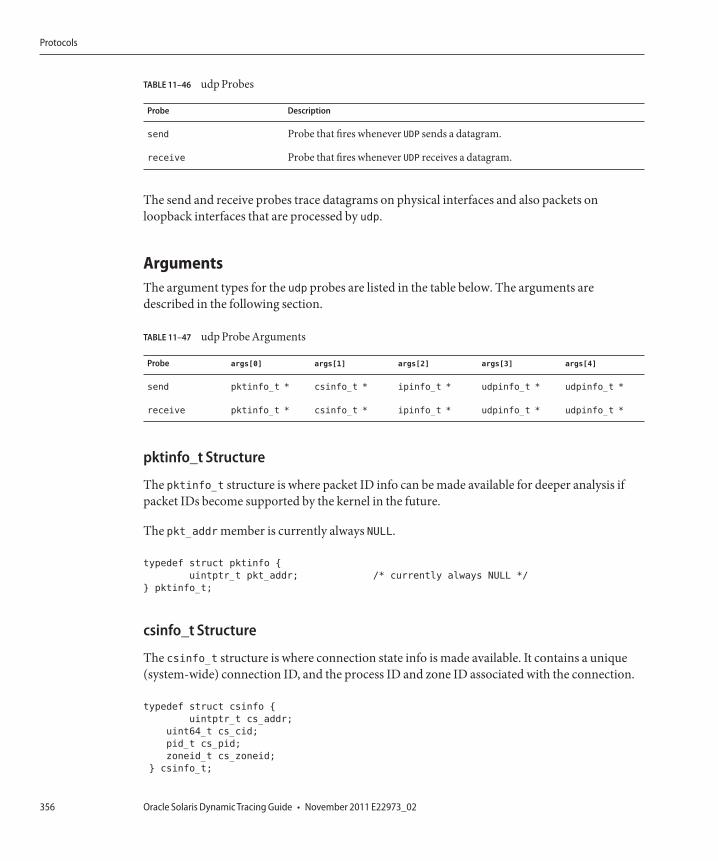
TABLE 11–46 udp Probes
Probe Description
send Probe that fires whenever UDP sends a datagram.
receive Probe that fires whenever UDP receives a datagram.
The send and receive probes trace datagrams on physical interfaces and also packets onloopback interfaces that are processed by udp.
ArgumentsThe argument types for the udp probes are listed in the table below. The arguments aredescribed in the following section.
TABLE 11–47 udp Probe Arguments
Probe args[0] args[1] args[2] args[3] args[4]
send pktinfo_t * csinfo_t * ipinfo_t * udpinfo_t * udpinfo_t *
receive pktinfo_t * csinfo_t * ipinfo_t * udpinfo_t * udpinfo_t *
pktinfo_t Structure
The pktinfo_t structure is where packet ID info can be made available for deeper analysis ifpacket IDs become supported by the kernel in the future.
The pkt_addr member is currently always NULL.
typedef struct pktinfo {
uintptr_t pkt_addr; /* currently always NULL */
} pktinfo_t;
csinfo_t Structure
The csinfo_t structure is where connection state info is made available. It contains a unique(system-wide) connection ID, and the process ID and zone ID associated with the connection.
typedef struct csinfo {
uintptr_t cs_addr;
uint64_t cs_cid;
pid_t cs_pid;
zoneid_t cs_zoneid;
} csinfo_t;
Protocols
Oracle Solaris Dynamic Tracing Guide • November 2011 E22973_02356
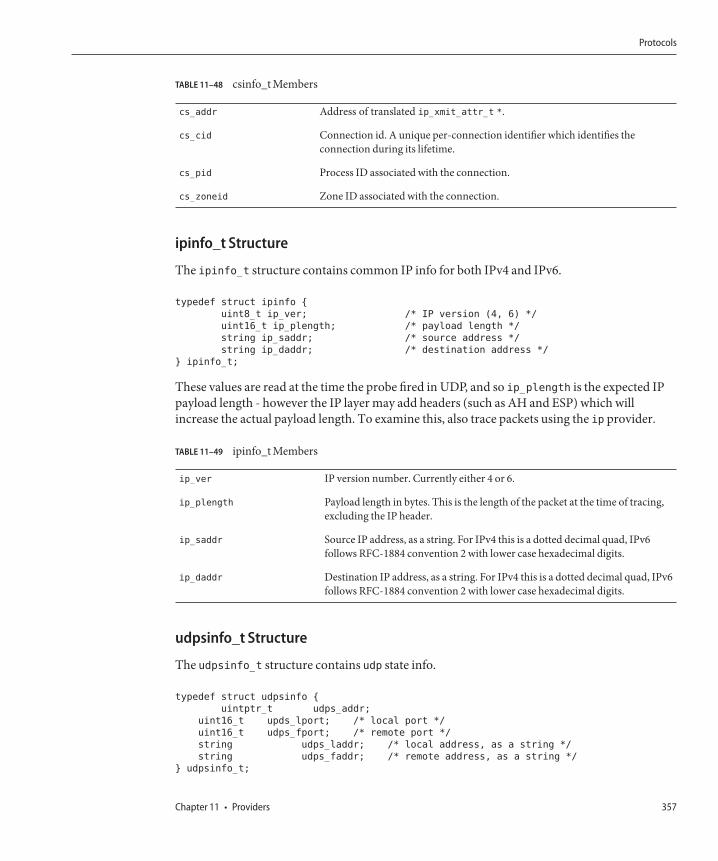
TABLE 11–48 csinfo_t Members
cs_addr Address of translated ip_xmit_attr_t *.
cs_cid Connection id. A unique per-connection identifier which identifies theconnection during its lifetime.
cs_pid Process ID associated with the connection.
cs_zoneid Zone ID associated with the connection.
ipinfo_t Structure
The ipinfo_t structure contains common IP info for both IPv4 and IPv6.
typedef struct ipinfo {
uint8_t ip_ver; /* IP version (4, 6) */
uint16_t ip_plength; /* payload length */
string ip_saddr; /* source address */
string ip_daddr; /* destination address */
} ipinfo_t;
These values are read at the time the probe fired in UDP, and so ip_plength is the expected IPpayload length - however the IP layer may add headers (such as AH and ESP) which willincrease the actual payload length. To examine this, also trace packets using the ip provider.
TABLE 11–49 ipinfo_t Members
ip_ver IP version number. Currently either 4 or 6.
ip_plength Payload length in bytes. This is the length of the packet at the time of tracing,excluding the IP header.
ip_saddr Source IP address, as a string. For IPv4 this is a dotted decimal quad, IPv6follows RFC-1884 convention 2 with lower case hexadecimal digits.
ip_daddr Destination IP address, as a string. For IPv4 this is a dotted decimal quad, IPv6follows RFC-1884 convention 2 with lower case hexadecimal digits.
udpsinfo_t Structure
The udpsinfo_t structure contains udp state info.
typedef struct udpsinfo {
uintptr_t udps_addr;
uint16_t upds_lport; /* local port */
uint16_t udps_fport; /* remote port */
string udps_laddr; /* local address, as a string */
string udps_faddr; /* remote address, as a string */
} udpsinfo_t;
Protocols
Chapter 11 • Providers 357
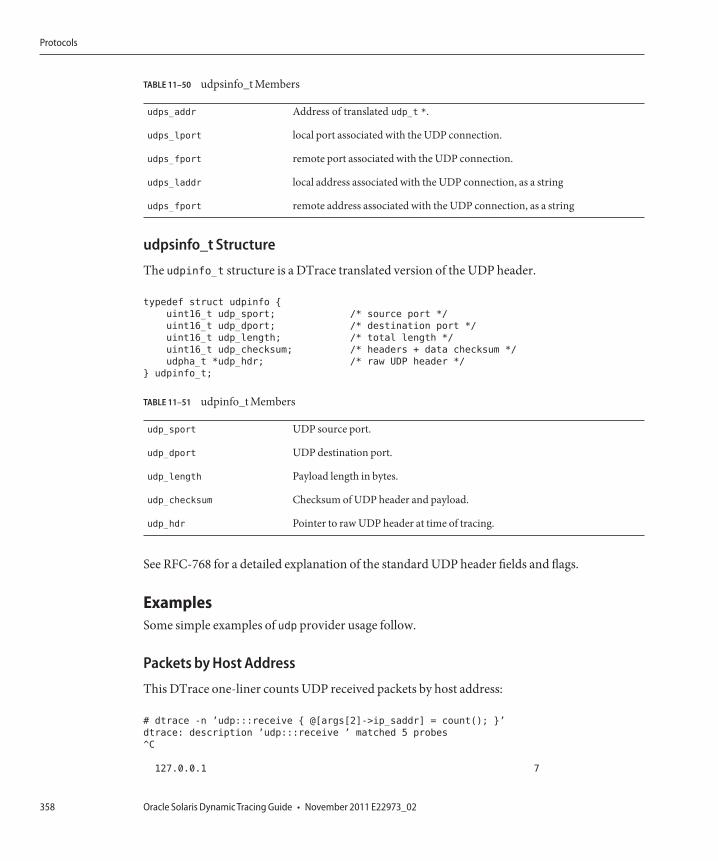
TABLE 11–50 udpsinfo_t Members
udps_addr Address of translated udp_t *.
udps_lport local port associated with the UDP connection.
udps_fport remote port associated with the UDP connection.
udps_laddr local address associated with the UDP connection, as a string
udps_fport remote address associated with the UDP connection, as a string
udpsinfo_t Structure
The udpinfo_t structure is a DTrace translated version of the UDP header.
typedef struct udpinfo {
uint16_t udp_sport; /* source port */
uint16_t udp_dport; /* destination port */
uint16_t udp_length; /* total length */
uint16_t udp_checksum; /* headers + data checksum */
udpha_t *udp_hdr; /* raw UDP header */
} udpinfo_t;
TABLE 11–51 udpinfo_t Members
udp_sport UDP source port.
udp_dport UDP destination port.
udp_length Payload length in bytes.
udp_checksum Checksum of UDP header and payload.
udp_hdr Pointer to raw UDP header at time of tracing.
See RFC-768 for a detailed explanation of the standard UDP header fields and flags.
ExamplesSome simple examples of udp provider usage follow.
Packets by Host Address
This DTrace one-liner counts UDP received packets by host address:
# dtrace -n ’udp:::receive { @[args[2]->ip_saddr] = count(); }’
dtrace: description ’udp:::receive ’ matched 5 probes
^C
127.0.0.1 7
Protocols
Oracle Solaris Dynamic Tracing Guide • November 2011 E22973_02358
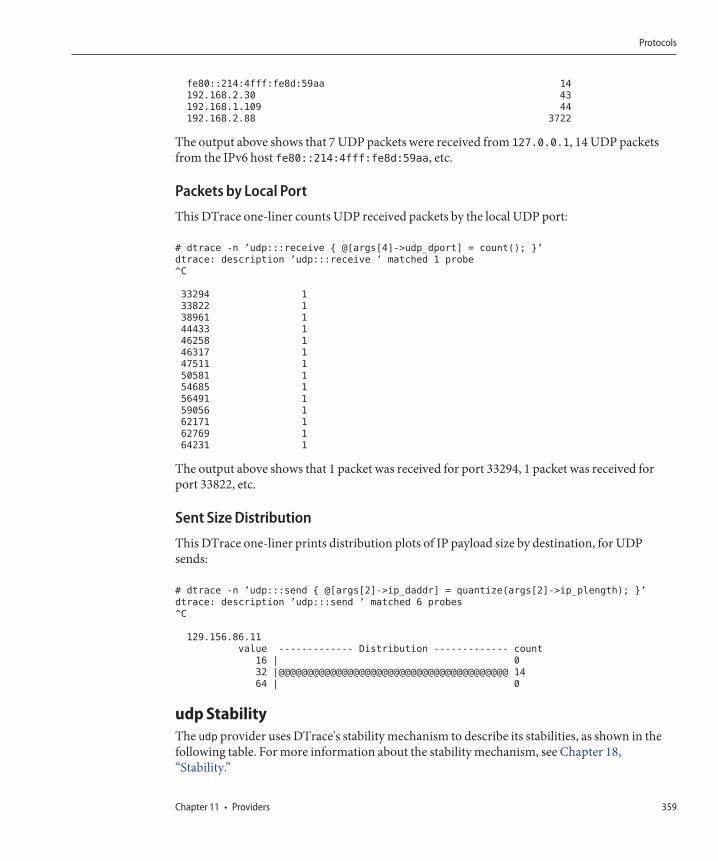
fe80::214:4fff:fe8d:59aa 14
192.168.2.30 43
192.168.1.109 44
192.168.2.88 3722
The output above shows that 7 UDP packets were received from 127.0.0.1, 14 UDP packetsfrom the IPv6 host fe80::214:4fff:fe8d:59aa, etc.
Packets by Local Port
This DTrace one-liner counts UDP received packets by the local UDP port:
# dtrace -n ’udp:::receive { @[args[4]->udp_dport] = count(); }’
dtrace: description ’udp:::receive ’ matched 1 probe
^C
33294 1
33822 1
38961 1
44433 1
46258 1
46317 1
47511 1
50581 1
54685 1
56491 1
59056 1
62171 1
62769 1
64231 1
The output above shows that 1 packet was received for port 33294, 1 packet was received forport 33822, etc.
Sent Size Distribution
This DTrace one-liner prints distribution plots of IP payload size by destination, for UDPsends:
# dtrace -n ’udp:::send { @[args[2]->ip_daddr] = quantize(args[2]->ip_plength); }’
dtrace: description ’udp:::send ’ matched 6 probes
^C
129.156.86.11
value ------------- Distribution ------------- count
16 | 0
32 |@@@@@@@@@@@@@@@@@@@@@@@@@@@@@@@@@@@@@@@@ 14
64 | 0
udp StabilityThe udp provider uses DTrace's stability mechanism to describe its stabilities, as shown in thefollowing table. For more information about the stability mechanism, see Chapter 18,“Stability.”
Protocols
Chapter 11 • Providers 359
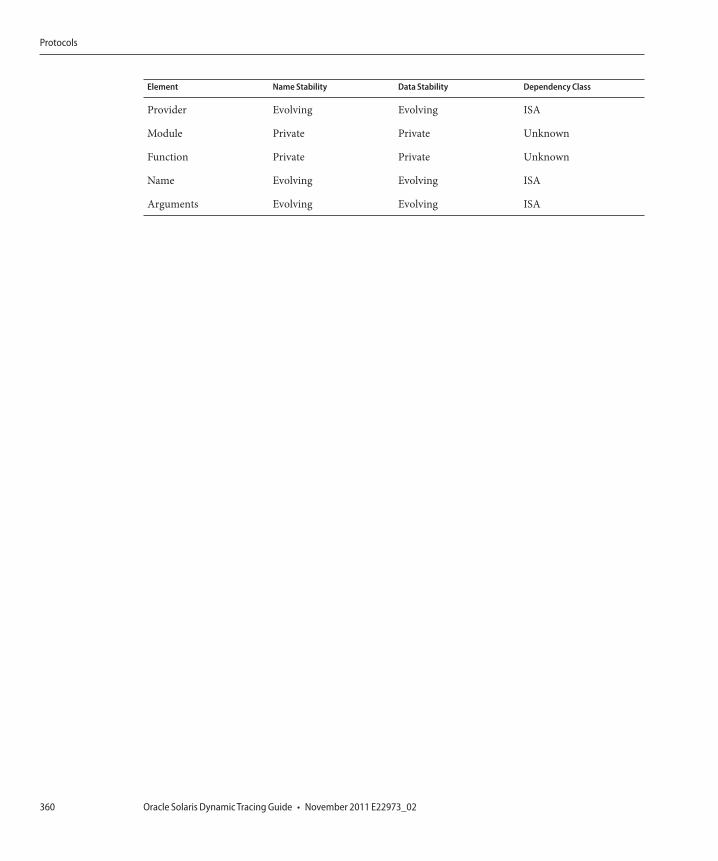
Element Name Stability Data Stability Dependency Class
Provider Evolving Evolving ISA
Module Private Private Unknown
Function Private Private Unknown
Name Evolving Evolving ISA
Arguments Evolving Evolving ISA
Protocols
Oracle Solaris Dynamic Tracing Guide • November 2011 E22973_02360
User Process Tracing
DTrace is an extremely powerful tool for understanding the behavior of user processes. DTracecan be invaluable when debugging, analyzing performance problems, or simply understandingthe behavior of a complex application. This chapter focuses on the DTrace facilities relevant fortracing user process activity and provides examples to illustrate their use.
copyin and copyinstr SubroutinesDTrace's interaction with processes is a little different than most traditional debuggers orobservability tools. Many such tools appear to execute within the scope of the process, lettingusers dereference pointers to program variables directly. Rather than appearing to executewithin or as part of the process itself, DTrace probes execute in the Oracle Solaris kernel. Toaccess process data, a probe needs to use the copyin or copyinstr subroutines to copy userprocess data into the address space of the kernel.
For example, consider the following write(2) system call:
ssize_t write(int fd, const void *buf, size_t nbytes);
The following D program illustrates an incorrect attempt to print the contents of a string passedto the write(2) system call:
syscall::write:entry
{
printf("%s", stringof(arg1)); /* incorrect use of arg1 */
}
If you try to run this script, DTrace will produce error messages similar to the followingexample:
dtrace: error on enabled probe ID 1 (ID 37: syscall::write:entry): \
invalid address (0x10038a000) in action #1
12C H A P T E R 1 2
361
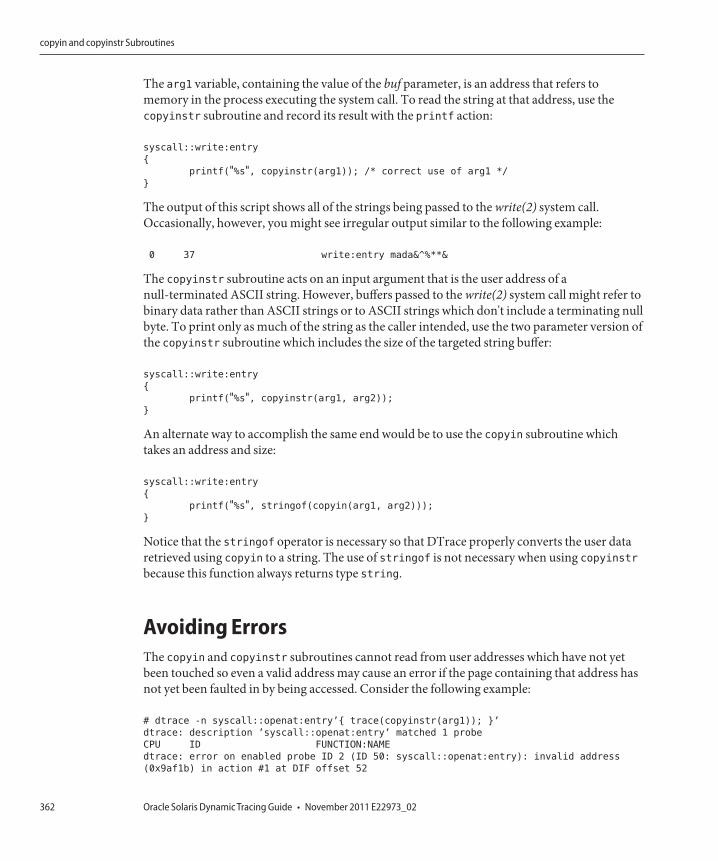
The arg1 variable, containing the value of the buf parameter, is an address that refers tomemory in the process executing the system call. To read the string at that address, use thecopyinstr subroutine and record its result with the printf action:
syscall::write:entry
{
printf("%s", copyinstr(arg1)); /* correct use of arg1 */
}
The output of this script shows all of the strings being passed to the write(2) system call.Occasionally, however, you might see irregular output similar to the following example:
0 37 write:entry mada&^%**&
The copyinstr subroutine acts on an input argument that is the user address of anull-terminated ASCII string. However, buffers passed to the write(2) system call might refer tobinary data rather than ASCII strings or to ASCII strings which don't include a terminating nullbyte. To print only as much of the string as the caller intended, use the two parameter version ofthe copyinstr subroutine which includes the size of the targeted string buffer:
syscall::write:entry
{
printf("%s", copyinstr(arg1, arg2));
}
An alternate way to accomplish the same end would be to use the copyin subroutine whichtakes an address and size:
syscall::write:entry
{
printf("%s", stringof(copyin(arg1, arg2)));
}
Notice that the stringof operator is necessary so that DTrace properly converts the user dataretrieved using copyin to a string. The use of stringof is not necessary when using copyinstrbecause this function always returns type string.
Avoiding ErrorsThe copyin and copyinstr subroutines cannot read from user addresses which have not yetbeen touched so even a valid address may cause an error if the page containing that address hasnot yet been faulted in by being accessed. Consider the following example:
# dtrace -n syscall::openat:entry’{ trace(copyinstr(arg1)); }’
dtrace: description ’syscall::openat:entry’ matched 1 probe
CPU ID FUNCTION:NAME
dtrace: error on enabled probe ID 2 (ID 50: syscall::openat:entry): invalid address
(0x9af1b) in action #1 at DIF offset 52
copyin and copyinstr Subroutines
Oracle Solaris Dynamic Tracing Guide • November 2011 E22973_02362
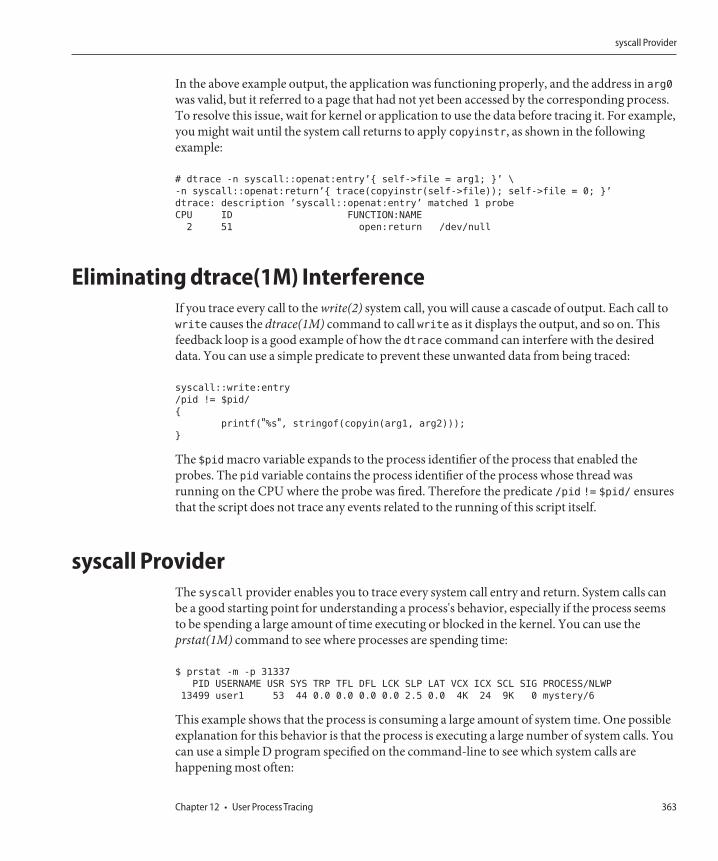
In the above example output, the application was functioning properly, and the address in arg0
was valid, but it referred to a page that had not yet been accessed by the corresponding process.To resolve this issue, wait for kernel or application to use the data before tracing it. For example,you might wait until the system call returns to apply copyinstr, as shown in the followingexample:
# dtrace -n syscall::openat:entry’{ self->file = arg1; }’ \
-n syscall::openat:return’{ trace(copyinstr(self->file)); self->file = 0; }’
dtrace: description ’syscall::openat:entry’ matched 1 probe
CPU ID FUNCTION:NAME
2 51 open:return /dev/null
Eliminating dtrace(1M) InterferenceIf you trace every call to the write(2) system call, you will cause a cascade of output. Each call towrite causes the dtrace(1M) command to call write as it displays the output, and so on. Thisfeedback loop is a good example of how the dtrace command can interfere with the desireddata. You can use a simple predicate to prevent these unwanted data from being traced:
syscall::write:entry
/pid != $pid/
{
printf("%s", stringof(copyin(arg1, arg2)));
}
The $pid macro variable expands to the process identifier of the process that enabled theprobes. The pid variable contains the process identifier of the process whose thread wasrunning on the CPU where the probe was fired. Therefore the predicate /pid != $pid/ ensuresthat the script does not trace any events related to the running of this script itself.
syscall ProviderThe syscall provider enables you to trace every system call entry and return. System calls canbe a good starting point for understanding a process's behavior, especially if the process seemsto be spending a large amount of time executing or blocked in the kernel. You can use theprstat(1M) command to see where processes are spending time:
$ prstat -m -p 31337
PID USERNAME USR SYS TRP TFL DFL LCK SLP LAT VCX ICX SCL SIG PROCESS/NLWP
13499 user1 53 44 0.0 0.0 0.0 0.0 2.5 0.0 4K 24 9K 0 mystery/6
This example shows that the process is consuming a large amount of system time. One possibleexplanation for this behavior is that the process is executing a large number of system calls. Youcan use a simple D program specified on the command-line to see which system calls arehappening most often:
syscall Provider
Chapter 12 • User Process Tracing 363
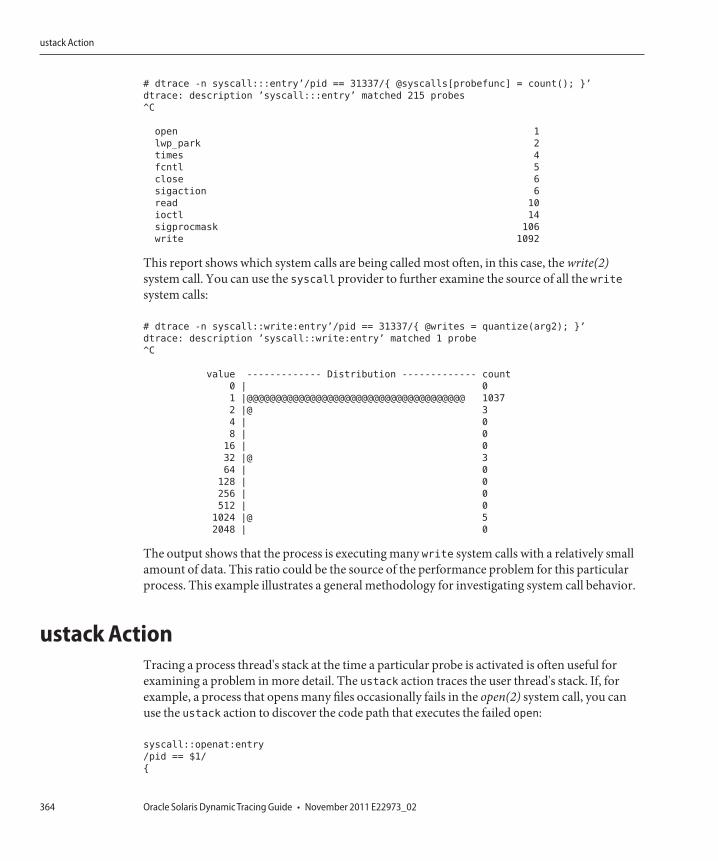
# dtrace -n syscall:::entry’/pid == 31337/{ @syscalls[probefunc] = count(); }’
dtrace: description ’syscall:::entry’ matched 215 probes
^C
open 1
lwp_park 2
times 4
fcntl 5
close 6
sigaction 6
read 10
ioctl 14
sigprocmask 106
write 1092
This report shows which system calls are being called most often, in this case, the write(2)system call. You can use the syscall provider to further examine the source of all the writesystem calls:
# dtrace -n syscall::write:entry’/pid == 31337/{ @writes = quantize(arg2); }’
dtrace: description ’syscall::write:entry’ matched 1 probe
^C
value ------------- Distribution ------------- count
0 | 0
1 |@@@@@@@@@@@@@@@@@@@@@@@@@@@@@@@@@@@@@@ 1037
2 |@ 3
4 | 0
8 | 0
16 | 0
32 |@ 3
64 | 0
128 | 0
256 | 0
512 | 0
1024 |@ 5
2048 | 0
The output shows that the process is executing many write system calls with a relatively smallamount of data. This ratio could be the source of the performance problem for this particularprocess. This example illustrates a general methodology for investigating system call behavior.
ustack ActionTracing a process thread's stack at the time a particular probe is activated is often useful forexamining a problem in more detail. The ustack action traces the user thread's stack. If, forexample, a process that opens many files occasionally fails in the open(2) system call, you canuse the ustack action to discover the code path that executes the failed open:
syscall::openat:entry
/pid == $1/
{
ustack Action
Oracle Solaris Dynamic Tracing Guide • November 2011 E22973_02364
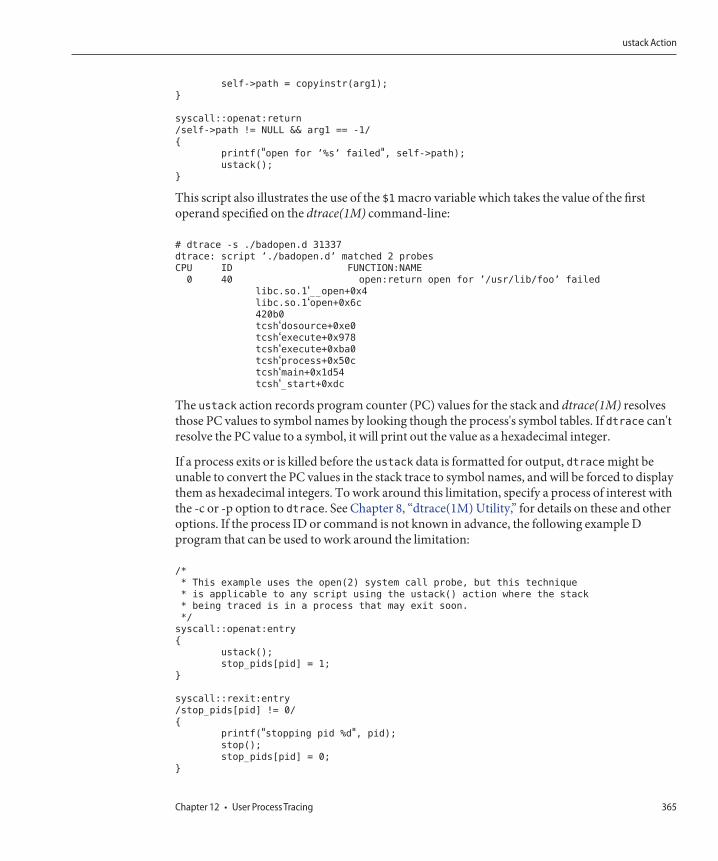
self->path = copyinstr(arg1);
}
syscall::openat:return
/self->path != NULL && arg1 == -1/
{
printf("open for ’%s’ failed", self->path);
ustack();
}
This script also illustrates the use of the $1 macro variable which takes the value of the firstoperand specified on the dtrace(1M) command-line:
# dtrace -s ./badopen.d 31337
dtrace: script ’./badopen.d’ matched 2 probes
CPU ID FUNCTION:NAME
0 40 open:return open for ’/usr/lib/foo’ failed
libc.so.1‘__open+0x4libc.so.1‘open+0x6c420b0
tcsh‘dosource+0xe0tcsh‘execute+0x978tcsh‘execute+0xba0tcsh‘process+0x50ctcsh‘main+0x1d54tcsh‘_start+0xdc
The ustack action records program counter (PC) values for the stack and dtrace(1M) resolvesthose PC values to symbol names by looking though the process's symbol tables. If dtrace can'tresolve the PC value to a symbol, it will print out the value as a hexadecimal integer.
If a process exits or is killed before the ustack data is formatted for output, dtrace might beunable to convert the PC values in the stack trace to symbol names, and will be forced to displaythem as hexadecimal integers. To work around this limitation, specify a process of interest withthe -c or -p option to dtrace. See Chapter 8, “dtrace(1M) Utility,” for details on these and otheroptions. If the process ID or command is not known in advance, the following example Dprogram that can be used to work around the limitation:
/*
* This example uses the open(2) system call probe, but this technique
* is applicable to any script using the ustack() action where the stack
* being traced is in a process that may exit soon.
*/
syscall::openat:entry
{
ustack();
stop_pids[pid] = 1;
}
syscall::rexit:entry
/stop_pids[pid] != 0/
{
printf("stopping pid %d", pid);
stop();
stop_pids[pid] = 0;
}
ustack Action
Chapter 12 • User Process Tracing 365
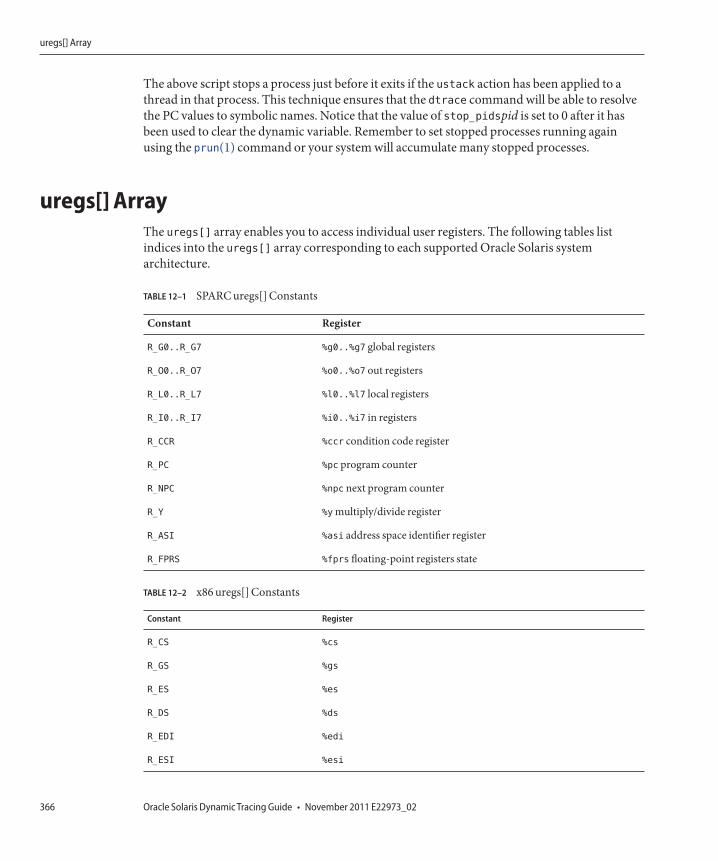
The above script stops a process just before it exits if the ustack action has been applied to athread in that process. This technique ensures that the dtrace command will be able to resolvethe PC values to symbolic names. Notice that the value of stop_pidspid is set to 0 after it hasbeen used to clear the dynamic variable. Remember to set stopped processes running againusing the prun(1) command or your system will accumulate many stopped processes.
uregs[] ArrayThe uregs[] array enables you to access individual user registers. The following tables listindices into the uregs[] array corresponding to each supported Oracle Solaris systemarchitecture.
TABLE 12–1 SPARC uregs[] Constants
Constant Register
R_G0..R_G7 %g0..%g7 global registers
R_O0..R_O7 %o0..%o7 out registers
R_L0..R_L7 %l0..%l7 local registers
R_I0..R_I7 %i0..%i7 in registers
R_CCR %ccr condition code register
R_PC %pc program counter
R_NPC %npc next program counter
R_Y %y multiply/divide register
R_ASI %asi address space identifier register
R_FPRS %fprs floating-point registers state
TABLE 12–2 x86 uregs[] Constants
Constant Register
R_CS %cs
R_GS %gs
R_ES %es
R_DS %ds
R_EDI %edi
R_ESI %esi
uregs[] Array
Oracle Solaris Dynamic Tracing Guide • November 2011 E22973_02366
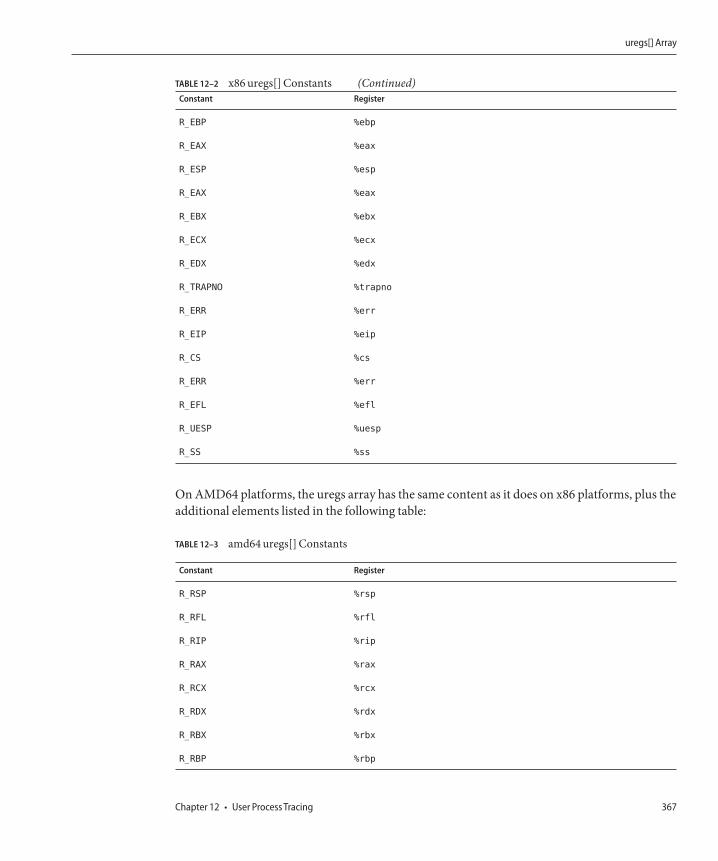
TABLE 12–2 x86 uregs[] Constants (Continued)Constant Register
R_EBP %ebp
R_EAX %eax
R_ESP %esp
R_EAX %eax
R_EBX %ebx
R_ECX %ecx
R_EDX %edx
R_TRAPNO %trapno
R_ERR %err
R_EIP %eip
R_CS %cs
R_ERR %err
R_EFL %efl
R_UESP %uesp
R_SS %ss
On AMD64 platforms, the uregs array has the same content as it does on x86 platforms, plus theadditional elements listed in the following table:
TABLE 12–3 amd64 uregs[] Constants
Constant Register
R_RSP %rsp
R_RFL %rfl
R_RIP %rip
R_RAX %rax
R_RCX %rcx
R_RDX %rdx
R_RBX %rbx
R_RBP %rbp
uregs[] Array
Chapter 12 • User Process Tracing 367
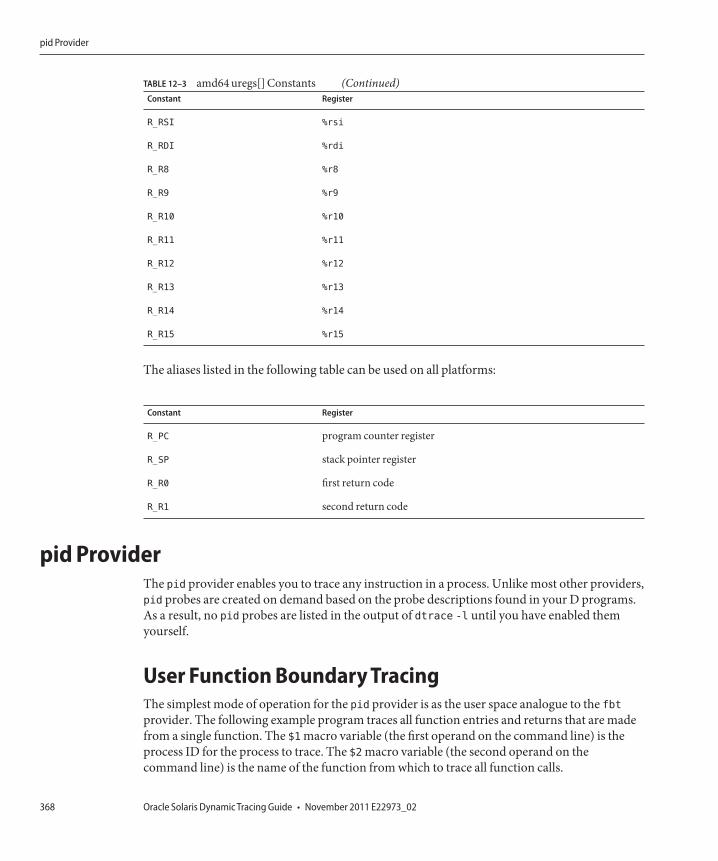
TABLE 12–3 amd64 uregs[] Constants (Continued)Constant Register
R_RSI %rsi
R_RDI %rdi
R_R8 %r8
R_R9 %r9
R_R10 %r10
R_R11 %r11
R_R12 %r12
R_R13 %r13
R_R14 %r14
R_R15 %r15
The aliases listed in the following table can be used on all platforms:
Constant Register
R_PC program counter register
R_SP stack pointer register
R_R0 first return code
R_R1 second return code
pid ProviderThe pid provider enables you to trace any instruction in a process. Unlike most other providers,pid probes are created on demand based on the probe descriptions found in your D programs.As a result, no pid probes are listed in the output of dtrace -l until you have enabled themyourself.
User Function Boundary TracingThe simplest mode of operation for the pid provider is as the user space analogue to the fbtprovider. The following example program traces all function entries and returns that are madefrom a single function. The $1 macro variable (the first operand on the command line) is theprocess ID for the process to trace. The $2 macro variable (the second operand on thecommand line) is the name of the function from which to trace all function calls.
pid Provider
Oracle Solaris Dynamic Tracing Guide • November 2011 E22973_02368
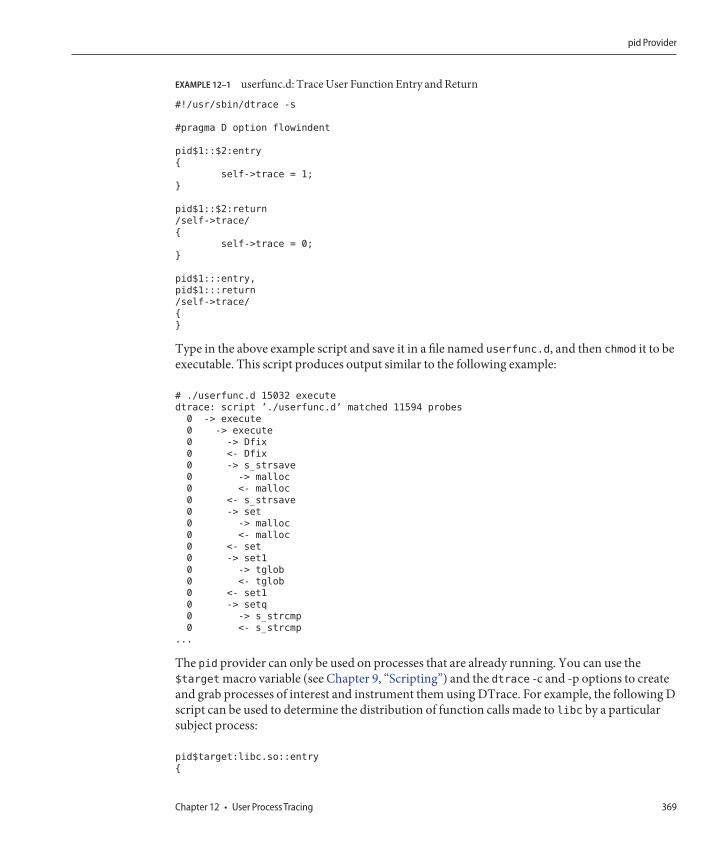
EXAMPLE 12–1 userfunc.d: Trace User Function Entry and Return
#!/usr/sbin/dtrace -s
#pragma D option flowindent
pid$1::$2:entry
{
self->trace = 1;
}
pid$1::$2:return
/self->trace/
{
self->trace = 0;
}
pid$1:::entry,
pid$1:::return
/self->trace/
{
}
Type in the above example script and save it in a file named userfunc.d, and then chmod it to beexecutable. This script produces output similar to the following example:
# ./userfunc.d 15032 execute
dtrace: script ’./userfunc.d’ matched 11594 probes
0 -> execute
0 -> execute
0 -> Dfix
0 <- Dfix
0 -> s_strsave
0 -> malloc
0 <- malloc
0 <- s_strsave
0 -> set
0 -> malloc
0 <- malloc
0 <- set
0 -> set1
0 -> tglob
0 <- tglob
0 <- set1
0 -> setq
0 -> s_strcmp
0 <- s_strcmp
...
The pid provider can only be used on processes that are already running. You can use the$target macro variable (see Chapter 9, “Scripting”) and the dtrace -c and -p options to createand grab processes of interest and instrument them using DTrace. For example, the following Dscript can be used to determine the distribution of function calls made to libc by a particularsubject process:
pid$target:libc.so::entry
{
pid Provider
Chapter 12 • User Process Tracing 369
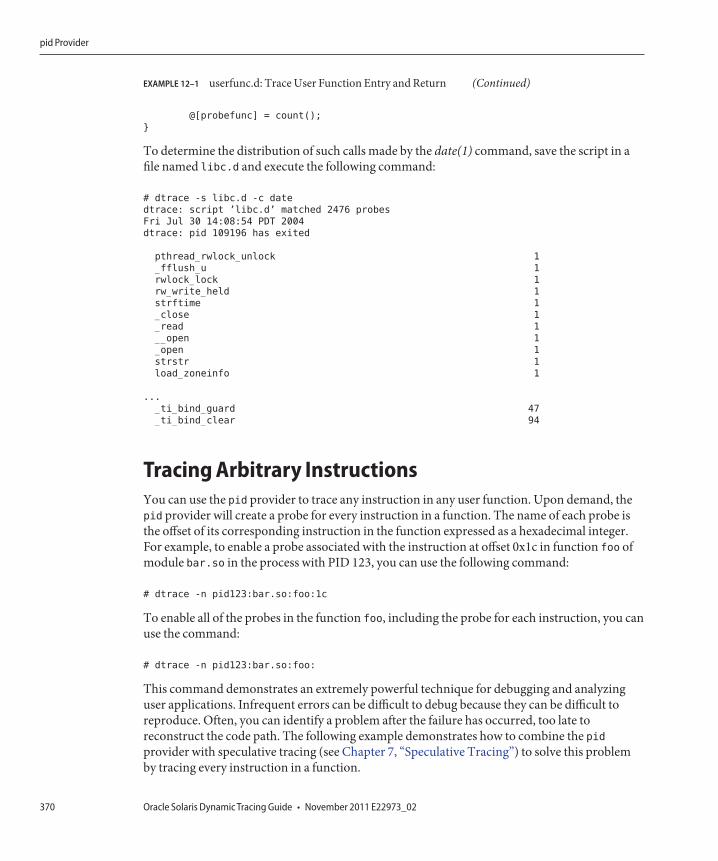
EXAMPLE 12–1 userfunc.d: Trace User Function Entry and Return (Continued)
@[probefunc] = count();
}
To determine the distribution of such calls made by the date(1) command, save the script in afile named libc.d and execute the following command:
# dtrace -s libc.d -c date
dtrace: script ’libc.d’ matched 2476 probes
Fri Jul 30 14:08:54 PDT 2004
dtrace: pid 109196 has exited
pthread_rwlock_unlock 1
_fflush_u 1
rwlock_lock 1
rw_write_held 1
strftime 1
_close 1
_read 1
__open 1
_open 1
strstr 1
load_zoneinfo 1
...
_ti_bind_guard 47
_ti_bind_clear 94
Tracing Arbitrary InstructionsYou can use the pid provider to trace any instruction in any user function. Upon demand, thepid provider will create a probe for every instruction in a function. The name of each probe isthe offset of its corresponding instruction in the function expressed as a hexadecimal integer.For example, to enable a probe associated with the instruction at offset 0x1c in function foo ofmodule bar.so in the process with PID 123, you can use the following command:
# dtrace -n pid123:bar.so:foo:1c
To enable all of the probes in the function foo, including the probe for each instruction, you canuse the command:
# dtrace -n pid123:bar.so:foo:
This command demonstrates an extremely powerful technique for debugging and analyzinguser applications. Infrequent errors can be difficult to debug because they can be difficult toreproduce. Often, you can identify a problem after the failure has occurred, too late toreconstruct the code path. The following example demonstrates how to combine the pidprovider with speculative tracing (see Chapter 7, “Speculative Tracing”) to solve this problemby tracing every instruction in a function.
pid Provider
Oracle Solaris Dynamic Tracing Guide • November 2011 E22973_02370
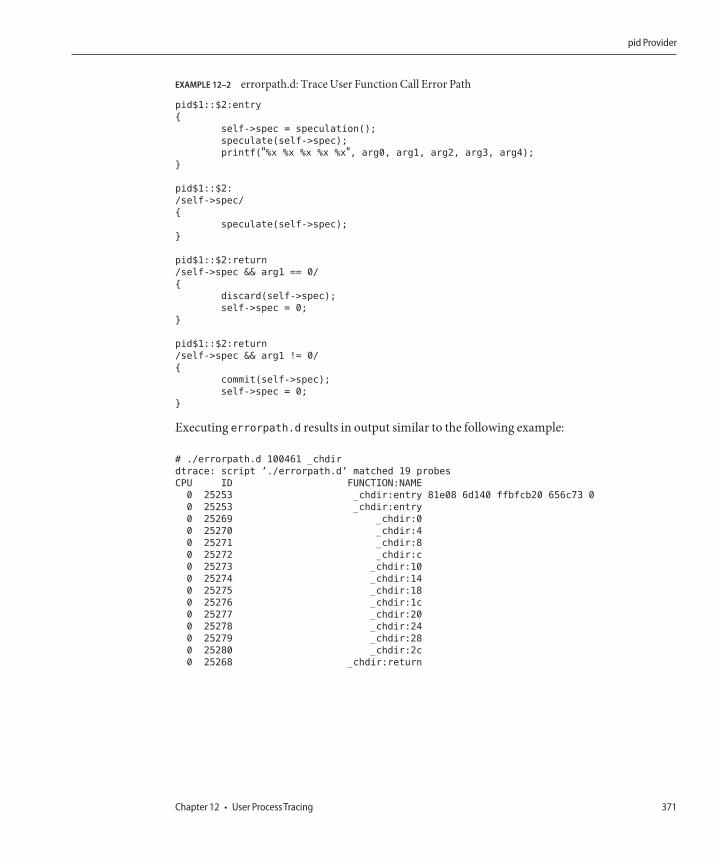
EXAMPLE 12–2 errorpath.d: Trace User Function Call Error Path
pid$1::$2:entry
{
self->spec = speculation();
speculate(self->spec);
printf("%x %x %x %x %x", arg0, arg1, arg2, arg3, arg4);
}
pid$1::$2:
/self->spec/
{
speculate(self->spec);
}
pid$1::$2:return
/self->spec && arg1 == 0/
{
discard(self->spec);
self->spec = 0;
}
pid$1::$2:return
/self->spec && arg1 != 0/
{
commit(self->spec);
self->spec = 0;
}
Executing errorpath.d results in output similar to the following example:
# ./errorpath.d 100461 _chdir
dtrace: script ’./errorpath.d’ matched 19 probes
CPU ID FUNCTION:NAME
0 25253 _chdir:entry 81e08 6d140 ffbfcb20 656c73 0
0 25253 _chdir:entry
0 25269 _chdir:0
0 25270 _chdir:4
0 25271 _chdir:8
0 25272 _chdir:c
0 25273 _chdir:10
0 25274 _chdir:14
0 25275 _chdir:18
0 25276 _chdir:1c
0 25277 _chdir:20
0 25278 _chdir:24
0 25279 _chdir:28
0 25280 _chdir:2c
0 25268 _chdir:return
pid Provider
Chapter 12 • User Process Tracing 371

372
Statically Defined Tracing for User Applications
DTrace provides a facility for user application developers to define customized probes inapplication code to augment the capabilities of the pid provider. These static probes imposelittle to no overhead when disabled and are dynamically enabled like all other DTrace probes.You can use static probes to describe application semantics to users of DTrace without exposingor requiring implementation knowledge of your applications. This chapter describes how todefine static probes in user applications and how to use DTrace to enable such probes in userprocesses.
Choosing the Probe PointsDTrace allows developers to embed static probe points in application code, including bothcomplete applications and shared libraries. These probes can be enabled wherever theapplication or library is running, either in development or in production. You should defineprobes that have a semantic meaning that is readily understood by your DTrace usercommunity. For example, you could define query-receive and query-respond probes for aweb server that correspond to a client submitting a request and the web server responding tothat request. These example probes are easily understood by most DTrace users and correspondto the highest level abstractions for the application, rather than lower level implementationdetails. DTrace users might use these probes to understand the time distribution of requests. Ifyour query-receive probe presented the URL request strings as an argument, a DTrace usercould determine which requests were generating the most disk I/O by combining this probewith the io provider.
You should also consider the stability of the abstractions you describe when choosing probenames and locations. Will this probe persist in future releases of the application, even if theimplementation changes? Does the probe make sense on all system architectures or is it specificto a particular instruction set? This chapter will discuss the details of how these decisions guideyour static tracing definitions.
13C H A P T E R 1 3
373
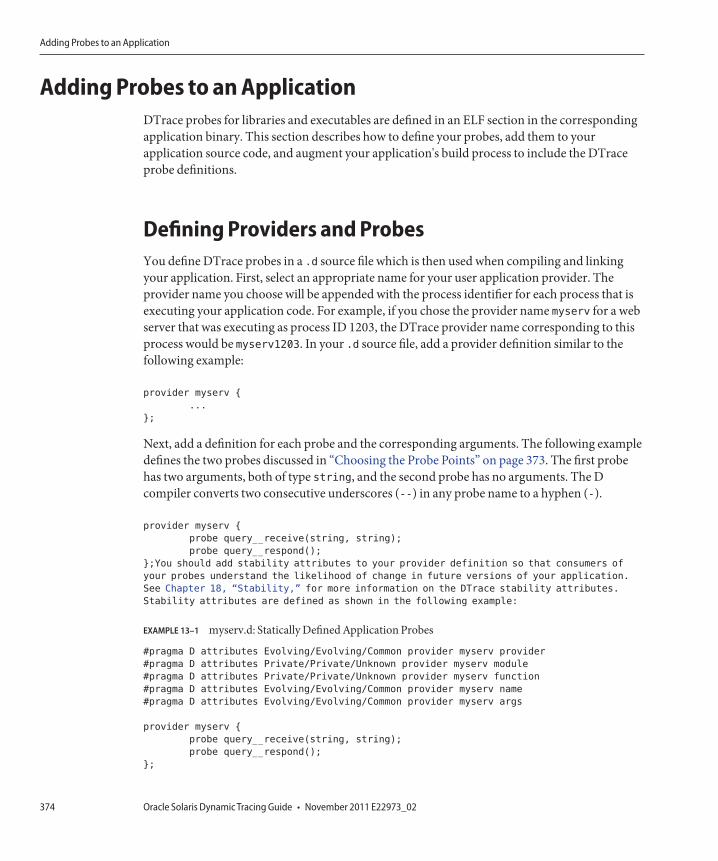
Adding Probes to an ApplicationDTrace probes for libraries and executables are defined in an ELF section in the correspondingapplication binary. This section describes how to define your probes, add them to yourapplication source code, and augment your application's build process to include the DTraceprobe definitions.
Defining Providers and ProbesYou define DTrace probes in a .d source file which is then used when compiling and linkingyour application. First, select an appropriate name for your user application provider. Theprovider name you choose will be appended with the process identifier for each process that isexecuting your application code. For example, if you chose the provider name myserv for a webserver that was executing as process ID 1203, the DTrace provider name corresponding to thisprocess would be myserv1203. In your .d source file, add a provider definition similar to thefollowing example:
provider myserv {
...
};
Next, add a definition for each probe and the corresponding arguments. The following exampledefines the two probes discussed in “Choosing the Probe Points” on page 373. The first probehas two arguments, both of type string, and the second probe has no arguments. The Dcompiler converts two consecutive underscores (--) in any probe name to a hyphen (-).
provider myserv {
probe query__receive(string, string);
probe query__respond();
};You should add stability attributes to your provider definition so that consumers of
your probes understand the likelihood of change in future versions of your application.
See Chapter 18, “Stability,” for more information on the DTrace stability attributes.
Stability attributes are defined as shown in the following example:
EXAMPLE 13–1 myserv.d: Statically Defined Application Probes
#pragma D attributes Evolving/Evolving/Common provider myserv provider
#pragma D attributes Private/Private/Unknown provider myserv module
#pragma D attributes Private/Private/Unknown provider myserv function
#pragma D attributes Evolving/Evolving/Common provider myserv name
#pragma D attributes Evolving/Evolving/Common provider myserv args
provider myserv {
probe query__receive(string, string);
probe query__respond();
};
Adding Probes to an Application
Oracle Solaris Dynamic Tracing Guide • November 2011 E22973_02374
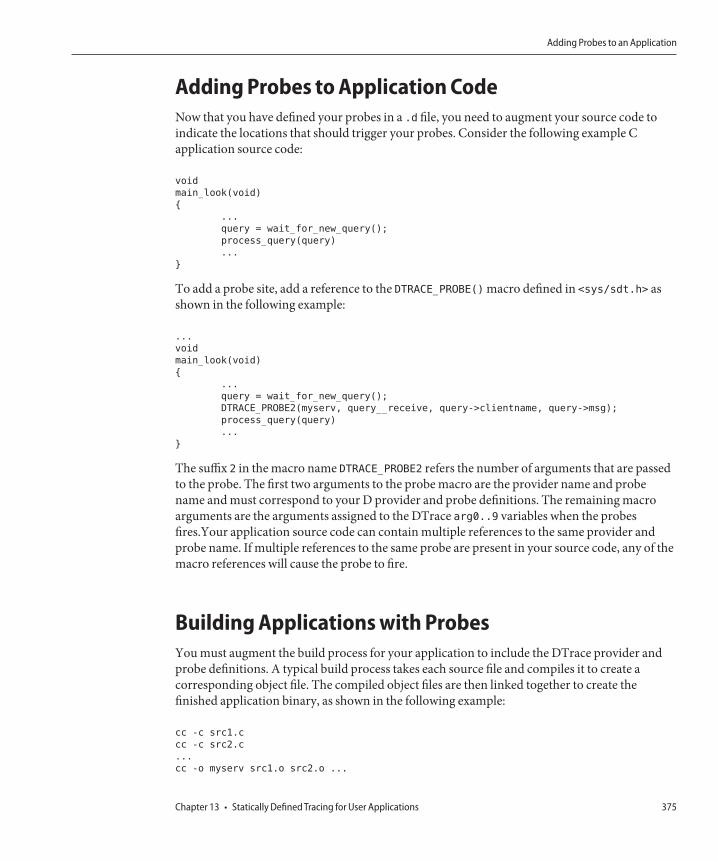
Adding Probes to Application CodeNow that you have defined your probes in a .d file, you need to augment your source code toindicate the locations that should trigger your probes. Consider the following example Capplication source code:
void
main_look(void)
{
...
query = wait_for_new_query();
process_query(query)
...
}
To add a probe site, add a reference to the DTRACE_PROBE() macro defined in <sys/sdt.h> asshown in the following example:
...
void
main_look(void)
{
...
query = wait_for_new_query();
DTRACE_PROBE2(myserv, query__receive, query->clientname, query->msg);
process_query(query)
...
}
The suffix 2 in the macro name DTRACE_PROBE2 refers the number of arguments that are passedto the probe. The first two arguments to the probe macro are the provider name and probename and must correspond to your D provider and probe definitions. The remaining macroarguments are the arguments assigned to the DTrace arg0..9 variables when the probesfires.Your application source code can contain multiple references to the same provider andprobe name. If multiple references to the same probe are present in your source code, any of themacro references will cause the probe to fire.
Building Applications with ProbesYou must augment the build process for your application to include the DTrace provider andprobe definitions. A typical build process takes each source file and compiles it to create acorresponding object file. The compiled object files are then linked together to create thefinished application binary, as shown in the following example:
cc -c src1.c
cc -c src2.c
...
cc -o myserv src1.o src2.o ...
Adding Probes to an Application
Chapter 13 • Statically Defined Tracing for User Applications 375
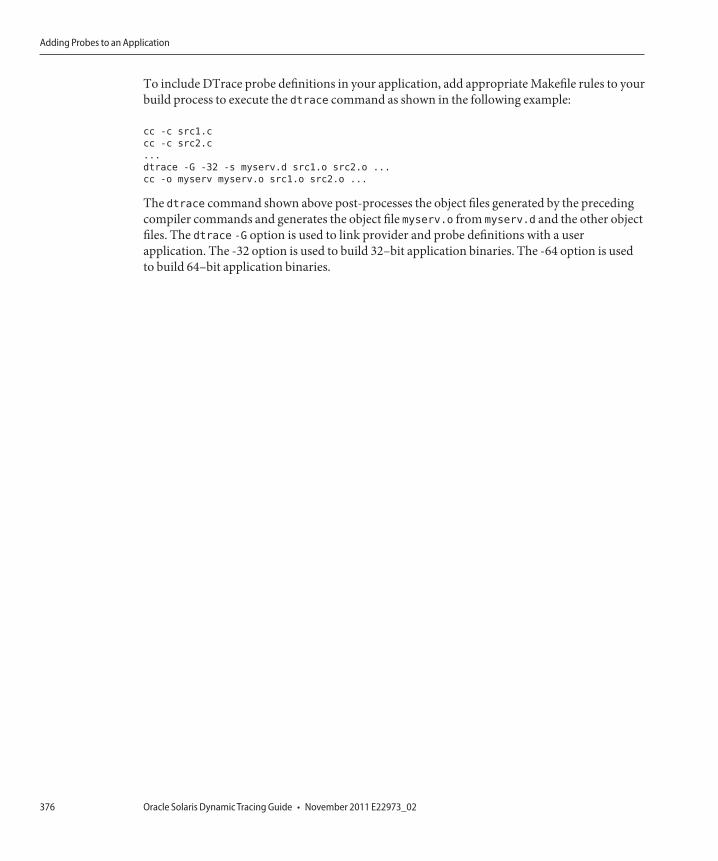
To include DTrace probe definitions in your application, add appropriate Makefile rules to yourbuild process to execute the dtrace command as shown in the following example:
cc -c src1.c
cc -c src2.c
...
dtrace -G -32 -s myserv.d src1.o src2.o ...
cc -o myserv myserv.o src1.o src2.o ...
The dtrace command shown above post-processes the object files generated by the precedingcompiler commands and generates the object file myserv.o from myserv.d and the other objectfiles. The dtrace -G option is used to link provider and probe definitions with a userapplication. The -32 option is used to build 32–bit application binaries. The -64 option is usedto build 64–bit application binaries.
Adding Probes to an Application
Oracle Solaris Dynamic Tracing Guide • November 2011 E22973_02376
Security
This chapter describes the privileges that system administrators can use to grant access toDTrace to particular users or processes. DTrace enables visibility into all aspects of the systemincluding user-level functions, system calls, kernel functions, and more. It allows for powerfulactions some of which can modify a program's state. Just as it would be inappropriate to allow auser access to another user's private files, a system administrator should not grant every user fullaccess to all the facilities that DTrace offers. By default, only the super-user can use DTrace. TheLeast Privilege facility can be used to allow other users controlled use of DTrace.
PrivilegesThe Oracle Solaris Least Privilege facility enables administrators to grant specific privileges tospecific Oracle Solaris users. To give a user a privilege on login, insert a line into the/etc/user_attr file of the form:
user-name::::defaultpriv=basic,privilege
To give a running process an additional privilege, use the ppriv(1) command:
# ppriv -s A+privilege process-ID
The three privileges that control a user's access to DTrace features are dtrace_proc,dtrace_user, and dtrace_kernel. Each privilege permits the use of a certain set of DTraceproviders, actions, and variables, and each corresponds to a particular type of use of DTrace.The privilege modes are described in detail in the following sections. System administratorsshould carefully weigh each user's need against the visibility and performance impact of thedifferent privilege modes. Users need at least one of the three DTrace privileges in order to useany of the DTrace functionality.
14C H A P T E R 1 4
377
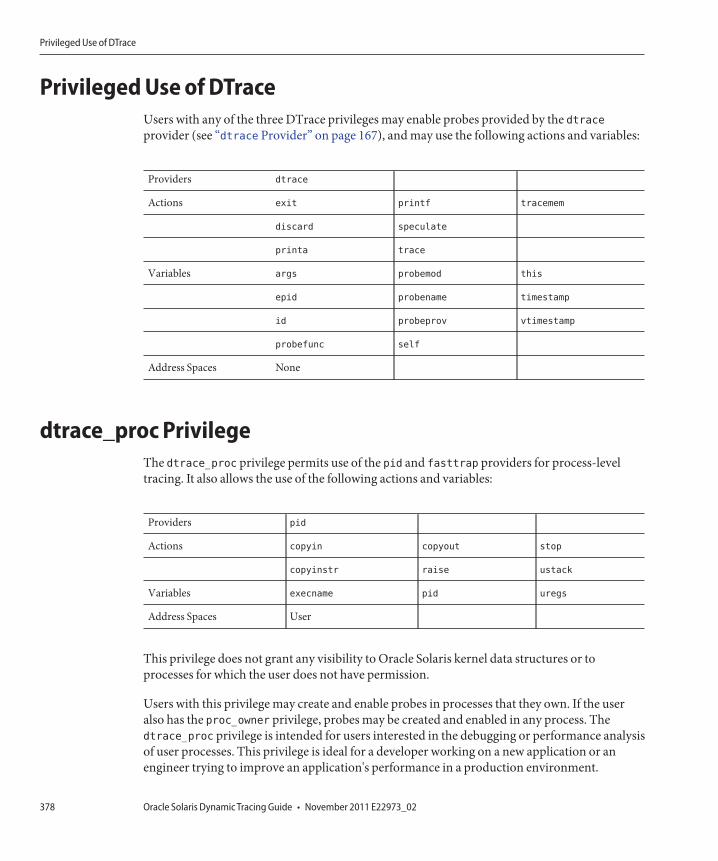
Privileged Use of DTraceUsers with any of the three DTrace privileges may enable probes provided by the dtraceprovider (see “dtrace Provider” on page 167), and may use the following actions and variables:
Providers dtrace
Actions exit printf tracemem
discard speculate
printa trace
Variables args probemod this
epid probename timestamp
id probeprov vtimestamp
probefunc self
Address Spaces None
dtrace_proc PrivilegeThe dtrace_proc privilege permits use of the pid and fasttrap providers for process-leveltracing. It also allows the use of the following actions and variables:
Providers pid
Actions copyin copyout stop
copyinstr raise ustack
Variables execname pid uregs
Address Spaces User
This privilege does not grant any visibility to Oracle Solaris kernel data structures or toprocesses for which the user does not have permission.
Users with this privilege may create and enable probes in processes that they own. If the useralso has the proc_owner privilege, probes may be created and enabled in any process. Thedtrace_proc privilege is intended for users interested in the debugging or performance analysisof user processes. This privilege is ideal for a developer working on a new application or anengineer trying to improve an application's performance in a production environment.
Privileged Use of DTrace
Oracle Solaris Dynamic Tracing Guide • November 2011 E22973_02378
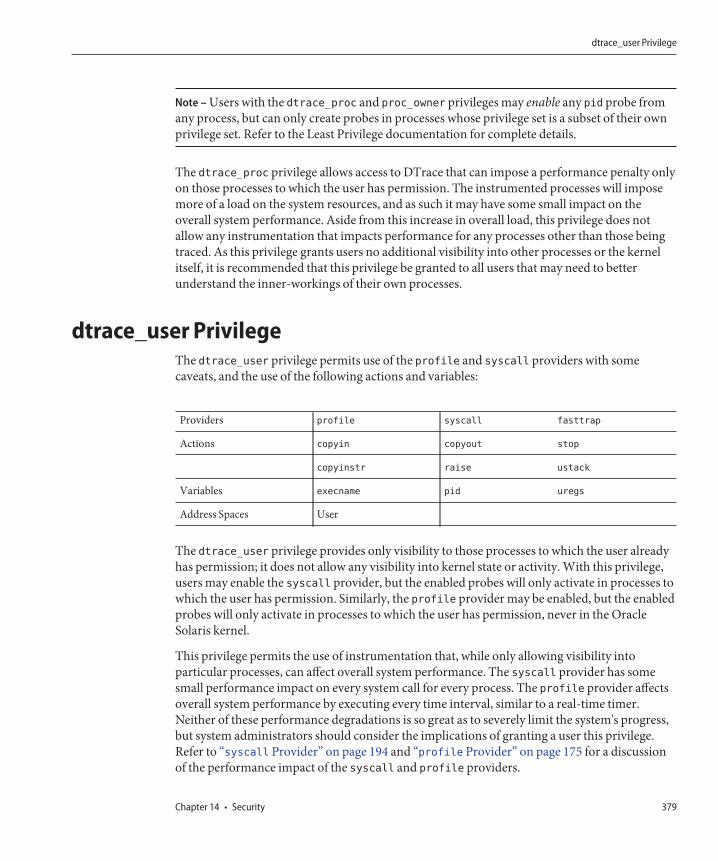
Note – Users with the dtrace_proc and proc_owner privileges may enable any pid probe fromany process, but can only create probes in processes whose privilege set is a subset of their ownprivilege set. Refer to the Least Privilege documentation for complete details.
The dtrace_proc privilege allows access to DTrace that can impose a performance penalty onlyon those processes to which the user has permission. The instrumented processes will imposemore of a load on the system resources, and as such it may have some small impact on theoverall system performance. Aside from this increase in overall load, this privilege does notallow any instrumentation that impacts performance for any processes other than those beingtraced. As this privilege grants users no additional visibility into other processes or the kernelitself, it is recommended that this privilege be granted to all users that may need to betterunderstand the inner-workings of their own processes.
dtrace_user PrivilegeThe dtrace_user privilege permits use of the profile and syscall providers with somecaveats, and the use of the following actions and variables:
Providers profile syscall fasttrap
Actions copyin copyout stop
copyinstr raise ustack
Variables execname pid uregs
Address Spaces User
The dtrace_user privilege provides only visibility to those processes to which the user alreadyhas permission; it does not allow any visibility into kernel state or activity. With this privilege,users may enable the syscall provider, but the enabled probes will only activate in processes towhich the user has permission. Similarly, the profile provider may be enabled, but the enabledprobes will only activate in processes to which the user has permission, never in the OracleSolaris kernel.
This privilege permits the use of instrumentation that, while only allowing visibility intoparticular processes, can affect overall system performance. The syscall provider has somesmall performance impact on every system call for every process. The profile provider affectsoverall system performance by executing every time interval, similar to a real-time timer.Neither of these performance degradations is so great as to severely limit the system's progress,but system administrators should consider the implications of granting a user this privilege.Refer to “syscall Provider” on page 194 and “profile Provider” on page 175 for a discussionof the performance impact of the syscall and profile providers.
dtrace_user Privilege
Chapter 14 • Security 379
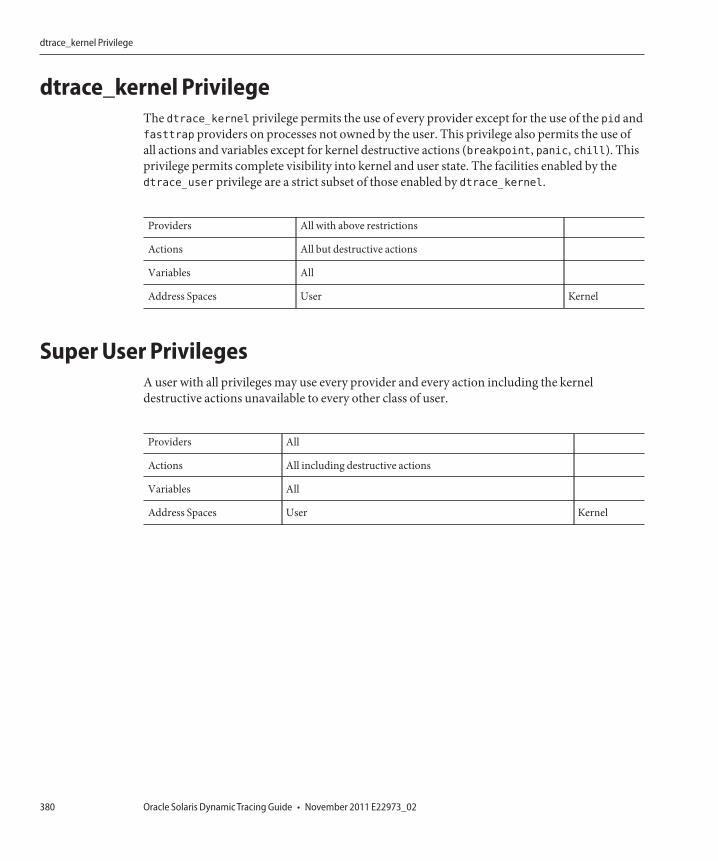
dtrace_kernel PrivilegeThe dtrace_kernel privilege permits the use of every provider except for the use of the pid andfasttrap providers on processes not owned by the user. This privilege also permits the use ofall actions and variables except for kernel destructive actions (breakpoint, panic, chill). Thisprivilege permits complete visibility into kernel and user state. The facilities enabled by thedtrace_user privilege are a strict subset of those enabled by dtrace_kernel.
Providers All with above restrictions
Actions All but destructive actions
Variables All
Address Spaces User Kernel
Super User PrivilegesA user with all privileges may use every provider and every action including the kerneldestructive actions unavailable to every other class of user.
Providers All
Actions All including destructive actions
Variables All
Address Spaces User Kernel
dtrace_kernel Privilege
Oracle Solaris Dynamic Tracing Guide • November 2011 E22973_02380
Anonymous Tracing
This chapter describes anonymous tracing, tracing that is not associated with any DTraceconsumer. Anonymous tracing is used in situations when no DTrace consumer processes canrun. The most common use of anonymous tracing is to permit device driver developers todebug and trace activity that occurs during system boot. Any tracing that you can dointeractively you can do anonymously. However, only the super user may create an anonymousenabling, and only one anonymous enabling can exist at any time.
Anonymous EnablingsTo create an anonymous enabling, use the -A option with a dtrace(1M) invocation that specifiesthe desired probes, predicates, actions and options. dtrace will add a series of driver propertiesrepresenting your request to the dtrace(7D) driver's configuration file, typically/kernel/drv/dtrace.conf. These properties will be read by the dtrace(7D) driver when it isloaded. The driver will enable the specified probes with the specified actions, and create ananonymous state to associate with the new enabling. Normally, the dtrace(7D) driver is loadedon-demand, as are any drivers that act as DTrace providers. To allow tracing during boot, thedtrace(7D) driver must be loaded as early as possible. dtrace adds the necessary forceloadstatements to /etc/system (see system(4)) for each required DTrace provider and fordtrace(7D) itself.
Thereafter, when the system boots, a message is emitted by dtrace(7D) to indicate that theconfiguration file has been successfully processed.
All options may be set with an anonymous enabling, including buffer size, dynamic variablesize, speculation size, number of speculations, and so on.
To remove an anonymous enabling, specify -A to dtrace without any probe descriptions.
15C H A P T E R 1 5
381
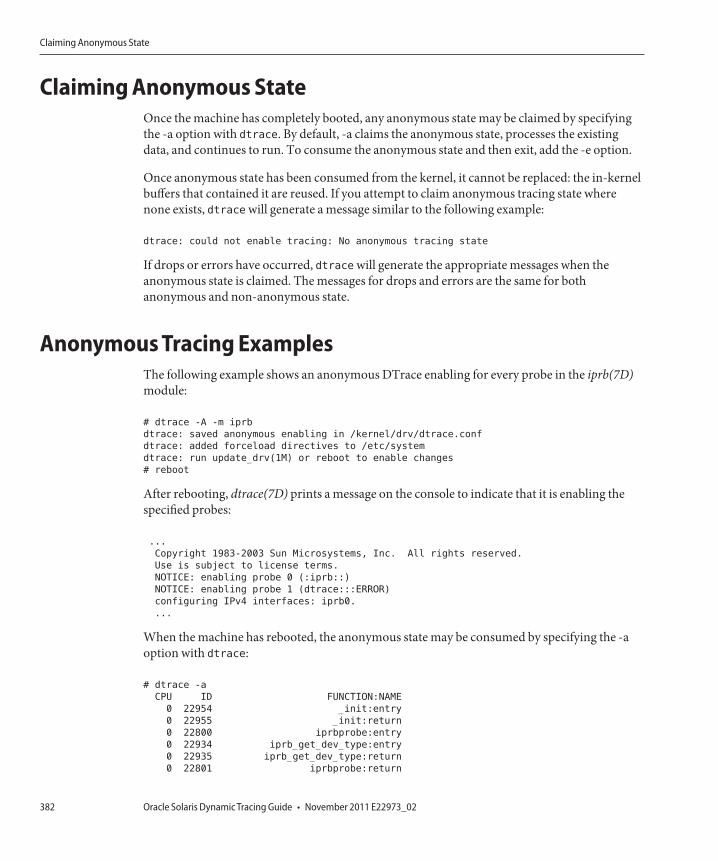
Claiming Anonymous StateOnce the machine has completely booted, any anonymous state may be claimed by specifyingthe -a option with dtrace. By default, -a claims the anonymous state, processes the existingdata, and continues to run. To consume the anonymous state and then exit, add the -e option.
Once anonymous state has been consumed from the kernel, it cannot be replaced: the in-kernelbuffers that contained it are reused. If you attempt to claim anonymous tracing state wherenone exists, dtrace will generate a message similar to the following example:
dtrace: could not enable tracing: No anonymous tracing state
If drops or errors have occurred, dtrace will generate the appropriate messages when theanonymous state is claimed. The messages for drops and errors are the same for bothanonymous and non-anonymous state.
Anonymous Tracing ExamplesThe following example shows an anonymous DTrace enabling for every probe in the iprb(7D)module:
# dtrace -A -m iprb
dtrace: saved anonymous enabling in /kernel/drv/dtrace.conf
dtrace: added forceload directives to /etc/system
dtrace: run update_drv(1M) or reboot to enable changes
# reboot
After rebooting, dtrace(7D) prints a message on the console to indicate that it is enabling thespecified probes:
...
Copyright 1983-2003 Sun Microsystems, Inc. All rights reserved.
Use is subject to license terms.
NOTICE: enabling probe 0 (:iprb::)
NOTICE: enabling probe 1 (dtrace:::ERROR)
configuring IPv4 interfaces: iprb0.
...
When the machine has rebooted, the anonymous state may be consumed by specifying the -aoption with dtrace:
# dtrace -a
CPU ID FUNCTION:NAME
0 22954 _init:entry
0 22955 _init:return
0 22800 iprbprobe:entry
0 22934 iprb_get_dev_type:entry
0 22935 iprb_get_dev_type:return
0 22801 iprbprobe:return
Claiming Anonymous State
Oracle Solaris Dynamic Tracing Guide • November 2011 E22973_02382
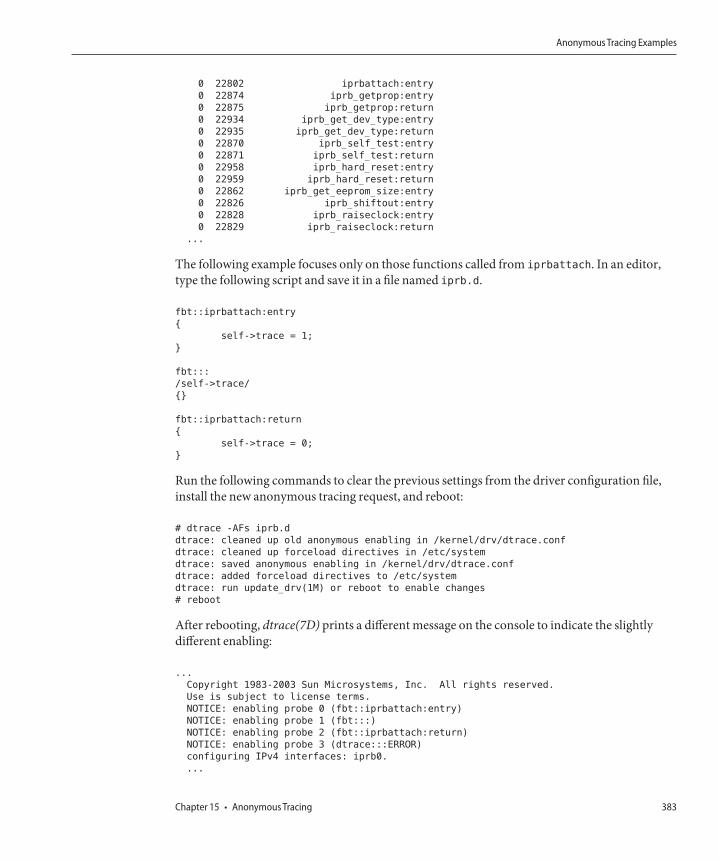
0 22802 iprbattach:entry
0 22874 iprb_getprop:entry
0 22875 iprb_getprop:return
0 22934 iprb_get_dev_type:entry
0 22935 iprb_get_dev_type:return
0 22870 iprb_self_test:entry
0 22871 iprb_self_test:return
0 22958 iprb_hard_reset:entry
0 22959 iprb_hard_reset:return
0 22862 iprb_get_eeprom_size:entry
0 22826 iprb_shiftout:entry
0 22828 iprb_raiseclock:entry
0 22829 iprb_raiseclock:return
...
The following example focuses only on those functions called from iprbattach. In an editor,type the following script and save it in a file named iprb.d.
fbt::iprbattach:entry
{
self->trace = 1;
}
fbt:::
/self->trace/
{}
fbt::iprbattach:return
{
self->trace = 0;
}
Run the following commands to clear the previous settings from the driver configuration file,install the new anonymous tracing request, and reboot:
# dtrace -AFs iprb.d
dtrace: cleaned up old anonymous enabling in /kernel/drv/dtrace.conf
dtrace: cleaned up forceload directives in /etc/system
dtrace: saved anonymous enabling in /kernel/drv/dtrace.conf
dtrace: added forceload directives to /etc/system
dtrace: run update_drv(1M) or reboot to enable changes
# reboot
After rebooting, dtrace(7D) prints a different message on the console to indicate the slightlydifferent enabling:
...
Copyright 1983-2003 Sun Microsystems, Inc. All rights reserved.
Use is subject to license terms.
NOTICE: enabling probe 0 (fbt::iprbattach:entry)
NOTICE: enabling probe 1 (fbt:::)
NOTICE: enabling probe 2 (fbt::iprbattach:return)
NOTICE: enabling probe 3 (dtrace:::ERROR)
configuring IPv4 interfaces: iprb0.
...
Anonymous Tracing Examples
Chapter 15 • Anonymous Tracing 383
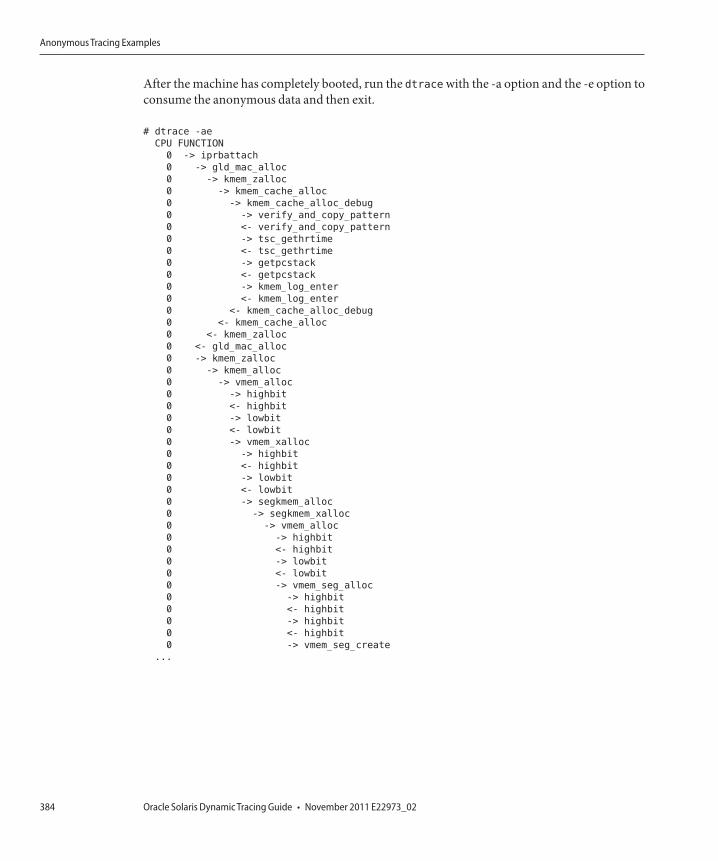
After the machine has completely booted, run the dtrace with the -a option and the -e option toconsume the anonymous data and then exit.
# dtrace -ae
CPU FUNCTION
0 -> iprbattach
0 -> gld_mac_alloc
0 -> kmem_zalloc
0 -> kmem_cache_alloc
0 -> kmem_cache_alloc_debug
0 -> verify_and_copy_pattern
0 <- verify_and_copy_pattern
0 -> tsc_gethrtime
0 <- tsc_gethrtime
0 -> getpcstack
0 <- getpcstack
0 -> kmem_log_enter
0 <- kmem_log_enter
0 <- kmem_cache_alloc_debug
0 <- kmem_cache_alloc
0 <- kmem_zalloc
0 <- gld_mac_alloc
0 -> kmem_zalloc
0 -> kmem_alloc
0 -> vmem_alloc
0 -> highbit
0 <- highbit
0 -> lowbit
0 <- lowbit
0 -> vmem_xalloc
0 -> highbit
0 <- highbit
0 -> lowbit
0 <- lowbit
0 -> segkmem_alloc
0 -> segkmem_xalloc
0 -> vmem_alloc
0 -> highbit
0 <- highbit
0 -> lowbit
0 <- lowbit
0 -> vmem_seg_alloc
0 -> highbit
0 <- highbit
0 -> highbit
0 <- highbit
0 -> vmem_seg_create
...
Anonymous Tracing Examples
Oracle Solaris Dynamic Tracing Guide • November 2011 E22973_02384
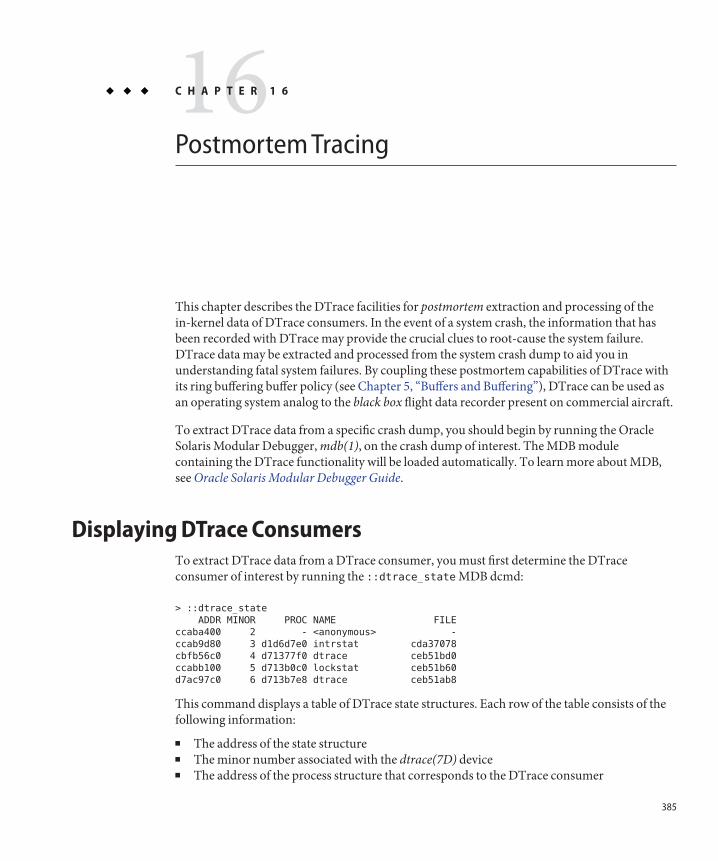
Postmortem Tracing
This chapter describes the DTrace facilities for postmortem extraction and processing of thein-kernel data of DTrace consumers. In the event of a system crash, the information that hasbeen recorded with DTrace may provide the crucial clues to root-cause the system failure.DTrace data may be extracted and processed from the system crash dump to aid you inunderstanding fatal system failures. By coupling these postmortem capabilities of DTrace withits ring buffering buffer policy (see Chapter 5, “Buffers and Buffering”), DTrace can be used asan operating system analog to the black box flight data recorder present on commercial aircraft.
To extract DTrace data from a specific crash dump, you should begin by running the OracleSolaris Modular Debugger, mdb(1), on the crash dump of interest. The MDB modulecontaining the DTrace functionality will be loaded automatically. To learn more about MDB,see Oracle Solaris Modular Debugger Guide.
Displaying DTrace ConsumersTo extract DTrace data from a DTrace consumer, you must first determine the DTraceconsumer of interest by running the ::dtrace_state MDB dcmd:
> ::dtrace_state
ADDR MINOR PROC NAME FILE
ccaba400 2 - <anonymous> -
ccab9d80 3 d1d6d7e0 intrstat cda37078
cbfb56c0 4 d71377f0 dtrace ceb51bd0
ccabb100 5 d713b0c0 lockstat ceb51b60
d7ac97c0 6 d713b7e8 dtrace ceb51ab8
This command displays a table of DTrace state structures. Each row of the table consists of thefollowing information:
■ The address of the state structure■ The minor number associated with the dtrace(7D) device■ The address of the process structure that corresponds to the DTrace consumer
16C H A P T E R 1 6
385
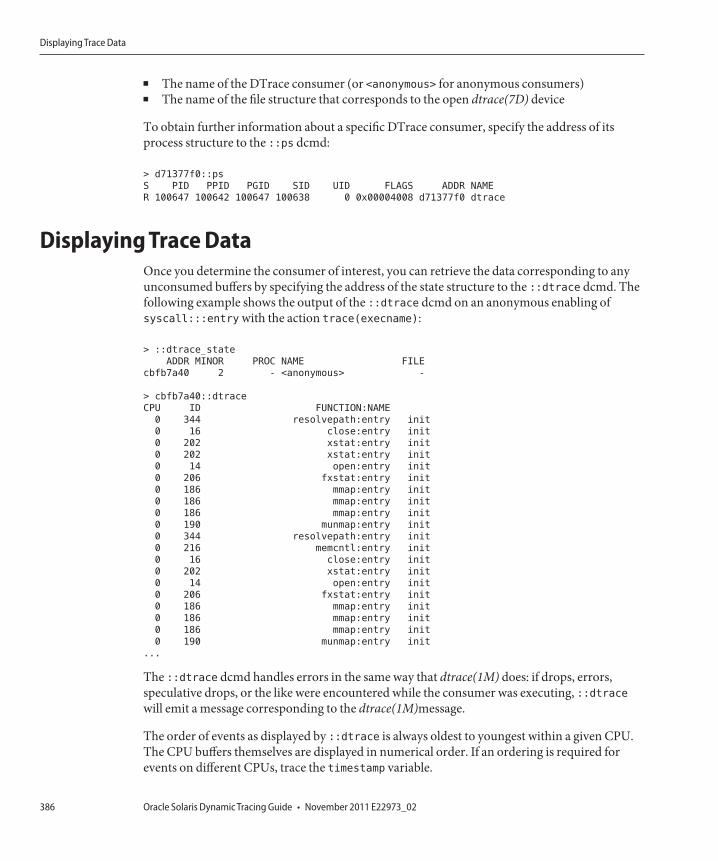
■ The name of the DTrace consumer (or <anonymous> for anonymous consumers)■ The name of the file structure that corresponds to the open dtrace(7D) device
To obtain further information about a specific DTrace consumer, specify the address of itsprocess structure to the ::ps dcmd:
> d71377f0::ps
S PID PPID PGID SID UID FLAGS ADDR NAME
R 100647 100642 100647 100638 0 0x00004008 d71377f0 dtrace
Displaying Trace DataOnce you determine the consumer of interest, you can retrieve the data corresponding to anyunconsumed buffers by specifying the address of the state structure to the ::dtrace dcmd. Thefollowing example shows the output of the ::dtrace dcmd on an anonymous enabling ofsyscall:::entry with the action trace(execname):
> ::dtrace_state
ADDR MINOR PROC NAME FILE
cbfb7a40 2 - <anonymous> -
> cbfb7a40::dtrace
CPU ID FUNCTION:NAME
0 344 resolvepath:entry init
0 16 close:entry init
0 202 xstat:entry init
0 202 xstat:entry init
0 14 open:entry init
0 206 fxstat:entry init
0 186 mmap:entry init
0 186 mmap:entry init
0 186 mmap:entry init
0 190 munmap:entry init
0 344 resolvepath:entry init
0 216 memcntl:entry init
0 16 close:entry init
0 202 xstat:entry init
0 14 open:entry init
0 206 fxstat:entry init
0 186 mmap:entry init
0 186 mmap:entry init
0 186 mmap:entry init
0 190 munmap:entry init
...
The ::dtrace dcmd handles errors in the same way that dtrace(1M) does: if drops, errors,speculative drops, or the like were encountered while the consumer was executing, ::dtracewill emit a message corresponding to the dtrace(1M)message.
The order of events as displayed by ::dtrace is always oldest to youngest within a given CPU.The CPU buffers themselves are displayed in numerical order. If an ordering is required forevents on different CPUs, trace the timestamp variable.
Displaying Trace Data
Oracle Solaris Dynamic Tracing Guide • November 2011 E22973_02386
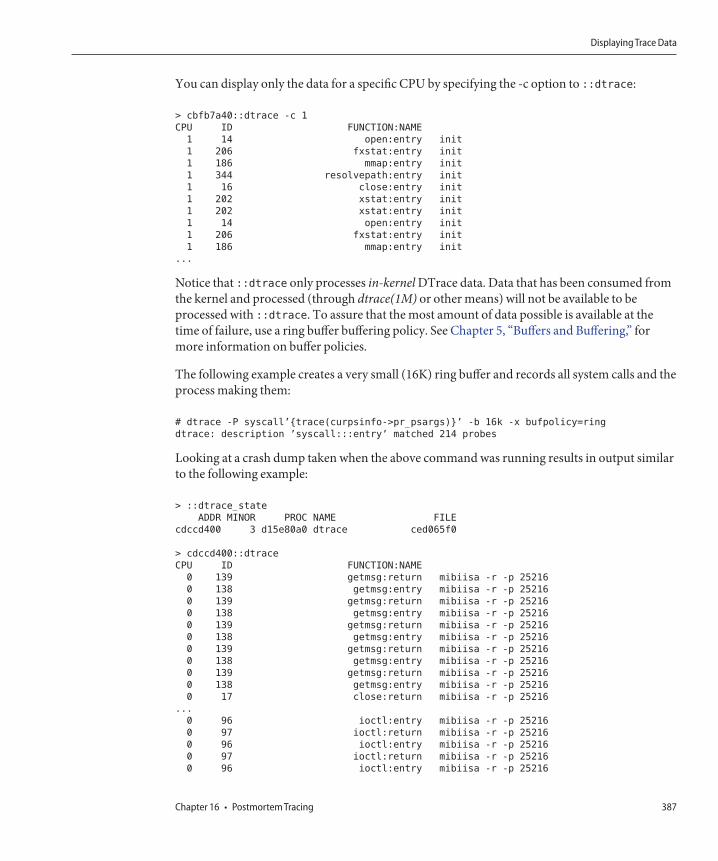
You can display only the data for a specific CPU by specifying the -c option to ::dtrace:
> cbfb7a40::dtrace -c 1
CPU ID FUNCTION:NAME
1 14 open:entry init
1 206 fxstat:entry init
1 186 mmap:entry init
1 344 resolvepath:entry init
1 16 close:entry init
1 202 xstat:entry init
1 202 xstat:entry init
1 14 open:entry init
1 206 fxstat:entry init
1 186 mmap:entry init
...
Notice that ::dtrace only processes in-kernel DTrace data. Data that has been consumed fromthe kernel and processed (through dtrace(1M) or other means) will not be available to beprocessed with ::dtrace. To assure that the most amount of data possible is available at thetime of failure, use a ring buffer buffering policy. See Chapter 5, “Buffers and Buffering,” formore information on buffer policies.
The following example creates a very small (16K) ring buffer and records all system calls and theprocess making them:
# dtrace -P syscall’{trace(curpsinfo->pr_psargs)}’ -b 16k -x bufpolicy=ring
dtrace: description ’syscall:::entry’ matched 214 probes
Looking at a crash dump taken when the above command was running results in output similarto the following example:
> ::dtrace_state
ADDR MINOR PROC NAME FILE
cdccd400 3 d15e80a0 dtrace ced065f0
> cdccd400::dtrace
CPU ID FUNCTION:NAME
0 139 getmsg:return mibiisa -r -p 25216
0 138 getmsg:entry mibiisa -r -p 25216
0 139 getmsg:return mibiisa -r -p 25216
0 138 getmsg:entry mibiisa -r -p 25216
0 139 getmsg:return mibiisa -r -p 25216
0 138 getmsg:entry mibiisa -r -p 25216
0 139 getmsg:return mibiisa -r -p 25216
0 138 getmsg:entry mibiisa -r -p 25216
0 139 getmsg:return mibiisa -r -p 25216
0 138 getmsg:entry mibiisa -r -p 25216
0 17 close:return mibiisa -r -p 25216
...
0 96 ioctl:entry mibiisa -r -p 25216
0 97 ioctl:return mibiisa -r -p 25216
0 96 ioctl:entry mibiisa -r -p 25216
0 97 ioctl:return mibiisa -r -p 25216
0 96 ioctl:entry mibiisa -r -p 25216
Displaying Trace Data
Chapter 16 • Postmortem Tracing 387
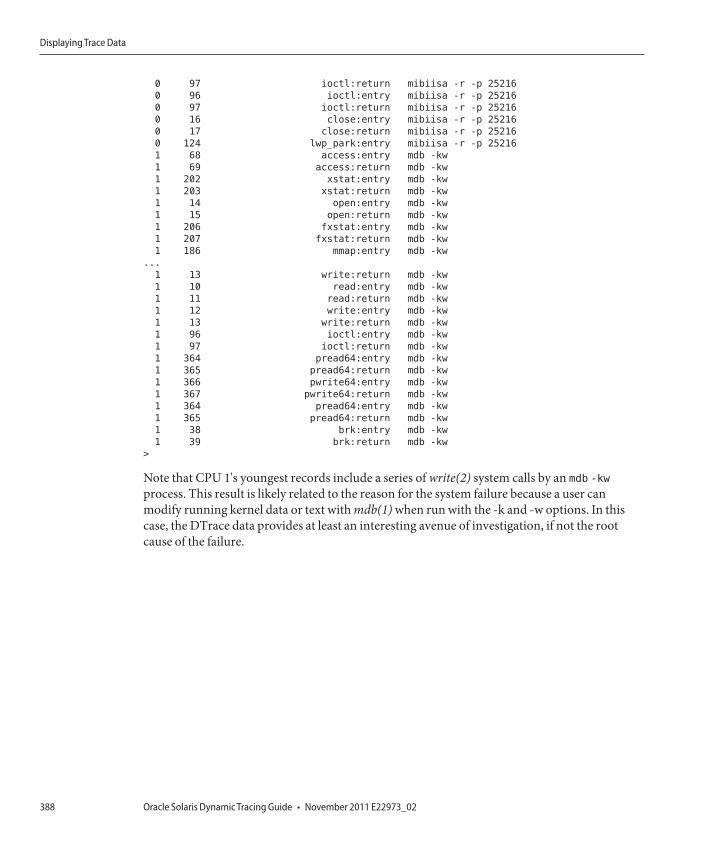
0 97 ioctl:return mibiisa -r -p 25216
0 96 ioctl:entry mibiisa -r -p 25216
0 97 ioctl:return mibiisa -r -p 25216
0 16 close:entry mibiisa -r -p 25216
0 17 close:return mibiisa -r -p 25216
0 124 lwp_park:entry mibiisa -r -p 25216
1 68 access:entry mdb -kw
1 69 access:return mdb -kw
1 202 xstat:entry mdb -kw
1 203 xstat:return mdb -kw
1 14 open:entry mdb -kw
1 15 open:return mdb -kw
1 206 fxstat:entry mdb -kw
1 207 fxstat:return mdb -kw
1 186 mmap:entry mdb -kw
...
1 13 write:return mdb -kw
1 10 read:entry mdb -kw
1 11 read:return mdb -kw
1 12 write:entry mdb -kw
1 13 write:return mdb -kw
1 96 ioctl:entry mdb -kw
1 97 ioctl:return mdb -kw
1 364 pread64:entry mdb -kw
1 365 pread64:return mdb -kw
1 366 pwrite64:entry mdb -kw
1 367 pwrite64:return mdb -kw
1 364 pread64:entry mdb -kw
1 365 pread64:return mdb -kw
1 38 brk:entry mdb -kw
1 39 brk:return mdb -kw
>
Note that CPU 1's youngest records include a series of write(2) system calls by an mdb -kw
process. This result is likely related to the reason for the system failure because a user canmodify running kernel data or text with mdb(1) when run with the -k and -w options. In thiscase, the DTrace data provides at least an interesting avenue of investigation, if not the rootcause of the failure.
Displaying Trace Data
Oracle Solaris Dynamic Tracing Guide • November 2011 E22973_02388
Performance Considerations
Because DTrace causes additional work in the system, enabling DTrace always affects systemperformance in some way. Often, this effect is negligible, but it can become substantial if manyprobes are enabled with costly enablings. This chapter describes techniques for minimizing theperformance effect of DTrace.
Limit Enabled ProbesDynamic instrumentation techniques enable DTrace to provide unparalleled tracing coverageof the kernel and of arbitrary user processes. While this coverage allows revolutionary newinsight into system behavior, it also can cause enormous probe effect. If tens of thousands orhundreds of thousands of probes are enabled, the effect on the system can easily be substantial.Therefore, you should only enable as many probes as you need to solve a problem. You shouldnot, for example, enable all FBT probes if a more concise enabling will answer your question.For example, your question might allow you to concentrate on a specific module of interest or aspecific function.
When using the pid provider, you should be especially careful. Because the pid provider caninstrument every instruction, you could enable millions of probes in an application, andtherefore slow the target process to a crawl.
DTrace can also be used in situations where large numbers of probes must be enabled for aquestion to be answered. Enabling a large number of probes might slow down the system quite abit, but it will never induce fatal failure on the machine. You should therefore not hesitate toenable many probes if required.
17C H A P T E R 1 7
389
Use AggregationsAs discussed in Chapter 3, “Aggregations,” DTrace's aggregations allow for a scalable way ofaggregating data. Associative arrays might appear to offer similar functionality to aggregations.However, by nature of being global, general-purpose variables, they cannot offer the linearscalability of aggregations. You should therefore prefer to use aggregations over associativearrays when possible. The following example is not recommended:
syscall:::entry
{
totals[execname]++;
}
syscall::rexit:entry
{
printf("%40s %d\n", execname, totals[execname]);
totals[execname] = 0;
}
The following example is preferable:
syscall:::entry
{
@totals[execname] = count();
}
END
{
printa("%40s %@d\n", @totals);
}
Use Cacheable PredicatesDTrace predicates are used to filter unwanted data from the experiment by tracing data is onlytraced if a specified condition is found to be true. When enabling many probes, you generallyuse predicates of a form that identifies a specific thread or threads of interest, such as/self->traceme/ or /pid == 12345/. Although many of these predicates evaluate to a falsevalue for most threads in most probes, the evaluation itself can become costly when done formany thousands of probes. To reduce this cost, DTrace caches the evaluation of a predicate if itincludes only thread-local variables (for example, /self->traceme/) or immutable variables(for example, /pid == 12345/). The cost of evaluating a cached predicate is much smaller thanthe cost of evaluating a non-cached predicate, especially if the predicate involves thread-localvariables, string comparisons, or other relatively costly operations. While predicate caching istransparent to the user, it does imply some guidelines for constructing optimal predicates, asshown in the following table:
Use Aggregations
Oracle Solaris Dynamic Tracing Guide • November 2011 E22973_02390
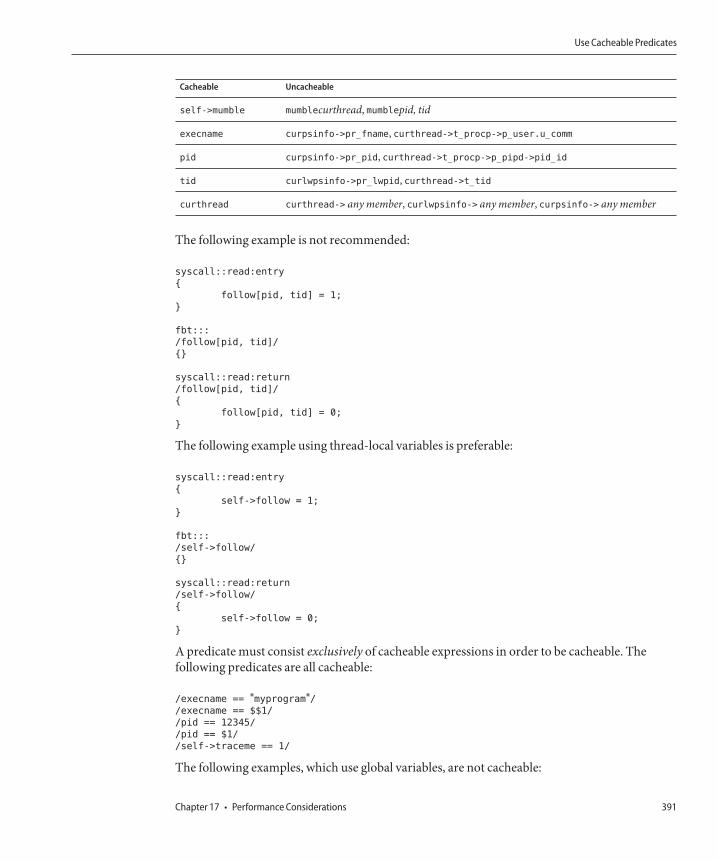
Cacheable Uncacheable
self->mumble mumblecurthread, mumblepid, tid
execname curpsinfo->pr_fname, curthread->t_procp->p_user.u_comm
pid curpsinfo->pr_pid, curthread->t_procp->p_pipd->pid_id
tid curlwpsinfo->pr_lwpid, curthread->t_tid
curthread curthread-> any member, curlwpsinfo-> any member, curpsinfo-> any member
The following example is not recommended:
syscall::read:entry
{
follow[pid, tid] = 1;
}
fbt:::
/follow[pid, tid]/
{}
syscall::read:return
/follow[pid, tid]/
{
follow[pid, tid] = 0;
}
The following example using thread-local variables is preferable:
syscall::read:entry
{
self->follow = 1;
}
fbt:::
/self->follow/
{}
syscall::read:return
/self->follow/
{
self->follow = 0;
}
A predicate must consist exclusively of cacheable expressions in order to be cacheable. Thefollowing predicates are all cacheable:
/execname == "myprogram"//execname == $$1/
/pid == 12345/
/pid == $1/
/self->traceme == 1/
The following examples, which use global variables, are not cacheable:
Use Cacheable Predicates
Chapter 17 • Performance Considerations 391
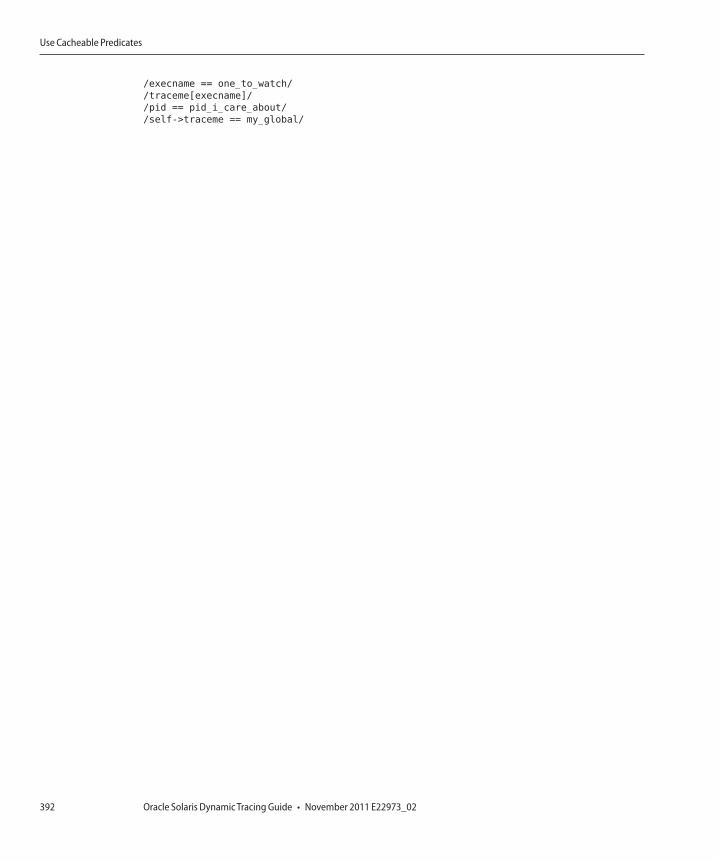
/execname == one_to_watch/
/traceme[execname]/
/pid == pid_i_care_about/
/self->traceme == my_global/
Use Cacheable Predicates
Oracle Solaris Dynamic Tracing Guide • November 2011 E22973_02392
Stability
Developers are provided with early access to new technologies as well as observability tools thatallow users to peer into the internal implementation details of user and kernel software.Unfortunately, new technologies and internal implementation details are both prone tochanges as interfaces and implementations evolve and mature when software is upgraded orpatched. Application and interface stability levels are documented using a set of labels describedin the attributes(5) man page to help set user expectations for what kinds of changes mightoccur in different kinds of future releases.
No one stability attribute appropriately describes the arbitrary set of entities and services thatcan be accessed from a D program. DTrace and the D compiler therefore include features todynamically compute and describe the stability levels of D programs you create. This chapterdiscusses the DTrace features for determining program stability to help you design stable Dprograms. You can use the DTrace stability features to inform you of the stability attributes ofyour D programs, or to produce compile-time errors when your program has undesirableinterface dependencies.
Stability LevelsDTrace provides two types of stability attributes for entities such as built-in variables, functions,and probes: a stability level and an architectural dependency class. The DTrace stability levelassists you in making risk assessments when developing scripts and tools based on DTrace byindicating how likely an interface or DTrace entity is to change in a future release or patch. TheDTrace dependency class tells you whether an interface is common to all Oracle Solarisplatforms and processors, or whether the interface is associated with a particular architecturesuch as SPARC processors only. The two types of attributes used to describe interfaces can varyindependently.
The stability values used by DTrace appear in the following list in order from lowest to higheststability. Applications that depend only on Stable interfaces should reliably continue to functioncorrectly on future minor releases and will not be broken by interim patches. The less stable
18C H A P T E R 1 8
393
interfaces allow experimentation, prototyping, tuning, and debugging on your current system,but should be used with the understanding that they might change incompatibly or even bedropped or replaced with alternatives in future minor releases.
The DTrace stability values also help you understand the stability of the software entities youare observing, in addition to the stability of the DTrace interfaces themselves. Therefore,DTrace stability values also tell you how likely your D programs and layered tools are to requirecorresponding changes when you upgrade or change the software stack you are observing.
Internal
The interface is private to DTrace and represents an implementation detail of DTrace. Internalinterfaces might change in minor or micro releases.
Private
The interface is private to Oracle and represents an interface developed for use by other Oracleproducts that is not yet publicly documented for use by customers and ISVs. Private interfacesmight change in minor or micro releases.
Obsolete
The interface is supported in the current release but is scheduled to be removed, most likely in afuture minor release. The D compiler might produce warning messages if you attempt to use anObsolete interface.
External
The interface is controlled by an entity other than Oracle. Oracle makes no claims regardingeither source or binary compatibility for External interfaces between any two releases.Applications based on these interfaces might not work in future releases, including patches thatcontain External interfaces.
Unstable
The interface is provided to give developers early access to new or rapidly changing technologyor to an implementation artifact that is essential for observing or debugging system behavior forwhich a more stable solution is anticipated in the future. Oracle makes no claims about eithersource or binary compatibility for Unstable interfaces from one minor release to another.
Evolving
The interface might eventually become Standard or Stable but is still in transition. Whennon-upward compatible changes become necessary, they will occur in minor and majorreleases. These changes will be avoided in micro releases whenever possible. If such a change isnecessary, it will be documented in the release notes for the affected release, and when feasible,migration aids will be provided for binary compatibility and continued D programdevelopment.
Stability Levels
Oracle Solaris Dynamic Tracing Guide • November 2011 E22973_02394
Stable
The interface is a mature interface.
Standard
The interface complies with an industry standard. The corresponding documentation for theinterface will describe the standard to which the interface conforms. Standards are typicallycontrolled by a standards development organization, and changes can be made to the interfacein accordance with approved changes to the standard. This stability level can also apply tointerfaces that have been adopted (without a formal standard by an industry convention.Support is provided for only the specified versions of a standard; support for later versions isnot guaranteed.
Dependency ClassesSince Oracle Solaris and DTrace support a variety of operating platforms and processors,DTrace also labels interfaces with a dependency class that tells you whether an interface iscommon to all Oracle Solaris platforms and processors, or whether the interface is associatedwith a particular system architecture. The dependency class is orthogonal to the stability levelsdescribed earlier. For example, a DTrace interface can be Stable but only supported on SPARCmicroprocessors, or it can be Unstable but common to all Oracle Solaris systems. The DTracedependency classes are described in the following list in order from least common (that is, mostspecific to a particular architecture) to most common (that is, common to all architectures).
Unknown
The interface has an unknown set of architectural dependencies. DTrace does not necessarilyknow the architectural dependencies of all entities, such as data types defined in the operatingsystem implementation. The Unknown label is typically applied to interfaces of very lowstability for which dependencies cannot be computed. The interface might not be availablewhen using DTrace on any architecture other than the one you are currently using.
CPU
The interface is specific to the CPU model of the current system. You can use the psrinfo(1M)utility's -v option to display the current CPU model and implementation names. Interfaces withCPU model dependencies might not be available on other CPU implementations, even if thoseCPUs export the same instruction set architecture (ISA). For example, a CPU-dependentinterface on an UltraSPARC-III+ microprocessor might not be available on an UltraSPARC-IImicroprocessor, even though both processors support the SPARC instruction set.
Platform
The interface is specific to the hardware platform of the current system. A platform typicallyassociates a set of system components and architectural characteristics such as a set of
Dependency Classes
Chapter 18 • Stability 395
supported CPU models with a system name such as SUNW,Ultra-Enterprise-10000. You candisplay the current platform name using the uname(1) -i option. The interface might not beavailable on other hardware platforms.
Group
The interface is specific to the hardware platform group of the current system. A platformgroup typically associates a set of platforms with related characteristics together under a singlename, such as sun4u. You can display the current platform group name using the uname(1) -moption. The interface is available on other platforms in the platform group, but might not beavailable on hardware platforms that are not members of the group.
ISA
The interface is specific to the instruction set architecture (ISA) supported by themicroprocessors on this system. The ISA describes a specification for software that can beexecuted on the microprocessor, including details such as assembly language instructions andregisters. You can display the native instruction sets supported by the system using theisainfo(1) utility. The interface might not be supported on systems that do not export any of thesame instruction sets. For example, an ISA-dependent interface on a Oracle Solaris SPARCsystem might not be supported on a Oracle Solaris x86 system.
Common
The interface is common to all Oracle Solaris systems regardless of the underlying hardware.DTrace programs and layered applications that depend only on Common interfaces can beexecuted and deployed on other Oracle Solaris systems with the same Oracle Solaris andDTrace revisions. The majority of DTrace interfaces are Common, so you can use themwherever you use Oracle Solaris.
Interface AttributesDTrace describes interfaces using a triplet of attributes consisting of two stability levels and adependency class. By convention, the interface attributes are written in the following order,separated by slashes:
name-stability / data-stability / dependency-class
The name stability of an interface describes the stability level associated with its name as itappears in your D program or on the dtrace(1M) command-line. For example, the execname Dvariable is a Stable name.
The data stability of an interface is distinct from the stability associated with the interface name.This stability level describes the commitment to maintain the data formats used by the interfaceand any associated data semantics.
Interface Attributes
Oracle Solaris Dynamic Tracing Guide • November 2011 E22973_02396
The dependency class of an interface is distinct from its name and data stability, and describeswhether the interface is specific to the current operating platform or microprocessor.
DTrace and the D compiler track the stability attributes for all of the DTrace interface entities,including providers, probe descriptions, D variables, D functions, types, and programstatements themselves, as we'll see shortly. Notice that all three values can vary independently.For example, the curthread D variable has Stable/Private/Common attributes: the variablename is Stable and is Common to all Oracle Solaris operating platforms, but this variableprovides access to a Private data format that is an artifact of the Oracle Solaris kernelimplementation. Most D variables are provided with Stable/Stable/Common attributes, as arethe variables you define.
USDT InterfacesUSDT providers require that stabilities be defined for five interface groups that fully specify aDTrace probe.
■ The Provider■ The Modules■ The Functions■ The Probes■ The Arguments
This will generally be done in the .d file where the provider is declared with pragmas using thetriplets discussed in “Interface Attributes” on page 396. For example:
#pragma D attributes Evolving/Evolving/Common provider providername provider
#pragma D attributes Private/Private/Common provider providername module
#pragma D attributes Private/Private/Common provider providername function
#pragma D attributes Evolving/Evolving/Common provider providername name
#pragma D attributes Evolving/Evolving/Common provider providername args
Stability Computations and ReportsThe D compiler performs stability computations for each of the probe descriptions and actionstatements in your D programs. You can use the dtrace -v option to display a report of yourprogram's stability. The following example uses a program written on the command line:
# dtrace -v -n dtrace:::BEGIN’{exit(0);}’
dtrace: description ’dtrace:::BEGIN’ matched 1 probe
Stability data for description dtrace:::BEGIN:
Minimum probe description attributes
Identifier Names: Evolving
Data Semantics: Evolving
Dependency Class: Common
Minimum probe statement attributes
Stability Computations and Reports
Chapter 18 • Stability 397
Identifier Names: Stable
Data Semantics: Stable
Dependency Class: Common
CPU ID FUNCTION:NAME
0 1 :BEGIN
You may also wish to combine the dtrace -v option with the -e option, which tells dtrace tocompile but not execute your D program, so that you can determine program stability withouthaving to enable any probes and execute your program. Here is another example stabilityreport:
# dtrace -ev -n dtrace:::BEGIN’{trace(curthread->t_procp);}’
Stability data for description dtrace:::BEGIN:
Minimum probe description attributes
Identifier Names: Evolving
Data Semantics: Evolving
Dependency Class: Common
Minimum probe statement attributes
Identifier Names: Stable
Data Semantics: Private
Dependency Class: Common
#
Notice that in our new program, we have referenced the D variable curthread, which has aStable name, but Private data semantics (that is, if you look at it, you are accessing Privateimplementation details of the kernel), and this status is now reflected in the program's stabilityreport. Stability attributes in the program report are computed by selecting the minimumstability level and class out of the corresponding values for each interface attributes triplet.
Stability attributes are computed for a probe description by taking the minimum stabilityattributes of all specified probe description fields according to the attributes published by theprovider. The attributes of the available DTrace providers are shown in the chaptercorresponding to each provider. DTrace providers export a stability attributes triplet for each ofthe four description fields for all probes published by that provider. Therefore, a provider'sname may have a greater stability than the individual probes it exports. For example, the probedescription:
fbt:::
indicating that DTrace should trace entry and return from all kernel functions, has greaterstability than the probe description:
fbt:foo:bar:entry
which names a specific internal function bar in the kernel module foo. For simplicity, mostproviders use a single set of attributes for all of the individual module function name values thatthey publish. Providers also specify attributes for the args[] array, as the stability of any probearguments varies by provider.
If the provider field is not specified in a probe description, then the description is assigned thestability attributes Unstable/Unstable/Common because the description might end up
Stability Computations and Reports
Oracle Solaris Dynamic Tracing Guide • November 2011 E22973_02398
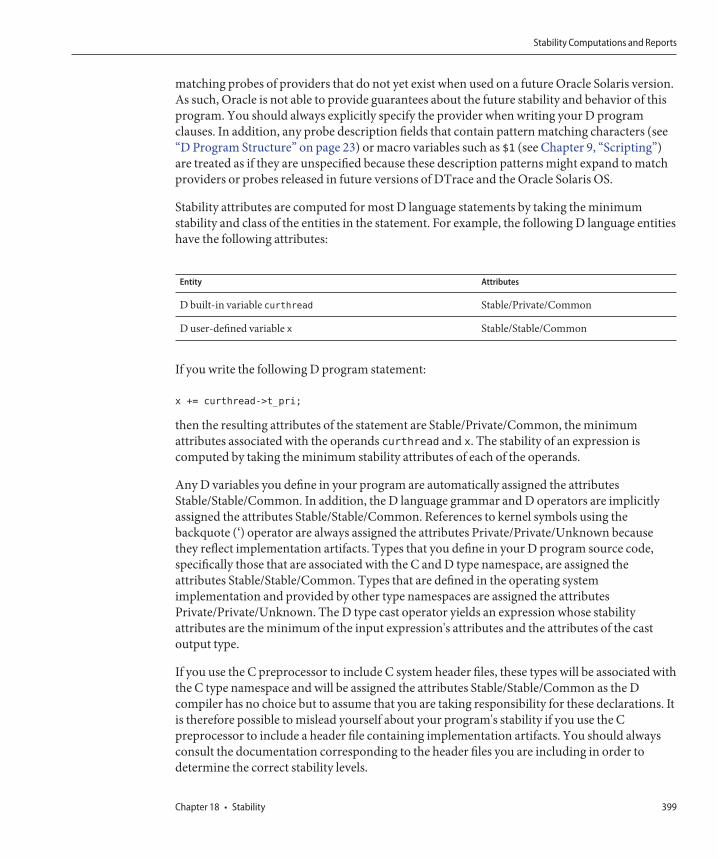
matching probes of providers that do not yet exist when used on a future Oracle Solaris version.As such, Oracle is not able to provide guarantees about the future stability and behavior of thisprogram. You should always explicitly specify the provider when writing your D programclauses. In addition, any probe description fields that contain pattern matching characters (see“D Program Structure” on page 23) or macro variables such as $1 (see Chapter 9, “Scripting”)are treated as if they are unspecified because these description patterns might expand to matchproviders or probes released in future versions of DTrace and the Oracle Solaris OS.
Stability attributes are computed for most D language statements by taking the minimumstability and class of the entities in the statement. For example, the following D language entitieshave the following attributes:
Entity Attributes
D built-in variable curthread Stable/Private/Common
D user-defined variable x Stable/Stable/Common
If you write the following D program statement:
x += curthread->t_pri;
then the resulting attributes of the statement are Stable/Private/Common, the minimumattributes associated with the operands curthread and x. The stability of an expression iscomputed by taking the minimum stability attributes of each of the operands.
Any D variables you define in your program are automatically assigned the attributesStable/Stable/Common. In addition, the D language grammar and D operators are implicitlyassigned the attributes Stable/Stable/Common. References to kernel symbols using thebackquote (‘) operator are always assigned the attributes Private/Private/Unknown becausethey reflect implementation artifacts. Types that you define in your D program source code,specifically those that are associated with the C and D type namespace, are assigned theattributes Stable/Stable/Common. Types that are defined in the operating systemimplementation and provided by other type namespaces are assigned the attributesPrivate/Private/Unknown. The D type cast operator yields an expression whose stabilityattributes are the minimum of the input expression's attributes and the attributes of the castoutput type.
If you use the C preprocessor to include C system header files, these types will be associated withthe C type namespace and will be assigned the attributes Stable/Stable/Common as the Dcompiler has no choice but to assume that you are taking responsibility for these declarations. Itis therefore possible to mislead yourself about your program's stability if you use the Cpreprocessor to include a header file containing implementation artifacts. You should alwaysconsult the documentation corresponding to the header files you are including in order todetermine the correct stability levels.
Stability Computations and Reports
Chapter 18 • Stability 399
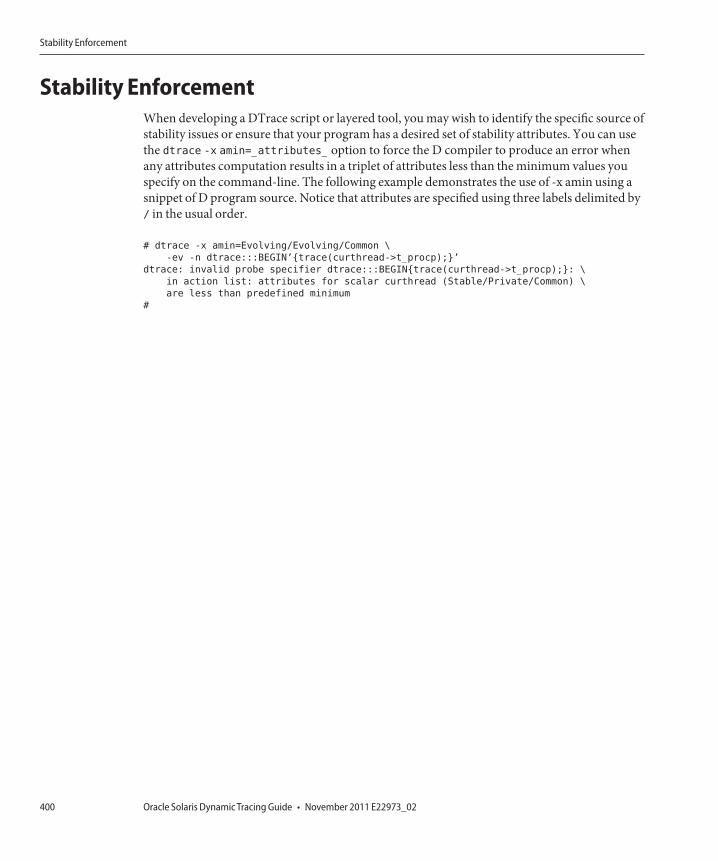
Stability EnforcementWhen developing a DTrace script or layered tool, you may wish to identify the specific source ofstability issues or ensure that your program has a desired set of stability attributes. You can usethe dtrace -x amin=_attributes_ option to force the D compiler to produce an error whenany attributes computation results in a triplet of attributes less than the minimum values youspecify on the command-line. The following example demonstrates the use of -x amin using asnippet of D program source. Notice that attributes are specified using three labels delimited by/ in the usual order.
# dtrace -x amin=Evolving/Evolving/Common \
-ev -n dtrace:::BEGIN’{trace(curthread->t_procp);}’
dtrace: invalid probe specifier dtrace:::BEGIN{trace(curthread->t_procp);}: \
in action list: attributes for scalar curthread (Stable/Private/Common) \
are less than predefined minimum
#
Stability Enforcement
Oracle Solaris Dynamic Tracing Guide • November 2011 E22973_02400
Translators
In Chapter 18, “Stability,” we learned about how DTrace computes and reports programstability attributes. Ideally, we would like to construct our DTrace programs by consuming onlyStable or Evolving interfaces. Unfortunately, when debugging a low-level problem ormeasuring system performance, you may need to enable probes that are associated withinternal operating system routines such as functions in the kernel, rather than probes associatedwith more stable interfaces such as system calls. The data available at probe locations deepwithin the software stack is often a collection of implementation artifacts rather than morestable data structures such as those associated with the Oracle Solaris system call interfaces. Inorder to aid you in writing stable D programs, DTrace provides a facility to translateimplementation artifacts into stable data structures accessible from your D programstatements.
Translator DeclarationsA translator is a collection of D assignment statements provided by the supplier of an interfacethat can be used to translate an input expression into an object of struct type. To understand theneed for and use of translators, we'll consider as an example the ANSI-C standard libraryroutines defined in stdio.h. These routines operate on a data structure named FILE whoseimplementation artifacts are abstracted away from C programmers. A standard technique forcreating a data structure abstraction is to provide only a forward declaration of a data structurein public header files, while keeping the corresponding struct definition in a separate privateheader file.
If you are writing a C program and wish to know the file descriptor corresponding to a FILEstruct, you can use the fileno(3C) function to obtain the descriptor rather than dereferencing amember of the FILE struct directly. The Oracle Solaris header files enforce this rule by definingFILE as an opaque forward declaration tag so it cannot be dereferenced directly by C programsthat include <stdio.h>. Inside the libc.so.1 library, you can imagine that fileno isimplemented in C something like this:
19C H A P T E R 1 9
401

int
fileno(FILE *fp)
{
struct file_impl *ip = (struct file_impl *)fp;
return (ip->fd);
}
Our hypothetical fileno takes a FILE pointer as an argument and casts it to a pointer to acorresponding internal libc structure, struct file_impl, and then returns the value of the fdmember of the implementation structure. Why does Oracle Solaris implement interfaces likethis? By abstracting the details of the current libc implementation away from client programs,it is possible to maintain a commitment to strong binary compatibility while continuing toevolve and change the internal implementation details of libc. In our example, the fd membercould change size or position within struct file_impl, even in a patch, and existing binariescalling fileno(3C) would not be affected by this change because they do not depend on theseartifacts.
Unfortunately, observability software such as DTrace has the need to peer inside theimplementation in order to provide useful results, and does not have the luxury of callingarbitrary C functions defined in Oracle Solaris libraries or in the kernel. You could declare acopy of struct file_impl in your D program in order to instrument the routines declared instdio.h, but then your D program would rely on Private implementation artifacts of the librarythat might break in a future micro or minor release, or even in a patch. Ideally, we want toprovide a construct for use in D programs that is bound to the implementation of the libraryand is updated accordingly, but still provides an additional layer of abstraction associated withgreater stability.
A new translator is created using a declaration of the form:
translator output-type < input-type input-identifier > {
member-name = expression ;
member-name = expression ;
...
};
The output-type names a struct that will be the result type for the translation. The input-typespecifies the type of the input expression, and is surrounded in angle brackets < > and followedby an input-identifier that can be used in the translator expressions as an alias for the inputexpression. The body of the translator is surrounded in braces { } and terminated with asemicolon (;), and consists of a list of member-name and identifiers corresponding translationexpressions. Each member declaration must name a unique member of the output-type andmust be assigned an expression of a type compatible with the member type, according to therules for the D assignment (=) operator.
For example, we could define a struct of stable information about stdio files based on some ofthe available libc interfaces:
Translator Declarations
Oracle Solaris Dynamic Tracing Guide • November 2011 E22973_02402
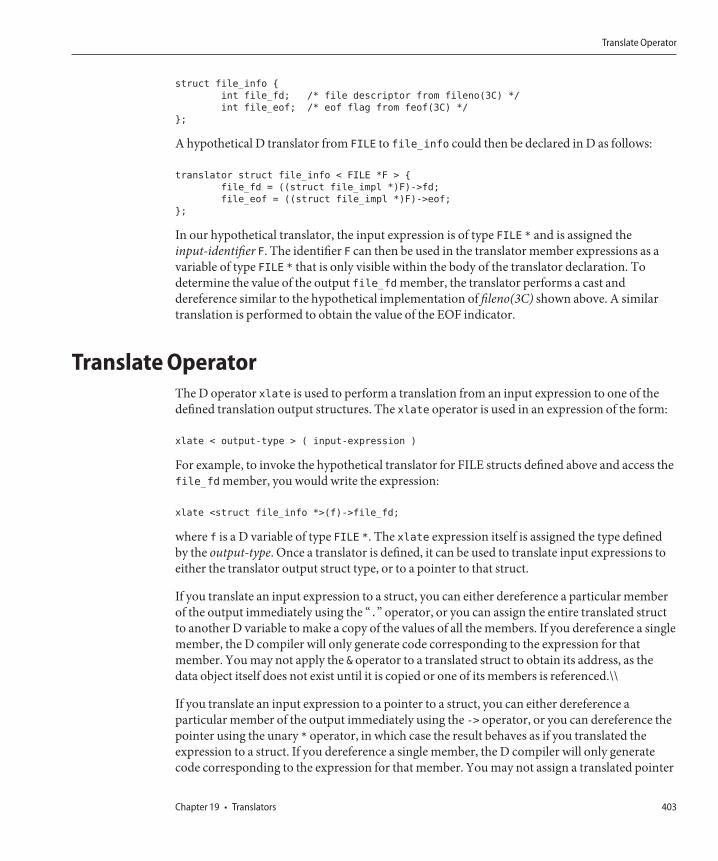
struct file_info {
int file_fd; /* file descriptor from fileno(3C) */
int file_eof; /* eof flag from feof(3C) */
};
A hypothetical D translator from FILE to file_info could then be declared in D as follows:
translator struct file_info < FILE *F > {
file_fd = ((struct file_impl *)F)->fd;
file_eof = ((struct file_impl *)F)->eof;
};
In our hypothetical translator, the input expression is of type FILE * and is assigned theinput-identifier F. The identifier F can then be used in the translator member expressions as avariable of type FILE * that is only visible within the body of the translator declaration. Todetermine the value of the output file_fd member, the translator performs a cast anddereference similar to the hypothetical implementation of fileno(3C) shown above. A similartranslation is performed to obtain the value of the EOF indicator.
Translate OperatorThe D operator xlate is used to perform a translation from an input expression to one of thedefined translation output structures. The xlate operator is used in an expression of the form:
xlate < output-type > ( input-expression )
For example, to invoke the hypothetical translator for FILE structs defined above and access thefile_fd member, you would write the expression:
xlate <struct file_info *>(f)->file_fd;
where f is a D variable of type FILE *. The xlate expression itself is assigned the type definedby the output-type. Once a translator is defined, it can be used to translate input expressions toeither the translator output struct type, or to a pointer to that struct.
If you translate an input expression to a struct, you can either dereference a particular memberof the output immediately using the “.” operator, or you can assign the entire translated structto another D variable to make a copy of the values of all the members. If you dereference a singlemember, the D compiler will only generate code corresponding to the expression for thatmember. You may not apply the & operator to a translated struct to obtain its address, as thedata object itself does not exist until it is copied or one of its members is referenced.\\
If you translate an input expression to a pointer to a struct, you can either dereference aparticular member of the output immediately using the -> operator, or you can dereference thepointer using the unary * operator, in which case the result behaves as if you translated theexpression to a struct. If you dereference a single member, the D compiler will only generatecode corresponding to the expression for that member. You may not assign a translated pointer
Translate Operator
Chapter 19 • Translators 403
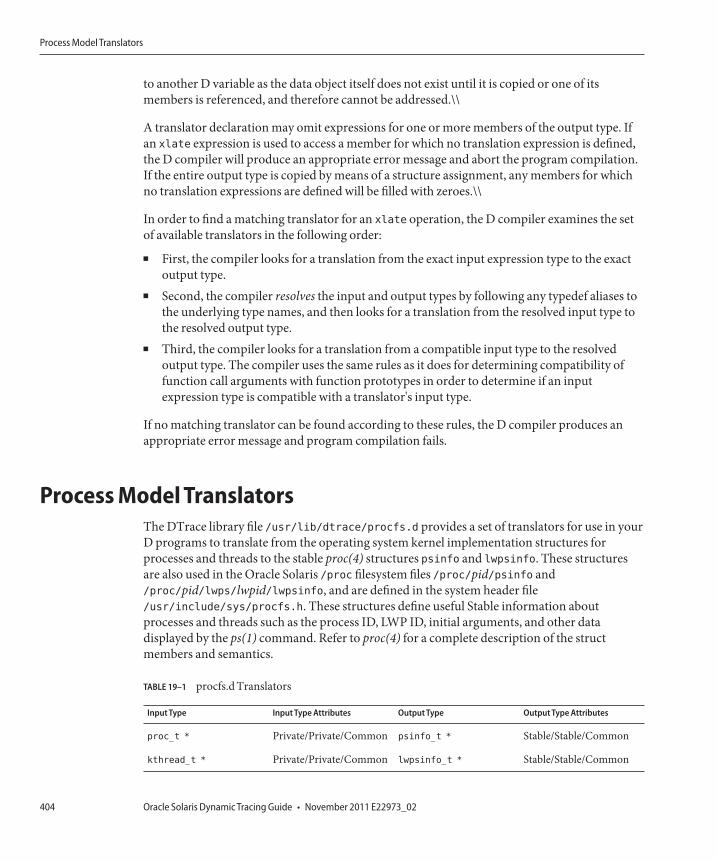
to another D variable as the data object itself does not exist until it is copied or one of itsmembers is referenced, and therefore cannot be addressed.\\
A translator declaration may omit expressions for one or more members of the output type. Ifan xlate expression is used to access a member for which no translation expression is defined,the D compiler will produce an appropriate error message and abort the program compilation.If the entire output type is copied by means of a structure assignment, any members for whichno translation expressions are defined will be filled with zeroes.\\
In order to find a matching translator for an xlate operation, the D compiler examines the setof available translators in the following order:
■ First, the compiler looks for a translation from the exact input expression type to the exactoutput type.
■ Second, the compiler resolves the input and output types by following any typedef aliases tothe underlying type names, and then looks for a translation from the resolved input type tothe resolved output type.
■ Third, the compiler looks for a translation from a compatible input type to the resolvedoutput type. The compiler uses the same rules as it does for determining compatibility offunction call arguments with function prototypes in order to determine if an inputexpression type is compatible with a translator's input type.
If no matching translator can be found according to these rules, the D compiler produces anappropriate error message and program compilation fails.
Process Model TranslatorsThe DTrace library file /usr/lib/dtrace/procfs.d provides a set of translators for use in yourD programs to translate from the operating system kernel implementation structures forprocesses and threads to the stable proc(4) structures psinfo and lwpsinfo. These structuresare also used in the Oracle Solaris /proc filesystem files /proc/pid/psinfo and/proc/pid/lwps/lwpid/lwpsinfo, and are defined in the system header file/usr/include/sys/procfs.h. These structures define useful Stable information aboutprocesses and threads such as the process ID, LWP ID, initial arguments, and other datadisplayed by the ps(1) command. Refer to proc(4) for a complete description of the structmembers and semantics.
TABLE 19–1 procfs.d Translators
Input Type Input Type Attributes Output Type Output Type Attributes
proc_t * Private/Private/Common psinfo_t * Stable/Stable/Common
kthread_t * Private/Private/Common lwpsinfo_t * Stable/Stable/Common
Process Model Translators
Oracle Solaris Dynamic Tracing Guide • November 2011 E22973_02404
Stable TranslationsWhile a translator provides the ability to convert information into a stable data structure, itdoes not necessarily resolve all stability issues that can arise in translating data. For example, ifthe input expression for an xlate operation itself references Unstable data, the resulting Dprogram is also Unstable because program stability is always computed as the minimumstability of the accumulated D program statements and expressions. Therefore, it is sometimesnecessary to define a specific stable input expression for a translator in order to permit stableprograms to be constructed. The D inline mechanism can be used to facilitate such stabletranslations.
The DTrace procfs.d library provides the curlwpsinfo and curpsinfo variables describedearlier as stable translations. For example, the curlwpsinfo variable is actually an inline
declared as follows:
inline lwpsinfo_t *curlwpsinfo = xlate <lwpsinfo_t *> (curthread);
#pragma D attributes Stable/Stable/Common curlwpsinfo
The curlwpsinfo variable is defined as an inlined translation from the curthread variable, apointer to the kernel's Private data structure representing a thread, to the Stable lwpsinfo_ttype. The D compiler processes this library file and caches the inline declaration, makingcurlwpsinfo appear as any other D variable. The #pragma statement following the declarationis used to explicitly reset the attributes of the curlwpsinfo identifier to Stable/Stable/Common,masking the reference to curthread in the inlined expression.
Stable Translations
Chapter 19 • Translators 405

406
Versioning
In Chapter 18, “Stability,” we learned about the DTrace features for determining the stabilityattributes of D programs that you create. Once you have created a D program with theappropriate stability attributes, you may also wish to bind this program to a particular version ofthe D programming interface. The D interface version is a label applied to a particular set oftypes, variables, functions, constants, and translators made available to you by the D compiler.If you specify a binding to a specific version of the D programming interface, you ensure thatyou can recompile your program on future versions of DTrace without encountering conflictsbetween program identifiers that you define and identifiers defined in future versions of the Dprogramming interface. You should establish version bindings for any D programs that youwish to install as persistent scripts (see Chapter 9, “Scripting”) or use in layered tools.
Versions and ReleasesThe D compiler labels sets of types, variables, functions, constants, and translatorscorresponding to a particular software release using a version string. A version string is aperiod-delimited sequence of decimal integers of the form “x” (a Major release), “x.y” (a Minorrelease), or “x.y.z” (a Micro release). Versions are compared by comparing the integers from leftto right. If the leftmost integers are not equal, the string with the greater integer is the greater(and therefore more recent) version. If the leftmost integers are equal, the comparison proceedsto the next integer in order from left to right to determine the result. All unspecified integers ina version string are interpreted as having the value zero during a version comparison.
The DTrace version strings correspond to the standard nomenclature for interface versions, asdescribed in attributes(5). A change in the D programming interface is accompanied by a newversion string. The following table summarizes the version strings used by DTrace and thelikely significance of the corresponding DTrace software release.
20C H A P T E R 2 0
407
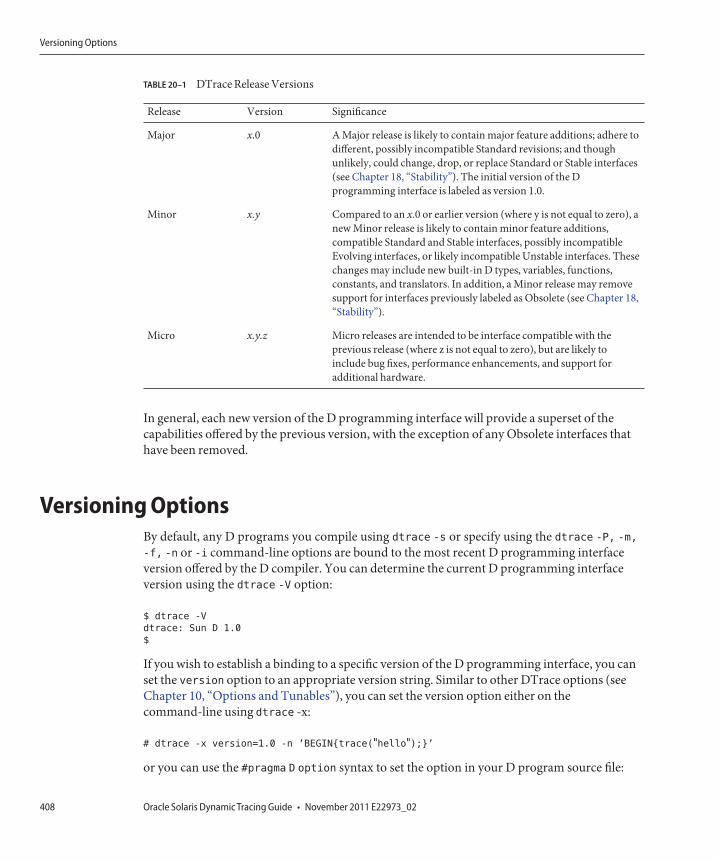
TABLE 20–1 DTrace Release Versions
Release Version Significance
Major x.0 A Major release is likely to contain major feature additions; adhere todifferent, possibly incompatible Standard revisions; and thoughunlikely, could change, drop, or replace Standard or Stable interfaces(see Chapter 18, “Stability”). The initial version of the Dprogramming interface is labeled as version 1.0.
Minor x.y Compared to an x.0 or earlier version (where y is not equal to zero), anew Minor release is likely to contain minor feature additions,compatible Standard and Stable interfaces, possibly incompatibleEvolving interfaces, or likely incompatible Unstable interfaces. Thesechanges may include new built-in D types, variables, functions,constants, and translators. In addition, a Minor release may removesupport for interfaces previously labeled as Obsolete (see Chapter 18,“Stability”).
Micro x.y.z Micro releases are intended to be interface compatible with theprevious release (where z is not equal to zero), but are likely toinclude bug fixes, performance enhancements, and support foradditional hardware.
In general, each new version of the D programming interface will provide a superset of thecapabilities offered by the previous version, with the exception of any Obsolete interfaces thathave been removed.
Versioning OptionsBy default, any D programs you compile using dtrace -s or specify using the dtrace -P, -m,-f, -n or -i command-line options are bound to the most recent D programming interfaceversion offered by the D compiler. You can determine the current D programming interfaceversion using the dtrace -V option:
$ dtrace -V
dtrace: Sun D 1.0
$
If you wish to establish a binding to a specific version of the D programming interface, you canset the version option to an appropriate version string. Similar to other DTrace options (seeChapter 10, “Options and Tunables”), you can set the version option either on thecommand-line using dtrace -x:
# dtrace -x version=1.0 -n ’BEGIN{trace("hello");}’
or you can use the #pragma D option syntax to set the option in your D program source file:
Versioning Options
Oracle Solaris Dynamic Tracing Guide • November 2011 E22973_02408
#pragma D option version=1.0
BEGIN
{
trace("hello");}
If you use the #pragma D option syntax to request a version binding, you must place thisdirective at the top of your D program file prior to any other declarations and probe clauses. Ifthe version binding argument is not a valid version string or refers to a version not offered bythe D compiler, an appropriate error message will be produced and compilation will fail. Youcan therefore also use the version binding facility to cause execution of a D script on an olderversion of DTrace to fail with an obvious error message.
Prior to compiling your program declarations and clauses, the D compiler loads the set of Dtypes, functions, constants, and translators for the appropriate interface version into thecompiler namespaces. Therefore, any version binding options you specify simply control the setof identifiers, types, and translators that are visible to your program in addition to the variables,types, and translators that your program defines. Version binding prevents the D compiler fromloading newer interfaces that may define identifiers or translators that conflict with declarationsin your program source code and would therefore cause a compilation error. See “IdentifierNames and Keywords” on page 40 for tips on how to pick identifier names that are unlikely toconflict with interfaces offered by future versions of DTrace.
Provider VersioningUnlike interfaces offered by the D compiler, interfaces offered by DTrace providers (that is,probes and probe arguments) are not affected by or associated with the D programminginterface or the previously described version binding options. The available provider interfacesare established as part of loading your compiled instrumentation into the DTrace software inthe operating system kernel and vary depending on your instruction set architecture, operatingplatform, processor, the software installed on your Oracle Solaris system, and your currentsecurity privileges. The D compiler and DTrace runtime examine the probes described in yourD program clauses and report appropriate error messages when probes requested by your Dprogram are not available. These features are orthogonal to the D programming interfaceversion because DTrace providers do not export interfaces that can conflict with definitions inyour D programs; that is, you can only enable probes in D, you cannot define them, and probenames are kept in a separate namespace from other D program identifiers.
DTrace providers are delivered with a particular release of Oracle Solaris and are described inthe corresponding version of the Oracle Solaris Dynamic Tracing Guide. The chapter of thisguide corresponding to each provider will also describe any relevant changes to or new featuresoffered by a given provider. You can use the dtrace -l option to explore the set of providersand probes available on your Oracle Solaris system. Providers label their interfaces using theDTrace stability attributes, and you can use the DTrace stability reporting features (see
Provider Versioning
Chapter 20 • Versioning 409

Chapter 18, “Stability”) to determine whether the provider interfaces used by your D programare likely to change or be offered in future Oracle Solaris releases.
Provider Versioning
Oracle Solaris Dynamic Tracing Guide • November 2011 E22973_02410
![Playing Hide and Seek Memory - FIRST · ponycorn (both pony and unicorn)… official mascott! 14. What’s DTrace? • Dynamic Tracing Framework [*] • Built for Solaris, now on](https://img.pdfslide.us/doc/110x75/612f17601ecc51586943390f/playing-hide-and-seek-memory-first-ponycorn-both-pony-and-unicorn-official-mascott.jpg)

![Oracle Solaris Dynamic Tracing – DTraceandrew/downloads/LOSUG/u-2011/dtrace... · Solaris Dynamic Tracing - DTrace “ [expletive deleted] It's like they saw inside my head and](https://img.pdfslide.us/doc/110x75/5a7a40b37f8b9ac3118be8eb/oracle-solaris-dynamic-tracing-andrewdownloadslosugu-2011dtracesolaris.jpg)


![Playing Hide and Seek Memory - Improving Security … · What’s DTrace? • Dynamic Tracing Framework [*] • Built for Solaris, now on OS X and TrustedBSD • Used for troubleshooting](https://img.pdfslide.us/doc/110x75/5b7ad8e17f8b9a474a8b7503/playing-hide-and-seek-memory-improving-security-whats-dtrace-dynamic.jpg)