Embed Size (px)
Citation preview
DTrace Boot Camp
Adam Leventhal http://blogs.sun.com/ahlSolaris Kernel DevelopmentSun Microsystems, Inc.
8.18.2005
DTrace Boot Camp(Drop And Give Me 20)
Adam Leventhal http://blogs.sun.com/ahlSolaris Kernel DevelopmentSun Microsystems, Inc.

DISCLAIMER
This is very much a work in progress – you'll notice that there are many places awaiting more information. I've made it publicly available because I think that even in its raw state it will be useful to people learning DTrace. I welcome any and all feedback. Thanks to the Sun folks in Prague and the UK who have already helped to improve this presentation. Enjoy!
-- Adam
What Is DTrace?
• DTrace is the dynamic tracing facility in Solaris 10• Unique in its focus on production systems and its
integration of user-level and kernel-level tracing• Has 30,000+ probes on a system by default• Allows for tracing of arbitrary data and arbitrary
expressions using the D language• Similar to C or awk
What Is This Talk?
• How to use DTrace• How to use the D language• Probes, arguments, variables, and actions• The basics to start using DTrace for the kernel,
user-land or Java• Many examples, exercises, and challenges to get
you using DTrace on your own• Ask questions!
Preliminary Steps
• Get a Solaris 10 machine• Become the root user• Make a new directory – use it to save all the
examples from this talk• Might want to record your command-line history for
future reference
Introduction to DTrace
• Listing probes• Enabling probes• Built-in variables• The trace(), and printf() actions
Listing Probes
• Use dtrace -l to list all probes• Can mix -l with -n to list probes matching a pattern• Specify probes by a four-tuple:
provider:module:function:name• Any component can be blank• Exercise: list some probes• Exercise: combine -l and -n• Exercise: try using wildcards for the various
components of the probe tuple
Enabling Probes
• Try it:dtrace -n syscall:::entry
• Traces every system call on the system• Exercise: trace a single system call entry
The trace() Action and Variables
• Use the trace() action to trace any datum> e.g. results of computation, variables, etc.
• Try tracing a value:dtrace -n 'syscall:::entry{ trace(10); }'
• Exercise: trace a variable> execname – currently running executable> timestamp – nanosecond timestamp> walltimestamp – seconds since the Unix epoch> pid, uid, gid, etc. – what you'd expect
Predicates
• Predicates are arbitrary D expressions that determine if a clause is executed• Specify a predicate like this:
/arbitrary-expression/• Try limiting tracing to a particular executable
dtrace -n 'syscall:::entry/execname == “Xorg”/{}'• Exercise: mix predicates and the trace() action
More Variables
• Each part of a probe has an associated variable> probeprov – provider name> probemod – module containing the probe (if any)> probefunc – function containing the probe> probename – name of probe
• Probes can have arguments (arg0, arg1, etc.)> Different for each provider and each probe
• syscall entry probe arguments are the parameters passed to the system call• Exercise: try tracing system call arguments
The printf() Action
• Modeled after printf(3C) – behaves as you'd expect• Small difference: 'l's not needed to specify argument
width – but you can use them• Exercise: use printf to trace the pid and execname• Done? Try your favorite printf() formats
Fun With walltimestamp
• The printf() action has some additional format characters (some borrowed from mdb(1))• %Y can be used to format a date• Try it:
dtrace -n 'BEGIN{ printf(“%Y”, walltimestamp); }'
D-Scripts
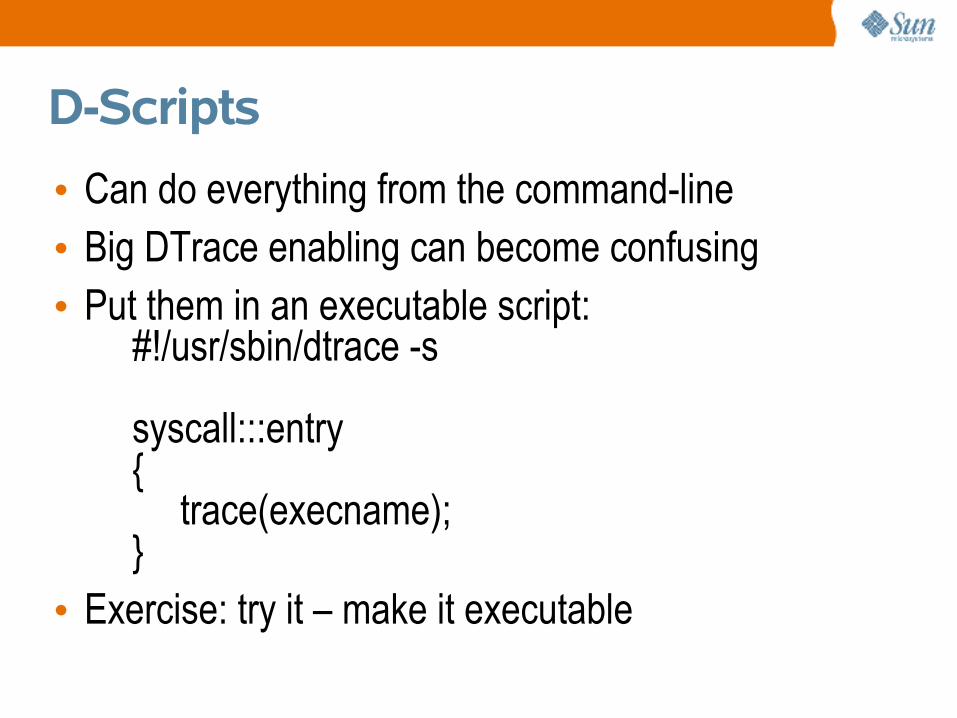
• Can do everything from the command-line• Big DTrace enabling can become confusing• Put them in an executable script:
#!/usr/sbin/dtrace -s
syscall:::entry{
trace(execname);}
• Exercise: try it – make it executable
Aggregations
• Often the individual data points are overwhelming• Aggregations provide a way of accumulating data• Data stored efficiently on MP systems• Several aggregating functions• Aggregations can be keyed by an arbitrary tuple of
D expressions• By default, the contents of aggregations are printed
when the consumer completes> e.g. when you hit ^C
Simple Aggregation With count()
• Aggregations are specified like this:@name[arbitrary-tuple] = action(arguments)
• The name and tuple may be omitted• The arguments depend on the aggregating action• Try it:
dtrace -n 'syscall:::entry{ @ = count(); }'• Exercise: try specifying a name for the aggregation• Exercise: try adding tuple keys (comma separated)• Exercise: produce a count for each system call
The quantize() Aggregating Action
• The quantize() action is particularly useful for performance work• Takes a single numeric argument• Produces a histogram in power of two buckets• Try it:
dtrace -n 'syscall::write:entry{ @ = quantize(arg2); }'
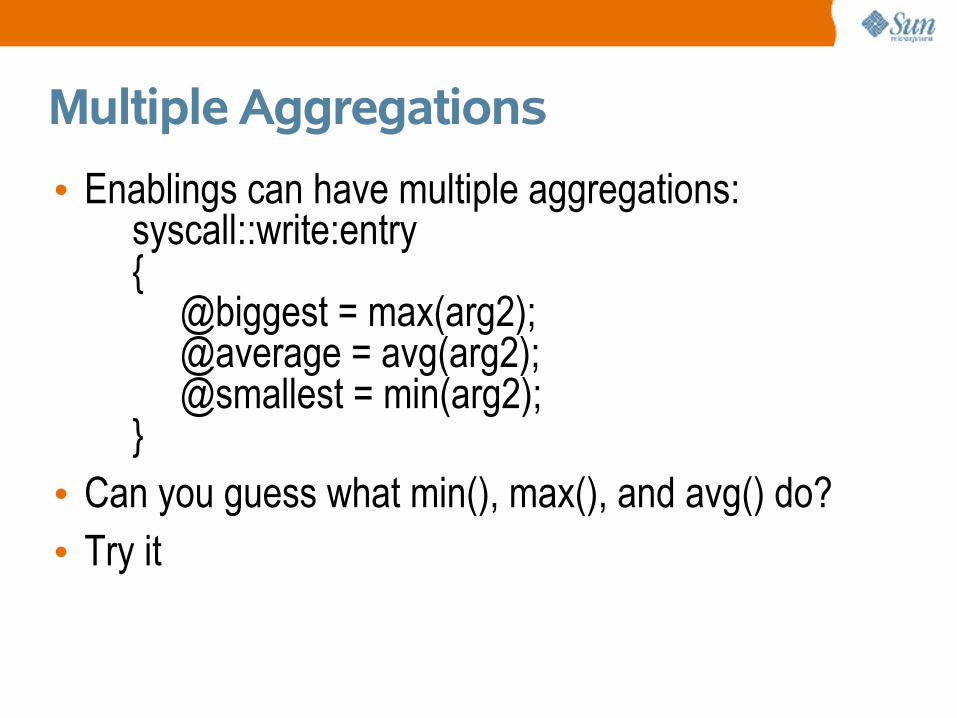
Multiple Aggregations
• Enablings can have multiple aggregations:syscall::write:entry{
@biggest = max(arg2);@average = avg(arg2);@smallest = min(arg2);
}• Can you guess what min(), max(), and avg() do?• Try it
Thread-Local Variables
• Several different types of variables> global, thread-local, probe-local> already seen built-in variables
• Thread-locals are the most common• Specify a thread-local variable like this:
self->name• Usually no need to declare them – DTrace will
create them on the fly and infer the type (if it can)• Value starts as 0 – assigning 0 frees them
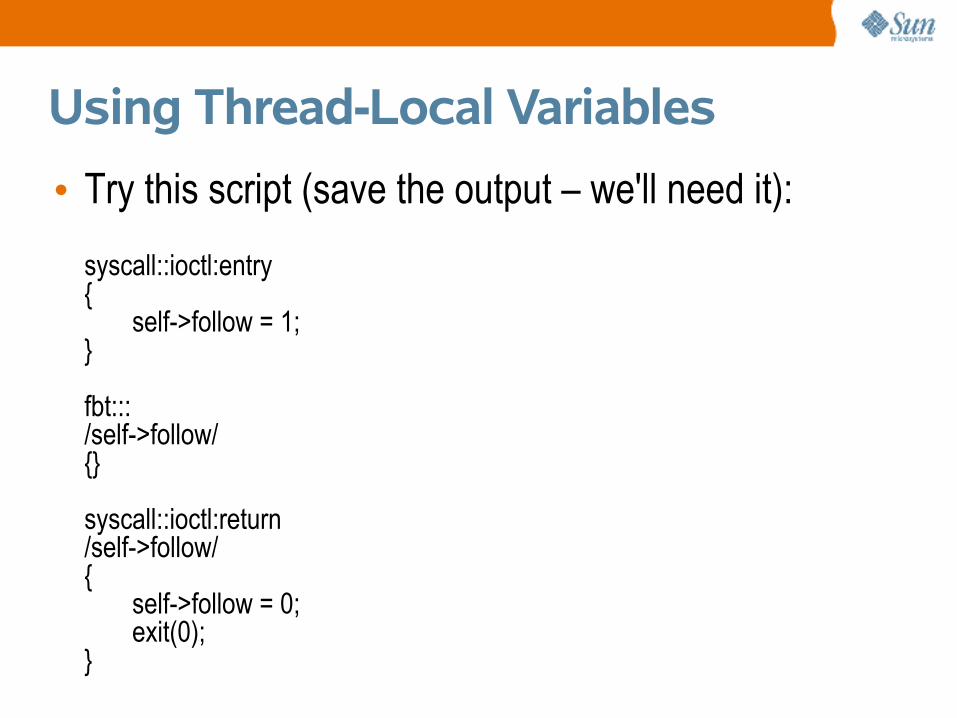
Using Thread-Local Variables
• Try this script (save the output – we'll need it):
syscall::ioctl:entry{
self->follow = 1;}
fbt:::/self->follow/{}
syscall::ioctl:return/self->follow/{
self->follow = 0;exit(0);
}
Aside: Pragmas
• DTrace has pragmas to allow you to tune certain options• To the previous script, try adding the following:
#pragma D option flowindent
• Note that you can do the same thing with the -F option to dtrace(1M)
Using Thread-Locals For Timing
• Exercise: using a thread-local variable and the timestamp variable, aggregate on the time taken for each system call• Exercise: keying the aggregation by the name of the
system call, quantize on the time taken
Aside: The stack() Action
• Run that follow script again and pick a kernel function• Try enabling it (in a new script)
fbt::function-name:entry• Now use the stack() action:
fbt::copyin:entry{ stack(); }• You can also use stack() as a key for an
aggregation• Exercise: try it
Problem With The stack() Action
• Trace the entire kernel stack trace• Can't access the individual elements• Would be nice to look at part of the stack in a
predicate• Can produce similar effects with thread-locals
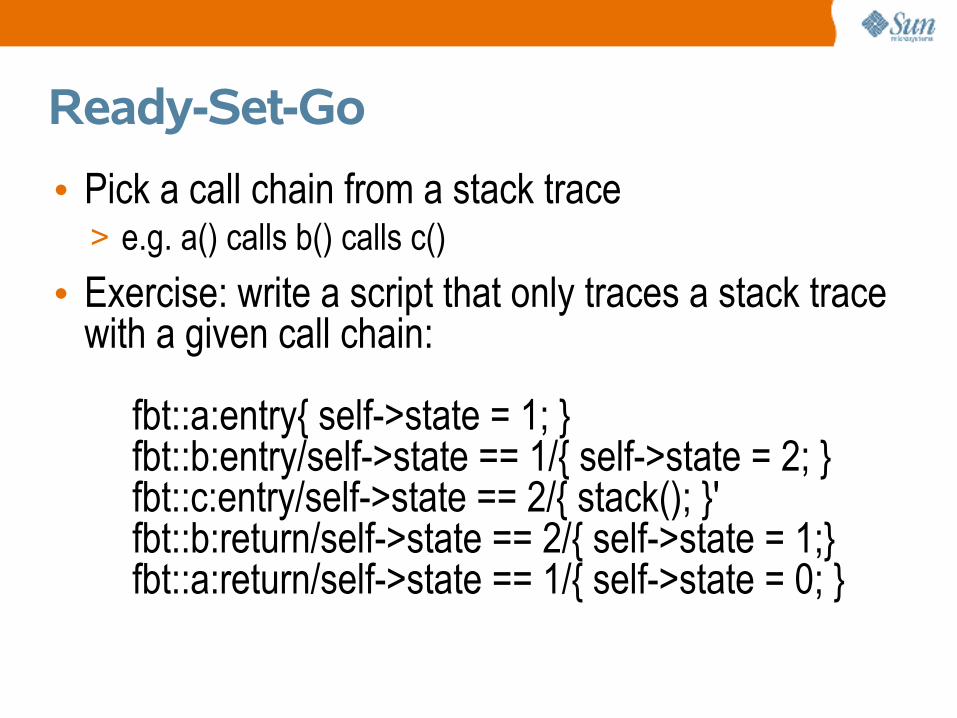
Ready-Set-Go
• Pick a call chain from a stack trace> e.g. a() calls b() calls c()
• Exercise: write a script that only traces a stack trace with a given call chain:
fbt::a:entry{ self->state = 1; }fbt::b:entry/self->state == 1/{ self->state = 2; }fbt::c:entry/self->state == 2/{ stack(); }'fbt::b:return/self->state == 2/{ self->state = 1;}fbt::a:return/self->state == 1/{ self->state = 0; }
Aside: The BEGIN and END probes
• The dtrace:::BEGIN probe fires when tracing starts• The dtrace:::END probe fires when tracing is done> Either because of a ^C or the exit() action
• Often abbreviated as BEGIN and END• Exercise: use the printf() action from BEGIN• Exercise: use the exit() action in BEGIN and the
printf() action in END• BEGIN is a good place to do some initialization• END is a good place to do clean up and printing
Associative Arrays
• Associative arrays are like maps or hashtables• A global associative array looks like this:
name[arbitrary-tuple]• Associative arrays can also be thread-local:
self->name[arbitrary-tuple]• Can be used like any other variable• Like all variables, uninitialized variables start out
with a value of 0 (or NULL if you prefer)
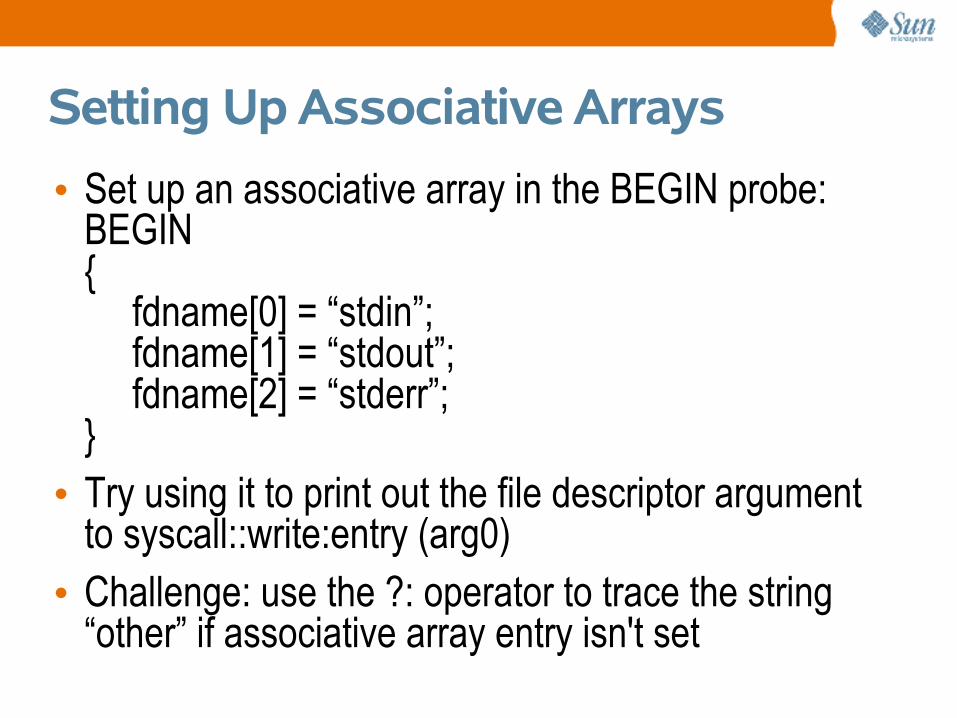
Setting Up Associative Arrays
• Set up an associative array in the BEGIN probe:BEGIN{
fdname[0] = “stdin”;fdname[1] = “stdout”;fdname[2] = “stderr”;
}• Try using it to print out the file descriptor argument
to syscall::write:entry (arg0)• Challenge: use the ?: operator to trace the string
“other” if associative array entry isn't set
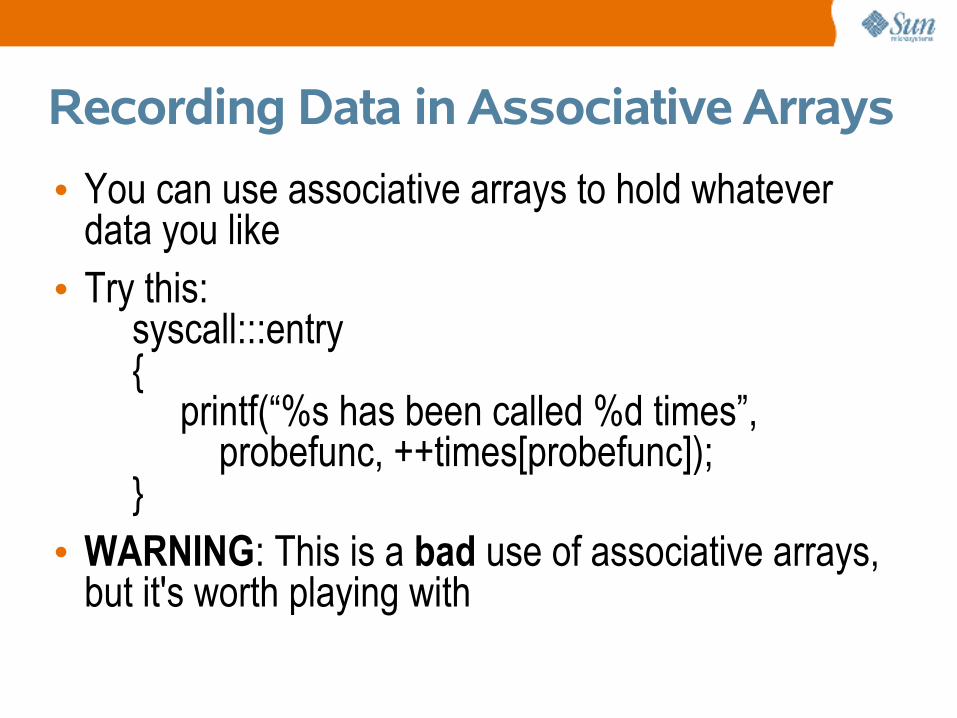
Recording Data in Associative Arrays
• You can use associative arrays to hold whatever data you like• Try this:
syscall:::entry{
printf(“%s has been called %d times”, probefunc, ++times[probefunc]);
}• WARNING: This is a bad use of associative arrays,
but it's worth playing with
Associative Array Challenge
• Exercise: modify that “follow” script from before to record the time spent in each function (don't worry about recursion)• Hint: use a thread-local associative array• Exercise (harder): try writing the above script to
gracefully handle recursive calls
Associative Arrays v. Aggregations
• Aggregations use per-CPU buffers to ensure a scalable implementation• Only one instance of each associative array
element• Multiple CPUs can race to read and modify values
in an associative array• No way to output the entire contents of an
associative array• Conclusion: use aggregations for recording data for
output and associative arrays like a hashtable
User-Level Tracing
• The pid provider• Probes and probe arguments• The ustack() action• Tracing processes with -c and -p• The copyin() and copyinstr() actions• Our first destructive action: copyout()
The pid Provider
• The pid provider defines a class of providerspidprocess-ID:object-name:function:name
• The probe name can be “entry” or “return” or a hexadecimal value corresponding to an instruction offset• The pid provider can trace any instruction on any
process on the system!• WARNING: You probably don't want to trace every
instruction even in a single process at once> It'll work, but it will take a loooooong time
Using the pid Provider
• Use prstat(1) or pgrep(1) to find the pid of a process for you to play with• Exercise: using an aggregation, count the number
of times each function is called in an application• Exercise (harder): aggregate based on the time
spent in each function (including called functions)• Done? Try modifying previous examples to use the
pid provider (rather than syscall or fbt)
Arguments For The pid Provider
• Arguments to the entry probe are the parameters to the function• For return probes:> arg0 – the offset in the function of the given return site> arg1 – the function's return value
• For offset probes, the arguments are undefined• Exercise: Use the pid<pid>::malloc:entry probe to
quantize on the size of allocations• Exercise (hard): Aggregate on the time between
malloc(3C) and free(3C) for a given allocation
The ustack() Action
• Records a user-level stack trace> Analogous to the stack() action for the kernel
• Can be used from any probe – kernel or user-level• Data recording action or key for aggregation• Exercise: pick a pid provider probe and use the
ustack() action both by itself and as a key for an aggregation
Tracing Processes with -c and -p
The copyin() Action
• DTrace actions are executed in the kernel• To access user-land data, need to use the copyin()
or copyinstr() actions – return pointers to data
copyin(address, size)copyinstr(address)
• copyinstr() looks for a terminating NULL byte
Using the copyin() Action
• Reminder:copyin(address, size)copyinstr(address)
• Exercise: use copyinstr() to examine the files being opened with the open(2) system call> Gotcha: applications may use open64(2)
• Exercise (hard): use copyin() to print the values returned by the uname(2) system call> Hint: use a thread-local to remember the input address> Hint: cast value returned by copyin() to struct utsname *
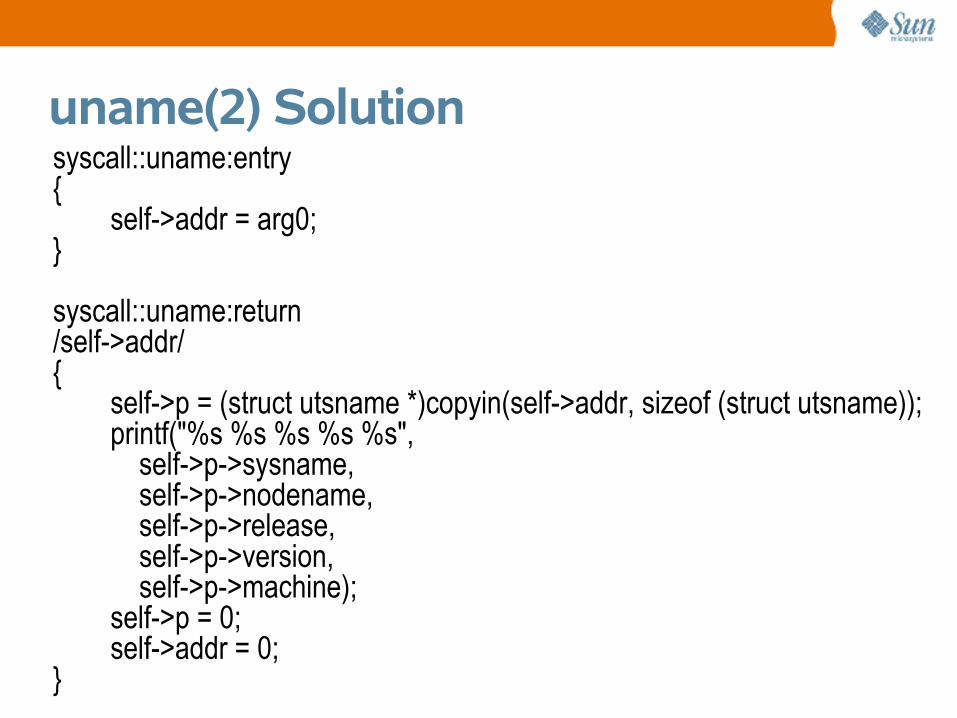
uname(2) Solutionsyscall::uname:entry{ self->addr = arg0;}
syscall::uname:return/self->addr/{ self->p = (struct utsname *)copyin(self->addr, sizeof (struct utsname)); printf("%s %s %s %s %s", self->p->sysname, self->p->nodename, self->p->release, self->p->version, self->p->machine); self->p = 0; self->addr = 0;}
Aside: Probe-Local Variables
• Probe-local variables survive for the duration of a given probe firing• Specified a little like thread-locals: this->name• Used to store temporary values or to communicate
values between successive instances of the same probe• No need to set variables to 0 as it was with thread-
locals – automatically deleted after a probe fires
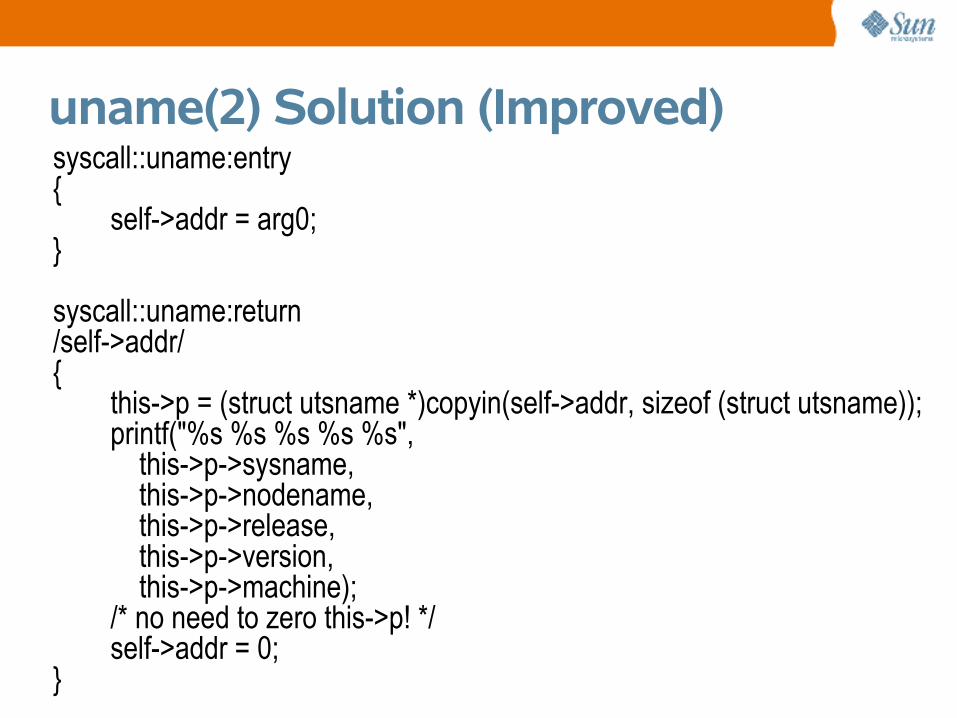
uname(2) Solution (Improved)syscall::uname:entry{ self->addr = arg0;}
syscall::uname:return/self->addr/{ this->p = (struct utsname *)copyin(self->addr, sizeof (struct utsname)); printf("%s %s %s %s %s", this->p->sysname, this->p->nodename, this->p->release, this->p->version, this->p->machine); /* no need to zero this->p! */ self->addr = 0;}
Aside: Destructive Actions
• DTrace is designed to protect the state of the system so doesn't allow modifications...• ... most of the time• Destructive actions allow for destructive behavior• Enable the use of destructive actions with with -w
option to dtrace(1M) or by adding the following to your script:
#pragma D option destructive• WARNING: Destructive actions are appropriately
named – you can destroy your system!
Fun With The copyout() Action
• Copies out given data to the user-land process:
copyout(address, data, size)copyoutstr(string, address, size)
• Exercise: using a predicate, try changing one file name to another in open(2) (be careful)• Exercise: try changing the output of uname(1) with a
DTrace script that modifies the data returned by uname(2)
The Profile Provider
• The profile provider has two types of probes> profile-interval – fires on every CPU each interval> tick-interval – fires on a CPU each interval
• Profile probes used for profiling• Tick probes used for time-based script activities• Intervals can have suffixes like 'hz', 's', 'sec', 'm',
'min'• Intervals default to hertz with no suffix
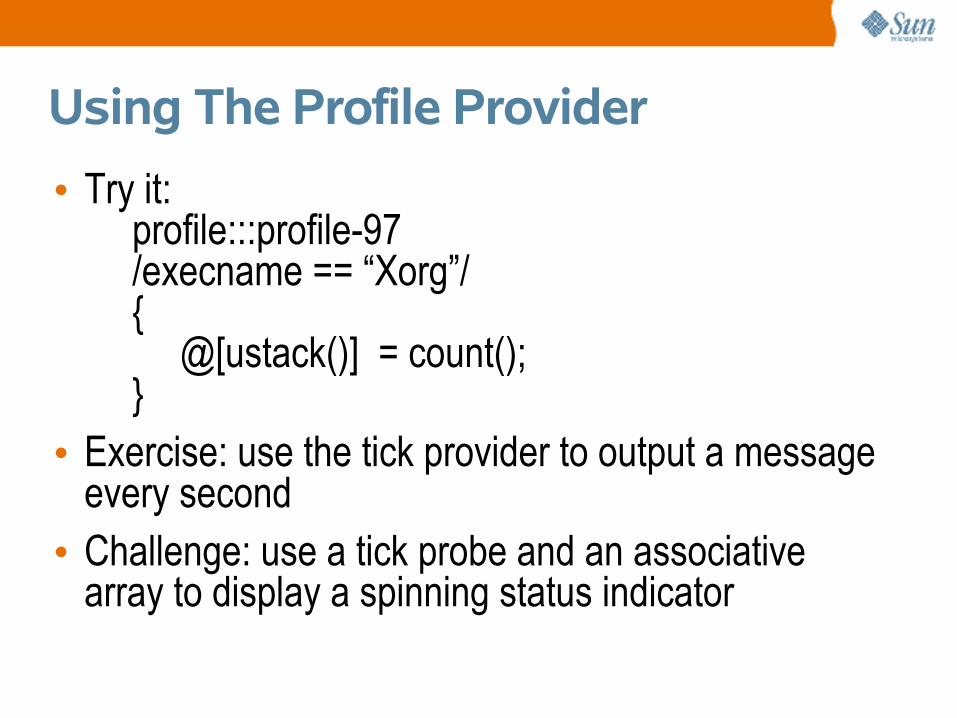
Using The Profile Provider
• Try it:profile:::profile-97/execname == “Xorg”/{
@[ustack()] = count();}
• Exercise: use the tick provider to output a message every second• Challenge: use a tick probe and an associative
array to display a spinning status indicator
Advanced Aggregations
• Aggregations have some operations which can be applied to them• The clear() action clears all values (not the keys)• The trunc() action clears values and keys• The printa() action can be used to format
aggregations
The trunc() Action
• The trunc() action clears aggregation keys and values• It is invoked like this:
trunc(@name[, count])• The optional count specifies the number of entries
to keep> Positive values keep the top count entries> Negative values keep the bottom count entries
• Exercise: write a DTrace script to output the top 10 most often called functions (use trunc() in END)
The clear() and printa() Actions
• The clear() action takes an aggregation as its argument and clears its values• The printa() action takes a printf-like format string
and an aggregation and prints out each element according to that format• The '@' format character is for the result of the
aggregation• Try it:
syscall:::entry{ @[probefunc] = count(); }END{ printa(“%s was called %@u times\n”, @); }
Using clear() and printa()
• Exercise: write a script that collects a count of the functions called in a process and prints them out every second (hint use a tick probe)• Exercise: now clear the aggregation so you see the
functions called in the last second• Challenge: record both the function and module
name, look at the default output, improve it with the printa() action
DTrace for Java
Aside: Options and Tunables
• Many options and tunables you can specify• Use -xoption[=value] or add this to your script:
#pragma D option option[=value]• Buffer sizes can use suffixes like 'k' or 'M'• Rates can use suffixes like 'hz', 's' or 'm'
Unexpected Failures
• Errors:> Illegal operations> Spurious failures
• Drops> Data drops> Aggregation drops> Dynamic variable drops
Errors
• Errors can occur due to an illegal operation• Errors cause the executing clause to be aborted
and no data to be traced from that clause• Try this:
dtrace -n 'BEGIN{ *(int *)NULL; }'• A common error is a copyin() “first touch”• If a user-land page is not in memory, copyin() will
fail with an error
Dealing With copyin() Errors
• Usually happens in a enabling like this:syscall::open:entry{ copyinstr(arg0); }
• Trick: let the kernel perform the “first touch”, and catch it in the return probe• Exercise: Use a thread-local variable and record the
filename to open(2) in the return probe
Data Drops
• Data drops can occur if you're tracing data too much data or you're tracing it too quickly• Data is recorded to per-CPU, fixed-sized, in-kernel
buffers and the user-land consumer then takes a snapshot of that buffer• Data drops can be solved by...> increasing the size of the tracing buffer (bufsize)> increasing the rate at which the consumer takes
snapshots (switchrate)> tracing less data
Aggregation Drops
• Aggregation drops are similar to data drops and can be solved by> increasing the size of the aggregation buffers (aggsize)> increasing the rate at which aggregations are captured
by the consumer (aggrate)
Dynamic Variable Drops
• Dynamic variable drops occur when there's no space to store an instantiated variable• NOTE: Any dynamic variable drops mean your data
is probably invalid• Usually happen when you fail to free a variable by
setting it to 0• Can happen with large and complex scripts• Fix it by tuning dynvarsize higher
Destructive Actions
• Destructive actions change the state of the system• They need to be used with utmost care – or else
you can trash your system
The stop() Action
• Stops the currently running process• Destructive because it modifies the state of the
system• Use prun(1) to restart a stopped process• Exercise: try using stop() to stop your shell> WARNING: If you don't use a predicate you could end up
stopping every process on your system
The raise() Action
• The raise() action sends a signal to the currently running process• Takes the signal number as an argument• Destructive – of course• Exercise: use the raise() action to kill every process
that tries to open(2) a particular file> WARNING: If you use the wrong predicate you could kill
every process on your system
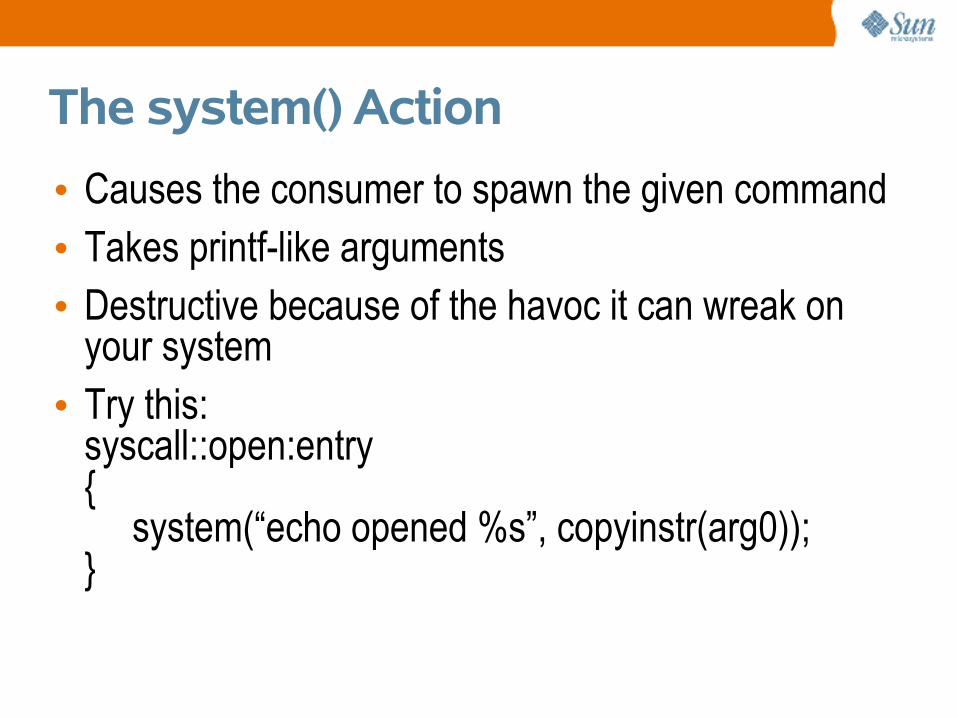
The system() Action
• Causes the consumer to spawn the given command• Takes printf-like arguments• Destructive because of the havoc it can wreak on
your system• Try this:
syscall::open:entry{
system(“echo opened %s”, copyinstr(arg0));}
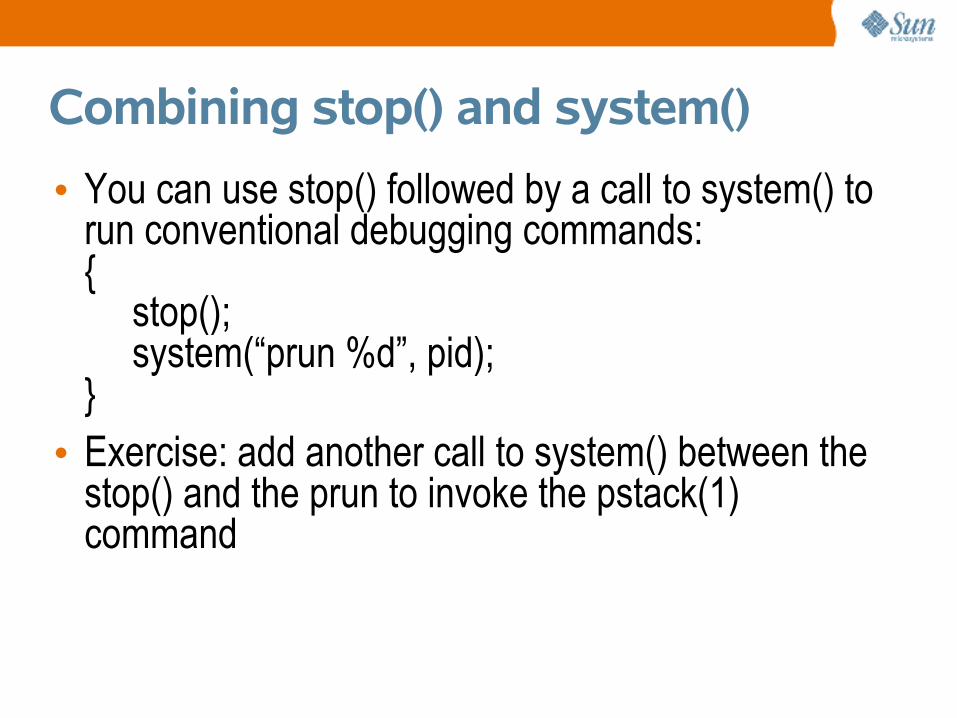
Combining stop() and system()
• You can use stop() followed by a call to system() to run conventional debugging commands:{
stop();system(“prun %d”, pid);
}• Exercise: add another call to system() between the
stop() and the prun to invoke the pstack(1) command
Speculative Tracing

Anonymous Tracing
Using DTrace as Non-Root
Want More?
• This was a decent survey, but it just scratched the surface• Go to the DTrace home page> http://www.opensolaris.org/os/community/dtrace> Check out the Solaris Dynamic Tracing Guide> Look at the examples in /usr/demo/dtrace> Join the DTrace discussion list
• You have enough to start using DTrace on your own• Ask questions if you get stuck
Adam Leventhalhttp://blogs.sun.com/ahl
Using DTrace
Q&A