Embed Size (px)
Citation preview
USE IMPROVE EVANGELIZE
Performance Tuning Linux Applications With DTraceAdam LeventhalSolaris Kernel DevelopmentSun Microsystems
http://blogs.sun.com/ahl
2
USE IMPROVE EVANGELIZE
Application Sprawl
● Applications are no longer simple entities● Complex heterogeneous systems● Rapid development trumps systemic
simplicity● Definition of the application is expanding
to include the operating environment
3
USE IMPROVE EVANGELIZE
Performance Still Rules
● A heterogeneous system may be faster to develop, but...
● It can be more difficult to understand● Therefore much more difficult to drive
performance problems to a root-cause● The age of solely solving performance
problems with more gear is over– Consider cost, power, cooling, space, etc.
4
USE IMPROVE EVANGELIZE
● Application-centric tools are narrow in scope, developer-focused, and not suitable for use in production
● Systemic tools are static, and difficult to correlate to specific application behavior
● Need a tool with systemic scope, that's dynamic, and can be used in production
Performance Tools
5
USE IMPROVE EVANGELIZE
DTrace
● Systemic analysis tool for system administrators and developers
● Offers dynamic instrumentation of user-land applications and the kernel
● Probes at any user-land instruction and throughout the kernel
● Most systems start with ~30,000 probes● Probes are also created dynamically
6
USE IMPROVE EVANGELIZE
DTrace, cont.
● No overhead when not in use● No application recompile or restart
needed● Dynamic control language for arbitrary
actions and predicates● Powerful data management primitives for
accumulation and analysis● Speculative tracing, thread-local
variables, and much more...
7
USE IMPROVE EVANGELIZE
Probes
● A probe is a point of instrumentation● A probe is made available by a provider● Each probe identifies the module and
function that it instruments● Each probe also has a name● Such a four-tuple uniquely identifies
every probe
8
USE IMPROVE EVANGELIZE
Providers
● A provider represents a way to instrument the system
● Providers make probes available to the DTrace framework
● The DTrace framework informs providers when a probe is to be enabled
● Providers transfer control to DTrace when an enabled probe is hit
9
USE IMPROVE EVANGELIZE
Listing Probes
● Probes can be listed with the “-l” option to dtrace(1M)
● For each probe, the identifying four-tuple is displayed
● Probe tuple components can be specified in a colon-delimited list
● Empty components match anything● For example: “syscall::open:entry”
10
USE IMPROVE EVANGELIZE
Enabling Probes
● Probes are enabled by specifying them without the “-l” option
● When enabled in this way, probes are enabled with the default action
● The default action will indicate only that the probe fired
11
USE IMPROVE EVANGELIZE
Actions
● Actions are taken when a probe fires● Most actions record some system state● Some actions change the state of the
system system in a well-defined way– These are called destructive actions
– Disabled by default
● Many actions take as parameters expressions in the D language
12
USE IMPROVE EVANGELIZE
The D Language
● D is a C-like language specific to DTrace, with some constructs similar to awk(1)
● Complete support for ANSI-C operators● Support for strings as first-class citizen● We'll introduce D features as we need
them...
13
USE IMPROVE EVANGELIZE
Built-In D Variables
● For now, our D expressions will consist only of built-in variables
● Example of built-in variables:– pid is the current process ID
– execname is the current executable name
– timestamp is the time since boot, in nanoseconds
– probeprov, probemod, probefunc and probename identify the current probe
14
USE IMPROVE EVANGELIZE
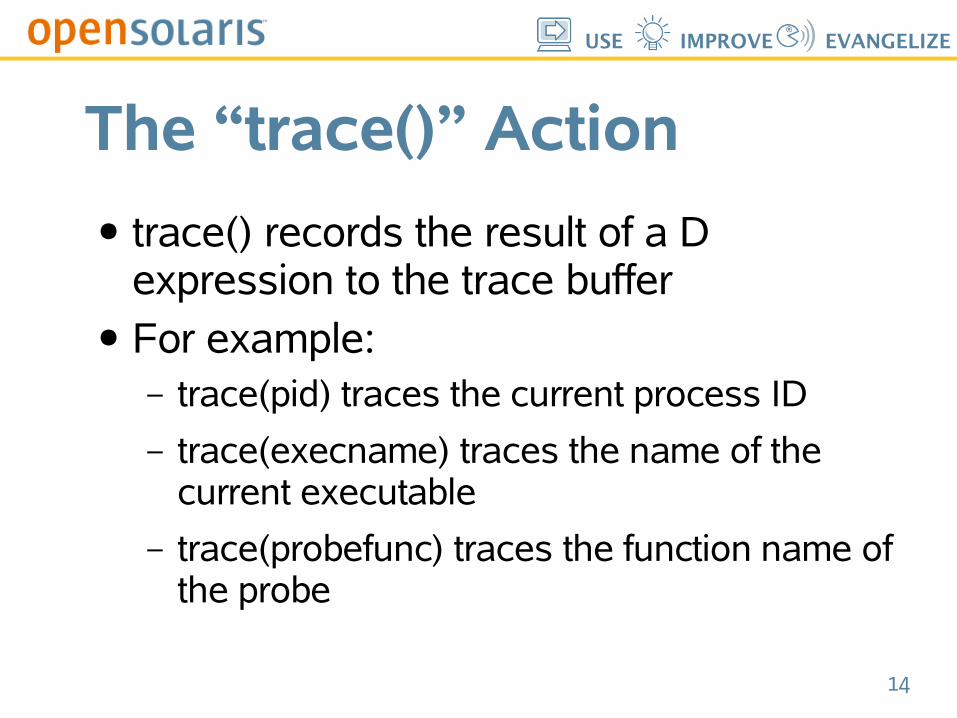
The “trace()” Action
● trace() records the result of a D expression to the trace buffer
● For example:– trace(pid) traces the current process ID
– trace(execname) traces the name of the current executable
– trace(probefunc) traces the function name of the probe
15
USE IMPROVE EVANGELIZE
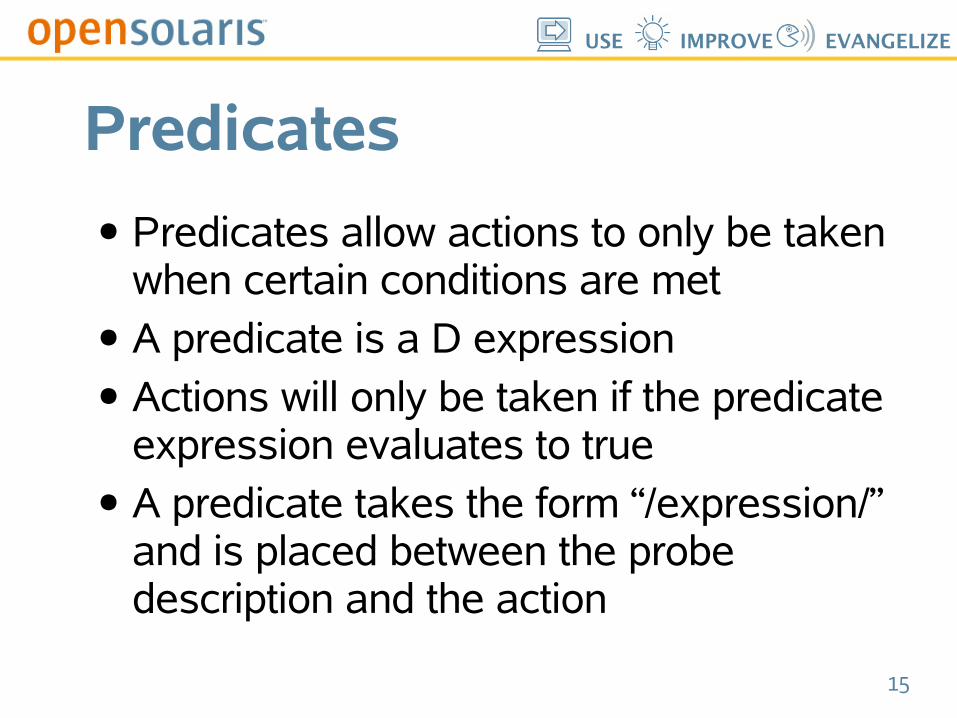
Predicates
● Predicates allow actions to only be taken when certain conditions are met
● A predicate is a D expression● Actions will only be taken if the predicate
expression evaluates to true● A predicate takes the form “/expression/”
and is placed between the probe description and the action
16
USE IMPROVE EVANGELIZE
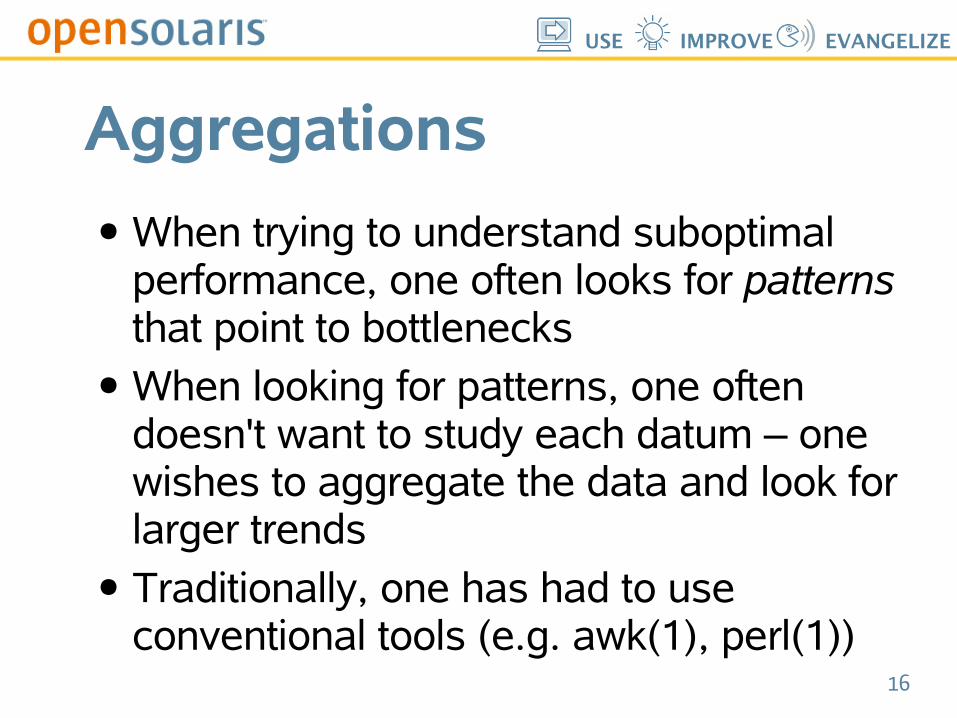
Aggregations
● When trying to understand suboptimal performance, one often looks for patterns that point to bottlenecks
● When looking for patterns, one often doesn't want to study each datum – one wishes to aggregate the data and look for larger trends
● Traditionally, one has had to use conventional tools (e.g. awk(1), perl(1))
17
USE IMPROVE EVANGELIZE
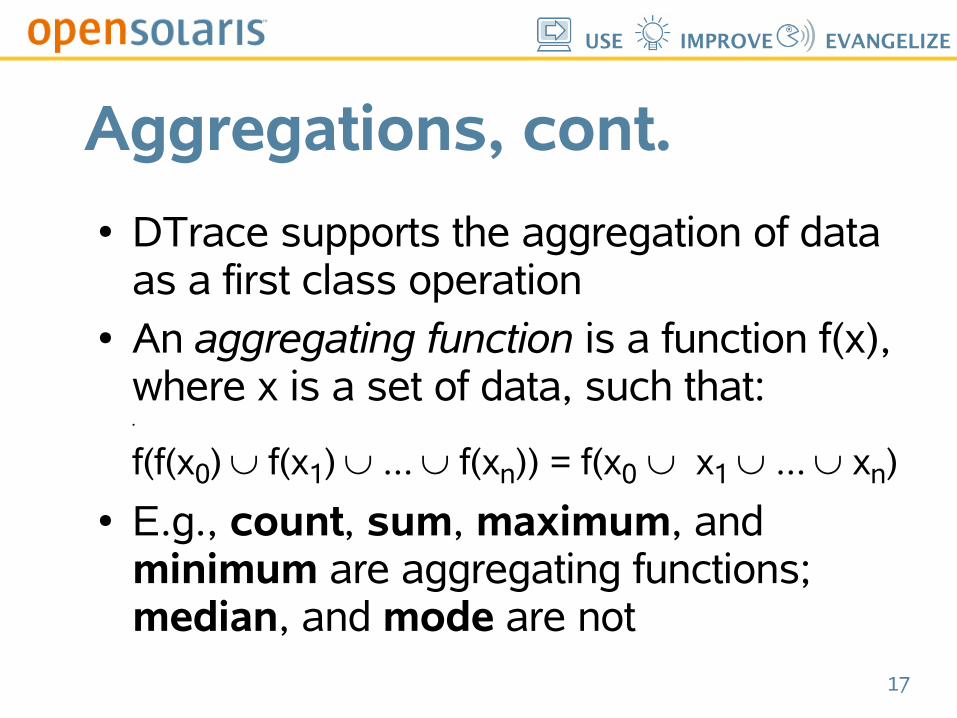
Aggregations, cont.● DTrace supports the aggregation of data
as a first class operation● An aggregating function is a function f(x),
where x is a set of data, such that:●
f(f(x0) f(x1) ... f(xn)) = f(x0 x1 ... xn)
● E.g., count, sum, maximum, and minimum are aggregating functions; median, and mode are not
18
USE IMPROVE EVANGELIZE
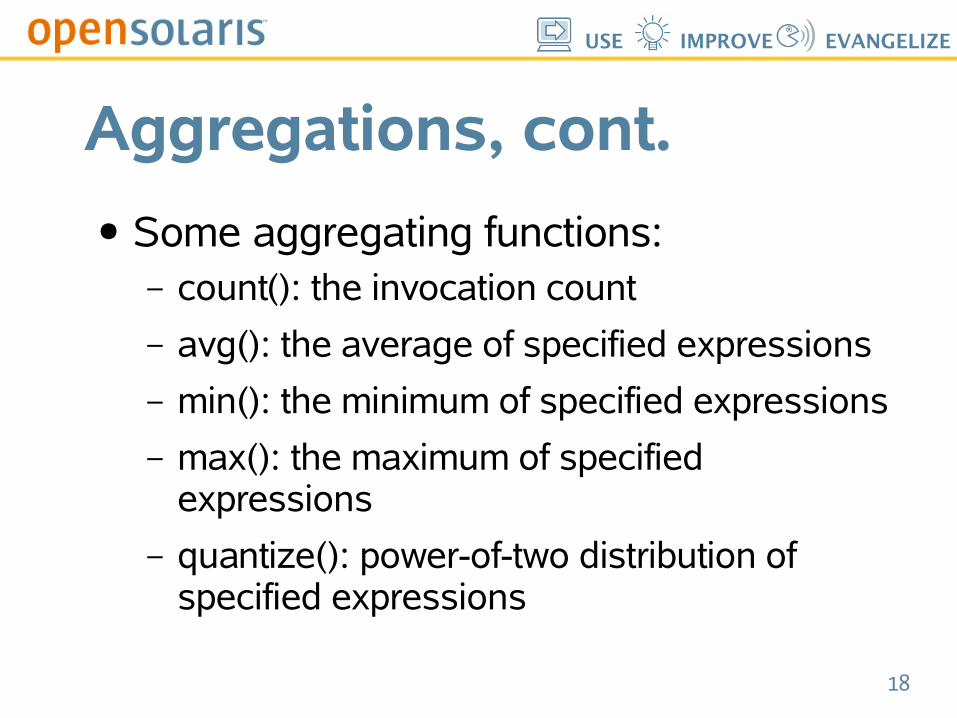
Aggregations, cont.
● Some aggregating functions:– count(): the invocation count
– avg(): the average of specified expressions
– min(): the minimum of specified expressions
– max(): the maximum of specified expressions
– quantize(): power-of-two distribution of specified expressions
19
USE IMPROVE EVANGELIZE
Providers
● The pid provider defines a probe at the entry and return for every function in every process on the system
● Programs need not be recompiled or even restarted
● The pid provider can also instrument any instruction in any process
20
USE IMPROVE EVANGELIZE
Providers, cont.
● The sched provider defines probes related to CPU scheduling– on-cpu, off-cpu, sleep, wakeup, ...
● The io provider defines probes for I/O– start, done, wait-start, wait-done
● The plockstat provider defines probes for user-land synchronization primitives– mutex-acquire, mutex-block, ...
21
USE IMPROVE EVANGELIZE
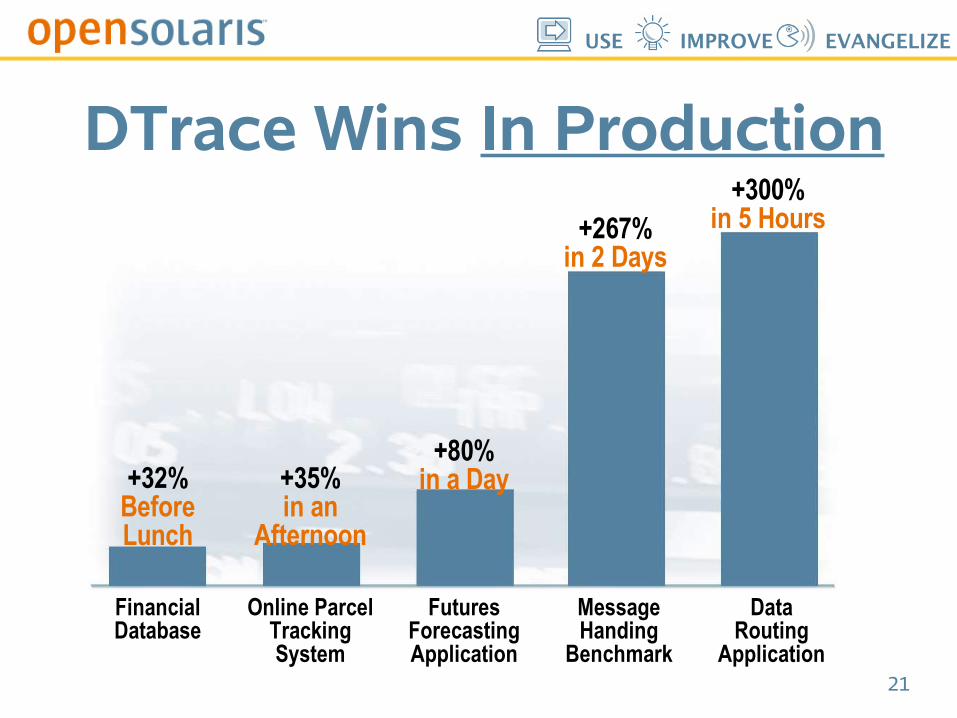
DTrace Wins In Production
+32%BeforeLunch
FinancialDatabase
+35%in an
Afternoon
Online ParcelTrackingSystem
+80%in a Day
FuturesForecastingApplication
+267%in 2 Days
+300%in 5 Hours
MessageHanding
Benchmark
DataRouting
Application
22
USE IMPROVE EVANGELIZE
DTrace Availability
● DTrace is part of the OpenSolaris project● First code in Solaris to be open sourced
(2/2005)
23
USE IMPROVE EVANGELIZE
So...
● DTrace is currently only available on OpenSolaris
● DTrace had previously only been useful for examining native Solaris programs
● But recently, a new OpenSolaris project lets us apply DTrace to Linux applications
24
USE IMPROVE EVANGELIZE
BrandZ
● The BrandZ project creates a Linux emulation environment
● Creates a virtual Linux machine on OpenSolaris
● Preview first released 12/2005
25
USE IMPROVE EVANGELIZE
What BrandZ Is Not
● Not a hardware virtualization layer– e.g. Xen or VMware
● Hardware virtualization has advantages– Run (mostly) unmodified operating systems
– Same abstractions as multiple boxes
● ... and some disadvantages– Relatively opaque
– Heavy weight
26
USE IMPROVE EVANGELIZE
BrandZ Details
● Built on top of OpenSolaris Zones– Lightweight virtualization technology
– Application containers – an über-chroot
● BrandZ (Branded Zones) add a system call emulation layer
● The 'lx' brand implements the Linux system call layer on top of the OpenSolaris kernel
27
USE IMPROVE EVANGELIZE
BrandZ Details, cont.
● Install a complete Linux user-land– Libraries, administration tools, etc.
● Unlike hardware virtualization, Zones and BrandZ are transparent application containers
● From the 'global' Zone, all Zones can be observed
28
USE IMPROVE EVANGELIZE
● With BrandZ, we can examine Linux applications with DTrace
● The pid provider trace Linux processes● Various kernel providers give insight into
the basic operating system operations● A new provider, lx-syscall, lets us trace
Linux system calls executed by the Linux binaries
BrandZ and DTrace

29
USE IMPROVE EVANGELIZE
DEMO
30
USE IMPROVE EVANGELIZE
The Fine Print
● Results will be skewed due to the emulation environment
● How much? YMMV● Computation-intensive apps will have
little emulation perturbation● Applications with many system calls will
show more variability● Coarse features should still be visible

31
USE IMPROVE EVANGELIZE
The Good News
● Every application we've looked at on OpenSolaris with DTrace has been improved
● At JavaOne applications never before run on Solaris were improved with DTrace
● Linux developers now have access to the same level of observability
● Wins will transfer, but not always directly
32
USE IMPROVE EVANGELIZE
Get Involved
● DTrace and BrandZ are both available on OpenSolaris.org
● Thriving communities and discussions– http://www.opensolaris.org/os/community/dtrace/
– http://www.opensolaris.org/os/community/brandz
● Check out the communities, join the discussions, download the bits, and get your Linux application running faster

USE IMPROVE EVANGELIZE
Q & AAdam LeventhalSolaris Kernel DevelopmentSun Microsystems
http://blogs.sun.com/ahl