Embed Size (px)
Citation preview

Options, Strategies, and Critical Points
in adjusting a
Data Management Organization
By Garry Nikola Kolafa,
Petroleum Development Support Group
Kuwait Oil Company,
a Subsidiary of Kuwait Petroleum Corporation

PNEC
Petroleum Network Education Conferences12th International Conference
OnPetroleum Data Integration
Information Management and Data Management Copyright 2008
Philip C. Crouse and Associates, Inc.Ministry of Oil, KuwaitAll Rights Reserved


Data Management at KOC • Historically Data Management develops from the
Exploration Side of operations rather than the Production Side of operations, due to the large amounts of data that are acquired and processed. These large amounts, made it imperative to dedicate resources to the pure management of data.
• At KOC a large part of the Exploration Data was handled by Contractors rather than in-house.
• Production Data Management was initialized, conducted, and developed in-house KOC for its’ own growing needs due to these activities.
• Because of this atypical development and impending targets set by management, we found it necessary to restructure and expand data management to meet these goals.
Created by:Garry Kolafa

KOC Targets & Growth• Increasing Production from 2.5 to 4 million bpd by 2020
KOC Targets & Anticipated Growth
0
20000
40000
60000
80000
100000
120000
2005 2010 2015 2020
TIME
Dat
a G
ener
atio
n i
n T
B
0
0.5
1
1.5
2
2.5
3
3.5
4
4.5
Oil
Pro
du
ctio
n i
n
mil
lio
ns
of
bp
d
Data
Oil
Created by:Garry Kolafa
DATA TSUNAMI

KOC = NOCNational Oil Company
• Not Always looking at Maximizing Production
• Production Quotas and Material Balance are more the norms
• Data Must be organized in a “National” way
• Energy Assets and Other Assets may be combined to form a National Database

• When my professor left college, (end of WWII):
20 Dry wells were drilled before 1 well produced
• When I left college (1970’s):
7 Dry wells were drilled before 1 well produced
• Today:
The average success rate has improved to drilling
3-4 Dry Wells before 1 well produces
To 1.8 Dry Wells before 1 well produces
In deep water environments
Benchmarking Exploration according to noted worldwide statistical information
Created by:Garry Kolafa

Why the increased success rate ?• My Professor’s Days (20:1)
– Introduction of Field Geophysical Methods – improved structure delineation
• My Graduation Days til today (7:1)– Analog to Digital conversion in Instrumentation to allow data to be
processed and managed by computers in Geophysics– Intro and practice of 3D Seismic within Geophysics– Improved Structure Imaging & Data Management from Geophysics
• Today Land (3:4) Deep Marine (1.8)– Combination of 3D Seismic and CSEM in Geophysics– Horizontal Drilling, Geo-steering guided by Geophysics &
Visualization– This is all made possible by Data Management that allows different
data types to be integrated and visualized.
Created by: Garry Kolafa

Production Character
0
10000
20000
30000
40000
50000
60000
70000
80000
Jan-0
4
Apr-04
Jul-0
4
Oct
-04
Jan-0
5
Apr-05
Jul-0
5
Oct
-05
Jan-0
6
Apr-06
Jul-0
6
Oct
-06
Time
Pro
du
ctio
n
Monthly Production/1K
Average Monthly/1K for last 12 mos
Average per well
Created by:Garry Kolafa
Urgency to Restructure

Industry Trends to take into Account• Exploration and Production Activities are converging• An interdependence is developing for requiring
information and knowledge sharing for better model constructions and decision-making. (IAM construction)
• Convergence is especially gaining momentum between Exploration Interpretation and Reservoir Engineering Departments
• Data Acquisition, Communication, as well as, Storage and Archival Technologies have improved
• 4-Dimensional Asset Control Techniques• Improved Visualization Technologies• Real Time Reservoir Monitoring • Integrated Asset Modeling for Production
Created by:Garry Kolafa

Expected Business Drivers
• More dependence on newer, more sophisticated data generating systems.
• Better Imaging practices for structural and reservoir modeling, simulation, engineering, and management.
• Higher level of Integration Requirements driven by E & P convergence.
• Additional Prospects
Created by:Garry Kolafa

Exploration Data and Activities needs rejuvenation and the application of more
targeted Geophysics
• Re-examine the resolution and techniques used in the past to see where data may be improved by re-shooting and reprocessing to accommodate for progress in newer technologies.
• Apply Geophysics more to solve current problems, especially some of our production problems, Geophysics is not just confined to Exploration.
Created by:Garry Kolafa

Convergence
Created by:Garry Kolafa
Visualization
Interpretation
Modeling
Re-Visualization
Re-Interpretation
Re-Modeling
Exploration Production
Reservoir Engineering
Geosteering
Real-Time Reservoir Monitoring
&
Time Lapse Seismic
Exploration1
2
3
45
6

Created by Garry Kolafa

Growth & Quality“A Critical Point”
• Many studies show that the highest risk to any organization experiencing growth is to maintain quality.
• Quality in operations is a direct function of select and sufficient manpower.• We will need to increase our manpower
selectively and sufficiently to increase our overall quality, as well as, to cope with the anticipated growth.
Created by Garry Kolafa

Re-structuring to reflect a Decision Centric Interface Considerations:
• SINGLE source for E & P data• Integration across applications, platforms. • Confidence in data ( quality , integrity , coherency )• Analytical tools• Calculation using industry standards• Industry standard naming convention across
Divisions and across Applications• Concurrent usage• Security• Compliance with SCADA and other relevant
methodologies
Created by Garry Kolafa

Production Data Sources, Structure, Standards
WELLS
Tank Farm
Gathering Centers
Created by:Garry Kolafa
2000 +
28WITSML
ProdML
C M M
RTDCs

Tools Development Analytics Development Market Savvy (know-how)Data EngineeringResearch Data MiningArtificial IntelligenceVisualizationIKW Transformation
IT CollaborationWeb solutionsSecurity/DR/Database Systems integration (G&G/GISRM/DO)Workflow & connectivityBusiness processesReal-time / AutomationVisualization Centre
E&P IM Research
and DevelopmentE&P IM Integration
E & P IM Solutions
Field Dev., Expl., Drilling, PDS & Planning SupportDatabase AdministrationE&P Library / ArchivalField Data IntegrityQuality Optzn. SystemTechnical Field SupportSurv. Data TrackingProcess Improvement
Project Planning Team PlanningDM TrainingDocumentationReporting processDM Team PromotionPublications/ConferencesManagement ReportingExternal Clients
E&P IM Planning and Reporting
E&P IM Assets
E & P IM Support
E & P Information Management
After the Data Management Team went through an extensive Brainstorming exercise and took many of the above and following points into consideration we chose the following structure of four divisions to be able to evolve into an E&P Information Management Team:

Definitions of E&P DM Divisions• E&P DM Management & Expert Contact Port
– Management handles Upper Management, Contractor, and Third Party Contact
– The Expert Contact Port Administrator handles User Contact • E&P DM Asset
– This Division focuses on providing “asset-driven” support in all forms
• E&P DM Integration – This Division focuses on handling cross data movement
between applications, databases, and company divisions to provide “synergy” and to complete E & P convergence
• E&P DM Projects & Reporting– This Division focuses on handling projects, planning, reporting,
training, and documentation, it supports the front-end Divisions• E&P DM Research & Development
– This Division focuses on handling research and development issues and provides direct support to the front-end Divisions to maximize visualization and IKW transformation

The Team was confronted with the possibility of assimilating a component of our IT group, so the proposed option was to regroup the original four divisions into two, and add a third group which would allow the assimilation to take place. Roles and Responsiblities are mapped in the following slides.

Exploration & ProductionInformation Management
Exploration & ProductionIM Support
Exploration & ProductionIM Solutions
Exploration & ProductionIM Services
ROLES
The Support Team focuses on providing “core business-driven” support for Users and their Systems, maintaining existing or new solutions, and visualization facilities, such as our Visualization Centre.
The support team also conducts the distribution of data and information to relevant users and/or groups as decision support, which may be found in our databases, archives, and/or physical assets (e.g. cores, tapes).
The Solutions Team focuses on designing and providing solutions that utilize resources to provide the support and service teams with their requirements that ultimately address core business users and their processes, to either improve existing processes or provide new solutions where IKW transformations are optimal, visualization is maximized, and exacting analysis of data and information is achieved.
All solutions are designed to conform to company strategies, standards, and frameworks, that allow exploration and production to converge and activities to synergize.
The Services Team focuses on consolidating user and solution requirements, as well as, compliance and benchmarking information for liaising with IT.
They manage contractual parameters, Policies, Standards, Documentation, Change management, and the enforcement thereof.
Finally, they conduct service quality control, project monitoring, reporting and publishing.

1. Provide E&P solutions2. Market Savvy (know-how)3. Data Engineering4. Data Mining5. Tools Development 6. Analytics Development 7. Visualization8. Web solutions9. Automation solutions10. Real Time Solutions 11. Artificial Intelligence12. G&G solutions13. Security & DR planning 14. Process improvement 15. Systems integration 16. Business continuity planning17. IKW Transformation
E&P IM Solutions
1. Corporate & Asset Support(Field Dev., Expl., Drilling,, PDS, RM, WS, Planning, Fin.)
2. E&P Library/Physical Asset Archival3. Field Data Integrity4. Optimization & Decision support5. Technical Field Support6. Surv. Data Tracking7. Process Definition8. Production volumes allocation9. E&P DBA support10. E&P application & system support11. IM Support Service Center12. Cartography & GIS Support13. Web & IM Toolkit Support 14. Vizcenter support15. User awareness16. External support (K-Companies)
E&P IM Support
E & P Information Management
E&P IM Services
NEW option
1. Policies, Standards & Enforcement2. Consolidate E&P computing
requirements Infrastructure Architecture Systems Technical software Support & training
3. Contracts management Technical software On-site support External storage Core Analyses Laboratory services
4. Quality Assurance Service delivery quality Compliance & benchmarking Change Mgmt.
5. Desktop Technical services6. E&P IM Online services7. Project Documentation & Planning8. Publications, Reporting & Promotion9. Project co-ordination & monitoring10. IM Growth Planning
Training & manpower Conf. / Workshops / Careers

Industrial ProcessesDownward Integration Process ≈ Automation Process
Software Developed
Software Perfected
Software Introduced to Hardware
X-chip programmable gate array
FPGA X-chip solution perfected
1 – Chip Solution
Relationship Developed
Relationship Perfected
Relationship Introduced to System
System Developed
System Perfected
Automated System
Created by:Garry Kolafa

Automation in Data Collection• Long Term Benefits:
– Supply reliable data for the calibration and re-calibration of production system models and production optimization systems.
– Ability for highly skilled and senior Production Operations management staff to access control room information for;
• Maximum utilization of production network capacity & treatment facilities
• Early identification of operational problems• Downtime Reduction • A data foundation for production optimization • Potentially remote access to operations
– Ability to capture measurements from many additional points in the production network without adding an additional significant workload to the Production Operations staff.
Created by:Garry Kolafa

Structured and Controlled Growth of Relationships
DWP
PDM
DWP
PDM
DWP
PDM
DWP
PDM
PDM
PDM
DWP
DWP
EXPL RM
DOPO
WS
FD
DM CoreG & G DWP PDM ?PDM DWP
Relationship
Created by:Garry Kolafa 27-Nov-06

Renaissance Engineer & Geoscientists
• Today we need “renaissance” Engineers and Geoscientists with IT knowledge.
• The BIG QUESTION:
• The medical analogy,
Would you prefer to be operated by an IT tech who had retrained in surgery or by a surgeon trained to operate sophisticated equipment ?

Requirements for Global File Systems
to support construction of IAMs
• Scalable
• Secure
• Manageable
• High Availability
• High Performance
• Broad Platform Coverage
Created by:Garry Kolafa
Data Management• Data Management is a specialized core
business activity within an E&P organization that is led by experts, who’s expertise extends into most, if not, all corners of the organization.
• It has developed into it’s own engineering science.
• Our DM team must be built by direct sourcing and lot’s of on-the-job training & educating.
• Data Management is a cumbersome task in the beginning, but finally, it becomes the heartbeat of the company.
Created by:Garry Kolafa

• The vehicle for positive convergence between Exploration and Production is Good “Data Management”.
• Good “Data Management” enables us to have the oversight required to correlate and find the required “new” reservoirs with less risk.
• Good “Data Management” is built on harmonious cooperation with and between Exploration and Production.
• This Leads to good Reservoir or Asset Management, in other words, Good control over the company

KOC
E&P
Information Management
gives
you
Oversight
Created by:Garry Kolafa
Thank You

Supporting Slides

Our Mission Statement:• Simply, to capture, store, and serve data and
help people make decisions.
• Comprehensively, to restructure, develop, and expand data management, to provide more efficient platforms to improve data access, availability, and preservation, as well as, allow multi-disciplinary teams to work seamlessly, to achieve synergy within KOC. Additionally, to aid in data transformation to produce information, knowledge, and ultimately company wisdom for added value.
Created by:Garry Kolafa 27-Nov-06

Integrated SAN/NAS Example
Network10 GB/sEthernet
Backbone
SAN
For Corporate Data
Storage & Archival
NAS
For Domain Data Storage & Migration
NAS
For Domain Data Storage & Migration
NAS
For Domain Data Storage & Migration
NAS
For Domain Data Storage & Migration

Requirements
• Excellent Current Assessment• Intensive planning on all fronts• Cooperation with all departments• Generation of Consensus• Ongoing Market Evaluation • Cost Control and Risk Analysis• Proper Justification Procedures• Management Approval• Acquiring Comprehensive Resources• Timely implementation
Created by:Garry Kolafa 27-Nov-06

Exploration Data Sources and Structure
Created by:Garry Kolafa 27-Nov-06
Geology
&
Geophysics
Navigation & Positioning
Wireline Logging
Visualization
Interpretation
Modeling

Objectives• To accommodate the planned increase in
Production with improved quality• Have Production Converge with Exploration• Real-Time Reservoir Monitoring by DM• Enable Geosteering Capabilities by DM• Optimize Sweep Efficiency by DM• Implement Improved Data Acquisition,
Processing, and Final Information/Knowledge Delivery and Archival Technology
• Quantify Services to be commercially viable and alternatively understand how much particular activities require subsidies
• Create opportunities for, and develop young Kuwaitis in our activities
Created by:Garry Kolafa 27-Nov-06

Other Objectives• Data Acquisition
– Reshoot certain prospects with correct target parameters
– Introduce Repeatability where required– New tailored acquisition for Kuwaiti conditions (cellular phone technology integrated with acquisition systems)
– Differentiate DM for Heavy Oil– Define “Fracturing” objectives in carbonate
formations – for both Heavy and Light Oil in terms of DM– What to do with mines ? – Map and Inform (GIS)– Alternatives to explosives for high frequency content – Intelligent Rigs, Well sites, and surface facilities
Created by:Garry Kolafa 27-Nov-06

Other Objectives• Integrate a plan to manage water geothermally
for Heavy Oil extraction• R&T/DM Project: CSEM in shallow water• Populate more Geophysicists into Production
activities• Introduce the use of WITSML in DM• Improve Archiving and Disaster Recovery• Help position and pilot Drilling• Reach relevant ISO standards with
acknowledgement
Created by:Garry Kolafa 27-Nov-06

Benefits of Automation realized by Data Management at JO/Texaco
• Daily data access vs. monthly data availability• 2.5 hrs/day gain in Production Data entry• 1 hour/day gain in Morning Report generation• 6.5 days gain in Well Test Validation• 2/3 days gain in Monthly Production Report • 4/5 days gain in various monthly report generation• 2 days gain in Shut-in Well Selection• 1 day gain in Back Allocation run• x days gain in Horizontal Sidetrack Selection• x days gain in Water Shutoff Selection• x days gain in ‘Wells Drop in Production’
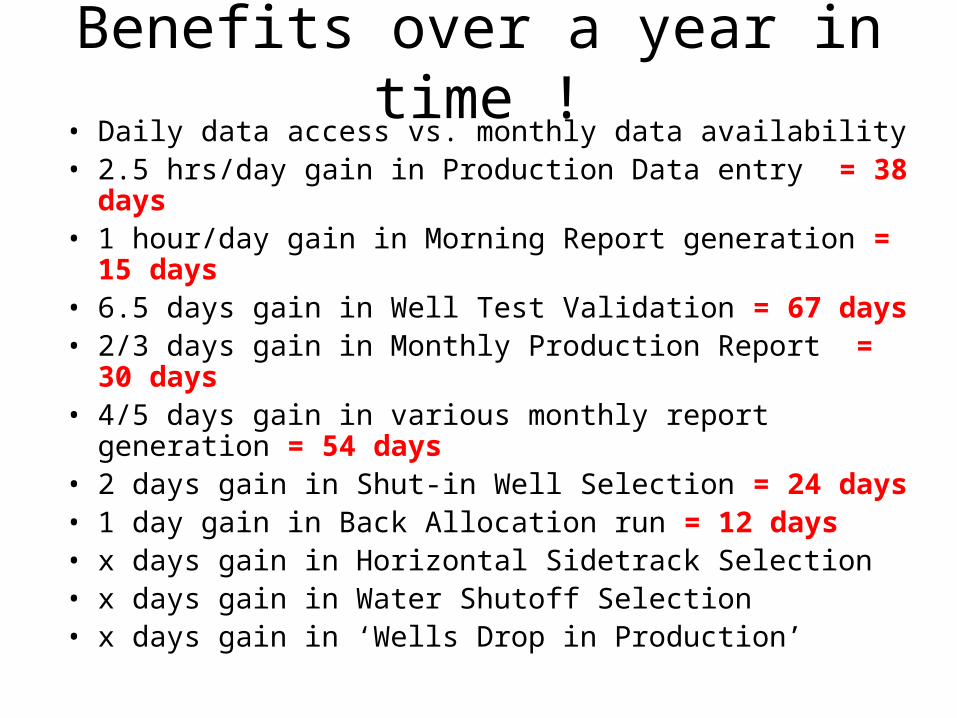
Benefits over a year in time !• Daily data access vs. monthly data availability• 2.5 hrs/day gain in Production Data entry = 38 days• 1 hour/day gain in Morning Report generation = 15 days• 6.5 days gain in Well Test Validation = 67 days• 2/3 days gain in Monthly Production Report = 30 days• 4/5 days gain in various monthly report generation = 54
days• 2 days gain in Shut-in Well Selection = 24 days• 1 day gain in Back Allocation run = 12 days • x days gain in Horizontal Sidetrack Selection• x days gain in Water Shutoff Selection• x days gain in ‘Wells Drop in Production’

SAN versus NAS
• NAS – distributed, asynchronous 10Gb ethernet sure to compete with both performance and bandwidth compared to existing SAN solutions (copper/fibre limited distance) even at only 40% bandwidth utility.
• SAN – centralized , asynchronous and synchronous capabilities, existing high end performance solutions (fiber – extended distance)
• Combinations of NAS and SAN possible
Created by:Garry Kolafa

Data Output
Data InputData Source
General Data Flow
Raw Data Generation
Data QC
Help Data Quality Control Design to provide and insure Quality Assurance
Data Integrity Check
Data Marked Ready for Use
Data tagged for storage
(temporary, permanent)
Data tagged for processing, transformation, & reporting & Visualization
Internally generated data from processing, transformation, and reports tagged for storage
Data Migration to Storage and Report locations
Data always delivered with DM seal of QA
Data Transfer
Data Validation
Raw Data Storage
ProductionIntermediate
Storage
ArchivalPermanent
Storage
ArchivalPermanent
Storage
DictateMigration
Path & Policy
Report Locations
BACK UP
DISASTERRECOVERY
Created by:Garry Kolafa
Visualization
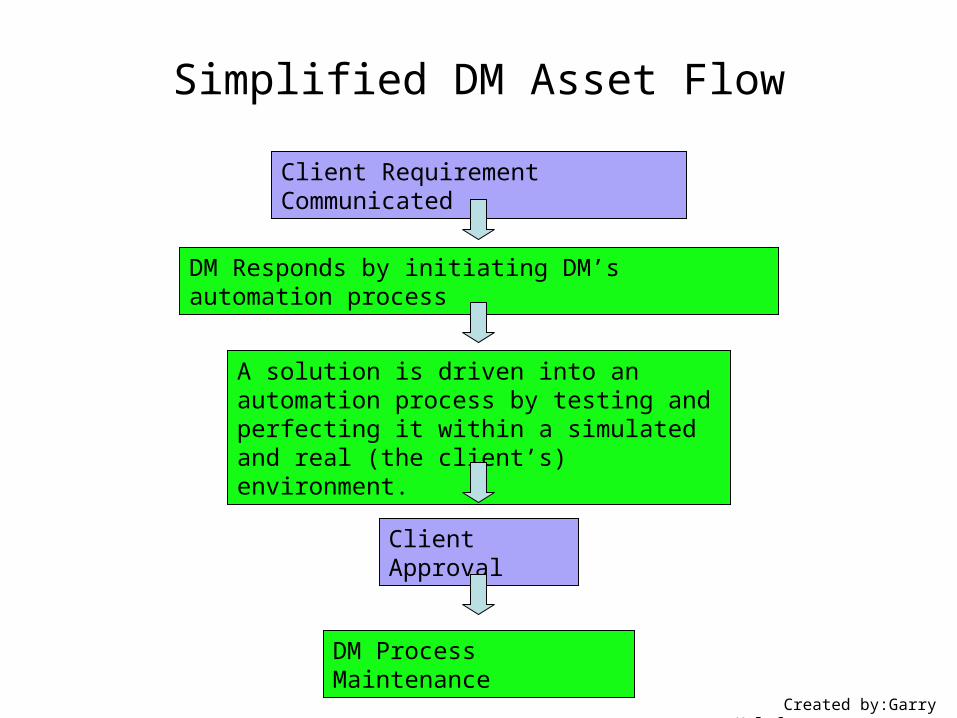
Simplified DM Asset Flow
Client Requirement Communicated
DM Responds by initiating DM’s automation process
A solution is driven into an automation process by testing and perfecting it within a simulated and real (the client’s) environment.
Client Approval
DM Process Maintenance
Created by:Garry Kolafa

DM Asset Work Flow in Detail
Solution Developed
Solution Perfected
Solution Introduced to Process
Process Developed
Process Perfected
Automated Process
Asset Requirement
ProcessAcknowledged
Process Tuned
Process Modified
Solution Acknowledged
Solution Tuned
Solution Checked
Process Maintained
Process Ready
Process Checked
SolutionImplemented
Solution Ready
Created by:Garry Kolafa

Simplified DM Project & Reporting Work Flow
Customized Workflows for Custom Projects and Reporting Requests
Client Request Communicated
DM responds by Planning, Scoping, Commissioning, and De-Commissioning
Projects
DM responds by delivering reports incorporating client requests and aiding in
design, documentation, visualization, and IKW transformations by liaising with
E&P DM R&D where necessary
DM handles archiving and distribution of reports
Created by:Garry Kolafa

DM Project & Reporting Work Flow in Detail
DM Asset Results from a Maintained Process
DM Integration Results fromAn Automated System
Business or Asset Requirement
Project Planning Definition
Timelining & Budgeting
ManagementApproval
Project Commissioning
Project Commencement
Project De-commissioning
End of Project
Documentation
Relevant Data Compiled
Data Processed
ProcessedData Visualized
QA and Distribution
REPORT LOCATIONS
IKW Transformation
Created by:Garry Kolafa

Simplified DM Integration Flow
Client Requirement Communicated
DM Responds by initiating DM’s automation process
A relationship is driven into an automated system via our automation process by testing and perfecting it within a simulated and real (the client’s) environment.
Client Approval
DM System Maintenance
Created by:Garry Kolafa

DM Integration Work Flow in Detail
Relationship Developed
Relationship Perfected
Relationship Introduced to System
System Developed
System Perfected
Automated System
Business Requirement
System Implementation
System Tuning
Protocol IntroTo System
Protocol Testing
Protocol Tuning
Establish Protocol
System Maintenance
SystemCommissioning
System Tested
Protocol Tested
Protocol Tuned
Created by:Garry Kolafa 27-Nov-06

Simplified DM Research & Development Work Flow
Client Requirements Communicated
DM responds by applying research or developing “in-house”, where necessary
to best meet the Client’s requirements taking all market possibilities into
consideration in the provision of tools and technologies
DM delivers optimally refined processes, systems, and tools to support both “asset-
driven” and integration focussedActivities and Projects
Customized Work Flows for Custom Research and Development Requests
Created by:Garry Kolafa

DM Research & Development Work Flow in Detail
Customized Work Flows for achieving results in the following areas:
Visualization
InformationKnowledge
Wisdom Transformation
DM DevelopmentAnalytics & Tools
Prototype Development
DM ResearchStatistical Analysis
Data MiningArtificial Intelligence
Data EngineeringNeural Networks
Integrity Check DesignQC Modeling
Market SaavyMarket Gap Recognition
Technical PlanningManagement Support
InconsistentInformation In
SimplificationStandardizationSynchronization
Consistent, AccurateInformation Out
Created by:Garry Kolafa

Road Map
Clean House
Close Data Gaps
Plan for Convergence and Growth
Converge
E & P
RT =Production
SideProgress
VIZ =Exploration
SideProgress
SetCore System
E & PConvergenceCompleted
andMaintained
ISORecognitionReach level
III or IVDM MM
ImproveCore System
ExpandCore System
Refine
Archival
Technology
Reach Level
VDM MM
PHASE
I II III IV V
Created by:Garry Kolafa

How to develop a relationship ?
FINDER Schlumberger Database
(Find Her)
& KISR
Kuwait Institute of Scientific Research
(Kiss Her)
Created by:Garry Kolafa