Embed Size (px)
Citation preview

Optimizing Fertigation Protocols for Nitrogen in Tree Crops (Almond)
Patrick BrownAndres Olivos
SCRI Project Team(Brown, Lamoinen, Shackel, Smart, Slaughter, Upphadaya, Sanden, Ustin,
Whitin, Lombardini, Sammis, Shukla)
University of California, DavisTAMU, NMSU

• Perennial fruit and nut crops are a $20 billion (farm gate)
industry. (Grape, almond, citrus, walnut, strawberry..)
• Approx 7 million irrigated acres
• Irrigated, fertigated, high input , high crop value ($3,000 -$30,000 acre)
• High Value/Low fertilizer cost
• High degree of variability
• Poor use of current technology Low degree of precision in fertilizer management
• Great potential for control of rate, timing, placement.
Perennial Horticulture in California

Current practice“One size fits all”
(>70% industry uses 250 lb N, 150 lb K and 48 inches water)
•Management recommendations for tree crops are not adequately site or time specific to optimize efficiency.
Why is management unsophisticated?:• Poor ability to estimate true demand• Poor ability to monitor tree nutrient status• Variability• Lack of user friendly tools•Lack of cost incentive
Why does it need to change?• The market (EU, the Walmart’s) and the public (through policy) are demanding ‘sustainability’ and BMP’s. • Financial and environmental sustainability

Within Field Variability complicates experimentation, understanding and
management
NDVI (Leaf Area) Yield
2000 lb ac
3000 lb ac
4000 lb ac
3700 lb three year average yield (top 5% yield level)
1.0%
3.0%
2.0%

Can N be managed sustainably?Motivations and Constraints
Improve efficiency of N use
Constraints: Inadequate understanding. Field variability and risk aversion, Low
relative cost of fertilizer.
Reduce nitrogen losses to the environment and decrease contamination of
water and generation of GHG’s.
Constraints: Inadequate understanding of the processes, inability to quantify the
effects, inability to link actions to outcomes.
Policy development and legislative action, public perception. (AB35)
Contraints: Poor information, no enforcement mechanism.
Market demands for sustainability Markets increasingly demand environmental accountability and many large wholesalers have sustainability
initiatives (Walmart, Nestles etc)
Constraints: Powerful enforcement mechanism but no scientific basis for decisions.

Multi-stakeholder Integrated Project 2009-2012
(≈$6 million)Almond Board, USDA-SCRI, Calif Dep Agric, Yara, Mosaic, TKI,
Compass, Pistachio Research Committee, Haifa, SQM, FFF.
Advanced sensing and management technologies to optimize resource management in specialty crops
(Nitrogen and Water)
Patrick Brown, Ken Shackel, Ted Sammis, Bruce Lampinen, Leonardo Lombardini, John Mexal, Blake Sanden, Manoj Shukla, David Slaughter, David Smart, Rolston St. Hilaire,
Shrini Upadhyaya, Jan Hopmans, Susan Ustin, Michael Whiting

Project structure
Integrated Activity #1 – Demand estimation
a.Plant and orchard/vineyard scale investigations of N and water demand and fluxesb.Modeling of crop nutrient and water demand.
Integrated Activity #2 – Status determination
a.Plant and orchard/vineyard based determination of water and nutrient statusb.Remote and local sensing of water and nutrient status
Integrated Activity #3 – Integration / validation
a.Beta development of web based decision support toolkit ‘NutMan’ under control and deficit conditionsb.Iteratively test, refine and validate models and tools

Activity #1 – Demand estimation
Develop phenology and yield based
nutrient demand model (Brown,
Sanden, Lampinen)
Validate ETa models (SEBAL, NCAR-WRF),
estimate orchard water needs (Ustin, Sammis)
Interactive effects of irrigation and nutrient status on plant water
use and plant response (Shackel, Brown,
Sanden)Gaseous, sub-soil N losses (Smart, Brown)
Develop fertilizer response curve
(Brown, Sanden, Lampinen)
Remote Sensing of yield, phenology, crop development
(Slaughter, Upadhyaya, Whiting)
Physiological/soil environmental
controls on N and water uptake
(Shukla, Lombardini)
Modeling of crop nutrient and water demandClimate/phenology based yield modeling
(Whiting, Ustin)N and water modeling in pecan and almond
(Sammis, Wang)

Activity #2 – Status determination
Re-evaluate leaf and orchard sampling
methods and “Critical Value” concept
(Brown, Lampinen)
Relate ETa to plant water status
(Shackel, Smart, Sanden)
Evaluate spectral measurements / correlate to crop status
(Whiting, Lampinen, Slaughter, Upadhyaya)
Modeling of crop nutrient and water demandClimate/phenology based yield modeling
(Whiting, Ustin)N and water modeling in pecan and almond
(Sammis, Wang)
Model solute transport(Hopmans, Brown, Kandelous, Olivos)
Determine root dynamics(Brown, Hopmans, Olivos,
Kandelous)

Activity #3 – Integration / validation
Beta development of web-based decision support toolkit “NutMan”
Iterative validation and improvement of models and tools
Development of basic data on resource demand and response and establishment of easy to use BMP’s

6 Almond, 6 Walnut and 5
Pistachio Orchard Sites
All Sites: (>100 trees)
•5 in-season full nutrient analysis
•5 in-season Spectral Analysis
•5 in-season Plant Water Status
•Soil water and irrigation volume
•Yield (100 + individual trees)
•Nitrogen Use Efficiency (NUE)
•Aerial and satellite imagery
Two Sites:•Gaseous nitrogen loss
•NUE
One Site: 50 x 2 acre, (drip/Fan Jet)
•Factorial 4N x 4K x source x
Irrigation Trial
•5 in-season full nutrient analysis, 5 in-season Stem
WP, Soil water and irrigation volume, Yield (768
individual trees)
•NUE
•Canopy level imagery
•Aerial and satellite imagery

Experimental Layout (almond)
Fig: Layout of the experimental plot at Bakersfield (Fan Jet block only). Different
background colors indicate different experimental units. Black rectangles mark trees
that are intensively sampled in this experiment.
Three sites, 14 treatments, 6 reps, 0.4 acre (300 acre total, $1 million crop value)
N Source (UAN, CAN, KNO3)K Source (SOP, KTS, KCl, KNO3)
Fertigation Type (drip, micro, pulse, continuous)
Rate (1/2, 1, 1.4, 1.8 x replacement)

SEA
SON
AL
CU
RV
ES F
OR
EA
RLY
SA
MP
LIN
G
Seb
asti
an S
aa a
nd
Pat
rick
Bro
wn
Leaf Analysis and Crop Demand

640 photodiodes active in PAR range
IR thermometers for soil surface temp
Sub meter GPS- used outside orchard
Radar used within orchard
Campbell Scientific CR3000
Display on dashboard
Adjustable to row widths from
~18-28 feet
Travel about 10km/hr- gives one scan
about every 30 cm
Infrared thermometers for
measuring soil surface
temperature
Mule light bar
Light Interception and Productivity

NASA Digital Cirrus Camera System1 m pixel, bands: B, G, R, or G, R, NIR Photographs provided at no charge to main systems users, such as
MASTER
Smart Image (Beltsville, MD)
10 and 20 cm pixel, bands: blue, green, NIR,
GNDVI product $3.75 per acre (500 acre minimum)
GeoG2 (Mountain View, CA)
1 m pixel, bands: green, red, NIR (creates NDVI, GNDVI and other indexes)
$1200 per 3 orchards
SMALL FORMAT AIRBORNE CAMERAS USED
Color Infrared composite
Green NDVI product
Color Infrared composite (G,R,NIR)

NASA MODIS/ASTER (2009-10) 50 visible, near & shortwave infrared and thermal bands.
•Results contrasted with ground based LAI, hand held spectral readings, nutrient status, Stem Water Potential, NIR, and Yield
Ustin, Whiting, Zarate.

Northrup Grumman (Lidar Hyperspectral submeter from 10,000 meters)
AO3; 3,25
• NonPareil (“A”) tree on the right
• Monterey (“B”) tree on the left
Height (ft)
18.0
9.4
0.7

Nutrient Demand: Whole tree
Harvesting:
5 mature trees x 5 times in a year

OPTIMIZING NUE: 4 R’s
Time:Rate
Rate-Location
NUTRIENT INTERACTIONS
Rate:Source

NUE in Almond(N removed in crop/N applied)
Estimated using 2009 Nutrient % x 2010 yield
NUE at 275 lbs application:
2008 = 75%
2009 = 68%
2010* = 80%
N Removal = 50-60 lbs N /1000 lb kernel

Almond NITROGEN USE EFFICIENCY
70% efficiency = 50 lbs N/acre/yr (x 500,000+ acres)
= 25,000,000 lbs N/yr (current best case scenario)
• However small changes make a big impact.
– A 25 lb reduction in N application or 15% increase in efficiency HALVES this N loss
THESE RESULTS ARE UNDER THE BEST AVAILABLE PRACTICE – MOST OF THE INDUSTRY IS NOT AT THIS LEVEL OF NUE
Challenges:
Define yield potential
Improve Monitoring
Define loss fate and movement of solutes and gases.
Define root growth, root uptake.
Optimize application (Right place, Right time)
Optimize and Integrate with Water management.
An NUE of 65-75% is among the highest ever measured in
agriculture – is that good enough?
VARIABILITY

Activity #2 – Status determination
Re-evaluate leaf and orchard sampling
methods and “Critical Value” concept
(Brown, Lampinen)
Relate ETa to plant water status
(Shackel, Smart, Sanden)
Evaluate spectral measurements / correlate to crop status
(Whiting, Lampinen, Slaughter, Upadhyaya)
Modeling of crop nutrient and water demandClimate/phenology based yield modeling
(Whiting, Ustin)N and water modeling in pecan and almond
(Sammis, Wang)
Model solute transport(Hopmans, Brown, Kandelous, Olivos)
Determine root dynamics(Brown, Hopmans, Olivos,
Kandelous)
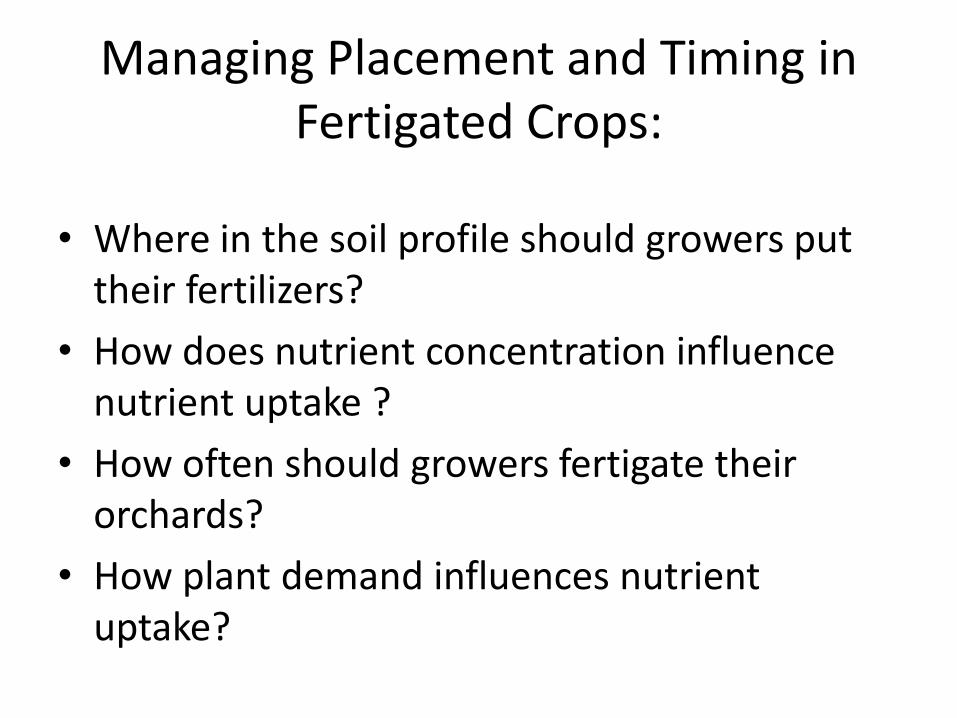
Managing Placement and Timing in Fertigated Crops:
• Where in the soil profile should growers put their fertilizers?
• How does nutrient concentration influence nutrient uptake ?
• How often should growers fertigate their orchards?
• How plant demand influences nutrient uptake?

Specific Objectives
• Determination of almond root growth and distribution .
• Determination of nutrient uptake dynamics (Km, Vmax, Cmin/max) and the relationship to soil nutrient concentration, tree demand and time.
• Characterize water and solute (Nitrogen) movement within the soil profile.

Project Description
• Paramount Belridge Almond Orchard Project
• For Water and solute transport:
– Two trees (Drip and Fanjet systems) heavily instrumented with 32 decagon 5Te (conductivity), 4 MPS (matricpotential:
• Six trees lightly instrumented (4 Decagon 5Te) to determine variability and cross reference validation
• 48 trees with neutron probe installations (4 per tree in 4 trees).
• 24 soil solution sampling sites.

Sensor installation
32 sensor at the 30 and 60 cm depths were
installed manually, the other 32 sensors at the
120 and 180 cm depths were installed by a
newly designed installation device.

Drip-linesSensorlocation
Y
X Tree
15
0 c
m1
50
cm
80cm 80cm
Fanjet
Sensor location
Y
X Tree
15
0 c
m1
50
cm
100 cm 100 cm
FANJETDRIP
Sensor Installation
(X,Y) notation represents Cartesian coordinate system, with both X and Y,representing distances (cm) for the tree trunk. For example (0 150) denotes thelocation of a sensor which is 150 cm away from the tree along the Y direction. Figure2 shows the sensor installation for both Drip and Fanjet irrigation system.

-60 cm
-120 cm
-30cm
-60 cm
-120 cm
-180 cm
-30cm
10cm
Sensor locationMPS1 and 5TE sensor
5TE sensor
-180 cm
40cm
YX
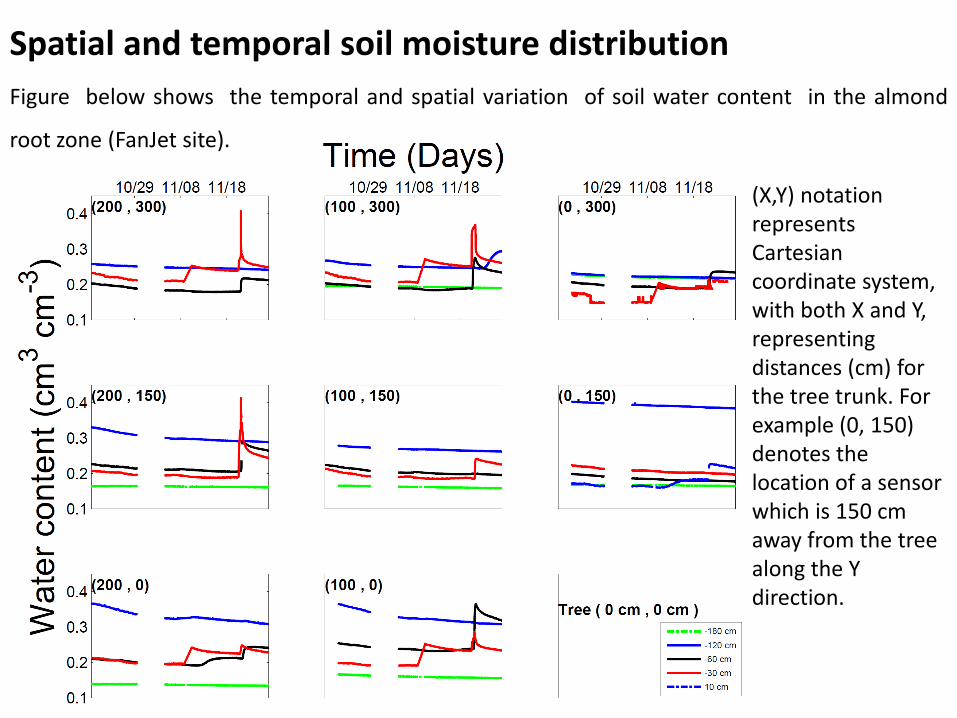
Spatial and temporal soil moisture distribution
Figure below shows the temporal and spatial variation of soil water content in the almond
root zone (FanJet site).
(X,Y) notation represents Cartesian coordinate system, with both X and Y, representing distances (cm) for the tree trunk. For example (0, 150) denotes the location of a sensor which is 150 cm away from the tree along the Y direction.

Irrigation evaluation, application patterns
Double-line drip and neutron probe / tensiometer array
Catch can and neutron probe / tensiometer array
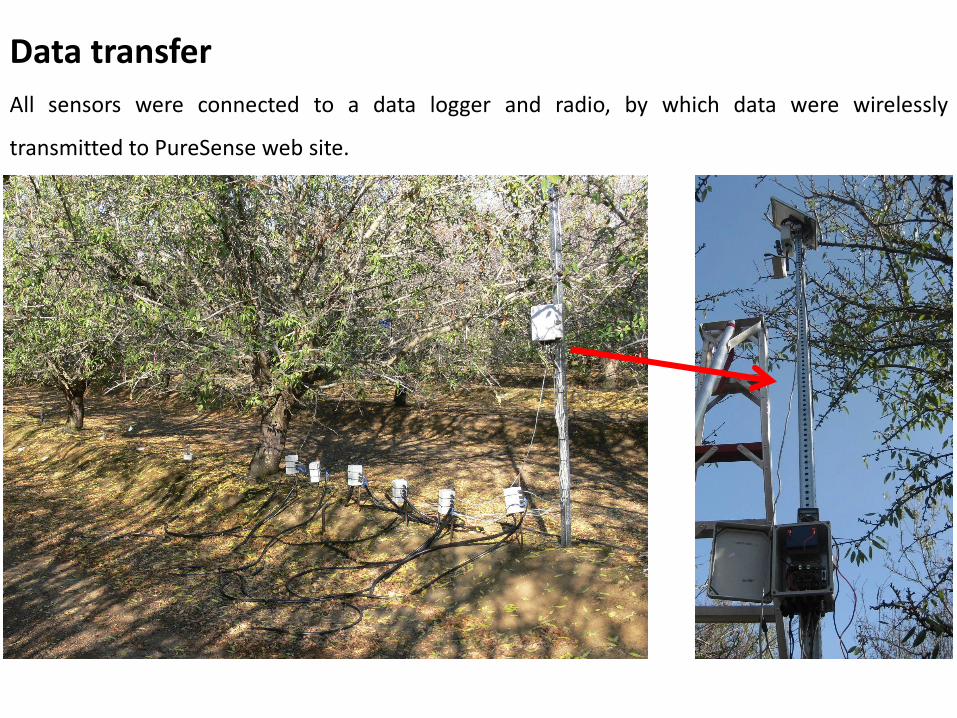
Data transfer
All sensors were connected to a data logger and radio, by which data were wirelessly
transmitted to PureSense web site.

Determination of almond root phenology and characterization of root distribution
• Main Objective: Determine the spatiotemporal distribution of root in the field and in greenhouse conditions.
• Methodology:• Minirhizotron observation: Determination of root phenology and active root lifespan.
• Soil Core sampling: Determination of spatiotemporal root distribution.
• In growth core sampling: Isolation of roots to determine root nutrient uptake physiological parameters.
• Greenhouse Setting to determine root nutrient uptake physiological parameters in controlled conditions in young trees.

Evaporation(potential)
Transpiration(Potential)
Irrigation rate
Fertigation rate
Precipitation rate
Soil Hydraulic properties
Solute properties
Root distribution
Stress function
Nutrient uptake function
Evaporation(actual)
Transpiration(actual)
Water drainage rate
Solute leaching rate
Spatial and temporal water content
Spatial and temporal solutes concentration
Nutrient uptake
Root distribution
Gas emission (CO2, N2O, N2)
INPUT PARAMETERS
OUTPUT
HYDRUS 2D
Modeling Water/Solute Transport and Uptake: The Role of Hydrus
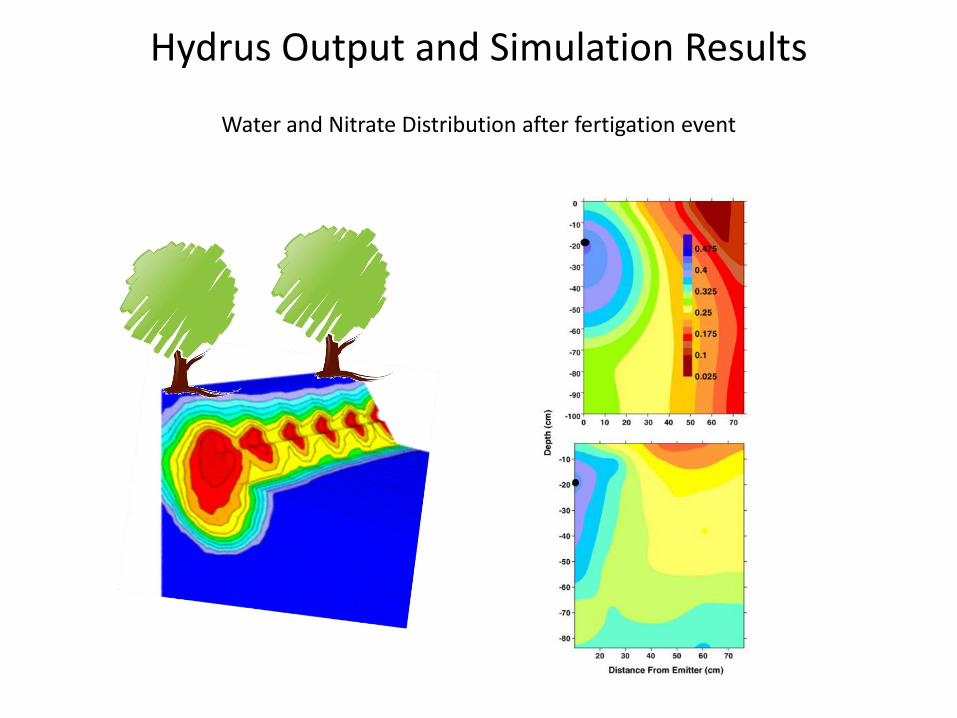
Hydrus Output and Simulation Results
Water and Nitrate Distribution after fertigation event
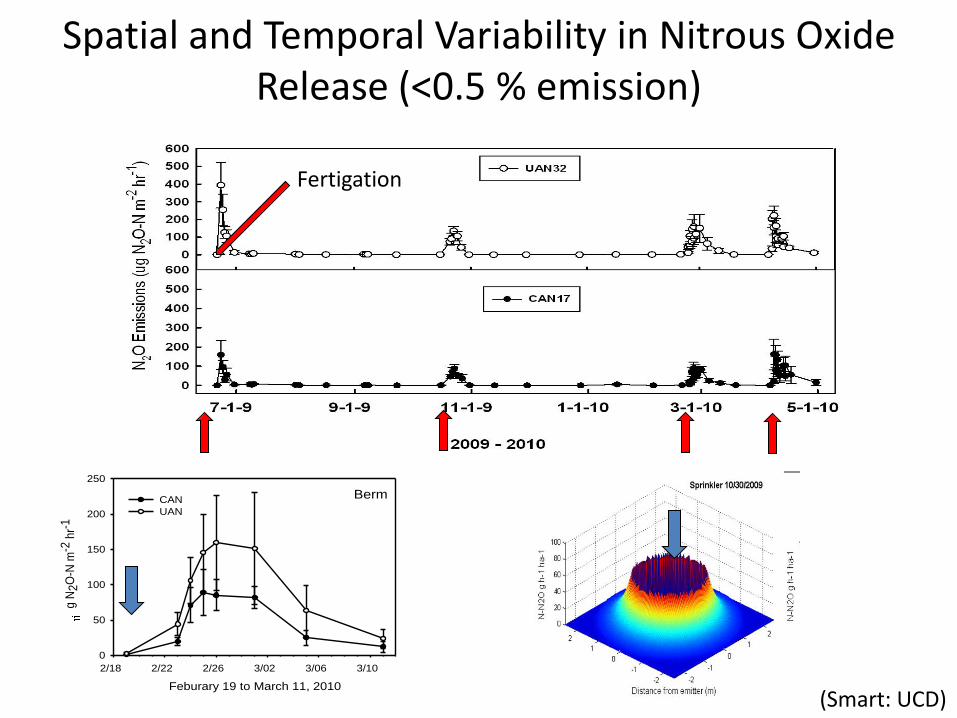
Spatial and Temporal Variability in Nitrous Oxide Release (<0.5 % emission)
Berm
Feburary 19 to March 11, 2010
2/18 2/22 2/26 3/02 3/06 3/10
g N
2O
-N m
-2 h
r-1
0
50
100
150
200
250
CAN
UAN
(Smart: UCD)
Fertigation

Project SynergismsRelate ETa to plant water
status(Shackel, Smart, Sanden)
Water and solute transport modeling
(Hopmans, Brown, Kandelous, Olivos)
Determine root physiology and dynamics(Brown, Hopmans, Olivos, Kandelous)
Gaseous, sub-soil N losses (Smart, Brown)
Develop fertilizer response curve
(Brown, Sanden, Lampinen)
Develop phenologyand yield based
nutrient demand model (Brown, Sanden,
Lampinen)
BEST FERTILIZATION PRACTICES FOR ALMOND PRODUCTION
Right RateRight SourceRight PlaceRight Time

Acknowledgements
Financial support:
USDA, CDFA, Almond Board, Pistachio Research Committee, Yara,
GSL Compass, Mosaic, TKI, FFF
Paramount Farming and numerous growers.
SCRI Co-PI’s
Ken Shackel, Ted Sammis, Bruce Lampinen, Leonardo Lombardini, John
Mexal, Blake Sanden, Manoj Shukla, David Slaughter, David Smart,
Rolston St. Hilaire, Shrini Upadhyaya, Jan Hopmans, Susan Ustin,
Michael Whiting
Students, Faculty, Staff:
Eike Luedeling, Sebastian Saa, Jeremy Nunes, Ismail Siddiqui, Saiful Muhammad, Todd
Rosenstock, Maria Paz Santibanez, Andres Olivos, Blake Sanden, Mike Whiting, Roger
Duncan, Bruce Lampinen, Roger Duncan, Brent Holtz, John Edstrom and others…

Thanks

Large percentage of municipal
wells in Californian exceed health
standards for nitrate.

Contribution of Agriculture to GHGAgriculture is a small but important source of greenhouse
gases

Growing Intensification: 70% utilize fertigation an additional 14% could and the
remainder are transitioning

Growing Intensification: 70% utilize fertigation and 55% provided all/most N and
K
UAN32:60%, CAN17:25%: K Sources: SOP (band) 60%, KTS (fertig) 25%, KCl <10%.

Between Year Variability:
Pistachio
Lbs per tree
Lbs per acre4000
3200
2400
4600
800
5000

Precision Nitrogen Management
-the 4 R’s-
• Applying the Right Rate
– Determine demand and variability.
– Account for all inputs (water, soil, plant).
• At Right Time
– Determine when uptake from the soil occur.
• In the Right Place
– Ensure delivery to the active roots.
– Managing variability across the orchard.
• Using the Right Source and Balance
– Balanced fertility