Embed Size (px)
Citation preview

Optimizing Nitrogen Fertilizer Management Strategies for High-Yielding Spring Wheat in
Manitoba
Amy Mangin & Don Flaten, University of Manitoba
John Heard, Manitoba Agriculture

Challenges to our traditional N fertilization management
• Current provincial guidelines do not address the high yield potential of current varieties that may exceed 90 bu/ac
• When high yields are achieved, risk of inadequate protein content for milling market is substantial
• The existing recommendation of 2-3 lbs. N/bu spring wheat target yield creates large financial, agronomic and environmental risks
• Midseason fertilization may mitigate these risks but there is very little research for Manitoba growing conditions

Project Objectives
1. Determine appropriate N rates, based on realistic yield and protein goals for new high-yielding varieties
2. Determine the most effective and efficient combination of N timing, rate, and source to meet yield and protein potential
3. Evaluate innovative soil tests for predicting mineralizable nitrogen during the growing season
4. Develop decision tools for midseason and post-harvest evaluation of N sufficiency for yield and protein potential

Methods
• Field trials conducted across MB over the 2016-2017 field seasons (8 site-years)
• Intensive agronomic management to maximize yields
• Factorial Design (Variety X N Treatment) arranged as a RCBD


VarietyN Rate (lbs N/ac) Source Timing/Placement
Spring In Season Spring In Season Spring In Season
Brandon (CWRS)
andProsper (CNHR)
0
ConventionalUrea
Midrow band at seeding
50
80
110
140
170
200
80ESN:Urea
(40:40)
140ESN:Urea (100:40)
80 30
ConventionalUrea
Agrotain treated urea
Stem elongation, broadcast
80 60
80 30 Flag leaf, broadcast80 60
80 30 UAN Post anthesis,
foliar80 30 Urea Sol'n
Treatments
RATE
SOURCE
TIMING

50 lbs N/ac 100 bu/ac
140 lbs N/ac 112 bu/ac
0 lbs N/ac 67 bu/ac
200 lbs N/ac 129 bu/ac
Prosper
Brunkild, MBJuly 2017

Variety

8
9
10
11
12
13
14
15
Brandon ProsperP
rote
in (
%)
0
20
40
60
80
100
Brandon Prosper
Yie
ld (
bu
/ac)
Variety: Silver Level Sites
• Prosper yield 4.2 – 16.3 bu/ac more than Brandon across Site-years
• Brandon had 0.7 – 1.3 % increased protein content than Prosper across Site-years
Yield Protein

0
20
40
60
80
100
Brandon Prosper
Yie
ld (
bu
/ac)
8
9
10
11
12
13
14
15
Brandon ProsperP
rote
in (
%)
Variety: Gold Level Sites
• Prosper yield 7.8 – 15.4 bu/ac more than Brandon across Site-years
• Brandon had 1.3 – 2.0 % increased protein content than Prosper across Site-years
Yield Protein
Nitrogen Rate

Melita 2016
0
20
40
60
80
0 50 80 110 140 170
Yie
ld (
bu
/ac)
lbs. N/ac
Brandon
Prosper
AA AAB
BCC
6789
10111213141516
0 50 80 110 140 170
Pro
tein
(%
)
lbs. N/ac
Brandon
Prosper
c
ab
c bcab a
Residual NO3-N: 43 lbs/ac
Yields adjusted to13.5% moisture
*Profitability based on Jan 5, 2018 pricing

Carberry 2016
0
20
40
60
80
100
120
140
0 50 80 110 140 170
Yie
ld (
bu
/ac)
lbs N/ac
Brandon
Prosper
BA A A A A
6789
10111213141516
0 50 80 110 140 170
Pro
tein
(%
)
lbs. N/ac
Brandon
Prosper
b ab aba a a
Residual NO3-N: 89 lbs/ac
Yields adjusted to13.5% moisture

Melita 2017
0
20
40
60
80
100
0 50 80 110 140 170
Yie
ld (
bu
/ac)
lbs. N/ac
Brandon
Prosper
AABABBC
C
D
6789
10111213141516
0 50 80 110 140 170
Pro
tein
(%
)
lbs. N/ac
Brandon
Prosper
aba a
bcc
Residual NO3-N: 11 lbs/ac
Yields adjusted to13.5% moisture
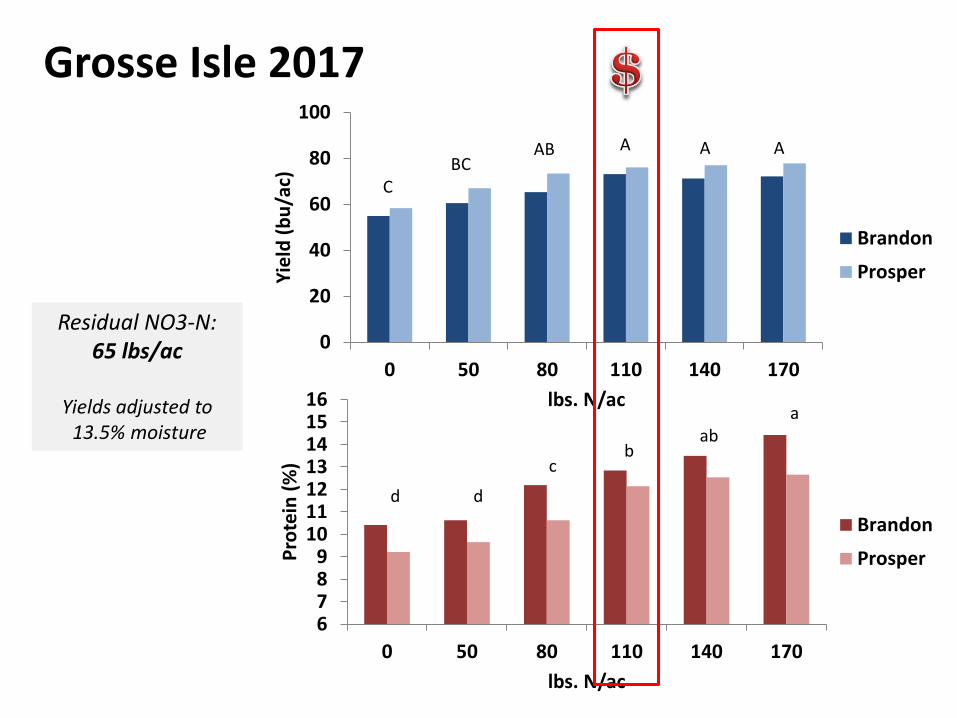
Grosse Isle 2017
0
20
40
60
80
100
0 50 80 110 140 170
Yie
ld (
bu
/ac)
lbs. N/ac
Brandon
Prosper
AAAABBC
C
6789
10111213141516
0 50 80 110 140 170
Pro
tein
(%
)
lbs. N/ac
Brandon
Prosper
bab
a
c
d d
Residual NO3-N: 65 lbs/ac
Yields adjusted to13.5% moisture
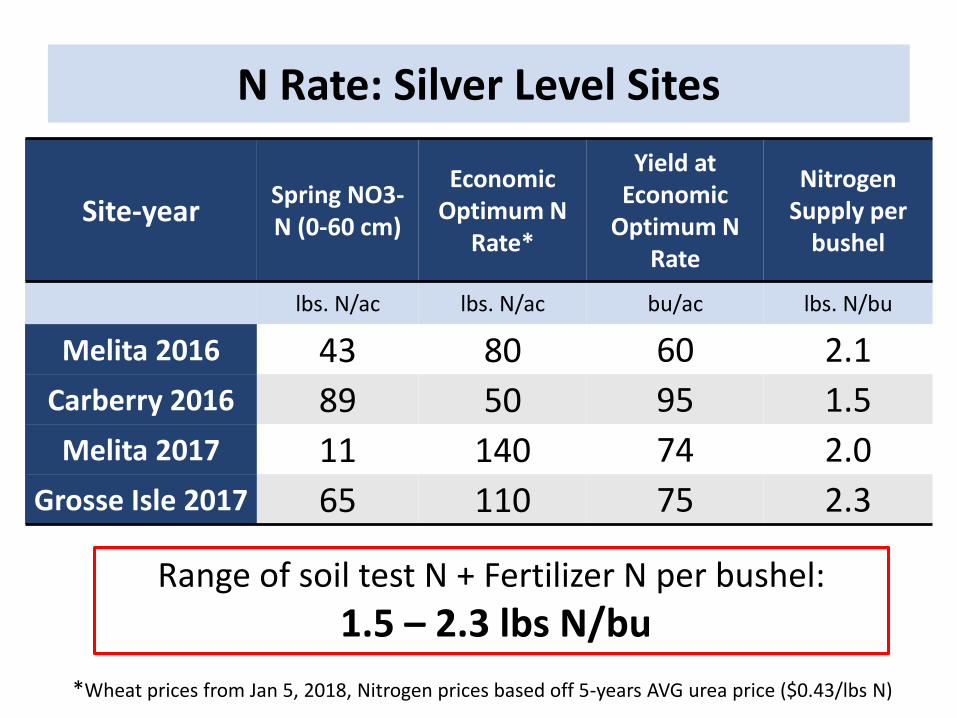
Site-yearSpring NO3-N (0-60 cm)
Economic Optimum N
Rate*
Yield at Economic
Optimum N Rate
Nitrogen Supply per
bushel
lbs. N/ac lbs. N/ac bu/ac lbs. N/bu
Melita 2016 43 80 60 2.1
Carberry 2016 89 50 95 1.5
Melita 2017 11 140 74 2.0
Grosse Isle 2017 65 110 75 2.3
N Rate: Silver Level Sites
Range of soil test N + Fertilizer N per bushel:
1.5 – 2.3 lbs N/bu
*Wheat prices from Jan 5, 2018, Nitrogen prices based off 5-years AVG urea price ($0.43/lbs N)

Carman 2016
0
20
40
60
80
100
0 50 80 110 140 170 200
Yie
ld (
bu
/ac)
lbs. N/ac
Brandon
Prosper
CD
AB ABC
BCD
A
D
6789
10111213141516
0 50 80 110 140 170 200
Pro
tein
(%
)
lbs. N/ac
Brandon
Prosper
d cd bcd bcab ab a
Residual NO3-N: 47 lbs/ac
Yields adjusted to13.5% moisture

Brunkild 2016
0
20
40
60
80
100
0 50 80 110 140 170 200
Yie
ld (
bu
/ac)
lbs. N/ac
Brandon
Prosper
D
E
CD
ABC A AB AB
6789
10111213141516
0 50 80 110 140 170 200
Pro
tein
(%
)
lbs. N/ac
Brandon
Prosper
aabbcbc
cddd
Residual NO3-N: 40 lbs/ac
Yields adjusted to13.5% moisture

Carman 2017
0
20
40
60
80
100
120
140
0 50 80 110 140 170 200
Yie
ld (
bu
/ac)
lbs. N/ac
Brandon
Prosper
B
A A A A A A
6789
10111213141516
0 50 80 110 140 170 200
Pro
tein
(%
)
lbs. N/ac
Brandon
Prosper
ede
cdbc ab
ab a
Residual NO3-N: 43 lbs/ac
Yields adjusted to13.5% moisture
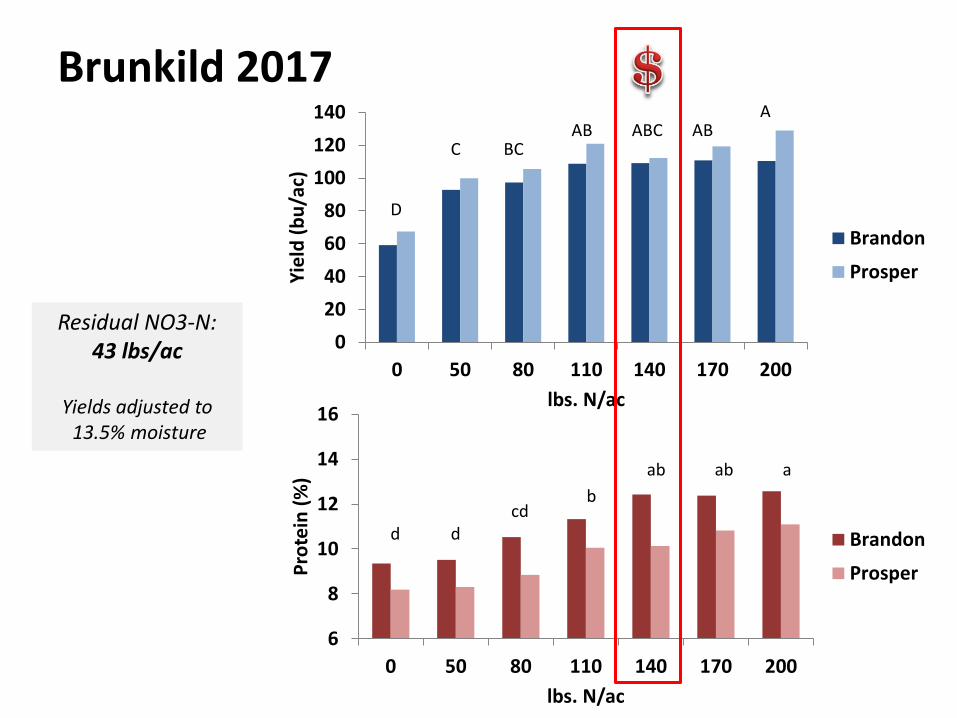
Brunkild 2017
0
20
40
60
80
100
120
140
0 50 80 110 140 170 200
Yie
ld (
bu
/ac)
lbs. N/ac
Brandon
Prosper
AABABCAB
BCC
D
6
8
10
12
14
16
0 50 80 110 140 170 200
Pro
tein
(%
)
lbs. N/ac
Brandon
Prosper
d
aabab
bcd
d
Residual NO3-N: 43 lbs/ac
Yields adjusted to13.5% moisture

N Rate: Gold Level Sites
Average soil test N + Fertilizer N per bushel:
1.7 – 3.0 lbs N/bu *Wheat prices from Jan 5, 2018, Nitrogen prices based off 5-years AVG urea price ($0.43/lbs N)
Site-yearSpring NO3-N (0-60 cm)
Economic Optimum N
Rate*
Yield at Economic
Optimum N Rate
Nitrogen Supply per
bushel
lbs. N/ac lbs. N/ac bu/ac lbs. N/bu
Carman 2016 47 140 62 3.0
Brunkild 2016 40 140 75 2.4
Carman 2017 43 140 96 1.9
Brunkild 2017 43 140 110 1.7

Nitrogen Timing
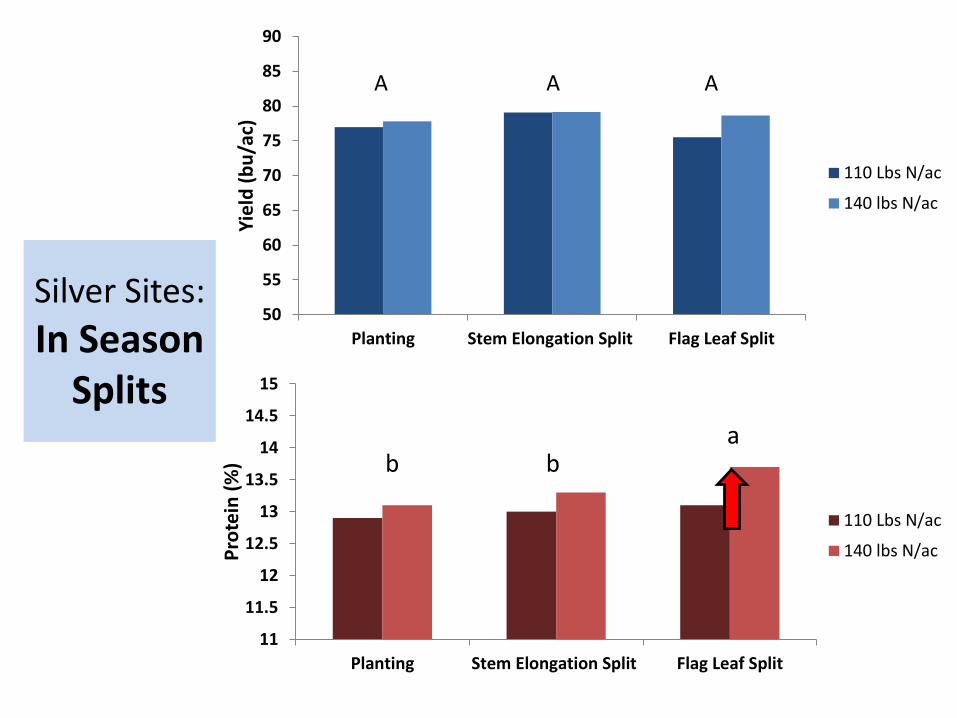
Silver Sites:
In Season Splits
50
55
60
65
70
75
80
85
90
Planting Stem Elongation Split Flag Leaf Split
Yie
ld (
bu
/ac)
110 Lbs N/ac
140 lbs N/ac
A A A
11
11.5
12
12.5
13
13.5
14
14.5
15
Planting Stem Elongation Split Flag Leaf Split
Pro
tein
(%
)
110 Lbs N/ac
140 lbs N/ac
b ba

60
65
70
75
80
85
90
95
100
Planting Stem ElongationSplit
Flag Leaf Split
Yie
ld (
bu
/ac)
110 Lbs N/ac
140 lbs N/ac
BA AB
11
11.5
12
12.5
13
13.5
14
14.5
15
Planting Stem Elongation Split Flag Leaf Split
Pro
tein
(%
)
110 Lbs N/ac
140 lbs N/acc
b
a
Gold Sites:
In Season Splits

50
60
70
80
90
100
80 lbs N/ac 80 + 30 PA lbs N/ac 110 lbs N/acY
ield
(b
u/a
c)
**
6
8
10
12
14
16
80 lbs N/ac 80 + 30 PA lbs N/ac 110 lbs N/ac
Pro
tein
(%
) **
Silver Sites:
Post- Anthesis Application

50
60
70
80
90
100
80 lbs N/ac 80 + 30 PA lbs N/ac 110 lbs N/ac
Yie
ld (
bu
/ac)
6
8
10
12
14
16
80 lbs N/ac 80 + 30 PA lbs N/ac 110 lbs N/ac
Pro
tein
(%
) **
*
Gold Sites:
Post- Anthesis Application
0
5
10
15
20
25
30
35
May
5 2
01
6
May
8 2
01
6
May
11
20
16
May
14
20
16
May
17
20
16
May
20
20
16
May
23
20
16
May
26
20
16
May
29
20
16
Jun
1 2
01
6
Jun
4 2
01
6
Jun
7 2
01
6
Jun
10
20
16
Jun
13
20
16
Jun
16
20
16
Jun
19
20
16
Jun
22
20
16
Jun
25
20
16
Jun
28
20
16
Jul 1
20
16
Jul 4
20
16
Jul 7
20
16
Jul 1
0 2
01
6
Jul 1
3 2
01
6
Jul 1
6 2
01
6
Jul 1
9 2
01
6
Jul 2
2 2
01
6
Jul 2
5 2
01
6
Jul 2
8 2
01
6
Jul 3
1 2
01
6
Au
g 3
20
16
Au
g 6
20
16
Au
g 9
20
16
Au
g 1
2 2
01
6
Au
g 1
5 2
01
6
Au
g 1
8 2
01
6
Au
g 2
1 2
01
6
Au
g 2
4 2
01
6
Au
g 2
7 2
01
6
Pre
cip
itat
ion
(m
m)
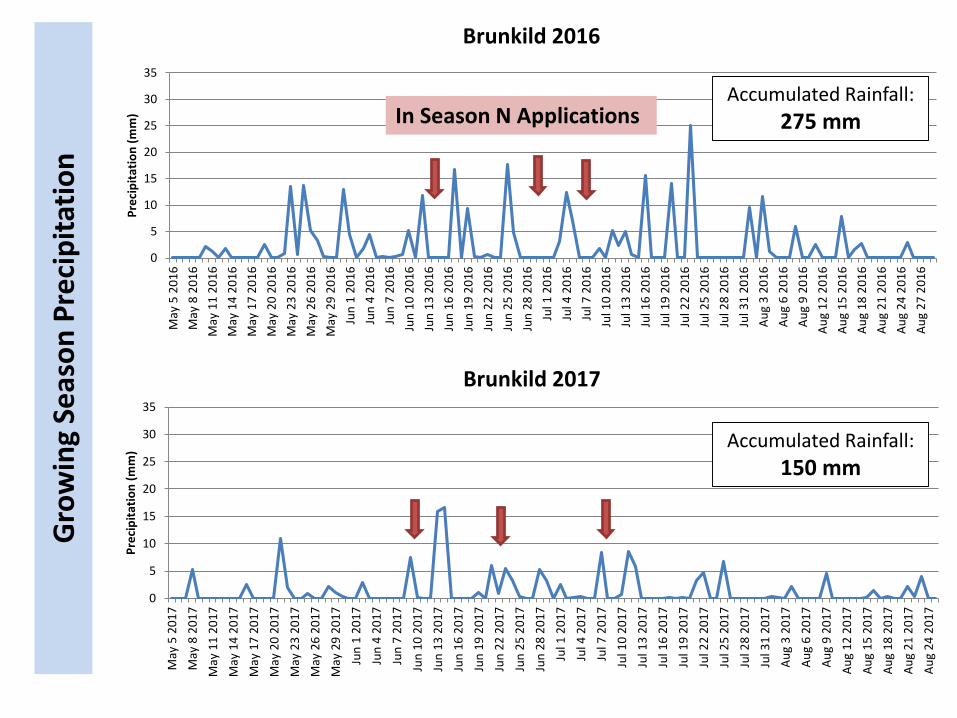
Brunkild 2016
0
5
10
15
20
25
30
35
May
5 2
01
7
May
8 2
01
7
May
11
20
17
May
14
20
17
May
17
20
17
May
20
20
17
May
23
20
17
May
26
20
17
May
29
20
17
Jun
1 2
01
7
Jun
4 2
01
7
Jun
7 2
01
7
Jun
10
20
17
Jun
13
20
17
Jun
16
20
17
Jun
19
20
17
Jun
22
20
17
Jun
25
20
17
Jun
28
20
17
Jul 1
20
17
Jul 4
20
17
Jul 7
20
17
Jul 1
0 2
01
7
Jul 1
3 2
01
7
Jul 1
6 2
01
7
Jul 1
9 2
01
7
Jul 2
2 2
01
7
Jul 2
5 2
01
7
Jul 2
8 2
01
7
Jul 3
1 2
01
7
Au
g 3
20
17
Au
g 6
20
17
Au
g 9
20
17
Au
g 1
2 2
01
7
Au
g 1
5 2
01
7
Au
g 1
8 2
01
7
Au
g 2
1 2
01
7
Au
g 2
4 2
01
7
Pre
cip
itat
ion
(m
m)
Brunkild 2017
Accumulated Rainfall:
275 mm
Accumulated Rainfall:
150 mm
Gro
win
g Se
aso
n P
reci
pit
atio
n
In Season N Applications

Nitrogen Sources

Post-Anthesis – Gold Sites
50
55
60
65
70
75
80
85
90
UAN Urea Sol'n
Yie
ld (
bu
/ac)
10
11
12
13
14
15
16
UAN Urea Sol'nP
rote
in (
%)
Carman 2017 Brunkild 2017
Yield Protein

ESN Blends – Gold Sites
50
60
70
80
90
100
Urea ESN Blend
Yie
ld (
bu
/ac)
10.0
11.0
12.0
13.0
14.0
15.0
Urea ESN Blend
Pro
tein
(%
)
Yield Protein

Preliminary Conclusions
• Total N supply (soil test nitrate-N + fert) required for economic optimum ranged from:➢ Silver Sites: 1.5 – 2.3 lbs N/bu➢ Gold Sites: 1.7 – 3.0 lbs N/bu
• Stem elongation and flag leaf split applications yielded at least as well as applications at planting
• Flag leaf split applications increased grain protein content compared to equivalent rates at planting and stem elongation splits.
• Post-anthesis applications increased grain protein content
• Foliar applied urea solution resulted in higher yield and grain protein content compared to UAN
• ESN blends produced yield and protein content similar to conventional urea
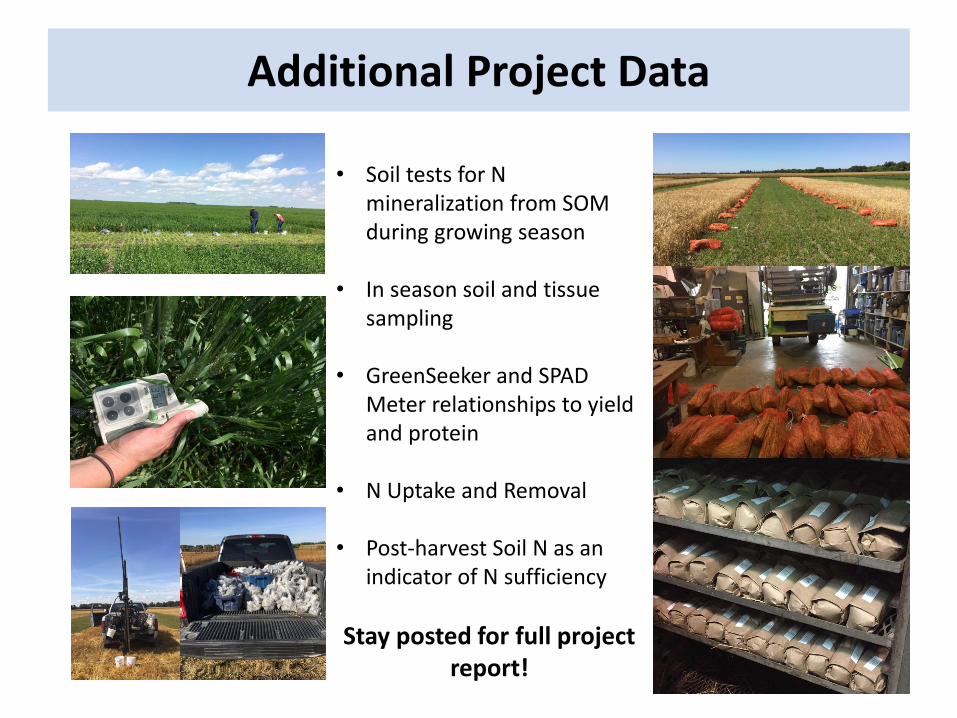
Additional Project Data
• Soil tests for N mineralization from SOM during growing season
• In season soil and tissue sampling
• GreenSeeker and SPAD Meter relationships to yield and protein
• N Uptake and Removal
• Post-harvest Soil N as an indicator of N sufficiency
Stay posted for full project report!

Acknowledgments
• Manitoba Wheat and Barley Growers Association
• John Heard and colleagues in Manitoba Agriculture
• Crop Diversification Centres (WADO, CMCDC)
• U of M Ian Morrison Research Station at Carman
• David Laudin • Antara Agronomy• Koch Fertilizer• Agrium • AGVISE Laboratories• Angie, Magda, Lanny, Megan, Trevor,
Thomas, Saad, Rockford, Meghan, Joel