Embed Size (px)
Citation preview

Optimizing nitrogen fertilization practices under intensive vineyard cover cropping floor management systems
DeAnna D’Attilio
Thesis submitted to the faculty of the Virginia Polytechnic Institute and State University in partial fulfillment of the requirements for the degree of
Master of Science
In Horticulture
Tony K. Wolf, Chair Gregory M. Peck Lailiang Cheng
21 February 2014 Blacksburg, VA
Keywords: Vitis vinifera, yeast assimilable nitrogen (YAN), chlorophyll content index (CCI), ultra performance liquid chromatography (UPLC), foliar fertilization
Optimizing nitrogen fertilization practices under intensive vineyard cover cropping floor management systems
DeAnna D’Attilio
ABSTRACT
Under-trellis cover crops have become more prevalent in East Coast grape growing regions through either intentional planting or adoption of native vegetation, to minimize the potential for erosion and to help regulate grapevine size and vigor. These companion crops, however, have sometimes resulted in increased competition for soil nitrogen, leading to decreased vine nitrogen status and berry yeast assimilable nitrogen (YAN). The aim of this study was to determine the effects of different nitrogen fertilization methods applied at varying doses and different times, on vine and berry nitrogen parameters of cover cropped grapevines. The research described herein involved Sauvignon blanc, Merlot, and Petit Manseng grapevines (Vitis vinifera L.) subjected to different sets of nitrogen treatments, and was primarily conducted over two years. There were very few differences in pruning weights, canopy architecture, components of yield, and primary fruit chemistry amongst nitrogen treatments. Sauvignon blanc petiole nitrogen concentration, season-long chlorophyll content index (CCI) values, and berry YAN were most affected by the highest rate of soil nitrogen treatment (60 kg N/ha total split between two calcium nitrate applications at bloom and six weeks post bloom) and foliar fertilization (40 kg N/ha split over seven to nine urea applications); however, the foliar fertilization was most effective at increasing the concentration of certain individual amino acids. Petit Manseng berry YAN at harvest was increased in response to post-véraison foliar applications (10 kg N/ha split between two urea applications), corresponding to an increased concentration of nine amino acids. Merlot berry YAN, petiole nitrogen concentration, and season-long CCI values were most affected by a high rate of soil nitrogen treatment (60 kg N/ha total split between two calcium nitrate applications at bloom and six weeks post bloom) and establishing clover as the under-trellis cover crop. This study identified nitrogen treatments that improved berry nitrogen concentration and content in cover cropped sites.

iii
Dedication
To my better half, James— the best data recorder and editor a girl could ask for.

iv
Acknowledgements
First and foremost, I thank my fiancé, James. Your love, motivation, and summer
sacrifice made this endeavor possible. You are truly the most brilliant and patient
individual I have ever met, and I am blessed to have you in my life.
I extend a million thanks to my entire family and closest friends for being my support
system every step of the way, but especially for keeping me company on my early
morning car rides between Fairfax and Winchester.
I would like to thank my advisor, Dr. Tony Wolf, for his guidance and understanding,
and the countless opportunities he provided me. It has been a great pleasure to be your
student. I would also like to thank my committee members, Dr. Gregory Peck and Dr.
Lailiang Cheng, for their assistance in this process.
I owe immense gratitude to Eva Collakova. Without her patience my amino acid analysis
would not have been possible.
I would like to thank the AREC team: Cain, Tremain, Brycen, Kay, and Greg. You all
made long days seem fleeting and were instrumental to my data collection.
And finally, I would like to thank the Virginia Wine Board for funding this project and
allowing me to pursue my research questions of interest.

v
Table of Contents
Abstract ............................................................................................................................... ii Dedication .......................................................................................................................... iii Acknowledgements ............................................................................................................ iv List of Figures ................................................................................................................... vii List of Tables ................................................................................................................... viii List of Abbreviations ...........................................................................................................x Introduction ..........................................................................................................................1 Review of Literature ............................................................................................................2
Nitrogen Cycling .......................................................................................................................... 2 Nitrogen partitioning overview ................................................................................................ 2 Early-season nitrogen dynamics .............................................................................................. 3 Mid-season nitrogen dynamics ................................................................................................ 4 Pre-harvest through senescence nitrogen dynamics ................................................................ 5
Cover Crop Use ............................................................................................................................ 6 Benefits of cover crops ............................................................................................................ 6 Effects of cover crops on vine yield and berry YAN ............................................................... 6 Leguminous cover crops .......................................................................................................... 9 Effect of cover crops on berry chemistry and wine quality ................................................... 13
Effects of nitrogen on berry development and fermentation ...................................................... 15 Importance of nitrogen balance ............................................................................................. 15 Effect of YAN on fermentation success and aroma development ......................................... 15 Effect of amino acid composition on fermentation success and aroma development ........... 16 Must nitrogen additions ......................................................................................................... 18 Factors affecting YAN concentration and amino acid composition in grapes ...................... 20
Vineyard Nitrogen Additions ..................................................................................................... 22 Effects of soil nitrogen applications on berry YAN .............................................................. 22 Effects of foliar nutrient applications on berry YAN ............................................................ 24 Factors affecting efficacy of foliar nutrient applications ....................................................... 27 Nitrogen applications in cover cropped systems ................................................................... 28
Materials and Methods ......................................................................................................30 Research objectives .................................................................................................................... 30 Site details .................................................................................................................................. 30 Explanation of treatments .......................................................................................................... 32 Temperature and rainfall ............................................................................................................ 34 Plant tissue analysis ................................................................................................................... 34 Soil nutrient analysis .................................................................................................................. 35 Chlorophyll content index .......................................................................................................... 36 Canopy architecture and fruit exposure ..................................................................................... 37 Primary chemistry and yeast assimilable nitrogen (YAN) of mature fruit ................................ 37 UPLC analysis of mature fruit ................................................................................................... 38 Components of yield .................................................................................................................. 39 Pruning weights .......................................................................................................................... 40 Data analysis .............................................................................................................................. 41
Results ...............................................................................................................................42 Temperature and rainfall ............................................................................................................ 42 Plant tissue analysis ................................................................................................................... 43 Soil nutrient analysis .................................................................................................................. 50
vi
Chlorophyll content index .......................................................................................................... 51 Linear regression analysis ......................................................................................................... 58 Canopy architecture and fruit exposure ..................................................................................... 60 Primary chemistry and yeast assimilable nitrogen (YAN) of mature fruit ................................ 64 UPLC analysis of mature fruit ................................................................................................... 68 Components of yield .................................................................................................................. 73 Pruning weights .......................................................................................................................... 74
Discussion .........................................................................................................................76 Conclusion .........................................................................................................................86 References ........................................................................................................................88
vii
List of Figures
Figure 1. GMV: 2013 treatment effects on Sauvignon blanc leaf chlorophyll content index values over time ......................................................................................................53 Figure 2. CON: 2013 treatment effects on Merlot leaf chlorophyll content index values over time ............................................................................................................................54 Figure 3. AREC: 2013 treatment effects on Petit Manseng leaf chlorophyll content index values over time .................................................................................................................56 Figure 4. GMV: Regression analysis of average 2013 Sauivngon blanc véraison chlorophyll content index readings and %N in blades .......................................................58 Figure 5. Regression analysis of average 2013 Merlot véraison chlorophyll content index readings from all sites and %N in petioles .........................................................................59 Figure 6. GMV: Treatment effect on Sauvignon blanc yeast assimilable nitrogen (YAN) in 2011-2013 ......................................................................................................................64 Figure 7. CON: Treatment effect on Merlot yeast assimilable nitrogen (YAN) in 2012-2013....................................................................................................................................65 Figure 8. AREC: Treatment effect on Petit Manseng yeast assimilable nitrogen (YAN) in 2012-2013 ..........................................................................................................................66 Figure 9. CON: May 2013 establishment of crimson clover and red clover .....................81
viii
List of Tables
Table 1. Temperature and rainfall data for AREC (Winchester, VA) experimental vineyard site 2011-2013 .....................................................................................................42 Table 2. GMV: Treatment effect on percent macronutrient composition of Sauvignon blanc petioles and blades at bloom and véraison in 2011-2013 .........................................44 Table 3. GMV: Treatment effect on micronutrient composition of Sauvigon blanc petioles and blades at bloom and véraison in 2011-2013 ..................................................45 Table 4. CON: Treatment effect on percent macronutrient composition of Merlot petioles at bloom and véraison in 2012-2013 ..................................................................................46 Table 5. CON: Treatment effect on micronutrient composition of Merlot petioles at bloom and véraison in 2012-2013......................................................................................47 Table 6. AREC: Treatment effect on percent macronutrient composition of Petit Manseng petioles at véraison in 2012-2013 and bloom in 2013 .......................................................48 Table 7. AREC: Treatment effect on micronutrient composition of Petit Manseng petioles at véraison in 2012-2013 and bloom in 2013 ....................................................................49 Table 8. Averaged soil nutrient analyses for AREC in 2013, and for GMV and CON in 2012 and 2013 ...................................................................................................................50 Table 9. GMV: Treatment effect on Sauvignon blanc leaf chlorophyll content index at véraison in 2012 .................................................................................................................52 Table 10. CON: Treatment effect on Merlot leaf chlorophyll content index at véraison in 2012....................................................................................................................................52 Table 11. AREC: Treatment effect on Petit Manseng leaf chlorophyll content index at véraison in 2012 .................................................................................................................52 Table 12. GMV: Season long treatment effect on Sauvignon blanc leaf chlorophyll content index in 2013 .........................................................................................................53 Table 13. GMV: Repeated measures univariate ANOVA Fixed Effect Tests for Sauvignon blanc chlorophyll content index measurements ...............................................53 Table 14. CON: Season long treatment effect on Merlot chlorophyll content index in 2013....................................................................................................................................55 Table 15. CON: Repeated measures univariate ANOVA Fixed Effect Tests for Merlot chlorophyll content index measurements ...........................................................................55 Table 16. AREC: Season long treatment effect on Petit Manseng leaf chlorophyll content index in 2013......................................................................................................................57 Table 17. AREC: Repeated measures univariate ANOVA Fixed Effect Tests for Petit Manseng chlorophyll content index measurements ...........................................................57 Table 18. GMV: Treatment effects on Sauvignon blanc EPQA parameters of interest in 2012 and 2013 ....................................................................................................................61 Table 19. CON: Treatment effects on Merlot EPQA parameters of interest in 2012 and 2013....................................................................................................................................61 Table 20. AREC: Treatment effects on Petit Manseng EPQA parameters of interest in 2012 and 2013 ....................................................................................................................62 Table 21. GMV: Treatment effect on Sauvignon blanc primary fruit chemistry and yeast assimilable nitrogen (YAN) in 2011-2013 ........................................................................64 Table 22. CON: Treatment effect on Merlot primary fruit chemistry and yeast assimilable nitrogen (YAN) in 2011-2013 .................................................................................................... 65

ix
Table 23. AREC: Treatment effect on Petit Manseng primary fruit chemistry and yeast assimilable nitrogen (YAN) in 2011-2013 ........................................................................66 Table 24. GMV: Treatment effects on Sauvignon blanc juice amino acid concentration (mg/L) at harvest in 2012 ...................................................................................................69 Table 25. GMV: Treatment effects on Sauvignon blanc juice amino acid concentration (mg/L) at harvest in 2013 ...................................................................................................69 Table 26. CON: Treatment effects on Merlot juice amino acid concentration (mg/L) at harvest in 2012 ...................................................................................................................70 Table 27. CON: Treatment effects on Merlot juice amino acid concentration (mg/L) at harvest in 2013. ..................................................................................................................70 Table 28. AREC: Treatment effects on Petit Manseng juice amino acid concentration (mg/L) at harvest in 2012 ...................................................................................................71 Table 29. AREC: Treatment effects on Petit Manseng juice amino acid concentration (mg/L) at harvest in 2013 ...................................................................................................71 Table 30. GMV: Treatment effects on Sauvignon blanc components of yield in 2011-2013....................................................................................................................................73 Table 31. CON: Treatment effects on Merlot components of yield in 2012 and 2013 .....73 Table 32. AREC: Treatment effects on Petit Manseng components of yield in 2012 and 2013....................................................................................................................................74 Table 33. GMV: Treatment effects on Sauvignon blanc pruning weights in 2011 and 2012....................................................................................................................................75 Table 34. CON: Treatment effects on Merlot pruning weights in 2012 ............................75 Table 35. AREC: Treatment effects on Petit Manseng pruning weights in 2012 ..............75

x
List of Abbreviations
Ala - Alanine AREC - Alson H. Smith Jr. AREC (Petit Manseng) Arg - Arginine Asn - Asparagine Asp - Aspartic acid CCI - Chlorophyll Content Index CEFA - Cluster Exposure Flux Availability CEL - Cluster Exposure Layer CON - Chateau O’Brien at Northpoint (Merlot) Cys - Cysteine EPQA - Enhanced Point Quadrat Analysis GDD - Growing Degree Days Gln - Glutamine Glu - Glutamic Acid Gly - Glycine GMV - Glen Manor Vineyards (Sauvignon blanc) His - Histidine Ile - Isoleucine LEFA - Leaf Exposure Flux Availability LEL - Leaf Exposure Layer Leu - Leucine Lys - Lysine Met - Methionine OLN - Occlusion Layer Number Phe - Phenylalanine PPFD – Photosynthetic Photon Flux Density Pro - Proline Ser – Serine TA – Titratable Ccidity Thr – Threonine TSS – Total Soluble Solids Tyr - Tyrosine UPLC - Ultra Performance Liquid Chromatography Val - Valine YAN - Yeast Assimilable Nitrogen

1
Introduction
In recent years Virginia vineyards have employed intensive cover cropping as a
vineyard management strategy to suppress excess vine vigor. Additional benefits
associated with cover cropping include: reducing soil nutrient leaching, improving soil
organic matter and soil structure, suppressing weed populations, improving conditions for
tractors in wet periods, moderating soil temperatures and water status, reducing erosion,
enhancing biodiversity, and improving water filtration (Baumgartner, Smith, and Bettiga
2005; Celette, Findeling, and Gary 2009; Fourie, Louw, and Agenbag 2007; Gulick et al.
1994). In many studies cover crops have been shown to compete for soil nitrogen, leading
to diminished berry nitrogen, and specifically, reduced yeast assimilable nitrogen (YAN)
in berries (Larchevêque, Casanova, and Dupuch 1998; Maigre 1997, 2002; Maigre and
Aerny 2000; Spring and Lorenzini 2006; Xi et al. 2010). There is an urgent need to
address this concern, because reduced berry YAN contributes to stuck or slow
fermentations and reduced wine quality (Bell and Henschke 2005). Standard nitrogen
application rates, which have previously been successful for vines grown in the presence
of an herbicide strip, may be insufficient to maintain or increase vine nitrogen and berry
nitrogen status, due to the cover crop successfully competing for the fertilizer addition.
Other methods—such as utilizing leguminous cover crops, applying compost, spraying
foliar nitrogen applications, or a combination thereof—have potential to be successful
alternatives, and were thus explored in this study (Guerra and Steenwerth 2012; Jreij et
al. 2009; Schreiber et al. 2002; Spring 2001; Spring and Lorenzini 2006).

2
Review of Literature
Nitrogen Cycling
Nitrogen partitioning overview
A fundamental role of nitrogen in grapevines is to produce amino acids that can
later be assembled into proteins vital to new tissue growth, vine metabolism, and energy
generation (Keller 2010). It is well documented that annual vine growth is sustained by
carbohydrates and nutrients stored in woody tissues, as well as those obtained from the
soil on a seasonal basis. For this reason, seasonal nitrogen uptake at critical demand
periods has often been studied in conjunction with annual carbohydrate cycling in
grapevines.
The most general summary of nitrogen and carbohydrate partitioning suggests
that early season root and shoot growth are supported by reserve nitrogen and
carbohydrates throughout active shoot growth. By the beginning of bloom, reserves are
often depleted and future growth is reliant on nitrogen uptake and carbon assimilation
until at least véraison. For this reason, the critical demand period for new nitrogen is
thought to be toward the end of active shoot growth through early berry development
(Christensen, Kasimatis, and Jensen 1978; Conradie 1986; Wermelinger, Baumgärtner,
and Gutierrez 1991). Uptake during this critical demand period is dependent on soil
nitrogen availability and is closely linked to climatic conditions that influence nitrogen
mineralization rates. Soil microbes mineralize more nitrogen in moist soil, consequently
resulting in a limited nitrogen pool in dryer soils (Keller 2010). After harvest, nitrogen
uptake and translocation of nutrients from leaf tissue prior to senescence are responsible
for renewing the nitrogen and carbohydrate reserves in woody tissues (Conradie 1986).
3
Early-season nitrogen dynamics
Initial spring growth from budbreak throughout rapid shoot growth is heavily
dependent on reserve nitrogen and total nonstructural carbohydrates being remobilized.
In a study conducted on three-year-old Pinot noir vines, roots stored 90% of total starch,
75% of total nitrogen at the beginning of the season, but exhibited a 70% starch loss by
bloom (Zapata et al. 2004). Destructive analyses were conducted throughout the season to
measure starch content, and to perform a quantitative nitrogen analysis through the use of
a 15N tracer. During the dormant analysis, nitrogen represented only 1.6% root dry
weight, while starch, represented 33% dry weight. No growth or yield data was provided,
but the authors of this study suggest that their findings illustrate that carbohydrates (and
starch specifically) are the primary contributor to initial spring growth (Zapata et al.
2004). In a similar study conducted on three-year-old Concord vines, roots stored 84% of
total vine starch and 75% of total vine nitrogen, with trunks and shoots contributing the
remaining storage units (Bates, Dunst, and Joy 2002). In accordance with Zapata et al.
2004, the Concord vines exhibited a 78% loss of the reserve starch, which was used for
pre-bloom root and shoot growth. Fine root nitrogen uptake accounted for at least 84% of
spring growth nitrogen, indicating that stored nitrogen is less important than stored starch
for initial spring growth. This data conflicts with a separate nitrogen fertilization
experiment which reported that 8 weeks of mid-summer fertigation with ammonium
nitrate did not have an impact on total vine nitrogen in one-year-old Concord vines, but
total nonstructural carbohydrates decreased slightly as determined by a destructive
analysis (Xia and Cheng 2004). In a separate publication, data is presented that
demonstrates total leaf area, fruit yield, and total dry weight increased in accordance with

4
the rate of nitrogen applied the previous year (0, 5, 10, 15, or 20 mM N): those that
received foliar nitrogen combined with fertigation had greater yield data than the
fertigation treatments alone—despite the decrease in total nonstructural carbohydrates—
suggesting that reserve nitrogen is actually more important than vine total nonstructural
carbohydrates in terms of contributions to growth and development (Cheng, Xia, and
Bates 2004). The differences in these studies may be attributed to the differences in vine
age or environmental conditions such as precipitation and temperature patterns. The fact
remains that replenishing storage nitrogen is important for maintaining overall vine
nitrogen status for future years, and the fertilization methods proposed in this Virginia
study take this into account.
Mid-season nitrogen dynamics
Rapid absorption of nitrogen into the roots occurs during active shoot growth
(Hanson and Howell 1995). For Chenin blanc grapevines grown in sand culture,
fertilization during different phenological periods found that flowering through véraison
was considered a critical period, as nitrogen uptake is highest at this point, while storage
nitrogen is depleted. Vines rely on this stage to absorb enough nitrogen to supply clusters
during maturation and growth (Conradie 1986). One study reports that 46% of the
nitrogen supplied at the end of rapid shoot growth will end up in mature berries
(Conradie 1991). Moreover, bloom commences this important uptake period because it
coincides with a fully developed fine root system. Beginning at bloom through early
berry development, nitrogen uptake and carbon assimilation support berry growth
(Zapata et al. 2001). Reserve nitrogen and carbohydrate accumulation also begin at

5
bloom and continue through harvest, with the majority of accumulation occurring at the
end of active shoot growth onward (Bates, Dunst, and Joy 2002; Pradubsuk and
Davenport 2010; Zapata et al. 2001). Given the significance of the bloom-harvest period
on N absorption and accumulation, it is unlikely that nitrogen applications prior to this
time will contribute meaningfully to either current season nitrogen or nitrogen reserves,
and therefore was not considered in this study.
Pre-harvest through senescence nitrogen dynamics
Similar fertilization studies conducted in South Africa demonstrate that up to 37%
of annual nitrogen absorption occurs between harvest and leaf senescence, thereby
providing 60% of the stored nitrogen for the following season (Conradie 1986; Conradie
1992). It appears that roots are still able to absorb nitrogen after harvest; therefore,
fertilization at this time replenishes storage nitrogen considerably (Treeby and Wheatley
2006). Post-harvest, nitrogen is remobilized from leaves to storage units in the trunk and
roots; however, this remobilization can be impaired if temperature drops rapidly or the
canopy defoliates (Cheng, Xia, and Bates 2004). For the purposes of my study, I aimed to
assess whether post-harvest nitrogen applications improve berry YAN levels in future
years, and specifically whether this strategy can be considered a feasible nitrogen
management practice in cover cropped vineyards.

6
Cover Crop Use
Benefits of cover crops
Growing grapevines in conjunction with alleyway cover crops or under-trellis
cover crops is now a long-standing viticulture practice. There are many perceived
benefits of cover cropping systems, which include: reducing excess vine vigor, improving
soil organic matter, soil structure and water holding capacity, reducing nitrate leaching,
suppressing weed populations, improving traffic conditions in wet periods, moderating
soil temperatures and water status, reducing erosion, enhancing biodiversity, and
improving water infiltration (Baumgartner, Smith, and Bettiga 2005; Celette, Findeling,
and Gary 2009; Fourie, Louw, and Agenbag 2007; Gulick et al. 1994). Most of these
effects also apply to other agricultural crops, but specific effects of cover crops on
grapevines include achieving higher total soil microbial biomass, an effect that has
potential for increased arbuscular mycorrhizal fungal interactions, pending grape root
overlap with cover crop roots (Ingels et al. 2005). Increased arbuscular mycorrhizal fungi
interactions have potential to improve vine nutrition by increasing phosphorous uptake,
providing greater protection from soil borne pathogens, and improving water acquisition
(Cheng and Baumgartner 2004; Schreiner 2005).
Effects of cover crops on vine yield and berry YAN
Many studies have illustrated that vines grown with cover crops exhibit reduced
vine vigor and significant decreases in yield (Celette, Findeling, and Gary 2009; Hatch,
Hickey, and Wolf 2011; Larchevêque, Casanova, and Dupuch 1998; Lavezzi et al. 2005;
7
Tan and Crabtree 1990; Tesic, Keller, and Hutton 2007; Wolpert et al. 1993).
Chardonnay vines grown with sward competition exhibited reduced vine vigor, more
open canopies, lower yields, and overall increased fruit maturity (Tesic, Keller, and
Hutton 2007). While decreased vigor and yield is considered beneficial in some
scenarios, the Chardonnay also exhibited reduced petiole nutrient status, an outcome that
may be detrimental to overall vine health. The reduced nutrient status was attributed to
the observed decrease in water supply and subsequent reduced nutrient uptake (Tesic,
Keller, and Hutton 2007). This data is in accordance with Hatch et al. 2011, who
suggested that under-trellis cover crops are a powerful tool for restricting vine growth by
limiting water supply, especially in regions prone to excess vigor. These studies justify
experimentation with alternate forms of nutrient additions less dependent on water uptake
to offset nutrient deficiencies, such as foliar applications. Studies that examine the effects
of cover crops on grape yield while providing irrigation to experiment vines often
indicate little or no reduction in vigor (Ingels et al. 2005). The lack of water stress and
ability to uptake minerals likely enables vigor, yield, and nutrient content to remain
unaffected in most cases, unless cover crops are excessively competitive in nature.
Furthermore, studies that examine the effects of alleyway cover crops on vine vigor and
yield are often unaffected if an herbicide strip is maintained under the trellis; however,
nutrient deficiencies in leaf tissue and berry YAN are often observed and have potential
to reduce wine quality (Baumgartner, Steenwerth, and Veilleux 2008; Sweet and
Schreiner 2010).
Celette et al. 2009 found that for Mediterranean Aranel/Fercal vines grown with a
permanent tall fescue or a nonpermanent barley intercrop, nitrogen uptake and growth
8
were reduced. This effect was greatest for the permanent tall fescue intercrop, leading to
reduced nitrogen reserves. The authors attributed the decrease in nitrogen to the cover
crops directly removing nitrogen and water from the mineralization zone, causing
drought and reduced nitrate reductase activity. This effect was exacerbated in the fescue
treatment because the crop’s early development, prior to vine rapid shoot growth, enabled
rapid removal of soil water at the same time that the vines were utilizing perennial
nitrogen rather than seeking absorption of early season soil nitrogen. In contrast, vines
grown with barley were able to take advantage of newly formed inorganic nitrogen
present in the soil, due to favorable spring conditions of warm temperatures and rainfall,
prior to barley emergence. The barley was also less competitive because it was destroyed
chemically by the time of bloom and therefore did not continue to compete for nitrogen
after that point (Celette et al. 2009). Reductions in growth are therefore attributed to in-
season nitrogen removal as well as reduced nitrogen accumulation for initial spring
growth in the following season. It should be noted that the degree of competition for
water and nitrogen is most likely dependent on the actual cover crop biomass produced,
which is affected by climatic and site-specific parameters.
In addition to the devigorating effects caused by reduced water and nitrogen
uptake, significant decreases in berry YAN levels in competitive cover cropped systems
are well documented (Larchevêque, Casanova, and Dupuch 1998; Maigre 1997, 2002;
Maigre and Aerny 2000; Spring and Lorenzini 2006; Xi et al. 2010). While the overall
decrease in YAN is primarily explained by increased competition for soil nitrogen, and
reduced uptake due to water availability, it may also be due to the increase in proline
relative to other amino acids. Environmental stressors, including water and heat stress,

9
induce proline accumulation which has been shown to protect proteins and cell
membranes against osmotic damage (Schaller 2005). If the competing cover crop limits
water to the point of inducing stress, then increased berry proline concentrations are
certainly plausible. This contrasts with the results of a cool climate experiment with
adequate soil moisture, where the presence of cover crops improved the relative
composition of amino acids in berries such that the content of assimilable amino acids, as
a percentage of total amino acids, was higher in cover cropped vines compared to the
control; however, total berry nitrogen concentration still decreased (Gouthu et al. 2012).
Insufficient YAN can be detrimental to wine production and will be discussed in section
III.
Leguminous cover crops
The use of leguminous cover crops to overcome nitrogen deficiencies has been
explored in vineyards. Compared to grasses, legumes have a much lower C:N ratio which
enables them to decompose rapidly after incorporation, thereby providing nitrogen to the
vines (Fourie, Louw, and Agenbag 2007). In order for the cover crops to be successful,
tilling in of the legumes must be synchronized with the critical demand period between
active shoot growth and véraison, and the relative biomass of the cover crop must be
large enough to contribute meaningfully to the nitrogen soil pool. This synchronization
will depend on the decomposition rate for the cover crop being used—a value that is
rarely documented in the literature for cover crops conducive to Virginia growing
conditions. Hairy vetch (Vicia villosa subsp. villosa L.) and yellow sweet clover
(Melilotus officinalis (L.) Lam.) were analyzed in a Pacific Northwest vineyard for their

10
potential contribution of nitrogen to four year-old Concord vines during the critical
demand period (Bair, Davenport, and Stevens 2008). Incorporation of either cover crop at
vine bloom appeared to significantly increase soil nitrate levels from bloom through
véraison compared to no nitrogen control treatments. The relative increase in soil
nitrogen was largely dependent on achieving adequate biomass, indicating an urgent need
to improve the methods of cover crop establishment if leguminous cover crops are to be
adopted as a commonplace grape growing practice in Virginia. In some cases, even
substantial biomass may not be fully sufficient to provide comparable nitrogen inputs as
conventional practices, but a study conducted in Egypt reported that when combined with
compost, leguminous cover crops can provide similar levels of nitrogen as synthetic
fertilizers after three years of establishment (Rizk 2012). My study aims to determine if
this is a viable option for Virginia growers.
Simply establishing a strong legume stand may suffice for improving available
soil nitrogen in vineyards, if the established legume exhibits substantial rhizodeposition
of nitrogen (Fustec et al. 2010). Rhizodeposition occurs via decomposition and decay of
nodules and roots cells, or through direct exudation of soluble nitrogen compounds
(namely ammonium and amino acids). Nitrogen derived from rhizodeposition can
account for 7-57% of the mature leguminous plant’s total nitrogen content, and is readily
available to surrounding plants (Fustec et al. 2010). If we consider that some leguminous
species such as white clover can fix upwards of 296 kg N/ha in a pure stand, then the
vital role rhizodeposition may play a role in using leguminous crops as a primary
nitrogen source becomes evident (Ledgard and Steele 1992). Nitrogen fixation has been
reported to increase when legumes are grown in association with non-legumes species,
11
with maximum reported nitrogen fixation values of 682 kg N/ha (Ledgard and Steele
1992). Such findings suggest that establishing legume-grass cover crop stands in
vineyards should be considered as a practice for commercial vineyards.
A Merlot study comparing leguminous cover crops in conjunction with different
methods of incorporation found that vines grown with a green manure mix (bell bean,
field pea, common vetch, barley) disked in the spring had significantly higher petiole
nitrogen concentration compared to vines grown with an annual clover mix (subterranean
clover, bur medic, crimson clover, rose clover) mowed in the spring (Ingels et al. 2005).
This may be explained by the green manure mix reaching a larger biomass and keeping
non-leguminous weed populations lower. The increase in higher petiole nitrogen
concentration was likely due to both the increased biomass available, as well as
incorporation of the mix with disking. While not mentioned in the publication as a
potential cause for biomass disparity, the green manure mix was seeded at a much higher
rate than the annual clover mix (90 ka/ha, and 28 kg/ha respectively), which may have
affected the cover crop establishment. However, the rate may not be the cause, as
suggested by a separate study where low seeding rates of clover mix (4.2 kg/ha) in an
Oregon vineyard provided up to 86 kg N/ha to Pinot noir vines when percent cover crop
establishment reached 80% as estimated by 0.25 meter quadrant plots (Sweet and
Schreiner 2010). In the same study, the clover mix produced increased vine nitrogen
content and berry YAN compared to the clean cultivated vines in the second year of data
collection. This data provides justification for further experimentation with clover mixes
as a method to improve berry YAN.
12
15N-enriched fertilizer studies have been used to assess the percent nitrogen that
cover crops actually contribute to grape-leaf nitrogen concentration. A large range of
values (0.28-25%) have been reported, which can be attributed to many potential
confounding variables that include: whether the study is conducted on young vines with
low nitrogen reserves or old vines that tend to have larger nitrogen reserves; whether the
cover crop is planted in the inter-row or under the trellis; whether fine root growth is
disturbed by tilling; the soil type present; and the cultivar and rootstock in the experiment
(Keller, Kummer, and Vasconcelos 2001; Ovalle et al. 2010; Patrick et al. 2004). Rainfall
also likely plays an important factor as reported by Patrick et al. 2004, where the 0.28%
contribution of legume nitrogen to vine nitrogen concentration occurred during a season
that received 45 mm of rain, which would undoubtedly reduce plant decomposition, and
nitrogen mineralization and uptake.
Legumes can also increase nitrogen availability through nitrogen fixation –
strawberry clover, for example, is capable of providing up to 330kg/ha of nitrogen
annually (Ingels 1998). The amount of nitrogen provided through fixation is dependent
on many variables, including: legume variety, inoculation effectiveness, soil moisture,
temperature, and phosphorous availability (Chaudhary et al. 2008; Madge 2005).
Leguminous cover crops were found to be more effective in a California vineyard at
improving soil water content than native grasses, thereby further improving the potential
for increased soil nitrogen levels via mineralization processes (King and Berry 2005).
Because nitrogen fixation is an extremely energy intensive process, legumes will
preferentially use soil nitrogen if it is available. For this reason, nitrogen applications
made to leguminous cover crops may halt nitrogen fixation (Salvagiotti et al. 2008). The

13
large range of variables that affect nitrogen fixation rates provide ample justification for
incorporating leguminous cover crops to ensure significant nitrogen contributions to the
system.
Effect of cover crops on berry chemistry and wine quality
The effect of cover crops on primary grape chemistry generally depends on the
level of competition between the cover crop and the vine. Systems in which no herbicide
strip is employed and irrigation is unavailable exhibit the most aggressive competition for
limited nutrients and water; competition of systems in which an herbicide strip is present
will heavily depend on the width of the herbicide strip.
Many studies illustrate that cover cropped systems can increase total soluble
solids (TSS) and decrease titratable acidity (TA) of harvested berries (Larchevêque,
Casanova, and Dupuch 1998; Wheeler, Black, and Pickering 2005). The increase in TSS
can likely be attributed to a concentrating effect induced by the reduction in yield. Other
studies indicate cover crops have no affect on TSS, TA, or pH (Ingels et al. 2005; Sweet
and Schreiner 2010). It is important to note that in these studies, less aggressive, inter-
row cropping systems were used, and yield and pruning weights were also unaffected.
There is also data that indicates nominal differences in primary chemistry attributes, but
TSS still increased and TA decreased for complete vineyard floor cropping systems
(Tesic, Keller, and Hutton 2007).
In aggressive systems where vine vigor is decreased, canopy porosity has been
found to increase, enabling greater sun exposure and increased cluster surface
temperatures (Maigre 2001). Price et al. (1995) report that greater exposure to direct

14
sunlight increased total polyphenols, anthocyananins, and flavonols. Yet, other reports
show no significant difference in anthocyanin or total phenolics for cover cropped vines
(Hostetler et al. 2007; Sweet and Schreiner 2010).
Reports on the effect of cover crops on wine quality vary. Off-aromas and loss of
aromas are expected results of fermentations on musts deficient in YAN due to cover
cropping. Schultz and Lohnertz (2003) report that sward-vine competition resulted in
nitrogen deficiencies which contributed to off-flavor development in white German
wines. On a similar note, a Swiss study conducted on Pinot noir vines found that wines
produced from cover cropped treatments contained more aggressive tannins and reduced
aroma potency (Maigre 2002). The increased water and nitrogen stress associated with
cover crops has also been associated with the presence of ortho-aminoacetophenone (O-
AAP) in wines, the compound responsible for atypical aging (Bell and Henschke 2005).
More recent literature suggests that, despite decreases in total berry nitrogen, the
total free amino acid concentration of wine and grape increases in cover cropped vines.
Xi et al. (2011) found that five-year-old Cabernet Sauvignon vines produced wines with a
greater number of aroma compounds when grown with cover crops (such as alfalfa, tall
fescue, and white clover), compared to wines produced from vines grown under clean
tillage. In the same study, wines produced from grapevines grown with cover crops rated
higher for aroma (rating more abundant in floral aroma and sweet and ripened fruit
notes), taste analysis, and harmony in a sensory study, than did wines produced from
grapevines grown in the presence of an herbicide strip.

15
Effects of nitrogen on berry development and fermentation
Importance of nitrogen balance
Nitrogen is an integral component of vine and berry development. Without
nitrogen, vines would be unable to produce the amino acids required for tissue growth or
have the energy necessary for metabolic functions (Keller 2010). Nitrogen is also a
fundamental driver of fermentation success by affecting yeast growth, fermentation
kinetics, and flavor metabolism. While there are many forms of nitrogen present in grape
berries, wine yeasts preferentially metabolize ammonia and primary amino acids
(collectively referred to as the yeast assimilable nitrogen or YAN) during fermentation.
Ultimately, it is the amount of YAN that regulates fermentation processes and wine
production (Bell and Henschke 2005).
Effect of YAN on fermentation success and aroma development
Extremely low or extremely high nitrogen YAN levels contribute to unbalanced
musts and the risk of consequences detrimental to wine quality. Nitrogen requirements
are dependent on the specific yeast strain used, but the culmination of many experiments
has suggested that 140 mg N/L is considered a minimum to complete fermentation. The
relative vigor of fermentations (as defined by sugar consumption per day) is influenced
by YAN, but is also heavily dependent on fermentation conditions and yeast strain (Bell
and Henschke 2005). Data from Ugliano et al. (2009) suggests that musts with YAN
levels above 400 mg N/L are able to finish fermentation up to one week faster than musts
containing 100 mg N/L. Although temperature, pH, sugar, clarification, aeration, and
vitamins all affect production of volatile compounds in wine, there are many studies to

16
suggest that there are significant relationships between aroma compounds and must
nitrogen levels. Most notably, low YAN is associated with an increased production of
volatile sulfur compounds, which include hydrogen sulfide, mercaptans and disulfides—
all of which contribute to rotten egg, cabbage, and onion aromas (Bell and Henschke
2005). There is a direct relationship between YAN and higher alcohol production, a
group of compounds, which impart solvent and fusel-like aromas to wines. When YAN is
less than 200-300 mg N/L, there is a direct relationship between higher alcohol
production and YAN, which becomes inverse at high nitrogen conditions (Vilanova et al.
2012; Vilanova et al. 2007). Studies conducted on both model solutions and wine
solutions determined that 350-450 mg N/L is an ideal range for optimal fatty acid ester
and ethyl ester formation, which impart floral and fruit aromas to wines (Hernández-Orte
et al. 2005; Torrea et al. 2011; Vilanova et al. 2012; Vilanova et al. 2007). However, the
higher end of the range also correlates with drastic increases in ethyl acetate, acetic acid
and volatile acidity; aromas that will surely mask any fruit or floral notes obtained by
higher ester concentrations (Torrea et al. 2011). Bell and Henschke (2005) review further
consequences of high nitrogen in must, which include: increased presence of haze-
causing proteins, higher instances of ethyl carbamate and biogenic amine formation,
increased risk of Brettanomyces spoilage, and higher heat outputs due to increases in
fermentation vigor.
Effect of amino acid composition on fermentation success and aroma development
Many studies focus on how the amino acid composition of juice correlates with
ester development in the final wine, due to the integral part amino acids play in ester

17
development (Bell and Henschke 2005). Such studies have yielded conflicting results,
which can likely be explained by whether the substrate of study was a natural must or
model solution, differences in the amount of juice used, timing of any additions made
(prior to fermentation or after a specific amount of sugar has been consumed), and
specific yeast strain used (Beltran et al. 2005; Garde-Cerdán and Ancín-Azpilicueta 2008;
Hernández-Orte, Cacho, and Ferreira 2002; Hernández-Orte et al. 2005; Miller et al.
2007). Miller et al. (2007) found that in Chardonnay juice, yeast preferentially utilize
ammonium over amino acids, and postulated that under high ammonium availability,
ester formation occurs via the biosynthetic pathway rather than from amino acid
degradation. For example, under additions of the amino acid leucine, the corresponding
ester (isoamyl acetate) did not increase. In cases were DAP was added, utilization of the
leucine in the must decreased, but the production of isoamyl acetate increased. This
contrasts with results previously obtained on both model solutions and Mazuelo (also
known as Carignan) musts, where relative ester formation increased when specific amino
acids were present at higher concentrations (Garde-Cerdán and Ancín-Azpilicueta 2008;
Hernández-Orte, Cacho, and Ferreira 2002). The effect of nitrogen source on ester
development has been found to be dependent on yeast strain in Airen juice where
supplementation with amino acids resulted in statistically similar aroma profiles to those
supplemented with ammonia with one yeast strain, while fermentation with amino acid
supplementation under a different yeast strain increased fruit and floral notes. Moreover,
when musts had sufficient assimilable primary amino acids, further additions did not
increase the concentrations of many esters (Hernández-Orte et al. 2005). This might be
explained by an observation made in supplemented Chardonnay grape juice with both
18
inorganic and amino acid additions: statistical differences were observed between
residual amino acids, suggesting that total concentration of nitrogen, rather than
concentration of individual amino acids, is the primary determinant of amino acid uptake
(Torrea et al. 2011). This study did, however, demonstrate that musts containing a
mixture of inorganic nitrogen and high amino acid additions produced wines with a more
intense fruity profile, favored by the production of ethyl and acetate esters.
Must nitrogen additions Diammonium phosphate (DAP) additions have been widely used to correct
nitrogen deficiencies in grape must, ensure successful fermentations, decrease
fermentation time, and prevent the formation of volatile sulfur compounds. While there is
certainly plenty of evidence indicating DAP additions decrease fermentation time, it
should be noted that musts naturally high in YAN are considered superior to those
additions, in that balanced mixtures of amino acids exhibit enhanced yeast growth. This
is because yeast directly incorporate the amino acids into protein, rather than expensing
energy to synthesize new amino acids (Bell and Henschke 2005). Many studies that have
analyzed the relationships between YAN and aroma compounds have utilized model
solutions or grape juice with a relatively high YAN starting point, which has contributed
to some of the discrepancies in reports. For this reason, further analyses on low YAN
musts should be considered to delineate these specific relationships (Torrea et al. 2011).
Recent literature suggests that DAP additions may not necessarily reduce the
presence of volatile sulfur compounds, despite their widespread use for this purpose. For
Shiraz grape juice supplemented to 250 mg N/L and 400 mg N/ L with two different
yeast strains, supplementation increased final levels of sulfides, disulfides, mercaptans,
19
and mercaptoesters in the finished wines (Ugliano et al. 2009). In a separate study, actual
production of hydrogen sulfide increased with increased YAN during fermentation;
however, residual hydrogen sulfide concentrations were lowest in the low and moderate
YAN Chardonnay musts. This reduction was attributed to a decrease in fermentation
vigor, which can result in less carbon dioxide production and a reduced ability to purge
the volatile compounds from the media (Ugliano, Kolouchova, and Henschke 2011).
These studies raise questions as to whether DAP additions are warranted as a way of
reducing volatile sulfur compounds in wine, and suggest further experimentation
analyzing this relationship with musts naturally high in YAN, such as those obtained
from nitrogen fertilizers in optimally managed vineyards.
Other studies document clear relationships between DAP additions and the
production of ethyl esters, acetate esters, and fatty acid esters (Vilanova et al. 2012;
Vilanova et al. 2007). A study conducted on Albariño grape juice demonstrates that
moderate DAP additions (up to 350 mg N/L) were associated with an increase in the
concentration of glycoside precursors of varietal volatile compounds, ethyl esters, volatile
fatty acids, and higher alcohols. The moderate nitrogen supplementation (to 350mg N/L)
also produced the most favorable intensity of ethyl esters, terpenes, and C13-
norisoprenoids—contributing to fruity and floral aromas—while high supplementation
(450 mg N/L) reduced the concentration of ethyl esters, terpenes, and C13-
norisoprenoids. The study suggests that very high nitrogen availability inhibits release of
free volatile compounds (Vilanova et al. 2012). These results are in close agreement with
other reports indicating fatty acid ester and ethyl ester production are highest when YAN
ranges from 350-450 mg N/L (Torrea et al. 2011; Vilanova et al. 2007). However, these
20
relationships are not concrete, as the results of separate studies have shown many
discrepancies. Such discrepancies may be attributed to differences in starting YAN
concentrations, yeast strain used, and fermentation conditions. For example, Ugliano et
al. (2010) found that DAP additions up to 250 mg N/L resulted in higher reduced
attributes, while additions up to 400 mg N/L resulted in higher red fruit and dark fruit
attributes and decreased yeast, cheese, vegetal, and earth attributes. This contrasts with
the reports of Torrea et al. (2011) where high concentrations of the esters obtained by
increased YAN levels did not result in wines rated highest for fruity and floral attributes.
Rather, nitrogen supplementation to 480 mg N/L produced musts dominated by nail
polish aromas as a result of increased ethyl acetate and acetic acid concentrations, an
outcome that was in agreement with high nitrogen supplementation experiments
(Vilanova et al. 2007).
Factors affecting YAN concentration and amino acid composition in grapes
Individual grape varieties have characteristic amino acid compositions, which
appear to be genetically determined, although moderated by environment and cultural
factors (Huang and Ough 1991; Stines et al. 2000; Stewart 2013). For all V. vinifera
varieties, proline and arginine concentrations are the highest, but some varieties
accumulate much greater concentrations of proline (e.g., Cabernet Sauvignon and Merlot)
while others accumulate greater concentrations of arginine (e.g., Tempranillo). There are
also varieties that show an accumulation of both (e.g., Sauvignon blanc). Proline
accumulators are more likely to have insufficient assimilable nitrogen for fermentation
due to the developmental regulation of proline and arginine concentrations: proline

21
begins to accumulate late in the ripening period (four weeks post-véraison) while arginine
increases pre-véraison and continues to the end of berry maturation, unless proline
accumulation is high, in which case arginine will no longer accumulate. If arginine
accumulation plateaus without having reached a sufficient concentration for fermentation,
the continued increase of proline will not contribute to YAN (Stines et al. 2000). The
timing of this developmental regulation may be an important consideration for nitrogen
fertilization practices seeking to increase YAN levels in proline accumulating varieties.
Rootstock selection also appears to affect assimilable amino acid concentrations.
Own-rooted Chardonnay vines and vines grafted to Schwarzmann and K51-40 had
significantly greater YAN than vines grafted to 140 Ruggeri and 101-14 in an Australian
study. Moreover, vines grafted to K51-40 had a greater concentration of six amino acids
than own-rooted vines (Treeby et al. 1998). Similarly, Cabernet Sauvignon vines grafted
to 110R exhibited greater YAN levels and higher concentrations of seven amino acids
compared to a less vigorous rootstock, 420A. For both rootstocks, juices were higher than
berry extracts in ammonia, but lower in total free amino acid concentration (Lee and
Steenwerth 2011).
Many studies indicate the role sampling protocol plays in accurately determining final
YAN concentrations. Wineries using juice for sampling do not account for skin-derived
YAN and may add too much artificial nitrogen during fermentation. Exhaustive
extraction is more representative for reds and should be done prior to any nitrogen
supplementation to the must to avoid the negative consequences of high nitrogen (Lee
2010).

22
On a molecular level, environmental factors such as drought stress have been
found to increase the expression of many transcripts associated with glutamate and
proline biosynthesis (Deluc et al. 2009). On a whole-plant level, factors affecting vine
nitrogen uptake—rate of soil nitrogen mineralization, soil type, water availability, vine
water potential, and their interactions—will also have a direct affect on final YAN
concentrations. Vineyard nitrogen applications also have a significant effect on berry
nitrogen status and will be considered in greater detail in the next section.
Vineyard Nitrogen Additions
Effects of soil nitrogen applications on berry YAN
Earlier in this review, the flowering through véraison and post-harvest periods
were discussed as the two critical demand periods for vine nitrogen uptake, and
consequently the most efficacious time periods to supply nitrogen. However, these
periods have been determined by conducting leaf tissue analyses, rather than considering
berry YAN or berry yield. The effect of fertilization practices on YAN has yielded
varying results depending on the method, timing, and rate of fertilizer application, but
some generalities persist. The first generality is that fertilization applications made too
early (i.e., around budbreak) contribute to excessive vegetative growth and decreased
berry yield (Linsenmeier, Loos, and Lohnertz 2008; Neilsen et al. 2010). The second
generality is that nitrogen applications made after fruit set, and even after véraison, are
most effective at increasing berry YAN (Linsenmeier, Loos, and Lohnertz 2008). The
third generality is that high fertilization rates may be required to obtain adequate berry
YAN in nitrogen deficient sites, but high fertilization rates heavily favor shoot growth
23
over fruit set (Goldspink 1991; Linsenmeier, Loos, and Lohnertz 2008; Spayd et al.
2000).
While budbreak nitrogen applications were found to be most effective at
incorporating nitrogen into vegetative growth in a Canadian study, bloom fertilization
was superior to budbreak applications for Merlot vines where the goal was to improve
berry yield and reduce canopy density (Neilsen et al. 2010). Rates of 80 kg N/ha were
required for the berries to obtain adequate YAN levels; yet, the effect of fertilization
timing on YAN concentration was not consistent for Cabernet Sauvignon vines, as there
were no differences between budbreak and bloom nitrogen applications applied at the
same rate. Holzapfel and Treeby (2007) observed that Shiraz vines grafted to different
rootstocks responded differently to nitrogen application timing, as well as fertilization
rate. Specifically, greater nitrogen inputs were required to obtain minimal YAN levels for
Teleki 5C compared to Ramsey and Schwarzmann rootstocks. While these disparities
may be due to a difference in site history, this phenomenon justifies experimentation with
multiple varieties for the current Virginia study.
A hydroponic study conducted on Cabernet Sauvignon vines suggests that post-
véraison nitrogen applications are most effective at stimulating berry growth and
achieving adequate YAN (Rodriguez-Lovelle and Gaudillere 2002). The authors suggest
this is due to the increased fruit-sink strength after véraison, but they caution growers
who apply nitrogen solely during this time, warning that as roots become a weaker sink,
their growth will be sacrificed. Failure of root systems to fully develop reduces the
overall nitrogen uptake capacity of vines in future years, resulting in vines that are

24
extremely dependent on nitrogen applications to improve both vine nitrogen status as
well as berry YAN.
Limitations of soil based nitrogen applications include favoring excessive
vegetative growth at the expense of fruit maturation, delayed harvest, increased
susceptibility to pathogens, and increased leaching in vineyards. For drip-irrigated
Riesling vines in Washington State, a minimum of 112 kg N/ha was required for YAN
levels to exceed the recommended minimal range for fermentation success. However,
such a high rate resulted in excessive vine growth, fruit shading, delayed ripening, and
ultimately reduced berry quality (Spayd et al. 2000). Shading is particularity problematic
given its effect on bud fruitfulness and yields the following year. Delayed ripening is also
an important consideration because there are many risks associated with a later harvest,
such as: loss of crop to frost, poor berry quality due to higher rainfall, and increased
instances of disease. Many other fertilization studies have noted the increased sensitivity
of berries to Botrytis cinerea in response to higher nitrogen applications (Eynard 2000;
Martinson 2012). Other berry quality parameters such as Brix, TA, pH, and
anthocyananins have varied considerably in fertilization studies, and appear to be more
heavily dependent on the combination of all cultural practices at the specific vineyard site
(Bell and Henschke 2005).
Effects of foliar nutrient applications on berry YAN
Foliar nitrogen applications have shown great promise in improving amino acid
compositions and wine aroma profiles. Twenty-year-old Sauvignon blanc vines
underwent treatment of various foliar nitrogen application rates with the specific goal of
25
increasing berry YAN and improving aromatic expression in wine. Two foliar
applications made at 10 kg N/ha prior to véraison increased YAN by 60% without
affecting vine vigor or susceptibility to Botrytis cinerea (Lacroux et al. 2008). When the
same application was applied with an addition of 5 kg S/ha YAN levels further increased,
as did the concentration of wine volatile thiols, the compounds responsible for
contributing to varietal aromas in Sauvignon blanc wines. Compared to the no nitrogen
control, soil applications did not contribute to significant differences in YAN levels or
volatile thiol concentration. This work justifies further experimentation with using foliar
applications to improve berry YAN and aromatic expression in other prominent grape
varieties grown in the state of Virginia.
Other studies have also found a synergism between coupled sulfur and nitrogen
applications in crops such as wheat, contributing to increased nitrogen use efficiency
(28%), and the subsequent concentration of cysteine (27%) and methionine (14%)
(Habtegebrial and Singh 2009). In an Argentine wheat study, this observation was
attributed to sulfur additions improving nitrogen use efficiency by increasing nitrogen
recovery from the soil rather than an improved internal efficiency (Salvagiotti et al.
2009). Given the success of both foliar and soil sulfur supplements in routine nitrogen
applications, it would be interesting to test both conditions in one controlled experiment.
In a New York study, foliar nitrogen applications at véraison to Riesling vines
increased the concentrations of all amino acids in juice, while soil nitrogen applications
or the combination of soil and foliar applications increased fewer amino acid
concentrations (Cheng 2010). This suggests that the method, and perhaps timing, of
nitrogen applications does in fact alter final amino acid composition. The potential for
26
increased concentrations of specific amino acids, which may result in increased fruity
aromas, justifies experimentation with vineyard practices that have potential to alter
grape amino acid composition. In the same token, we should be interested in evaluating
practices that may decrease the concentration of specific amino acids. A study conducted
on Monastrell grapes found that the application of six different fungicides all decreased
the concentration of amino acids and ammonium at varying levels (Oliva et al., 2011).
In a study analyzing nitrogen accumulation and cycling, 15N labeled ammonium
nitrate was applied as a broadcast application to Seyval blanc vines at budbreak or at
bloom. Recovery of the nitrogen fertilizer by the vines, determined by the percent of
labeled N of total N present in the vine, was 7.1% and 10.6%, respectively. Recovery of
the nitrogen fertilizer by the inter-row sod was 13.0-20.2% of the total nitrogen present in
the plant (Hanson and Howell 1995). This study demonstrates the significant competition
that can exist between cover crops and their surrounding vines, and justifies
experimentation with foliar-based nitrogen sources that may increase the efficiency of
vine utilization of applied nitrogen sources.
Lasa et al. (2012) assessed the effects of foliar N applications of 10 kg N/ha and
50 kg N/ha applied to Merlot and Sauvignon blanc vines at three time periods – 3 weeks
pre-véraison, véraison, and 3 weeks post-véraison—on grape juice quality; concluding
that the low rate (10 kg N/ha) urea application made post-véraison were more effective at
increasing berry YAN in both varieties. The urea applications in this study contained a
1% 15N tracer, which enabled the determination of how much nitrogen was transferred to
the berries after incorporation by the leaf tissue. The group determined that 17-80% of
nitrogen applied to Merlot and Sauvignon blanc leaves was absorbed by the berries, with

27
maximum translocation occurring as a result of véraison and post-véraison urea
applications. These results were higher than those previously reported, where only 30%
of foliar nitrogen absorbed by grapevine leaves ended up in the berries (Schreiber et al.
2002). The disparity between these studies justifies investigating the ideal timing of foliar
applications for individual cultivars.
Factors affecting efficacy of foliar nutrient applications
High penetration rate is an important prerequisite for effective foliar applications.
(Mengel 2002). Urea has long been selected as a foliar nitrogen application source due to
its ability to readily penetrate the epicuticular wax and the cutin layer of leaves. The
primary limitation of urea is its potential to induce phytotoxicity (Mengel 2002).
There are disparities regarding whether new or old leaves have better nitrogen
uptake. One theory argues that because nitrogen is transported under deficiency
conditions from old leaves to new leaves, old leaves must have a better uptake capacity—
and that old leaves are damaged in such a way that readily provides pathways for applied
solutions (Mengel 2002). A second theory supports improved uptake for apical leaves,
specifically in apples, where absorption has been found to be 32% greater than in basal
leaves (Toselli, Thalheimer, and Tagliavini 2004). This theory seems more likely, as the
greater absorption by young leaves may be explained by their thinner cuticles and
reduced barrier (Boynton, 1954).
Other factors affecting absorption of nutrient solutions include contact angle,
surface wetting, temperature, humidity, vapor pressure, and loss of the spray to the
atmosphere (Boynton 1954). Losses may occur through volatilization, large spray
volumes that result in the liquid dripping off the leaves, and poor sprayer set-up resulting

28
in drift (Boynton 1954). Toselli, Thalheimer, and Tagliavini (2004) postulate that the
spray carrier water volume in urea applications is only significant in the first 48 hours
after application, where larger volumes result in longer wetting periods that favor
absorption. In the following 72 hours, total absorption will reach an equilibrium across
treatments receiving the same concentration at varying application volumes because the
repeated drying and wetting cycles that occur increase cuticle pore size and cuticle
penetration. Moreover, similar studies on apples show that highest uptake of urea in the
first 48 hours occurs when applied in low concentrations (Toselli, Thalheimer, and
Tagliavini 2004). This suggests that multiple applications throughout the season may be
superior to single applications—a strategy that will be tested in my Virginia experiment.
Nitrogen applications in cover cropped systems
While many studies discuss nitrogen limitations in cover cropped systems, to my
knowledge, few studies have attempted to determine the most efficient method for
improving berry YAN in cover-cropped vines. Nonetheless, there are studies that assess
the effects of soil and foliar applications on berry YAN levels, and in some cases, these
studies were conducted on vines experiencing similar stresses brought about by cover
crops (e.g., water stress).
In a permanently grassed twelve-year-old Riesling vineyard, 30% of nitrogen
from foliar applications was partitioned to clusters, which was significantly greater than
the 2% partitioned to berries in response to soil nitrogen applications made at the same
time. In this study, foliar fertilization was combined with soil applications (0 or 60 kg
N/ha). When only foliar applications were made, berry YAN increased 30%, but when

29
foliar application were combined with soil applications of 60 kg N/ha, YAN levels
increased 100%. However, YAN levels in this study were still far below the 140mg N/L
minimum requirement, which warrants exploring additional nitrogen management
practices, such as leguminous cover crops to achieve adequate berry YAN (Schreiber et
al. 2002).
For Sauvignon blanc vines experiencing mild water deficit and previous nitrogen
deficiency, soil nitrogen applications at budbreak (30 or 60 kg N/ha) were combined with
foliar nitrogen applications at véraison (2.5 or 5 kg N/ha). The foliar supplementation of
5 kg N/ha increased YAN levels across all treatments, but increased YAN by 143% under
the highest fertilization treatment (60 kg N to soil + 5 kg N foliar). The authors of this
study concluded that foliar supplementation was an appropriate solution for water-
stressed vines late in the season when nitrogen uptake is low (Jreij et al. 2009). The lack
of literature on fertilization management in cover cropped systems, and specifically
regarding adaption of a solely foliar-based program to compensate for nitrogen
competition, justifies experimentation with optimizing fertilization practices in cover
cropped Virginia vineyards.

30
Materials and Methods
Research objectives While many studies discuss nitrogen limitations in cover cropped systems, few
studies have attempted to determine the most efficient method for improving vine
nitrogen and berry YAN in these cases. The primary objective of this study was to
determine the most efficient method and optimal time for annual nitrogen applications,
such that cover crop growth is maintained for known benefits, while adequate vine
nitrogen and final berry YAN are achieved. This research explores differences in nitrogen
contributions from both foliar nitrogen applications and sustainable alternatives, such as
composting and utilizing leguminous cover crops.
An additional objective of this study is to determine if different fertilization
methods in cover cropped vineyards affect the amino acid composition of mature berries,
and to consider how that may affect the sensory component of the produced wines.
Site details Research was conducted at three experimental sites in this study. The first site
was located at Glen Manor Vineyards (GMV) near Front Royal, VA. The Sauvignon
blanc vines were planted in 1995 and trellised to an open Lyre system. Soil is a
Myersville-Catoctin silt loam that is considered deep and well drained. Located
approximately 335 meters above sea level, the vineyard rows run north/south on a 15%
slope with an inter row spacing of 3.7 meters and an inter-planting spacing of 2.4 m. The
vineyard floor has consisted of natural vegetation, predominately tall fescue (Festuca
arundinacea) in the inter-row and creeping red fescue (Festuca rubra) in the intra-row,

31
for the past six years, maintained by mowing. This site was selected because it exhibits
low nitrogen status in the vines and in the must.
The second site was located at Chateau O’Brien at Northpoint (CON) in
Markham, VA. The Merlot vines were planted in 2004 and trellised to a VSP system. Soil
is a Tankerville loam. Located approximately 200 meters above sea level, the vineyard
rows run north/south, on a 5 % slope, with an inter-row spacing of 2.1 m and an inter-
planting spacing of 1.2 m. The vineyard floor has permanent row middle fescue, with
intra-row consisting of native vegetation, maintained with a hand-held line trimmer. This
site was selected due to chronically low nitrogen levels in the vines and in the must and
chronically inferior vine capacity. It is also the platform for exploring sustainable
alternatives to conventional fertilizer practices.
The third site was located at the Virginia Tech Alson H. Smith Jr. Agricultural
Research and Extension Center (AREC) in Winchester, VA. The Petit Manseng vines
were planted in 2007 and trellised to a VSP system. Soil was a Frederick-Poplimento
sandy loam. Located approximately 300 meters above sea level, the rows run
northeast/southwest on a 2% slope with an inter-row spacing of 3 meters and an inter-
planting spacing of 1.5 meters. Inter-rows consist of a mixed sward of tall fescue
(Festuca arundinacea) and orchard grass (Dactylis glomerata), with under-trellis cover
crop consisting of creeping red fescue infested with native weed vegetation (primarily
Trifolium arvense L. and Medicago lupulina L.), maintained by mowing. This site was
selected to evaluate the relative difference in nitrogen status for cover cropped panels
compared to herbicide panels, and to extend my research on foliar nitrogen applications.

32
Explanation of treatments Nitrogen fertilizer treatment was the sole nutrient factor evaluated in this study, at
three different vineyard locations.
The experiment was first implemented in 2010 at GMV where four treatments
were evaluated in a randomized complete block experimental design. Experimental units
included three-vine panels. The following treatments were applied to cover cropped
vines: a control treatment that received no nitrogen (Control-GMV), a low soil rate of
30kg N/ha calcium nitrate at bloom (Low soil-GMV), a high soil rate of 30 kg N /ha of
calcium nitrate at bloom and an additional 30 kg N /ha calcium nitrate six weeks after
bloom (High soil-GMV), and a foliar nitrogen treatment of 40 kg N/ha of urea spread
over multiple applications, beginning at bloom and ending at véraison (Foliar-GMV).
Between 2011 and 2013, the number of applications increased, from 5 to 7 to 9
respectively, to reduce instances of phytotoxicity and enable more efficient N absorption.
Due to a miscalculation of plot area, nitrogen treatments were under-applied by 33.3% in
2011; however, this error was corrected for in 2012 and 2013.
In January 2012, a second research plot was implemented at CON where eight
treatments were evaluated in a randomized complete block experimental design.
Experimental units included six-vine panels. The following treatments were applied to
cover cropped vines: a control treatment that received no nitrogen (Control-CON), a low
rate compost treatment of 33.5 kg N/ha in the first year (Low compost), a high compost
treatment of 67 kg N/ha in the first year (High compost), a combination of the low rate
compost treatment with clover as the planted cover crop (Low compost+ clover), a
combination of the high rate compost treatment with clover as the planted cover crop

33
(High compost + clover), a low soil rate of 15 kg N/ha of calcium nitrate at bloom and an
additional 15 kg N/ha of calcium nitrate six weeks after bloom (Low soil-CON), a high
soil rate of 30 kg N/ha of calcium nitrate at bloom and an additional 30 kg N/ha of
calcium nitrate six weeks after bloom (High soil-CON), and a low soil rate of 30 kg N/ha
of calcium nitrate post-harvest (Post-harvest). In 2012, Merlot vines exhibited
phosphorous deficiency, which was corrected for with 112 kg/ha triple super phosphate
(P2O5) application made to all panels. P2O5 was selected because it contains no nitrogen
that could confound treatment effects. The compost used in this study was sourced from
Cow Pie Compost (Midland, VA) and comprised primarily cow manure and wood chips.
A compost sample was sent to A&L Great Lakes Laboratories, Inc. (Fort Wayne, IN) for
a full analysis to enable the calculation of 33.5 kg N/ha and 67 kg N/ha compost
treatments in this study. In 2012, clover plots were roto-tilled to 45.7 cm soil depth on
each side of the panels. Red clover (Trifolium pratense) was then sown at a rate of 22.4
kg/ha and raked in. Due to poor germination in 2012, the sowing method was modified in
2013. Clover panels received two applications of 1% TouchDown (glyphosate) in early
spring. At the time of sowing, panels received double the suggested forage rate of red
clover (Trifolium pratense; 35.9 kg/ha) and of crimson clover (Trifolium incarnatum;
67.3 kg/ha) and the seed was raked in to a depth of 0.64cm. Clover was mowed to 7.6cm
and raked to evenly distribute the residue under the trellis two weeks post-bloom in 2013.
In the summer of 2012 a third research plot was implemented at AREC where
four treatments were evaluated in a randomized design. Blocking was not an option due
to the limited number of available panels that have been continuously maintained with an
herbicide strip. Experimental units included five-vine panels and were replicated five
34
times. All units received a baseline of 10 kg N/ha as calcium nitrate at bloom in 2012 and
in 2013, as part of annual vineyard management routine. The treatments included: a cover
crop control treatment with no additional nitrogen (CC-control), an herbicide control
treatment whereby the panels were maintained with an herbicide strip and received no
additional nitrogen (Herbicide-control), a pre-véraison foliar treatment to cover cropped
vines of 5kg N/ha as foliar urea 2 weeks pre-véraison followed by an additional 5kg N/ha
as foliar urea 1 week pre-véraison (Pre-véraison foliar), a post-véraison foliar treatment
to cover cropped vines of 5kg N/ha as foliar urea 1 week post-véraison followed by an
additional 5kg N/ha as foliar urea 2 weeks post-véraison (Post-véraison foliar).
Temperature and rainfall Weather data was logged daily using an ET106 weather station (Campbell
Scientific, Inc., Logan, UT) on site at AREC in 2012 and 2013. Within weather data was
not available for GMV or CON.
Plant tissue analysis GMV: Leaf petioles were collected at bloom and véraison and analyzed for
nutrient levels in 2011, 2012, and 2013. Thirty petioles per panel (15 per side) were
collected. Leaf blades were collected at véraison in 2011 and 2013. Ten blades per panel
(5 per side) were collected. Petioles and blades were collected opposite an inflorescence
at bloom and from the first fully expanded leaf at véraison, and triple rinsed in tap water
prior to bagging. Samples were oven dried (60˚C) and sent to Pennsylvania State
University’s Agricultural Analytical Service’s Laboratory (University Park, PA) for
analysis of essential mineral nutrients.

35
CON: Baseline leaf petiole samples were collected at the time of experiment
implementation (bloom) in 2012, and analyzed for nutrient levels. 80 petioles were
collected for each block sample, whereby 10 petioles were collected from each
experimental unit. Leaf petioles were collected at véraison in 2012 and 2013, and at
bloom in 2013 and analyzed for nutrient levels. Due to a limited number of canopy leaves
at véraison in 2012, only 20 petioles were taken from each experimental unit. Petioles
from individual experimental units were consolidated into 50 petiole samples by taking
the collected petioles from 2.5 experimental units to produce two replicates from each
experimental treatment. Thirty petioles per panel (15 per side) were collected at both
sampling times in 2013. Petioles and blades were collected opposite an inflorescence at
bloom and from the first fully expanded leaf at véraison and triple rinsed in tap water
prior to bagging. Samples were oven dried (60˚C) and sent to Pennsylvania State
University’s Agricultural Analytical Service’s Laboratory (University Park, PA) for
analysis of essential mineral nutrients.
AREC: Baseline leaf petiole samples were collected at the time of experiment
implementation (post-bloom) in 2012 and analyzed for nutrient levels. 100 total petioles
were collected from all cover cropped experimental units and 100 total petioles were
collected from experimental units with a maintained herbicide strip. Leaf petioles were
collected at bloom and véraison in 2013. Sixty petioles (30 petioles per side) were
collected opposite an inflorescence at bloom and from the first fully expanded leaf at
véraison, and triple rinsed in tap water prior to bagging. Samples were oven dried (60˚C)
and sent to Pennsylvania State University’s Agricultural Analytical Service’s Laboratory
(University Park, PA) for analysis of essential mineral nutrients.

36
Soil nutrient analysis
Soil samples were collected in 2011, 2012, and 2013 at GMV, and 2012 and 2013
at CON to benchmark soil organic matter (OM), cation exchange capacity (CEC), and
plant available nutrient levels. Two subsamples were collected from each block.
Subsamples were a composite of four 25cm deep soil cores with the top 5cm of soil
discarded, collected with a handheld augur. Samples were only collected in 2013 at
AREC. Due to the lack of blocking, two 25cm cores with the top 5cm discarded were
collected from each experimental unit. Samples submitted consisted of a composite of
four samples in relative proximity to each other in the experimental design. Samples were
sent to Virginia Tech’s Soil Testing Lab (Blacksburg, VA) for analysis.
Chlorophyll content index
A handheld chlorophyll meter (CCM-200 plus, Apogee Instruments, Logan, UT)
was used to record the chlorophyll content index (CCI) by measuring the ratio of
radiation transmitted through a 0.71 cm2 segment of the leaf at 940nm and 660nm. In
2012, one CCI reading was taken from two leaves per vine, roughly located at the 7th
node, at véraison. In 2013, individual leaves were tagged at bloom on representative
vines from each experimental unit at all sites. At GMV, eight leaves located between the
5-8th node positions were tagged per vine and two CCI measurements were recorded per
leaf post- bloom, véraison, post-véraison and harvest. At CON, five leaves located
between the 5th-8th node position were tagged per vine and two CCI measurements were
recorded per leaf post-bloom, véraison, and post-véraison. Due to suspected raccoon
feeding, harvest at CON occurred very early in the season and a pre-harvest reading was
not attained. At AREC, five leaves located between the 5th and 8th node position were

37
tagged per vine and two CCI measurements per leaf were recorded post-bloom, véraison,
post-harvest, and harvest.
Canopy architecture and fruit exposure The Point Quadrat Analysis (PQA), developed by Smart and Robinson (1991),
was used to provide an assessment of canopy density. To conduct the PQA for this study,
a measuring tape was tied to the end posts of each treatment panel at the center of the
fruiting zone. Canopy insertions were made at 30cm intervals with a thin metal probe
directly below the measuring tape, resulting in approximately 24 insertions per treatment
replicate. For each insertion, data was recorded as the probe came in contact with leaves,
clusters, or “gaps.” In this study, an Enhanced Point Quadrat Analysis (EPQA) was
performed (Meyers and Vanden Heuvel, 2008) to include the characterization of fruit
exposure to sunlight. Photosynthetic photon flux density (PPFD) was recorded at solar
noon on cloudless days during véraison with an AccuPAR ceptometer (AccuPAR80,
Decagon Devices, Inc., Pullman, WA). Before and after taking the canopy measurements
for each panel, an unobstructed ambient PPFD reading was taken. The ceptometer was
placed within the fruiting zone, such that it lay parallel to the cordon, and the PPFD was
recorded on a per vine basis. A vertical, east, and west measurement was recorded and
averaged. Data were analyzed with EPQA software (Meyers and Vanden-Heuvel 2008).
Primary chemistry and yeast assimilable nitrogen (YAN) of mature fruit In 2011, berries were collected from GMV at different sampling dates. Fifty
berries were collected from the west side of the canopy approximately 10 days earlier
than the 50 berries collected from the east side of the canopy. Both sample sets were
38
analyzed for primary fruit chemistry within 24 hours of collection. At all sites in 2012, 60
berries were collected per experimental unit at harvest and then frozen for future analysis.
Prior to analysis, samples were thawed in a warm water bath. At all sites in 2013, 100
berries were collected per experimental unit at harvest and analyzed for primary fruit
chemistry within 48 hours. In all years, juice samples were obtained by hand-pressing
fresh (non-frozen) berry samples such that full maceration was achieved and seed
breakage avoided. Fifteen milliliters of the juice was poured into a test tube and
centrifuged for 5 minutes at 4,500 rpm. One milliliter was allocated to a 96-well plate and
sent to the Virginia Tech Enology Service Lab for a yeast assimilable nitrogen (YAN)
analysis. In 2012 and 2013, 2mL were allocated for amino acid analysis (see: “UPLC
analysis of mature fruit”). Juice pH was measured directly in the test tube with an Orion 3
Star pH meter (Thermo Fisher Scientific, Beverly, MA). Soluble solids (˚Brix) were
measured with a digital refractometer (Pocket PAL-1, ATAGO USA, Inc., Bellevue,
WA). Titratable acidity (TA) was measured using an automatic titrator (848 Titrino Plus,
Metrohm, Herisau, Switzerland) with 0.1 N NaOH to an endpoint detection of pH 8.2 in
2012 and 2013.
UPLC analysis of mature fruit
AccQFluor reagent Kit (Waters Corporation, Milford, MA, USA) was used for
the UPLC analysis and the derivation was conducted according to the manufacturer’s
protocol. The standard 2.5 mM amino acid solution containing hydrochloric acid and the
following amino acids: His, Ser, Arg, Gly, Asp, Glu, Thr, Ala, Pro, Cys Lys, Tyr, Met,
Val, Ile, Leu, and Phe was obtained from Waters Corporation. Standards for 2.5mM Gln
and Asp were prepared and added to the standard solution prior to analysis. In 2012 and
39
2013, 20 μL of the standard were mixed with 80 μL of AccQTag Ultra borate buffer (pH
8.8), and 20 μL of the AccQTag Ultra reagent (containing 6-acetamido-4-hydroxy-2-
methyl quinolone) previously diluted in 1.0mL of AccQTag Ultra reagent diluent. The
mixture was vortexed and the reaction was allowed to proceed in a heating block at 55°C
for 10 minutes. Juice samples were prepared as described above and then diluted 1:8 with
water. In 2012, juice samples were prepared in the same way, with the standard mix
being substituted by diluted juice. In 2013, sample reactions were quartered, such that 5
μL of wine were mixed with 20 μL of the AccQTag Ultra borate buffer and 5 μL of the
diluted AccQTag Ultra reagent.
In 2012 and 2013, the UPLC analysis was performed on a Waters AccQ Tag TM
Ultra C18 column (2.1 mm x 100 mm, 5 microm). Water/acetonitrile (95:5) was used as
the weak needle wash solvent, and water/acetonitrile (5:95) were used as the strong
needle was solvent. The derivatives were eluted with the specified dilutions of Waters
AccQTag Ultra Eluent A and Waters AccQTag Eluent B at a flow rate of 0.7mL per
minute (Aubin et al., 2007). The column heater was set to 55°C. Wavelength detection
occurred at 260nm. The system was controlled and data were collected using Empower 2
Software (Waters Corporation, Milford, MA, USA).
Components of yield
GMV: Crop yield data were collected at harvest in 2011, 2012, and 2013. Fruit
mass and number of clusters were recorded on a per-vine basis, and used to calculate the
average cluster weight. Individual berry weights were determined in 2011 by weighing
the berry samples used for primary fruit chemistry analysis and dividing by the sample
size.

40
CON: Crop yield data were collected at harvest in 2012 and 2013. Yields in both
years were extremely small due to the culmination of poor fruit set, frost damage,
disease, and raccoon and bird herbivory. In 2012, fruit mass and number of clusters were
recorded on a per-panel basis. The number of healthy vines producing fruit was recorded,
and used to estimate the average yield per vine. Average cluster weights were estimated
by dividing the total yield by the total number of clusters. In 2013, raccoon damage was
too severe in experimental units to record precise yield data. Projected yield was
calculated by taking the average cluster weight—as determined by sampling and
weighing 100 representative, undamaged clusters in triplicate—and multiplying it by the
total number of clusters on the vine, inclusive of completely bare rachises, at harvest.
Individual berry weights were determined by weighing the berry samples used for
primary fruit chemistry analysis and dividing by the sample size.
AREC: Crop yield data were collected at harvest in 2012, and 2013. Fruit mass
and number of clusters were recorded on a per-vine basis, and used to calculate the
average cluster weight. Individual berry weights were determined by weighing the berry
samples used for primary fruit chemistry analysis and dividing by the sample size.
Pruning weights Vine pruning weights were recorded by vine each winter at GMV and AREC.
Vine pruning weights were recorded by panel at CON due to the small vine size at the
site.

41
Data analysis GMV: Data were analyzed using JMP version 11 (SAS; Cary, NC). Two-way
analysis of variance (ANOVA) was computed for the following response variables:
petiole nutrients, primary fruit chemistry and YAN, components of yield, pruning
weights, EPQA parameters, and individual amino acid concentrations. Model effects
tested were treatment and block. Their interaction could not be tested due to insufficient
degrees of freedom. Differences of least square means were analyzed using Tukey’s HSD
test. All tests evaluated the responses for significance at the 95% confidence level.
CON: Data were analyzed using JMP version 11 (SAS; Cary, NC). Two-way
analysis of variance (ANOVA) was computed for the following data obtained: plant
nutrients, primary fruit chemistry and YAN, components of yield, pruning weights,
EPQA parameters, and individual amino acid concentrations. Model effects tested were
treatment and block. Their interaction could not be tested due to insufficient degrees of
freedom. Differences of least square means were analyzed using Tukey’s HSD test. All
tests evaluated the responses for significance at the 95% confidence level.
AREC: Data were analyzed using JMP version 11 (SAS; Cary, NC). One-way
analysis of variance (ANOVA) was computed for the completely randomized design
where the following response varaibles were analyzed: plant nutrients, primary fruit
chemistry and YAN, components of yield, pruning weights, EPQA parameters, and
individual amino acid concentrations. Differences of least square means were analyzed
using Tukey’s HSD test. All tests evaluated the responses for significance at the 95%
confidence level.
All sites: A univariate repeated measures ANOVA was conducted on averaged

42
2013 CCI readings (two readings per leaf at each time point) from all sites to test the
effect of treatment over time. In all cases the sphericity test chi-square was not
significant, and therefore the unadjusted univariate F tests were used. Time was the only
within subject variable modeled, and treatment was the only between subject variable
modeled. The univarate approach was selected due to occasional missing CCI values (i.e.,
if the tag blew away or couldn’t be located), for which the multivariate analysis would
exclude all non-missing data values for those individuals.
Results
Temperature and rainfall The 2012 and 2013 seasons had comparable mean July temperatures of 24.91Co
and 23.65Co respectively (Table 1) that approximated the historical average of 23.67Co
(Wolf et al. 2008). The accumulated growing degree days (GDD) at the end of October in
2012 were 119 GDD higher than in 2013, indicating 2012 was a warmer season (Table
1). The cumulative rainfall during the active growing season was 165.35mm greater in
2012 than in 2013 (Table 1).
Table 1. Temperature and rainfall data for AREC (Winchester, VA) experimental vineyard site 2011-2013.
Heat summation(10 Co base)
Precipitation (mm)
Year GMVa harvest
date
CONb harvest
date
AREC harvest
date
Mean July temperature
(Co)
Apr-Oct inclusive
Apr-Oct inclusive
Jan-Dec inclusive
2011 3-Sept n/a n/a 25.37 2019 645.65 902.96 2012 21-Aug 1-Oct 14-Sept 24.91 1941 785.15 972.85 2013 9-Sept 25-Sept 21-Oct 23.65 1820 619.80 932.98
abNo official weather station serves GMV or CON therefore weather data from AREC (47.5km from GMV; 52km from CON) is listed for these sites.

43
Plant tissue analysis GMV: Nitrogen concentration in petioles was increased by the high calcium
nitrate rate (High soil-GMV) at véraison in 2011 and 2012, and by foliar fertilization
(Foliar-GMV) at véraison in 2011 (Table 2). Nitrogen concentration in blades was
increased by the high calcium nitrate rate (High soil-GMV) and foliar fertilization
(Foliar-GMV) at véraison 2013 (Table 2). Phosphorous concentration in petioles was
reduced by all fertilization treatments at véraison in 2012 and 2013 and at bloom in 2013
(Table 2). Potassium concentration was reduced in petioles at véraison in 2012 and 2013,
bloom 2013, and in blades at véraison in 2013 by the high calcium nitrate rate (High soil-
GMV) (Table 2). Sulfur concentration was reduced by the high calcium nitrate rate (High
soil-GMV) at véraison in 2012 and 2013, and in bloom 2013 (Table 2).
CON: Both clover treatments (Clover + low compost and clover+high compost)
increased petiole nitrogen concentration and decreased calcium concentration at bloom
2013 (Table 4). Phosphorous concentration in petioles was decreased by both clover
treatments (Clover + low compost and Clover + high compost) at bloom 2012 and
véraison 2013 (Table 4). Potassium concentration in petioles was unaffected by all
treatments. Magnesium concentration in petioles was decreased by the two compost
treatments (Low compost and High compost) and increased by the high calcium nitrate
rate (High soil-CON) treatment at véraison 2013.
AREC: Nitrogen and phosphorous concentrations in petioles from vines grown in
the presence of an herbicide strip were consistently the greatest (Herbicide control)
(Table 6). Magnesium concentration in petioles from vines grown in the presence of an
herbicide strip was consistently the lowest (Herbicide control) (Table 7).

44
Table 2. GMV: Treatment effect on percent macronutrient composition of Sauvignon blanc petioles and blades at bloom and véraison in 2011-2013. Treatmentab N % P % K % Ca % Mg % S% Tissuec P B P B P B P B P B P B
Bloom 2011
0.88 2.87 0.50 0.22 4.87 1.18 1.71 1.85 0.67 0.33 0.26 0.51
Vér
aiso
n
2011
Significanced 0.0112 ns ns ns ns ns ns ns 0.0173 ns ns ns Control 0.43b 2.50 0.21 0.17 4.58 1.45 1.13 1.48 0.53b 0.31 0.15 0.27 Low soil 0.47ab 2.53 0.20 0.18 4.62 1.43 1.14 1.60 0.55ab 0.31 0.15 0.27 High soil 0.48a 2.59 0.18 0.18 4.27 1.38 1.12 1.50 0.59a 0.32 0.14 0.26 Foliar 0.48a 2.54 0.19 0.18 4.21 1.33 1.12 1.57 0.59a 0.31 0.15 0.27
Blo
om
2012
Significance ns ns ns ns ns ns ns ns ns 0.0143 ns ns Control 0.89 2.56 0.46 0.23 3.47 1.24 1.51 1.88 0.51 0.32ab 0.24 0.29 Low soil 0.85 2.62 0.48 0.22 3.32 1.17 1.63 1.91 0.49 0.33a 0.26 0.28 High soil 0.86 2.52 0.44 0.22 3.42 1.22 1.50 1.73 0.51 0.31b 0.25 0.29 Foliar 0.89 2.63 0.41 0.22 3.35 1.22 1.51 1.80 0.51 0.32ab 0.27 0.29
Vér
aiso
n
2012
e
Significance 0.0138 ns 0.0475 ns ns 0.0110 Control 0.81b 0.37 4.40a 1.01 0.60 0.13a Low soil 0.91ab 0.33 3.96ab 1.00 0.63 0.12ab High soil 0.94a 0.31 3.85b 1.03 0.69 0.10b Foliar 0.84ab 0.31 4.11ab 0.98 0.60 0.12ab
Blo
om
2013
d
Significance ns <.0001 <.0001 ns 0.0045 0.0090 Control 0.82 0.62a 3.14a 1.26 0.43b 0.22a Low soil 0.80 0.39c 2.06bc 1.25 0.45ab 0.20ab High soil 0.86 0.26d 1.75c 1.17 0.52a 0.18b Foliar 0.81 0.51b 2.56b 1.22 0.43b 0.20ab
Vér
aiso
n
2013
Significance ns 0.0005 <.0001 ns 0.0194 0.0021 ns ns <.0001 ns <.0001 ns Control 0.52 2.52b 0.49a 0.22 4.26a 1.66a 1.19 1.61 0.51c 0.30 0.21a 0.33 Low soil 0.53 2.58b 0.18b 0.21 3.83ab 1.59ab 1.22 1.73 0.60b 0.30 0.18b 0.32 High soil 0.55 2.72a 0.15b 0.21 3.42b 1.50b 1.20 1.74 0.73a .032 0.16c 0.30 Foliar 0.52 2.72a 0.24b 0.21 3.70ab 1.59ab 1.18 1.51 0.57bc .028 0.18b 0.29
a. Control= no nitrogen; Low soil= 30kg N/ha of calcium nitrate at bloom; High soil= 30kg N/ha of calcium nitrate at bloom + 30kg N/ha of calcium nitrate 6 weeks post-bloom; Foliar= 40 kg N/ha of urea applied evenly in roughly 7 applications between bloom and véraison. b. Separation of means using Tukey’s HSD (α=0.05). c. P= petiole; B= blade. d. Significance of treatment effects on response variables using two-way ANOVA (p>F; ns= not significant). e. Blade samples were not taken at véraison in 2012 or at bloom in 2013.
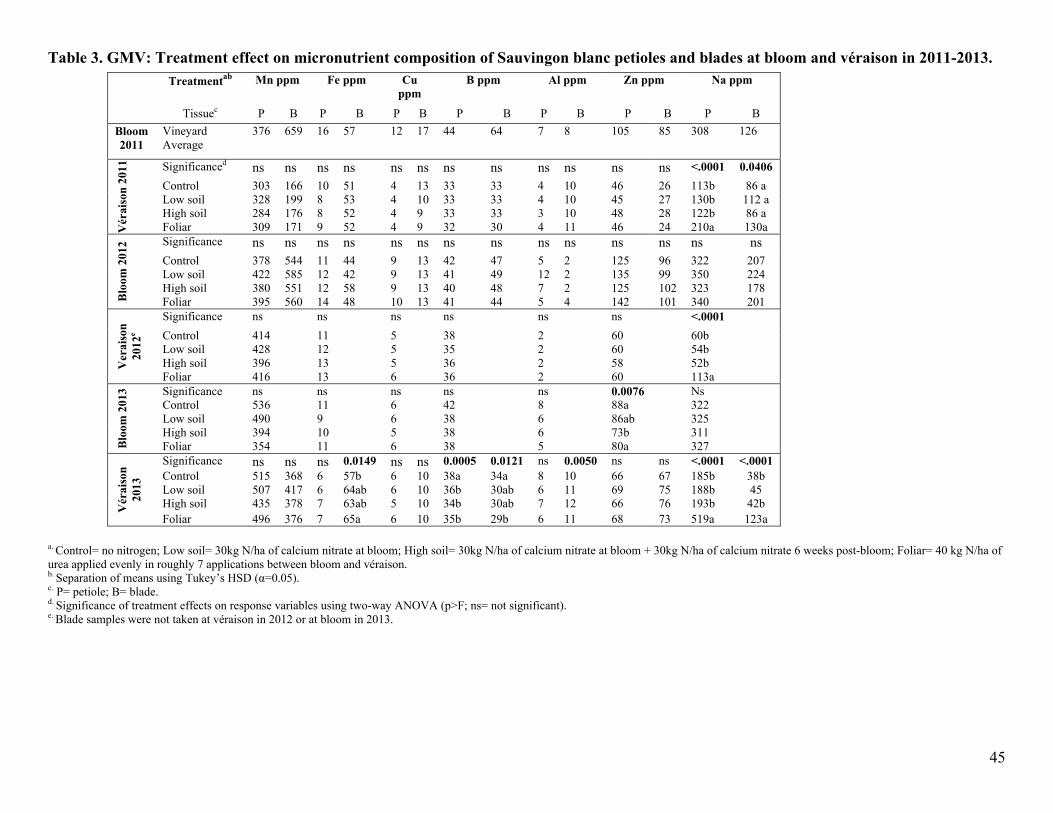
45
Table 3. GMV: Treatment effect on micronutrient composition of Sauvingon blanc petioles and blades at bloom and véraison in 2011-2013. a. Control= no nitrogen; Low soil= 30kg N/ha of calcium nitrate at bloom; High soil= 30kg N/ha of calcium nitrate at bloom + 30kg N/ha of calcium nitrate 6 weeks post-bloom; Foliar= 40 kg N/ha of urea applied evenly in roughly 7 applications between bloom and véraison. b. Separation of means using Tukey’s HSD (α=0.05). c. P= petiole; B= blade. d. Significance of treatment effects on response variables using two-way ANOVA (p>F; ns= not significant). e. Blade samples were not taken at véraison in 2012 or at bloom in 2013.
Treatmentab Mn ppm Fe ppm Cu ppm
B ppm Al ppm Zn ppm Na ppm
Tissuec P B P B P B P B P B P B P B
Bloom 2011
Vineyard Average
376 659 16 57 12 17 44 64 7 8 105 85 308 126 V
érai
son
201
1 Significanced ns ns ns ns ns ns ns ns ns ns ns ns <.0001 0.0406
Control 303 166 10 51 4 13 33 33 4 10 46 26 113b 86 a Low soil 328 199 8 53 4 10 33 33 4 10 45 27 130b 112 a High soil 284 176 8 52 4 9 33 33 3 10 48 28 122b 86 a Foliar 309 171 9 52 4 9 32 30 4 11 46 24 210a 130a
Blo
om 2
012 Significance ns ns ns ns ns ns ns ns ns ns ns ns ns ns
Control 378 544 11 44 9 13 42 47 5 2 125 96 322 207 Low soil 422 585 12 42 9 13 41 49 12 2 135 99 350 224 High soil 380 551 12 58 9 13 40 48 7 2 125 102 323 178 Foliar 395 560 14 48 10 13 41 44 5 4 142 101 340 201
Ver
aiso
n 20
12e
Significance ns ns ns ns ns ns <.0001
Control 414 11 5 38 2 60 60b Low soil 428 12 5 35 2 60 54b High soil 396 13 5 36 2 58 52b Foliar 416 13 6 36 2 60 113a
Blo
om 2
013 Significance ns ns ns ns ns 0.0076 Ns
Control 536 11 6 42 8 88a 322 Low soil 490 9 6 38 6 86ab 325 High soil 394 10 5 38 6 73b 311 Foliar 354 11 6 38 5 80a 327
Vér
aiso
n 20
13
Significance ns ns ns 0.0149 ns ns 0.0005 0.0121 ns 0.0050 ns ns <.0001 <.0001 Control 515 368 6 57b 6 10 38a 34a 8 10 66 67 185b 38b Low soil 507 417 6 64ab 6 10 36b 30ab 6 11 69 75 188b 45 High soil 435 378 7 63ab 5 10 34b 30ab 7 12 66 76 193b 42b Foliar 496 376 7 65a 6 10 35b 29b 6 11 68 73 519a 123a

46
Table 4. CON: 2012 and 2013 Nitrogen treatment effect on percent macronutrient composition of Merlot petioles at bloom and véraison in 2012-2013. Treatmentab N % P % K % Ca % Mg % S %
Bloom 2012
Vineyard Average 1.06 0.16 4.74 1.48 0.44 0.48
Vér
aiso
n 20
12
Significance c ns ns ns ns ns ns Control 0.74 0.16 5.20 1.22 0.30 0.28 Low compost 0.75 0.16 5.40 1.14 0.28 0.28 High compost 0.75 0.14 5.72 1.16 0.26 0.32 Clover + low compost 0.74 0.14 6.22 1.19 0.29 0.34 Clover + high compost 0.72 0.14 5.97 1.19 0.29 0.32 Low soil 0.77 0.15 5.42 1.21 0.33 0.31 High soil 0.82 0.12 6.25 1.19 0.33 0.30 Post harvest 0.77 0.14 5.90 1.18 0.29 0.32
Blo
om 2
013
Significance <.0001 0.0001 ns 0.0209 ns
0.0044
Control 0.86c 0.33a 5.17 1.25ab 0.29 0.35abc Low compost 0.96bc 0.41a 4.45 1.13ab 0.29 0.35bc High compost 0.88c 0.38a 4.46 1.17ab 0.31 0.31c Clover + low compost 1.16ab 0.14b 4.20 1.10ab 0.37 0.39ab Clover + high compost 1.23a 0.14b 4.59 1.08b 0.34 0.42a Low soil 0.97bc 0.37a 4.96 1.23ab 0.34 0.37abc High soil 0.92bc 0.28ab 4.69 1.25ab 0.37 0.37abc
Post-harvest 0.93bc 0.30ab 4.25 1.34a 0.42 0.36abc
Vér
aiso
n 20
13
Significance ns <.0001 ns ns 0.0085 ns Control 0.63 0.40abc 4.99 1.26 0.31ab 0.26 Low compost 0.63 0.50a 5.34 1.21 0.28b 0.27 High compost 0.62 0.47ab 5.34 1.17 0.28b 0.27 Clover + low compost 0.60 0.19d 5.48 1.15 0.36ab 0.27 Clover + high compost 0.62 0.21d 5.36 1.17 0.37ab 0.27 Low soil 0.63 0.28cd 5.36 1.24 0.35ab 0.25 High soil 0.67 0.18d 5.49 1.19 0.40a 0.26 Post-harvest 0.61 0.32bcd 5.51 1.19 0.32ab 0.28
a. Control= no nitrogen; Low compost= 33.5 kg N/ha applied as compost at bloom in 2012; High compost= 67 kg N/ha applied as compost at bloom in 2012; Clover + low compost= 33.5 kg N/ha applied as compost at bloom in 2012 + early season establishment of red clover in 2012, and red clover+crimson clover in 2013; Clover + high compost= 67 kg N/ha applied as compost at bloom in 2012 + early season establishment of red clover in 2012, and red clover+crimson clover in 2013; Low soil= 15kg N/ha of calcium nitrate at bloom + 15kg N/ha of calcium nitrate 6 weeks post-bloom; High soil= 30kg N/ha of calcium nitrate at bloom + 30kg N/ha of calcium nitrate 6 weeks post-bloom; Post-harvest= 30kg N/ha of calcium nitrate applied post-harvest. b. Separation of means using Tukey’s HSD (α=0.05). c. Significance of treatment effects on response variables using two-way ANOVA (p>F; ns= not significant).

47
Table 5. CON: Treatment effect on micronutrient composition of Merlot petioles at bloom and véraison in 2012-2013.
Treatmentab Mn ppm
Fe ppm
Cu ppm
B ppm
Al ppm
Zn ppm
Na ppm
Bloom 2012
Vineyard Average 416 28 96 46 2 167 398 V
érai
son
2012
Significancec ns ns ns ns ns ns ns Control 285 18 75 42 2 103 151 Low compost 323 17 99 41 3 119 158 High compost 302 17 99 41 2 121 160 Clover + low compost
363 13 83 40 2 118 135
Clove + high compost
371 16 94 43 3 103 146
Low soil 377 18 94 43 2 104 150 High soil 323 16 101 41 2 97 152 Post-harvest 322 18 106 42 3 114 163
Blo
om 2
013
Significance 0.0043 ns ns ns ns ns ns Control 303b 13 13 36 3 130 323 Low compost 339ab 13 13 38 2 132 313 High compost 305b 11 11 35 2 122 248 Clover + low compost
406a 14 11 38 2 111 279
Clove + high compost
377ab 13 14 38 2 125 265
Low soil 343ab 13 13 39 2 122 319 High soil 350ab 14 12 37 2 115 311 Post-harvest 407a 13 12 36 2 114 263
Vér
aiso
n 20
13
Significance 0.0138 ns ns ns ns ns ns Control 209b 11 174 41 4 103 211 Low compost 228ab 11 162 43 3 106 212 High compost 197b 9 140 41 3 100 203 Clover + low compost
297a 11 148 41 3 98 231
Clove + high compost
275ab 10 153 40 3 112 226
Low soil 228ab 13 177 41 4 104 221 High soil 242ab 10 138 39 3 103 193 Post-harvest 252ab 10 134 43 3 103 199
a. Control= no nitrogen; Low compost= 33.5 kg N/ha applied as compost at bloom in 2012; High compost= 67 kg N/ha applied as compost at bloom in 2012; Clover + low compost= 33.5 kg N/ha applied as compost at bloom in 2012 + early season establishment of red clover in 2012, and red clover+crimson clover in 2013; Clover + high compost= 67 kg N/ha applied as compost at bloom in 2012 + early season establishment of red clover in 2012, and red clover+crimson clover in 2013; Low soil= 15kg N/ha of calcium nitrate at bloom + 15kg N/ha of calcium nitrate 6 weeks post-bloom; High soil= 30kg N/ha of calcium nitrate at bloom + 30kg N/ha of calcium nitrate 6 weeks post-bloom; Post-harvest= 30kg N/ha of calcium nitrate applied post-harvest. b. Separation of means using Tukey’s HSD (α=0.05). c. Significance of treatment effects on response variables using two-way ANOVA (p>F; ns= not significant).
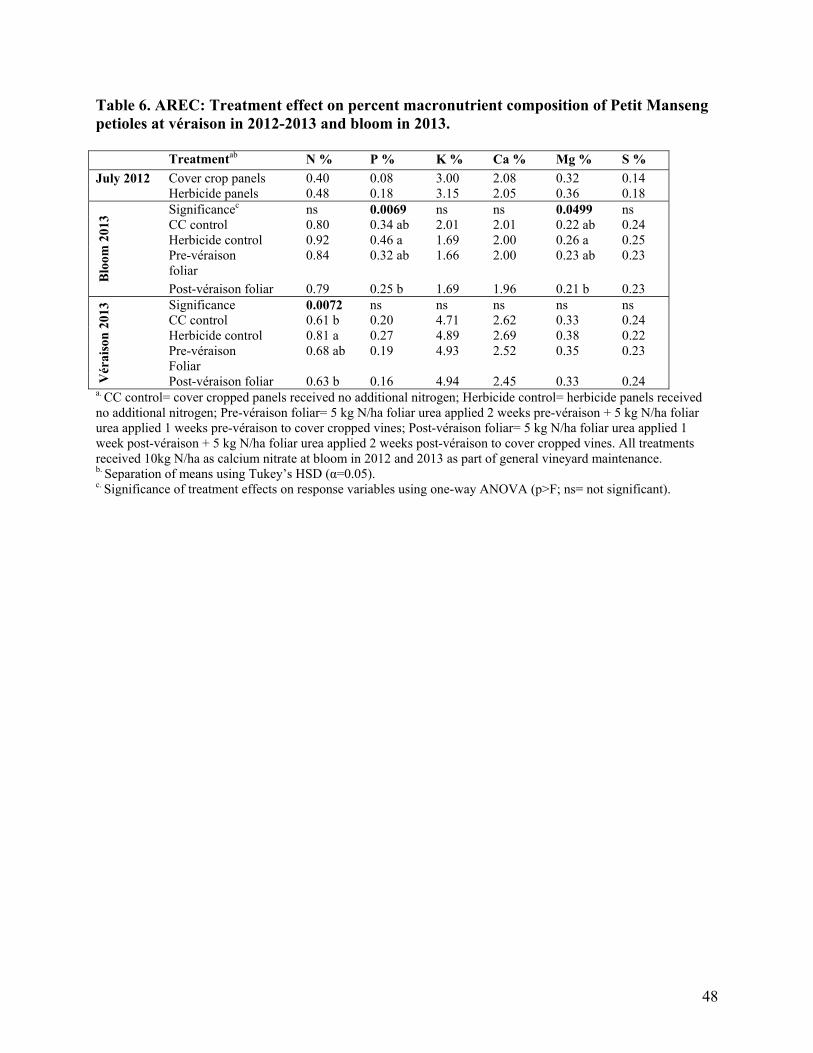
48
Table 6. AREC: Treatment effect on percent macronutrient composition of Petit Manseng petioles at véraison in 2012-2013 and bloom in 2013. Treatmentab N % P % K % Ca % Mg % S % July 2012 Cover crop panels 0.40 0.08 3.00 2.08 0.32 0.14
Herbicide panels 0.48 0.18 3.15 2.05 0.36 0.18
Blo
om 2
013 Significancec ns 0.0069 ns ns 0.0499 ns
CC control 0.80 0.34 ab 2.01 2.01 0.22 ab 0.24 Herbicide control 0.92 0.46 a 1.69 2.00 0.26 a 0.25 Pre-véraison foliar
0.84 0.32 ab
1.66 2.00 0.23 ab 0.23
Post-véraison foliar 0.79 0.25 b 1.69 1.96 0.21 b 0.23
Vér
aiso
n 2
013 Significance 0.0072 ns ns ns ns ns
CC control 0.61 b 0.20 4.71 2.62 0.33 0.24 Herbicide control 0.81 a 0.27 4.89 2.69 0.38 0.22 Pre-véraison Foliar
0.68 ab 0.19 4.93 2.52 0.35 0.23
Post-véraison foliar 0.63 b 0.16 4.94 2.45 0.33 0.24 a. CC control= cover cropped panels received no additional nitrogen; Herbicide control= herbicide panels received no additional nitrogen; Pre-véraison foliar= 5 kg N/ha foliar urea applied 2 weeks pre-véraison + 5 kg N/ha foliar urea applied 1 weeks pre-véraison to cover cropped vines; Post-véraison foliar= 5 kg N/ha foliar urea applied 1 week post-véraison + 5 kg N/ha foliar urea applied 2 weeks post-véraison to cover cropped vines. All treatments received 10kg N/ha as calcium nitrate at bloom in 2012 and 2013 as part of general vineyard maintenance. b. Separation of means using Tukey’s HSD (α=0.05). c. Significance of treatment effects on response variables using one-way ANOVA (p>F; ns= not significant).

49
Table 7. AREC: Treatment effect on micronutrient composition of Petit Manseng petioles at véraison in 2012-2013 and bloom in 2013. Treatmentab Mn ppm Fe ppm Cu ppm B ppm Al ppm Zn ppm Na ppm July 2012
Cover crop panels
229 12 3 25 2 73 311
Herbicide panels 169 9 4 25 2 82 248
Blo
om 2
013
Significancec 0.0209 ns ns ns ns ns ns CC control 220 ab 16 9 40 9 74 189 Herbicide control 159 b 18 10 40 9 76 158 Pre-véraison foliar
241 a 18 10 40 10 80 178
Post-véraison foliar
216 ab 16 8 39 9 76 183
Vér
aiso
n 2
013
Significance 0.0049 ns ns ns ns ns ns CC control 295a 7 6 37 3 70 290 Herbicide control 166b 7 6 37 3 71 275 Pre-véraison Foliar
292a 7 6 36 3 66 326
Post-véraison foliar
258ab 6 6 37 3 72 333
a. CC control= cover cropped panels received no additional nitrogen; Herbicide control= herbicide panels received no additional nitrogen; Pre-véraison foliar= 5 kg N/ha foliar urea applied 2 weeks pre-véraison + 5 kg N/ha foliar urea applied 1 weeks pre-véraison to cover cropped vines; Post-véraison foliar= 5 kg N/ha foliar urea applied 1 week post-véraison + 5 kg N/ha foliar urea applied 2 weeks post-véraison to cover cropped vines. All treatments received 10kg N/ha as calcium nitrate at bloom in 2012 and 2013 as part of general vineyard maintenance. b. Separation of means using Tukey’s HSD (α=0.05). c. Significance of treatment effects on response variables using one-way ANOVA (p>F; ns= not significant).

50
Soil Nutrient Analysis AREC and GMV soils were found to have low soil organic matter and pH ranges suitable
for growing V. vinifera (Table 8). In both years the pH at CON was below the recommended pH
of 6.5; however the increase from 5.55 to 5.97 is attributed to a lime application made in 2012
(Table 8). All sites were highly deficient in phosphorous and moderately deficient in calcium
(Table 8).
Table 8. Averageda soil nutrient analyses for AREC in 2013, and for GMV and CON in 2012 and 2013. Vineyard Site GMV CON AREC Nutrient Target Value b 2012 2013 2012 2013 2013
pH 6.5c 6.34 6.25 5.55 5.97 6.73 % OM 3-5 2.3 2.0 3.43 3.38 1.34 P (lbs/A) 40-100 2 2 2 4 3 K (lbs/A) 150-200 70 58 111 109 68 Ca (lbs/A) 1,000-4,000 559 540 557 639 723 Mg (lbs/A) 200-500 85 90 83 123 85 Zn (ppm) 2 1.3 0.8 1.1 1.2 1.7 Mn (ppm) 20 7.9 6.1 5.4 5.3 9.8 Cu (ppm) 0.5 0.8 0.6 3.0 3.3 0.6 Fe (ppm) 20 6.8 7.7 15.9 13.3 6.9 B (ppm) 0.3-2.0 0.3 0.3 0.3 0.3 0.3 a. Soil samples collected for each block were averaged to provide a baseline description of soil nutrients at each site. b. Target value recommendations obtained from Wolf et al. (2008). c. Recommendation for V. vinifera.

51
Chlorophyll content index GMV: No treatment significantly affected CCI values at véraison in 2012 (Table 9).
Sauvignon blanc CCI values increased continuously between the post-bloom sampling period
and harvest in response to all treatments in 2013, with the high rate of calcium nitrate being most
effective at increasing average season-long CCI values by 26.0% (Figure 1, Table 12).
CON: No treatment significantly affected CCI values at véraison in 2012 (Table 10).
Merlot leaf CCI values varied by treatment between the post-bloom and véraison sampling
periods (Figure 2). Merlot leaf CCI values increased in response to the high calcium nitrate rate
and clover combined with a low compost rate between the post-bloom and véraison sampling
periods (Figure 2). In contrast, leaves from the post-harvest, clover + high compost, and both
compost treatments exhibited a decrease in CCI values between the post-bloom and véraison
sampling periods; while leaves from the low calcium nitrate rate and control treatments remained
stagnant (Figure 2). All treatments exhibited a decline in CCI values at harvest. Both clover
treatments, the high rate of calcium nitrate, and the post harvest calcium nitrate treatments
increased average season-long CCI values in 2013, but the high rate of calcium nitrate was most
effective by increasing CCI values by 57.6% (Figure 2, Table 14).
AREC: Vines grown in the presence of an herbicide strip exhibited the highest CCI
values at véraison in 2012 (Table 11) and average season-long CCI values in 2013 (Figure 3,
Table 16). Sauvignon blanc leaf CCI values increased between the post-bloom and véraison
sampling periods and decreased between the pre-harvest and harvest sampling periods in
response to all treatments (Figure 3). Leaves from vines grown in the presence of an herbicide
strip, and from the post-véraison foliar, and cover crop control treatments all showed slight

52
increases in CCI values between véraison and harvest; in contrast, the pre-véraison foliar
treatment resulted in decreased CCI values between these sampling periods.
Table 9. GMV: Treatment effect on Sauvignon blanc leaf chlorophyll content index at véraison in 2012.
Treatmenta CCI at véraison Significanceb ns Control 14.92 Low soil 14.68 High S\soil 15.99 Foliar 16.32
a. Control= no nitrogen; Low soil= 30kg N/ha of calcium nitrate at bloom; High soil= 30kg N/ha of calcium nitrate at bloom + 30kg N/ha of calcium nitrate 6 weeks post-bloom; Foliar= 40 kg N/ha of urea applied evenly in roughly 7 applications between bloom and véraison. b. Significance of treatment effects on response variables using two-way ANOVA (p>F; ns= not significant). Table 10. CON: Treatment effect on Merlot leaf chlorophyll content index at véraison in 2012.
Treatmenta CCI at véraison Significanceb ns Control 19.14 Low compost 18.98 High compost 19.34 Clover + low compost 20.58 Clover + high compost 21.48 Low soil 19.75 High soil 21.41 Post-harvest 20.02
a. Control= no nitrogen; Low compost= 33.5 kg N/ha applied as compost at bloom in 2012; High compost= 67 kg N/ha applied as compost at bloom in 2012; Clover + low compost= 33.5 kg N/ha applied as compost at bloom in 2012 + early season establishment of red clover in 2012, and red clover+crimson clover in 2013; Clover + high compost= 67 kg N/ha applied as compost at bloom in 2012 + early season establishment of red clover in 2012, and red clover+crimson clover in 2013; Low soil= 15kg N/ha of calcium nitrate at bloom + 15kg N/ha of calcium nitrate 6 weeks post-bloom; High soil= 30kg N/ha of calcium nitrate at bloom + 30kg N/ha of calcium nitrate 6 weeks post-bloom; Post-harvest= 30kg N/ha of calcium nitrate applied post-harvest. b. Separation of means using Tukey’s HSD (α=0.05).
Table 11. AREC: Treatment effect on Petit Manseng leaf chlorophyll content index at véraison in 2012.
Treatmentab CCI at véraison Significancec 0.0012 CC control 14.72 b Herbicide control 18.39 a Pre-véraison foliar 17.13 ab Post- véraison foliar 16.82 ab
a. CC Control= cover cropped panels received no additional nitrogen; Herbicide control= herbicide panels received no additional nitrogen; Pre-véraison foliar= 5 kg N/ha foliar urea applied 2 weeks pre-véraison + 5 kg N/ha foliar urea applied 1 weeks pre-véraison to cover cropped vines; Post-véraison foliar= 5 kg N/ha foliar urea applied 1 week post-véraison + 5 kg N/ha foliar urea applied 2 weeks post-véraison to cover cropped vines. All treatments received 10kg N/ha as calcium nitrate at bloom in 2012 and 2013 as part of general vineyard maintenance. b. Separation of means using Tukey’s HSD (α=0.05). c. Significance of treatment effects on response variables using one-way ANOVA (p>F; ns= not significant)
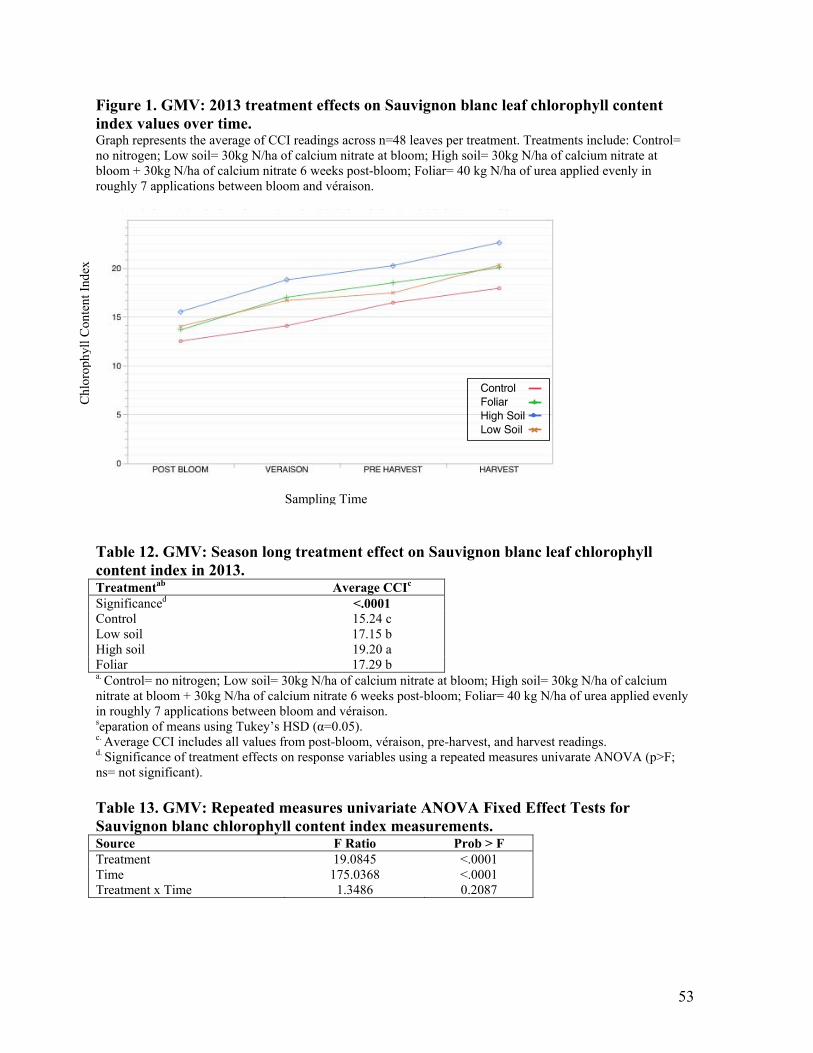
53
Figure 1. GMV: 2013 treatment effects on Sauvignon blanc leaf chlorophyll content index values over time. Graph represents the average of CCI readings across n=48 leaves per treatment. Treatments include: Control= no nitrogen; Low soil= 30kg N/ha of calcium nitrate at bloom; High soil= 30kg N/ha of calcium nitrate at bloom + 30kg N/ha of calcium nitrate 6 weeks post-bloom; Foliar= 40 kg N/ha of urea applied evenly in roughly 7 applications between bloom and véraison.
Table 12. GMV: Season long treatment effect on Sauvignon blanc leaf chlorophyll content index in 2013. Treatmentab Average CCIc
Significanced <.0001 Control 15.24 c Low soil 17.15 b High soil 19.20 a Foliar 17.29 b a. Control= no nitrogen; Low soil= 30kg N/ha of calcium nitrate at bloom; High soil= 30kg N/ha of calcium nitrate at bloom + 30kg N/ha of calcium nitrate 6 weeks post-bloom; Foliar= 40 kg N/ha of urea applied evenly in roughly 7 applications between bloom and véraison. separation of means using Tukey’s HSD (α=0.05). c. Average CCI includes all values from post-bloom, véraison, pre-harvest, and harvest readings. d. Significance of treatment effects on response variables using a repeated measures univarate ANOVA (p>F; ns= not significant). Table 13. GMV: Repeated measures univariate ANOVA Fixed Effect Tests for Sauvignon blanc chlorophyll content index measurements. Source F Ratio Prob > F Treatment 19.0845 <.0001 Time 175.0368 <.0001 Treatment x Time 1.3486 0.2087
Chl
orop
hyll
Con
tent
Ind
ex
Sampling Time
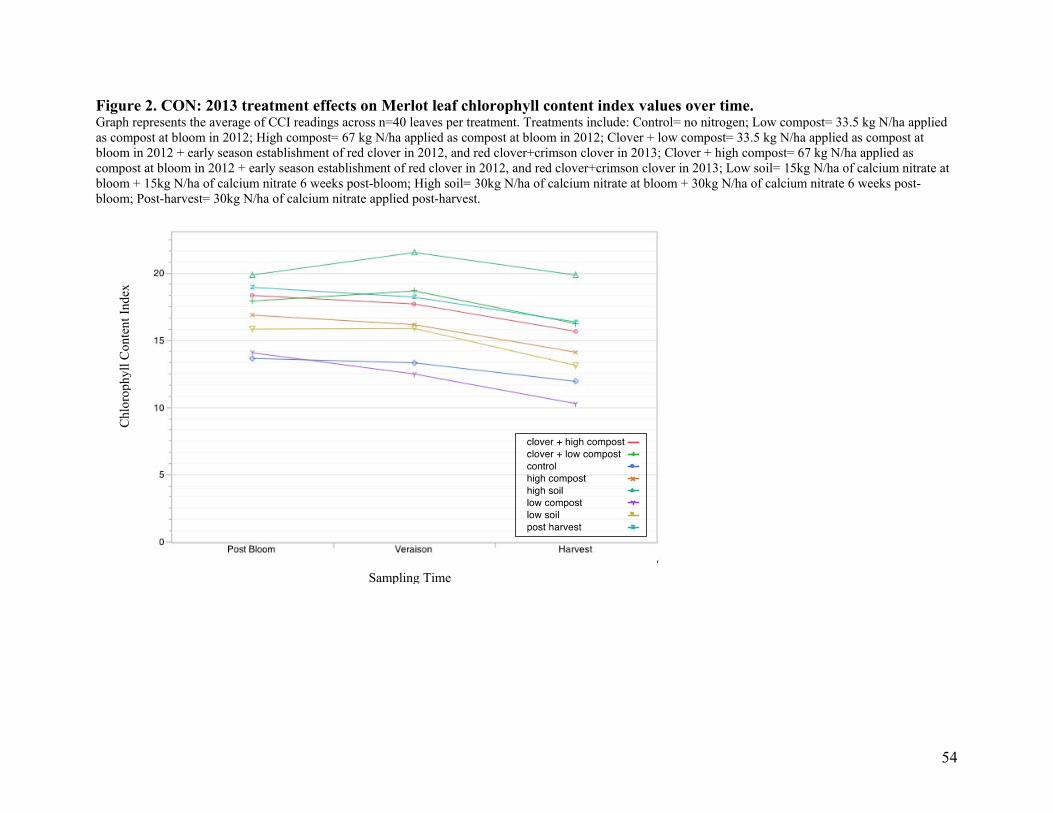
54
Figure 2. CON: 2013 treatment effects on Merlot leaf chlorophyll content index values over time. Graph represents the average of CCI readings across n=40 leaves per treatment. Treatments include: Control= no nitrogen; Low compost= 33.5 kg N/ha applied as compost at bloom in 2012; High compost= 67 kg N/ha applied as compost at bloom in 2012; Clover + low compost= 33.5 kg N/ha applied as compost at bloom in 2012 + early season establishment of red clover in 2012, and red clover+crimson clover in 2013; Clover + high compost= 67 kg N/ha applied as compost at bloom in 2012 + early season establishment of red clover in 2012, and red clover+crimson clover in 2013; Low soil= 15kg N/ha of calcium nitrate at bloom + 15kg N/ha of calcium nitrate 6 weeks post-bloom; High soil= 30kg N/ha of calcium nitrate at bloom + 30kg N/ha of calcium nitrate 6 weeks post-bloom; Post-harvest= 30kg N/ha of calcium nitrate applied post-harvest.
Chl
orop
hyll
Con
tent
Ind
ex
Sampling Time
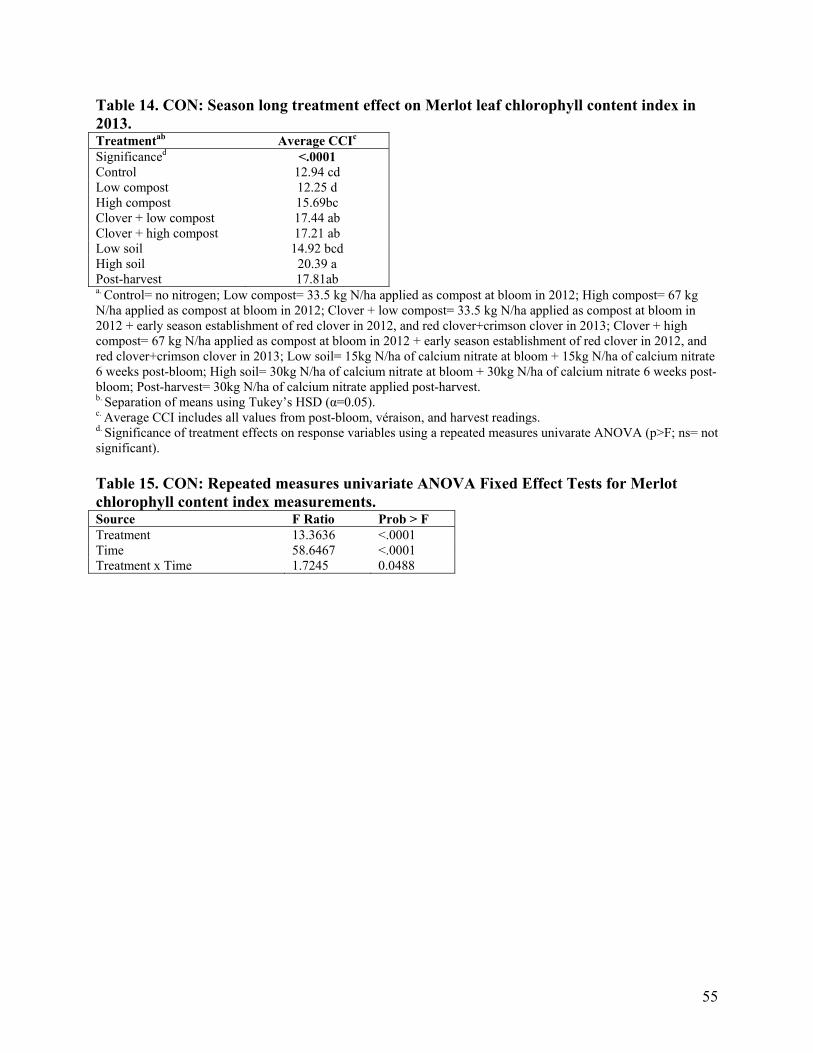
55
Table 14. CON: Season long treatment effect on Merlot leaf chlorophyll content index in 2013. Treatmentab Average CCIc
Significanced <.0001 Control 12.94 cd Low compost 12.25 d High compost 15.69bc Clover + low compost 17.44 ab Clover + high compost 17.21 ab Low soil 14.92 bcd High soil 20.39 a Post-harvest 17.81ab a. Control= no nitrogen; Low compost= 33.5 kg N/ha applied as compost at bloom in 2012; High compost= 67 kg N/ha applied as compost at bloom in 2012; Clover + low compost= 33.5 kg N/ha applied as compost at bloom in 2012 + early season establishment of red clover in 2012, and red clover+crimson clover in 2013; Clover + high compost= 67 kg N/ha applied as compost at bloom in 2012 + early season establishment of red clover in 2012, and red clover+crimson clover in 2013; Low soil= 15kg N/ha of calcium nitrate at bloom + 15kg N/ha of calcium nitrate 6 weeks post-bloom; High soil= 30kg N/ha of calcium nitrate at bloom + 30kg N/ha of calcium nitrate 6 weeks post-bloom; Post-harvest= 30kg N/ha of calcium nitrate applied post-harvest. b. Separation of means using Tukey’s HSD (α=0.05). c. Average CCI includes all values from post-bloom, véraison, and harvest readings. d. Significance of treatment effects on response variables using a repeated measures univarate ANOVA (p>F; ns= not significant). Table 15. CON: Repeated measures univariate ANOVA Fixed Effect Tests for Merlot chlorophyll content index measurements. Source F Ratio Prob > F Treatment 13.3636 <.0001 Time 58.6467 <.0001 Treatment x Time 1.7245 0.0488
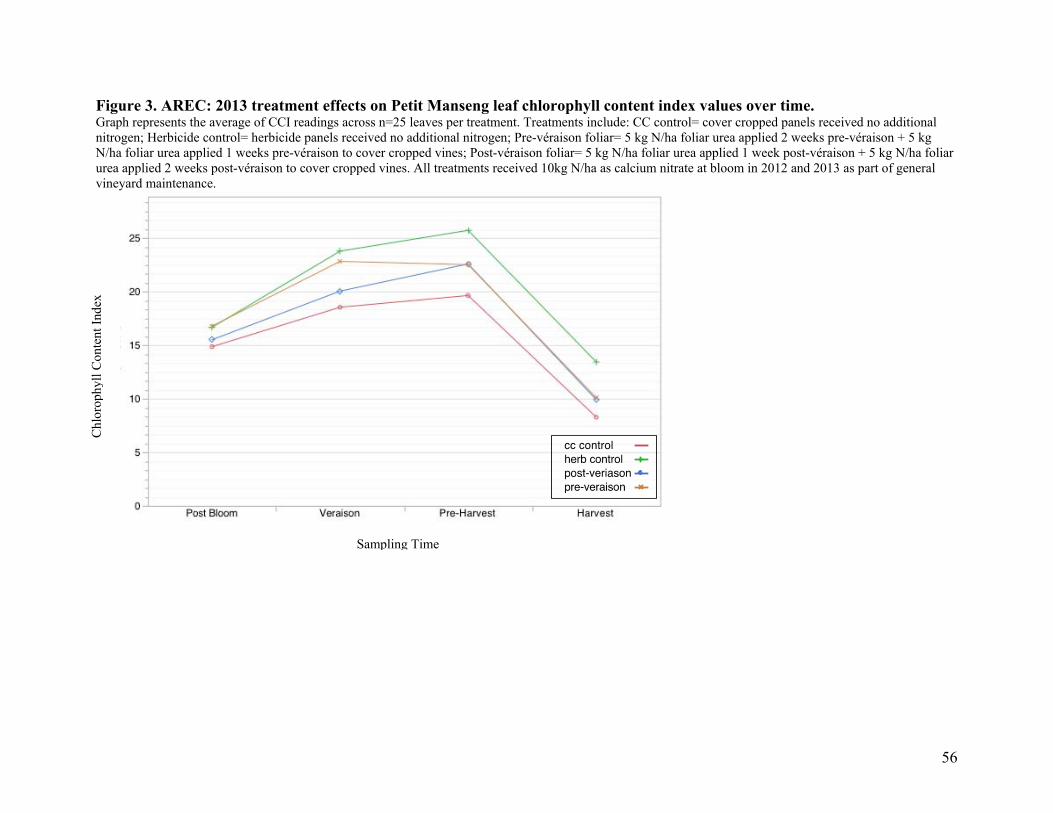
56
Figure 3. AREC: 2013 treatment effects on Petit Manseng leaf chlorophyll content index values over time. Graph represents the average of CCI readings across n=25 leaves per treatment. Treatments include: CC control= cover cropped panels received no additional nitrogen; Herbicide control= herbicide panels received no additional nitrogen; Pre-véraison foliar= 5 kg N/ha foliar urea applied 2 weeks pre-véraison + 5 kg N/ha foliar urea applied 1 weeks pre-véraison to cover cropped vines; Post-véraison foliar= 5 kg N/ha foliar urea applied 1 week post-véraison + 5 kg N/ha foliar urea applied 2 weeks post-véraison to cover cropped vines. All treatments received 10kg N/ha as calcium nitrate at bloom in 2012 and 2013 as part of general vineyard maintenance.
Chl
orop
hyll
Con
tent
Ind
ex
Sampling Time

57
Table 16. AREC: Season long treatment effect on Petit Manseng leaf chlorophyll content index in 2013. Treatmentab Average CCIc
Significanced 0.0003 CC control 15.33b Herbicide control 19.68a Pre-véraison foliar 17.74ab Post-véraison foliar 17.01b a. CC control= cover cropped panels received no additional nitrogen; Herbicide control= herbicide panels received no additional nitrogen; Pre-véraison foliar= 5 kg N/ha foliar urea applied 2 weeks pre-véraison + 5 kg N/ha foliar urea applied 1 weeks pre-véraison to cover cropped vines; Post-véraison foliar= 5 kg N/ha foliar urea applied 1 week post-véraison + 5 kg N/ha foliar urea applied 2 weeks post-véraison to cover cropped vines. All treatments received 10kg N/ha as calcium nitrate at bloom in 2012 and 2013 as part of general vineyard maintenance. b. Separation of means using Tukey’s HSD (α=0.05). c. Average CCI includes all values from post-bloom, véraison, pre-harvest, and harvest readings. d. Significance of treatment effects on response variables using a repeated measures univarate ANOVA (p>F; ns= not significant). Table 17. AREC: Repeated measures univariate ANOVA Fixed Effect Tests for Petit Manseng chlorophyll content index measurements. Source F Ratio Prob > F Treatment 97.18 0.0003 Time 271.2 <.0001 Treatment x Time 271.1 0.0020
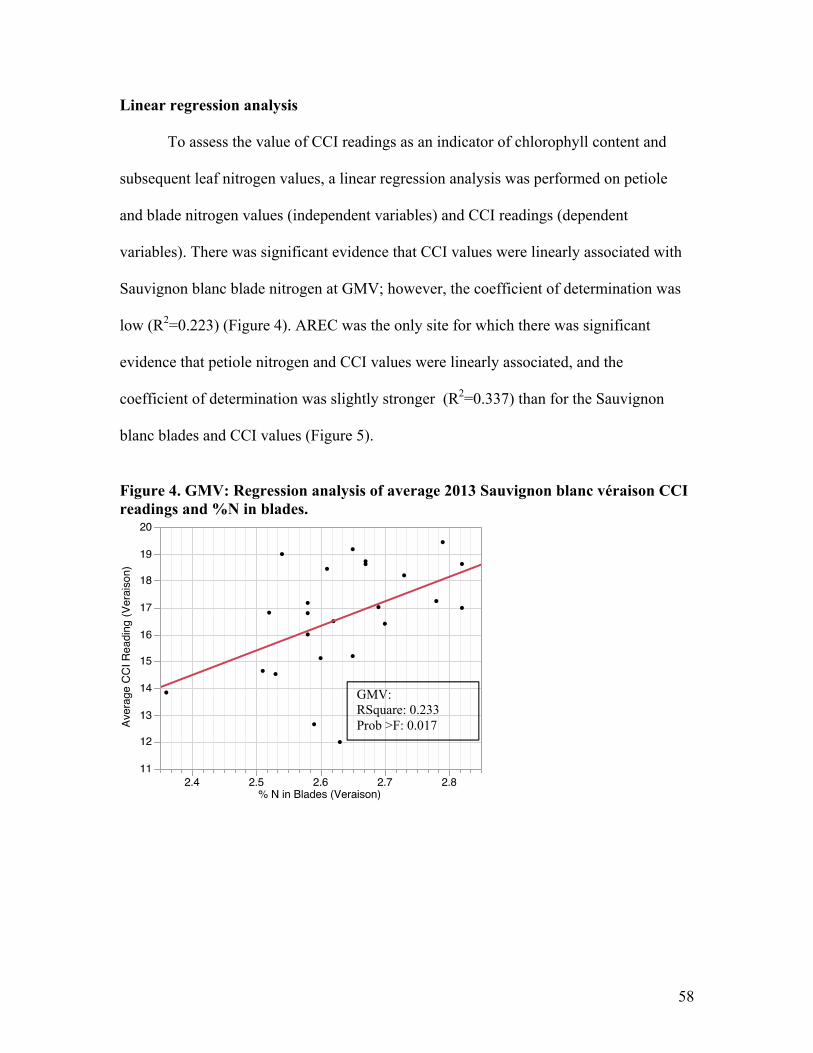
58
Linear regression analysis To assess the value of CCI readings as an indicator of chlorophyll content and
subsequent leaf nitrogen values, a linear regression analysis was performed on petiole
and blade nitrogen values (independent variables) and CCI readings (dependent
variables). There was significant evidence that CCI values were linearly associated with
Sauvignon blanc blade nitrogen at GMV; however, the coefficient of determination was
low (R2=0.223) (Figure 4). AREC was the only site for which there was significant
evidence that petiole nitrogen and CCI values were linearly associated, and the
coefficient of determination was slightly stronger (R2=0.337) than for the Sauvignon
blanc blades and CCI values (Figure 5).
Figure 4. GMV: Regression analysis of average 2013 Sauvignon blanc véraison CCI readings and %N in blades.
GMV: RSquare: 0.233 Prob >F: 0.017

59
Figure 5. Regression analysis of average 2013 véraison CCI readings from all sites and %N in petioles.
c. AREC RSquare: 0.337 Prob >Fa: 0.0073
a. CON RSquare: 0.019 Prob >Fa: 0.397
b. GMV RSquare: 0.003 Prob >Fa: 0.798

60
Canopy architecture and fruit exposure The canopy density did not change as a function of nitrogen treatment for any site
in this study as indicated by the EQPA parameters of interest (Tables 18, 19, and 20).
Fruit zone light interception (fruit zone PPFD) was decreased by the two compost
treatments (Low compost and High compost), the clover combined with a low compost
rate (Clover + low compost), and both calcium nitrate rates (Low soil-CON and High
soil-CON) at CON in 2013 (Table 19).
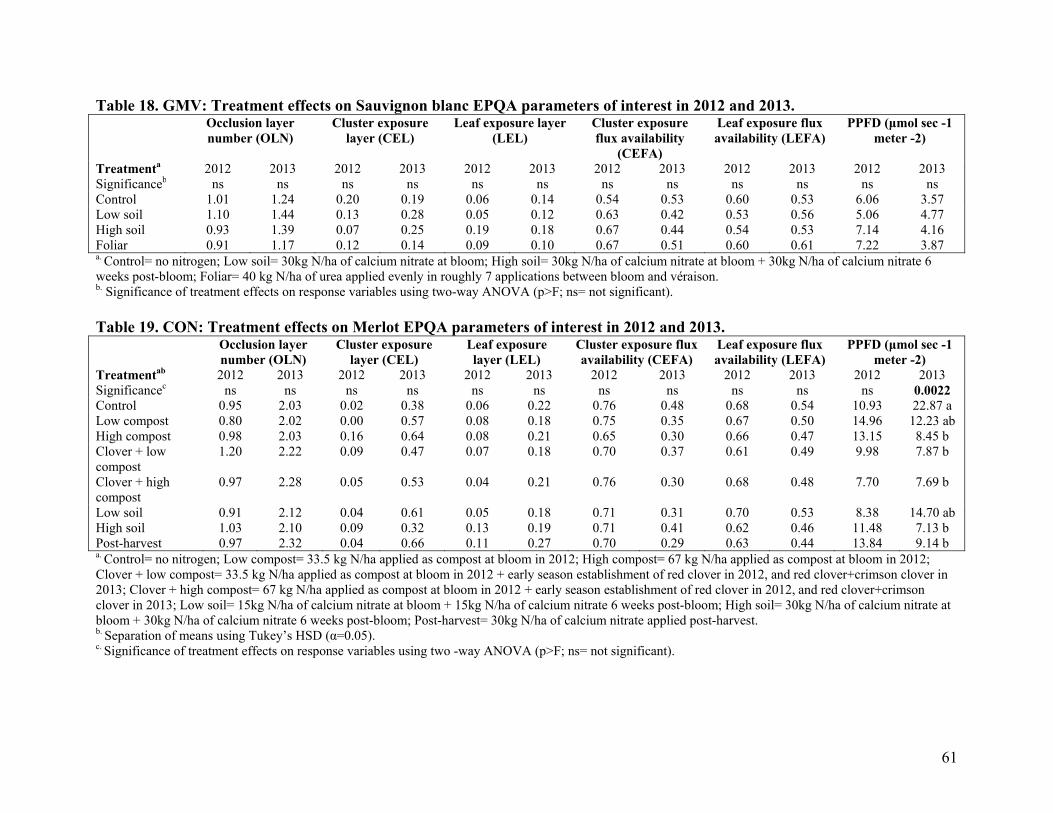
61
Table 18. GMV: Treatment effects on Sauvignon blanc EPQA parameters of interest in 2012 and 2013. Occlusion layer
number (OLN) Cluster exposure
layer (CEL) Leaf exposure layer
(LEL) Cluster exposure flux availability
(CEFA)
Leaf exposure flux availability (LEFA)
PPFD (μmol sec -1 meter -2)
Treatmenta 2012 2013 2012 2013 2012 2013 2012 2013 2012 2013 2012 2013 Significanceb ns ns ns ns ns ns ns ns ns ns ns ns Control 1.01 1.24 0.20 0.19 0.06 0.14 0.54 0.53 0.60 0.53 6.06 3.57 Low soil 1.10 1.44 0.13 0.28 0.05 0.12 0.63 0.42 0.53 0.56 5.06 4.77 High soil 0.93 1.39 0.07 0.25 0.19 0.18 0.67 0.44 0.54 0.53 7.14 4.16 Foliar 0.91 1.17 0.12 0.14 0.09 0.10 0.67 0.51 0.60 0.61 7.22 3.87 a. Control= no nitrogen; Low soil= 30kg N/ha of calcium nitrate at bloom; High soil= 30kg N/ha of calcium nitrate at bloom + 30kg N/ha of calcium nitrate 6 weeks post-bloom; Foliar= 40 kg N/ha of urea applied evenly in roughly 7 applications between bloom and véraison. b. Significance of treatment effects on response variables using two-way ANOVA (p>F; ns= not significant). Table 19. CON: Treatment effects on Merlot EPQA parameters of interest in 2012 and 2013. Occlusion layer
number (OLN) Cluster exposure
layer (CEL) Leaf exposure layer (LEL)
Cluster exposure flux availability (CEFA)
Leaf exposure flux availability (LEFA)
PPFD (μmol sec -1 meter -2)
Treatmentab 2012 2013 2012 2013 2012 2013 2012 2013 2012 2013 2012 2013 Significancec ns ns ns ns ns ns ns ns ns ns ns 0.0022 Control 0.95 2.03 0.02 0.38 0.06 0.22 0.76 0.48 0.68 0.54 10.93 22.87 a Low compost 0.80 2.02 0.00 0.57 0.08 0.18 0.75 0.35 0.67 0.50 14.96 12.23 ab High compost 0.98 2.03 0.16 0.64 0.08 0.21 0.65 0.30 0.66 0.47 13.15 8.45 b Clover + low compost
1.20 2.22 0.09 0.47 0.07 0.18 0.70 0.37 0.61 0.49 9.98 7.87 b
Clover + high compost
0.97 2.28 0.05 0.53 0.04 0.21 0.76 0.30 0.68 0.48 7.70 7.69 b
Low soil 0.91 2.12 0.04 0.61 0.05 0.18 0.71 0.31 0.70 0.53 8.38 14.70 ab High soil 1.03 2.10 0.09 0.32 0.13 0.19 0.71 0.41 0.62 0.46 11.48 7.13 b Post-harvest 0.97 2.32 0.04 0.66 0.11 0.27 0.70 0.29 0.63 0.44 13.84 9.14 b a. Control= no nitrogen; Low compost= 33.5 kg N/ha applied as compost at bloom in 2012; High compost= 67 kg N/ha applied as compost at bloom in 2012; Clover + low compost= 33.5 kg N/ha applied as compost at bloom in 2012 + early season establishment of red clover in 2012, and red clover+crimson clover in 2013; Clover + high compost= 67 kg N/ha applied as compost at bloom in 2012 + early season establishment of red clover in 2012, and red clover+crimson clover in 2013; Low soil= 15kg N/ha of calcium nitrate at bloom + 15kg N/ha of calcium nitrate 6 weeks post-bloom; High soil= 30kg N/ha of calcium nitrate at bloom + 30kg N/ha of calcium nitrate 6 weeks post-bloom; Post-harvest= 30kg N/ha of calcium nitrate applied post-harvest. b. Separation of means using Tukey’s HSD (α=0.05). c. Significance of treatment effects on response variables using two -way ANOVA (p>F; ns= not significant).
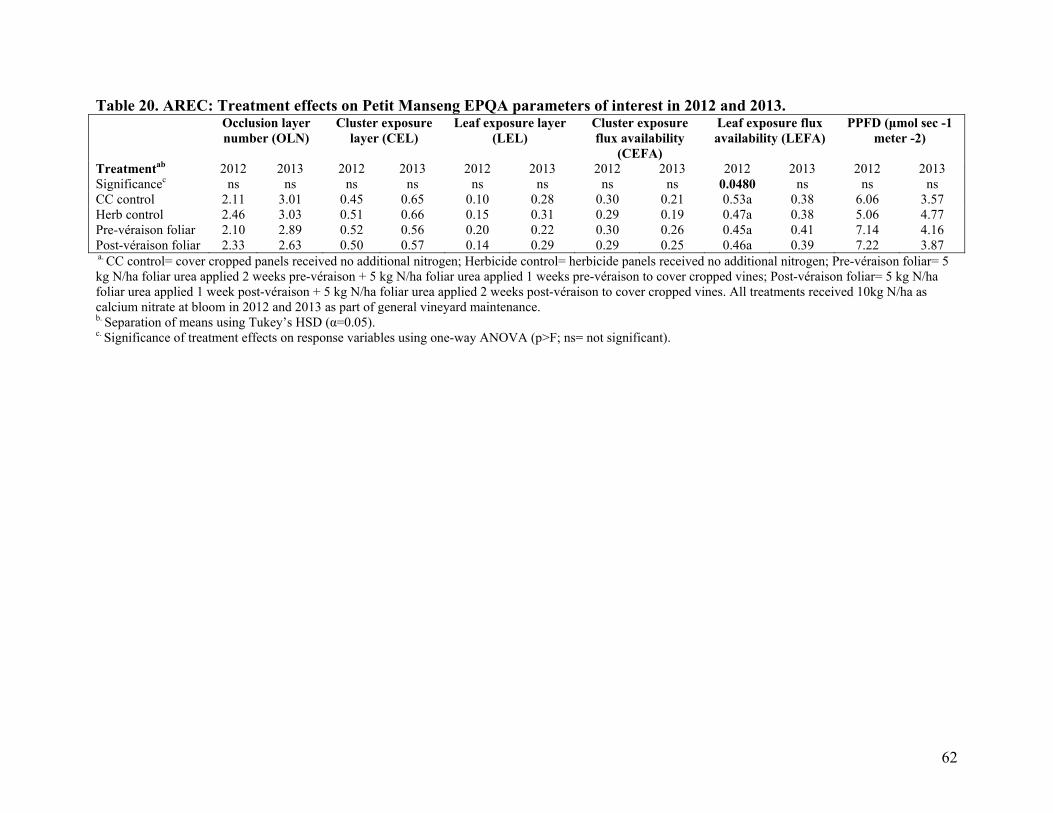
62
Table 20. AREC: Treatment effects on Petit Manseng EPQA parameters of interest in 2012 and 2013. Occlusion layer
number (OLN) Cluster exposure
layer (CEL) Leaf exposure layer
(LEL) Cluster exposure flux availability
(CEFA)
Leaf exposure flux availability (LEFA)
PPFD (μmol sec -1 meter -2)
Treatmentab 2012 2013 2012 2013 2012 2013 2012 2013 2012 2013 2012 2013 Significancec ns ns ns ns ns ns ns ns 0.0480 ns ns ns CC control 2.11 3.01 0.45 0.65 0.10 0.28 0.30 0.21 0.53a 0.38 6.06 3.57 Herb control 2.46 3.03 0.51 0.66 0.15 0.31 0.29 0.19 0.47a 0.38 5.06 4.77 Pre-véraison foliar 2.10 2.89 0.52 0.56 0.20 0.22 0.30 0.26 0.45a 0.41 7.14 4.16 Post-véraison foliar 2.33 2.63 0.50 0.57 0.14 0.29 0.29 0.25 0.46a 0.39 7.22 3.87 a. CC control= cover cropped panels received no additional nitrogen; Herbicide control= herbicide panels received no additional nitrogen; Pre-véraison foliar= 5 kg N/ha foliar urea applied 2 weeks pre-véraison + 5 kg N/ha foliar urea applied 1 weeks pre-véraison to cover cropped vines; Post-véraison foliar= 5 kg N/ha foliar urea applied 1 week post-véraison + 5 kg N/ha foliar urea applied 2 weeks post-véraison to cover cropped vines. All treatments received 10kg N/ha as calcium nitrate at bloom in 2012 and 2013 as part of general vineyard maintenance. b. Separation of means using Tukey’s HSD (α=0.05). c. Significance of treatment effects on response variables using one-way ANOVA (p>F; ns= not significant).

63
Primary chemistry and yeast assimilable nitrogen (YAN) of mature fruit GMV: Treatments had no effect on primary juice chemistry in 2011, 2012, or 2013
(Table 21). Foliar fertilization (Foliar-GMV) consistently increased berry YAN at harvest in all
three years by 29.4%, 45.2%, and 88.8% respectively (Figure 6). The high calcium nitrate rate
(High soil-GMV) increased berry YAN at harvest in 2011 and 2013 (Figure 6). The low calcium
nitrate rate (Low soil-GMV) only affected berry YAN at harvest in 2013 (Figure 6).
CON: Treatments had no effect on primary juice chemistry in 2011, 2012, or 2013 (Table
22). The high calcium nitrate rate (High soil-CON) increased berry YAN at harvest by 66.2% in
2013 (Figure 7).
AREC: Treatments had no effect on juice pH or TA (g/L) in 2012 or 2013 (Table 23).
Vines grown in the presence of an herbicide strip (Herbicide control) produced berries with
decreased °Brix at harvest in 2013 (Table 23). The post-véraison foliar application (Post-
véraison foliar) increased berry YAN at harvest by 69.8% in 2013 (Figure 8).
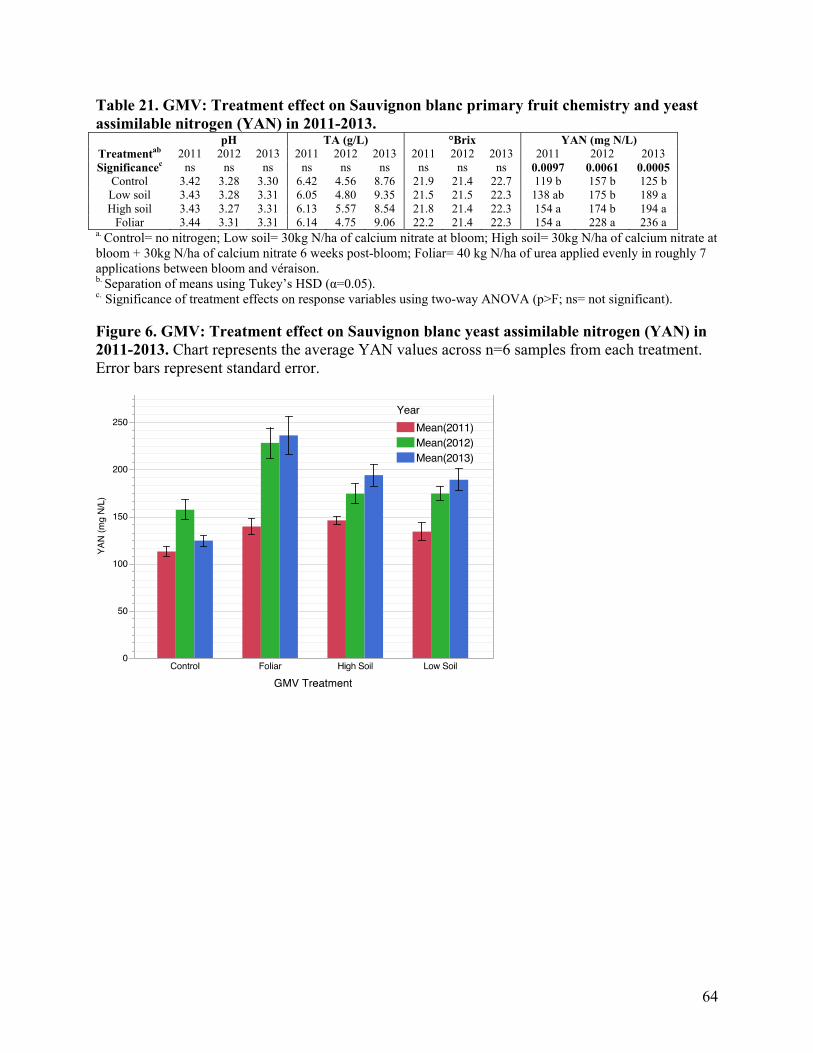
64
Table 21. GMV: Treatment effect on Sauvignon blanc primary fruit chemistry and yeast assimilable nitrogen (YAN) in 2011-2013.
Treatmentab
pH TA (g/L) °Brix YAN (mg N/L) 2011 2012 2013 2011 2012 2013 2011 2012 2013 2011 2012 2013
Significancec ns ns ns ns ns ns ns ns ns 0.0097 0.0061 0.0005 Control 3.42 3.28 3.30 6.42 4.56 8.76 21.9 21.4 22.7 119 b 157 b 125 b Low soil 3.43 3.28 3.31 6.05 4.80 9.35 21.5 21.5 22.3 138 ab 175 b 189 a High soil 3.43 3.27 3.31 6.13 5.57 8.54 21.8 21.4 22.3 154 a 174 b 194 a
Foliar 3.44 3.31 3.31 6.14 4.75 9.06 22.2 21.4 22.3 154 a 228 a 236 a a. Control= no nitrogen; Low soil= 30kg N/ha of calcium nitrate at bloom; High soil= 30kg N/ha of calcium nitrate at bloom + 30kg N/ha of calcium nitrate 6 weeks post-bloom; Foliar= 40 kg N/ha of urea applied evenly in roughly 7 applications between bloom and véraison. b. Separation of means using Tukey’s HSD (α=0.05). c. Significance of treatment effects on response variables using two-way ANOVA (p>F; ns= not significant). Figure 6. GMV: Treatment effect on Sauvignon blanc yeast assimilable nitrogen (YAN) in 2011-2013. Chart represents the average YAN values across n=6 samples from each treatment. Error bars represent standard error.

65
Table 22. CON: Treatment effect on Merlot primary fruit chemistry and yeast assimilable nitrogen (YAN) in 2011-2013.
Treatmentab
pH 2012
pH 2013
TA (g/L) 2012
TA (g/L) 2013
°Brix 2012
°Brix 2013
YAN (mg N/L)
2012
YAN (mg N/L)
2013 Significancec ns ns ns ns ns ns ns 0.0090
Control 4.02 5.34 1.29 2.19 18.7 20.7 73 65 b Low compost 4.11 4.82 1.42 2.90 20.0 20.2 58 66 b High compost 4.16 4.35 1.40 3.49 20.0 20.3 63 73 ab Clover + low
compost 4.15 4.44 1.60 3.40 20.2 20.8 75 94 ab
Clover + high compost
4.07 4.75 1.72 3.02 20.4 20.4 69 94 ab
Low soil 4.01 4.76 1.53 2.92 19.9 20.4 78 75 ab High soil 4.14 4.19 1.58 3.85 20.0 20.1 88 108 a
Post-harvest 4.16 4.04 1.60 4.02 20.2 20.5 67 100 ab a. Control= no nitrogen; Low compost= 33.5 kg N/ha applied as compost at bloom in 2012; High compost= 67 kg N/ha applied as compost at bloom in 2012; Clover + low compost= 33.5 kg N/ha applied as compost at bloom in 2012 + early season establishment of red clover in 2012, and red clover+crimson clover in 2013; Clover + high compost= 67 kg N/ha applied as compost at bloom in 2012 + early season establishment of red clover in 2012, and red clover+crimson clover in 2013; Low soil= 15kg N/ha of calcium nitrate at bloom + 15kg N/ha of calcium nitrate 6 weeks post-bloom; High soil= 30kg N/ha of calcium nitrate at bloom + 30kg N/ha of calcium nitrate 6 weeks post-bloom; Post-harvest= 30kg N/ha of calcium nitrate applied post-harvest. b. Separation of means using Tukey’s HSD (α=0.05). c. Significance of treatment effects on response variables using two-way ANOVA (p>F; ns= not significant). Figure 7. CON: Treatment effect on Merlot yeast assimilable nitrogen (YAN) in 2012-2013. Chart represents the average YAN values across n=5 samples from each treatment. Error bars represent standard error.
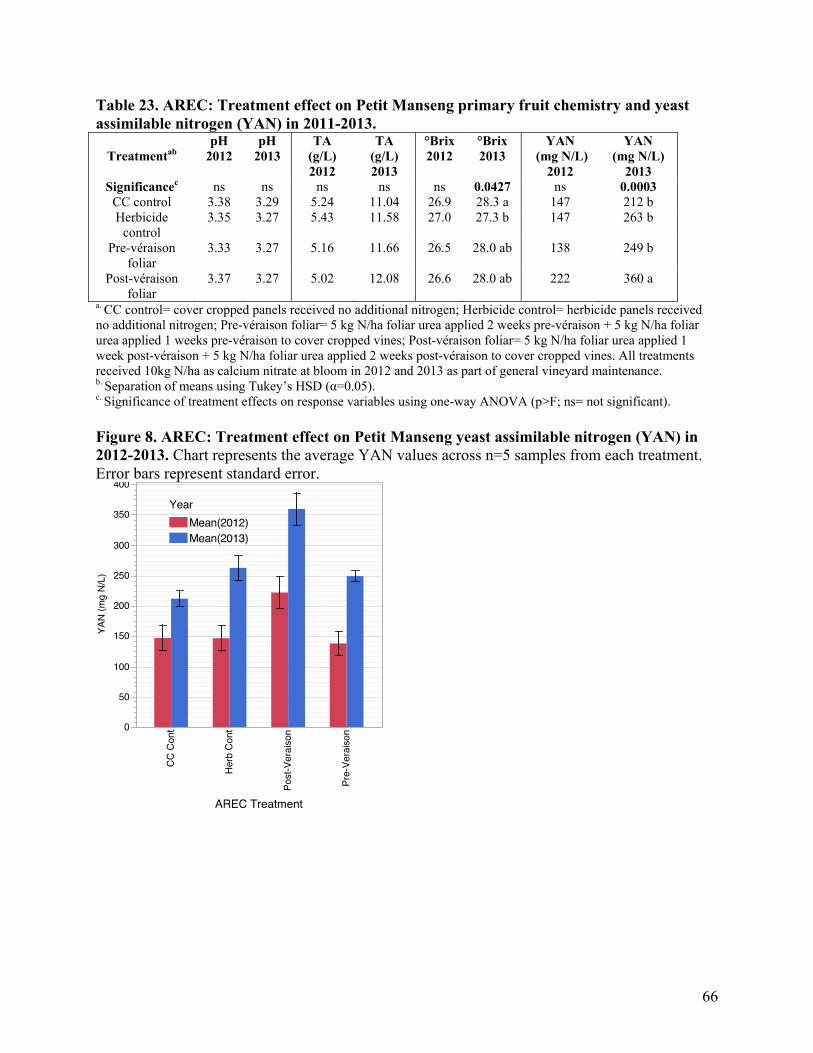
66
Table 23. AREC: Treatment effect on Petit Manseng primary fruit chemistry and yeast assimilable nitrogen (YAN) in 2011-2013.
Treatmentab
pH 2012
pH 2013
TA (g/L) 2012
TA (g/L) 2013
°Brix 2012
°Brix 2013
YAN (mg N/L)
2012
YAN (mg N/L)
2013 Significancec ns ns ns ns ns 0.0427 ns 0.0003
CC control 3.38 3.29 5.24 11.04 26.9 28.3 a 147 212 b Herbicide
control 3.35 3.27 5.43 11.58 27.0 27.3 b 147 263 b
Pre-véraison foliar
3.33 3.27 5.16 11.66 26.5 28.0 ab 138 249 b
Post-véraison foliar
3.37 3.27 5.02 12.08 26.6 28.0 ab 222 360 a
a. CC control= cover cropped panels received no additional nitrogen; Herbicide control= herbicide panels received no additional nitrogen; Pre-véraison foliar= 5 kg N/ha foliar urea applied 2 weeks pre-véraison + 5 kg N/ha foliar urea applied 1 weeks pre-véraison to cover cropped vines; Post-véraison foliar= 5 kg N/ha foliar urea applied 1 week post-véraison + 5 kg N/ha foliar urea applied 2 weeks post-véraison to cover cropped vines. All treatments received 10kg N/ha as calcium nitrate at bloom in 2012 and 2013 as part of general vineyard maintenance. b. Separation of means using Tukey’s HSD (α=0.05). c. Significance of treatment effects on response variables using one-way ANOVA (p>F; ns= not significant). Figure 8. AREC: Treatment effect on Petit Manseng yeast assimilable nitrogen (YAN) in 2012-2013. Chart represents the average YAN values across n=5 samples from each treatment. Error bars represent standard error.

67
UPLC analysis of mature fruit GMV: Among free amino acids, Gln (47.76-68.70 mg/L), Arg (79.29-125.41
mg/L), Thr (68.93-96.69 mg/L), Ala (93.36-125.79 mg/L) and Pro (210.18-284.67 mg/L)
were the most abundant in 2012 Sauvignon blanc juice (Table 24). The high rate of
calcium nitrate (High soil-GMV) increased the concentrations of Ser and Gln in 2012
(Table 24). In 2013, Gln (46.30-87.06 mg/L), Arg (103.04-269.44 mg/L), Glu (108.55-
139.75 mg/L), Ala (86.65-147.35 mg/L), and Pro (158.14-222.31) were among the most
abundant free amino acids in Sauvignon blanc juice (Table 25). In 2013, the low rate of
calcium nitrate (Low soil-GMV) increased the concentration of Arg; the high rate of
calcium nitrate (High soil-GMV) increased the concentration of five amino acids (Gln,
Arg, Thr, Ala, and Ile); and season long foliar nitrogen applications (Foliar-GMV)
increased the concentration of eleven amino acids (Gln, Arg, Thr, Ala, Lys, Tyr, Met,
Val, Ile, Leu, and Phe) (Table 25). Berries treated with season-long foliar nitrogen
(Foliar-GMV) exhibited a 65.6% increase in total free amino acids (1164.77 mg/L) in
2013 (Table 25).
CON: Among free amino acids, Ser (24.52-37.36 mg/L), Gln (28.81-41.11 mg/L),
Arg (53.48-95.13 mg/L), Ala (22.84-38.91 mg/L), and Pro (740.09-1078.24 mg/L) were
the most abundant in 2012 Merlot juice (Table 26). In 2013, His (50.03-65.52 mg/L), Arg
(62.18-130.86 mg/L), Glu (44.19-70.43 mg/L), Ala (55.75-80.67 mg/L), and Pro (573.30-
932.59 mg/L) were among the most abundant free amino acids in Merlot juice (Table 27).
Treatments had no effect on total free amino acids or individual amino acid
concentrations in 2012 or 2013 (Table 26 and Table 27).
68
AREC: Among free amino acids, Ser (60.94-81.47 mg/L), Gln (42.92-75.32
mg/L), Arg (230.08-313.85 mg/L), Thr (68.13-90.10 mg/L), and Pro (1841.89-2165.85
mg/L) were the most abundant in 2012 Petit Manseng juice (Table 28). Treatments had
no effect on total free amino acids or individual amino acid concentrations in 2012. In
2013, Ser (80.38-145.72 mg/L), Gln (67.72-135.76 mg/L), Arg (284.74-612.26 mg/L),
Thr (90.00-158.66 mg/L), and Pro (2309.71-2591.74 mg/L) were among the most
abundant amino acids in Petit Manseng juice (Table 29). In 2013, the post-véraison foliar
treatment (Post-véraison foliar) increased the concentration of total free amino acids by
30.3%, which corresponded to an increase in 9 individual amino acids (Ser, Gln, Arg,
Gly, Glu, Thr, Ala, Lys, and Met) (Table 29).

69
Table 24. GMV: Treatment effects on Sauvignon blanc juice amino acid concentration (mg/L) at harvest in 2012. Free amino acid concentration (mg/L)e
Tre
atm
ent
ab Amino acidsc His Asn Ser Gln Arg Gly Asp Glu Thr Ala Pro Lys Tyr Met Val Ile Leu Phe Total:
# Increased by treatment
Significanced ns ns 0.0345 0.0312 ns ns ns ns ns ns ns ns ns ns ns ns ns ns ns -- Control 18.04 5.26 47.76b 79.29b 243.25 2.91 41.46 50.97 68.93 93.36 210.18 3.11 4.08 0.91 19.73 8.34 9.96 7.95 915.48 -- Low soil 17.95 14.02 59.90ab 101.51ab 317.19 3.47 48.6 62.21 87.39 118.73 268.39 3.86 5.5 1.26 25.01 10.28 12.82 9.99 1168.07 0 High soil 18.81 7.27 68.70a 125.41a 364.32 3.92 50.88 69.82 96.69 125.79 284.67 4.01 5.8 1.31 26.13 10.89 13.53 10.12 1288.1 2
Foliar 20.55 5.65 57.00ab 110.62ab 358.88 3.75 45.71 57.76 87.5 118.94 255.41 3.28 5.28 1.56 24.45 10.14 12.6 10 1189.08 0 a. Control= no nitrogen; Low soil= 30kg N/ha of calcium nitrate at bloom; High soil= 30kg N/ha of calcium nitrate at bloom + 30kg N/ha of calcium nitrate 6 weeks post-bloom; Foliar= 40 kg N/ha of urea applied evenly in roughly 7 applications between bloom and véraison. b. Separation of means using Tukey’s HSD (α=0.05). c. Cysteine was not identified in 2012 samples. d. Significance of treatment effects on response variables using two-way ANOVA (p>F; ns= not significant). e. Table represents the average amino acid concentrations from n=6 biological repetitions.
Table 25. GMV: Treatment effects on Sauvignon blanc juice amino acid concentration (mg/L) at harvest in 2013. Free amino acid concentration (mg/L)e # Increased
by treatment
Tre
atm
ent
ab Amino acidsc His Ser Gln Arg Gly Asp Glu Thr Ala Pro Lys Tyr Met Val Ile Leu Phe Total:
Significanced ns 0.0046 0.0064 0.0006 ns 0.0318 ns 0.001 0.0043 ns 0.0227 0.0369 0.0169 0.023 0.0056 0.0147 0.0237 0.0063 --
Control 46.45 32.63b 46.30b 103.04b 3.39 25.03ab 108.55 39.11b 86.65b 158.14 2.75b 4.27b 2.43b 18.98b 9.81b 9.47b 8.45b 703.47b -- Low soil 46.05 41.89ab 69.94ab 194.70a 4.02 22.97b 119.71 54.85ab 117.95ab 195.53 3.29ab 5.90ab 2.911ab 23.01ab 12.44ab 12.34ab 9.81ab 937.33ab 1 High soil 48.78 44.29ab 77.78a 200.19a 4.33 26.83ab 134.4 60.26a 134.94a 202.66 3.43ab 5.30ab 2.64b 24.26ab 13.12a 13.24ab 10.10ab 1006.64ab 5
Foliar 56.03 53.33a 87.06a 269.44a 4.82 29.95a 139.75 73.03a 147.35a 222.31 4.12a 6.12a 4.29a 26.82a 14.11a 14.31a 11.93a 1164.77a 11 a. Control= no nitrogen; Low soil= 30kg N/ha of calcium nitrate at bloom; High soil= 30kg N/ha of calcium nitrate at bloom + 30kg N/ha of calcium nitrate 6 weeks post-bloom; Foliar= 40 kg N/ha of urea applied evenly in roughly 7 applications between bloom and véraison. b. Separation of means using Tukey’s HSD (α=0.05). c. Cysteine and asparagine was not identified in 2013 samples. d. Significance of treatment effects on response variables using two-way ANOVA (p>F; ns= not significant). e. Table represents the average amino acid concentrations from n=6 biological repetitions.

70
Table 26. CON: Treatment effects on Merlot juice amino acid concentration (mg/L) at harvest in 2012. Free amino acid concentration (mg/L)e
Tre
atm
ent
ab
Amino acidsc His Asn Ser Gln Arg Gly Asp Glu Thr Ala Pro Lys Tyr Met Val Ile Leu Phe Total: # Increased
by treatment Significanced ns ns ns ns 0.0157 ns ns ns ns ns ns ns ns ns ns ns ns ns ns --
Control 12.71 10.51 28.99 32.75 62.56ab 2.14 13.75 13.41 15.36 27.18 783.48 1.58 1.05 0.55 21.21 13.05 13.68 2.81 1056.79 -- Low compost 14.77 11.74 33.28 38.11 56.74ab 5.22 14.49 13.2 16.75 22.84 878.75 2.42 2.23 1.14 19.04 16 15.87 2.92 1165.5 0 High compost 12.01 11.38 28.7 31.76 64.11ab 2.24 13.76 13.07 15.21 28.29 740.13 1.85 1.4 1.17 20.99 12.35 13 2.6 1014.05 0 Clover + low
compost 15.44 13.47 30.55 34.61 75.74ab 2.19 11.97 12.78 17.31 24.6 949.46 1.56 0.73 0.74 24.36 14.85 16.14 3.07 1249.58 0
Clover + high compost
10.43 11.61 24.52 28.81 53.48b 1.89 12.3 12.11 12.57 26.13 740.09 1.51 1.32 0.67 19.84 12.48 12.39 2.11 984.27 0
Low soil 13.16 12.17 37.36 41.11 88.23ab 2.67 15.26 15.98 21.74 36.12 1004.04 1.97 1.36 1.23 27.58 17.15 18.47 3.7 1359.31 0 High soil 16.5 15.29 33.96 40.27 95.13a 2.54 16.4 16.65 21.1 38.91 1078.24 1.62 1.28 0.74 26.36 15.47 18.25 3.9 1442.66 0
Post-harvest 10.62 12.62 29.02 32.88 61.59ab 2.2 14.33 13.1 14.88 31.4 810.86 1.79 1.16 0.74 23.37 14.1 14.71 3.03 1092.42 0 a. Control= no nitrogen; Low compost= 33.5 kg N/ha applied as compost at bloom in 2012; High compost= 67 kg N/ha applied as compost at bloom in 2012; Clover + low compost= 33.5 kg N/ha applied as compost at bloom in 2012 + early season establishment of red clover in 2012, and red clover+crimson clover in 2013; Clover + high compost= 67 kg N/ha applied as compost at bloom in 2012 + early season establishment of red clover in 2012, and red clover+crimson clover in 2013; Low soil= 15kg N/ha of calcium nitrate at bloom + 15kg N/ha of calcium nitrate 6 weeks post-bloom; High soil= 30kg N/ha of calcium nitrate at bloom + 30kg N/ha of calcium nitrate 6 weeks post-bloom; Post-harvest= 30kg N/ha of calcium nitrate applied post-harvest. b. Separation of means using Tukey’s HSD (α=0.05). c. Cysteine was not identified in 2012 samples. d. Significance of treatment effects on response variables using two-way ANOVA (p>F; ns= not significant). e. Table represents the average amino acid concentrations from n=6 biological repetitions.
Table 27. CON: Treatment effects on Merlot juice amino acid concentration (mg/L) at harvest in 2013. Free amino acid concentration (mg/L)e
Tre
atm
ent
ab
Amino acidsc His Ser Gln Arg Gly Asp Glu Thr Ala Pro Lys Tyr Met Val Ile Leu Phe Total: # Increased
by treatment
Significanced ns ns ns ns ns ns ns ns ns ns ns ns ns ns ns ns ns ns --
Control 50.75 54.53 40.64 65.77 4.81 24.03 55.87 37.96 67.02 788.23 3.93 3.74 4.21 24.29 12.72 13.78 11.12 1265.38 -- Low compost 53.95 48.21 40.45 62.18 3.74 16.65 55.58 27.89 57.53 573.3 3.73 3.3 4.37 22.36 13.88 14.03 10.53 1011.69 0 High compost 50.83 40.76 33.38 66.99 3.36 11.76 44.19 24.79 54.9 587.2 2.44 3.71 3.46 19.01 11.38 13.12 10.86 982.14 0 Clover + low
compost 59.66 55.9 50.2 97.51 3.66 17.33 64.55 25.81 72.52 887.39 4.19 4.08 4.03 26.23 12.75 16.73 13.22 1415.77 0
Clover + high compost
65.52 51.97 46.9 108.85 4.14 25.86 56.18 21.47 67.76 699.15 3.41 5.74 4.92 22.12 13.67 14.43 13.3 1225.41 0
Low soil 51.22 44.04 33.03 65.83 3.25 13.37 50.03 27.89 55.73 709.57 2.63 3.55 3.47 20.8 12.7 14.04 9.73 1120.89 0 High soil 50.03 52.22 48.97 130.86 4.13 17.52 57.83 37.09 72.16 882.91 3.66 4.78 4.53 24.36 13.44 16.17 13.91 1434.58 0
Post-harvest 59.37 58.32 48.2 130.25 4.55 17.04 70.43 39.77 80.67 932.59 3.96 4.05 4.37 26.21 16.49 12.7 16.08 1525.05 0 a. Control= no nitrogen; Low compost= 33.5 kg N/ha applied as compost at bloom in 2012; High compost= 67 kg N/ha applied as compost at bloom in 2012; Clover + low compost= 33.5 kg N/ha applied as compost at bloom in 2012 + early season establishment of red clover in 2012, and red clover+crimson clover in 2013; Clover + high compost= 67 kg N/ha applied as compost at bloom in 2012 + early season establishment of red clover in 2012, and red clover+crimson clover in 2013; Low soil= 15kg N/ha of calcium nitrate at bloom + 15kg N/ha of calcium nitrate 6 weeks post-bloom; High soil= 30kg N/ha of calcium nitrate at bloom + 30kg N/ha of calcium nitrate 6 weeks post-bloom; Post-harvest= 30kg N/ha of calcium nitrate applied post-harvest. b. Separation of means using Tukey’s HSD (α=0.05). c. Cysteine and asparagine was not identified in 2013 samples. d. Significance of treatment effects on response variables using two-way ANOVA (p>F; ns= not significant). e. Table represents the average amino acid concentrations from n=6 biological repetitions.

71
Table 28. AREC: Treatment effects on Petit Manseng juice amino acid concentration (mg/L) at harvest in 2012. Free amino acid concentration (mg/L)e
Tre
atm
ent ab
Amino acidsc His Asn Ser Gln Arg Gly Asp Glu Thr Ala Pro Lys Tyr Met Val Ile Leu Phe Total: # Increased
by treatment Significanced ns ns ns ns ns ns ns ns ns ns ns ns ns ns ns ns ns ns ns --
Control 37.22 5.70 65.64 47.64 236.53 4.36 14.12 30.96 68.13 46.62 1977.01 2.11 19.08 2.53 43.7 22.59 41.47 18.27 2678.69 -- Herbicide Control
20.66 29.64 61.42 49.34 230.08 4.75 17.49 28.37 68.46 34.10 1841.89 2.39 13.87 4.17 38.27 21.51 38.57 18.90 2523.9 0
Pre-Véraison Foliar
29.34 5.73 60.94 42.92 233.03 4.62 13.83 27.71 69.7 38.88 1933.35 1.96 19.12 2.30 44.95 24.48 44.04 19.97 2616.85 0
Post-Véraison Foliar
32.53 5.82 81.47 75.32 313.85 5.71 15.5 34.86 90.1 59.87 2165.85 2.17 22.75 4.01 52.17 30.08 40.72 17.09 3049.87 0
a. CC control= cover cropped panels received no additional nitrogen; Herbicide control= herbicide panels received no additional nitrogen; Pre-véraison foliar= 5 kg N/ha foliar urea applied 2 weeks pre-véraison + 5 kg N/ha foliar urea applied 1 weeks pre-véraison to cover cropped vines; Post-véraison foliar= 5 kg N/ha foliar urea applied 1 week post-véraison + 5 kg N/ha foliar urea applied 2 weeks post-véraison to cover cropped vines. All treatments received 10kg N/ha as calcium nitrate at bloom in 2012 and 2013 as part of general vineyard maintenance. b. Separation of means using Tukey’s HSD (α=0.05). c. Cysteine was not identified in 2012 samples. d. Significance of treatment effects on response variables using two-way ANOVA (p>F; ns= not significant). e. Table represents the average amino acid concentrations from n=6 biological repetitions.
Table 29. AREC: Treatment effects on Petit Manseng juice amino acid concentration (mg/L) at harvest in 2013. Free amino acid concentration (mg/L)e
Tre
atm
ent
ab
Amino acidsc His Ser Gln Arg Gly Asp Glu Thr Ala Pro Lys Tyr Met Val Ile Leu Phe Total: # Increased
by treatment
Significanced ns 0.0101 0.0042 0.0131 0.0076 0.0265 0.0069 0.0268 0.0003 ns 0.0096 ns 0.0061 ns ns ns ns ns --
Control 65.12 80.38b 67.72b 284.74b 6.17b 28.63 36.35b 90.00b 37.34b 2309.71 3.44b 24.57 5.11b 43.99 26.46 40.87 21.35 3171.94 -- Herbicide Control
68.52 105.93ab 90.48ab 371.32ab 7.34ab 43.05 50.37ab 115.40ab 57.44b 2520.2 4.43ab 26.25 6.17b 51.41 27.67 43.40 24.97 3616.37 0
Pre-Véraison Foliar
63.91 100.07ab 80.06b 357.62ab 7.82ab 30.70 40.78b 110.65ab 48.67b 2284.17 4.83b 26.99 5.57b 48.56 28.77 41.00 23.58 3299.8 0
Post-Véraison Foliar
78.45 145.72a 135.76a 612.26a 10.14a 40.68 58.74a 158.66a 86.35a 2591.74 3.64a 36.55 9.36a 58.94 25.99 48.4 30.11 4135.46 9
a. CC control= cover cropped panels received no additional nitrogen; Herbicide control= herbicide panels received no additional nitrogen; Pre-véraison foliar= 5 kg N/ha foliar urea applied 2 weeks pre-véraison + 5 kg N/ha foliar urea applied 1 weeks pre-véraison to cover cropped vines; Post-véraison foliar= 5 kg N/ha foliar urea applied 1 week post-véraison + 5 kg N/ha foliar urea applied 2 weeks post-véraison to cover cropped vines. All treatments received 10kg N/ha as calcium nitrate at bloom in 2012 and 2013 as part of general vineyard maintenance. b. Separation of means using Tukey’s HSD (α=0.05). c. Cysteine and asparagine was not identified in 2013 samples. d. Significance of treatment effects on response variables using two-way ANOVA (p>F; ns= not significant). e. Table represents the average amino acid concentrations from n=6 biological repetitions
72
Components of yield GMV: Treatments had no effect on components of yield in 2011, 2012, or 2013 (Table 30). CON: Treatments had no effect on components of yield in 2012 or 2013 (Table 31). AREC: Treatment had no effect on number of clusters per vine in 2012 or 2013 (Table
32). Vines grown in the presence of an herbicide strip (Herbicide control) exhibited
increased cluster weights, corresponding to a 50.0% increase in total vine yield in 2012
(Table 32). Berries from herbicide plots (Herbicide control) had greater berry weights
than berries treated with a post-véraison foliar (Post-véraison foliar) application, but they
did not have significantly greater berry weights than the cover crop control (CC control)
(Table 32).

73
Table 30. GMV: Treatment effects on Sauvignon blanc components of yield in 2011-2013. 2011 Harvest 2012 Harvest 2013 Harvest
Treatmenta Individual berry
weight (g)
Clusters per vine
Vine Yield (kg)
Cluster weight
(g)
Individual berry
weight (g)
Clusters per vine
Vine Yield (kg)
Cluster weight
(g)
Individual berry
weight (g)
Clusters per vine
Projected vine yield
(kg)
Projected cluster
weight (g) Significance
b ns ns ns ns n/a ns ns ns n/a ns ns ns
Control 2.0 21 6.1 291.0 . 41 5.2 128.5 . 50 9.1 179.7 Low soil 2.1 22 6.5 296.7 . 42 5.4 127.0 . 50 9.8 196.0 High soil 2.0 23 6.5 284.8 . 41 4.9 119.8 . 55 10.6 193.8
Foliar 2.0 22 6.0 277.2 . 38 4.5 122.3 . 50 9.3 184.3 a. Control= no nitrogen; Low soil= 30kg N/ha of calcium nitrate at bloom; High soil= 30kg N/ha of calcium nitrate at bloom + 30kg N/ha of calcium nitrate 6 weeks post-bloom; Foliar= 40 kg N/ha of urea applied evenly in roughly 7 applications between bloom and véraison. b. Significance of treatment effects on response variables using two-way ANOVA (p>F; ns= not significant). Table 31. CON: Treatment effects on Merlot components of yield in 2012 and 2013.
2012 Harvest 2013 Harvest Treatmenta Individual
berry weight (g)
Clusters per vine
Vine Yield (kg)
Cluster weight
(g)
Individual berry
weight (g)
Clusters per vine
Projected vine yield
(kg)
Projected cluster
weight (g) Significanceb ns ns ns ns ns ns ns ns
Control 0.99 64 2.7 41.9 1.18 60 0.3 27.9 Low compost 0.99 60 3.1 48.8 1.20 70 0.3 24.1
High compost
1.01 63 3.3 51.4 1.22 76 0.4 25.3
Clover+ low compost
0.95 70 3.4 48.1 1.18 88 0.4 22.5
Clover+ high compost
0.99 75 3.4 45.5 1.20 97 0.4 21.4
Low soil 0.93 62 2.7 41.4 1.21 73 0.3 21.1 High soil 0.99 68 2.6 38.1 1.23 79 0.4 24.0
Post-harvest 1.07 72 3.7 51.9 1.23 76 0.4 25.3 a. Control= no nitrogen; Low compost= 33.5 kg N/ha applied as compost at bloom in 2012; High compost= 67 kg N/ha applied as compost at bloom in 2012; Clover + low compost= 33.5 kg N/ha applied as compost at bloom in 2012 + early season establishment of red clover in 2012, and red clover+crimson clover in 2013; Clover + high compost= 67 kg N/ha applied as compost at bloom in 2012 + early season establishment of red clover in 2012, and red clover+crimson clover in 2013; Low soil= 15kg N/ha of calcium nitrate at bloom + 15kg N/ha of calcium nitrate 6 weeks post-bloom; High soil= 30kg N/ha of calcium nitrate at bloom + 30kg N/ha of calcium nitrate 6 weeks post-bloom; Post-harvest= 30kg N/ha of calcium nitrate applied post-harvest. b. Significance of treatment effects on response variables using two-way ANOVA (p>F; ns= not significant).
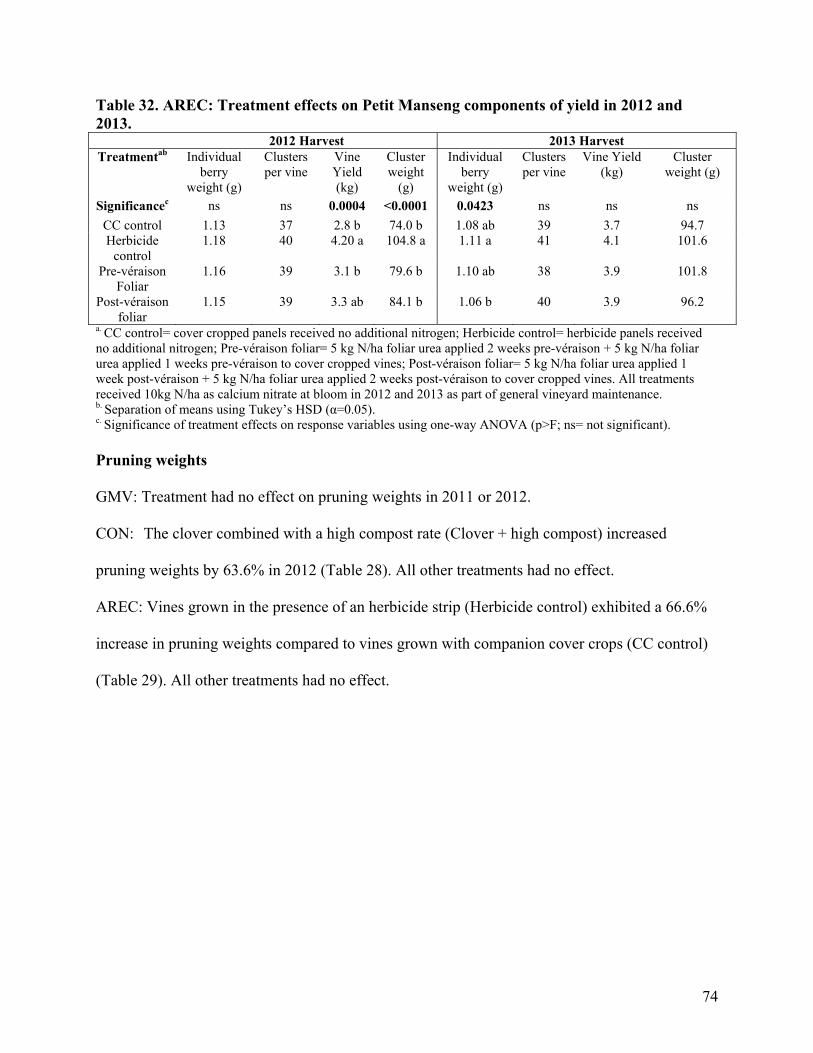
74
Table 32. AREC: Treatment effects on Petit Manseng components of yield in 2012 and 2013.
2012 Harvest 2013 Harvest Treatmentab Individual
berry weight (g)
Clusters per vine
Vine Yield (kg)
Cluster weight
(g)
Individual berry
weight (g)
Clusters per vine
Vine Yield (kg)
Cluster weight (g)
Significancec ns ns 0.0004 <0.0001 0.0423 ns ns ns
CC control 1.13 37 2.8 b 74.0 b 1.08 ab 39 3.7 94.7 Herbicide
control 1.18 40 4.20 a 104.8 a 1.11 a 41 4.1 101.6
Pre-véraison Foliar
1.16 39 3.1 b 79.6 b 1.10 ab 38 3.9 101.8
Post-véraison foliar
1.15 39 3.3 ab 84.1 b 1.06 b 40 3.9 96.2
a. CC control= cover cropped panels received no additional nitrogen; Herbicide control= herbicide panels received no additional nitrogen; Pre-véraison foliar= 5 kg N/ha foliar urea applied 2 weeks pre-véraison + 5 kg N/ha foliar urea applied 1 weeks pre-véraison to cover cropped vines; Post-véraison foliar= 5 kg N/ha foliar urea applied 1 week post-véraison + 5 kg N/ha foliar urea applied 2 weeks post-véraison to cover cropped vines. All treatments received 10kg N/ha as calcium nitrate at bloom in 2012 and 2013 as part of general vineyard maintenance. b. Separation of means using Tukey’s HSD (α=0.05). c. Significance of treatment effects on response variables using one-way ANOVA (p>F; ns= not significant). Pruning weights GMV: Treatment had no effect on pruning weights in 2011 or 2012.
CON: The clover combined with a high compost rate (Clover + high compost) increased
pruning weights by 63.6% in 2012 (Table 28). All other treatments had no effect.
AREC: Vines grown in the presence of an herbicide strip (Herbicide control) exhibited a 66.6%
increase in pruning weights compared to vines grown with companion cover crops (CC control)
(Table 29). All other treatments had no effect.
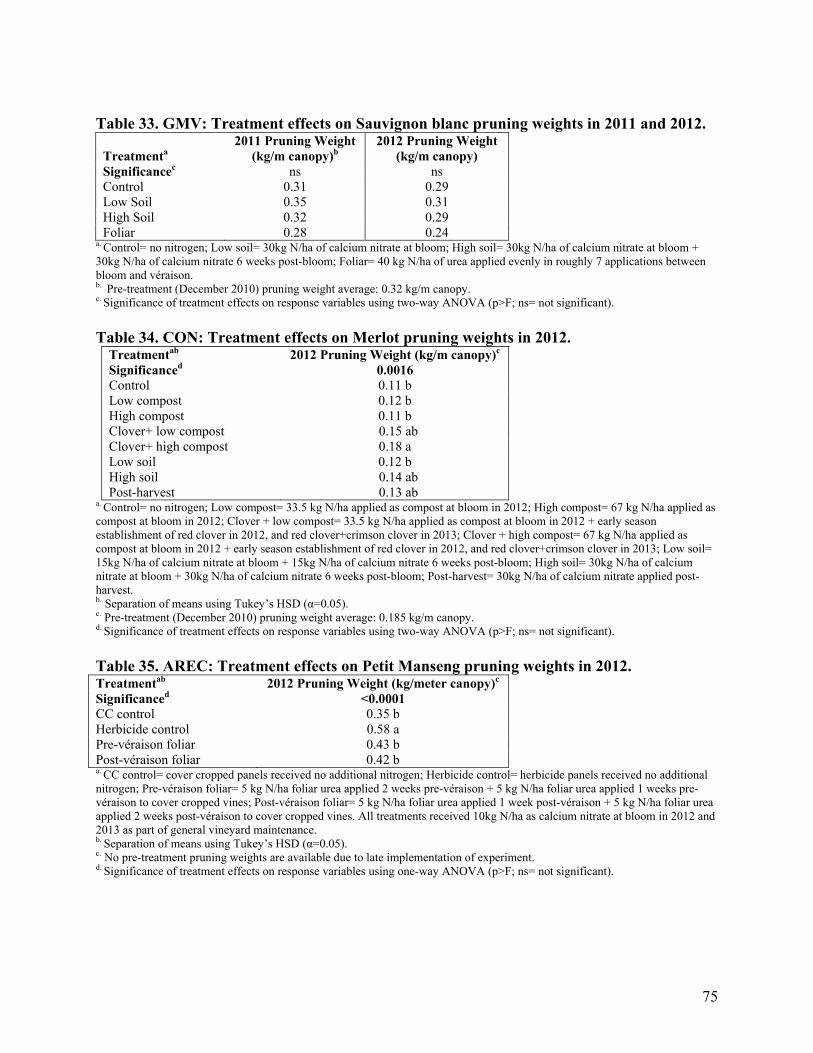
75
Table 33. GMV: Treatment effects on Sauvignon blanc pruning weights in 2011 and 2012.
Treatmenta
2011 Pruning Weight (kg/m canopy)b
2012 Pruning Weight (kg/m canopy)
Significancec ns ns Control 0.31 0.29 Low Soil 0.35 0.31 High Soil 0.32 0.29 Foliar 0.28 0.24
a. Control= no nitrogen; Low soil= 30kg N/ha of calcium nitrate at bloom; High soil= 30kg N/ha of calcium nitrate at bloom + 30kg N/ha of calcium nitrate 6 weeks post-bloom; Foliar= 40 kg N/ha of urea applied evenly in roughly 7 applications between bloom and véraison. b. Pre-treatment (December 2010) pruning weight average: 0.32 kg/m canopy. c. Significance of treatment effects on response variables using two-way ANOVA (p>F; ns= not significant).
Table 34. CON: Treatment effects on Merlot pruning weights in 2012.
Treatmentab 2012 Pruning Weight (kg/m canopy)c
Significanced 0.0016 Control 0.11 b Low compost 0.12 b High compost 0.11 b Clover+ low compost 0.15 ab Clover+ high compost 0.18 a Low soil 0.12 b High soil 0.14 ab Post-harvest 0.13 ab
a. Control= no nitrogen; Low compost= 33.5 kg N/ha applied as compost at bloom in 2012; High compost= 67 kg N/ha applied as compost at bloom in 2012; Clover + low compost= 33.5 kg N/ha applied as compost at bloom in 2012 + early season establishment of red clover in 2012, and red clover+crimson clover in 2013; Clover + high compost= 67 kg N/ha applied as compost at bloom in 2012 + early season establishment of red clover in 2012, and red clover+crimson clover in 2013; Low soil= 15kg N/ha of calcium nitrate at bloom + 15kg N/ha of calcium nitrate 6 weeks post-bloom; High soil= 30kg N/ha of calcium nitrate at bloom + 30kg N/ha of calcium nitrate 6 weeks post-bloom; Post-harvest= 30kg N/ha of calcium nitrate applied post-harvest. b. Separation of means using Tukey’s HSD (α=0.05). c. Pre-treatment (December 2010) pruning weight average: 0.185 kg/m canopy. d. Significance of treatment effects on response variables using two-way ANOVA (p>F; ns= not significant).
Table 35. AREC: Treatment effects on Petit Manseng pruning weights in 2012. Treatmentab 2012 Pruning Weight (kg/meter canopy)c
Significanced <0.0001 CC control 0.35 b Herbicide control 0.58 a Pre-véraison foliar 0.43 b Post-véraison foliar 0.42 b a. CC control= cover cropped panels received no additional nitrogen; Herbicide control= herbicide panels received no additional nitrogen; Pre-véraison foliar= 5 kg N/ha foliar urea applied 2 weeks pre-véraison + 5 kg N/ha foliar urea applied 1 weeks pre-véraison to cover cropped vines; Post-véraison foliar= 5 kg N/ha foliar urea applied 1 week post-véraison + 5 kg N/ha foliar urea applied 2 weeks post-véraison to cover cropped vines. All treatments received 10kg N/ha as calcium nitrate at bloom in 2012 and 2013 as part of general vineyard maintenance. b. Separation of means using Tukey’s HSD (α=0.05). c. No pre-treatment pruning weights are available due to late implementation of experiment. d. Significance of treatment effects on response variables using one-way ANOVA (p>F; ns= not significant).
76
Discussion
Establishing cover crops as a floor management system in vineyards is an
effective method to battle excess vine vigor, reduce erosion, reduce soil nitrate leaching,
and improve soil structure (Baumgartner, Smith, and Bettiga 2005; Celettte, Findeling,
and Gary 2009; Fourie, Louw, and Agenbag 2007; Gulick et al. 1994). In grape growing
regions such as Virginia, where many sites are characterized by steep terrain and the
growing season is conducive to excess vegetative vine growth, cover crops have become
an increasingly common component of routine vineyard management. The consequences
of allowing cover crops to become intensively established in areas that do not perform
annual hilling-up are evident by intense competition for soil nitrogen, leading to
diminished vine and berry nitrogen concentrations.
The objectives of this study were two-fold. First, I sought to determine the most
efficient method and optimal time for annual nitrogen applications, such that cover crop
growth could be maintained for its intended benefits, while adequate vine nitrogen and
berry YAN were achieved. Second, I sought to determine if different fertilization
methods affected the amino acid concentration of mature berries and, if so, to consider
how that may affect the sensory component of the resultant wines. A wide range of
treatments were evaluated in this study: some were common practices currently
employed on many vineyards (e.g., soil nitrogen treatments); others have yet to gain
common usage in commercial vineyards (e.g., compost and leguminous cover crops); still
others are not typically considered sufficient for perennial nitrogen requirements (e.g.,
sole reliance on foliar fertilization). This study sought to develop a fertilization
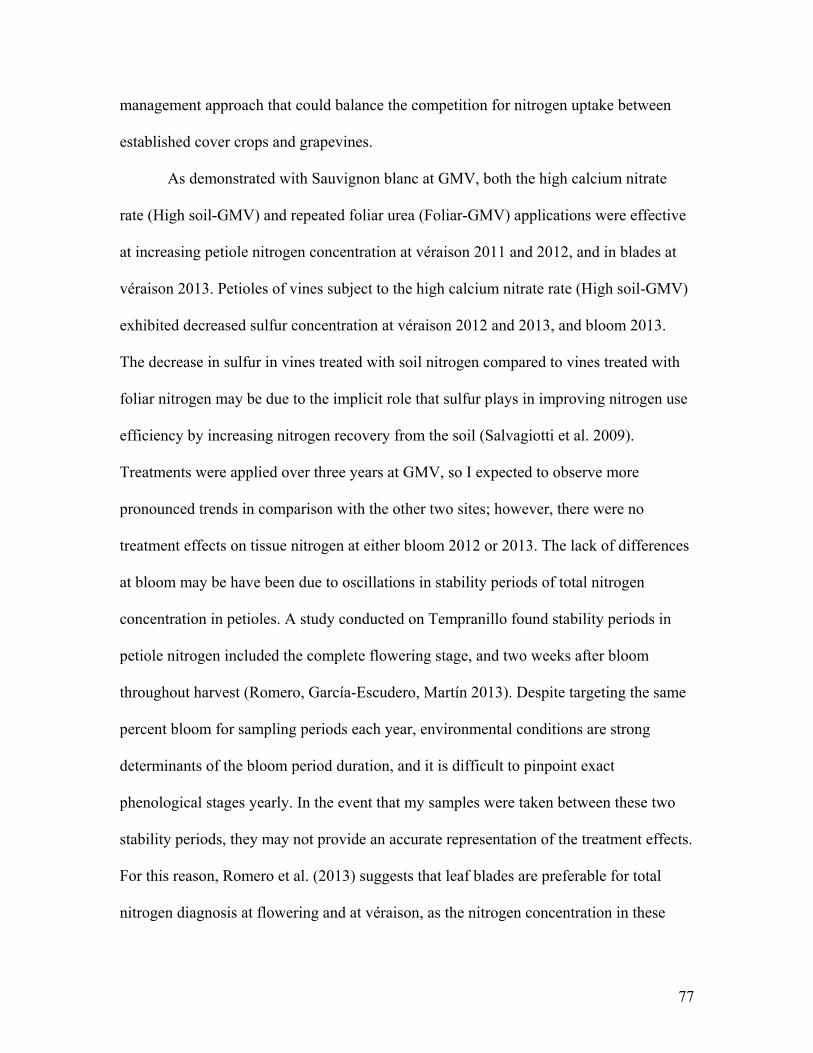
77
management approach that could balance the competition for nitrogen uptake between
established cover crops and grapevines.
As demonstrated with Sauvignon blanc at GMV, both the high calcium nitrate
rate (High soil-GMV) and repeated foliar urea (Foliar-GMV) applications were effective
at increasing petiole nitrogen concentration at véraison 2011 and 2012, and in blades at
véraison 2013. Petioles of vines subject to the high calcium nitrate rate (High soil-GMV)
exhibited decreased sulfur concentration at véraison 2012 and 2013, and bloom 2013.
The decrease in sulfur in vines treated with soil nitrogen compared to vines treated with
foliar nitrogen may be due to the implicit role that sulfur plays in improving nitrogen use
efficiency by increasing nitrogen recovery from the soil (Salvagiotti et al. 2009).
Treatments were applied over three years at GMV, so I expected to observe more
pronounced trends in comparison with the other two sites; however, there were no
treatment effects on tissue nitrogen at either bloom 2012 or 2013. The lack of differences
at bloom may be have been due to oscillations in stability periods of total nitrogen
concentration in petioles. A study conducted on Tempranillo found stability periods in
petiole nitrogen included the complete flowering stage, and two weeks after bloom
throughout harvest (Romero, García-Escudero, Martín 2013). Despite targeting the same
percent bloom for sampling periods each year, environmental conditions are strong
determinants of the bloom period duration, and it is difficult to pinpoint exact
phenological stages yearly. In the event that my samples were taken between these two
stability periods, they may not provide an accurate representation of the treatment effects.
For this reason, Romero et al. (2013) suggests that leaf blades are preferable for total
nitrogen diagnosis at flowering and at véraison, as the nitrogen concentration in these
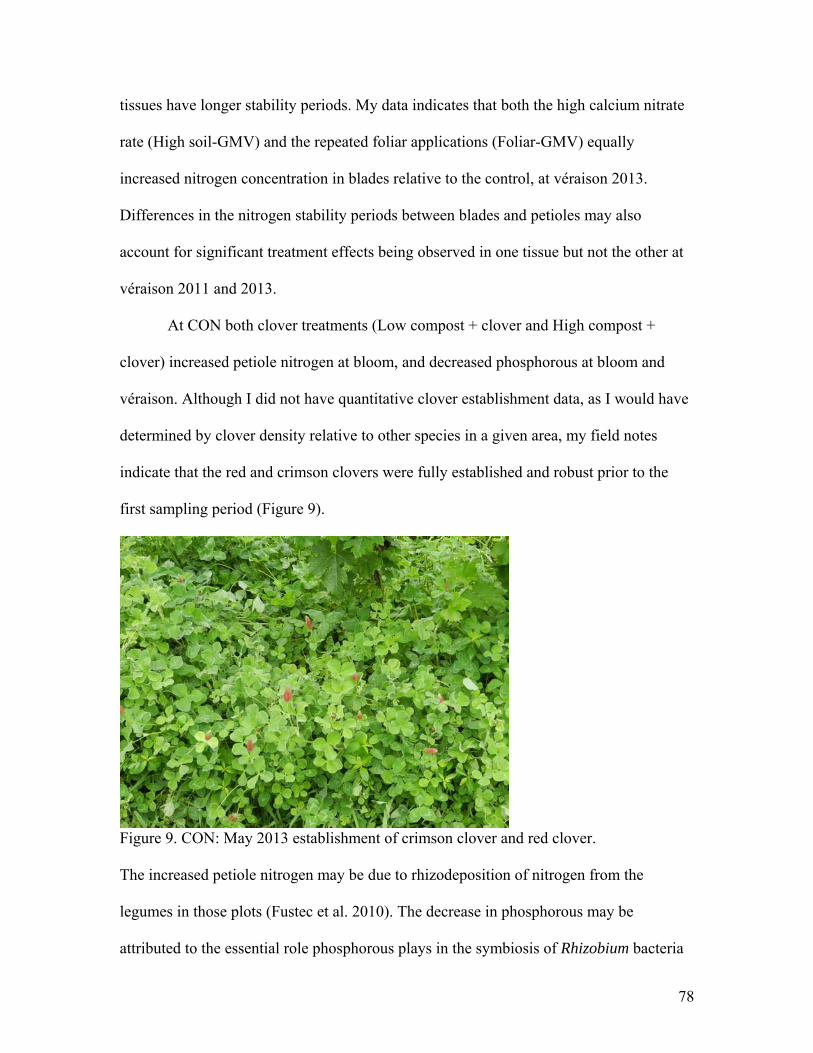
78
tissues have longer stability periods. My data indicates that both the high calcium nitrate
rate (High soil-GMV) and the repeated foliar applications (Foliar-GMV) equally
increased nitrogen concentration in blades relative to the control, at véraison 2013.
Differences in the nitrogen stability periods between blades and petioles may also
account for significant treatment effects being observed in one tissue but not the other at
véraison 2011 and 2013.
At CON both clover treatments (Low compost + clover and High compost +
clover) increased petiole nitrogen at bloom, and decreased phosphorous at bloom and
véraison. Although I did not have quantitative clover establishment data, as I would have
determined by clover density relative to other species in a given area, my field notes
indicate that the red and crimson clovers were fully established and robust prior to the
first sampling period (Figure 9).
Figure 9. CON: May 2013 establishment of crimson clover and red clover. The increased petiole nitrogen may be due to rhizodeposition of nitrogen from the
legumes in those plots (Fustec et al. 2010). The decrease in phosphorous may be
attributed to the essential role phosphorous plays in the symbiosis of Rhizobium bacteria

79
and host plants. Rhizobium bacteria require phosphorous, in the form of ATP, in order to
fix atmospheric nitrogen into ammonium. It is likely that the clover plants were
aggressively competing with the grapevines to obtain enough phosphorous to support the
energy demands of their nodules, and subsequently those vines exhibited a decrease in
phosphorous (International Rice Research 1990).
Foliar applications (Post-véraison foliar and Pre-véraison foliar) did not affect the
macronutrient concentration or micronutrient content in Petit Manseng vines. Vines
grown in the presence of an herbicide strip (Herbicide control) exhibited increased
nitrogen content in petioles, relative to vines grown with companion cover crops (CC
control). This is in agreement with other studies that have observed reduced petiole
nutrient status in Chardonnay vines grown in the presence of under-trellis cover crops,
which they attribute to a decrease in water supply and subsequent nutrient uptake (Tesic,
Keller, and Hutton 2007).
A handheld chlorophyll meter was used to assess chlorophyll content because it
was previously demonstrated that CCI values are significantly associated with leaf
chlorophyll content and leaf nitrogen concentration in grapevines (Porro et al. 2001). In a
study on Chardonnay vines, the coefficients of determination for CCI readings and leaf
nitrogen content ranged from 0.95 at fruit set to 0.64 at harvest (Porro et al. 2001). The
coefficients of determination for CCI readings and petiole or blade nitrogen concentration
were much weaker in my experiment than values previously reported, but they were also
computed on a season-long basis rather than at individual sampling periods. Of the three
varieties in this study, a linear relationship was only significant between CCI readings
and nitrogen concentration in Petit Manseng petioles and Sauvignon blanc blades. The

80
lack of a strong correlation between Merlot and Sauvignon blanc petiole nitrogen
concentration and CCI values and variations in leaf greenness, may be a result of vine
age, rootstock, stage of growth, sun exposure, air temperature, or other nutrient
deficiencies (Porro et al. 2001). Due to the fact that a calibration standard – plotting
measured chlorophyll content against CCI readings – was not performed for each variety
in this study, CCI values were not adjusted and cannot be compared across varieties. My
decision to not perform a calibration standard was justified by my primary interest being
the relative CCI values within each variety, as the treatments in this study were not
applied to all subjects.
Despite the poor correlations found in the regression analysis, the effect of
nitrogen treatment on CCI values for all varieties closely resembled the outcomes of the
petiole nutrient analysis. The high calcium nitrate rate (High soil-GMV) was most
effective at increasing leaf chlorophyll content in Sauvignon blanc vines. Similarly a high
calcium nitrate rate (High soil-CON) was the most effective at increasing leaf chlorophyll
content in Merlot vines. The clover treatments (Low compost + clover, High compost +
clover) and post-harvest calcium nitrate treatment (Post-harvest) also increased Merlot
CCI values, but not as dramatically. The substantial effect of the 2012 post-harvest
calcium nitrate (Post-harvest) treatment on 2013 leaf chlorophyll content was
unexpected, given its low rate compared to other treatments. One explanation for the
increased CCI values may be attributed to efficient nitrogen uptake and translocation by
Merlot after cover crop growth and competition had been suppressed late in the 2012
season. Neither of the foliar applications made to Petit Manseng vines had an effect on
CCI values. This was not unexpected, given that the pre-véraison foliar treatment was

81
only implemented for three of the four sampling periods and that the post-véraison foliar
treatment was only implemented for half of the sampling periods. Petit Manseng vines
grown in the presence of an herbicide strip had 28.4% higher CCI values than vines
grown with an under-trellis cover crop present. This supports previous findings of under-
trellis cover crops reducing vine nutrient status (Tesic, Keller, and Hutton 2007).
Canopy density did not change as a function of nitrogen treatment for any variety
in this study as indicated by the EPQA parameters of interest. Moreover, vines grown in
the presence of an herbicide strip (Herbicide control) did not have less dense canopies
when compared to vines grown with companion cover crops. This contradicts previous
reports of under-trellis cover crops significantly reducing canopy congestion in Cabernet
Sauvignon vines (Hatch, Hickey, Wolf 2011). Fruit zone light interception was decreased
by the two compost treatments (Low compost and High compost), the clover combined
with a low compost rate (Clover + low compost), and both calcium nitrate rates in Merlot
(Low soil-CON and High-soil CON); however, given the lack of treatment effect on other
growth parameters, it is more likely that inconsistent leaf removal was responsible for
differences in PPFD readings. The lack of treatments effects on EPQA parameters may
be explained by adequate rainfall being received in both years of the experiment. Ingels
et al. (2005) found that when Merlot vines in intensively cover cropped systems were
supplemented with adequate irrigation, there were no cover crop treatment effects on
shoot growth.
While my primary goal was to assess which nitrogen fertilization methods are
most efficient at increasing vine and berry nitrogen, I also sought to determine whether
any of the fertilization methods had unwanted consequences on berry maturation.
82
Nitrogen treatments had no effect on berry ripening and maturation in Merlot, Sauvignon
blanc, or Petit Manseng berries, as determined by soluble solids, titratable acidity, and
pH. One exception was with Petit Manseng vines grown in the presence of an herbicide
strip (Herbicide control) which demonstrated decreased °Brix at harvest 2013. This is in
agreement with previous reports of under-trellis cover crops increasing total soluble
solids in Cabernet Sauvignon (Wheeler, Black, and Pickering 2005).
The recommended concentration for YAN is a function of the pre-fermentation
sugar concentration of juice, but 140 mg N/L must is generally considered the absolute
minimum concentration required to successfully complete fermentation (Bell et al. 2005).
Although diammonium phosphate (DAP) and autolyzed yeast can be added to musts to
increase YAN levels, there are some documented drawbacks to their use. First, there are
legal restrains on the amount of DAP that can be added to a must. In the United States it
corresponds to an increase of 200 mg N/L, and in the European Union it corresponds to
an increase of only 68 mg N/L (TTB, 21 CFR 184.1141). In situations where starting
YAN is extremely low, DAP additions may not provide adequate nitrogen for yeast
metabolism. Nonetheless, DAP additions are considered inferior to musts containing a
naturally abundant mixture of amino acids because yeast can directly incorporate the
amino acids into protein, rather than synthesizing new amino acids and wasting energy
(Bell and Henschke 2005). The use of autolyzed yeast are proposed as a retort to this
concern because they provide the must with a source of amino nitrogen and are marketed
as promoting more complex aromas in wine. Yet, evidence suggests that musts higher in
naturally occurring amino acids produce superior wine. Previous authors report that berry
tissue amino acid composition is genetically fixed for each variety, while the amino acid
83
composition of other tissues (e.g., roots) is approximately the same across varieties
(Oungoulian 2012). Consequently, signature amino acid profiles are considered to play
an integral role in the formation of varietal character (Oungoulian 2012). By this logic,
naturally enhancing a variety’s pre-determined amino acid profile is more likely to
improve the formation of varietal aromas.
Although not significant in 2012, the post-véraison foliar treatment (Post-véraison
foliar) increased Petit Manseng berry YAN at harvest by 51.0% and 69.8% in 2012 and
2013, respectively. In 2012 the post-véraison foliar treatment (Post-véraison foliar) did
not increase the concentration of any free amino acid; however, it increased the
concentration of nine amino acids in 2013. Threonine has been demonstrated to have the
greatest influence on wine aroma composition by way of its concentration being most
correlated with aromas related to esters and fatty acid synthesis (Hernández-Orte, Cacho,
and Ferreira 2002). In this study, the concentration of threonine was increased by the
post-véraison foliar treatment. The pre-véraison foliar treatment (Pre-véraison foliar) did
not have an affect on berry YAN or amino acid composition. This is possibly due to the
pre-véraison applied nitrogen being diverted to vegetative growth, instead of to the
berries. My findings are in accordance with previous reports of post-véraison nitrogen
applications increasing berry YAN due to increased fruit-sink strength at this time
(Rodriguez-Lovelle and Gaudillere 2002).
The high calcium nitrate rate (High soil-CON) was the only treatment that
increased Merlot berry YAN at harvest, and was limited to 2013. Moreover, no treatment
affected the free amino acid composition of Merlot berries at harvest in either year. Given
the low berry YAN values each year (58-108 mg N/L) compared to other varieties in this

84
study (119-306 mg N/L) UPLC reaction volumes could have been reduced for the Merlot
samples to enable more accurate quantifications.
Foliar fertilization (Foliar-GMV) consistently increased Sauvignon blanc berry
YAN in all three years of this study and the high calcium nitrate rate (High soil-GMV)
increased berry YAN in 2011 and 2013. Although the high calcium nitrate rate (High
soil-GMV) did not significantly increase berry YAN in 2012, it increased the individual
concentration of Ser and Gln. This result has limited practical importance due to the fact
that other studies have demonstrated glutamine does not have an influential role in aroma
development (Hernández-Orte, Cacho, and Ferreira 2002). The foliar treatment did not
have an affect on individual free amino acid concentrations in 2012 despite its affect on
berry YAN. In 2013, the low calcium nitrate rate (Low soil-GMV), high calcium nitrate
rate (High soil-GMV) and foliar fertilization (Foliar-GMV) all significantly increased
YAN by one, five, and eleven amino acids, respectively. My results are in close
agreement with previous reports of foliar nitrogen fertilization increasing the
concentration of all measured amino acids (except lysine) in Riesling berries, with soil-
applied ammonium nitrate only increasing the concentration of five amino acids
(asparagine, glutamic acid, arginine, threonine, and alanine) (Cheng and Lakso 2010). Of
the amino acids identified as having an influential role in aroma development
(Hernández-Orte, Cacho, and Ferreira 2002), threonine and alanine were both increased
by the high calcium nitrate rate (High soil-GMV) and foliar fertilization (Foliar-GMV).
Nitrogen treatments had no effect on components of yield in Merlot, Sauvignon
blanc, or Petit Manseng vines; however, vines grown in the presence of an herbicide strip
(Herbicide control) exhibited increased cluster weights, corresponding to a 50% increase

85
in total vine yield in 2012. Similarly, nitrogen treatments had limited effects on pruning
weights, with the exception of vines grown in the presence of an herbicide strip
(Herbicide control) exhibiting a 66.6% increase compared to the cover cropped control
vines (CC control). These findings were in agreement with previous reports of under-
trellis cover crops decreasing vine yields and pruning weights (Hatch, Hickey, Wolf
2011; Tesic, Keller, and Hutton 2007). In 2012, the clover combined with a high compost
rate increased pruning rates by 63.6% compared to the control. Given the poor
establishment of the clover in 2012, I attribute this increase to the combined effects of the
high compost rate with disking the plots and subsequently temporarily removing the
cover crop competition. The clover combined with the low compost rate also increased
pruning weights by 36.4%, although this difference was not significant.

86
Conclusion
Results from this study varied, possibly due to the different varieties being tested,
the different sites under consideration, the varying degrees of vineyard floor
establishment, and other variations in routine vineyard management practices (e.g., spray
schedule, leaf pulling, pruning, fertilization of other nutrients). Nonetheless, this study
helped identify nitrogen treatments that effectively increase berry YAN and the
concentration of specific amino acids, without interfering with berry ripening or
inhibiting the primary purpose of utilizing cover crops to curtail vine vigor. Although no
treatment in this study wholly increased all parameters of vine nitrogen status (as
determined by nutrient analyses of petioles and blades, and CCI readings), it did provide
a baseline of how growers might integrate fertilization approaches. Given the combined
success of foliar nitrogen applications to Petit Manseng and Sauvignon blanc increasing
berry YAN and individual amino acids, with the positive effects of high rates of soil-
applied calcium nitrate on improving chlorophyll content and petiole nitrogen in Merlot
and Sauvignon blanc, I believe an integrated approach may be an effective fertilization
practice to help alleviate some of the competition for nitrogen uptake between established
cover crops and grapevines. Coupling a high rate of soil-applied calcium nitrate with a
post-véraison foliar application of urea may facilitate adequate vine nitrogen status while
significantly increasing berry YAN and individual amino acids, thereby boosting the
potential to improve the overall aroma profile of resultant wines. The results from this
study suggest establishing clover as the under-trellis cover crop may aid in improving
vine nitrogen status; as such, future work could focus on improving establishment of
clover in vineyards and potentially combining leguminous cover crops with post-véraison

87
foliar nitrogen applications. In terms of how increasing the concentration of individual
amino acids in berries may affect sensory components of wine, future work should
include metabolomics profiling and be conducted on multiple varieties to account for the
genetic differences in amino acid accumulation and the formation of specific metabolites.
In those studies, it would be valuable to correlate berry amino acid concentrations and
specific metabolites with sensory analyses.
88
References
Aubin, A., M. Hynes, and J. Shockcor. 2007. Acquity UPLC for the rapid analysis of
amino acids in wine. Waters Corporation, Appl. Note. Bair, K.E., J.R. Davenport, and R.G. Stevens. 2008. Release of available nitrogen after
incorporation of a legume cover crop in concord grape. HortScience 43: 875-880. Bates, T.R., R.M. Dunst, and P. Joy. 2002. Seasonal dry matter, starch, and nutrient
distribution in 'Concord' grapevine roots. HortScience 37: 313-316. Baumgartner, K., R.F. Smith, and L. Bettiga. 2005. Weed control and cover crop
management affect mycorrhizal colonization of grapevine roots and arbuscular mycorrhizal fungal spore populations in a California vineyard. Mycorrhiza 15: 111-119.
Baumgartner, K., K.L. Steenwerth, and L. Veilleux. 2008. Cover-crop systems affect weed communities in a California vineyard. Weed Sci. 56: 596-605.
Bell, S.-J., and P.A. Henschke. 2005. Implications of nitrogen nutrition for grapes, fermentation and wine. Australian Journal of Grape and Wine Research 11: 242-295.
Beltran, G., B. Esteve-Zarzoso, N. Rozès, A. Mas, and J.M. Guillamón. 2005. Influence of the timing of nitrogen additions during synthetic grape must fermentations on fermentation kinetics and nitrogen consumption. J. Agric. Food Chem. 53: 996-1002.
Boynton, D. 1954. Nutrition by Foliar Application. Annual Review of Plant Physiology 5: 31-54.
Buchannan, B. B., W. Gruissem, R. L. Jones. 2000. Biochemistry& Molecular Biology of Plants. American Society of Plant Physiologists. Rockville, MD, USA. pp. 358-410. Celette, F., A. Findeling, and C. Gary. 2009. Competition for nitrogen in an unfertilized
intercropping system: The case of an association of grapevine and grass cover in a Mediterranean climate. European Journal of Agronomy 30: 41-51.
Chaudhary, M.I., J.J. Adu-Gyamfi, H. Saneoka, N.T. Nguyen, R. Suwa, S. Kanai, H.A. El-Shemy, D.A. Lightfoot, and K. Fujita. 2008. The effect of phosphorus deficiency on nutrient uptake, nitrogen fixation and photosynthetic rate in mashbean, mungbean and soybean. Acta Physiologiae Plantarum 30: 537-544.
Cheng, L., Lakso, A.N. 2010. Developmental changes of berry composition in ‘Riesling’ as affected by cropload, water stress and nitrogen supply. Progress Report to Eastern Viticulture Consortium and NY Wine/Grape Foundation.
Cheng, L.L., G.H. Xia, and T. Bates. 2004. Growth and fruiting of young 'Concord' grapevines in relation to reserve nitrogen and carbohydrates. J. Am. Soc. Hort. Sci. 129: 660-666.
Cheng, X., and K. Baumgartner. 2004. Arbuscular mycorrhizal fungi-mediated nitrogen transfer from vineyard cover crops to grapevines. Biol. Fertility Soils 40: 406-412.
Christensen, L.P., A.N. Kasimatis, and F.L. Jensen. 1978. Grapevine nutrition and fertilization in the San Joaquin Valley. Division of Agricultural Sciences, University of California, Berkeley.
89
Conradie, W.J. 1986. Utilisation of nitrogen by the grape-vine as affected by time application and soil type. South Africa Journal of Enology and Viticulture 76-82. Conradie, W.J. 1991. Distribution and translocation of nitrogen absorbed during early
summer by 2-year-old grapevines grown in sand culture. American Journal of Enology and Viticulture 42: 180-190.
———. 1992. Partitioning of nitrogen in grapevines during autumn and the utilization of nitrogen reserves during the following growing season. South Africa Journal of Enology and Viticulture 13: 45-51.
Deluc, L.G., D.R. Quilici, A. Decendit, J. Grimplet, M.D. Wheatley, K.A. Schlauch, J.M. Merillon, J.C. Cushman, and G.R. Cramer. 2009. Water deficit alters differentially metabolic pathways affecting important flavor and quality traits in grape berries of Cabernet Sauvignon and Chardonnay. BMC Genomics 10: 212-212.
Eynard, G., Morando, A., Lovisolo, C. and Bovio, M. . 2000. Nitrogen effects on yield and canopy of 'white Muscat' grapevine. . Act Hort. 512: 47-54.
Fourie, J.C., P.J.E. Louw, and G.A. Agenbag. 2007. Cover crop management in a Sauvignon blanc/Ramsey vineyard in the semi-arid Olifants River Valley, South Africa. 2. Effect of different cover crops and cover crop management practices on grapevine performance. South Africa Journal of Enology and Viticulture 28: 81-91.
Fustec, J., F. Lesuffleur, S. Mahieu, and J.-B. Cliquet. 2010. Nitrogen rhizodeposition of legumes. A review. Agronomy for Sustainable Development 30: 57-66.
Garde-Cerdán, T., and C. Ancín-Azpilicueta. 2008. Effect of the addition of different quantities of amino acids to nitrogen-deficient must on the formation of esters, alcohols, and acids during wine alcoholic fermentation. LWT - Food Science and Technology 41: 501-510.
Goldspink, B.H., C. Gordon. 1991. Response of Vitis vinifera cv. Sauvignon blanc grapevines to timed applications of nitrogen fertilizers. In Proceedings of the International Symposium on Nitrogen in Grapes and Wine, Seattle, USA (American Society for Enology and Viticulture) 255-258.
Gouthu, S., P.A. Skinkis, J. Morre, C.S. Maier, and L.G. Deluc. 2012. Berry nitrogen status altered by cover cropping: Effects on berry hormone dynamics, growth and amino acid composition of Pinot noir. Food Chem. 135: 1-8.
Guerra, B., and K. Steenwerth. 2012. Influence of Floor Management Technique on Grapevine Growth, Disease Pressure, and Juice and Wine Composition: A Review. American Journal of Enology and Viticulture 63: 149-164.
Gulick, S.H., D.W. Grimes, D.S. Munk, and D.A. Goldhamer. 1994. Cover-crop-enhanced water infiltration of a slowly permeable fine sandy loam. Soil Sci. Soc. Am. J. 58: 1539-1546.
Habtegebrial, K., and B.R. Singh. 2009. Response of Wheat Cultivars to Nitrogen and Sulfur for Crop Yield, Nitrogen Use Efficiency, and Protein Quality in the Semiarid Region. J. Plant Nutr. 32: 1768-1787.
Hanson, E.J., and G.S. Howell. 1995. Nitrogen accumulation and fertilizer use efficiency by grapevines in short-season growing areas. HortScience 30: 504-507.

90
Hatch, T.A., C.C. Hickey, and T.K. Wolf. 2011. Cover Crop, Rootstock, and Root Restriction Regulate Vegetative Growth of Cabernet Sauvignon in a Humid Environment. American Journal of Enology and Viticulture 62: 298-311.
Hernández-Orte, P., J.F. Cacho, and V. Ferreira. 2002. Relationship between varietal amino acid profile of grapes and wine aromatic composition. Experiments with model solutions and chemometric study. J. Agric. Food Chem. 50: 2891-2899.
Hernández-Orte, P., M.J. Ibarz, J. Cacho, and V. Ferreira. 2005. Effect of the addition of ammonium and amino acids to musts of Airen variety on aromatic composition and sensory properties of the obtained wine. Food Chem. 89: 163-174.
Holzapfel, B.P., and M.T. Treeby. 2007. Effects of timing and rate of N supply on leaf nitrogen status, grape yield and juice composition from Shiraz grapevines grafted to one of three different rootstocks. Australian Journal of Grape and Wine Research 13: 14-22.
Hostetler, G.L., I.A. Merwin, M.G. Brown, and O. Padilla-Zakour. 2007. Influence of undervine floor management on weed competition, vine nutrition, and yields of Pinot noir. American Journal of Enology and Viticulture 58: 421-430.
Huang, Z., and C.S. Ough. 1991. Amino-acid profiles of commerican grape juices and wines. American Journal of Enology and Viticulture 42: 261-267.
Ingels, C.A. 1998. University of California Division of Agriculture and Natural Resources. Cover cropping in vineyards: a grower's handbook.
University of California, Division of Agriculture and Natural Resources, Berkeley.
Ingels, C.A., K.M. Scow, D.A. Whisson, and R.E. Drenovsky. 2005. Effects of cover crops on grapevines, yield, juice composition, soil microbial ecology, and gopher activity. American Journal of Enology and Viticulture 56: 19-29.
International Rice Research, I. 1990. Phosphorus requirements for sustainable agriculture in Asia and Oceania: Proceedings of a symposium 6-10 March 1989.
Jreij, R., M.T. Kelly, A. Deloire, E. Brenon, and A. Blaise. 2009. Combined effects of soil-applied and foliar-applied nitrogen on the nitrogen composition and distribution in water stressed Vitis vinifera L. cv Sauvignon blanc grapes. Journal International des Sciences de la Vigne et du Vin 43: 179-187.
Keller, M. 2010. The science of grapevines: anatomy and physiology. Academic Press/Elsevier, Amsterdam.
Keller, M., M. Kummer, and M.C. Vasconcelos. 2001. Soil nitrogen utilisation for growth and gas exchange by grapevines in response to nitrogen supply and rootstock. Australian Journal of Grape and Wine Research 7: 2-11.
King, A.P., and A.M. Berry. 2005. Vineyard δ15N, nitrogen and water status in perennial clover and bunch grass cover crop systems of California's central valley. Agriculture, Ecosystems & Environment 109: 262-272.
Kliewer, W.M., and N.K. Dokoozlian. 2005. Leaf area/crop weight ratios of grapevines: Influence on fruit composition and wine quality. American Journal of Enology and Viticulture 56: 170-181.
Lacroux, F., O. Tregoat, C. Van Leeuwen, A. Pons, T. Tominaga, V. Lavigne-Cruege, and D. Dubourdieu. 2008. Effect of foliar nitrogen and sulphur application on aromatic expression of Vitis vinifera L. cv. Sauvignon blanc. Journal International Des Sciences De La Vigne Et Du Vin 42: 125-132.

91
Larchevêque, C., A. Casanova, and V. Dupuch. 1998. Relation between kinetics of alcoholic fermentation and must nitrogen content. Influence of nitrogen fertilization on Vitis vinifera cv. Muscadelle with permanent grass cover. Nature and concentration levels of some amino acids of musts. Journal International des Sciences de la Vigne et du Vin 32: 137-151.
Lasa, B., S. Menendez, K. Sagastizabal, M.E.C. Cervantes, I. Irigoyen, J. Muro, P.M. Aparicio-Tejo, and I. Ariz. 2012. Foliar application of urea to “Sauvignon Blanc” and “Merlot” vines: doses and time of application. Plant Growth Regulation 67: 73-81.
Lavezzi, A., G. Pascarella, P. Sivilotti, D. Tomasi, and A. Altissimo. 2005. Cover cropping systems in vineyard: grass species and row management as affecting grapevine performance. In, pp. 635-641. Groupe d'Etude des Systemes de COnduite de la vigne (GESCO), Geisenheim.
Ledgard, S.F., and K.W. Steele. 1992. Biological nitrogen-fixation in mixed legume grass pastures. Plant Soil 141: 137-153.
Lee, J., and K.L. Steenwerth. 2011. Rootstock and vineyard floor management influence on ‘Cabernet Sauvignon’ grape yeast assimilable nitrogen (YAN). Food Chem. 127: 926-933.
Linsenmeier, A.W., U. Loos, and O. Lohnertz. 2008. Must composition and nitrogen uptake in a long-term trial as affected by timing of nitrogen fertilization in a cool-climate riesling vineyard. American Journal of Enology and Viticulture 59: 255-264.
Madge, D. 2005. Organic viticulture: An Australian manual. . Publication of Department of Primary Industries. , State of Victoria, Australia. .
Maigre, D. 1997. Influence of grassing down and nitrogen fertilizer on the quality of Chasselas wines. Progrès Agricole et Viticole 114: 255-258.
———. 2001. Permanent grass cover and nitrogen fertilizer use in cv. Gamay in central Valais. 3: light and thermal microclimate of the clusters. Revue Suisse de Viticulture, Arboriculture et Horticulture 33: 305-308.
———. 2002. Behaviour of Pinot noir in the presence of permanent grass cover and under the influence of nitrogen fertilization. 2. Analytical and organoleptic results. Revue Suisse de Viticulture, Arboriculture et Horticulture 34: 239-244.
Maigre, D., and J. Aerny. 2000. Permanent grass cover and nitrogen fertilization trial on cv. Gamay in western Switzerland. 2. Analytic and sensorial results. Revue Suisse de Viticulture, Arboriculture et Horticulture 32: 279-285.
Martinson, T., Nisbet, M., Katharine Mansfield, A., Wilsey, B. . 2012. First Look at Botrytis Ratings and YAN in Foliar Nitrogen Spray Trial. In Veraison to Harvest. pp. 4-6, Cornell Unviersity
Mengel, K. 2002. Alternative or complementary role of foliar supply in mineral nutrition. 33-47.
Meyers, J.M., and J.E. Vanden Heuvel. 2008. Enhancing the precision and spatial acuity of point quadrat analyses via calibrated exposure mapping. American Journal of Enology and Viticulture 59: 425-431.
Miller, A.C., S.R. Wolff, L.F. Bisson, and S.E. Ebeler. 2007. Yeast strain and nitrogen supplementation: Dynamics of volatile ester production in Chardonnay juice fermentations. American Journal of Enology and Viticulture 58: 470-483.
92
Neilsen, G.H., D. Neilsen, P. Bowen, C. Bogdanoff, and K. Usher. 2010. Effect of Timing, Rate, and Form of N Fertilization on Nutrition, Vigor, Yield, and Berry Yeast-Assimilable N of Grape. American Journal of Enology and Viticulture 61: 327-336.
Oliva, J., T. Garde-Cerdán, A.M. Martínez-Gil, M. Rosario Salinas, and A. Barba. 2011. Fungicide effects on ammonium and amino acids of Monastrell grapes. Food Chem. 129: 1676-1680.
Oungoulian, S.E. 2012. The Grapevine Nitrogen Economy: Amino Acids and Ammonium Accumulation and Partitioning. ProQuest, UMI Dissertations Publishing.
Ovalle, C., A. Pozo, M.B. Peoples, and A. Lavín. 2010. Estimating the contribution of nitrogen from legume cover crops to the nitrogen nutrition of grapevines using a 15N dilution technique. Plant Soil 334: 247-259.
Patrick, A.E., R. Smith, K. Keck, and A.M. Berry. 2004. Grapevine uptake of N-15-labeled nitrogen derived from a winter-annual leguminous cover-crop mix. American Journal of Enology and Viticulture 55: 187-190.
Porro, D., Dorigatti, C., Stefanini, M. and Ceschini, A. 2001. Use of SPAD meter in diagnosis of nutritional status in apple and grapevine. Acta Hort. (ISHS) 564: 243-252.
Pradubsuk, S., and J.R. Davenport. 2010. Seasonal Uptake and Partitioning of Macronutrients in Mature 'Concord' Grape. J. Am. Soc. Hort. Sci. 135: 474-483.
Price, S.F., P.J. Breen, M. Valladao, and B.T. Watson. 1995. Cluster sun exposure and quercetin in pinot-noir grapes and vine. American Journal of Enology and Viticulture 46: 187-194.
Rizk, M.H. 2012. Effect of some legume cover crops and organic fertilizer on petiole nutrient content, productivity and fruit composition of 'Thompson seedless' grapevines. Acta Hort. (ISHS) 933: 381-387.
Rodriguez-Lovelle, B., and J.P. Gaudillere. 2002. Carbon and nitrogen partitioning in either fruiting or non-fruiting grapevines: effects of nitrogen limitation before and after veraison. Australian Journal of Grape and Wine Research 8: 86-94.
Romero, I., E. García-Escudero, and I. Martín. 2013. Leaf blade versus petiole analysis for nutritional diagnosis of Vitis vinifera L. cv. Tempranillo. American Journal of Enology and Viticulture 64: 50-64.
Salvagiotti, F., K.G. Cassman, J.E. Specht, D.T. Walters, A. Weiss, and A. Dobermann. 2008. Nitrogen uptake, fixation and response to fertilizer N in soybeans: A review. Field Crops Res. 108: 1-13.
Salvagiotti, F., J.M. Castellarin, D.J. Miralles, and H.M. Pedrol. 2009. Sulfur fertilization improves nitrogen use efficiency in wheat by increasing nitrogen uptake. Field Crops Res. 113: 170-177.
Schaller, K. 2005. Proline accumulation in grapevine berries during growth and development: is it a quality indicator? Bulletin de l'OIV 78: 321-333.
Schreiber, A.T., N. Merkt, R. Blaich, and R. Fox. 2002. Distribution of foliar applied labelled nitrogen in grapevines (Vitis vinifera L., cv. Riesling). Acta Hort. (ISHS) 594:139-148.
93
Schreiner, R.P. Mycorrhizas and mineral acquisition in grapevines. 2005. In Proceedings of the the Soil Environment and Vine Mineral Nutrition Symposium, San Diego, CA (American Society for Enology and Viticulture) 49-60.
Schultz, H.R., and O. Lohnertz. 2003. Management of vine-growing soils. The utilization of cover crops in Germany and its possible effects on wine quality. Progrès Agricole et Viticole 120: 175-178.
Smart, R., and M. Robinson. 1991. Sunlight into wine: a handbook for winegrape canopy management. Winetitles, Adelaide.
Spayd, S.E., R.G. Stevens, R.L. Wample, R.G. Evans, C.G. Edwards, and D. Webster. 2000. Impact of nitrogen fertilization on vine performance and juice and wine composition of 'Riesling' grapes (Vitis vinifera L.) in Washington State. 65-75.
Spring, J.L. 2001. Effect of ground cover type on grapevine performance and wine quality. Results of a trial with Chasselas in the Lake Geneva region. 1. Agronomic results. Revue Suisse de Viticulture, Arboriculture et Horticulture 33: 253-260.
Spring, J.L., and F. Lorenzini. 2006. Effect of urea leaf fertilisers on green grapevine. Obst- und Weinbau 142: 4-7.
Stewart, A.C.H. 2013. Nitrogen composition of interspecific hybrid and Vitis vinifera wine grapes from the Eastern United States. ProQuest, UMI Dissertations Publishing.
Stines, A.P., J. Grubb, H. Gockowiak, P.A. Henschke, P.B. HØJ, and R. Heeswijck. 2000. Proline and arginine accumulation in developing berries of Vitis vinifera L. in Australian vineyards: Influence of vine cultivar, berry maturity and tissue type. Australian Journal of Grape and Wine Research 6: 150-158.
Sweet, R.M., and R.P. Schreiner. 2010. Alleyway Cover Crops Have Little Influence on Pinot noir Grapevines (Vitis vinifera L.) in Two Western Oregon Vineyards. American Journal of Enology and Viticulture 61: 240-252.
Tan, S.Y., and G.D. Crabtree. 1990. Competition between perennial ryegrass sod and chardonnay wine grapes for mineral nutrients HortScience 25: 533-535.
Tesic, D., M. Keller, and R.J. Hutton. 2007. Influence of vineyard floor management practices on grapevine vegetative growth, yield, and fruit composition. American Journal of Enology and Viticulture 58: 1-11.
Torrea, D., C. Varela, M. Ugliano, C. Ancin-Azpilicueta, I. Leigh Francis, and P.A. Henschke. 2011. Comparison of inorganic and organic nitrogen supplementation of grape juice – Effect on volatile composition and aroma profile of a Chardonnay wine fermented with Saccharomyces cerevisiae yeast. Food Chem. 127: 1072-1083.
Toselli, M., M. Thalheimer, and M. Tagliavini. 2004. Leaf uptake and subsequent partitioning of urea-N as affected by the concentration and volume of spray solution and by the shoot leaf position in apple (Malus domestica) trees. J. Horticult. Sci. Biotechnol. 79: 97-100.
Treeby, M.T., B.P. Holzapfel, R.R. Walker, and P.R. Nicholas. 1998. Profiles of free amino acids in grapes of grafted Chardonnay grapevines. Australian Journal of Grape and Wine Research 4: 121-126.
Treeby, M.T., and D.M. Wheatley. 2006. Effect of nitrogen fertiliser on nitrogen partitioning and pool sizes in irrigated Sultana grapevines. Australian Journal of Experimental Agriculture 46: 1207-1215.

94
Ugliano, M., B. Fedrizzi, T. Siebert, B. Travis, F. Magno, G. Versini, and P.A. Henschke. 2009. Effect of nitrogen supplementation and Saccharomyces species on hydrogen sulfide and other volatile sulfur compounds in shiraz fermentation and wine. Journal of Agricultural and Food Chemistry. 57: 4948.
Ugliano, M., R. Kolouchova, and P.A. Henschke. 2011. Occurrence of hydrogen sulfide in wine and in fermentation: influence of yeast strain and supplementation of yeast available nitrogen. J. Ind. Microbiol. Biotechnol. 38: 423-429.
Ugliano, M., B. Travis, I.L. Francis, and P.A. Henschke. 2010. Volatile Composition and Sensory Properties of Shiraz Wines As Affected by Nitrogen Supplementation and Yeast Species: Rationalizing Nitrogen Modulation of Wine Aroma. J. Agric. Food Chem. 58: 12417-12425.
Vilanova, M., T.E. Siebert, C. Varela, I.S. Pretorius, and P.A. Henschke. 2012. Effect of ammonium nitrogen supplementation of grape juice on wine volatiles and non-volatiles composition of the aromatic grape variety Albariño. Food Chem. 133: 124-131.
Vilanova, M., M. Ugliano, C. Varela, T. Siebert, I.S. Pretorius, and P.A. Henschke. 2007. Assimilable nitrogen utilisation and production of volatile and non-volatile compounds in chemically defined medium by Saccharomyces cerevisiae wine yeasts. Appl. Microbiol. Biotechnol. 77: 145-157.
Wermelinger, B., J. Baumgärtner, and A.P. Gutierrez. 1991. A demographic model of assimilation and allocation of carbon and nitrogen in grapevines. Ecol. Model. 53: 1-26.
Wheeler, S.J., A.S. Black, and G.J. Pickering. 2005. Vineyard floor management improves wine quality in highly vigorous Vitis vinifera 'Cabernet Sauvignon' in New Zealand. N. Z. J. Crop Hortic. Sci. 33: 317-328.
Wolf, T.K., A. Natural Resource, and E. Engineering Service. Cooperative. 2008. Wine grape production guide for eastern North America. Natural Resource, Agriculture, and Engineering Service (NRAES) Cooperative Extension, Ithaca, N.Y.
Wolpert, J.A., P.A. Phillips, R.K. Striegler, M.V. McKenry, and J.H. Foott. 1993. Berber orchardgrass tested as cover crop in commercial vineyard. Calif. Agric. 47: 23-25.
Xi, Z., Y. Tao, L. Zhang, and H. Li. 2011. Impact of cover crops in vineyard on the aroma compounds of Vitis vinifera L. cv Cabernet Sauvignon wine. Food Chem. 127: 516-522.
Xi, Z., Z. Zhang, X. Ma, S. Ma, and H. Li. 2010. Effects of vineyard cover crops on main nitrogen compounds in grape berry and wine from Vitis vinifera L. cv. Cabernet Sauvignon. Scientia Agricultura Sinica 43: 4045-4052.
Xia, G.H., and L.L. Cheng. 2004. Foliar Urea Application in the Fall Affects Both Nitrogen and Carbon Storage in Young 'Concord' Grapevines Grown Under a Wide Range of Nitrogen Supply. HortScience 39: 827-828.
Zapata, C., E. Deleens, S. Chaillou, and C. Magne. 2004. Partitioning and mobilization of starch and N reserves in grapevine (Vitis vinifera L.). J. Plant Physiol. 161: 1031-1040.
Zapata, C., C. Magné, E. Deléens, O. Brun, J.C. Audran, and S. Chaillou. 2001. Grapevine culture in trenches: root growth and dry matter partitioning. Australian Journal of Grape and Wine Research 7: 127-131.