Embed Size (px)
Citation preview
Optimizing Electric Propulsion Systemsfor Unmanned Aerial Vehicles
Ohad Gur∗ and Aviv Rosen†
Technion—Israel Institute of Technology, Haifa 32000, Israel
DOI: 10.2514/1.41027
Design of an electric propulsion system for an unmanned aerial vehicle incorporates various disciplines such as the
propeller’s aerodynamic and structural properties, characteristics of the electric system, and characteristics of the
vehicle itself. This makes the design of this propulsion system amultidisciplinary design optimization task. Although
thepresent propellermodel is based onprevious derivations that are described verybriefly, newmodels of the electric
motor and battery pack,which are based on examining existing products on themarket, are described inmore detail.
The propeller model and a model of the electric system, together with various optimization schemes, are used to
design optimal propulsion systems for a mini unmanned aerial vehicle for various goals and under various
constraints. Important design trends are presented, discussed, and explained. Although the first part of the
investigation is based on typical characteristics of the electric system, the second part includes a sensitivity study of
the influence of variations of these characteristics on the optimal system design.
Nomenclature
BEB = battery energy densityBI0 = no-load current parameterBKV = motor speed-constant parameterBP-M = maximum power-to-mass ratioBRa = internal-resistance parameterCD, CL = vehicle’s drag and lift coefficientsCd = blade cross-sectional drag coefficientCLmax = vehicle’s maximum lift coefficientc = chordEB = battery energy capacityg = gravity accelerationKV = motor speed constantIin = driver input currentI0 = motor no-load currentmB = battery-pack massmM = electric motor massMtip = blade tip Mach numbermtotal = total vehicle massm0 = vehicle mass without the propulsion systemPin = electric system input powerPout = motor output powerPout-max = maximum motor output powerR = propeller radiusRa = motor resistancer = radial coordinateSW = wing areaT = thrustt = cross-sectional thicknessVF = airspeedVin = driver input voltageVl = loitering airspeedVst = stall airspeed
Wa = axial induced velocityD = driver efficiencyP = propeller efficiencyP-ideal = ideal propeller efficiencyS = electric system efficiencya = air density = maximal von Mises stress = rotational speed
I. Introduction
M OSTof today’s unmanned aerial vehicles (UAVs) are used forreconnaissance and surveillance missions [1]. Considerable
effort has been directed toward the development of small tacticalUAVs, sometimes referred to as mini or micro UAVs [2,3]. Thesevehicles are applied as tactical surveillance tools, used by soldiers for“behind the hill” reconnaissance purposes. Most of these UAVs areequipped with electric motors that contribute to the simplicity ofoperation and significantly reduce their noise signature.
The propulsion systems of these small UAVs (batteries, motor,propeller, etc.) account for as much as 60% of the vehicle weight [4].Therefore, optimization of the propulsion systems is extremelycrucial.
The electric propulsion system of a typical UAV includes thefollowing components: propeller; electricmotor; energy source; gearbox (optional); driver; wiring, plugs, and connectors; and coolingsystem (optional).
The paper will concentrate on the first three items (propeller,electric motor, and the batteries). Although the other components areimportant, the influence of thefirst three on theUAV’s performance isusually far more significant.
Most of the existing methods for propeller design are based on thewell-known work of Betz [5] from 1919. An example of such adesign is presented in [6]. This approach is based on optimizing thepropeller’s geometry at a certain specific operating condition (a cer-tain combination of airspeed, altitude, and propeller rotationalspeed), such that the power, which is required to obtain a certainpropulsive force at these operating conditions, is minimized (or,alternatively, the thrust produced by a certain power is maximized).An example of such a design is the propeller of Rutan’s Voyager (thefirst nonstop, nonrefueled flight around the world) [7].
The Betz method considers only the aerodynamic efficiency of thepropeller. It does not include structural considerations or the pro-peller’s noise signature. Thus, for practical design of a propellerwhen using the Betzmethod, a serial design process is used. First, theoptimal aerodynamic propeller, having a maximum efficiency, is
Presented as Paper 5916 at the 12th AIAA/ISSMO MultidisciplinaryAnalysis and Optimization Conference, Victoria, British Columbia, Canada,10–12 September 2008; received 15 September 2008; accepted for publi-cation 31 March 2009. Copyright © 2009 by the American Institute ofAeronautics and Astronautics, Inc. All rights reserved. Copies of this papermay be made for personal or internal use, on condition that the copier pay the$10.00 per-copy fee to the Copyright Clearance Center, Inc., 222 RosewoodDrive, Danvers, MA 01923; include the code 0021-8669/09 and $10.00 incorrespondence with the CCC.
∗Researcher, Faculty of Aerospace Engineering; [email protected]. Member AIAA.
†Professor, Faculty of Aerospace Engineering; [email protected]. Fellow AIAA.
JOURNAL OF AIRCRAFT
Vol. 46, No. 4, July–August 2009
1340
defined. Then this propeller is modified to fulfill other goals. Such aprocess has been used extensively [7–9]. The main disadvantage ofsuch an iterative process is that it does not ensure that the final designwill be optimal.
The best approach for the complex design of propellers is to usemultidisciplinary design optimization (MDO) [10,11]. DuringMDO, all of the different design goals and constraints are addressedsimultaneously. Thus, the best compromise between contradictorydesign goals will be reached. This kind of approach has been alreadyapplied to rotary wing designs. Most of the previous investigationswere limited to two disciplines: either aerodynamic and structuralanalyses, mostly for helicopter rotors [12,13], or aerodynamic andacoustic design of propellers [14–19]. Most of the previousinvestigations used a very limited number of design variables, ratherthan the full range of design parameters that are under the authority ofthe designer. Previous investigations also included a limited numberof constraints and did not consider the entire propulsion system(namely, the coupled system: propeller, gearbox, engine, and energysource). For example, [20] does not take into account the enginecharacteristics during the propeller design. Only after the isolatedpropeller optimization are these characteristics used to calculate theperformance of the entire propulsion system, which is themeasure ofthe design quality. Recently, a new comprehensiveMDO design toolfor propeller-based propulsion systems was presented by the authorsthat offers a very highflexibility in choosing the cost function, designvariables, and constraints [21,22].
The design of various electricminiUAVs has been described in thepast [3,4,23–30]. Most of these papers discuss the design consi-derations of the various components and the integration of thesecomponents into the final design.
It is clear from previous studies on electric UAVs, as well as otherpropeller-based propulsion systems, that an optimization of theelectric propulsion system of a UAV should include a simultaneousconsideration of the: propeller, electric motor, and battery. Theperformance and characteristics of the vehicle depend on the stronginteraction between these three.
The purpose of the present study is not to present an optimal designof a specific electric propulsion system for a certain UAV, but ratherto investigate trends and obtain insight into the interactions betweenthe various components of the system. To do that, theoretical modelsof these components are required. Although the propeller model ofthe present study is based on thewell-known blade-element/momen-tum theory, special effort is directed into modeling the electric motorand battery. These models are based on a comprehensive investi-gation of existing motors and batteries, followed by derivations ofrepresentativemodels that include certain parameters. All the variousmodels are combined with various optimization schemes to form acomprehensiveMDO tool that can handle a large number and varietyof design variables and constraints. There is also a large flexibility inchoosing the cost function: namely, the goal of the design.
The newMDOtool is used to study optimal propulsion systems fordifferent design goals (cost functions) and constraints. The inter-actions between the various components of the system are investi-gated, explained, and discussed.
As indicated previously, the analyticalmodels of the electricmotorand battery represent typical existing technologies. Yet these techno-logies exhibit significant variations between products and a contin-uous rate of improvement. Thus, the paper also includes a sensitivitystudy to understand how variations in the characteristics of thevarious electric components can affect the system optimal design.
II. Analysis Tools
The following analysis tools are used to model the components ofthe entire propulsion system: propeller’s aerodynamic model, pro-peller’s structural model, electric motor model, and battery model.The selection of each model is based on the following two consi-derations:
1) It should be sufficiently accurate.2) It should be efficient, because the optimization procedure in-
cludes a very high number of iterations.
The aerodynamic model calculates the distribution of the aero-dynamic loads along the propeller blades. These data are used tocalculate the propeller’s thrust and required power. In addition, thedistribution of the aerodynamic loads is used as an input for thestructural analysis. In the present case, a momentum/blade-elementmodel is used. For regular flight conditions of propellers (uniformaxial flow at high-enough advance ratios), the blade’s cross sectionsdo not experience stall and the momentum/blade-element modelgives results of good accuracy [31]. The blade-element/momentumanalysis can be extended to include the influence of rotation on theaerodynamic behavior of cross sections experiencing stall [32].Momentum/blade-element models are usually much more efficientthan other models; thus, they are suitable for the present purpose.
A structural analysis is essential to ensure that the propeller bladeswill be able to withstand the aerodynamic and inertial loads that actalong them. Common tools for the structural analysis of blades arefinite element models [33]. To reduce the computations, a moreefficient rod model, together with a transfer-matrix formulation, isused [34].
The rod structural model describes the propeller blades as a seriesof straight segments located along the blade’s elastic axis. Thestructural cross-sectional properties are uniform along each segmentand equal to the structural properties of a representative cross sectionof that segment. The transfer-matrix formulation is applied using theboundary conditions of a cantilevered rod (clamped root and free tip).The solution procedure is very efficient and the results are veryaccurate [34].
A. Electric Motor Model
Characteristics of 250 brushless direct-current electric motorswere analyzed. Data for these motors were taken from various Web-based catalogs.‡ The list includes 12 manufacturers that are dividedinto three main groups:
1) Group I contains themanufacturers of heavy-duty/high-voltageelectric motors.
2) Group II contains the manufacturers of high-performance in-dustrial electric motors.
3) Group III contains the manufacturers of aeromodel/hobbyelectric motors.
Heavy-duty motors are characterized by low speed and hightorque. On the other hand, aeromodel motors exhibit high speed andlow torque.
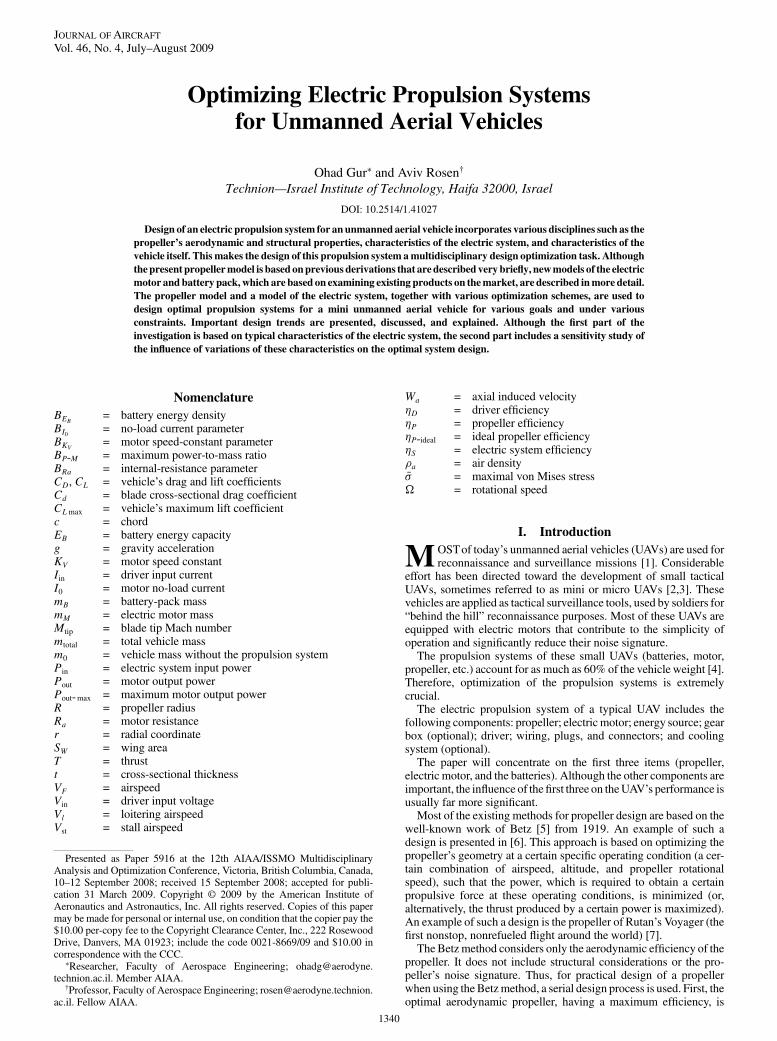
There is a relation between amotormaximumoutput power and itssize/weight [35]. Figure 1 presents themotors’maximumcontinuouspowerPout-max versus theirmassmM. Eachmanufacturer is presentedby a different symbol (there are 12 different symbols). In addition,each symbol indicates to which group (of the aforementioned threegroups) this manufacturer belongs:
1) The heavy-duty group uses solid symbols.2) The high-performance group uses open symbols.3) The aeromodel group uses or symbols.Figure 1 also presents representative boundaries between these
three groups. Heavy-duty motors exhibit a low power-to-weightratio, whereas aeromodel motors exhibit a high power-to-weightratio. It is the goal of any air vehicle to exhibit a high power-to-weightratio, and thus aeromodel motors are natural candidates for UAVapplications. Yet UAV motors are required to present much betterreliability and endurance than hobby motors. This aspect, as well asexperience with existing UAV motors, leads to the conclusion thatgroup II is a better representative of UAV motors.
The motor model of the present study will assume a constantmaximum power-to-mass ratio BP-M [35]:
Pout-max BP-M mM (1)
In group II, BP-M varies between the following limits:
‡Data available online at http://www.bental.co.il/, http://www.alliedmotion.com/, http://www.micromo.com/, http://www.cyclone-usa.com/, and http://www.maxonmotorusa.com/ [retrieved 15 March 2009].
GUR AND ROSEN 1341
110 W=kg< BP-M < 800 W=kg (2)
Equation (2) presents a very wide range of variation of BP-M.Examination of the data in Fig. 1 shows that for a certain series ofproducts from the same manufacturer, different sizes of motorsfollow Eq. (1).
The differences in BP-M between manufacturers, or betweendifferent series of the same manufacturer, probably emerge fromdifferent technologies, design concepts, or manufacturing methods.For the present study, a typical value of BP-M 200 W=kg will beused.
During the present study, electric motors will be described by asimple performance model [36], which is based on the followingassumptions:
1) Power factor is equal to unit. This assumption is applicable tosmall brushless permanent-magnet motors [37].
2) Magnetic losses (eddy/Foucault current and magnetichysteresis) can be neglected.
Using these assumptions, the driver input power Pin and shaftoutput power Pout are given by the following expressions:
Pin Vin Iin (3)
Pout Iin I0 Vin Iin:Ra (4)
where Iin is the driver’s input current,Vin, is the driver’s input voltage,I0 is the current at zero load, and Ra is the motor resistance.
The electric system efficiency S is
S D 1 Iin:Ra
Vin
1 I0
Iin
(5)
where D is the driver efficiency. In the present study, the driverefficiency is considered to be constant: D 0:95. The followingrelation also exists:
Vin Iin Ra KV (6)
where is motor rotational speed and KV is motor speed constant,which is identical to the inverse of torque constant or the inverse ofthe back electromotive force constant.
The preceding described simplified model includes the followingthree motor parameters: speed constant KV , internal resistance Ra,and no-load current I0. Simple relations between these three
parameters will be used. These relations are based on available motordata (see footnote ‡).
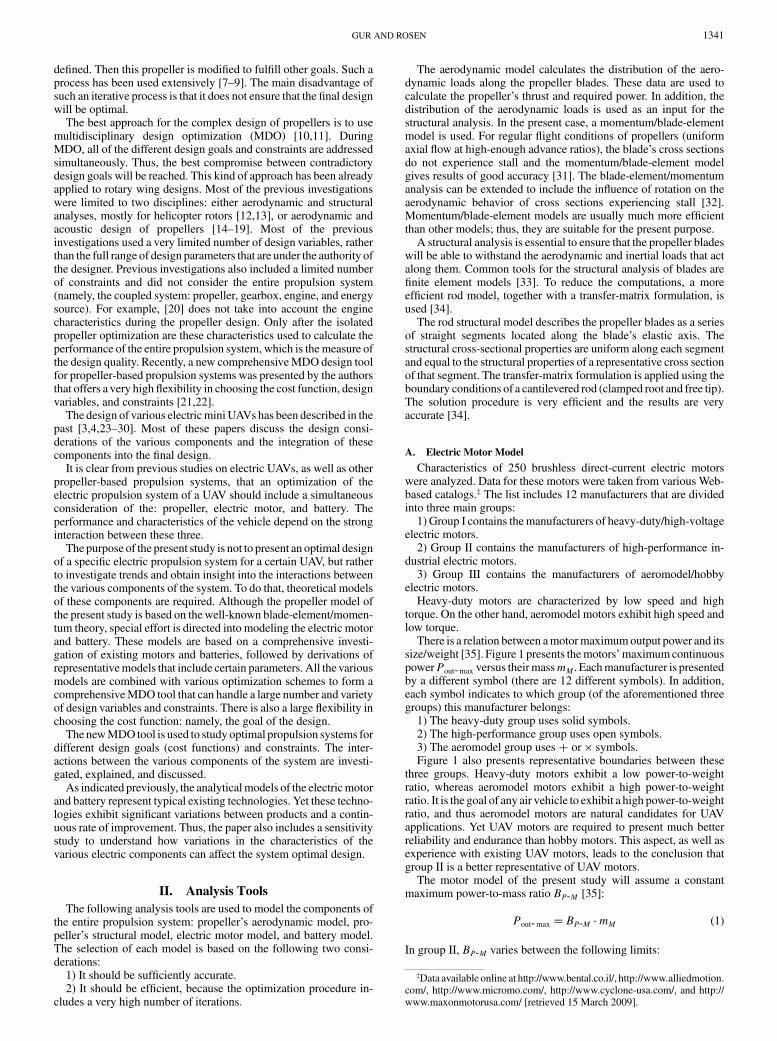
The motor speed constant KV is directly related to the motor size.The torque constant (inverse of speed constant) depends on themotorflux linkage and magnetic circuit: the larger the motor, the larger theflux linkage and torque constant. Consequently, as the rotor becomesheavier, the speed constant decreases. Figure 2 presents motor speedconstant versus motor mass for all the motors that were shown inFig. 1. Figure 2 also includes a database of electric aeromodelmotors.§ This database contains data for about 1300 electric motors,which aremostly shown as a cloud of dots on the upper left side of thefigure.
As indicated previously, as motors become lighter, their speedconstants become higher (heavy-duty motors have low speedconstants); thus, a general relation can be described as follows:
KV rpm=V BKV =mM kg (7)
where BKV is a speed-constant parameter. For most cases, it fallsbetween the following values (see Fig. 2):
50 rpm kg=V< BKV < 600 rpm kg=V (8)
For the present study, a typical value of BKV 170 rpm kg=V willbe used (see Fig. 2).
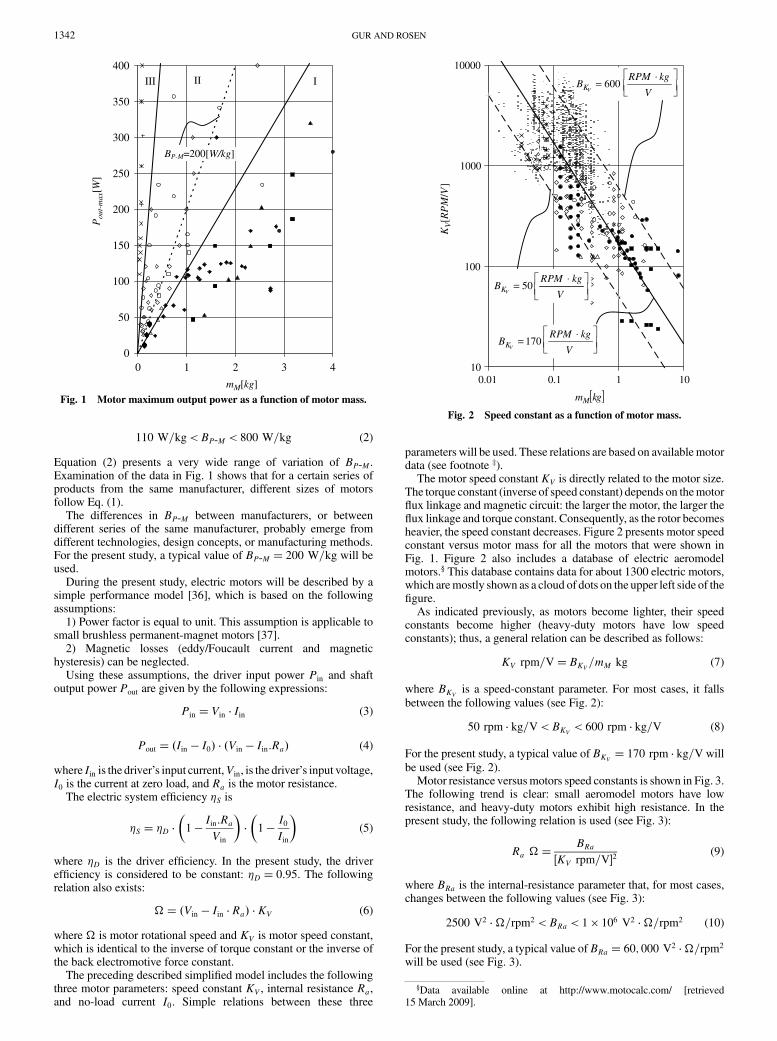
Motor resistance versusmotors speed constants is shown in Fig. 3.The following trend is clear: small aeromodel motors have lowresistance, and heavy-duty motors exhibit high resistance. In thepresent study, the following relation is used (see Fig. 3):
Ra BRaKV rpm=V2 (9)
where BRa is the internal-resistance parameter that, for most cases,changes between the following values (see Fig. 3):
2500 V2 =rpm2 < BRa < 1 106 V2 =rpm2 (10)
For the present study, a typical value of BRa 60; 000 V2 =rpm2
will be used (see Fig. 3).
0
50
100
150
200
250
300
350
400
0 1 2 3 4
III II IP
out-
max
[W]
mM[kg]
BP-M=200[W/kg]
Fig. 1 Motor maximum output power as a function of motor mass.
10
100
1000
10000
0.01 0.1 1 10
mM[kg]
KV[R
PM
/V]
170VK
RPM kgB
V
⋅=
50VK
RPM kgB
V
⋅=
600VK
RPM kgB
V
⋅=
Fig. 2 Speed constant as a function of motor mass.
§Data available online at http://www.motocalc.com/ [retrieved15 March 2009].
1342 GUR AND ROSEN
In the same manner, Fig. 4 presents motors no-load current I0versus motor resistance Ra. The following representative relation isused in the present study:
I0 A BI0Ra 0:6 (11)
where BI0 is the no-load current parameter that, for most cases,changes between the following values (see Fig. 4):
0:1 A 0:6 < BRa < 0:4 A 0:6 (12)
For the present study, a typical value of BI0 0:2 A 0:6 will beused (see Fig. 4).
B. Battery Model
An important component of an electric propulsion system is thebattery pack. The battery often represents one of the heaviestcomponents of the entire vehicle [38].One of themost common typesof batteries is the lithium polymer (LiPo), which offers a relativelyhigh energy capacity along with low weight. Data of 240 LiPobatteries, produced by 11 different manufacturers,¶ are presented inFig. 5. The figure shows the battery energy capacity EB as a functionof the battery mass mB. The following representative relationbetween these two parameters is shown in Fig. 5:
EB W h 4:04 mB kg2 139 mB kg 0:0155 (13)
III. Optimal Design of a Propulsion System
Any optimal design problem can be describedmathematically as asearch process for a design configuration that minimizes (ormaximizes) a specific cost function that represents the design goal.This search process is usually carried out under certain designconstraints.
Any design process requires an a priori definition of designvariables, design constraints, and cost function. The design variables
are parameters that are determined by the designer. In the generalcase of an electric propulsion system design, these variables aredivided into five main categories: propeller general design variables,propeller blade design variables, blade cross-sectional design vari-ables, electric motor design variables, and battery design variables.
The propeller’s general design variables affect the global confi-guration of the propeller system and may include the followingparameters: number of propellers, number of blades Nb, propellerradius R, and rotational speed .
The blade’s design variables are parameters that define thegeometry and structure of each blade [namely, the distribution alongthe blade of the following parameters: pitch angle r, chord cr,
0.001
0.01
0.1
1
10
100
10 100 1000 10000
KV [RPM/V]
Ra[
Ω]
2
260,000Ra
VB
RPM
⋅ Ω=
2
22,500Ra
VB
RPM
⋅ Ω=
2
21,000,000Ra
VB
RPM
⋅ Ω=
Fig. 3 Internal resistance as a function of speed coefficient.
I 0[ A
]
Ra[Ω]
0.60 0.2 .IB [Amp= Ω ]
0.01
0.1
1
10
0.001 0.01 0.1 1 10 100
0.60 0.1 .IB [Amp= ⋅ Ω]
0.60 0.4 .IB Amp[= ⋅ Ω]
Fig. 4 No-load current as a function of internal resistance.
mB[kg]
EB[ W
·hr]
0.1
1
10
100
1000
10000
0.001 0.01 0.1 1 10
[ ] [ ]( )[ ]
2E =4.04
139 0.0155
BB
B
W hr m kg
m kg
⋅ ⋅ +
⋅ +
Fig. 5 Battery capacity as a function of battery mass.
¶Data available online at http://www.flightpower.co.uk/, http://kokamamerica.com/news.htm, http://us.sanyo.com/Batteries, and http://www.thunderpowerrc.com/ [retrieved 15 March 2009].
GUR AND ROSEN 1343
sweep angle, dihedral angle (cone angle in the simplest case), massand inertia, and structural properties].
The blade’s cross-sectional design variables define the airfoilgeometry as a function of a chordwise coordinate; thus, for example,[21] if the cross sections belong to the NACA-16 airfoil family [39],the geometry of each cross section is defined by two parameters (thatmay vary along the blade): thickness ratio t=cr and design liftcoefficient Clir. In the current study, Clark-Y airfoils [40] areused, which are defined by the cross-sectional thickness ratio t=cr.
The electric system variables include the motor mass mM and thebattery-pack mass mB.
The design constraints may include, for example, minimum ormaximumchord size of the blade, allowablemaximum stress, systemmass, motor maximum mass, etc. The cost function is a quantitativemeasure of the success in achieving the design goal, and thus the costfunction offers a measure of the quality of the design. A penaltymethod is used to solve the constrained optimization problem [41]. Itleads to a new constrained cost function, which is minimized to findthe optimal design, subject to all the constraints.
The present optimization scheme is based on a mixed-strategyapproach that combines different optimization methods: 1) heuristicsearch using a simple genetic algorithm [42], 2) enumerative schemeusing Nelder and Mead’s [43] simplex scheme, and 3) derivative-based scheme using the steepest-descent method [44].
This approach ensures a thorough search for the global minimumby taking advantage of the strength of each of the preceding schemes.A detailed description of this strategy and examples of its applicationis presented in [21].
It should be emphasized that this design approach is by no meansfully automatic. The designer plays a major role in the entire process.He or she follows the results during the design procedure and, basedon these results, changes (if necessary) the optimization strategy.Thus, for example, in certain instances, the designer may decide toease certain constraints to increase the flexibility of the searchprocess or to freeze a few variables to avoid impractical results.
IV. Design of an Optimal Propulsion Systemfor an Electric UAV
An electric mini UAV is considered. The mass of the vehiclewithout its propulsion system is m0 5:5 kg. The wing area isSw 0:72 m2, and the drag polar of the vehicle is described by thefollowing equation:
CD 0:03 0:033 C2L (14)
where CL and CD are the vehicle’s lift and drag coefficients,respectively.
A direct drive is used (the system does not include a gear box);namely, the rotational speed of the propeller is equal to that of theelectric motor, .
Because of operational constraints, the radius of the propeller islimited:
R 0:15 m (15)
The blade tip Mach numberMtip is limited to subsonic speeds:
Mtip < 0:7 (16)
As indicated previously, Clark-Y cross sections are used. Thedatabase for this airfoil family is limited to the following range ofthickness ratios t=c [40]:
0:04<t
c< 0:21 (17)
For practical reasons, the chord is also limited:
c=R < 0:35 (18)
The design variables of the current design problem are propellerradius R; distribution of chord length along the blade, cr;
distribution of pitch angle along the blade, r; distribution ofthickness ratio along the blade, t=cr; mass of the electric motor,mM; and mass of the battery pack, mB.
Note that the motor/propeller rotational speed does not appear asone of the design variables. The rotational speed is a result of amotor–propeller matching procedure. For specific flight condition(required thrust, airspeed, and atmospheric conditions) there is acertain rotational speed that makes the motor output power equal tothe propeller-required power. This procedure is conducted for eachanalysis, and thus the rotational speed is part of the results.
The distribution of the various parameters along the blade isdefined by their values at 11 radial stations; thus, there are 36 designvariables in total. Although complex configurations of the blades(e.g., sweep and dihedral) may offer certain advantages [22,45], thepresent study is confined to two-bladed propellers with straightblades and zero cone angles.
In the present study, the electric motor mass and the battery-packmass cannot exceed 5 and 20 kg, respectively:
mM < 5 kg (19)
mB < 20 kg (20)
The main task of the UAV is to loiter at low altitude above a certainarea; thus, the design goal is an optimal propulsion system forloitering conditions that are defined by flight altitude (sea level in thepresent case) and airspeed Vl. In the present case,
Vl 1:2 Vst (21)
where Vst is the vehicle’s stall airspeed. The stall airspeed is afunction of the maximum lift coefficient CLmax:
V2st m0 mM mB g
12 a SW CLmax
(22)
where g is the gravity acceleration, and the maximum lift coefficientis CLmax 1:4.
Based on the vehicle’s mass (which is a function of motor andbattery mass), the stall and loitering airspeed are defined by usingEqs. (21) and (22). Then these flight conditions are used to calculatethe required thrust based on the vehicle’s drag polar [Eq. (14)].
According to Eq. (13) the battery energy capacity is a function ofits mass. It is assumed in the present study that 70% of the totalenergy capacity is used for loitering and that the other 30% are usedfor other flight phases (takeoff, climb, landing, etc.), payloadrequirements, and vehicle’s subsystems.
A. Single-Goal Design
As indicated previously, the main task of the UAV is loitering.Thus, a main design goal is to optimize loitering: namely, tomaximize loiter time. On the other hand, because the vehicle isdesigned for tactical field operation, rate of climb after takeoff repre-sents a very critical parameter that is related tovehicle survivability aswell as the safety of nearby people. Thus, two different design goalsare defined: maximum loiter time tl and maximum rate of climb(ROC) at loitering speed. As a first stage in this study, each of thesegoals will be dealt with separately as a single-goal design. Formaximum loiter time, the cost function (to be minimized) is tl(where tl is the minus of loiter time). Similarly, for maximum rateof climb, the cost function is ROC (minus of ROC).
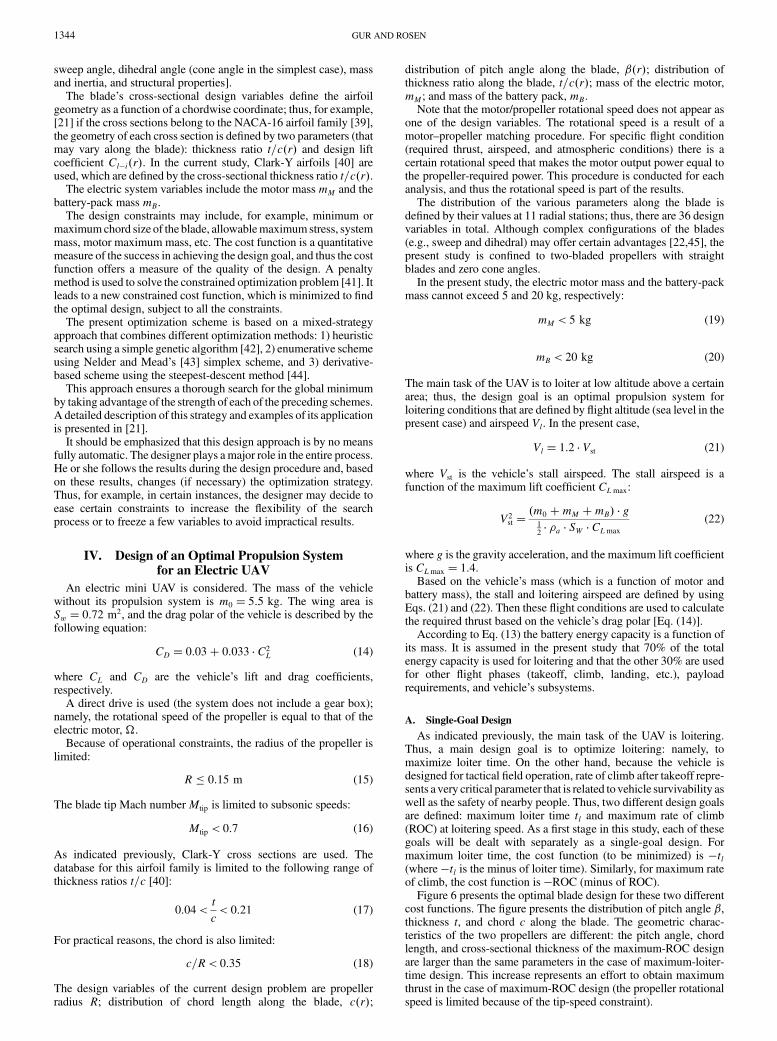
Figure 6 presents the optimal blade design for these two differentcost functions. The figure presents the distribution of pitch angle ,thickness t, and chord c along the blade. The geometric charac-teristics of the two propellers are different: the pitch angle, chordlength, and cross-sectional thickness of the maximum-ROC designare larger than the same parameters in the case of maximum-loiter-time design. This increase represents an effort to obtain maximumthrust in the case of maximum-ROC design (the propeller rotationalspeed is limited because of the tip-speed constraint).
1344 GUR AND ROSEN
Important differences between the two optimal designs are evidentfrom Table 1. The maximum-ROC propulsion system has zerobattery mass, because maximum thrust is required in this case, butthere is no requirement for a finite flight time. On the other hand, themaximum-loiter-time design requires high energy capacity; thus, themass of the battery increases significantly, but the vehicle’s ROC atloiter is zero, which presents an impractical flight condition. Thus,these two single-goal optimal designs are impractical, yet they areimportant because they present the boundaries of practical designsand they offer important insight into design trends.
It should be noted (Table 1) that because the totalmasses of the twodesigns are different, there are significant differences in loiter speedbetween both cases [see Eqs. (21) and (22)]. The battery of themaximum-loiter-time design does not reach the limit of 20 kg,because at a certain point, an increase of the batterymass results in an
increase in loiter speed and, consequently, an increase in vehicle’sdrag that offsets the beneficial effect of increasing the energycapacity.
Table 1 also presents the rotational speed , motor output powerPout, propeller thrust T, and efficiencies of the propeller and theelectric system, P and S, respectively. For each optimal design,these parameters are given for two flight conditions: loiter andmaximum ROC.
The propeller’s efficiency is defined as follows:
P T VFPout
(23)
It is interesting to note in Table 1 that for the maximum-loiter-timedesign, the flight conditions of loiter and maximum ROC areidentical: At loiter the constraint on the maximum blade tip speed,Eq. (16), is active and does not allow any increase in power, thusresulting in zero ROC.On the other hand, for the design ofmaximumROC, there are differences between the two flight conditions.Although loitering is carried out atPout 116 W, maximumROC isobtained forPout 1000 W, where the constraint ofmaximumbladetip speed becomes active again.
The efficiency of the propeller formaximumROC is relatively lowat that flight condition. Ideal propeller efficiency P-ideal is defined asthe efficiency under the following ideal conditions [46]: 1) zerowakerotation, 2) zero cross-sectional friction drag (Cd 0), and3) uniform axial induced velocity.
The relation between the ideal propeller efficiency P-ideal andthe ideal propeller-required power (motor output power) Pout
becomes [46]
Pout 2 a V3F R2 1 P-ideal
3P-ideal(24)
For the present case ofPout 1000 W andVF 15:1 m=s, the idealefficiency according to Eq. (24) is P-ideal 0:612 (compared with anonideal value of P 0:561). This indicates that if the power of thepropeller is increased (to increase ROC in this case) and the radius islimited, efficiency may decrease significantly.
The rotational speeds of the two designs are different at loitering.This difference is due to the difference in the loitering airspeed Vl, adifference that is a result of the various vehicles’ total massmtotal [seeEqs. (21) and (22)].
Note that both designs have a radius of 0.15 m, the maximumallowed value. This trend continued along the entire present study,and thus data about the propeller radius are not repeated in whatfollows.
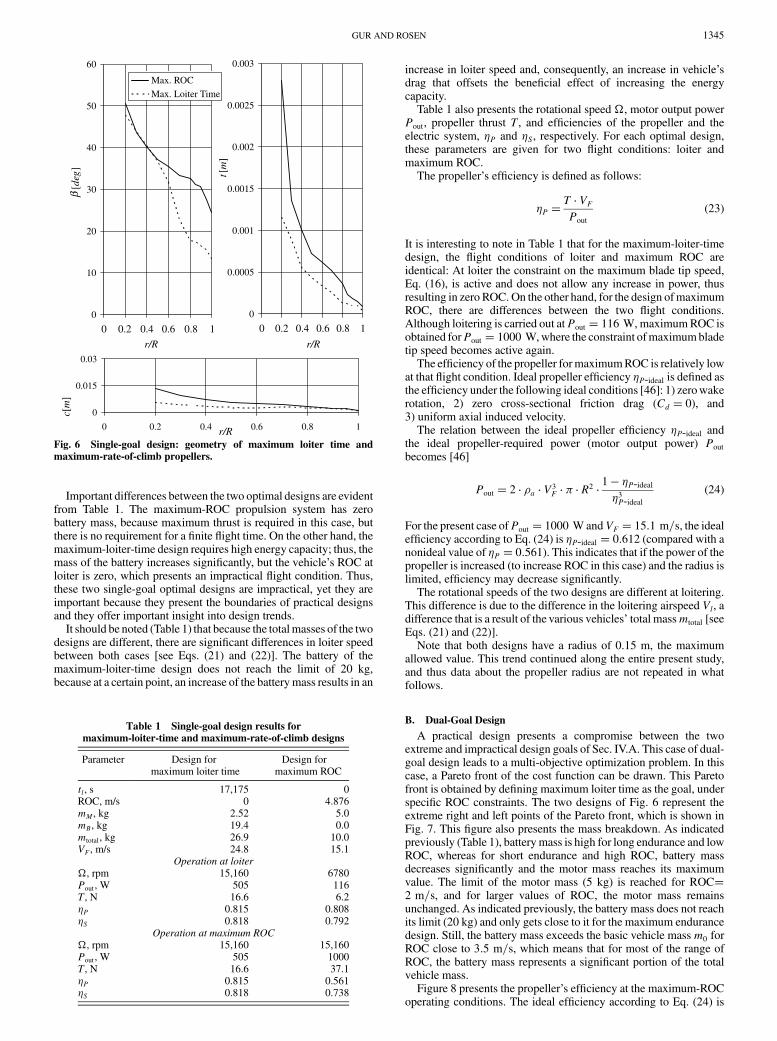
B. Dual-Goal Design
A practical design presents a compromise between the twoextreme and impractical design goals of Sec. IV.A. This case of dual-goal design leads to a multi-objective optimization problem. In thiscase, a Pareto front of the cost function can be drawn. This Paretofront is obtained by defining maximum loiter time as the goal, underspecific ROC constraints. The two designs of Fig. 6 represent theextreme right and left points of the Pareto front, which is shown inFig. 7. This figure also presents the mass breakdown. As indicatedpreviously (Table 1), batterymass is high for long endurance and lowROC, whereas for short endurance and high ROC, battery massdecreases significantly and the motor mass reaches its maximumvalue. The limit of the motor mass (5 kg) is reached for ROC2 m=s, and for larger values of ROC, the motor mass remainsunchanged. As indicated previously, the battery mass does not reachits limit (20 kg) and only gets close to it for the maximum endurancedesign. Still, the battery mass exceeds the basic vehicle massm0 forROC close to 3:5 m=s, which means that for most of the range ofROC, the battery mass represents a significant portion of the totalvehicle mass.
Figure 8 presents the propeller’s efficiency at the maximum-ROCoperating conditions. The ideal efficiency according to Eq. (24) is
r/R
r/Rr/R
β[d
eg]
t[m
]
c[m
]
0
10
20
30
40
50
60
0 0.2 0.4 0.6 0.8 1
Max. ROC
Max. Loiter Time
0
0.0005
0.001
0.0015
0.002
0.0025
0.003
0 0.2 0.4 0.6 0.8 1
0
0.015
0.03
0 0.2 0.4 0.6 0.8 1
Fig. 6 Single-goal design: geometry of maximum loiter time andmaximum-rate-of-climb propellers.
Table 1 Single-goal design results formaximum-loiter-time and maximum-rate-of-climb designs
Parameter Design formaximum loiter time
Design formaximum ROC
tl, s 17,175 0ROC, m/s 0 4.876mM , kg 2.52 5.0mB, kg 19.4 0.0mtotal, kg 26.9 10.0VF, m/s 24.8 15.1
Operation at loiter
, rpm 15,160 6780Pout, W 505 116T, N 16.6 6.2P 0.815 0.808S 0.818 0.792
Operation at maximum ROC
, rpm 15,160 15,160Pout, W 505 1000T, N 16.6 37.1P 0.815 0.561S 0.818 0.738
GUR AND ROSEN 1345
also shown. The actual efficiency is lower than the ideal value byapproximately 0.06.
C. Dual-Goal Design Under Mass and Structural Constraints
To make the design more practical, the total mass of the vehicle islimited to 8 kg. This limit is based on a typical weight that can becarried by a single soldier:
mtotal 8 kg (25)
This means that the total mass of the propulsion system (motor andbattery pack) cannot exceed 3 kg.
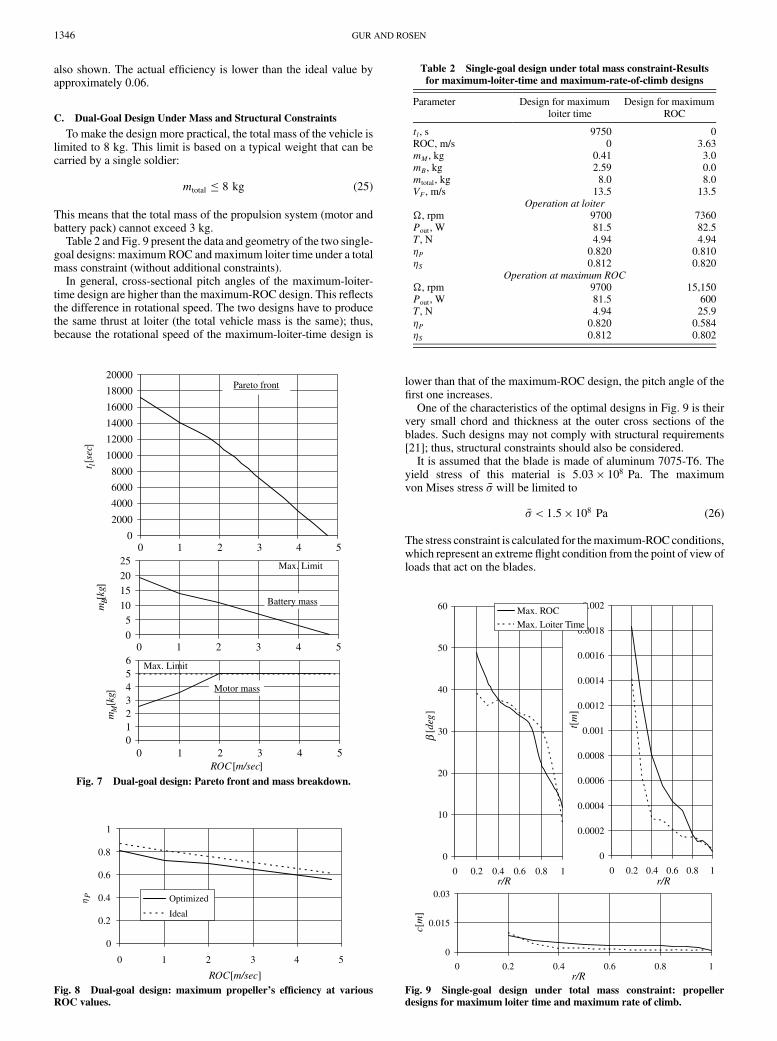
Table 2 and Fig. 9 present the data and geometry of the two single-goal designs: maximumROC and maximum loiter time under a totalmass constraint (without additional constraints).
In general, cross-sectional pitch angles of the maximum-loiter-time design are higher than the maximum-ROC design. This reflectsthe difference in rotational speed. The two designs have to producethe same thrust at loiter (the total vehicle mass is the same); thus,because the rotational speed of the maximum-loiter-time design is
lower than that of the maximum-ROC design, the pitch angle of thefirst one increases.
One of the characteristics of the optimal designs in Fig. 9 is theirvery small chord and thickness at the outer cross sections of theblades. Such designs may not comply with structural requirements[21]; thus, structural constraints should also be considered.
It is assumed that the blade is made of aluminum 7075-T6. Theyield stress of this material is 5:03 108 Pa. The maximumvon Mises stress will be limited to
< 1:5 108 Pa (26)
The stress constraint is calculated for themaximum-ROCconditions,which represent an extreme flight condition from the point of view ofloads that act on the blades.
ROC[m/sec]
Pη
0
0.2
0.4
0.6
0.8
1
0 1 2 3 4 5
Optimized
Ideal
Fig. 8 Dual-goal design: maximum propeller’s efficiency at various
ROC values.
0
0.0002
0.0004
0.0006
0.0008
0.001
0.0012
0.0014
0.0016
0.0018
0.002
0 0.2 0.4 0.6 0.8 1
r/R
r/Rr/R
β[d
eg]
t[m
]
c[m
]
0
10
20
30
40
50
60
0 0.2 0.4 0.6 0.8 1
Max. ROC
Max. Loiter Time
0
0.015
0.03
0 0.2 0.4 0.6 0.8 1
Fig. 9 Single-goal design under total mass constraint: propeller
designs for maximum loiter time and maximum rate of climb.
Table 2 Single-goal design under total mass constraint-Results
for maximum-loiter-time and maximum-rate-of-climb designs
Parameter Design for maximumloiter time
Design for maximumROC
tl, s 9750 0ROC, m/s 0 3.63mM , kg 0.41 3.0mB, kg 2.59 0.0mtotal, kg 8.0 8.0VF, m/s 13.5 13.5
Operation at loiter
, rpm 9700 7360Pout, W 81.5 82.5T, N 4.94 4.94P 0.820 0.810S 0.812 0.820
Operation at maximum ROC
, rpm 9700 15,150Pout, W 81.5 600T, N 4.94 25.9P 0.820 0.584S 0.812 0.802
0
510
1520
25
0 1 2 3 4 5
0
2000
4000
6000
8000
10000
12000
14000
16000
18000
20000
0 1 2 3 4 5
0123456
0 1 2 3 4 5ROC [m/sec]
t l[se
c]m
B[kg
]m
M[k
g]
Max. Limit
Max. Limit
Pareto front
Battery mass
Motor mass
Fig. 7 Dual-goal design: Pareto front and mass breakdown.
1346 GUR AND ROSEN
Figures 10 and 11 present comparisons between optimal designswith and without structural constraints for maximum ROC andmaximum loiter time, respectively. The application of structuralconstraints significantly increases the chord lengths and thicknessesof the blades.
After the application of the structural constraints, the chordlength of the optimized blades is still small: less than 3 mm at theouter 30% of the blades’ length for the maximum-loiter-time designand less than 5 mm at the outer 15% portion of the maximum-ROCdesign. Although the two designs comply with the structuralconstraints (26), the blade geometry is impractical and will notcomply with maintenance and operational constraints. Thus,additional geometric constraints limiting the minimum blade chordare introduced:
c 0:01 m (27)
Figures 10 and 11 also present the geometry of optimal blades undercombined structural [Eq. (26)] and geometric [Eq. (27)] constraints.Tables 3 and 4 present the characteristics of these two designs underthe various constraints. Note that the introduction of structuralconstraints leads to a significant reduction of rotational speed ofboth designs, to keep stresses within their limit. Adding geometricconstraints decreases the rotational speed even further: wider andthicker blades result in larger centrifugal forces, and thus a furtherreduction of the rotational speed is needed. The decrease of therotational speed results in a decrease of the available thrust atmaximum ROC (for the optimal design of that flight condition) andthus a reduced ROC. In the case of maximum-loiter-time design, thereduction in rotational speed is accompanied by a reduction in theefficiencies of the propeller and electric system. This leads to areduction in loiter time.
0
0.0005
0.001
0.0015
0.002
0.0025
0.003
0.0035
0 0.2 0.4 0.6 0.8 1
r/R
r/Rr/R
[deg
β]
t[m
]
c[m
]
0
5
10
15
20
25
30
35
40
45
0 0.2 0.4 0.6 0.8 1
With Structural Const.w/o Structural Const.With Structural & Geo. Const.
0
0.015
0.03
0 0.2 0.4 0.6 0.8 1
Fig. 11 Maximum-loiter-time design under total mass constraint:influence of additional constraints.
Table 3 Maximum-ROC design under total mass constraint: influence of additional constraints
Parameter Without additional constraints. With structural constraints With structural and geometric contraints
tl, s 0 0 0ROC, m/s 3.61 3.54 3.45mM , kg 3.00 3.00 3.00mB, kg 0.00 0.00 0.00mtotal, kg 8.0 8.0 8.0VF , m/s 13.5 13.5 13.5
Operation at loiter
, rpm 7360 5780 4961Pout, W 82.5 84.4 86.5T, N 4.94 4.94 4.94P 0.810 0.791 0.773S 0.820 0.784 0.748
Operation at maximum ROC
, rpm 15,150 11,320 9660Pout, W 600 600 600T, N 25.9 25.4 24.9P 0.584 0.574 0.562S 0.802 0.723 0.668
0
0.0005
0.001
0.0015
0.002
0.0025
0.003
0.0035
0.004
0 0.2 0.4 0.6 0.8 1
r/R
r/Rr/R
[deg
]
t
β
[m]
c[m
]
0
10
20
30
40
50
60
70
0 0.2 0.4 0.6 0.8 1
w/o Stress Const.
With Stress Cont.
With Stress & Geo. Const.
0
0.015
0.03
0 0.2 0.4 0.6 0.8 1
Fig. 10 Maximum-ROC design under total mass constraint: influence
of structural and geometric constraints.
GUR AND ROSEN 1347
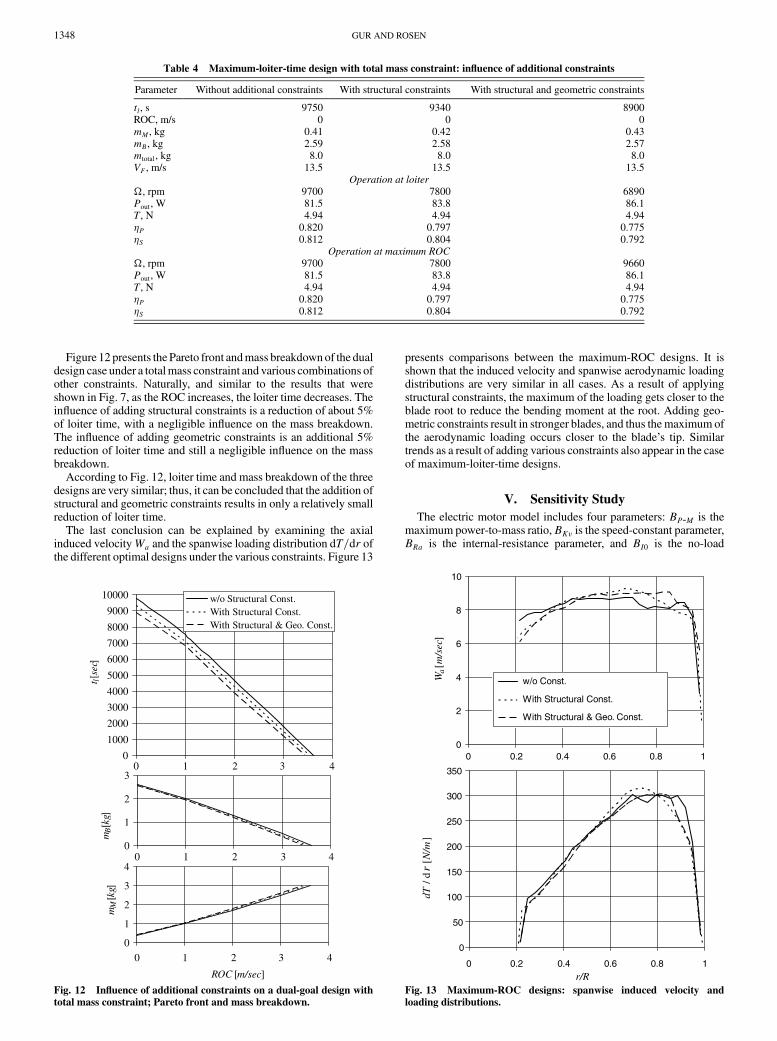
Figure 12 presents the Pareto front andmass breakdownof the dualdesign case under a totalmass constraint and various combinations ofother constraints. Naturally, and similar to the results that wereshown in Fig. 7, as the ROC increases, the loiter time decreases. Theinfluence of adding structural constraints is a reduction of about 5%of loiter time, with a negligible influence on the mass breakdown.The influence of adding geometric constraints is an additional 5%reduction of loiter time and still a negligible influence on the massbreakdown.
According to Fig. 12, loiter time and mass breakdown of the threedesigns are very similar; thus, it can be concluded that the addition ofstructural and geometric constraints results in only a relatively smallreduction of loiter time.
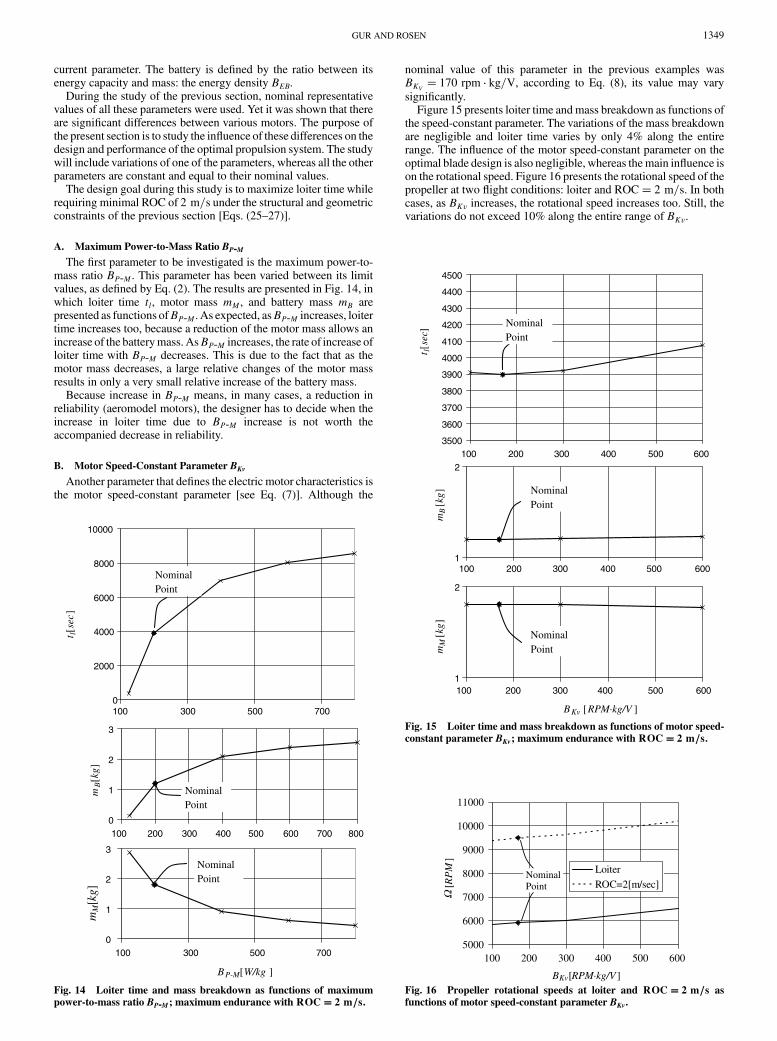
The last conclusion can be explained by examining the axialinduced velocityWa and the spanwise loading distribution dT=dr ofthe different optimal designs under the various constraints. Figure 13
presents comparisons between the maximum-ROC designs. It isshown that the induced velocity and spanwise aerodynamic loadingdistributions are very similar in all cases. As a result of applyingstructural constraints, the maximum of the loading gets closer to theblade root to reduce the bending moment at the root. Adding geo-metric constraints result in stronger blades, and thus themaximum ofthe aerodynamic loading occurs closer to the blade’s tip. Similartrends as a result of adding various constraints also appear in the caseof maximum-loiter-time designs.
V. Sensitivity Study
The electric motor model includes four parameters: BP-M is themaximum power-to-mass ratio,BKv is the speed-constant parameter,BRa is the internal-resistance parameter, and BI0 is the no-load
Table 4 Maximum-loiter-time design with total mass constraint: influence of additional constraints
Parameter Without additional constraints With structural constraints With structural and geometric constraints
tl, s 9750 9340 8900ROC, m/s 0 0 0mM , kg 0.41 0.42 0.43mB, kg 2.59 2.58 2.57mtotal, kg 8.0 8.0 8.0VF , m/s 13.5 13.5 13.5
Operation at loiter
, rpm 9700 7800 6890Pout, W 81.5 83.8 86.1T, N 4.94 4.94 4.94P 0.820 0.797 0.775S 0.812 0.804 0.792
Operation at maximum ROC
, rpm 9700 7800 9660Pout, W 81.5 83.8 86.1T, N 4.94 4.94 4.94P 0.820 0.797 0.775S 0.812 0.804 0.792
ROC [m/sec]
t l[se
c]m
B[k
g]m
M[k
g]
0
1
2
3
0 1 2 3 4
0
1
2
3
4
0 1 2 3 4
0
1000
2000
3000
4000
5000
6000
7000
8000
9000
10000
0 1 2 3 4
w/o Structural Const.With Structural Const.With Structural & Geo. Const.
Fig. 12 Influence of additional constraints on a dual-goal design with
total mass constraint; Pareto front and mass breakdown.
Wa
[m/s
ec]
dT/ d
r[N
/m]
0
50
100
150
200
250
300
350
0 0.2 0.4 0.6 0.8 1
0
2
4
6
8
10
0 0.2 0.4 0.6 0.8 1
w/o Const.
With Structural Const.
With Structural & Geo. Const.
r/RFig. 13 Maximum-ROC designs: spanwise induced velocity and
loading distributions.
1348 GUR AND ROSEN
current parameter. The battery is defined by the ratio between itsenergy capacity and mass: the energy density BEB.
During the study of the previous section, nominal representativevalues of all these parameters were used. Yet it was shown that thereare significant differences between various motors. The purpose ofthe present section is to study the influence of these differences on thedesign and performance of the optimal propulsion system. The studywill include variations of one of the parameters, whereas all the otherparameters are constant and equal to their nominal values.
The design goal during this study is to maximize loiter time whilerequiring minimal ROC of 2 m=s under the structural and geometricconstraints of the previous section [Eqs. (25–27)].
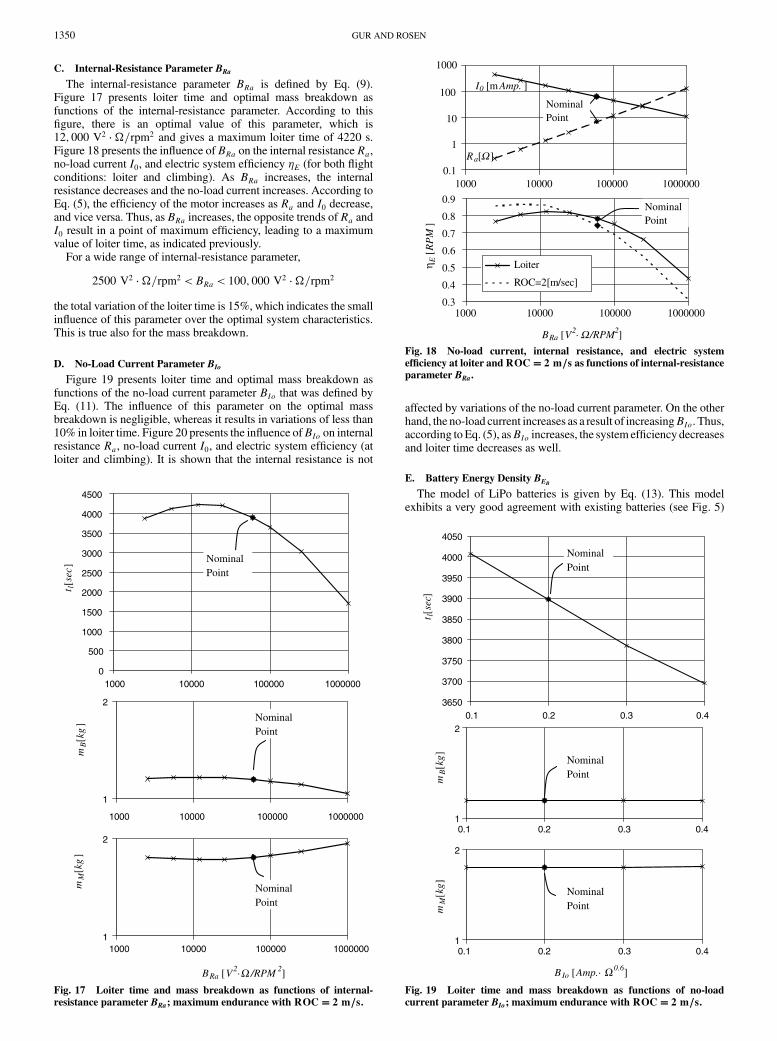
A. Maximum Power-to-Mass Ratio BP-M
The first parameter to be investigated is the maximum power-to-mass ratio BP-M. This parameter has been varied between its limitvalues, as defined by Eq. (2). The results are presented in Fig. 14, inwhich loiter time tl, motor mass mM, and battery mass mB arepresented as functions ofBP-M. As expected, asBP-M increases, loitertime increases too, because a reduction of the motor mass allows anincrease of the batterymass. AsBP-M increases, the rate of increase ofloiter time with BP-M decreases. This is due to the fact that as themotor mass decreases, a large relative changes of the motor massresults in only a very small relative increase of the battery mass.
Because increase in BP-M means, in many cases, a reduction inreliability (aeromodel motors), the designer has to decide when theincrease in loiter time due to BP-M increase is not worth theaccompanied decrease in reliability.
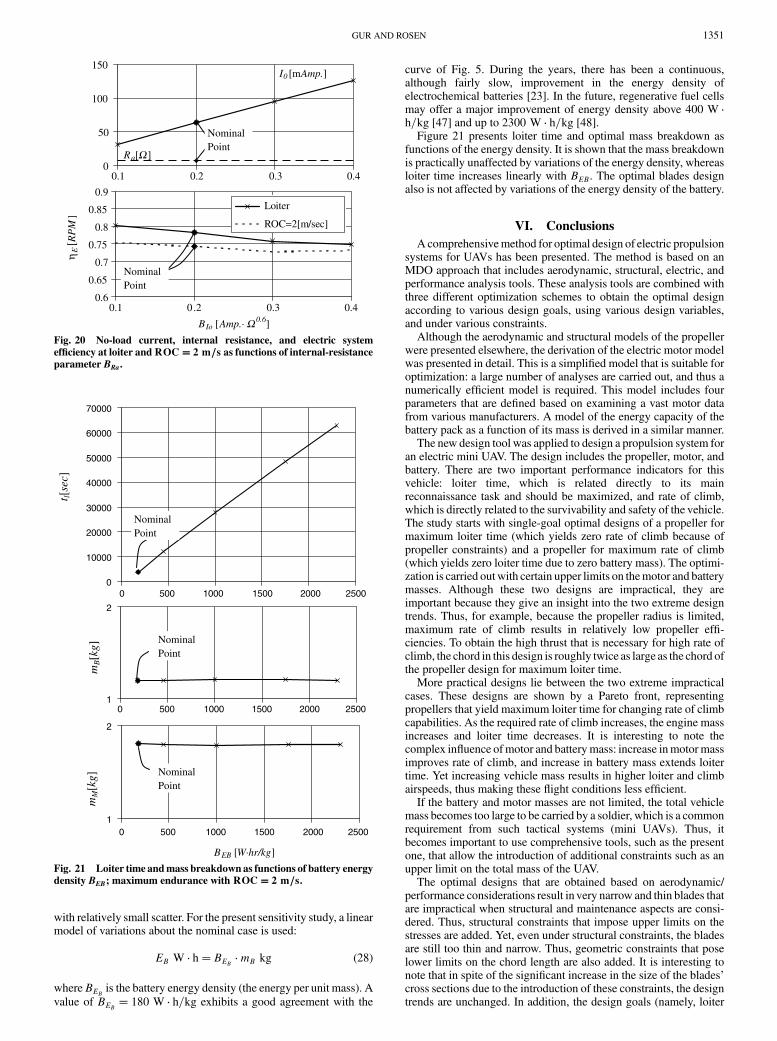
B. Motor Speed-Constant Parameter BKv
Another parameter that defines the electric motor characteristics isthe motor speed-constant parameter [see Eq. (7)]. Although the
nominal value of this parameter in the previous examples wasBKV 170 rpm kg=V, according to Eq. (8), its value may varysignificantly.
Figure 15 presents loiter time andmass breakdown as functions ofthe speed-constant parameter. The variations of the mass breakdownare negligible and loiter time varies by only 4% along the entirerange. The influence of the motor speed-constant parameter on theoptimal blade design is also negligible, whereas themain influence ison the rotational speed. Figure 16 presents the rotational speed of thepropeller at two flight conditions: loiter and ROC 2 m=s. In bothcases, as BKv increases, the rotational speed increases too. Still, thevariations do not exceed 10% along the entire range of BKv.
t l[se
c]
mB[ k
g]m
M[k
g ]
BP-M[W/kg ]
0
2000
4000
6000
8000
10000
100 300 500 700
Nominal Point
0
1
2
3
100 200 300 400 500 600 700 800
0
1
2
3
100 300 500 700
Nominal Point
Nominal Point
Fig. 14 Loiter time and mass breakdown as functions of maximum
power-to-mass ratio BP-M; maximum endurance with ROC 2 m=s.
t l[se
c]
mB
[kg ]
mM
[kg ]
BKv [RPM·kg/V ]
3500
3600
3700
3800
3900
4000
4100
4200
4300
4400
4500
100 200 300 400 500 600
1
2
100 200 300 400 500 600
1
2
100 200 300 400 500 600
Nominal Point
Nominal Point
Nominal Point
Fig. 15 Loiter time and mass breakdown as functions of motor speed-
constant parameter BKv; maximum endurance with ROC 2 m=s.
5000
6000
7000
8000
9000
10000
11000
100 200 300 400 500 600
Loiter
ROC=2[m/sec][RP
MΩ
]
BKv [RPM·kg/V ]
Nominal Point
Fig. 16 Propeller rotational speeds at loiter and ROC 2 m=s as
functions of motor speed-constant parameter BKv.
GUR AND ROSEN 1349
C. Internal-Resistance Parameter BRa
The internal-resistance parameter BRa is defined by Eq. (9).Figure 17 presents loiter time and optimal mass breakdown asfunctions of the internal-resistance parameter. According to thisfigure, there is an optimal value of this parameter, which is12; 000 V2 =rpm2 and gives a maximum loiter time of 4220 s.Figure 18 presents the influence of BRa on the internal resistance Ra,no-load current I0, and electric system efficiency E (for both flightconditions: loiter and climbing). As BRa increases, the internalresistance decreases and the no-load current increases. According toEq. (5), the efficiency of the motor increases as Ra and I0 decrease,and vice versa. Thus, as BRa increases, the opposite trends of Ra andI0 result in a point of maximum efficiency, leading to a maximumvalue of loiter time, as indicated previously.
For a wide range of internal-resistance parameter,
2500 V2 =rpm2 < BRa < 100; 000 V2 =rpm2
the total variation of the loiter time is 15%, which indicates the smallinfluence of this parameter over the optimal system characteristics.This is true also for the mass breakdown.
D. No-Load Current Parameter BIo
Figure 19 presents loiter time and optimal mass breakdown asfunctions of the no-load current parameter BIo that was defined byEq. (11). The influence of this parameter on the optimal massbreakdown is negligible, whereas it results in variations of less than10% in loiter time. Figure 20 presents the influence ofBIo on internalresistance Ra, no-load current I0, and electric system efficiency (atloiter and climbing). It is shown that the internal resistance is not
affected by variations of the no-load current parameter. On the otherhand, the no-load current increases as a result of increasingBIo. Thus,according to Eq. (5), asBIo increases, the system efficiency decreasesand loiter time decreases as well.
E. Battery Energy Density BEB
The model of LiPo batteries is given by Eq. (13). This modelexhibits a very good agreement with existing batteries (see Fig. 5)
t l[s
ec]
mB[k
g]
mM
[kg
]
BRa [V2·Ω /RPM 2]
0
500
1000
1500
2000
2500
3000
3500
4000
4500
1000 10000 100000 1000000
1
2
1000 10000 100000 1000000
1
2
1000 10000 100000 1000000
Nominal Point
Nominal Point
Nominal Point
Fig. 17 Loiter time and mass breakdown as functions of internal-
resistance parameter BRa; maximum endurance with ROC 2 m=s.
η E [
RP
M]
BRa [V2· Ω /RPM2]
I0 [m Amp. ]
Ra[Ω ]
0.3
0.4
0.5
0.6
0.7
0.8
0.9
1000 10000 100000 1000000
Loiter
ROC=2[m/sec]
0.1
1
10
100
1000
1000 10000 100000 1000000
Nominal Point
Nominal Point
Fig. 18 No-load current, internal resistance, and electric system
efficiency at loiter andROC 2 m=s as functions of internal-resistanceparameter BRa.
t l[se
c]m
B[k
g]m
M[k
g]
BIo [Amp.· Ω0.6]
3650
3700
3750
3800
3850
3900
3950
4000
4050
0.1 0.2 0.3 0.4
1
2
0.1 0.2 0.3 0.4
1
2
0.1 0.2 0.3 0.4
Nominal Point
Nominal Point
Nominal Point
Fig. 19 Loiter time and mass breakdown as functions of no-load
current parameter BIo; maximum endurance with ROC 2 m=s.
1350 GUR AND ROSEN
with relatively small scatter. For the present sensitivity study, a linearmodel of variations about the nominal case is used:
EB W h BEB mB kg (28)
whereBEB is the battery energy density (the energy per unit mass). Avalue of BEB 180 W h=kg exhibits a good agreement with the
curve of Fig. 5. During the years, there has been a continuous,although fairly slow, improvement in the energy density ofelectrochemical batteries [23]. In the future, regenerative fuel cellsmay offer a major improvement of energy density above 400 W h=kg [47] and up to 2300 W h=kg [48].
Figure 21 presents loiter time and optimal mass breakdown asfunctions of the energy density. It is shown that the mass breakdownis practically unaffected by variations of the energy density, whereasloiter time increases linearly with BEB. The optimal blades designalso is not affected by variations of the energy density of the battery.
VI. Conclusions
Acomprehensivemethod for optimal design of electric propulsionsystems for UAVs has been presented. The method is based on anMDO approach that includes aerodynamic, structural, electric, andperformance analysis tools. These analysis tools are combined withthree different optimization schemes to obtain the optimal designaccording to various design goals, using various design variables,and under various constraints.
Although the aerodynamic and structural models of the propellerwere presented elsewhere, the derivation of the electric motor modelwas presented in detail. This is a simplified model that is suitable foroptimization: a large number of analyses are carried out, and thus anumerically efficient model is required. This model includes fourparameters that are defined based on examining a vast motor datafrom various manufacturers. A model of the energy capacity of thebattery pack as a function of its mass is derived in a similar manner.
The new design tool was applied to design a propulsion system foran electric mini UAV. The design includes the propeller, motor, andbattery. There are two important performance indicators for thisvehicle: loiter time, which is related directly to its mainreconnaissance task and should be maximized, and rate of climb,which is directly related to the survivability and safety of the vehicle.The study starts with single-goal optimal designs of a propeller formaximum loiter time (which yields zero rate of climb because ofpropeller constraints) and a propeller for maximum rate of climb(which yields zero loiter time due to zero battery mass). The optimi-zation is carried outwith certain upper limits on themotor and batterymasses. Although these two designs are impractical, they areimportant because they give an insight into the two extreme designtrends. Thus, for example, because the propeller radius is limited,maximum rate of climb results in relatively low propeller effi-ciencies. To obtain the high thrust that is necessary for high rate ofclimb, the chord in this design is roughly twice as large as the chord ofthe propeller design for maximum loiter time.
More practical designs lie between the two extreme impracticalcases. These designs are shown by a Pareto front, representingpropellers that yield maximum loiter time for changing rate of climbcapabilities. As the required rate of climb increases, the engine massincreases and loiter time decreases. It is interesting to note thecomplex influence ofmotor and batterymass: increase inmotormassimproves rate of climb, and increase in battery mass extends loitertime. Yet increasing vehicle mass results in higher loiter and climbairspeeds, thus making these flight conditions less efficient.
If the battery and motor masses are not limited, the total vehiclemass becomes too large to be carried by a soldier, which is a commonrequirement from such tactical systems (mini UAVs). Thus, itbecomes important to use comprehensive tools, such as the presentone, that allow the introduction of additional constraints such as anupper limit on the total mass of the UAV.
The optimal designs that are obtained based on aerodynamic/performance considerations result in very narrow and thin blades thatare impractical when structural and maintenance aspects are consi-dered. Thus, structural constraints that impose upper limits on thestresses are added. Yet, even under structural constraints, the bladesare still too thin and narrow. Thus, geometric constraints that poselower limits on the chord length are also added. It is interesting tonote that in spite of the significant increase in the size of the blades’cross sections due to the introduction of these constraints, the designtrends are unchanged. In addition, the design goals (namely, loiter
t l[se
c]
mB[k
g]m
M[k
g]
BEB [W·hr/kg]
0
10000
20000
30000
40000
50000
60000
70000
0 500 1000 1500 2000 2500
1
2
0 500 1000 1500 2000 2500
1
2
0 500 1000 1500 2000 2500
Nominal Point
Nominal Point
Nominal Point
Fig. 21 Loiter time andmass breakdown as functions of battery energy
density BEB; maximum endurance with ROC 2 m=s.
0.6
0.65
0.7
0.75
0.8
0.85
0.9
0.1 0.2 0.3 0.4
Loiter
ROC=2[m/sec]
ηE [
RP
M]
BIo [Amp.· Ω 0.6]
I0 [mAmp.]
Ra[Ω ]0
50
100
150
0.1 0.2 0.3 0.4
Nominal Point
Nominal Point
Fig. 20 No-load current, internal resistance, and electric system
efficiency at loiter andROC 2 m=s as functions of internal-resistanceparameter BRa.
GUR AND ROSEN 1351
time under minimum rate of climb constraint) are usually reduced byno more than 10%.
The introduction of structural and geometric constraints results ina significant reduction of the propeller rotational speed. Conse-quently, the tension stresses due to centrifugal forces do not exceedthe allowed levels. Moreover, the MDO process is also capable ofreducing the bending moment at the root due to aerodynamic loadsby moving the point of maximum loading toward the blade root.
There are differences in the characteristics of electric componentsbetween different manufacturers and different technologies and forother reasons. A sensitivity study was carried out to study theinfluence of such variations on the optimal system design. This paperpresents the influence of variations of four motor parameters: maxi-mum power-to-motor-mass ratio, motor speed-constant parameter,internal-resistance parameter, and zero-load current parameter. Inaddition, the sensitivity to the battery energy density is alsoexamined.
Increasing the maximum power-to-motor-mass ratio results in abeneficial effect of increasing loiter time. Yet the rate of increase ofloiter time reduces as the motor mass decreases. Because a reductionof this parameter is accompanied, in many cases, by a parallelreduction of the motor’s reliability and availability, at a certain stage,a further increase of the maximum power-to-motor-mass ratio isworthless.
Variations of the motor speed parameter exhibit negligible effecton the mass breakdown. Loiter time changes by less than 5% for theentire range of variations. The propeller rotational speed exhibits asomewhat larger change, resulting in only small changes of theoptimal blades design.
There is an optimal value of the internal-resistance parameter thatmaximizes the loiter time. Still, the relative variation in loiter timeand mass breakdown are small. This is also true for the no-loadcurrent parameter, which has a small influence on the systemcharacteristics. Increase of the battery energy density increases loitertime in a linear manner. Nevertheless, this change does not affect themass breakdown.
It can be concluded, based on the sensitivity study, that the batterydensity and maximum power-to-mass ratio have the largest influ-ences on the design and performance of the system. The other para-meters have a relatively minor influence on the vehicle performance,but they may influence the optimal design. The present study showsonce more that when optimizing a propeller-based propulsionsystem, it is essential to simultaneously consider all the componentsof this system: propeller, motor, and energy source, as well as thevehicle’s characteristics.
Acknowledgments
This research was supported by the BernardM. Gordon Center forSystems Engineering at Technion—Israel Institute of Technology.The authors would like to thank the center for this support. Theauthors would also like to thank Raul Rabinovici from Ben-GurionUniversity and Vladimir Grinberg from Bental Motion Systems fortheir assistance with the development of the electric system model.
References
[1] “Unmanned Aerial Vehicles Roadmap 2000–2025,” http://www.globalsecurity.org/intell/library/reports/2001/uavr0401.htm#_Toc509906768 [retrieved 15 Mar. 2009].
[2] Ott, J., and Biezad, D., “Design of a Tube-Launched UAV,” AIAA 3rd“Unmanned Unlimited” Technical Conference, Workshop and Exhibit,AIAA Paper 2004-6493, Chicago, 20–23 Sept. 2004.
[3] Nagel, A., Levy, D. E., and Shepshelovich, M., “Conceptual Aero-dynamic Evolution of Mini/Micro UAV,” 44th AIAA AerospaceSciences Meeting and Exhibit, AIAA Paper 2006-1261, Reno, NV, 9–12 Jan. 2006.
[4] Keennon, M. T., and Grasmeyer, J. M., “Development of the BlackWidow and Microbat MAVs and a Vision of the Future of MAVDesign,” AIAA/ICAS International Air and Space Symposium andExposition: The Next 100Y, AIAA Paper 2003-2901, 14–7 July 2003.
[5] Betz, A., “Schraubenpropeller mit Geringstem Energieverlust,”Königliche Gesellschaft der Wissenschaften Vol. 2, 1919, pp. 193–
217; also “Screw Propeller with Minimum Energy Loss,” TechnicalTranslation 736, translated by D. A. Sinclair, National ResearchCouncil Library, Ottawa, Canada, 1958.
[6] Adkins, C. N., and Liebeck, R. H., “Design of Optimum Propellers,”Journal of Propulsion and Power, Vol. 10, No. 5, Sept.–Sept. 1994,pp. 676–682.doi:10.2514/3.23779
[7] Roncz, G. J., “Propeller Development for the Rutan Voyager,” GeneralAviation Aircraft Meeting and Exposition, Society of AutomotiveEngineers, Paper SAE-891034, Wichita, KS, 11–13 Apr. 1989.
[8] Succi, G. P., “Design of Quiet Efficient Propellers,” SAE BusinessAircraft Meeting, Society of Automotive Engineers Paper 790584,Apr. 1979.
[9] Patrick, H., Finn, W. R., and Stich, K. C., “Two and Three-BladedPropeller Design for the Reduction of Radiated Noise,” 3rd AIAA/CEAS Aeroacoustics Conference, AIAA Paper 97-1710-CP, Atlanta,GA, 12–14 May, 1997.
[10] “White Paper on Current State of the Art,”AIAATechnical Committeeon Multidisciplinary Design Optimization (MDO), Jan. 1991, http://endo.sandia.gov/AIAA_MDOTC/sponsored/aiaa_paper.html [retrieved15 Mar. 2009].
[11] Sobieszczanski-Sobieski, J., and Haftka, R. T., “MultidisciplinaryAerospace Design Optimization: Survey of Recent Development,”Structural optimization, Vol. 14, No. 1, 1997, pp. 1–23.doi:10.1007/BF01197554
[12] Bennet, R. L., “Application of Optimization Methods to Rotor DesignProblems,” Vertica, Vol. 7, No. 3, 1983, pp. 201–208.
[13] Friedmann, P., “Application of Modern Structural Optimization toVibration Reduction in Rotorcraft,” Vertica, Vol. 9, No. 4, 1985,pp. 363–376.
[14] Ormsbee, A. I., and Woan, C. J.,“Optimum Acoustic Design of FreeRunning Low Speed Propellers,” AIAA Aircraft Systems & Techno-logy Meeting, AIAA Paper 77-1248, Seattle, WA, 22–24 Aug. 1977.
[15] Chang, L. K., and Sullivan, J. P., “Optimization of Propeller BladeShape by an Analytical Method,” AIAA/SAE/ASME 18th Joint Pro-pulsion Conference, AIAA Paper 82-1125, Cleveland, OH 21–23 June,1982.
[16] Chang, L.K., andSullivan, J. P., “Optimization of Propeller BladeTwistby an Analytical Method,” AIAA Journal, Vol. 22, No. 2, Feb. 1984,pp. 252–255.doi:10.2514/3.48441
[17] Miller, J. C., “Optimally Designed Propellers Constrained by Noise,”Ph.D. Thesis, Purdue Univ., Purdue, IN, Dec. 1984.
[18] Miller, J. C., and Sullivan, P. J., “Noise Constraints Effecting OptimalPropeller Designs,”General Aviation Aircraft Meeting and Exposition,” Society of Automotive Engineers Paper 850871, Wichita, KS, 16–19 Apr. 1985, pp. 4.585–4.593.
[19] Drack, E. L., and Wood, A. L., “Design and Analysis of Propellers forGeneral Aviation Aircraft Noise Reduction,” 21st InternationalCongress of Aeronautical Sciences, Paper 98-5.11.3, Melbourne,Australia, 13–18 Sept. 1998.
[20] Monk, J. S.,“The Aerodynamic Design of an Optimized Propeller for aHigh Altitude Long Endurance UAV,” 23rd International Congress ofAeronautical Sciences, International Congress of AeronauticalSciences, 8–13 Sept. 2002, pp. 5104.1–5104.9.
[21] Gur O., and Rosen, A., “Optimization of Propeller-Based PropulsionSystem,” Journal of Aircraft, Vol. 46, No. 1, Jan.–Feb. 2009, pp. 95–106.doi:10.2514/1.36055
[22] Gur O., and Rosen, A., “Multidisciplinary Design Optimization of aQuiet Propeller,” Journal of Propulsion and Power, Vol. 25, No. 3,May–June 2009, pp. 717–728.doi:10.2514/1.38814
[23] Logan, J. M., Chu, J., Motter, A. M., Carter, L. D., Ol, M., and Zeune,C., “Small UAV Research and Evolution in Long Endurance ElectricPowered Vehicles,”AIAA Infotech@Aerospace 2007 Conference andExhibit, AIAA Paper 2007-2730, 7–10 May, 2007.
[24] Grasmeyer, J. M., and Keennon, M. T., “Development of the BlackWidow Micro Air Vehicle,” 39th Aerospace Sciences Meeting andExhibit, AIAA Paper 2001-0127 Reno, NV, 8–11 Jan. 2001.
[25] Roberts, C., Vaughan,M., andBowman,W. J., “Development of a SolarPowered Micro Air Vehicle,” 40th Aerospace Science Meeting and
Exhibit, AIAA Paper 2002-0703, Reno, NV, 14–17 Jan. 2002.[26] Peterson, B., Erath, B., Henry, K., Lyon, M., Walker, B., Powell, N.,
Fowkes, K., and Bowman, W. J., “Development of a Micro Air Vehiclefor Maximum Endurance andMinimum Size,” 41st Aerospace ScienceMeeting and Exhibit, AIAA Paper 2003-416, Reno, NV, 6–9 Jan. 2003.
[27] Wu, H., Sun, D., and Zhou, Z., “Micro Air Vehicle: Configuration,Analysis, Fabrication, and Test,” IEEE/ASME Transactions on
1352 GUR AND ROSEN
Mechatronics, Vol. 9, No. 1, Mar. 2004.[28] Ott, J., and Biezad, D., “Design of a Tube-Launched UAV,” 3rd AIAA
“Unmanned Unlimited” Technical Conference, Workshop and Exhibit,AIAA Paper 2004-6493, Chicago, 20–23 Sept. 2004.
[29] Choi, T. P., Soban, D. S., and Mavris, D. N., “Creation of a DesignFramework for All-Electric Aircraft Propulsion Architectures,” 3rdInternational Energy Conversion Engineering Conference, AIAAPaper 2005-5549, San Francisco, 15–18 Aug. 2005.
[30] Soban, D. S., and Upton, E., “Design of a UAV to Optimize Use of FuelCell Propulsion Technology,” AIAA Infotech @ Aerospace 2005Conference and Exhibit, AIAA Paper 2005-7135, Arlington, VA, 26–29 Sept. 2005.
[31] Gur, O., and Rosen, A., “Comparison Between Blade-Element Modelsof Propellers,” The Aeronautical Journal, Vol. 112, No. 1138,Dec. 2008, pp. 689–704.
[32] Gur, O., and Rosen, A., “Propeller Performance at Low AdvanceRatio,” Journal of Aircraft, Vol. 42, No. 2, Mar.–Apr. 2005, pp. 435–441.doi:10.2514/1.6564
[33] Yamamoto, O., and August, R., “Structural and Aerodynamic Analysisof a Large-ScaleAdvanced Propeller Blade,” Journal of Propulsion andPower, Vol. 8, No. 2, Mar.–Apr. 1992, pp. 367–373.doi:10.2514/3.23487
[34] Rosen, A., and Gur, O., “A Transfer Matrix Model for LargeDeformations of Curved Rods,” Computers and Structures, Vol. 87,Nos. 7–8, Apr. 2009, pp. 467–484.doi:10.1016/j.compstruc.2008.12.014
[35] Hanselman, D. C., Brushless Permanent-Magnet Motor Design,McGraw–Hill, New York, p. 191.
[36] Lawrence, D. A., and Mohseni, K., “Efficiency Analysis for Long-Duration Electric MAVs,” Infotech @ Aerospace, AIAA Paper 2005-7090, Arlington, VA, 26–29 Sept. 2005.
[37] Su, G.-J., and Adams, D. J., “Multilevel DC Link Inverter for BrushlessPermanentMagnetMotors with Very Low Inductance,“ IEEE IAS 2001
Annual Meeting, Vol. 2, Inst. of Electrical and Electronics Engineers,Piscataway, NJ, 2001, pp. 829–834.
[38] Logan, M. J., Chu, J., Motter, M. A., Carter, D. L., Ol, M., and Zeune,C., “Small UAV Research and Evolution in Long Endurance ElectricPowered Vehicles,” Infotech@ Aerospace, AIAA Paper 2007-2730 7–10 May 2007.
[39] Borst, V. H., “Summary of Propeller Design Procedures and Data,”Vol. 1, U.S. ArmyAirMobility Research andDevelopment Lab. TR 73-34A/B/C, Moffett Field, CA, Nov. 1973.
[40] Korkan, K. D., Camba, J., andMorris, P.M., “AerodynamicData Banksfor Clark-Y, NACA 4-Digit, and NACA 16-Series Airfoil Families,”NASA CR 176883, Jan. 1986.
[41] Boyd, S., and Vandenberghe, L., Convex Optimization, CambridgeUniv. Press, New York, 2004, p. 716.
[42] Goldberg, E. D., Genetic Algorithms in Search, Optimization, and
Machine Learning, Addison-Wesley, Reading, MA, 1989, p. 412.[43] Nelder, J. A., and Mead, R., “A Simplex Method for Function
Minimization,” Computer Journal, Vol. 7, 1965, pp. 308–313.[44] Van der Velden, A., “Tools for Applied Engineering Optimization,”
AGARD Rept. R-803, Neuilly-sur-Seine, France, Apr. 1994.[45] Sullivan, J. P., Chang, L. K., and Miller, C. J., “The Effect of Proplets
and Bi-Blades on the Performance and Noise of Propellers,” SAEBusiness Aircraft Meeting and Exposition, Society of AutomotiveEngineers Paper 810600, Wichita, KS, 7–10 Apr. 1981.
[46] Glauert, H., “Airplane Propellers,” Aerodynamic Theory, Vol. 4, editedby F. W. Durand, 3rd ed., Dover, New York, 1963.
[47] Burke, K. A., and Jakupca, I., “Unitized Regenerative Fuel Cell SystemGas Storage-Radiator Development,” NASA TM 2005-213442,Sept. 2005.
[48] Wicke, G. B., “General Motors Hydrogen Storage Requirements forFuel Cell Vehicles,” DOE Hydrogen Storage Workshop, ArgonneNational Lab., Argonne, IL, Aug. 2002, http://www1.eere.energy.gov/hydrogenandfuelcells/pdfs/h2_fuelcell_vehicles.pdf [retrievedMar. 2009].
GUR AND ROSEN 1353


![FY18 RWDC State Unmanned Aerial System Challenge ... · Unmanned Aerial System Challenge: Practical Solutions to ... , Real World Design Challenge ... , unmanned aerial vehicle [UAV])](https://img.pdfslide.us/doc/110x75/5ae85cfb7f8b9a8b2b8fe5e5/fy18-rwdc-state-unmanned-aerial-system-challenge-aerial-system-challenge-practical.jpg)