Embed Size (px)
Citation preview
Optimization of solid phase PLA withemphasis on antibody modification
Junhong Yan
Degree project in biology, Master of science (2 years), 2010Examensarbete i biologi 30 hp till masterexamen, 2010Biology Education Centre and Department of Genetics and Pathology, Rudbeck Laboratory, UppsalaUniversitySupervisors: Masood Kamali-Moghaddam and Maria Hammond
1
Table of contents
Summary .................................................................................................................................. 2
Introduction ............................................................................................................................. 3
Protein detection methods ......................................................................................... 3
Proximity Ligation Assay (PLA) ............................................................................... 4
Proximity probes ........................................................................................................ 6
qPCR readout ........................................................................................................... 10
Aim .......................................................................................................................... 12
Results .....................................................................................................................................13
Biotin modification reagents ................................................................................... 13
Comparison of biotinylated anti-mouse-IgG antibody in solid phase PLA ............ 16
Comparison of biotinylated anti-VEGF antibody in solid phase PLA .................... 19
Controllability and reproducibility of biotin modification ...................................... 20
Capture efficiency of immobilized antibody over time ........................................... 25
Discussion ................................................................................................................................26
Materials and methods ..........................................................................................................29
Buffers, proteins and oligonucleotides used in the experiment ............................... 29
Biotinylation of antibodies ...................................................................................... 30
Antibody immobilization on solid surface .............................................................. 32
Preparation of proximity probes .............................................................................. 32
Solid phase PLA ...................................................................................................... 32
Solution phase PLA ................................................................................................. 33
Data analysis ............................................................................................................ 34
Acknowledgement ..................................................................................................................35
References................................................................................................................................36
2
Summary
Proximity ligation assay (PLA) is a sensitive protein detection technique that converts protein
detection into DNA detection. The ligation of oligonucleotides on proximity probes binding
simultaneously on one target protein ensures the specificity of the assay. One crucial part of
the assay is the proximity probes, which consist of affinity binders, such as antibodies, and
oligonucleotides. The conjugation of oligonucleotides on antibodies can be covalent using
bifunctional linkers or noncovalent using streptavidin-biotin interaction. The quality of the
biotinylated antibody directly affects the dynamic range and limit of detection of the assay.
In this project, five biotinylation reagents with different linker structures were compared in
quality, price and handling. The biotinylation kit from Solulink performed better in quality
than the three biotinylation reagents from Pierce and Lightning Link from Innova Bioscience.
When using the ChromaLink Biotin reagent from Solulink, the biotinylated antibodies,
directed against mouse IgG or human VEGF, performed equally well in solid phase PLA as
compared to the antibodies biotinylated by the manufacturer. The robustness of the Solulink
biotin reagent was tested using antibodies modified by different amounts of biotin reagent.
The comparison of dynamic range and limit of detection in the assay using these antibodies
showed that the Solulink biotin reagent was controllable and reproducible.
3
Introduction
Protein detection methods
The success of the genome project of different organisms from prokaryotes to mammals
brings great challenges to the detection and analysis of proteins, because proteomics is far
more complex than the genomics because of alternative splicing and editing of mRNA, post-
translational modification and degradation. The dynamic complexity of proteomics calls for
new technologies to identify and quantify different proteins in a high throughput and precise
way (Twyman 2003). One of the most impressive technologies in the past decades the
combination of mass spectrometry with traditional protein detection methods such as gel-
based electrophoresis and chromatography (Florens et al 2002, Aebersold and Mann 2003) to
precisely indentify and quantify the dynamic changes of proteins in organisms. A lot of
candidate biomarkers that can distinguish samples of cancer patients from healthy controls
were found through mass spectrometry (Ackermann et al 2006).
With the discovery of numerous candidate biomarkers for cancer and other diseases in the
study of proteomics, sensitive detection and quantification of these protein biomarkers play a
gradually more important part in diagnostic and prognostic procedures (Lopez et al 2007).
Several antibody-dependent immunoassays with different readout systems have been
developed to meet the needs of clinical diagnosis. In these immunoassays such as ELISA
(Enzyme-linked immunosorbant assay; Doyle et al 1984, Ohkuma et al 2002) and protein
arrays (Wiese 2001, SpisAjk and Guttman 2009), the binding of a target protein to a
4
recognition molecule must be detected either with signal amplification or direct readout. The
readout based on a fluorescent or colorimetric signal has a fairly wide dynamic range,
quantification accuracy and reproducibility
Proximity Ligation Assay
The proximity ligation assay (PLA) was first described in detection of extremely low amounts
(10-21 moles) of PDGF (Platelet-Derived Growth Factor) using DNA aptamers as affinity
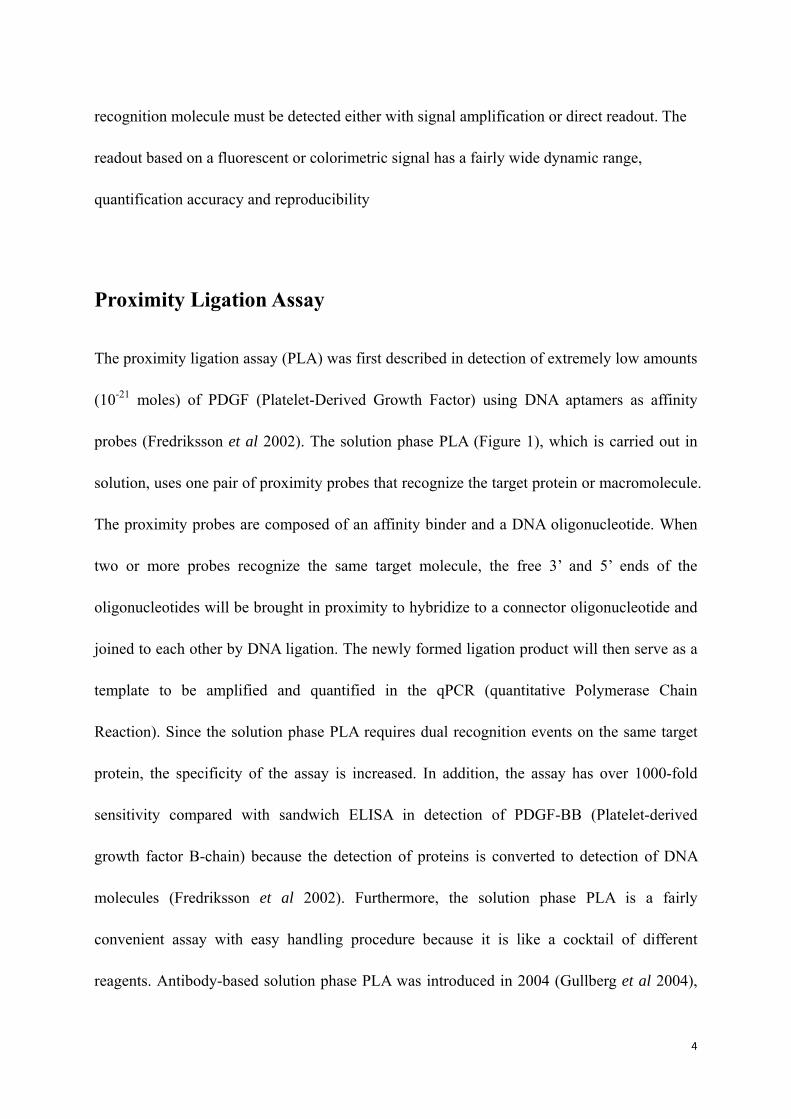
probes (Fredriksson et al 2002). The solution phase PLA (Figure 1), which is carried out in
solution, uses one pair of proximity probes that recognize the target protein or macromolecule.
The proximity probes are composed of an affinity binder and a DNA oligonucleotide. When
two or more probes recognize the same target molecule, the free 3’ and 5’ ends of the
oligonucleotides will be brought in proximity to hybridize to a connector oligonucleotide and
joined to each other by DNA ligation. The newly formed ligation product will then serve as a
template to be amplified and quantified in the qPCR (quantitative Polymerase Chain
Reaction). Since the solution phase PLA requires dual recognition events on the same target
protein, the specificity of the assay is increased. In addition, the assay has over 1000-fold
sensitivity compared with sandwich ELISA in detection of PDGF-BB (Platelet-derived
growth factor B-chain) because the detection of proteins is converted to detection of DNA
molecules (Fredriksson et al 2002). Furthermore, the solution phase PLA is a fairly
convenient assay with easy handling procedure because it is like a cocktail of different
reagents. Antibody-based solution phase PLA was introduced in 2004 (Gullberg et al 2004),
5
where the proximity probes were prepared with poly- or monoclonal antibodies that were
conjugated with oligonucleotide arms. The antibody-based proximity ligation can detect as
little as 10-20 moles of cytokine molecules in PBS (Phosphate Buffered Saline) and 100%
serum.
Figure 1. Solution phase PLA (upper left) and solid phase PLA (lower left). In the solution
phase PLA, a pair of proximity probes, which are affinity binders (black antibody in the
figure) conjugated with ligatable oligonucleotides (blue and red line), bind to the same target
protein (pink oval). The 3’ and 5’ end of the two oligonucleotides in proximity will hybridize
to the connector oligonucleotide (orange line) and be ligated by DNA ligase (yellow star).
The ligation product will serve as template in qPCR (upper right) and the Ct value reflects the
quantity of target protein (lower right). In the solid phase PLA (lower left), the target protein
is first captured by the capture antibody immobilized on the solid surface.
6
PLA can also be performed on a solid support based on the principle of a sandwich
immunoassay. For solid phase PLA (SP-PLA), the capture antibody is first immobilized on
the solid phase, either inside a surface-modified tube (Gustafsdottir et al 2006) or on
microspheres such as magnetic particles (Darmanis et al 2009) to capture the target protein in
the solution (Figure 1). When detecting extremely low amounts of target protein in a complex
matrix that might contain molecules inhibiting ligation or PCR amplification, capture
antibody in SP-PLA can function as concentrating and purifying the target protein (Darmanis
et al 2009). Compared with solution phase PLA, SP-PLA provides increased sensitivity and
specificity (Darmanis et al 2009). However, the drawback of SP-PLA is the time-consuming
washing steps that may introduce variation between replicates. SP-PLA has been used to
detect individual infectious pathogen such as porcine parvovirus (PPV) and bacterial
pathogen Lawsonia intracellularis with sensitivity comparable to that of real-time PCR of
nucleic acid of the pathogens (Gustafsdottir et al 2006).
Proximity probes
The proximity probes used in PLA play a crucial role in the way that they convert protein
detection to DNA detection. The first generation of proximity probes were DNA aptamers
with attachment of ligatable 3’ and 5’ DNA extension (Fredriksson et al 2002). Since the
library of DNA aptamers is limited, the most commonly used affinity binders are purified
mono- and polyclonal antibodies, or recombinant immunoglobulin fragments like the Fab part
(antigen binding part of the antibody) or scFv (single-chain variable fragment) which is a
7
fusion of the variable regions of the heavy and light chains of immunoglobulins, linked
together with a short linker, usually serine or glycine). Alternative affinity binders are also
available including non-immunoglobulin protein scaffolds, like affibodies that are small
binders of high affinity with alpha-helix bundles (Nord et al 1995, Wikman 2004) and
DARPins (Designed Ankyrin Repeat Proteins, Binz et al 2004) that are small binders with
high affinity towards protein through screening through the DARPin library. Compared with
antibodies, alternative binders are small and have less steric hinderance. Moreover, protein
scaffolds are more robust than antibodies, and can be stored for a long time (Stoevesandt &
Taussig 2007). However, alternative binders have less affinity to the target proteins than their
respective antibodies, and the libraries of alternative binders are underdeveloped (Stoevesandt
& Taussig 2007).
The affinity binder and the oligonucleotide can be linked by modification of both the affinity
binder and the oligonucleotide to form covalent conjugates through the reaction of the
modified groups. In the case of antibody – oligonucleotide conjugation, which is used widely
in PLA, the antibody and oligonucleotide are linked noncovalently by modifying the
oligonucleotide with streptavidin and biotinylating the antibody. Streptavidin is a 52 kD
tetrameric protein purified from bacterium Streptomycin avidinii. It has a strong affinity for
biotin with a dissociation constant of 10-15 mol/L. The binding between streptavidin and biotin
is stable from pH 4 to 7 and up to 95 °C (Green 1990). When preparing the antibody-
oligonucleotide conjugates using streptavidin-biotin interaction, the oligonucleotide is first
covalently linked to streptavidin through maleimide conjugation chemistry. The streptavidin
8
modified oligonucleotide - provided as a service by several companies - can be linked to
biotinylated antibodies forming conjugates directly as proximity probes in PLA without
further purification (Gullberg et al 2004).
The biotinylation reagent is usually composed of three parts, a biotin molecule, a spacer arm
and an NHS (N-Hydroxy Succinimidyl) or NHS-sulfo group, which will react with primary
amines on the antibody. The reaction of NHS (sulfo)-esters occurs as follows: an amine bond
is formed between the biotin reagents and the antibody, while the NHS-(sulfo) is the leaving
group (Figure 2, Hermanson 2008). The sulfo group is present to enhance the water solubility
of the biotin reagents. Different commercial biotin modification reagents from different
companies have a similar biotin group and NHS-(sulfo) reaction group, but different spacer
arms. Since the biotin binds in a pocket 9 Å below the surface of the streptavidin molecule
(Livnah et al 1993), the length of the spacer arm between the biotin and the antibody is
important. Longer spacer arms can reduce the steric hindrance and enhance the interaction
between streptavidin and biotinylated antibody. The biotin modification on the antibody will
somehow reduce the solubility of the antibody in water. However, a hydrophilic PEG
(Polyethylene Glycol) spacer arm can enhance the solubility after modification when the sulfo
group is leaving.
9
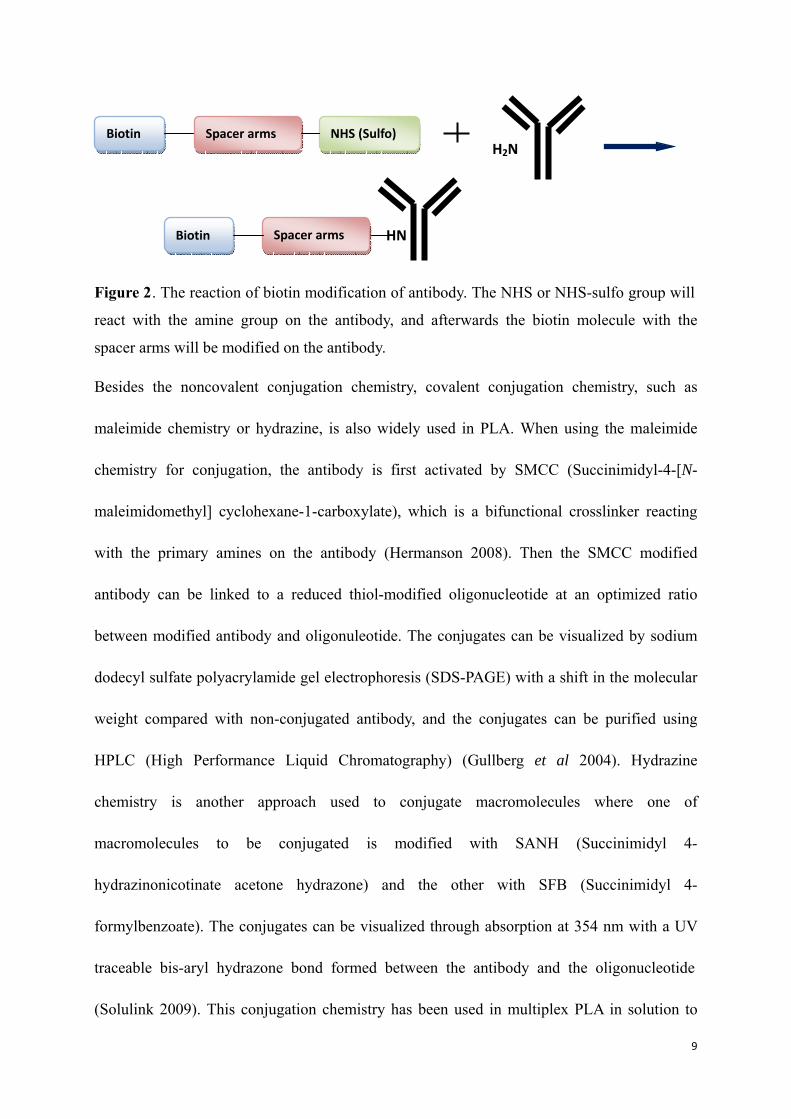
Figure 2. The reaction of biotin modification of antibody. The NHS or NHS-sulfo group will
react with the amine group on the antibody, and afterwards the biotin molecule with the
spacer arms will be modified on the antibody.
Besides the noncovalent conjugation chemistry, covalent conjugation chemistry, such as
maleimide chemistry or hydrazine, is also widely used in PLA. When using the maleimide
chemistry for conjugation, the antibody is first activated by SMCC (Succinimidyl-4-[N-
maleimidomethyl] cyclohexane-1-carboxylate), which is a bifunctional crosslinker reacting
with the primary amines on the antibody (Hermanson 2008). Then the SMCC modified
antibody can be linked to a reduced thiol-modified oligonucleotide at an optimized ratio
between modified antibody and oligonuleotide. The conjugates can be visualized by sodium
dodecyl sulfate polyacrylamide gel electrophoresis (SDS-PAGE) with a shift in the molecular
weight compared with non-conjugated antibody, and the conjugates can be purified using
HPLC (High Performance Liquid Chromatography) (Gullberg et al 2004). Hydrazine
chemistry is another approach used to conjugate macromolecules where one of
macromolecules to be conjugated is modified with SANH (Succinimidyl 4-
hydrazinonicotinate acetone hydrazone) and the other with SFB (Succinimidyl 4-
formylbenzoate). The conjugates can be visualized through absorption at 354 nm with a UV
traceable bis-aryl hydrazone bond formed between the antibody and the oligonucleotide
(Solulink 2009). This conjugation chemistry has been used in multiplex PLA in solution to
Biotin Spacer arms NHS (Sulfo) H2N
Biotin Spacer arms HN
10
profile putative plasma biomarkers relevant to pancreatic and ovarian cancer (Fredriksson et
al 2007, Fredriksson et al 2008).
Both covalent and noncovalent conjugation chemistries have merits and flaws. The
streptavidin–biotin interaction is efficient and no purification step is needed after conjugation,
if streptavidin modified oligonucleotides are available. During covalent conjugation several
purification steps are required since excessive reagent must be removed during modification
and after conjugation. However, streptavidin is nearly 1/3 the size of antibody, which could
affect the binding affinity of the antibody. In multiplex PLA, different detection
oligonucleotides are linked with different antibodies. Covalent conjugation of antibody and
oligonucleotide is used in multiplex PLA in order to reduce the risk that the detection
oligonucleotide of one antibody might bind to another antibody if the binding of streptavidin-
biotin breaks (Fredriksson et al, 2007).
Quantitative polymerase chain reaction
PLA uses qPCR to quantify the ligation products, which is different from other immuno-
assays. After the event of proximity ligation happens, the ligation products will be quantified
using quantitative PCR amplification. The procedure of qPCR follows the standard procedure
of a normal PCR with additional step to quantify amplified DNA molecules at the end of each
amplification cycle. One common way to quantify DNA molecules is through measuring the
fluorescence intensity from unspecific fluorescent dyes that bind to any double stranded DNA
such as SybrGreen. The other method is to measure the fluorescence intensity by using a
11
sequence-specific probe such as a TaqMan probe consisting of oligonucleotide labeled with a
fluorescent reporter that will only give fluorescence when it hybridizes to the target (single-
stranded) DNA template. In a typical exponential qPCR amplification plot, the X axis is the
cycle of amplification and y axis is the fluorescence intensity measured at the end of each
cycle. A threshold for detection of fluorescence above background fluorescence is usually set
as soon as the curve goes to the exponential phase. The Ct value, which is defined as cycle of
threshold, is the cycle number when the fluorescence intensity comes to the threshold. With a
sample where there is more DNA template, the fluorescence will come to the threshold earlier
than with a sample that has less DNA template, since the number of DNA molecules doubles
after each cycle. A higher Ct value indicates lower template concentration.
In order to quantify a target protein with unknown concentration in the sample using PLA, a
standard curve of the target protein serially diluted in the matrix similar to the sample will be
drawn with Ct value of each sample against concentration of the target protein in a
logarithmic plot. A curve-fitting equation will be made. The Ct value of the sample will also
be measured and can be calculated with the equation. In a typical standard curve for protein
detection using PLA, the Ct value is usually plotted inversely (from higher to lower values)
along the y-axis so as to make the curve go up when the protein concentration goes higher.
The dynamic range of a standard curve is the linear part which can be used to calculate
the concentration of the target protein using the Ct value measured from the sample. The limit
of detection (LOD) is the least amount of target protein that can be detected using PLA.
12
Aim
The aim of my project was to optimize the solid phase PLA with a special emphasis on the
conjugation of proximity probes. The aim was also to set up an assay to find a robust
modification kit or reagent for functionalization of antibodies as proximity probes in the PLA.
The modification would be focused on biotinylation of antibody in noncovalent streptavidin-
biotin conjugation.
13
Results
Biotin modification reagents
The biotin modification reagents tested here were two commercial kits from Solulink
(Solulink ChromaLink Biotin Protein Labeling Kit) and Innova Biosciences (Lightning-Link
Biotin Conjugation kit Type A and Type B), and three biotin modification linkers from Pierce
(Table 1). The Solulink ChromaLink Biotin reagent has a traceable bis aryl hydrazone
chromophore that can be used as a way to quantify the molar substitution rate of biotin on
antibody. The Lightning-Link Biotin Conjugation kit was chosen because it claims to have a
very short hands-on time. The Pierce biotin modification linkers chosen were one with a short
spacer arm, and two with longer spacer arms of different solubility, LC-LC and PEG4. The
handling and price comparison are summarized in Table 2 and Table 3.
14
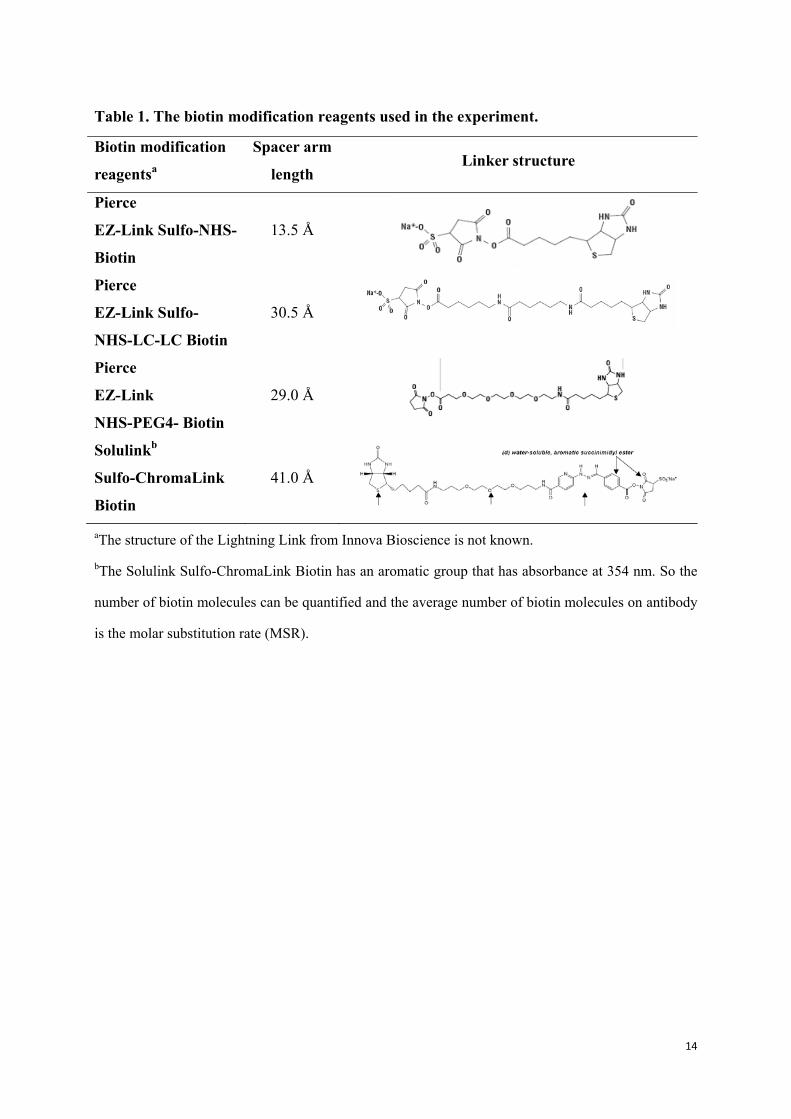
Table 1. The biotin modification reagents used in the experiment.
Biotin modification
reagentsa
Spacer arm
length Linker structure
Pierce
EZ-Link Sulfo-NHS-
Biotin
13.5 Å
Pierce
EZ-Link Sulfo-
NHS-LC-LC Biotin
30.5 Å
Pierce
EZ-Link
NHS-PEG4- Biotin
29.0 Å
Solulinkb
Sulfo-ChromaLink
Biotin
41.0 Å
aThe structure of the Lightning Link from Innova Bioscience is not known.
bThe Solulink Sulfo-ChromaLink Biotin has an aromatic group that has absorbance at 354 nm. So the
number of biotin molecules can be quantified and the average number of biotin molecules on antibody
is the molar substitution rate (MSR).
15
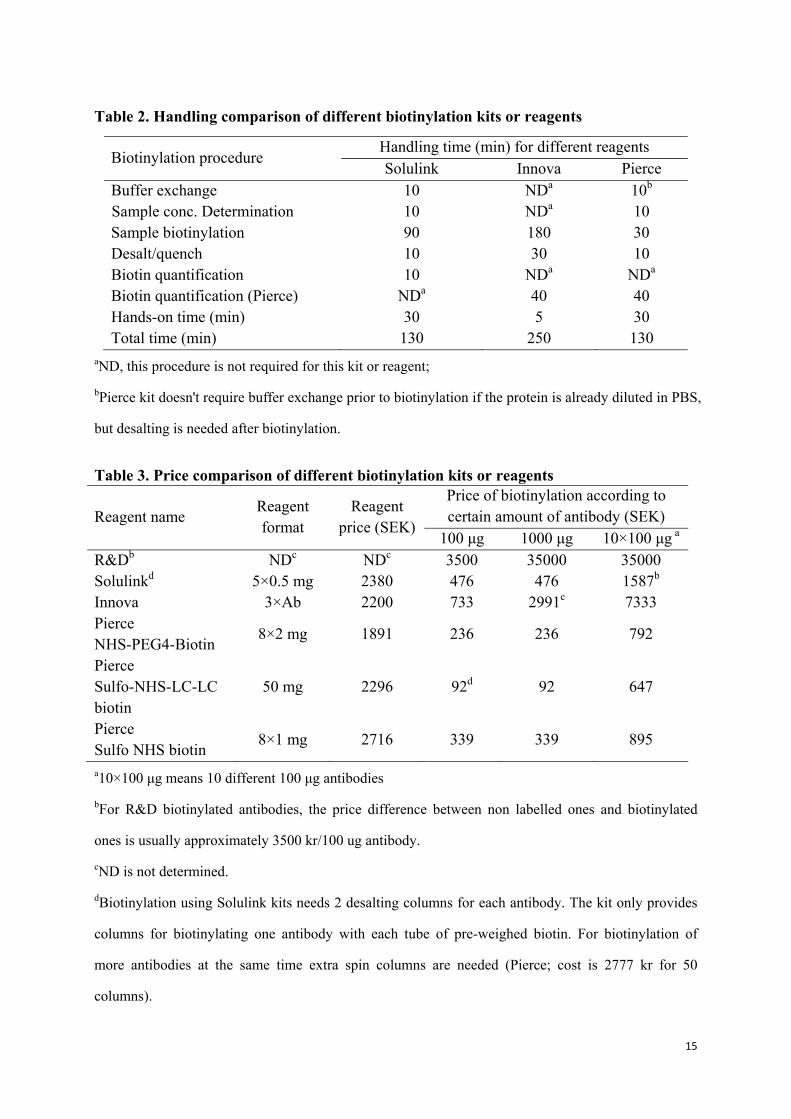
Table 2. Handling comparison of different biotinylation kits or reagents
Biotinylation procedure Handling time (min) for different reagents Solulink Innova Pierce
Buffer exchange 10 NDa 10b Sample conc. Determination 10 NDa 10 Sample biotinylation 90 180 30 Desalt/quench 10 30 10 Biotin quantification 10 NDa NDa Biotin quantification (Pierce) NDa 40 40 Hands-on time (min) 30 5 30 Total time (min) 130 250 130
aND, this procedure is not required for this kit or reagent;
bPierce kit doesn't require buffer exchange prior to biotinylation if the protein is already diluted in PBS,
but desalting is needed after biotinylation.
Table 3. Price comparison of different biotinylation kits or reagents
Reagent name Reagent format
Reagent price (SEK)
Price of biotinylation according to certain amount of antibody (SEK)
100 μg 1000 μg 10×100 μg a
R&Db NDc NDc 3500 35000 35000 Solulinkd 5×0.5 mg 2380 476 476 1587b Innova 3×Ab 2200 733 2991c 7333 Pierce NHS-PEG4-Biotin
8×2 mg 1891 236 236 792
Pierce Sulfo-NHS-LC-LC biotin
50 mg 2296 92d 92 647
Pierce Sulfo NHS biotin
8×1 mg 2716 339 339 895
a10×100 μg means 10 different 100 μg antibodies
bFor R&D biotinylated antibodies, the price difference between non labelled ones and biotinylated
ones is usually approximately 3500 kr/100 ug antibody.
cND is not determined.
dBiotinylation using Solulink kits needs 2 desalting columns for each antibody. The kit only provides
columns for biotinylating one antibody with each tube of pre-weighed biotin. For biotinylation of
more antibodies at the same time extra spin columns are needed (Pierce; cost is 2777 kr for 50
columns).
16
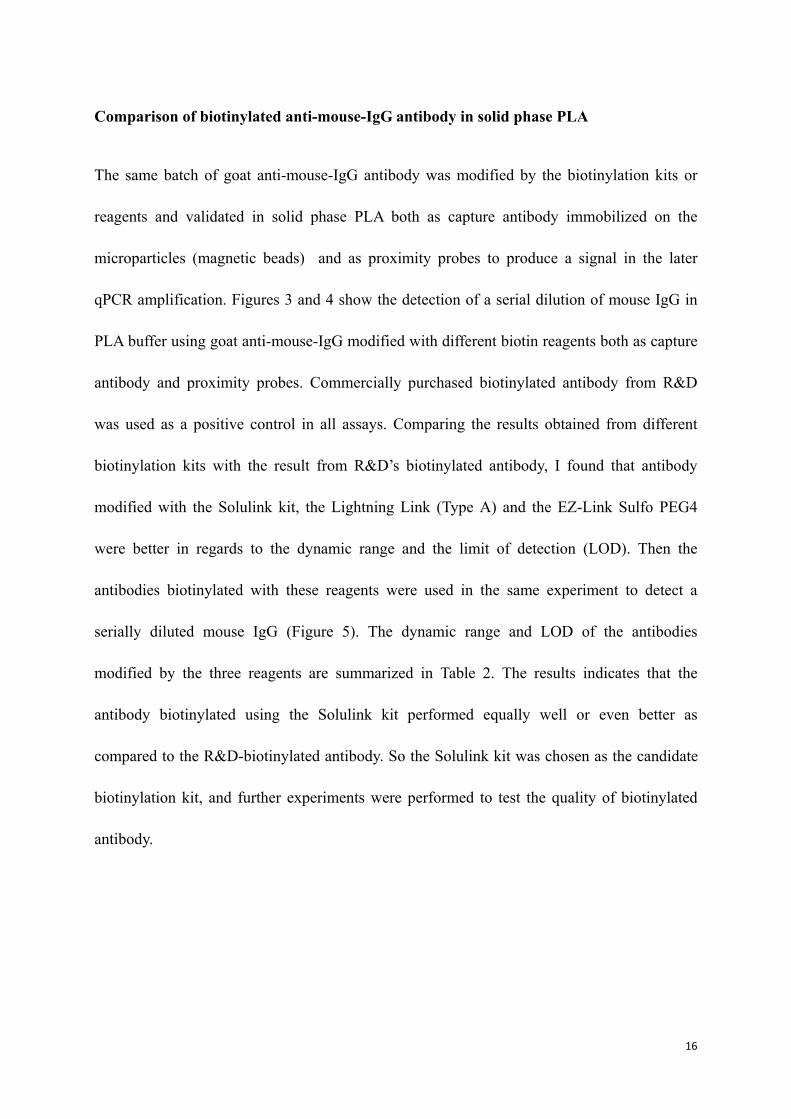
Comparison of biotinylated anti-mouse-IgG antibody in solid phase PLA
The same batch of goat anti-mouse-IgG antibody was modified by the biotinylation kits or
reagents and validated in solid phase PLA both as capture antibody immobilized on the
microparticles (magnetic beads) and as proximity probes to produce a signal in the later
qPCR amplification. Figures 3 and 4 show the detection of a serial dilution of mouse IgG in
PLA buffer using goat anti-mouse-IgG modified with different biotin reagents both as capture
antibody and proximity probes. Commercially purchased biotinylated antibody from R&D
was used as a positive control in all assays. Comparing the results obtained from different
biotinylation kits with the result from R&D’s biotinylated antibody, I found that antibody
modified with the Solulink kit, the Lightning Link (Type A) and the EZ-Link Sulfo PEG4
were better in regards to the dynamic range and the limit of detection (LOD). Then the
antibodies biotinylated with these reagents were used in the same experiment to detect a
serially diluted mouse IgG (Figure 5). The dynamic range and LOD of the antibodies
modified by the three reagents are summarized in Table 2. The results indicates that the
antibody biotinylated using the Solulink kit performed equally well or even better as
compared to the R&D-biotinylated antibody. So the Solulink kit was chosen as the candidate
biotinylation kit, and further experiments were performed to test the quality of biotinylated
antibody.
17
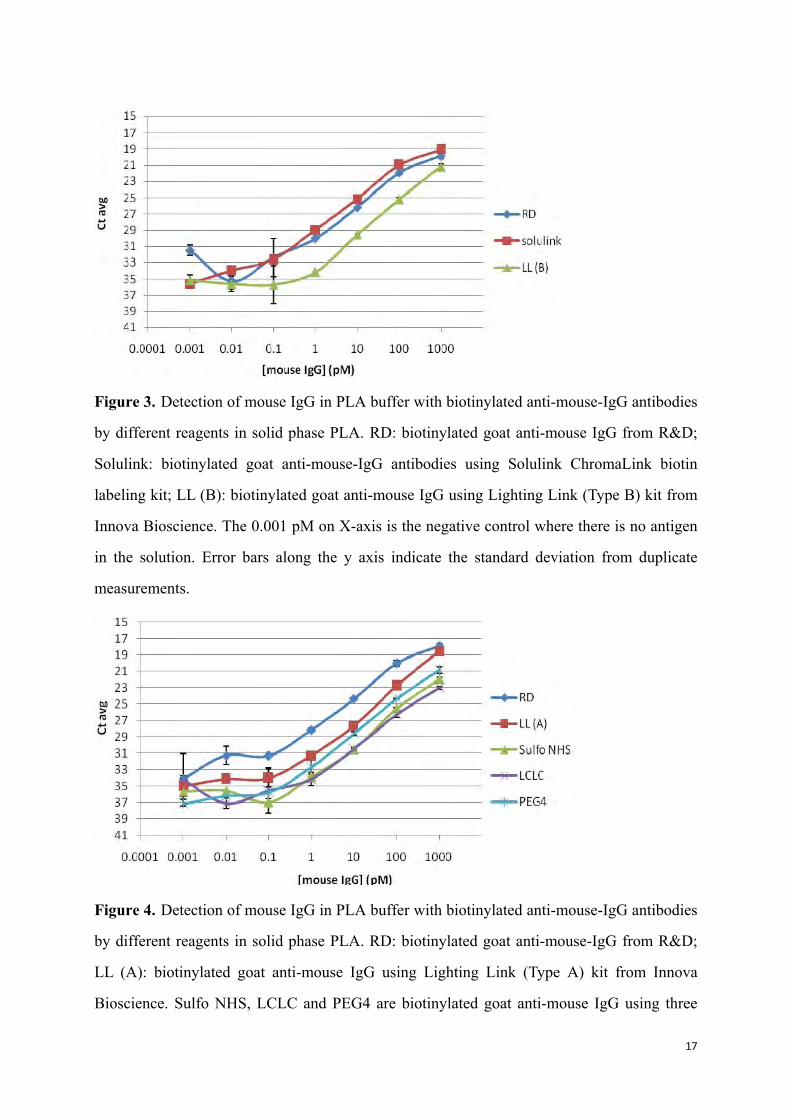
Figure 3. Detection of mouse IgG in PLA buffer with biotinylated anti-mouse-IgG antibodies
by different reagents in solid phase PLA. RD: biotinylated goat anti-mouse IgG from R&D;
Solulink: biotinylated goat anti-mouse-IgG antibodies using Solulink ChromaLink biotin
labeling kit; LL (B): biotinylated goat anti-mouse IgG using Lighting Link (Type B) kit from
Innova Bioscience. The 0.001 pM on X-axis is the negative control where there is no antigen
in the solution. Error bars along the y axis indicate the standard deviation from duplicate
measurements.
Figure 4. Detection of mouse IgG in PLA buffer with biotinylated anti-mouse-IgG antibodies
by different reagents in solid phase PLA. RD: biotinylated goat anti-mouse-IgG from R&D;
LL (A): biotinylated goat anti-mouse IgG using Lighting Link (Type A) kit from Innova
Bioscience. Sulfo NHS, LCLC and PEG4 are biotinylated goat anti-mouse IgG using three
18
biotin modification reagents from Pierce. The 0.001 pM on X-axis is the negative control
where there is no antigen in the solution. Error bars along the y axis indicate the standard
deviation from duplicate measurements.
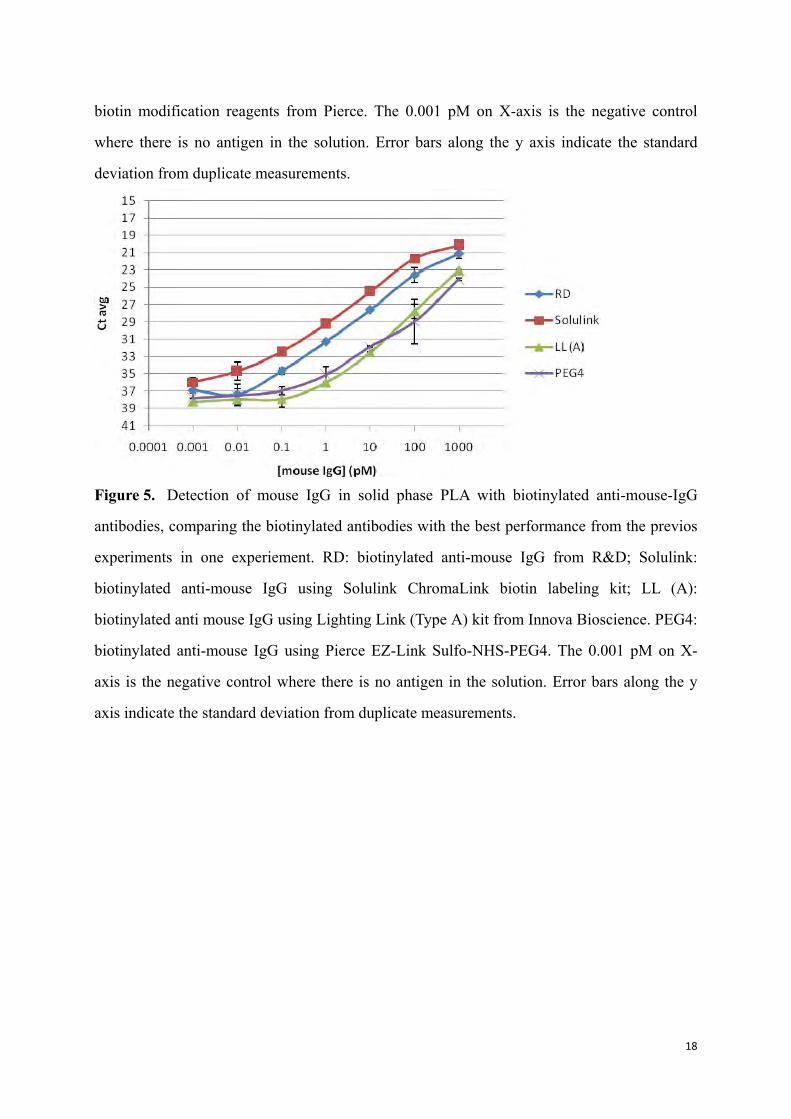
Figure 5. Detection of mouse IgG in solid phase PLA with biotinylated anti-mouse-IgG
antibodies, comparing the biotinylated antibodies with the best performance from the previos
experiments in one experiement. RD: biotinylated anti-mouse IgG from R&D; Solulink:
biotinylated anti-mouse IgG using Solulink ChromaLink biotin labeling kit; LL (A):
biotinylated anti mouse IgG using Lighting Link (Type A) kit from Innova Bioscience. PEG4:
biotinylated anti-mouse IgG using Pierce EZ-Link Sulfo-NHS-PEG4. The 0.001 pM on X-
axis is the negative control where there is no antigen in the solution. Error bars along the y
axis indicate the standard deviation from duplicate measurements.
19
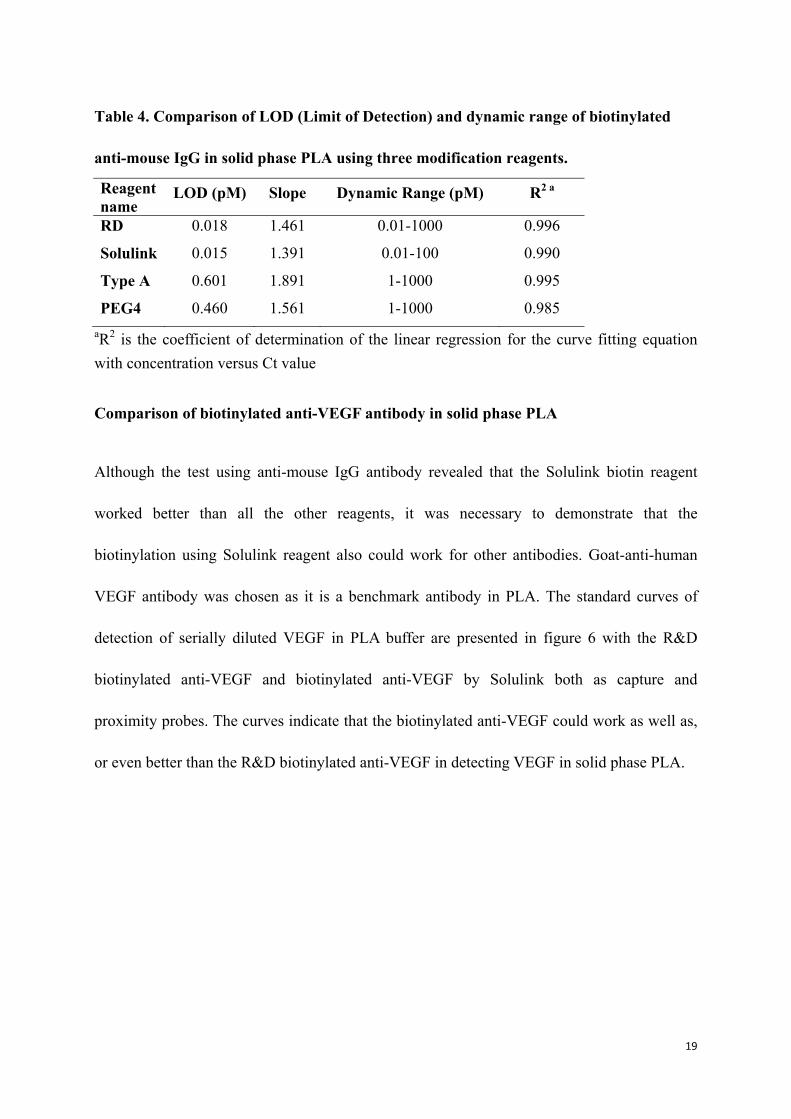
Table 4. Comparison of LOD (Limit of Detection) and dynamic range of biotinylated
anti-mouse IgG in solid phase PLA using three modification reagents.
Reagent name
LOD (pM) Slope Dynamic Range (pM) R2 a
RD 0.018 1.461 0.01-1000 0.996
Solulink 0.015 1.391 0.01-100 0.990
Type A 0.601 1.891 1-1000 0.995
PEG4 0.460 1.561 1-1000 0.985 aR2 is the coefficient of determination of the linear regression for the curve fitting equation with concentration versus Ct value
Comparison of biotinylated anti-VEGF antibody in solid phase PLA
Although the test using anti-mouse IgG antibody revealed that the Solulink biotin reagent
worked better than all the other reagents, it was necessary to demonstrate that the
biotinylation using Solulink reagent also could work for other antibodies. Goat-anti-human
VEGF antibody was chosen as it is a benchmark antibody in PLA. The standard curves of
detection of serially diluted VEGF in PLA buffer are presented in figure 6 with the R&D
biotinylated anti-VEGF and biotinylated anti-VEGF by Solulink both as capture and
proximity probes. The curves indicate that the biotinylated anti-VEGF could work as well as,
or even better than the R&D biotinylated anti-VEGF in detecting VEGF in solid phase PLA.
20
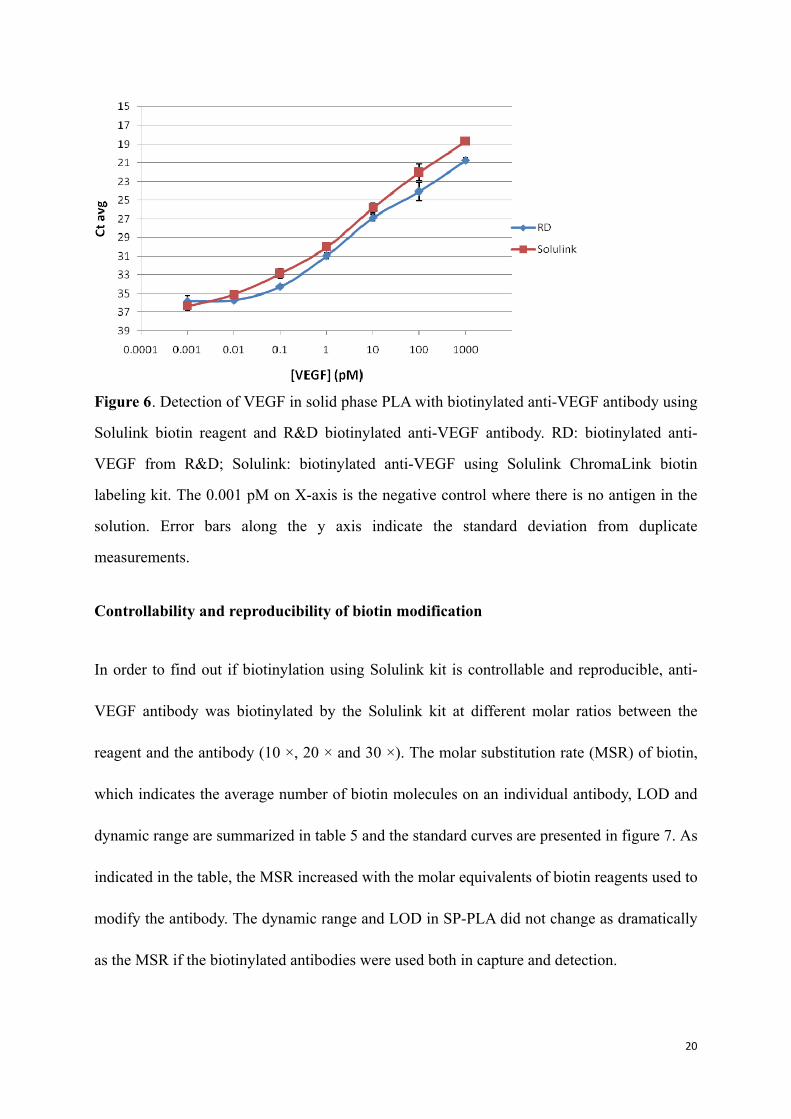
Figure 6. Detection of VEGF in solid phase PLA with biotinylated anti-VEGF antibody using
Solulink biotin reagent and R&D biotinylated anti-VEGF antibody. RD: biotinylated anti-
VEGF from R&D; Solulink: biotinylated anti-VEGF using Solulink ChromaLink biotin
labeling kit. The 0.001 pM on X-axis is the negative control where there is no antigen in the
solution. Error bars along the y axis indicate the standard deviation from duplicate
measurements.
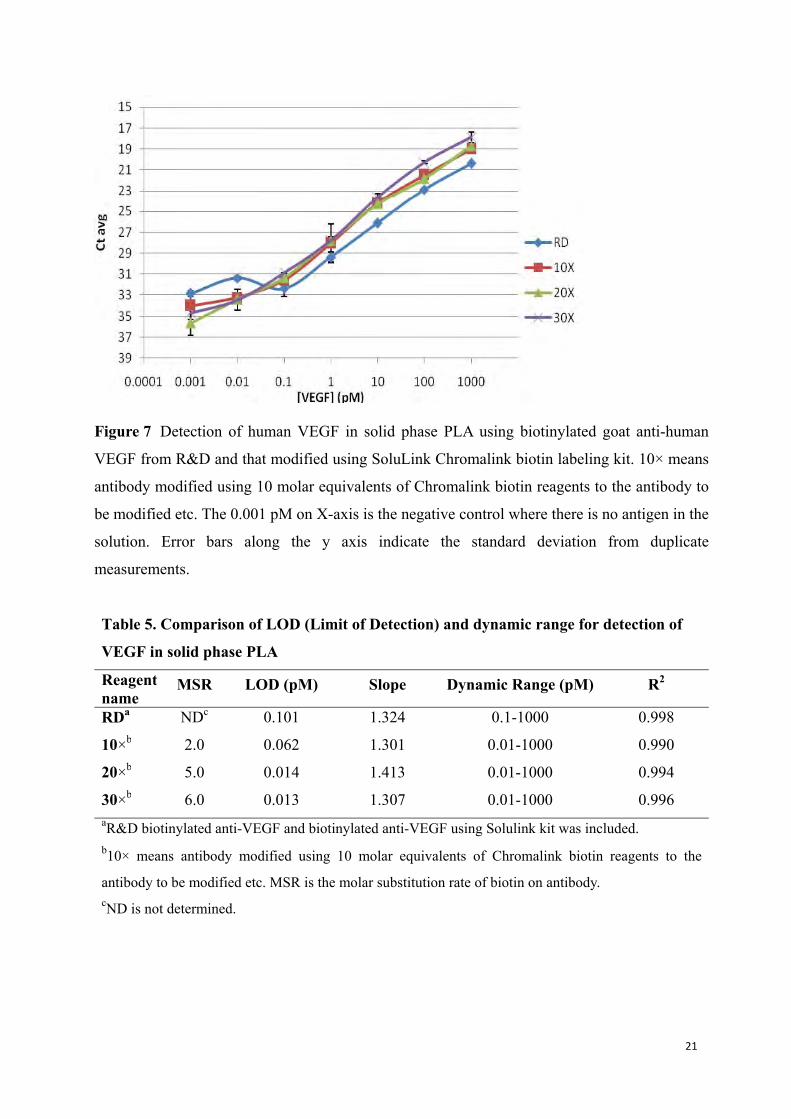
Controllability and reproducibility of biotin modification
In order to find out if biotinylation using Solulink kit is controllable and reproducible, anti-
VEGF antibody was biotinylated by the Solulink kit at different molar ratios between the
reagent and the antibody (10 ×, 20 × and 30 ×). The molar substitution rate (MSR) of biotin,
which indicates the average number of biotin molecules on an individual antibody, LOD and
dynamic range are summarized in table 5 and the standard curves are presented in figure 7. As
indicated in the table, the MSR increased with the molar equivalents of biotin reagents used to
modify the antibody. The dynamic range and LOD in SP-PLA did not change as dramatically
as the MSR if the biotinylated antibodies were used both in capture and detection.
21
Figure 7 Detection of human VEGF in solid phase PLA using biotinylated goat anti-human
VEGF from R&D and that modified using SoluLink Chromalink biotin labeling kit. 10× means
antibody modified using 10 molar equivalents of Chromalink biotin reagents to the antibody to
be modified etc. The 0.001 pM on X-axis is the negative control where there is no antigen in the
solution. Error bars along the y axis indicate the standard deviation from duplicate
measurements.
Table 5. Comparison of LOD (Limit of Detection) and dynamic range for detection of
VEGF in solid phase PLA
Reagent name
MSR LOD (pM) Slope Dynamic Range (pM) R2
RDa NDc 0.101 1.324 0.1-1000 0.998
10×b 2.0 0.062 1.301 0.01-1000 0.990
20×b 5.0 0.014 1.413 0.01-1000 0.994
30×b 6.0 0.013 1.307 0.01-1000 0.996 aR&D biotinylated anti-VEGF and biotinylated anti-VEGF using Solulink kit was included. b10× means antibody modified using 10 molar equivalents of Chromalink biotin reagents to the
antibody to be modified etc. MSR is the molar substitution rate of biotin on antibody. cND is not determined.
22
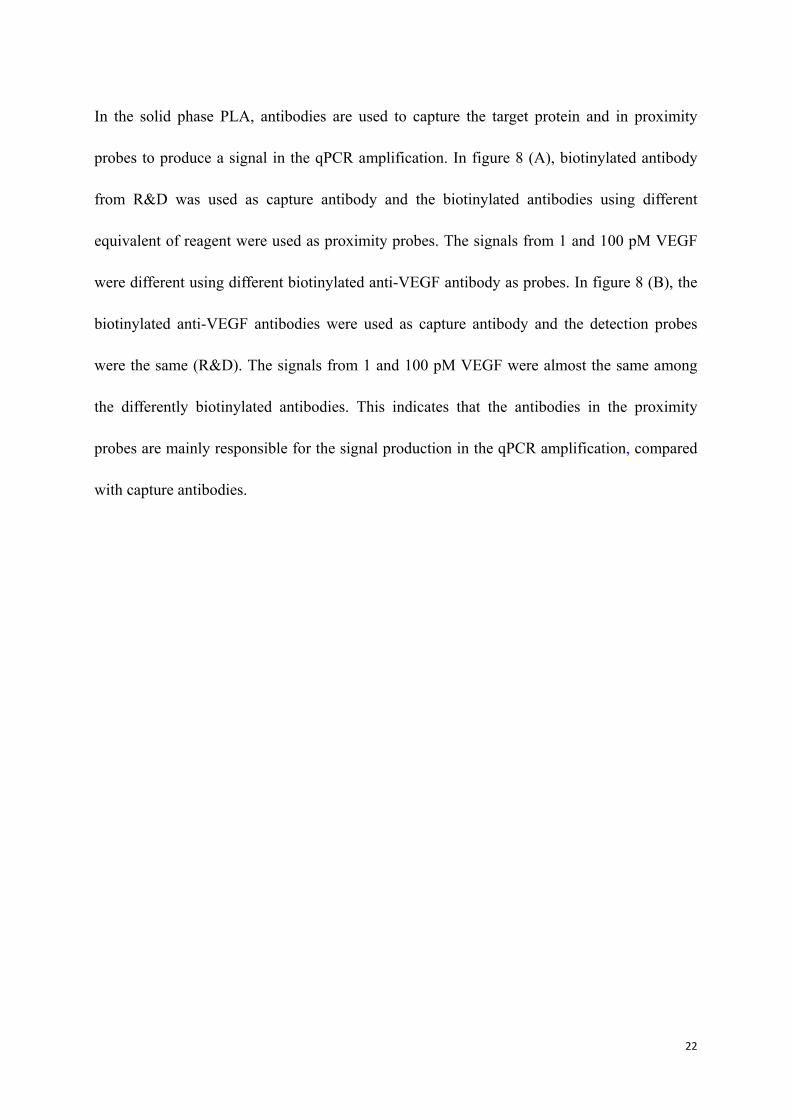
In the solid phase PLA, antibodies are used to capture the target protein and in proximity
probes to produce a signal in the qPCR amplification. In figure 8 (A), biotinylated antibody
from R&D was used as capture antibody and the biotinylated antibodies using different
equivalent of reagent were used as proximity probes. The signals from 1 and 100 pM VEGF
were different using different biotinylated anti-VEGF antibody as probes. In figure 8 (B), the
biotinylated anti-VEGF antibodies were used as capture antibody and the detection probes
were the same (R&D). The signals from 1 and 100 pM VEGF were almost the same among
the differently biotinylated antibodies. This indicates that the antibodies in the proximity
probes are mainly responsible for the signal production in the qPCR amplification, compared
with capture antibodies.
23
A B
Figure 8. Comparison of detection signal of 1 and 100 pM VEGF in solid phase PLA. 10X
means antibody modified using 10 molar equivalents of Chromalink biotin reagents to the
antibody to be modified etc. (A) R&D biotinylated antibody was used as capture antibody.
Differently biotinylated antibodies were used as proximity probes. (B) Differently
biotinylated antibodies were used as capture antibody. R&D biotinylated antibody was used in
proximity probes. Error bars in the y axis indicate the standard deviation from duplicate
measurements.
Since the antibodies in the proximity probes were important in producing signal, it would be
interesting to see if the signal would increase when the oligonucleotide amount in the
proximity probes was increased and if it was related to the MSR of biotin on the antibody.
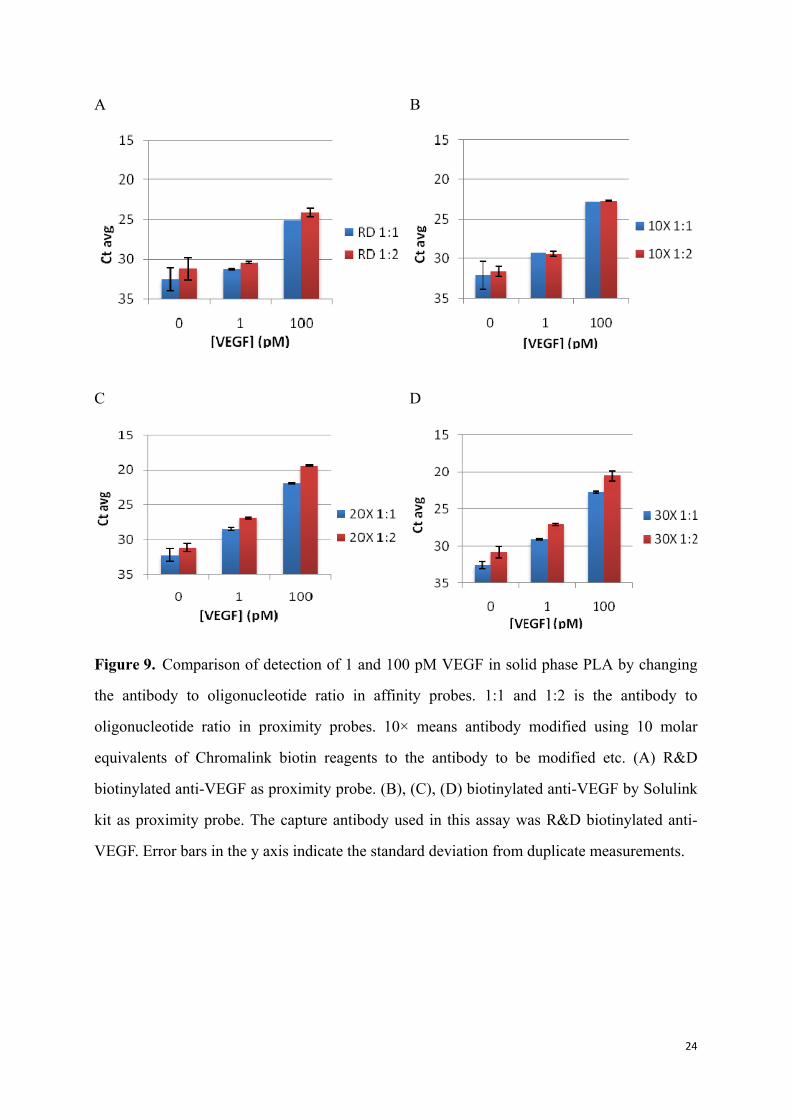
When the antibody to oligonucleotide ratio changed from 1:1 to 1:2, a slight increase of signal
(about 1 Ct) was observed in the R&D biotinylated antibody (Figure 9A), obvious increase of
signal (about 2 Ct) in the 20× modified (MSR is 5.0, figure 9C) and 30× modified (MSR 6.0,
figure 9D) antibody by Solulink kit and almost no signal increase in the 10× modified (MSR
is 2.0, figure 9B) antibody. The increase in signal indicates that more oligonucleotides were
linked to the antibody in the proximity probe as the number of biotins on each antibody
increased.
24
A B
C D
Figure 9. Comparison of detection of 1 and 100 pM VEGF in solid phase PLA by changing
the antibody to oligonucleotide ratio in affinity probes. 1:1 and 1:2 is the antibody to
oligonucleotide ratio in proximity probes. 10× means antibody modified using 10 molar
equivalents of Chromalink biotin reagents to the antibody to be modified etc. (A) R&D
biotinylated anti-VEGF as proximity probe. (B), (C), (D) biotinylated anti-VEGF by Solulink
kit as proximity probe. The capture antibody used in this assay was R&D biotinylated anti-
VEGF. Error bars in the y axis indicate the standard deviation from duplicate measurements.
25
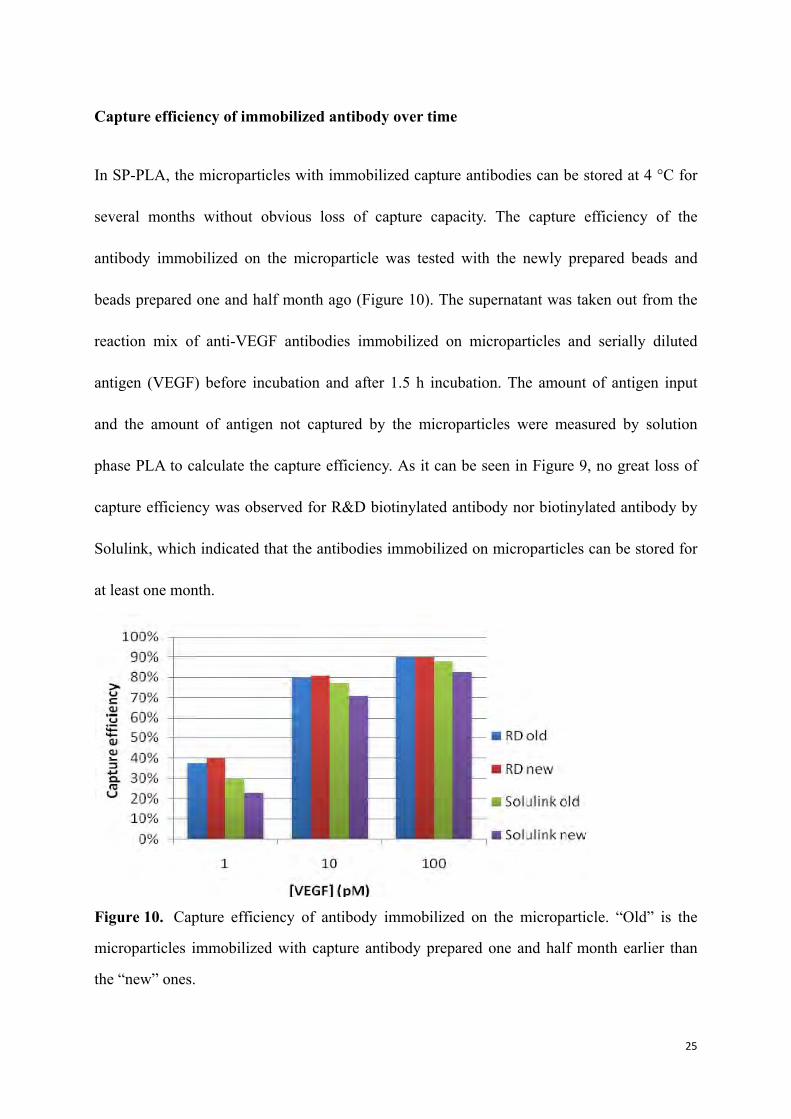
Capture efficiency of immobilized antibody over time
In SP-PLA, the microparticles with immobilized capture antibodies can be stored at 4 °C for
several months without obvious loss of capture capacity. The capture efficiency of the
antibody immobilized on the microparticle was tested with the newly prepared beads and
beads prepared one and half month ago (Figure 10). The supernatant was taken out from the
reaction mix of anti-VEGF antibodies immobilized on microparticles and serially diluted
antigen (VEGF) before incubation and after 1.5 h incubation. The amount of antigen input
and the amount of antigen not captured by the microparticles were measured by solution
phase PLA to calculate the capture efficiency. As it can be seen in Figure 9, no great loss of
capture efficiency was observed for R&D biotinylated antibody nor biotinylated antibody by
Solulink, which indicated that the antibodies immobilized on microparticles can be stored for
at least one month.
Figure 10. Capture efficiency of antibody immobilized on the microparticle. “Old” is the
microparticles immobilized with capture antibody prepared one and half month earlier than
the “new” ones.
26
Discussion
The technologies of using DNA surrogates to detect proteins such as PLA depend to a large
extent on the quality of binders, which are usually antibody-oligonucleotide conjugates. For
the noncovalent conjugation chemistry using streptavidin-biotin interaction, the biotinylation
of the antibody is the crucial step and the quality of the biotinylated antibody directly affects
the dynamic range and limit of detection of the assay. Biotinylated counterparts are
commercially available for some antibodies, but not for all.
The biotin modification reagents available on the market are different in spacer arm length
and chemical structure, solubility and reaction group as well. Since the biotinylation target in
my project was he antibody, an NHS group that targets the primary amines on the antibody
was the first choice. The linker structure can affect the efficiency of the biotinylation reaction,
the affinity of the antibody after modification and the interaction of biotin-streptavidin as well.
Reagents with different spacer arm length and structure were chosen to compare the quality of
the biotinylated antibody (Figure 3, 4 and 5). In the experiment of detection of mouse IgG in
PLA buffer, anti-mouse-IgG antibody biotinylated with different biotinylation reagents were
compared. The sulfo-NHS biotin reagent (Pierce), which has the shortest linker, had a narrow
dynamic range and limit of detection of 1 pM. This short length of the spacer arm of sulfo-
NHS (13.5 Å) could cause steric hindrance for the binding pocket 9 Å below the surface of
streptavidin. The sulfo-NHS-LC-LC biotin reagent (Pierce) has a long spacer arm (30.5 Å),
but the signal obtained with a high concentration of target protein was lower than for the other
27
antibodies. The reason could be that LC-LC structure in the biotin reagent is less hydrophilic,
so that modification of the antibody is less efficient. It could also be that the antibody
biotinylation using this linker structure reduces the solubility of the antibody, which might
affect the kinetics for affinity binding. The Solulink biotin reagent, which has the longest
linker (41 Å), a hydrophilic PEG linker, could have less steric hindrance effect than the sulfo-
NHS-PEG4 reagent from Pierce and could also enhance solubility of the biotinylated antibody.
Those could be the main reasons for its good performance (Figure 6).
The next step was to see if the antibody biotinylation using the Solulink kit could be
controllable and reproducible. After modifying different antibodies with biotin, the number of
biotin molecules on the different antibodies may vary due to the numbers of the lysine present
on the antibody and the modification efficiency. For the same antibody, the MSR should be
related to the amount of modification reagent used in the biotinylation. Theoretically, the
number of biotin molecules on antibody should follow the Poisson Distribution. When MSR
is 2.0, on the average 15% of the antibodies are not modified with biotin molecules. But when
MSR is 5, more than 99% of the antibodies will be modified with biotin molecules. If more
than one biotin molecule is coupled to the antibody (MSR>1), and the ratio of antibody
to oligonucleotides remains to 1:1, chances are that more than one streptavidin-oligonucleotide
conjugate may link to one antibody, leaving some antibodies without oligonucleotides. “Cold
binders” – i.e. antibodies without oligonucleotides - will cause loss of signals in the detection.
As the MSR increases with the amount of modification reagent used in biotinylation, the
dynamic range and the LOD was not changed dramatically when the modified antibody was
28
used both as capture and proximity probes (Table 5 and Figure 7), which meant that the
streptavidin - oligonucleotides tended to bind to the biotinylated antibodies evenly without
generating “cold binders.” Another hypothesis was that the increase of MSR of biotin on the
antibody was correlated with the signal increase when more oligonucleotides were linked to
the antibody in the proximity probe (Figure 9). For the 10×modification antibody with MSR
of 2.0, the increase of oligonucleotides in probes did not result in increase in signal, because
60% of the antibodies were modified with 2 biotin molecules. For the 10× and 20×
modified antibody with MSR of 5 and 6, more than 97% of the antibodies have at least 2
biotin molecules on themselves. So the increase of signal was obvious when the antibody:
oligonucleotide ratio increased from 1:1 to 1:2.
In solid phase PLA, the biotinylated antibodies are immobilized on the magnetic beads as
capture antibody and conjugated with oligonucleotides as proximity probes. If the differently
biotinylated anti-VEGF is used as capture antibody, the number of biotin molecules on
antibody will not have great impact on signal production (Figure 8B). However, if the
biotinylated antibody is used in proximity probes, differently biotinylated anti-VEGF with
different MSR numbers will cause difference in signal production (Figure 8B). The
biotinylated antibody using Solulink biotin reagent immobilized on the magnetic beads can be
stored for at least one month without obvious losing capture capacity (Figure 10).
29
Materials and methods
Buffers, proteins and oligonucleotides
1×PBS buffer contained 137 mM NaCl, 2.7 mM KCl, 10 mM sodium phosphate dibasic, 2
mM potassium phosphate monobasic and a pH of 7.4 (The salts used in PBS buffer were from
Sigma-Aldrich). PLA buffer consists of 1 mM D-biotin (Invitrogen), 0.1% purified BSA
(Bovine Serum Albumin, New England Biolabs), 0.05% Tween-20 (Sigma-Aldrich), 100 nM
goat IgG (Sigma-Aldrich), 0.1 μg/μl salmon sperm DNA (Invitrogen), 5 mM EDTA in 1×PBS
(pH 7.4). The washing buffer contained 0.05% Tween-20 (Sigma-Aldrich) in 1×PBS. The
storage buffer was 1×PBS with 0.1% purified BSA (New England Biolabs).
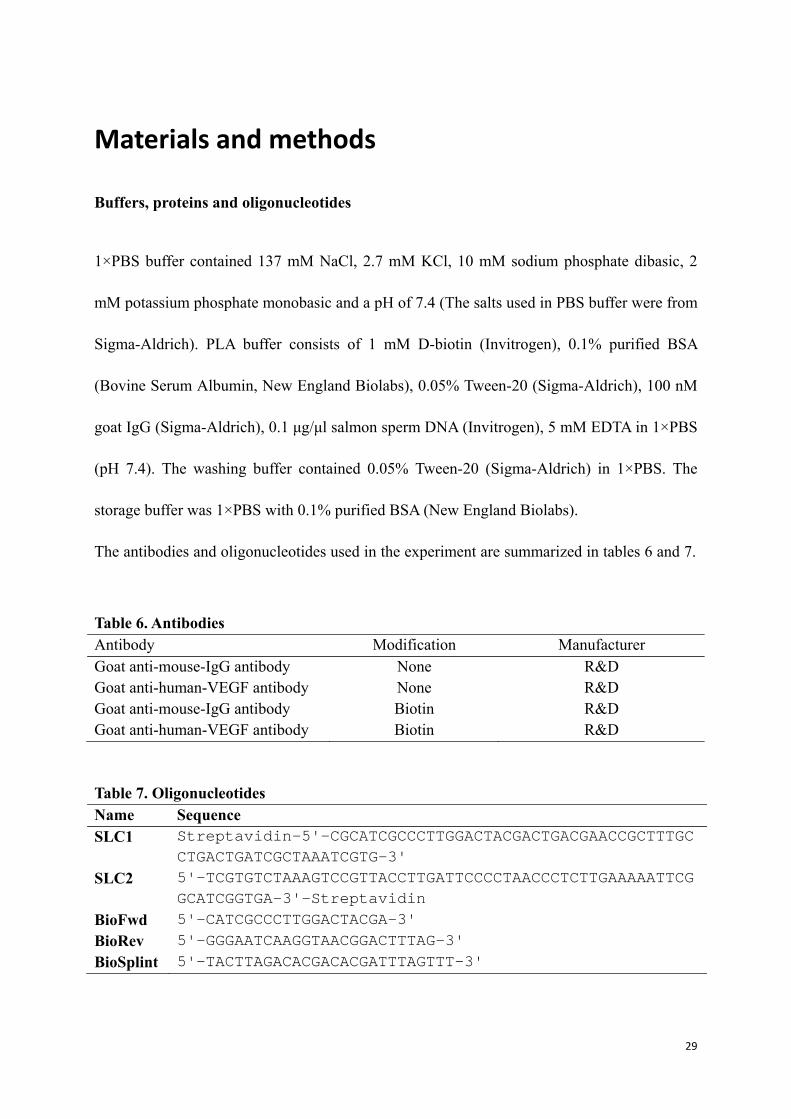
The antibodies and oligonucleotides used in the experiment are summarized in tables 6 and 7.
Table 6. Antibodies Antibody Modification Manufacturer Goat anti-mouse-IgG antibody None R&D Goat anti-human-VEGF antibody None R&D Goat anti-mouse-IgG antibody Biotin R&D Goat anti-human-VEGF antibody Biotin R&D
Table 7. Oligonucleotides Name Sequence SLC1 Streptavidin-5'-CGCATCGCCCTTGGACTACGACTGACGAACCGCTTTGC
CTGACTGATCGCTAAATCGTG-3' SLC2 5'-TCGTGTCTAAAGTCCGTTACCTTGATTCCCCTAACCCTCTTGAAAAATTCG
GCATCGGTGA-3'-Streptavidin BioFwd 5'-CATCGCCCTTGGACTACGA-3' BioRev 5'-GGGAATCAAGGTAACGGACTTTAG-3' BioSplint 5'-TACTTAGACACGACACGATTTAGTTT-3'
30
Biotinylation of antibodies
Solulink ChromaLink Biotin Protein Labeling Kit
Before biotinylation, 25-40 μg antibody (0.25-0.4 mg/ml in 1×PBS) was desalted into
1×modification buffer (provided with the kit) using a 0.5 ml Zeba Desalt Spin Column
(Pierce). 0.5 mg of pre-weighed solid Sulfo-ChromaLink biotin was dissolved in 1000 μl
1×modification buffer to make up a 0.5 mM ChromaLink biotin working solution
immediately before biotinylation. A 20-fold molar excess (if nothing else stated) of
ChromaLink biotin in working solution was added to the desalted antibody and the mixture
was incubated at room temperature for 90 min. After biotinylation, the antibody was desalted
into 1×PBS using a 0.5 ml Zeba spin column to remove excessive ChromaLink biotin and
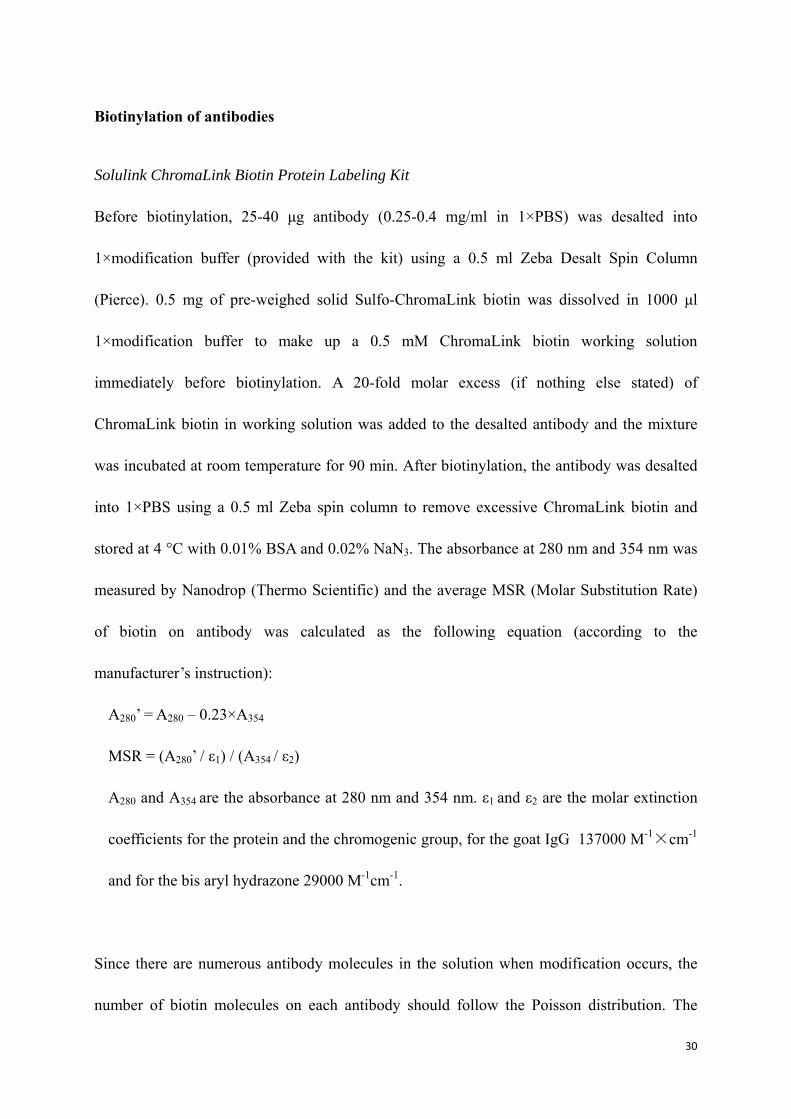
stored at 4 °C with 0.01% BSA and 0.02% NaN3. The absorbance at 280 nm and 354 nm was
measured by Nanodrop (Thermo Scientific) and the average MSR (Molar Substitution Rate)
of biotin on antibody was calculated as the following equation (according to the
manufacturer’s instruction):
A280’ = A280 – 0.23×A354
MSR = (A280’ / ε1) / (A354 / ε2)
A280 and A354 are the absorbance at 280 nm and 354 nm. ε1 and ε2 are the molar extinction
coefficients for the protein and the chromogenic group, for the goat IgG 137000 M-1×cm-1
and for the bis aryl hydrazone 29000 M-1cm-1.
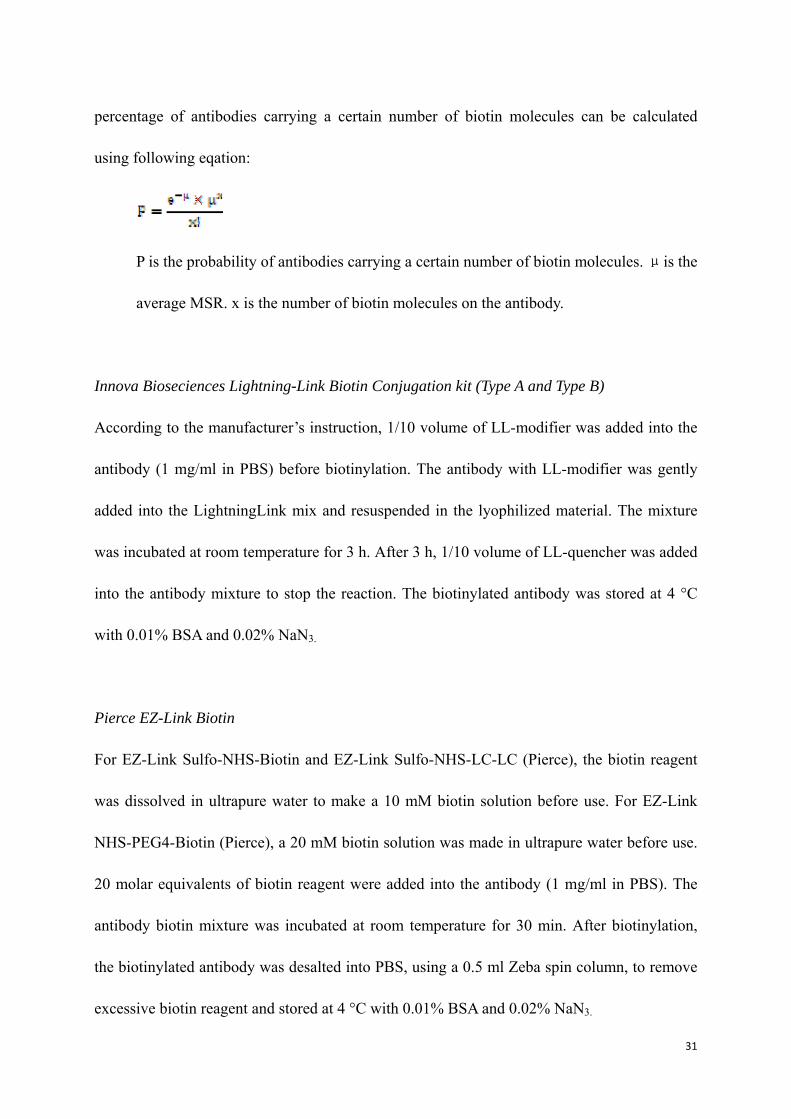
Since there are numerous antibody molecules in the solution when modification occurs, the
number of biotin molecules on each antibody should follow the Poisson distribution. The
31
percentage of antibodies carrying a certain number of biotin molecules can be calculated
using following eqation:
P is the probability of antibodies carrying a certain number of biotin molecules. μis the
average MSR. x is the number of biotin molecules on the antibody.
Innova Bioseciences Lightning-Link Biotin Conjugation kit (Type A and Type B)
According to the manufacturer’s instruction, 1/10 volume of LL-modifier was added into the
antibody (1 mg/ml in PBS) before biotinylation. The antibody with LL-modifier was gently
added into the LightningLink mix and resuspended in the lyophilized material. The mixture
was incubated at room temperature for 3 h. After 3 h, 1/10 volume of LL-quencher was added
into the antibody mixture to stop the reaction. The biotinylated antibody was stored at 4 °C
with 0.01% BSA and 0.02% NaN3.
Pierce EZ-Link Biotin
For EZ-Link Sulfo-NHS-Biotin and EZ-Link Sulfo-NHS-LC-LC (Pierce), the biotin reagent
was dissolved in ultrapure water to make a 10 mM biotin solution before use. For EZ-Link
NHS-PEG4-Biotin (Pierce), a 20 mM biotin solution was made in ultrapure water before use.
20 molar equivalents of biotin reagent were added into the antibody (1 mg/ml in PBS). The
antibody biotin mixture was incubated at room temperature for 30 min. After biotinylation,
the biotinylated antibody was desalted into PBS, using a 0.5 ml Zeba spin column, to remove
excessive biotin reagent and stored at 4 °C with 0.01% BSA and 0.02% NaN3.
32
Antibody immobilization on solid surface
The Dynabeads Myone streptavidin T1 (Invitrogen) was used as solid surface in the
experiment. In order to immobilize antibody on the solid surface, 100 μl (1 mg) of Dynabeads
was washed twice with 500 μl washing buffer and 200 μl of 50nM biotinylated antibody was
added into the Dynabeads. After incubation for one hour on a rotator at room temperature, the
Dynabeads were washed twice with 500 μl washing buffer and reconstituted in 200 μl storage
buffer. The Dynabeads immobilized with capture antibody were stored at 4 °C.
Preparation of proximity probes
Two aliquots of biotinylated antibody were incubated with SLC1 and SLC2 oligonucleotide
(Table 7) proximity arms separately at 1:1 molar ratio with the concentration of 50 nM
antibody in storage buffer. After incubation for 45 min at room temperature, the antibody-
oligonucleotide conjugates were separately blocked in PLA buffer for 5 min. Before use, the
two antibody-oligonucleotide conjugates were mixed together to a final concentration of 250
pM, to work as proximity probe mix in the solid phase PLA. In the solution phase PLA, the
final probe concentration in the reaction was 50 pM.
Solid phase PLA
For each PLA reaction, 5 μg of Dynabeads immobilized with 7.5 ng capture antibody were
diluted in PLA buffer in a 1:4 (v/v) ratio. The antigen that would be detected in the assay was
33
serially diluted from 1 nM to 0.01 pM in PLA buffer. A negative control with no antigen
added was included. In order to capture the antigen on the solid support, 5 μl of diluted
Dynabeads were mixed with 45 μl antigen sample in a well of a conventional 96-well
microtiter/PCR plate. The mixture was incubated at room temperature for 1.5 h on a rotator.
After incubation, the Dynabeads were washed twice with 100 μl of washing buffer with the
microtiter plate placed on a 96-well plate magnet (Perkin Elmer). 50 μl of proximity probe
mix was added into each well and incubated with the Dynabeads for another 1.5 h on a rotator
at room temperature. The Dynabeads were washed twice with 100 μl of washing buffer after
the incubation. 50 µl of ligation and PCR mix, which contained 1×Taq buffer (Invitrogen), 2.5
mM MgCl2 (Invitrogen), 0.5×SybrGold, 0.1 μM BioFwd primer (Integrated DNA
Technology), 0.1 μM BioRev primer (Integrated DNA Technology), 0.1 μM BioSplint
(Integrated DNA Technology), 0.08 mM ATP, 0.2 mM dNTP (with dUTP, Fermentas), 0.03
U/μl Taq polymerase (Invitrogen), 0.01 U/μl T4 ligase (Fermentas) and 0.002 U/μl Uracil-
DNA glycosylase (Fermentas), was added into each microtiter well. Finally the ligation
products were detected through qPCR, which was programmed at 95 °C for 2 min, and
followed by 40 cycles of 95 °C for 15 sec and 60 °C for 1 min.
Solution phase PLA
Solution phase PLA started with incubation of 2 μl sample and 2 μl affinity probes (50 pM) at
room temperature for 1.5 h. After incubation, 46 μl ligation and PCR mix as that in the solid
phase PLA was added into the reaction and followed by the same qPCR program as the solid
34
phase PLA.
Data analysis
The qPCR results were analyzed by MxPro software (Stratagene), and the recorded Ct value
was exported and analyzed in Excel software (Microsoft). The dynamic range of the standard
curve was the linear range with R2 larger than 0.99 in a Ct average versus antigen
concentration fitting curve. The limit of detection (LOD) was defined as the concentration of
protein corresponding to CtLOD, i.e. two standard deviations above the average background Ct
value. The capture efficiency was calculated as following:
Capture efficiency = (1 – 2ΔCt) × 100%
ΔCt is the Ct difference between the sample before or after capture on the solid phase.
The Ct of the sample in this case was measured by solution phase PLA.

35
Acknowledgement
I would like to thank Ulf Landegren for giving me the opportunity to work in this fantastic
group, Masood Kamali-Moghaddam for this interesting project and critical comments on the
thesis. I would also like to thank Maria Hammond for her patience in practical lab work and
brilliant suggestions on the report. In addition, I would like to appreciate the PLA meeting
every Monday morning for giving me inspiring ideas and thank Carla and Lena for providing
all the reagents and keeping stable function of the equipment. Last but not least, I would like
to thank all the people in the Molecular Medicine group for creating the small academic world
with great freedom and opportunity.
36
References
Ackermann BL, Hale JE, Duffin KL. 2006. The role of mass spectrometry in biomarker
discovery and measurement. Current Drug Metabolism 7: 525-539
Aebersold R, and Mann M. 2003. Mass spectrometry-based proteomics. Nature 422:
198-207.
Anborgh PH, Wilson SM, Tuck AB, Winquist E, Schmidt N, Hart R, Kon S, Maeda M,
Uede T, Stitt LW, Chambers AF. 2009. New Dual Monoclonal ELISA for Measuring Plasma
Osteopontin as a Biomarker Associated with Survival in Prostate Cancer: Clinical Validation
and Comparison of Multiple ELISAs. Clin. Chem. 55: 895 - 903.
Beck M, Malmstrom JA, Lange A, Schmidt A, Deutsch EW, Aebersold R. 2009. Visual
proteomics of the human pathogen Leptospira interrogans. Nat Meth 6: 817-823.
Binz HK, Amstutz P, Kohl A, Stumpp M T, Briand C, Forrer P, Grutter MG, Pluckthun A.
2004. High-affinity binders selected from designed ankyrin repeat protein libraries. Nat
Biotech 22: 575-582.
Darmanis S, Nong RY, Hammond M, Gu J, Alderborn A, Vanelid J, Siegbahn A,
Gustafsdottir A, Ericsson O, Landegren U, Moghaddam MK. 2009. Sensitive plasma protein
analysis by microparticle-based proximity ligation assays. Mol Cell Proteomics 9: 327-335
Doyle MJ, Halsall HB, Heineman WR. 1984. Enzyme-linked immunoadsorbent assay
with electrochemical detection of .alpha.1-acid glycoprotein. Analytical Chemistry 56: 2355-
2360
Florens L, Washburn MP, Raine JD, Anthony RM, Grainger M, Haynes JD, Moch JK,
37
Muster N, Sacci JD, Tabb DL, Witney AA, Wolters D, Wu Y, Gardner DY, Holder AA, Sinden
RE, Yates JR, Carucci DJ. 2002. A proteomic view of the Plasmodium falciparum life cycle.
Nature 419: 520-526.
Fredriksson S, Dixon W, Ji H, Koong AC, Mindrinos M and Davis RW. 2007.
Multiplexed protein detection by proximity ligation for cancer biomarker validation. Nature
Methods 4: 327-329.
Fredriksson S, Gullberg M, Jarvius J, Olsson C, Pietras K, Gustafsdottir SM, Ostman A,
Landegren U. 2002. Protein detection using proximity-dependent DNA ligation assays.
Nature Biotechnology 20: 473-477.
Fredriksson S, Horecka J, Brustugun OT, Schlingemann J, Koong AC, Tibshirani R,
Davis RW. 2008. Multiplexed Proximity Ligation Assays to Profile Putative Plasma
Biomarkers Relevant to Pancreatic and Ovarian Cancer. Proteomics and Protein Markers
54:582-589
Gullberg M, Gustafsdottir SM, Schallmeiner E, Jarvius J, Bjarnegard M, Betsholtz C,
Landegren U, Fredriksson S. 2004. Cytokine detection by antibody-based proximity ligation.
Proceedings of the National Academy of Sciences of the United States of America 101: 8420-
8424.
Green NM. 1990. Avidin and streptavidin. Methods Enzymol. 184: 51–67.
Gustafsdottir SM, Nordengrahn A, Fredriksson S, Wallgren P, Rivera E, Schallmeiner E,
Merza M, Landegren U. 2006. Detection of Individual Microbial Pathogens by Proximity
Ligation. Clin Chem 52: 1152-1160.
Hermanson GT. 2008. Bioconjugation techniques. 2nd ed. Academic Press. New York
38
Livnah O, Bayer EA, Wilchek M, and Sussman JL. 1993. Three-dimensional structures
of avidin and the avidin-biotin complex. Proceedings of the National Academy of Sciences of
the United States of America 90: 5076–5080.
Lopez MF, Mikulskis A, Kuzdzal S, Golenko E, Petricoin EF, Liotta LA, Patton WF,
Whiteley GR, Rosenblatt K, Gurnani F, Nandi A, Neill S, Cullen S, O'Gorman M, Sarracino
D, Lynch C, Johnson A, Mckenzie W, Fishman D. 2007. A Novel, High-Throughput
Workflow for Discovery and Identification of Serum Carrier Protein-Bound Peptide
Biomarker Candidates in Ovarian Cancer Samples. Clin Chem 53: 1067-1074
Nord K, Nilsson J, Nilsson B, Uhlén M and Nygren P. 1995. A combinatorial library of
an -helical bacterial receptor domain. Protein Engnieering 8: 601-608
Ohkuma H, Abe K, Ito M, Kokado A, Kambegawa A, Maeda M. 2002. Development of
a highly sensitive enzyme-linked immunosorbent assay for bisphenol A in serum. Analyst 127:
93-97
Spisák S, Guttman A. 2009. Biomedical applications of protein microarrays. Current
Medicinal Chemistry 16: 2806-2815
Stoevesandt O, Taussig MJ. 2007. Affinity reagent resources for human proteome
detection: Initiatives and perspectives. Proteomics 7: 2738-2750
SoluLink. 2009. Protein-oligo conjugation. www document 10. November 2009
http://www.solulink.com/products/hynic-conjugation-kit-s-9011-1.php
Twyman R. 2003. Proteomics. www document 8. January 2003
http://genome.wellcome.ac.uk/doc_wtd020767.html
Wiese R, Belosludtsev Y, Powdrill T, Thompson P, Hogan M. 2001. Simultaneous

39
multianalyte ELISA performed on a microarray platform. Clinical Chemistry 47:1451-1457
Wikman M, Steffen AC, Gunneriusson E, Tolmachev E, Adams GP, Carlsson J and Ståhl
S. 2004. Selection and characterization of HER2/neu-binding affibody ligand. Protein
Engineering Design and Selection 5:455-462