Embed Size (px)
Citation preview
Vol.:(0123456789)1 3
Arabian Journal for Science and Engineering https://doi.org/10.1007/s13369-021-05645-0
RESEARCH ARTICLE-ELECTRICAL ENGINEERING
Optimal Design of Hybrid Renewable Energy System for a Reverse Osmosis Desalination System in Arar, Saudi Arabia
Ali M. Eltamaly1,2,3 · Emad Ali4 · Mourad Bumazza4 · Sarwono Mulyono4 · Muath Yasin4
Received: 30 October 2020 / Accepted: 3 April 2021 © King Fahd University of Petroleum & Minerals 2021
AbstractSaudi Arabia tries to build local desalination water stations to supply water to remote areas. Due to the low cost and energy requirements of reverse osmosis (RO) desalination technology, it has been used to supply fresh water to Arar City in the northeast of Saudi Arabia. In this paper, it is proposed to provide an average of 1000 cubic meters of water per day by using autonomous hybrid renewable energy system (RES). This proposed system contains wind turbines (WTs), photovoltaic (PV), battery, and it is designed to feed the RO system with the energy adequate to produce the required amount of fresh water for the minimum cost and minimum loss of supply probability. The proposed system was designed to generate 2440 kW power to produce this amount of water. Matching study between the site and the best WT among 10 market-available WTs is introduced. Three optimization strategies were used and compared for the design of the proposed system to ensure that no premature convergence can occur. These strategies consisted of two well-known techniques, particle swarm optimization and bat algorithm (BA), and a relatively new technique: social mimic optimization. The simulation results obtained from the proposed system showed the superiority of using a RES for feeding a RO desalination power plant in Arar City, and they also showed that the BA is the fastest and most accurate optimization technique to perform this design problem compared with the other two optimization techniques. This detailed analysis shows that the cost of production of fresh water is $0.745/m3.
Keywords Reverse osmosis · Water desalination · Wind energy · Battery system · Cost analysis · Optimization techniques
1 Introduction
Fresh water is essential for humans, and modern socie-ties concentrate around sources of fresh water. However, between 10% [1] and 25% of the world’s population does not have adequate access to fresh water [2]. Moreover, increases in the global population, coupled with drought and deserti-fication due to climate change, will undoubtedly aggravate water security. Water desalination substations provide a use-ful solution to remedy these problems. However, an inherent
problem in these substations is the need for electric energy and the high cost of the desalination seawater or brackish water, which could be resolved by using innovative energy solutions that can participate in helping 18% of the global population that lacks access to electricity [1]. This problem has led to researchers investigating the use of renewable energy systems (RESs) for water desalination, especially for remote communities without access to electricity. With the vast expanse of Saudi Arabia, water scarcity is a critical issue for remote areas. Most remote societies without access to electricity use diesel engines to power desalination substa-tion, which could cause a shortage of fresh water when there is no fuel. Therefore, RESs provide a suitable alternative to supply these communities with their needs from electric power.
Many types of water desalination systems have been introduced in the literature [2–10], including solar distilla-tion, vacuum distillation, multi-stage flash distillation, multi-ple-effect distillation, vapor compression distillation, reverse osmosis (RO), membrane distillation, etc. The use of RES for driving reverse osmosis desalination systems (RODSs)
* Ali M. Eltamaly [email protected]
1 Sustainable Energy Technologies Center, King Saud University, Riyadh 11421, Saudi Arabia
2 Electrical Engineering Department, Mansoura University, Mansoura, Egypt
3 K.A. CARE Energy Research and Innovation Center, Riyadh 11451, Saudi Arabia
4 Chemical Engineering Department, King Saud University, Riyadh 11421, Saudi Arabia
Arabian Journal for Science and Engineering
1 3
is one of the best options in remote areas because it does need fuel transmission, and it provides a safe, feasible, and reliable source of energy. Moreover, RODS technology is advancing, it is widespread in many places worldwide, its price is continuously dropping, and it produces fresh water with relatively lower energy consumption than other tech-nologies. Fresh water can be produced from both seawa-ter and brackish water using a RODS [2–9]. A review of the drawbacks of using renewable energy systems in water desalination and other application are shown in [11]. For these reasons, RODS technology was selected to be inves-tigated in this paper as water desalination technology. The RODS size is computed according to the amount of fresh water produced, while RES-rated values are designed to sat-isfy the required energy for a RODS to produce the required amount of fresh water based on the wind speed and solar irradiance of the site.
Different sources of RESs with and without storage sys-tems can be used to supply a RODS with the electric energy needed for its operation. Some researchers have introduced RODSs working from wind energy systems without an energy storage system [3]. Other researchers introduced photovoltaic (PV) energy systems without battery storage [4–9]. These systems are very cost-effective because the expensive and short-lived storage system is not included in these systems. However, RODSs working from RESs without energy storage systems are unreliability due to the intermittent nature of the RES sources, such as wind or photovoltaic energy systems. Therefore, many RODSs use hybrid RESs with battery storage and/or fuel cells and hydrogen tanks to store energy when needed [12, 13]. Some studies recommend using a water tank to store extra desali-nated water for later use when water production is lower
than consumer needs [2]. Using a water tank reduces the size of the battery storage required to store the surplus energy required to account for shortages from RES generation. An exergy analysis of a hydrogen and water production by using a solar-driven transcritical CO2 power cycle with Stirling engine is introduced in [14, 15]. This study aimed to further utilizes the highest possible exergy using a novel system for hydrogen and fresh water production. This system used a Stirling engine instead of a condenser in abundant access places to solar radiation and brackish or sea water.
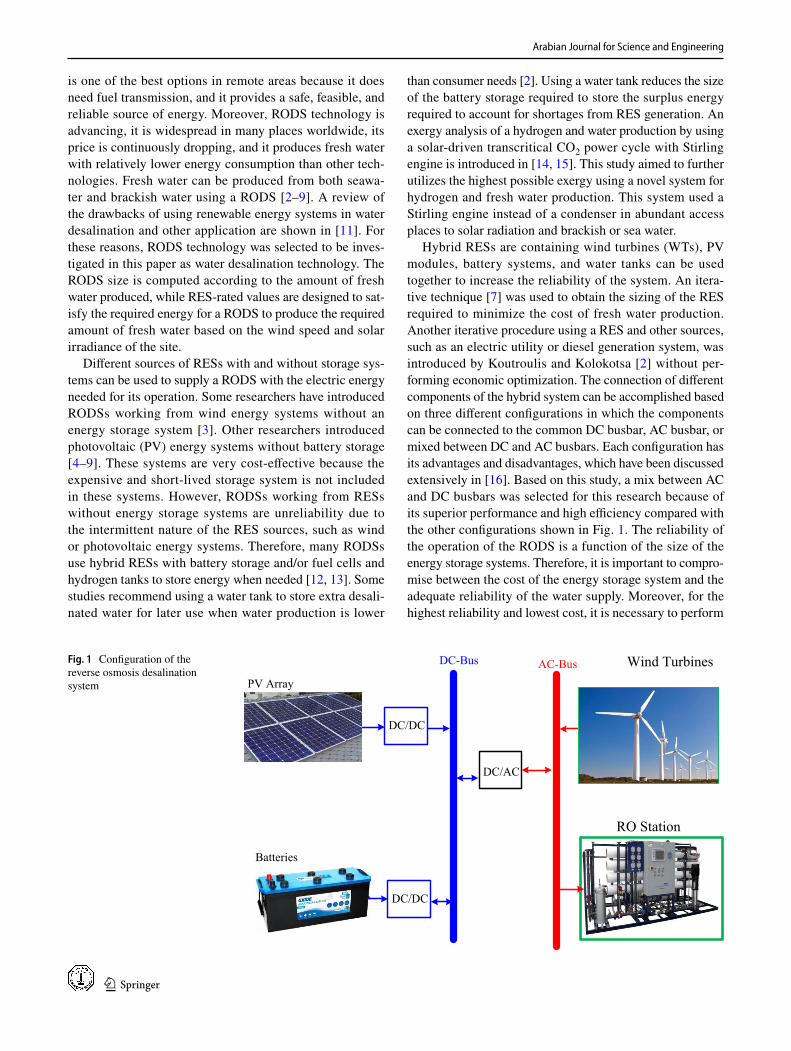
Hybrid RESs are containing wind turbines (WTs), PV modules, battery systems, and water tanks can be used together to increase the reliability of the system. An itera-tive technique [7] was used to obtain the sizing of the RES required to minimize the cost of fresh water production. Another iterative procedure using a RES and other sources, such as an electric utility or diesel generation system, was introduced by Koutroulis and Kolokotsa [2] without per-forming economic optimization. The connection of different components of the hybrid system can be accomplished based on three different configurations in which the components can be connected to the common DC busbar, AC busbar, or mixed between DC and AC busbars. Each configuration has its advantages and disadvantages, which have been discussed extensively in [16]. Based on this study, a mix between AC and DC busbars was selected for this research because of its superior performance and high efficiency compared with the other configurations shown in Fig. 1. The reliability of the operation of the RODS is a function of the size of the energy storage systems. Therefore, it is important to compro-mise between the cost of the energy storage system and the adequate reliability of the water supply. Moreover, for the highest reliability and lowest cost, it is necessary to perform
Fig. 1 Configuration of the reverse osmosis desalination system
DC/DC
PV ArrayAC-Bus
DC/AC
Batteries
DC/DC
DC-Bus Wind Turbines
RO Station
Arabian Journal for Science and Engineering
1 3
optimization operations to select each system component’s optimal size. Many iterative techniques have been used to determine the best option for sizing the RES for supplying a RODS. One of these techniques is using the iterative proce-dure to design the optimal size of a PV system for a RODS [17–19]. These iterative techniques provide a suitable option for sizing the RES and RODS, but there is no guarantee that this solution is the optimal one. Hybrid RESs with several components and several factors inherent in each component provide a challenge to using iterative techniques to perform the optimal design of the hybrid RES for RODS applica-tions. Modern soft computing techniques, such as swarm techniques, can be useful for the selection of the optimal size of the RES that can supply the RODS with the required amount of electric energy. The particle swarm optimization (PSO) technique has been used several times to optimally design a hybrid RES for RODS [20–22]. The PSO tech-nique is a powerful optimization tool that can be used for this purpose, but it may capture local optima. Moreover, the PSO optimization time is sometimes long, especially with a higher number of variables. The Genetic Algorithm (GA) optimization technique has also been used in several stud-ies [23, 24]. The GA is one of the evolutionary techniques that can be trapped in one of the local optima and is suffer-ing from complexity and long convergence time. Simulated annealing (SA) [25] and gray wolf optimization (GWO) [26] techniques have also been used for the optimal design of a hybrid RES for use in supplying a RODS. Other research-ers have used hybrid optimization techniques, such as PSO-GWO, for this purpose to accurately determine the global optimal values and to improve the convergence speed [27]. The results obtained from this hybrid optimization technique [27] have been compared with the results obtained from each optimization technique separately. The results obtained from the hybrid PSO-GWO showed better performance than using PSO or GWO alone. However, this technique introduced complexity into the system, and the improvements in this hybrid technique are not clear. Moreover, this hybrid opti-mization technique requires substantial effort to tune the control parameters of PSO and GWO. Therefore, it is essen-tial to find another optimization technique to conduct these optimization requirements without adding complexity or lowering the convergence speed and reliability of capturing the optimal solution. The bat algorithm (BA) optimization technique, which was introduced in 2010 [28], is a modifica-tion of the PSO technique. This technique is characterized by a very fast and accurate convergence performance for low-dimensional problems [29, 30] such as the case studies presented in this paper. This powerful optimization tool has never been used in the design of the renewable desalination system, and for this reason, it was selected for investigation in this paper. A modern optimization technique, called the social mimic optimization (SMO) technique [31, 32], was
also be used in the optimization of the hybrid system, and it was compared with the well-known PSO and BA optimiza-tion techniques.
In this paper, we conduct optimization of a RODS pow-ered by a RES for supplying fresh water to Arar City located in the northeast of Saudi Arabia. The proposed RES contains WTs, PV modules, batteries, and a water tank, along with their control systems and power conditioner. A new optimal matching between the site and the WTs was introduced in the sizing processes. A total of 10 market-available WTs were studied to select the best one for the Arar site which include the WT matching strategy with the sizing of the RES components. Moreover, the optimal sizing of the RES components was used to determine the lowest cost and high-est reliability of fresh water produced from the system. The loss of supply probability (LOSP) is used to evaluate the reliability of the proposed system during the year. A detailed cost analysis of the proposed system was conducted to cover all details of the proposed system, taking into considera-tion the salvage value and operating and maintenance costs. The optimization techniques used in this problem were PSO, BA, and SMO. The latter two techniques have not been used before in the design of desalination systems, and for this reason, they were used and compared with the previously used PSO technique. Results are shown for different levels of reliability to see the effect of the high LOSP level on the cost of desalinated cubic meters of fresh water. This paper indicates that lower LOSP leads to higher confidence from the RODS system and higher costs of the generated energy and fresh water produced and vice versa.
The rest of the paper is structured to show the proposed system in Sect. 2. Section 3 shows the power flow in a RES and the energy balance between the generation, battery, and the load. Section 4 presents the cost analysis and economic issues used in the simulation section. Section 5 introduces the three optimization techniques understudy, while Sect. 6 shows the simulation work. Recommendations and conclu-sions are summarized in the final section.
2 Proposed System
Different renewable energy sources with different storage systems can be used to feed a RODS with the energy it requires. Wind turbine-only RODSs can be used at low cost to effectively produce desalinated water. However, although a wind energy system without battery storage has a lower cost, its reliability is very low since fresh water can only be produced when wind speed and solar irradiances are suffi-cient to satisfy RODS requirements. A water tank can solve part of the problem, as the water stored in a tank can feed the customer during the electric power generated using a RES is deficient. Moreover, battery storage can also be used to store
Arabian Journal for Science and Engineering
1 3
the surplus generated electric energy for use during deficit periods. The proposed hybrid RES and RODS is shown in Fig. 1. This system uses WTs and a PV array as a renewable generation system. Lead–acid batteries will be used as an electric storage system. The configuration of the system uses a mixed configuration between DC and AC busbars, which shows better performance and higher efficiency [16]. The operating characteristics of these components are provided in the following sections.
2.1 Wind Energy System Modeling
WTs can have different performance characteristics from site to site, and for this reason, it is necessary to match the site with an appropriate WT. Statistical analysis was con-ducted to determine the capacity factor (CF), where the CF represents the relationship between the average generated power from a WT and its rated power. The WT with the highest performance can be selected as the best option based on technical considerations. Meanwhile, selecting the best WT should take technological and economic parameters into consideration [33].
Hourly wind speed, u, is modeled using the Weibull distribution where its probability density function can be expressed in terms of Weibull parameters, scale parameter, c, and shape parameter, k, as shown in Eq. (1). The value of k and c can be determined from the iterative process pre-sented by Stevens and Smulders [34], as shown in Eqs. (2) and (3), respectively. The CF of using WT parameters and site wind speed is shown in Eq. (4). The average amount of power generated from a WT at a certain site is equal to the CF multiplied by the rated power of the WT as shown in Eq. (5) [35].
(1)
f (u) =k
c
(u
c
)k−1
exp
(−(u
c
)k), (k > 0, u > 0, c > 1)
(2)k =
⎛⎜⎜⎜⎜⎝
N∑j=1
ukjln�uj�
N∑j=1
ukj
−
N∑j=1
ln�uj�
N
⎞⎟⎟⎟⎟⎠
−1
(3)c =
(N∑j=1
ukj∕N
) 1
k
CF =exp
[−(uC∕c
)k]− exp
[−(ur∕c
)k]
(ur∕c
)k−(uC∕c
)k − exp[−(uF∕c
)k]
where uj is the wind speed at time step j, N is the number of time steps, and PR is the rated power of the WT.
The hourly generated power at wind speed u from a WT was calculated following Tzen et al. [10].
where UC, UR, and UF are the WT cut-in speed, rated speed, and cutoff speed, respectively.
2.2 Photovoltaic Energy System Modeling
The electric power generated from the PV system is sub-stantially affected by the irradiance falling on the PV as well as its area. It is recommended to tilt the PV modules with an optimal tilt angle to increase the irradiance and, conse-quently, the energy generated from a PV system. This opti-mal tilt angle is chosen to be equal to the latitude angle of the site [16]. The hourly generated power from the PV array was determined using Eq. (7).
where Ht is the solar radiation on an optimally tilted surface, PVA is the total area of PV array, and ηc(t) is the hourly efficiency of a PV array, which was obtained using Eq. (8).
where βt is the temperature coefficient, which was set at 0.005 per °C following [36], Tcr and ηcr are the solar cell temperature and efficiency, respectively. Tc(t) is the instan-taneous solar cell temperature at the ambient temperature (Ta), which was obtained using Eq. (9).
2.3 Battery Storage Model
When a battery is being used, it loses some of its charge whenever it is charging, discharging, or storing energy. The factor that characterizes the loss of its energy is called the self-discharge rate. The equation that shows the state of charge (SOC) of the battery due to the self-discharge rate (SDR) is given by Kaabeche et al. [37].
where EB is the rated energy of the battery bank and σ is the battery SDR, which was taken to be equal to 0.2% per day
PW,av = CF ∗ PR
(6)Pw(v) =
⎧⎪⎨⎪⎩
0 u ≤ UC & u ≥ UF
PR ∗uk−Uk
C
UkR−Uk
C
, UC ≤ u ≤ UR
PR UR ≤ u ≤ UFUR ≤ u ≤ UF
⎫⎪⎬⎪⎭
(7)PPV (t) = Ht(t) ∗ PVA ∗ �c(t)
�c(t) = �cr[1 − �t ×
(Tc(t) − Tcr
)]
(9)Tc(t) = Ta + 3Ht(t)
(10)EB(t + 1) = EB(t) (1 − �)
Arabian Journal for Science and Engineering
1 3
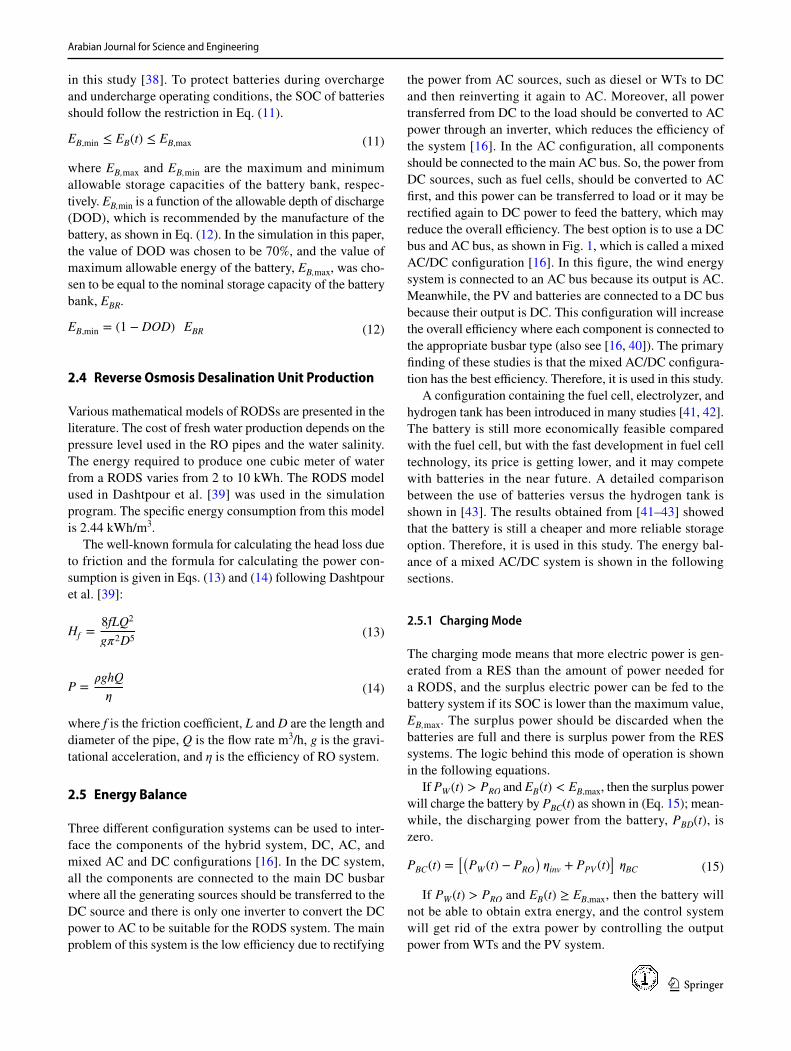
in this study [38]. To protect batteries during overcharge and undercharge operating conditions, the SOC of batteries should follow the restriction in Eq. (11).
where EB,max and EB,min are the maximum and minimum allowable storage capacities of the battery bank, respec-tively. EB,min is a function of the allowable depth of discharge (DOD), which is recommended by the manufacture of the battery, as shown in Eq. (12). In the simulation in this paper, the value of DOD was chosen to be 70%, and the value of maximum allowable energy of the battery, EB,max, was cho-sen to be equal to the nominal storage capacity of the battery bank, EBR.
2.4 Reverse Osmosis Desalination Unit Production
Various mathematical models of RODSs are presented in the literature. The cost of fresh water production depends on the pressure level used in the RO pipes and the water salinity. The energy required to produce one cubic meter of water from a RODS varies from 2 to 10 kWh. The RODS model used in Dashtpour et al. [39] was used in the simulation program. The specific energy consumption from this model is 2.44 kWh/m3.
The well-known formula for calculating the head loss due to friction and the formula for calculating the power con-sumption is given in Eqs. (13) and (14) following Dashtpour et al. [39]:
where f is the friction coefficient, L and D are the length and diameter of the pipe, Q is the flow rate m3/h, g is the gravi-tational acceleration, and η is the efficiency of RO system.
2.5 Energy Balance
Three different configuration systems can be used to inter-face the components of the hybrid system, DC, AC, and mixed AC and DC configurations [16]. In the DC system, all the components are connected to the main DC busbar where all the generating sources should be transferred to the DC source and there is only one inverter to convert the DC power to AC to be suitable for the RODS system. The main problem of this system is the low efficiency due to rectifying
(11)EB,min ≤ EB(t) ≤ EB,max
(12)EB,min = (1 − DOD) EBR
(13)Hf =8fLQ2
g�2D5
(14)P =�ghQ
�
the power from AC sources, such as diesel or WTs to DC and then reinverting it again to AC. Moreover, all power transferred from DC to the load should be converted to AC power through an inverter, which reduces the efficiency of the system [16]. In the AC configuration, all components should be connected to the main AC bus. So, the power from DC sources, such as fuel cells, should be converted to AC first, and this power can be transferred to load or it may be rectified again to DC power to feed the battery, which may reduce the overall efficiency. The best option is to use a DC bus and AC bus, as shown in Fig. 1, which is called a mixed AC/DC configuration [16]. In this figure, the wind energy system is connected to an AC bus because its output is AC. Meanwhile, the PV and batteries are connected to a DC bus because their output is DC. This configuration will increase the overall efficiency where each component is connected to the appropriate busbar type (also see [16, 40]). The primary finding of these studies is that the mixed AC/DC configura-tion has the best efficiency. Therefore, it is used in this study.
A configuration containing the fuel cell, electrolyzer, and hydrogen tank has been introduced in many studies [41, 42]. The battery is still more economically feasible compared with the fuel cell, but with the fast development in fuel cell technology, its price is getting lower, and it may compete with batteries in the near future. A detailed comparison between the use of batteries versus the hydrogen tank is shown in [43]. The results obtained from [41–43] showed that the battery is still a cheaper and more reliable storage option. Therefore, it is used in this study. The energy bal-ance of a mixed AC/DC system is shown in the following sections.
2.5.1 Charging Mode
The charging mode means that more electric power is gen-erated from a RES than the amount of power needed for a RODS, and the surplus electric power can be fed to the battery system if its SOC is lower than the maximum value, EB,max. The surplus power should be discarded when the batteries are full and there is surplus power from the RES systems. The logic behind this mode of operation is shown in the following equations.
If PW (t) > PRO and EB(t) < EB,max , then the surplus power will charge the battery by PBC(t) as shown in (Eq. 15); mean-while, the discharging power from the battery, PBD(t), is zero.
If PW (t) > PRO and EB(t) ≥ EB,max , then the battery will not be able to obtain extra energy, and the control system will get rid of the extra power by controlling the output power from WTs and the PV system.
(15)PBC(t) =[(PW (t) − PRO
)�inv + PPV (t)
]�BC
Arabian Journal for Science and Engineering
1 3
If PW (t) < PRO , meanwhile [PW (t) +
(PPV (t)
)𝜂inv
]> PRO and
the batteries are not fully charged, EB(t) < EB,max , then the extra power will be transferred to charge the batteries, as shown in the following equation:
If PW (t) < PRO(t) , [PW (t) +
(PPV (t) 𝜂inv
)]> PRO(t) and
EB(t) ≥ EB,max , then the control system will discard the extra power by controlling the generated power from WT and PV systems, and for this reason Eq. (18) is used.
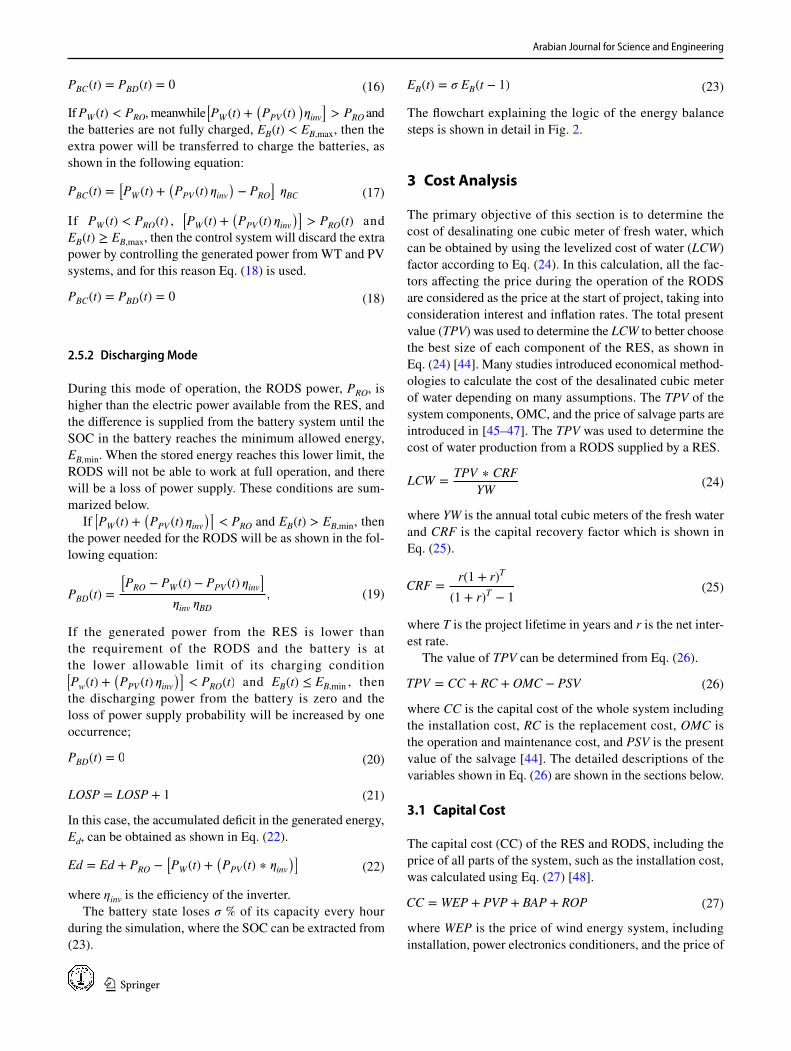
2.5.2 Discharging Mode
During this mode of operation, the RODS power, PRO, is higher than the electric power available from the RES, and the difference is supplied from the battery system until the SOC in the battery reaches the minimum allowed energy, EB,min. When the stored energy reaches this lower limit, the RODS will not be able to work at full operation, and there will be a loss of power supply. These conditions are sum-marized below.
If [PW (t) +
(PPV (t) 𝜂inv
)]< PRO and EB(t) > EB,min , then
the power needed for the RODS will be as shown in the fol-lowing equation:
If the generated power from the RES is lower than the requirement of the RODS and the battery is at the lower allowable limit of its charging condition [Pw(t) +
(PPV (t) 𝜂inv
)]< PRO(t) and EB(t) ≤ EB,min , then
the discharging power from the battery is zero and the loss of power supply probability will be increased by one occurrence;
In this case, the accumulated deficit in the generated energy, Ed, can be obtained as shown in Eq. (22).
where ηinv is the efficiency of the inverter.The battery state loses σ % of its capacity every hour
during the simulation, where the SOC can be extracted from (23).
(16)PBC(t) = PBD(t) = 0
(17)PBC(t) =[PW (t) +
(PPV (t) �inv
)− PRO
]�BC
(18)PBC(t) = PBD(t) = 0
(19)PBD(t) =
[PRO − PW (t) − PPV (t) �inv
]�inv �BD
,
(20)PBD(t) = 0
(21)LOSP = LOSP + 1
(22)Ed = Ed + PRO −[PW (t) +
(PPV (t) ∗ �inv
)]
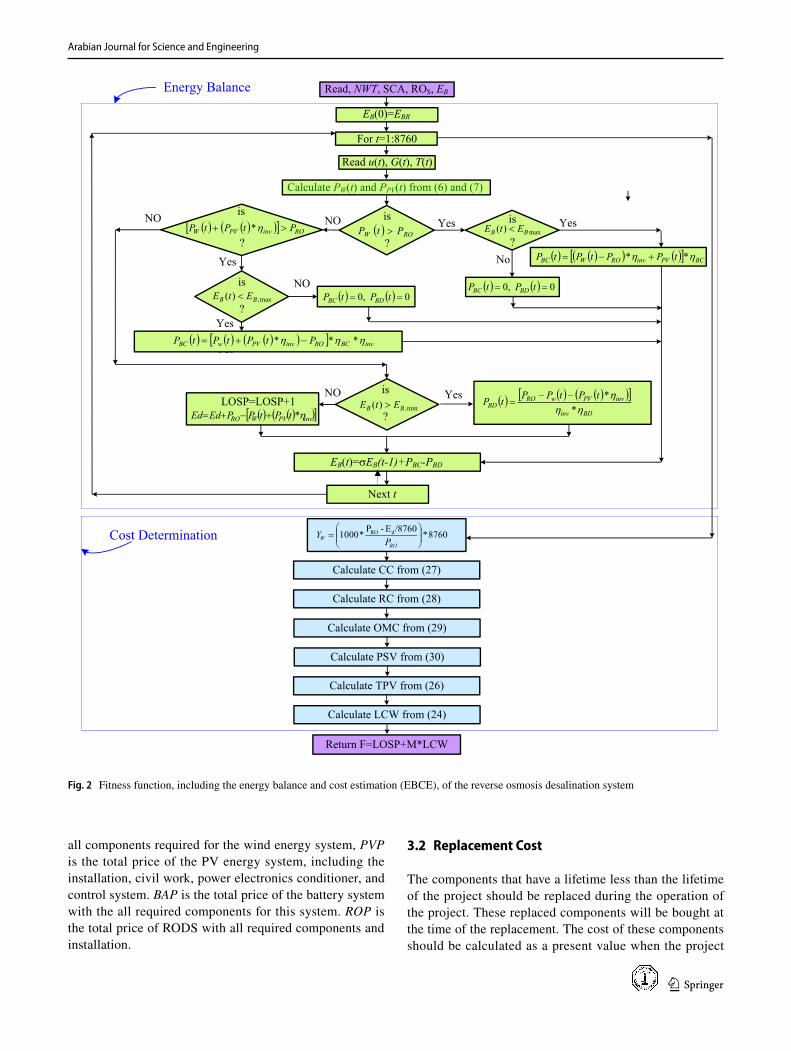
The flowchart explaining the logic of the energy balance steps is shown in detail in Fig. 2.
3 Cost Analysis
The primary objective of this section is to determine the cost of desalinating one cubic meter of fresh water, which can be obtained by using the levelized cost of water (LCW) factor according to Eq. (24). In this calculation, all the fac-tors affecting the price during the operation of the RODS are considered as the price at the start of project, taking into consideration interest and inflation rates. The total present value (TPV) was used to determine the LCW to better choose the best size of each component of the RES, as shown in Eq. (24) [44]. Many studies introduced economical method-ologies to calculate the cost of the desalinated cubic meter of water depending on many assumptions. The TPV of the system components, OMC, and the price of salvage parts are introduced in [45–47]. The TPV was used to determine the cost of water production from a RODS supplied by a RES.
where YW is the annual total cubic meters of the fresh water and CRF is the capital recovery factor which is shown in Eq. (25).
where T is the project lifetime in years and r is the net inter-est rate.
The value of TPV can be determined from Eq. (26).
where CC is the capital cost of the whole system including the installation cost, RC is the replacement cost, OMC is the operation and maintenance cost, and PSV is the present value of the salvage [44]. The detailed descriptions of the variables shown in Eq. (26) are shown in the sections below.
3.1 Capital Cost
The capital cost (CC) of the RES and RODS, including the price of all parts of the system, such as the installation cost, was calculated using Eq. (27) [48].
where WEP is the price of wind energy system, including installation, power electronics conditioners, and the price of
(23)EB(t) = � EB(t − 1)
(24)LCW =TPV ∗ CRF
YW
(25)CRF =r(1 + r)T
(1 + r)T − 1
(26)TPV = CC + RC + OMC − PSV
(27)CC = WEP + PVP + BAP + ROP
Arabian Journal for Science and Engineering
1 3
all components required for the wind energy system, PVP is the total price of the PV energy system, including the installation, civil work, power electronics conditioner, and control system. BAP is the total price of the battery system with the all required components for this system. ROP is the total price of RODS with all required components and installation.
3.2 Replacement Cost
The components that have a lifetime less than the lifetime of the project should be replaced during the operation of the project. These replaced components will be bought at the time of the replacement. The cost of these components should be calculated as a present value when the project
Fig. 2 Fitness function, including the energy balance and cost estimation (EBCE), of the reverse osmosis desalination system
Arabian Journal for Science and Engineering
1 3
started taking into consideration the interest rate, r, and inflation rate, l. The cost of replacement of any component of the system at the beginning of the project, RC, is shown in Eq. (28) [37].
where RCU is the current replacement cost of the compo-nents that will be replaced during the project period and Nrep represents the times that the component is replaced during the lifetime of the project, T.
3.3 Operation and Maintenance Cost
The proposed system needs an OMC during the lifetime of the project. There is no exact evaluation for the OMC for each price, but the value used for it is obtained from experts and previous research work or as recommended by the man-ufactures of the components. These values will be shown in detail in the simulation section.
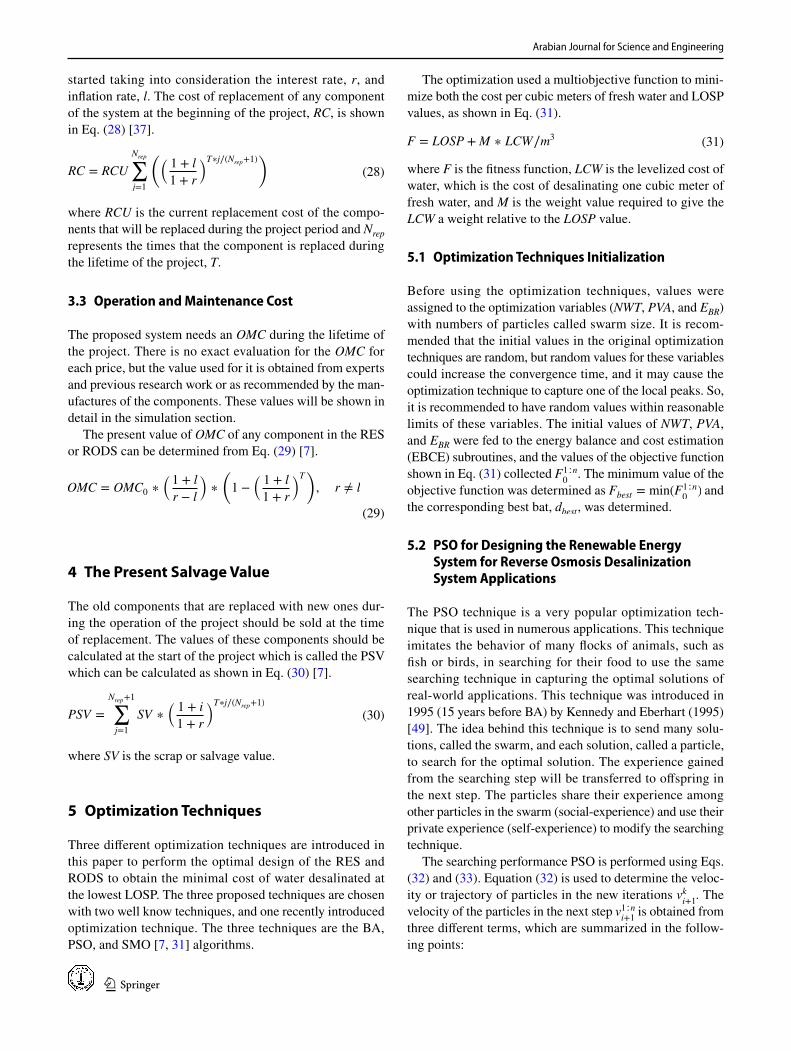
The present value of OMC of any component in the RES or RODS can be determined from Eq. (29) [7].
4 The Present Salvage Value
The old components that are replaced with new ones dur-ing the operation of the project should be sold at the time of replacement. The values of these components should be calculated at the start of the project which is called the PSV which can be calculated as shown in Eq. (30) [7].
where SV is the scrap or salvage value.
5 Optimization Techniques
Three different optimization techniques are introduced in this paper to perform the optimal design of the RES and RODS to obtain the minimal cost of water desalinated at the lowest LOSP. The three proposed techniques are chosen with two well know techniques, and one recently introduced optimization technique. The three techniques are the BA, PSO, and SMO [7, 31] algorithms.
(28)RC = RCU
Nrep∑j=1
((1 + l
1 + r
)T∗j∕(Nrep+1))
(29)
OMC = OMC0 ∗(1 + l
r − l
)∗
(1 −
(1 + l
1 + r
)T), r ≠ l
(30)PSV =
Nrep+1∑j=1
SV ∗(1 + i
1 + r
)T∗j∕(Nrep+1)
The optimization used a multiobjective function to mini-mize both the cost per cubic meters of fresh water and LOSP values, as shown in Eq. (31).
where F is the fitness function, LCW is the levelized cost of water, which is the cost of desalinating one cubic meter of fresh water, and M is the weight value required to give the LCW a weight relative to the LOSP value.
5.1 Optimization Techniques Initialization
Before using the optimization techniques, values were assigned to the optimization variables (NWT, PVA, and EBR) with numbers of particles called swarm size. It is recom-mended that the initial values in the original optimization techniques are random, but random values for these variables could increase the convergence time, and it may cause the optimization technique to capture one of the local peaks. So, it is recommended to have random values within reasonable limits of these variables. The initial values of NWT, PVA, and EBR were fed to the energy balance and cost estimation (EBCE) subroutines, and the values of the objective function shown in Eq. (31) collected F1∶n
0 . The minimum value of the
objective function was determined as Fbest = min(F1∶n0
) and the corresponding best bat, dbest , was determined.
5.2 PSO for Designing the Renewable Energy System for Reverse Osmosis Desalinization System Applications
The PSO technique is a very popular optimization tech-nique that is used in numerous applications. This technique imitates the behavior of many flocks of animals, such as fish or birds, in searching for their food to use the same searching technique in capturing the optimal solutions of real-world applications. This technique was introduced in 1995 (15 years before BA) by Kennedy and Eberhart (1995) [49]. The idea behind this technique is to send many solu-tions, called the swarm, and each solution, called a particle, to search for the optimal solution. The experience gained from the searching step will be transferred to offspring in the next step. The particles share their experience among other particles in the swarm (social-experience) and use their private experience (self-experience) to modify the searching technique.
The searching performance PSO is performed using Eqs. (32) and (33). Equation (32) is used to determine the veloc-ity or trajectory of particles in the new iterations vk
i+1 . The
velocity of the particles in the next step v1∶ni+1
is obtained from three different terms, which are summarized in the follow-ing points:
(31)F = LOSP +M ∗ LCW∕m3
Arabian Journal for Science and Engineering
1 3
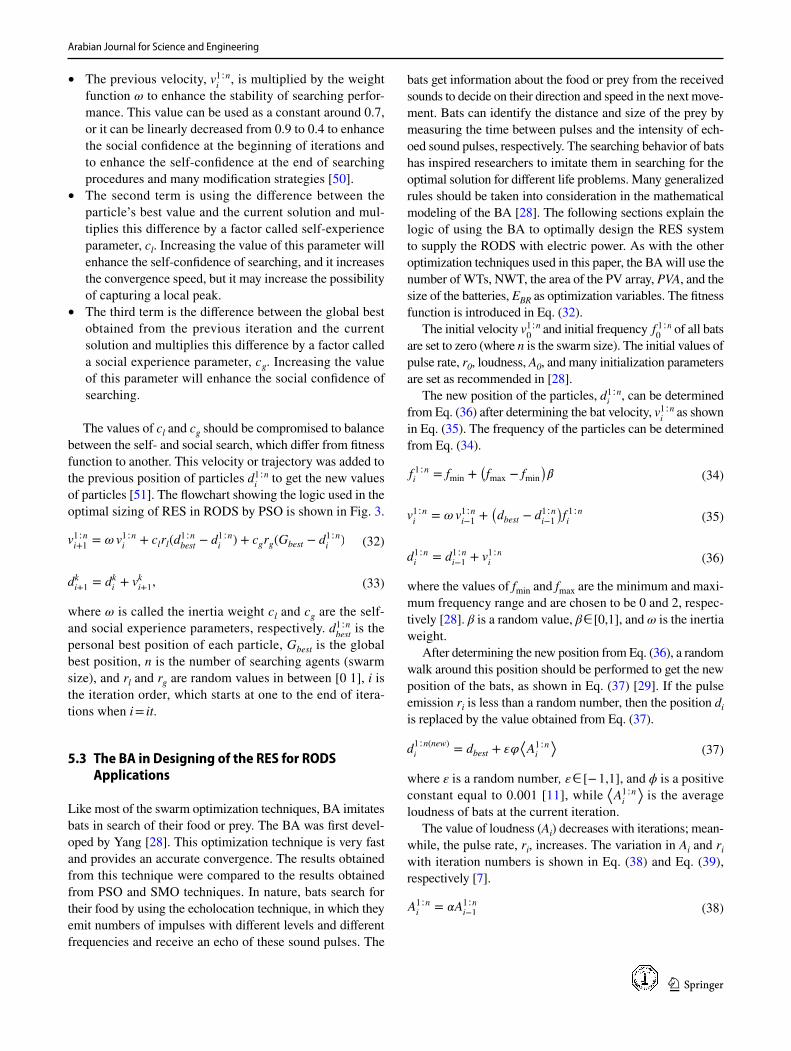
• The previous velocity, v1∶ni
, is multiplied by the weight function ω to enhance the stability of searching perfor-mance. This value can be used as a constant around 0.7, or it can be linearly decreased from 0.9 to 0.4 to enhance the social confidence at the beginning of iterations and to enhance the self-confidence at the end of searching procedures and many modification strategies [50].
• The second term is using the difference between the particle’s best value and the current solution and mul-tiplies this difference by a factor called self-experience parameter, cl. Increasing the value of this parameter will enhance the self-confidence of searching, and it increases the convergence speed, but it may increase the possibility of capturing a local peak.
• The third term is the difference between the global best obtained from the previous iteration and the current solution and multiplies this difference by a factor called a social experience parameter, cg. Increasing the value of this parameter will enhance the social confidence of searching.
The values of cl and cg should be compromised to balance between the self- and social search, which differ from fitness function to another. This velocity or trajectory was added to the previous position of particles d1∶n
i to get the new values
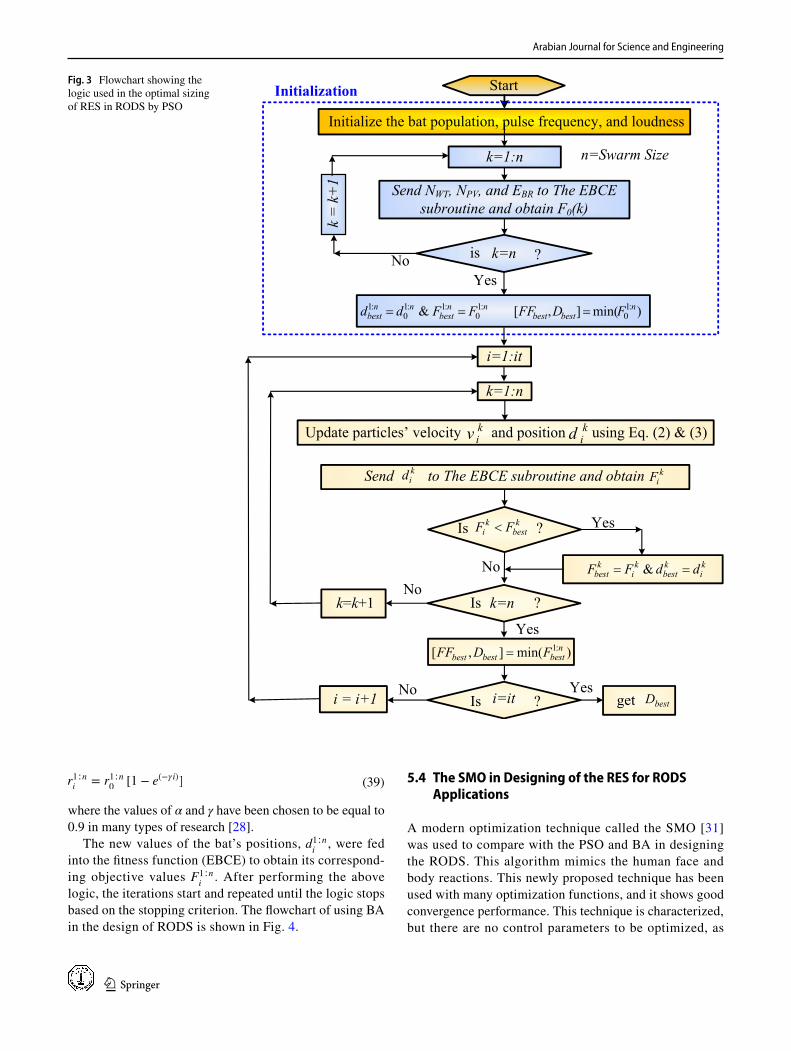
of particles [51]. The flowchart showing the logic used in the optimal sizing of RES in RODS by PSO is shown in Fig. 3.
where ω is called the inertia weight cl and cg are the self- and social experience parameters, respectively. d1∶n
best is the
personal best position of each particle, Gbest is the global best position, n is the number of searching agents (swarm size), and rl and rg are random values in between [0 1], i is the iteration order, which starts at one to the end of itera-tions when i = it.
5.3 The BA in Designing of the RES for RODS Applications
Like most of the swarm optimization techniques, BA imitates bats in search of their food or prey. The BA was first devel-oped by Yang [28]. This optimization technique is very fast and provides an accurate convergence. The results obtained from this technique were compared to the results obtained from PSO and SMO techniques. In nature, bats search for their food by using the echolocation technique, in which they emit numbers of impulses with different levels and different frequencies and receive an echo of these sound pulses. The
(32)v1∶ni+1
= � v1∶ni
+ clrl(d1∶nbest
− d1∶ni
) + cgrg(Gbest − d1∶ni
)
(33)dki+1
= dki+ vk
i+1,
bats get information about the food or prey from the received sounds to decide on their direction and speed in the next move-ment. Bats can identify the distance and size of the prey by measuring the time between pulses and the intensity of ech-oed sound pulses, respectively. The searching behavior of bats has inspired researchers to imitate them in searching for the optimal solution for different life problems. Many generalized rules should be taken into consideration in the mathematical modeling of the BA [28]. The following sections explain the logic of using the BA to optimally design the RES system to supply the RODS with electric power. As with the other optimization techniques used in this paper, the BA will use the number of WTs, NWT, the area of the PV array, PVA, and the size of the batteries, EBR as optimization variables. The fitness function is introduced in Eq. (32).
The initial velocity v1∶n0
and initial frequency f 1∶n0
of all bats are set to zero (where n is the swarm size). The initial values of pulse rate, r0, loudness, A0, and many initialization parameters are set as recommended in [28].
The new position of the particles, d1∶ni
, can be determined from Eq. (36) after determining the bat velocity, v1∶n
i as shown
in Eq. (35). The frequency of the particles can be determined from Eq. (34).
where the values of fmin and fmax are the minimum and maxi-mum frequency range and are chosen to be 0 and 2, respec-tively [28]. β is a random value, β ∈ [0,1], and ω is the inertia weight.
After determining the new position from Eq. (36), a random walk around this position should be performed to get the new position of the bats, as shown in Eq. (37) [29]. If the pulse emission ri is less than a random number, then the position di is replaced by the value obtained from Eq. (37).
where ε is a random number, ε ∈ [− 1,1], and ϕ is a positive constant equal to 0.001 [11], while
⟨A1∶ni
⟩ is the average
loudness of bats at the current iteration.The value of loudness (Ai) decreases with iterations; mean-
while, the pulse rate, ri, increases. The variation in Ai and ri with iteration numbers is shown in Eq. (38) and Eq. (39), respectively [7].
(34)f 1∶ni
= fmin +(fmax − fmin
)�
(35)v1∶ni
= � v1∶ni−1
+(dbest − d1∶n
i−1
)f 1∶ni
(36)d1∶ni
= d1∶ni−1
+ v1∶ni
(37)d1∶n(new)
i= dbest + ��
⟨A1∶ni
⟩
(38)A1∶ni
= �A1∶ni−1
Arabian Journal for Science and Engineering
1 3
where the values of α and γ have been chosen to be equal to 0.9 in many types of research [28].
The new values of the bat’s positions, d1∶ni
, were fed into the fitness function (EBCE) to obtain its correspond-ing objective values F1∶n
i . After performing the above
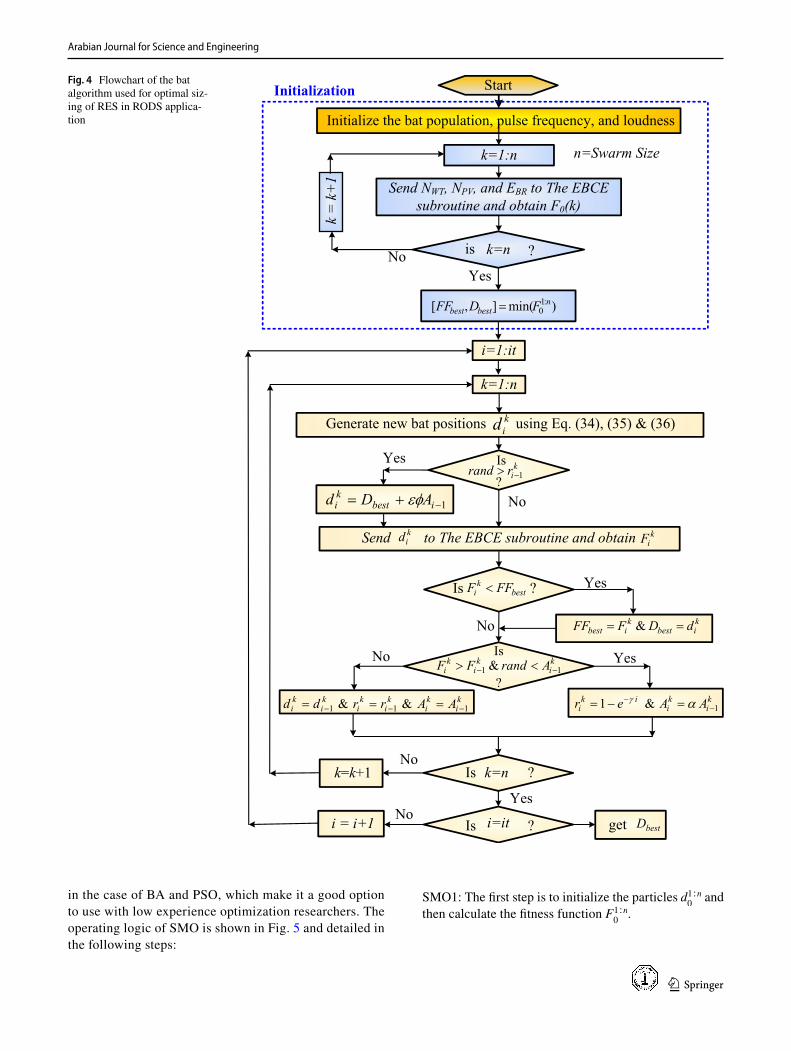
logic, the iterations start and repeated until the logic stops based on the stopping criterion. The flowchart of using BA in the design of RODS is shown in Fig. 4.
(39)r1∶ni
= r1∶n0
[1 − e(−�i)] 5.4 The SMO in Designing of the RES for RODS Applications
A modern optimization technique called the SMO [31] was used to compare with the PSO and BA in designing the RODS. This algorithm mimics the human face and body reactions. This newly proposed technique has been used with many optimization functions, and it shows good convergence performance. This technique is characterized, but there are no control parameters to be optimized, as
Fig. 3 Flowchart showing the logic used in the optimal sizing of RES in RODS by PSO
Arabian Journal for Science and Engineering
1 3
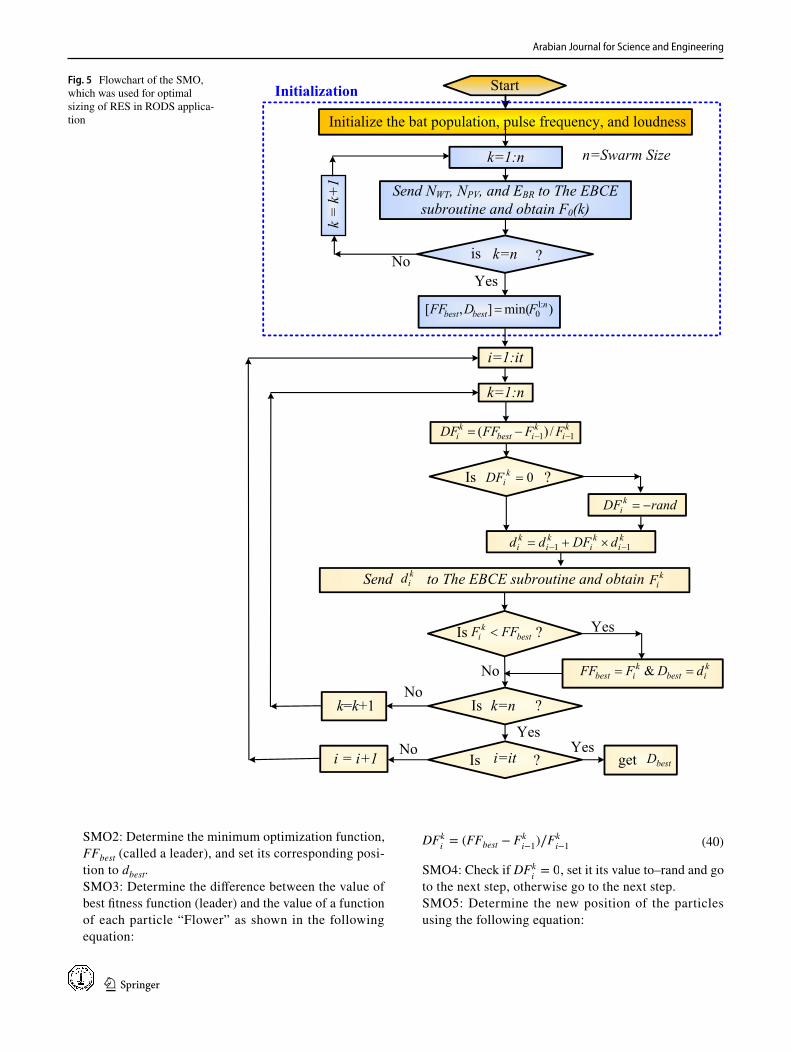
in the case of BA and PSO, which make it a good option to use with low experience optimization researchers. The operating logic of SMO is shown in Fig. 5 and detailed in the following steps:
SMO1: The first step is to initialize the particles d1∶n0
and then calculate the fitness function F1∶n
0.
Fig. 4 Flowchart of the bat algorithm used for optimal siz-ing of RES in RODS applica-tion
Arabian Journal for Science and Engineering
1 3
SMO2: Determine the minimum optimization function, FFbest (called a leader), and set its corresponding posi-tion to dbest.SMO3: Determine the difference between the value of best fitness function (leader) and the value of a function of each particle “Flower” as shown in the following equation:
SMO4: Check if DFki= 0 , set it its value to–rand and go
to the next step, otherwise go to the next step.SMO5: Determine the new position of the particles using the following equation:
(40)DFki= (FFbest − Fk
i−1)∕Fk
i−1
Fig. 5 Flowchart of the SMO, which was used for optimal sizing of RES in RODS applica-tion
Arabian Journal for Science and Engineering
1 3
SMO6: Send the new position of particles dki to the EBCE
and determine the corresponding fitness function f ki.
SMO7: Check if Fki< FFbest , then FFbest = Fk
i , and go
to the next step, otherwise go to the next step without modification.SMO8: Check if all particles are performed, if yes go to the next step otherwise go to SMO3.
(41)dki= dk
i−1+ DFk
i× dk
i−1SMO9: Check the stopping criterion is valid, print the values of dbest and FFbest,, otherwise go to SMO3.
6 Simulation Results
The simulation study was performed for Arar City in the northeast part of Saudi Arabia (30.9599° N, 41.0596° E). With 2.44 kWh/m specific energy consumption, the required
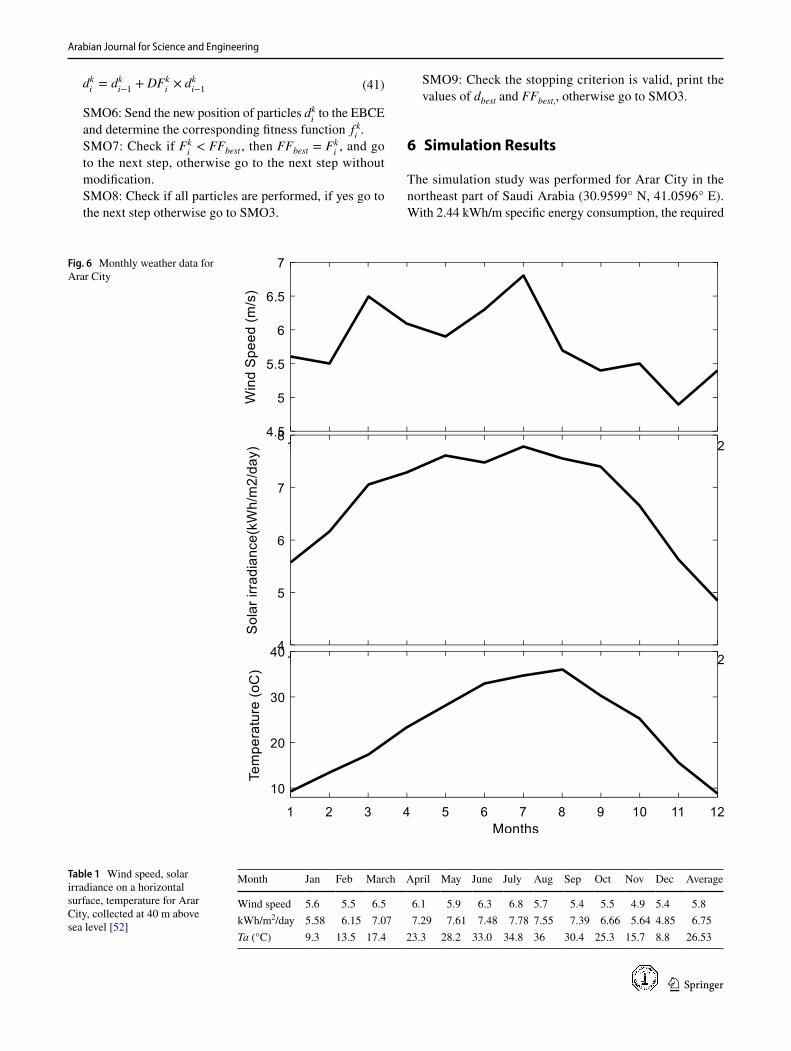
Fig. 6 Monthly weather data for Arar City
Table 1 Wind speed, solar irradiance on a horizontal surface, temperature for Arar City, collected at 40 m above sea level [52]
Month Jan Feb March April May June July Aug Sep Oct Nov Dec Average
Wind speed 5.6 5.5 6.5 6.1 5.9 6.3 6.8 5.7 5.4 5.5 4.9 5.4 5.8kWh/m2/day 5.58 6.15 7.07 7.29 7.61 7.48 7.78 7.55 7.39 6.66 5.64 4.85 6.75Ta (°C) 9.3 13.5 17.4 23.3 28.2 33.0 34.8 36 30.4 25.3 15.7 8.8 26.53
Arabian Journal for Science and Engineering
1 3
power from the RES to produce 1000 m3 of fresh water was 2440 kW. The weather data for this site were collected, such as hourly wind speed, solar irradiance, and temperature [53]. Figure 6 shows the wind speed distribution in this site on 40 m elevations. The maximum and average monthly wind speed is shown in Table 1, which shows the monthly average wind speed, solar irradiance on the horizontal surface, tem-perature for Arar City on 40 m height [52]. The wind speed distribution is shown in Fig. 6. The average wind speed at 40 m height is 5.8 m/s [52]. The hourly solar irradiance and temperature for the Arar site were collected from the PV geographical information system [53].
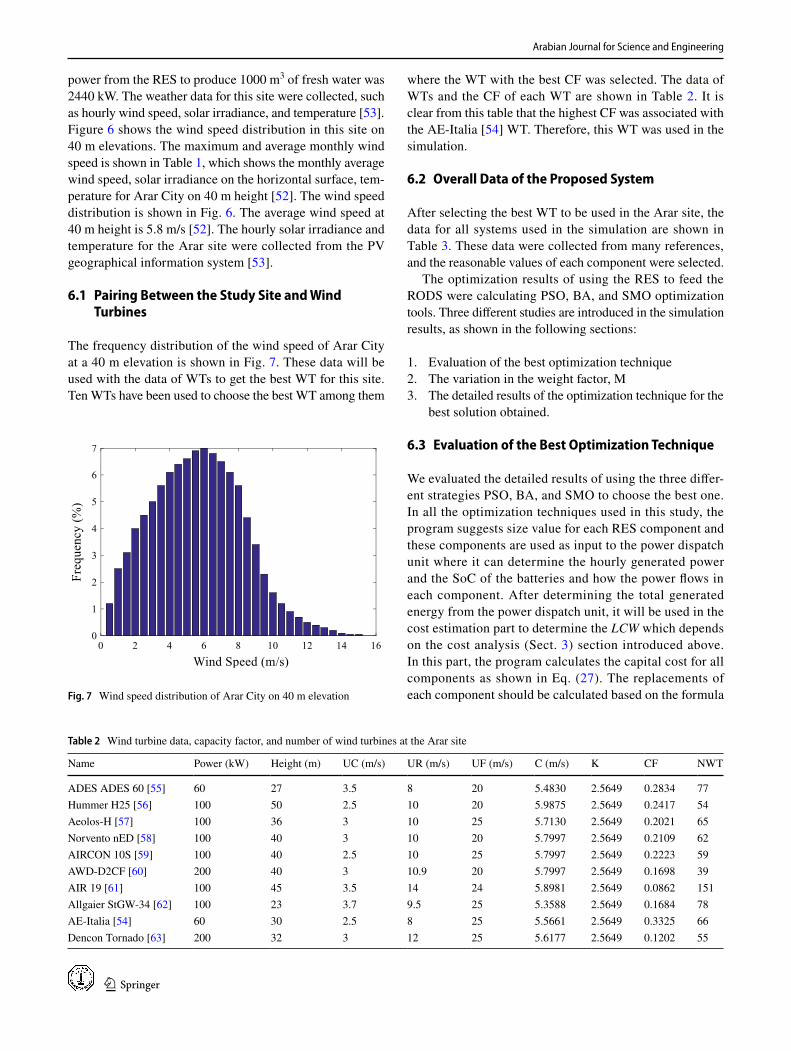
6.1 Pairing Between the Study Site and Wind Turbines
The frequency distribution of the wind speed of Arar City at a 40 m elevation is shown in Fig. 7. These data will be used with the data of WTs to get the best WT for this site. Ten WTs have been used to choose the best WT among them
where the WT with the best CF was selected. The data of WTs and the CF of each WT are shown in Table 2. It is clear from this table that the highest CF was associated with the AE-Italia [54] WT. Therefore, this WT was used in the simulation.
6.2 Overall Data of the Proposed System
After selecting the best WT to be used in the Arar site, the data for all systems used in the simulation are shown in Table 3. These data were collected from many references, and the reasonable values of each component were selected.
The optimization results of using the RES to feed the RODS were calculating PSO, BA, and SMO optimization tools. Three different studies are introduced in the simulation results, as shown in the following sections:
1. Evaluation of the best optimization technique2. The variation in the weight factor, M3. The detailed results of the optimization technique for the
best solution obtained.
6.3 Evaluation of the Best Optimization Technique
We evaluated the detailed results of using the three differ-ent strategies PSO, BA, and SMO to choose the best one. In all the optimization techniques used in this study, the program suggests size value for each RES component and these components are used as input to the power dispatch unit where it can determine the hourly generated power and the SoC of the batteries and how the power flows in each component. After determining the total generated energy from the power dispatch unit, it will be used in the cost estimation part to determine the LCW which depends on the cost analysis (Sect. 3) section introduced above. In this part, the program calculates the capital cost for all components as shown in Eq. (27). The replacements of each component should be calculated based on the formula Fig. 7 Wind speed distribution of Arar City on 40 m elevation
Table 2 Wind turbine data, capacity factor, and number of wind turbines at the Arar site
Name Power (kW) Height (m) UC (m/s) UR (m/s) UF (m/s) C (m/s) K CF NWT
ADES ADES 60 [55] 60 27 3.5 8 20 5.4830 2.5649 0.2834 77Hummer H25 [56] 100 50 2.5 10 20 5.9875 2.5649 0.2417 54Aeolos-H [57] 100 36 3 10 25 5.7130 2.5649 0.2021 65Norvento nED [58] 100 40 3 10 20 5.7997 2.5649 0.2109 62AIRCON 10S [59] 100 40 2.5 10 25 5.7997 2.5649 0.2223 59AWD-D2CF [60] 200 40 3 10.9 20 5.7997 2.5649 0.1698 39AIR 19 [61] 100 45 3.5 14 24 5.8981 2.5649 0.0862 151Allgaier StGW-34 [62] 100 23 3.7 9.5 25 5.3588 2.5649 0.1684 78AE-Italia [54] 60 30 2.5 8 25 5.5661 2.5649 0.3325 66Dencon Tornado [63] 200 32 3 12 25 5.6177 2.5649 0.1202 55
Arabian Journal for Science and Engineering
1 3
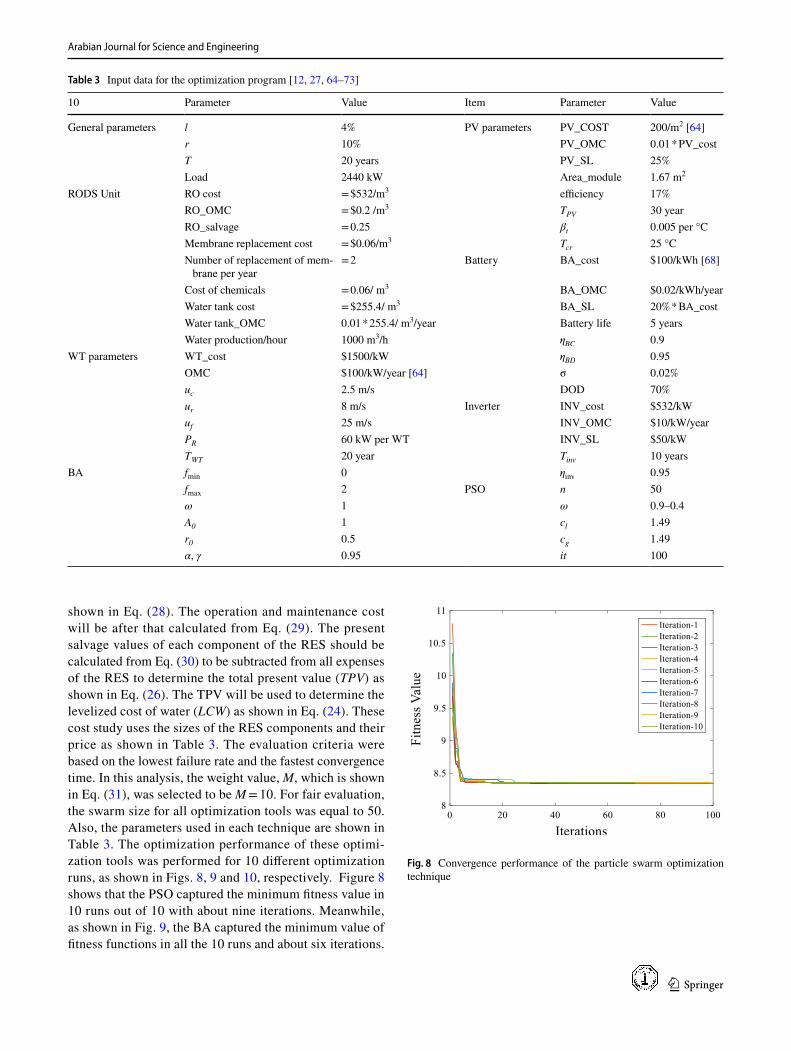
shown in Eq. (28). The operation and maintenance cost will be after that calculated from Eq. (29). The present salvage values of each component of the RES should be calculated from Eq. (30) to be subtracted from all expenses of the RES to determine the total present value (TPV) as shown in Eq. (26). The TPV will be used to determine the levelized cost of water (LCW) as shown in Eq. (24). These cost study uses the sizes of the RES components and their price as shown in Table 3. The evaluation criteria were based on the lowest failure rate and the fastest convergence time. In this analysis, the weight value, M, which is shown in Eq. (31), was selected to be M = 10. For fair evaluation, the swarm size for all optimization tools was equal to 50. Also, the parameters used in each technique are shown in Table 3. The optimization performance of these optimi-zation tools was performed for 10 different optimization runs, as shown in Figs. 8, 9 and 10, respectively. Figure 8 shows that the PSO captured the minimum fitness value in 10 runs out of 10 with about nine iterations. Meanwhile, as shown in Fig. 9, the BA captured the minimum value of fitness functions in all the 10 runs and about six iterations.
Table 3 Input data for the optimization program [12, 27, 64–73]
10 Parameter Value Item Parameter Value
General parameters l 4% PV parameters PV_COST 200/m2 [64]r 10% PV_OMC 0.01 * PV_costT 20 years PV_SL 25%Load 2440 kW Area_module 1.67 m2
RODS Unit RO cost = $532/m3 efficiency 17%RO_OMC = $0.2 /m3 TPV 30 yearRO_salvage = 0.25 βt 0.005 per °CMembrane replacement cost = $0.06/m3 Tcr 25 °CNumber of replacement of mem-
brane per year= 2 Battery BA_cost $100/kWh [68]
Cost of chemicals = 0.06/ m3 BA_OMC $0.02/kWh/yearWater tank cost = $255.4/ m3 BA_SL 20% * BA_costWater tank_OMC 0.01 * 255.4/ m3/year Battery life 5 yearsWater production/hour 1000 m3/h �
BC0.9
WT parameters WT_cost $1500/kW �BD
0.95OMC $100/kW/year [64] σ 0.02%uc 2.5 m/s DOD 70%ur 8 m/s Inverter INV_cost $532/kWuf 25 m/s INV_OMC $10/kW/yearPR 60 kW per WT INV_SL $50/kWTWT 20 year Tinv 10 years
BA fmin 0 �inv
0.95fmax 2 PSO n 50ω 1 ω 0.9–0.4A0 1 cl 1.49r0 0.5 cg 1.49α, γ 0.95 it 100
Fig. 8 Convergence performance of the particle swarm optimization technique
Arabian Journal for Science and Engineering
1 3
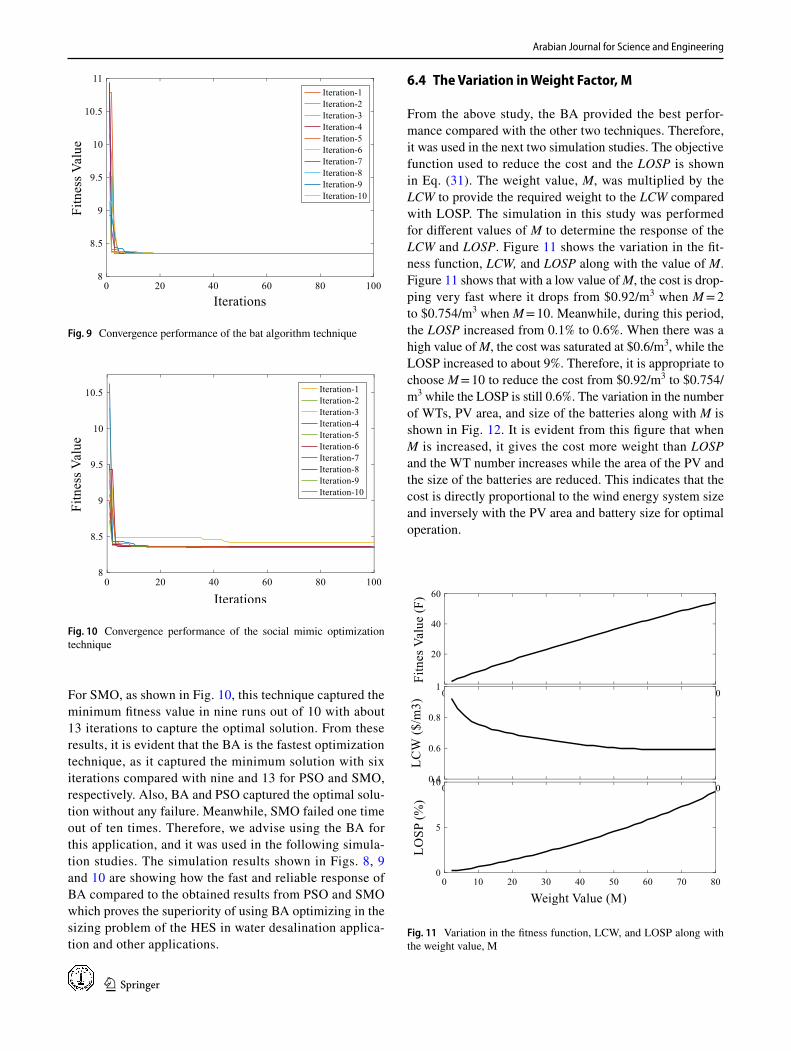
For SMO, as shown in Fig. 10, this technique captured the minimum fitness value in nine runs out of 10 with about 13 iterations to capture the optimal solution. From these results, it is evident that the BA is the fastest optimization technique, as it captured the minimum solution with six iterations compared with nine and 13 for PSO and SMO, respectively. Also, BA and PSO captured the optimal solu-tion without any failure. Meanwhile, SMO failed one time out of ten times. Therefore, we advise using the BA for this application, and it was used in the following simula-tion studies. The simulation results shown in Figs. 8, 9 and 10 are showing how the fast and reliable response of BA compared to the obtained results from PSO and SMO which proves the superiority of using BA optimizing in the sizing problem of the HES in water desalination applica-tion and other applications.
6.4 The Variation in Weight Factor, M
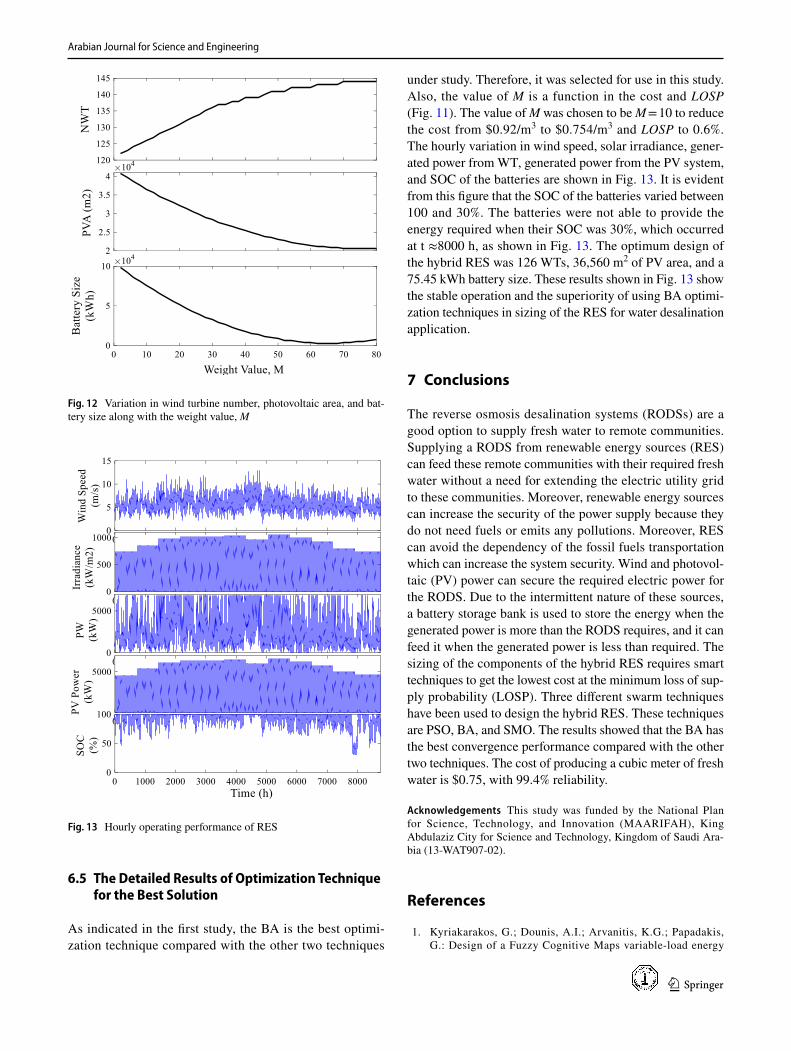
From the above study, the BA provided the best perfor-mance compared with the other two techniques. Therefore, it was used in the next two simulation studies. The objective function used to reduce the cost and the LOSP is shown in Eq. (31). The weight value, M, was multiplied by the LCW to provide the required weight to the LCW compared with LOSP. The simulation in this study was performed for different values of M to determine the response of the LCW and LOSP. Figure 11 shows the variation in the fit-ness function, LCW, and LOSP along with the value of M. Figure 11 shows that with a low value of M, the cost is drop-ping very fast where it drops from $0.92/m3 when M = 2 to $0.754/m3 when M = 10. Meanwhile, during this period, the LOSP increased from 0.1% to 0.6%. When there was a high value of M, the cost was saturated at $0.6/m3, while the LOSP increased to about 9%. Therefore, it is appropriate to choose M = 10 to reduce the cost from $0.92/m3 to $0.754/m3 while the LOSP is still 0.6%. The variation in the number of WTs, PV area, and size of the batteries along with M is shown in Fig. 12. It is evident from this figure that when M is increased, it gives the cost more weight than LOSP and the WT number increases while the area of the PV and the size of the batteries are reduced. This indicates that the cost is directly proportional to the wind energy system size and inversely with the PV area and battery size for optimal operation.
Fig. 9 Convergence performance of the bat algorithm technique
Fig. 10 Convergence performance of the social mimic optimization technique
Fig. 11 Variation in the fitness function, LCW, and LOSP along with the weight value, M
Arabian Journal for Science and Engineering
1 3
6.5 The Detailed Results of Optimization Technique for the Best Solution
As indicated in the first study, the BA is the best optimi-zation technique compared with the other two techniques
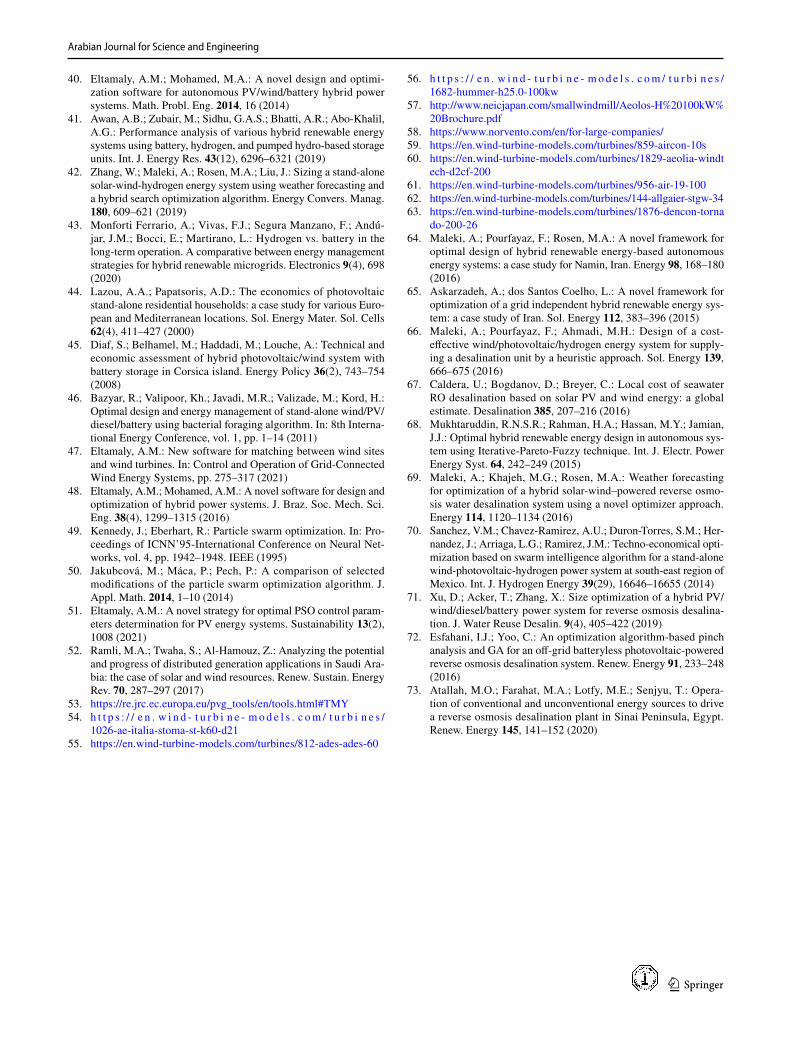
under study. Therefore, it was selected for use in this study. Also, the value of M is a function in the cost and LOSP (Fig. 11). The value of M was chosen to be M = 10 to reduce the cost from $0.92/m3 to $0.754/m3 and LOSP to 0.6%. The hourly variation in wind speed, solar irradiance, gener-ated power from WT, generated power from the PV system, and SOC of the batteries are shown in Fig. 13. It is evident from this figure that the SOC of the batteries varied between 100 and 30%. The batteries were not able to provide the energy required when their SOC was 30%, which occurred at t ≈8000 h, as shown in Fig. 13. The optimum design of the hybrid RES was 126 WTs, 36,560 m2 of PV area, and a 75.45 kWh battery size. These results shown in Fig. 13 show the stable operation and the superiority of using BA optimi-zation techniques in sizing of the RES for water desalination application.
7 Conclusions
The reverse osmosis desalination systems (RODSs) are a good option to supply fresh water to remote communities. Supplying a RODS from renewable energy sources (RES) can feed these remote communities with their required fresh water without a need for extending the electric utility grid to these communities. Moreover, renewable energy sources can increase the security of the power supply because they do not need fuels or emits any pollutions. Moreover, RES can avoid the dependency of the fossil fuels transportation which can increase the system security. Wind and photovol-taic (PV) power can secure the required electric power for the RODS. Due to the intermittent nature of these sources, a battery storage bank is used to store the energy when the generated power is more than the RODS requires, and it can feed it when the generated power is less than required. The sizing of the components of the hybrid RES requires smart techniques to get the lowest cost at the minimum loss of sup-ply probability (LOSP). Three different swarm techniques have been used to design the hybrid RES. These techniques are PSO, BA, and SMO. The results showed that the BA has the best convergence performance compared with the other two techniques. The cost of producing a cubic meter of fresh water is $0.75, with 99.4% reliability.
Acknowledgements This study was funded by the National Plan for Science, Technology, and Innovation (MAARIFAH), King Abdulaziz City for Science and Technology, Kingdom of Saudi Ara-bia (13-WAT907-02).
References
1. Kyriakarakos, G.; Dounis, A.I.; Arvanitis, K.G.; Papadakis, G.: Design of a Fuzzy Cognitive Maps variable-load energy
Fig. 12 Variation in wind turbine number, photovoltaic area, and bat-tery size along with the weight value, M
Fig. 13 Hourly operating performance of RES

Arabian Journal for Science and Engineering
1 3
management system for autonomous PV-reverse osmosis desali-nation systems: a simulation survey. Appl. Energy 187, 575–584 (2017)
2. Koutroulis, E.; Kolokotsa, D.: Design optimization of desalina-tion systems power-supplied by PV and W/G energy sources. Desalination 258(1–3), 171–181 (2010)
3. de la Nuez-Pestana, I.; Latorre, F.J.G.; Espinoza, C.A.; Gotor, A.G.: Optimization of RO desalination systems powered by renewable energies. Part I: wind energy. Desalination 160(3), 293–299 (2004)
4. Soric, A.; Césaro, R.; Perez, P.; Guiol, E.; Moulin, P.: Eausmose project desalination by reverse osmosis and batteryless solar energy: design for a 1 m3 per day delivery. Desalination 301, 67–74 (2012)
5. Kumarasamy, S.; Narasimhan, S.; Narasimhan, S.: Optimal operation of battery-less solar powered reverse osmosis plant for desalination. Desalination 375, 89–99 (2015)
6. Laborde, H.M.; Franca, K.B.; Neff, H.; Lima, A.M.N.: Optimi-zation strategy for a small-scale reverse osmosis water desalina-tion system based on solar energy. Desalination 133(1), 1–12 (2001)
7. Eltamaly, A.M.; Addoweesh, K.E.; Bawa, U.; Mohamed, M.A.: Economic modeling of hybrid renewable energy system: a case study in Saudi Arabia. Arab. J. Sci. Eng. 39(5), 3827–3839 (2014)
8. Wenceslas, K.Y.; Ghislain, T.: Experimental validation of exergy optimization of a flat-plate solar collector in a thermosyphon solar water heater. Arab. J. Sci. Eng. 44(3), 2535–2549 (2019)
9. Ra’ad, K.: An innovative receiver design for a parabolic trough solar collector using overlapped and reverse flow: an experimental study. Arab. J. Sci. Eng. 44(9), 7529–7539 (2019)
10. Ali, E.; Bumazza, M.; Eltamaly, A.; Mulyono, S.; Yasin, M.: Opti-mization of wind driven RO plant for brackish water desalination during wind speed fluctuation with and without battery. Mem-branes 11(2), 77 (2021)
11. Azarpour, A.; Suhaimi, S.; Zahedi, G.; Bahadori, A.: A review on the drawbacks of renewable energy as a promising energy source of the future. Arab. J. Sci. Eng. 38(2), 317–328 (2013)
12. Maleki, A.: Design and optimization of autonomous solar-wind-reverse osmosis desalination systems coupling battery and hydro-gen energy storage by an improved bee algorithm. Desalination 435, 221–234 (2018)
13. Mohamed, M.A.; Eltamaly, A.M.; Alolah, A.I.; Hatata, A.Y.: A novel framework-based cuckoo search algorithm for sizing and optimization of grid-independent hybrid renewable energy sys-tems. Int. J. Green Energy 16(1), 86–100 (2019)
14. Naseri, A.; Bidi, M.; Ahmadi, M.H.; Saidur, R.: Exergy analy-sis of a hydrogen and water production process by a solar-driven transcritical CO2 power cycle with Stirling engine. J. Clean. Prod. 158, 165–181 (2017)
15. Eltamaly, A.M.; Al-Saud, M.S.: Nested multi-objective PSO for optimal allocation and sizing of renewable energy distributed gen-eration. J. Renew. Sustain. Energy 10(3), 035302 (2018)
16. Mohamed, M.A.; Eltamaly, A.M.: Modeling of hybrid renew-able energy system. In: Modeling and Simulation of Smart Grid Integrated with Hybrid Renewable Energy Systems, pp. 11–21. Springer, Cham (2018)
17. Tzen, E.; Perrakis, K.; Baltas, P.: Design of a stand alone PV-desalination system for rural areas. Desalination 119(1–3), 327–333 (1998)
18. Keeper, B.G.; Hembree, R.D.; Schrack, F.C.: Optimized matching of solar photovoltaic power with reverse osmosis desalination. Desalination 54, 89–103 (1985)
19. Voivontas, D.; Misirlis, K.; Manoli, E.; Arampatzis, G.; Assima-copoulos, D.: A tool for the design of desalination plants powered by renewable energies. Desalination 133(2), 175–198 (2001)
20. Asayesh, M.; Kasaeian, A.; Ataei, A.: Optimization of a combined solar chimney for desalination and power generation. Energy Con-vers. Manag. 150(2017), 72–80 (2017)
21. García-Triviño, P.; Llorens-Iborra, F.; García-Vázquez, C.A.; Gil-Mena, A.J.; Fernández-Ramírez, L.M.; Jurado, F.: Long-term optimization based on PSO of a grid-connected renewable energy/battery/hydrogen hybrid system. Int. J. Hydrogen Energy 39(21), 10805–10816 (2014)
22. Eltamaly, A.M.; Mohamed, M.A.: Optimal sizing and designing of hybrid renewable energy systems in smart grid applications. In: Advances in Renewable Energies and Power Technologies, pp. 231–313. Elsevier (2018)
23. Ismail, M.S.; Moghavvemi, M.; Mahlia, T.M.I.: Genetic algorithm based optimization on modeling and design of hybrid renewable energy systems. Energy Convers. Manag. 85, 120–130 (2014)
24. Ko, M.J.; Kim, Y.S.; Chung, M.H.; Jeon, H.C.: Multi-objective optimization design for a hybrid energy system using the genetic algorithm. Energies 8(4), 2924–2949 (2015)
25. Ekren, O.; Ekren, B.Y.: Size optimization of a PV/wind hybrid energy conversion system with battery storage using simulated annealing. Appl. Energy 87(2), 592–598 (2010)
26. Yahiaoui, A.; Fodhil, F.; Benmansour, K.; Tadjine, M.; Cheggaga, N.: Grey wolf optimizer for optimal design of hybrid renewable energy system PV-Diesel Generator-Battery: application to the case of Djanet city of Algeria. Sol. Energy 158, 941–951 (2017)
27. Abdelshafy, A.M.; Hassan, H.; Jurasz, J.: Optimal design of a grid-connected desalination plant powered by renewable energy resources using a hybrid PSO–GWO approach. Energy Convers. Manag. 173, 331–347 (2018)
28. Yang, X.-S.: A new metaheuristic bat-inspired algorithm. In: Nature Inspired Cooperative Strategies for Optimization, pp. 65–74. Springer, Berlin, Heidelberg (2010)
29. Eltamaly, A.M.; Al-Saud, M.S.; Abokhalil, A.G.: A novel bat algorithm strategy for maximum Power Point tracker of photovol-taic energy systems under dynamic partial shading. IEEE Access 8, 10048–10060 (2020)
30. Eltamaly, A.M.; Al-Saud, M.S.; Abokhalil, A.G.: A novel scan-ning bat algorithm strategy for maximum power point tracker of partially shaded photovoltaic energy systems. Ain Shams Eng. J. 11(4), 1093–1103 (2020)
31. Balochian, S.; Baloochian, H.: Social mimic optimization algo-rithm and engineering applications. Expert Syst. Appl. 134, 178–191 (2019)
32. Eltamaly, A.M.; Alotaibi, M.A.; Alolah, A.I.; Ahmed, M.A.: A novel demand response strategy for sizing of hybrid energy system with smart grid concepts. IEEE Access 9, 20277–20294 (2021)
33. Eltamaly, A.M.: Design and implementation of wind energy sys-tem in Saudi Arabia. Renew. Energy 60, 42–52 (2013)
34. Stevens, M.J.M.; Smulders, P.T.: The estimation of the parameters of the Weibull wind speed distribution for wind energy utilization purposes. Wind Eng. 3, 132–145 (1979)
35. Eltamaly, A.M.: Pairing between sites and wind turbines for Saudi Arabia Sites. Arab. J. Sci. Eng. 39(8), 6225–6233 (2014)
36. Skoplaki, E.; Boudouvis, A.G.; Palyvos, J.A.: A simple correlation for the operating temperature of photovoltaic modules of arbi-trary mounting. Sol. Energy Mater. Sol. Cells 92(11), 1393–1402 (2008)
37. Kaabeche, A.; Belhamel, M.; Ibtiouen, R.: Optimal sizing method for stand-alone hybrid PV/wind power generation system. Revue des Energies Renouvelables (SMEE’10) Bou Ismail Tipaza 205–213 (2010)@@
38. Yang, H.; Zhou, W.; Lu, L.; Fang, Z.: Optimal sizing method for stand-alone hybrid solar–wind system with LPSP technology by using genetic algorithm. Sol. Energy 82(4), 354–367 (2008)
39. Dashtpour, R.; Al-Zubaidy, S.N.: Energy efficient reverse osmosis desalination process. Int. J. Environ. Sci. Dev. 3(4), 339 (2012)
Arabian Journal for Science and Engineering
1 3
40. Eltamaly, A.M.; Mohamed, M.A.: A novel design and optimi-zation software for autonomous PV/wind/battery hybrid power systems. Math. Probl. Eng. 2014, 16 (2014)
41. Awan, A.B.; Zubair, M.; Sidhu, G.A.S.; Bhatti, A.R.; Abo-Khalil, A.G.: Performance analysis of various hybrid renewable energy systems using battery, hydrogen, and pumped hydro-based storage units. Int. J. Energy Res. 43(12), 6296–6321 (2019)
42. Zhang, W.; Maleki, A.; Rosen, M.A.; Liu, J.: Sizing a stand-alone solar-wind-hydrogen energy system using weather forecasting and a hybrid search optimization algorithm. Energy Convers. Manag. 180, 609–621 (2019)
43. Monforti Ferrario, A.; Vivas, F.J.; Segura Manzano, F.; Andú-jar, J.M.; Bocci, E.; Martirano, L.: Hydrogen vs. battery in the long-term operation. A comparative between energy management strategies for hybrid renewable microgrids. Electronics 9(4), 698 (2020)
44. Lazou, A.A.; Papatsoris, A.D.: The economics of photovoltaic stand-alone residential households: a case study for various Euro-pean and Mediterranean locations. Sol. Energy Mater. Sol. Cells 62(4), 411–427 (2000)
45. Diaf, S.; Belhamel, M.; Haddadi, M.; Louche, A.: Technical and economic assessment of hybrid photovoltaic/wind system with battery storage in Corsica island. Energy Policy 36(2), 743–754 (2008)
46. Bazyar, R.; Valipoor, Kh.; Javadi, M.R.; Valizade, M.; Kord, H.: Optimal design and energy management of stand-alone wind/PV/diesel/battery using bacterial foraging algorithm. In: 8th Interna-tional Energy Conference, vol. 1, pp. 1–14 (2011)
47. Eltamaly, A.M.: New software for matching between wind sites and wind turbines. In: Control and Operation of Grid-Connected Wind Energy Systems, pp. 275–317 (2021)
48. Eltamaly, A.M.; Mohamed, A.M.: A novel software for design and optimization of hybrid power systems. J. Braz. Soc. Mech. Sci. Eng. 38(4), 1299–1315 (2016)
49. Kennedy, J.; Eberhart, R.: Particle swarm optimization. In: Pro-ceedings of ICNN’95-International Conference on Neural Net-works, vol. 4, pp. 1942–1948. IEEE (1995)
50. Jakubcová, M.; Máca, P.; Pech, P.: A comparison of selected modifications of the particle swarm optimization algorithm. J. Appl. Math. 2014, 1–10 (2014)
51. Eltamaly, A.M.: A novel strategy for optimal PSO control param-eters determination for PV energy systems. Sustainability 13(2), 1008 (2021)
52. Ramli, M.A.; Twaha, S.; Al-Hamouz, Z.: Analyzing the potential and progress of distributed generation applications in Saudi Ara-bia: the case of solar and wind resources. Renew. Sustain. Energy Rev. 70, 287–297 (2017)
53. https:// re. jrc. ec. europa. eu/ pvg_ tools/ en/ tools. html# TMY 54. h t t p s : / / e n . w i n d - t u r b i n e - m o d e l s . c o m / t u r b i n e s /
1026- ae- italia- stoma- st- k60- d21 55. https:// en. wind- turbi ne- models. com/ turbi nes/ 812- ades- ades- 60
56. h t t p s : / / e n . w i n d - t u r b i n e - m o d e l s . c o m / t u r b i n e s / 1682- hummer- h25.0- 100kw
57. http:// www. neicj apan. com/ small windm ill/ Aeolos- H% 20100 kW% 20Bro chure. pdf
58. https:// www. norve nto. com/ en/ for- large- compa nies/ 59. https:// en. wind- turbi ne- models. com/ turbi nes/ 859- aircon- 10s 60. https:// en. wind- turbi ne- models. com/ turbi nes/ 1829- aeolia- windt
ech- d2cf- 200 61. https:// en. wind- turbi ne- models. com/ turbi nes/ 956- air- 19- 100 62. https:// en. wind- turbi ne- models. com/ turbi nes/ 144- allga ier- stgw- 34 63. https:// en. wind- turbi ne- models. com/ turbi nes/ 1876- dencon- torna
do- 200- 26 64. Maleki, A.; Pourfayaz, F.; Rosen, M.A.: A novel framework for
optimal design of hybrid renewable energy-based autonomous energy systems: a case study for Namin, Iran. Energy 98, 168–180 (2016)
65. Askarzadeh, A.; dos Santos Coelho, L.: A novel framework for optimization of a grid independent hybrid renewable energy sys-tem: a case study of Iran. Sol. Energy 112, 383–396 (2015)
66. Maleki, A.; Pourfayaz, F.; Ahmadi, M.H.: Design of a cost-effective wind/photovoltaic/hydrogen energy system for supply-ing a desalination unit by a heuristic approach. Sol. Energy 139, 666–675 (2016)
67. Caldera, U.; Bogdanov, D.; Breyer, C.: Local cost of seawater RO desalination based on solar PV and wind energy: a global estimate. Desalination 385, 207–216 (2016)
68. Mukhtaruddin, R.N.S.R.; Rahman, H.A.; Hassan, M.Y.; Jamian, J.J.: Optimal hybrid renewable energy design in autonomous sys-tem using Iterative-Pareto-Fuzzy technique. Int. J. Electr. Power Energy Syst. 64, 242–249 (2015)
69. Maleki, A.; Khajeh, M.G.; Rosen, M.A.: Weather forecasting for optimization of a hybrid solar-wind–powered reverse osmo-sis water desalination system using a novel optimizer approach. Energy 114, 1120–1134 (2016)
70. Sanchez, V.M.; Chavez-Ramirez, A.U.; Duron-Torres, S.M.; Her-nandez, J.; Arriaga, L.G.; Ramirez, J.M.: Techno-economical opti-mization based on swarm intelligence algorithm for a stand-alone wind-photovoltaic-hydrogen power system at south-east region of Mexico. Int. J. Hydrogen Energy 39(29), 16646–16655 (2014)
71. Xu, D.; Acker, T.; Zhang, X.: Size optimization of a hybrid PV/wind/diesel/battery power system for reverse osmosis desalina-tion. J. Water Reuse Desalin. 9(4), 405–422 (2019)
72. Esfahani, I.J.; Yoo, C.: An optimization algorithm-based pinch analysis and GA for an off-grid batteryless photovoltaic-powered reverse osmosis desalination system. Renew. Energy 91, 233–248 (2016)
73. Atallah, M.O.; Farahat, M.A.; Lotfy, M.E.; Senjyu, T.: Opera-tion of conventional and unconventional energy sources to drive a reverse osmosis desalination plant in Sinai Peninsula, Egypt. Renew. Energy 145, 141–152 (2020)