Embed Size (px)
Citation preview

Performance Analysis of Optimal Sized
Hybrid Renewable Energy Grid-
Connected Systems
Anjani Kumar Prajapati
1*, Sudhir Kumar Srivastava
2
1*Research cum Teacher Fellow, Madan Mohan Malaviya University of
Technology, Gorakhpur, Uttar Pradesh, India 1*
Email: [email protected]
2Professor, Madan Mohan Malaviya University of Technology, Gorakhpur, Uttar
Pradesh, India 2Email: [email protected]
Abstract
Hybrid solar energy-based power generation systems (PGS) are one of the exciting options for
potential distributed networks. PV and wind grid linked PGSs are the most appropriate for its
good output across various configurations. However, due to the system's complexity, special
attention is required to achieve a successful engineering solution in the optimal balance between
these two energy sources. This paper discusses optimum scale of PV and wind by following
multiple optimization methods to various condition decision analysis (VCDA). The versatility of
the VCDA algorithm was tested by taking into account several weighting parameter techniques
for differing wind speeds and fluctuations in radiation levels, thus illustrating the advantages and
limitations of the suggested optimum size approaches. The subsequent study can be called upon
as a significant reference for decision makers, analysts and policymakers.
Key Words —Optimization of power plant design, various condition decision analysis, PV-WP
systems.
Taxonomy
HRE hybrid renewable energy NPV PV modules number
PGSs power generation systems TA Ambient temperature.
VCDA various condition decision analysis ISC.STC Short-circuit current under nominal test
criterions
KI Short-circuit current constant Tref PV cell temperature at 28oC.
KV Open-circuit voltage constant V Speed of wind at the HWT
WP Wind Power NPV ,NWP ,NP duration for PV, WT, and PGS systems.
PVP PV installed power PVSV PV recover value.
PVOM PV maintenance and running costs. WTP WP installed power
WPSV WP salvage value for each kW β, γ, Ψ Inflation rate, interest rate, growth
rate. s
jw Subjective criteria weight. k Criteria final score.
NOCT Nominal operating cell temperature. ξ Coefficient of wind speed
PWP.max Maximum power of wind plant. PWT.out Actual output WT power.
Cp Efficiency of the wind turbine α, β, γ Coefficients similar to the generator
emission feature.
ηPVinv. PV system inverter efficiency TA Ambient temperature
ηWPInv.,
ηMech
Inverter efficiency, mechanical
components efficiency
Iint
Primary expenditure
vci,vra,vco
inward, standard, outward wind speeds
FF Fill factor
Iint
Initial investment
vr
Wind speed calculated at the reference
height Hr
Introduction
Hybrid renewable energy (HRE) is deemed most critical in the coming days for power
generation systems (PGSs) in view of the complexities of increasing renewable energy (REE).
Even as its research continues technologically and economically, HRE PGSs have shown
internationally recognized environmental and social benefits. The non-consistent output power

for a standalone power generation systems contribution between several options is highly likely
to be PV-WP generation systems. Net-connected hybrids have a large potential. The optimal
design of these systems requires care, requiring trade-offs between decision-making criteria to
improve sustained energy development. Technical literature is rich in proposals on methods for
optimizing the size of hybrid PGS. Specific techniques have in the past been used on various
methods. The new program will provide a unique technological performance [4]–[10]. PSO [1],
genetic algorithms [2] and [3], non-linear, mixed integer programme [4], dual-simulation
annealing-tabu search algorithms [5] and specific prospects for dual GMP price optimisation. A
certain target feature is assumed in general to be reduced, which mainly is the overall cost of the
system; certain technological and environmental criteria may be incorporated in the sizing phase
in two schemes: firstly, considering the necessities as restrictions and, secondly, the transfer of
the additional method. Therefore, the ultimate judgment on both methods is similarly relevant to
all system requirements / variables. With the aid of a Multi-Objective PSO or genetics algorithm
the Pareto system is considered to be a great solution collection in [11] and [12] at the same time
to boost objective functions (environment, economic or technical). Thus these methods provide
the best solution for different PV-WP configurations, thus leaving the decision maker's final
choice, which may not be a simple task. In addition, all the parameters in this case are equally
relevant. Essence, the right hybrid PV-WP method, a big balance of various parameters in
design, contributes to a suboptimal solution cannot be derived from the solutions that are already
proposed. The particle swarm optimization (PSO) algorithm was used for optimal location and
tuning of a new custom power device (CPD) for minimization of the total CPD injected currents
and the total harmonic distortion (THD) of current and voltage. Hence, the real-time control of
reactive power with CPD was suggested. The PSO method was proposed to find out the optimal

size and location of the distributed active filter system for reducing total losses while satisfying
harmonic voltages, THD limits on a typical 37-bus distribution system [13]. In [14] optimal
location of UPQC for enhancing the power quality in distribution network under critical
situations has been investigated. Cuckoo Optimization Algorithm is proposed to find the optimal
placement and number of UPQCs for improving the power quality issues. Reconfiguration
system and placement of UPQC were used for power loss reduction and maintaining voltage
stability in a distribution network with different evolutionary algorithms [15]. Then, a steady-
state model of UPQC was used for the forward/backward sweep load flow. Distributed power
condition controller (DPCC) with the fuzzy based PI controller was proposed in [16] to enhance
power quality in a multi-microgrid. The relative capacity credit of the renewable power plants is
typically 25-50 percent. The intermittent renewable sources and loads in grid cause many
negative problems in these networks.
In this article the VCDA approaches are used to solve some of the above limits so that the
optimal size share can be defined among PV and WP plants. The suggested solution helps one to
hit the optimal level by simultaneously implementing various criteria (technique, economic,
environmental or social), without trying to transform it into a single entity. The responsiveness of
the proposed algorithms has therefore also been evaluated in the light of the various weighting
parameters and specific variance circumstances based on speed of wind and radiation emits from
solar system. This can be used during either a new PGS hybrid design or the assessment of
various unusual development for an accessible system. The following design models are
described in Section II. Section III explains the VCDA and its suggested approach to
optimization; Section IV provides the findings of a realistic argument for research and,
ultimately, its implications are summarized in Section V.
Modeling and Concept systemic methods
This segment shows the numerical models taken for various PV-WP size configurations and
theoretical design constraints. PGS aims primarily to meet cargo demand and enhance
sustainability. If ample HRE sources are available then zero economic interest is used for the
additional energy produced after meeting demand for price. The HRE plant is expected to
respond best to the demand curve and therefore will not provide local power supplies with extra
energy at a competitive rate. On the other side, if renewable energy reserves are small, the
electricity shortfall is faced by the grid. Therefore, the load requirement factor is an essential
input to the formulation criterion and is measured as recognised system data.
1. PV System Model
The developed power PPV can be analyzed by the following expression:
.( ) ( ) ( ) ( )pv PV OC SC PVinvP t N V t I t FF t (1)
Though open circuit voltage and short circuit current were depend on the required
temperature TC and the universal irradiance RG. The numerical relationship was expressed by
the following equations:
.( ) ( ( ) ( ))OC OC STC v C refV t V K T t T t (2)
.
( )( ) [ ( ) ( )]
1000
G
SC SC STC I C ref
R tI t I K T t T t (3)
20( ) ( ) ( )
800C A G
NCOTT t T t R t
(4)
2. Wind Power Generation Systems

The amount of wind power can be developed by its speed variation and can be expressed
using [12].
( ) ( ). WT
r
r
Hv t v t
H
(5)
The overall power generated by WP is computed by
max
3
. .
1( ) ( )
2WT p WTInv MechP t Av t C (6)
.max
.
0 ( )
( )
( )
0 ( )
ci
WT ci ra
WT out
r ra co
co
v t v
P v v t vP
P v v t v
v v t
(7)
The aforesaid numerical models of PV and WP were utilized to forecast and run the
developed power linked to variable PV-WP generation system.
3. Design Criteria
This paper chooses to optimize the various design criteria, which reflect the ecological,
cost-effective and social outline of the suggested ecological criteria — C1 emission
reduction. The reduction of atmospheric pollutants from SO2 and NOx emissions from
HRE sources to accomplish the load is estimated in ton / h emissions rather than in fossil-
fueled thermal units [11].
2
.
1 1
( ) ( ( ))T T
mss out out
t t
E P t P t
(8)
Performance Criteria—Estimated Costs (C2): This performance condition is measured
as the amount of installation expenditure, operating and repair, and electricity from
system costs minus the recovery benefit of photovoltaics or transmitting systems. The
following equations are used for the calculation of this performance criterion, labeled
EC[11]:
.inv P C P CI PV PV WT WT (9)
_
1
1
PVN
PV P P SVSV PV PV
(10)
_
1
1
WTN
WT P P SVSV WT WT
(11)
_ _ _PGS P PV P WT PSV SV SV (12)
_
1
1
1
PVi
N
PV P P OM
i
OM PV PV
(13)
_
1
1
1
WTi
N
WT P P OM
i
OM WT WT
(14)
_ _ _PGS P PV P WT POM OM OM (15)
cosgrid grid tC E E (16)
. _ _
.
inv PGS P PGS P
grid
P
I SV OMEC C
N
(17)
Social Criteria—Social Acceptance (C3): In this sense, the usage of the land and its
visual effects have been taken into account, including, social impact evaluation phase,
electromagnetic interference, acoustic disruption, flicker shades and habitat disturbance
[15]. The use of the land involves social opposition to the deployment of the Hybrid PV-
WP generation systems.
The social requirements methodology is carried out in this report using a fugitive logical
algorithm, which reveals the input variables being the land area used in PGS and the
amount of WP required, while the performance of this algorithm represents an indication
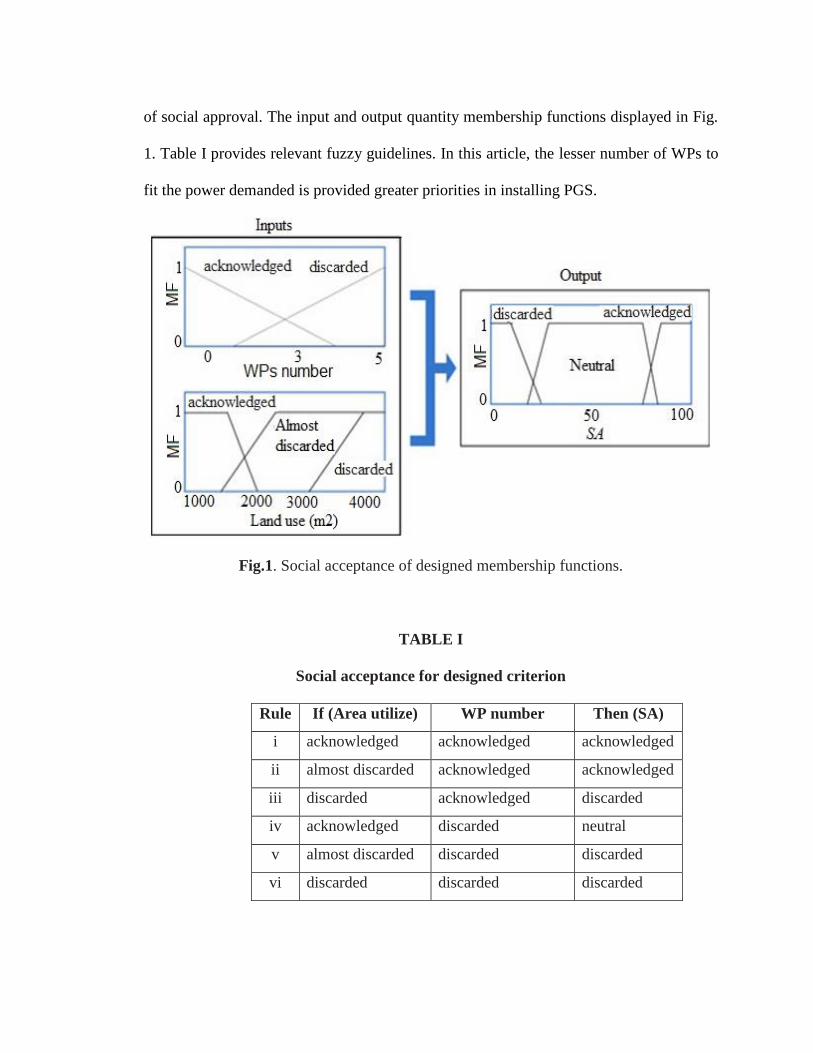
of social approval. The input and output quantity membership functions displayed in Fig.
1. Table I provides relevant fuzzy guidelines. In this article, the lesser number of WPs to
fit the power demanded is provided greater priorities in installing PGS.
Fig.1. Social acceptance of designed membership functions.
TABLE I
Social acceptance for designed criterion
Rule If (Area utilize) WP number Then (SA)
i acknowledged acknowledged acknowledged
ii almost discarded acknowledged acknowledged
iii discarded acknowledged discarded
iv acknowledged discarded neutral
v almost discarded discarded discarded
vi discarded discarded discarded
In the projected case study, the profiles shown in Fig.1 were used where the minimum
installed PV capacity was set at a level up to 50 kW; wind power generation systems of
10, 30 and 50 kW have also been considered, and the arrangement of three wind
generator turbine sizes consent for the maximum of possession as the least number of
WPs is forced. With regard to calculations of land use, 1 kW installed photovoltaic power
requires a maximum of 10m2 [16], though essential land for the wind power generation
system is measured in accordance with installation regulations and thumb rules. PGS
includes the minimum land needed for PV and WP. Models for social analysis of
requirements may vary from place to place since embracing or rejecting local populations
relies heavily on their group.
4. Design Constraint
The overall energy intake from the HRE method is limited to a minimum by enforcing
that certain quantities shall not be more than a certain threshold level for the pre-defined
evaluated duration T, presumed to be 8450 H ( per year). These are the following
parameters:
1
( ( ) ( )),
0,
T
PGS
t
E t LD tTEL
(18)
0 TEL THR
In conjunction with the energy efficiency policy implemented by the Network, the net
energy generated from excess power is sold to the grid. The suggested optimization
strategy also views excess electrical electricity as unjustified added expenses and,
regardless of the added infrastructure built, societal acceptability fines, these must be
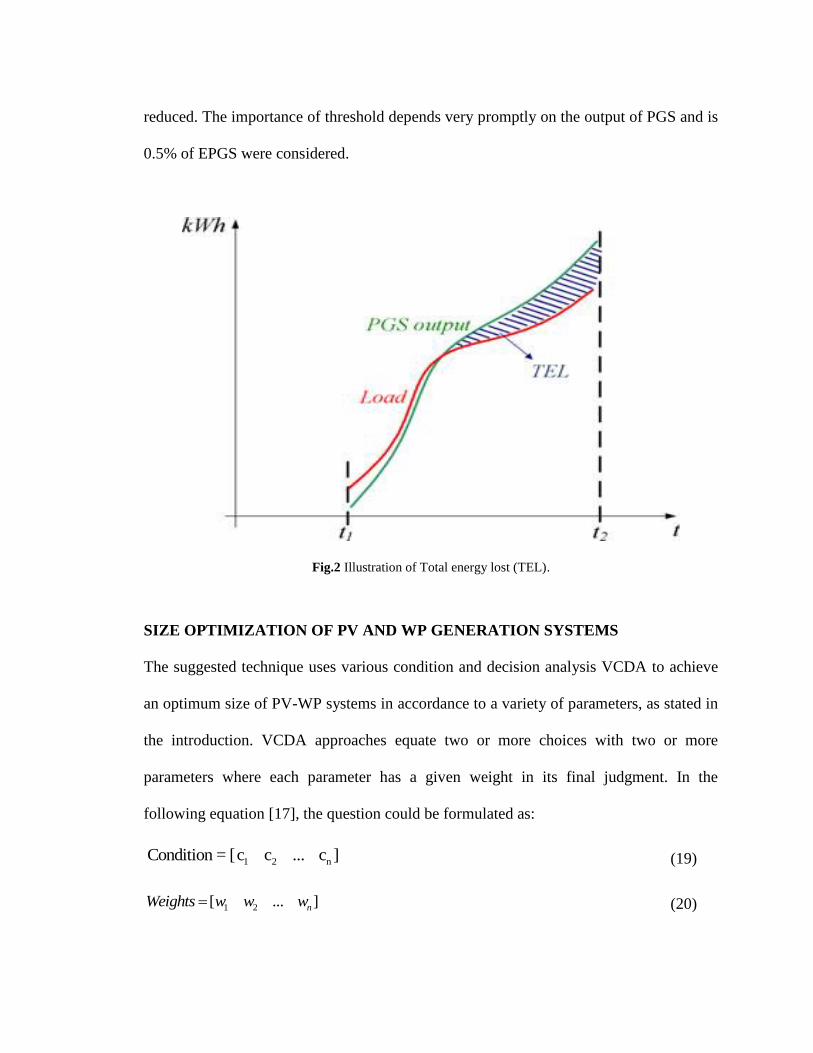
reduced. The importance of threshold depends very promptly on the output of PGS and is
0.5% of EPGS were considered.
Fig.2 Illustration of Total energy lost (TEL).
SIZE OPTIMIZATION OF PV AND WP GENERATION SYSTEMS
The suggested technique uses various condition and decision analysis VCDA to achieve
an optimum size of PV-WP systems in accordance to a variety of parameters, as stated in
the introduction. VCDA approaches equate two or more choices with two or more
parameters where each parameter has a given weight in its final judgment. In the
following equation [17], the question could be formulated as:
1 2 nCondition = [c c ... c ] (19)
1 2[ ... ]nWeights w w w (20)
1 11 12 1
2 21 22 2
1 2
...
...
... ... ... ... ...
...
n
n
m m m mn mXn
A X X X
A X X XX
A X X X
(21)
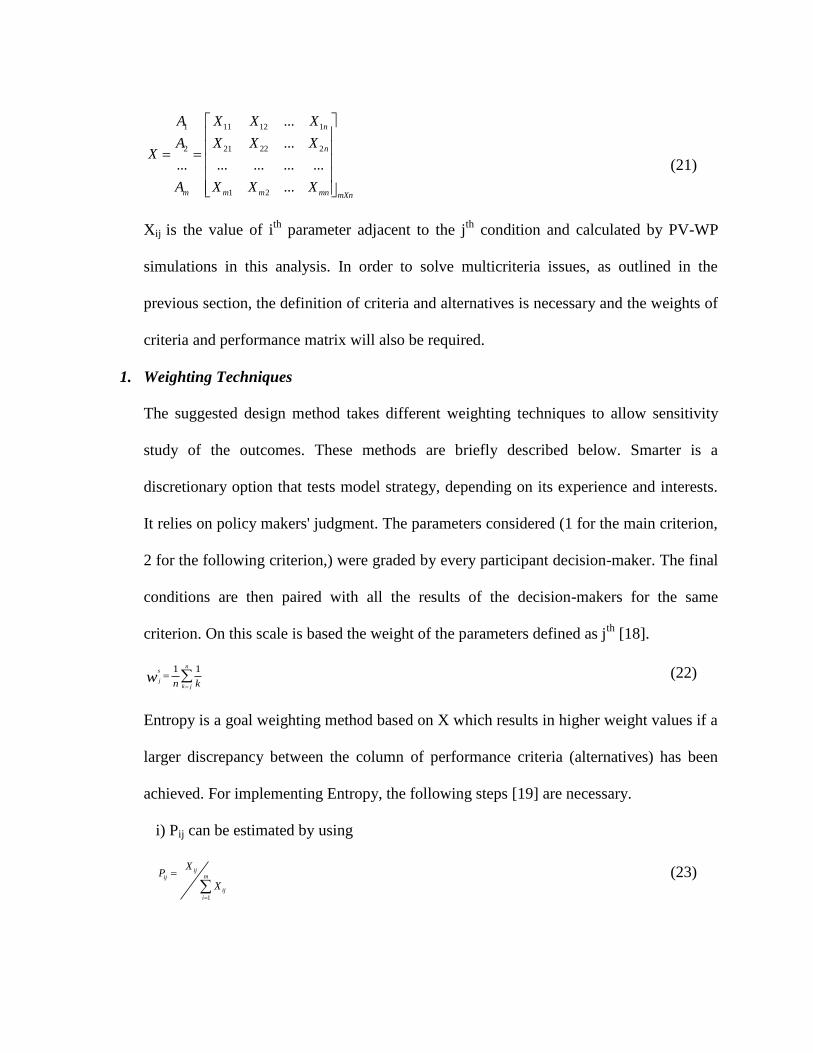
Xij is the value of ith
parameter adjacent to the jth
condition and calculated by PV-WP
simulations in this analysis. In order to solve multicriteria issues, as outlined in the
previous section, the definition of criteria and alternatives is necessary and the weights of
criteria and performance matrix will also be required.
1. Weighting Techniques
The suggested design method takes different weighting techniques to allow sensitivity
study of the outcomes. These methods are briefly described below. Smarter is a
discretionary option that tests model strategy, depending on its experience and interests.
It relies on policy makers' judgment. The parameters considered (1 for the main criterion,
2 for the following criterion,) were graded by every participant decision-maker. The final
conditions are then paired with all the results of the decision-makers for the same
criterion. On this scale is based the weight of the parameters defined as jth
[18].
1 1ns
jk jn k
w
(22)
Entropy is a goal weighting method based on X which results in higher weight values if a
larger discrepancy between the column of performance criteria (alternatives) has been
achieved. For implementing Entropy, the following steps [19] are necessary.
i) Pij can be estimated by using
1
ijmij
ij
i
XP
X
(23)

ii) Ej can be estimated by using
lnj ij ijE z P P (24)
iii) dj can be estimated by using
dj=1-Ej (25)
iv) b
jw can be estimated by using
1
/m
b
j j j
j
w d d
where 0 1b
j and 1
nb
j
j
w
(26)
Two different ways of combining the above-mentioned weighting methods are adequately
followed:.
( ) ((1 ) )s b
j jASCWM q w q w (27)
1
.
.
s b
j j
ns b
j j
j
w wMSCWM
w w
(28)
2. Sources sizing algorithm
The HPGS by an HG using PV and WP is modelled as given belows:
( , )
max max
( ) ( ) ( ) ( ) ( )
[1, ], [1, ], 0
i j i i j j
G PV PV status WT WT statusP t N P t PV t N P t WT t
i i j j t
(29)
where
0 ( )( ) 0
1
i
i PV PV
status
G t FORPV t t
otherwise
(30)
where
( ) ()i
PVG t rand
and
0 ( )( ) 0
1
j
j WT WT
status
G t FORWT t t
otherwise
(31)
where
( ) ()j
WTG t rand
subjected to following capacities constraints:
min maxi
PV PV PVN N N
min maxi
WT WT WTN N N
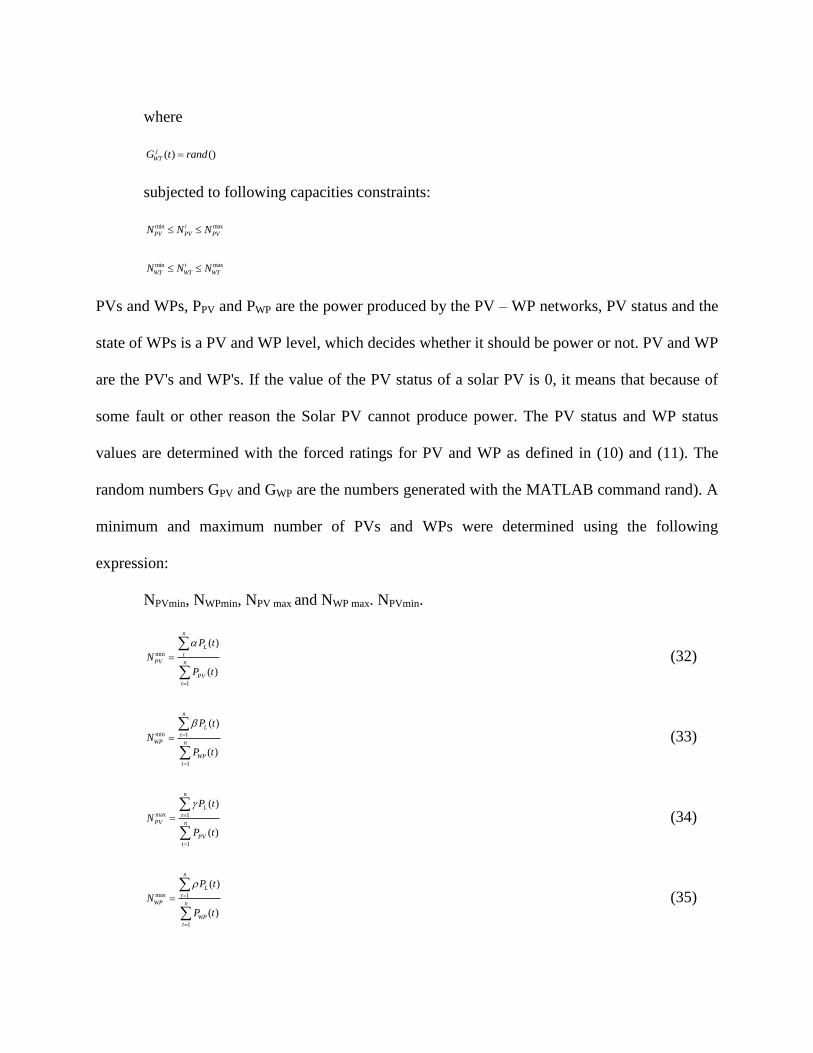
PVs and WPs, PPV and PWP are the power produced by the PV – WP networks, PV status and the
state of WPs is a PV and WP level, which decides whether it should be power or not. PV and WP
are the PV's and WP's. If the value of the PV status of a solar PV is 0, it means that because of
some fault or other reason the Solar PV cannot produce power. The PV status and WP status
values are determined with the forced ratings for PV and WP as defined in (10) and (11). The
random numbers GPV and GWP are the numbers generated with the MATLAB command rand). A
minimum and maximum number of PVs and WPs were determined using the following
expression:
NPVmin, NWPmin, NPV max and NWP max. NPVmin.
min
1
( )
( )
n
L
tPV n
PV
t
P t
N
P t
(32)
min 1
1
( )
( )
n
L
tWP n
WP
t
P t
N
P t
(33)
max 1
1
( )
( )
n
L
tPV n
PV
t
P t
N
P t
(34)
max 1
1
( )
( )
n
L
tWP n
WP
t
P t
N
P t
(35)

where α, β, γ and ρ are constant factors and n is required interval. The instant error among
generation and load can be computed by:
( , ) ( , )( ) ( ) ( )i j i j
L Gp t P t P t 0t (36)
where Δp shows the instant error. The overall instant error were represented by ΔP and computed
as
( , ) ( , )
1
( ) (| ( ) |)n
i j i j
t
P t p t
0t (37)
A smaller cumulated failure value indicates that an unreliable generation efficiently meets the
need for the load whereas a larger combined failure value implies that the difference between the
blended generation of renewable energy and the need for load is large. The accumulated error is
estimated and processed in a matrix as follows for any conceivable PV / WP combination:
max
max, max . max
max max
(1, )(1,1)
( 1) ( )
( )
j
i i j
i j
P P
P
P P
(38)
where ΔP is the error matrix representing all total error potential values. In the NPV and NWP
variables, values which are equal to increasing total error are preserved as :
max
min max
( 1)
T
PV PV PVi
N N N
(39)
max
min max
(1 )WT WT WT
jN N N
(40)
A search area is developed by taking , PVP N and WTN
max max( 1) ( 1)
0 WT
area
PV i j
NS
N P
(41)

The Sarea includes all possible PV and WP compounds and cumulative errors corresponding to
each compound. The minimum value of ΔP is reduced by selecting from each column of the
minimum value.
max
max
1
min min min (1 )[ ]L
jP P P (42)
where
min
max
min( ( , ))
2,..., 1
j
spaceP S z j j
z i
(43)
The values of NPV and NWP that match to each ΔPmin are expressed as
max
min min minmax
1
( 1)
Tj
PV PV PVj
N N N
(44)
max
min min minmax
1
(1 )
j
WT WT WTj
N N N
(45)
The logic of SSA is presented in Fig.4.

Fig. 4 Algorithm 1: SSA

Results and discussions
The variations of solar PV and WP power are shown in the Fig.6. As previously stated,
efficiency and costs are the key criteria for the evaluation of microgrid output. It should be
remembered that a mixture of WP and PV is given for increasing solution vector array, and total
installed ability of RE sources is improved by an improvement in the array. The optimum
combination is the index with an optimal decision variable value. Due to the higher value of the
optimum decision variable, the reliability at reasonably low cost is comparatively higher while
the lowest value of the optimal decision variable shows a high reliability at high costs or low
reliability at lowness. The combination PV and WP, which correlates to the SV index number
187, is the optimal answer from Fig.5. The PV and WP power is respectively 57 MW and 187
MW. The limit and then the patterns for the optimum judgment variable value were found at the
outset. Lower ODV values at the onset are attributed to a smaller volume of energy supplied in
PV and WP power. Similarly, ODV values are also small for higher indices, because costs are
very high with largely installed capacity, making the solution un-economic. Although its impact
on ODV is higher (service of energy) compared to costs, as the expense of RE sources and
storage is high and overall cost becomes even higher for very large capacities, which makes a
solution very expensive. In addition to this, the Figs.6. It may also be noticed that the exactly
minimum and maximum PV and WP capacity limitations must be chosen though the optimum
size of each method is determined. The limitations can cause the algorithms to operate in a
region that has low ODV values and leads to a solution that is uneconomic. As stated previously,
the RE sources' production is erratic, hence it may happen, during service of the HG, that the
Reg performance is inadequate to satisfy the demand needed, in these situations the HG
purchases energy from the utilities grid to transfer the load. The Fig.5 shows the overall energy

transferred by the HG and the utilities grid to reach the necessary load. It is seen that the change
in indexes raises the energy given by the HG while the energy generated by the power grid
declines. At first, HG-supported electricity decreases and the grid capacity declines both
saturated and heavy. The increase in demand and generation is seen over the span of one year in
Fig.6. The supply can be shown to still be the same as demand. As the analysis network is linked
to the grid and the power grid acts as a buffer. Therefore when the production capacity of HG is
not appropriate for supplying the necessary load demand, HG acquires power from the grid,
which renders the overall device extremely stable.
Fig. 5 Energy relationship among grid and HG
Fig. 6 deviation in generation and demand across the year.

Through the use of PSO algorithms, the issues of sizing are designed to prove the global
equilibrium is feasible. The PV and WP algorithm gives an effective power of 57.3 MW and 187
MW. Therefore, both algorithms found a small variation in PV size because of the rendering
factor. The two algorithms produce less time and guarantee maximum global results while the
calculation time for the proposed algorithm is the same. In addition , the proposed technique can
not view how the solution is established and how the algorithm can be contacted in order to find
the solution that is needed in a straightforward and comprehensible way.
In Fig.7 presented that the hybrid fluctuations of the WG and PV power generation were
effectively controlled below the 10 percent limit for the 10 minutes using method 2. The results
above show that using the control method 2 the rate of power fluctuations in the specific ranges
can more efficiently be regulated. It should also be noted that the filter time constant needs to be
modified and updated timely because of the inertia feature of the first order filter, otherwise
sometimes the power fluctuation limit is difficult to ensure. It is important that this method
(Method 1) is a function of the variable time constant checks strategy. Method 2 is however not
only more easy to apply, but also can ensure the efficient control of the power fluctuation rate
within a limited range once power fluctuation limit value is provided. Moreover, the power
fluctuation rate limit value will be regularly updated on the basis of operating conditions of the
specific location. It is also suggested.

Fig. 7 Comparison with existing the Schemes
A comparative statement with different schemes was presented in Fig.8. The proposed technique
exhibits better performance.
Fig. 8 Comparison with existing the Schemes

The algorithm proposed also does not require parameter tuning, like traditional optimization
approaches focused on impact and testing methods. Table 2 identifies the different potential
approaches to demonstrate the efficiency, based on unit cost, the energy provided by renewable
energies (energies provided by HG) and CO2 emissions, of the suggested methodology.
Table II Input Data
Load Type Maximum Load Average Load Factors of Load
300 kW 48kW 46%
Climate Conditions Maximum Value Base Value
Speed of Wind 24m/s 4.9 m/s
Radiation produced by Sun 845 W/m2 149.4W/m
2
Case I shows that the technology of modern generation generates both electricity. The lowest
cost per unit is, while in this situation the highest emissions. The remaining cases show that
electricity comes from both HG and station. The general costs of Case II are practical, and there
are also sensible emissions occurred in this condition. The renewable energy used in case III is
understandable in comparison to case II. Table 3 indicates that the rise in the renewable energy
percentage given by switching from Cases II to III equals the decreased expense percentage.
TABLE III
WP AND PV CELL PARAMETERS
Wind Turbines
Particulars Values
Power 250 MW
Impedance 0.765Ω
Inductance 3.52 mH
Magnetizing Flux 0.25 wb
No. of Poles (DFIG) 4
Torque (Max) 2.32 Nm/A
Wind speed (Avg) 14 m/s
PV modules
Number of cells 36
Highest power 150 W
OC voltage (Voc) 35.24 V

SC current (Isc) 8.33 A
Max. Volt 57.14 V
Max. Current 8.35 A
The percentage reduction in CO2 emissions is also rising, counter to the investment increase.
Case III levels are approximately 70% lower than those for Case I, i.e. modern decades. Cases III
CO2 levels are also less than Case III. Case V has the lowest CO2 emissions, but in this case, the
power of RE and BESS sources for most is very high per units of expenditure. The cost for each
product in Case I V remains higher and CO2 pollution decreased. The above discussion clearly
shows Case III to be an excellent solution because it offers considerable clean energy and
reduces CO2 emissions significantly per unit charge, namely 14.27 c / kWh at a reasonable cost.
It should be remembered that cost is the aspect / function of several other factors , for example
where solar irradiation, wind velocity or load curve is more accurately associated, contributes to
a more cost reduction, which renders our optimized approach stronger and more rational.
MATLAB is utilized to model and simulate. Simulation is conducted on the core i7 6th
generation RAM platform, 2.6 GHz, 16 GB.
Conclusion
A technique to optimize the capacity of RE sources e.g. was proposed in this paper. The optimal
capacity is measured on the basis of the energy supplied per unit cost ratio. The ideal method has
been shown to be inexpensive and to contain less emissions of CO2. A cost- and pollution
analysis is often made under some chosen situations, and the best alternative is proven to be
preferable to the other alternatives. The value of the approach suggested resides in ensuring that
it will not over- and under-size as all feasible alternatives are found. Moreover, forced outages of

WP are considered to make the methodology more practical. The suggested approach is very
general and can be extended to different types of generation and storage technologies and to
other geographical locations.
Compliance with Ethical Standards
1. Disclosure of potential conflicts of interest: The authors declare that they have no
conflict of interest.
2. Research involving human participants and/or animals: This paper does not contain
any studies with human participants or animals performed by any of the authors.
3. Informed consent: Informed consent was obtained from all individual participants
included in the study.
4. Funding: This study was not funded by any agencies.
References
[1] Montuori L, Alcázar-Ortega M, Álvarez-Bel C, Domijan A. Integration of renewable energy in microgrids
coordinated with demand response resources: economic evaluation of a biomass gasification plant by Homer
Simulator. Appl Energy 2014;132:15–22.
[2] Zhao B, Zhang X, Li P, Wang K, Xue M, Wang C. Optimal sizing, operating strategy and operational
experience of a stand-alone microgrid on Dongfushan Island. Appl Energy Jan. 2014;113:1656–66.
[3] Kuhn V, Klemeš J, Bulatov I. MicroCHP: overview of selected technologies, products and field test results.
Appl Therm Eng 2008;28(16):2039–48.
[4] N. Patel, N. Gupta, and B. C. Babu, ―Design, Development, and Implementation of Grid-Connected Solar
Photovoltaic Power Conversion System,‖ Energy Sources, Part A: Recovery, Utilization, and Environmental
Effects, Taylor and Francis, pp. 1-20, Sept. 2019.
[5] Ranaboldo M, Lega BD, Ferrenbach DV, Ferrer-Martí L, Moreno RP, GarcíaVilloria A. Renewable energy
projects to electrify rural communities in Cape Verde. Appl Energy 2014;118:280–91.
[6] Ma T, Yang H, Lu L. A feasibility study of a stand-alone hybrid solar–wind– battery system for a remote
island. Appl Energy 2014;121:149–58.
[7] Deshmukh MK, Deshmukh SS. Modeling of hybrid renewable energy systems. Renew Sustain Energy Rev
2008;12(1):235–49.
[8] K. Natarajan, M. Sankaramoorthy, A. Rajkumar, T. Shamshabad, T. Kandlakoya, ―Controlling the Power
Loss in Radial Distribution Network by Optimally Placing UPQC through Reconfiguration Using
Evolutionary Algorithms‖, International Journal of Pure and Applied Mathematics, vol. 118, pp. 161-179,
2018.
[9] Calise F, Cipollina A, Dentice d’Accadia M, Piacentino A. A novel renewable poly generation system for a
small Mediterranean volcanic island for the combined production of energy and water: dynamic simulation
and economic assessment. Appl Energy 2014;135:675–93.
[10] Chen H-C. Optimum capacity determination of stand-alone hybrid generation system considering cost and
reliability. Appl Energy 2013;103:155–64.
[11] Perera ATD, Attalage RA, Perera KKCK, Dassanayake VPC. A hybrid tool to combine multi-objective
optimization and multi-criterion decision making in designing standalone hybrid energy systems. Appl
Energy 2013;107:412–25.
[12] Perera ATD, Attalage RA, Perera KKCK, Dassanayake VPC. Designing standalone hybrid energy systems
minimizing initial investment, life cycle cost and pollutant emission. Energy 2013; 54:220–30.
[13] Bhandari B, Lee K-T, Lee CS, Song C-K, Maskey RK, Ahn S-H. A novel off-grid hybrid power system
comprised of solar photovoltaic, wind, and hydro energy sources. Appl Energy 2014; 133:236–42.
[14] M. Esmaeili, H. Shayeghi, K. Valipour, A. Safari, F. Sedaghati, ―Power quality improvement of
multimicrogrid using improved custom power device called as distributed power condition controller‖,
International Transactions on Electrical Energy Systems, vol. 30, p. e12259, 2020.
[15] Bekele G, Tadesse G. Feasibility study of small Hydro/PV/Wind hybrid system for off-grid rural
electrification in Ethiopia. Appl Energy 2012;97:5–15.
[16] Bekele G, Palm B. Feasibility study for a standalone solar–wind-based hybrid energy system for application
in Ethiopia. Appl Energy 2010;87(2):487–95.
[17] Rehman S, Mahbub Alam M, Meyer JP, Al-Hadhrami LM. Feasibility study of a wind–pv–diesel hybrid
power system for a village. Renew. Energy 2012;38(1):258–68.
[18] Fadaee M, Radzi MAM. Multi-objective optimization of a stand-alone hybrid renewable energy system by
using evolutionary algorithms: a review. Renew Sustain Energy Rev 2012;16(5):3364–9.
[19] Abbes D, Martinez A, Champenois G. Life cycle cost, embodied energy and loss of power supply probability
for the optimal design of hybrid power systems. Math. Comput. Simul. 2014;98:46–62.
[20] Hu Y, Solana P. Optimization of a hybrid diesel-wind generation plant with operational options. Renew.
Energy 2013;51:364–72.
[21] Kaldellis JK, Kavadias KA, Filios AE. A new computational algorithm for the calculation of maximum wind
energy penetration in autonomous electrical generation systems. Appl Energy Jul. 2009;86(7–8):1011–23.
[22] Alsayed M, Cacciato M, Scarcella G, Scelba G. Multicriteria optimal sizing of photovoltaic-wind turbine grid
connected systems. IEEE Trans Energy Convers 2013;28(2):370–9.
[23] A.Ma T, Yang H, Lu L, Peng J. Technical feasibility study on a standalone hybrid solar-wind system with
pumped hydro storage for a remote island in Hong Kong. Renew. Energy 2014;69:7–15. González et al. /
Applied Energy 154 (2015) 752–762 761
[24] Kapsali M, Anagnostopoulos JS, Kaldellis JK. Wind powered pumped-hydro storage systems for remote
islands: a complete sensitivity analysis based on economic perspectives. Appl Energy 2012;99:430–44.
[25] Baquero G, Esteban B, Riba J-R, Rius A, Puig R. An evaluation of the life cycle cost of rapeseed oil as a
straight vegetable oil fuel to replace petroleum diesel in agriculture. Biomass Bioenergy 2011;35(8):3687–97.
[26] S. Saremi, S. Mirjalili, A. Lewis, ―Grasshopper optimization algorithm: theory and application‖, Advances in
Engineering Software, vol. 105, pp. 30-47, 2017.
[27] A. Lakum and V. Mahajan, ―Optimal placement and sizing of multiple active power filters in radial
distribution system using grey wolf optimizer in presence of nonlinear distributed generation‖, Electric Power
Systems Research, vol. 173, pp. 281-290, 2019.
[28] M. Moghbel, M. A. Masoum, A. Fereidouni, S. Deilami, ―Optimal sizing, siting and operation of custom
power devices with STATCOM and APLC functions for real-time reactive power and network voltage
quality control of smart grid‖, IEEE Transactions on Smart Grid, vol. 9, pp. 5564-5575, 2017.
[29] Y. Li, et al., ―Optimal distributed generation planning in active distribution networks considering integration
of energy storage‖, Applied Energy, vol. 210, pp. 1073-1081, 2018.
[30] J. Sarker and S. Goswami, ―Optimal location of unified power quality conditioner in distribution system for
power quality improvement‖, International Journal of Electrical Power & Energy Systems, vol. 83, pp. 309-
324, 2016.