Embed Size (px)
Citation preview
Provisional chapter
Optical Network Optimization Based on Particle SwarmIntelligence
Fábio Renan Durand, Larissa Melo,Lucas Ricken Garcia, Alysson José dos Santos andTaufik Abrão
Additional information is available at the end of the chapter
1. Introduction
Modern optical communication networks are expected to meet a broad range of serviceswith different and variable demands of bit rate, connection (session) duration, frequency ofuse, and set up time [1]. Thus, it is necessary to build flexible all-optical networks that allowdynamic resources sharing between different users and clients in an efficient way. The all-optical network is able to implement ultrahigh speed transmitting, routing and switching ofdata in the optical domain, presenting the transparency to data formats and protocols whichincreases network flexibility and functionality such that future network requirements can bemet [2]. Optical code division multiplexing access (OCDMA) based technology has attracteda lot of interests due to its various advantages including asynchronous operation, high net‐work flexibility, protocol transparency, simplified network control and potentially enhancedsecurity [3]. Therefore, recent developments and researches on OCDMA have been experi‐enced an expansion of interest, from short-range networks, such as access networks, to high-capacity medium/large networks.
The optical network presents two promising scenarios: the transport (backbone) networkswith optical code division multiplexing/wavelength division multiplexing (OCDM/WDM)technology and the access network with OCDMA technology. In both, transportOCDM/WDM and access OCDMA networks, each different code defines a specific user orlogic channel transmitted in a common channel. In a common channel, the interference thatmay arise between different user codes is known as multiple access interference (MAI), andit can limit the number of users utilizing the channel simultaneously [3]. In this work we
© 2013 Durand et al.; licensee InTech. This is an open access article distributed under the terms of theCreative Commons Attribution License (http://creativecommons.org/licenses/by/3.0), which permitsunrestricted use, distribution, and reproduction in any medium, provided the original work is properly cited.
have focus on hybrid OCDM/WDM systems. In this one, data signals in routing networkconfiguration are carried on optical code path (OCP) from a source node to a destinationnode passing through nodes where the signals are optically routed and switched without re‐generation in the electrical domain. Hence, in routing and channel (code/wavelength) as‐signment (RCA) problem, suitable paths and channels are carefully selected among themany possible choices for the required connections [2].
Establishing OCP with higher optical signal-to-noise plus interference ratio (SNIR) allowsreducing the number of retransmissions by higher layers, thus increasing network through‐put. Therefore, RCA techniques that consider physical layer impairments for the establish‐ment of an OCP, namely Quality of Transmission-Aware (QoT-aware) RCA, could be muchmore practical [4-5]. For a dynamic traffic scenario the objective is to minimize the blockingprobability of the connections by routing, assigning channels, and to maintain an acceptablelevel of optical power and adequate SNIR all over the network [6]. Furthermore, differentchannels can travel via different optical paths and also have different levels of quality ofservice (QoS) requirements. The QoS depends on SNIR, dispersion, and nonlinear effects [6].Therefore, it is desirable to adjust network parameters in an optimal way, based on on-linedecentralized iterative algorithms to accomplish such adjustment [7].
As a result, this dynamic optimization allows an increased network flexibility and capacity[6-7]. The SNIR optimization problem appears to be a huge challenge, since the MAI intro‐duces the near-far problem [7]. Furthermore, if the distances between the nodes are quitedifferent, like in real optical networks, the signal power received from various nodes will besignificantly distinct. Thus, considering an optical node as the reference, the performance ofcloser nodes is many orders of magnitude better than that of far ones. Then, an efficientpower control is needed to overcome this problem and enhance the performance andthroughput of the network; this could be achieved through the SNIR optimization [6]. In thiscase, which is analogous to the CDMA cellular system, the power control (centralized or dis‐tributed) is one of the most important issues, because it has a significant impact on both net‐work performance and capacity. It is the most effective way to avoid the near-far problemand to increase the SNIR [6-7].
The optical power control problem has been recently investigated in the context of accessnetworks aiming at solving the near-far problem [7-8] and establishing the QoS at the physi‐cal layer [9-11]. In [7], the impact of power control on the random access protocol was inves‐tigated. In [8], the effect of near-far problem and a detailed review of the power control werepresented including the use of distributed algorithms. On the other hand, in [9-12] the con‐cept that users of various classes should transmit at different power levels was applied. Dis‐tinct power levels were obtained with power attenuators [10], adjustable encoders/decoders[11], and adjustable transmitters [12]. Furthermore, the optimal selection of the system’s pa‐rameters such as the transmitted power and the information rate would improve their per‐formances [9, 13-15]. In [13], optical power control and time hopping for multimediaapplications using single wavelength was proposed. The approach accommodates variousdata rates using only one sequence by changing the time-hopping rate. However, in order toimplement such system an optical selector device that consists of a number of optical hard-
Search Algorithms2
limiters is needed [13]. On the other hand, in [14] a multi rate and multi power level schemeusing adaptive overlapping pulse-position modulator (OPPM) and optical power controllerwas proposed. The bit rate varies depending on the number of slots in the optical OPPMsystem and has the advantage that it is not required to change the code sequence dependingon the required user’s information rate. The power level can be achieved by accommodatingusers with the different transmitted power. The power controller requires only power at‐tenuator, and the difference of the power does not cause the change of the bit rate. In [15] ahybrid power and rate control nonlinear programming algorithm for overlapped optical fastfrequency hopping (OFFH) was proposed. The multi rate transmission is achieved by over‐lapping consecutive bits while coded using fiber Bragg grating (FBG). The intensity of thetransmitted optical signal is directly adjusted from the laser source with respect to the trans‐mission data rate. The proposed algorithm provides a joint transmission power and overlap‐ping coefficient allocation strategy, which has been obtained via the solution of aconstrained optimization problem, which maximizes the aggregate system throughput sub‐ject to a peak laser transmission power constraint. In [9], a control algorithm to solve the un‐fairness in the resource allocation strategy presented in [10] has been analyzed. Also, aunified framework for allocating and controlling the transmission rate and power in a waythat it can be applied for any expression of the system capacity was implemented.
Besides, recently researches have showed the utilization of resource allocation and optimiza‐tion algorithms such as Local Search, Simulated Annealing, GA, Particle Swarm optimiza‐tion (PSO), Ant Colony optimization (ACO) and Game Theory to regulate the transmittedpower, bit rate variation and the number of active users in order to maximize the aggregatethroughput of the optical networks [16-17]. However, the complexity and unfairness in thestrategies presented are aspects to be improved. On the other hand, resource allocation hasnot been largely investigated considering energy efficiency aspects. This issue has becomeparamount since energy consumption is dominated by the access segment due to the largeamount of distributed network elements. The related works have showed the utilization ofresource allocation and optimization algorithms to optimization of the access network; how‐ever, these issues have not been largely investigated considering routed OCDM/WDM net‐works [6]. In the case of the OCP networks optimization, it is necessary to consider the useof distributed iterative algorithms with high performance-complexity tradeoffs and the im‐perfections of physical layer, which constitute a new research area so far, which was investi‐gated under an analytical perspective in [6].
It is worth noting the routed OCDM/WDM networks brings a new combination of challengeswith the power control, like amplified spans, multiple links, accumulation, and self-generationof the optical spontaneous noise power (ASE) noise, as well as the MAI generated by the OCPs.On the other hand, the dispersive effects, such as chromatic or group velocity dispersion(GVD) and polarization mode dispersion (PMD), are signal degradation mechanisms that sig‐nificantly affect the overall performance of optical communication systems [6, 18-21].
In this chapter, optimization procedures based on PSO are investigated in details, aiming toefficiently solve the optimal resource allocation for SNIR optimization of OCPs fromOCDM/WDM networks under QoS restrictions and energy efficiency constraint problem,
Optical Network Optimization Based on Particle Swarm Intelligence 3
considering imperfections on physical constraints. Herein, the adopted SNIR model consid‐ers the MAI between the OCP based on 2-D codes (time/wavelength) [22, 23], ASE at cascad‐ed amplified spans, and GVD and PMD dispersion effects.
The optimization method based on the heuristic PSO approach is attractive due to its perform‐ance-complexity tradeoff and fairness features regarding the optimization methods that de‐ploy matrix inversion, purely numerical procedures and other heuristic approaches [9][17].
The chapter is organized in the following manner: in Section 2 the optical transport (OCDM/WDM) is described, while in Section 3 the SNIR optimization for the OCPs based on particleswarm intelligence is described in order to solve the resource allocation problem. In the net‐work optimization context, figures of merit are presented and the PSO is developed in Sec‐tion 4, with emphasis on its input parameters optimal choice and the network performance.Afterward, numerical results are discussed for realistic networks operation scenarios. Final‐ly, the main conclusions are offered in Section 5.
2. Network architecture
2.1. OCDM/WDM transport network
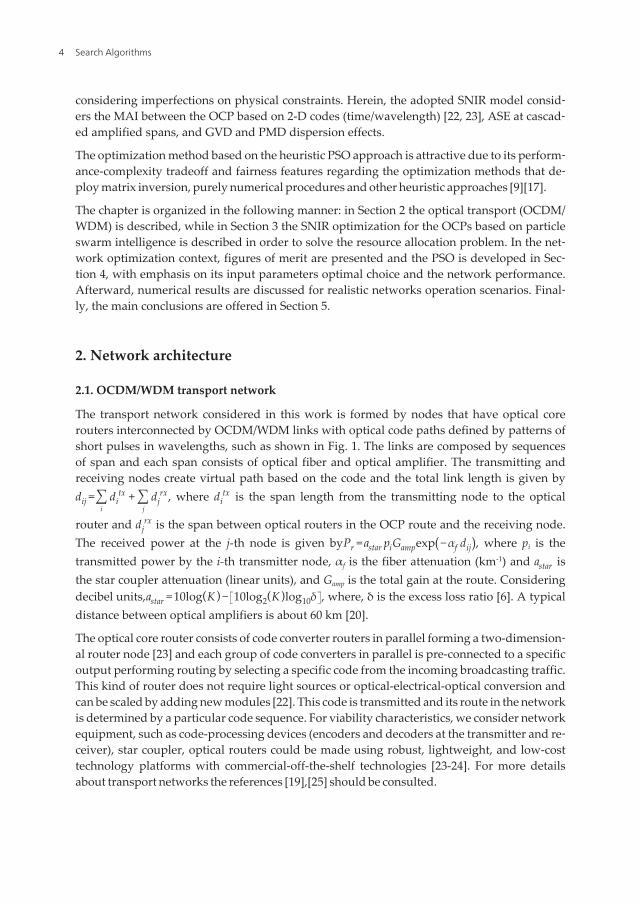
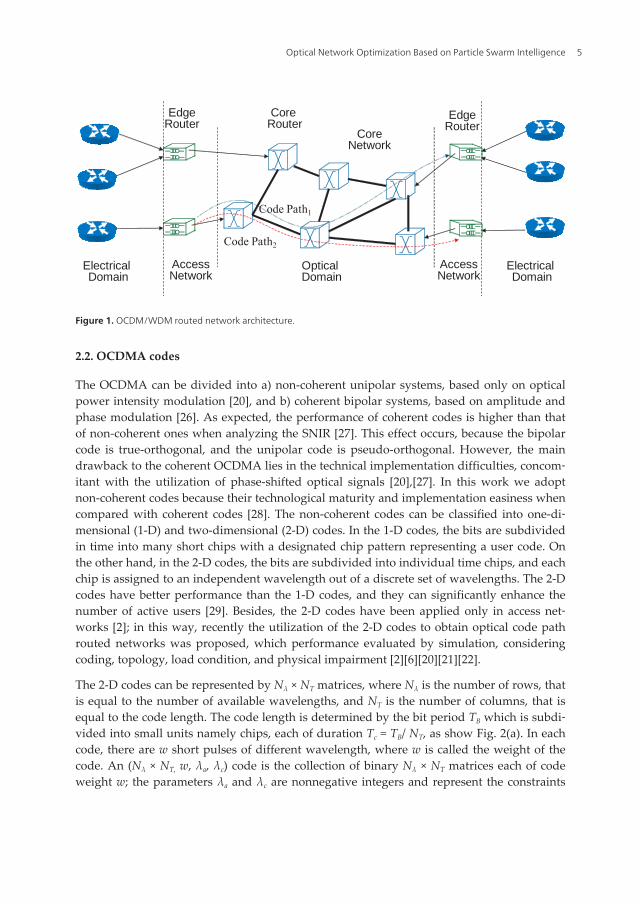
The transport network considered in this work is formed by nodes that have optical corerouters interconnected by OCDM/WDM links with optical code paths defined by patterns ofshort pulses in wavelengths, such as shown in Fig. 1. The links are composed by sequencesof span and each span consists of optical fiber and optical amplifier. The transmitting andreceiving nodes create virtual path based on the code and the total link length is given bydij =∑
idi
tx +∑j
djrx, where di
tx is the span length from the transmitting node to the optical
router and djrx is the span between optical routers in the OCP route and the receiving node.
The received power at the j-th node is given byPr =astar piGampexp(−αf dij), where pi is thetransmitted power by the i-th transmitter node, αf is the fiber attenuation (km-1) and astar isthe star coupler attenuation (linear units), and Gamp is the total gain at the route. Consideringdecibel units,astar =10log(K )− 10log2(K )log10δ , where, δ is the excess loss ratio [6]. A typicaldistance between optical amplifiers is about 60 km [20].
The optical core router consists of code converter routers in parallel forming a two-dimension‐al router node [23] and each group of code converters in parallel is pre-connected to a specificoutput performing routing by selecting a specific code from the incoming broadcasting traffic.This kind of router does not require light sources or optical-electrical-optical conversion andcan be scaled by adding new modules [22]. This code is transmitted and its route in the networkis determined by a particular code sequence. For viability characteristics, we consider networkequipment, such as code-processing devices (encoders and decoders at the transmitter and re‐ceiver), star coupler, optical routers could be made using robust, lightweight, and low-costtechnology platforms with commercial-off-the-shelf technologies [23-24]. For more detailsabout transport networks the references [19],[25] should be consulted.
Search Algorithms4
Electrical Domain
Optical Domain
Electrical Domain
EdgeRouter
EdgeRouter
Core Router
AccessNetwork
AccessNetwork
CoreNetwork
Code Path1
Code Path2
Figure 1. OCDM/WDM routed network architecture.
2.2. OCDMA codes
The OCDMA can be divided into a) non-coherent unipolar systems, based only on opticalpower intensity modulation [20], and b) coherent bipolar systems, based on amplitude andphase modulation [26]. As expected, the performance of coherent codes is higher than thatof non-coherent ones when analyzing the SNIR [27]. This effect occurs, because the bipolarcode is true-orthogonal, and the unipolar code is pseudo-orthogonal. However, the maindrawback to the coherent OCDMA lies in the technical implementation difficulties, concom‐itant with the utilization of phase-shifted optical signals [20],[27]. In this work we adoptnon-coherent codes because their technological maturity and implementation easiness whencompared with coherent codes [28]. The non-coherent codes can be classified into one-di‐mensional (1-D) and two-dimensional (2-D) codes. In the 1-D codes, the bits are subdividedin time into many short chips with a designated chip pattern representing a user code. Onthe other hand, in the 2-D codes, the bits are subdivided into individual time chips, and eachchip is assigned to an independent wavelength out of a discrete set of wavelengths. The 2-Dcodes have better performance than the 1-D codes, and they can significantly enhance thenumber of active users [29]. Besides, the 2-D codes have been applied only in access net‐works [2]; in this way, recently the utilization of the 2-D codes to obtain optical code pathrouted networks was proposed, which performance evaluated by simulation, consideringcoding, topology, load condition, and physical impairment [2][6][20][21][22].
The 2-D codes can be represented by Nλ × NT matrices, where Nλ is the number of rows, thatis equal to the number of available wavelengths, and NT is the number of columns, that isequal to the code length. The code length is determined by the bit period TB which is subdi‐vided into small units namely chips, each of duration Tc = TB/ NT, as show Fig. 2(a). In eachcode, there are w short pulses of different wavelength, where w is called the weight of thecode. An (Nλ × NT, w, λa, λc) code is the collection of binary Nλ × NT matrices each of codeweight w; the parameters λa and λc are nonnegative integers and represent the constraints
Optical Network Optimization Based on Particle Swarm Intelligence 5
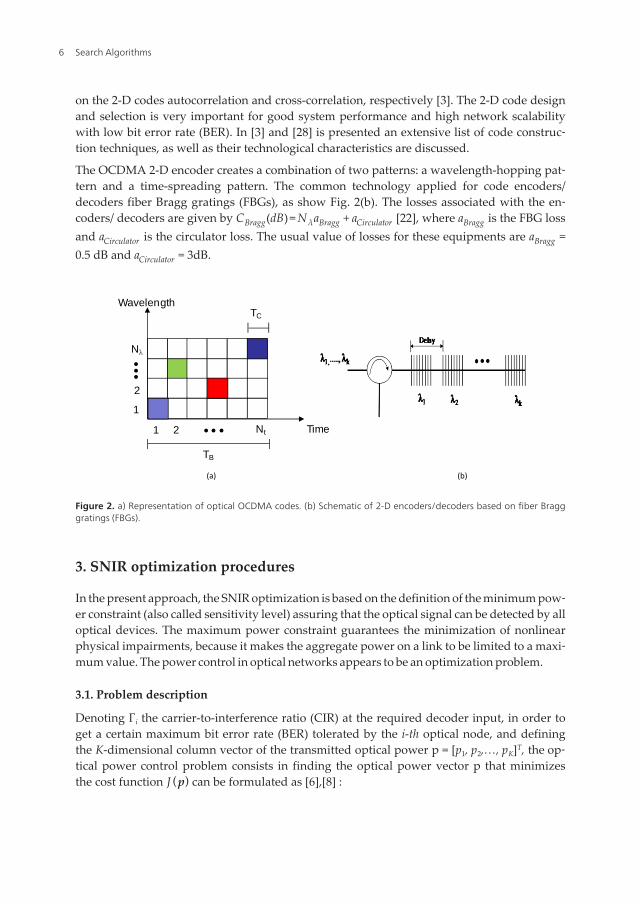
on the 2-D codes autocorrelation and cross-correlation, respectively [3]. The 2-D code designand selection is very important for good system performance and high network scalabilitywith low bit error rate (BER). In [3] and [28] is presented an extensive list of code construc‐tion techniques, as well as their technological characteristics are discussed.
The OCDMA 2-D encoder creates a combination of two patterns: a wavelength-hopping pat‐tern and a time-spreading pattern. The common technology applied for code encoders/decoders fiber Bragg gratings (FBGs), as show Fig. 2(b). The losses associated with the en‐coders/ decoders are given by CBragg(dB)= NλaBragg + aCirculator [22], where aBragg is the FBG lossand aCirculator is the circulator loss. The usual value of losses for these equipments are aBragg =0.5 dB and aCirculator = 3dB.
1 2 Nt
1
2
N
Wavelength
TB
TC
Time
(a) (b)
Figure 2. a) Representation of optical OCDMA codes. (b) Schematic of 2-D encoders/decoders based on fiber Bragggratings (FBGs).
3. SNIR optimization procedures
In the present approach, the SNIR optimization is based on the definition of the minimum pow‐er constraint (also called sensitivity level) assuring that the optical signal can be detected by alloptical devices. The maximum power constraint guarantees the minimization of nonlinearphysical impairments, because it makes the aggregate power on a link to be limited to a maxi‐mum value. The power control in optical networks appears to be an optimization problem.
3.1. Problem description
Denoting Γi the carrier-to-interference ratio (CIR) at the required decoder input, in order toget a certain maximum bit error rate (BER) tolerated by the i-th optical node, and definingthe K-dimensional column vector of the transmitted optical power p = [p1, p2,…, pK]T, the op‐tical power control problem consists in finding the optical power vector p that minimizesthe cost function J (p) can be formulated as [6],[8] :
Search Algorithms6
( )
( )
K
i 1
*
1,
min max
min max
:
1,..
min min min ,
2
0, ,
0,
K Ki
Ti
p
ii i amp Di K
eqamp ij j sp
j j i
i
J p
G p G
G G p N
P p
subject to
i KPP P
s+ + +Î Î Î =
= ¹
= =
G = ³ G+
£ £ " =
³ >
å
å
¡ ¡ ¡p pp 1 p
(1)
where 1T = [1,..., 1] and Γ *is the minimum CIR to achieve a desired QoS; Gii is the attenuationof the OCP taking into account the power loss between the nodes, according to network top‐ology, while Gij corresponds to the attenuation factor for the interfering OCP signals at thesame route, Gamp is the total gain at the OCP, Nsp
eqis the spontaneous noise power (ASE) foreach polarization at cascaded amplified spans [29], pi is the transmitted power for the i-OCPand pj is the transmitted power for the interfering OCP; σD is the pulse spreading due to thecombined effects of the GVD and the first-order PMD for Gaussian pulses [30]. Using matrixnotations, (1) can be written as Ι -Γ *H p ≥u, where I is the identity matrix, H is the normal‐ized interference matrix, which elements evaluated by H ij =Gij / Giifor i ≠ j and zero for an‐
other case, thus ui =Γ *Nspeq / Gii, where there is a scaled version of the noise power.
Substituting inequality by equality, the optimized power vector solution through the matrix
inversion p *= Ι -Γ *H -1u could be obtained. The matrix inversion is equivalent to central‐ized power control, i.e. the existence of a central node in power control. The central nodestores information about all physical network architecture, such as fiber length between no‐des, amplifier position and regular update for the OCP establishment, and traffic dynamics.These observations justify the need for on-line SNIR optimization algorithms, which haveprovable convergence properties for general network configurations [6, 16, 29].
The SNIR and the carrier to interference ratio in eq. (1) are related to the factorNT / σ, i. e.,
γi ≈ (NT / σ)2Γi. The bit error probability (BER) is given by Pb(i)= erfc( γi / 2) / 2, when theGaussian approximation is adopted, and the signal-to-noise plus interference ratio (SNIR) ateach OCP, considering the 2-D codes, is given by [6, 8],
( )2
2
1,2
T ii i amp Di K
eqamp ij j sp
j j i
N G p G
G G p N
sg
s= ¹
=+å
(2)
where the average variance of the Hamming aperiodic cross-correlation amplitude is repre‐sented by σ 2[3].
Optical Network Optimization Based on Particle Swarm Intelligence 7
3.2. Physical restrictions
The physical impairments are signal degradation mechanisms that significantly affect theoverall performance of optical communication systems [6]. For the data that are transmittedthrough a transparent optical network, degradation effects may accumulate over a large dis‐tance. The major linear physical impairments are group velocity dispersion (GVD), polariza‐tion mode dispersion (PMD), and amplifier spontaneous emission (ASE) noise [24]. On theother hand, the major nonlinear physical impairments are self phase modulation (SPM), cross-phase modulation (XPM), and four wave mixing (FWM), stimulated Brillouin scattering (SBS),and Raman scattering (SRS). The nonlinear physical impairments are excited with high powerlevel [24]. However, the maximum power constraint guarantees the minimization of nonlinearphysical impairments, because it makes the aggregate power on a link to be limited to a maxi‐mum value [6]. In the currently technology stage, besides GVD, the main linear impairment isthe PMD, that must be considered in high capacity optical networks. Differently from GVD,PMD is usually difficult to accurately determine and compensate due to its dynamic natureand its fluctuations induced by external stress/strain applied to the fiber after installation [5][21][22]. As a result, the signals quality in an OCDM/WDM network can be quickly evaluatedby analyzing the GVD, PMD and MAI restrictions. PMD impairment establishes an upperbound on the length of the optical segment due to fiber dispersion which causes the temporalspreading of optical pulses. On the other hand, due to the advances in the fiber manufacturingprocess with a continuous reduction of the PMD parameter, the deleterious effect of PMD willnot be an issue for 10 Gbps or lower bit rates, for future small and medium-sized networks [20][21]. In this context, the dominant impairment in SNIR will be given by i) ASE noise accumula‐tion in chains of optical amplifiers for future optical networks [29] and ii) ASE, GVD and PMDfor currently stage of optical networks.
The dispersive effects, such as chromatic or group velocity dispersion (GVD) and polariza‐tion mode dispersion (PMD) constitute degradation mechanisms of the optical signal thatsignificantly affect the overall performance of optical communication systems [21]. Current‐ly, the PMD effect appears to be the only major physical impairment that must be consid‐ered in high capacity optical networks, which can hardly be controlled due to its dynamicand stochastic nature [5][21-22]. On the other hand, the GVD causes the temporal spreadingof optical pulses that limits the product line rate and link length [6-30]. The pulse spreadingeffect due to the combined effects of the GVD and the first-order PMD for Gaussian pulsescan be calculated as [30]:
σD ={(1 +Cpβ2dij
2τ02 ) + ( β2dij
2τ02 ) + x − ( 1
2(1 + Cp2) × 1 +
43 (1 + Cp
2)x −1)}1/2(3)
where Cp is the chirp parameter, τ0 =TC
2 2ln2 is the RMS pulse width, Tc is the chip period at
half maximum, β2 = −Dλ02 / 2πc is the GVD factor, D is the dispersion parameter, c is the
speed of light in the vacuum, x =Δτ 2 / 4τ02 and Δτ = DPMD dij, DPMD is the PMD parameter,
Search Algorithms8
and dij is the link length. Although there is a difference in the GVD for each wavelength, re‐sulting from time skewing between the wavelengths, the consideration of the same GVDvalue for the entire transmission window is reasonable for a small number of wavelengths,as for the present code [27], [28]. On the other hand, this approximation is utilized to obtainan analytical treatment of the GVD and the PMD, in the same and less complex formalism,rather than to apply a formalism based on numerical methods [6].
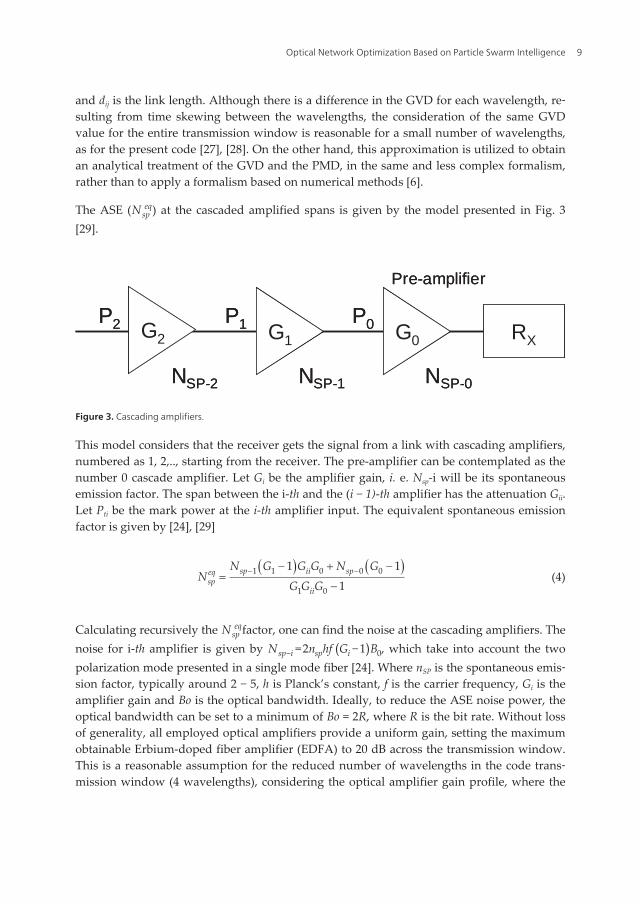
The ASE (Nspeq) at the cascaded amplified spans is given by the model presented in Fig. 3
[29].
RXG0G1G2
NSP-0NSP-1NSP-2
P2 P1 P0
Pre-amplifier
RXG0G1G2
NSP-0NSP-1NSP-2
P2 P1 P0
Pre-amplifier
Figure 3. Cascading amplifiers.
This model considers that the receiver gets the signal from a link with cascading amplifiers,numbered as 1, 2,.., starting from the receiver. The pre-amplifier can be contemplated as thenumber 0 cascade amplifier. Let Gi be the amplifier gain, i. e. Nsp-i will be its spontaneousemission factor. The span between the i-th and the (i − 1)-th amplifier has the attenuation Gii.Let Pti be the mark power at the i-th amplifier input. The equivalent spontaneous emissionfactor is given by [24], [29]
( ) ( )1 1 0 0 0
1 0
1 11
sp ii speqsp
ii
N G G G N GN
G G G- -- + -
=-
(4)
Calculating recursively the Nspeqfactor, one can find the noise at the cascading amplifiers. The
noise for i-th amplifier is given by Nsp−i =2nsphf (Gi −1)B0, which take into account the twopolarization mode presented in a single mode fiber [24]. Where nSP is the spontaneous emis‐sion factor, typically around 2 − 5, h is Planck’s constant, f is the carrier frequency, Gi is theamplifier gain and Bo is the optical bandwidth. Ideally, to reduce the ASE noise power, theoptical bandwidth can be set to a minimum of Bo = 2R, where R is the bit rate. Without lossof generality, all employed optical amplifiers provide a uniform gain, setting the maximumobtainable Erbium-doped fiber amplifier (EDFA) to 20 dB across the transmission window.This is a reasonable assumption for the reduced number of wavelengths in the code trans‐mission window (4 wavelengths), considering the optical amplifier gain profile, where the
Optical Network Optimization Based on Particle Swarm Intelligence 9
maximum difference of this gain is 0.4 dB for the wavelength, which is the most distant onefrom the central wavelength (1550 nm), with spectral spacing of 100 GHz [6][17].
3.3. Particle swarm optimization
3.3.1. PSO description
Particle Swarm Optimization (PSO) is a population-based stochastic optimization algorithmfor global optimization that was presented first in 1995 [31]. It is based on the behavior ofsocial groups like fish schools or bird flocks and it differs from other well-known Evolution‐ary Algorithms (EA). As in EA, a population of potential solutions is used to probe thesearch space, but no operators, inspired by evolution procedures, are applied on the popula‐tion to generate new promising solutions [32]. The fact which is recursively exploited is thatan improved performance can be gained by interactions between individuals, or more spe‐cifically by imitation of successful individuals. In a PSO system, particles fly around in mul‐tidimensional search space. During the flight, each particle adjusts its position according toits own experience, and the experience of neighboring particles, making use of the best posi‐tion encountered by itself and its neighbors. The swarm direction of a particle is defined bythe set of particles neighboring the particle and its history experience. Although PSO doesnot rely on the survival of the fittest principle, it is often classified as an evolutionary algo‐rithm (EA) because the update equations, which control the movement of individuals, aresimilar to the evolutionary operators used in EAs.
In general, the PSO performance for resource allocation problem can guarantee fast conver‐gence and fairness within fewer iterations regarding the genetic algorithm-based [16]. It iswell known in the literature that the PSO performance for resource allocation problem ishighly dependent on its control parameters and that recommended parameter settings fromthe literature often do not lead to reliable and fast convergence behavior for the consideredoptimization problem [33], [34], [35].
In the PSO process, each particle keeps track of its coordinates in the space of interest, whichare associated with the best solution (fitness) it has achieved so far. Another best valuetracked by the global version of the particle swarm optimizer is the overall best value, andits location, obtained so far by any particle in the population. At each time iteration step, thePSO concept consists of velocity changes of each particle toward local and global locations.Acceleration is weighted by a random term, with separate random numbers being generatedfor acceleration toward local and global locations. Let bp and vp denote a particle coordinates(position) and its corresponding flight speed (velocity) in a search space, respectively. In thisstrategy, each power-vector candidate b p t , with dimension K x 1, is used for the velocity-vector calculation of the next iteration [33]:
v p t + 1 = ω t ∙v p t + C1∙U p1 t (b pbest t - b p t ) + C2 ∙U p2 t (bg
best t - b p t ) (5)
Search Algorithms10
where ω t is the inertia weight of the previous velocity in the present speed calculation, thevelocity-vector has K dimension v p t = v p1
t v p2 t … v pK
t T ; the diagonal matrices U p1 t andU p2 t with dimension K have their elements as random variables with uniform distribution
∼ U ∈ [0, 1], generated for the pth particle at iteration t = 1, 2,..., G; bgbest t and b p
best t are thebest global vector-position and the best local vector-position found until the tth iteration, re‐spectively; C1 and C2 are acceleration coefficients regarding the best particles and the bestglobal positions influences in the velocity updating, respectively. The pth particle’s position
at the tth iteration is defined by the power candidate-vector b p t = b p1 t b p2
t … b pK t T . The
position of each particle is updated using the new velocity vector for that particle,
b p t + 1 = b p t + v p t + 1 , p =1, …, P (6)
where P is the population size. In order to reduce the likelihood that the particle might leavethe search universe, maximum velocity factor Vmax factor is added to the PSO model, whichwill be responsible for limiting the velocity to the range ±V max . Hence, the adjustment ofvelocity allows the particle to move in a continuous but constrained subspace, been simplyaccomplished by:
v pk t =min {Vmax;max {-Vmax; v pk
t }}, k =1, …, K ; p =1, …, P (7)
From (7) it’s clear that if |v pk t | exceeds a positive constant value Vmax specified by the user,
the pth particle’ velocity of kth user is assigned to be sign(v pk t )Vmax, i.e. particles velocity on
each of K -dimension is clamped to a maximum magnitude Vmax. Besides, if the search spacecould be defined by the bounds Pmin; Pmax , then the value of Vmax typically is set so thatVmax =τ(Pmax - Pmin), where 0.1≤τ ≤1.0; please refer to Chapter 1 within the definition ofreference [35].
In order to elaborate further about the inertia weight it can be noted that a relatively largervalue of ω is helpful for global optimum, and lesser influenced by the best global and localpositions, while a relatively smaller value for ω is helpful for convergence, i.e., smaller iner‐tial weight encourages the local exploration as the particles are more attracted towards b p
best
and bgbest [31, 32]. Hence, in order to achieve a balance between global and local search abili‐
ties, a linear inertia weight decreasing with the algorithm convergence evolving was adopt‐ed, which has demonstrated good global search capability at beginning and good localsearch capability latter iterations:
ω t =(ωinitial - ω final)∙ ( G - tG
)m+ ω final (8)
Optical Network Optimization Based on Particle Swarm Intelligence 11
where ωinitial and ω final is the initial and final weight inertia, respectively, ωinitial >ω final , G isthe maximum number of iterations, and m ∈ 0.6; 1.4 is the nonlinear index [36].
3.3.2. Optical code path resource allocation optimization
The following maximization cost function could be employed as an alternative to OCP re‐source allocation optimization [33]. This single-objective function was modified in order toincorporate the near-far effect [37], [38]
J1(p)=max
1K ∑
k=1
KFk
th (1 - pk
Pmax) + ρ
σrp
γk ≥ γk*, 0< pk
l ≤ Pmax, R l = Rminl ∀k∈K l , and ∀ l =1,2, …, L
(9)
where L is the number of different group of information rates allowing in the system, and K l
is the number of user in the lth rate group with minimum rate given by Rminl . Important to
say, the second term in eq. (9) gives credit to the solutions with small standard deviation ofthe normalized (by the inverse of rate factor, F l) received power distribution:
σrp2 =var (F 1p1G11, F 1p2G22, …, F l pkGkk , …, F L pkGkk ) (10)
i.e. the more close the normalized received power values are with other (small variance of
normalized received power vector), the bigger contribution of the term ρσrp
. For single-rate
systems, F 1 = … = F l = … = F L . It is worth to note that since the variance of the normalizedreceived power vector, σrp
2 , normally assumes very small values, the coefficient ρ just also
take very small values in order to the ratio ρσrp
achieves a similar order of magnitude of thefirst term in (9), been determined as a function of the number of users, K . Hence, the term
ρσrp
has an effective influence in minimizing the near-far effect on OCDM/WDM systems,and at the same time it has a non-zero value for all swarm particles [33]. Finally, the thresh‐old function in (9) is simply defined as:
Fkth = {1, γk ≥ γ *
0, otherwise(11)
where the SNIR for the k th user, γk , is given by (2). The term 1 - pk
Pmax gives credit to those
solutions with minimum power and punishes others using high power levels [33].
The PSO algorithm consists of repeated application of the updating velocity and position,eq. (5) and (6), respectively. The pseudo-code for the single-objective continuous PSO powerallocation problem is presented in Algorithm 1.
Search Algorithms12
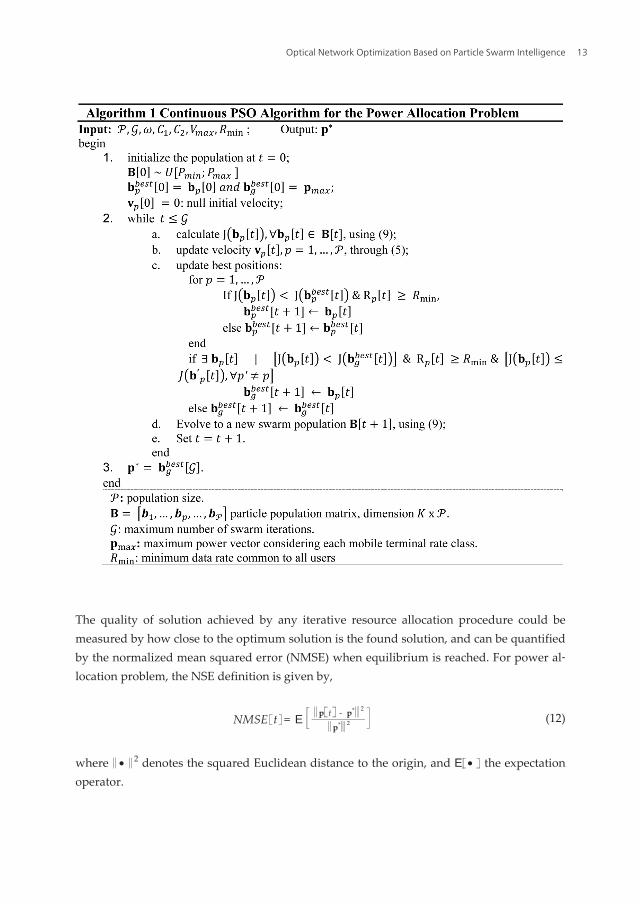
The quality of solution achieved by any iterative resource allocation procedure could bemeasured by how close to the optimum solution is the found solution, and can be quantifiedby the normalized mean squared error (NMSE) when equilibrium is reached. For power al‐location problem, the NSE definition is given by,
NMSE t = E p t - p* 2
p* 2 (12)
where ∙ 2 denotes the squared Euclidean distance to the origin, and E ∙ the expectationoperator.
Optical Network Optimization Based on Particle Swarm Intelligence 13
3.3.3. Energy efficiency optimization in OCPs
Recent studies have showed the importance of the consideration of energy consumption inoptical communications design [39], considering the transmission infrastructure (transmit‐ters, receivers, fibers and amplifiers) [40] and network infrastructure (switchers and rout‐ers) [41] aspects. Researches in a global scale network have indicated that the energyconsumption of the switching infrastructure is larger than the energy consumption of thetransport infrastructure [39-41]. In this context, it is necessary to improving the energy ef‐ficiency of switching and optimizing the network design in order to reduce the quantity ofswitching and overheads. The energy necessary for 1 bit transmission on each OCP can beexpressed as [40],
, 1,..,i i bitE p T J bit i Ké ù= ë û = (13)
where Tbit =1/R is the time to transmit one bit over the network, with R is the bit rate. In ouranalysis, to determinate the energy is necessary define the individual OCPs transmittedpower (pi). The pi is obtained by power control PSO algorithm given in Algorithm 1 and maybe associated to a specific QoS, SNIR and maximum BER tolerated by the i-th optical node.In a power control situation, each optical node adjusts its transmitter power in an attempt tomaximize the number of transmitted bits with minimum consumption of energy. This con‐cept is formulated by the energy efficiency [42]:
( ) , 1,..,ii
i
R gi K
pg
h =×
= (14)
where g(γi)=1−BE Ri is the efficiency function, which represents the number of correctpackets received for the for the i-th node, given a SNIR γi. In the same way this concept isused in a metric called utility that is the number of bits received per energy expended or therelation of the throughput and power dissipation [41].
For each i-th OCP, the maximum number of transmitted bits occurs at power level for whichthe partial derivative of energy efficiency function in (14) with respect to pi is zero∂ηi / ∂ pi =0. Considering a SNIR general formula for CDMA networks, given by [6]
, 1,..,ii ii
i i
h pI N
i Kg+
== (15)
where hij are the total loss in the path that connects i-th transmitter node to j-th receivernode, I1 is the interference from the others transmitters nodes and Ni is the receiver noise.We can obtain the derivative of energy efficiency referring to efficiency function and (15),
Search Algorithms14
( ) ( )2 , 1,..,iii i
i ii
gR g i Kp p
ghg g
g
æ ö¶¶= -ç ÷ =ç ÷¶ ¶è ø
(16)
From (16) we observe, for pi > 0, the necessary condition to maximize the energy efficiency is
( ) ( ) , ..,0 1,ii i
ii K
gg
gg g
g¶=
¶- = (17)
To satisfy (17) it is necessary that the received node achieves the target SNIR, namelyγi*. In
this context, we propose the utilization of PSO power allocation algorithm in order to estab‐lish the lower energy per bit according to the OCDM/WDM network QoS requirements.
4. Numerical results
For all simulations, it is considered the transmission over a nonzero-dispersion shifted fiber(NFD)-ITU G.655 with fiber attenuation (α) of 0.2 dB/km, non-linear parameter (Γ) of 2(W.km)-1, zero-dispersion wavelength (λ0) of 1550 nm, dispersion slope (S0) of 0.07 ps/(nm2.km). The signal is placed at λ0 and its peak power is P. Note that the nonlinear length[24] LNL= 1/(ΓP) is limited to 500 km, which is much longer than the considered fiber lengths;besides self-phase modulation (SPM) should not seriously affect the system performance.Furthermore, the threshold power for stimulated Brillouin scattering (SBS) is below a fewmW; as a result, SBS should also not interfere in our results. Similarly, for these considera‐tions, the physical impairments, such as stimulated Raman scattering (SRS) should not berelevant [24]. Typical parameter values for the noise power in all optical amplifiers were as‐sumed [21]. So, it was adopted nSP= 2, h=6.63 × 10⁻³⁴ (J/Hz), f=193.1 (THz), G=20 (dB) andBo=30 (GHz). Herein, it was considered an amplifier gain of 20 dB with a minimum spacingof 60 km, DPMD=0.1ps / km, and D=15 ps/nm/km. Losses for encoder/decoder and router ar‐chitecture of 5 dB and 20 dB, respectively, were included in the power losses model [22-24].The parameters are code weight of 4 and code length of 101, thus the code is characterizedby (4 × 101, 4, 1,0) and the target SNIR γi
* =20dB was adopted.
4.1. PSO parameters optimization for resource allocation problem
For power resource allocation problem, simulation experiments were carried out in order todetermine the suitable values for the PSO input parameters, such as acceleration coefficients,C1 and C2, maximal velocity factor, Vmax, weight inertia, ω, and population size, P, regardingthe power optimization problem.
The continuous optimization for resource allocation problem was investigated in [33], [34], itindicates that after an enough number of iterations (G) for convergence, the maximization of
Optical Network Optimization Based on Particle Swarm Intelligence 15
cost function were obtained within low values for both acceleration coefficients. The Vmax
factor is then optimized. The diversity increases as the particle velocity crosses the limits es‐tablished by ±V max . The range of Vmax determines the maximum change one particle cantake during iteration. With no influence of inertial weight (ω =1), it was obtained that themaximum allowed velocity Vmax is best set around 10 to 20% of the dynamic range of eachparticle dimension [33]. The appropriate choose of Vmax avoids particles flying out of mean‐ingful solution space. Herein, for OCP power allocation problem, similar to the problemsolved in [33], the better performance versus complexity trade-off was obtained setting themaximal velocity factor value as Vmax =0.2 (Pmax - Pmin). For the inertial weight, ω, simula‐tion results has confirmed that high values imply in fast convergence, but this means a lackof search diversity, and the algorithm can easily be trapped in some local optimum, whereasa small value for ω results in a slow convergence due to excessive changes around a verysmall search space. In this work, it was adopted a variable ω, as described in (8), but with m= 1, and initial and final weight inertia setting up to ωinitial = 1 and ω final = 0.01. Hence, theinitial and final maximal velocity excursion values were bounded through the initial and fi‐nal linear inertia weight multiplied by Vmax, adopted as a percentage of the maximal andminimal power difference values [33],
ωinitial ∙Vmax =0.2 (Pmax - Pmin) ω final ∙Vmax =0.002 (Pmax - Pmin) (18)
Finally, stopping criterion can be the maximum number of iterations G (velocity changes al‐lowed for each particle) combined with the minimum error threshold:
| J t - J t - 1J t
|< ∊stop (19)
where typically ∊stop ∈ 0.001;0.01 . Alternately, the convergence test can be evaluatedthrough the computation of the average percent of success, taken over T runs to achieve theglobal optimum, and considering a fixed number of iterations G. A convergence test is con‐sidered 100% successful if the following relation holds:
|J |G| - J |p*||< �1J p* + �2 (20)
where, J |p*| is the global optimum of the objective function under consideration, J |G| isthe optimum of the objective function obtained by the algorithm after G iterations, and ∊1 ,
∊2 are accuracy coefficients, usually in the range 10-6; 10-2 . In this study it was assumed
that T = 100 trials and ∊1 = ∊2 = 10-2.
The parameter ρ in cost function (9), was set as a function of the number of users OCPs (K),such that ρ = K × 10−19. This relation was adapted from [38] for the power-rate allocation
Search Algorithms16
problem through non-exhaustive search [33]. The swarm population size was set byP= K + 2.
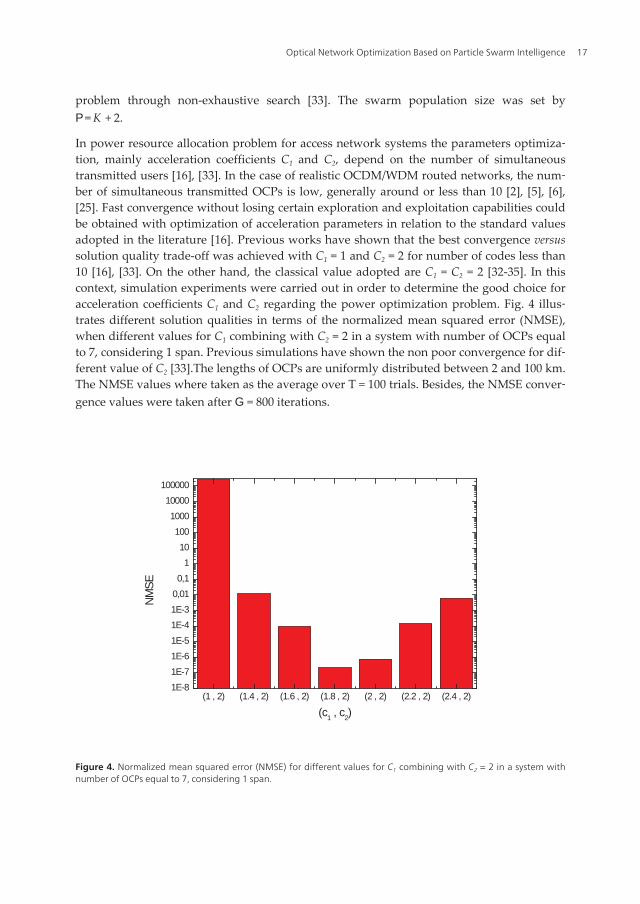
In power resource allocation problem for access network systems the parameters optimiza‐tion, mainly acceleration coefficients C1 and C2, depend on the number of simultaneoustransmitted users [16], [33]. In the case of realistic OCDM/WDM routed networks, the num‐ber of simultaneous transmitted OCPs is low, generally around or less than 10 [2], [5], [6],[25]. Fast convergence without losing certain exploration and exploitation capabilities couldbe obtained with optimization of acceleration parameters in relation to the standard valuesadopted in the literature [16]. Previous works have shown that the best convergence versussolution quality trade-off was achieved with C1 = 1 and C2 = 2 for number of codes less than10 [16], [33]. On the other hand, the classical value adopted are C1 = C2 = 2 [32-35]. In thiscontext, simulation experiments were carried out in order to determine the good choice foracceleration coefficients C1 and C2 regarding the power optimization problem. Fig. 4 illus‐trates different solution qualities in terms of the normalized mean squared error (NMSE),when different values for C1 combining with C2 = 2 in a system with number of OCPs equalto 7, considering 1 span. Previous simulations have shown the non poor convergence for dif‐ferent value of C2 [33].The lengths of OCPs are uniformly distributed between 2 and 100 km.The NMSE values where taken as the average over T = 100 trials. Besides, the NMSE conver‐gence values were taken after G = 800 iterations.
(1 , 2) (1.4 , 2) (1.6 , 2) (1.8 , 2) (2 , 2) (2.2 , 2) (2.4 , 2)1E-8
1E-7
1E-6
1E-5
1E-4
1E-3
0,01
0,1
1
10
100
1000
10000
100000
NM
SE
(c1 , c
2)
Figure 4. Normalized mean squared error (NMSE) for different values for C1 combining with C2 = 2 in a system withnumber of OCPs equal to 7, considering 1 span.
Optical Network Optimization Based on Particle Swarm Intelligence 17
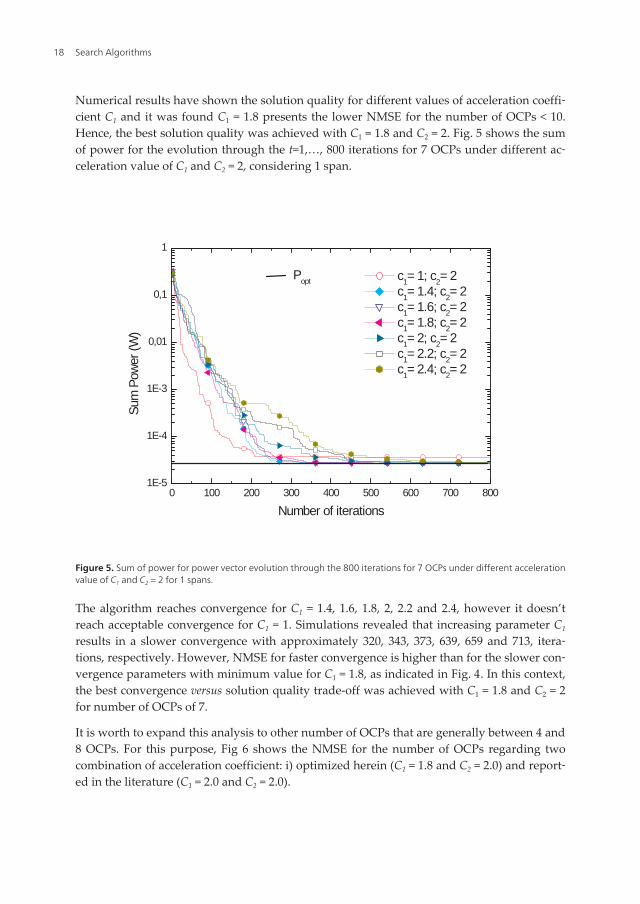
Numerical results have shown the solution quality for different values of acceleration coeffi‐cient C1 and it was found C1 = 1.8 presents the lower NMSE for the number of OCPs < 10.Hence, the best solution quality was achieved with C1 = 1.8 and C2 = 2. Fig. 5 shows the sumof power for the evolution through the t=1,…, 800 iterations for 7 OCPs under different ac‐celeration value of C1 and C2 = 2, considering 1 span.
0 100 200 300 400 500 600 700 8001E-5
1E-4
1E-3
0,01
0,1
1
Popt
Sum
Pow
er (W
)
Number of iterations
c1= 1; c
2= 2
c1= 1.4; c
2= 2
c1= 1.6; c
2= 2
c1= 1.8; c
2= 2
c1= 2; c
2= 2
c1= 2.2; c
2= 2
c1= 2.4; c
2= 2
Figure 5. Sum of power for power vector evolution through the 800 iterations for 7 OCPs under different accelerationvalue of C1 and C2 = 2 for 1 spans.
The algorithm reaches convergence for C1 = 1.4, 1.6, 1.8, 2, 2.2 and 2.4, however it doesn’treach acceptable convergence for C1 = 1. Simulations revealed that increasing parameter C1
results in a slower convergence with approximately 320, 343, 373, 639, 659 and 713, itera‐tions, respectively. However, NMSE for faster convergence is higher than for the slower con‐vergence parameters with minimum value for C1 = 1.8, as indicated in Fig. 4. In this context,the best convergence versus solution quality trade-off was achieved with C1 = 1.8 and C2 = 2for number of OCPs of 7.
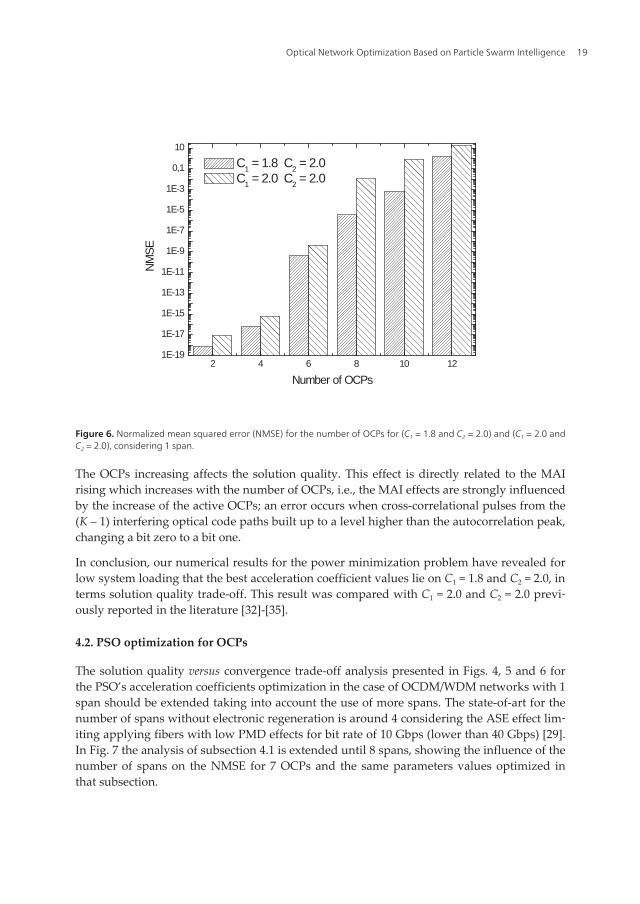
It is worth to expand this analysis to other number of OCPs that are generally between 4 and8 OCPs. For this purpose, Fig 6 shows the NMSE for the number of OCPs regarding twocombination of acceleration coefficient: i) optimized herein (C1 = 1.8 and C2 = 2.0) and report‐ed in the literature (C1 = 2.0 and C2 = 2.0).
Search Algorithms18
2 4 6 8 10 121E-19
1E-17
1E-15
1E-13
1E-11
1E-9
1E-7
1E-5
1E-3
0,1
10
NM
SE
Number of OCPs
C1 = 1.8 C
2 = 2.0
C1 = 2.0 C
2 = 2.0
Figure 6. Normalized mean squared error (NMSE) for the number of OCPs for (C1 = 1.8 and C2 = 2.0) and (C1 = 2.0 andC2 = 2.0), considering 1 span.
The OCPs increasing affects the solution quality. This effect is directly related to the MAIrising which increases with the number of OCPs, i.e., the MAI effects are strongly influencedby the increase of the active OCPs; an error occurs when cross-correlational pulses from the(K – 1) interfering optical code paths built up to a level higher than the autocorrelation peak,changing a bit zero to a bit one.
In conclusion, our numerical results for the power minimization problem have revealed forlow system loading that the best acceleration coefficient values lie on C1 = 1.8 and C2 = 2.0, interms solution quality trade-off. This result was compared with C1 = 2.0 and C2 = 2.0 previ‐ously reported in the literature [32]-[35].
4.2. PSO optimization for OCPs
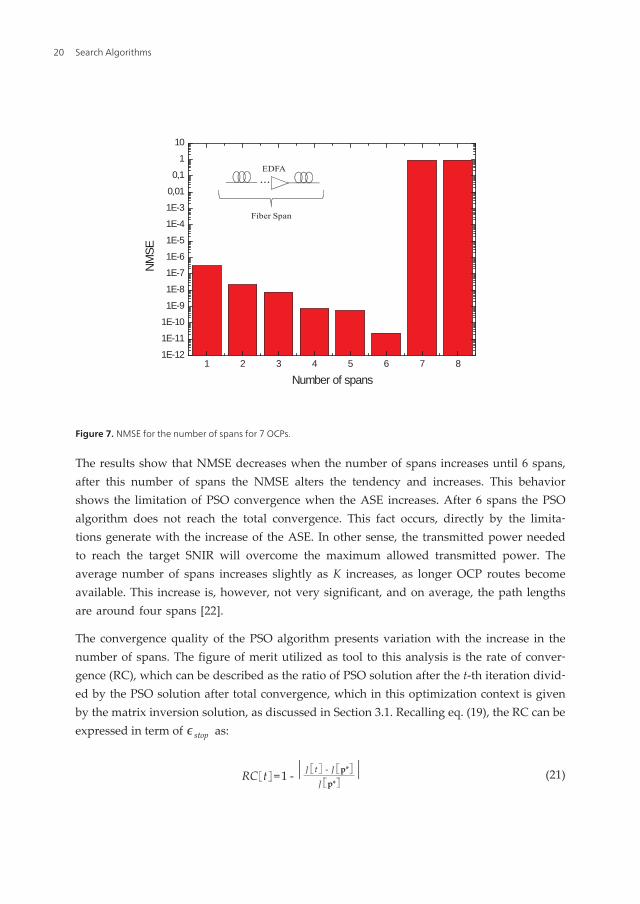
The solution quality versus convergence trade-off analysis presented in Figs. 4, 5 and 6 forthe PSO’s acceleration coefficients optimization in the case of OCDM/WDM networks with 1span should be extended taking into account the use of more spans. The state-of-art for thenumber of spans without electronic regeneration is around 4 considering the ASE effect lim‐iting applying fibers with low PMD effects for bit rate of 10 Gbps (lower than 40 Gbps) [29].In Fig. 7 the analysis of subsection 4.1 is extended until 8 spans, showing the influence of thenumber of spans on the NMSE for 7 OCPs and the same parameters values optimized inthat subsection.
Optical Network Optimization Based on Particle Swarm Intelligence 19
1 2 3 4 5 6 7 81E-12
1E-11
1E-10
1E-9
1E-8
1E-7
1E-6
1E-5
1E-4
1E-3
0,01
0,1
1
10
...
Fiber Span
EDFA
NM
SE
Number of spans
Figure 7. NMSE for the number of spans for 7 OCPs.
The results show that NMSE decreases when the number of spans increases until 6 spans,after this number of spans the NMSE alters the tendency and increases. This behaviorshows the limitation of PSO convergence when the ASE increases. After 6 spans the PSOalgorithm does not reach the total convergence. This fact occurs, directly by the limita‐tions generate with the increase of the ASE. In other sense, the transmitted power neededto reach the target SNIR will overcome the maximum allowed transmitted power. Theaverage number of spans increases slightly as K increases, as longer OCP routes becomeavailable. This increase is, however, not very significant, and on average, the path lengthsare around four spans [22].
The convergence quality of the PSO algorithm presents variation with the increase in thenumber of spans. The figure of merit utilized as tool to this analysis is the rate of conver‐gence (RC), which can be described as the ratio of PSO solution after the t-th iteration divid‐ed by the PSO solution after total convergence, which in this optimization context is givenby the matrix inversion solution, as discussed in Section 3.1. Recalling eq. (19), the RC can beexpressed in term of ∊stop as:
RC t =1 - | J t - J p*J p*
| (21)
Search Algorithms20
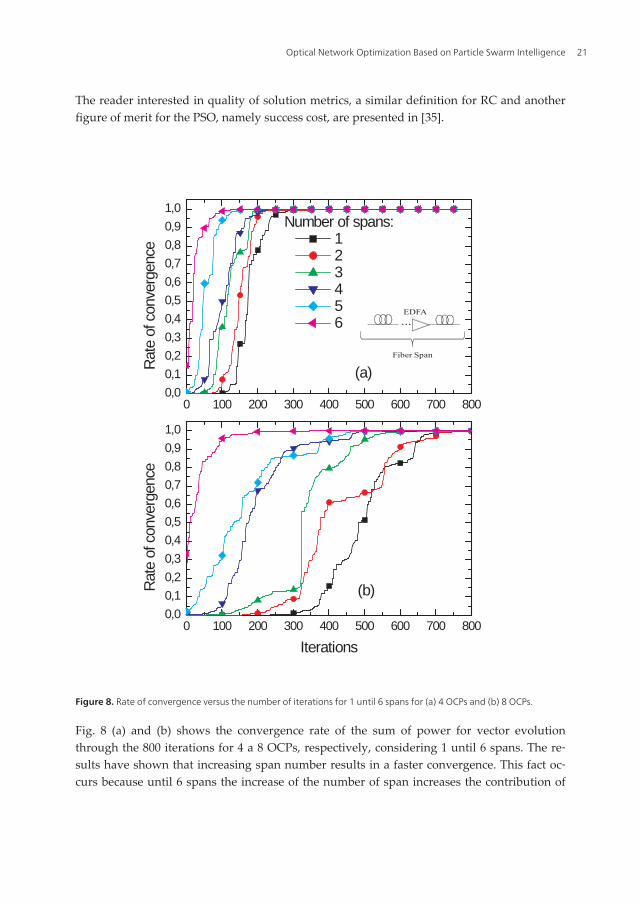
The reader interested in quality of solution metrics, a similar definition for RC and anotherfigure of merit for the PSO, namely success cost, are presented in [35].
0 100 200 300 400 500 600 700 8000,0
0,1
0,2
0,3
0,4
0,5
0,6
0,7
0,8
0,9
1,0
0 100 200 300 400 500 600 700 8000,0
0,1
0,2
0,3
0,4
0,5
0,6
0,7
0,8
0,9
1,0
Rat
e of
con
verg
ence
Iterations
(b)
(a)
...
Fiber Span
EDFA
Rat
e of
con
verg
ence
Number of spans: 1 2 3 4 5 6
Figure 8. Rate of convergence versus the number of iterations for 1 until 6 spans for (a) 4 OCPs and (b) 8 OCPs.
Fig. 8 (a) and (b) shows the convergence rate of the sum of power for vector evolutionthrough the 800 iterations for 4 a 8 OCPs, respectively, considering 1 until 6 spans. The re‐sults have shown that increasing span number results in a faster convergence. This fact oc‐curs because until 6 spans the increase of the number of span increases the contribution of
Optical Network Optimization Based on Particle Swarm Intelligence 21
the amplifier with signal, besides for more than 6 spans the contribution of the amplifier isfor the ASE noise. On the other hand, the increase in the number of OCPs results in a slowconvergence that results from the MAI between the OCPs.
In summary, our numerical results for the power minimization problem considering differ‐ent number of spans have revealed the viability of the PSO algorithm deployment to solve apower allocation in OCPs with until 6 spans in order to guarantee the solution quality interms of NMSE. Furthermore, the numerical results revealed that increasing the number ofspans results in a faster convergence. In this context, the PSO algorithm is quite suitable tosolve a power allocation in OCPs that presents an average of 4 spans as reported in the liter‐ature [22].
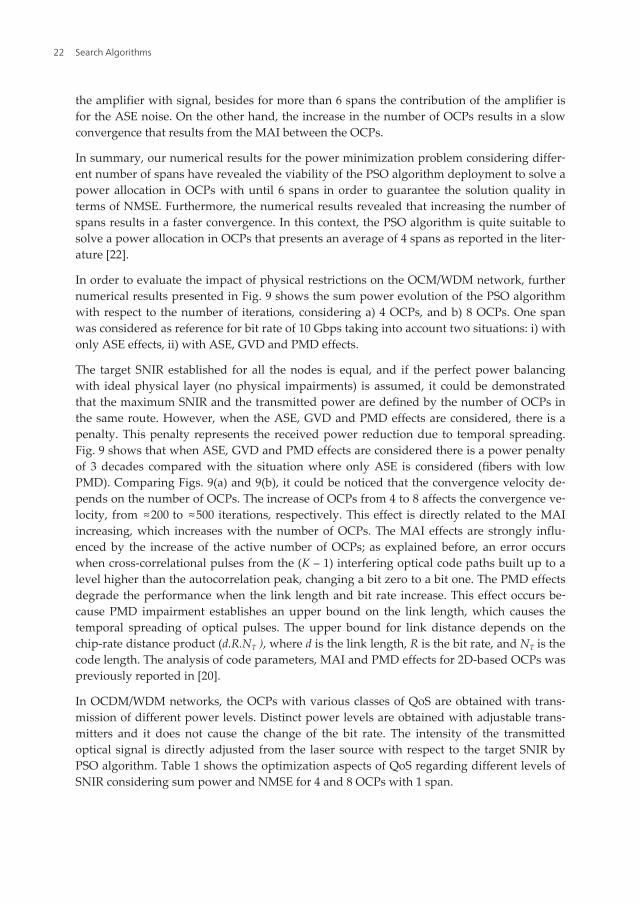
In order to evaluate the impact of physical restrictions on the OCM/WDM network, furthernumerical results presented in Fig. 9 shows the sum power evolution of the PSO algorithmwith respect to the number of iterations, considering a) 4 OCPs, and b) 8 OCPs. One spanwas considered as reference for bit rate of 10 Gbps taking into account two situations: i) withonly ASE effects, ii) with ASE, GVD and PMD effects.
The target SNIR established for all the nodes is equal, and if the perfect power balancingwith ideal physical layer (no physical impairments) is assumed, it could be demonstratedthat the maximum SNIR and the transmitted power are defined by the number of OCPs inthe same route. However, when the ASE, GVD and PMD effects are considered, there is apenalty. This penalty represents the received power reduction due to temporal spreading.Fig. 9 shows that when ASE, GVD and PMD effects are considered there is a power penaltyof 3 decades compared with the situation where only ASE is considered (fibers with lowPMD). Comparing Figs. 9(a) and 9(b), it could be noticed that the convergence velocity de‐pends on the number of OCPs. The increase of OCPs from 4 to 8 affects the convergence ve‐locity, from ≈200 to ≈500 iterations, respectively. This effect is directly related to the MAIincreasing, which increases with the number of OCPs. The MAI effects are strongly influ‐enced by the increase of the active number of OCPs; as explained before, an error occurswhen cross-correlational pulses from the (K – 1) interfering optical code paths built up to alevel higher than the autocorrelation peak, changing a bit zero to a bit one. The PMD effectsdegrade the performance when the link length and bit rate increase. This effect occurs be‐cause PMD impairment establishes an upper bound on the link length, which causes thetemporal spreading of optical pulses. The upper bound for link distance depends on thechip-rate distance product (d.R.NT ), where d is the link length, R is the bit rate, and NT is thecode length. The analysis of code parameters, MAI and PMD effects for 2D-based OCPs waspreviously reported in [20].
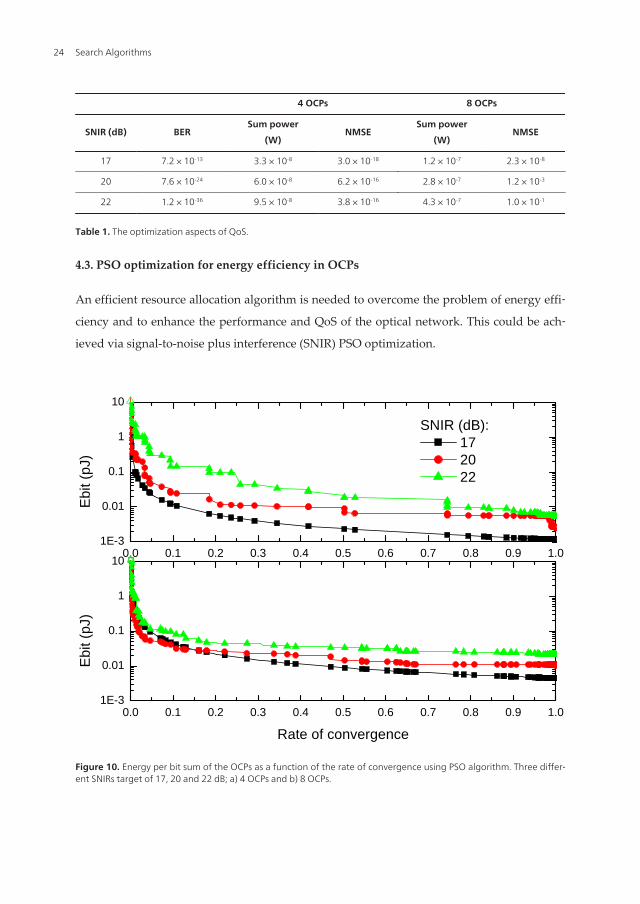
In OCDM/WDM networks, the OCPs with various classes of QoS are obtained with trans‐mission of different power levels. Distinct power levels are obtained with adjustable trans‐mitters and it does not cause the change of the bit rate. The intensity of the transmittedoptical signal is directly adjusted from the laser source with respect to the target SNIR byPSO algorithm. Table 1 shows the optimization aspects of QoS regarding different levels ofSNIR considering sum power and NMSE for 4 and 8 OCPs with 1 span.
Search Algorithms22
0 100 200 300 400 500 600 700 8001E-8
1E-7
1E-6
1E-5
1E-4
1E-3
0,01
0,1
10 100 200 300 400 500 600 700 800
1E-8
1E-7
1E-6
1E-5
1E-4
1E-3
0,01
0,1
1
Sum
pow
er (W
)
Iterations
(b)
(a)
Popt
ASE ASE + GVD + PMD
S
um p
ower
(W)
Figure 9. PSO sum power evolution for a) 4 OCPs; b) 8 OCPs. One span as reference, with R=10 Gbps. Two situations: i)ASE effects, ii) ASE, GVD and PMD effects.
The results in Table I show the necessary values for transmitted power, as well as the solu‐tion quality evaluation in terms of NMSE. The increase in the target SNIR results in the in‐crease of the transmitted power, which is major for more OCPs. On the other hand, thesolution quality (NMSE) decreases with the increase of SNIR target, since the number of thePSO iterations is fixed.
Optical Network Optimization Based on Particle Swarm Intelligence 23
4 OCPs 8 OCPs
SNIR (dB) BERSum power
(W)NMSE
Sum power
(W)NMSE
17 7.2 × 10⁻¹³ 3.3 × 10⁻⁸ 3.0 × 10⁻¹⁸ 1.2 × 10⁻⁷ 2.3 × 10⁻⁸
20 7.6 × 10⁻²⁴ 6.0 × 10⁻⁸ 6.2 × 10⁻¹⁶ 2.8 × 10⁻⁷ 1.2 × 10⁻³
22 1.2 × 10-36 9.5 × 10⁻⁸ 3.8 × 10⁻¹⁶ 4.3 × 10⁻⁷ 1.0 × 10⁻¹
Table 1. The optimization aspects of QoS.
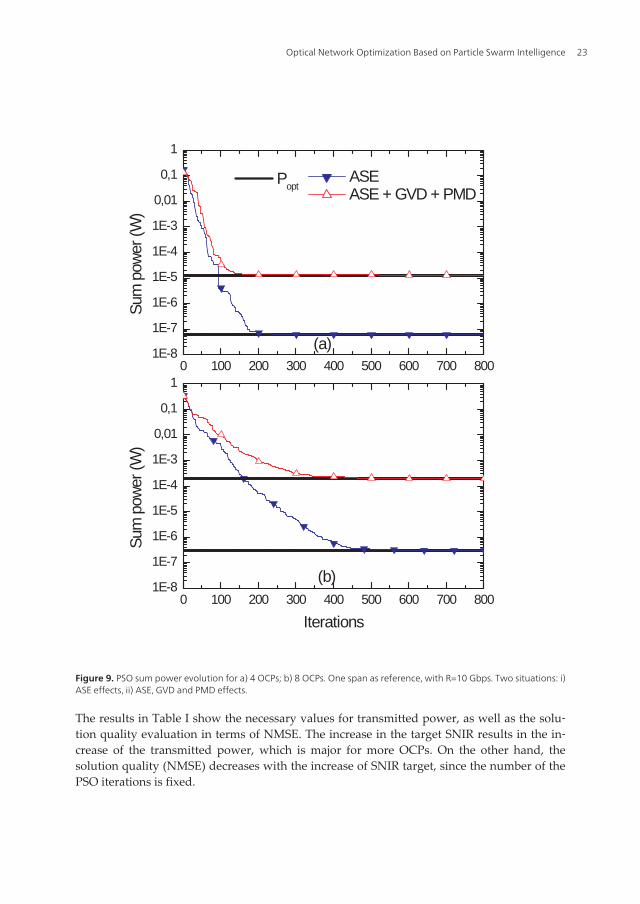
4.3. PSO optimization for energy efficiency in OCPs
An efficient resource allocation algorithm is needed to overcome the problem of energy effi‐
ciency and to enhance the performance and QoS of the optical network. This could be ach‐
ieved via signal-to-noise plus interference (SNIR) PSO optimization.
5
0.0 0.1 0.2 0.3 0.4 0.5 0.6 0.7 0.8 0.9 1.01E-3
0.01
0.1
1
100.0 0.1 0.2 0.3 0.4 0.5 0.6 0.7 0.8 0.9 1.0
1E-3
0.01
0.1
1
10
Eb
it (p
J)
Rate of convergence
Eb
it (p
J)
SNIR (dB): 17 20 22
Figure 10. Energy per bit sum of the OCPs as a function of the rate of convergence using PSO algorithm. Three differ‐ent SNIRs target of 17, 20 and 22 dB; a) 4 OCPs and b) 8 OCPs.
Search Algorithms24
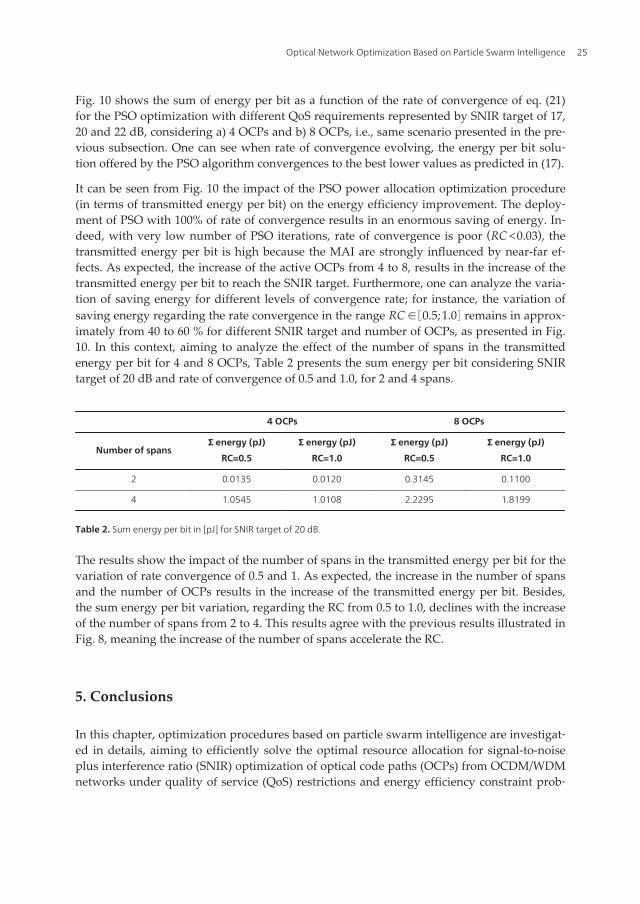
Fig. 10 shows the sum of energy per bit as a function of the rate of convergence of eq. (21)for the PSO optimization with different QoS requirements represented by SNIR target of 17,20 and 22 dB, considering a) 4 OCPs and b) 8 OCPs, i.e., same scenario presented in the pre‐vious subsection. One can see when rate of convergence evolving, the energy per bit solu‐tion offered by the PSO algorithm convergences to the best lower values as predicted in (17).
It can be seen from Fig. 10 the impact of the PSO power allocation optimization procedure(in terms of transmitted energy per bit) on the energy efficiency improvement. The deploy‐ment of PSO with 100% of rate of convergence results in an enormous saving of energy. In‐deed, with very low number of PSO iterations, rate of convergence is poor (RC <0.03), thetransmitted energy per bit is high because the MAI are strongly influenced by near-far ef‐fects. As expected, the increase of the active OCPs from 4 to 8, results in the increase of thetransmitted energy per bit to reach the SNIR target. Furthermore, one can analyze the varia‐tion of saving energy for different levels of convergence rate; for instance, the variation ofsaving energy regarding the rate convergence in the range RC∈ 0.5;1.0 remains in approx‐imately from 40 to 60 % for different SNIR target and number of OCPs, as presented in Fig.10. In this context, aiming to analyze the effect of the number of spans in the transmittedenergy per bit for 4 and 8 OCPs, Table 2 presents the sum energy per bit considering SNIRtarget of 20 dB and rate of convergence of 0.5 and 1.0, for 2 and 4 spans.
4 OCPs 8 OCPs
Number of spansΣ energy (pJ)
RC=0.5
Σ energy (pJ)
RC=1.0
Σ energy (pJ)
RC=0.5
Σ energy (pJ)
RC=1.0
2 0.0135 0.0120 0.3145 0.1100
4 1.0545 1.0108 2.2295 1.8199
Table 2. Sum energy per bit in [pJ] for SNIR target of 20 dB.
The results show the impact of the number of spans in the transmitted energy per bit for thevariation of rate convergence of 0.5 and 1. As expected, the increase in the number of spansand the number of OCPs results in the increase of the transmitted energy per bit. Besides,the sum energy per bit variation, regarding the RC from 0.5 to 1.0, declines with the increaseof the number of spans from 2 to 4. This results agree with the previous results illustrated inFig. 8, meaning the increase of the number of spans accelerate the RC.
5. Conclusions
In this chapter, optimization procedures based on particle swarm intelligence are investigat‐ed in details, aiming to efficiently solve the optimal resource allocation for signal-to-noiseplus interference ratio (SNIR) optimization of optical code paths (OCPs) from OCDM/WDMnetworks under quality of service (QoS) restrictions and energy efficiency constraint prob‐
Optical Network Optimization Based on Particle Swarm Intelligence 25
lem, considering imperfections on physical constraints. The SNIR model considers multipleaccess interference (MAI) between the OCP based on 2-D codes (time/wavelength), amplifi‐er spontaneous emission (ASE) at cascaded amplified spans, and group velocity dispersion(GVD) and polarization mode dispersion (PMD) dispersion effects. The characteristic of theparticle swarm optimization (PSO) is attractive due their performance-complexity tradeoffand fairness regarding the optimization methods that use numerical methods, matrix inver‐sion and other heuristics. The resource allocation optimization based on PSO strategy allowsthe regulation of the transmitted power and the number of active OCPs in order to maxi‐mize the aggregate throughput of the OCDM/WDM networks considering QoS and energyefficiency constraint. For the network optimization context, system model was described,figures of merit were presented and a suitable model of PSO was developed, with emphasisin the optimization of input parameters and network performance. Afterward, extensive nu‐merical results for the optimization problem are discussed taking into account realistic net‐works operation scenarios.
In order determine the suitable values for the PSO input parameters, such as acceleration co‐efficients, C1 and C2, maximal velocity factor, Vmax, weight inertia, ω, and population size, P,simulation experiments were carried out in regarding the power optimization problem forOCDM/WDM networks. In these networks, the number of simultaneous transmitted OCPsis low, generally around or less than 10. For our specific problem, the optimized input pa‐rameters are different from the reported in the literature for similar problems. The numeri‐cal results considering the number of spans have revealed the viability of the PSO algorithmdeployment in order to solve a power allocation in OCPs with until 6 spans to guarantee thesolution quality and convergence. This result is adequate considering the average of 4 spanswithout electronic regeneration presented for this kind of network. Besides, the numericalresults have shown a penalty when the ASE, GVD and PMD effects are considered. Thispenalty represents the received power reduction due to temporal spreading. Indeed, whenASE, GVD and PMD effects are considered there is a power penalty of 3 decades comparedwith the situation where only ASE is considered (fibers with low PMD). Finally, our numeri‐cal results reveal considerable variation of transmitted energy for different levels of conver‐gence rate of PSO algorithm, in which the maximum energy efficiency is reached when theconvergence of PSO algorithm is total. Interesting, even with only 10%-20% of the total PSOconvergence, the network is able to operate within a remarkable energy efficiency gain re‐gion compared to network operation without power allocation policy.
Author details
Fábio Renan Durand1, Larissa Melo1, Lucas Ricken Garcia1, Alysson José dos Santos2 andTaufik Abrão2
1 Federal University of Technology, Parana, Campo Mourão, Brazil
2 State University of Londrina – Electrical Engineering Department, Brazil
Search Algorithms26
References
[1] E. Wong, “Next-Generation Broadband Access Networks and Technologies,” Journalof Lightwave Technology, vol. 30, no. 4, pp. 597 – 608, Feb., 2012
[2] H. Beyranvand and J. Salehi, “All-optical multiservice path switching in optical codeswitched GMPLS core network”, Journal of Lightwave Technology, vol. 27, no. 17,pp. 2001 – 2012, Jun. 2009.
[3] H. Yin and D. J. Richardson, Optical code division multiple access communicationnetworks: theory and applications. Berlin: Springer-Verlag and Tsinghua UniversityPress, 2009.
[4] A. Rahbar, “Review of Dynamic Impairment-Aware Routing and Wavelength As‐signment Techniques in All-Optical Wavelength-Routed Networks”, IEEE Commu‐nications Surveys & Tutorials, ACCEPTED FOR PUBLICATION
[5] F. R. Durand, M. Lima and E. Moschim, “Impact of pmd on hybrid wdm/ocdm net‐works,” IEEE Photonics Technology Letters, vol. 17, no. 12, pp. 2787–2789, December2005.
[6] F. R. Durand and T. Abrão, “Distributed SNIR Optimization Based on the VerhulstModel in Optical Code Path Routed Networks With Physical Constraints”, Journal ofOptical Communications and Networking, vol. 3, no. 9, pp. 683–691, Sep. 2011. doi:10.1364/JOCN.3.000683
[7] F. R. Durand, M. S. Filho and T. Abrão, “The effects of power control on the opticalCDMA random access protocol”, Optical Switching and Networking, (In press) doi:10.1016/j.osn.2011.06.002
[8] N. Tarhuni, T. Korhonen, M. Elmusrati and E. Mutafungwa, “Power Control of Opti‐cal CDMA Star Networks”, Optics Communications, vol. 259, pp. 655 – 664, Mar.2006.
[9] E. Inaty, R. Raad, P. Fortier, and H. M. H. Shalaby, “A Fair QoS-Based Resource Allo‐cation Scheme For a Time-Slotted Optical OV-CDMA Packet Networks: a UnifiedApproach,” Journal of Lightwave Technology, vol. 26, no. 21, pp. 1-10, Jan. 2009.
[10] E. Inaty, H. Shalaby, P. Fortie, and L. Rusch, “Optical Fast Frequency HoppingCDMA System Using Power Control”, Journal of Lightwave Tech., vol. 20, n. 2, pp.166 – 177, March 2003.
[11] C. C. Yang, J. F. Huang, and T. C. Hsu, “Differentiated service provision in opticalCDMA network using power control,” IEEE Photon. Technol. Lett., vol. 20, no. 20,pp. 1664–1666, 2008.
[12] S. Khaleghi and Mohammad Reza Pakravan, Quality of Service Provisioning in Opti‐cal CDMA Packet Networks, Journal of Optical Communications and Networking,vol. 2, no. 5, pp. 283–292, Feb. 2010.
Optical Network Optimization Based on Particle Swarm Intelligence 27
[13] H. Yashima, and T. Kobayashi “Optical CDMA with time hopping and power con‐trol for multirate networks,” J. Lightwave Technol., vol. 21, pp. 695-702, March 2003.
[14] T. Miyazawa and I. Sasase “Multi-rate and multi-quality transmission scheme usingadaptive overlapping pulse-position modulator and power controller in optical net‐work,” IEEE ICON, vol. 1, pp. 127-131, November 2004.
[15] R. Raad, E. Inaty, P. Fortier, and H. M. H. Shalaby, “Optimal resource allocationscheme in a multirate overlapped optical CDMA system,” J. of Lightwave Technol.,vol. 25, no. 8, pp. 2044 – 2053, August 2007.
[16] M. Tang, C. Long and X. Guan, “Nonconvex Optimization for Power Control inWireless CDMA Networks,” Wireless Personal Communications, vol. 58, n. 4, pp.851-865, 2011.
[17] Q. Zhu. and L. Pavel, “Enabling Differentiated Services Using Generalized PowerControl Model in Optical Networks”, IEEE Transactions on Communications, vol. 57,no 9, p. 1 – 6, Sept. 2009.
[18] R. Ramaswami, K. Sivarajan and G. Sasaki, Optical Networks: A Practical Perspec‐tive, Morgan Kaufmann, Boston, MA, 2009.
[19] E. Mutafungwa, “Comparative analysis of the traffic performance of fiber-impair‐ment limited WDM and hybrid OCDM/WDM networks”, Photon Network Com‐mun., vol. 13, pp.53–66, Jan. 2007.
[20] F R. Durand, L. Galdino, L. H. Bonani, F. R. Barbosa1, M. L. F. Abbade and EdsonMoschim, “The Effects of Polarization Mode Dispersion on 2D Wavelength-HoppingTime Spreading Code Routed Networks”, Photonics Network Communications, vol.20, no. 1, pp. 27 – 32, Aug. 2010. DOI 10.1007/s11107-010-0242-6.
[21] F. R. Durand, M. L. F. Abbade, F. R. Barbosa, and E. Moschim, “Design of multi-rateoptical code paths considering polarisation mode dispersion limitations,” IET Com‐munications, vol. 4, no. 2, pp. 234–239, Jan. 2010.
[22] Camille-Sophie Brès and Paul R. Prucnal, “Code-Empowered Lightwave Networks”,J. Lightw. Technol. , vol. 25, n. 10, pp. 2911 – 2921, Oct. 2007.
[23] Yue-Kai Huang, Varghese Baby, Ivan Glesk, Camille-Sophie Bres, Christoph M.Greiner, Dmitri Iazikov, Thomas W. Mossberg, and Paul R. Prucnal, Fellow, “NovelMulticode-Processing Platform for Wavelength-Hopping Time-Spreading OpticalCDMA: A Path to Device Miniaturization and Enhanced Network Functionality”,IEEE Journal of Selected Topics in Quantum Electronics, vol. 13, no. 5, pp. 1471 –1479, september/october 2007.
[24] G. P. Agrawal, Fiber-optic communication systems, John Wiley & Sons, 2002.
[25] K. Kitayama and M. Murata, “Versatile Optical Code-Based MPLS for Circuit, Burstand Packet Switching”, J. Lightwave Technol, vol. 21, no. 11, pp. 2573 – 2764, Nov.2003.
Search Algorithms28
[26] S. Huang, K. Baba, M. Murata and K. Kitayama, “Variable-bandwidth optical paths:comparison between optical code-labeled path and OCDM path”, J. Lightwave Tech‐nol., vol. 24, no. 10, pp. 3563 – 3573, Oct. 2006.
[27] Kerim Fouli e Martin Maier, “OCDMA and Optical Coding: Principles, Applications,and Challenges”, IEEE Communications Magazine, vol. 45, no. 8, pp. 27 – 34, Aug.2007.
[28] G.-C. Yang and W.C. Kwong, Prime codes with applications to CDMA optical andwireless networks, Artech House, Boston, MA, 2002.
[29] G. Pavani, L. Zuliani, H. Waldman and M. Magalhães, “Distributed approaches forimpairment-aware routing and wavelength assignment algorithms in GMPLS net‐works”, Computer Networks, vol. 52, no. 10, pp. 1905–1915, July 2008.
[30] A. L. Sanches, J. V. dos Reis Jr. and B.-H. V. Borges, “Analysis of High-Speed OpticalWavelength/Time CDMA Networks Using Pulse-Position Modulation and ForwardError Correction Techniques”, J. Lightwave Technol., vol. 27, no. 22, pp. 5134 – 5144,Nov. 2009.
[31] J. Kennedy and R.C. Eberhart, “Particle swarm optimization”, in Proceedings of IEEEInternational Conference on Neural Networks, Piscataway, USA, pp. 1942–1948,1995.
[32] N. Nedjah and L. Mourelle, Swarm Intelligent Systems, Springer, Springer-VerlagBerlin Heidelberg, 2006.
[33] T. Abrão, L. D. Sampaio, M. Proença Jr., B. A. Angélico and Paul Jean E. Jeszensky,Multiple Access Network Optimization Aspects via Swarm Search Algorithms, In:Nashat Mansour. (Org.). Search Algorithms and Applications. 1 ed. Vienna, Austria:InTech, ISBN 978-953-307-156-5, 2011, v. 1, p. 261-298.
[34] K. Zielinski, P. Weitkemper, R. Laur, and K. Kammeyer, “Optimization of Power Al‐location for Interference Cancellation With Particle Swarm Optimization”, IEEETransactions on Evolutionary Computation, vol. 13, no. 1, pp. 128 – 150, Feb. 2009.
[35] N. Nedjah and L. M. Mourelle. Swarm Intelligent Systems, Springer, Springer-VerlagBerlin Heidelberg, 2006.
[36] A. Chatterjee and P. Siarry, Nonlinear inertia weight variation for dynamic adapta‐tion in particle swarm optimization, Computers & Operations Research, vol 33, no. 3,pp. 859–871.
[37] M. Moustafa, I. Habib, and M. Naghshineh, Genetic algorithm for mobiles equilibri‐um, MILCOM 2000. 21st Century Military Communications Conference Proceedings2000.
[38] H. Elkamchouchi, H., EIragal and M. Makar, Power control in cdma system usingparticle swarm optimization, 24th National Radio Science Conference, pp. 1–8. 2007.
Optical Network Optimization Based on Particle Swarm Intelligence 29

[39] S. Yoo, “Energy Efficiency in the Future Internet: the Role of Optical Packet Switch‐ing and Optical Label Switching”, IEEE J Selected Topics in Quantum Electronics,vol. 17, no. 2, pp. 406 – 418, March-April 2011.
[40] Rodney S. Tucker, "Green Optical Communications - Part I: Energy Limitations inTransport", IEEE J Selected Topics in Quantum Electronics, vol. 17, no. 2, pp. 245 –260, March-April 2011.
[41] Rodney S. Tucker, "Green Optical Communications - Part II: Energy Limitations inNetworks", IEEE J Selected Topics in Quantum Electronics, vol. 17, no. 2, pp. 261 –274, March-April 2011.
[42] D. Goodman and Narayan Mandayan “Power control for wireless data”, IEEE Per‐sonal Communications, vol. 7, no. 2, pp. 48 – 54, April 2000.
Search Algorithms30