Embed Size (px)
Citation preview

Oppenheimer 12th
Annual Industrial Growth Conference
May 9, 2017
DisclaimerThis presentation contains “forward-looking statements” within the meaning of the Private Securities Litigation Reform Act of 1995. Such forward looking statements generally include the words “may,” “could,” “should,” “believes,” “plans,” “intends,” “targets,” “will,” “expects,” “suggests,” “anticipates,” “outlook,” “continues,” “forecast,” “prospect,” “potential” or similar expressions. Forward-looking statements may include, without limitation, expected financial positions, results of operations and cash flows; financing plans; business strategies and expectations; operating plans; capital and other expenditures; competitive positions; growth opportunities for existing products; benefits from new technology and cost-reduction initiatives, plans and objectives; and markets for securities. Like other businesses, Ingevity is subject to risks and uncertainties that could cause its actual results to differ materially from its expectations or that could cause other forward-looking statements to prove incorrect. Factors that could cause actual results to materially differ from those contained in the forward-looking statements, or that could cause other forward-looking statements to prove incorrect, include, without limitation, general economic and financial conditions; international sales and operations; currency exchange rates and currency devaluation; compliance with U.S.and foreign regulations; attracting and retaining key personnel; conditions in the automotive market; worldwide air quality standards; government infrastructure spending; declining volumes in the printing inks market; the limited supply of crude tall oil (“CTO”); lack of access to sufficient CTO; access to and pricing of raw materials; competition from producers of substitute products and new technologies; a prolonged period of low energy prices; the provision of services by third parties at severalfacilities; natural disasters, such as hurricanes, winter or tropical storms, earthquakes, floods, fires; other unanticipatedproblems such as labor difficulties including renewal of collective bargaining agreements, equipment failure or unscheduled maintenance and repair; protection of intellectual property and proprietary information; information technology security risks; government policies and regulations, including, but not limited to, those affecting the environment, climate change, tax policies and the chemicals industry; and lawsuits arising out of environmental damage or personal injuries associated with chemical orother manufacturing processes. These and other important factors that could cause actual results or events to differ materially from those expressed in forward-looking statements that may have been made in this document are and will be more particularly described in our filings with the U.S. Securities and Exchange Commission, including our Form 10 Registration Statement and periodic filings. Readers are cautioned not to place undue reliance on Ingevity’s projections and forward-looking statements, which speak only as the date thereof. Ingevity undertakes no obligation to publicly release any revision to the projections and forward-looking statements contained in this presentation, or to update them to reflect events or circumstances occurring after the date of this presentation.
Non-GAAP Financial Measures
This presentation includes certain non‐GAAP financial measures intended to supplement, not substitute for, comparable GAAP measures. Reconciliations of non‐GAAP financial measures to GAAP financial measures are provided within the Appendix to this presentation. Investors are urged to consider carefully the comparable GAAP measures and the reconciliations to those measures provided.
2
Contents
•Company Overview
•Q1 2017 Results
•Segment Overviews
•Appendix
3

Company Overview
4
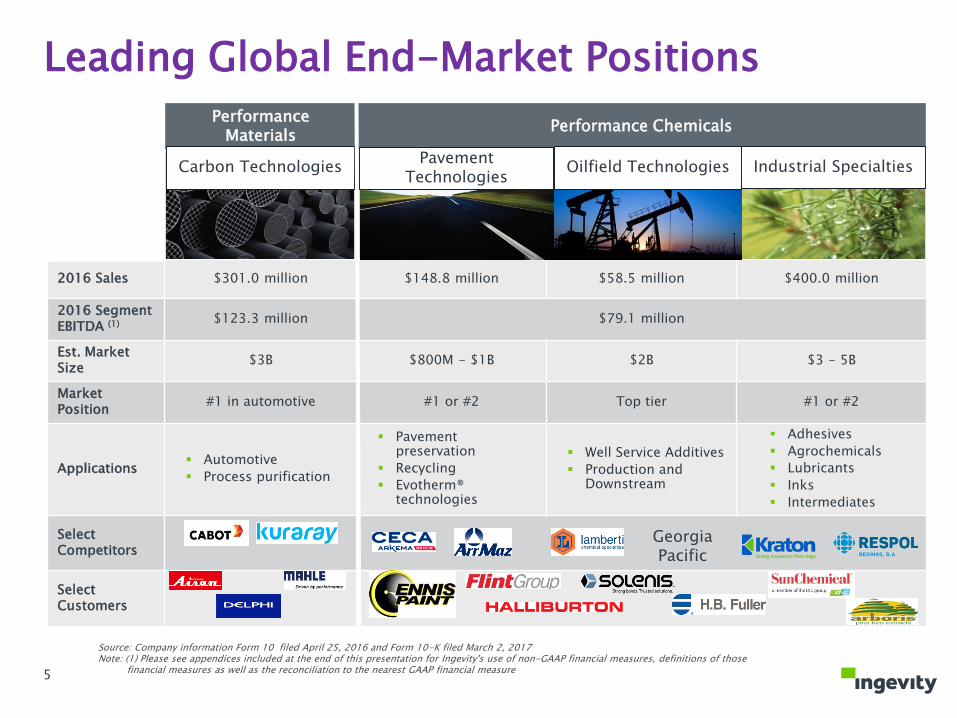
Performance Materials
Performance Chemicals
2016 Sales $301.0 million $148.8 million $58.5 million $400.0 million
2016 Segment EBITDA (1) $123.3 million $79.1 million
Est. Market Size
$3B $800M - $1B $2B $3 - 5B
Market Position
#1 in automotive #1 or #2 Top tier #1 or #2
Applications Automotive
Process purification
Pavement preservation
Recycling
Evotherm® technologies
Well Service Additives
Production and Downstream
Adhesives
Agrochemicals
Lubricants
Inks
Intermediates
Select Competitors
Select Customers
Carbon TechnologiesPavement
TechnologiesOilfield Technologies
Leading Global End-Market Positions
Source: Company information Form 10 filed April 25, 2016 and Form 10-K filed March 2, 2017Note: (1) Please see appendices included at the end of this presentation for Ingevity's use of non-GAAP financial measures, definitions of those
financial measures as well as the reconciliation to the nearest GAAP financial measure
Industrial Specialties
5
Georgia Pacific
Q1 2017 Results
6
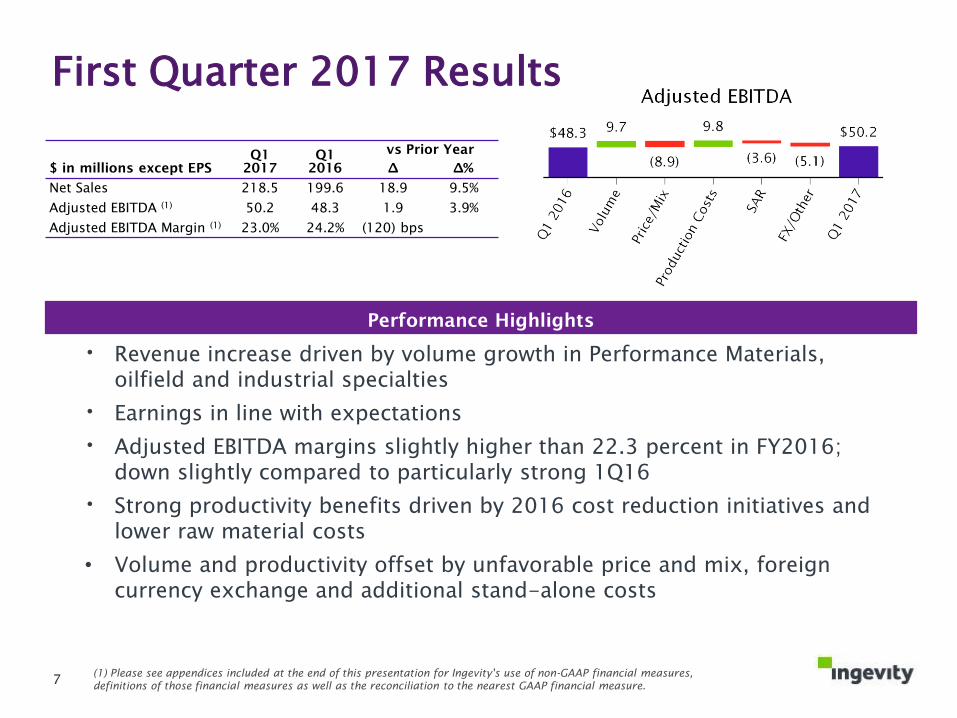
First Quarter 2017 Results
• Revenue increase driven by volume growth in Performance Materials, oilfield and industrial specialties
• Earnings in line with expectations
• Adjusted EBITDA margins slightly higher than 22.3 percent in FY2016; down slightly compared to particularly strong 1Q16
• Strong productivity benefits driven by 2016 cost reduction initiatives and lower raw material costs
• Volume and productivity offset by unfavorable price and mix, foreign currency exchange and additional stand-alone costs
Performance Highlights
(1) Please see appendices included at the end of this presentation for Ingevity's use of non-GAAP financial measures,
definitions of those financial measures as well as the reconciliation to the nearest GAAP financial measure.
$ in millions except EPS
Q1
2017
Q1
2016
vs Prior Year
∆ ∆%
Net Sales 218.5 199.6 18.9 9.5%
Adjusted EBITDA (1)
50.2 48.3 1.9 3.9%
Adjusted EBITDA Margin (1)
23.0% 24.2% (120) bps
7
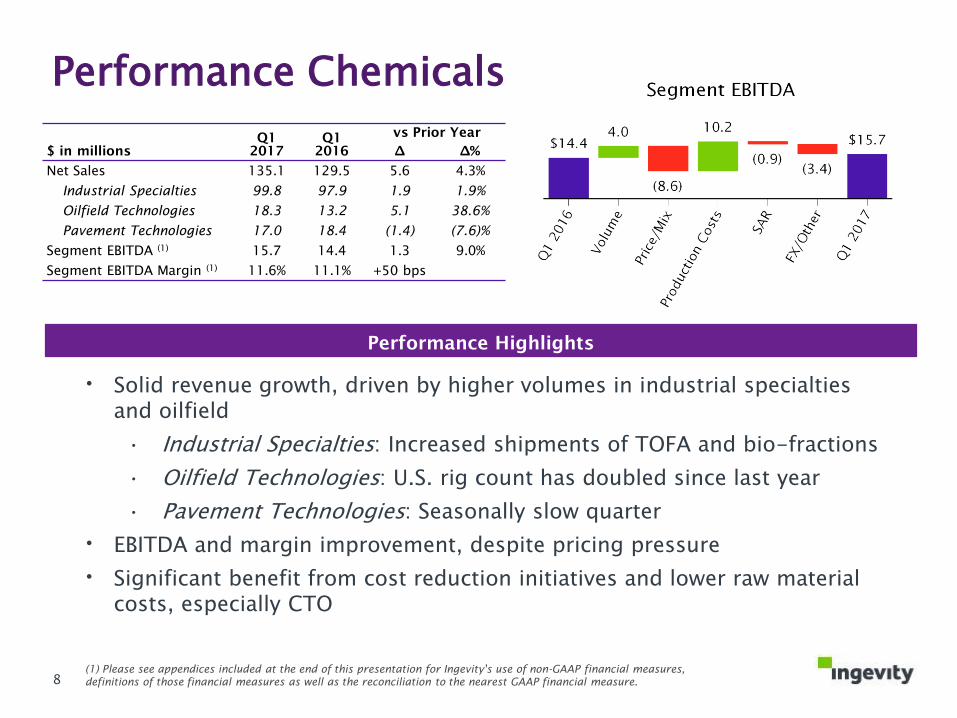
Performance Chemicals
• Solid revenue growth, driven by higher volumes in industrial specialties and oilfield
• Industrial Specialties: Increased shipments of TOFA and bio-fractions
• Oilfield Technologies: U.S. rig count has doubled since last year
• Pavement Technologies: Seasonally slow quarter
• EBITDA and margin improvement, despite pricing pressure
• Significant benefit from cost reduction initiatives and lower raw material costs, especially CTO
Performance Highlights
(1) Please see appendices included at the end of this presentation for Ingevity's use of non-GAAP financial measures,
definitions of those financial measures as well as the reconciliation to the nearest GAAP financial measure.
$ in millions
Q1
2017
Q1
2016
vs Prior Year
∆ ∆%
Net Sales 135.1 129.5 5.6 4.3%
Industrial Specialties 99.8 97.9 1.9 1.9%
Oilfield Technologies 18.3 13.2 5.1 38.6%
Pavement Technologies 17.0 18.4 (1.4) (7.6)%
Segment EBITDA (1)
15.7 14.4 1.3 9.0%
Segment EBITDA Margin (1)
11.6% 11.1% +50 bps
8
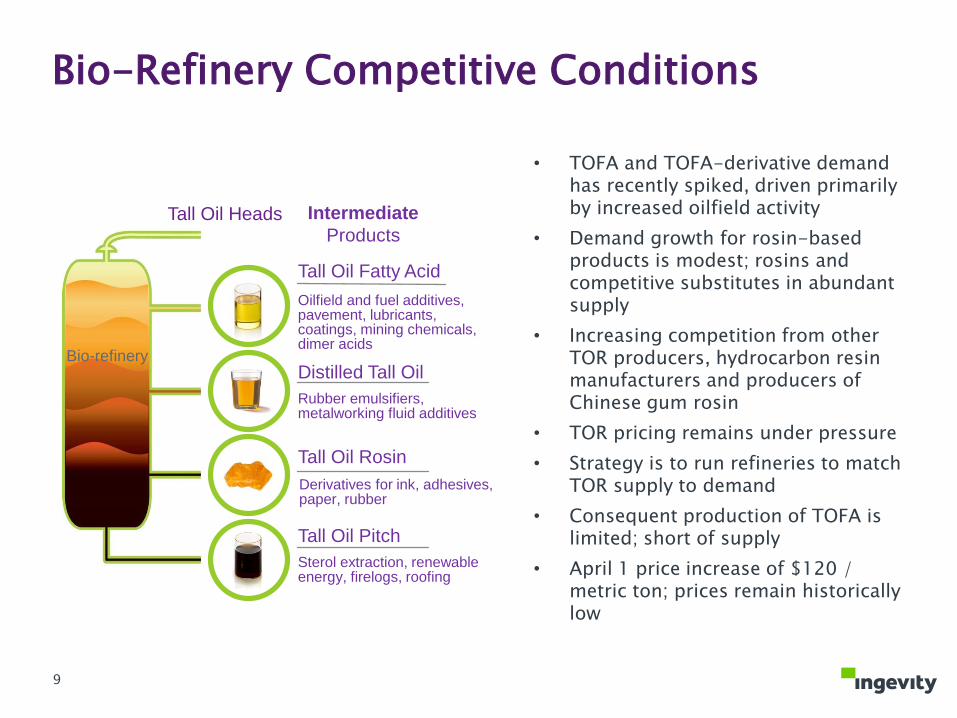
Sterol extraction, renewable energy, firelogs, roofing
Tall Oil Fatty Acid
Distilled Tall Oil
Tall Oil Rosin
Tall Oil Pitch
Tall Oil Heads
Bio-refinery
Rubber emulsifiers, metalworking fluid additives
Oilfield and fuel additives,pavement, lubricants, coatings, mining chemicals, dimer acids
Intermediate
Products
Bio-Refinery Competitive Conditions
Derivatives for ink, adhesives, paper, rubber
• TOFA and TOFA-derivative demand has recently spiked, driven primarily by increased oilfield activity
• Demand growth for rosin-based products is modest; rosins and competitive substitutes in abundant supply
• Increasing competition from other TOR producers, hydrocarbon resin manufacturers and producers of Chinese gum rosin
• TOR pricing remains under pressure
• Strategy is to run refineries to match TOR supply to demand
• Consequent production of TOFA is limited; short of supply
• April 1 price increase of $120 / metric ton; prices remain historically low
9
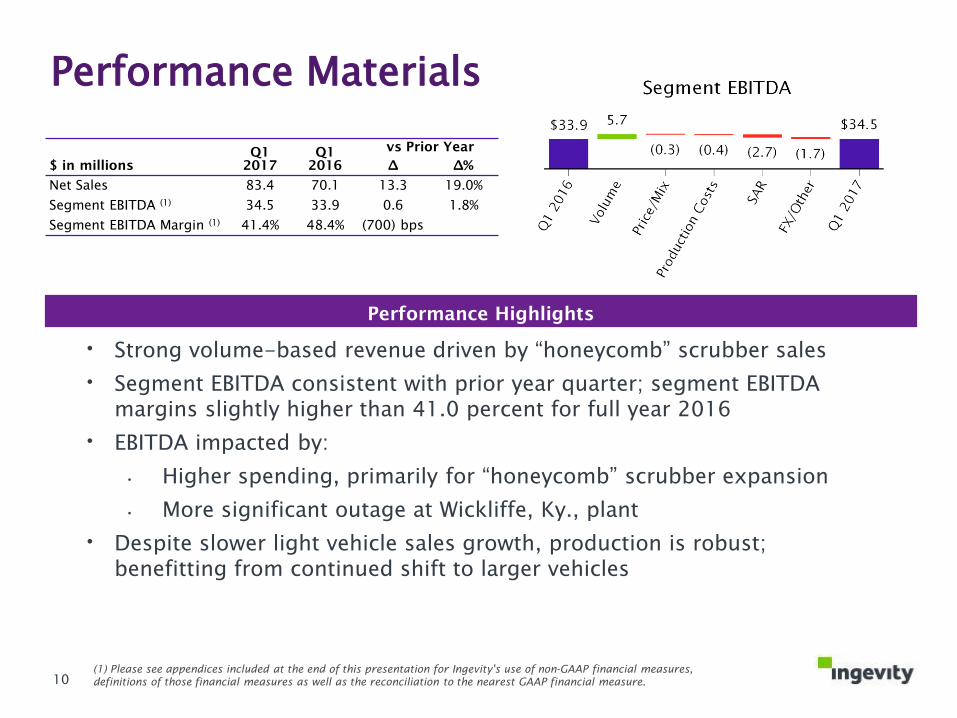
Performance Materials
• Strong volume-based revenue driven by “honeycomb” scrubber sales
• Segment EBITDA consistent with prior year quarter; segment EBITDA margins slightly higher than 41.0 percent for full year 2016
• EBITDA impacted by:
• Higher spending, primarily for “honeycomb” scrubber expansion
• More significant outage at Wickliffe, Ky., plant
• Despite slower light vehicle sales growth, production is robust; benefitting from continued shift to larger vehicles
Performance Highlights
(1) Please see appendices included at the end of this presentation for Ingevity's use of non-GAAP financial measures,
definitions of those financial measures as well as the reconciliation to the nearest GAAP financial measure.
$ in millions
Q1
2017
Q1
2016
vs Prior Year
∆ ∆%
Net Sales 83.4 70.1 13.3 19.0%
Segment EBITDA (1)
34.5 33.9 0.6 1.8%
Segment EBITDA Margin (1)
41.4% 48.4% (700) bps
10
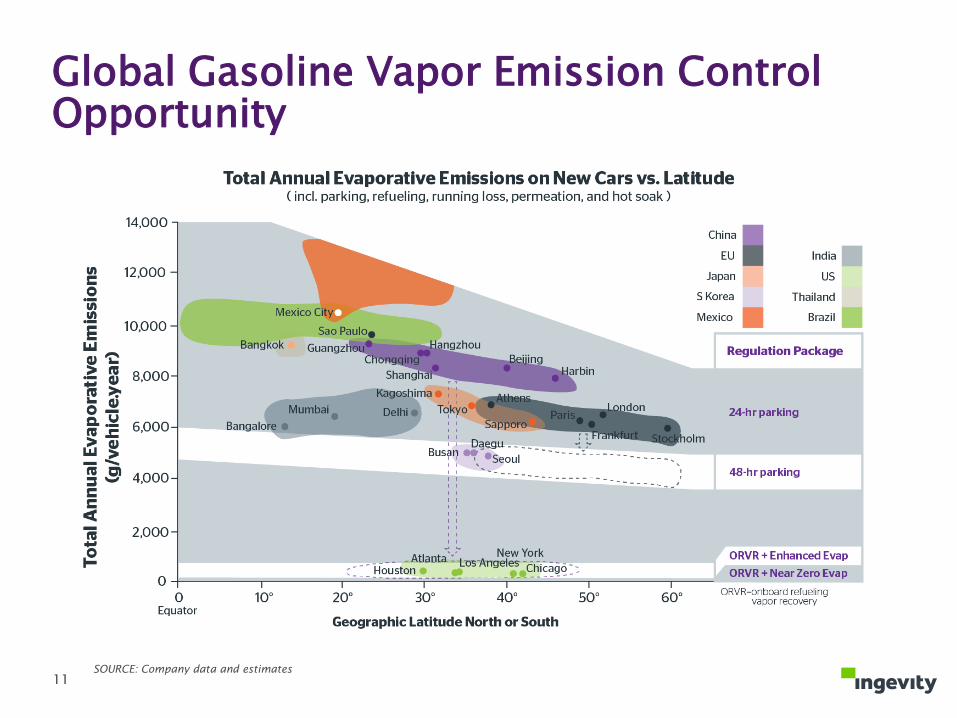
Global Gasoline Vapor Emission Control Opportunity
SOURCE: Company data and estimates
11
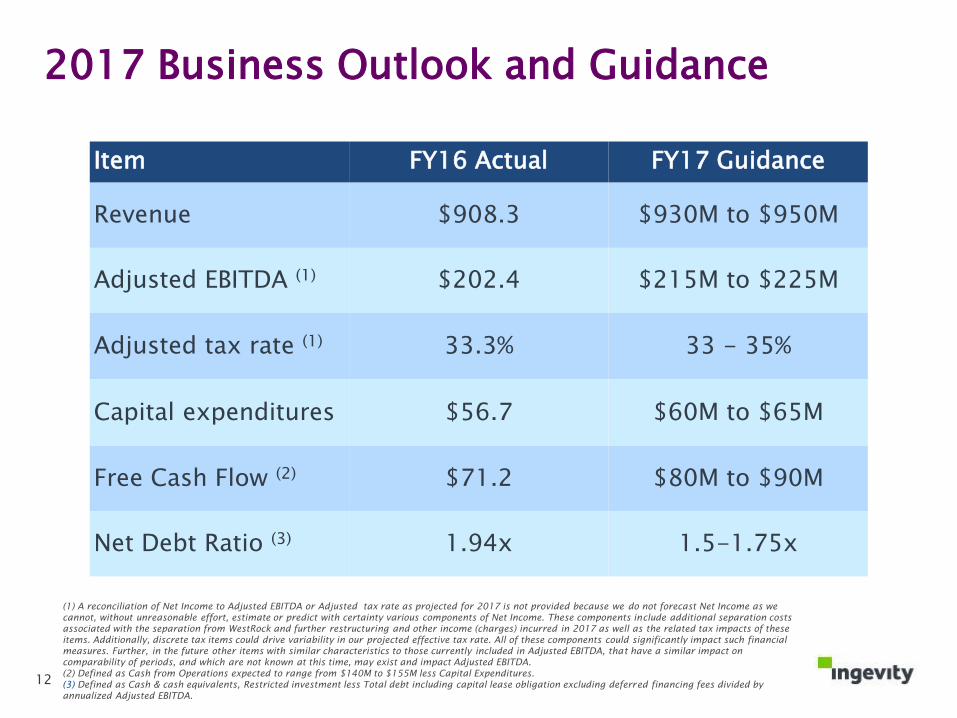
2017 Business Outlook and Guidance
Item FY16 Actual FY17 Guidance
Revenue $908.3 $930M to $950M
Adjusted EBITDA (1) $202.4 $215M to $225M
Adjusted tax rate (1) 33.3% 33 - 35%
Capital expenditures $56.7 $60M to $65M
Free Cash Flow (2) $71.2 $80M to $90M
Net Debt Ratio (3) 1.94x 1.5-1.75x
(1) A reconciliation of Net Income to Adjusted EBITDA or Adjusted tax rate as projected for 2017 is not provided because we do not forecast Net Income as we
cannot, without unreasonable effort, estimate or predict with certainty various components of Net Income. These components include additional separation costs
associated with the separation from WestRock and further restructuring and other income (charges) incurred in 2017 as well as the related tax impacts of these
items. Additionally, discrete tax items could drive variability in our projected effective tax rate. All of these components could significantly impact such financial
measures. Further, in the future other items with similar characteristics to those currently included in Adjusted EBITDA, that have a similar impact on
comparability of periods, and which are not known at this time, may exist and impact Adjusted EBITDA.
(2) Defined as Cash from Operations expected to range from $140M to $155M less Capital Expenditures.
(3) Defined as Cash & cash equivalents, Restricted investment less Total debt including capital lease obligation excluding deferred financing fees divided by
annualized Adjusted EBITDA.
12
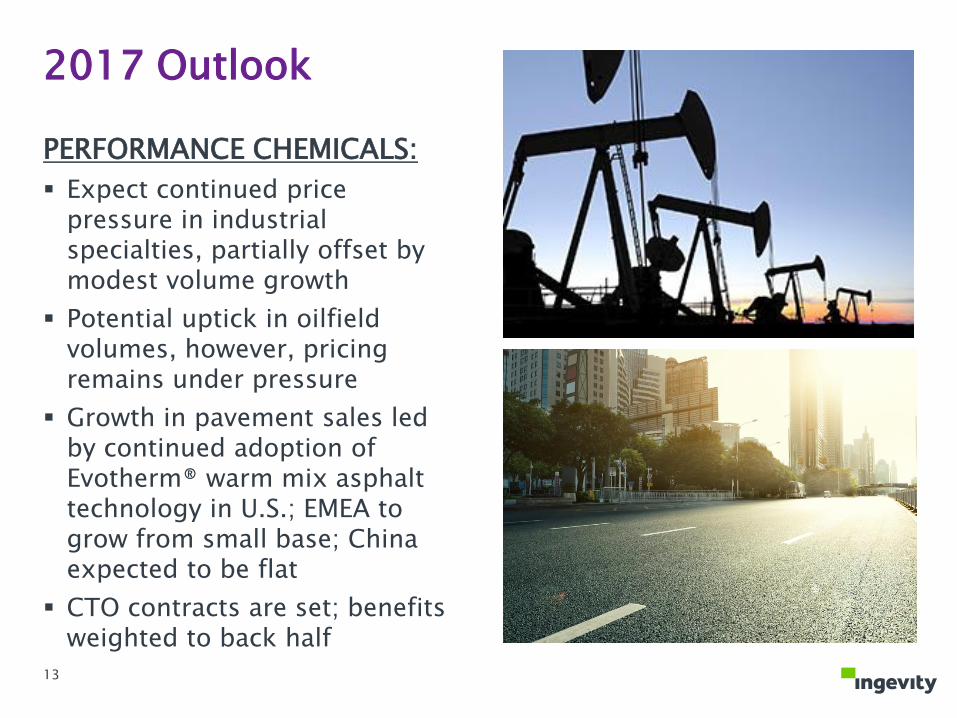
2017 Outlook
PERFORMANCE CHEMICALS:
Expect continued price pressure in industrial specialties, partially offset by modest volume growth
Potential uptick in oilfield volumes, however, pricing remains under pressure
Growth in pavement sales led by continued adoption of Evotherm® warm mix asphalt technology in U.S.; EMEA to grow from small base; China expected to be flat
CTO contracts are set; benefits weighted to back half
13
Performance Materials
14
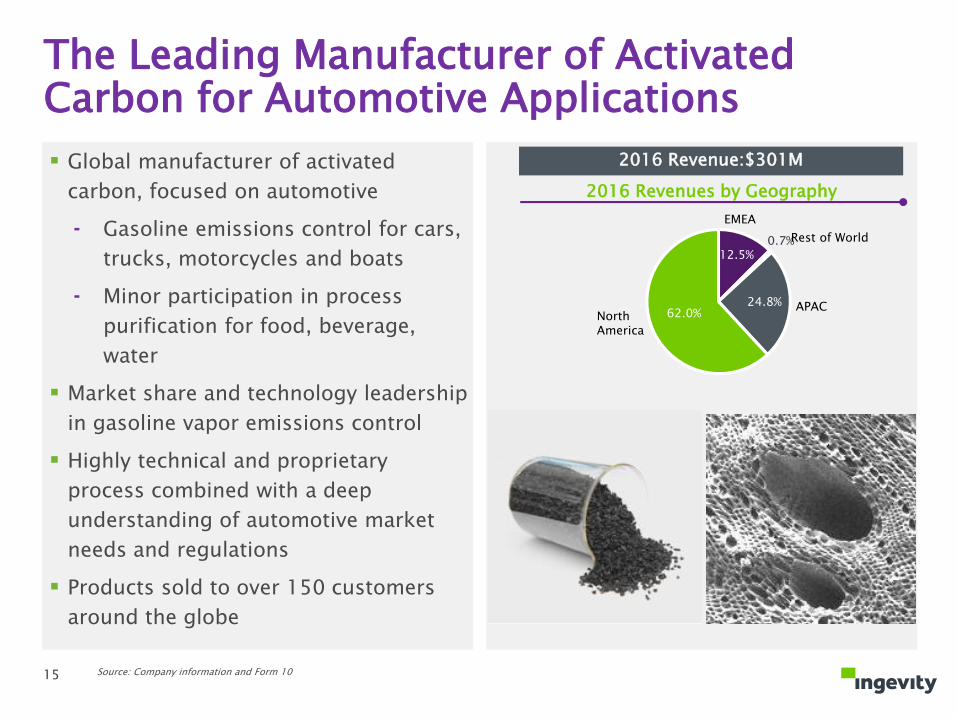
Global manufacturer of activated
carbon, focused on automotive
⁃ Gasoline emissions control for cars,
trucks, motorcycles and boats
⁃ Minor participation in process
purification for food, beverage,
water
Market share and technology leadership
in gasoline vapor emissions control
Highly technical and proprietary
process combined with a deep
understanding of automotive market
needs and regulations
Products sold to over 150 customers
around the globe
The Leading Manufacturer of Activated Carbon for Automotive Applications
12.5%0.7%
24.8%62.0%
2016 Revenue:$301M
2016 Revenues by Geography
North America
EMEA
Rest of World
APAC
Source: Company information and Form 1015
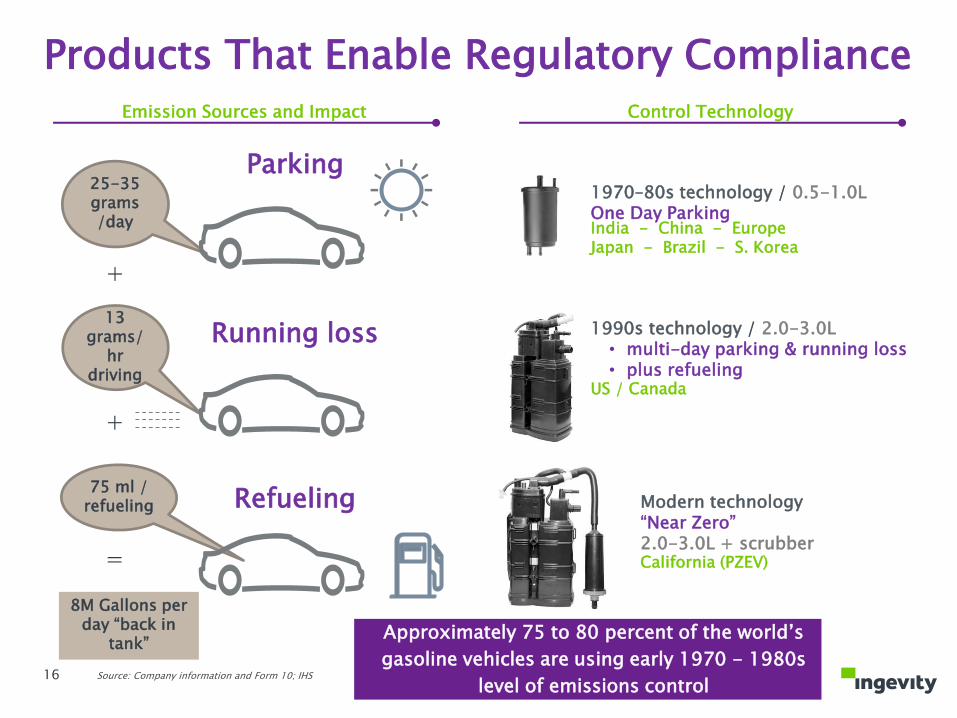
25-35 grams/day
1970–80s technology / 0.5-1.0LOne Day Parking
1990s technology / 2.0-3.0L• multi-day parking & running loss• plus refueling
Modern technology“Near Zero”2.0-3.0L + scrubber
India - China - Europe Japan - Brazil - S. Korea
US / Canada
California (PZEV)
Control TechnologyEmission Sources and Impact
Products That Enable Regulatory Compliance
Approximately 75 to 80 percent of the world’s
gasoline vehicles are using early 1970 - 1980s
level of emissions control
Parking
13 grams/
hrdriving
Running loss
75 ml / refueling Refueling
Source: Company information and Form 10; IHS
+
+
=
16
8M Gallons per day “back in
tank”
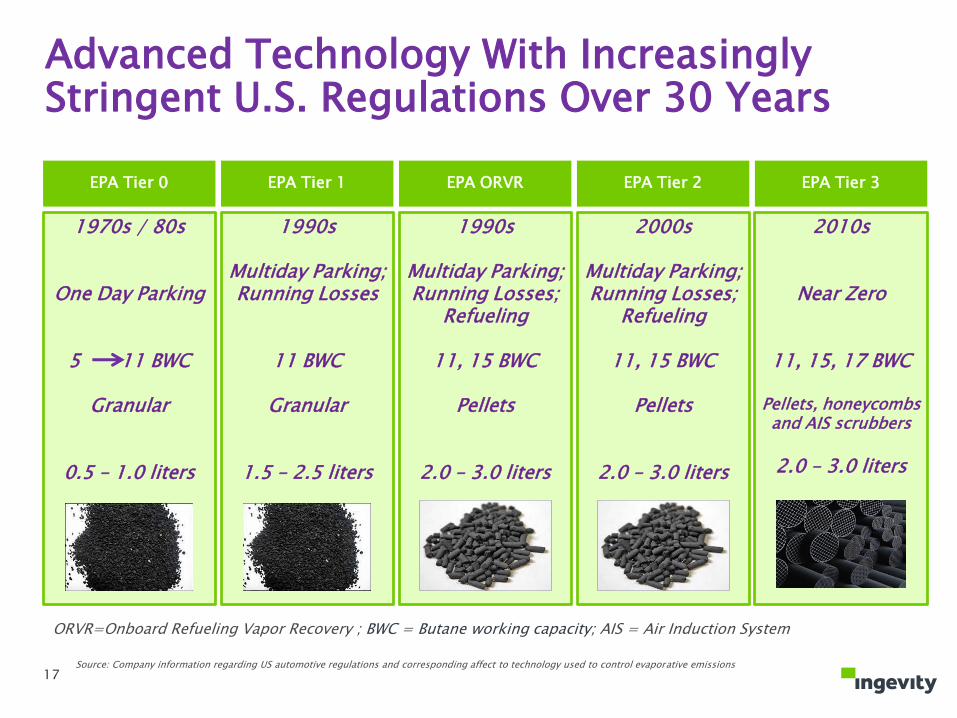
Advanced Technology With Increasingly Stringent U.S. Regulations Over 30 Years
Source: Company information regarding US automotive regulations and corresponding affect to technology used to control evaporative emissions
ORVR=Onboard Refueling Vapor Recovery ; BWC = Butane working capacity; AIS = Air Induction System
17
EPA Tier 0 EPA Tier 1 EPA ORVR EPA Tier 2 EPA Tier 3
1970s / 80s
One Day Parking
5 11 BWC
Granular
0.5 – 1.0 liters
1990s
Multiday Parking; Running Losses
11 BWC
Granular
1.5 – 2.5 liters
1990s
Multiday Parking; Running Losses;
Refueling
11, 15 BWC
Pellets
2.0 – 3.0 liters
2000s
Multiday Parking; Running Losses;
Refueling
11, 15 BWC
Pellets
2.0 – 3.0 liters
2010s
Near Zero
11, 15, 17 BWC
Pellets, honeycombs and AIS scrubbers
2.0 – 3.0 liters
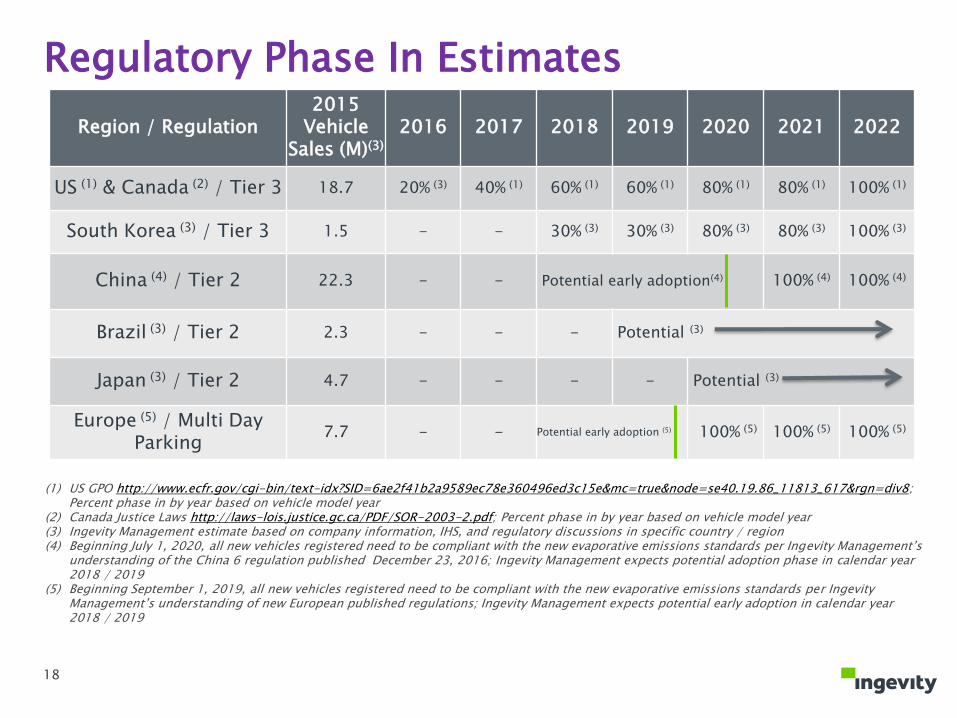
Regulatory Phase In Estimates
Region / Regulation2015
Vehicle Sales (M)(3)
2016 2017 2018 2019 2020 2021 2022
US (1) & Canada (2) / Tier 3 18.7 20% (3) 40% (1) 60% (1) 60% (1) 80% (1) 80% (1) 100% (1)
South Korea (3) / Tier 3 1.5 - - 30% (3) 30% (3) 80% (3) 80% (3) 100% (3)
China (4) / Tier 2 22.3 - - Potential early adoption(4) 100% (4) 100% (4)
Brazil (3) / Tier 2 2.3 - - - Potential (3)
Japan (3) / Tier 2 4.7 - - - - Potential (3)
Europe (5) / Multi Day Parking
7.7 - - Potential early adoption (5) 100% (5) 100% (5) 100% (5)
(1) US GPO http://www.ecfr.gov/cgi-bin/text-idx?SID=6ae2f41b2a9589ec78e360496ed3c15e&mc=true&node=se40.19.86_11813_617&rgn=div8; Percent phase in by year based on vehicle model year
(2) Canada Justice Laws http://laws-lois.justice.gc.ca/PDF/SOR-2003-2.pdf; Percent phase in by year based on vehicle model year(3) Ingevity Management estimate based on company information, IHS, and regulatory discussions in specific country / region(4) Beginning July 1, 2020, all new vehicles registered need to be compliant with the new evaporative emissions standards per Ingevity Management’s
understanding of the China 6 regulation published December 23, 2016; Ingevity Management expects potential adoption phase in calendar year 2018 / 2019
(5) Beginning September 1, 2019, all new vehicles registered need to be compliant with the new evaporative emissions standards per Ingevity Management’s understanding of new European published regulations; Ingevity Management expects potential early adoption in calendar year 2018 / 2019
18
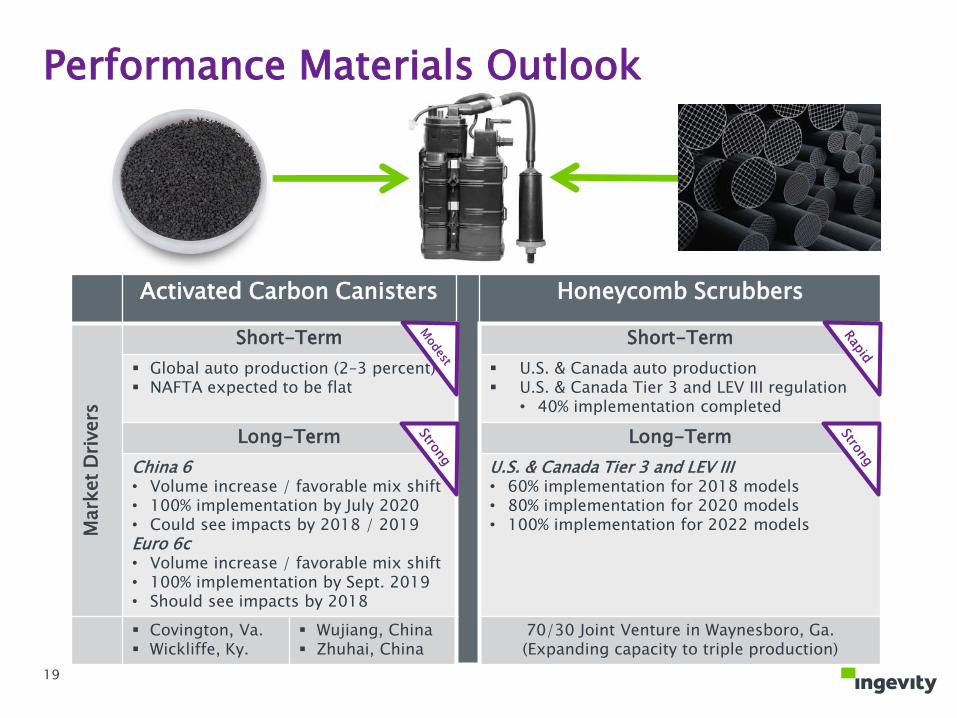
Performance Materials Outlook
Activated Carbon Canisters Honeycomb Scrubbers
Mark
et
Dri
vers
Short-Term Short-Term
Global auto production (2–3 percent) NAFTA expected to be flat
U.S. & Canada auto production U.S. & Canada Tier 3 and LEV III regulation
• 40% implementation completed
Long-Term Long-Term
China 6• Volume increase / favorable mix shift• 100% implementation by July 2020• Could see impacts by 2018 / 2019Euro 6c• Volume increase / favorable mix shift• 100% implementation by Sept. 2019• Should see impacts by 2018
U.S. & Canada Tier 3 and LEV III• 60% implementation for 2018 models• 80% implementation for 2020 models• 100% implementation for 2022 models
Covington, Va. Wickliffe, Ky.
Wujiang, China Zhuhai, China
70/30 Joint Venture in Waynesboro, Ga.(Expanding capacity to triple production)
19
Performance Chemicals
20
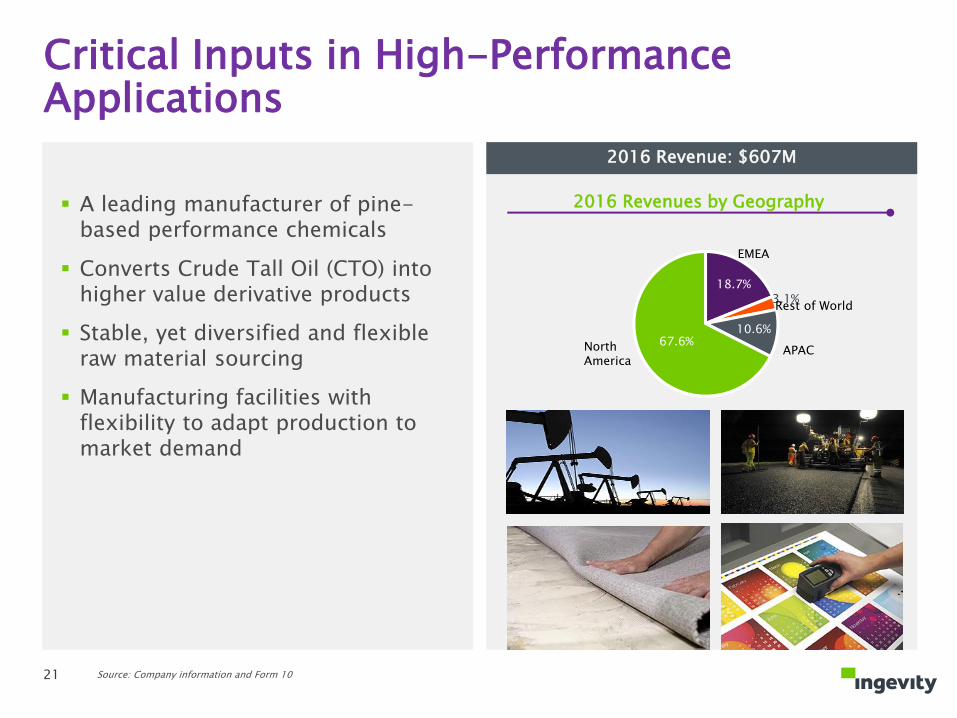
18.7%3.1%
10.6%67.6%
2016 Revenue: $607M
2016 Revenues by Geography
Critical Inputs in High-Performance Applications
North America
EMEA
Rest of World
APAC
A leading manufacturer of pine-based performance chemicals
Converts Crude Tall Oil (CTO) into higher value derivative products
Stable, yet diversified and flexible raw material sourcing
Manufacturing facilities with flexibility to adapt production to market demand
Source: Company information and Form 1021
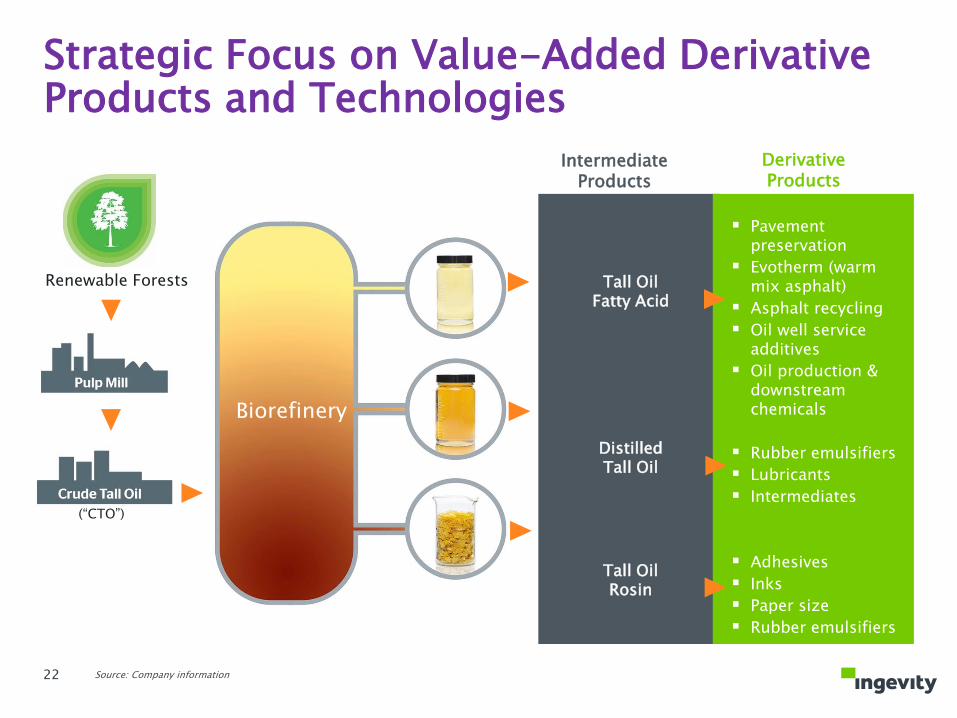
Biorefinery
DerivativeProducts
Pavement preservation
Evotherm (warm mix asphalt)
Asphalt recycling
Oil well service additives
Oil production & downstream chemicals
Rubber emulsifiers
Lubricants
Intermediates
Adhesives
Inks
Paper size
Rubber emulsifiers
Renewable Forests Tall Oil Fatty Acid
IntermediateProducts
Distilled Tall Oil
Tall Oil Rosin
(“CTO”)
Strategic Focus on Value-Added Derivative Products and Technologies
Source: Company information22
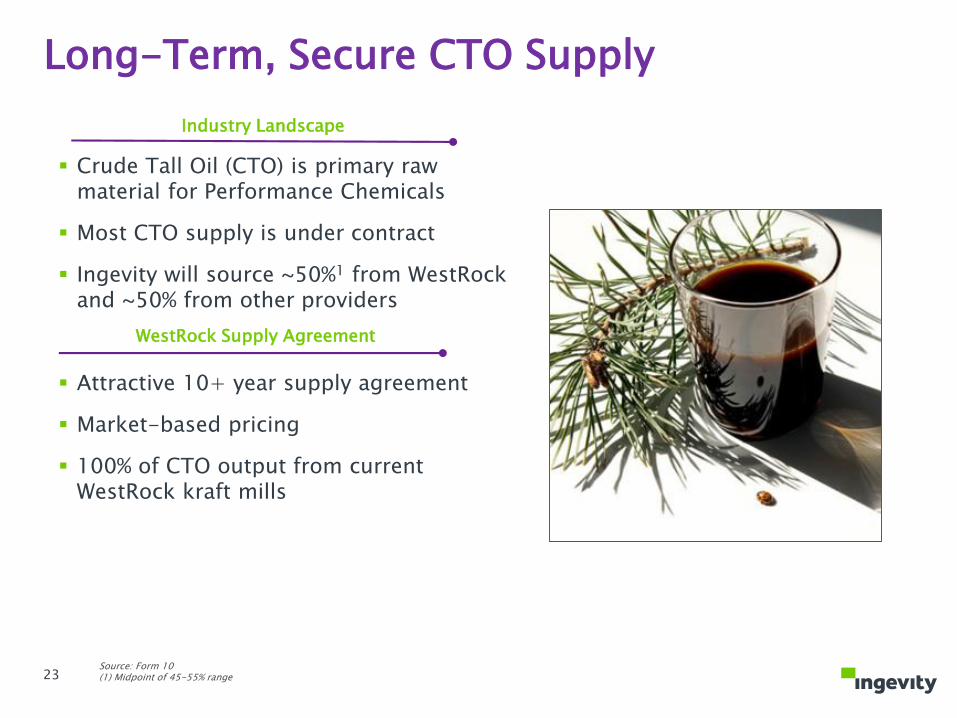
Source: Form 10(1) Midpoint of 45-55% range
Crude Tall Oil (CTO) is primary raw material for Performance Chemicals
Most CTO supply is under contract
Ingevity will source ~50%1 from WestRock and ~50% from other providers
Attractive 10+ year supply agreement
Market-based pricing
100% of CTO output from current WestRock kraft mills
Industry Landscape
WestRock Supply Agreement
Long-Term, Secure CTO Supply
23
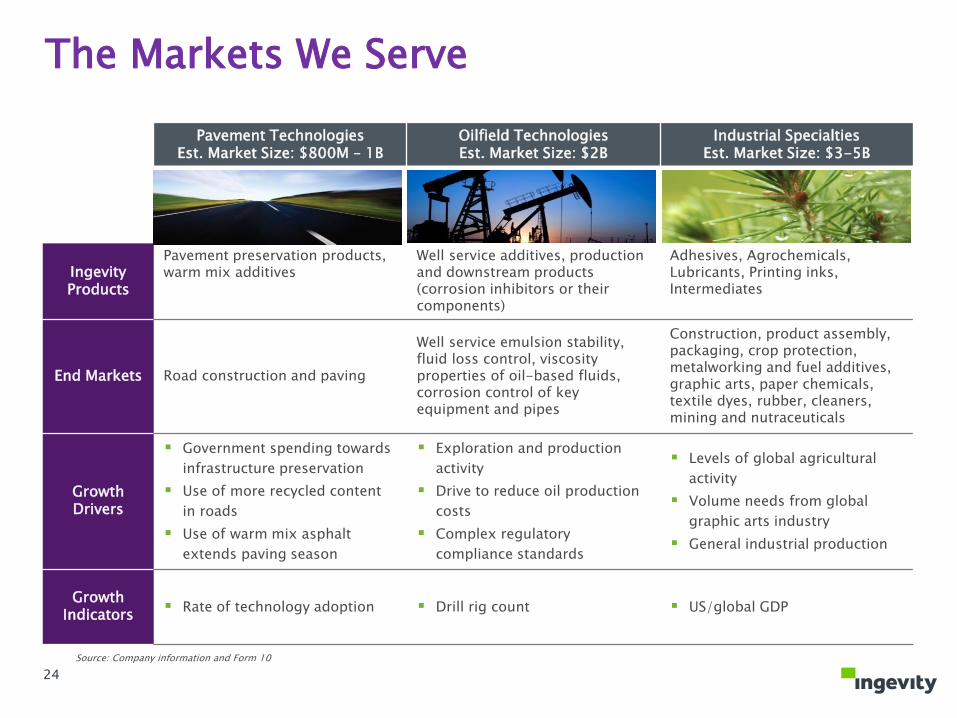
The Markets We Serve
Pavement TechnologiesEst. Market Size: $800M – 1B
Oilfield TechnologiesEst. Market Size: $2B
Industrial SpecialtiesEst. Market Size: $3-5B
Ingevity Products
Pavement preservation products,warm mix additives
Well service additives, production and downstream products (corrosion inhibitors or their components)
Adhesives, Agrochemicals,Lubricants, Printing inks, Intermediates
End Markets Road construction and paving
Well service emulsion stability, fluid loss control, viscosity properties of oil-based fluids, corrosion control of key equipment and pipes
Construction, product assembly, packaging, crop protection, metalworking and fuel additives, graphic arts, paper chemicals, textile dyes, rubber, cleaners, mining and nutraceuticals
Growth Drivers
Government spending towards
infrastructure preservation
Use of more recycled content
in roads
Use of warm mix asphalt
extends paving season
Exploration and production
activity
Drive to reduce oil production
costs
Complex regulatory
compliance standards
Levels of global agricultural
activity
Volume needs from global
graphic arts industry
General industrial production
Growth Indicators
Rate of technology adoption Drill rig count US/global GDP
Source: Company information and Form 10
24
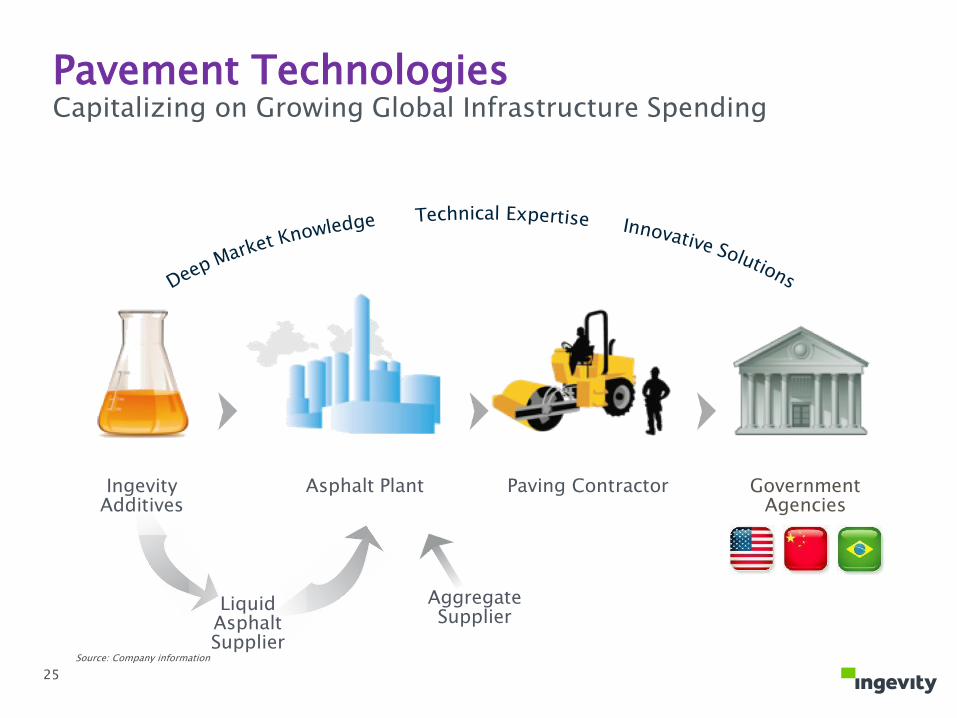
Aggregate
SupplierLiquid
Asphalt
Supplier
Asphalt Plant Paving Contractor Government
Agencies
Ingevity
Additives
Pavement TechnologiesCapitalizing on Growing Global Infrastructure Spending
25
Source: Company information

Appendix
26
Non-GAAP Financial MeasuresIngevity has presented certain financial measures, defined below, which have not been prepared in accordance with U.S. generally accepted accounting principles (“GAAP”) and has provided a reconciliation to the most directly comparable financial measure calculated in accordance with GAAP. These financial measures are not meant to be considered in isolation or as a substitute for the most directly comparable financial measure calculated in accordance with GAAP. The company believes these non-GAAP measures provide investors, potential investors, securities analysts and others with useful information to evaluate the performance of the business, because such measures, when viewed together with our financial results computed in accordance with GAAP, provide a more complete understanding of the factors and trends affecting our historical financial performance and projected future results.
Ingevity uses the following non-GAAP measures:
Adjusted earnings (loss) is defined as net income (loss) attributable to Ingevity stockholders plus restructuring and other (income) charges, separation costs, and the income tax expense (benefit) on those items.
Diluted adjusted earnings (loss) per share is defined as diluted earnings (loss) per common share attributable to Ingevity stockholders plus restructuring and other (income) charges per share, separation costs per share, and the income tax expense (benefit) per share on those items.
Adjusted EBITDA is defined as net income (loss) plus provision for income taxes, interest expense, depreciation and amortization, separation costs and restructuring and other (income) charges.
Adjusted EBITDA Margin is defined as Adjusted EBITDA divided by Net Sales
Segment EBITDA is defined as segment operating profit plus depreciation and amortization.
Segment EBITDA Margin is defined as Segment EBITDA divided by Net Sales.
The Company also uses the above financial measures as the primary measures of profitability used by managers of the business and its segments. In addition, the Company believes Adjusted EBITDA, Adjusted EBITDA Margin, Segment EBITDA and Segment EBITDA Margin are useful measures because they exclude the effects of financing and investment activities as well as non-operating activities. These non-GAAP financial measures are not intended to replace the presentation of financial results in accordance with GAAP and investors should consider the limitations associated with these non-GAAP measures, including the potential lack of comparability of these measures from one company to another. Reconciliations of these non-GAAP financial measures are set forth within the following pages.27
28
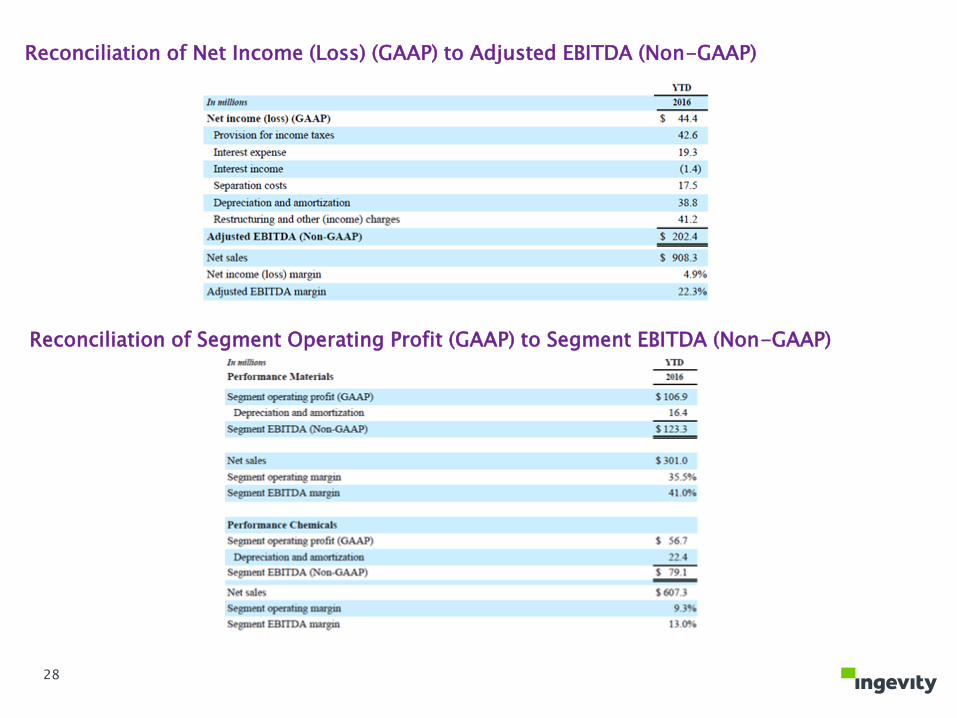
Reconciliation of Net Income (Loss) (GAAP) to Adjusted EBITDA (Non-GAAP)
Reconciliation of Segment Operating Profit (GAAP) to Segment EBITDA (Non-GAAP)
Three Months EndedMarch 31,
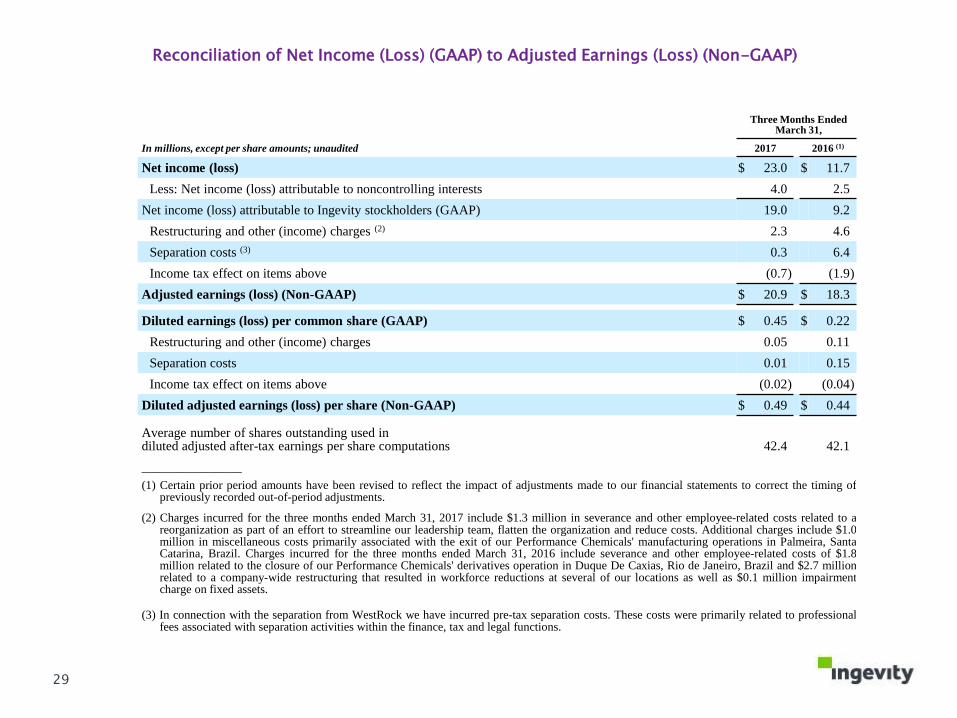
In millions, except per share amounts; unaudited 2017 2016 (1)
Net income (loss) $ 23.0 $ 11.7
Less: Net income (loss) attributable to noncontrolling interests 4.0 2.5
Net income (loss) attributable to Ingevity stockholders (GAAP) 19.0 9.2
Restructuring and other (income) charges (2) 2.3 4.6
Separation costs (3) 0.3 6.4
Income tax effect on items above (0.7) (1.9)
Adjusted earnings (loss) (Non-GAAP) $ 20.9 $ 18.3
Diluted earnings (loss) per common share (GAAP) $ 0.45 $ 0.22
Restructuring and other (income) charges 0.05 0.11
Separation costs 0.01 0.15
Income tax effect on items above (0.02) (0.04)
Diluted adjusted earnings (loss) per share (Non-GAAP) $ 0.49 $ 0.44
Average number of shares outstanding used in diluted adjusted after-tax earnings per share computations 42.4 42.1
_______________
(1) Certain prior period amounts have been revised to reflect the impact of adjustments made to our financial statements to correct the timing ofpreviously recorded out-of-period adjustments.
(2) Charges incurred for the three months ended March 31, 2017 include $1.3 million in severance and other employee-related costs related to areorganization as part of an effort to streamline our leadership team, flatten the organization and reduce costs. Additional charges include $1.0million in miscellaneous costs primarily associated with the exit of our Performance Chemicals' manufacturing operations in Palmeira, SantaCatarina, Brazil. Charges incurred for the three months ended March 31, 2016 include severance and other employee-related costs of $1.8million related to the closure of our Performance Chemicals' derivatives operation in Duque De Caxias, Rio de Janeiro, Brazil and $2.7 millionrelated to a company-wide restructuring that resulted in workforce reductions at several of our locations as well as $0.1 million impairmentcharge on fixed assets.
(3) In connection with the separation from WestRock we have incurred pre-tax separation costs. These costs were primarily related to professionalfees associated with separation activities within the finance, tax and legal functions.
Reconciliation of Net Income (Loss) (GAAP) to Adjusted Earnings (Loss) (Non-GAAP)
29
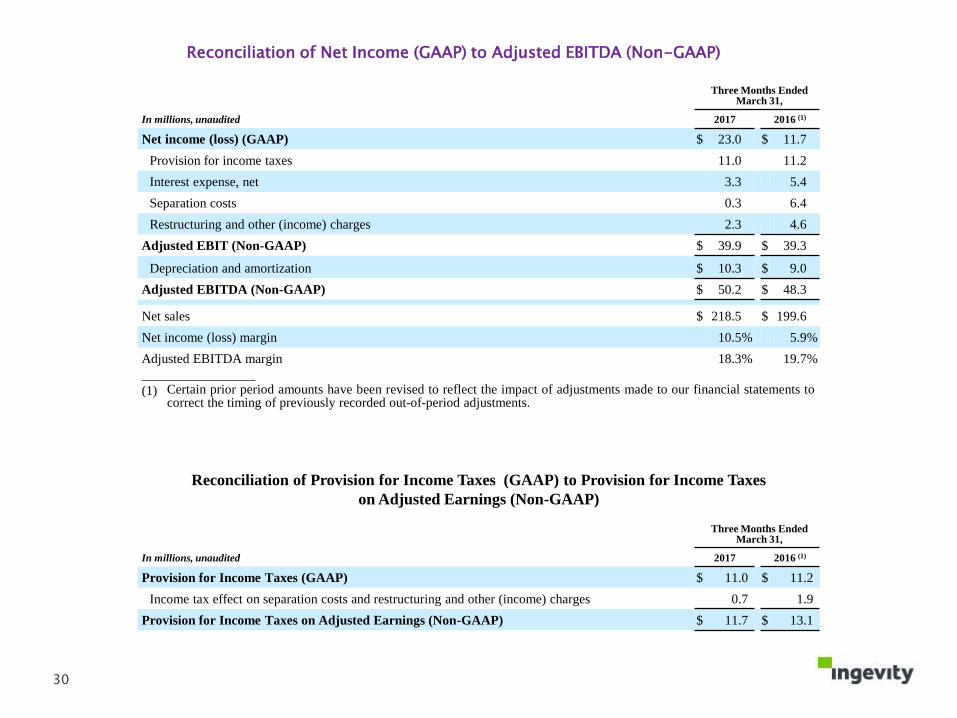
Three Months EndedMarch 31,
In millions, unaudited 2017 2016 (1)
Net income (loss) (GAAP) $ 23.0 $ 11.7
Provision for income taxes 11.0 11.2
Interest expense, net 3.3 5.4
Separation costs 0.3 6.4
Restructuring and other (income) charges 2.3 4.6
Adjusted EBIT (Non-GAAP) $ 39.9 $ 39.3
Depreciation and amortization $ 10.3 $ 9.0
Adjusted EBITDA (Non-GAAP) $ 50.2 $ 48.3
Net sales $ 218.5 $ 199.6
Net income (loss) margin 10.5% 5.9%
Adjusted EBITDA margin 18.3% 19.7%
_________________
(1) Certain prior period amounts have been revised to reflect the impact of adjustments made to our financial statements tocorrect the timing of previously recorded out-of-period adjustments.
Reconciliation of Net Income (GAAP) to Adjusted EBITDA (Non-GAAP)
Reconciliation of Provision for Income Taxes (GAAP) to Provision for Income Taxes
on Adjusted Earnings (Non-GAAP)
Three Months EndedMarch 31,
In millions, unaudited 2017 2016 (1)
Provision for Income Taxes (GAAP) $ 11.0 $ 11.2
Income tax effect on separation costs and restructuring and other (income) charges 0.7 1.9
Provision for Income Taxes on Adjusted Earnings (Non-GAAP) $ 11.7 $ 13.1
30
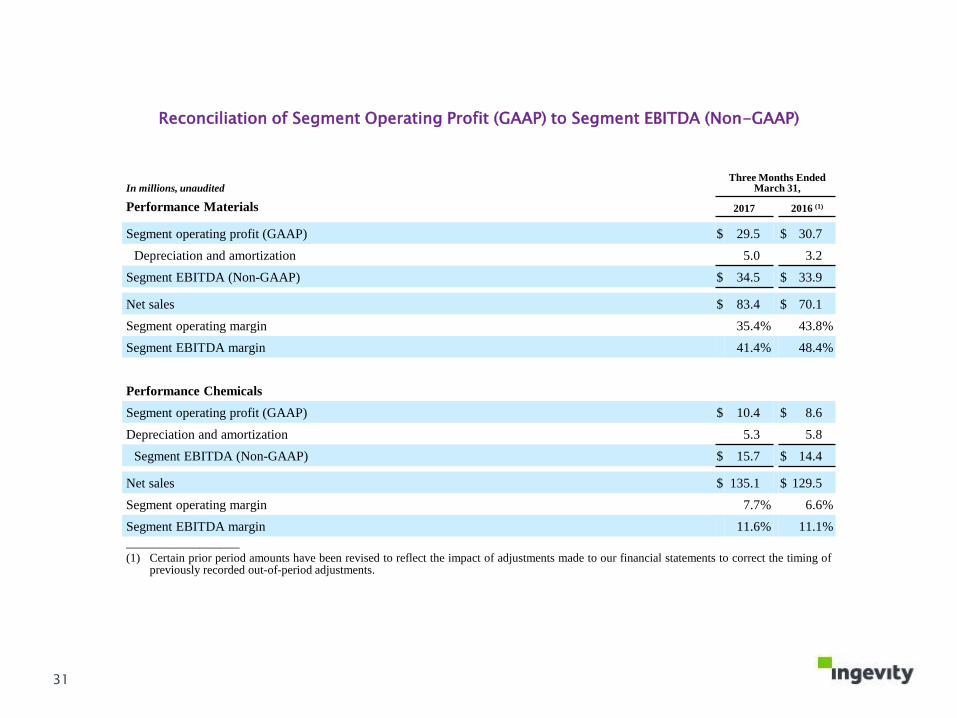
In millions, unauditedThree Months Ended
March 31,
Performance Materials 2017 2016 (1)
Segment operating profit (GAAP) $ 29.5 $ 30.7
Depreciation and amortization 5.0 3.2
Segment EBITDA (Non-GAAP) $ 34.5 $ 33.9
Net sales $ 83.4 $ 70.1
Segment operating margin 35.4% 43.8%
Segment EBITDA margin 41.4% 48.4%
Performance Chemicals
Segment operating profit (GAAP) $ 10.4 $ 8.6
Depreciation and amortization 5.3 5.8
Segment EBITDA (Non-GAAP) $ 15.7 $ 14.4
Net sales $ 135.1 $ 129.5
Segment operating margin 7.7% 6.6%
Segment EBITDA margin 11.6% 11.1%
_________________(1) Certain prior period amounts have been revised to reflect the impact of adjustments made to our financial statements to correct the timing of
previously recorded out-of-period adjustments.
Reconciliation of Segment Operating Profit (GAAP) to Segment EBITDA (Non-GAAP)
31