Embed Size (px)
Citation preview
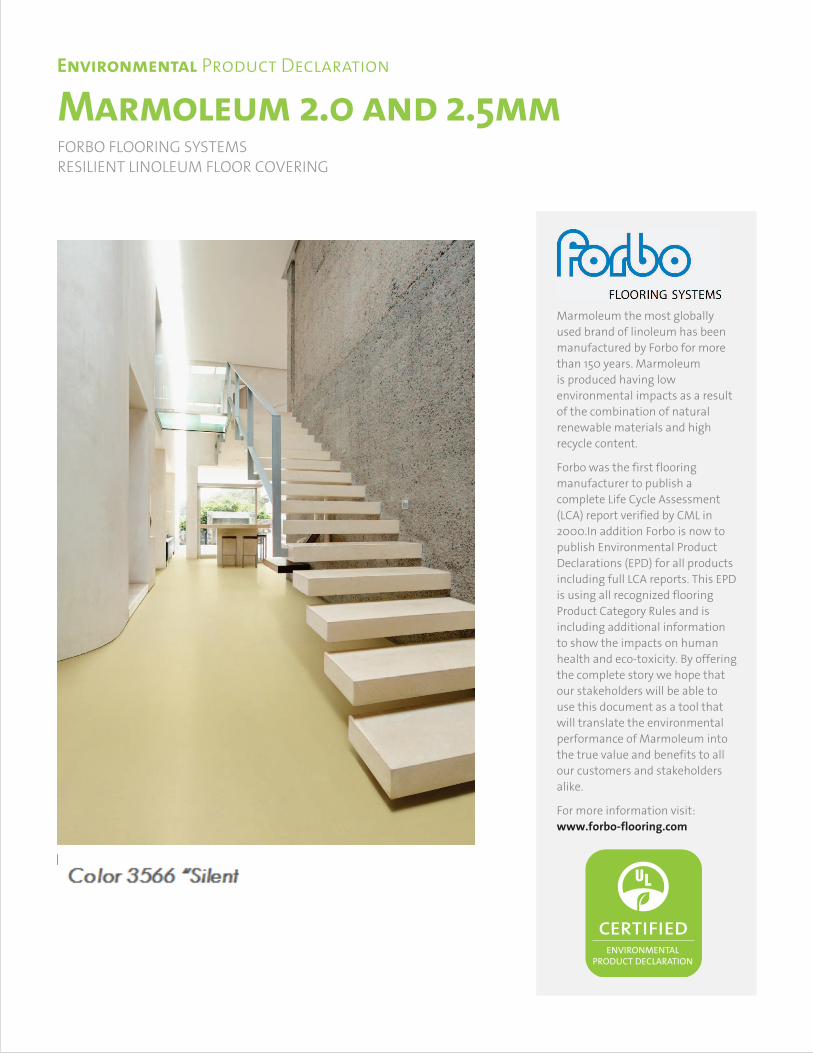
MARMOLEUM 2.0 AND 2.5MMENVIRONMENTAL PRODUCT DECLARATION
Marmoleum the most globally
used brand of linoleum has been
manufactured by Forbo for more
than 150 years. Marmoleum
is produced having low
environmental impacts as a result
of the combination of natural
renewable materials and high
recycle content.
Forbo was the first flooring
manufacturer to publish a
complete Life Cycle Assessment
(LCA) report verified by CML in
2000.In addition Forbo is now to
publish Environmental Product
Declarations (EPD) for all products
including full LCA reports. This EPD
is using all recognized flooring
Product Category Rules and is
including additional information
to show the impacts on human
health and eco-toxicity. By offering
the complete story we hope that
our stakeholders will be able to
use this document as a tool that
will translate the environmental
performance of Marmoleum into
the true value and benefits to all
our customers and stakeholders
alike.
For more information visit:
www.forbo-flooring.com
FORBO FLOORING SYSTEMSRESILIENT LINOLEUM FLOOR COVERING
Marmoleum 2.0 and 2.5 mm Resilient Linoleum Floor Covering
According to ISO 14025 & EN 15804
Page 1 of 3
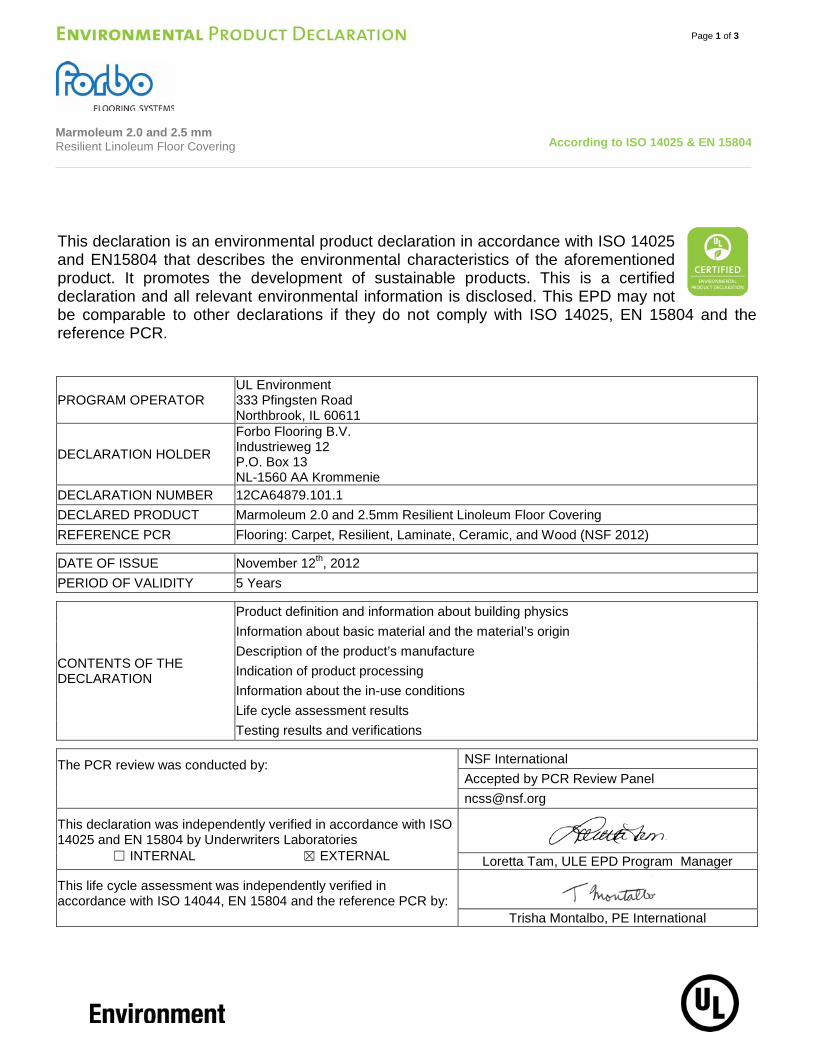
This declaration is an environmental product declaration in accordance with ISO 14025 and EN15804 that describes the environmental characteristics of the aforementioned product. It promotes the development of sustainable products. This is a certified declaration and all relevant environmental information is disclosed. This EPD may not be comparable to other declarations if they do not comply with ISO 14025, EN 15804 and the reference PCR.
PROGRAM OPERATOR UL Environment 333 Pfingsten Road Northbrook, IL 60611
DECLARATION HOLDER
Forbo Flooring B.V. Industrieweg 12 P.O. Box 13 NL-1560 AA Krommenie
DECLARATION NUMBER 12CA64879.101.1 DECLARED PRODUCT Marmoleum 2.0 and 2.5mm Resilient Linoleum Floor Covering
REFERENCE PCR Flooring: Carpet, Resilient, Laminate, Ceramic, and Wood (NSF 2012) DATE OF ISSUE November 12th, 2012 PERIOD OF VALIDITY 5 Years
CONTENTS OF THE DECLARATION
Product definition and information about building physics Information about basic material and the material’s origin Description of the product’s manufacture Indication of product processing Information about the in-use conditions Life cycle assessment results Testing results and verifications
The PCR review was conducted by: NSF International
Accepted by PCR Review Panel [email protected]
This declaration was independently verified in accordance with ISO 14025 and EN 15804 by Underwriters Laboratories ☐ INTERNAL ☒ EXTERNAL
Loretta Tam, ULE EPD Program Manager
This life cycle assessment was independently verified in accordance with ISO 14044, EN 15804 and the reference PCR by:
Trisha Montalbo, PE International
Marmoleum 2.0 and 2.5 mm Resilient Linoleum Floor Covering
According to ISO 14025 & EN 15804
Page 2 of 3
Product Definition
Product Classification and description
This declaration covers a broad range of designs and colors. Marmoleum is a resilient floor covering complying with all the requirements of EN-ISO 24011: Specification for plain and decorative linoleum. Marmoleum is made from natural raw materials making it preferable ecological floor covering with a beautiful and colorful design. The key raw materials include linseed oil, which comes from the flax plant seeds, gum rosin from pine trees, recycled wood waste of wood from controlled forests, limestone and jute from the jute plant which is used for the backing. Because of the use of natural raw materials Marmoleum is biodegradable.
Linoleum is produced by Forbo Flooring for more than 150 years and our well-known brand Marmoleum is sold worldwide. This declaration refers to Marmoleum sheet of 2.0 and 2.5 mm nominal thickness.
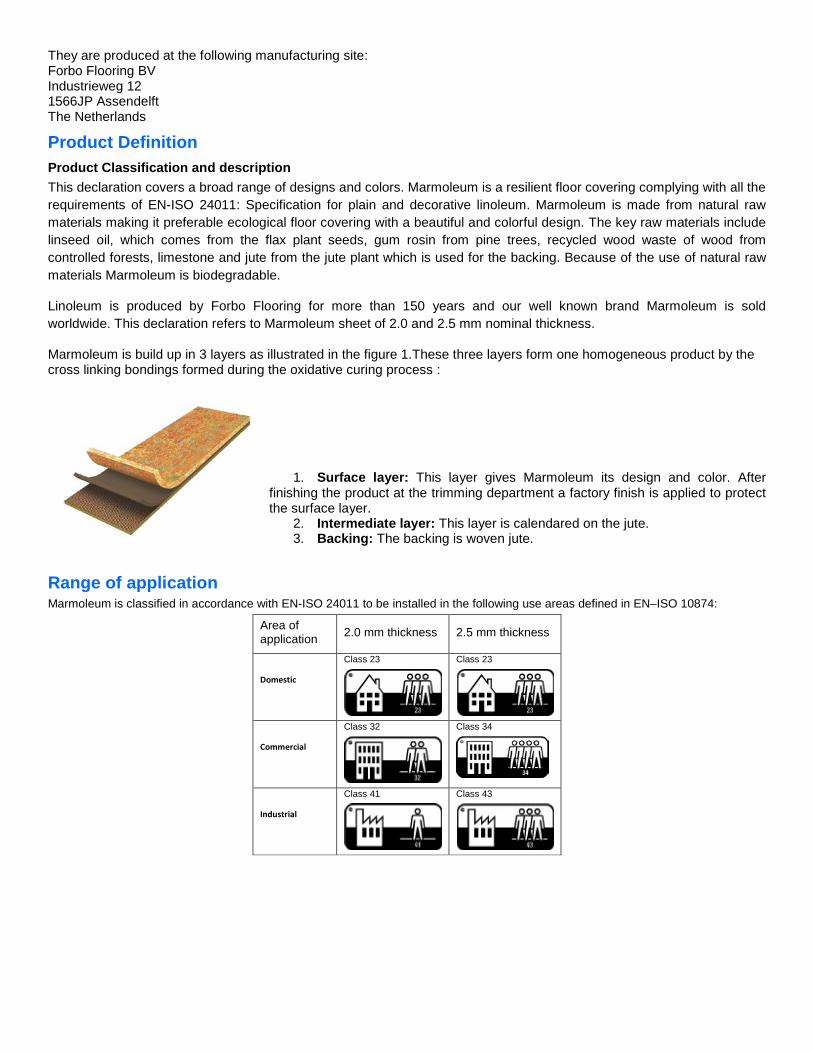
Marmoleum is build up in 3 layers as illustrated in the figure 1.These three layers form one homogeneous product by the cross linking bondings formed during the oxidative curing process :
Figure 1: Illustration of Marmoleum
1. Surface layer: This layer gives Marmoleum its design and color. After finishing the product at the trimming department a factory finish is applied to protect the surface layer.
2. Intermediate layer: This layer is calendared on the jute. 3. Backing: The backing is woven jute.
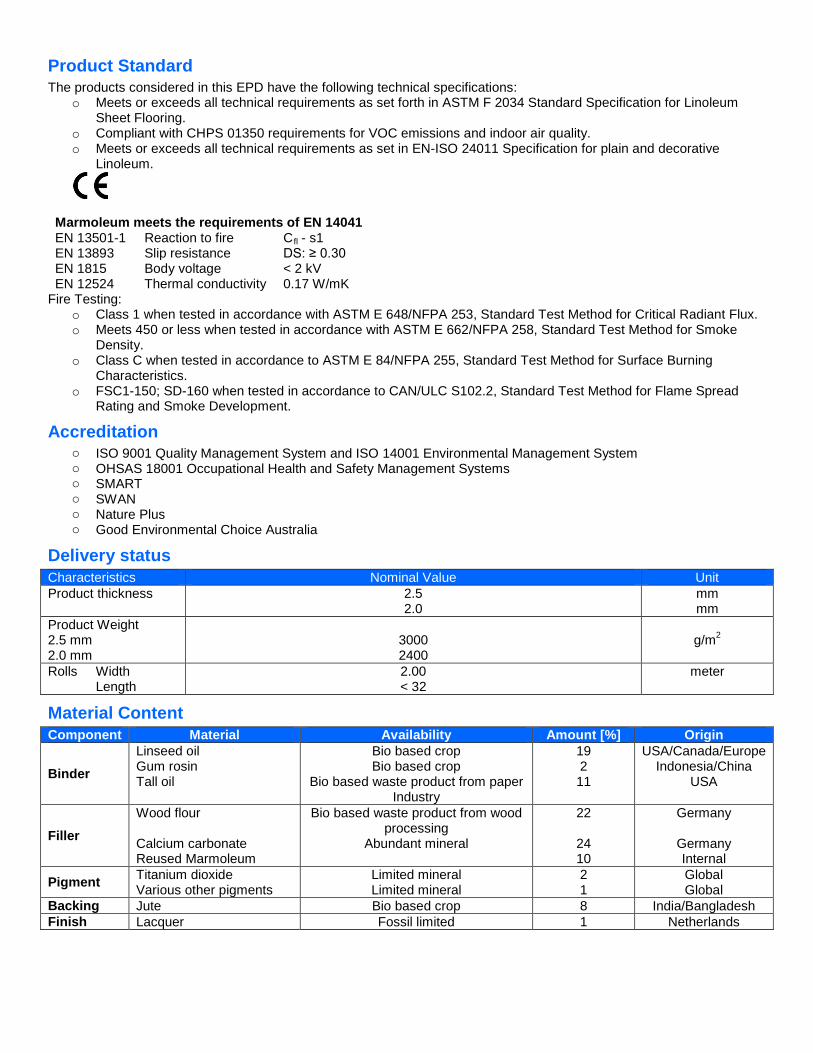
Range of application
Marmoleum is classified in accordance with EN-ISO 24011 to be installed in the following use areas defined in EN–ISO 10874:
Area of application 2.0 mm thickness 2.5 mm thickness
Domestic
Class 23
Class 23
Commercial
Class 32
Class 34
Industrial
Class 41
Class 43
Marmoleum 2.0 and 2.5 mm Resilient Linoleum Floor Covering
According to ISO 14025 & EN 15804
Page 3 of 3
Product Standard
The products considered in this EPD have the following technical specifications: o Meets or exceeds all technical requirements in ASTM F 2034 Standard Specification for Linoleum Sheet
Flooring. o Meets or exceeds all technical requirements in EN-ISO 24011 Specification for plain and decorative Linoleum.
Marmoleum meets the requirements of EN 14041 EN 13501-1 Reaction to fire Cfl - s1 EN 13893 Slip resistance DS: ≥ 0.30 EN 1815 Body voltage < 2 kV EN 12524 Thermal conductivity 0.17 W/mK Fire Testing:
o Class 1 when tested in accordance with ASTM E 648/NFPA 253, Standard Test Method for Critical Radiant Flux.
o Meets 450 or less when tested in accordance with ASTM E 662/NFPA 258, Standard Test Method for Smoke Density.
o Class C when tested in accordance to ASTM E 84/NFPA 255, Standard Test Method for Surface Burning Characteristics.
o FSC1-150; SD-160 when tested in accordance to CAN/ULC S102.2, Standard Test Method for Flame Spread Rating and Smoke Development.
o Compliant with CHPS 01350 requirements for VOC emissions and indoor air quality.
Accreditation
o ISO 9001 Quality Management System o ISO 14001 Environmental Management System o OHSAS 18001 Occupational Health and Safety Management Systems o SMART o SWAN o Nature Plus o Good Environmental Choice Australia
Marmoleum 2.0 and 2.5 mm Resilient Linoleum Floor Covering
According to ISO 14025 & EN 15804
Page 4 of 3
Delivery Status
Table 1: Specification of delivered product Characteristics Nominal Value Unit Product thickness 2.5
2.0 mm mm
Product Weight 2.5 mm 2.0 mm
3000 2400
g/m2
Rolls Width Length
2.00 < 32
meter
Material Content
Material Content of the Product
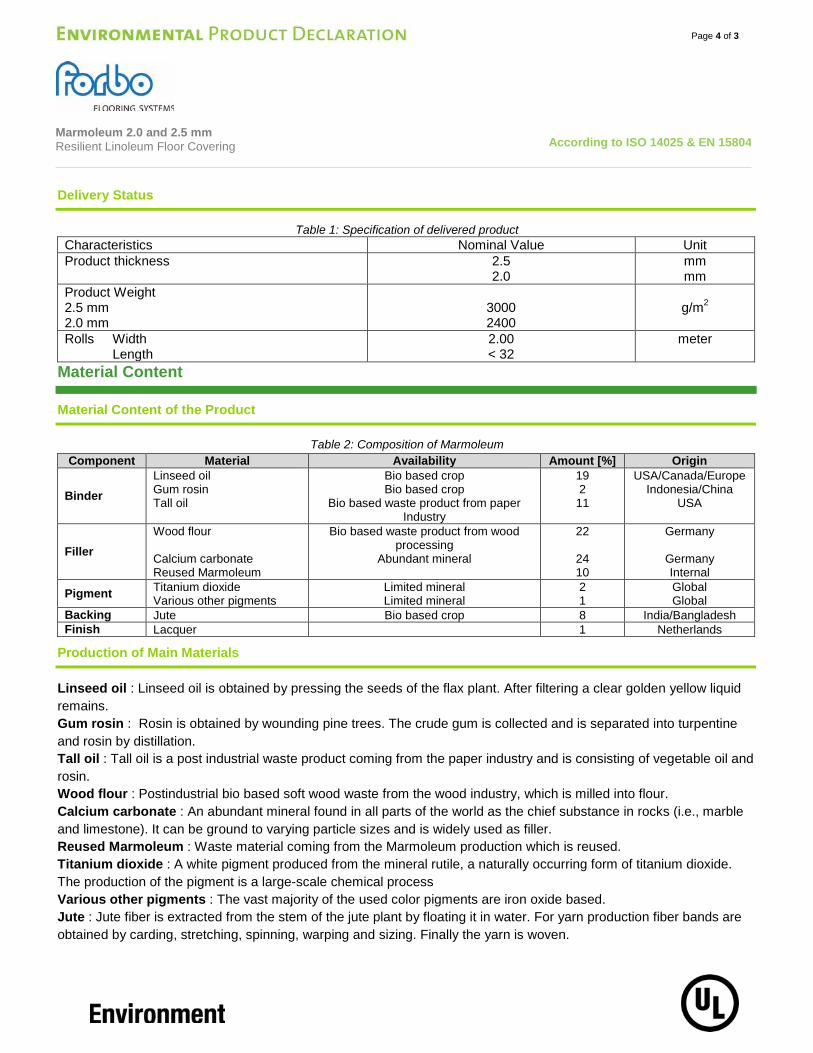
Table 2: Composition of Marmoleum Component Material Availability Amount [%] Origin
Binder Linseed oil Gum rosin Tall oil
Bio based crop Bio based crop
Bio based waste product from paper Industry
19 2
11
USA/Canada/Europe Indonesia/China
USA
Filler Wood flour Calcium carbonate Reused Marmoleum
Bio based waste product from wood processing
Abundant mineral
22
24 10
Germany
Germany Internal
Pigment Titanium dioxide Various other pigments
Limited mineral Limited mineral
2 1
Global Global
Backing Jute Bio based crop 8 India/Bangladesh Finish Lacquer 1 Netherlands
Production of Main Materials
Linseed oil : Linseed oil is obtained by pressing the seeds of the flax plant. After filtering a clear golden yellow liquid remains. Gum rosin : Rosin is obtained by wounding pine trees. The crude gum is collected and is separated into turpentine and rosin by distillation. Tall oil : Tall oil is a post industrial waste product coming from the paper industry and is consisting of vegetable oil and rosin. Wood flour : Postindustrial bio based soft wood waste from the wood industry, which is milled into flour. Calcium carbonate : An abundant mineral found in all parts of the world as the chief substance in rocks (i.e., marble and limestone). It can be ground to varying particle sizes and is widely used as filler. Reused Marmoleum : Waste material coming from the Marmoleum production which is reused. Titanium dioxide : A white pigment produced from the mineral rutile, a naturally occurring form of titanium dioxide. The production of the pigment is a large-scale chemical process Various other pigments : The vast majority of the used color pigments are iron oxide based. Jute : Jute fiber is extracted from the stem of the jute plant by floating it in water. For yarn production fiber bands are obtained by carding, stretching, spinning, warping and sizing. Finally the yarn is woven.
Marmoleum 2.0 and 2.5 mm Resilient Linoleum Floor Covering
According to ISO 14025 & EN 15804
Page 5 of 3
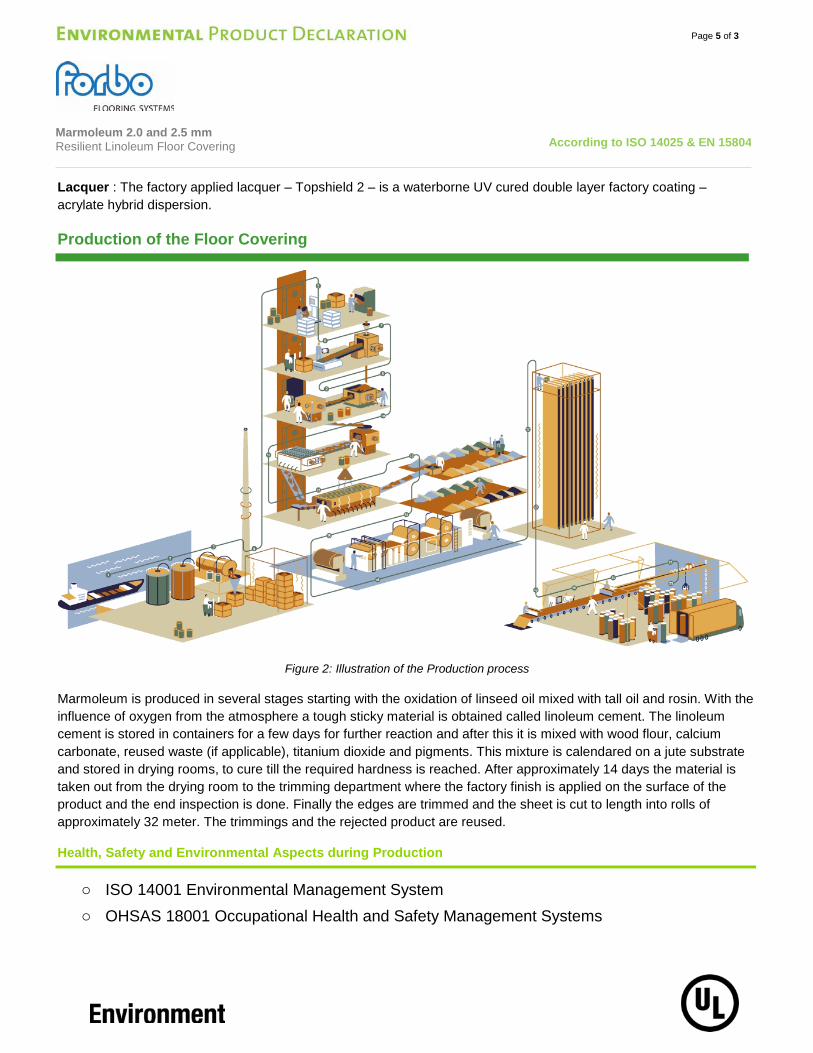
Lacquer : The factory applied lacquer – Topshield 2 – is a waterborne UV cured double layer factory coating – acrylate hybrid dispersion. Production of the Floor Covering
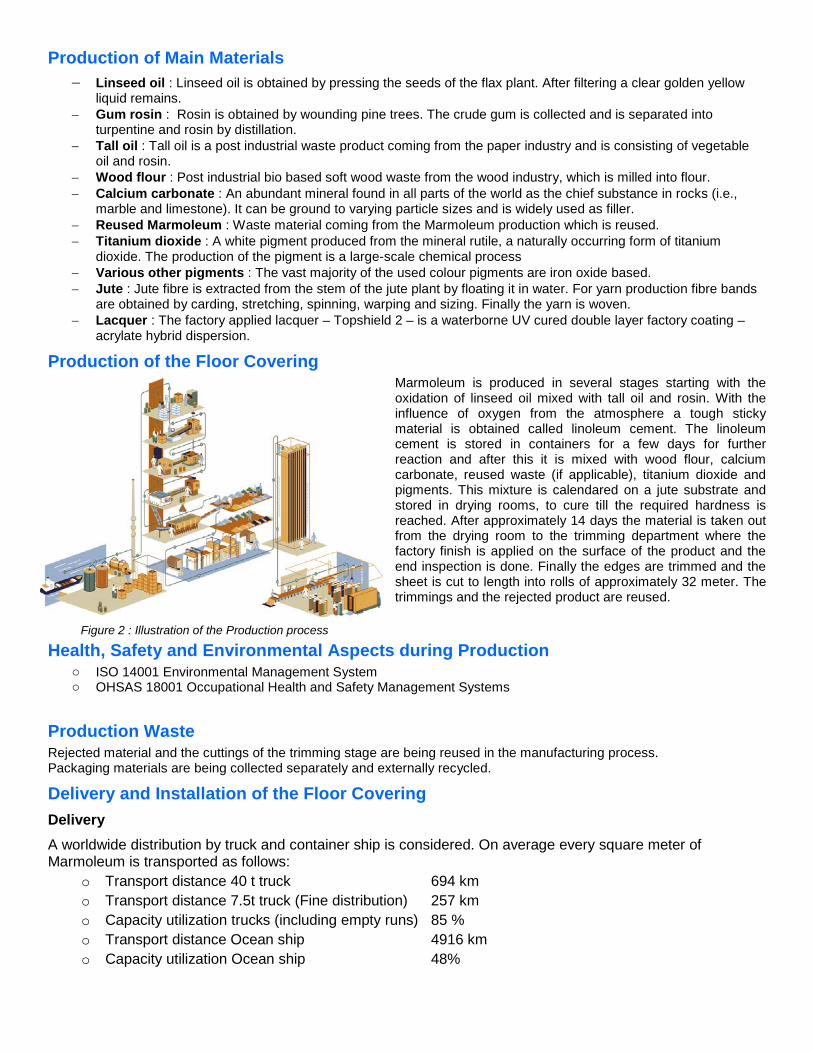
Figure 2: Illustration of the Production process Marmoleum is produced in several stages starting with the oxidation of linseed oil mixed with tall oil and rosin. With the influence of oxygen from the atmosphere a tough sticky material is obtained called linoleum cement. The linoleum cement is stored in containers for a few days for further reaction and after this it is mixed with wood flour, calcium carbonate, reused waste (if applicable), titanium dioxide and pigments. This mixture is calendared on a jute substrate and stored in drying rooms, to cure till the required hardness is reached. After approximately 14 days the material is taken out from the drying room to the trimming department where the factory finish is applied on the surface of the product and the end inspection is done. Finally the edges are trimmed and the sheet is cut to length into rolls of approximately 32 meter. The trimmings and the rejected product are reused.
Health, Safety and Environmental Aspects during Production
o ISO 14001 Environmental Management System o OHSAS 18001 Occupational Health and Safety Management Systems
Marmoleum 2.0 and 2.5 mm Resilient Linoleum Floor Covering
According to ISO 14025 & EN 15804
Page 6 of 3
Production Waste
Rejected material and the cuttings of the trimming stage are being reused in the manufacturing process. Packaging materials are being collected separately and externally recycled. Delivery and Installation of the Floor Covering
Delivery
A worldwide distribution by truck and container ship is considered. On average every square meter of Marmoleum is transported as follows:
o Transport distance 40 t truck 694 km o Transport distance 7.5t truck (Fine distribution) 257 km o Capacity utilization trucks (including empty runs) 85 % o Transport distance Ocean ship 4916 km o Capacity utilization Ocean ship 48%
Installation
Because of the specific techniques used during the installation of Marmoleum 6% of the material is cut off as installation waste. For installation of Marmoleum on the floor a worst case scenario has been modeled (assuming 0.435 kg/m2 of adhesive is required). In practice this amount will almost always be lower. Waste during the installation process may be recycled as floor covering through the manufacturers’ facilities or thermally recycled in a waste incineration plant. Since the major part of Marmoleum is sold in Europe the European electricity grid mix is used in the calculations for the energy recovery during incineration.
Health, Safety and Environmental Aspects during Installation
Forbo flooring recommends to use (low) zero emission adhesives for installing Marmoleum.
Waste
Waste during the installation process may be recycled as floor covering through the manufacturers’ facilities or thermally recycled in a waste incineration plant. Since the major part of Marmoleum is sold in Europe the European electricity grid mix is used in the calculations for the energy recovery during incineration.
Packaging
Cardboard tubes and packaging paper can be collected separately and should be used in a local recycling process. In the calculation model 100% incineration is taken into account for which there is a credit received. Use stage
The service lifetime of a floor covering for a certain application on a floor is too widespread to give one common number. For this EPD model the reference service lifetime (RSL) is set to one year. This means that all impacts for the use phase are based on the cleaning and maintenance model for one year. Depending on the area of use, the technical lifetime advised by the manufacturer and the estimated time on the floor by the customer, the service lifetime
Marmoleum 2.0 and 2.5 mm Resilient Linoleum Floor Covering
According to ISO 14025 & EN 15804
Page 7 of 3
can be determined. The use phase impacts should be calculated with the foreseen service life to arrive at the total environmental impact.
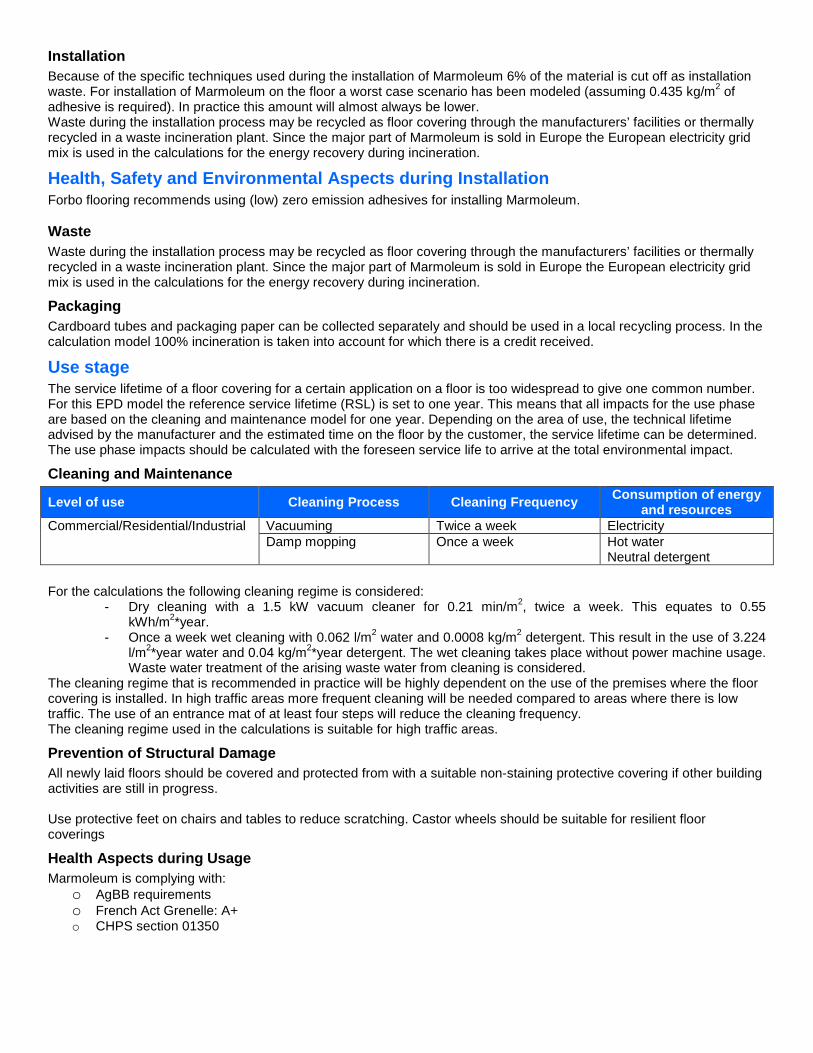
Cleaning and Maintenance
Level of use Cleaning Process Cleaning Frequency Consumption of energy and resources
Commercial/Residential/Industrial Vacuuming Twice a week Electricity Damp mopping Once a week Hot water
Neutral detergent For the calculations the following cleaning regime is considered:
- Dry cleaning with a 1.5 kW vacuum cleaner for 0.21 min/m2, twice a week. This equates to 0.55 kWh/m2*year.
- Once a week wet cleaning with 0.062 l/m2 water and 0.0008 kg/m2 detergent. This result in the use of 3.224 l/m2*year water and 0.04 kg/m2*year detergent. The wet cleaning takes place without power machine usage. Waste water treatment of the arising waste water from cleaning is considered.
The cleaning regime that is recommended in practice will be highly dependent on the use of the premises where the floor covering is installed. In high traffic areas more frequent cleaning will be needed compared to areas where there is low traffic. The use of an entrance mat of at least four steps will reduce the cleaning frequency.
The cleaning regime used in the calculations is suitable for high traffic areas.
Prevention of Structural Damage
All newly laid floor covering should be covered and protected with a suitable non-staining protective covering if other building activities are still in progress. Use protective feet on chairs and tables to reduce scratching. Castor wheels should be suitable for resilient floor coverings
Health Aspects during Usage
Marmoleum is complying with: o AgBB requirements o French act Grenelle: A+ o CHPS section 01350
End of Life
The deconstruction of installed Marmoleum from the floor is done mechanically and the electrical energy needed for this is estimated to be 0.03 kWh/sqm. This amount of energy is taken into account for the calculations. For the end of life stage no landfilling is taken into account, since the vast majority of the countries in which Marmoleum is sold are having a non landfill policy. Because of the high calorific value of Marmoleum the incineration is very profitable as a waste to energy conversion.
Marmoleum 2.0 and 2.5 mm Resilient Linoleum Floor Covering
According to ISO 14025 & EN 15804
Page 8 of 3
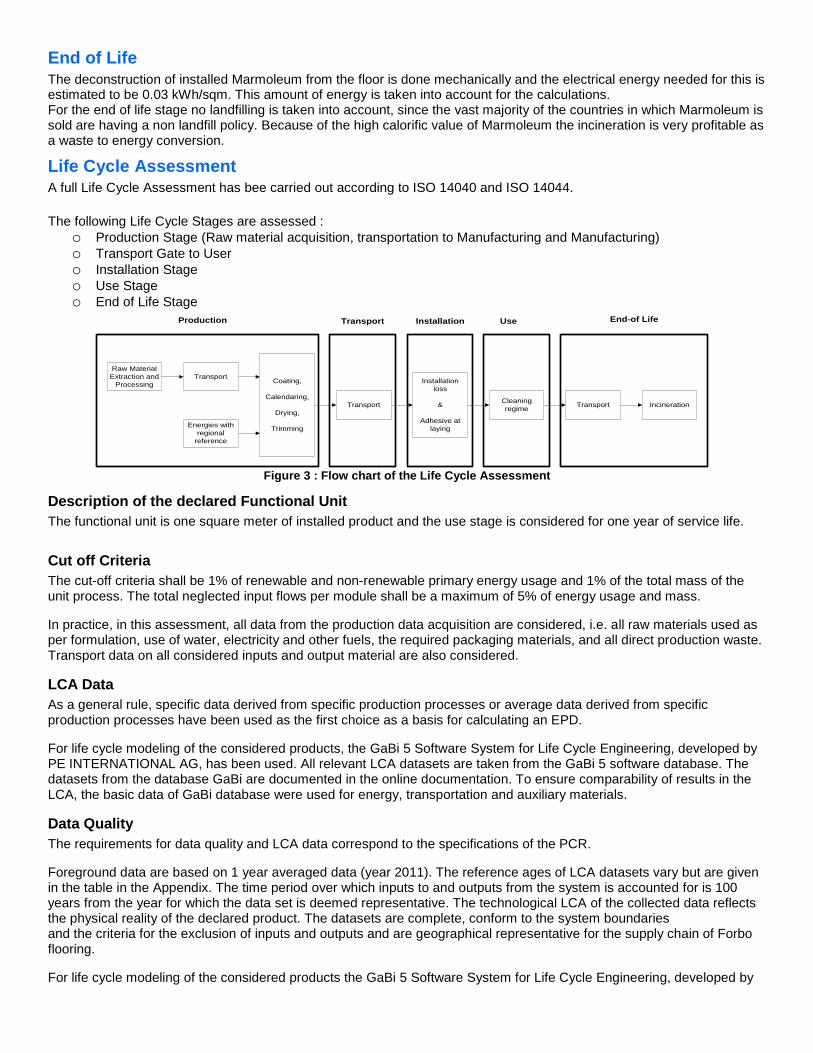
Life Cycle Assessment
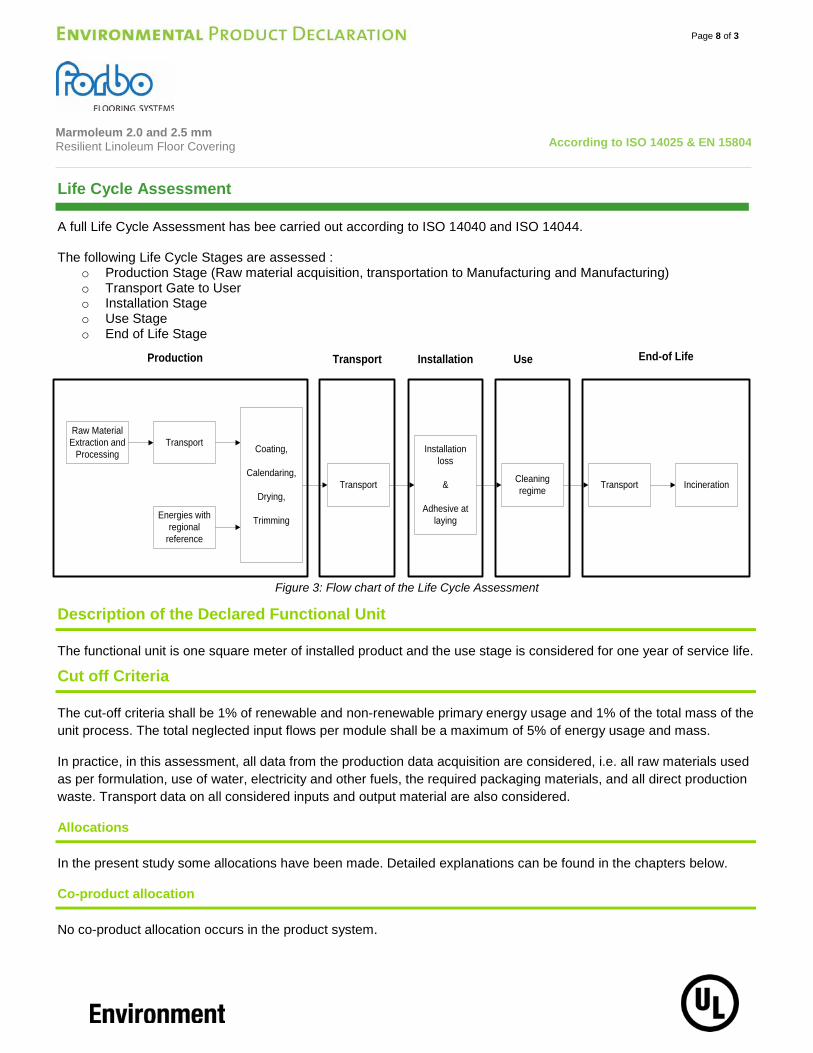
A full Life Cycle Assessment has bee carried out according to ISO 14040 and ISO 14044. The following Life Cycle Stages are assessed :
o Production Stage (Raw material acquisition, transportation to Manufacturing and Manufacturing) o Transport Gate to User o Installation Stage o Use Stage o End of Life Stage
Raw Material Extraction and
Processing
Energies with regional
reference
Coating,
Calendaring,
Drying,
Trimming
Transport
Transport
Installation loss
&
Adhesive at laying
Cleaning regime Transport Incineration
Production Transport Installation Use End-of Life
Figure 3: Flow chart of the Life Cycle Assessment
Description of the Declared Functional Unit
The functional unit is one square meter of installed product and the use stage is considered for one year of service life.
Cut off Criteria
The cut-off criteria shall be 1% of renewable and non-renewable primary energy usage and 1% of the total mass of the unit process. The total neglected input flows per module shall be a maximum of 5% of energy usage and mass.
In practice, in this assessment, all data from the production data acquisition are considered, i.e. all raw materials used as per formulation, use of water, electricity and other fuels, the required packaging materials, and all direct production waste. Transport data on all considered inputs and output material are also considered.
Allocations
In the present study some allocations have been made. Detailed explanations can be found in the chapters below.
Co-product allocation
No co-product allocation occurs in the product system.
Marmoleum 2.0 and 2.5 mm Resilient Linoleum Floor Covering
According to ISO 14025 & EN 15804
Page 9 of 3
Allocation of multi-input processes
The Production and End of Life stage include incineration plants. In these processes different products are treated together within a process. The allocation procedures followed in these cases are based on a physical classification of the mass flows or calorific values.
Credits from energy substitution are allocated to the production stage, because the gained energy from energy substitution is lower than the energy input in this stage. The same quality of energy is considered.
Allocation procedure of reuse, recycling and recovery
The installation waste and end of life waste is fed into incineration processes. Incineration processes include cogeneration processes which give thermal and power energy as outputs. It is assumed that this recovered energy offsets that produced by the European average grid mix and thermal energy generation from natural gas.
The LCA dataset used to model the incineration of Marmoleum is based on data developed by European Resilient Flooring Manufacturers’ Institute (ERFMI) and is specific to linoleum flooring products. This indicates that 250 kWh/tonne electricity and 9744 MJ/tonne thermal energy is recovered during incineration. This model is part of the ERFMI 2008 LCA study on resilient floorings; critical reviewed by Dr ir Jeroen Guinée (Institute of Environmental Sciences CML) /ERFMI 2008/.
Description of the allocation processes in the LCA report
The description of allocation rules in of this LCA report meets the requirements of the PCR.
LCA Data
As a general rule, specific data derived from specific production processes or average data derived from specific production processes have been used as the first choice as a basis for calculating an EPD.
For life cycle modeling of the considered products, the GaBi 5 Software System for Life Cycle Engineering, developed by PE INTERNATIONAL AG has been used. All relevant LCA datasets are taken from the GaBi 5 software database. The datasets from the database GaBi are documented in the online documentation. To ensure comparability of results in the LCA, the basic data of GaBi database were used for energy, transportation and auxiliary materials.
Data Quality
The requirements for data quality and LCA data correspond to the specifications of the PCR.
Foreground data are based on 1 year averaged data (year 2011). The reference ages of LCA datasets vary but are given in the table in the Appendix. The time period over which inputs to and outputs from the system is accounted for is 100 years from the year for which the data set is deemed representative. The technological LCA of the collected data reflects the physical reality of the declared product. The datasets are complete, conform to the system boundaries and the criteria for the exclusion of inputs and outputs and are geographical representative for the supply chain of Forbo flooring.
Marmoleum 2.0 and 2.5 mm Resilient Linoleum Floor Covering
According to ISO 14025 & EN 15804
Page 10 of 3
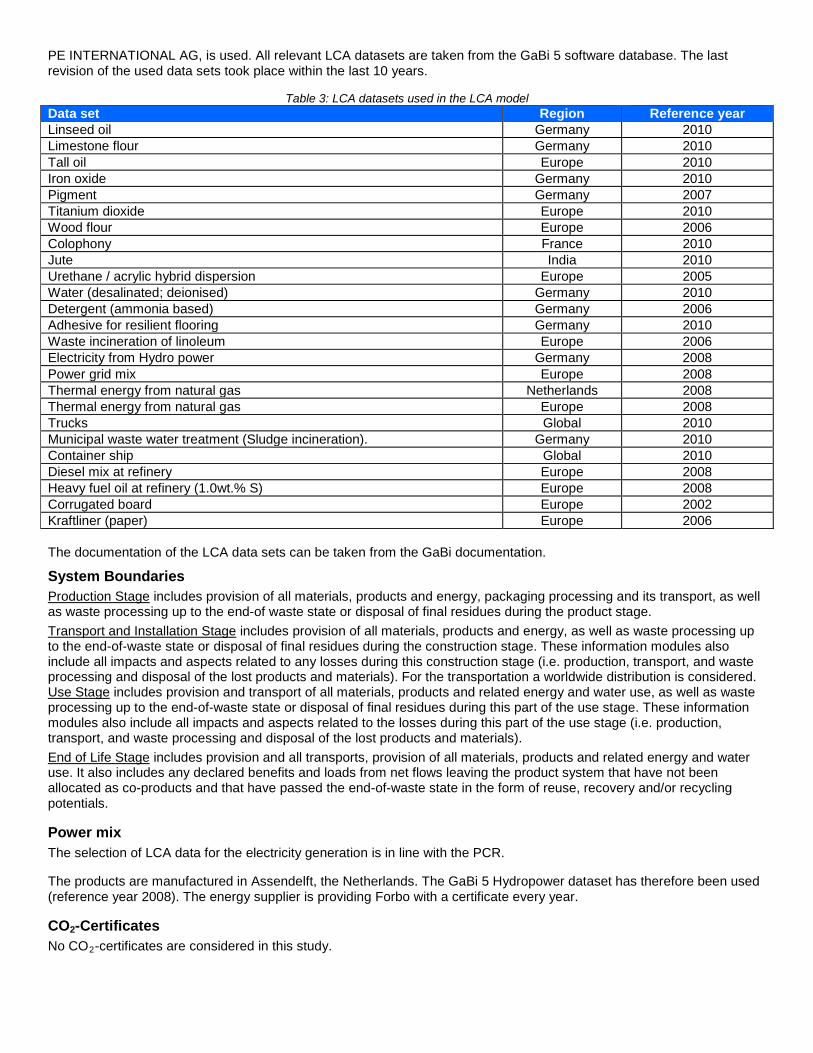
For life cycle modeling of the considered products the GaBi 5 Software System for Life Cycle Engineering, developed by PE INTERNATIONAL AG, is used. All relevant LCA datasets are taken from the GaBi 5 software database. The last revision of the used data sets took place within the last 10 years.
System Boundaries
Production Stage includes provision of all materials, products and energy, packaging processing and its transport, as well as waste processing up to the end-of waste state or disposal of final residues during the product stage. Transport and Installation Stage includes provision of all materials, products and energy, as well as waste processing up to the end-of-waste state or disposal of final residues during the construction stage. These information modules also include all impacts and aspects related to any losses during this construction stage (i.e. production, transport, and waste processing and disposal of the lost products and materials). For the transportation a worldwide distribution is considered. Use Stage includes provision and transport of all materials, products and related energy and water use, as well as waste processing up to the end-of-waste state or disposal of final residues during this part of the use stage. These information modules also include all impacts and aspects related to the losses during this part of the use stage (i.e. production, transport, and waste processing and disposal of the lost products and materials). End of Life Stage includes provision and all transports, provision of all materials, products and related energy and water use. It also includes any declared benefits and loads from net flows leaving the product system that have not been allocated as co-products and that have passed the end-of-waste state in the form of reuse, recovery and/or recycling potentials.
Power mix
The selection of LCA data for the electricity generation is in line with the PCR.
The products are manufactured in Assendelft, the Netherlands. The GaBi 5 Hydropower dataset has therefore been used (reference year 2008). The energy supplier is providing Forbo with a certificate every year.
CO2-Certificates
No CO2-certificates are considered in this study.
Life Cycle Inventory Analysis
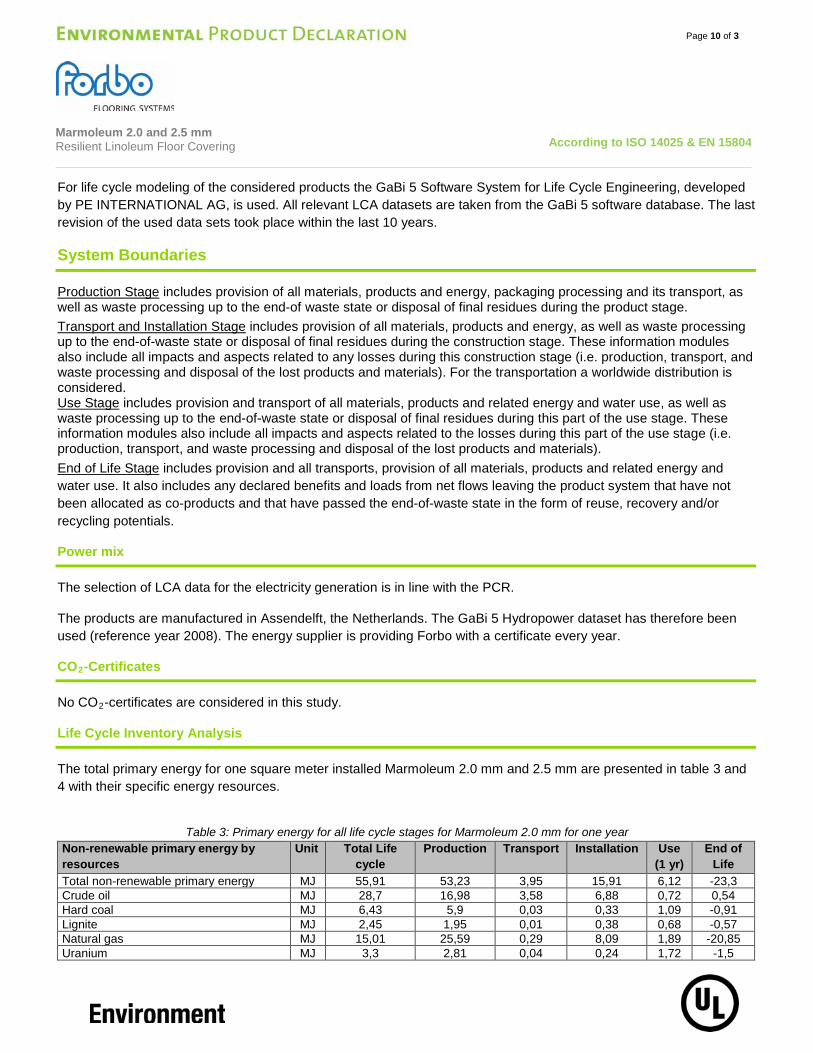
The total primary energy for one square meter installed Marmoleum 2.0 mm and 2.5 mm are presented in table 3 and 4 with their specific energy resources.
Table 3: Primary energy for all life cycle stages for Marmoleum 2.0 mm for one year
Non-renewable primary energy by resources
Unit Total Life cycle
Production Transport Installation Use (1 yr)
End of Life
Total non-renewable primary energy MJ 55,91 53,23 3,95 15,91 6,12 -23,3 Crude oil MJ 28,7 16,98 3,58 6,88 0,72 0,54 Hard coal MJ 6,43 5,9 0,03 0,33 1,09 -0,91 Lignite MJ 2,45 1,95 0,01 0,38 0,68 -0,57 Natural gas MJ 15,01 25,59 0,29 8,09 1,89 -20,85 Uranium MJ 3,3 2,81 0,04 0,24 1,72 -1,5
Marmoleum 2.0 and 2.5 mm Resilient Linoleum Floor Covering
According to ISO 14025 & EN 15804
Page 11 of 3
Renewable primary energy by resources
Unit Total Life cycle
Production Transport Installation Use (1 yr)
End of Life
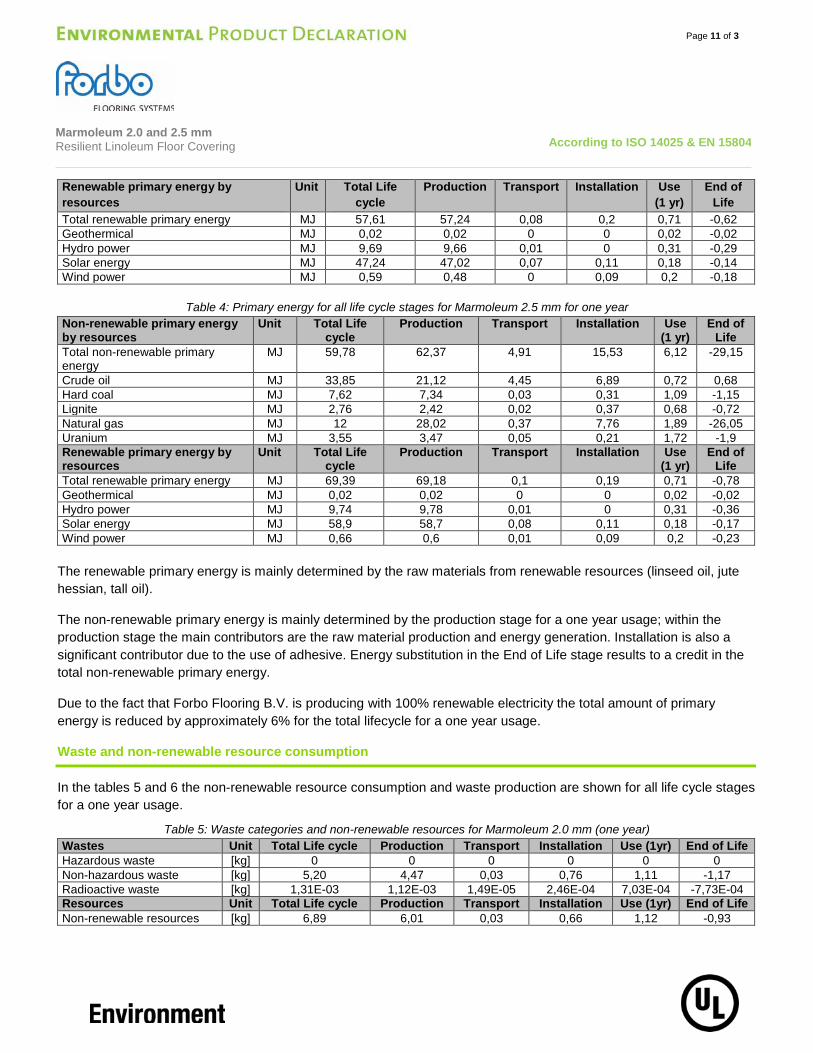
Total renewable primary energy MJ 57,61 57,24 0,08 0,2 0,71 -0,62 Geothermical MJ 0,02 0,02 0 0 0,02 -0,02 Hydro power MJ 9,69 9,66 0,01 0 0,31 -0,29 Solar energy MJ 47,24 47,02 0,07 0,11 0,18 -0,14 Wind power MJ 0,59 0,48 0 0,09 0,2 -0,18
Table 4: Primary energy for all life cycle stages for Marmoleum 2.5 mm for one year
Non-renewable primary energy by resources
Unit Total Life cycle
Production Transport Installation Use (1 yr)
End of Life
Total non-renewable primary energy
MJ 59,78 62,37 4,91 15,53 6,12 -29,15
Crude oil MJ 33,85 21,12 4,45 6,89 0,72 0,68 Hard coal MJ 7,62 7,34 0,03 0,31 1,09 -1,15 Lignite MJ 2,76 2,42 0,02 0,37 0,68 -0,72 Natural gas MJ 12 28,02 0,37 7,76 1,89 -26,05 Uranium MJ 3,55 3,47 0,05 0,21 1,72 -1,9 Renewable primary energy by resources
Unit Total Life cycle
Production Transport Installation Use (1 yr)
End of Life
Total renewable primary energy MJ 69,39 69,18 0,1 0,19 0,71 -0,78 Geothermical MJ 0,02 0,02 0 0 0,02 -0,02 Hydro power MJ 9,74 9,78 0,01 0 0,31 -0,36 Solar energy MJ 58,9 58,7 0,08 0,11 0,18 -0,17 Wind power MJ 0,66 0,6 0,01 0,09 0,2 -0,23
The renewable primary energy is mainly determined by the raw materials from renewable resources (linseed oil, jute hessian, tall oil).
The non-renewable primary energy is mainly determined by the production stage for a one year usage; within the production stage the main contributors are the raw material production and energy generation. Installation is also a significant contributor due to the use of adhesive. Energy substitution in the End of Life stage results to a credit in the total non-renewable primary energy.
Due to the fact that Forbo Flooring B.V. is producing with 100% renewable electricity the total amount of primary energy is reduced by approximately 6% for the total lifecycle for a one year usage.
Waste and non-renewable resource consumption
In the tables 5 and 6 the non-renewable resource consumption and waste production are shown for all life cycle stages for a one year usage.
Table 5: Waste categories and non-renewable resources for Marmoleum 2.0 mm (one year) Wastes Unit Total Life cycle Production Transport Installation Use (1yr) End of Life Hazardous waste [kg] 0 0 0 0 0 0 Non-hazardous waste [kg] 5,20 4,47 0,03 0,76 1,11 -1,17 Radioactive waste [kg] 1,31E-03 1,12E-03 1,49E-05 2,46E-04 7,03E-04 -7,73E-04 Resources Unit Total Life cycle Production Transport Installation Use (1yr) End of Life Non-renewable resources [kg] 6,89 6,01 0,03 0,66 1,12 -0,93
Marmoleum 2.0 and 2.5 mm Resilient Linoleum Floor Covering
According to ISO 14025 & EN 15804
Page 12 of 3
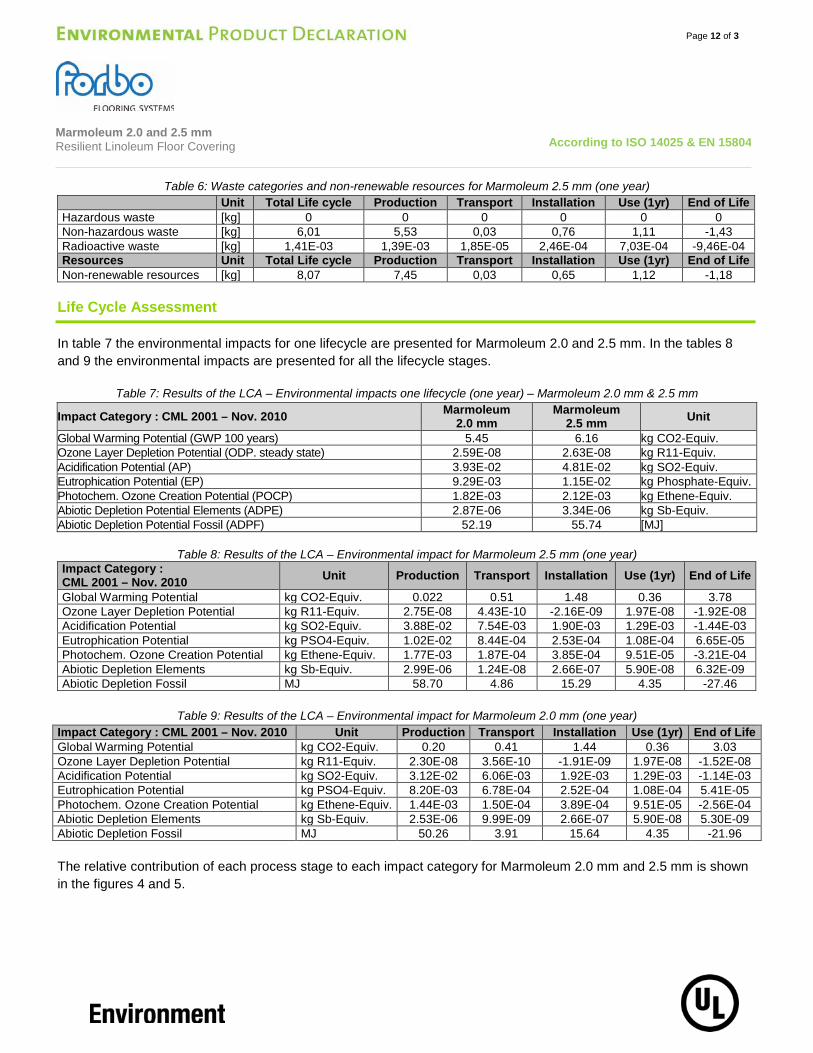
Table 6: Waste categories and non-renewable resources for Marmoleum 2.5 mm (one year) Unit Total Life cycle Production Transport Installation Use (1yr) End of Life Hazardous waste [kg] 0 0 0 0 0 0 Non-hazardous waste [kg] 6,01 5,53 0,03 0,76 1,11 -1,43 Radioactive waste [kg] 1,41E-03 1,39E-03 1,85E-05 2,46E-04 7,03E-04 -9,46E-04 Resources Unit Total Life cycle Production Transport Installation Use (1yr) End of Life Non-renewable resources [kg] 8,07 7,45 0,03 0,65 1,12 -1,18
Life Cycle Assessment
In table 7 the environmental impacts for one lifecycle are presented for Marmoleum 2.0 and 2.5 mm. In the tables 8 and 9 the environmental impacts are presented for all the lifecycle stages.
Table 7: Results of the LCA – Environmental impacts one lifecycle (one year) – Marmoleum 2.0 mm & 2.5 mm
Impact Category : CML 2001 – Nov. 2010 Marmoleum 2.0 mm
Marmoleum 2.5 mm Unit
Global Warming Potential (GWP 100 years) 5.45 6.16 kg CO2-Equiv. Ozone Layer Depletion Potential (ODP. steady state) 2.59E-08 2.63E-08 kg R11-Equiv. Acidification Potential (AP) 3.93E-02 4.81E-02 kg SO2-Equiv. Eutrophication Potential (EP) 9.29E-03 1.15E-02 kg Phosphate-Equiv. Photochem. Ozone Creation Potential (POCP) 1.82E-03 2.12E-03 kg Ethene-Equiv. Abiotic Depletion Potential Elements (ADPE) 2.87E-06 3.34E-06 kg Sb-Equiv. Abiotic Depletion Potential Fossil (ADPF) 52.19 55.74 [MJ]
Table 8: Results of the LCA – Environmental impact for Marmoleum 2.5 mm (one year) Impact Category : CML 2001 – Nov. 2010 Unit Production Transport Installation Use (1yr) End of Life
Global Warming Potential kg CO2-Equiv. 0.022 0.51 1.48 0.36 3.78 Ozone Layer Depletion Potential kg R11-Equiv. 2.75E-08 4.43E-10 -2.16E-09 1.97E-08 -1.92E-08 Acidification Potential kg SO2-Equiv. 3.88E-02 7.54E-03 1.90E-03 1.29E-03 -1.44E-03 Eutrophication Potential kg PSO4-Equiv. 1.02E-02 8.44E-04 2.53E-04 1.08E-04 6.65E-05 Photochem. Ozone Creation Potential kg Ethene-Equiv. 1.77E-03 1.87E-04 3.85E-04 9.51E-05 -3.21E-04 Abiotic Depletion Elements kg Sb-Equiv. 2.99E-06 1.24E-08 2.66E-07 5.90E-08 6.32E-09 Abiotic Depletion Fossil MJ 58.70 4.86 15.29 4.35 -27.46
Table 9: Results of the LCA – Environmental impact for Marmoleum 2.0 mm (one year)
Impact Category : CML 2001 – Nov. 2010 Unit Production Transport Installation Use (1yr) End of Life Global Warming Potential kg CO2-Equiv. 0.20 0.41 1.44 0.36 3.03 Ozone Layer Depletion Potential kg R11-Equiv. 2.30E-08 3.56E-10 -1.91E-09 1.97E-08 -1.52E-08 Acidification Potential kg SO2-Equiv. 3.12E-02 6.06E-03 1.92E-03 1.29E-03 -1.14E-03 Eutrophication Potential kg PSO4-Equiv. 8.20E-03 6.78E-04 2.52E-04 1.08E-04 5.41E-05 Photochem. Ozone Creation Potential kg Ethene-Equiv. 1.44E-03 1.50E-04 3.89E-04 9.51E-05 -2.56E-04 Abiotic Depletion Elements kg Sb-Equiv. 2.53E-06 9.99E-09 2.66E-07 5.90E-08 5.30E-09 Abiotic Depletion Fossil MJ 50.26 3.91 15.64 4.35 -21.96 The relative contribution of each process stage to each impact category for Marmoleum 2.0 mm and 2.5 mm is shown in the figures 4 and 5.
Marmoleum 2.0 and 2.5 mm Resilient Linoleum Floor Covering
According to ISO 14025 & EN 15804
Page 13 of 3
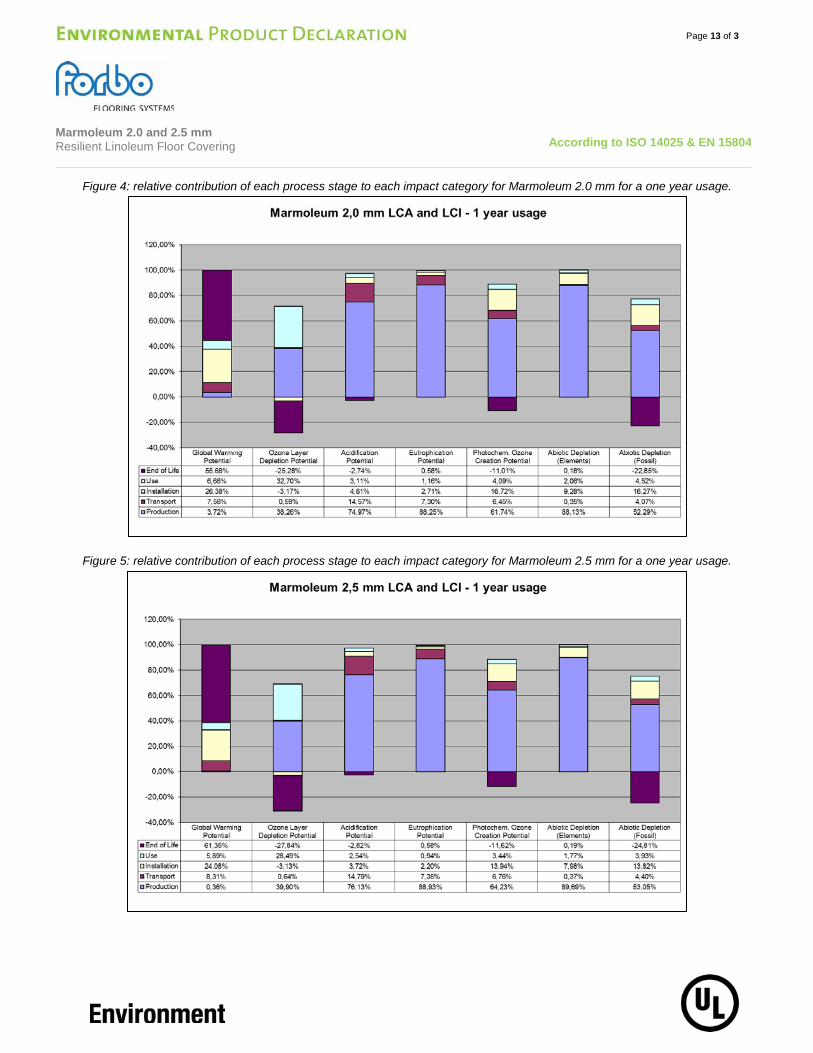
Figure 4: relative contribution of each process stage to each impact category for Marmoleum 2.0 mm for a one year usage.
Figure 5: relative contribution of each process stage to each impact category for Marmoleum 2.5 mm for a one year usage.
Marmoleum 2.0 and 2.5 mm Resilient Linoleum Floor Covering
According to ISO 14025 & EN 15804
Page 14 of 3
Interpretation
The interpretation of the results has been carried out considering the assumptions and limitations declared in the EPD, both methodology- and data-related for a one year usage.
In most impact categories (AP, EP, POCP, ADPE, ADPF) the production stage has the main contribution to the overall impact. For these categories the main contributor in the production stage is the Raw material supply with a share of 65-92% of total impacts from the production stage.
For GWP, POCP, and ADPF the adhesive for the flooring installation has a significant impact. The LCA for the installation is based on a conservative assumption of 435g/m² adhesive. In practice this amount will almost always be lower.
Forbo declares in the EPD a worldwide distribution by truck (951km) and container ship (4916 km). For this scenario the transport has a relevance of 7%-16% in the impact categories GWP, AP, EP, POCP and ADPF.
The LCA profile for the results of ODP is different. After the production stage (89-105%) the use stage accounts for the main contribution to ODP (76%). For the production stage the raw materials are responsible for most of the impact (78-82%) while for the use stage the contribution is mainly due to the consumption of electricity (EU power grid mix) for cleaning. The third main impact on ODP comes from the End Of Life stage.
The LCA for GWP reflects the use of renewable raw materials for the production of Marmoleum (linseed oil and jute). Carbon dioxide, a greenhouse gas, is locked in from the atmosphere in the course of the plant growth via photosynthesis and stored during the use stage. This carbon dioxide is not released until the end of life when it is incinerated with energy recovery – this process accounts for the greatest emission of greenhouse gases in the life cycle of the product.
Energy recovery from incineration and the respective energy substitution at the end of life results in a credit for all impact categories as reported in the End of Life stage.
Additional Environmental Information
To be fully transparant Forbo Flooring does not only want to declare the environmental impacts required in the PCR, but also the impacts on human health and eco-toxicity. Furthermore the outcome of the calculations according to the european Standard EN15804 are published in this section.
Toxicity
For this calculations the USEtoxTM model is used as being the globally recommended preferred model for characterization modelling of human and eco-toxic impacts in LCIA by the United Nations Environment Programme SETAC Life Cycle Initiative. According to the "ILCD Handbook: Recommendations for Life Cycle Impact Assessment in the European context" the recommended characterization models and associated characterization factors are classified according to their quality into three levels:
o Level I (recommended and satisfactory), o level II (recommended but in need of some improvements)
Marmoleum 2.0 and 2.5 mm Resilient Linoleum Floor Covering
According to ISO 14025 & EN 15804
Page 15 of 3
o level III (recommended, but to be applied with caution). A mixed classification sometimes is related to the application of the classified method to different types of substances. USEtoxTM is classified as Level II / III, unlike for example the CML impact categories which are classified as Level I.
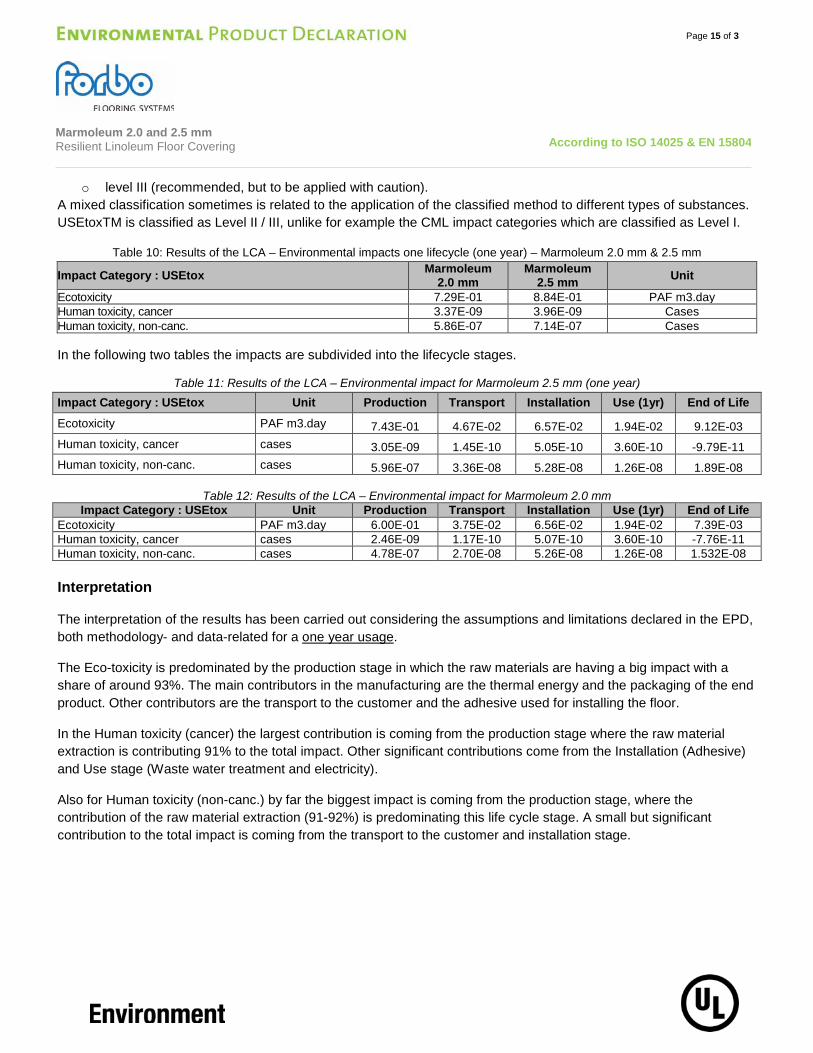
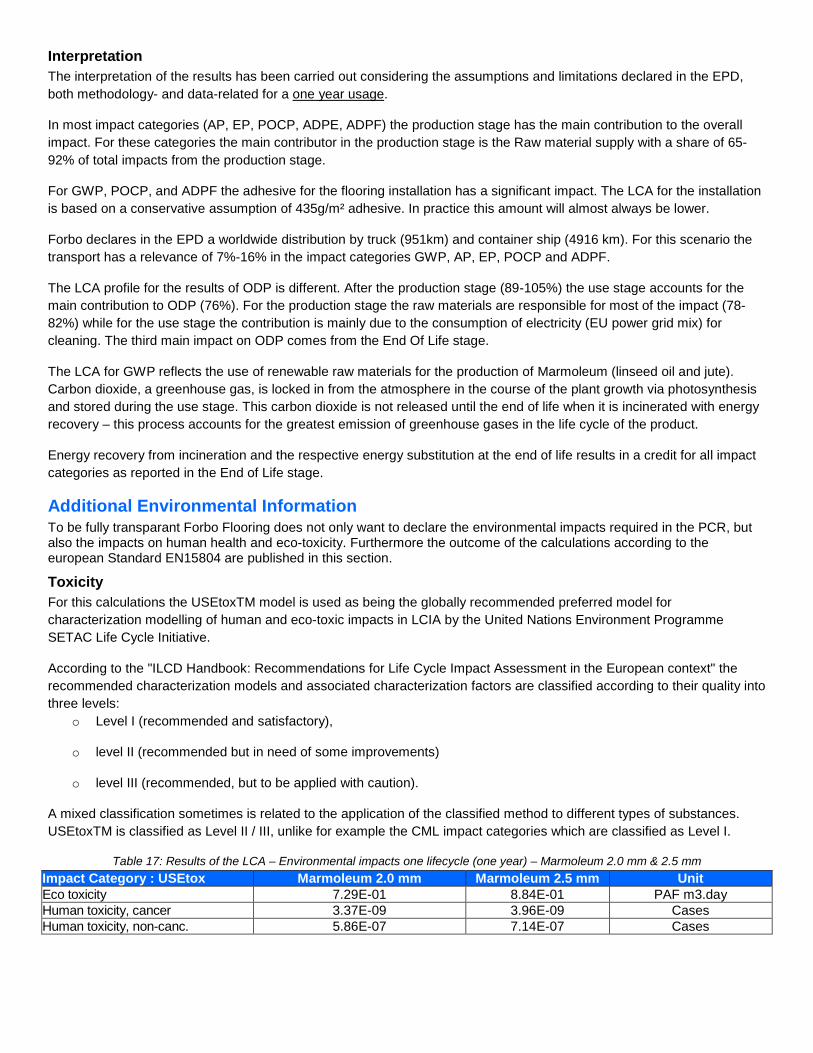
Table 10: Results of the LCA – Environmental impacts one lifecycle (one year) – Marmoleum 2.0 mm & 2.5 mm
Impact Category : USEtox Marmoleum 2.0 mm
Marmoleum 2.5 mm Unit
Ecotoxicity 7.29E-01 8.84E-01 PAF m3.day Human toxicity, cancer 3.37E-09 3.96E-09 Cases Human toxicity, non-canc. 5.86E-07 7.14E-07 Cases In the following two tables the impacts are subdivided into the lifecycle stages.
Table 11: Results of the LCA – Environmental impact for Marmoleum 2.5 mm (one year) Impact Category : USEtox Unit Production Transport Installation Use (1yr) End of Life
Ecotoxicity PAF m3.day 7.43E-01 4.67E-02 6.57E-02 1.94E-02 9.12E-03 Human toxicity, cancer cases 3.05E-09 1.45E-10 5.05E-10 3.60E-10 -9.79E-11 Human toxicity, non-canc. cases 5.96E-07 3.36E-08 5.28E-08 1.26E-08 1.89E-08
Table 12: Results of the LCA – Environmental impact for Marmoleum 2.0 mm Impact Category : USEtox Unit Production Transport Installation Use (1yr) End of Life
Ecotoxicity PAF m3.day 6.00E-01 3.75E-02 6.56E-02 1.94E-02 7.39E-03 Human toxicity, cancer cases 2.46E-09 1.17E-10 5.07E-10 3.60E-10 -7.76E-11 Human toxicity, non-canc. cases 4.78E-07 2.70E-08 5.26E-08 1.26E-08 1.532E-08 Interpretation
The interpretation of the results has been carried out considering the assumptions and limitations declared in the EPD, both methodology- and data-related for a one year usage.
The Eco-toxicity is predominated by the production stage in which the raw materials are having a big impact with a share of around 93%. The main contributors in the manufacturing are the thermal energy and the packaging of the end product. Other contributors are the transport to the customer and the adhesive used for installing the floor.
In the Human toxicity (cancer) the largest contribution is coming from the production stage where the raw material extraction is contributing 91% to the total impact. Other significant contributions come from the Installation (Adhesive) and Use stage (Waste water treatment and electricity).
Also for Human toxicity (non-canc.) by far the biggest impact is coming from the production stage, where the contribution of the raw material extraction (91-92%) is predominating this life cycle stage. A small but significant contribution to the total impact is coming from the transport to the customer and installation stage.
Marmoleum 2.0 and 2.5 mm Resilient Linoleum Floor Covering
According to ISO 14025 & EN 15804
Page 16 of 3
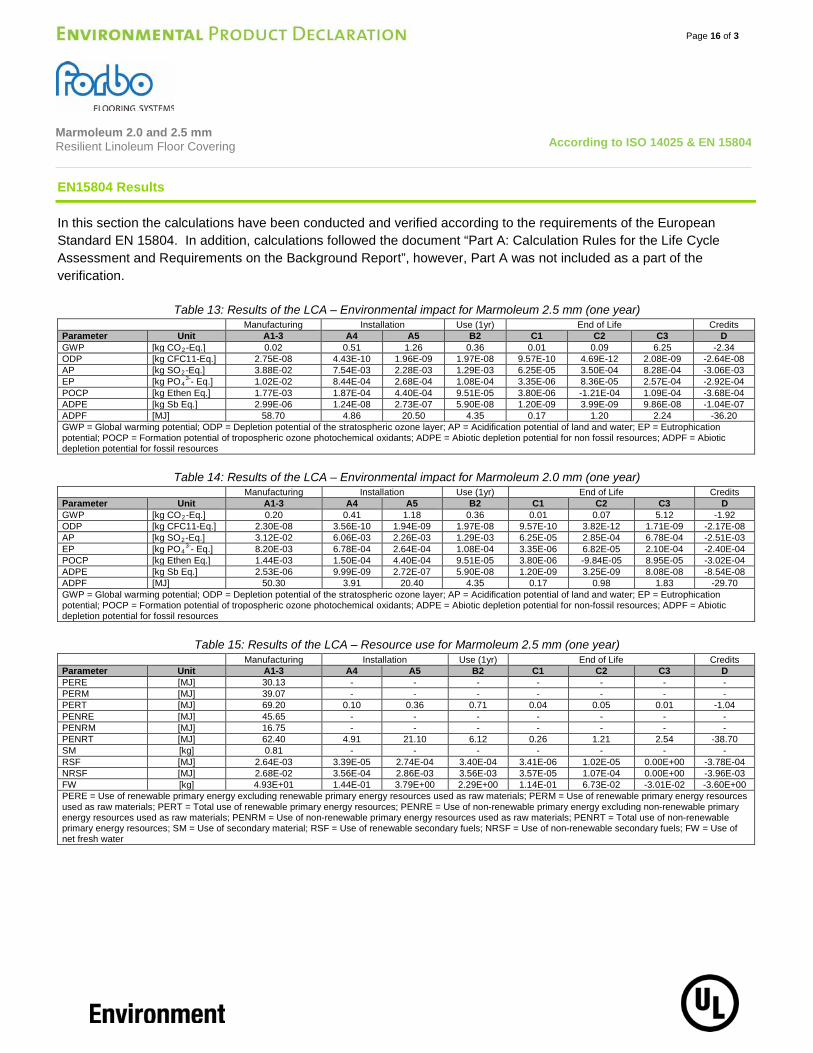
EN15804 Results
In this section the calculations have been conducted and verified according to the requirements of the European Standard EN 15804. In addition, calculations followed the document “Part A: Calculation Rules for the Life Cycle Assessment and Requirements on the Background Report”, however, Part A was not included as a part of the verification.
Table 13: Results of the LCA – Environmental impact for Marmoleum 2.5 mm (one year) Manufacturing Installation Use (1yr) End of Life Credits
Parameter Unit A1-3 A4 A5 B2 C1 C2 C3 D GWP [kg CO2-Eq.] 0.02 0.51 1.26 0.36 0.01 0.09 6.25 -2.34 ODP [kg CFC11-Eq.] 2.75E-08 4.43E-10 1.96E-09 1.97E-08 9.57E-10 4.69E-12 2.08E-09 -2.64E-08 AP [kg SO2-Eq.] 3.88E-02 7.54E-03 2.28E-03 1.29E-03 6.25E-05 3.50E-04 8.28E-04 -3.06E-03 EP [kg PO4
3-- Eq.] 1.02E-02 8.44E-04 2.68E-04 1.08E-04 3.35E-06 8.36E-05 2.57E-04 -2.92E-04 POCP [kg Ethen Eq.] 1.77E-03 1.87E-04 4.40E-04 9.51E-05 3.80E-06 -1.21E-04 1.09E-04 -3.68E-04 ADPE [kg Sb Eq.] 2.99E-06 1.24E-08 2.73E-07 5.90E-08 1.20E-09 3.99E-09 9.86E-08 -1.04E-07 ADPF [MJ] 58.70 4.86 20.50 4.35 0.17 1.20 2.24 -36.20 GWP = Global warming potential; ODP = Depletion potential of the stratospheric ozone layer; AP = Acidification potential of land and water; EP = Eutrophication potential; POCP = Formation potential of tropospheric ozone photochemical oxidants; ADPE = Abiotic depletion potential for non fossil resources; ADPF = Abiotic depletion potential for fossil resources
Table 14: Results of the LCA – Environmental impact for Marmoleum 2.0 mm (one year)
Manufacturing Installation Use (1yr) End of Life Credits Parameter Unit A1-3 A4 A5 B2 C1 C2 C3 D GWP [kg CO2-Eq.] 0.20 0.41 1.18 0.36 0.01 0.07 5.12 -1.92 ODP [kg CFC11-Eq.] 2.30E-08 3.56E-10 1.94E-09 1.97E-08 9.57E-10 3.82E-12 1.71E-09 -2.17E-08 AP [kg SO2-Eq.] 3.12E-02 6.06E-03 2.26E-03 1.29E-03 6.25E-05 2.85E-04 6.78E-04 -2.51E-03 EP [kg PO4
3-- Eq.] 8.20E-03 6.78E-04 2.64E-04 1.08E-04 3.35E-06 6.82E-05 2.10E-04 -2.40E-04 POCP [kg Ethen Eq.] 1.44E-03 1.50E-04 4.40E-04 9.51E-05 3.80E-06 -9.84E-05 8.95E-05 -3.02E-04 ADPE [kg Sb Eq.] 2.53E-06 9.99E-09 2.72E-07 5.90E-08 1.20E-09 3.25E-09 8.08E-08 -8.54E-08 ADPF [MJ] 50.30 3.91 20.40 4.35 0.17 0.98 1.83 -29.70 GWP = Global warming potential; ODP = Depletion potential of the stratospheric ozone layer; AP = Acidification potential of land and water; EP = Eutrophication potential; POCP = Formation potential of tropospheric ozone photochemical oxidants; ADPE = Abiotic depletion potential for non-fossil resources; ADPF = Abiotic depletion potential for fossil resources
Table 15: Results of the LCA – Resource use for Marmoleum 2.5 mm (one year)
Manufacturing Installation Use (1yr) End of Life Credits Parameter Unit A1-3 A4 A5 B2 C1 C2 C3 D PERE [MJ] 30.13 - - - - - - - PERM [MJ] 39.07 - - - - - - - PERT [MJ] 69.20 0.10 0.36 0.71 0.04 0.05 0.01 -1.04 PENRE [MJ] 45.65 - - - - - - - PENRM [MJ] 16.75 - - - - - - - PENRT [MJ] 62.40 4.91 21.10 6.12 0.26 1.21 2.54 -38.70 SM [kg] 0.81 - - - - - - - RSF [MJ] 2.64E-03 3.39E-05 2.74E-04 3.40E-04 3.41E-06 1.02E-05 0.00E+00 -3.78E-04 NRSF [MJ] 2.68E-02 3.56E-04 2.86E-03 3.56E-03 3.57E-05 1.07E-04 0.00E+00 -3.96E-03 FW [kg] 4.93E+01 1.44E-01 3.79E+00 2.29E+00 1.14E-01 6.73E-02 -3.01E-02 -3.60E+00 PERE = Use of renewable primary energy excluding renewable primary energy resources used as raw materials; PERM = Use of renewable primary energy resources used as raw materials; PERT = Total use of renewable primary energy resources; PENRE = Use of non-renewable primary energy excluding non-renewable primary energy resources used as raw materials; PENRM = Use of non-renewable primary energy resources used as raw materials; PENRT = Total use of non-renewable primary energy resources; SM = Use of secondary material; RSF = Use of renewable secondary fuels; NRSF = Use of non-renewable secondary fuels; FW = Use of net fresh water
Marmoleum 2.0 and 2.5 mm Resilient Linoleum Floor Covering
According to ISO 14025 & EN 15804
Page 17 of 3
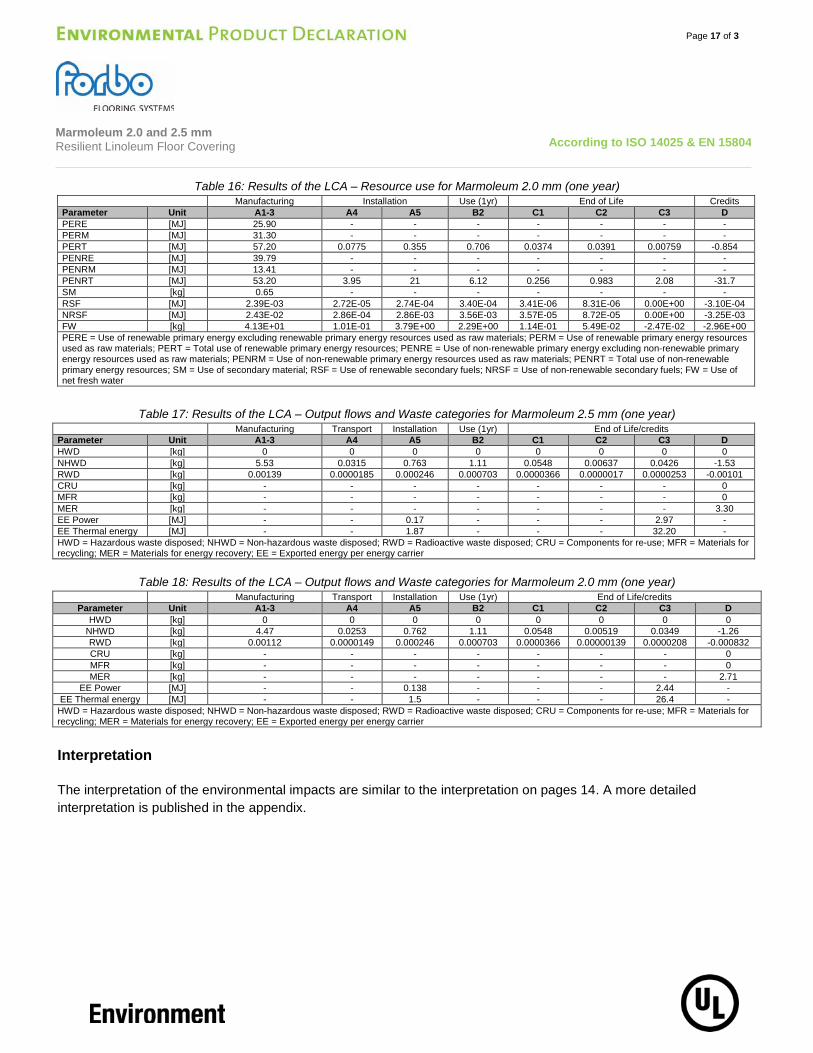
Table 16: Results of the LCA – Resource use for Marmoleum 2.0 mm (one year) Manufacturing Installation Use (1yr) End of Life Credits
Parameter Unit A1-3 A4 A5 B2 C1 C2 C3 D PERE [MJ] 25.90 - - - - - - - PERM [MJ] 31.30 - - - - - - - PERT [MJ] 57.20 0.0775 0.355 0.706 0.0374 0.0391 0.00759 -0.854 PENRE [MJ] 39.79 - - - - - - - PENRM [MJ] 13.41 - - - - - - - PENRT [MJ] 53.20 3.95 21 6.12 0.256 0.983 2.08 -31.7 SM [kg] 0.65 - - - - - - - RSF [MJ] 2.39E-03 2.72E-05 2.74E-04 3.40E-04 3.41E-06 8.31E-06 0.00E+00 -3.10E-04 NRSF [MJ] 2.43E-02 2.86E-04 2.86E-03 3.56E-03 3.57E-05 8.72E-05 0.00E+00 -3.25E-03 FW [kg] 4.13E+01 1.01E-01 3.79E+00 2.29E+00 1.14E-01 5.49E-02 -2.47E-02 -2.96E+00 PERE = Use of renewable primary energy excluding renewable primary energy resources used as raw materials; PERM = Use of renewable primary energy resources used as raw materials; PERT = Total use of renewable primary energy resources; PENRE = Use of non-renewable primary energy excluding non-renewable primary energy resources used as raw materials; PENRM = Use of non-renewable primary energy resources used as raw materials; PENRT = Total use of non-renewable primary energy resources; SM = Use of secondary material; RSF = Use of renewable secondary fuels; NRSF = Use of non-renewable secondary fuels; FW = Use of net fresh water
Table 17: Results of the LCA – Output flows and Waste categories for Marmoleum 2.5 mm (one year)
Manufacturing Transport Installation Use (1yr) End of Life/credits Parameter Unit A1-3 A4 A5 B2 C1 C2 C3 D HWD [kg] 0 0 0 0 0 0 0 0 NHWD [kg] 5.53 0.0315 0.763 1.11 0.0548 0.00637 0.0426 -1.53 RWD [kg] 0.00139 0.0000185 0.000246 0.000703 0.0000366 0.0000017 0.0000253 -0.00101 CRU [kg] - - - - - - - 0 MFR [kg] - - - - - - - 0 MER [kg] - - - - - - - 3.30 EE Power [MJ] - - 0.17 - - - 2.97 - EE Thermal energy [MJ] - - 1.87 - - - 32.20 - HWD = Hazardous waste disposed; NHWD = Non-hazardous waste disposed; RWD = Radioactive waste disposed; CRU = Components for re-use; MFR = Materials for recycling; MER = Materials for energy recovery; EE = Exported energy per energy carrier
Table 18: Results of the LCA – Output flows and Waste categories for Marmoleum 2.0 mm (one year) Manufacturing Transport Installation Use (1yr) End of Life/credits
Parameter Unit A1-3 A4 A5 B2 C1 C2 C3 D HWD [kg] 0 0 0 0 0 0 0 0
NHWD [kg] 4.47 0.0253 0.762 1.11 0.0548 0.00519 0.0349 -1.26 RWD [kg] 0.00112 0.0000149 0.000246 0.000703 0.0000366 0.00000139 0.0000208 -0.000832 CRU [kg] - - - - - - - 0 MFR [kg] - - - - - - - 0 MER [kg] - - - - - - - 2.71
EE Power [MJ] - - 0.138 - - - 2.44 - EE Thermal energy [MJ] - - 1.5 - - - 26.4 - HWD = Hazardous waste disposed; NHWD = Non-hazardous waste disposed; RWD = Radioactive waste disposed; CRU = Components for re-use; MFR = Materials for recycling; MER = Materials for energy recovery; EE = Exported energy per energy carrier
Interpretation
The interpretation of the environmental impacts are similar to the interpretation on pages 14. A more detailed interpretation is published in the appendix.
Marmoleum 2.0 and 2.5 mm Resilient Linoleum Floor Covering
According to ISO 14025 & EN 15804
Page 18 of 3
References
GABI 5 2012 PE INTERNATIONAL AG; GaBi 5: Software-System and Database for Life Cycle Engineering. Copyright, TM. Stuttgart, Echterdingen, 1992-2012.
GABI 5 2012D GaBi 5: Documentation of GaBi 5: Software-System and Database for Life Cycle Engineering. Copyright, TM. Stuttgart, Echterdingen, 1992-2012. http://documentation.gabi-software.com/
NSF International May 22, 2012
Product Category Rule for Environmental Product Declarations Flooring: Carpet, Resilient, Laminate, Ceramic, Wood
UL ENVIRONMENT UL Environment’s Program Operator Rules ERFMI 2008 Final report: LCA, Environmental Information Sheet and Ecodesign Model of Resilient
Flooring by order of ERFMI, PE International, 2008 IBU 2011 PCR - Part A: Calculation rules for the Life Cycle Assessment and Requirements on the
Background Report, Institut Bauen und Umwelt e.V. PE 2012 ILCD Handbook: General guide for Life Cycle Assessment - Detailed guidance
Description of Selected Impact Categories, PE International AG, 2012 European Commission - Joint Research Centre - Institute for Environment and Sustainability: International Reference Life Cycle Data System (ILCD) Handbook - General guide for Life Cycle Assessment - Detailed guidance. First edition March 2010. EUR 24708 EN. Luxembourg. Publications Office of the European Union; 2010
STANDARDS AND LAWS DIN EN ISO 14044 Environmental management - Life cycle assessment - Requirements and guidelines (ISO
14044:2006); German and English version EN ISO 14044 ISO 14025 2006 DIN EN ISO 14025: Environmental labels and declarations — Type III environmental
declarations — Principles and procedures ISO 14040 2006 Environmental management - Life cycle assessment - Principles and framework (ISO 14040);
German and English version EN ISO 14040 CEN/TR 15941 Sustainability of construction works - Environmental product declarations - Methodology for
selection and use of generic data; German version CEN/TR 15941 EN 15804 EN 15804: Sustainability of construction works — Environmental Product Declarations —
Core rules for the product category of construction products ISO 24011 Resilient floor coverings - Specification for plain and decorative linoleum CPR REGULATION (EU) No 305/2011 OF THE EUROPEAN PARLIAMENT AND OF THE
COUNCIL of 9 March 2011 laying down harmonised conditions for the marketing of construction products and repealing Council Directive 89/106/EEC
EN-ISO 10874 Resilient, textile and laminate floor coverings - Classification
Life Cycle Assessment Marmoleum 2.0 and 2.5 mm
LCA study conducted by: Forbo Flooring
Industrieweg 12 1566 JP Assendelft
The Netherlands
August 2012 Authors: Floris Zeitler, Forbo Supported by Peter Shonfield, Julia Goerke
Forbo Flooring BV Industrieweg 12 1566 JP Assendelft, The Netherlands
Tel. +31 (0) 75 6477477 Fax +31 (0) 75 6477707
E-mail [email protected] Internet www.forbo-flooring.com Supported by: PE INTERNATIONAL AG
Hauptstraße 111 – 115 D – 70771 Leinfelden – Echterdingen
Tel. +49 (0) 711 34 18 17 – 0 Fax +49 (0) 711 34 18 17 – 25
E-mail [email protected] Internet www.pe-international.com
Nomenclature Abbreviation Explanation ADP Abiotic Depletion Potential AP Acidification Potential BLBSB Benefits and Loads Beyond the System Boundary CRU Components for re-use EE Exported energy per energy carrier EP Eutrophication Potential EPD Environmental Product Declaration FW Use of net fresh water GWP Global Warming Potential HWD Hazardous waste disposed LCA Life Cycle Assessment MER Materials for energy recovery MFR Materials for recycling NRSF Use of non-renewable secondary fuels ODP Ozone Layer Depletion Potential PENRE Use of non-renewable primary energy excluding non-renewable primary energy resources used as raw
materials PENRM Use of non-renewable primary energy resources used as raw materials PENRT Total use of non-renewable primary energy resources PERE Use of renewable primary energy excluding renewable primary energy resources used as raw materials PERM Use of renewable primary energy resources used as raw materials PERT Total use of renewable primary energy resources PCR Product Category Rules POCP Photochemical Ozone Creation Potential RSF Use of renewable secondary fuels RSL Reference Service Life RWD Radioactive waste disposed SM Use of secondary material
General The present LCA study of the company Forbo Flooring, a manufacturer of resilient floor coverings, has been performed by Forbo Flooring under support of PE International and has been conducted according to the requirements of the European Standard EN15804 following the document “Part A: Calculation Rules for the Life Cycle Assessment and Requirements on the Background Report”. The LCA report was sent to verification on 10/17/12
Scope This document is the LCA report for the “Environmental Product Declaration” (EPD) of "Marmoleum 2.0 & 2.5 mm". The provision of an LCA report is required for each EPD of the EPD-program holder (UL Environment). This document shows how the calculation rules were applied and describes additional LCA information on the Life Cycle Assessment in accordance with the requirements of ISO 14040 series.
Content, structure and accessibility of the LCA report The LCA report provides a systematic and comprehensive summary of the project documentation supporting the verification of an EPD. The report documents the information on which the Life Cycle Assessment is based, while also ensuring the additional information contained within the EPD complies with the requirements of ISO 14040 series. The LCA report contains all of the data and information of importance for the details published in the EPD. Care is been given to all explanations as to how the data and information declared in the EPD arises from the Life Cycle Assessment. The verification of the EPD is aligned towards the structure of the rule document based on ISO 14025 and EN15804.
Goal of the study The reason for performing this LCA study is to publish an EPD based on EN 15804 and ISO 14025. This study contains the calculation and interpretation of the LCA results for Marmoleum complying with EN-ISO 24011 in two different thicknesses:
- Marmoleum 2.5 mm - Marmoleum 2.0 mm
Manufactured by Forbo Flooring BV Industrieweg 12 1566JP Assendelft The Netherlands. The following life cycle stages were considered:
- Product stage - Transport stage - Installation stage - Use stage - End-of-life stage - Benefits and loads beyond the product system boundary
The main purpose of EPD is for use in business-to-business communication. As all EPD are publicly available on the website of UL Environment and therefore are accessible to the end consumer they can also be used in business-to-consumer communication. The intended use of the EPD is to communicate environmentally related information and LCA results to support the assessment of the sustainable use of resources and of the impact of construction works on the environment
Scope of the study Declared / functional unit The declaration refers to the declared/functional unit of 1m² installed flooring product.
Declaration of construction products classes The LCA report refers to a manufacturer declaration of type 1a): Declaration of a specific product from a manufacturer’s plant. These products are also known under the following brand names:
− Marmoleum − Artoleum − Striato − Walton
They are produced at the following manufacturing site: Forbo Flooring BV Industrieweg 12 1566JP Assendelft The Netherlands
Product Definition Product Classification and description This declaration covers a broad range of designs and colors. Marmoleum is a resilient floor covering complying with all the requirements of EN-ISO 24011: Specification for plain and decorative linoleum. Marmoleum is made from natural raw materials making it preferable ecological floor covering with a beautiful and colorful design. The key raw materials include linseed oil, which comes from the flax plant seeds, gum rosin from pine trees, recycled wood waste of wood from controlled forests, limestone and jute from the jute plant which is used for the backing. Because of the use of natural raw materials Marmoleum is biodegradable.
Linoleum is produced by Forbo Flooring for more than 150 years and our well known brand Marmoleum is sold worldwide. This declaration refers to Marmoleum sheet of 2.0 and 2.5 mm nominal thickness.
Marmoleum is build up in 3 layers as illustrated in the figure 1.These three layers form one homogeneous product by the cross linking bondings formed during the oxidative curing process :
1. Surface layer: This layer gives Marmoleum its design and color. After finishing the product at the trimming department a factory finish is applied to protect the surface layer.
2. Intermediate layer: This layer is calendared on the jute. 3. Backing: The backing is woven jute.
Range of application Marmoleum is classified in accordance with EN-ISO 24011 to be installed in the following use areas defined in EN–ISO 10874:
Area of application 2.0 mm thickness 2.5 mm thickness
Domestic
Class 23
Class 23
Commercial
Class 32
Class 34
Industrial
Class 41
Class 43
Product Standard The products considered in this EPD have the following technical specifications:
o Meets or exceeds all technical requirements as set forth in ASTM F 2034 Standard Specification for Linoleum Sheet Flooring.
o Compliant with CHPS 01350 requirements for VOC emissions and indoor air quality. o Meets or exceeds all technical requirements as set in EN-ISO 24011 Specification for plain and decorative
Linoleum.
Marmoleum meets the requirements of EN 14041 EN 13501-1 Reaction to fire Cfl - s1 EN 13893 Slip resistance DS: ≥ 0.30 EN 1815 Body voltage < 2 kV EN 12524 Thermal conductivity 0.17 W/mK
Fire Testing: o Class 1 when tested in accordance with ASTM E 648/NFPA 253, Standard Test Method for Critical Radiant Flux. o Meets 450 or less when tested in accordance with ASTM E 662/NFPA 258, Standard Test Method for Smoke
Density. o Class C when tested in accordance to ASTM E 84/NFPA 255, Standard Test Method for Surface Burning
Characteristics. o FSC1-150; SD-160 when tested in accordance to CAN/ULC S102.2, Standard Test Method for Flame Spread
Rating and Smoke Development.
Accreditation o ISO 9001 Quality Management System and ISO 14001 Environmental Management System o OHSAS 18001 Occupational Health and Safety Management Systems o SMART o SWAN o Nature Plus o Good Environmental Choice Australia
Delivery status Characteristics Nominal Value Unit Product thickness 2.5
2.0 mm mm
Product Weight 2.5 mm 2.0 mm
3000 2400
g/m2
Rolls Width Length
2.00 < 32
meter
Material Content Component Material Availability Amount [%] Origin
Binder Linseed oil Gum rosin Tall oil
Bio based crop Bio based crop
Bio based waste product from paper Industry
19 2 11
USA/Canada/Europe Indonesia/China
USA
Filler Wood flour Calcium carbonate Reused Marmoleum
Bio based waste product from wood processing
Abundant mineral
22
24 10
Germany
Germany Internal
Pigment Titanium dioxide Various other pigments
Limited mineral Limited mineral
2 1
Global Global
Backing Jute Bio based crop 8 India/Bangladesh Finish Lacquer Fossil limited 1 Netherlands
Production of Main Materials − Linseed oil : Linseed oil is obtained by pressing the seeds of the flax plant. After filtering a clear golden yellow
liquid remains. − Gum rosin : Rosin is obtained by wounding pine trees. The crude gum is collected and is separated into
turpentine and rosin by distillation. − Tall oil : Tall oil is a post industrial waste product coming from the paper industry and is consisting of vegetable
oil and rosin. − Wood flour : Post industrial bio based soft wood waste from the wood industry, which is milled into flour. − Calcium carbonate : An abundant mineral found in all parts of the world as the chief substance in rocks (i.e.,
marble and limestone). It can be ground to varying particle sizes and is widely used as filler. − Reused Marmoleum : Waste material coming from the Marmoleum production which is reused. − Titanium dioxide : A white pigment produced from the mineral rutile, a naturally occurring form of titanium
dioxide. The production of the pigment is a large-scale chemical process − Various other pigments : The vast majority of the used colour pigments are iron oxide based. − Jute : Jute fibre is extracted from the stem of the jute plant by floating it in water. For yarn production fibre bands
are obtained by carding, stretching, spinning, warping and sizing. Finally the yarn is woven. − Lacquer : The factory applied lacquer – Topshield 2 – is a waterborne UV cured double layer factory coating –
acrylate hybrid dispersion.
Production of the Floor Covering Marmoleum is produced in several stages starting with the oxidation of linseed oil mixed with tall oil and rosin. With the influence of oxygen from the atmosphere a tough sticky material is obtained called linoleum cement. The linoleum cement is stored in containers for a few days for further reaction and after this it is mixed with wood flour, calcium carbonate, reused waste (if applicable), titanium dioxide and pigments. This mixture is calendared on a jute substrate and stored in drying rooms, to cure till the required hardness is reached. After approximately 14 days the material is taken out from the drying room to the trimming department where the factory finish is applied on the surface of the product and the end inspection is done. Finally the edges are trimmed and the sheet is cut to length into rolls of approximately 32 meter. The trimmings and the rejected product are reused.
Health, Safety and Environmental Aspects during Production
o ISO 14001 Environmental Management System o OHSAS 18001 Occupational Health and Safety Management Systems
Production Waste Rejected material and the cuttings of the trimming stage are being reused in the manufacturing process. Packaging materials are being collected separately and externally recycled.
Delivery and Installation of the Floor Covering Delivery A worldwide distribution by truck and container ship is considered. On average every square meter of Marmoleum is transported as follows:
o Transport distance 40 t truck 694 km o Transport distance 7.5t truck (Fine distribution) 257 km o Capacity utilization trucks (including empty runs) 85 % o Transport distance Ocean ship 4916 km o Capacity utilization Ocean ship 48%
Figure 2 : Illustration of the Production process
Installation Because of the specific techniques used during the installation of Marmoleum 6% of the material is cut off as installation waste. For installation of Marmoleum on the floor a worst case scenario has been modeled (assuming 0.435 kg/m2 of adhesive is required). In practice this amount will almost always be lower. Waste during the installation process may be recycled as floor covering through the manufacturers’ facilities or thermally recycled in a waste incineration plant. Since the major part of Marmoleum is sold in Europe the European electricity grid mix is used in the calculations for the energy recovery during incineration.
Health, Safety and Environmental Aspects during Installation Forbo flooring recommends using (low) zero emission adhesives for installing Marmoleum.
Waste Waste during the installation process may be recycled as floor covering through the manufacturers’ facilities or thermally recycled in a waste incineration plant. Since the major part of Marmoleum is sold in Europe the European electricity grid mix is used in the calculations for the energy recovery during incineration.
Packaging Cardboard tubes and packaging paper can be collected separately and should be used in a local recycling process. In the calculation model 100% incineration is taken into account for which there is a credit received.
Use stage The service lifetime of a floor covering for a certain application on a floor is too widespread to give one common number. For this EPD model the reference service lifetime (RSL) is set to one year. This means that all impacts for the use phase are based on the cleaning and maintenance model for one year. Depending on the area of use, the technical lifetime advised by the manufacturer and the estimated time on the floor by the customer, the service lifetime can be determined. The use phase impacts should be calculated with the foreseen service life to arrive at the total environmental impact.
Cleaning and Maintenance
Level of use Cleaning Process Cleaning Frequency Consumption of energy and resources
Commercial/Residential/Industrial Vacuuming Twice a week Electricity Damp mopping Once a week Hot water
Neutral detergent For the calculations the following cleaning regime is considered:
- Dry cleaning with a 1.5 kW vacuum cleaner for 0.21 min/m2, twice a week. This equates to 0.55 kWh/m2*year.
- Once a week wet cleaning with 0.062 l/m2 water and 0.0008 kg/m2 detergent. This result in the use of 3.224 l/m2*year water and 0.04 kg/m2*year detergent. The wet cleaning takes place without power machine usage. Waste water treatment of the arising waste water from cleaning is considered.
The cleaning regime that is recommended in practice will be highly dependent on the use of the premises where the floor covering is installed. In high traffic areas more frequent cleaning will be needed compared to areas where there is low traffic. The use of an entrance mat of at least four steps will reduce the cleaning frequency. The cleaning regime used in the calculations is suitable for high traffic areas.
Prevention of Structural Damage All newly laid floors should be covered and protected from with a suitable non-staining protective covering if other building activities are still in progress. Use protective feet on chairs and tables to reduce scratching. Castor wheels should be suitable for resilient floor coverings Health Aspects during Usage Marmoleum is complying with:
o AgBB requirements o French Act Grenelle: A+ o CHPS section 01350
End of Life The deconstruction of installed Marmoleum from the floor is done mechanically and the electrical energy needed for this is estimated to be 0.03 kWh/sqm. This amount of energy is taken into account for the calculations. For the end of life stage no landfilling is taken into account, since the vast majority of the countries in which Marmoleum is sold are having a non landfill policy. Because of the high calorific value of Marmoleum the incineration is very profitable as a waste to energy conversion.
Life Cycle Assessment A full Life Cycle Assessment has bee carried out according to ISO 14040 and ISO 14044. The following Life Cycle Stages are assessed :
o Production Stage (Raw material acquisition, transportation to Manufacturing and Manufacturing) o Transport Gate to User o Installation Stage o Use Stage o End of Life Stage
Raw Material Extraction and
Processing
Energies with regional
reference
Coating,
Calendaring,
Drying,
Trimming
Transport
Transport
Installation loss
&
Adhesive at laying
Cleaning regime Transport Incineration
Production Transport Installation Use End-of Life
Figure 3 : Flow chart of the Life Cycle Assessment
Description of the declared Functional Unit The functional unit is one square meter of installed product and the use stage is considered for one year of service life.
Cut off Criteria The cut-off criteria shall be 1% of renewable and non-renewable primary energy usage and 1% of the total mass of the unit process. The total neglected input flows per module shall be a maximum of 5% of energy usage and mass.
In practice, in this assessment, all data from the production data acquisition are considered, i.e. all raw materials used as per formulation, use of water, electricity and other fuels, the required packaging materials, and all direct production waste. Transport data on all considered inputs and output material are also considered.
LCA Data As a general rule, specific data derived from specific production processes or average data derived from specific production processes have been used as the first choice as a basis for calculating an EPD.
For life cycle modeling of the considered products, the GaBi 5 Software System for Life Cycle Engineering, developed by PE INTERNATIONAL AG, has been used. All relevant LCA datasets are taken from the GaBi 5 software database. The datasets from the database GaBi are documented in the online documentation. To ensure comparability of results in the LCA, the basic data of GaBi database were used for energy, transportation and auxiliary materials.
Data Quality The requirements for data quality and LCA data correspond to the specifications of the PCR.
Foreground data are based on 1 year averaged data (year 2011). The reference ages of LCA datasets vary but are given in the table in the Appendix. The time period over which inputs to and outputs from the system is accounted for is 100 years from the year for which the data set is deemed representative. The technological LCA of the collected data reflects the physical reality of the declared product. The datasets are complete, conform to the system boundaries and the criteria for the exclusion of inputs and outputs and are geographical representative for the supply chain of Forbo flooring.
For life cycle modeling of the considered products the GaBi 5 Software System for Life Cycle Engineering, developed by
PE INTERNATIONAL AG, is used. All relevant LCA datasets are taken from the GaBi 5 software database. The last revision of the used data sets took place within the last 10 years.
Table 3: LCA datasets used in the LCA model Data set Region Reference year Linseed oil Germany 2010 Limestone flour Germany 2010 Tall oil Europe 2010 Iron oxide Germany 2010 Pigment Germany 2007 Titanium dioxide Europe 2010 Wood flour Europe 2006 Colophony France 2010 Jute India 2010 Urethane / acrylic hybrid dispersion Europe 2005 Water (desalinated; deionised) Germany 2010 Detergent (ammonia based) Germany 2006 Adhesive for resilient flooring Germany 2010 Waste incineration of linoleum Europe 2006 Electricity from Hydro power Germany 2008 Power grid mix Europe 2008 Thermal energy from natural gas Netherlands 2008 Thermal energy from natural gas Europe 2008 Trucks Global 2010 Municipal waste water treatment (Sludge incineration). Germany 2010 Container ship Global 2010 Diesel mix at refinery Europe 2008 Heavy fuel oil at refinery (1.0wt.% S) Europe 2008 Corrugated board Europe 2002 Kraftliner (paper) Europe 2006 The documentation of the LCA data sets can be taken from the GaBi documentation. System Boundaries Production Stage includes provision of all materials, products and energy, packaging processing and its transport, as well as waste processing up to the end-of waste state or disposal of final residues during the product stage. Transport and Installation Stage includes provision of all materials, products and energy, as well as waste processing up to the end-of-waste state or disposal of final residues during the construction stage. These information modules also include all impacts and aspects related to any losses during this construction stage (i.e. production, transport, and waste processing and disposal of the lost products and materials). For the transportation a worldwide distribution is considered. Use Stage includes provision and transport of all materials, products and related energy and water use, as well as waste processing up to the end-of-waste state or disposal of final residues during this part of the use stage. These information modules also include all impacts and aspects related to the losses during this part of the use stage (i.e. production, transport, and waste processing and disposal of the lost products and materials). End of Life Stage includes provision and all transports, provision of all materials, products and related energy and water use. It also includes any declared benefits and loads from net flows leaving the product system that have not been allocated as co-products and that have passed the end-of-waste state in the form of reuse, recovery and/or recycling potentials.
Power mix The selection of LCA data for the electricity generation is in line with the PCR.
The products are manufactured in Assendelft, the Netherlands. The GaBi 5 Hydropower dataset has therefore been used (reference year 2008). The energy supplier is providing Forbo with a certificate every year.
CO2-Certificates No CO2-certificates are considered in this study.
Allocations In the present study some allocations have been made. Detailed explanations can be found in the chapters below.
Co-product allocation No co-product allocation occurs in the product system.
Allocation of multi-Input processes The Production and End of Life stage include incineration plants. In these processes different products are treated together within a process. The allocation procedures followed in these cases are based on a physical classification of the mass flows or calorific values.
Credits from energy substitution are allocated to the production stage, because the gained energy from energy substitution is lower than the energy input in this stage. The same quality of energy is considered.
Allocation procedure of reuse, recycling and recovery The installation waste and end of life waste is fed into incineration processes. Incineration processes include cogeneration processes which give thermal and power energy as outputs. It is assumed that this recovered energy offsets that produced by the European average grid mix and thermal energy generation from natural gas.
The LCA dataset used to model the incineration of Marmoleum is based on data developed by European Resilient Flooring Manufacturers’ Institute (ERFMI) and is specific to linoleum flooring products. This indicates that 250 kWh/tonne electricity and 9744 MJ/tonne thermal energy is recovered during incineration. This model is part of the ERFMI 2008 LCA study on resilient floorings; critical reviewed by Dr ir Jeroen Guinée (Institute of Environmental Sciences CML).
Description of the allocation processes in the LCA report The description of allocation rules in of this LCA report meets the requirements of the PCR.
Description of the unit processes in the LCA report The modeling of the unit processes reported for the LCA are documented in a transparent way, respecting the confidentiality of the data present in the LCA report.
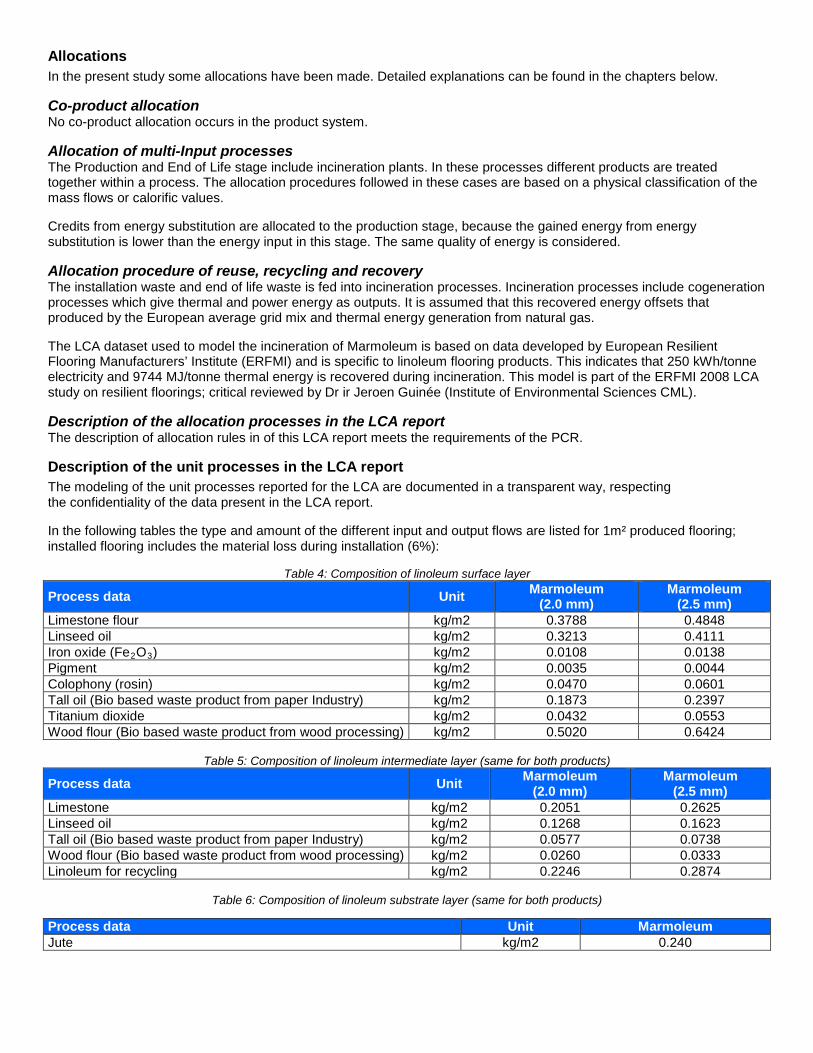
In the following tables the type and amount of the different input and output flows are listed for 1m² produced flooring; installed flooring includes the material loss during installation (6%):
Table 4: Composition of linoleum surface layer
Process data Unit Marmoleum (2.0 mm)
Marmoleum (2.5 mm)
Limestone flour kg/m2 0.3788 0.4848 Linseed oil kg/m2 0.3213 0.4111 Iron oxide (Fe2O3) kg/m2 0.0108 0.0138 Pigment kg/m2 0.0035 0.0044 Colophony (rosin) kg/m2 0.0470 0.0601 Tall oil (Bio based waste product from paper Industry) kg/m2 0.1873 0.2397 Titanium dioxide kg/m2 0.0432 0.0553 Wood flour (Bio based waste product from wood processing) kg/m2 0.5020 0.6424
Table 5: Composition of linoleum intermediate layer (same for both products)
Process data Unit Marmoleum (2.0 mm)
Marmoleum (2.5 mm)
Limestone kg/m2 0.2051 0.2625 Linseed oil kg/m2 0.1268 0.1623 Tall oil (Bio based waste product from paper Industry) kg/m2 0.0577 0.0738 Wood flour (Bio based waste product from wood processing) kg/m2 0.0260 0.0333 Linoleum for recycling kg/m2 0.2246 0.2874
Table 6: Composition of linoleum substrate layer (same for both products)
Process data Unit Marmoleum Jute kg/m2 0.240
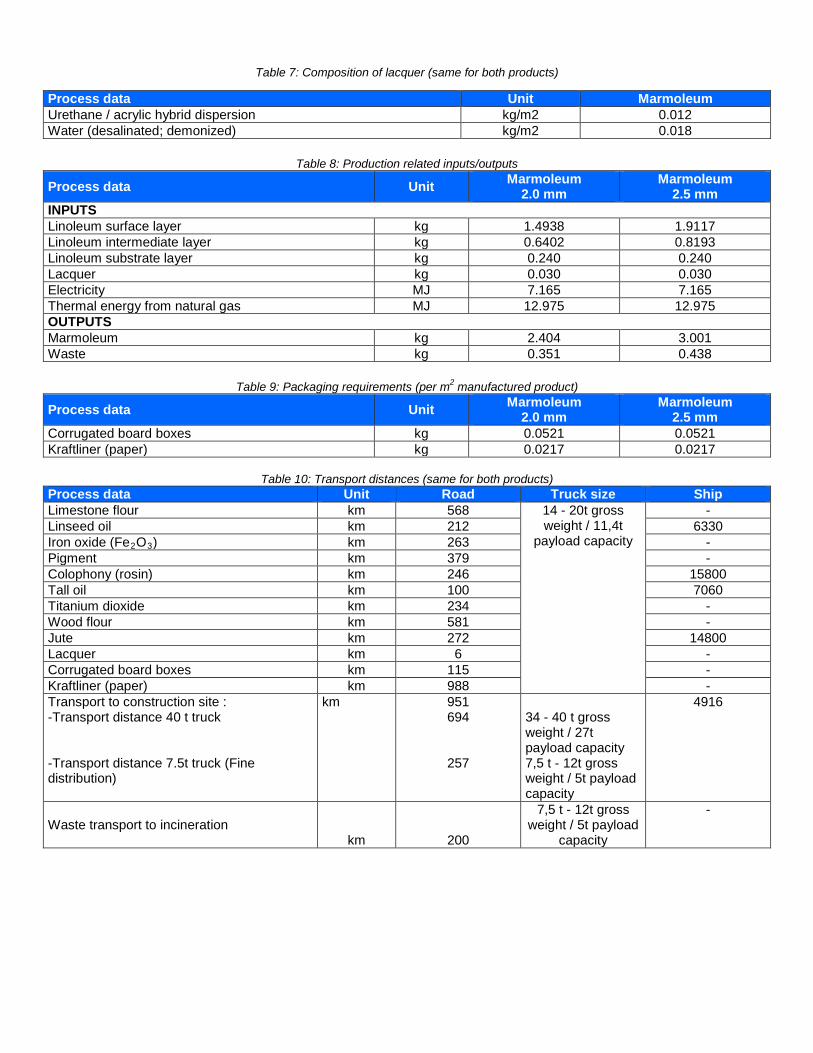
Table 7: Composition of lacquer (same for both products)
Table 8: Production related inputs/outputs
Process data Unit Marmoleum 2.0 mm
Marmoleum 2.5 mm
INPUTS Linoleum surface layer kg 1.4938 1.9117 Linoleum intermediate layer kg 0.6402 0.8193 Linoleum substrate layer kg 0.240 0.240 Lacquer kg 0.030 0.030 Electricity MJ 7.165 7.165 Thermal energy from natural gas MJ 12.975 12.975 OUTPUTS Marmoleum kg 2.404 3.001 Waste kg 0.351 0.438
Table 9: Packaging requirements (per m2 manufactured product)
Process data Unit Marmoleum 2.0 mm
Marmoleum 2.5 mm
Corrugated board boxes kg 0.0521 0.0521 Kraftliner (paper) kg 0.0217 0.0217
Table 10: Transport distances (same for both products) Process data Unit Road Truck size Ship Limestone flour km 568 14 - 20t gross
weight / 11,4t payload capacity
- Linseed oil km 212 6330 Iron oxide (Fe2O3) km 263 - Pigment km 379 - Colophony (rosin) km 246 15800 Tall oil km 100 7060 Titanium dioxide km 234 - Wood flour km 581 - Jute km 272 14800 Lacquer km 6 - Corrugated board boxes km 115 - Kraftliner (paper) km 988 - Transport to construction site : -Transport distance 40 t truck -Transport distance 7.5t truck (Fine distribution)
km 951 694
257
34 - 40 t gross weight / 27t payload capacity 7,5 t - 12t gross weight / 5t payload capacity
4916
Waste transport to incineration km 200
7,5 t - 12t gross weight / 5t payload
capacity
-
Process data Unit Marmoleum Urethane / acrylic hybrid dispersion kg/m2 0.012 Water (desalinated; demonized) kg/m2 0.018
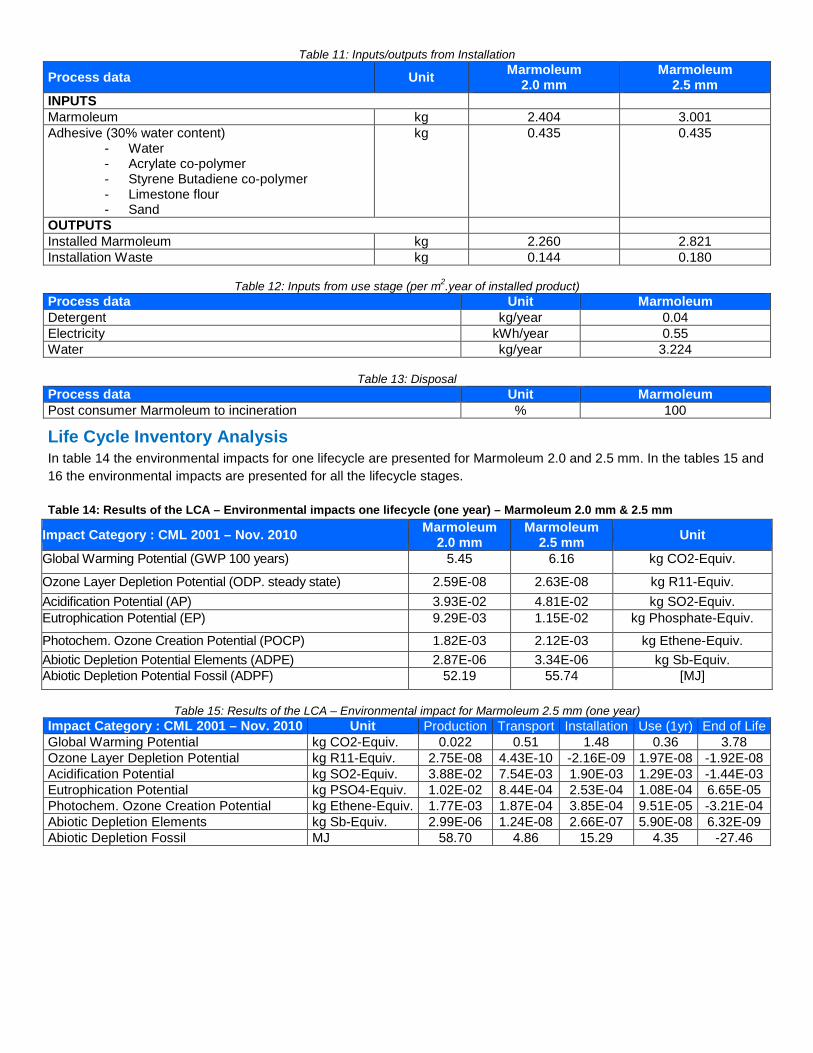
Table 11: Inputs/outputs from Installation
Process data Unit Marmoleum 2.0 mm
Marmoleum 2.5 mm
INPUTS Marmoleum kg 2.404 3.001 Adhesive (30% water content)
- Water - Acrylate co-polymer - Styrene Butadiene co-polymer - Limestone flour - Sand
kg 0.435 0.435
OUTPUTS Installed Marmoleum kg 2.260 2.821 Installation Waste kg 0.144 0.180
Table 12: Inputs from use stage (per m2.year of installed product) Process data Unit Marmoleum Detergent kg/year 0.04 Electricity kWh/year 0.55 Water kg/year 3.224
Table 13: Disposal Process data Unit Marmoleum Post consumer Marmoleum to incineration % 100
Life Cycle Inventory Analysis In table 14 the environmental impacts for one lifecycle are presented for Marmoleum 2.0 and 2.5 mm. In the tables 15 and 16 the environmental impacts are presented for all the lifecycle stages. Table 14: Results of the LCA – Environmental impacts one lifecycle (one year) – Marmoleum 2.0 mm & 2.5 mm
Impact Category : CML 2001 – Nov. 2010 Marmoleum 2.0 mm
Marmoleum 2.5 mm Unit
Global Warming Potential (GWP 100 years) 5.45 6.16 kg CO2-Equiv.
Ozone Layer Depletion Potential (ODP. steady state) 2.59E-08 2.63E-08 kg R11-Equiv. Acidification Potential (AP) 3.93E-02 4.81E-02 kg SO2-Equiv. Eutrophication Potential (EP) 9.29E-03 1.15E-02 kg Phosphate-Equiv.
Photochem. Ozone Creation Potential (POCP) 1.82E-03 2.12E-03 kg Ethene-Equiv. Abiotic Depletion Potential Elements (ADPE) 2.87E-06 3.34E-06 kg Sb-Equiv. Abiotic Depletion Potential Fossil (ADPF) 52.19 55.74 [MJ]
Table 15: Results of the LCA – Environmental impact for Marmoleum 2.5 mm (one year) Impact Category : CML 2001 – Nov. 2010 Unit Production Transport Installation Use (1yr) End of Life Global Warming Potential kg CO2-Equiv. 0.022 0.51 1.48 0.36 3.78 Ozone Layer Depletion Potential kg R11-Equiv. 2.75E-08 4.43E-10 -2.16E-09 1.97E-08 -1.92E-08 Acidification Potential kg SO2-Equiv. 3.88E-02 7.54E-03 1.90E-03 1.29E-03 -1.44E-03 Eutrophication Potential kg PSO4-Equiv. 1.02E-02 8.44E-04 2.53E-04 1.08E-04 6.65E-05 Photochem. Ozone Creation Potential kg Ethene-Equiv. 1.77E-03 1.87E-04 3.85E-04 9.51E-05 -3.21E-04 Abiotic Depletion Elements kg Sb-Equiv. 2.99E-06 1.24E-08 2.66E-07 5.90E-08 6.32E-09 Abiotic Depletion Fossil MJ 58.70 4.86 15.29 4.35 -27.46
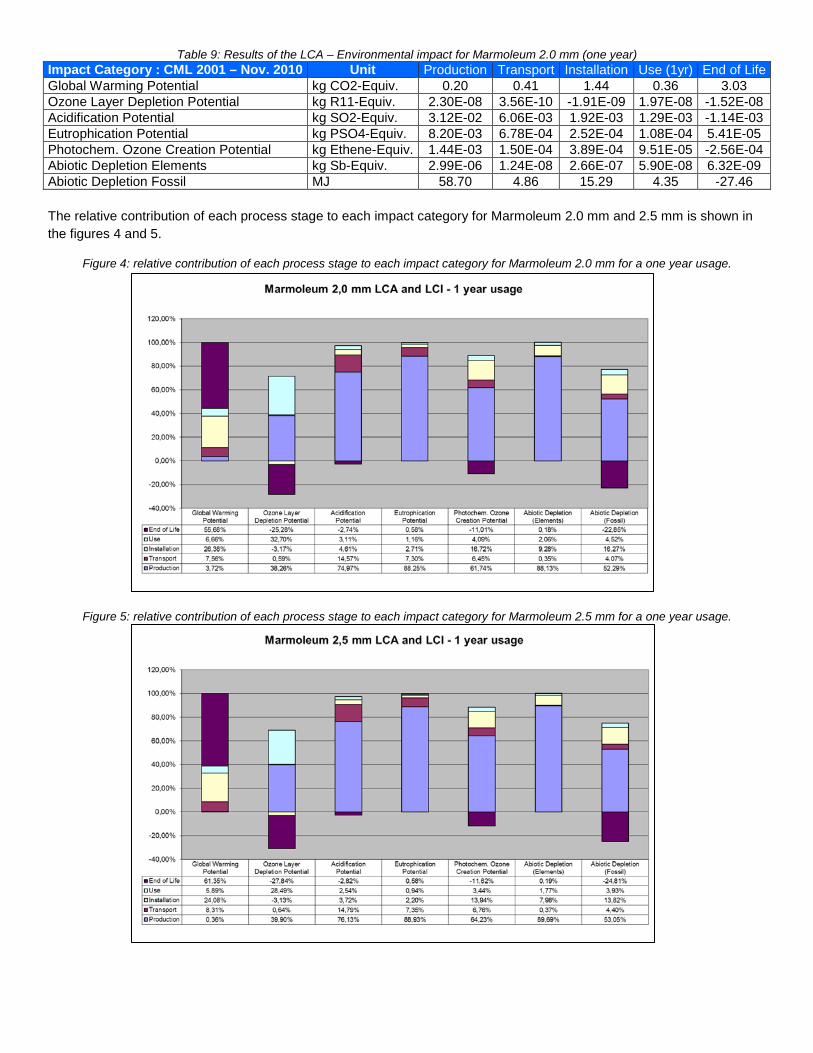
Table 9: Results of the LCA – Environmental impact for Marmoleum 2.0 mm (one year) Impact Category : CML 2001 – Nov. 2010 Unit Production Transport Installation Use (1yr) End of Life Global Warming Potential kg CO2-Equiv. 0.20 0.41 1.44 0.36 3.03 Ozone Layer Depletion Potential kg R11-Equiv. 2.30E-08 3.56E-10 -1.91E-09 1.97E-08 -1.52E-08 Acidification Potential kg SO2-Equiv. 3.12E-02 6.06E-03 1.92E-03 1.29E-03 -1.14E-03 Eutrophication Potential kg PSO4-Equiv. 8.20E-03 6.78E-04 2.52E-04 1.08E-04 5.41E-05 Photochem. Ozone Creation Potential kg Ethene-Equiv. 1.44E-03 1.50E-04 3.89E-04 9.51E-05 -2.56E-04 Abiotic Depletion Elements kg Sb-Equiv. 2.99E-06 1.24E-08 2.66E-07 5.90E-08 6.32E-09 Abiotic Depletion Fossil MJ 58.70 4.86 15.29 4.35 -27.46 The relative contribution of each process stage to each impact category for Marmoleum 2.0 mm and 2.5 mm is shown in the figures 4 and 5.
Figure 4: relative contribution of each process stage to each impact category for Marmoleum 2.0 mm for a one year usage.
Figure 5: relative contribution of each process stage to each impact category for Marmoleum 2.5 mm for a one year usage.
Interpretation The interpretation of the results has been carried out considering the assumptions and limitations declared in the EPD, both methodology- and data-related for a one year usage.
In most impact categories (AP, EP, POCP, ADPE, ADPF) the production stage has the main contribution to the overall impact. For these categories the main contributor in the production stage is the Raw material supply with a share of 65-92% of total impacts from the production stage.
For GWP, POCP, and ADPF the adhesive for the flooring installation has a significant impact. The LCA for the installation is based on a conservative assumption of 435g/m² adhesive. In practice this amount will almost always be lower.
Forbo declares in the EPD a worldwide distribution by truck (951km) and container ship (4916 km). For this scenario the transport has a relevance of 7%-16% in the impact categories GWP, AP, EP, POCP and ADPF.
The LCA profile for the results of ODP is different. After the production stage (89-105%) the use stage accounts for the main contribution to ODP (76%). For the production stage the raw materials are responsible for most of the impact (78-82%) while for the use stage the contribution is mainly due to the consumption of electricity (EU power grid mix) for cleaning. The third main impact on ODP comes from the End Of Life stage.
The LCA for GWP reflects the use of renewable raw materials for the production of Marmoleum (linseed oil and jute). Carbon dioxide, a greenhouse gas, is locked in from the atmosphere in the course of the plant growth via photosynthesis and stored during the use stage. This carbon dioxide is not released until the end of life when it is incinerated with energy recovery – this process accounts for the greatest emission of greenhouse gases in the life cycle of the product.
Energy recovery from incineration and the respective energy substitution at the end of life results in a credit for all impact categories as reported in the End of Life stage.
Additional Environmental Information To be fully transparant Forbo Flooring does not only want to declare the environmental impacts required in the PCR, but also the impacts on human health and eco-toxicity. Furthermore the outcome of the calculations according to the european Standard EN15804 are published in this section.
Toxicity For this calculations the USEtoxTM model is used as being the globally recommended preferred model for characterization modelling of human and eco-toxic impacts in LCIA by the United Nations Environment Programme SETAC Life Cycle Initiative. According to the "ILCD Handbook: Recommendations for Life Cycle Impact Assessment in the European context" the recommended characterization models and associated characterization factors are classified according to their quality into three levels:
o Level I (recommended and satisfactory),
o level II (recommended but in need of some improvements)
o level III (recommended, but to be applied with caution).
A mixed classification sometimes is related to the application of the classified method to different types of substances. USEtoxTM is classified as Level II / III, unlike for example the CML impact categories which are classified as Level I.
Table 17: Results of the LCA – Environmental impacts one lifecycle (one year) – Marmoleum 2.0 mm & 2.5 mm Impact Category : USEtox Marmoleum 2.0 mm Marmoleum 2.5 mm Unit Eco toxicity 7.29E-01 8.84E-01 PAF m3.day Human toxicity, cancer 3.37E-09 3.96E-09 Cases Human toxicity, non-canc. 5.86E-07 7.14E-07 Cases
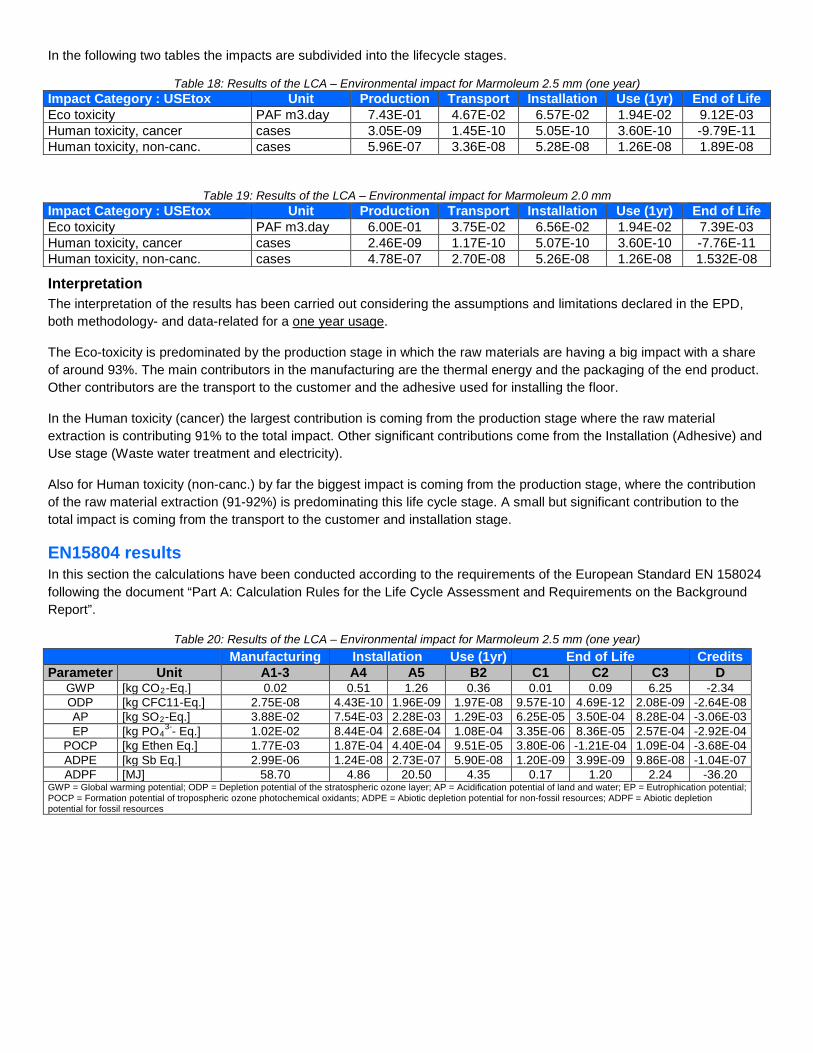
In the following two tables the impacts are subdivided into the lifecycle stages.
Table 18: Results of the LCA – Environmental impact for Marmoleum 2.5 mm (one year) Impact Category : USEtox Unit Production Transport Installation Use (1yr) End of Life Eco toxicity PAF m3.day 7.43E-01 4.67E-02 6.57E-02 1.94E-02 9.12E-03 Human toxicity, cancer cases 3.05E-09 1.45E-10 5.05E-10 3.60E-10 -9.79E-11 Human toxicity, non-canc. cases 5.96E-07 3.36E-08 5.28E-08 1.26E-08 1.89E-08
Table 19: Results of the LCA – Environmental impact for Marmoleum 2.0 mm Impact Category : USEtox Unit Production Transport Installation Use (1yr) End of Life Eco toxicity PAF m3.day 6.00E-01 3.75E-02 6.56E-02 1.94E-02 7.39E-03 Human toxicity, cancer cases 2.46E-09 1.17E-10 5.07E-10 3.60E-10 -7.76E-11 Human toxicity, non-canc. cases 4.78E-07 2.70E-08 5.26E-08 1.26E-08 1.532E-08
Interpretation The interpretation of the results has been carried out considering the assumptions and limitations declared in the EPD, both methodology- and data-related for a one year usage.
The Eco-toxicity is predominated by the production stage in which the raw materials are having a big impact with a share of around 93%. The main contributors in the manufacturing are the thermal energy and the packaging of the end product. Other contributors are the transport to the customer and the adhesive used for installing the floor.
In the Human toxicity (cancer) the largest contribution is coming from the production stage where the raw material extraction is contributing 91% to the total impact. Other significant contributions come from the Installation (Adhesive) and Use stage (Waste water treatment and electricity).
Also for Human toxicity (non-canc.) by far the biggest impact is coming from the production stage, where the contribution of the raw material extraction (91-92%) is predominating this life cycle stage. A small but significant contribution to the total impact is coming from the transport to the customer and installation stage.
EN15804 results In this section the calculations have been conducted according to the requirements of the European Standard EN 158024 following the document “Part A: Calculation Rules for the Life Cycle Assessment and Requirements on the Background Report”.
Table 20: Results of the LCA – Environmental impact for Marmoleum 2.5 mm (one year) Manufacturing Installation Use (1yr) End of Life Credits
Parameter Unit A1-3 A4 A5 B2 C1 C2 C3 D GWP [kg CO2-Eq.] 0.02 0.51 1.26 0.36 0.01 0.09 6.25 -2.34 ODP [kg CFC11-Eq.] 2.75E-08 4.43E-10 1.96E-09 1.97E-08 9.57E-10 4.69E-12 2.08E-09 -2.64E-08 AP [kg SO2-Eq.] 3.88E-02 7.54E-03 2.28E-03 1.29E-03 6.25E-05 3.50E-04 8.28E-04 -3.06E-03 EP [kg PO4
3-- Eq.] 1.02E-02 8.44E-04 2.68E-04 1.08E-04 3.35E-06 8.36E-05 2.57E-04 -2.92E-04 POCP [kg Ethen Eq.] 1.77E-03 1.87E-04 4.40E-04 9.51E-05 3.80E-06 -1.21E-04 1.09E-04 -3.68E-04 ADPE [kg Sb Eq.] 2.99E-06 1.24E-08 2.73E-07 5.90E-08 1.20E-09 3.99E-09 9.86E-08 -1.04E-07 ADPF [MJ] 58.70 4.86 20.50 4.35 0.17 1.20 2.24 -36.20
GWP = Global warming potential; ODP = Depletion potential of the stratospheric ozone layer; AP = Acidification potential of land and water; EP = Eutrophication potential; POCP = Formation potential of tropospheric ozone photochemical oxidants; ADPE = Abiotic depletion potential for non-fossil resources; ADPF = Abiotic depletion potential for fossil resources
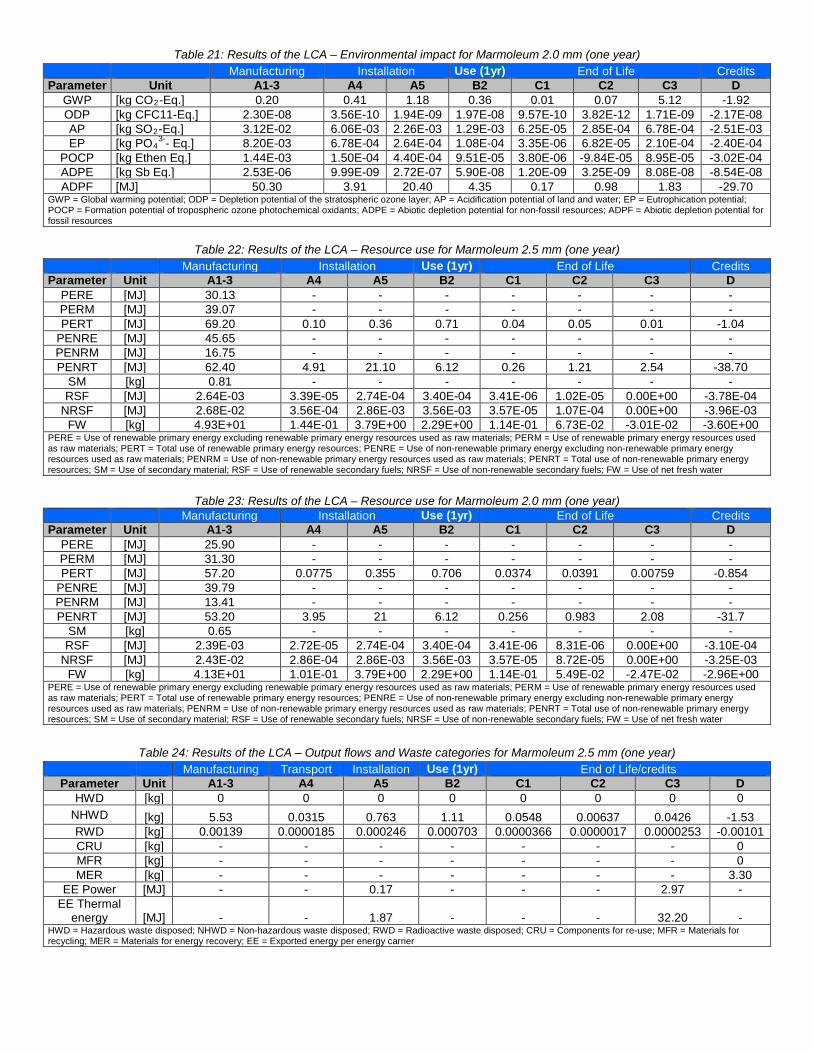
Table 21: Results of the LCA – Environmental impact for Marmoleum 2.0 mm (one year) Manufacturing Installation Use (1yr) End of Life Credits
Parameter Unit A1-3 A4 A5 B2 C1 C2 C3 D GWP [kg CO2-Eq.] 0.20 0.41 1.18 0.36 0.01 0.07 5.12 -1.92 ODP [kg CFC11-Eq.] 2.30E-08 3.56E-10 1.94E-09 1.97E-08 9.57E-10 3.82E-12 1.71E-09 -2.17E-08 AP [kg SO2-Eq.] 3.12E-02 6.06E-03 2.26E-03 1.29E-03 6.25E-05 2.85E-04 6.78E-04 -2.51E-03 EP [kg PO4
3-- Eq.] 8.20E-03 6.78E-04 2.64E-04 1.08E-04 3.35E-06 6.82E-05 2.10E-04 -2.40E-04 POCP [kg Ethen Eq.] 1.44E-03 1.50E-04 4.40E-04 9.51E-05 3.80E-06 -9.84E-05 8.95E-05 -3.02E-04 ADPE [kg Sb Eq.] 2.53E-06 9.99E-09 2.72E-07 5.90E-08 1.20E-09 3.25E-09 8.08E-08 -8.54E-08 ADPF [MJ] 50.30 3.91 20.40 4.35 0.17 0.98 1.83 -29.70
GWP = Global warming potential; ODP = Depletion potential of the stratospheric ozone layer; AP = Acidification potential of land and water; EP = Eutrophication potential; POCP = Formation potential of tropospheric ozone photochemical oxidants; ADPE = Abiotic depletion potential for non-fossil resources; ADPF = Abiotic depletion potential for fossil resources
Table 22: Results of the LCA – Resource use for Marmoleum 2.5 mm (one year) Manufacturing Installation Use (1yr) End of Life Credits
Parameter Unit A1-3 A4 A5 B2 C1 C2 C3 D PERE [MJ] 30.13 - - - - - - - PERM [MJ] 39.07 - - - - - - - PERT [MJ] 69.20 0.10 0.36 0.71 0.04 0.05 0.01 -1.04
PENRE [MJ] 45.65 - - - - - - - PENRM [MJ] 16.75 - - - - - - - PENRT [MJ] 62.40 4.91 21.10 6.12 0.26 1.21 2.54 -38.70
SM [kg] 0.81 - - - - - - - RSF [MJ] 2.64E-03 3.39E-05 2.74E-04 3.40E-04 3.41E-06 1.02E-05 0.00E+00 -3.78E-04
NRSF [MJ] 2.68E-02 3.56E-04 2.86E-03 3.56E-03 3.57E-05 1.07E-04 0.00E+00 -3.96E-03 FW [kg] 4.93E+01 1.44E-01 3.79E+00 2.29E+00 1.14E-01 6.73E-02 -3.01E-02 -3.60E+00
PERE = Use of renewable primary energy excluding renewable primary energy resources used as raw materials; PERM = Use of renewable primary energy resources used as raw materials; PERT = Total use of renewable primary energy resources; PENRE = Use of non-renewable primary energy excluding non-renewable primary energy resources used as raw materials; PENRM = Use of non-renewable primary energy resources used as raw materials; PENRT = Total use of non-renewable primary energy resources; SM = Use of secondary material; RSF = Use of renewable secondary fuels; NRSF = Use of non-renewable secondary fuels; FW = Use of net fresh water
Table 23: Results of the LCA – Resource use for Marmoleum 2.0 mm (one year)
Manufacturing Installation Use (1yr) End of Life Credits Parameter Unit A1-3 A4 A5 B2 C1 C2 C3 D
PERE [MJ] 25.90 - - - - - - - PERM [MJ] 31.30 - - - - - - - PERT [MJ] 57.20 0.0775 0.355 0.706 0.0374 0.0391 0.00759 -0.854
PENRE [MJ] 39.79 - - - - - - - PENRM [MJ] 13.41 - - - - - - - PENRT [MJ] 53.20 3.95 21 6.12 0.256 0.983 2.08 -31.7
SM [kg] 0.65 - - - - - - - RSF [MJ] 2.39E-03 2.72E-05 2.74E-04 3.40E-04 3.41E-06 8.31E-06 0.00E+00 -3.10E-04
NRSF [MJ] 2.43E-02 2.86E-04 2.86E-03 3.56E-03 3.57E-05 8.72E-05 0.00E+00 -3.25E-03 FW [kg] 4.13E+01 1.01E-01 3.79E+00 2.29E+00 1.14E-01 5.49E-02 -2.47E-02 -2.96E+00
PERE = Use of renewable primary energy excluding renewable primary energy resources used as raw materials; PERM = Use of renewable primary energy resources used as raw materials; PERT = Total use of renewable primary energy resources; PENRE = Use of non-renewable primary energy excluding non-renewable primary energy resources used as raw materials; PENRM = Use of non-renewable primary energy resources used as raw materials; PENRT = Total use of non-renewable primary energy resources; SM = Use of secondary material; RSF = Use of renewable secondary fuels; NRSF = Use of non-renewable secondary fuels; FW = Use of net fresh water
Table 24: Results of the LCA – Output flows and Waste categories for Marmoleum 2.5 mm (one year)
Manufacturing Transport Installation Use (1yr) End of Life/credits Parameter Unit A1-3 A4 A5 B2 C1 C2 C3 D
HWD [kg] 0 0 0 0 0 0 0 0 NHWD [kg] 5.53 0.0315 0.763 1.11 0.0548 0.00637 0.0426 -1.53 RWD [kg] 0.00139 0.0000185 0.000246 0.000703 0.0000366 0.0000017 0.0000253 -0.00101 CRU [kg] - - - - - - - 0 MFR [kg] - - - - - - - 0 MER [kg] - - - - - - - 3.30
EE Power [MJ] - - 0.17 - - - 2.97 - EE Thermal
energy [MJ] - - 1.87 - - - 32.20 - HWD = Hazardous waste disposed; NHWD = Non-hazardous waste disposed; RWD = Radioactive waste disposed; CRU = Components for re-use; MFR = Materials for recycling; MER = Materials for energy recovery; EE = Exported energy per energy carrier
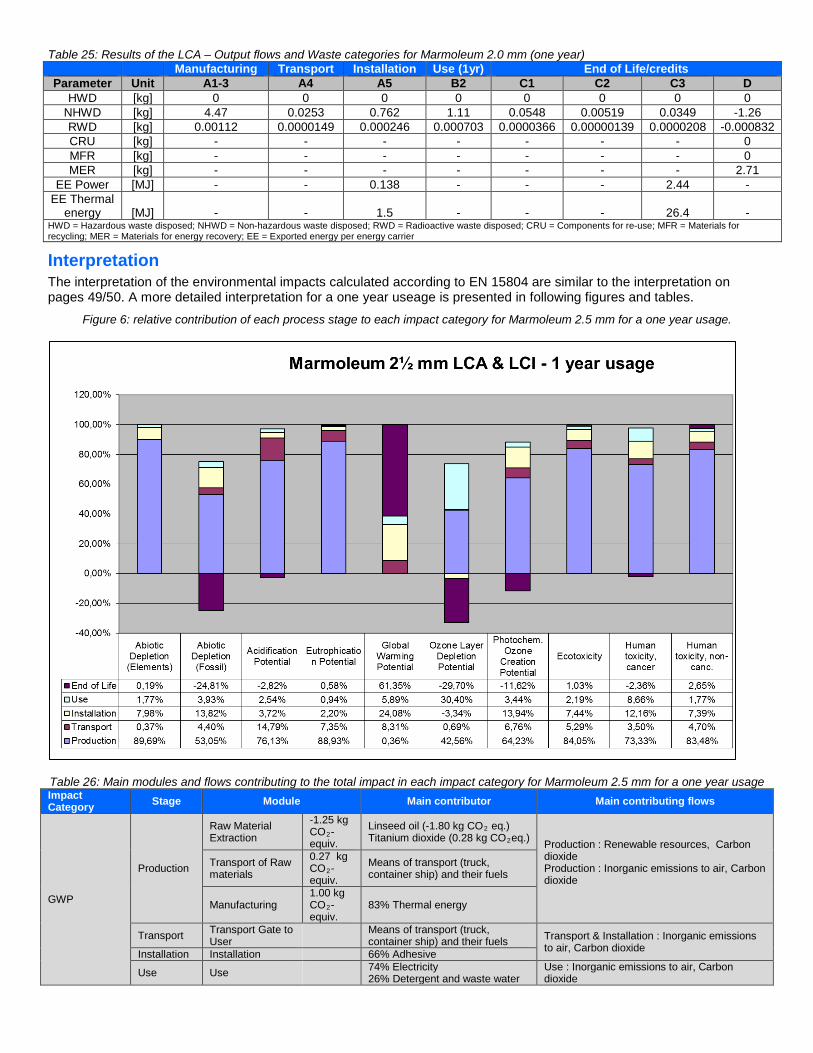
Table 25: Results of the LCA – Output flows and Waste categories for Marmoleum 2.0 mm (one year) Manufacturing Transport Installation Use (1yr) End of Life/credits
Parameter Unit A1-3 A4 A5 B2 C1 C2 C3 D HWD [kg] 0 0 0 0 0 0 0 0
NHWD [kg] 4.47 0.0253 0.762 1.11 0.0548 0.00519 0.0349 -1.26 RWD [kg] 0.00112 0.0000149 0.000246 0.000703 0.0000366 0.00000139 0.0000208 -0.000832 CRU [kg] - - - - - - - 0 MFR [kg] - - - - - - - 0 MER [kg] - - - - - - - 2.71
EE Power [MJ] - - 0.138 - - - 2.44 - EE Thermal
energy [MJ] - - 1.5 - - - 26.4 - HWD = Hazardous waste disposed; NHWD = Non-hazardous waste disposed; RWD = Radioactive waste disposed; CRU = Components for re-use; MFR = Materials for recycling; MER = Materials for energy recovery; EE = Exported energy per energy carrier
Interpretation The interpretation of the environmental impacts calculated according to EN 15804 are similar to the interpretation on pages 49/50. A more detailed interpretation for a one year useage is presented in following figures and tables.
Figure 6: relative contribution of each process stage to each impact category for Marmoleum 2.5 mm for a one year usage.
Table 26: Main modules and flows contributing to the total impact in each impact category for Marmoleum 2.5 mm for a one year usage Impact Category Stage Module Main contributor Main contributing flows
GWP
Production
Raw Material Extraction
-1.25 kg CO2-equiv.
Linseed oil (-1.80 kg CO2 eq.) Titanium dioxide (0.28 kg CO2eq.) Production : Renewable resources, Carbon
dioxide Production : Inorganic emissions to air, Carbon dioxide
Transport of Raw materials
0.27 kg CO2-equiv.
Means of transport (truck, container ship) and their fuels
Manufacturing 1.00 kg CO2-equiv.
83% Thermal energy
Transport Transport Gate to User Means of transport (truck,
container ship) and their fuels Transport & Installation : Inorganic emissions to air, Carbon dioxide Installation Installation 66% Adhesive
Use Use 74% Electricity 26% Detergent and waste water
Use : Inorganic emissions to air, Carbon dioxide
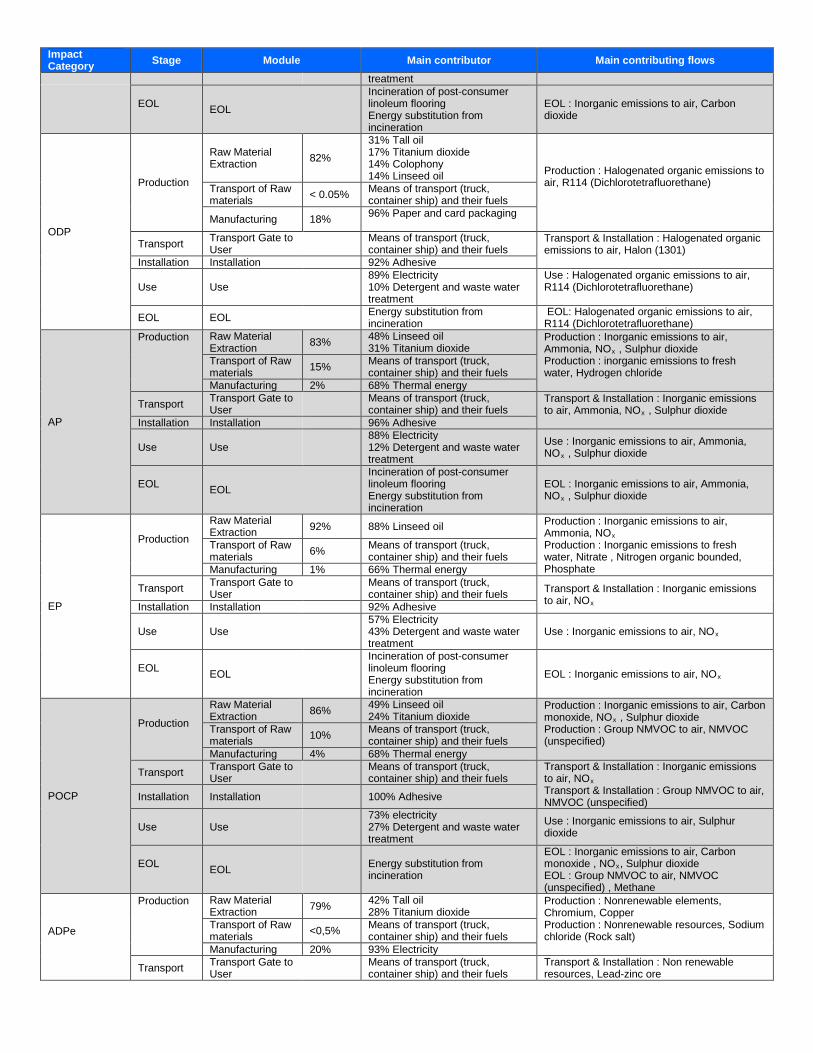
Impact Category Stage Module Main contributor Main contributing flows
treatment
EOL EOL
Incineration of post-consumer linoleum flooring Energy substitution from incineration
EOL : Inorganic emissions to air, Carbon dioxide
ODP
Production
Raw Material Extraction 82%
31% Tall oil 17% Titanium dioxide 14% Colophony 14% Linseed oil Production : Halogenated organic emissions to
air, R114 (Dichlorotetrafluorethane) Transport of Raw
materials < 0.05% Means of transport (truck, container ship) and their fuels
Manufacturing 18% 96% Paper and card packaging
Transport Transport Gate to User Means of transport (truck,
container ship) and their fuels Transport & Installation : Halogenated organic emissions to air, Halon (1301) Installation Installation 92% Adhesive
Use Use 89% Electricity 10% Detergent and waste water treatment
Use : Halogenated organic emissions to air, R114 (Dichlorotetrafluorethane)
EOL EOL Energy substitution from incineration
EOL: Halogenated organic emissions to air, R114 (Dichlorotetrafluorethane)
AP
Production
Raw Material Extraction 83% 48% Linseed oil
31% Titanium dioxide Production : Inorganic emissions to air, Ammonia, NOx , Sulphur dioxide Production : inorganic emissions to fresh water, Hydrogen chloride
Transport of Raw materials 15% Means of transport (truck,
container ship) and their fuels Manufacturing 2% 68% Thermal energy
Transport Transport Gate to User Means of transport (truck,
container ship) and their fuels Transport & Installation : Inorganic emissions to air, Ammonia, NOx , Sulphur dioxide Installation Installation 96% Adhesive
Use Use 88% Electricity 12% Detergent and waste water treatment
Use : Inorganic emissions to air, Ammonia, NOx , Sulphur dioxide
EOL EOL
Incineration of post-consumer linoleum flooring Energy substitution from incineration
EOL : Inorganic emissions to air, Ammonia, NOx , Sulphur dioxide
EP
Production
Raw Material Extraction 92% 88% Linseed oil Production : Inorganic emissions to air,
Ammonia, NOx Production : Inorganic emissions to fresh water, Nitrate , Nitrogen organic bounded, Phosphate
Transport of Raw materials 6% Means of transport (truck,
container ship) and their fuels Manufacturing 1% 66% Thermal energy
Transport Transport Gate to User Means of transport (truck,
container ship) and their fuels Transport & Installation : Inorganic emissions to air, NOx Installation Installation 92% Adhesive
Use Use 57% Electricity 43% Detergent and waste water treatment
Use : Inorganic emissions to air, NOx
EOL EOL
Incineration of post-consumer linoleum flooring Energy substitution from incineration
EOL : Inorganic emissions to air, NOx
POCP
Production
Raw Material Extraction 86% 49% Linseed oil
24% Titanium dioxide Production : Inorganic emissions to air, Carbon monoxide, NOx , Sulphur dioxide Production : Group NMVOC to air, NMVOC (unspecified)
Transport of Raw materials 10% Means of transport (truck,
container ship) and their fuels Manufacturing 4% 68% Thermal energy
Transport Transport Gate to User Means of transport (truck,
container ship) and their fuels Transport & Installation : Inorganic emissions to air, NOx Transport & Installation : Group NMVOC to air, NMVOC (unspecified) Installation Installation 100% Adhesive
Use Use 73% electricity 27% Detergent and waste water treatment
Use : Inorganic emissions to air, Sulphur dioxide
EOL EOL Energy substitution from
incineration
EOL : Inorganic emissions to air, Carbon monoxide , NOx, Sulphur dioxide EOL : Group NMVOC to air, NMVOC (unspecified) , Methane
ADPe
Production
Raw Material Extraction 79% 42% Tall oil
28% Titanium dioxide Production : Nonrenewable elements, Chromium, Copper Production : Nonrenewable resources, Sodium chloride (Rock salt)
Transport of Raw materials <0,5% Means of transport (truck,
container ship) and their fuels Manufacturing 20% 93% Electricity
Transport Transport Gate to User Means of transport (truck,
container ship) and their fuels Transport & Installation : Non renewable resources, Lead-zinc ore
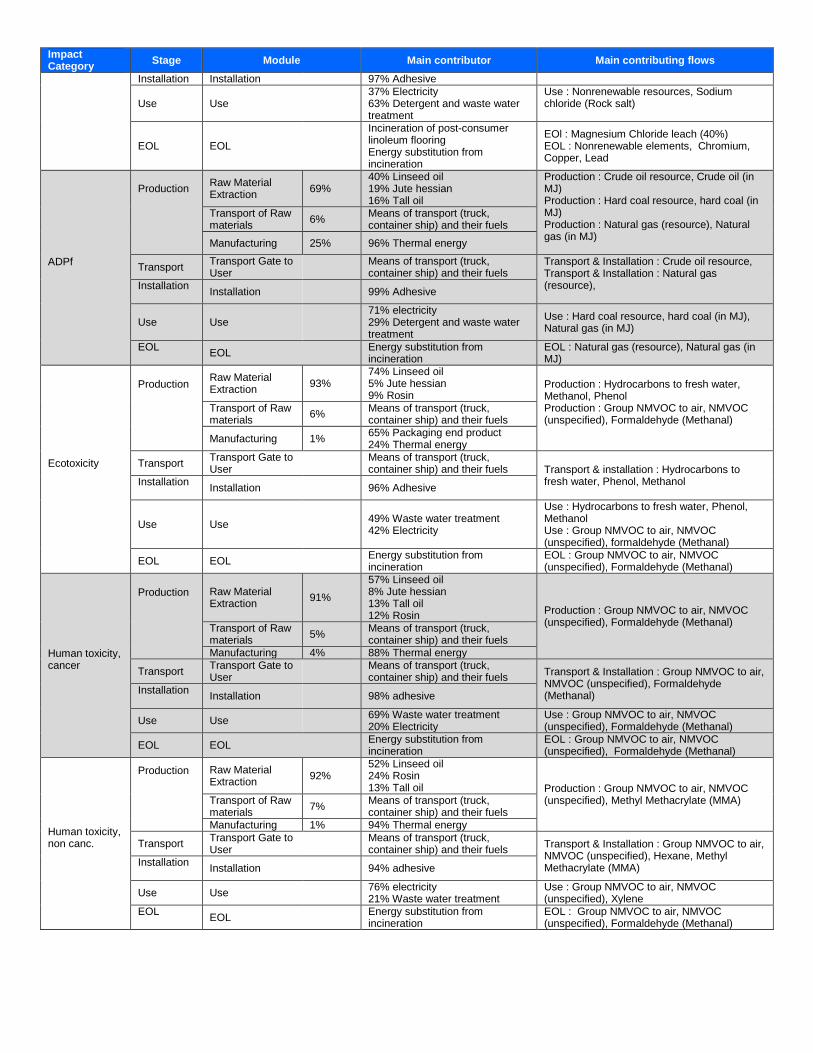
Impact Category Stage Module Main contributor Main contributing flows
Installation Installation 97% Adhesive
Use Use 37% Electricity 63% Detergent and waste water treatment
Use : Nonrenewable resources, Sodium chloride (Rock salt)
EOL EOL
Incineration of post-consumer linoleum flooring Energy substitution from incineration
EOl : Magnesium Chloride leach (40%) EOL : Nonrenewable elements, Chromium, Copper, Lead
ADPf
Production
Raw Material Extraction 69%
40% Linseed oil 19% Jute hessian 16% Tall oil
Production : Crude oil resource, Crude oil (in MJ) Production : Hard coal resource, hard coal (in MJ) Production : Natural gas (resource), Natural gas (in MJ)
Transport of Raw materials 6% Means of transport (truck,
container ship) and their fuels
Manufacturing 25% 96% Thermal energy
Transport Transport Gate to User Means of transport (truck,
container ship) and their fuels Transport & Installation : Crude oil resource, Transport & Installation : Natural gas (resource),
Installation Installation 99% Adhesive
Use Use 71% electricity 29% Detergent and waste water treatment
Use : Hard coal resource, hard coal (in MJ), Natural gas (in MJ)
EOL EOL Energy substitution from
incineration EOL : Natural gas (resource), Natural gas (in MJ)
Ecotoxicity
Production
Raw Material Extraction 93%
74% Linseed oil 5% Jute hessian 9% Rosin
Production : Hydrocarbons to fresh water, Methanol, Phenol Production : Group NMVOC to air, NMVOC (unspecified), Formaldehyde (Methanal)
Transport of Raw materials 6% Means of transport (truck,
container ship) and their fuels
Manufacturing 1% 65% Packaging end product 24% Thermal energy
Transport Transport Gate to User Means of transport (truck,
container ship) and their fuels Transport & installation : Hydrocarbons to fresh water, Phenol, Methanol Installation
Installation 96% Adhesive
Use Use 49% Waste water treatment 42% Electricity
Use : Hydrocarbons to fresh water, Phenol, Methanol Use : Group NMVOC to air, NMVOC (unspecified), formaldehyde (Methanal)
EOL EOL Energy substitution from incineration
EOL : Group NMVOC to air, NMVOC (unspecified), Formaldehyde (Methanal)
Human toxicity, cancer
Production
Raw Material Extraction 91%
57% Linseed oil 8% Jute hessian 13% Tall oil 12% Rosin Production : Group NMVOC to air, NMVOC
(unspecified), Formaldehyde (Methanal) Transport of Raw materials 5% Means of transport (truck,
container ship) and their fuels Manufacturing 4% 88% Thermal energy
Transport Transport Gate to User Means of transport (truck,
container ship) and their fuels Transport & Installation : Group NMVOC to air, NMVOC (unspecified), Formaldehyde (Methanal) Installation
Installation 98% adhesive
Use Use 69% Waste water treatment 20% Electricity
Use : Group NMVOC to air, NMVOC (unspecified), Formaldehyde (Methanal)
EOL EOL Energy substitution from incineration
EOL : Group NMVOC to air, NMVOC (unspecified), Formaldehyde (Methanal)
Human toxicity, non canc.
Production
Raw Material Extraction 92%
52% Linseed oil 24% Rosin 13% Tall oil Production : Group NMVOC to air, NMVOC
(unspecified), Methyl Methacrylate (MMA) Transport of Raw materials 7% Means of transport (truck,
container ship) and their fuels Manufacturing 1% 94% Thermal energy
Transport Transport Gate to User Means of transport (truck,
container ship) and their fuels Transport & Installation : Group NMVOC to air, NMVOC (unspecified), Hexane, Methyl Methacrylate (MMA) Installation
Installation 94% adhesive
Use Use 76% electricity 21% Waste water treatment
Use : Group NMVOC to air, NMVOC (unspecified), Xylene
EOL EOL Energy substitution from
incineration EOL : Group NMVOC to air, NMVOC (unspecified), Formaldehyde (Methanal)
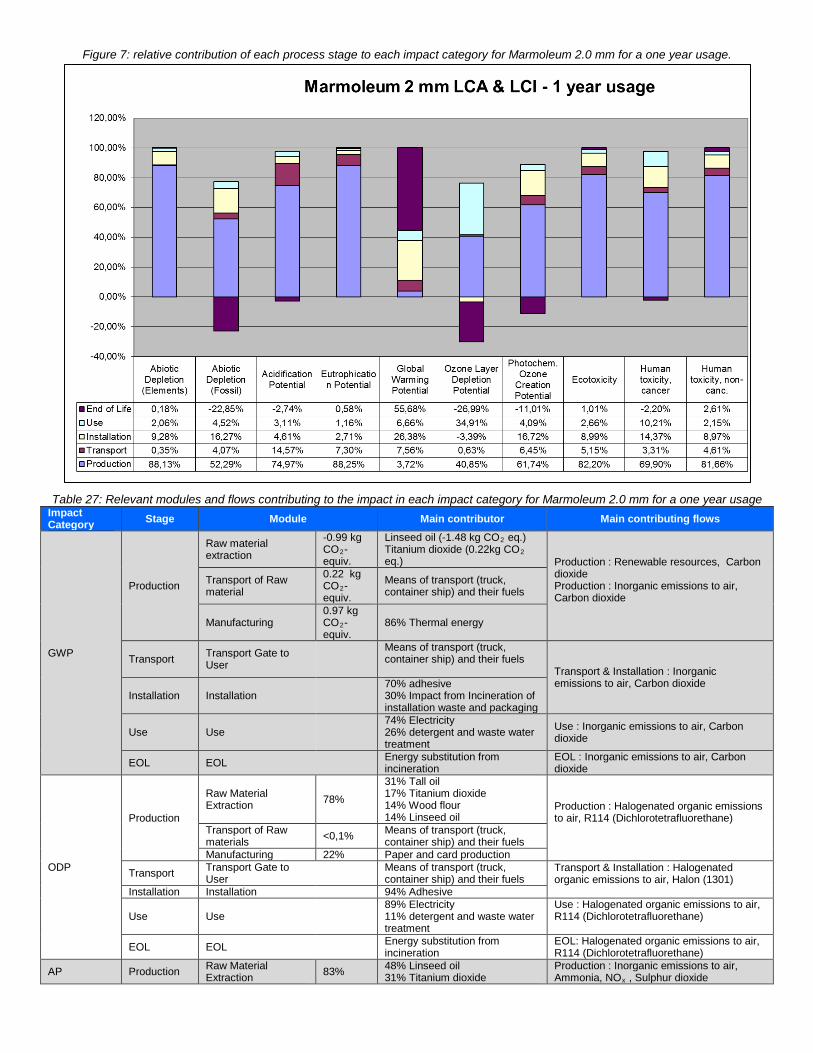
Figure 7: relative contribution of each process stage to each impact category for Marmoleum 2.0 mm for a one year usage.
Table 27: Relevant modules and flows contributing to the impact in each impact category for Marmoleum 2.0 mm for a one year usage Impact Category Stage Module Main contributor Main contributing flows
GWP
Production
Raw material extraction
-0.99 kg CO2-equiv.
Linseed oil (-1.48 kg CO2 eq.) Titanium dioxide (0.22kg CO2 eq.) Production : Renewable resources, Carbon
dioxide Production : Inorganic emissions to air, Carbon dioxide
Transport of Raw material
0.22 kg CO2-equiv.
Means of transport (truck, container ship) and their fuels
Manufacturing 0.97 kg CO2-equiv.
86% Thermal energy
Transport Transport Gate to User
Means of transport (truck, container ship) and their fuels Transport & Installation : Inorganic
emissions to air, Carbon dioxide Installation Installation
70% adhesive 30% Impact from Incineration of installation waste and packaging
Use Use 74% Electricity 26% detergent and waste water treatment
Use : Inorganic emissions to air, Carbon dioxide
EOL EOL Energy substitution from incineration
EOL : Inorganic emissions to air, Carbon dioxide
ODP
Production
Raw Material Extraction 78%
31% Tall oil 17% Titanium dioxide 14% Wood flour 14% Linseed oil
Production : Halogenated organic emissions to air, R114 (Dichlorotetrafluorethane) Transport of Raw
materials <0,1% Means of transport (truck, container ship) and their fuels
Manufacturing 22% Paper and card production
Transport Transport Gate to User Means of transport (truck,
container ship) and their fuels Transport & Installation : Halogenated organic emissions to air, Halon (1301) Installation Installation 94% Adhesive
Use Use 89% Electricity 11% detergent and waste water treatment
Use : Halogenated organic emissions to air, R114 (Dichlorotetrafluorethane)
EOL EOL Energy substitution from incineration
EOL: Halogenated organic emissions to air, R114 (Dichlorotetrafluorethane)
AP Production Raw Material Extraction 83% 48% Linseed oil
31% Titanium dioxide Production : Inorganic emissions to air, Ammonia, NOx , Sulphur dioxide
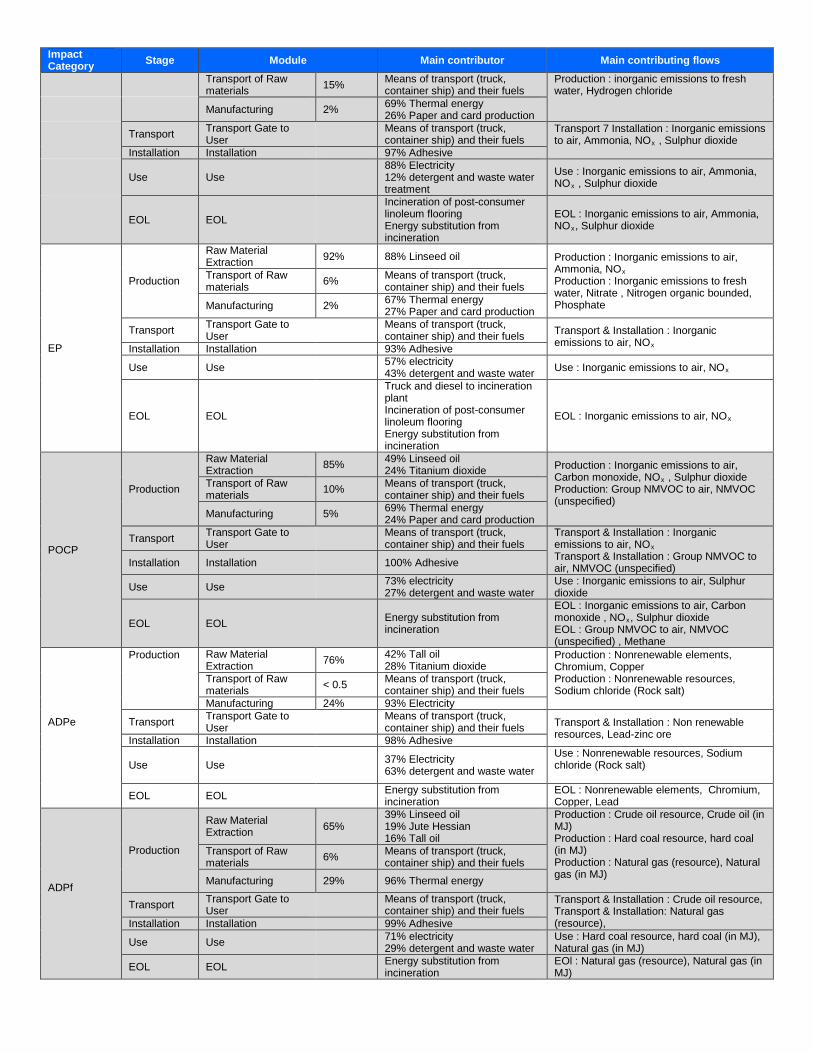
Impact Category Stage Module Main contributor Main contributing flows
Transport of Raw materials 15% Means of transport (truck,
container ship) and their fuels Production : inorganic emissions to fresh water, Hydrogen chloride Manufacturing 2% 69% Thermal energy
26% Paper and card production
Transport Transport Gate to User Means of transport (truck,
container ship) and their fuels Transport 7 Installation : Inorganic emissions to air, Ammonia, NOx , Sulphur dioxide Installation Installation 97% Adhesive
Use Use 88% Electricity 12% detergent and waste water treatment
Use : Inorganic emissions to air, Ammonia, NOx , Sulphur dioxide
EOL EOL
Incineration of post-consumer linoleum flooring Energy substitution from incineration
EOL : Inorganic emissions to air, Ammonia, NOx, Sulphur dioxide
EP
Production
Raw Material Extraction 92% 88% Linseed oil Production : Inorganic emissions to air,
Ammonia, NOx Production : Inorganic emissions to fresh water, Nitrate , Nitrogen organic bounded, Phosphate
Transport of Raw materials 6% Means of transport (truck,
container ship) and their fuels
Manufacturing 2% 67% Thermal energy 27% Paper and card production
Transport Transport Gate to User Means of transport (truck,
container ship) and their fuels Transport & Installation : Inorganic emissions to air, NOx Installation Installation 93% Adhesive
Use Use 57% electricity 43% detergent and waste water Use : Inorganic emissions to air, NOx
EOL EOL
Truck and diesel to incineration plant Incineration of post-consumer linoleum flooring Energy substitution from incineration
EOL : Inorganic emissions to air, NOx
POCP
Production
Raw Material Extraction 85% 49% Linseed oil
24% Titanium dioxide Production : Inorganic emissions to air, Carbon monoxide, NOx , Sulphur dioxide Production: Group NMVOC to air, NMVOC (unspecified)
Transport of Raw materials 10% Means of transport (truck,
container ship) and their fuels
Manufacturing 5% 69% Thermal energy 24% Paper and card production
Transport Transport Gate to User Means of transport (truck,
container ship) and their fuels Transport & Installation : Inorganic emissions to air, NOx Transport & Installation : Group NMVOC to air, NMVOC (unspecified) Installation Installation 100% Adhesive
Use Use 73% electricity 27% detergent and waste water
Use : Inorganic emissions to air, Sulphur dioxide
EOL EOL Energy substitution from incineration
EOL : Inorganic emissions to air, Carbon monoxide , NOx, Sulphur dioxide EOL : Group NMVOC to air, NMVOC (unspecified) , Methane
ADPe
Production
Raw Material Extraction 76% 42% Tall oil
28% Titanium dioxide Production : Nonrenewable elements, Chromium, Copper Production : Nonrenewable resources, Sodium chloride (Rock salt)
Transport of Raw materials < 0.5 Means of transport (truck,
container ship) and their fuels Manufacturing 24% 93% Electricity
Transport Transport Gate to User Means of transport (truck,
container ship) and their fuels Transport & Installation : Non renewable resources, Lead-zinc ore Installation Installation 98% Adhesive
Use Use 37% Electricity 63% detergent and waste water
Use : Nonrenewable resources, Sodium chloride (Rock salt)
EOL EOL Energy substitution from incineration
EOL : Nonrenewable elements, Chromium, Copper, Lead
ADPf
Production
Raw Material Extraction 65%
39% Linseed oil 19% Jute Hessian 16% Tall oil
Production : Crude oil resource, Crude oil (in MJ) Production : Hard coal resource, hard coal (in MJ) Production : Natural gas (resource), Natural gas (in MJ)
Transport of Raw materials 6% Means of transport (truck,
container ship) and their fuels
Manufacturing 29% 96% Thermal energy
Transport Transport Gate to User Means of transport (truck,
container ship) and their fuels Transport & Installation : Crude oil resource, Transport & Installation: Natural gas (resource), Installation Installation 99% Adhesive
Use Use 71% electricity 29% detergent and waste water
Use : Hard coal resource, hard coal (in MJ), Natural gas (in MJ)
EOL EOL Energy substitution from incineration
EOl : Natural gas (resource), Natural gas (in MJ)
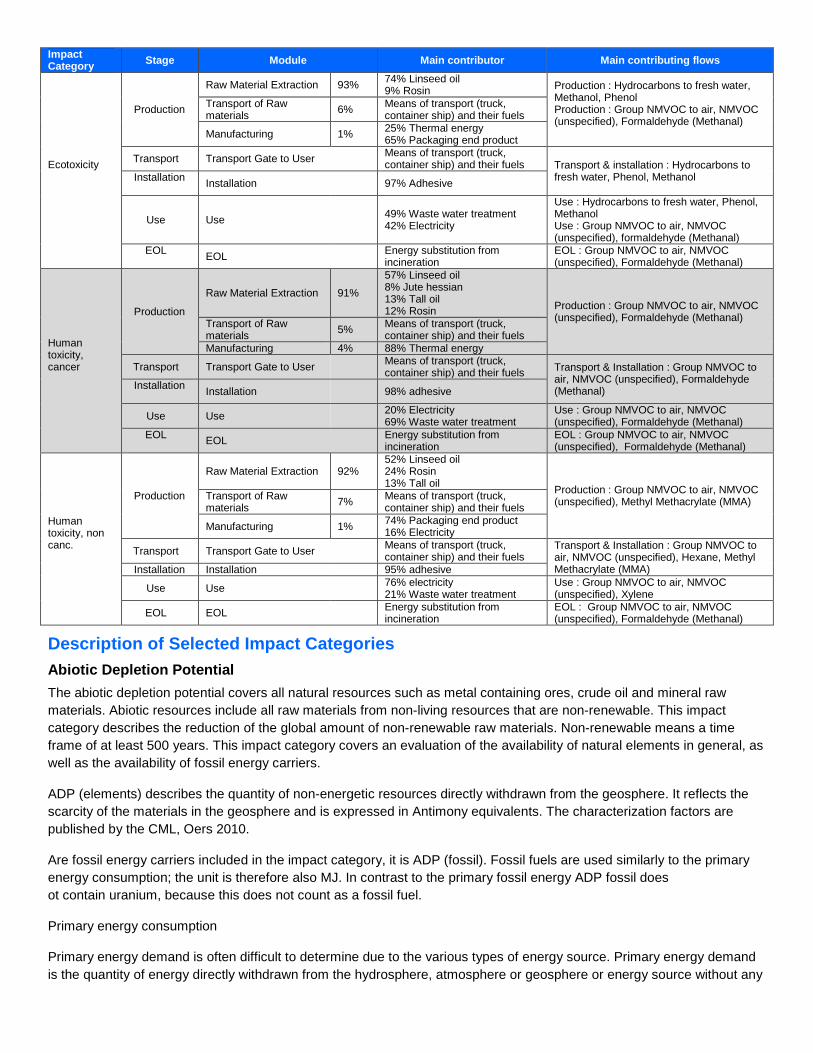
Impact Category Stage Module Main contributor Main contributing flows
Ecotoxicity
Production
Raw Material Extraction 93% 74% Linseed oil 9% Rosin Production : Hydrocarbons to fresh water,
Methanol, Phenol Production : Group NMVOC to air, NMVOC (unspecified), Formaldehyde (Methanal)
Transport of Raw materials 6% Means of transport (truck,
container ship) and their fuels
Manufacturing 1% 25% Thermal energy 65% Packaging end product
Transport Transport Gate to User Means of transport (truck, container ship) and their fuels Transport & installation : Hydrocarbons to
fresh water, Phenol, Methanol Installation Installation 97% Adhesive
Use Use 49% Waste water treatment 42% Electricity
Use : Hydrocarbons to fresh water, Phenol, Methanol Use : Group NMVOC to air, NMVOC (unspecified), formaldehyde (Methanal)
EOL EOL Energy substitution from
incineration EOL : Group NMVOC to air, NMVOC (unspecified), Formaldehyde (Methanal)
Human toxicity, cancer
Production
Raw Material Extraction 91%
57% Linseed oil 8% Jute hessian 13% Tall oil 12% Rosin Production : Group NMVOC to air, NMVOC
(unspecified), Formaldehyde (Methanal) Transport of Raw materials 5% Means of transport (truck,
container ship) and their fuels Manufacturing 4% 88% Thermal energy
Transport Transport Gate to User Means of transport (truck, container ship) and their fuels Transport & Installation : Group NMVOC to
air, NMVOC (unspecified), Formaldehyde (Methanal) Installation
Installation 98% adhesive
Use Use 20% Electricity 69% Waste water treatment
Use : Group NMVOC to air, NMVOC (unspecified), Formaldehyde (Methanal)
EOL EOL Energy substitution from
incineration EOL : Group NMVOC to air, NMVOC (unspecified), Formaldehyde (Methanal)
Human toxicity, non canc.
Production
Raw Material Extraction 92% 52% Linseed oil 24% Rosin 13% Tall oil Production : Group NMVOC to air, NMVOC
(unspecified), Methyl Methacrylate (MMA) Transport of Raw materials 7% Means of transport (truck,
container ship) and their fuels
Manufacturing 1% 74% Packaging end product 16% Electricity
Transport Transport Gate to User Means of transport (truck, container ship) and their fuels
Transport & Installation : Group NMVOC to air, NMVOC (unspecified), Hexane, Methyl Methacrylate (MMA) Installation Installation 95% adhesive
Use Use 76% electricity 21% Waste water treatment
Use : Group NMVOC to air, NMVOC (unspecified), Xylene
EOL EOL Energy substitution from incineration
EOL : Group NMVOC to air, NMVOC (unspecified), Formaldehyde (Methanal)
Description of Selected Impact Categories Abiotic Depletion Potential The abiotic depletion potential covers all natural resources such as metal containing ores, crude oil and mineral raw materials. Abiotic resources include all raw materials from non-living resources that are non-renewable. This impact category describes the reduction of the global amount of non-renewable raw materials. Non-renewable means a time frame of at least 500 years. This impact category covers an evaluation of the availability of natural elements in general, as well as the availability of fossil energy carriers.
ADP (elements) describes the quantity of non-energetic resources directly withdrawn from the geosphere. It reflects the scarcity of the materials in the geosphere and is expressed in Antimony equivalents. The characterization factors are published by the CML, Oers 2010.
Are fossil energy carriers included in the impact category, it is ADP (fossil). Fossil fuels are used similarly to the primary energy consumption; the unit is therefore also MJ. In contrast to the primary fossil energy ADP fossil does ot contain uranium, because this does not count as a fossil fuel.
Primary energy consumption
Primary energy demand is often difficult to determine due to the various types of energy source. Primary energy demand is the quantity of energy directly withdrawn from the hydrosphere, atmosphere or geosphere or energy source without any
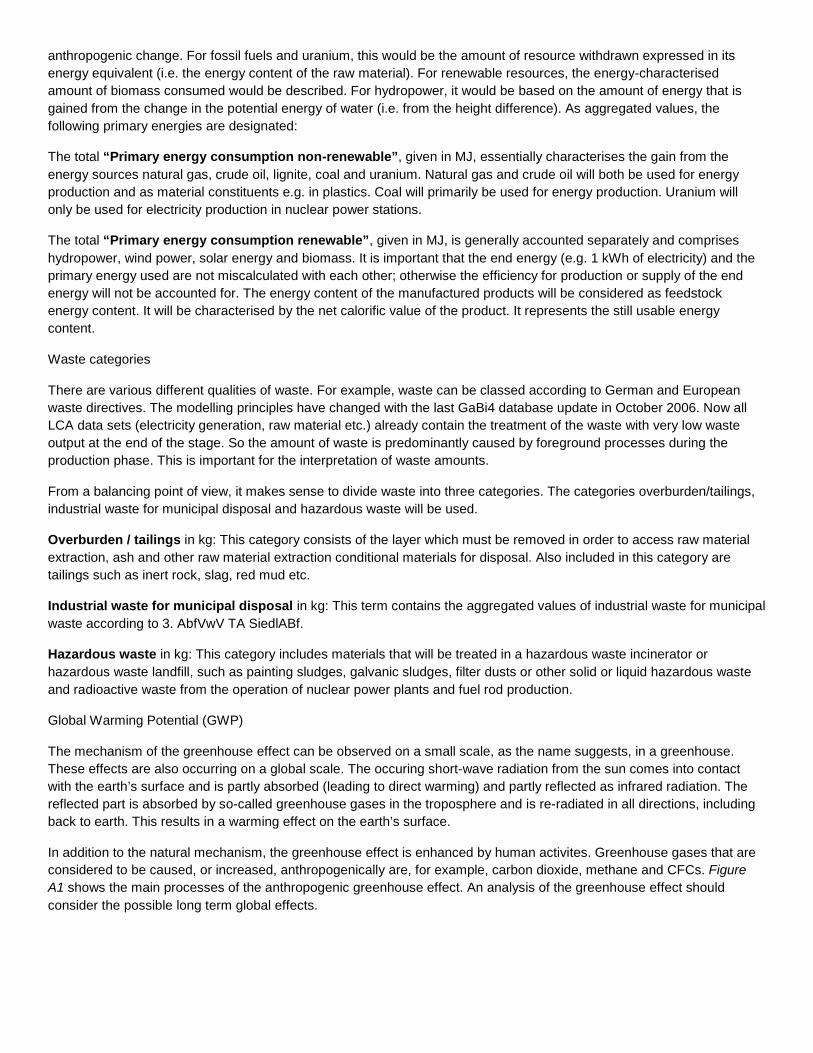
anthropogenic change. For fossil fuels and uranium, this would be the amount of resource withdrawn expressed in its energy equivalent (i.e. the energy content of the raw material). For renewable resources, the energy-characterised amount of biomass consumed would be described. For hydropower, it would be based on the amount of energy that is gained from the change in the potential energy of water (i.e. from the height difference). As aggregated values, the following primary energies are designated:
The total “Primary energy consumption non-renewable”, given in MJ, essentially characterises the gain from the energy sources natural gas, crude oil, lignite, coal and uranium. Natural gas and crude oil will both be used for energy production and as material constituents e.g. in plastics. Coal will primarily be used for energy production. Uranium will only be used for electricity production in nuclear power stations.
The total “Primary energy consumption renewable”, given in MJ, is generally accounted separately and comprises hydropower, wind power, solar energy and biomass. It is important that the end energy (e.g. 1 kWh of electricity) and the primary energy used are not miscalculated with each other; otherwise the efficiency for production or supply of the end energy will not be accounted for. The energy content of the manufactured products will be considered as feedstock energy content. It will be characterised by the net calorific value of the product. It represents the still usable energy content.
Waste categories
There are various different qualities of waste. For example, waste can be classed according to German and European waste directives. The modelling principles have changed with the last GaBi4 database update in October 2006. Now all LCA data sets (electricity generation, raw material etc.) already contain the treatment of the waste with very low waste output at the end of the stage. So the amount of waste is predominantly caused by foreground processes during the production phase. This is important for the interpretation of waste amounts.
From a balancing point of view, it makes sense to divide waste into three categories. The categories overburden/tailings, industrial waste for municipal disposal and hazardous waste will be used.
Overburden / tailings in kg: This category consists of the layer which must be removed in order to access raw material extraction, ash and other raw material extraction conditional materials for disposal. Also included in this category are tailings such as inert rock, slag, red mud etc.
Industrial waste for municipal disposal in kg: This term contains the aggregated values of industrial waste for municipal waste according to 3. AbfVwV TA SiedlABf.
Hazardous waste in kg: This category includes materials that will be treated in a hazardous waste incinerator or hazardous waste landfill, such as painting sludges, galvanic sludges, filter dusts or other solid or liquid hazardous waste and radioactive waste from the operation of nuclear power plants and fuel rod production.
Global Warming Potential (GWP)
The mechanism of the greenhouse effect can be observed on a small scale, as the name suggests, in a greenhouse. These effects are also occurring on a global scale. The occuring short-wave radiation from the sun comes into contact with the earth’s surface and is partly absorbed (leading to direct warming) and partly reflected as infrared radiation. The reflected part is absorbed by so-called greenhouse gases in the troposphere and is re-radiated in all directions, including back to earth. This results in a warming effect on the earth’s surface.
In addition to the natural mechanism, the greenhouse effect is enhanced by human activites. Greenhouse gases that are considered to be caused, or increased, anthropogenically are, for example, carbon dioxide, methane and CFCs. Figure A1 shows the main processes of the anthropogenic greenhouse effect. An analysis of the greenhouse effect should consider the possible long term global effects.
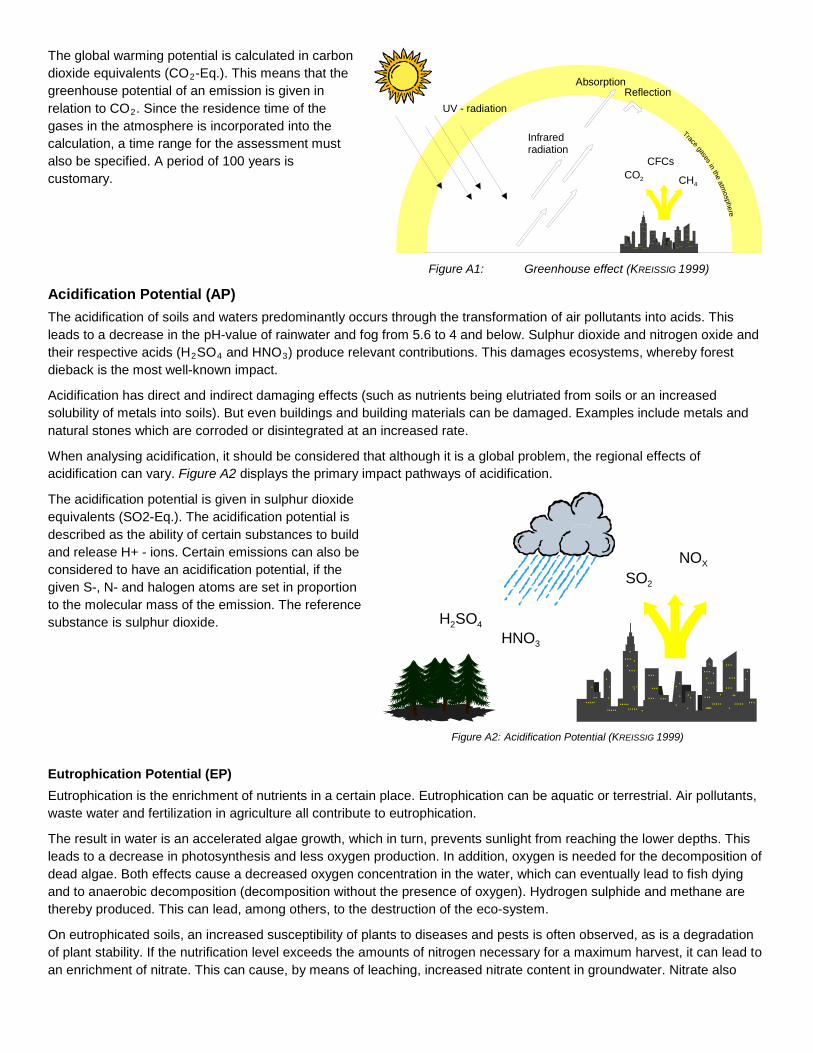
The global warming potential is calculated in carbon dioxide equivalents (CO2-Eq.). This means that the greenhouse potential of an emission is given in relation to CO2. Since the residence time of the gases in the atmosphere is incorporated into the calculation, a time range for the assessment must also be specified. A period of 100 years is customary.
Figure A1: Greenhouse effect (KREISSIG 1999)
Acidification Potential (AP) The acidification of soils and waters predominantly occurs through the transformation of air pollutants into acids. This leads to a decrease in the pH-value of rainwater and fog from 5.6 to 4 and below. Sulphur dioxide and nitrogen oxide and their respective acids (H2SO4 and HNO3) produce relevant contributions. This damages ecosystems, whereby forest dieback is the most well-known impact.
Acidification has direct and indirect damaging effects (such as nutrients being elutriated from soils or an increased solubility of metals into soils). But even buildings and building materials can be damaged. Examples include metals and natural stones which are corroded or disintegrated at an increased rate.
When analysing acidification, it should be considered that although it is a global problem, the regional effects of acidification can vary. Figure A2 displays the primary impact pathways of acidification.
The acidification potential is given in sulphur dioxide equivalents (SO2-Eq.). The acidification potential is described as the ability of certain substances to build and release H+ - ions. Certain emissions can also be considered to have an acidification potential, if the given S-, N- and halogen atoms are set in proportion to the molecular mass of the emission. The reference substance is sulphur dioxide.
Figure A2: Acidification Potential (KREISSIG 1999)
Eutrophication Potential (EP) Eutrophication is the enrichment of nutrients in a certain place. Eutrophication can be aquatic or terrestrial. Air pollutants, waste water and fertilization in agriculture all contribute to eutrophication.
The result in water is an accelerated algae growth, which in turn, prevents sunlight from reaching the lower depths. This leads to a decrease in photosynthesis and less oxygen production. In addition, oxygen is needed for the decomposition of dead algae. Both effects cause a decreased oxygen concentration in the water, which can eventually lead to fish dying and to anaerobic decomposition (decomposition without the presence of oxygen). Hydrogen sulphide and methane are thereby produced. This can lead, among others, to the destruction of the eco-system.
On eutrophicated soils, an increased susceptibility of plants to diseases and pests is often observed, as is a degradation of plant stability. If the nutrification level exceeds the amounts of nitrogen necessary for a maximum harvest, it can lead to an enrichment of nitrate. This can cause, by means of leaching, increased nitrate content in groundwater. Nitrate also
SO2
NOX
H2SO44
HNO3
CO2 CH4
CFCs
UV - radiation
AbsorptionReflection
Infraredradiation
Trace gases in the atmosphere
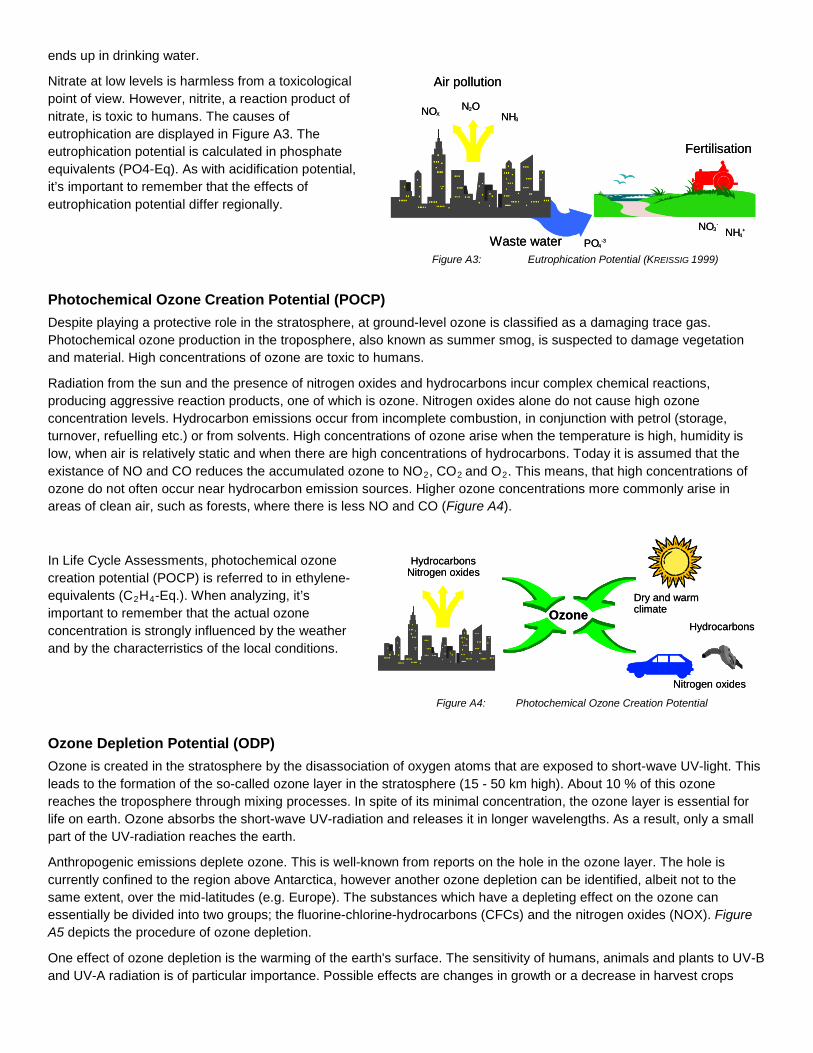
ends up in drinking water.
Nitrate at low levels is harmless from a toxicological point of view. However, nitrite, a reaction product of nitrate, is toxic to humans. The causes of eutrophication are displayed in Figure A3. The eutrophication potential is calculated in phosphate equivalents (PO4-Eq). As with acidification potential, it’s important to remember that the effects of eutrophication potential differ regionally.
Figure A3: Eutrophication Potential (KREISSIG 1999)
Photochemical Ozone Creation Potential (POCP) Despite playing a protective role in the stratosphere, at ground-level ozone is classified as a damaging trace gas. Photochemical ozone production in the troposphere, also known as summer smog, is suspected to damage vegetation and material. High concentrations of ozone are toxic to humans.
Radiation from the sun and the presence of nitrogen oxides and hydrocarbons incur complex chemical reactions, producing aggressive reaction products, one of which is ozone. Nitrogen oxides alone do not cause high ozone concentration levels. Hydrocarbon emissions occur from incomplete combustion, in conjunction with petrol (storage, turnover, refuelling etc.) or from solvents. High concentrations of ozone arise when the temperature is high, humidity is low, when air is relatively static and when there are high concentrations of hydrocarbons. Today it is assumed that the existance of NO and CO reduces the accumulated ozone to NO2, CO2 and O2. This means, that high concentrations of ozone do not often occur near hydrocarbon emission sources. Higher ozone concentrations more commonly arise in areas of clean air, such as forests, where there is less NO and CO (Figure A4).
Ozone Depletion Potential (ODP) Ozone is created in the stratosphere by the disassociation of oxygen atoms that are exposed to short-wave UV-light. This leads to the formation of the so-called ozone layer in the stratosphere (15 - 50 km high). About 10 % of this ozone reaches the troposphere through mixing processes. In spite of its minimal concentration, the ozone layer is essential for life on earth. Ozone absorbs the short-wave UV-radiation and releases it in longer wavelengths. As a result, only a small part of the UV-radiation reaches the earth.
Anthropogenic emissions deplete ozone. This is well-known from reports on the hole in the ozone layer. The hole is currently confined to the region above Antarctica, however another ozone depletion can be identified, albeit not to the same extent, over the mid-latitudes (e.g. Europe). The substances which have a depleting effect on the ozone can essentially be divided into two groups; the fluorine-chlorine-hydrocarbons (CFCs) and the nitrogen oxides (NOX). Figure A5 depicts the procedure of ozone depletion.
One effect of ozone depletion is the warming of the earth's surface. The sensitivity of humans, animals and plants to UV-B and UV-A radiation is of particular importance. Possible effects are changes in growth or a decrease in harvest crops
In Life Cycle Assessments, photochemical ozone creation potential (POCP) is referred to in ethylene-equivalents (C2H4-Eq.). When analyzing, it’s important to remember that the actual ozone concentration is strongly influenced by the weather and by the characterristics of the local conditions.
Figure A4: Photochemical Ozone Creation Potential
Waste water
Air pollution
Fertilisation
PO4-3
NO3-
NH4+
NOXN2O
NH3
Waste water
Air pollution
Fertilisation
PO4-3
NO3-
NH4+
NOXN2O
NH3
HydrocarbonsNitrogen oxides
Dry and warmclimate
Hydrocarbons
Nitrogen oxides
Ozone
HydrocarbonsNitrogen oxides
Dry and warmclimate
Hydrocarbons
Nitrogen oxides
Ozone
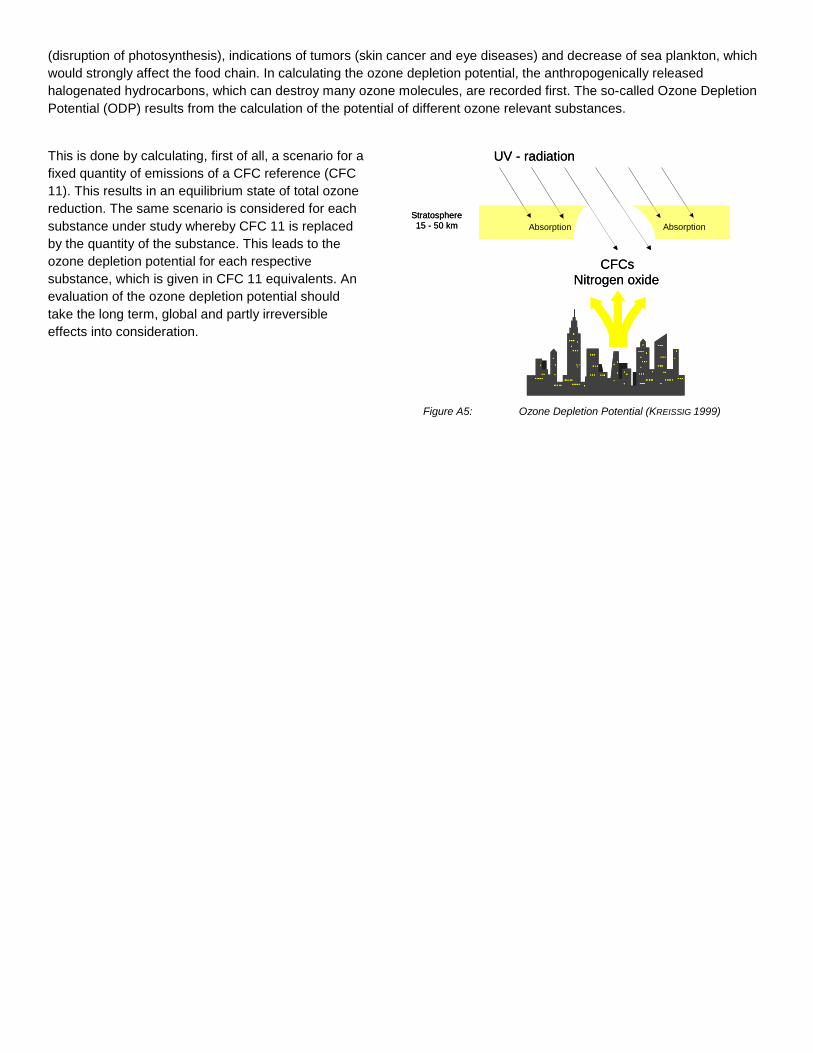
(disruption of photosynthesis), indications of tumors (skin cancer and eye diseases) and decrease of sea plankton, which would strongly affect the food chain. In calculating the ozone depletion potential, the anthropogenically released halogenated hydrocarbons, which can destroy many ozone molecules, are recorded first. The so-called Ozone Depletion Potential (ODP) results from the calculation of the potential of different ozone relevant substances.
This is done by calculating, first of all, a scenario for a fixed quantity of emissions of a CFC reference (CFC 11). This results in an equilibrium state of total ozone reduction. The same scenario is considered for each substance under study whereby CFC 11 is replaced by the quantity of the substance. This leads to the ozone depletion potential for each respective substance, which is given in CFC 11 equivalents. An evaluation of the ozone depletion potential should take the long term, global and partly irreversible effects into consideration.
Figure A5: Ozone Depletion Potential (KREISSIG 1999)
CFCsNitrogen oxide
Stratosphere15 - 50 km Absorption Absorption
UV - radiation
CFCsNitrogen oxide
Stratosphere15 - 50 km Absorption Absorption
UV - radiation
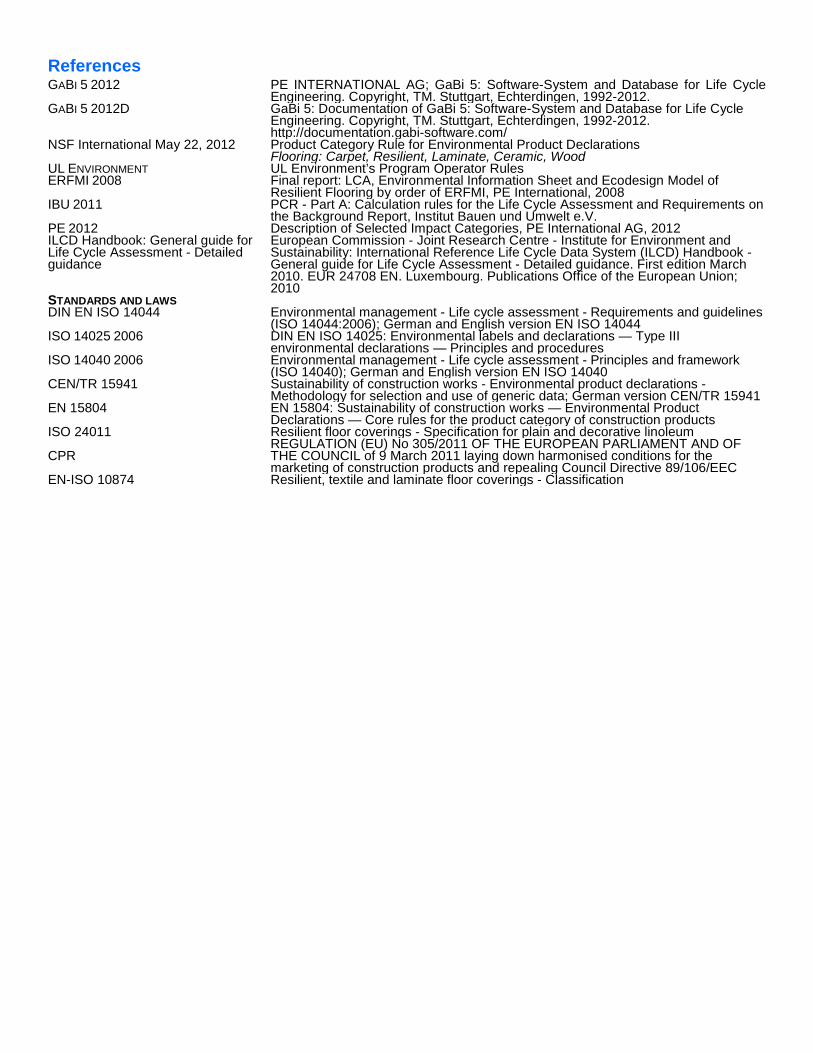
References GABI 5 2012 PE INTERNATIONAL AG; GaBi 5: Software-System and Database for Life Cycle
Engineering. Copyright, TM. Stuttgart, Echterdingen, 1992-2012. GABI 5 2012D GaBi 5: Documentation of GaBi 5: Software-System and Database for Life Cycle
Engineering. Copyright, TM. Stuttgart, Echterdingen, 1992-2012. http://documentation.gabi-software.com/
NSF International May 22, 2012 Product Category Rule for Environmental Product Declarations Flooring: Carpet, Resilient, Laminate, Ceramic, Wood
UL ENVIRONMENT UL Environment’s Program Operator Rules ERFMI 2008 Final report: LCA, Environmental Information Sheet and Ecodesign Model of
Resilient Flooring by order of ERFMI, PE International, 2008 IBU 2011 PCR - Part A: Calculation rules for the Life Cycle Assessment and Requirements on
the Background Report, Institut Bauen und Umwelt e.V. PE 2012 ILCD Handbook: General guide for Life Cycle Assessment - Detailed guidance
Description of Selected Impact Categories, PE International AG, 2012 European Commission - Joint Research Centre - Institute for Environment and Sustainability: International Reference Life Cycle Data System (ILCD) Handbook - General guide for Life Cycle Assessment - Detailed guidance. First edition March 2010. EUR 24708 EN. Luxembourg. Publications Office of the European Union; 2010
STANDARDS AND LAWS DIN EN ISO 14044 Environmental management - Life cycle assessment - Requirements and guidelines
(ISO 14044:2006); German and English version EN ISO 14044 ISO 14025 2006 DIN EN ISO 14025: Environmental labels and declarations — Type III
environmental declarations — Principles and procedures ISO 14040 2006 Environmental management - Life cycle assessment - Principles and framework
(ISO 14040); German and English version EN ISO 14040 CEN/TR 15941 Sustainability of construction works - Environmental product declarations -
Methodology for selection and use of generic data; German version CEN/TR 15941 EN 15804 EN 15804: Sustainability of construction works — Environmental Product
Declarations — Core rules for the product category of construction products ISO 24011 Resilient floor coverings - Specification for plain and decorative linoleum CPR
REGULATION (EU) No 305/2011 OF THE EUROPEAN PARLIAMENT AND OF THE COUNCIL of 9 March 2011 laying down harmonised conditions for the marketing of construction products and repealing Council Directive 89/106/EEC
EN-ISO 10874 Resilient, textile and laminate floor coverings - Classification