Embed Size (px)
Citation preview
EJM
The efficacy of non-vitamin K anticoagulants in treatment of thromboembolism
Systematic review
Commercialization of kidney donation; an option?
The role of positron- emission tomography
in giant cell arteritis
October 2015 • vol 5 - no 1 Erasmus Journal of Medicine: independent scientific journal
Erasmus Journal of Medicine
Opinion
Systematic review
Systematic review
The clinical impact of single nucleotide
polymorphism

vol 5 - no 1 - October 2015 • Erasmus Journal of Medicine 3
The Erasmus Journal of Medicine (EJM) is a scientific magazine by and for students, especially students of Erasmus MC University Medical Center Rotterdam. It was initiated by the MFVR (the medical students’ organization of Erasmus MC). The journal appears twice a year. It is published on paper (1500 copies) and on the EJM website (www.erasmusjournalofmedicine.nl).The main purpose of the EJM is to encourage medical and research master students to conduct research (empirical studies or systematic reviews) and report on this research, and become acquainted with a professional publishing process either as authors, reviewers or editors. A secondary purpose is to make the results of excellent student-driven research known to others. The journal contains articles describing original research, systematic reviews, extended abstracts (summaries of recently conducted studies), calls from research projects for students to participate, opinion papers written by students, editorial comments, case reports, clinical lessons, clinical images, and letters to the editor. The Erasmus Journal of Medicine is funded by Erasmus MC, through an unrestricted grant. First authors of submitted papers have to be medical or research master students.
PublisherErasmus MC University Medical Center Rotterdam.
Editorial BoardAjda Rowshani, MD PhD, nephrologist-clinical immunologist (chair); Ron de Bruin, PhD, associate professor of experimental surgery; Paul van Daele, MD PhD, internist; Tom Birkenhäger, MD PhD, psychiatrist, Mostafa Mohseni, medical student; Angela van Gelderen, editorial assistant. The editorial board acts independently of Erasmus MC University Medical Center and Erasmus MC Desiderius School.
Honorary editor-in-chief Honorary editor-in-chief: Jaap Verweij, MD PhD, Dean and vice-chairman of the Board of Directors of Erasmus MC. Past honorary editor-in-chief: Huibert A.P. Pols, MD PhD, Rector magnificus of Erasmus University Rotterdam.
English language editing Ed Hull and Charles Frink, language editors.
Staff reviewers Jelmer Alsma, MD, internist; Carla Baan, Prof, PhD, Gert Bessems, MD, PhD, orthopedic surgeon, traumatologist; Nicole Besouw, PhD, scientific research; Jacoline Bromberg, MD PhD, neurologist; Virgil Dalm, MD PhD, clinical immunologist; Diederik Dippel, MD PhD, neurologist; Jaap Deckers, MD PhD, cardiologist; Edith Friesema, UD; Frank Dor, MD PhD, transplant-surgeon; Teun van Gelder, MD, PhD, internist - nephrologist and clinical pharmacologist; Ieneke Hartman, MD, radiologist; Martijn van den Hoogen, MD, PhD, internist - nephrologist; Joost Jongen, MD PhD, neurologist; Markus Klimek, MD PhD, anaesthesiologist; Hannes Lans, PhD scientific research; Jeanine Roeters van Lennep, MD, PhD, internist vascular health; Maarten Limper, MD, internal medicine; Hester Lingsma, MD, UD; Ton van den Meiracker, MD, PhD, internist; Peter Moorman, MD, UD; Anita Rijneveld, MD PhD, internist-hematologist; Joost Schouten, MD PhD, neurosurgeon; Karin Schurink, MD PhD, internist-infectiologist; Marion Smits, MD PhD, neuroradiologist; Bing Thio, MD PhD, dermatologist; Willy Visser, MD PhD, internist; Annelies de Weerd, MD, internist nephrologist; Roos van Westrhenen, MD, PhD, psychia-trist and clinical Pharmacologist.
Student reviewersNermina Buljubasic, Adem Dereci, Ivana van der Geest, Patrick van der Geest, Meelad Habib, Philip Jansen, Tim Korevaar, Perijn Obbens, Begum Pekbay, Maartje van der Schaaf, Sadaf Soloukey, Michelle Tas, Hilal Varol, medical students.
Supervisory boardWalter van den Broek, MD PhD, psychiatrist, director of medical education; Sílvia Mamede Studart Soares, MD PhD, associate professor of medical education; Maarten Frens; UD system physiology.
FormattingDitems Media, Monnickendam
PrintingMazeline BV, Purmerend
CorrespondenceErasmus Journal of MedicineAngela van Gelderen, editorial assistantRoom AE-255PO Box 2040 3000 CA RotterdamE-mail: [email protected]
Websitewww.erasmusjournalofmedicine.nl. Like us on www.facebook.com/erasmusjournalofmedicine and www.twitter.com/ErasmusJournal
Copyright and warrantyStatements, opinions, and results of studies published in Erasmus Journal of Medicine (EJM) are those of the authors and do not reflect the policy or position of the Erasmus MC University Medical Center or the Editorial Board of the EJM. The Erasmus MC University Medical Center or the Editorial Board of the EJM provide no warranty as to their accuracy or reliability. By submitting an article to the Erasmus Journal of Medicine, the authors have transferred and assigned all rights, title, interest, and copyright ownership in their manuscript to Erasmus MC. The rights assigned to the Erasmus MC include (but are not limited to) the rights to edit, publish, reproduce, distribute copies, prepare derivative works, include in indexes or search databases in print, electronic, or other media, (whether or not they are used when this agreement is executed), and claim copyright in this Work throughout the world for as long as it is copyrighted, including renewals or extensions. All accepted manuscripts become the Erasmus MC’s property and may not be published elsewhere, as a whole or in part, without the Erasmus MC’s prior written permission
Colophon
Colophon
Erasmus Journal of Medicine • vol 5 - no 1 - October 20154
Foreword
Erasmus MC’s position in the worldResearch is a global enterprise. Within the scientific discourse, innovative ideas are conceived, developed, verified, and applied. This is why Erasmus MC can only exist as a research institute if it is part of an international platform. Fortunately, we have achieved a respectable international reputation. The influential Times Higher Education Ranking ranks Erasmus MC’s clinical research within the world’s top 20, together with prestigious institutes, such as Harvard, Johns Hopkins, Oxford, Cambridge and Karolinska Institute.
But patient care and medical education - both core tasks of Erasmus MC in addition to research - are also becoming increasingly international. We encourage our medical students to spend at least a few months abroad during their study to get a feel for international collaboration and cultural differences. Furthermore, we also see an increasing number of foreign patients choosing to be treated in our hospital. This could very well be the result of our strong international reputation in research.
While research has always been international, I think we are only at the beginning of the internationalization of patient care. Modern means of information exchange, communication, and transport have made the world smaller. Patients, organizations, and governments will increasingly behave like consumers trying to find the best quality at the best price.
Erasmus MC has to ensure that it not only delivers the best quality, but that this is also recognized by audiences across the world. ‘Be good and let others know’. Our excellent scientific reputation, based on solid numbers, is a great starting point for internationalization in general.
Erasmus Journal of Medicine not only provides medical students of Erasmus MC with a platform to take their first steps into the world of scientific publishing, but it also prepares them for a future in the global world of both medical science and practice.
Prof. Dr. Jaap Verweij, Dean and vice-chairman of the Executive Board of Erasmus MC
Dr. Ajda Rowshani, Co-editor in chief and chair of the editorial board
vol 5 - no 1 - October 2015 • Erasmus Journal of Medicine 5
Erasmus Journal of Medicine
ForEWord 4
Editorial CoMMEnt
Our way to an acknowledgeable journal: 6 a journey with research, teamwork and winners Linda Al-Hassany, Mostafa Mohseni, Begum Pekbay, Iris van der Sar
Birth of a unique journal 7Maarten Frens and Wu Wei
Kidney donation reimbursement; is it ethical? 8Martijn van den Hoogen
Is screening always the best option? 9 Ron de Bruin and Iris van der Sar
SyStEMatiC rEviEW
The role of positron-emission tomography in the 10 diagnosis of giant cell arteritis A systematic review and meta-analysisNiels van der Schaft, Kars Compagne, Albert Groenendijk, Marijn Vis
Long-term outcome in adult patients after surgery for 17isolated pulmonary valve stenosis in childhood A systematic review and meta-analysisBritt Kramer, Wouter van Genuchten, Myrthe Menting
Clinical impact of single nucleotide polymorphism 21identification associated with the development of testicular germ cell cancer Jochem Bosch, Farhat Shalizi, Leendert Looijenga
Incidence and severity of herpes zoster after organ 25transplantation. A meta-analysisNynke Bouma, Kendis Esuon, Kristel Kolloen, Ron de Bruin, Nicole van Besouw
Peptide YY and reduction in food intake: fact or fiction? 29Linda Al-Hassany, Elise Adriaansens, Aart Jan van der Lelij
The efficacy and safety of non-vitamin K oral 34 anticoagulants in the treatment of acute venous thromboembolismA systematic review and meta-analysis Lizet Küsters, Anneke Snel, Marieke Kruip
Reversibility of tenofovir nephrotoxicity in HIV-positive 39 patients. A systematic review Ysette Karlijn de Boer, Rosanne de Lannoy, Rana Orhan, Bart Rijnders
The relationship between maternal migration and an 43increased risk of childhood autism. A systematic reviewAnne Roos van der Endt, Merel Stegenga, Mila Ivanova
Contents
oPinion
Should financial compensation be given for living 48 kidney donation? Stephanie de Graaff and Ed van Beeck
CliniCal iMaGE
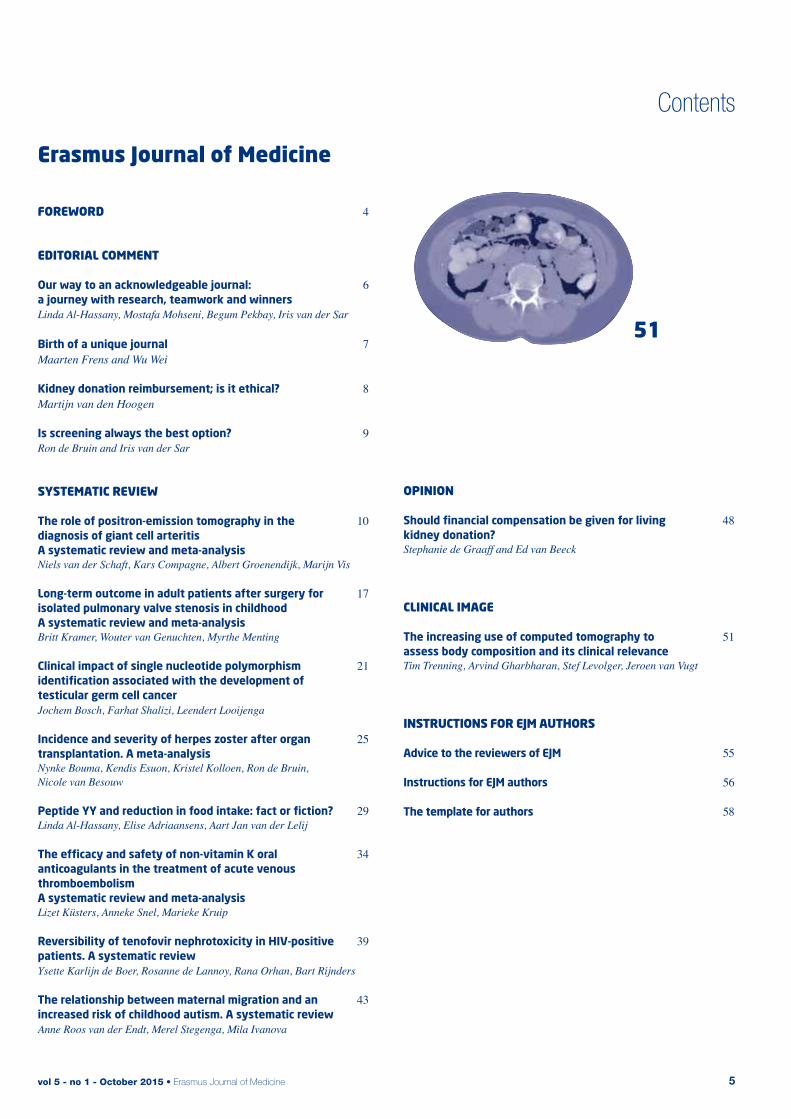
The increasing use of computed tomography to 51assess body composition and its clinical relevanceTim Trenning, Arvind Gharbharan, Stef Levolger, Jeroen van Vugt
inStruCtionS For EJM autHorS
Advice to the reviewers of EJM 55
Instructions for EJM authors 56
The template for authors 58
51
Erasmus Journal of Medicine • vol 5 - no 1 - October 20156
Editorial comment
The board of Erasmus Journal of Medicine (EJM) consists of a dynamic teamwork between students and staff members. Since the Erasmus University Medical Center (Erasmus MC) serves as a matrix for aspiring as well as successful academics, we are continuously receiving scientific articles for review.With the same aim in mind – providing students and researchers of the Medical Faculty of the Erasmus University an approachable way to publish scientific articles and to promote research as early as possible - we strive to push the boundaries of this Journal towards an acknowledgeable faculty journal. Starting with a bustling period of managing a pile of articles, the end result of browsing through a brand new issue always feels quite satisfying!
As an annual event, the best EJM article receives an award which is personally handed over by our Dean. This year, the award ceremony took place during ‘In Praise of Medicine’ in October. After extensive evaluationby our scientific jury, an orthopaedics and radiology related article by Stephanie de Graaff et al. was chosen as the best among all. They studied the association between knee joint shape and osteoarthritis. This research article,
our way to an acknowledgeable journal: a journey with research, teamwork and winners
‘The association between knee joint shape and osteoarthritis development in middle-aged, overweight and obese women’, can be found in the second issue of vol. 4, which is published in March 2015. A population with an important worldwide health problem, i.e. obesity, is selected in this study to investigate whether knee shapes can predict the incidence and the progression of knee osteoarthritis. The clinical relevanc of their research question is clear: the early detection of those distinctive knee shape characteristics associated with the high-risk of osteoarthritis . In an aging population with an steadily growing incidence of obesity, early detection of this clinical problem is essential.
It remains a tough job to choose the best article of each year, meaning that the articles of Erasmus MC’s students are of high quality. This is also approved by external evaluation: PubMed reviewers noticed that especially our systematic reviews can be rated as excellent. Congratulations to all our student authors!
Thank you for choosing EJM.
Student editors: Linda Al-Hassany, Mostafa Mohseni,Begum Pekbay, Iris van der Sar
vol 5 - no 1 - October 2015 • Erasmus Journal of Medicine 7
The Erasmus Journal of Medicine (EJM) is, to the best of our knowledge, a unique scientific journal. On one hand it is primarily meant for original articles written by medical students. On the other hand it has a complete reviewing system, including peer review, and editorial decisions. It therefore provides a unique training opportunity for medical students who have scientific aspirations.
The EJM is by origin first and foremost a student initiative, initiated by the Erasmus MC Studentenraad. In 2008 they actually got triggered by the launch of another biomedical journal at another Dutch university that was filled with student products. A small delegation, consisting of Christian von Kriegenbergh and Wu Wei, visited the offices of said journal and came to the conclusion that something more exciting and more professional should be possible within the Rotterdam context.
Indeed the conditions at Erasmus MC were optimal at the time. The medical bachelor had chosen to seek a profile that stressed the combination of medicine and science, fitting for the largest medical research institute in the Netherlands. Immediate support was found with Prof. Themmen, the coordinator of the BSc program. He had already been heavily involved in student profile tracks that had similar objectives, such as the Junior Med School and the Erasmus MC Honours Class.
Possibly that strongest support came from the Dean of Erasmus MC. At the time this was Prof. Pols and he had, coincidently, proposed a similar journal with a similar setup during his inaugural speech as full professor in 1998. During this speech, Prof. Pols had even proposed a name for such a journal: Eras-mus Journal of Medicine. Thus it seemed only fitting to start a journal with that name, a decade after it had been proposed.
The first Head editor of EJM, Prof. Dippel, created a format that is still in use: both the editorial board and the reviewers of EJM would consist of equal amounts of students, established clinicians and scientists. This has been a formula that has been successful ever since.
Maarten Frens, and Wu Wei Department of Neuroscience, Erasmus MC; [email protected] Department of Orthopedics, Erasmus MC; [email protected]
Birth of a unique journal
Editorial comment
Erasmus Journal of Medicine • vol 5 - no 1 - October 20158
Editorial comment
Many transplant programs have been implemented all over the world to increase the number of kidney donors, with varying successes, In this issue of Erasmus Journal of Medicine, de Graaff appealsfor financial compensation for kidney donation. A financial compensation could increase the number of living donations. She also refers to the potential negative effects of such a concept, like jeopardizing the equality principle.
Paid kidney donation might target the weakest / poorest of society, since their decision to donate might be influenced by money. Therefore there might not be a free choice and so the informed consent would be invalid. However, if a person is capable of understandingthe risks associated with kidney donation, what is unethical about that person’s decision? One could argue that the person is motivated by ‘wrong’ reasons (money instead of altruism), but is that in itself a bad thing? In some countries donation of blood or stem cells is financially reimbursed and accepted. Moreover,financial incentives are often used to move people to accomplish a social goal The Hippocratic tradition (primum non nocere) and the Philosophical tradition (respect for human life) are used to criticize the paid living donor concept, because healthy individuals are then exposed to a higher and an unnecessary risk of complications and even death. However, this argument also implies for non-paid living donation. So the Hippocratic and Philosophical tradition add no extra ethical limitations, especially since one can assume that doctors will still do everything to minimize the risk for the donor.
However, before we implement this financial compensation, let us reflect on two other issues. First, paid donation could create a system of organ selling and organ trafficking. This creates an enormous fear for the care providers in the transplant community. An organ cannot be traded or offered to the highest bidder. The WHO states “Trade is inconsistent with the most basic human values and contravenes the Universal Declaration of Human Rights and the spirit of the WHO Constitution.” Moreover, such a ‘market’ profit could become more important than the quality of the transplantation care. To prevent organ selling and organ trafficking, a paid donation system should be strictly regulated by the government, and it should be subjected to the same allocation rules as it is the common practice nowadays. So the allocation should be transparent and fair.
Second, prior to the implementation of such a paid donation principle , it seems necessary to consult the general public. Organ donation as a whole greatly depends on public view and acceptance. If the public views paid donation as unacceptable, the implementation could have detrimental effects for the current running programs, for example the willingness to donate after death resulting in a lower number of total organs donated.
Martijn W.F. van den Hoogen, MD , PhDErasmus MC, Department of Nephrology and Renal Transplantation
Kidney donation reimbursement; is it ethical?
vol 5 - no 1 - October 2015 • Erasmus Journal of Medicine 9
Editorial comment
Jochem Bosch et al. performed in this issue a literature review to find SNP variants associated with Testicular germ cell tumor (TGCT) development. These kind of tumors are worldwide the most common malignancy in men aged 15–45 years and accounts for approximately 1% of all cancers in males. Therefore, the relevance of research for this type of malignancy seems to be relatively high.
Early detection of tumors is a very hot topic in medicine, because early detection is associated with less intensive treatment and higher survival rates in many types of cancer. Bosch et al. show that a few SNPs that are strongly associated with the development of TGCT. Based on this finding the authors recommend to screen al young men for the presence of these specific SNPs, for early detection and recommend follow up of these men to allow early detection of TGCT.
The current survival rate of patients treated for TGCT is already 95% without screening for SNPs. This is because of the remarkable sensitivity to radiotherapy and/or chemotherapy of these tumors. Nevertheless, this article recommends a (worldwide) screening for SNPs and a follow-up in those carrying these SNPs.
SNPs are associated with increased risk, but it will not be sure that a patient will develop cancer. And it’s not sure that survival will be much better, because survival is already really high. Also, a person with the specific SNP will maybe have psychological burden of knowing to have an increased risk for developing cancer. It would be interesting if the authors would have dwelled upon how many saved lives a screening program would yield and weighed the advantages and disadvantages of cancer screening in general and in particular with regard to TGCT.
Of course we can discuss about the weight of low cost effectiveness, because in the other hand, it will be absolutely great when we could reach a 100% survival of this tumor by just screening for a few SNPs. Or to screen the high-risk men is another option to be keep in mind, based on family history or other possible risk factors.
It could be a step forward in medicine, but we must not forget the effort for an enormous logistical operation with high cost like this.
On behalf of the editorial board of the EJM,
Ron de Bruin and Iris van der Sar
is screening always the best option?
Erasmus Journal of Medicine • vol 5 - no 1 - October 201510
the role of positron-emission tomography in the diagnosis of giant cell arteritis A systematic review and meta-analysisNiels van der Schafta, Kars Compagnea, Albert Groenendijka, Marijn Visb
a Medical student, Erasmus University Medical Center, Rotterdam, the Netherlandsb Supervisor, Department of Rheumatology, Erasmus University Medical Center, Rotterdam, the NetherlandsCorrespondence: Niels van der Schaft, e-mail: [email protected]
abstractBackground: Giant cell arteritis (GCA) is an inflammatory disease of the larger vessels, typically affecting the temporal arteries, but involvement of the carotid and thoracic arteries is not uncommon. Serious complications such as blindness can occur if the disease is left untreated. Currently, the gold standard test for GCA is a temporal biopsy, but this invasive technique is not without risks and frequently inaccurate. We investigate the use of 18-fluoro-desoxyglucose (18F-FDG) positron emission tomography (PET) as a new diagnostic means in GCA.Methods: We performed a literature search in the MEDLINE database for original research articles written in the English language that discussed the use of PET in diagnosing GCA. After applying selection criteria, 9 articles were included for literature review and 4 of these were incorporated in a meta-analysis.Results: 18-FDG uptake in the extracranial arteries is correlated to the presence GCA within patients suspected for vasculitis. In our meta-analysis we found the following results: sensitivity 85% (95% CI; 74-92%, I2=0.0%), specificity 91% (95% CI; 82-96%, I2=31.2%), positive likelihood ratio 7.18 (95% CI; 3.43-15.06, I2 =10.1%) and negative likelihood ratio 0.19 (95% CI; 0.11-0.33, I2= 0.0%).Discussion: 18F-FDG-PET cannot replace temporal artery biopsy at the present time, because of its limited ability to visualise the cranial arteries. However, PET may be provide valuable information when extracranial involvement is suspected, specifically in biopsy-negative patients who are strongly suspected of having GCA.
Systematic Review
BackgroundGiant cell arteritis (GCA) is one of the two types of large vessel vasculitis, as classified according to the 2012 Revised International Chapel Hill Consensus Conference.[1] GCA is the most common primary systemic vasculitis in adults and usually occurs in those over the age of 50 years. This age criterion distinguishes GCA from the other type of large vessel vasculitis, Takayasu’s arteritis, a disease phenotypically similar to GCA but most commonly occuring in those aged younger than 50 years.[1] Histopathologically, however, Takayasu’s arteritis and GCA are indistinguishable.[1] GCA typically affects the temporal arteries, but involvement of the aorta and its major branches, mainly the branches of the carotid and vertebral arteries, is often observed. With the increasing use of novel imaging techniques, large vessel involvement is more frequently recognized.[2,3]GCA is the most common primary systemic vasculitis in adults. In Europe and North America, the estimated prevalence is 200 per 100 000 and the incidence is 20–30 per 100 000.[4-8] If left undiagnosed, the disease progresses and can result in audiovestibular dysfunction, generalised peripheral polyneuro-pathy, stroke, myocardial infarctions, and blindness.[9-12]
The clinical presentation varies significantly between cases and diagnosing CGA can be difficult, but a variety of diagnostic tools are helpful in the diagnosis of GCA. These include haemoglobin counts, ESR/CRP, liver biochemistry and, most importantly, temporal artery biopsies. Because the latter test produces far more specific results than the former three [13], a positive temporal artery biopsy is currently regarded as the gold standard in the diagnosis of GCA.[14] However, this gold standard test is not without its limitations. In their 1983 study, Hall and colleagues [15] already found that its sensitivity is not ideal (85%). They also remarked that in other, similar studies, sensitivity had varied between 67% and 97%. In these studies, a diagnosis of GCA was made using other strong radiological, pathological or clinical evidence.[15,16] This means that the current gold standard test will still leave more than 1 in every 10 patients undiagnosed. These results appear to hold true in more recent research, as a Spanish study [17] conducted in 2001 found that 29 of 190 patients with proven GCA had a negative initial temporal artery biopsy.
vol 5 - no 1 - October 2015 • Erasmus Journal of Medicine 11
Systematic Review
Biopsies might be negative because the biopsy missed the pathologically inflamed area, or because the GCA has an atypical phenotype and does not involve the temporal arteries.[18] Such extracranial involvement can occur in up to 74% of GCA patients.[19] The current imperfect gold standard and the serious morbidity and mortality that are associated with GCA led us to investigate alternative methods of diagnosing the disease. One such method is the use of positron emission tomography with or without computed tomography (PET or PET-CT) to detect large vessel inflammation or extracranial involvement secondary to GCA. PET has shown promise in detecting extracranial involvement of GCA in previous research.[19-22] A PET scan is a non-invasive assessment technique compared to temporal artery biopsies. Hemorrhage and facial nerve injury have been reported as complications of the biopsy procedure.[23,24] In addition, several studies report that PET has proven useful in diagnosing patients with fever or inflammation of unknown origin [25-27] and patients with large vessel vasculitis.[28-30] Therefore, the objective of this review is to determine whether PET, with or without an added CT component, is a valuable addition to the current diagnostic work-up of GCA.
MethodsLiterature searchWe performed a search in the MEDLINE database for articles written in the English language that addressed the use of 18-FDG PET in the diagnostic process of GCA, up to September 2014. The exact MeSH-query we used was the following:
(“Giant Cell Arteritis/diagnosis”[Majr] OR “Giant Cell Arteritis/ radiography”[Majr] OR “Giant Cell Arteritis/radionuclide imaging”[Majr]) AND ((“Radionuclide Imaging”[majr]) OR (“Positron-Emission Tomography”[Mesh])OR (“Fluorode-oxyglucose F18/diagnostic use”[Mesh])) AND (“humans”[MeSH Terms] AND English[lang]) NOT “Case Reports”[ptyp]
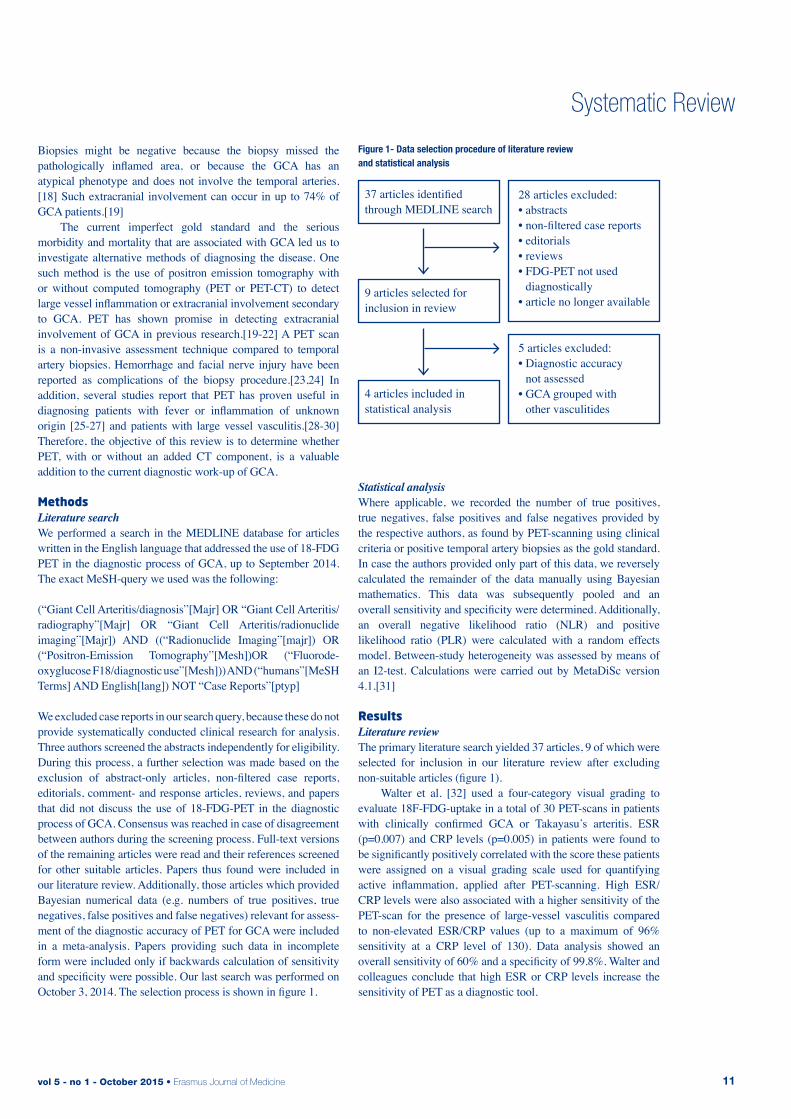
We excluded case reports in our search query, because these do not provide systematically conducted clinical research for analysis. Three authors screened the abstracts independently for eligibility. During this process, a further selection was made based on the exclusion of abstract-only articles, non-filtered case reports, editorials, comment- and response articles, reviews, and papers that did not discuss the use of 18-FDG-PET in the diagnostic process of GCA. Consensus was reached in case of disagreement between authors during the screening process. Full-text versions of the remaining articles were read and their references screened for other suitable articles. Papers thus found were included in our literature review. Additionally, those articles which provided Bayesian numerical data (e.g. numbers of true positives, true negatives, false positives and false negatives) relevant for assess-ment of the diagnostic accuracy of PET for GCA were included in a meta-analysis. Papers providing such data in incomplete form were included only if backwards calculation of sensitivity and specificity were possible. Our last search was performed on October 3, 2014. The selection process is shown in figure 1.
Statistical analysisWhere applicable, we recorded the number of true positives, true negatives, false positives and false negatives provided by the respective authors, as found by PET-scanning using clinical criteria or positive temporal artery biopsies as the gold standard. In case the authors provided only part of this data, we reversely calculated the remainder of the data manually using Bayesian mathematics. This data was subsequently pooled and an overall sensitivity and specificity were determined. Additionally, an overall negative likelihood ratio (NLR) and positive likelihood ratio (PLR) were calculated with a random effects model. Between-study heterogeneity was assessed by means of an I2-test. Calculations were carried out by MetaDiSc version 4.1.[31]
resultsLiterature reviewThe primary literature search yielded 37 articles, 9 of which were selected for inclusion in our literature review after excluding non-suitable articles (figure 1). Walter et al. [32] used a four-category visual grading to evaluate 18F-FDG-uptake in a total of 30 PET-scans in patients with clinically confirmed GCA or Takayasu’s arteritis. ESR (p=0.007) and CRP levels (p=0.005) in patients were found to be significantly positively correlated with the score these patients were assigned on a visual grading scale used for quantifying active inflammation, applied after PET-scanning. High ESR/CRP levels were also associated with a higher sensitivity of the PET-scan for the presence of large-vessel vasculitis compared to non-elevated ESR/CRP values (up to a maximum of 96% sensitivity at a CRP level of 130). Data analysis showed an overall sensitivity of 60% and a specificity of 99.8%. Walter and colleagues conclude that high ESR or CRP levels increase the sensitivity of PET as a diagnostic tool.
37 articles identified through MEDLINE search
9 articles selected for inclusion in review
4 articles included in statistical analysis
28 articles excluded:• abstracts• non-filtered case reports• editorials• reviews• FDG-PET not used
diagnostically• article no longer available
5 articles excluded:• Diagnostic accuracy
not assessed• GCA grouped with
other vasculitides
Figure 1- Data selection procedure of literature review and statistical analysis
Erasmus Journal of Medicine • vol 5 - no 1 - October 201512
Systematic Review
Blockmans et al. [33] conducted a study to evaluate the use of 18F-FDG-PET in GCA and polymyalgia rheumatica (PMR). In a cohort of 25 patients with clinical symptoms associated with GCA or PMR, a PET-scan of the thoracic, femoral and tibial arteries was performed and assessed using a four-category scoring system similar to the system used by Walter et al..[32] Vascular uptake in thoracic arteries was significantly more frequently observed (p<0.0001) in patients with GCA. Uptake in the thoracic arteries was associated with a sensitivity of 56% and a specificity of 98% for the diagnosis of GCA or PMR. Vascular uptake in the legs displayed a sensitivity of 64%, but a specificity of 77%. The authors speculate that this might be explained by the fact that arteriosclerosis is more frequently observed in the lower legs. These authors subsequently set up another study [34] to assess 18F-FDG uptake in different parts of the vascular system and the larger joints at diagnosis and after three and six months of corticosteroid therapy. 35 patients with proven GCA underwent a PET-scan, which was scored at seven different vascular regions using the same scoring system as applied in their previous research. This resulted in a so-called total vascular score (TVS) ranging from 0 (no regions involved) to 21 (all regions involved). At baseline 29 out of 35 patients showed vascular uptake, most frequently (74%) in the subclavian arteries. In contrast with the aforementioned research by Walter et al. [32], patients with vascular 18F-FDG uptake had a significantly lower ESR (p=0.039) compared to those without vascular uptake in this study. After three months of corticosteroid therapy, mean TVS dropped to 2.4 ± 3.5 compared to baseline (p<0.0005) in 14 out of 22 patients who underwent a second PET-scan. After six months there was no further significant decrease in mean TVS in the 8 patients who still showed 18F-FDG uptake at this point. TVS did not differ significantly between patients who did and did not relapse. In line with the results of the study conducted by Walter et al. [32], Hooisma et al. [35] found that an elevated ESR was a statistically significant positive predictor for a positive 18F-FDG-PET-scan in cases of confirmed large vessel vasculitis. Additionally, the presence of arthralgia was determined to be a statistically significant negative predictor of a positive 18F-FDG-PET-scan. However, because these predictive effects were very weak, Hooisma et al. concluded that these parameters would be of little clinical relevance. 18F-FDG-PET was not found to be a sensitive diagnostic tool by Brodmann et al. [36], who hypothesized that like duplex ultrasonography, 18F-FDG-PET would be able to detect inflammation of small vessels such as the temporal arteries. However, 18F-FDG-PET was unable to detect inflammation in 17 patients with GCA which only involved the temporal arteries, as confirmed by ultrasound. It should be noted that in accordance with the results found using ultrasound, PET did detect inflammation of the large vessels in all of the remaining 5 patients, who only had extracranial manifestations of GCA. Hautzel et al. [21] investigated the degree of 18F-FDG uptake in the thoracic aorta compared to uptake in the liver, which invariably shows homogenous uptake, as a reference organ.
They quantified the maximal standardised uptake value (SUVmax) in predetermined regions of interest (ROI) in both of these organs. Subsequently, a cut-off ratio between these organs associated with an optimal sensitivity and specificity of the PET-scan was determined using a receiver operating characteristic (ROC). The study involved a cohort of 18 GCA patients and two control groups. The participants in the first control group were age- and sex-matched patients who underwent a PET-scan for oncological reasons but had no history of malignant mediastinal, pulmonary or liver processes; the second control group contained age- and sex matched participants with at least one elevated liver enzyme value. Other inclusion criteria in this group were identical to those for the other control group. An optimal cut-off value was identified in a comparison between the GCA group and the first control group, corresponding with a sensitivity of 88.9% and a specificity of 95.1%. Applying this cut-off ratio to the control group with elevated liver enzymes revealed a specificity of 95.6%. The authors did not provide a sensitivity in this study. Like Hautzel et al. [21], Prieto-Gonzalez et al. [19] determined sensitivity and specificity cut-off values for vascular inflammation as seen on PET/CT. A total of 32 patients were included, of whom 17 had used corticosteroids for a maximum of three days prior to scanning. The control group was comprised of 20 patients undergoing PET-scans for oncologic reasons. ROIs for 18F-FDG uptake were four aortic segments and their loco-regional tributaries, all normalised to liver 18F-FDG uptake, and SUVmax was determined quantitatively at each of these ROIs. SUVmax at every ROI was significantly higher in GCA patients compared to controls. The optimal cut-off value (1.89) provided a sensitivity of 80% and a specificity of 79%. Patients with cranial symptoms presented significantly higher values of maximal and mean SUVmax than patients lacking cranial manifestations. In agreement with the studies by Hooisma et al. [35] and Walter et al. [32], mean SUVmax correlated with CRP levels. Besson et al. [20] attempted to identify a new semi-quantitative standard for assessing the presence of aortic wall inflammation in GCA on 18F-FDG-PET-scans. The study included 11 patients with biopsy-proven GCA, 8 of whom were undergoing corticosteroid therapy, and 11 controls. ROIs investigated included the ascending aorta, aortic arch and descending thoracic aorta. In these regions the SUVmax of 18F-FDG was determined semi-quantitatively and normalised to either lung, liver or venous blood pool uptake. The aortic to blood pool uptake ratio was found to be the most discriminative between the two cohorts. When applied to the aortic arch this method provided the best diagnostic performance, providing a sensitivity and specificity of 82% and 91%, respectively. CRP levels were found to correlate with the amount of uptake of the ascending aorta in the GCA group, in consonance with research by Walter, Hooisma and Hautzel and their respective colleagues.[21,32,35] In a cohort including a total of 13 patients with GCA (n=10) or Takayasu’s arteritis (n=3), stratified by age, Henes et al. [22] found increased SUVmax of 18F-FDG in the ascending and descending aorta and supra-aortic branches in 9 out of 10 GCA patients. The one patient who did not have increased SUVmax was receiving steroid therapy when the PET-scan was performed.
vol 5 - no 1 - October 2015 • Erasmus Journal of Medicine 13
Systematic Review
However, 5 other patients in this group were also on steroid therapy during the PET-procedure. No patients in the control group, composed of 8 oncologic patients, showed pathological 18F-FDG uptake. By means of our own calculations, we determined the sensitivity and specificity to be 90% and 100%, respectively.
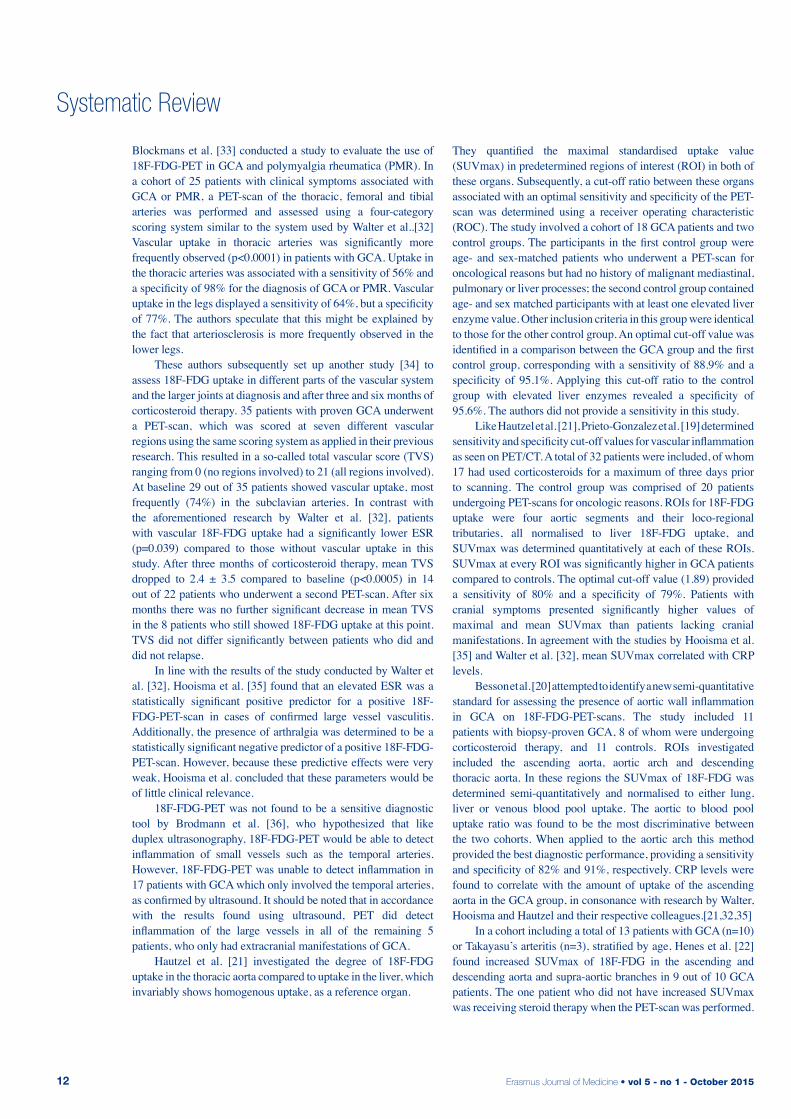
Meta-analysisOf the 9 articles selected for literature review, 4 were included in the statistical analysis. The remaining articles were excluded from analysis because they did not assess the diagnostic accuracy of PET in GCA in terms of specificity and sensitivity (Blockmans et al. (2006), Hooisma et al.), only compared the efficacy of PET with the efficacy of another diagnostic technique (Brodmann et al.), or analysed a heterogeneous cohort of patients with different types of vasculitis as opposed to GCA only, thus confounding the statistical data. (Blockmans et al. (2000), Walter et al.). The characteristics of the studies included in the meta-analysis are presented in table 1. The outcome of the meta-analysis is presented in figures 2 through 5. Overall sensitivity was determined to be 85% (95% CI; 74-92%, I2=0.0%), overall specificity was determined to be 91% (95% CI; 82-96%, I2=31.2%), positive likelihood ratio was determined to be 7.18 (95% CI; 3.43-15.06, I2 =10.1%) and negative likelihood ratio was determined to be 0.19 (95% CI; 0.11-0.33, I2= 0.0%).
discussionAt 85% sensitivity and 91% specificity, our own analysis confirms that PET is an accurate diagnostic tool for GCA. Although the resolution of PET has improved in recent years, visualisation of the temporal arteries remains very difficult because of the high uptake of 18F-FDG in the brain and the small size of the cranial vessels.[36,37] This limitation was also found by Brodmann et al. [36], who found that PET was unable to detect temporal inflammation but flawlessly identified extracranial involvement.
TP = true positives, FP = false positives, TN = true negatives, FN = false negatives, CI = confidence interval, LR = likelihood ratio, SUVmax = maximum standardised uptake value
Table 1 - Characteristics of studies included in meta-analysis.
Year
2014
2014
2008
2008
Design
Prospective, case-control
Retrospective, case-control
Retrospective
Retrospective, case-control
PET-scoring system
Mean of four SUVmax-values in four different aortic segmentsSUVmax-ratio artery/liver, artery/lung and artery/venous blood poolMaximum of six SUVmax-values measured in six arterial locationsSUVmax-ratio aorta/liver
TP
26
9
9
16
FP
4
1
0
2
TN
16
10
8
34
FN
6
2
1
2
Sensitivity (95% CI)
0.81 (0.64-0.93)
0.82 (0.48-0.98)
0.90 (0.55-1.00)
0.89 (0.65-0.99)
Specificity (95% CI)
0.80 (0.56-0.94)
0.91(0.59-1.00)
1.00 (0.63-1.00)
0.94(0.81-0.99)
Positive Likelihood Ration (95% CI)
4.06 (1.66 - 9.91)
9.00 (1.36-59.54)
15.55 (1.04-232.22)
16.00 (4.12 - 62.14)
Nagative Likelihood Ration (95% CI)
0.23 (0.11 - 0.50)
0.20 (0.06-0.71)
0.14 (0.03-0.64)
0.12 (0.03-0.44)
Study
Prieto- Gonzalez et al.
Besson et al.
Henes et al.
Hautzel et al.
Figure 2 - Sensitivity Forest Plot. CI = confidence interval
Figure 3 - Specificity Forest Plot. CI = confidence interval
Figure 4 - Positive Likelihood Ratio (LR) Forest Plot. CI = confidence interval
Figure 5 - Negative Likelihood Ratio (LR) Forest Plot. CI = confidence interval
Erasmus Journal of Medicine • vol 5 - no 1 - October 201514
Systematic Review
The sensitivity of the biopsy procedure has been reported to vary between 67% and 97% (the most common value appearing to be around 80-85%)[15-17] but its specificity is often not reported. The sensitivity we found in our meta-analysis for PET appears almost identical. Because of the aforementioned difficulties in visualising the temporal arteries with PET, we do not recommend replacing temporal artery biopsies with PET as the first diagnostic modality of choice. However, PET might be very well suited to demonstrate GCA in patients with a negative biopsy but suspected extracranial involvement. PET could potentially reach even higher sensitivity and specificity in these cases because its limited ability to visualise the cranial vessels would be taken out of the equation. Several issues arise in the interpretation of our meta-analysis and the literature we base our recommendation on. First of all, no standard protocol for the scoring of PET scans currently exists. Several authors have attempted to design a novel scoring system in their research. Hautzel et al. [21] proposed the use of a semi-quantitative scoring system based on the ratio between the SUVmax measured in the aorta and the liver. However, in a head-to-head comparison between different semi-quantitative scoring systems by Besson et al. [20], the aorta to liver ratio was outperformed by the aortic to venous blood pool SUVmax ratio. The latter study was methodically superior (but used a significantly smaller cohort) because all patients had biopsy-proven GCA, versus only clinical suspicion in the study by Hautzel et al. [21], and a carefully selected control group. For further research into the diagnostic performance of PET in GCA, we suggest the adoption of a semi-quantitative scoring system as opposed to a quantitative scoring system, because a semi-quantitative system generally achieves lower intra- and inter-observer variability.[38] We recommend the use of the aortic to venous blood pool SUVmax ratio using a cut-off value of 1.53, as proposed by Besson et al. [20], in order to achieve an optimal sensitivity and specificity. Several studies included in our review reported difficulties in distinguishing atherosclerosis from vasculitis on PET imaging. Atherosclerosis can produce an image similar to vasculitis, because increased macrophage metabolism in this disease process increases 18F-FDG uptake in the vessel walls. CT provides a solution in dealing with this difficulty, even without the use of intravenous contrast (which could introduce attenuation errors). Dunphy et al. [39] found that calcification found on CT and 18F-FDG uptake rarely occur simultaneously within a vessel. This provides further rationale for the use of joint PET-CT as a diagnostic tool for GCA in future research.Another problem with much of the pre-existing research in this field is that GCA is diagnosed inconsistently, based on either clinical criteria, a positive temporal artery biopsy or both. Because GCA shows significant clinical overlap with Takayasu’s arteritis and PMR, arbitrary stratification of patients in one of these groups is to some degree unavoidable. However, we argue that further research would significantly benefit from selection of patients with consistently defined GCA. As positive biopsies are currently the most accurate test, disregarding PET, we propose the exclusive selection of patients with positive temporal artery biopsies who fulfil the ACR-criteria for GCA in future research. These ACR-criteria are displayed in table 2.[40]
As a direct consequence of the overlap between GCA and other rheumatic diseases, these disease entities are often pooled in analyses investigating the efficacy of PET in large vessel vasculitis. In our opinion, a disease-specific targeted approach is more desirable because it allows for the design of more accurate diagnostic protocols. In order to make our meta-analysis as accurate as possible, we excluded studies with heterogeneous cohorts, i.e. cohorts consisting of patients with multiple types of vasculitis. By doing so, we achieved consistently low heterogeneity in our analysis. With increasing understanding of the underlying mechanisms and pathology of these diseases, we expect more specific research to be available in the near future.
Another point of note is that a considerable number of studies include patients who receive corticosteroid therapy during their participation in the study. As demonstrated by Walter et al. [32], the sensitivity and specificity of PET directly correlate with the degree of active inflammation (ESR/CRP) in a patient, with higher accuracy achieved at more active inflammation. Therefore, in clinical practice, PET might reach higher sensitivity because patients not yet on treatment will have highly active inflammation. Furthermore, many studies include only small cohort of patients, contain poorly matched or absent control groups and are retrospective in design. The consequence of such a design is that ideally only patients who have positive biopsies are studied. Whether there is a difference between the biopsy positive and negative GCA patients in terms of the development of extracranial manifestations is unknown and difficult to investigate. Future research would benefit from larger prospective, randomised trials with accurately matched controls. With continuing improvement in radiation dosage, image quality and scan time, we expect the sensitivity and specificity of PET to rise even further in the nearby future. A breakthrough in medical imaging was the introduction of the hybrid PET-CT scan. An important disadvantage of PET-scans is that anatomical landmarks are very difficult or impossible to recognise. The joint use of PET and CT can overcome this obstacle, but CT examination can also be used for correction of attenuation on PET images. PET-CT is commonly used in oncology, especially in staging lung cancer and lymphomas.[41,42] Hybrid PET-CT could potentially provide higher diagnostic accuracy that PET alone in the diagnosis of GCA. However, using both imaging techniques could lead to a significant increase in radiation dose. Research is currently being undertaken on how to counteract this disadvantage. Rodríguez-Vigil et al. have reported that the use of low-dose CT is possible without compromising image quality.[43]
A patient is considered to have GCA if three of these five criteria are met.
Table 2 - 1990 ACR criteria for the diagnosis of GCA.
1. Age at onset 50 years or more2. Newly developed (localized) headache3. Tenderness of temporal artery or decreased pulse4. ESR greater than or equal to 50 mm/hr5. Temporal artery biopsy showing vasculitis
vol 5 - no 1 - October 2015 • Erasmus Journal of Medicine 15
Conclusion After consideration of the results of our literature review and meta-analysis, we conclude that PET cannot replace temporal artery biopsy as a diagnostic modality in GCA at the present time. However, when considering GCA in patients with a negative biopsy, PET may provide a valuable addition because of its ability to visualise extracranial involvement. In our meta-analysis, we found that PET has a sensitivity of 85%, a specificity of 91%, a positive likelihood ratio of 7.18 and a negative likelihood ratio of 0.19 for diagnosing GCA. These values will most likely not be directly applicable in clinical situations, because the exact accuracy of this diagnostic modality will vary with the circumstances in which it is used. PET will achieve a higher accuracy in patients with highly active inflammation (high ESR/CRP levels) and extensive extracranial inflammation, but lower accuracy in those patients who receive immunosuppressive treatment (such as corticosteroids). The diagnostic accuracy of PET could be improved further by the development of standardised scoring systems and the use of joint PET-CT. However, our meta-analysis proves that when used in the right circumstances, PET is a very accurate diagnostic modality when considering GCA in clinical practice.
references1. Jennette J.C., Falk R.J., Bacon P.A., et al. 2012 revised Internatio-
nal Chapel Hill Consensus Conference Nomenclature of Vasculiti-des. Arthritis Rheum. 2013; 65: 1-11.
2. Martinez-Valle F., Solans-Laque R., Bosch-Gil J., et al. Aortic involvement in giant cell arteritis. Autoimmunity reviews. 2010; 9: 521-524.
3. Muratore F., Pazzola G., Pipitone N., et al. Large-vessel involve-ment in giant cell arteritis and polymyalgia rheumatica. Clin Exp Rheumatol. 2014; 32: S106-111.
4. Borchers A.T., Gershwin M.E. Giant cell arteritis: a review of classification, pathophysiology, geoepidemiology and treatment. Autoimmunity reviews. 2012; 11: A544-554.
5. Gonzalez-Gay M.A., Garcia-Porrua C. Epidemiology of the vascu-litides. Rheum Dis Clin North Am. 2001; 27: 729-749.
6. Gonzalez-Gay M.A., Martinez-Dubois C., Agudo M., et al. Giant cell arteritis: epidemiology, diagnosis, and management. Current rheumatology reports. 2010; 12: 436-442.
7. Gonzalez-Gay M.A., Vazquez-Rodriguez T.R., Lopez-Diaz M.J., et al. Epidemiology of giant cell arteritis and polymyalgia rheuma-tica. Arthritis Rheum. 2009; 61: 1454-1461.
8. Richards B.L., March L., Gabriel S.E. Epidemiology of large-vessel vasculidities. Best Pract Res Clin Rheumatol. 2010; 24: 871-883.
9. Ness T., Bley T.A., Schmidt W.A., et al. The diagnosis and treat-ment of giant cell arteritis. Deutsches Arzteblatt international. 2013; 110: 376-385; quiz 386.
10. Salvarani C., Cantini F., Boiardi L., et al. Polymyalgia rheumatica and giant-cell arteritis. N Engl J Med. 2002; 347: 261-271.
11. Salvarani C., Macchioni P.L., Tartoni P.L., et al. Polymyalgia rheumatica and giant cell arteritis: a 5-year epidemiologic and clinical study in Reggio Emilia, Italy. Clin Exp Rheumatol. 1987; 5: 205-215.
12. Schmidt W.A., Gromnica-Ihle E. What is the best approach to di-agnosing large-vessel vasculitis? Best Pract Res Clin Rheumatol. 2005; 19: 223-242.
13. Weyand C.M., Goronzy J.J. Clinical practice. Giant-cell arteritis and polymyalgia rheumatica. N Engl J Med. 2014; 371: 50-57.
14. Weyand C.M., Goronzy J.J. Giant-cell arteritis and polymyalgia rheumatica. Ann Intern Med. 2003; 139: 505-515.
15. Hall S., Persellin S., Lie J.T., et al. The therapeutic impact of temporal artery biopsy. Lancet. 1983; 2: 1217-1220.
16. Jones J.G., Hazleman B.L. Prognosis and management of polymy-algia rheumatica. Ann Rheum Dis. 1981; 40: 1-5.
17. Gonzalez-Gay M.A., Garcia-Porrua C., Llorca J., et al. Biopsy-ne-gative giant cell arteritis: clinical spectrum and predictive factors for positive temporal artery biopsy. Semin Arthritis Rheum. 2001; 30: 249-256.
18. Brack A., Martinez-Taboada V., Stanson A., et al. Disease pattern in cranial and large-vessel giant cell arteritis. Arthritis Rheum. 1999; 42: 311-317.
19. Prieto-Gonzalez S., Depetris M., Garcia-Martinez A., et al. Positron emission tomography assessment of large vessel inflam-mation in patients with newly diagnosed, biopsy-proven giant cell arteritis: a prospective, case-control study. Ann Rheum Dis. 2014; 73: 1388-1392.
20. Besson F.L., de Boysson H., Parienti J.J., et al. Towards an optimal semiquantitative approach in giant cell arteritis: an (18)F-FDG PET/CT case-control study. Eur J Nucl Med Mol Imaging. 2014; 41: 155-166.
21. Hautzel H., Sander O., Heinzel A., et al. Assessment of large-vessel involvement in giant cell arteritis with 18F-FDG PET: introducing an ROC-analysis-based cutoff ratio. J Nucl Med. 2008; 49: 1107-1113.
22. Henes J.C., Muller M., Krieger J., et al. [18F] FDG-PET/CT as a new and sensitive imaging method for the diagnosis of large vessel vasculitis. Clin Exp Rheumatol. 2008; 26: S47-52.
23. Rison R.A. Branch facial nerve trauma after superficial temporal artery biopsy: a case report. J Med Case Rep. 2011; 5: 34.
24. Yoon M.K., Horton J.C., McCulley T.J. Facial nerve injury: a com-plication of superficial temporal artery biopsy. Am J Ophthalmol. 2011; 152: 251-255 e251.
25. Balink H., Collins J., Bruyn G.A., et al. F-18 FDG PET/CT in the diagnosis of fever of unknown origin. Clin Nucl Med. 2009; 34: 862-868.
26. Blokhuis G.J., Bleeker-Rovers C.P., Diender M.G., et al. Diag-nostic value of FDG-PET/(CT) in children with fever of unknown origin and unexplained fever during immune suppression. Eur J Nucl Med Mol Imaging. 2014; 41: 1916-1923.
27. Hao R., Yuan L., Kan Y., et al. Diagnostic performance of 18F-FDG PET/CT in patients with fever of unknown origin: a meta-analysis. Nucl Med Commun. 2013; 34: 682-688.
28. Fuchs M., Briel M., Daikeler T., et al. The impact of 18F-FDG PET on the management of patients with suspected large vessel vasculitis. Eur J Nucl Med Mol Imaging. 2012; 39: 344-353.
29. Muto G., Yamashita H., Takahashi Y., et al. Large vessel vasculitis in elderly patients: early diagnosis and steroid-response evalua-tion with FDG-PET/CT and contrast-enhanced CT. Rheumatol Int. 2014:
30. Papathanasiou N.D., Du Y., Menezes L.J., et al. 18F-Fludeoxy-glucose PET/CT in the evaluation of large-vessel vasculitis: diag-nostic performance and correlation with clinical and laboratory parameters. Br J Radiol. 2012; 85: e188-194.
31. Zamora J., Abraira V., Muriel A., et al. Meta-DiSc: a software for meta-analysis of test accuracy data. BMC Med Res Methodol. 2006; 6: 31.
32. Walter M.A., Melzer R.A., Schindler C., et al. The value of [18F]FDG-PET in the diagnosis of large-vessel vasculitis and the assessment of activity and extent of disease. Eur J Nucl Med Mol Imaging. 2005; 32: 674-681.
33. Blockmans D., Stroobants S., Maes A., et al. Positron emission tomography in giant cell arteritis and polymyalgia rheumatica: evidence for inflammation of the aortic arch. Am J Med. 2000; 108: 246-249.
34. Blockmans D., de Ceuninck L., Vanderschueren S., et al. Repetitive 18F-fluorodeoxyglucose positron emission tomography in giant cell arteritis: a prospective study of 35 patients. Arthritis Rheum. 2006; 55: 131-137.
Systematic Review
Erasmus Journal of Medicine • vol 5 - no 1 - October 201516
35. Hooisma G.A., Balink H., Houtman P.M., et al. Parameters related to a positive test result for FDG PET(/CT) for large vessel vascu-litis: a multicenter retrospective study. Clin Rheumatol. 2012; 31: 861-871.
36. Brodmann M., Lipp R.W., Passath A., et al. The role of 2-18F-fluoro-2-deoxy-D-glucose positron emission tomography in the diagnosis of giant cell arteritis of the temporal arteries. Rheuma-tology (Oxford). 2004; 43: 241-242.
37. Belhocine T., Blockmans D., Hustinx R., et al. Imaging of large vessel vasculitis with (18)FDG PET: illusion or reality? A critical review of the literature data. Eur J Nucl Med Mol Imaging. 2003; 30: 1305-1313.
38. Besson F.L., Parienti J.J., Bienvenu B., et al. Diagnostic perfor-mance of (1)(8)F-fluorodeoxyglucose positron emission tomograp-hy in giant cell arteritis: a systematic review and meta-analysis. Eur J Nucl Med Mol Imaging. 2011; 38: 1764-1772.
39. Dunphy M.P., Freiman A., Larson S.M., et al. Association of vascular 18F-FDG uptake with vascular calcification. J Nucl Med. 2005; 46: 1278-1284.
40. Hunder G.G., Bloch D.A., Michel B.A., et al. The American Col-lege of Rheumatology 1990 criteria for the classification of giant cell arteritis. Arthritis Rheum. 1990; 33: 1122-1128.
41. Wu L.M., Chen F.Y., Jiang X.X., et al. 18F-FDG PET, combined FDG-PET/CT and MRI for evaluation of bone marrow infiltration in staging of lymphoma: a systematic review and meta-analysis. Eur J Radiol. 2012; 81: 303-311.
42. Wu Y., Li P., Zhang H., et al. Diagnostic value of fluorine 18 fluorodeoxyglucose positron emission tomography/computed tomography for the detection of metastases in non-small-cell lung cancer patients. Int J Cancer. 2013; 132: E37-47.
43. Rodriguez-Vigil B., Gomez-Leon N., Pinilla I., et al. PET/CT in lymphoma: prospective study of enhanced full-dose PET/CT versus unenhanced low-dose PET/CT. J Nucl Med. 2006; 47: 1643-1648.
Systematic Review
vol 5 - no 1 - October 2015 • Erasmus Journal of Medicine 17
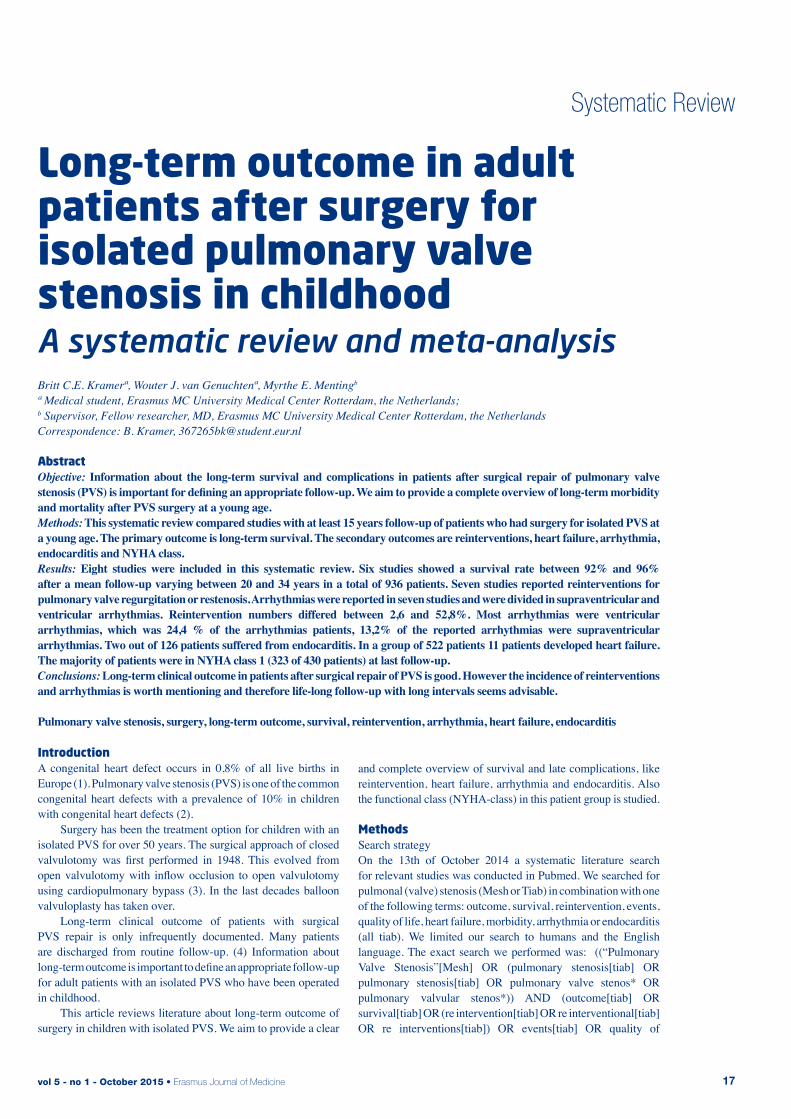
long-term outcome in adult patients after surgery for isolated pulmonary valve stenosis in childhood A systematic review and meta-analysisBritt C.E. Kramerª, Wouter J. van Genuchtenª, Myrthe E. Mentingb
ª Medical student, Erasmus MC University Medical Center Rotterdam, the Netherlands;b Supervisor, Fellow researcher, MD, Erasmus MC University Medical Center Rotterdam, the NetherlandsCorrespondence: B. Kramer, [email protected]
abstractObjective: Information about the long-term survival and complications in patients after surgical repair of pulmonary valve stenosis (PVS) is important for defining an appropriate follow-up. We aim to provide a complete overview of long-term morbidity and mortality after PVS surgery at a young age. Methods: This systematic review compared studies with at least 15 years follow-up of patients who had surgery for isolated PVS at a young age. The primary outcome is long-term survival. The secondary outcomes are reinterventions, heart failure, arrhythmia, endocarditis and NYHA class. Results: Eight studies were included in this systematic review. Six studies showed a survival rate between 92% and 96% after a mean follow-up varying between 20 and 34 years in a total of 936 patients. Seven studies reported reinterventions for pulmonary valve regurgitation or restenosis. Arrhythmias were reported in seven studies and were divided in supraventricular and ventricular arrhythmias. Reintervention numbers differed between 2,6 and 52,8%. Most arrhythmias were ventricular arrhythmias, which was 24,4 % of the arrhythmias patients, 13,2% of the reported arrhythmias were supraventricular arrhythmias. Two out of 126 patients suffered from endocarditis. In a group of 522 patients 11 patients developed heart failure. The majority of patients were in NYHA class 1 (323 of 430 patients) at last follow-up.Conclusions: Long-term clinical outcome in patients after surgical repair of PVS is good. However the incidence of reinterventions and arrhythmias is worth mentioning and therefore life-long follow-up with long intervals seems advisable.
Pulmonary valve stenosis, surgery, long-term outcome, survival, reintervention, arrhythmia, heart failure, endocarditis
Systematic Review
introductionA congenital heart defect occurs in 0,8% of all live births in Europe (1). Pulmonary valve stenosis (PVS) is one of the common congenital heart defects with a prevalence of 10% in children with congenital heart defects (2). Surgery has been the treatment option for children with an isolated PVS for over 50 years. The surgical approach of closed valvulotomy was first performed in 1948. This evolved from open valvulotomy with inflow occlusion to open valvulotomy using cardiopulmonary bypass (3). In the last decades balloon valvuloplasty has taken over. Long-term clinical outcome of patients with surgical PVS repair is only infrequently documented. Many patients are discharged from routine follow-up. (4) Information about long-term outcome is important to define an appropriate follow-up for adult patients with an isolated PVS who have been operated in childhood. This article reviews literature about long-term outcome of surgery in children with isolated PVS. We aim to provide a clear
and complete overview of survival and late complications, like reintervention, heart failure, arrhythmia and endocarditis. Also the functional class (NYHA-class) in this patient group is studied.
MethodsSearch strategyOn the 13th of October 2014 a systematic literature search for relevant studies was conducted in Pubmed. We searched for pulmonal (valve) stenosis (Mesh or Tiab) in combination with one of the following terms: outcome, survival, reintervention, events, quality of life, heart failure, morbidity, arrhythmia or endocarditis (all tiab). We limited our search to humans and the English language. The exact search we performed was: ((“Pulmonary Valve Stenosis”[Mesh] OR (pulmonary stenosis[tiab] OR pulmonary stenosis[tiab] OR pulmonary valve stenos* OR pulmonary valvular stenos*)) AND (outcome[tiab] OR survival[tiab] OR (re intervention[tiab] OR re interventional[tiab] OR re interventions[tiab]) OR events[tiab] OR quality of
Erasmus Journal of Medicine • vol 5 - no 1 - October 201518
life[tiab] OR heart failure[tiab] OR morbidity[tiab] OR arrhythmia[tiab] OR endocarditis[tiab]) AND (“humans”[MeSH Terms] AND English[lang]))).
In- and exclusion criteriaArticles had to have a long term follow-up of patients surgically treated for isolated PVS. To accomplish our search the following inclusion criteria were used:- Patients had to be surgically treated for PVS- Minimal mean follow-up duration of 15 years- Patients had to be treated before 18 years of age. Studies were excluded when other heart defects were present, e.g. Tetralogy of Fallot or transposition of the great arteries, except for small atrial septum defect (ASD) or patent foramen ovale.
Study selectionThe titles and abstracts of the articles were screened by one of the researchers. The full-text articles were analysed by two researchers (BK and WvG) separately.
OutcomeAs a primary outcome we analysed long-term survival. Secondary outcomes were: reinterventions, heart failure, arrhythmia, endocar-ditis and NYHA-class at last follow-up. NYHA-class is a functional classification for patients with heart failure. Parameters that are used are symptoms, limitations of physical activity and status of rest (5).
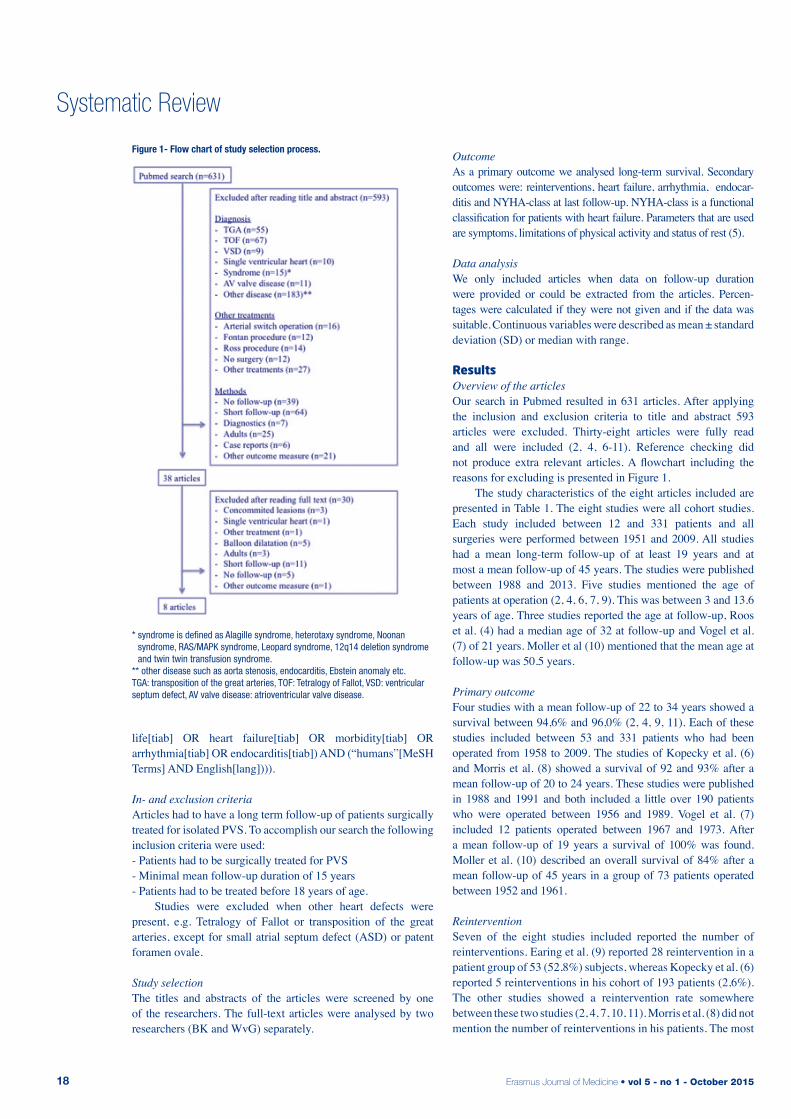
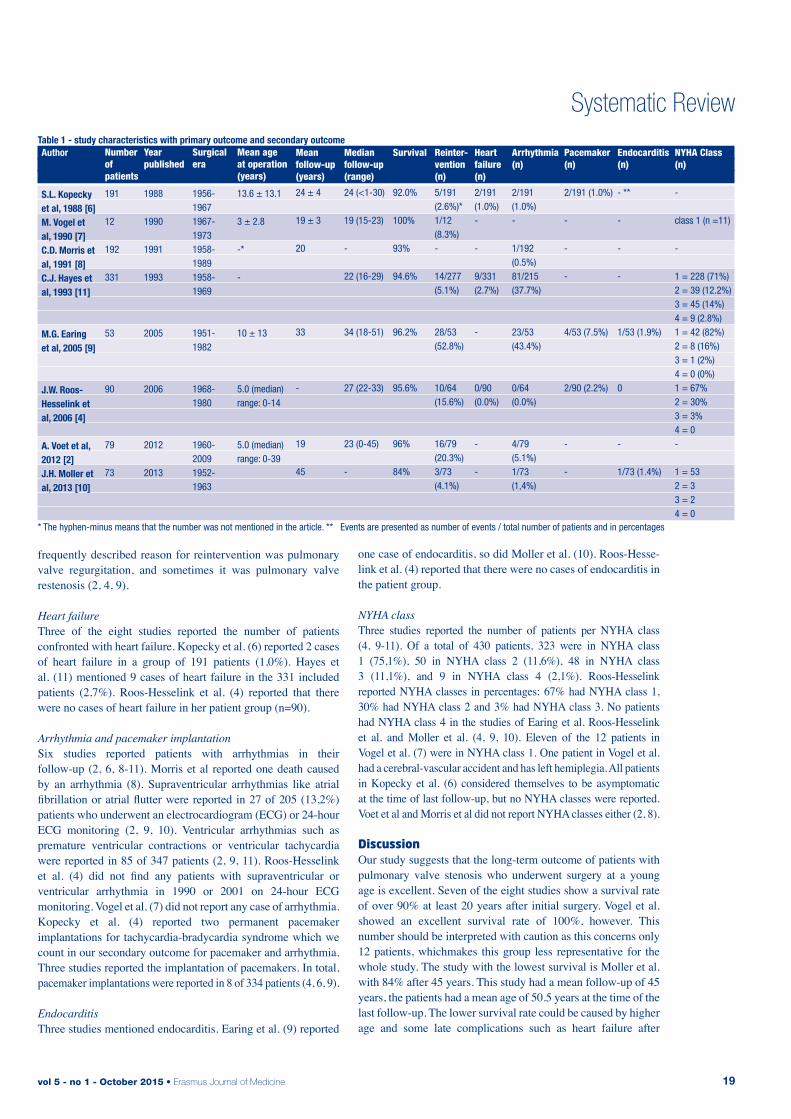
Data analysisWe only included articles when data on follow-up duration were provided or could be extracted from the articles. Percen-tages were calculated if they were not given and if the data was suitable. Continuous variables were described as mean ± standard deviation (SD) or median with range. resultsOverview of the articlesOur search in Pubmed resulted in 631 articles. After applying the inclusion and exclusion criteria to title and abstract 593 articles were excluded. Thirty-eight articles were fully read and all were included (2, 4, 6-11). Reference checking did not produce extra relevant articles. A flowchart including the reasons for excluding is presented in Figure 1. The study characteristics of the eight articles included are presented in Table 1. The eight studies were all cohort studies. Each study included between 12 and 331 patients and all surgeries were performed between 1951 and 2009. All studies had a mean long-term follow-up of at least 19 years and at most a mean follow-up of 45 years. The studies were published between 1988 and 2013. Five studies mentioned the age of patients at operation (2, 4, 6, 7, 9). This was between 3 and 13.6 years of age. Three studies reported the age at follow-up, Roos et al. (4) had a median age of 32 at follow-up and Vogel et al. (7) of 21 years. Moller et al (10) mentioned that the mean age at follow-up was 50.5 years.
Primary outcomeFour studies with a mean follow-up of 22 to 34 years showed a survival between 94,6% and 96,0% (2, 4, 9, 11). Each of these studies included between 53 and 331 patients who had been operated from 1958 to 2009. The studies of Kopecky et al. (6) and Morris et al. (8) showed a survival of 92 and 93% after a mean follow-up of 20 to 24 years. These studies were published in 1988 and 1991 and both included a little over 190 patients who were operated between 1956 and 1989. Vogel et al. (7) included 12 patients operated between 1967 and 1973. After a mean follow-up of 19 years a survival of 100% was found. Moller et al. (10) described an overall survival of 84% after a mean follow-up of 45 years in a group of 73 patients operated between 1952 and 1961.
ReinterventionSeven of the eight studies included reported the number of reinterventions. Earing et al. (9) reported 28 reintervention in a patient group of 53 (52,8%) subjects, whereas Kopecky et al. (6) reported 5 reinterventions in his cohort of 193 patients (2,6%). The other studies showed a reintervention rate somewhere between these two studies (2, 4, 7, 10, 11). Morris et al. (8) did not mention the number of reinterventions in his patients. The most
Systematic Review
Figure 1- Flow chart of study selection process.
* syndrome is defined as Alagille syndrome, heterotaxy syndrome, Noonan syndrome, RAS/MAPK syndrome, Leopard syndrome, 12q14 deletion syndrome and twin twin transfusion syndrome.
** other disease such as aorta stenosis, endocarditis, Ebstein anomaly etc.TGA: transposition of the great arteries, TOF: Tetralogy of Fallot, VSD: ventricular septum defect, AV valve disease: atrioventricular valve disease.
vol 5 - no 1 - October 2015 • Erasmus Journal of Medicine 19
frequently described reason for reintervention was pulmonary valve regurgitation, and sometimes it was pulmonary valve restenosis (2, 4, 9).
Heart failureThree of the eight studies reported the number of patients confronted with heart failure. Kopecky et al. (6) reported 2 cases of heart failure in a group of 191 patients (1,0%). Hayes et al. (11) mentioned 9 cases of heart failure in the 331 included patients (2,7%). Roos-Hesselink et al. (4) reported that there were no cases of heart failure in her patient group (n=90).
Arrhythmia and pacemaker implantationSix studies reported patients with arrhythmias in their follow-up (2, 6, 8-11). Morris et al reported one death caused by an arrhythmia (8). Supraventricular arrhythmias like atrial fibrillation or atrial flutter were reported in 27 of 205 (13,2%) patients who underwent an electrocardiogram (ECG) or 24-hour ECG monitoring (2, 9, 10). Ventricular arrhythmias such as premature ventricular contractions or ventricular tachycardia were reported in 85 of 347 patients (2, 9, 11). Roos-Hesselink et al. (4) did not find any patients with supraventricular or ventricular arrhythmia in 1990 or 2001 on 24-hour ECG monitoring. Vogel et al. (7) did not report any case of arrhythmia. Kopecky et al. (4) reported two permanent pacemaker implantations for tachycardia-bradycardia syndrome which we count in our secondary outcome for pacemaker and arrhythmia. Three studies reported the implantation of pacemakers. In total, pacemaker implantations were reported in 8 of 334 patients (4, 6, 9).
EndocarditisThree studies mentioned endocarditis. Earing et al. (9) reported
one case of endocarditis, so did Moller et al. (10). Roos-Hesse-link et al. (4) reported that there were no cases of endocarditis in the patient group.
NYHA classThree studies reported the number of patients per NYHA class (4, 9-11). Of a total of 430 patients, 323 were in NYHA class 1 (75,1%), 50 in NYHA class 2 (11,6%), 48 in NYHA class 3 (11,1%), and 9 in NYHA class 4 (2,1%). Roos-Hesselink reported NYHA classes in percentages: 67% had NYHA class 1, 30% had NYHA class 2 and 3% had NYHA class 3. No patients had NYHA class 4 in the studies of Earing et al. Roos-Hesselink et al. and Moller et al. (4, 9, 10). Eleven of the 12 patients in Vogel et al. (7) were in NYHA class 1. One patient in Vogel et al. had a cerebral-vascular accident and has left hemiplegia. All patients in Kopecky et al. (6) considered themselves to be asymptomatic at the time of last follow-up, but no NYHA classes were reported. Voet et al and Morris et al did not report NYHA classes either (2, 8).
discussionOur study suggests that the long-term outcome of patients with pulmonary valve stenosis who underwent surgery at a young age is excellent. Seven of the eight studies show a survival rate of over 90% at least 20 years after initial surgery. Vogel et al. showed an excellent survival rate of 100%, however. This number should be interpreted with caution as this concerns only 12 patients, whichmakes this group less representative for the whole study. The study with the lowest survival is Moller et al. with 84% after 45 years. This study had a mean follow-up of 45 years, the patients had a mean age of 50.5 years at the time of the last follow-up. The lower survival rate could be caused by higher age and some late complications such as heart failure after
Systematic ReviewTable 1 - study characteristics with primary outcome and secondary outcome
Number of patients
191
12
192
331
53
90
79
73
Year published
1988
1990
1991
1993
2005
2006
2012
2013
Surgical era
1956-19671967-19731958-19891958-1969
1951-1982
1968-1980
1960-20091952-1963
Mean age at operation (years)
13.6 ± 13.1
3 ± 2.8
-*
-
10 ± 13
5.0 (median) range: 0-14
5.0 (median) range: 0-39
Mean follow-up (years)
24 ± 4
19 ± 3
20
33
-
19
45
Median follow-up (range)
24 (<1-30)
19 (15-23)
-
22 (16-29)
34 (18-51)
27 (22-33)
23 (0-45)
-
Survival
92.0%
100%
93%
94.6%
96.2%
95.6%
96%
84%
Reinter-vention(n)
5/191 (2.6%)*1/12 (8.3%)-
14/277 (5.1%)
28/53(52.8%)
10/64 (15.6%)
16/79 (20.3%)3/73 (4.1%)
Heart failure (n)
2/191 (1.0%)-
-
9/331 (2.7%)
-
0/90 (0.0%)
-
-
Arrhythmia(n)
2/191 (1.0%)-
1/192 (0.5%)81/215 (37.7%)
23/53 (43.4%)
0/64 (0.0%)
4/79 (5.1%)1/73 (1,4%)
Pacemaker (n)
2/191 (1.0%)
-
-
-
4/53 (7.5%)
2/90 (2.2%)
-
-
Endocarditis (n)
- **
-
-
-
1/53 (1.9%)
0
-
1/73 (1.4%)
NYHA Class (n)
-
class 1 (n =11)
-
1 = 228 (71%) 2 = 39 (12.2%)3 = 45 (14%)4 = 9 (2.8%)1 = 42 (82%)2 = 8 (16%)3 = 1 (2%)4 = 0 (0%)1 = 67% 2 = 30% 3 = 3%4 = 0-
1 = 532 = 3 3 = 2 4 = 0
Author
S.L. Kopecky et al, 1988 [6]M. Vogel et al, 1990 [7]C.D. Morris et al, 1991 [8]C.J. Hayes et al, 1993 [11]
M.G. Earing et al, 2005 [9]
J.W. Roos-Hesselink et al, 2006 [4]
A. Voet et al, 2012 [2]J.H. Moller et al, 2013 [10]
* The hyphen-minus means that the number was not mentioned in the article. ** Events are presented as number of events / total number of patients and in percentages
Erasmus Journal of Medicine • vol 5 - no 1 - October 201520
longer follow-up. Year of surgery could be another explanation. The patients in this cohort were operated the earliest of all studies (1952-1963). Surgical techniques and perioperative care have improved since the start of open-heart surgery in the early 50’s. This is why it is important to do more studies with 40-50 year follow-up in this group of patients.
Secondary outcomesSeven studies reported a considerable number of reinterventions. One study showed an reintervention rate of 52,8% in after 33 years, this is more than half of the patients, whereas the lowest reintervention rate was 2,6% in a study with a 24 years follow-up. This could possibly be explained by different definitions of reinterventions. The reason for reintervention is mostly pulmonary valve replacement for regurgitation and sometimes pulmonary valve re-stenosis. Only eleven heart failure patients were described in all articles. However five articles did not mention it. It is possible that the follow-up rate is too short to do a make prediction of heart failure numbers. The incidence of heart failure will increase with longer duration of follow-up and can be caused by compensatory mechanism based on right ventricular dilatation or by other factors such as aging with cell destruction and apoptosis (4). We have found a great difference in numbers of arrhythmia between studies. Kopecky et al showed a low rate of arrhythmia 1,0%. A high number of arrhythmia was found in the study of Earing et al. with 37,7%. An explanation for the higher number of arrhythmia in some studies is probably the method of investigation: some studies incorporated 24-hour ECG monitoring while others did not. Only eight pacemaker implantations were reported in 334 patients (2,4%), therefore the need to implant a pacemaker after PVS surgery seems rare. Two cases of endocarditis were reported in all studies (9, 10). This suggests that endocarditis is also a rare complication.Discussion exists about the clinical condition at longterm follow-up. Some studies report a limitation in some form of their physical condition. This was shown by the NYHA classes in the ar-ticles of Hayes et al. Earing et al and Roos-Hesselink et al. On the other hand, other articles showed no physical limitations (6, 7, 10). Morris et al. did not report much about secondary outcomes except for arrhythmia. However, they have described the survival, our primary outcome, very well. The fact that this article reported many different congenital heart defects could be a reason for missing secondary outcomes. Meantime Earing showed higher numbers of complications. The higher number of the secondary outcome in this article may be caused by longer follow-up. However, this number of complications is much higher than that from Moller et al. which had a longer follow-up. The explanation is probably the different definition of reintervention and arrhythmia.
LimitationsThis systematic review has a few limitations. Firstly, we did not do a statistical analysis of the raw data of all patients. Furthermore not all patients had at least 15 years follow-up. For example, in Voet et al. (published in 2012) the last patient was operated in 2009 and thus had a follow-up of only 3 years. Nevertheless,
Systematic Review
studies were included if the mean (or median) follow-up was over 15 years conform one of our inclusion criteria. Our review showed the importance of extensive follow-up including an interview, physical examination, electrocardiogram and echocardiogram. In this way a complete image of the patients will be acquired and thereby arrhythmias and pulmonary valve problems may be detected in time. Except for these complications there were no other common complications found which need specific attention. Nowadays surgery of PVS is not always the first choice of treatment because of the use of balloon valvuloplasty. According to Peterson et al. (12) surgical treatment produces lower long-term complications and lower number of reinterven-tions. Despite these results, balloon valvuloplasty could well be the preferred therapy for PVS, because the intervention is less invasive, less expensive and requires a shorter hospital stay. We think more research is needed to determine which patients with PVS are best treated with balloon valvuloplasty or with surgery.
Conclusion Patients with PVS who undergo surgery at a young age have good long-term survival, but because of the incidence of reintervention and arrhythmia life-long follow-up with long intervals is advisable.
references1. van der Linde D., Konings E.E., Slager M.A., et al. Birth preva-
lence of congenital heart disease worldwide: a systematic review and meta-analysis. Journal of the American College of Cardiology. 2011; 58: 2241-2247.
2. Voet A., Rega F., de Bruaene A.V., et al. Long-term outcome after treatment of isolated pulmonary valve stenosis. International journal of cardiology. 2012; 156: 11-15.
3. Brock S.R. The Surgical Treatment of Pulmonary Stenosis. British heart journal. 1961; 23: 337-356.
4. Roos-Hesselink J.W., Meijboom F.J., Spitaels S.E., et al. Long-term outcome after surgery for pulmonary stenosis (a longitudinal study of 22-33 years). European heart journal. 2006; 27: 482-488.
5. Momen N., Hadfield P., Harrison K., et al. Managing pain in advan-ced cancer: a survey of United kingdom general practitioners and community nurses. J Pain Symptom Manage. 2013; 46: 345-354.
6. Kopecky S.L., Gersh B.J., McGoon M.D., et al. Long-term outcome of patients undergoing surgical repair of isolated pulmonary valve ste-nosis. Follow-up at 20-30 years. Circulation. 1988; 78: 1150-1156.
7. Vogel M., Eger R., Klinner W., et al. Brock transventricular pulmona-ry valvotomy in patients with pulmonary stenosis: long-term results. Pediatric cardiology. 1990; 11: 191-194.
8. Morris C.D., Menashe V.D. 25-year mortality after surgical repair of congenital heart defect in childhood. A population-based cohort study. Jama. 1991; 266: 3447-3452.
9. Earing M.G., Connolly H.M., Dearani J.A., et al. Long-term follow-up of patients after surgical treatment for isolated pulmonary valve stenosis. Mayo Clinic proceedings. 2005; 80: 871-876.
10. Moller J.H., Anderson R.C. A 43- to 54-year follow-up of 1,000 pa-tients with congenital heart disease. The American journal of cardio-logy. 2013; 111: 1496-1500.
11. Hayes C.J., Gersony W.M., Driscoll D.J., et al. Second natural his-tory study of congenital heart defects. Results of treatment of patients with pulmonary valvar stenosis. Circulation. 1993; 87: I28-37.
12. Peterson C., Schilthuis J.J., Dodge-Khatami A., et al. Comparative long-term results of surgery versus balloon valvuloplasty for pulmo-nary valve stenosis in infants and children. The Annals of thoracic surgery. 2003; 76: 1078-1082; discussion 1082-1073.
vol 5 - no 1 - October 2015 • Erasmus Journal of Medicine 21
Systematic Review
Clinical impact of single nucleotide polymorphism identification associated with the development of testicular germ cell cancer Jochem Boscha, Farhat Shalizia, Leendert Looijengab
a Medical student, Erasmus MC University Medical Center Rotterdam, the Netherlandsb Supervisor, Department of Medical Biology, Erasmus MC, Rotterdam, the NetherlandsCorrespondence: Jochem Bosch, e-mail: [email protected]
abstractIntroduction: Although a strong genetic basis for testicular germ cell tumours (TGCT) has been found in previous studies little is known about the clinical impact of the possibility to detect this genetic basis.Objective: Primary objective was to identify the impact, of the possibility to detect Single Nucleotide Polymorphisms (SNPs) as-sociated with a higher risk for development of TGCT, on the clinical setting, using the known odds ratios (OR).Methods: Pubmed search using the phrase: “Testicular Neoplasms/genetics”[Mesh] AND “Genetic Predisposition to Disease” [Mesh] AND (“Genetic Association Studies”[All Fields] OR “Polymorphism, Single Nucleotide”[Mesh]) was performed. From the 26 found articles were 19 articles excluded utilizing the formulated criteria.Results: In this systematic review seven genome-wide association studies (GWAS), published 2010 or later, were analyzed resul-ting in the finding of 28 of the 29 unique SNPs, which had a significant OR with 95% CI. The SNPs rs1508595 (OR 2.69 (95% CI= 2.10-3.44)); rs3782179 (OR 2.71 (95% CI= 2.19-3.37)); and rs4474514 (OR 2.78 (95% CI= 2.23-3.45)) had the highest OR.Conclusion: SNP variants are significantly associated with a higher risk of developing TGCT. People with these SNPs can be followed in time. In the near future this can lead to early detection and follow-up of patients with a high risk to developTGCT.
introduction Testicular germ cell tumour (TGCT) is the most common malig-nancy in men aged 15–45 years.[1] The worldwide average in-cidence of the disease is 1.5/100,000,[2] but rates vary between countries and ethnic groups. The incidence of TGCT is four to five times higher in men of European ancestry than in men of Asian or African ancestry (figure 1).[3] Over the past 30 years, the incidence of the disease has increased significantly from 3.3/100,000 in 1975 to 6.9/100,000 in 2006 in the UK [4] and 4.1/100,000 in 1975 to 6.6/100,000 in the US (figure 2).[5] Si-milar trends are noted across most European countries.[6] The reasons for the increasing incidence in the Western countries remain unknown. The two main histological subgroups of TGCT are semino-mas (50% of cases) and non-seminomas (40% of cases). About 10% of TGCTs contain a mixture of both seminomatous as well as non-seminomatous histologies. The seminomas resemble the primary (embryonic) germ cells from which they are derived and the non-seminomas display varying degrees of differentia-tion, from embryonal carcinoma, being the embryonic stem cell component, through to teratoma, fully matured somatic tissue, as well as extra-embryonic lineages, like yolk sac tumor and
choriocarcinoma.[7] TCGT are believed to arise from primor-dial germ cells (PGCs) or gonocytes via a pre-invasive phase of carcinoma-in situ (CIS).[8] For non-seminomas the peak of incidence occurs between the ages of 20 and 30 whereas semi-nomas manifest a decade later.[9] TGCT are malignant tumours that easily metastasize. Nevertheless,the five-year survival rate exceeds 95%. The reason for this is the remarkable sensitivity to radiotherapy and/or chemotherapy of these tumours.[10] Risk factors for TGCT include previous germ cell tumour, a family history of TGCT, sub- or infertility and abnormalities of testicular development such as cryptorchidism.[7, 11] The risk of TGCT has been reported to be 8–10 fold higher in brothers compared with the general male population and 4-6 fold higher in sons of men who have had TGCT.[11, 12] These familial risks are higher than the approximately 2-fold familial relative risk observed in other cancers such as colorectal cancer. Previous studies support a strong genetic basis for TGCT.[13] But little is known about the clinical impact of this genetic basis for TGCT. Through this systematic review, the clinical impact of Single Nucleotide Polymorphism (SNP) variants associated with the development of TGCT in the population will be investigated. The possible SNPs found can, in the near future, be used for
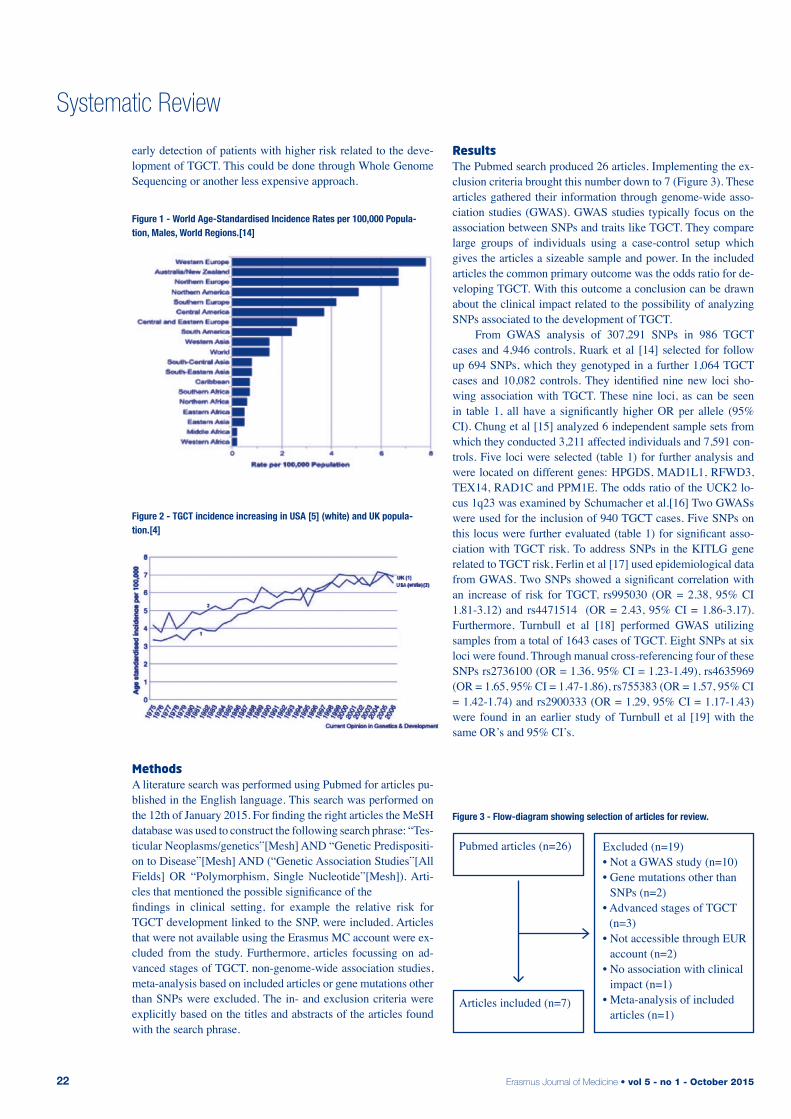
Erasmus Journal of Medicine • vol 5 - no 1 - October 201522
Systematic Review
early detection of patients with higher risk related to the deve-lopment of TGCT. This could be done through Whole Genome Sequencing or another less expensive approach.
MethodsA literature search was performed using Pubmed for articles pu-blished in the English language. This search was performed on the 12th of January 2015. For finding the right articles the MeSH database was used to construct the following search phrase: “Tes-ticular Neoplasms/genetics”[Mesh] AND “Genetic Predispositi-on to Disease”[Mesh] AND (“Genetic Association Studies”[All Fields] OR “Polymorphism, Single Nucleotide”[Mesh]). Arti-cles that mentioned the possible significance of the findings in clinical setting, for example the relative risk for TGCT development linked to the SNP, were included. Articles that were not available using the Erasmus MC account were ex-cluded from the study. Furthermore, articles focussing on ad-vanced stages of TGCT, non-genome-wide association studies, meta-analysis based on included articles or gene mutations other than SNPs were excluded. The in- and exclusion criteria were explicitly based on the titles and abstracts of the articles found with the search phrase.
resultsThe Pubmed search produced 26 articles. Implementing the ex-clusion criteria brought this number down to 7 (Figure 3). These articles gathered their information through genome-wide asso-ciation studies (GWAS). GWAS studies typically focus on the association between SNPs and traits like TGCT. They compare large groups of individuals using a case-control setup which gives the articles a sizeable sample and power. In the included articles the common primary outcome was the odds ratio for de-veloping TGCT. With this outcome a conclusion can be drawn about the clinical impact related to the possibility of analyzing SNPs associated to the development of TGCT. From GWAS analysis of 307,291 SNPs in 986 TGCT cases and 4,946 controls, Ruark et al [14] selected for follow up 694 SNPs, which they genotyped in a further 1,064 TGCT cases and 10,082 controls. They identified nine new loci sho-wing association with TGCT. These nine loci, as can be seen in table 1, all have a significantly higher OR per allele (95% CI). Chung et al [15] analyzed 6 independent sample sets from which they conducted 3,211 affected individuals and 7,591 con-trols. Five loci were selected (table 1) for further analysis and were located on different genes: HPGDS, MAD1L1, RFWD3, TEX14, RAD1C and PPM1E. The odds ratio of the UCK2 lo-cus 1q23 was examined by Schumacher et al.[16] Two GWASs were used for the inclusion of 940 TGCT cases. Five SNPs on this locus were further evaluated (table 1) for significant asso-ciation with TGCT risk. To address SNPs in the KITLG gene related to TGCT risk, Ferlin et al [17] used epidemiological data from GWAS. Two SNPs showed a significant correlation with an increase of risk for TGCT, rs995030 (OR = 2.38, 95% CI 1.81-3.12) and rs4471514 (OR = 2.43, 95% CI = 1.86-3.17). Furthermore, Turnbull et al [18] performed GWAS utilizing samples from a total of 1643 cases of TGCT. Eight SNPs at six loci were found. Through manual cross-referencing four of these SNPs rs2736100 (OR = 1.36, 95% CI = 1.23-1.49), rs4635969 (OR = 1.65, 95% CI = 1.47-1.86), rs755383 (OR = 1.57, 95% CI = 1.42-1.74) and rs2900333 (OR = 1.29, 95% CI = 1.17-1.43) were found in an earlier study of Turnbull et al [19] with the same OR’s and 95% CI’s.
Figure 1 - World Age-Standardised Incidence Rates per 100,000 Popula-tion, Males, World Regions.[14]
Figure 2 - TGCT incidence increasing in USA [5] (white) and UK popula-tion.[4]
Pubmed articles (n=26)
Articles included (n=7)
Excluded (n=19)• Not a GWAS study (n=10)• Gene mutations other than
SNPs (n=2)• Advanced stages of TGCT
(n=3)• Not accessible through EUR
account (n=2)• No association with clinical
impact (n=1)• Meta-analysis of included
articles (n=1)
Figure 3 - Flow-diagram showing selection of articles for review.
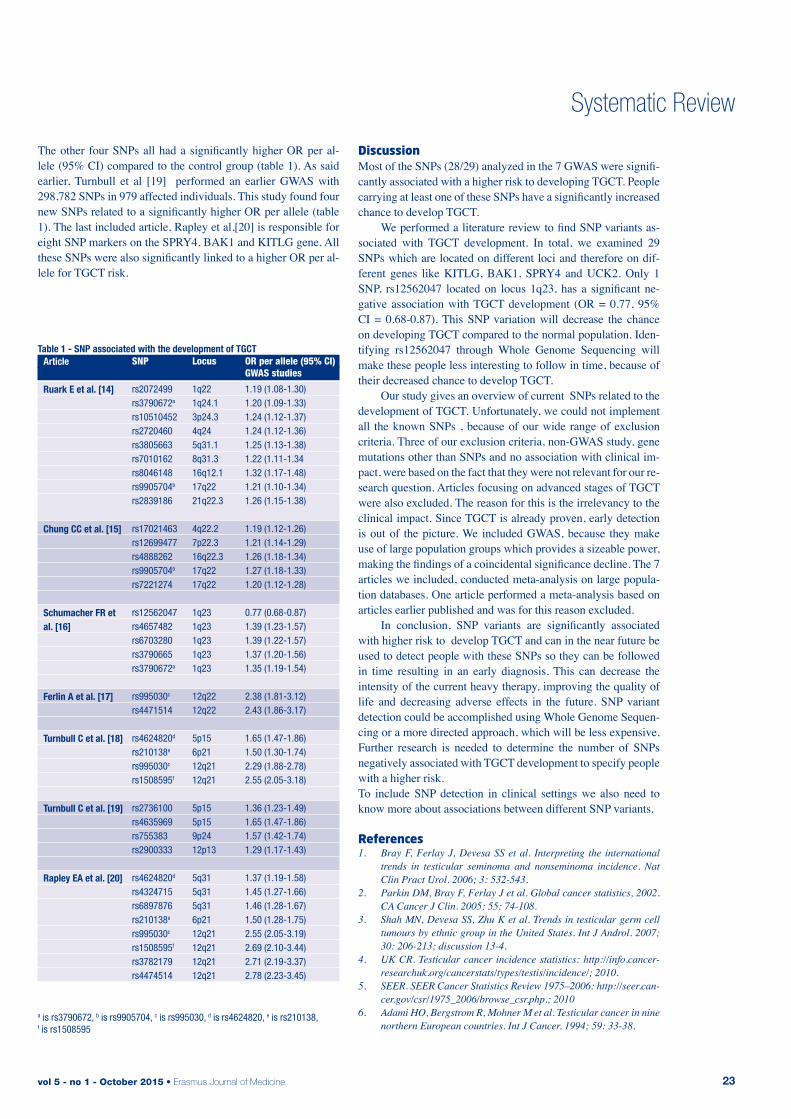
vol 5 - no 1 - October 2015 • Erasmus Journal of Medicine 23
Systematic Review
The other four SNPs all had a significantly higher OR per al-lele (95% CI) compared to the control group (table 1). As said earlier, Turnbull et al [19] performed an earlier GWAS with 298,782 SNPs in 979 affected individuals. This study found four new SNPs related to a significantly higher OR per allele (table 1). The last included article, Rapley et al,[20] is responsible for eight SNP markers on the SPRY4, BAK1 and KITLG gene. All these SNPs were also significantly linked to a higher OR per al-lele for TGCT risk.
discussionMost of the SNPs (28/29) analyzed in the 7 GWAS were signifi-cantly associated with a higher risk to developing TGCT. People carrying at least one of these SNPs have a significantly increased chance to develop TGCT. We performed a literature review to find SNP variants as-sociated with TGCT development. In total, we examined 29 SNPs which are located on different loci and therefore on dif-ferent genes like KITLG, BAK1, SPRY4 and UCK2. Only 1 SNP, rs12562047 located on locus 1q23, has a significant ne-gative association with TGCT development (OR = 0.77, 95% CI = 0.68-0.87). This SNP variation will decrease the chance on developing TGCT compared to the normal population. Iden-tifying rs12562047 through Whole Genome Sequencing will make these people less interesting to follow in time, because of their decreased chance to develop TGCT. Our study gives an overview of current SNPs related to the development of TGCT. Unfortunately, we could not implement all the known SNPs , because of our wide range of exclusion criteria. Three of our exclusion criteria, non-GWAS study, gene mutations other than SNPs and no association with clinical im-pact, were based on the fact that they were not relevant for our re-search question. Articles focusing on advanced stages of TGCT were also excluded. The reason for this is the irrelevancy to the clinical impact. Since TGCT is already proven, early detection is out of the picture. We included GWAS, because they make use of large population groups which provides a sizeable power, making the findings of a coincidental significance decline. The 7 articles we included, conducted meta-analysis on large popula-tion databases. One article performed a meta-analysis based on articles earlier published and was for this reason excluded. In conclusion, SNP variants are significantly associated with higher risk to develop TGCT and can in the near future be used to detect people with these SNPs so they can be followed in time resulting in an early diagnosis. This can decrease the intensity of the current heavy therapy, improving the quality of life and decreasing adverse effects in the future. SNP variant detection could be accomplished using Whole Genome Sequen-cing or a more directed approach, which will be less expensive. Further research is needed to determine the number of SNPs negatively associated with TGCT development to specify people with a higher risk.To include SNP detection in clinical settings we also need to know more about associations between different SNP variants.
references1. Bray F, Ferlay J, Devesa SS et al. Interpreting the international
trends in testicular seminoma and nonseminoma incidence. Nat Clin Pract Urol. 2006; 3: 532-543.
2. Parkin DM, Bray F, Ferlay J et al. Global cancer statistics, 2002. CA Cancer J Clin. 2005; 55: 74-108.
3. Shah MN, Devesa SS, Zhu K et al. Trends in testicular germ cell tumours by ethnic group in the United States. Int J Androl. 2007; 30: 206-213; discussion 13-4.
4. UK CR. Testicular cancer incidence statistics: http://info.cancer-researchuk.org/cancerstats/types/testis/incidence/; 2010.
5. SEER. SEER Cancer Statistics Review 1975–2006: http://seer.can-cer.gov/csr/1975_2006/browse_csr.php.; 2010
6. Adami HO, Bergstrom R, Mohner M et al. Testicular cancer in nine northern European countries. Int J Cancer. 1994; 59: 33-38.
a is rs3790672, b is rs9905704, c is rs995030, d is rs4624820, e is rs210138, f is rs1508595
Table 1 - SNP associated with the development of TGCT
SNP
rs2072499 rs3790672a rs10510452 rs2720460 rs3805663 rs7010162 rs8046148 rs9905704b rs2839186
rs17021463rs12699477rs4888262rs9905704b
rs7221274
rs12562047rs4657482rs6703280rs3790665rs3790672a
rs995030c
rs4471514
rs4624820d
rs210138e
rs995030c
rs1508595f
rs2736100rs4635969rs755383rs2900333
rs4624820d
rs4324715rs6897876rs210138e
rs995030c
rs1508595f
rs3782179rs4474514
Locus
1q22 1q24.1 3p24.3 4q24 5q31.1 8q31.3 16q12.1 17q22 21q22.3
4q22.27p22.316q22.317q2217q22
1q231q231q231q231q23
12q2212q22
5p156p2112q2112q21
5p155p159p2412p13
5q315q315q316p2112q2112q21 12q2112q21
OR per allele (95% CI) GWAS studies
1.19 (1.08-1.30) 1.20 (1.09-1.33) 1.24 (1.12-1.37) 1.24 (1.12-1.36) 1.25 (1.13-1.38) 1.22 (1.11-1.34 1.32 (1.17-1.48) 1.21 (1.10-1.34) 1.26 (1.15-1.38)
1.19 (1.12-1.26)1.21 (1.14-1.29)1.26 (1.18-1.34)1.27 (1.18-1.33)1.20 (1.12-1.28)
0.77 (0.68-0.87)1.39 (1.23-1.57)1.39 (1.22-1.57)1.37 (1.20-1.56)1.35 (1.19-1.54)
2.38 (1.81-3.12)2.43 (1.86-3.17)
1.65 (1.47-1.86)1.50 (1.30-1.74)2.29 (1.88-2.78)2.55 (2.05-3.18)
1.36 (1.23-1.49)1.65 (1.47-1.86)1.57 (1.42-1.74)1.29 (1.17-1.43)
1.37 (1.19-1.58)1.45 (1.27-1.66)1.46 (1.28-1.67)1.50 (1.28-1.75)2.55 (2.05-3.19)2.69 (2.10-3.44)2.71 (2.19-3.37)2.78 (2.23-3.45)
Article
Ruark E et al. [14]
Chung CC et al. [15]
Schumacher FR et al. [16]
Ferlin A et al. [17]
Turnbull C et al. [18]
Turnbull C et al. [19]
Rapley EA et al. [20]
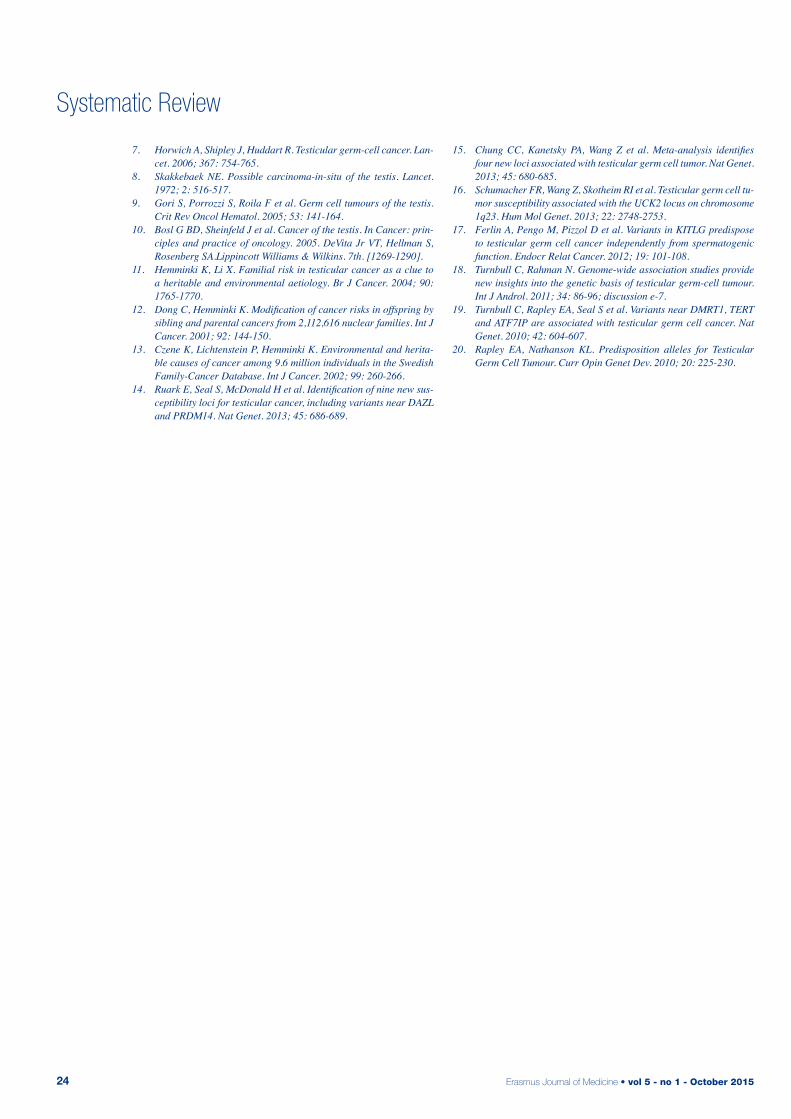
Erasmus Journal of Medicine • vol 5 - no 1 - October 201524
Systematic Review
7. Horwich A, Shipley J, Huddart R. Testicular germ-cell cancer. Lan-cet. 2006; 367: 754-765.
8. Skakkebaek NE. Possible carcinoma-in-situ of the testis. Lancet. 1972; 2: 516-517.
9. Gori S, Porrozzi S, Roila F et al. Germ cell tumours of the testis. Crit Rev Oncol Hematol. 2005; 53: 141-164.
10. Bosl G BD, Sheinfeld J et al. Cancer of the testis. In Cancer: prin-ciples and practice of oncology. 2005. DeVita Jr VT, Hellman S, Rosenberg SA.Lippincott Williams & Wilkins. 7th. [1269-1290].
11. Hemminki K, Li X. Familial risk in testicular cancer as a clue to a heritable and environmental aetiology. Br J Cancer. 2004; 90: 1765-1770.
12. Dong C, Hemminki K. Modification of cancer risks in offspring by sibling and parental cancers from 2,112,616 nuclear families. Int J Cancer. 2001; 92: 144-150.
13. Czene K, Lichtenstein P, Hemminki K. Environmental and herita-ble causes of cancer among 9.6 million individuals in the Swedish Family-Cancer Database. Int J Cancer. 2002; 99: 260-266.
14. Ruark E, Seal S, McDonald H et al. Identification of nine new sus-ceptibility loci for testicular cancer, including variants near DAZL and PRDM14. Nat Genet. 2013; 45: 686-689.
15. Chung CC, Kanetsky PA, Wang Z et al. Meta-analysis identifies four new loci associated with testicular germ cell tumor. Nat Genet. 2013; 45: 680-685.
16. Schumacher FR, Wang Z, Skotheim RI et al. Testicular germ cell tu-mor susceptibility associated with the UCK2 locus on chromosome 1q23. Hum Mol Genet. 2013; 22: 2748-2753.
17. Ferlin A, Pengo M, Pizzol D et al. Variants in KITLG predispose to testicular germ cell cancer independently from spermatogenic function. Endocr Relat Cancer. 2012; 19: 101-108.
18. Turnbull C, Rahman N. Genome-wide association studies provide new insights into the genetic basis of testicular germ-cell tumour. Int J Androl. 2011; 34: 86-96; discussion e-7.
19. Turnbull C, Rapley EA, Seal S et al. Variants near DMRT1, TERT and ATF7IP are associated with testicular germ cell cancer. Nat Genet. 2010; 42: 604-607.
20. Rapley EA, Nathanson KL. Predisposition alleles for Testicular Germ Cell Tumour. Curr Opin Genet Dev. 2010; 20: 225-230.
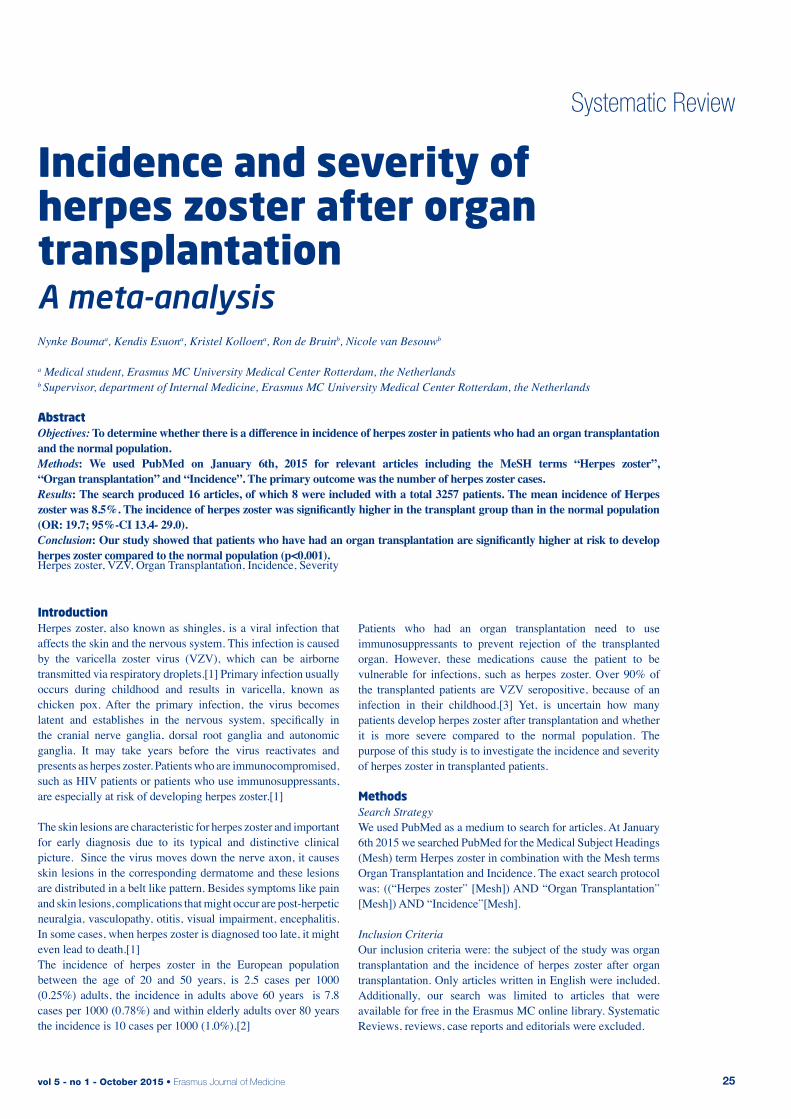
vol 5 - no 1 - October 2015 • Erasmus Journal of Medicine 25
incidence and severity of herpes zoster after organ transplantation A meta-analysis Nynke Boumaa, Kendis Esuona, Kristel Kolloena, Ron de Bruinb, Nicole van Besouwb
a Medical student, Erasmus MC University Medical Center Rotterdam, the Netherlandsb Supervisor, department of Internal Medicine, Erasmus MC University Medical Center Rotterdam, the Netherlands
abstractObjectives: To determine whether there is a difference in incidence of herpes zoster in patients who had an organ transplantation and the normal population.Methods: We used PubMed on January 6th, 2015 for relevant articles including the MeSH terms “Herpes zoster”, “Organ transplantation” and “Incidence”. The primary outcome was the number of herpes zoster cases. Results: The search produced 16 articles, of which 8 were included with a total 3257 patients. The mean incidence of Herpes zoster was 8.5%. The incidence of herpes zoster was significantly higher in the transplant group than in the normal population (OR: 19.7; 95%-CI 13.4- 29.0).Conclusion: Our study showed that patients who have had an organ transplantation are significantly higher at risk to develop herpes zoster compared to the normal population (p<0.001).Herpes zoster, VZV, Organ Transplantation, Incidence, Severity
Systematic Review
introduction Herpes zoster, also known as shingles, is a viral infection that affects the skin and the nervous system. This infection is caused by the varicella zoster virus (VZV), which can be airborne transmitted via respiratory droplets.[1] Primary infection usually occurs during childhood and results in varicella, known as chicken pox. After the primary infection, the virus becomes latent and establishes in the nervous system, specifically in the cranial nerve ganglia, dorsal root ganglia and autonomic ganglia. It may take years before the virus reactivates and presents as herpes zoster. Patients who are immunocompromised, such as HIV patients or patients who use immunosuppressants, are especially at risk of developing herpes zoster.[1]
The skin lesions are characteristic for herpes zoster and important for early diagnosis due to its typical and distinctive clinical picture. Since the virus moves down the nerve axon, it causes skin lesions in the corresponding dermatome and these lesions are distributed in a belt like pattern. Besides symptoms like pain and skin lesions, complications that might occur are post-herpetic neuralgia, vasculopathy, otitis, visual impairment, encephalitis. In some cases, when herpes zoster is diagnosed too late, it might even lead to death.[1] The incidence of herpes zoster in the European population between the age of 20 and 50 years, is 2.5 cases per 1000 (0.25%) adults, the incidence in adults above 60 years is 7.8 cases per 1000 (0.78%) and within elderly adults over 80 years the incidence is 10 cases per 1000 (1.0%).[2]
Patients who had an organ transplantation need to use immunosuppressants to prevent rejection of the transplanted organ. However, these medications cause the patient to be vulnerable for infections, such as herpes zoster. Over 90% of the transplanted patients are VZV seropositive, because of an infection in their childhood.[3] Yet, is uncertain how many patients develop herpes zoster after transplantation and whether it is more severe compared to the normal population. The purpose of this study is to investigate the incidence and severity of herpes zoster in transplanted patients.
MethodsSearch Strategy We used PubMed as a medium to search for articles. At January 6th 2015 we searched PubMed for the Medical Subject Headings (Mesh) term Herpes zoster in combination with the Mesh terms Organ Transplantation and Incidence. The exact search protocol was: ((“Herpes zoster” [Mesh]) AND “Organ Transplantation” [Mesh]) AND “Incidence”[Mesh].
Inclusion CriteriaOur inclusion criteria were: the subject of the study was organ transplantation and the incidence of herpes zoster after organ transplantation. Only articles written in English were included. Additionally, our search was limited to articles that were available for free in the Erasmus MC online library. Systematic Reviews, reviews, case reports and editorials were excluded.
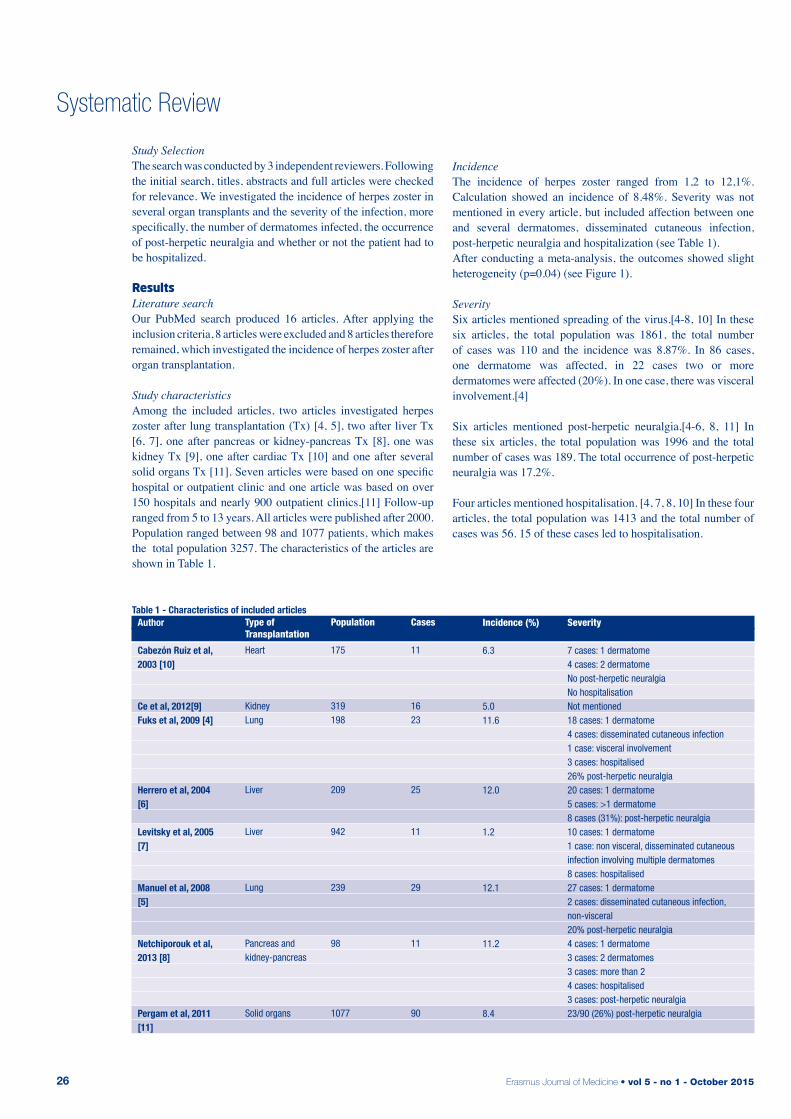
Erasmus Journal of Medicine • vol 5 - no 1 - October 201526
Systematic Review
Table 1 - Characteristics of included articles
Type of Transplantation
Heart
Kidney Lung
Liver
Liver
Lung
Pancreas and kidney-pancreas
Solid organs
Population
175
319 198
209
942
239
98
1077
Cases
11
16 23
25
11
29
11
90
Incidence (%)
6.3
5.0 11.6
12.0
1.2
12.1
11.2
8.4
Severity
7 cases: 1 dermatome4 cases: 2 dermatomeNo post-herpetic neuralgiaNo hospitalisation Not mentioned 18 cases: 1 dermatome4 cases: disseminated cutaneous infection1 case: visceral involvement3 cases: hospitalised26% post-herpetic neuralgia 20 cases: 1 dermatome5 cases: >1 dermatome8 cases (31%): post-herpetic neuralgia 10 cases: 1 dermatome1 case: non visceral, disseminated cutaneous infection involving multiple dermatomes8 cases: hospitalised 27 cases: 1 dermatome2 cases: disseminated cutaneous infection, non-visceral20% post-herpetic neuralgia 4 cases: 1 dermatome3 cases: 2 dermatomes3 cases: more than 24 cases: hospitalised3 cases: post-herpetic neuralgia 23/90 (26%) post-herpetic neuralgia
Author
Cabezón Ruiz et al, 2003 [10]
Ce et al, 2012[9]Fuks et al, 2009 [4]
Herrero et al, 2004 [6]
Levitsky et al, 2005 [7]
Manuel et al, 2008 [5]
Netchiporouk et al, 2013 [8]
Pergam et al, 2011 [11]
Study SelectionThe search was conducted by 3 independent reviewers. Following the initial search, titles, abstracts and full articles were checked for relevance. We investigated the incidence of herpes zoster in several organ transplants and the severity of the infection, more specifically, the number of dermatomes infected, the occurrence of post-herpetic neuralgia and whether or not the patient had to be hospitalized.
resultsLiterature searchOur PubMed search produced 16 articles. After applying the inclusion criteria, 8 articles were excluded and 8 articles therefore remained, which investigated the incidence of herpes zoster after organ transplantation.
Study characteristics Among the included articles, two articles investigated herpes zoster after lung transplantation (Tx) [4, 5], two after liver Tx [6, 7], one after pancreas or kidney-pancreas Tx [8], one was kidney Tx [9], one after cardiac Tx [10] and one after several solid organs Tx [11]. Seven articles were based on one specific hospital or outpatient clinic and one article was based on over 150 hospitals and nearly 900 outpatient clinics.[11] Follow-up ranged from 5 to 13 years. All articles were published after 2000. Population ranged between 98 and 1077 patients, which makes the total population 3257. The characteristics of the articles are shown in Table 1.
Incidence The incidence of herpes zoster ranged from 1,2 to 12,1%. Calculation showed an incidence of 8.48%. Severity was not mentioned in every article, but included affection between one and several dermatomes, disseminated cutaneous infection, post-herpetic neuralgia and hospitalization (see Table 1). After conducting a meta-analysis, the outcomes showed slight heterogeneity (p=0.04) (see Figure 1).
Severity Six articles mentioned spreading of the virus.[4-8, 10] In these six articles, the total population was 1861, the total number of cases was 110 and the incidence was 8.87%. In 86 cases, one dermatome was affected, in 22 cases two or more dermatomes were affected (20%). In one case, there was visceral involvement.[4]
Six articles mentioned post-herpetic neuralgia.[4-6, 8, 11] In these six articles, the total population was 1996 and the total number of cases was 189. The total occurrence of post-herpetic neuralgia was 17.2%.
Four articles mentioned hospitalisation. [4, 7, 8, 10] In these four articles, the total population was 1413 and the total number of cases was 56. 15 of these cases led to hospitalisation.
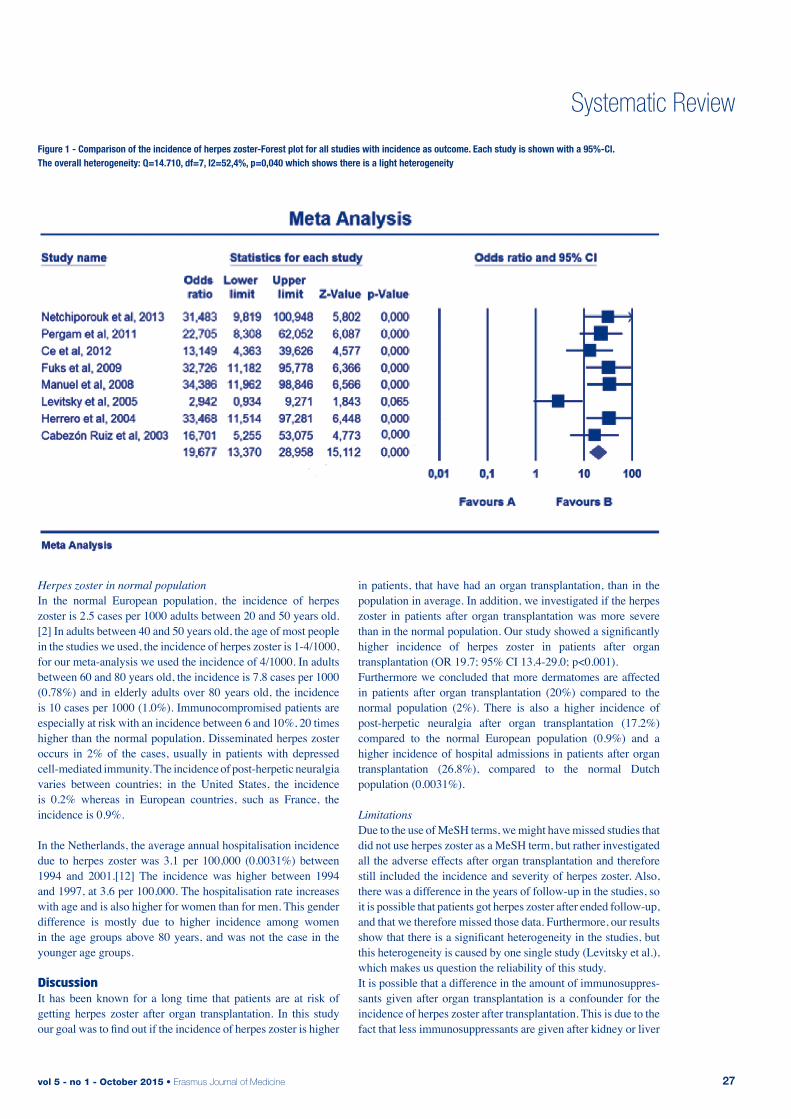
vol 5 - no 1 - October 2015 • Erasmus Journal of Medicine 27
Figure 1 - Comparison of the incidence of herpes zoster-Forest plot for all studies with incidence as outcome. Each study is shown with a 95%-CI. The overall heterogeneity: Q=14.710, df=7, I2=52,4%, p=0,040 which shows there is a light heterogeneity
Table 1 - Characteristics of included articles
Systematic Review
Herpes zoster in normal population In the normal European population, the incidence of herpes zoster is 2.5 cases per 1000 adults between 20 and 50 years old.[2] In adults between 40 and 50 years old, the age of most people in the studies we used, the incidence of herpes zoster is 1-4/1000, for our meta-analysis we used the incidence of 4/1000. In adults between 60 and 80 years old, the incidence is 7.8 cases per 1000 (0.78%) and in elderly adults over 80 years old, the incidence is 10 cases per 1000 (1.0%). Immunocompromised patients are especially at risk with an incidence between 6 and 10%, 20 times higher than the normal population. Disseminated herpes zoster occurs in 2% of the cases, usually in patients with depressed cell-mediated immunity. The incidence of post-herpetic neuralgia varies between countries; in the United States, the incidence is 0.2% whereas in European countries, such as France, the incidence is 0.9%.
In the Netherlands, the average annual hospitalisation incidence due to herpes zoster was 3.1 per 100,000 (0.0031%) between 1994 and 2001.[12] The incidence was higher between 1994 and 1997, at 3.6 per 100,000. The hospitalisation rate increases with age and is also higher for women than for men. This gender difference is mostly due to higher incidence among women in the age groups above 80 years, and was not the case in the younger age groups.
discussion It has been known for a long time that patients are at risk of getting herpes zoster after organ transplantation. In this study our goal was to find out if the incidence of herpes zoster is higher
in patients, that have had an organ transplantation, than in the population in average. In addition, we investigated if the herpes zoster in patients after organ transplantation was more severe than in the normal population. Our study showed a significantly higher incidence of herpes zoster in patients after organ transplantation (OR 19.7; 95% CI 13.4-29.0; p<0.001). Furthermore we concluded that more dermatomes are affected in patients after organ transplantation (20%) compared to the normal population (2%). There is also a higher incidence of post-herpetic neuralgia after organ transplantation (17.2%) compared to the normal European population (0.9%) and a higher incidence of hospital admissions in patients after organ transplantation (26.8%), compared to the normal Dutch population (0.0031%).
Limitations Due to the use of MeSH terms, we might have missed studies that did not use herpes zoster as a MeSH term, but rather investigated all the adverse effects after organ transplantation and therefore still included the incidence and severity of herpes zoster. Also, there was a difference in the years of follow-up in the studies, so it is possible that patients got herpes zoster after ended follow-up, and that we therefore missed those data. Furthermore, our results show that there is a significant heterogeneity in the studies, but this heterogeneity is caused by one single study (Levitsky et al.), which makes us question the reliability of this study.It is possible that a difference in the amount of immunosuppres-sants given after organ transplantation is a confounder for the incidence of herpes zoster after transplantation. This is due to the fact that less immunosuppressants are given after kidney or liver
Erasmus Journal of Medicine • vol 5 - no 1 - October 201528
Systematic Review
transplantation compared to lung or heart transplantation, which then decreases the risk of developing herpes zoster. A possible explanation for the difference in amount of immunosuppressants, is that lung tissue for example contains more lymphoid tissue, which makes it more immunogenic. Thus, a higher doses of immunosuppressants is needed to prevent the transplant from being rejected. The clinicians are also very cautious with heart transplants, since the rejection of the organ is a major problem. To prevent the rejection, a higher doses of immunosuppressants is prescribed.Another limitation is where the studies took place. Most of the studies were performed in the United States of America [1,5] and Canada [3,6] . The other studies took place in Spain [4, 8], Turkey [7] and Israel [2]. It is possible that the amount of drugs given to transplant patients differs between countries, so the incidence can vary. This may result in a higher or lower incidence of herpes zoster. Since the treatment of the patients is not avalaible for us to view, it is difficult to conclude whether the incidence can be compared with the European or Dutch incidence.
Consequences In this study, we concluded that the incidence and severity of herpes zoster are higher after organ transplantation, compared to the normal population. Since the progress of herpes zoster is more severe in immunocompromised patients, it is important that doctors are aware of this fact. Therefore, it is advised that doctors monitor their patients for signs of herpes zoster after transplantation. If the infection is found and treated quickly, it can prevent loss of graft function. In this way, unnecessary retransplantation and donor organ waste can be prevented. Also, before a patient is transplanted, a vaccine should be considered, however, the vaccine can have some adverse effects. This is why it is only recommended in adults with evidence of immunity to varicella and at least two months before the transplantation. At the moment, the vaccine is in use, yet there is still more research needed to confirm the advantages. [13]
references1. Staikov, I., et al., Herpes zoster as a systemic disease. Clin Derma-
tol, 2014. 32(3): p. 424-9.2. Pinchinat, S., et al., Similar herpes zoster incidence across Europe:
results from a systematic literature review. BMC Infect Dis, 2013. 13: p. 170.
3. Pergam, S.A., A.P. Limaye, and A.S.T.I.D.C.o. Practice, Varicella zoster virus in solid organ transplantation. Am J Transplant, 2013. 13 Suppl 4: p. 138-46.
4. Fuks, L., et al., Herpes zoster after lung transplantation: incidence, timing, and outcome. Ann Thorac Surg, 2009. 87(2): p. 423-6.
5. Manuel, O., et al., Incidence and clinical characteristics of herpes zoster after lung transplantation. J Heart Lung Transplant, 2008. 27(1): p. 11-6.
6. Herrero, J.I., et al., Herpes zoster after liver transplantation: inci-dence, risk factors, and complications. Liver Transpl, 2004. 10(9): p. 1140-3.
7. Levitsky, J., et al., Herpes zoster infection after liver transplanta-tion: a case-control study. Liver Transpl, 2005. 11(3): p. 320-5.
8. Netchiporouk, E., et al., Evaluation of varicella zoster virus in-fection morbidity and mortality in pancreas and kidney-pancreas transplant recipients. Transplant Proc, 2013. 45(2): p. 701-4.
9. Ce, P., et al., Neurologic complications of renal transplant. Exp Clin Transplant, 2012. 10(3): p. 243-6.
10. Cabezon Ruiz, S., et al., Characteristics and repercussion of vari-cella-zoster virus infection in cardiac transplant. Transplant Proc, 2003. 35(5): p. 2004-5.
11. Pergam, S.A., et al., Herpes zoster incidence in a multicenter co-hort of solid organ transplant recipients. Transpl Infect Dis, 2011. 13(1): p. 15-23.
12. de Melker, H., et al., The epidemiology of varicella and herpes zoster in The Netherlands: implications for varicella zoster virus vaccination. Vaccine, 2006. 24(18): p. 3946-52.
13. Chow, J., et al., Vaccination of Solid-Organ Transplantation Can-didates. Clinical Infectious Diseases, 2009; 45:1550-6
vol 5 - no 1 - October 2015 • Erasmus Journal of Medicine 29
Systematic Review
Peptide yy and reduction in food intake: fact or fiction? Linda Al-Hassanya, Elise H. Adriaansensa, Aart Jan van der Lelijb
a Medical student, Erasmus MC University Medical Center Rotterdam, the Netherlandsb Supervisor, Department of Endocrinology, Erasmus MC University Medical Center, Rotterdam, the NetherlandsCorrespondence: Linda Al-Hassany, e-mail: [email protected]
abstractObjective: To determine the effect of PYY3-36 on appetite in animals, specifically in mammals. Methods: A systematic search in PubMed using Medical Subject Headings (MeSH) terms for articles that focussed mainly on PYY3-36 (administration) itself (not other interventions) and its effect on appetite.Results: The search term delivered 5 suitable articles, after applying the in- and exclusion criteria. All studies used mammals, 4 used mice, only one used rats. All articles showed that PYY3-36 does suppress appetite to some extend/duration. The extend and/or the duration of this effect remains unclear, due to the incomparable study designs.Conclusion: PYY3-36 has an appetite suppressive effect in mice and rats, but the extend of this effect has to be further investigated in future, more comparable studies.
introduction PYY, an amidated neuropeptide composed of 36 amino acids, postprandial secreted by L-cells in the ileum and colon within 15 minutes after food intake. [1] L-cells are a type of intestinal enteroendocrine cells, they secrete PYY1-36 together with GLP-1; both are anorectic hormones. There are two endogenous types of PYY, one of them is PYY1-36, which is the type secreted by the L-cells. The other, PYY3-36, is obtained by cleavage of the two terminal N-amino-acids of PYY1-36 by an enzyme called dipeptidyl-pepti-dase-IV (DPP-IV). PYY1-36 levels are high during fasting, while PYY3-36 levels rise postprandial, peaking at about 90 minutes after eating. PYY3-36 levels remain elevated for up to 6 hours. PYY1-36 has affinity for 3 of the 5 known types of neuropeptide Y-receptors: Y1,2 and 5.[1] PYY3-36, which is the most bio-active form postprandial [2], is mainly active through the Y2-receptor. Rats, mice and humans are all mammals. It is thought that all these mammals have the same type of receptors, which would make it possible to use animals experiments to predict effects in humans. [3] However, according to Widdowson (1993) [4]: human brain contains primarily Y2 receptors with few regions containing Y1 receptors whilst rat brain, as a whole, contains more proportionate amounts of Y1 and Y2 receptors. So rat and human brain differ considerably regarding the distribution of NPY receptors. [4] The Y2-receptor is mostly found in the following parts of the brain: amygdala, corpus callosum, hippocampus and subthalamic nucleus. The receptor is also detectable in the caudate nucleus, hypothalamus and substantia nigra.[4] In the hypothalamus lies the so called arcuate nucleus which plays a key role in appetite regulation.[5] It is suggested that the initial post-prandial release of PYY is under neural control, because the nutrients have not reached
the small intestine and colon within 15 minutes after a meal when the levels of PYY are already rising. Further rise is most likely caused by the nutrients arriving in the distal intestine.[6] In conclusion: the anorectic effect is mostly mediated via the Y2-receptor and its interactions with the vagus nerve as well as the arcuate nucleus of the hypothamalus.[7] Although PYY3-36 seems to decrease food intake, the reproducibility of the outcomes of some of the experiments is low [8,9]. Nevertheless, PYY3-36 might play a major role in the battle against obesity. Obesity is a major problem in the Western world and investing in research to PYY3-36 could lead to a solution. Therefore this review will focus on PYY3-36 to create more consensus on its effect on appetite in animals.
MethodsLiterature searchWe performed a systematic search for articles about PYY and its effects on appetite in animals via PubMed on January 26th
2015. We searched PubMed for the Medical Subject Headings (MeSH) term PYY, appetite and eating. Only English articles were taken into account and review articles had to be excluded. The exact search we used was: “Peptide YY”[Majr] AND (“Appetite”[Mesh] OR “Eating”[Mesh]) AND English[lang] NOT review[ptyp]. We had to opt for the ‘Free and Erasmus MC available’-articles.
In- and exclusion criteriaInclusion criteria: animal experiment mammals only, intrape-ritoneal injection, study designs that investigated short-term effects <24 hours. The outcome of the trials had to be food intake in grams after injection. Exclusion criteria: not an original study, human subjects only, non-mammalian subjects, other administration than intraperitoneal, infusion instead of
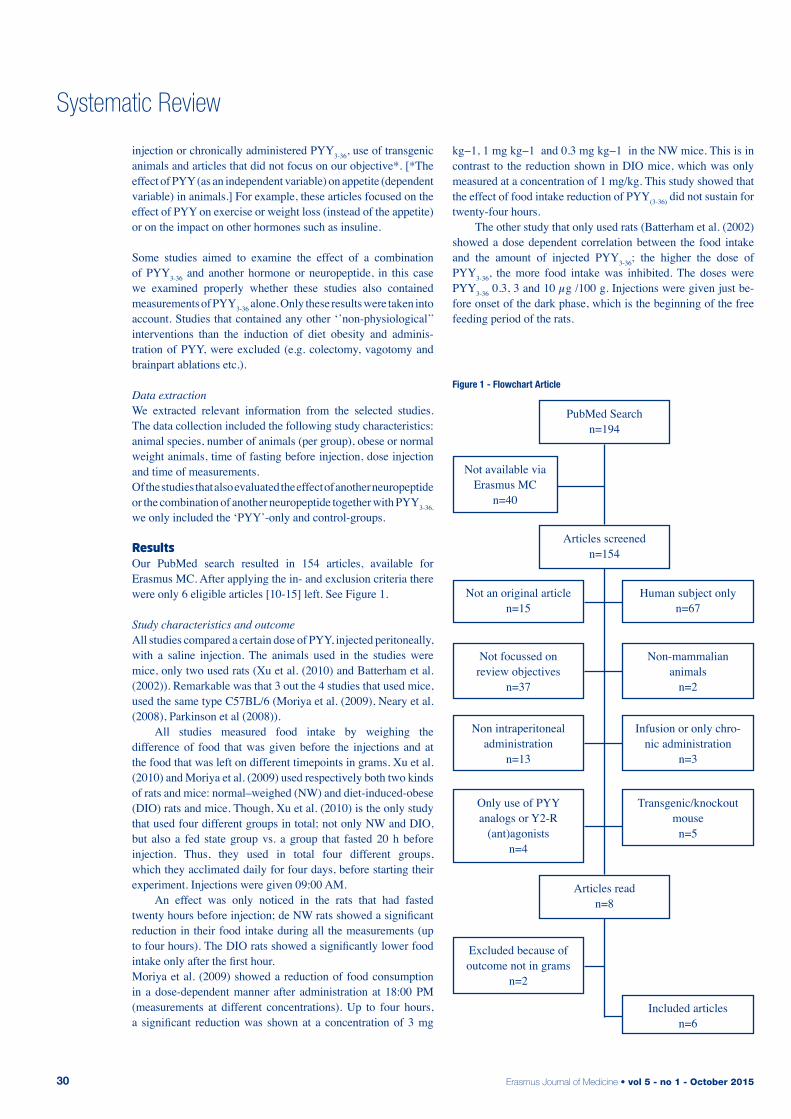
Erasmus Journal of Medicine • vol 5 - no 1 - October 201530
Systematic Review
injection or chronically administered PYY3-36, use of transgenic animals and articles that did not focus on our objective*. [*The effect of PYY (as an independent variable) on appetite (dependent variable) in animals.] For example, these articles focused on the effect of PYY on exercise or weight loss (instead of the appetite) or on the impact on other hormones such as insuline. Some studies aimed to examine the effect of a combination of PYY3-36 and another hormone or neuropeptide, in this case we examined properly whether these studies also contained measurements of PYY3-36 alone. Only these results were taken into account. Studies that contained any other ‘’non-physiological’’ interventions than the induction of diet obesity and adminis-tration of PYY, were excluded (e.g. colectomy, vagotomy and brainpart ablations etc.).
Data extractionWe extracted relevant information from the selected studies. The data collection included the following study characteristics: animal species, number of animals (per group), obese or normal weight animals, time of fasting before injection, dose injection and time of measurements.Of the studies that also evaluated the effect of another neuropeptide or the combination of another neuropeptide together with PYY3-36, we only included the ‘PYY’-only and control-groups.
resultsOur PubMed search resulted in 154 articles, available for Erasmus MC. After applying the in- and exclusion criteria there were only 6 eligible articles [10-15] left. See Figure 1.
Study characteristics and outcomeAll studies compared a certain dose of PYY, injected peritoneally, with a saline injection. The animals used in the studies were mice, only two used rats (Xu et al. (2010) and Batterham et al. (2002)). Remarkable was that 3 out the 4 studies that used mice, used the same type C57BL/6 (Moriya et al. (2009), Neary et al. (2008), Parkinson et al (2008)). All studies measured food intake by weighing the difference of food that was given before the injections and at the food that was left on different timepoints in grams. Xu et al. (2010) and Moriya et al. (2009) used respectively both two kinds of rats and mice: normal–weighed (NW) and diet-induced-obese (DIO) rats and mice. Though, Xu et al. (2010) is the only study that used four different groups in total; not only NW and DIO, but also a fed state group vs. a group that fasted 20 h before injection. Thus, they used in total four different groups, which they acclimated daily for four days, before starting their experiment. Injections were given 09:00 AM. An effect was only noticed in the rats that had fasted twenty hours before injection; de NW rats showed a significant reduction in their food intake during all the measurements (up to four hours). The DIO rats showed a significantly lower food intake only after the first hour. Moriya et al. (2009) showed a reduction of food consumption in a dose-dependent manner after administration at 18:00 PM (measurements at different concentrations). Up to four hours, a significant reduction was shown at a concentration of 3 mg
kg−1, 1 mg kg−1 and 0.3 mg kg−1 in the NW mice. This is in contrast to the reduction shown in DIO mice, which was only measured at a concentration of 1 mg/kg. This study showed that the effect of food intake reduction of PYY(3-36) did not sustain for twenty-four hours. The other study that only used rats (Batterham et al. (2002)showed a dose dependent correlation between the food intake and the amount of injected PYY3-36; the higher the dose of PYY3-36, the more food intake was inhibited. The doses were PYY3-36 0.3, 3 and 10 µg /100 g. Injections were given just be-fore onset of the dark phase, which is the beginning of the free feeding period of the rats.
PubMed Searchn=194
Articles screened n=154
Articles readn=8
Not available via Erasmus MC
n=40
Not an original articlen=15
Not focussed on review objectives
n=37
Non intraperitoneal administration
n=13
Only use of PYY analogs or Y2-R
(ant)agonistsn=4
Excluded because of outcome not in grams
n=2
Human subject onlyn=67
Non-mammalian animals
n=2
Infusion or only chro-nic administration
n=3
Transgenic/knockout mouse
n=5
Included articlesn=6
Figure 1 - Flowchart Article
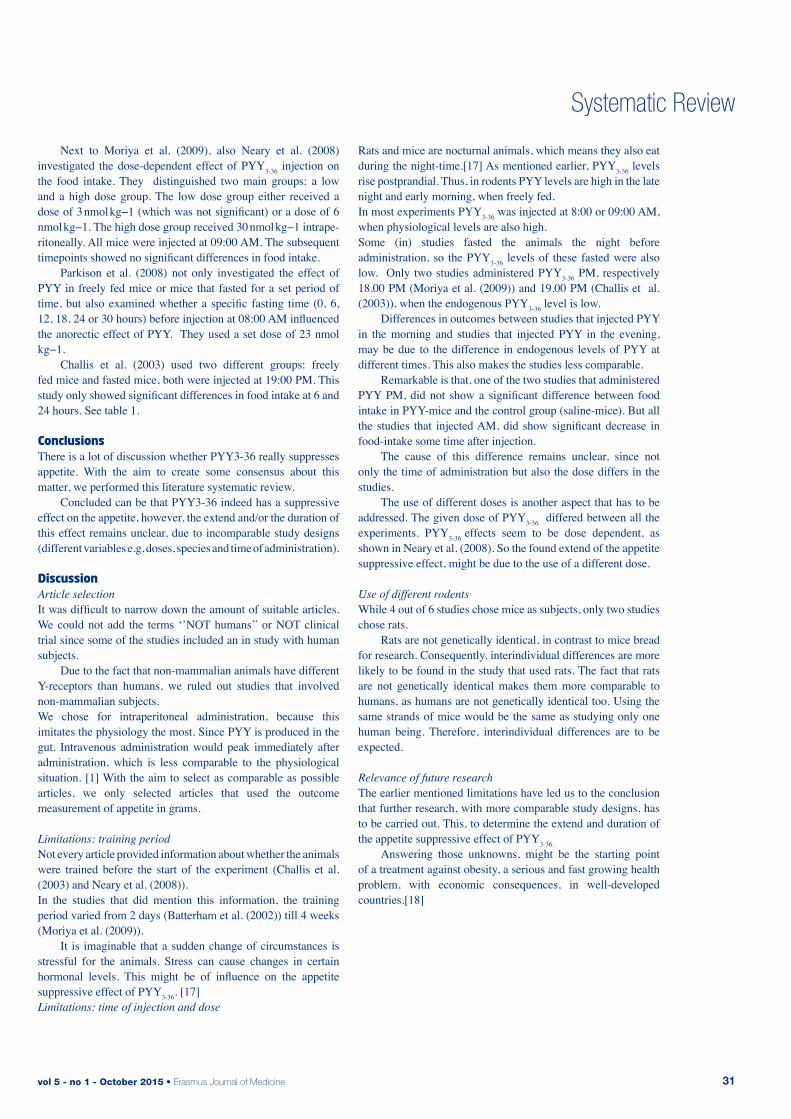
vol 5 - no 1 - October 2015 • Erasmus Journal of Medicine 31
Systematic Review
Next to Moriya et al. (2009), also Neary et al. (2008) investigated the dose-dependent effect of PYY3-36 injection on the food intake. They distinguished two main groups: a low and a high dose group. The low dose group either received a dose of 3 nmol kg−1 (which was not significant) or a dose of 6 nmol kg−1. The high dose group received 30 nmol kg−1 intrape-ritoneally. All mice were injected at 09:00 AM. The subsequent timepoints showed no significant differences in food intake. Parkison et al. (2008) not only investigated the effect of PYY in freely fed mice or mice that fasted for a set period of time, but also examined whether a specific fasting time (0, 6, 12, 18, 24 or 30 hours) before injection at 08:00 AM influenced the anorectic effect of PYY. They used a set dose of 23 nmol kg−1. Challis et al. (2003) used two different groups: freely fed mice and fasted mice, both were injected at 19:00 PM. This study only showed significant differences in food intake at 6 and 24 hours. See table 1.
ConclusionsThere is a lot of discussion whether PYY3-36 really suppresses appetite. With the aim to create some consensus about this matter, we performed this literature systematic review. Concluded can be that PYY3-36 indeed has a suppressive effect on the appetite, however, the extend and/or the duration of this effect remains unclear, due to incomparable study designs (different variables e.g. doses, species and time of administration).
discussionArticle selectionIt was difficult to narrow down the amount of suitable articles. We could not add the terms ‘’NOT humans’’ or NOT clinical trial since some of the studies included an in study with human subjects. Due to the fact that non-mammalian animals have different Y-receptors than humans, we ruled out studies that involved non-mammalian subjects.We chose for intraperitoneal administration, because this imitates the physiology the most. Since PYY is produced in the gut. Intravenous administration would peak immediately after administration, which is less comparable to the physiological situation. [1] With the aim to select as comparable as possible articles, we only selected articles that used the outcome measurement of appetite in grams.
Limitations: training periodNot every article provided information about whether the animals were trained before the start of the experiment (Challis et al. (2003) and Neary et al. (2008)). In the studies that did mention this information, the training period varied from 2 days (Batterham et al. (2002)) till 4 weeks (Moriya et al. (2009)). It is imaginable that a sudden change of circumstances is stressful for the animals. Stress can cause changes in certain hormonal levels. This might be of influence on the appetite suppressive effect of PYY3-36. [17] Limitations: time of injection and dose
Rats and mice are nocturnal animals, which means they also eat during the night-time.[17] As mentioned earlier, PYY3-36 levels rise postprandial. Thus, in rodents PYY levels are high in the late night and early morning, when freely fed.In most experiments PYY3-36 was injected at 8:00 or 09:00 AM, when physiological levels are also high. Some (in) studies fasted the animals the night before administration, so the PYY3-36 levels of these fasted were also low. Only two studies administered PYY3-36 PM, respectively 18.00 PM (Moriya et al. (2009)) and 19.00 PM (Challis et al. (2003)), when the endogenous PYY3-36 level is low. Differences in outcomes between studies that injected PYY in the morning and studies that injected PYY in the evening, may be due to the difference in endogenous levels of PYY at different times. This also makes the studies less comparable. Remarkable is that, one of the two studies that administered PYY PM, did not show a significant difference between food intake in PYY-mice and the control group (saline-mice). But all the studies that injected AM, did show significant decrease in food-intake some time after injection. The cause of this difference remains unclear, since not only the time of administration but also the dose differs in the studies. The use of different doses is another aspect that has to be addressed. The given dose of PYY3-36 differed between all the experiments. PYY3-36 effects seem to be dose dependent, as shown in Neary et al. (2008). So the found extend of the appetite suppressive effect, might be due to the use of a different dose.
Use of different rodentsWhile 4 out of 6 studies chose mice as subjects, only two studies chose rats. Rats are not genetically identical, in contrast to mice bread for research. Consequently, interindividual differences are more likely to be found in the study that used rats. The fact that rats are not genetically identical makes them more comparable to humans, as humans are not genetically identical too. Using the same strands of mice would be the same as studying only one human being. Therefore, interindividual differences are to be expected.
Relevance of future researchThe earlier mentioned limitations have led us to the conclusion that further research, with more comparable study designs, has to be carried out. This, to determine the extend and duration of the appetite suppressive effect of PYY3-36. Answering those unknowns, might be the starting point of a treatment against obesity, a serious and fast growing health problem, with economic consequences, in well-developed countries.[18]
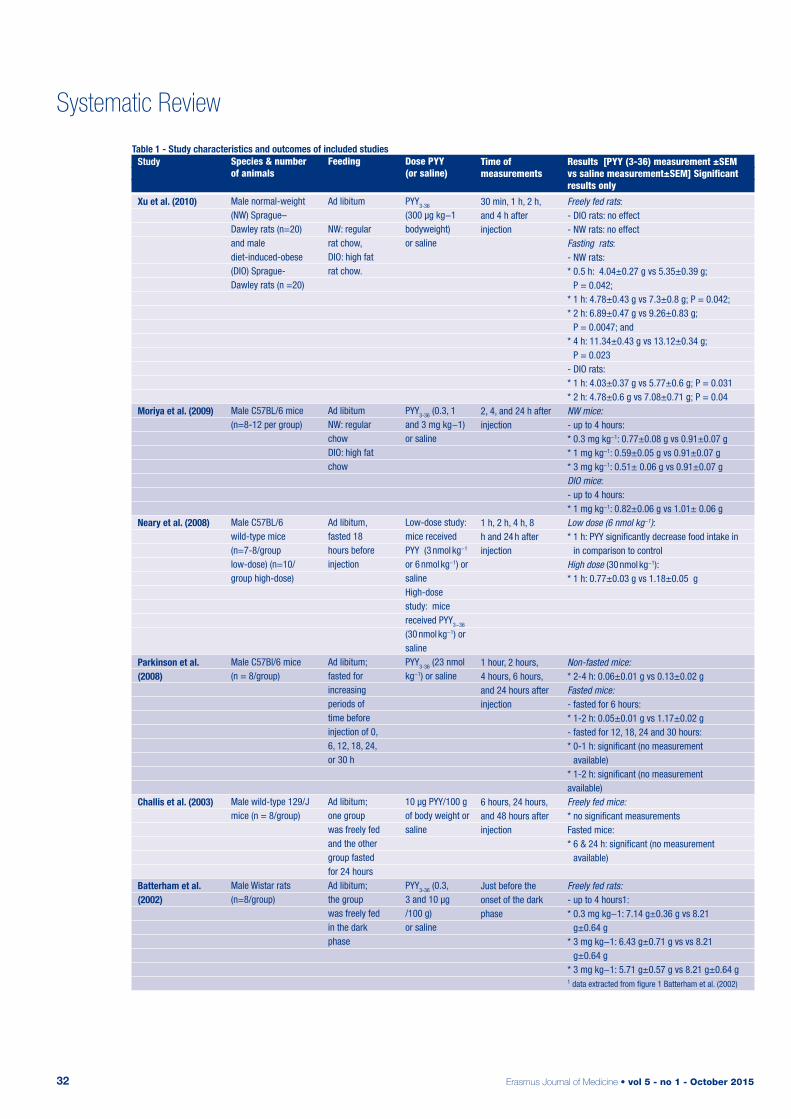
Erasmus Journal of Medicine • vol 5 - no 1 - October 201532
Systematic Review
Table 1 - Study characteristics and outcomes of included studies
Species & number of animals
Male normal-weight (NW) Sprague– Dawley rats (n=20) and male diet-induced-obese (DIO) Sprague- Dawley rats (n =20)
Male C57BL/6 mice (n=8-12 per group)
Male C57BL/6 wild-type mice (n=7-8/group low-dose) (n=10/group high-dose)
Male C57Bl/6 mice (n = 8/group)
Male wild-type 129/J mice (n = 8/group)
Male Wistar rats (n=8/group)
Feeding
Ad libitum
NW: regular rat chow, DIO: high fat rat chow.
Ad libitumNW: regular chowDIO: high fat chow
Ad libitum,fasted 18 hours before injection
Ad libitum;fasted for increasing periods of time before injection of 0, 6, 12, 18, 24, or 30 h
Ad libitum; one group was freely fed and the other group fasted for 24 hoursAd libitum; the group was freely fed in the dark phase
Dose PYY (or saline)
PYY3-36
(300 µg kg−1 bodyweight) or saline
PYY3-36 (0.3, 1 and 3 mg kg−1) or saline
Low-dose study: mice received PYY (3 nmol kg−1 or 6 nmol kg−1) or salineHigh-dose study: mice received PYY3−36
(30 nmol kg−1) or salinePYY3-36 (23 nmol kg−1) or saline
10 µg PYY/100 g of body weight or saline
PYY3-36 (0.3, 3 and 10 µg /100 g) or saline
Time of measurements
30 min, 1 h, 2 h, and 4 h after injection
2, 4, and 24 h after injection
1 h, 2 h, 4 h, 8 h and 24 h after injection
1 hour, 2 hours, 4 hours, 6 hours, and 24 hours after injection
6 hours, 24 hours, and 48 hours after injection
Just before the onset of the dark phase
Results [PYY (3-36) measurement ±SEM vs saline measurement±SEM] Significant results only
Freely fed rats: - DIO rats: no effect- NW rats: no effectFasting rats:- NW rats: * 0.5 h: 4.04±0.27 g vs 5.35±0.39 g;
P = 0.042; * 1 h: 4.78±0.43 g vs 7.3±0.8 g; P = 0.042; * 2 h: 6.89±0.47 g vs 9.26±0.83 g;
P = 0.0047; and* 4 h: 11.34±0.43 g vs 13.12±0.34 g;
P = 0.023- DIO rats:* 1 h: 4.03±0.37 g vs 5.77±0.6 g; P = 0.031* 2 h: 4.78±0.6 g vs 7.08±0.71 g; P = 0.04NW mice:- up to 4 hours:* 0.3 mg kg−1: 0.77±0.08 g vs 0.91±0.07 g* 1 mg kg−1: 0.59±0.05 g vs 0.91±0.07 g* 3 mg kg−1: 0.51± 0.06 g vs 0.91±0.07 gDIO mice:- up to 4 hours:* 1 mg kg−1: 0.82±0.06 g vs 1.01± 0.06 gLow dose (6 nmol kg−1):* 1 h: PYY significantly decrease food intake in
in comparison to controlHigh dose (30 nmol kg−1):* 1 h: 0.77±0.03 g vs 1.18±0.05 g
Non-fasted mice:* 2-4 h: 0.06±0.01 g vs 0.13±0.02 gFasted mice:- fasted for 6 hours:* 1-2 h: 0.05±0.01 g vs 1.17±0.02 g- fasted for 12, 18, 24 and 30 hours:* 0-1 h: significant (no measurement
available)* 1-2 h: significant (no measurement available)Freely fed mice:* no significant measurementsFasted mice:* 6 & 24 h: significant (no measurement
available)
Freely fed rats:- up to 4 hours1:* 0.3 mg kg−1: 7.14 g±0.36 g vs 8.21
g±0.64 g* 3 mg kg−1: 6.43 g±0.71 g vs vs 8.21
g±0.64 g * 3 mg kg−1: 5.71 g±0.57 g vs 8.21 g±0.64 g1 data extracted from figure 1 Batterham et al. (2002)
Study
Xu et al. (2010)
Moriya et al. (2009)
Neary et al. (2008)
Parkinson et al. (2008)
Challis et al. (2003)
Batterham et al. (2002)
vol 5 - no 1 - October 2015 • Erasmus Journal of Medicine 33
Systematic Review
references1. Gautier-Stein A, Mithieux G. A role for PYY3-36 in GLP1-induced
insulin secretion. Mol Metab. 2013; 2: 123-125.2. Batterham RL, Bloom SR. The gut hormone peptide YY regulates
appetite. Ann N Y Acad Sci. 2003; 994: 162-168.3. Larhammar D, Wraith A, Berglund MM, et al. Origins of the many
NPY-family receptors in mammals. Peptides. 2001; 22: 295-307.4. Widdowson PS. Quantitative receptor autoradiography demon-
strates a differential distribution of neuropeptide-Y Y1 and Y2 re-ceptor subtypes in human and rat brain. Brain Res. 1993; 631: 27-38.
5. Riediger T. The receptive function of hypothalamic and brainstem centres to hormonal and nutrient signals affecting energy balance. Proc Nutr Soc. 2012; 71: 463-477.
6. De Silva A, Bloom SR. Gut Hormones and Appetite Control: A Focus on PYY and GLP-1 as Therapeutic Targets in Obesity. Gut Liver. 2012; 6: 10-20.
7. Koda S, Date Y, Murakami N, et al. The role of the vagal nerve in peripheral PYY3-36-induced feeding reduction in rats. Endocrino-logy. 2005; 146:2369-2375.
8. Tschop M, Castaneda TR, Joost HG, et al. Physiology: does gut hormone PYY3-36 decrease food intake in rodents? Nature. 2004; 430:1 p following 165; discussion 2 p following.
9. Ladenheim EE. Peptide YY(3-36) and food intake: a peptide wai-ting for a paradigm? Am J Physiol Regul Integr Comp Physiol. 2007; 293: R37-38.
10. Challis BG, Pinnock SB, Coll AP, et al. Acute effects of PYY3-36 on food intake and hypothalamic neuropeptide expression in the mouse. Biochem Biophys Res Commun. 2003; 311: 915-919.
11. Moriya R, Mashiko S, Ishihara A, et al. Comparison of indepen-dent and combined chronic anti-obese effects of NPY Y2 receptor agonist, PYY(3-36), and NPY Y5 receptor antagonist in diet-indu-ced obese mice. Peptides. 2009; 30: 1318-1322.
12. Neary NM, McGowan BM, Monteiro MP, et al. No evidence of an additive inhibitory feeding effect following PP and PYY 3-36 admi-nistration. Int J Obes (Lond). 2008; 32: 1438-1440.
13. Parkinson JR, Dhillo WS, Small CJ, et al. PYY3-36 injection in mice produces an acute anorexigenic effect followed by a delayed orexigenic effect not observed with other anorexigenic gut hormo-nes. Am J Physiol Endocrinol Metab. 2008; 294: E698-708.
14. Xu J, McNearney TA, Chen JD. Impaired postprandial releases/syntheses of ghrelin and PYY(3-36) and blunted responses to exo-genous ghrelin and PYY(3-36) in a rodent model of diet-induced obesity. J Gastroenterol Hepatol. 2011; 26: 700-705.
15. Batterham RL, Cowley MA, Small CJ, et al. Gut hormone PYY3-36 physiologically inhibits food intake. Nature 2002; 418: 650-654.
16. Ghatei MA, Cone RD, Bloom SR. Brief communications arising (Batterham et al. reply). Nature 2004; 3-4.
17. Patton DF, Parfyonov M, Gourmelen S, et al. Photic and Pineal Modulation of Food Anticipatory Circadian Activity Rhythms in Rodents. PLoS One. 2013; 8.
18. Troke RC, Tan TM, Bloom SR. The future role of gut hormones in the treatment of obesity. Ther Adv Chronic Dis. 2014; 5: 4-14.
Table 1 - Study characteristics and outcomes of included studies
Erasmus Journal of Medicine • vol 5 - no 1 - October 201534
Systematic Review
The efficacy and safety of non-vitamin K oral anticoagulants in the treatment of acute venous thromboembolismA systematic review and meta-analysis Lizet Küstersa, Anneke Snela, Marieke Kruipb
a Medical student, Erasmus MC University Medical Center Rotterdam, the Netherlandsb Supervisor, Department of Hematology, Erasmus MC University Medical Center Rotterdam, the NetherlandsCorrespondence: Anneke Snel, e-mail: [email protected]
SummaryObjective: This systematic review and meta-analysis aims to summarize the evidence of the efficacy and safety of non-vitamin K oral anticoagulants (NOACs) in the treatment of acute venous thromboembolism (VTE) compared to standard treatment with vitamin K antagonists (VKAs).Methods: PubMed was searched for randomised controlled trials that investigated non-inferiority between a NOAC and a VKA in patients treated for acute VTE. Primary outcome had to be reported as recurrent VTE and related death. Safety outcome had to be major bleeding and clinically relevant non-major bleeding.Results: 152 publications were identified and 5 publications were eventually included. The meta-analysis showed non-inferiority between NOACs and VKAs (RR 0.900 [0.773-1.05]) in recurrent VTE. The safety analysis showed significantly less major bleeding events (RR 0.604 [0.415-0.879]) with a relative risk reduction (RRR) of 39,6% and a significant decrease in clinically relevant non-major bleeding (RR 0.755 [0.578-0.985]) with a RRR of 24,5%.Conclusions: NOACs are as effective as standard therapy in preventing recurrent VTE, but have a more favourable bleeding risk profile.
introduction Acute venous thromboembolism is a common disease affecting 1 to 2 in 1000 adults a year.[1,2] The condition often leads to hospitalisation, is known for its recurring properties and can be fatal.[3] Venous thromboembolism (VTE) is the third most common cardiovascular disease after myocardial infarction and stroke.[4] A VTE can present itself as deep-vein thrombosis (DVT) or pulmonary embolism (PE) or a combination of both. The current standard treatment consists of initial parental anticoagulant therapy with heparin and overlapping administration of a vitamin K antagonist (VKA).[5] Though the conventional therapy is effective, it has significant disadvantages. Heparin needs to be injected, where VKA treatment requires laboratory monitoring of the international normalized ratio (INR) and frequent dose adjustment partly due to its complex interactions.[6,7] In addition, bleeding continues to be a substantial problem during VKA therapy. The risk of major bleeding after the first year of therapy associated with VKAs is still 1 to 2% per year.[6] In the last decades several trials have been published on the role of so called non-vitamin K oral anticoagulants (NOACs) in the treatment of VTE. These drugs have a potent, direct
effect on factor Xa or thrombin, are orally available and can be administered in fixed doses without the need for coagulation monitoring. A previous meta-analysis showed a favourable risk-benefit profile of NOACs compared to VKAs in patients with atrial fibrillation.[8] The objective of this review is to systematically review and summarize the evidence of the efficacy and safety of non-vitamin K anticoagulants in the treatment of acute venous thromboembolism.
MethodsThe study aims to find all randomised control trials (RCTs) that investigated non-inferiority between a NOAC (edoxaban, rivaroxaban, dabigatran or apixaban) and a VKA (acenocoumarol, warfarin or phenprocoumon) in patients treated for acute VTE. Primary outcome had to be reported as recurrent venous thromboembolism and related death. In addition, the studies should examine the safety of NOACs in comparison with VKAs, expressed in major bleeding and clinically relevant non-major bleeding.
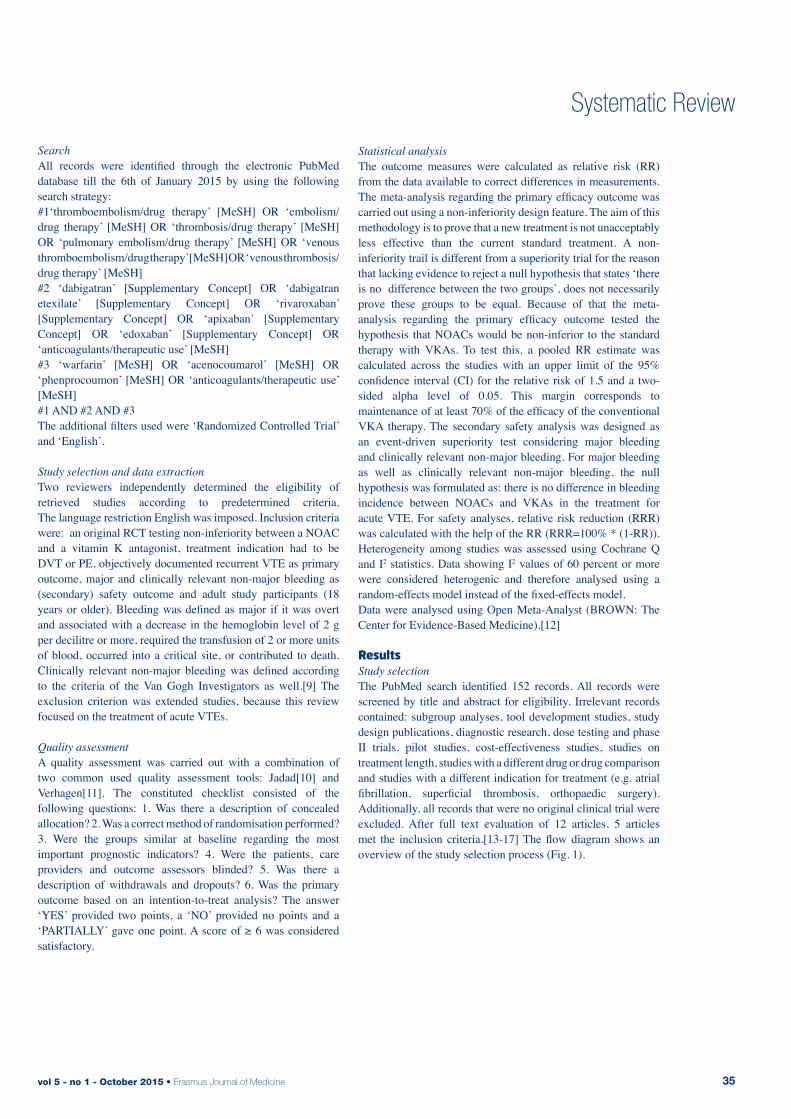
vol 5 - no 1 - October 2015 • Erasmus Journal of Medicine 35
Systematic Review
SearchAll records were identified through the electronic PubMed database till the 6th of January 2015 by using the following search strategy:#1‘thromboembolism/drug therapy’ [MeSH] OR ‘embolism/drug therapy’ [MeSH] OR ‘thrombosis/drug therapy’ [MeSH] OR ‘pulmonary embolism/drug therapy’ [MeSH] OR ‘venous thromboembolism/drug therapy’ [MeSH] OR ‘venous thrombosis/ drug therapy’ [MeSH]#2 ‘dabigatran’ [Supplementary Concept] OR ‘dabigatran etexilate’ [Supplementary Concept] OR ‘rivaroxaban’ [Supplementary Concept] OR ‘apixaban’ [Supplementary Concept] OR ‘edoxaban’ [Supplementary Concept] OR ‘anticoagulants/therapeutic use’ [MeSH]#3 ‘warfarin’ [MeSH] OR ‘acenocoumarol’ [MeSH] OR ‘phenprocoumon’ [MeSH] OR ‘anticoagulants/therapeutic use’ [MeSH]#1 AND #2 AND #3The additional filters used were ‘Randomized Controlled Trial’ and ‘English’.
Study selection and data extractionTwo reviewers independently determined the eligibility of retrieved studies according to predetermined criteria. The language restriction English was imposed. Inclusion criteria were: an original RCT testing non-inferiority between a NOAC and a vitamin K antagonist, treatment indication had to be DVT or PE, objectively documented recurrent VTE as primary outcome, major and clinically relevant non-major bleeding as (secondary) safety outcome and adult study participants (18 years or older). Bleeding was defined as major if it was overt and associated with a decrease in the hemoglobin level of 2 g per decilitre or more, required the transfusion of 2 or more units of blood, occurred into a critical site, or contributed to death. Clinically relevant non-major bleeding was defined according to the criteria of the Van Gogh Investigators as well.[9] The exclusion criterion was extended studies, because this review focused on the treatment of acute VTEs.
Quality assessmentA quality assessment was carried out with a combination of two common used quality assessment tools: Jadad[10] and Verhagen[11]. The constituted checklist consisted of the following questions: 1. Was there a description of concealed allocation? 2. Was a correct method of randomisation performed? 3. Were the groups similar at baseline regarding the most important prognostic indicators? 4. Were the patients, care providers and outcome assessors blinded? 5. Was there a description of withdrawals and dropouts? 6. Was the primary outcome based on an intention-to-treat analysis? The answer ‘YES’ provided two points, a ‘NO’ provided no points and a ‘PARTIALLY’ gave one point. A score of ≥ 6 was considered satisfactory.
Statistical analysis The outcome measures were calculated as relative risk (RR) from the data available to correct differences in measurements. The meta-analysis regarding the primary efficacy outcome was carried out using a non-inferiority design feature. The aim of this methodology is to prove that a new treatment is not unacceptably less effective than the current standard treatment. A non- inferiority trail is different from a superiority trial for the reason that lacking evidence to reject a null hypothesis that states ‘there is no difference between the two groups’, does not necessarily prove these groups to be equal. Because of that the meta- analysis regarding the primary efficacy outcome tested the hypothesis that NOACs would be non-inferior to the standard therapy with VKAs. To test this, a pooled RR estimate was calculated across the studies with an upper limit of the 95% confidence interval (CI) for the relative risk of 1.5 and a two- sided alpha level of 0.05. This margin corresponds to maintenance of at least 70% of the efficacy of the conventional VKA therapy. The secondary safety analysis was designed as an event-driven superiority test considering major bleeding and clinically relevant non-major bleeding. For major bleeding as well as clinically relevant non-major bleeding, the null hypothesis was formulated as: there is no difference in bleeding incidence between NOACs and VKAs in the treatment for acute VTE. For safety analyses, relative risk reduction (RRR) was calculated with the help of the RR (RRR=100% * (1-RR)). Heterogeneity among studies was assessed using Cochrane Q and I2 statistics. Data showing I2 values of 60 percent or more were considered heterogenic and therefore analysed using a random-effects model instead of the fixed-effects model.Data were analysed using Open Meta-Analyst (BROWN: The Center for Evidence-Based Medicine).[12]
resultsStudy selectionThe PubMed search identified 152 records. All records were screened by title and abstract for eligibility. Irrelevant records contained: subgroup analyses, tool development studies, study design publications, diagnostic research, dose testing and phase II trials, pilot studies, cost-effectiveness studies, studies on treatment length, studies with a different drug or drug comparison and studies with a different indication for treatment (e.g. atrial fibrillation, superficial thrombosis, orthopaedic surgery). Additionally, all records that were no original clinical trial were excluded. After full text evaluation of 12 articles, 5 articles met the inclusion criteria.[13-17] The flow diagram shows an overview of the study selection process (Fig. 1).
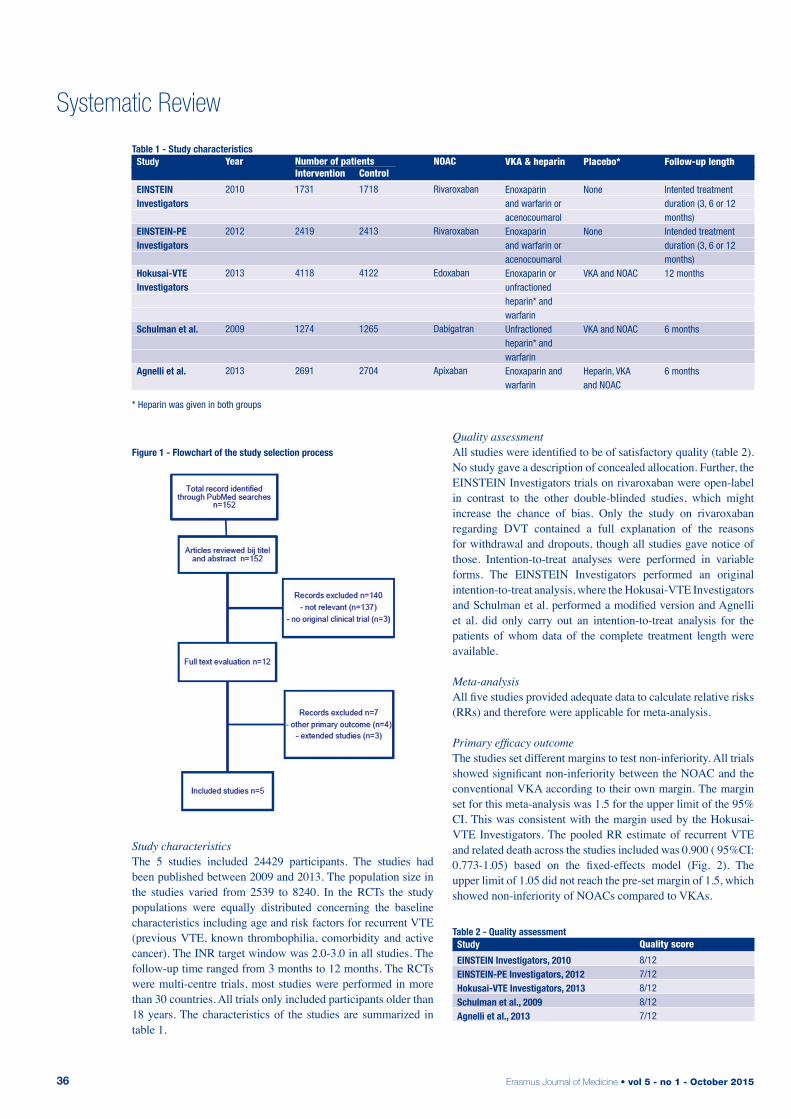
Erasmus Journal of Medicine • vol 5 - no 1 - October 201536
Systematic Review
Study characteristicsThe 5 studies included 24429 participants. The studies had been published between 2009 and 2013. The population size in the studies varied from 2539 to 8240. In the RCTs the study populations were equally distributed concerning the baseline characteristics including age and risk factors for recurrent VTE (previous VTE, known thrombophilia, comorbidity and active cancer). The INR target window was 2.0-3.0 in all studies. The follow-up time ranged from 3 months to 12 months. The RCTs were multi-centre trials, most studies were performed in more than 30 countries. All trials only included participants older than 18 years. The characteristics of the studies are summarized in table 1.
Quality assessmentAll studies were identified to be of satisfactory quality (table 2). No study gave a description of concealed allocation. Further, the EINSTEIN Investigators trials on rivaroxaban were open-label in contrast to the other double-blinded studies, which might increase the chance of bias. Only the study on rivaroxaban regarding DVT contained a full explanation of the reasons for withdrawal and dropouts, though all studies gave notice of those. Intention-to-treat analyses were performed in variable forms. The EINSTEIN Investigators performed an original intention-to-treat analysis, where the Hokusai-VTE Investigators and Schulman et al. performed a modified version and Agnelli et al. did only carry out an intention-to-treat analysis for the patients of whom data of the complete treatment length were available.
Meta-analysisAll five studies provided adequate data to calculate relative risks (RRs) and therefore were applicable for meta-analysis.
Primary efficacy outcomeThe studies set different margins to test non-inferiority. All trials showed significant non-inferiority between the NOAC and the conventional VKA according to their own margin. The margin set for this meta-analysis was 1.5 for the upper limit of the 95% CI. This was consistent with the margin used by the Hokusai-VTE Investigators. The pooled RR estimate of recurrent VTE and related death across the studies included was 0.900 ( 95%CI: 0.773-1.05) based on the fixed-effects model (Fig. 2). The upper limit of 1.05 did not reach the pre-set margin of 1.5, which showed non-inferiority of NOACs compared to VKAs.
Table 1 - Study characteristics
Year
2010
2012
2013
2009
2013
Number of patientsIntervention
1731
2419
4118
1274
2691
NOAC
Rivaroxaban
Rivaroxaban
Edoxaban
Dabigatran
Apixaban
VKA & heparin
Enoxaparin and warfarin or acenocoumarolEnoxaparin and warfarin or acenocoumarolEnoxaparin or unfractioned heparin* and warfarinUnfractioned heparin* and warfarinEnoxaparin and warfarin
Placebo*
None
None
VKA and NOAC
VKA and NOAC
Heparin, VKA and NOAC
Study
EINSTEIN Investigators
EINSTEIN-PE Investigators
Hokusai-VTE Investigators
Schulman et al.
Agnelli et al.
Control
1718
2413
4122
1265
2704
Follow-up length
Intented treatment duration (3, 6 or 12 months)Intended treatment duration (3, 6 or 12 months)12 months
6 months
6 months
* Heparin was given in both groups
Table 2 - Quality assessment
Quality score
8/127/128/128/127/12
Study
EINSTEIN Investigators, 2010EINSTEIN-PE Investigators, 2012Hokusai-VTE Investigators, 2013Schulman et al., 2009Agnelli et al., 2013
Figure 1 - Flowchart of the study selection process
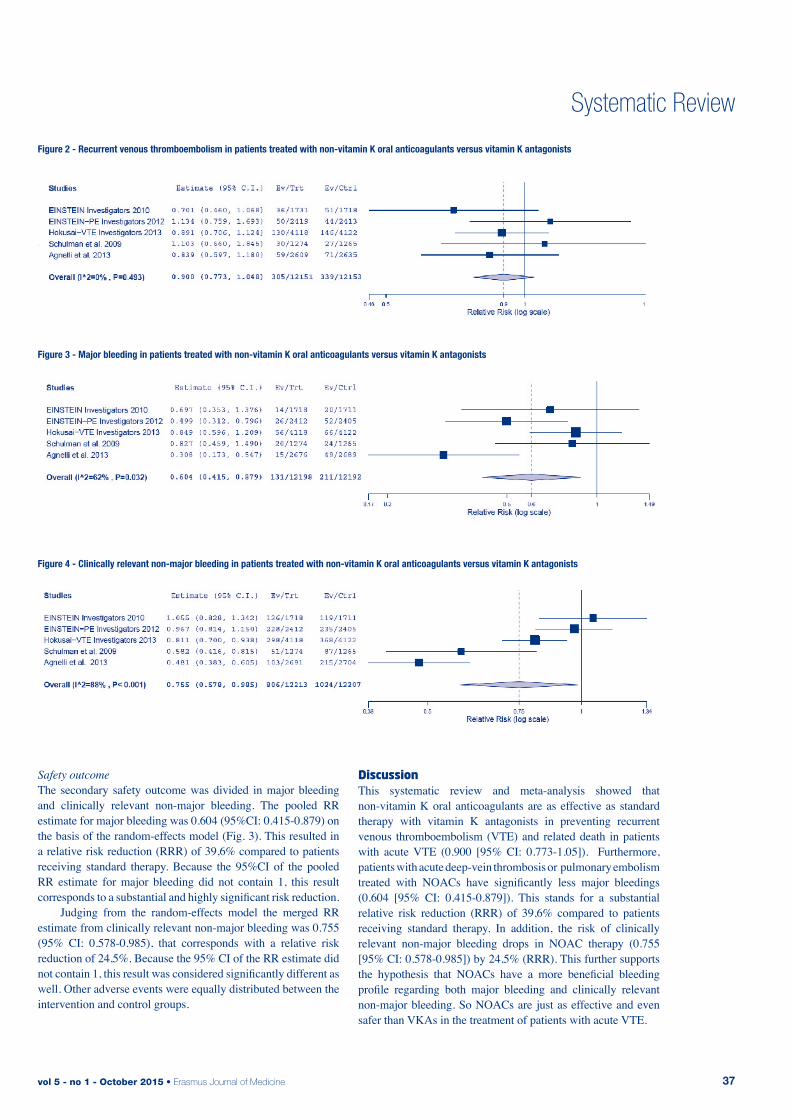
vol 5 - no 1 - October 2015 • Erasmus Journal of Medicine 37
Systematic Review
Safety outcomeThe secondary safety outcome was divided in major bleeding and clinically relevant non-major bleeding. The pooled RR estimate for major bleeding was 0.604 (95%CI: 0.415-0.879) on the basis of the random-effects model (Fig. 3). This resulted in a relative risk reduction (RRR) of 39,6% compared to patients receiving standard therapy. Because the 95%CI of the pooled RR estimate for major bleeding did not contain 1, this result corresponds to a substantial and highly significant risk reduction. Judging from the random-effects model the merged RR estimate from clinically relevant non-major bleeding was 0.755 (95% CI: 0.578-0.985), that corresponds with a relative risk reduction of 24,5%. Because the 95% CI of the RR estimate did not contain 1, this result was considered significantly different as well. Other adverse events were equally distributed between the intervention and control groups.
discussionThis systematic review and meta-analysis showed that non-vitamin K oral anticoagulants are as effective as standard therapy with vitamin K antagonists in preventing recurrent venous thromboembolism (VTE) and related death in patients with acute VTE (0.900 [95% CI: 0.773-1.05]). Furthermore, patients with acute deep-vein thrombosis or pulmonary embolism treated with NOACs have significantly less major bleedings (0.604 [95% CI: 0.415-0.879]). This stands for a substantial relative risk reduction (RRR) of 39,6% compared to patients receiving standard therapy. In addition, the risk of clinically relevant non-major bleeding drops in NOAC therapy (0.755 [95% CI: 0.578-0.985]) by 24,5% (RRR). This further supports the hypothesis that NOACs have a more beneficial bleeding profile regarding both major bleeding and clinically relevant non-major bleeding. So NOACs are just as effective and even safer than VKAs in the treatment of patients with acute VTE.
Table 1 - Study characteristics
Figure 2 - Recurrent venous thromboembolism in patients treated with non-vitamin K oral anticoagulants versus vitamin K antagonists
Figure 3 - Major bleeding in patients treated with non-vitamin K oral anticoagulants versus vitamin K antagonists
Figure 4 - Clinically relevant non-major bleeding in patients treated with non-vitamin K oral anticoagulants versus vitamin K antagonists
Erasmus Journal of Medicine • vol 5 - no 1 - October 201538
Systematic Review
Ruff et al. already compared the efficacy and safety of NOACs versus warfarin in the treatment of patient with atrial fibrillation.[8] They found NOACs to be non-inferior to VKAs in treatment of patients with atrial fibrillation with respect to efficacy, like the present study did for the treatment of patients suffering from acute VTE. Regarding safety, Ruff et al. found a significant reduction in all-cause mortality and intracranial bleeding in patients with atrial fibrillation treated with NOACs compared to patient receiving warfarin, which none of the five studies of the present meta-analysis did. The concerns of Ruff et al. regarding increased gastro-intestinal bleeding in NOAC treatment were not confirmed by our data in patients with VTE. Further, their study found a relative risk reduction of 14% in major bleeding, which did not reach significance level. In contrast, the analysis of the data on VTE treatment resulted in a significant relative risk reduction of 39,6% for major bleeding and 24,5% for clinically relevant non-major bleeding. Clinically relevant non-major bleeding was not analysed separately by Ruff et al.
LimitationsThe studies showed somewhat difference in treatment protocol and blinding methods. Hokusai-VTE Investigators and Schulman et al. gave heparin in the control as well as in the intervention group and used sham INR monitoring. Also, the EINSTEIN Investigators used an open-label design for both of their studies, where the other researchers did not. Besides that, the follow-up duration differed among the studies ranging from 3 to 12 months. Some depended on the duration of treatment, others did not. Those factors might give rise to variation among the studies compared in the meta-analysis. We only collected records through PubMed, which could have led to selection bias, although PubMed contains all relevant studies published in high-quality journals. The margin for the upper limit 95% CI was chosen based on clinical considerations. We considered that a margin of 1.5 was the maximum tolerance level, appro-priate to prove non-inferiority. This choice was supported by the fact that 1.5 was the lowest limit in all studies we examined. Heterogeneity of the clinically relevant non-major bleeding analysis was substantial. Reasons for that could be found in differences in pharmacodynamics and pharmacokinetics among the different substances. Another factor that might play a role is the difference in interpretation of the definition of clinically relevant non-major bleeding.
RecommendationsBased on our research we recommend the implementation of NOACs in the treatment of patients with acute venous thromboembolism. The clinical value of NOACs consists of less major and clinically relevant non-major bleeding events during treatment with a similar risk of recurrence of the disease. The clinical and social implications of bleeding, especially those of major bleeding (e.g. cranial bleeding), are extensive, which involves costs as well. Therefore, this recommendation might need research, in particular on finances, to prove that implementation of NOACs has a favourable cost-benefit ratio. We think the medical advantages of the NOACs can justify the possible extra costs required for implementation.
acknowledgmentsWe would like to thank dr. M.J.H.A. Kruip for her expert advice and feedback on our review.
references1. Oger, E., Incidence of Venous Thromboembolism: A Community-
based Study in Western France. Thromb Haemost. 2000; 83: 657-602. Spencer, F.A., Emery, C., Lessard, D. et al., The Worcester Venous
Thromboembolism study: a population-based study of the clini-cal epidemiology of venous thromboembolism. J Gen Intern Med 2006;21:722-7
3. Douketis, J.D., Kearon, C., Bates, S. et al., Risk of fatal pulmonary embolism in patients with treated venous thromboembolism. Jama 1998;279:458-62
4. Goldhaber, S.Z., and Bounameaux, H., Pulmonary embolism and deep vein thrombosis. Lancet 2012;379:1835-46
5. Kearon, C., Akl, E.A., Comerota, A.J. et al., Antithrombotic therapy for VTE disease: Antithrombotic Therapy for VTE Disease: Anti-thrombotic Therapy and Prevention of Thrombosis, 9th ed: Ameri-can College of Chest Physicians Evidance-Based Clinical Practica Guidelines. Chest 2012;14:e419S-94S
6. Kearon, C., Kahn, S.R., Agnelli, G. et al., Antithrombotic the-rapy for venous thromboembolic disease: American College of Chest Physicians Evidence-Based Clinical Practice Guideli-nes (8th Edition). Chest 2008;133:454S-545S. [Erratum, Chest 2008;134:892.]
7. Ansell, J., Hirsch, J., Hylek, E. et al., Pharmacology and manage-ment of the vitamin K antagonist: American College of Chest Phy-sicians Evidence-Based Clinical Practice Guidelines (8th Edition). Chest 2008;133:160S-98S.
8. Ruff, C.T., Giugliano, R.P., Braunwald, E. et al., Comparison of the efficacy and safety of new oral anticoagulants with warfarin in patients with atrial fibrillation: a meta-analysis of randomised trials. Lancet 2014;383:955-62
9. The van Gogh investigators, Büller H.R., Cohen A.T. et al., Idrapa-rinux versus standard therapy for venous thromboembolic disease. N Engl J Med 2007;357:1094-104
10. Jadad, A.R., Moore, R.A., Carroll, D. et al., Assessing the quality of reports of randomized clinical trials: is blinding necessary? Con-trol. Clin. Trials 1996;17:1-12
11. Verhagen, A.P., de Vet, H.C., de Bie, R.A. et al., The Delphi list: a criteria list for quality assessment of randomized clinical trials for cobnducting systematic reviews developed by Delphi consensus. J Clin Epidemiol 1998; 51:1235-41
12. OpenMetaAnalyst: Wallace, Byron C., Issa J. Dahabreh, Thomas A. Trikalinos, Joseph Lau, Paul Trow, and Christopher H. Schmid. Closing the Gap between Methodologists and End-Users: R as a Computational Back-End. Journal of Statistical Software 49 (2012): 5.
13. EINSTEIN Investigators, Bauersachs, R., Berkowitz, S.D., et al., Oral rivaroxaban for symptomatic venous thromboembolism. N Engl J Med 2010;363:2499-510
14. EINSTEIN-PE Investigators, Büller, H.R., Prins, M.H. et al., Oral rivaroxaban for the treatment of symptomatic pulmonary embo-lism. N Engl J Med 2012;366:1278-97
15. Hokusai-VTE Investigators, Büller, H.R., Décousus, H. et al., Edoxaban versus warfarin for the treatment of symptomatic venous thromboembolism. N Engl J Med 2013;369:1406-15
16. Schulman, S., Kearon, C., Kakkar, AK. et al., Dabigatran versus warfarin in the treatment of acute venous thromboembolism. N Engl J Med 2009;361:2342-52
17. Agnelli, G., Buller, H.R., Cohen, A. et al., Oral apixaban for the treatment of acute venous thromboembolism. N Engl J Med 2013;369:799-808
vol 5 - no 1 - October 2015 • Erasmus Journal of Medicine 39
Systematic Review
reversibility of tenofovir nephrotoxicity in Hiv-positive patientsA systematic review Ysette Karlijn de Boera, Rosanne de Lannoya, Rana Orhana, Bart Rijndersb
a Medical student, Erasmus MC University Medical Center Rotterdam, the Netherlandsb Supervisor, Department of Internal Medicine, Erasmus MC University Medical Center Rotterdam, the NetherlandsCorrespondence: Rosanne de Lannoy, e-mail: [email protected]
abstractObjective: Tenofovir disoproxil fumarate (TDF) is widely prescribed for the treatment of HIV infection, despite the considerable risk of renal impairment. However, the reversibility of TDF-induced nephrotoxicity has not been determined systematically.Methods: PubMed was searched in January 2015. Randomized controlled trials and cohort studies were included if they compared eGFR after discontinuation of TDF therapy with eGFR at baseline in HIV-positive patients.Results: One randomized controlled trial and four retrospective observational studies were included. The majority of studies reported improvement of eGFR after discontinuation of TDF therapy in more than half of the participants.Conclusion: eGFR should be thoroughly monitored during TDF therapy in HIV-positive patients, since, after discontinuation, TDF-induced nephrotoxicity appears to be partly or even completely reversible in most of those patients.
introduction In 2013, 35 million people were living with human immuno-deficiency virus (HIV) worldwide, of which 12.9 million (37%) had access to antiretroviral therapy.[1] Combination antiretrovi-ral therapy (cART) has dramatically declined mortality in HIV-infected patients, by achieving sustained virological suppression to restore and preserve immunological function and prevent opportunistic infections.[2-5]
Next to HIV-infection itself and pre-existing comorbidities, toxicity of certain antiretroviral drugs can play an important role in organ damage. Some protease inhibitors (PIs), such as indinavir and atazanavir, and nucleoside reverse transcriptase inhibitors (NRTIs), including adefovir and cidofovir, have been associated with nephrotoxicity.[6-8] Tenofovir disoproxil fumarate (TDF), a NRTI, is recommen-ded for use in combination with other antiretroviral agents, for the treatment of HIV-1 infection.[9,10] TDF is widely prescri-bed due to its superior antiviral efficacy, low pill burden and relatively few side effects.[10,11] Despite low incidence of serious renal adverse events in registrational clinical trials [12,13], TDF has been linked to renal impairment in 4% of HIV-infected patients [14-17]. Developing nephrotoxicity, defined as a decline in estimated glomerular filtration rate (eGFR), can lead to discontinuation of TDF therapy.[18] Since kidney disease in HIV-infected persons is associated with increased mortality, the aim of this review was to systematically determine whether TDF-induced nephrotoxicity is reversible.[19]
“tenofovir”[Title] AND (“nephrotoxicity”[Title] OR “renal function”[Title] OR “renal dysfunction”[Title] OR “renal damage”[Title] OR “kidney toxicity”[Title] OR “renal toxicity”[Title] OR “renal failure”[Title] OR “kidney disease”[Title] OR “kidney failure”[Title] OR “renal safety”[Title] OR “renal adverse events”[Title] OR “renal dysfunction”[Title] OR “nephropathy”[Title] OR “renal impairment”[Title] OR “glomerular filtration rate”[Title] OR “eGFR”[Title] OR “GFR”[Title]) AND (“reversibility”[All Fields] OR “reversible”[All Fields] OR “irreversible”[All Fields] OR “irreversibility”[All Fields]) AND (“humans”[MeSH Terms] AND English[lang])
MethodsIn January 2015, PubMed was searched using different synonyms of tenofovir, nephrotoxicity and reversibility. No restrictions on the publication date were imposed. The search was limited to articles written in English. The exact search strategy is presented in Appendix 1.Only studies with HIV-positive patients were included. Furthermore, explicit data on eGFR (quantified in ml/min/1.73 m2) at initiation or directly after discontinuation of TDF therapy and during follow-up after discontinuation had to be given.Case reports and review studies were excluded.The risk of bias was assessed based on the number of patients, selection bias and adequate follow-up.
Appendix 1 - Search strategy
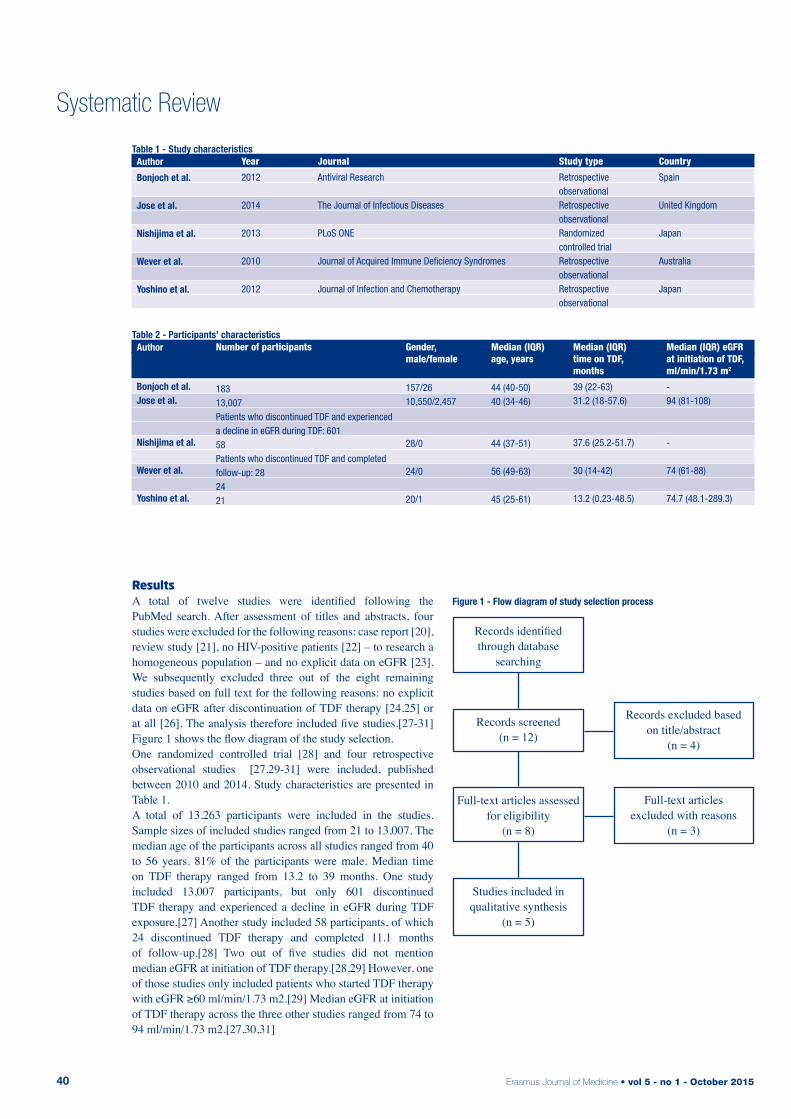
Erasmus Journal of Medicine • vol 5 - no 1 - October 201540
Systematic Review
resultsA total of twelve studies were identified following the PubMed search. After assessment of titles and abstracts, four studies were excluded for the following reasons: case report [20], review study [21], no HIV-positive patients [22] – to research a homogeneous population – and no explicit data on eGFR [23]. We subsequently excluded three out of the eight remaining studies based on full text for the following reasons: no explicit data on eGFR after discontinuation of TDF therapy [24,25] or at all [26]. The analysis therefore included five studies.[27-31] Figure 1 shows the flow diagram of the study selection. One randomized controlled trial [28] and four retrospective observational studies [27,29-31] were included, published between 2010 and 2014. Study characteristics are presented in Table 1.A total of 13,263 participants were included in the studies. Sample sizes of included studies ranged from 21 to 13,007. The median age of the participants across all studies ranged from 40 to 56 years. 81% of the participants were male. Median time on TDF therapy ranged from 13.2 to 39 months. One study included 13,007 participants, but only 601 discontinued TDF therapy and experienced a decline in eGFR during TDF exposure.[27] Another study included 58 participants, of which 24 discontinued TDF therapy and completed 11.1 months of follow-up.[28] Two out of five studies did not mention median eGFR at initiation of TDF therapy.[28,29] However, one of those studies only included patients who started TDF therapy with eGFR ≥60 ml/min/1.73 m2.[29] Median eGFR at initiation of TDF therapy across the three other studies ranged from 74 to 94 ml/min/1.73 m2.[27,30,31]
Table 1 - Study characteristics
Year
2012
2014
2013
2010
2012
Journal
Antiviral Research
The Journal of Infectious Diseases
PLoS ONE
Journal of Acquired Immune Deficiency Syndromes
Journal of Infection and Chemotherapy
Country
Spain
United Kingdom
Japan
Australia
Japan
Author
Bonjoch et al.
Jose et al.
Nishijima et al.
Wever et al.
Yoshino et al.
Study type
Retrospective observationalRetrospective observationalRandomized controlled trialRetrospective observationalRetrospective observational
Table 2 - Participants’ characteristics
Number of participants
18313,007Patients who discontinued TDF and experienced a decline in eGFR during TDF: 601 58Patients who discontinued TDF and completed follow-up: 282421
Gender, male/female
157/2610,550/2,457
28/0
24/0
20/1
Median (IQR) time on TDF, months
39 (22-63) 31.2 (18-57.6)
37.6 (25.2-51.7)
30 (14-42)
13.2 (0.23-48.5)
Author
Bonjoch et al.Jose et al.
Nishijima et al.
Wever et al.
Yoshino et al.
Median (IQR) age, years
44 (40-50) 40 (34-46)
44 (37-51)
56 (49-63)
45 (25-61)
Median (IQR) eGFR at initiation of TDF, ml/min/1.73 m2
-94 (81-108)
-
74 (61-88)
74.7 (48.1-289.3)
Records identifiedthrough database
searching
Records screened(n = 12)
Full-text articles assessedfor eligibility
(n = 8)
Studies included in qualitative synthesis
(n = 5)
Records excluded basedon title/abstract
(n = 4)
Full-text articles excluded with reasons
(n = 3)
Figure 1 - Flow diagram of study selection process
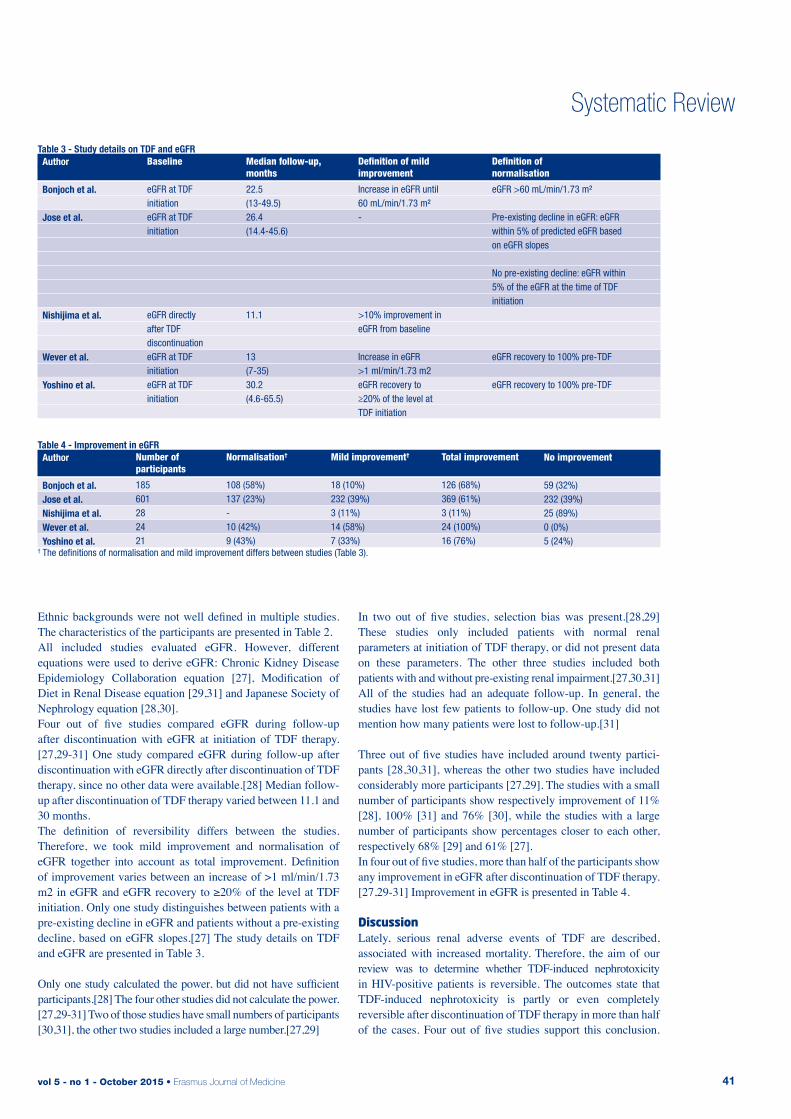
vol 5 - no 1 - October 2015 • Erasmus Journal of Medicine 41
Systematic Review
Ethnic backgrounds were not well defined in multiple studies. The characteristics of the participants are presented in Table 2. All included studies evaluated eGFR. However, different equations were used to derive eGFR: Chronic Kidney Disease Epidemiology Collaboration equation [27], Modification of Diet in Renal Disease equation [29,31] and Japanese Society of Nephrology equation [28,30]. Four out of five studies compared eGFR during follow-up after discontinuation with eGFR at initiation of TDF therapy.[27,29-31] One study compared eGFR during follow-up after discontinuation with eGFR directly after discontinuation of TDF therapy, since no other data were available.[28] Median follow-up after discontinuation of TDF therapy varied between 11.1 and 30 months.The definition of reversibility differs between the studies. Therefore, we took mild improvement and normalisation of eGFR together into account as total improvement. Definition of improvement varies between an increase of >1 ml/min/1.73 m2 in eGFR and eGFR recovery to ≥20% of the level at TDF initiation. Only one study distinguishes between patients with a pre-existing decline in eGFR and patients without a pre-existing decline, based on eGFR slopes.[27] The study details on TDF and eGFR are presented in Table 3. Only one study calculated the power, but did not have sufficient participants.[28] The four other studies did not calculate the power.[27,29-31] Two of those studies have small numbers of participants [30,31], the other two studies included a large number.[27,29]
Table 3 - Study details on TDF and eGFR
Baseline
eGFR at TDF initiationeGFR at TDF initiation
eGFR directly after TDF discontinuationeGFR at TDF initiationeGFR at TDF initiation
Median follow-up, months
22.5(13-49.5)26.4 (14.4-45.6)
11.1
13 (7-35)30.2(4.6-65.5)
Definition of normalisation
eGFR >60 mL/min/1.73 m²
Pre-existing decline in eGFR: eGFR within 5% of predicted eGFR based on eGFR slopes
No pre-existing decline: eGFR within 5% of the eGFR at the time of TDF initiation
eGFR recovery to 100% pre-TDF
eGFR recovery to 100% pre-TDF
Author
Bonjoch et al.
Jose et al.
Nishijima et al.
Wever et al.
Yoshino et al.
Definition of mild improvement
Increase in eGFR until 60 mL/min/1.73 m²-
>10% improvement in eGFR from baseline
Increase in eGFR>1 ml/min/1.73 m2eGFR recovery to ≥20% of the level at TDF initiation
In two out of five studies, selection bias was present.[28,29] These studies only included patients with normal renal parameters at initiation of TDF therapy, or did not present data on these parameters. The other three studies included both patients with and without pre-existing renal impairment.[27,30,31]All of the studies had an adequate follow-up. In general, the studies have lost few patients to follow-up. One study did not mention how many patients were lost to follow-up.[31] Three out of five studies have included around twenty partici-pants [28,30,31], whereas the other two studies have included considerably more participants [27,29]. The studies with a small number of participants show respectively improvement of 11% [28], 100% [31] and 76% [30], while the studies with a large number of participants show percentages closer to each other, respectively 68% [29] and 61% [27].In four out of five studies, more than half of the participants show any improvement in eGFR after discontinuation of TDF therapy.[27,29-31] Improvement in eGFR is presented in Table 4.
discussionLately, serious renal adverse events of TDF are described, associated with increased mortality. Therefore, the aim of our review was to determine whether TDF-induced nephrotoxicity in HIV-positive patients is reversible. The outcomes state that TDF-induced nephrotoxicity is partly or even completely reversible after discontinuation of TDF therapy in more than half of the cases. Four out of five studies support this conclusion.
Table 4 - Improvement in eGFR
Number of participants
185601282421
Normalisation†
108 (58%)137 (23%)-10 (42%)9 (43%)
Total improvement
126 (68%)369 (61%)3 (11%)24 (100%)16 (76%)
Author
Bonjoch et al.Jose et al.Nishijima et al.Wever et al.Yoshino et al.
Mild improvement†
18 (10%)232 (39%)3 (11%)14 (58%)7 (33%)
No improvement
59 (32%)232 (39%)25 (89%)0 (0%)5 (24%)
† The definitions of normalisation and mild improvement differs between studies (Table 3).
Table 1 - Study characteristics
Table 2 - Participants’ characteristics
Erasmus Journal of Medicine • vol 5 - no 1 - October 201542
Systematic Review
[27,29-31] This suggests that eGFR should be evaluated in HIV-positive patients who receive TDF therapy and when a decline is measured, patients should discontinue TDF.Our review had a few limitations. One of which is the small number of patients included in three out of five studies.[28,30,31] This could influence the outcome and therefore, we considered this as an increased risk of bias. A second limitation is selection bias. Three out of five studies have included both pa-tients with and without pre-existing renal impairment.[27,30,31] The other two studies have not, or data on renal function at initiation of TDF is not presented.[28,29] A pre-existing decline in eGFR might affect the percentages of mild improvement and normalisation of eGFR. Another limitation is the way eGFR is derived in the studies. Three kinds of equations were used, which makes it difficult to compare the studies. Moreover, all five studies use different criteria for both mild improvement and normalisation. One study uses eGFR directly after discontinuation of TDF therapy, instead of eGFR at initiation of TDF therapy, as baseline.[28]Factors we did not study, but most likely have an influence on reversibility are such as, but not limited to: time on TDF therapy, gender and age. These factors are investigated in several studies, but since those are secondary outcomes, we did not research them.In conclusion, future studies should investigate whether pre-existing renal impairment influences reversibility of tenofovir-induced nephrotoxicity.
references1. UNAIDS Latest fact sheet on the global aids epidemic. In; 2014; 2. Egger M H.B., Francioli P, et al. Impact of new anti-retroviral com-
bination therapies in HIV infected patients in Switzerland: prospec-tive multicentre study. BMJ. 1997; 315: 1194–1199.
3. Jaggy C v.O.J., Ledergerber B, et al. Mortality in the Swiss HIV Co-hort Study (SHCS) and the Swiss general population. Lancet. 2003; 362: 877-878.
4. Sterne JA H.M., Ledergerber B, et al. Long-term effectiveness of potent antiretroviral therapy in preventing AIDS and death: a pros-pective cohort study. Lancet. 2005; 366: 378-384.
5. Mocroft A L.B., Katlama C, et al. Decline in the AIDS and death rates in the EuroSIDA study: an observational study. Lancet. 2003; 362: 22-29.
6. Tanji N T.K., Kambham N et al. Adefovir Nephrotoxicity: possible role of mitochondrial DNA depletion. Human Pathology. 2001; 32: 734-740.
7. Meier P D.-G.S., Ronco P et al. Cidofovir-induced end-stage renal failure. Nephrology Dialysis Transplantation. 2002; 17: 148-149.
8. Mocroft A K.O., Gatell J, et al. Chronic renal failure among HIV-1-infected patients. Aids. 2007; 21: 1119-1127.
9. Gunthard H.F., Aberg J.A., Eron J.J., et al. Antiretroviral treatment of adult HIV infection: 2014 recommendations of the International Antiviral Society-USA Panel. Jama. 2014; 312: 410-425.
10. Services D.o.H.a.H. Panel on Antiretroviral Guidelines for Adults and Adolescents. Guidelines for the use of antiretroviral agents in HIV-1-infected adults and adolescents.
11. Jimenez-Nacher I G.B., Barreiro P et al. Trends in the prescription of antiretroviral drugs and impact on plasma HIV-RNA measurements. Journal of Antimicrobial Chemotherapy. 2008; 62: 186-822.
12. Squires K P.A., Pierone G Jr. Steinhart CR, Berger D, Bellos NC, et al. Tenofovir disoproxil fumarate in nucleoside-resistant HIV-1 infection: a randomized trial. Annals of Internal Medicine. 2003; 139: 313-320.
13. Gallant JE S.S., Pozniak AL, DeJesus E, Suleiman JM, Miller MD, et al. Efficacy and safety of tenofovir DF vs stavudine in combination therapy in antiretroviral-naive patients: a 3-year randomized trial. Jama. 2004; 292: 191-201.
14. James C S.M., Szabo S, Dressier R. Tenofovir-related nephrotoxicity: case report and review of the literature. Pharmacotherapy. 2004; 24: 415-418.
15. Fontana R.J. Side effects of long-term oral antiviral therapy for hepatitis B. Hepatology. 2009; 49: S185-195.
16. Malik A A.P., Malik N. Acute renal failure and Fanconi syndrome in an AIDS patient on tenofovir treatment-case report and review of literature. Journal of Infection. 2005; 51: E61-65.
17. Young B B.K., Moorman A, et al. Renal function in patients with preexisting renal disease receiving tenofovir-containing highly ac-tive antiretroviral therapy in the HIV outpatient study. AIDS Patient Care and STDs. 2009; 23: 589-592.
18. Fux CA S.M., Wolbers M, et al. Tenofovir use is associated with a reduction in calculated glomerular filtration rates in the Swiss HIV Cohort Study. Antiviral Therapy. 2007; 12: 1165-1173.
19. Choi A S.R., Bacchetti P, Tien PC, Saag MS, Gibert CL, et al. Cys-tatin C, albuminuria, and 5-year all-cause mortality in HIV-infected persons. American Journal of Kidney Diseases. 2010; 56: 872-882.
20. Wood S.M., Shah S.S., Steenhoff A.P., et al. Tenofovir-associated nephrotoxicity in two HIV-infected adolescent males. AIDS Patient Care STDS. 2009; 23: 1-4.
21. Rodriguez-Novoa S., Alvarez E., Labarga P., et al. Renal toxicity associated with tenofovir use. Expert Opin Drug Saf. 2010; 9: 545-559.
22. Solomon M.M., Lama J.R., Glidden D.V., et al. Changes in renal function associated with oral emtricitabine/tenofovir disoproxil fu-marate use for HIV pre-exposure prophylaxis. Aids. 2014; 28: 851-859.
23. Herlitz L.C., Mohan S., Stokes M.B., et al. Tenofovir nephrotoxi-city: acute tubular necrosis with distinctive clinical, pathological, and mitochondrial abnormalities. Kidney Int. 2010; 78: 1171-1177.
24. Scherzer R., Estrella M., Li Y., et al. Association of tenofovir ex-posure with kidney disease risk in HIV infection. Aids. 2012; 26: 867-875.
25. Manosuthi W., Prasithsirikul W., Tantanathip P., et al. Renal impair-ment in HIV-1 infected patients receiving antiretroviral regimens including tenofovir in a resource-limited setting. Southeast Asian J Trop Med Public Health. 2011; 42: 643-650.
26. Campbell L.J., Hamzah L., Post F.A. Is tenofovir-related renal toxi-city incompletely reversible? J Acquir Immune Defic Syndr. 2011; 56: e95; author reply e95-96.
27. Jose S., Hamzah L., Campbell L.J., et al. Incomplete reversibility of estimated glomerular filtration rate decline following tenofovir disoproxil fumarate exposure. J Infect Dis. 2014; 210: 363-373.
28. Nishijima T., Gatanaga H., Shimbo T., et al. Switching tenofovir/emtricitabine plus lopinavir/r to raltegravir plus Darunavir/r in patients with suppressed viral load did not result in improvement of renal function but could sustain viral suppression: a randomized multicenter trial. PLoS One. 2013; 8: e73639.
29. Bonjoch A., Echeverria P., Perez-Alvarez N., et al. High rate of reversibility of renal damage in a cohort of HIV-infected patients receiving tenofovir-containing antiretroviral therapy. Antiviral Res. 2012; 96: 65-69.
30. Yoshino M., Yagura H., Kushida H., et al. Assessing recovery of renal function after tenofovir disoproxil fumarate discontinuation. J Infect Chemother. 2012; 18: 169-174.
31. Wever K., van Agtmael M.A., Carr A. Incomplete reversibility of tenofovir-related renal toxicity in HIV-infected men. J Acquir Im-mune Defic Syndr. 2010; 55: 78-81.
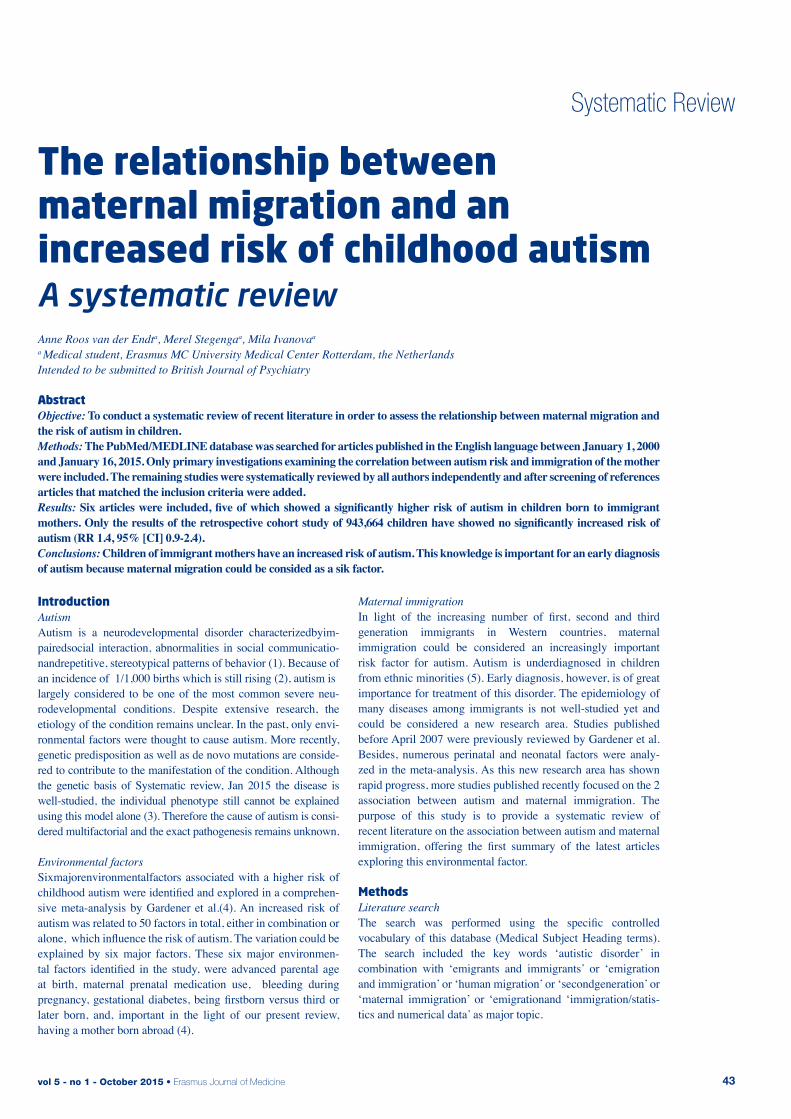
vol 5 - no 1 - October 2015 • Erasmus Journal of Medicine 43
Systematic Review
the relationship between maternal migration and an increased risk of childhood autism A systematic review Anne Roos van der Endta, Merel Stegengaa, Mila Ivanovaa
a Medical student, Erasmus MC University Medical Center Rotterdam, the NetherlandsIntended to be submitted to British Journal of Psychiatry
abstractObjective: To conduct a systematic review of recent literature in order to assess the relationship between maternal migration and the risk of autism in children. Methods: The PubMed/MEDLINE database was searched for articles published in the English language between January 1, 2000 and January 16, 2015. Only primary investigations examining the correlation between autism risk and immigration of the mother were included. The remaining studies were systematically reviewed by all authors independently and after screening of references articles that matched the inclusion criteria were added.Results: Six articles were included, five of which showed a significantly higher risk of autism in children born to immigrant mothers. Only the results of the retrospective cohort study of 943,664 children have showed no significantly increased risk of autism (RR 1.4, 95% [CI] 0.9-2.4).Conclusions: Children of immigrant mothers have an increased risk of autism. This knowledge is important for an early diagnosis of autism because maternal migration could be consided as a sik factor.
introductionAutismAutism is a neurodevelopmental disorder characterizedbyim-pairedsocial interaction, abnormalities in social communicatio-nandrepetitive, stereotypical patterns of behavior (1). Because of an incidence of 1/1,000 births which is still rising (2), autism islargely considered to be one of the most common severe neu-rodevelopmental conditions. Despite extensive research, the etiology of the condition remains unclear. In the past, only envi-ronmental factors were thought to cause autism. More recently, genetic predisposition as well as de novo mutations are conside-red to contribute to the manifestation of the condition. Although the genetic basis of Systematic review, Jan 2015 the disease is well-studied, the individual phenotype still cannot be explained using this model alone (3). Therefore the cause of autism is consi-dered multifactorial and the exact pathogenesis remains unknown.
Environmental factorsSixmajorenvironmentalfactors associated with a higher risk of childhood autism were identified and explored in a comprehen-sive meta-analysis by Gardener et al.(4). An increased risk of autism was related to 50 factors in total, either in combination or alone, which influence the risk of autism. The variation could beexplained by six major factors. These six major environmen-tal factors identified in the study, were advanced parental age at birth, maternal prenatal medication use, bleeding during pregnancy, gestational diabetes, being firstborn versus third or later born, and, important in the light of our present review, having a mother born abroad (4).
Maternal immigrationIn light of the increasing number of first, second and third generation immigrants in Western countries, maternal immigration could be considered an increasingly important risk factor for autism. Autism is underdiagnosed in children from ethnic minorities (5). Early diagnosis, however, is of great importance for treatment of this disorder. The epidemiology of many diseases among immigrants is not well-studied yet and could be considered a new research area. Studies published before April 2007 were previously reviewed by Gardener et al. Besides, numerous perinatal and neonatal factors were analy-zed in the meta-analysis. As this new research area has shown rapid progress, more studies published recently focused on the 2 association between autism and maternal immigration. The purpose of this study is to provide a systematic review of recent literature on the association between autism and maternal immigration, offering the first summary of the latest articles exploring this environmental factor.
MethodsLiterature searchThe search was performed using the specific controlled vocabulary of this database (Medical Subject Heading terms). The search included the key words ‘autistic disorder’ in combination with ‘emigrants and immigrants’ or ‘emigration and immigration’ or ‘human migration’ or ‘secondgeneration’ or ‘maternal immigration’ or ‘emigrationand ‘immigration/statis-tics and numerical data’ as major topic.
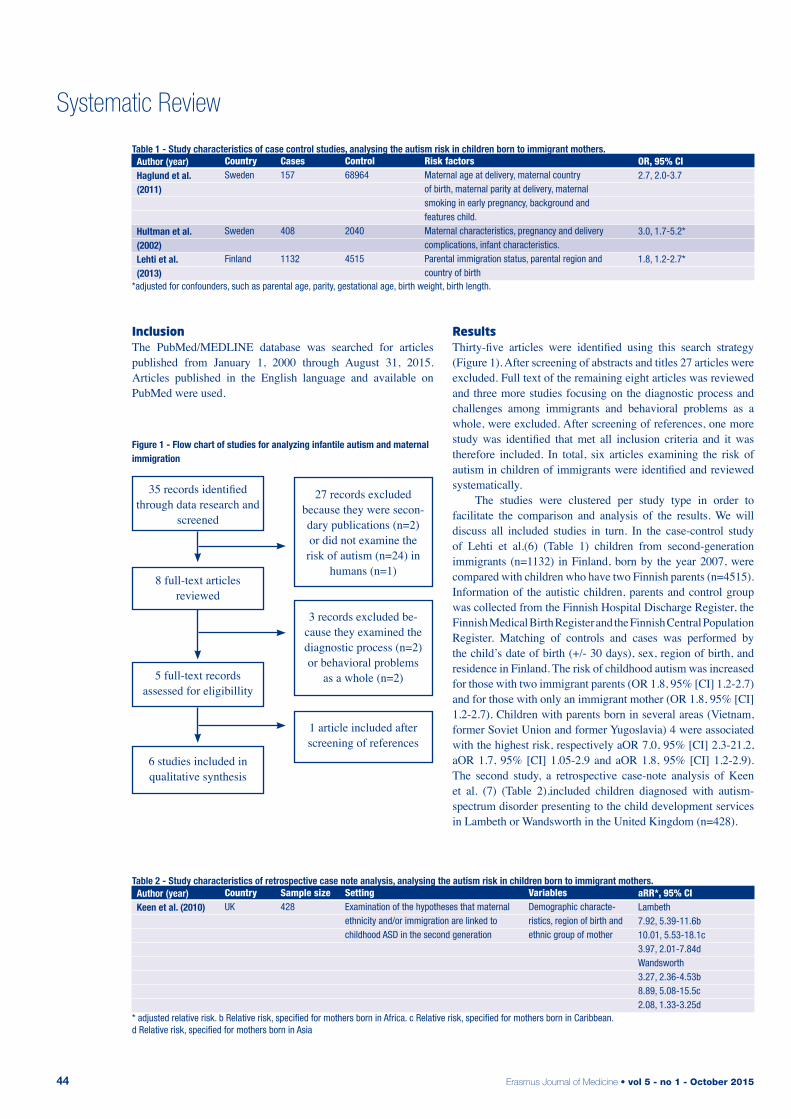
Erasmus Journal of Medicine • vol 5 - no 1 - October 201544
Systematic Review
inclusionThe PubMed/MEDLINE database was searched for articles published from January 1, 2000 through August 31, 2015. Articles published in the English language and available on PubMed were used.
resultsThirty-five articles were identified using this search strategy (Figure 1). After screening of abstracts and titles 27 articles were excluded. Full text of the remaining eight articles was reviewed and three more studies focusing on the diagnostic process and challenges among immigrants and behavioral problems as a whole, were excluded. After screening of references, one more study was identified that met all inclusion criteria and it was therefore included. In total, six articles examining the risk of autism in children of immigrants were identified and reviewed systematically. The studies were clustered per study type in order to facilitate the comparison and analysis of the results. We will discuss all included studies in turn. In the case-control study of Lehti et al.(6) (Table 1) children from second-generation immigrants (n=1132) in Finland, born by the year 2007, were compared with children who have two Finnish parents (n=4515). Information of the autistic children, parents and control group was collected from the Finnish Hospital Discharge Register, the Finnish Medical Birth Register and the Finnish Central Population Register. Matching of controls and cases was performed by the child’s date of birth (+/- 30 days), sex, region of birth, and residence in Finland. The risk of childhood autism was increased for those with two immigrant parents (OR 1.8, 95% [CI] 1.2-2.7) and for those with only an immigrant mother (OR 1.8, 95% [CI] 1.2-2.7). Children with parents born in several areas (Vietnam, former Soviet Union and former Yugoslavia) 4 were associated with the highest risk, respectively aOR 7.0, 95% [CI] 2.3-21.2, aOR 1.7, 95% [CI] 1.05-2.9 and aOR 1.8, 95% [CI] 1.2-2.9). The second study, a retrospective case-note analysis of Keen et al. (7) (Table 2),included children diagnosed with autism- spectrum disorder presenting to the child development services in Lambeth or Wandsworth in the United Kingdom (n=428).
35 records identified through data research and
screened
8 full-text articles reviewed
5 full-text records assessed for eligibillity
6 studies included in qualitative synthesis
27 records excluded because they were secon-dary publications (n=2) or did not examine the
risk of autism (n=24) in humans (n=1)
3 records excluded be-cause they examined the diagnostic process (n=2) or behavioral problems
as a whole (n=2)
1 article included after screening of references
Figure 1 - Flow chart of studies for analyzing infantile autism and maternal immigration
Table 1 - Study characteristics of case control studies, analysing the autism risk in children born to immigrant mothers.
CountrySweden
Sweden
Finland
Cases157
408
1132
Risk factorsMaternal age at delivery, maternal country of birth, maternal parity at delivery, maternal smoking in early pregnancy, background and features child. Maternal characteristics, pregnancy and delivery complications, infant characteristics. Parental immigration status, parental region and country of birth
Author (year)Haglund et al. (2011)
Hultman et al. (2002) Lehti et al. (2013)
Control68964
2040
4515
OR, 95% CI2.7, 2.0-3.7
3.0, 1.7-5.2*
1.8, 1.2-2.7*
*adjusted for confounders, such as parental age, parity, gestational age, birth weight, birth length.
Table 2 - Study characteristics of retrospective case note analysis, analysing the autism risk in children born to immigrant mothers.
CountryUK
Sample size428
VariablesDemographic characte-ristics, region of birth and ethnic group of mother
Author (year)Keen et al. (2010)
SettingExamination of the hypotheses that maternal ethnicity and/or immigration are linked to childhood ASD in the second generation
aRR*, 95% CILambeth7.92, 5.39-11.6b10.01, 5.53-18.1c3.97, 2.01-7.84dWandsworth3.27, 2.36-4.53b8.89, 5.08-15.5c2.08, 1.33-3.25d
* adjusted relative risk. b Relative risk, specified for mothers born in Africa. c Relative risk, specified for mothers born in Caribbean. d Relative risk, specified for mothers born in Asia
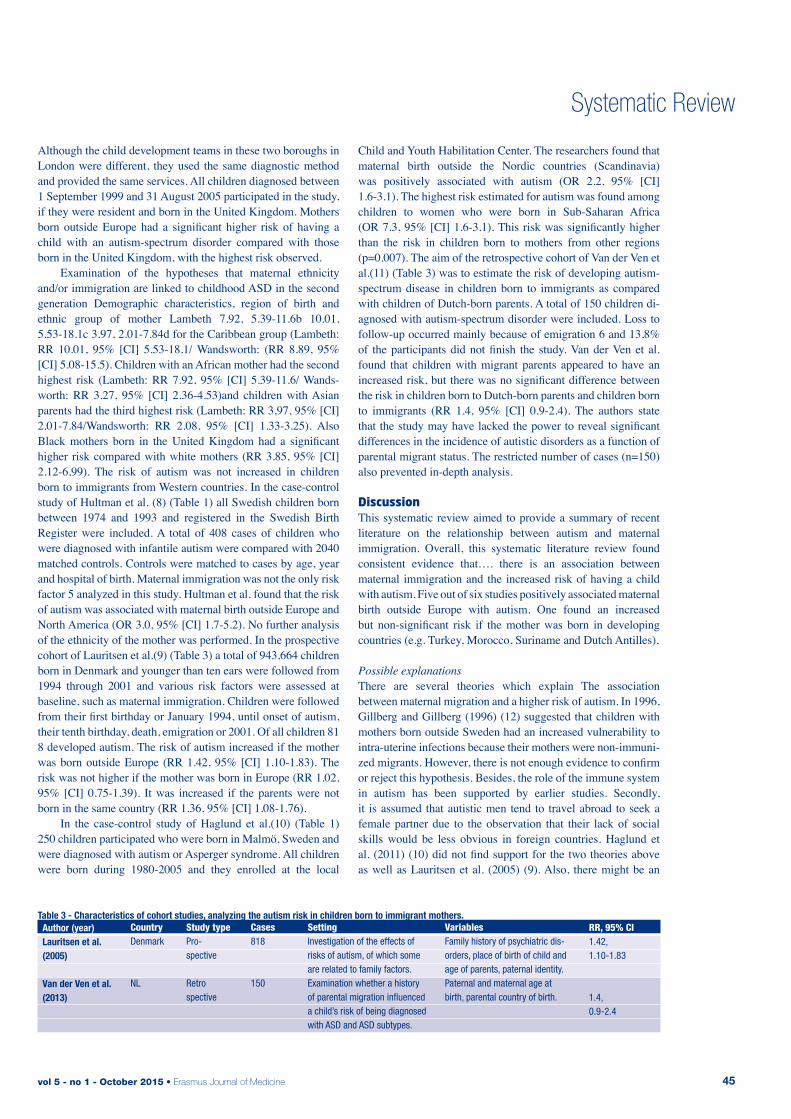
vol 5 - no 1 - October 2015 • Erasmus Journal of Medicine 45
Systematic Review
Although the child development teams in these two boroughs in London were different, they used the same diagnostic method and provided the same services. All children diagnosed between 1 September 1999 and 31 August 2005 participated in the study, if they were resident and born in the United Kingdom. Mothers born outside Europe had a significant higher risk of having a child with an autism-spectrum disorder compared with those born in the United Kingdom, with the highest risk observed. Examination of the hypotheses that maternal ethnicity and/or immigration are linked to childhood ASD in the second generation Demographic characteristics, region of birth and ethnic group of mother Lambeth 7.92, 5.39-11.6b 10.01, 5.53-18.1c 3.97, 2.01-7.84d for the Caribbean group (Lambeth: RR 10.01, 95% [CI] 5.53-18.1/ Wandsworth: (RR 8.89, 95% [CI] 5.08-15.5). Children with an African mother had the second highest risk (Lambeth: RR 7.92, 95% [CI] 5.39-11.6/ Wands-worth: RR 3.27, 95% [CI] 2.36-4.53)and children with Asian parents had the third highest risk (Lambeth: RR 3,97, 95% [CI] 2.01-7.84/Wandsworth: RR 2.08, 95% [CI] 1.33-3.25). Also Black mothers born in the United Kingdom had a significant higher risk compared with white mothers (RR 3.85, 95% [CI] 2.12-6,99). The risk of autism was not increased in children born to immigrants from Western countries. In the case-control study of Hultman et al. (8) (Table 1) all Swedish children born between 1974 and 1993 and registered in the Swedish Birth Register were included. A total of 408 cases of children who were diagnosed with infantile autism were compared with 2040 matched controls. Controls were matched to cases by age, year and hospital of birth. Maternal immigration was not the only risk factor 5 analyzed in this study. Hultman et al. found that the risk of autism was associated with maternal birth outside Europe and North America (OR 3.0, 95% [CI] 1.7-5.2). No further analysis of the ethnicity of the mother was performed. In the prospective cohort of Lauritsen et al.(9) (Table 3) a total of 943,664 children born in Denmark and younger than ten ears were followed from 1994 through 2001 and various risk factors were assessed at baseline, such as maternal immigration. Children were followed from their first birthday or January 1994, until onset of autism, their tenth birthday, death, emigration or 2001. Of all children 81 8 developed autism. The risk of autism increased if the mother was born outside Europe (RR 1.42, 95% [CI] 1.10-1.83). The risk was not higher if the mother was born in Europe (RR 1.02, 95% [CI] 0.75-1.39). It was increased if the parents were not born in the same country (RR 1.36, 95% [CI] 1.08-1.76). In the case-control study of Haglund et al.(10) (Table 1) 250 children participated who were born in Malmö, Sweden and were diagnosed with autism or Asperger syndrome. All children were born during 1980-2005 and they enrolled at the local
Child and Youth Habilitation Center. The researchers found that maternal birth outside the Nordic countries (Scandinavia) was positively associated with autism (OR 2.2, 95% [CI] 1.6-3.1). The highest risk estimated for autism was found among children to women who were born in Sub-Saharan Africa (OR 7.3, 95% [CI] 1.6-3.1). This risk was significantly higher than the risk in children born to mothers from other regions (p=0.007). The aim of the retrospective cohort of Van der Ven et al.(11) (Table 3) was to estimate the risk of developing autism-spectrum disease in children born to immigrants as compared with children of Dutch-born parents. A total of 150 children di-agnosed with autism-spectrum disorder were included. Loss to follow-up occurred mainly because of emigration 6 and 13,8% of the participants did not finish the study. Van der Ven et al. found that children with migrant parents appeared to have an increased risk, but there was no significant difference between the risk in children born to Dutch-born parents and children born to immigrants (RR 1.4, 95% [CI] 0.9-2.4). The authors state that the study may have lacked the power to reveal significant differences in the incidence of autistic disorders as a function of parental migrant status. The restricted number of cases (n=150) also prevented in-depth analysis. discussion This systematic review aimed to provide a summary of recent literature on the relationship between autism and maternal immigration. Overall, this systematic literature review found consistent evidence that…. there is an association between maternal immigration and the increased risk of having a child with autism. Five out of six studies positively associated maternal birth outside Europe with autism. One found an increased but non-significant risk if the mother was born in developing countries (e.g. Turkey, Morocco, Suriname and Dutch Antilles).
Possible explanationsThere are several theories which explain The association between maternal migration and a higher risk of autism. In 1996, Gillberg and Gillberg (1996) (12) suggested that children with mothers born outside Sweden had an increased vulnerability to intra-uterine infections because their mothers were non-immuni-zed migrants. However, there is not enough evidence to confirm or reject this hypothesis. Besides, the role of the immune systemin autism has been supported by earlier studies. Secondly, it is assumed that autistic men tend to travel abroad to seek a female partner due to the observation that their lack of social skills would be less obvious in foreign countries. Haglund et al. (2011) (10) did not find support for the two theories above as well as Lauritsen et al. (2005) (9). Also, there might be an
Table 3 - Characteristics of cohort studies, analyzing the autism risk in children born to immigrant mothers.
CountryDenmark
NL
Study typePro-spective
Retrospective
SettingInvestigation of the effects of risks of autism, of which some are related to family factors.Examination whether a history of parental migration influenced a child’s risk of being diagnosed with ASD and ASD subtypes.
Author (year)Lauritsen et al. (2005)
Van der Ven et al. (2013)
Cases818
150
RR, 95% CI1.42,1.10-1.83
1.4,0.9-2.4
VariablesFamily history of psychiatric dis-orders, place of birth of child and age of parents, paternal identity. Paternal and maternal age at birth, parental country of birth.
Table 1 - Study characteristics of case control studies, analysing the autism risk in children born to immigrant mothers.
Table 2 - Study characteristics of retrospective case note analysis, analysing the autism risk in children born to immigrant mothers.
Erasmus Journal of Medicine • vol 5 - no 1 - October 201546
association between vitamin D deficiency and autism(13), which could explain the association found in this review. Vitamin D deficiency in dark skinned immigrants is caused by a reduced exposure to sun in Northern countries and prenatal exposure to vitamin D deficiency might increase the risk of having an infant with autism.However, there is no convincing evidence that vitamin D deficiency is the main cause of the increased risk for autism in children of black women and only one of the studies examined in this systematic review could provide evidence for this hypothesis, so additional research is required. Exposure to environmental hazards in country of origin might support this relationship as well. Lehti et al. (2013), who focused on former Yugoslavia, formerSoviet Union and Vietnam, mentions these factors since these countries had been in war during their research period. One of those environmental hazards is Agent Orange, a very toxic herbicide used during the Vietnam War. Polychlorinated biphenyls (PCBs) and depleted uranium are environmental toxics used in the Balkan wars. Even though there is no evidence to support the hypothesis that exposure to these materials cause neuro developmental problems in the long term, this should be considered as a possible explanation. Further investigation is needed. Another possible explanation could be intrauterine Toxoplasmosis. Toxoplasma gondii is associated with a higher risk of schizophrenia and schizophrenia is associated with an elevated risk of autism. This risk factor has been discovered recently and may be this is the reason it was not included in any of the reviewed articles for they examined other potential hazards during pregnancy and birth. It could also be possible that the prevalence of autism is hi-gher in non-Western countries. This could explain why children of non-Western mothers are more likely to be diagnosed with autism. However, the prevalence rates of autism in non-Western countries seem lower than the incidence rates in Western coun-tries so the origin of the mothers could not explain the findings in this research. Psychosocial stress during migration is also mentioned to be a cause of this association. It has been suggested that this stress, accompanied by high maternal adrenal androgen concen-trations, is a risk factor for autism. (14) The studies examined in this review did not specifically measure the psychosocial stress and testosterone concentrations in migrants. However, this could be investigated and in order to do so the prenatal testosterone exposure should be estimated by measuring and analyzing the finger length ratio. A lower finger length ratio is associated with exposure to higher levels of androgens during the second trimester and a higher sensitivity for testosterone (15), which offers the opportunity for retrospective investigation of these levels. Children diagnosed with autism had lower finger length ratios than children without the diagnosis (16). The finger length ratio was not measured in any of the studies included in this syste-matic review. Therefore, no conclusions could be made about this explanation, based on our research.
Strengths and limitationsOne of the strengths of this systematic review is the inclusion of all available studies published in the English language over
the past fifteen years. Only articles from the pubmed/MEDLINE database were used for this review which implies that some other studies could have been missed. The limitations of the reviewedstudies define most of the limitations of our study. The investigation of Lauritsen et al. is not prone to recall bias because the diagnoses were made independently for this study by clinicians. Another strength of this study is that the risks were adjusted for confounders such as age, gender, time of diagnosis of the disorder, parental age and place of birth, except for the confounder socioeconomic status. In contrast, the outcomes in the study of Keen et al. were not adjusted for a number of variables known to be risk factors for autism. These confounders could potentially have differed between the groups of interest in the study. The risk of misclassification of the diagnosis of childhood autism in the Danish Psychiatric Central Register is believed to be very low, the possibility that some individuals with autism were missed cannot be excluded. In most studies misclassification is known to be a problem. It is more likely to occur if a child has a different cultural background than the clinician. In most studies it was unknown if the parent immigrated as a child or as an adult. Also, the reason for immigration is unknown in most studies. It could be possible that the age of the parent at the moment of migration and the reason for leaving the country of origin could affect the autism risk. Another important limitation of some of the reviewed studies was not taking all variables into account that could influence the results. Not all of the studies examined risk factors for autism such as prenatal exposure to alcohol, smoking and drugs.
Implications and future researchOne of the implications of these findings could be screening of children born to immigrant mothers. Physicians should be aware of the higher risk of autism in these children and consi-der a screening test in case they notice any atypical behavior. A routine screening test could be another option in order to diagnose patients as soon as possible. The impact of the six major factors Gardener et al.(4) mentions needs further investigation.However, maternal migrations is one of the most robust and well-studied of them. (17) Future research on the importance of this and other perinatal factors is recommended in order to identify risk groups. Studies of the etiology of autism are crucial in order to understandtheunderlying pathophysiology as the cause of au-tism remains unclear.
ConclusionsChildren with autistic disorder typically have more social, communication and cognitive delays than children with other autism-spectrum disorders(18). Therefore it is crucial to identify children with autism as soon as possible. This will have a lot ofbenefits such as earlier access to intervention programs and an early diagnosis. Also the parents will feel relieved when a diagnosis is made, as it gives them a better understanding of their child’s behavior (18). There is strong evidence that the causes of autism are multifactorial: genetic and environmental. (14) We studied one of these factors: the association between immigration of the mother and a higher risk of having a child
vol 5 - no 1 - October 2015 • Erasmus Journal of Medicine 47
with autism. In this review we described the increased risk for immigrated mothers on having a child with autism. Even though this is concluded, more research is required to define to what extent immigration causes autism, since it is clear that the disease is multifactorial.
References1. Lai MC, Lombardo MV, Baron-Cohen S. Autism. Lancet. 2014 Mar
8;383(9920):896-910.2. Blaxill MF. What’s going on? The question of time trends in autism.
Public Health Rep. 2004 Nov-Dec;119(6):536-51.3. Spek AA. [The influence of genes and environment on the develop-
ment of autism spectrum disorders] De invloed van genen en om-geving op het ontstaan van autismespectrumstoornissen. Tijdschr Psychiatr. 2014;56(10):660-7.
4. Gardener H, Spiegelman D, Buka SL. Prenatal risk factors for autism: comprehensive meta-analysis. Br J Psychiatry. 2009 Jul;195(1):7-14.
5. Begeer S, Bouk SE, Boussaid W, Terwogt MM, Koot HM. Underdi-agnosis and referral bias of autism in ethnic minorities. J Autism Dev Disord. 2009 Jan;39(1):142-8.
6. Lehti V, Hinkka-Yli-Salomaki S, Cheslack-Postava K, Gissler M, Brown AS, Sourander A. The risk of childhood autism among se-cond-generation migrants in Finland: a case-control study. BMC Pediatr. 2013;13:171.
7. Keen DV, Reid FD, Arnone D. Autism, ethnicity and maternal im-migration. Br J Psychiatry. 2010 Apr;196(4):274-81.
8. Hultman CM, Sparen P, Cnattingius S. Perinatal risk factors for infantile autism. Epidemiology. 2002 Jul;13(4):417-23.
9. Lauritsen MB, Pedersen CB, Mortensen PB. Effects of familial risk factors and place of birth on the risk of autism: a nationwide regis-ter-based study. J Child Psychol Psychiatry. 2005 Sep;46(9):963-71.
10. Haglund NG, Kallen KB. Risk factors for autism and Asper-ger syndrome. Perinatal factors and migration. Autism. 2011 Mar;15(2):163-83.
11. van der Ven E, Termorshuizen F, Laan W, Breetvelt EJ, van Os J, Selten JP. An incidence study of diagnosed autism-spectrum disor-ders among immigrants to the Netherlands. Acta Psychiatr Scand. 2013 Jul;128(1):54-60.
12. Gillberg IC, Gillberg C. Autism in immigrants: a population-based study from Swedish rural and urban areas. J Intellect Disabil Res. 1996 Feb;40 ( Pt 1):24-31.
13. Cannell JJ. Autism and vitamin D. Med Hypotheses. 2008;70(4):750-9.
14. James WH. A potential explanation of some established major risk factors for autism. Dev Med Child Neurol. 2012 Apr;54(4):301-5.
15. McIntyre MH. The use of digit ratios as markers for perinatal an-drogen action. Reprod Biol Endocrinol. 2006;4:10.
16. Manning JT, Baron-Cohen S, Wheelwright S, Sanders G. The 2nd to 4th digit ratio and autism. Dev Med Child Neurol. 2001 Mar;43(3):160-4.
17. Guinchat V, Thorsen P, Laurent C, Cans C, Bodeau N, Cohen D. Pre-, peri- and neonatal risk factors for autism. Acta Obstet Gyne-col Scand. 2012 Mar;91(3):287-300.
18. Coo H, Ouellette-Kuntz H, Lam M, Yu CT, Dewey D, Bernier FP, et al. Correlates of age at diagnosis of autism spectrum disorders in six Canadian regions. Chronic Dis Inj Can. 2012 Mar;32(2):90-100.
Erasmus Journal of Medicine • vol 5 - no 1 - October 201548
Opinion
Should financial compensation be given for living kidney donation? Stephanie de Graaff a, Ed van Beeckb
a Medical student, Erasmus MC University Medical Center Rotterdam, the Netherlandsb Supervisor, Erasmus MC University Medical Center Rotterdam, the NetherlandsCorrespondence: Stephanie de Graaff, e-mail: [email protected]
introduction Living kidney donation has taken place in the Netherlands since 1966 and has increased compared with post-mortem donation [1]. There are different types of donors: donations after brain death and donations after circulatory death, better known as heart beating and non-heart beating donors, and living organ donation. The numbers of living kidney donations is increasing and there is a stabilization in the numbers of organs from deceased donors. 18,712 kidney donations have taken place in Europe in 2011, of these donations were 20.6% (0-61%) living kidney donations [2,3]. In the Netherlands, the number of living kidney donations was 26,3 % [2]. Living donation has a major impact on the life of the donor, physically, psychologically and financially [1,4,5] and often gives a better outcome/prognosis for the receiver compared with post-mortem donation [5,6]. Should living donors be compensated for their kidney?
QuestionA person can donate a kidney with anonymous, altruistic intentions, known as the Samaritan donors or because they know someone who needs a new kidney. When a person decides to donate a kidney, they go through the living donation process. This consists of screening, surgery and the postoperative period [1]. The donor is confronted with both physical and psychological challenges associated with the operation, the risks it entails, and the long-term risks of living with one kidney. They also face the financial burden of medical expenses and will be temporarily in the Health Insurance Act. In the Netherlands, the medical costs that are incurred by the donor are reimbursed by health insurance and they are entitled to a benefit of the Health Insurance Act, which is provided by the Netherlands Employees Insurance, the “UWV”. In addition, they are eligible for an allowance, which was introduced in January 1, 2011 by the Dutch Transplant Foundation [1]. Therefore the direct expenses of the donation should be cover-ed for the donor. The Center for Ethics and Health (CEG) has suggested an additional financial stimulation, for example in the form of a lifetime exemption of health insurance premiums [7]. Through this stimulus the Centre for Ethics and Health expects more people would be willing to donate a kidney [7]. However, the Netherlands has a prohibition on the provision of
financial compensations for donation [8]. The question is whether this is reasonable for the donor. Donors help a patient with chronic kidney failure, but are then exposed to the risks of the surgery and will have to continue living with one kidney. Should kidney donors receive compensation in ex-change for their kidney donation?
Medical situationLiving donation brings risks for the donor during and after the surgery. Of these living donations, the risk of death during and immediately following surgery is the greatest. However, this risk is minimal [9-11]. In the short term there is a small risk of spleen injury, thrombosis, wound infection, bleeding and pneumonia [9,10]. It is hypothesized that long term effects are seen with declining kidney function, but the available research is inconclusive [9-11]. Some of the latest studies show that kid-ney donors have an increased long-term risk for end-stage renal disease (ESRD) compared with people who did not donated a kidney [12]. Studies have shown there is a minimal increased risk of hypertension and proteinuria [9,10]. Also, female donors have an increased risk of developing preeclampsia during preg-nancy, compared with women who have not donated a kidney [9,11]. In addition to the physical issues, living donation could psychologically affect the donor as well [9,13].
Ethical situation Beside the financial and medical aspects, living donation also involves ethical aspects. The surgeon must consider whether the improved health of the recipient can be seen as a greater benefit compared to the attendant risks faced by the donor [14]. Another ethical issue is autonomy. An individual in the Netherlands may, free of pressure and coercion from others, voluntarily register as a living kidney donor based on his or her own values. Similarly, the individual has the opportunity to withdraw at any time as a donor [1]. A third issue to consider is that of justice. Equals should be treated as equals and unequals as unequals according to Rawls’ principle of justice [15]. Therefore all people should be treated equally, also in terms of access to health care. Factors such as gender, social status or race, should not be considered when it comes to organ donation.
vol 5 - no 1 - October 2015 • Erasmus Journal of Medicine 49
Opinion
argumentationA compensation for living donation can be viewed in different ways. The compensation can be viewed as a payment for goods, which is a donated kidney in this case. It could be seen as a compensation for the lost time and the costs incurred, and it could be seen as a gift which stands for appreciation [16]. Paying non-medical expenses associated with the transplant is a possibility of paying off debt, an option which is preferred in the study of Gordon et al. [17] which investigated the change of willingness to donate in case of a financial compensation [17]. The Dutch government prohibits any form of compensation that is a direct consequence of the removal of an organ [8]. As long as there is no solution to the growing waiting lists and the associated cost from morbidity and mortality, a compensation for ethical living donation should be considered to increase the numbers of living donations!In my opinion there should be further compensation for living donation, in addition to the compensation which already exists in the Netherlands. This compensation should be provided because of the risks to which the donor is exposed. The donor indirectly promotes the welfare of the recipient and acts using the principle of beneficence. The principle of beneficence should in my view be the reason for remuneration and not the delivered organ itself. However this distinction may not be allowed under current European law. [8] It is expected that with the introduction of a compensation system the numbers of (anonymous) donations will increase and the waiting period will decrease. Ethical screening would be required as the autonomy of a donor may be compromised when an individual is financially uncertain. The form of the compensation could vary. Donors could opt for an one-time payment for their organs, they could opt for a small life time benefit either as cash or an indirect benefit such as lifetime discount on the premium. The indirect compensation is the best option as it ensures the donor is not rewarded directly or temporarily. Therefore the autonomy of the donor is less at risk. The principle of justice, which stands for division and equality, would be jeopardized if the compensation for living donation should be paid by the receiver himself. This would have the effect that only the wealthy could afford a kidney transplant. To prevent this, it should be paid by a multidisciplinary authority like the Dutch Transplant Foundation [7,18]. The costs of a kidney transplant are lower than the costs incurred annually by the chronic kidney patients on hemodialysis and peritoneal dialysis [19]. Therefore these funds could be redirected toward reimbursement of donors’ annual insurance premium. There is little evidence that shows the number of (anonymous) donations will actually increase after the introduction of a compensation. One of the reasons is that organ compensation is prohibited in many countries [8,14]. Only in Iran such a reimbursement is permitted. In 2006, there was no waiting list in Iran for kidney donation [14,20]. The data from the Iranian model do not provide sufficient evidence that compensation for living donation in the Netherlands will help shorten the waiting list. Further research is necessary [14].
ConclusionA compensation available to living kidney donors should certainly be considered in the Netherlands mainly, because it is expected that the number of (anonymous) donors will increase. This could be verified through a pilot project, where a compen-sation is offered temporarily during the duration of the pilot. The introduction of compensation does not cause a conflict with the ethical principles. Individuals remain free to choose to register as donors, whether they will receive compensation or not. By choosing an indirect compensation, such as a discount on the premium for health insurance, the principle of justice will be prevented from being jeopardized. This can also be prevented by making the financial compensation paid by a multidisciplinary authority, so rich and poor have equal chance of receiving a new kidney.Also, the medical costs, which are made in the current situation due to chronic kidney patients, can be reduced by an increase in the number of kidney transplants as a result of the increased number of donor kidneys. This could offset the costs of a compensation system.Thus compensation for living donors of kidneys should be considered.
references1. Nierstichting Nederland. Nierdonatie bij leven, informatie voor men-
sen die overwegen bij leven een nier af te staan. 2011 Febr. Available at: www.nierstichting.nl/asset/folders/nierdonatie-bij-leven.pdf.
2. Council of Europe Newsletter Transplant. International figures on donation and transplantation 2011. Rafael Matesanz (Ed), vol 17, No 1, September; 2012.:
3. Living Organ Donation in Europe Clinical Praxis. A. Lennerling et al. A part of The EULOD Project: Results and Recommendations, edited by Frederike Ambagtsheer and Willem Weimar Pabst Sci-ence Publishers, Lengerich (2013). Available at: http://www.eulod.org/?section=ExpectedResults.
4. Reimer J., Rensing A., Haasen C., et al. The impact of living-re-lated kidney transplantation on the donor’s life. Transplantation. 2006; 81: 1268-1273.
5. Thiel G. Emotionally related living kidney donation: pro and con-tra. Nephrology, dialysis, transplantation : official publication of the European Dialysis and Transplant Association - European Re-nal Association. 1997; 12: 1820-1824.
6. Kranenburg L., Zuidema W., Weimar W., et al. Postmortal or living related donor: preferences of kidney patients. Transplant interna-tional : official journal of the European Society for Organ Trans-plantation. 2005; 18: 519-523.
7. Raad voor de Volksgezondheid & Zorg Financiële stimulering van orgaandonatie Een ethische verkenning Signalering ethiek en ge-zondheid 2007/3 Den Haag: Centrum voor ethiek en gezondheid. Available at: http://wwwcegnl/publicaties/jaar/2007.
8. Nederlandse overheid. Wet op de Orgaandonatie, artikel 2. Mei 1996.:
9. Delanaye P., Weekers L., Dubois B.E., et al. Outcome of the living kidney donor. Nephrology, dialysis, transplantation : official publi-cation of the European Dialysis and Transplant Association - Eu-ropean Renal Association. 2012; 27: 41-50.
10. Sommerer C., Morath C., Andrassy J., et al. The long-term conse-quences of living-related or unrelated kidney donation. Nephro-logy, dialysis, transplantation : official publication of the European Dialysis and Transplant Association - European Renal Associati-on. 2004; 19 Suppl 4: iv45-47.
Erasmus Journal of Medicine • vol 5 - no 1 - October 201550
11. Morgan B.R., Ibrahim H.N. Long-term outcomes of kidney donors. Current opinion in nephrology and hypertension. 2011; 20: 605-609.
12. Mjoen G., Hallan S., Hartmann A., et al. Long-term risks for kid-ney donors. Kidney international. 2014; 86: 162-167.
13. Fournier C., Pallet N., Cherqaoui Z., et al. Very long-term follow-up of living kidney donors. Transplant international : official jour-nal of the European Society for Organ Transplantation. 2012; 25: 385-390.
14. Ghods A.J. Ethical issues and living unrelated donor kidney trans-plantation. Iranian journal of kidney diseases. 2009; 3: 183-191.
15. G. Hawley. Ethiek In De Klinische Praktijk. Amsterdam: Pearson Education Benelux; 2009. p. 106. .
16. de Castro L.D. Commodification and exploitation: arguments in favour of compensated organ donation. Journal of medical ethics. 2003; 29: 142-146.
Opinion
17. Gordon E.J., Patel C.H., Sohn M.W., et al. Does financial compen-sation for living kidney donation change willingness to donate? American journal of transplantation : official journal of the Ameri-can Society of Transplantation and the American Society of Trans-plant Surgeons. 2015; 15: 265-273.
18. Friedman A.L. Payment for living organ donation should be lega-lised. Bmj. 2006; 333: 746-748.
19. Laupacis A., Keown P., Pus N., et al. A study of the quality of life and cost-utility of renal transplantation. Kidney international. 1996; 50: 235-242.
20. Ghods A.J., Savaj S. Iranian model of paid and regulated living-unrelated kidney donation. Clinical journal of the American Soci-ety of Nephrology : CJASN. 2006; 1: 1136-1145.
vol 5 - no 1 - October 2015 • Erasmus Journal of Medicine 51
Clinical Image
the increasing use of computed tomography to assess body composition and its clinical relevanceTim A. Trenninga*, Arvind Gharbharana*, Stef Levolgerb, Jeroen L.A. van Vugtb
a Medical students, Erasmus University Medical Center, Rotterdam, the Netherlandsb Supervisor, Department of Surgery, Erasmus University Medical Center, Rotterdam, the Netherlands* Contributed equally to this manuscriptCorrespondence: Arvind Gharbharan, e-mail: [email protected]
abstractDeviations in body composition (subcutaneous fat, visceral fat, and skeletal muscle), that can occur independently of body mass index (BMI), are considered risk factors for impaired outcome in patients with various benign and malignant diseases. In recent years, new techniques have been developed to accurately measure body composition. One of these methods uses single-slice computed tomography (CT)-scans to measure both skeletal muscle and adipose tissue. It has been shown that this method correlates with the total body muscle and fat mass. Determining low skeletal muscle mass using CT-scans during oncological workup could provide options for interventions to optimize the physical condition, for example in patients scheduled for oncological resection.
introduction The body mass index (BMI) is widely used in population based studies and to categorize individual’s weight. The BMI is an attractive measure, as it is an easily obtainable, cheap, and non-invasive tool for assessing excess body fat. However, its weakness lies herein. BMI is a proxy measure and does not take distinct body composition elements into account (e.g. skeletal muscle tissue or adipose tissue). This may be one reason that BMI fails to accurately predict postoperative outcome(1). In recent years, body composition (i.e. subcutaneous adipose tissue, visceral adipose tissue and skeletal muscle tissue) has extensively been studied as predictor for outcome following for example oncological treatment(2), transplant surgery(3, 4), emergency surgery(5), intensive care unit (ICU) admission(6), trauma(7), and vascular surgery(8). Deviations in these components, which can also occur within a normal weight range or BMI, are associated with individual risk and reduced survival in patients with various benign and malignant diseases(9). Visceral adipose tissue differs from subcutaneous adipose tissue in that it is more metabolically active(9, 10). A high proportion of visceral adipose tissue is related to a chronic inflammatory state and the metabolic syndrome(11).
Depletion of skeletal muscle mass and reduction of muscle function, which is called sarcopenia (from the Greek sarx [i.e. flesh] and penia [i.e. lack of]), is a phenomenon that occurs indepen-dently of BMI. Sarcopenia was first described in geriatric patient populations(12) and is related to frailty (i.e. a status leading to an impaired reaction to stressors) and functional impairment in the elderly(13). The distribution of different tissue compartments can be misbalanced. Patients with sarcopenic obesity, for example, have both risk factors of low muscle mass and a high BMI, resulting from a high proportion of adipose tissue(14). Consequently, sarcopenia can be an occult phenomenon. This emphasizes the importance of body composition measuring techniques compared with BMI (15, 16). Computed tomography (CT) and magnetic resonance imaging (MRI) are known for their specificity and precision regarding body imaging. In recent years, it has come to ligh that it is possible to accurately measure body composition using these techniques. Parameters resulting from these measurements have extensively been validated and applied(16). Prado et al. were the first to investigate the association between CT-assessed skeletal muscle mass and outcome in oncological patients in 2008(2) and hereby introduced the term sarcopenia in oncology. In this article we will discuss some of the novel findings in this area of research, with emphasis on oncological populations. Measuring body composition A suitable, precise method which is applicable on a large scale and with high specificity was wanted to perform body composition analyses. Between 1979 and 1981, Heymsfield et al. reported the use of CT to measure skeletal muscle and visceral adipose tissue mass(17). In 1986, Kvist et al. were the first to assess whole-body adipose tissue volumes with CT, using just several slices(18). A standardized part of the body with images at specific skeletal landmarks were chosen(16).
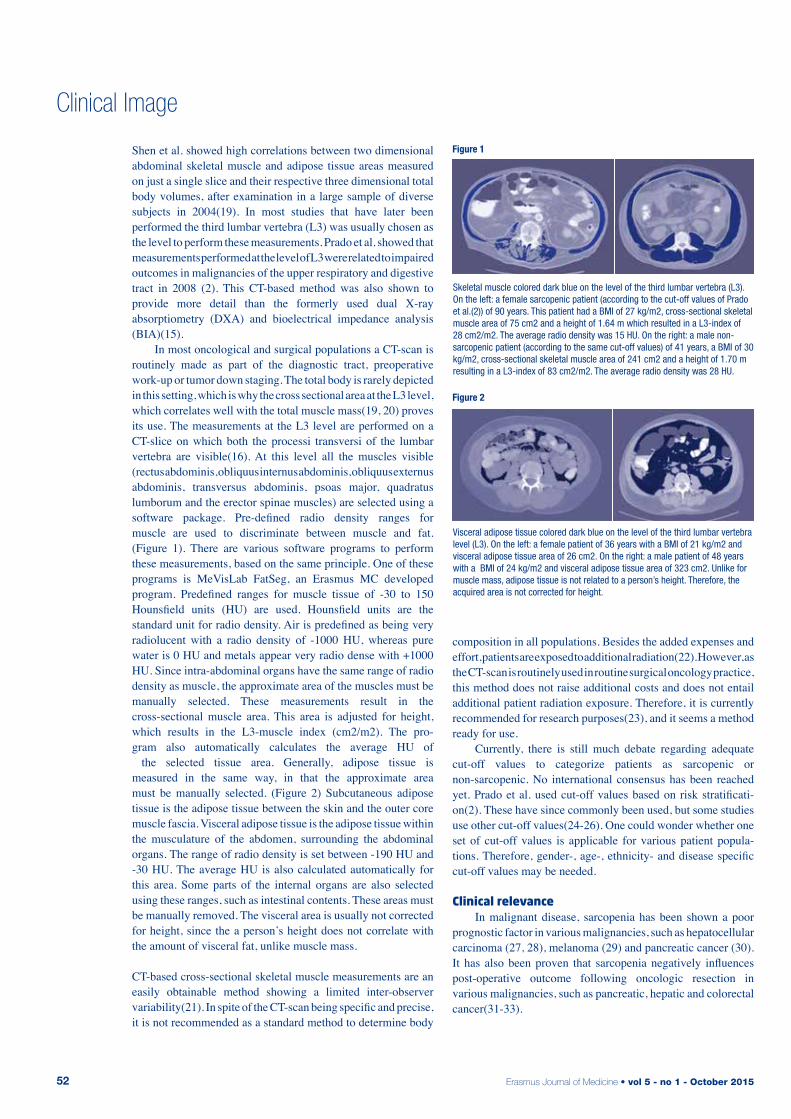
Erasmus Journal of Medicine • vol 5 - no 1 - October 201552
Shen et al. showed high correlations between two dimensional abdominal skeletal muscle and adipose tissue areas measured on just a single slice and their respective three dimensional total body volumes, after examination in a large sample of diverse subjects in 2004(19). In most studies that have later been performed the third lumbar vertebra (L3) was usually chosen as the level to perform these measurements. Prado et al. showed that measurements performed at the level of L3 were related to impaired outcomes in malignancies of the upper respiratory and digestive tract in 2008 (2). This CT-based method was also shown to provide more detail than the formerly used dual X-ray absorptiometry (DXA) and bioelectrical impedance analysis (BIA)(15). In most oncological and surgical populations a CT-scan is routinely made as part of the diagnostic tract, preoperative work-up or tumor down staging. The total body is rarely depicted in this setting, which is why the cross sectional area at the L3 level, which correlates well with the total muscle mass(19, 20) proves its use. The measurements at the L3 level are performed on a CT-slice on which both the processi transversi of the lumbar vertebra are visible(16). At this level all the muscles visible (rectus abdominis, obliquus internus abdominis, obliquus externus abdominis, transversus abdominis, psoas major, quadratus lumborum and the erector spinae muscles) are selected using a software package. Pre-defined radio density ranges for muscle are used to discriminate between muscle and fat. (Figure 1). There are various software programs to perform these measurements, based on the same principle. One of these programs is MeVisLab FatSeg, an Erasmus MC developed program. Predefined ranges for muscle tissue of -30 to 150 Hounsfield units (HU) are used. Hounsfield units are the standard unit for radio density. Air is predefined as being very radiolucent with a radio density of -1000 HU, whereas pure water is 0 HU and metals appear very radio dense with +1000 HU. Since intra-abdominal organs have the same range of radio density as muscle, the approximate area of the muscles must be manually selected. These measurements result in the cross-sectional muscle area. This area is adjusted for height, which results in the L3-muscle index (cm2/m2). The pro-gram also automatically calculates the average HU of the selected tissue area. Generally, adipose tissue is measured in the same way, in that the approximate area must be manually selected. (Figure 2) Subcutaneous adipose tissue is the adipose tissue between the skin and the outer core muscle fascia. Visceral adipose tissue is the adipose tissue within the musculature of the abdomen, surrounding the abdominal organs. The range of radio density is set between -190 HU and -30 HU. The average HU is also calculated automatically for this area. Some parts of the internal organs are also selected using these ranges, such as intestinal contents. These areas must be manually removed. The visceral area is usually not corrected for height, since the a person’s height does not correlate with the amount of visceral fat, unlike muscle mass.
CT-based cross-sectional skeletal muscle measurements are an easily obtainable method showing a limited inter-observer variability(21). In spite of the CT-scan being specific and precise, it is not recommended as a standard method to determine body
composition in all populations. Besides the added expenses and effort, patients are exposed to additional radiation(22). However, as the CT-scan is routinely used in routine surgical oncology practice, this method does not raise additional costs and does not entail additional patient radiation exposure. Therefore, it is currently recommended for research purposes(23), and it seems a method ready for use. Currently, there is still much debate regarding adequate cut-off values to categorize patients as sarcopenic or non-sarcopenic. No international consensus has been reached yet. Prado et al. used cut-off values based on risk stratificati-on(2). These have since commonly been used, but some studies use other cut-off values(24-26). One could wonder whether one set of cut-off values is applicable for various patient popula-tions. Therefore, gender-, age-, ethnicity- and disease specific cut-off values may be needed. Clinical relevance In malignant disease, sarcopenia has been shown a poor prognostic factor in various malignancies, such as hepatocellular carcinoma (27, 28), melanoma (29) and pancreatic cancer (30). It has also been proven that sarcopenia negatively influences post-operative outcome following oncologic resection in various malignancies, such as pancreatic, hepatic and colorectal cancer(31-33).
Clinical Image
Skeletal muscle colored dark blue on the level of the third lumbar vertebra (L3). On the left: a female sarcopenic patient (according to the cut-off values of Prado et al.(2)) of 90 years. This patient had a BMI of 27 kg/m2, cross-sectional skeletal muscle area of 75 cm2 and a height of 1.64 m which resulted in a L3-index of 28 cm2/m2. The average radio density was 15 HU. On the right: a male non-sarcopenic patient (according to the same cut-off values) of 41 years, a BMI of 30 kg/m2, cross-sectional skeletal muscle area of 241 cm2 and a height of 1.70 m resulting in a L3-index of 83 cm2/m2. The average radio density was 28 HU.
Visceral adipose tissue colored dark blue on the level of the third lumbar vertebra level (L3). On the left: a female patient of 36 years with a BMI of 21 kg/m2 and visceral adipose tissue area of 26 cm2. On the right: a male patient of 48 years with a BMI of 24 kg/m2 and visceral adipose tissue area of 323 cm2. Unlike for muscle mass, adipose tissue is not related to a person’s height. Therefore, the acquired area is not corrected for height.
Figure 1
Figure 2
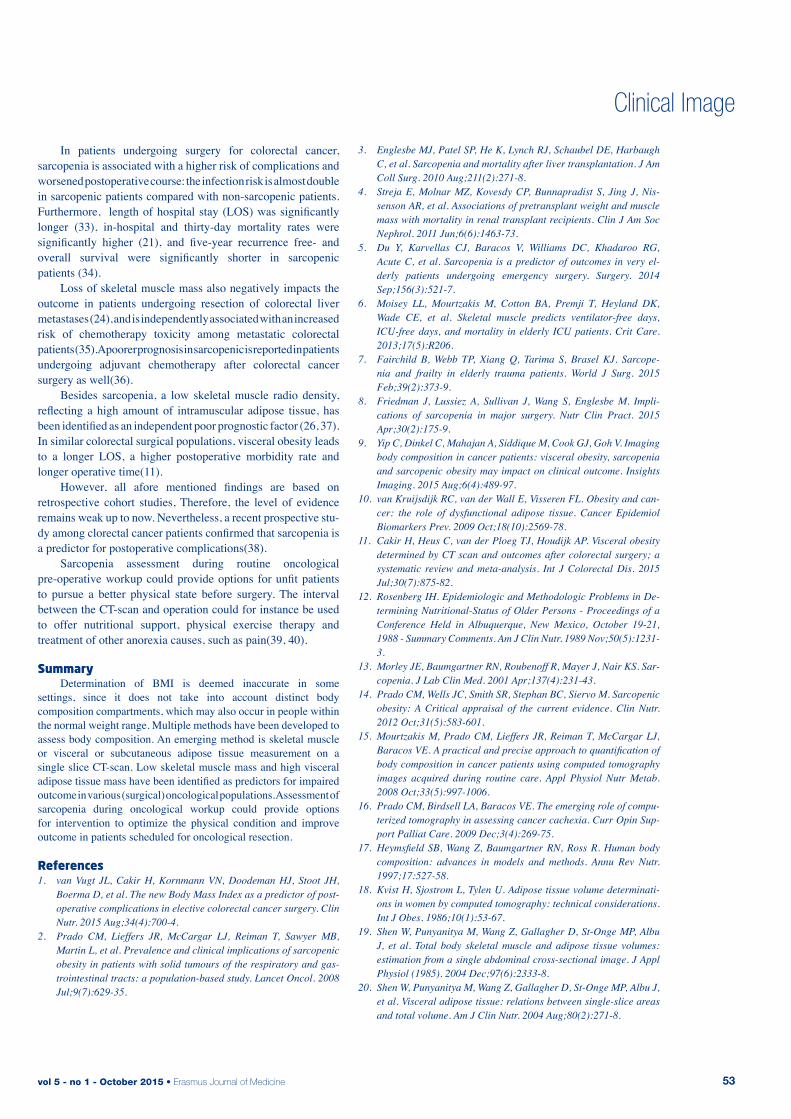
vol 5 - no 1 - October 2015 • Erasmus Journal of Medicine 53
Clinical Image
In patients undergoing surgery for colorectal cancer, sarcopenia is associated with a higher risk of complications and worsened postoperative course: the infection risk is almost double in sarcopenic patients compared with non-sarcopenic patients. Furthermore, length of hospital stay (LOS) was significantly longer (33), in-hospital and thirty-day mortality rates were significantly higher (21), and five-year recurrence free- and overall survival were significantly shorter in sarcopenic patients (34). Loss of skeletal muscle mass also negatively impacts the outcome in patients undergoing resection of colorectal liver metastases (24), and is independently associated with an increased risk of chemotherapy toxicity among metastatic colorectal patients (35). A poorer prognosis in sarcopenic is reported in patients undergoing adjuvant chemotherapy after colorectal cancer surgery as well(36). Besides sarcopenia, a low skeletal muscle radio density, reflecting a high amount of intramuscular adipose tissue, has been identified as an independent poor prognostic factor (26, 37). In similar colorectal surgical populations, visceral obesity leads to a longer LOS, a higher postoperative morbidity rate and longer operative time(11). However, all afore mentioned findings are based on retrospective cohort studies, Therefore, the level of evidence remains weak up to now. Nevertheless, a recent prospective stu-dy among clorectal cancer patients confirmed that sarcopenia is a predictor for postoperative complications(38). Sarcopenia assessment during routine oncological pre-operative workup could provide options for unfit patients to pursue a better physical state before surgery. The interval between the CT-scan and operation could for instance be used to offer nutritional support, physical exercise therapy and treatment of other anorexia causes, such as pain(39, 40). Summary Determination of BMI is deemed inaccurate in some settings, since it does not take into account distinct body composition compartments, which may also occur in people within the normal weight range. Multiple methods have been developed to assess body composition. An emerging method is skeletal muscle or visceral or subcutaneous adipose tissue measurement on a single slice CT-scan. Low skeletal muscle mass and high visceral adipose tissue mass have been identified as predictors for impaired outcome in various (surgical) oncological populations. Assessment of sarcopenia during oncological workup could provide options for intervention to optimize the physical condition and improve outcome in patients scheduled for oncological resection. references1. van Vugt JL, Cakir H, Kornmann VN, Doodeman HJ, Stoot JH,
Boerma D, et al. The new Body Mass Index as a predictor of post-operative complications in elective colorectal cancer surgery. Clin Nutr. 2015 Aug;34(4):700-4.
2. Prado CM, Lieffers JR, McCargar LJ, Reiman T, Sawyer MB, Martin L, et al. Prevalence and clinical implications of sarcopenic obesity in patients with solid tumours of the respiratory and gas-trointestinal tracts: a population-based study. Lancet Oncol. 2008 Jul;9(7):629-35.
3. Englesbe MJ, Patel SP, He K, Lynch RJ, Schaubel DE, Harbaugh C, et al. Sarcopenia and mortality after liver transplantation. J Am Coll Surg. 2010 Aug;211(2):271-8.
4. Streja E, Molnar MZ, Kovesdy CP, Bunnapradist S, Jing J, Nis-senson AR, et al. Associations of pretransplant weight and muscle mass with mortality in renal transplant recipients. Clin J Am Soc Nephrol. 2011 Jun;6(6):1463-73.
5. Du Y, Karvellas CJ, Baracos V, Williams DC, Khadaroo RG, Acute C, et al. Sarcopenia is a predictor of outcomes in very el-derly patients undergoing emergency surgery. Surgery. 2014 Sep;156(3):521-7.
6. Moisey LL, Mourtzakis M, Cotton BA, Premji T, Heyland DK, Wade CE, et al. Skeletal muscle predicts ventilator-free days, ICU-free days, and mortality in elderly ICU patients. Crit Care. 2013;17(5):R206.
7. Fairchild B, Webb TP, Xiang Q, Tarima S, Brasel KJ. Sarcope-nia and frailty in elderly trauma patients. World J Surg. 2015 Feb;39(2):373-9.
8. Friedman J, Lussiez A, Sullivan J, Wang S, Englesbe M. Impli-cations of sarcopenia in major surgery. Nutr Clin Pract. 2015 Apr;30(2):175-9.
9. Yip C, Dinkel C, Mahajan A, Siddique M, Cook GJ, Goh V. Imaging body composition in cancer patients: visceral obesity, sarcopenia and sarcopenic obesity may impact on clinical outcome. Insights Imaging. 2015 Aug;6(4):489-97.
10. van Kruijsdijk RC, van der Wall E, Visseren FL. Obesity and can-cer: the role of dysfunctional adipose tissue. Cancer Epidemiol Biomarkers Prev. 2009 Oct;18(10):2569-78.
11. Cakir H, Heus C, van der Ploeg TJ, Houdijk AP. Visceral obesity determined by CT scan and outcomes after colorectal surgery; a systematic review and meta-analysis. Int J Colorectal Dis. 2015 Jul;30(7):875-82.
12. Rosenberg IH. Epidemiologic and Methodologic Problems in De-termining Nutritional-Status of Older Persons - Proceedings of a Conference Held in Albuquerque, New Mexico, October 19-21, 1988 - Summary Comments. Am J Clin Nutr. 1989 Nov;50(5):1231-3.
13. Morley JE, Baumgartner RN, Roubenoff R, Mayer J, Nair KS. Sar-copenia. J Lab Clin Med. 2001 Apr;137(4):231-43.
14. Prado CM, Wells JC, Smith SR, Stephan BC, Siervo M. Sarcopenic obesity: A Critical appraisal of the current evidence. Clin Nutr. 2012 Oct;31(5):583-601.
15. Mourtzakis M, Prado CM, Lieffers JR, Reiman T, McCargar LJ, Baracos VE. A practical and precise approach to quantification of body composition in cancer patients using computed tomography images acquired during routine care. Appl Physiol Nutr Metab. 2008 Oct;33(5):997-1006.
16. Prado CM, Birdsell LA, Baracos VE. The emerging role of compu-terized tomography in assessing cancer cachexia. Curr Opin Sup-port Palliat Care. 2009 Dec;3(4):269-75.
17. Heymsfield SB, Wang Z, Baumgartner RN, Ross R. Human body composition: advances in models and methods. Annu Rev Nutr. 1997;17:527-58.
18. Kvist H, Sjostrom L, Tylen U. Adipose tissue volume determinati-ons in women by computed tomography: technical considerations. Int J Obes. 1986;10(1):53-67.
19. Shen W, Punyanitya M, Wang Z, Gallagher D, St-Onge MP, Albu J, et al. Total body skeletal muscle and adipose tissue volumes: estimation from a single abdominal cross-sectional image. J Appl Physiol (1985). 2004 Dec;97(6):2333-8.
20. Shen W, Punyanitya M, Wang Z, Gallagher D, St-Onge MP, Albu J, et al. Visceral adipose tissue: relations between single-slice areas and total volume. Am J Clin Nutr. 2004 Aug;80(2):271-8.
Erasmus Journal of Medicine • vol 5 - no 1 - October 201554
Clinical Image
21. Reisinger KW, van Vugt JL, Tegels JJ, Snijders C, Hulsewe KW, Hoofwijk AG, et al. Functional compromise reflected by sarcope-nia, frailty, and nutritional depletion predicts adverse postope-rative outcome after colorectal cancer surgery. Ann Surg. 2015 Feb;261(2):345-52.
22. Walsh L, Shore R, Auvinen A, Jung T, Wakeford R. Risks from CT scans--what do recent studies tell us? J Radiol Prot. 2014 Mar;34(1):E1-5.
23. Fearon K, Strasser F, Anker SD, Bosaeus I, Bruera E, Fainsinger RL, et al. Definition and classification of cancer cachexia: an inter-national consensus. Lancet Oncol. 2011 May;12(5):489-95.
24. van Vledder MG, Levolger S, Ayez N, Verhoef C, Tran TC, Ijzer-mans JN. Body composition and outcome in patients under-going resection of colorectal liver metastases. Br J Surg. 2012 Apr;99(4):550-7.
25. Coelen RJ, Wiggers JK, Nio CY, Besselink MG, Busch OR, Gouma DJ, et al. Preoperative computed tomography assessment of skele-tal muscle mass is valuable in predicting outcomes following he-patectomy for perihilar cholangiocarcinoma. HPB (Oxford). 2015 Jun;17(6):520-8.
26. Martin L, Birdsell L, Macdonald N, Reiman T, Clandinin MT, Mc-Cargar LJ, et al. Cancer cachexia in the age of obesity: skeletal muscle depletion is a powerful prognostic factor, independent of body mass index. J Clin Oncol. 2013 Apr 20;31(12):1539-47.
27. Iritani S, Imai K, Takai K, Hanai T, Ideta T, Miyazaki T, et al. Ske-letal muscle depletion is an independent prognostic factor for he-patocellular carcinoma. J Gastroenterol. 2015 Mar;50(3):323-32.
28. Voron T, Tselikas L, Pietrasz D, Pigneur F, Laurent A, Compagnon P, et al. Sarcopenia Impacts on Short- and Long-term Results of Hepatectomy for Hepatocellular Carcinoma. Ann Surg. 2014 Jun 19.
29. Sabel MS, Lee J, Cai S, Englesbe MJ, Holcombe S, Wang S. Sarc-openia as a prognostic factor among patients with stage III mela-noma. Ann Surg Oncol. 2011 Dec;18(13):3579-85.
30. Tan BH, Birdsell LA, Martin L, Baracos VE, Fearon KC. Sarc-openia in an overweight or obese patient is an adverse prog-nostic factor in pancreatic cancer. Clin Cancer Res. 2009 Nov 15;15(22):6973-9.
31. Peng P, Hyder O, Firoozmand A, Kneuertz P, Schulick RD, Huang D, et al. Impact of sarcopenia on outcomes following re-section of pancreatic adenocarcinoma. J Gastrointest Surg. 2012 Aug;16(8):1478-86.
32. Itoh S, Shirabe K, Matsumoto Y, Yoshiya S, Muto J, Harimoto N, et al. Effect of body composition on outcomes after hepatic resection for hepatocellular carcinoma. Ann Surg Oncol. 2014 Sep;21(9):3063-8.
33. Lieffers JR, Bathe OF, Fassbender K, Winget M, Baracos VE. Sar-copenia is associated with postoperative infection and delayed re-covery from colorectal cancer resection surgery. Br J Cancer. 2012 Sep 4;107(6):931-6.
34. Miyamoto Y, Baba Y, Sakamoto Y, Ohuchi M, Tokunaga R, Kura-shige J, et al. Sarcopenia is a Negative Prognostic Factor After Curative Resection of Colorectal Cancer. Ann Surg Oncol. 2015 Aug;22(8):2663-8.
35. Barret M, Antoun S, Dalban C, Malka D, Mansourbakht T, Zaanan A, et al. Sarcopenia is linked to treatment toxicity in patients with metastatic colorectal cancer. Nutr Cancer. 2014;66(4):583-9.
36. Jung HW, Kim JW, Kim JY, Kim SW, Yang HK, Lee JW, et al. Ef-fect of muscle mass on toxicity and survival in patients with colon cancer undergoing adjuvant chemotherapy. Support Care Cancer. 2015 Mar;23(3):687-94.
37. Chu MP, Lieffers J, Ghosh S, Belch AR, Chua NS, Fontaine A, et al. Skeletal muscle radio-density is an independent predictor of res-ponse and outcomes in follicular lymphoma treated with chemoim-munotherapy. PLoS One. 2015;10(6):e0127589.
38. Huang DD, Wang SL, Zhuang CL, Zheng BS, Lu JX, Chen FF, et al. Sarcopenia, as defined by low muscle mass, strength and phy-sical performance, predicts complications after colorectal cancer surgery. Colorectal Dis. 2015 Jul 20.
39. van Vugt JL, Braam HJ, van Oudheusden TR, Vestering A, Bol-len TL, Wiezer MJ, et al. Skeletal Muscle Depletion is Associated with Severe Postoperative Complications in Patients Undergoing Cytoreductive Surgery with Hyperthermic Intraperitoneal Chemo-therapy for Peritoneal Carcinomatosis of Colorectal Cancer. Ann Surg Oncol. 2015 Feb 12.
40. Fearon K, Arends J, Baracos V. Understanding the mechanisms and treatment options in cancer cachexia. Nat Rev Clin Oncol. 2013 Feb;10(2):90-9.
vol 5 - no 1 - October 2015 • Erasmus Journal of Medicine 55
Instructions for EJM authors
For the convenience of our future contributors and our readers, we publish here the advice we give to our reviewers.
In the process of reviewing a paper, please refer to the following points:
• Your first step should be to evaluate your relationship with the authors. To ensure the credibility of the process, reviewers should not have a conflict of interest with the authors. If this is a case, the paper should be appointed to other reviewers. Please keep us informed whether conflict of interest is an issue for you as an appointed reviewer.
• Is this work relevant and interesting for EJM? • Are the objectives appropriate and clearly stated?• Are the data valid?• Are the conclusions valid and properly supported?• Is the already existing work described adequately?• Paper structure/organization; is this logical?• Does abstract clearly convey meaning of the paper?• Is the paper well written and can be easily understood?
(Please keep in mind that students don’t have the experience to reed throughout the paper very quickly and to understand everything in a research paper at the first glance)
• Are all sections really needed, or could they be shortened?• Is the science reliable? Please, be aware of ethical issues
such as plagiarism! Comments should be detailed and specific. Mentoring the authors includes helping authors improve their paper under review even if these papers will/could not be accepted for publication in our journal. By careful reviewing, you will help improving the quality of papers published elsewhere too. Avoid vague complaints and provide appropriate citations if authors are unaware of the relevant work.
Please consider a manuscript received for reviewing as a confidential document and do not discuss the content of this paper with others. To maintain the validity of this process, you should never contact the authors about the paper under review. The review process serves two important goals: providing guidance to the authors to improve the quality of their paper, and providing the editor or editorial board with valuable recommendations regarding the acceptance or rejection of the peer-reviewed papers (along the whole spectrum of major revision- minor revision- rejection). So it is important that you give comments to the authors, and to the editor in separate sections. Please use the provided form, because this makes life easier for you, the editor and the authors. EJM is committed to rapid editorial decisions and publication. We request that reviewers return their comments within the time indicated at invitation. If any unanticipated difficulties arise that may prevent you from submitting the review on time, contact us by sending an email to the editorial office at [email protected]. You are welcome to contact us if you have any questions. For more information about guidelines for the review process, please visit our website: www.erasmusmc.nl/ejm. We also recommend you to view the presentations of the EJM workshop on our website. Here you can find instructions about how to scan through a paper and grab its essence, and how to structure your comments to the authors and to the editor.
July 2014, Editorial board of Erasmus Journal of Medicine.
advice to the reviewers of EJM
Erasmus Journal of Medicine • vol 5 - no 1 - October 201556
Instructions for EJM authors
GeneralThe instructions that follow have several purposes. First, we want to make life easy for you, the authors, and for the editors and peer reviewers, the layout (prepress) people, and the journal readers. The section Authors instructions storyline, on the website (www.erasmusmc.nl/erasmusjournalofmedicine) will help you to organize your article in a logical, credible and readable way. This will help you - it tells you what goes where—and, thus, save you time. It will help the editors and peer reviewers—they will easily see the credibility and relevance of your work— and, thus, save them from writing rejection letters. And, it will help readers to quickly and easily read and understand your work and see its value. The section entitled Formatting Instructions will help you as well; the basic idea is to keep the formatting as simple as possible, so you can focus on content and not get involved with layout. The language editor and the prepress people will also be able to more efficiently do their jobs. Please follow these instructions. Please be aware that we will have to return papers that do not conform to these instructions to the authors.
What you can enterResearch news - Research articles describe one study or analysis, usually from an elective research project or one of the masters programs. Number of words: max. 3500 + 4 figures or tables.Extended abstracts - Extended abstracts consist of a condensed presentation of final or preliminary results of a study. Extended abstracts can concern ongoing research that is not yet published elsewhere which is comparable with a congress presentation thus does not require copyright transfer. An extended abstract can also be submitted after publication in another Journal if possible with extra figures, this does require proper referencing. Number of words: 350 words + 1 figure or table. Research papers - Here researchers or teachers describe ongoing research projects at the Erasmus Medical centre for which they want to invite students to participate. Number of words: 350. Systematic reviews - A systematic review is a literature review focused on a research question that tries to identify, appraise, select and synthesize all high quality research evidence relevant to that question in a quantitative way. Systematic reviews of high-quality randomized controlled trials are crucial to evidence-based medicine, and are considered very important by the editorial board of EJM. Besides health interventions, systematic reviews may concern clinical tests, public health interventions, social interventions, adverse effects, and economic evaluations. Number of words: 3000 + 3 figures or tables.
Opinion papers - These are papers that reflect the opinion of the author on a scientific topic. The author should be clear where evidence ends and personal opinion starts. A paper typically has a length of about 1000 words.Clinical lesson/question - A clinical lesson should present a scenario and a concrete related question about a disease or condition, the article should elaborate on possible approaches or treatment options for this disease or condition. Conclusion should provice a solid evidence based conclusion on the preferred approach or treatment. Number of words: 1000 + 1 figure or table. Case reports - A case report consists of the initial presentation, medical history, examination, tests performed, eventual outcome and discussion on the case backed up by scientific literature. Number of words: 900 + 1 figure or table.
Clinical quiz - A clinical quiz should present a scenario and a concrete related question about the disease or condition, preferably accompanied by a clinical image, and four plausible treatment options or courses of action. Conclusion should elaborate on which is the correct option and why. Number of words: 600 + 1 figure or table. Clinical images - Clinical images should present a typical abnormality on a photograph/imaging tests of a patient or on an additional investigation. It must be accompanied by an elaboration on the clinical diagnosis. Number of words: 350 + 1 figure. Make sure that the patient is not identifiable or that the data presented traceable to the patient. Additionally, written consent should be obtained from presented patient. We expect the author to refer to scientific literature to back up their case presentations.Comments - In this section editors, or faculty staff, as well students are invited to write a short critical comment on a paper, putting it into perspective for a broader medical public readership. Number of words: 350.Letters to the editor - The editorial board encourages students to write a letter to the editor to comment on published papers, or on the journal in general. These will be published on the website of the journal. Letters should not exceed 200 words and may be abbreviated by the editor.
the review processPapers may be submitted to the editorial office. Please indicate which author will act as corresponding author. We expect this author to maintain contact with the other authors and to speak and decide on their behalf. Each paper will be assigned to a team consisting of a managing editor and an associate editor. Each submitted paper will be checked for compliance with the author instructions. If this is not the case, the paper may be returned to the author.
instructions for EJM authors
vol 5 - no 1 - October 2015 • Erasmus Journal of Medicine 57
Instructions for EJM authors
When the paper is taken into review, it will be sent out to two external reviewers, a student and a staff member of Erasmus MC. Based upon these reviewers comments, their recommendations and the opinion of the editorial team, a decision will be made: reject, major revision, minor revision, accept with or without minor changes. The paper will then be returned to the corresponding author, along with the recommendation. We try to return papers within 3 weeks after submission. When a paper is rejected, it cannot be resubmitted, but we encourage resubmissions when we recommend major or minor changes to a paper. Resubmitted paper will be reviewed again by the same reviewers and editorial team. Before a paper can be accepted for publication, we will need a statement that the staff member that supervised your work agrees with the submission of your paper. Moreover, we need a signed Copyright Transfer Agreement (CTA) and a signed Conflict of Interest statement. When your research project involves patients or volunteers, we need a statement in the paper that the research protocol has been reviewed by a Medical Ethics Committee. Failure to provide this information at an early stage of the submission may impair the review process. When a paper is accepted for publication, it will often be forwarded to our language editing and restructuring editors. They will each in turn give recommendations and ask the author adapt the paper accordingly. When this phase is completed, the paper will be forwarded to the publisher. Page proofs will be sent to the author for a final check.
Formatting instructionsEntry format - Papers should be submitted by email, [email protected]. Word 2007 files are preferred for the initial submission. The file should include all figures and tables. Title page - The title page should clearly identify the authors, the institute where the research project was carried out, as well as the staff member who supervised the project. The corresponding author name (first name and family name), email address, student id, should be clearly indicated. In case of multiple authors, state functions and departments only in superscript in alphabetical order.
Example:First name A.G. Family namea and First name W.F. Family namea Supervisor: First name R. Lastnameb
a Medical students, Erasmus MC University Medical Center Rotterdam, the Netherlands
b Dept. of Internal Medicine, Erasmus MC University Medical Center Rotterdam, the Netherlands
Correspondence: First name A.G. Family name, email: [email protected].
Structure - Please use the following sections in all papers (except in comments and opinion papers): Abstract, Introduction, Methods, Results, Discussion, References, Tables, Figures.References - Number references in order of appearance.References should have the following format:Rothwell, P. M. Medical and surgical management of symptomatic carotid stenosis. Int J Stroke. 2006; 1: 140-149. (I.e. year;vol:ppp-ppp) In case of more than 3 authors, name the first 3 and insert “et al.”. Limit the number of references to 30. References should appear in the text as follows: “… treatment is of proven benefit.[1]”Tables and figures - Tables and illustrations (both numbered in Arabic numerals) should be prepared on separate pages. Number tables and figures separately and consecutively. Tables require a heading and figures a legend, also prepared on a separate page and should be formatted with a text editor (example). Figures should be submitted electronically. B/w half-tone and color illustrations must have a final resolution of 300 dpi after scaling, line drawings one of 800-1,200 dpi (jpg and tiff is an acceptable format). Please note that all color-figures will be converted to gray tones. Please adapt graphs to suit this format, i.e. make use of dotted and dashed lines and hatched bars instead of colored items.. The final submission should contain figures as JPG or TIFF files.
Page layout• Standard margins• no headers or footers• no columns• left align (ragged right)• font: 12pt Arial• single line spacing• main headings 14 pt bold; subheading 12 point italic• indent every paragraph, except after headings, tables, bul-
leted lists or figures
Other formatting• number all tables and figures sequentially• place tables and figures at the end of article; insert captions
at correct locations in body text• no text boxes• no footnotes or end notes• do not submit figures with text as drawing objects (they
cannot be edited)• limit the use of italics and do not use italics for simple
emphasis; do not italicize quotations; quotation marks are sufficient
• do not use italics for commonly understood Latin expressions such as “in vitro”
• use italics for other foreign words, such as expressions in Dutch
• no “sub-paragraphs” • no hyphenation (afbreking)
LanguageUS English spelling and punctuation
Erasmus Journal of Medicine • vol 5 - no 1 - October 201558
introduction1. What is the health-related problem that your
research helps to solve?
2. What is your strategy to solve the problem?
3. What is your research question/hypothesis? Whether a question or a hypothesis, state it in terms of
2 items: • variables: the measurable/observable independent and
outcome variables that you measured/observed and • relationships: the relationships between those variables
that your data analyses were designed to determine.
4. The core concept of the methods you used to answer the research question
Briefly describe the core concept of the methods at the end of the Introduction section. This helps readers to understand the complex details that are then presented in the Methods section
Methods section Organize the details of the Methods section under subheadings.Possible subheadings:
What was studied and study design (subheading)Describe the details of − what was studied: sample from a patient/animal
population, and − the design of the study: case-series, cohort study,
case-control study, randomized trial, etc.
Data collection (subheading)Describe the details of how the data was collected/observed Note Observable variables will be credible only if qualified
observers and validated instruments were used to assess them. Examples of observable variables include patient symptoms, subject responses to open interviews/ questionnaires, ultrasound/MRI/CT images, assessments of articles in a literature review etc. In such cases, build credibility in the Methods section; report “who” observed and interpreted the data. For example, “An experienced radiologist interpreted the images.”
Note When reporting on decisions/judgments that were made,
use the “we” form—take responsibility for what you did. Note The Methods section reports historical facts and must be in
past tense.
Data analysis (subheading)
results section5. The core concept of the Results Briefly describe the core concept of the results in a short
paragraph at the beginning of the Results section. This helps readers to understand the details that follow. Note just as in the Methods section, this section reports historical facts and must be in past tense.
Then organize the details of your Results under sub-headings, for example:
Patient/animal characteristics Data Statistical results
discussion sectionStructure your Discussion to focus on 4 core concepts (6, 7, 8, and 9 below).6. The answer to your research question Present this right at the top of the Discussion section—the
very first sentence, a present tense statement that expresses—to the best of your knowledge—how the world works as related to your research question/hypothesis. It is a direct answer to the question/hypothesis stated in the Introduction.
7. Support that answer? a) how your factual findings, (expressed in past tense),
support your answer. b) relating the findings of others to your answer. c) theoretical considerations that support your
answer.
Limitations (subheading)8. The limitations to that answer Focus explicitly on limitations related to possible confoun-
ders: • sample size • specific locations/medical centers of your study, • possible ethnic/cultural variables, • uncontrolled patient/subject characteristics and • underlying assumptions.
Conclusions (subheading) The Conclusion is not a summary, but should focus on the consequences of your work. Structure this subsection using separate paragraphs that state 2 main messages (9 and 10)
9. What are the practical/theoretical consequences of your answer?
The value—relevance— of your work: how it helps to solve the problem described at the beginning of the Introduction.
10. What is a next step to help solve the original problem? • a new research question to be answered • a refinement of the present study to reduce limitations • a protocol to implement the findings in the clinic
the template for authors
Instructions for EJM authors


Erasmus Journal of Medicine