Embed Size (px)
Citation preview
Summer Internship Report
On
MAHARSHI DAYANAND UNIVERSITY, ROTHAK
Operational & Financial Viability of Distribution Utilities
in Major States of India
Under the Guidance of
Mr. Sunil Varma Marri (Head-Energy)
iMaCS(ICRA)
&
Mrs Indu Maheshwari, Director
National Power Training Institute, Faridabad
ICRA Management Consulting Services Ltd
Submitted by
Ashish Garg
Roll No 21, Batch 2012-14
MBA (POWER MANAGEMENT)
NATIONAL POWER TRAINING INSTITUTE
Affiliated to
Center for Advanced Management and Power StudiesCenter for Advanced Management and Power StudiesCenter for Advanced Management and Power StudiesCenter for Advanced Management and Power Studies
NATIONAL POWER TRAINING INSTITUTE NATIONAL POWER TRAINING INSTITUTE NATIONAL POWER TRAINING INSTITUTE NATIONAL POWER TRAINING INSTITUTE (Under Ministry of Power, Govt. of India)
OPERATIONAL & FINANCIAL VIABILITY OF DISTRIBUTION UTILITIES IN MAJOR STATES OF
INDIA
National Power Training Institute (NPTI) | | ICRA Management Consulting Services Ltd (IMaCS) 1
CERTIFICATE
OPERATIONAL & FINANCIAL VIABILITY OF DISTRIBUTION UTILITIES IN MAJOR STATES OF
INDIA
National Power Training Institute (NPTI) | | ICRA Management Consulting Services Ltd (IMaCS) 2
DECLARATION
I, Ashish Garg, Roll no. 21 / Semester 3rd / Class of 2012-14 of the MBA (Power Management)
of the National Power Training Institute, Faridabad hereby declare that the Summer Training
Report entitled:
Operational & Financial Viability of Distribution Utilities in Major States of India
is an original work and the same has not been submitted to any institute for the award of any
other degree.
Project In charge Signature of Candidate (Faculty)
Countersigned
Director/Principal of the Institute
OPERATIONAL & FINANCIAL VIABILITY OF DISTRIBUTION UTILITIES IN MAJOR STATES OF
INDIA
National Power Training Institute (NPTI) | | ICRA Management Consulting Services Ltd (IMaCS) 3
ACKNOWLEDGEMENT
The projects done by me under this internship program wouldn’t have been completed, if not for
the active help and guidance of various people.
I express my sincere thanks to Mr. Sunil Varma Marri (Head – Energy Sector), IMaCS for giving
me a great opportunity to work in such a dynamic organization and for guiding me in all stages of
the project. I am thankful to Mr. Rohit Singh (Analyst), IMaCS for his guidance and support. I
have a deep sense of gratitude and respect for the entire staff of IMaCS for sharing their knowledge
and for assisting me.
I would like to thank my Project In-charge Mrs. Indu Maheshwari, Director, NPTI, Faridabad for
her support and guidance throughout the course of summer internship.
A special thanks to Mr. S.K Choudhary, Director (CAMPS), Mrs. Manju Mam, Director, NPTI
for their guidance throughout my summer internship and all faculty members for arranging my
internship at iMacs and being a constant source of motivation and guidance throughout the course
of my internship.
Ashish Garg
MBA (Power Management)
OPERATIONAL & FINANCIAL VIABILITY OF DISTRIBUTION UTILITIES IN MAJOR STATES OF
INDIA
National Power Training Institute (NPTI) | | ICRA Management Consulting Services Ltd (IMaCS) 4
TABLE OF CONTENTS
CERTIFICATE ........................................................................................................................................... 1
DECLARATION......................................................................................................................................... 2
ACKNOWLEDGEMENT .......................................................................................................................... 3
LIST OF FIGURES .................................................................................................................................... 7
ABBREVIATIONS ..................................................................................................................................... 9
EXECUTIVE SUMMARY ...................................................................................................................... 10
CHAPTER 1: INTRODUCTION ............................................................................................................ 12
1.1 POWER DISTRIBUTION SECTOR-SNAPSHOT .............................................................................. 12
1.2 OBJECTIVE OF THE PROJECT: ............................................................................................................... 13
1.3 SCOPE OF THE PROJECT: ......................................................................................................................... 13
1.4 SIGNIFICANCE OF THE PROJECT: ......................................................................................................... 14
CHAPTER 2: INTRODUCTION TO THE ORGANISATION ........................................................... 15
2.1 ABOUT THE ORGANISATION: ................................................................................................................. 15
2.1.1 CONSULTING SERVICES .............................................................................................................. 16
2.1.2 SOFTWARE DEVELOPMENT ....................................................................................................... 16
2.1.3 ONLINE SOFTWARE & KNOWLEDGE PROCESS OUTSOURCING .................................... 16
2.2 THE ICRA FACTOR: .................................................................................................................................... 17
2.3 IMACS-ENERGY: .......................................................................................................................................... 21
2.4 BRIEF DESCRIPTION ABOUT FUNCTIONAL AREAS: ....................................................................... 21
2.4.1 REFORM, REGULATION AND PUBLIC POLICY: .................................................................... 21
2.4.2 RISK MANAGEMENT: .................................................................................................................... 22
2.4.3 TRANSACTION SUPPORT: ............................................................................................................ 22
2.4.4 STRATEGY & OPERATIONS: ....................................................................................................... 23
CHAPTER 3: REVIEW OF EXISTING LITERATURE & RESEARCH METHODOLOGY ....... 25
3.1 LITERATURE REVIEW ............................................................................................................................... 25
3.1.1 NATIONAL TARIFF POLICY: ....................................................................................................... 25
3.1.2 NATIONAL ELECTRICITY POLICY: .......................................................................................... 25
3.1.3 OTHER LITERATURES .................................................................................................................. 26
3.2. RESEARCH METHODOLOGY .................................................................................................................. 28
3.2.1 FILTERING OF DATA ..................................................................................................................... 28
3.3 APPROACH .................................................................................................................................................... 30
3.4 RISK PROFILING OF STATES ................................................................................................................... 30
OPERATIONAL & FINANCIAL VIABILITY OF DISTRIBUTION UTILITIES IN MAJOR STATES OF
INDIA
National Power Training Institute (NPTI) | | ICRA Management Consulting Services Ltd (IMaCS) 5
CHAPTER 4: FACTS AND ANALYSIS OF ANDHRA PRADESH ................................................... 31
4.1 OVERALL SCENARIO ................................................................................................................................. 31
4.1.1 General Background and Political Economy ................................................................................... 31
4.1.2 Power Sector – Overview & Evolution of Reforms ......................................................................... 32
4.1.3. Current Industry Structure .............................................................................................................. 32
4.2 APNPDCL ........................................................................................................................................................ 33
(Northern Power Distribution Company of Andhra Pradesh Ltd.) ................................................................. 33
4.2.1 Operational Performance .................................................................................................................. 34
4.2.2 Financial Performance ....................................................................................................................... 35
4.3 APEPDCL ........................................................................................................................................................ 36
(Eastern Power Distribution Company of Andhra Pradesh Ltd.) .................................................................... 36
4.3.1 Operational Performance .................................................................................................................. 37
4.3.2 Financial Performance ....................................................................................................................... 38
4.4 APCPDCL (Central Power Distribution Company of Andhra Pradesh Ltd) ........................................... 39
4.4.1 Operational Performance .................................................................................................................. 40
4.4.2 Financial Performance ....................................................................................................................... 41
Chapter 5: FACTS AND ANALYSIS OF GUJARAT .......................................................................... 43
5.1 OVERALL SCENARIO ................................................................................................................................. 43
5.1.1 General Background & Political Economy ...................................................................................... 43
5.1.2 Power Sector – Overview & Evolution of Reforms ......................................................................... 44
5.1.3 Current Industry Structure ............................................................................................................... 44
5.2 DGVCL (Dakshin Gujarat VIJ Company Ltd) ............................................................................................ 45
5.2.1 Operational Performance .................................................................................................................. 46
5.2.2 Financial Performance ....................................................................................................................... 47
5.3 PGVCL (Paschim Gujarat Vij Company Ltd) ............................................................................................. 48
5.3.1 Operational Performance .................................................................................................................. 49
5.2.2 Financial Performance ....................................................................................................................... 50
Chapter 6: FACTS AND ANALYSIS OF MAHARASHTRA ............................................................. 52
6.1 OVERALL SCENARIO ................................................................................................................................. 52
6.1.1 General Background & Political Economy ...................................................................................... 52
6.1.2 Power Sector – Overview & Evolution of Reforms ......................................................................... 53
6.1.3. Current Industry Structure .............................................................................................................. 53
6.2 MSEDCL (Maharashtra State Electricity Distribution Company Ltd) ..................................................... 54
6.2.1 Operational Performance .................................................................................................................. 55
6.2.3 Financial Performance ....................................................................................................................... 56
OPERATIONAL & FINANCIAL VIABILITY OF DISTRIBUTION UTILITIES IN MAJOR STATES OF
INDIA
National Power Training Institute (NPTI) | | ICRA Management Consulting Services Ltd (IMaCS) 6
CHAPTER 7: FINDINGS & RECOMMENDATIONS ........................................................................ 58
7.1 FINDINGS ....................................................................................................................................................... 58
7.2 RISK MATRIX ............................................................................................................................................... 59
7.3 RECOMMENDATIONS: ............................................................................................................................... 60
BIBLIOGRAPHY & REFERENCES ..................................................................................................... 61
OPERATIONAL & FINANCIAL VIABILITY OF DISTRIBUTION UTILITIES IN MAJOR STATES OF
INDIA
National Power Training Institute (NPTI) | | ICRA Management Consulting Services Ltd (IMaCS) 7
LIST OF FIGURES
Figure 1: Distribution Reforms-AP............................................................................................................. 32
Figure 2: Consumer Category-wise Number of Consumers, Connected Load (MW), Sales Mix and
Revenue from Sale of Power-APNPDCL (2011-12) .................................................................................. 33
Figure 3: Category-wise Net Growth in Input Energy and Energy Sold (MU)-APNPDCL (2011-12) ...... 34
Figure 4:Cost-wise Break up of ACS and ACS-ARR Gap (Rs/Kwh)-APNPDCL (2011-12) .................... 35
Figure 5: Consumer Category-wise Number of Consumers, Sales Mix and Revenue from Sale of Power-
APEPDCL (2011-12) .................................................................................................................................. 36
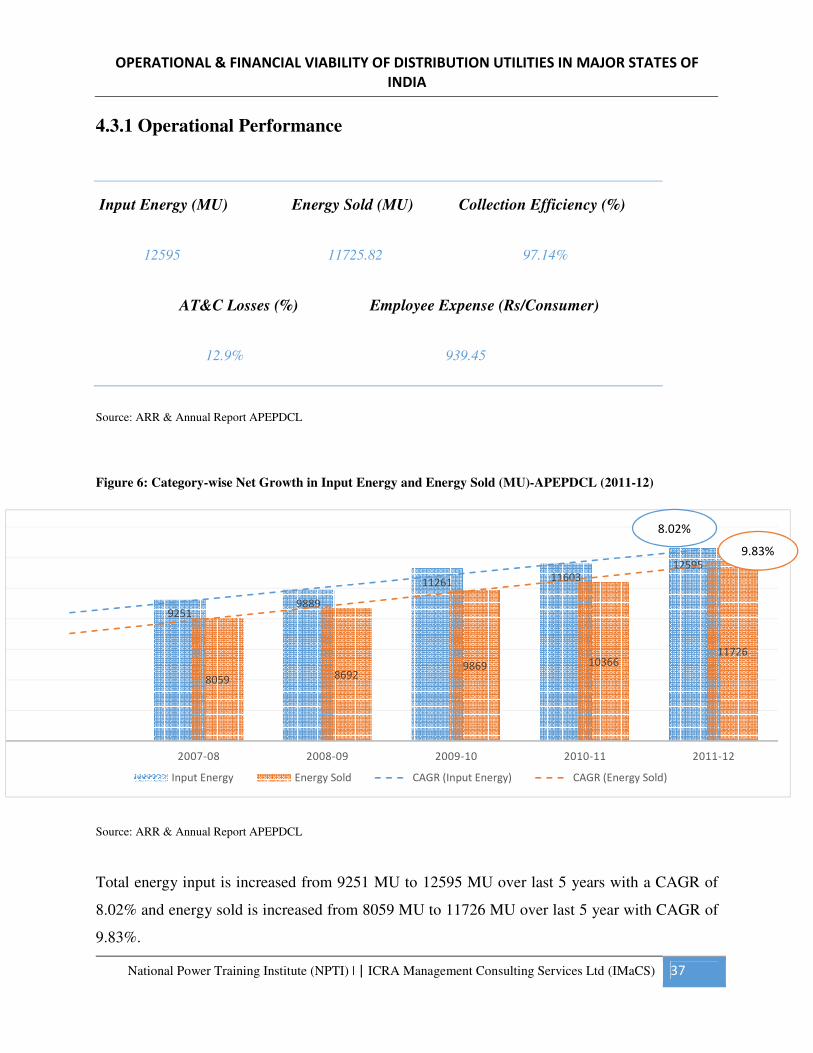
Figure 6: Category-wise Net Growth in Input Energy and Energy Sold (MU)-APEPDCL (2011-12) ...... 37
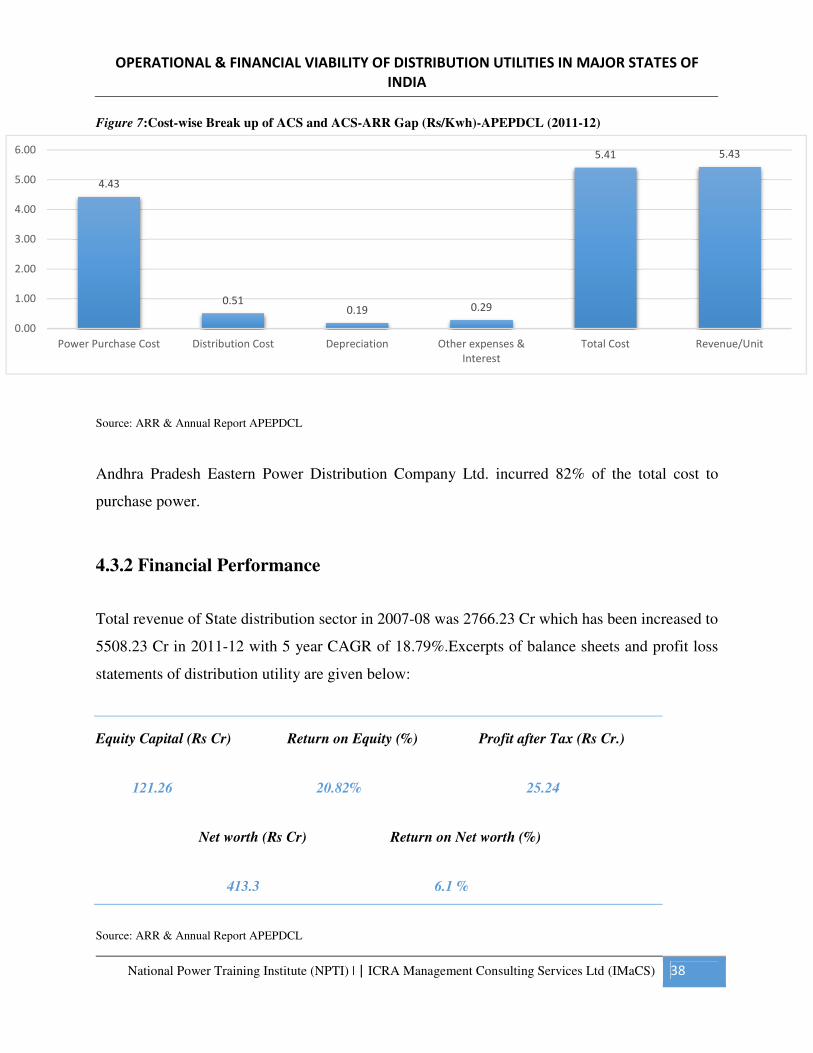
Figure 7:Cost-wise Break up of ACS and ACS-ARR Gap (Rs/Kwh)-APEPDCL (2011-12) .................... 38
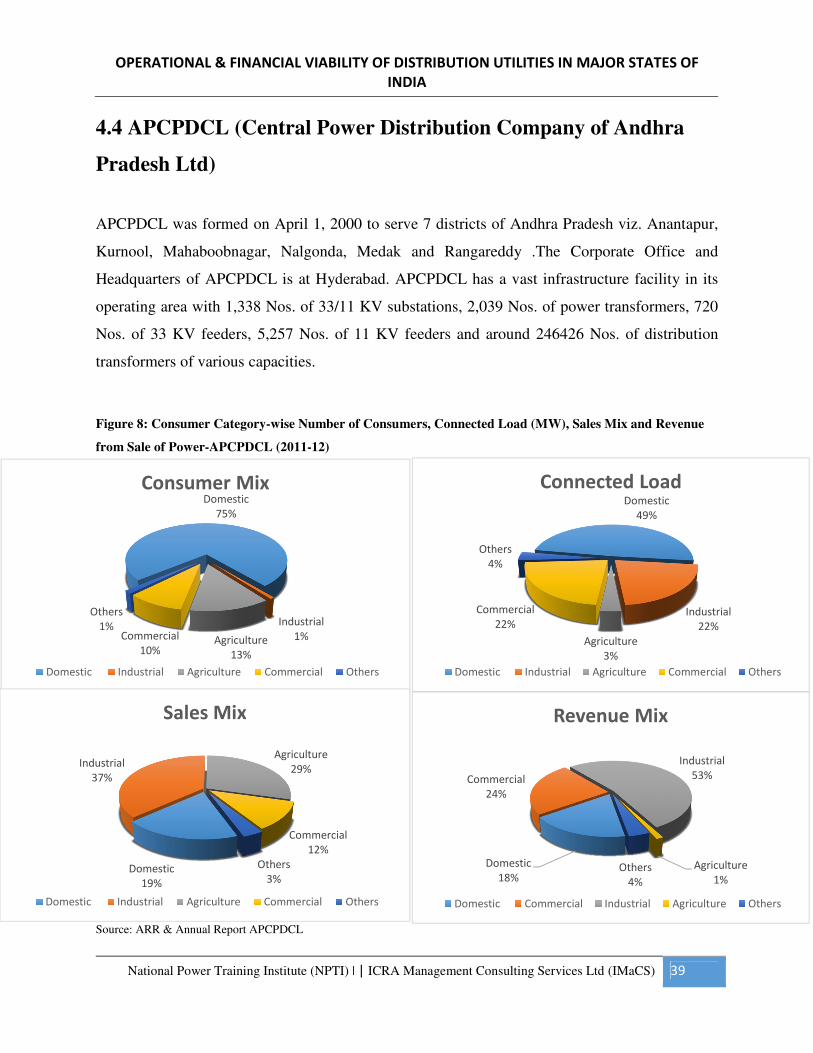
Figure 8: Consumer Category-wise Number of Consumers, Connected Load (MW), Sales Mix and
Revenue from Sale of Power-APCPDCL (2011-12) .................................................................................. 39
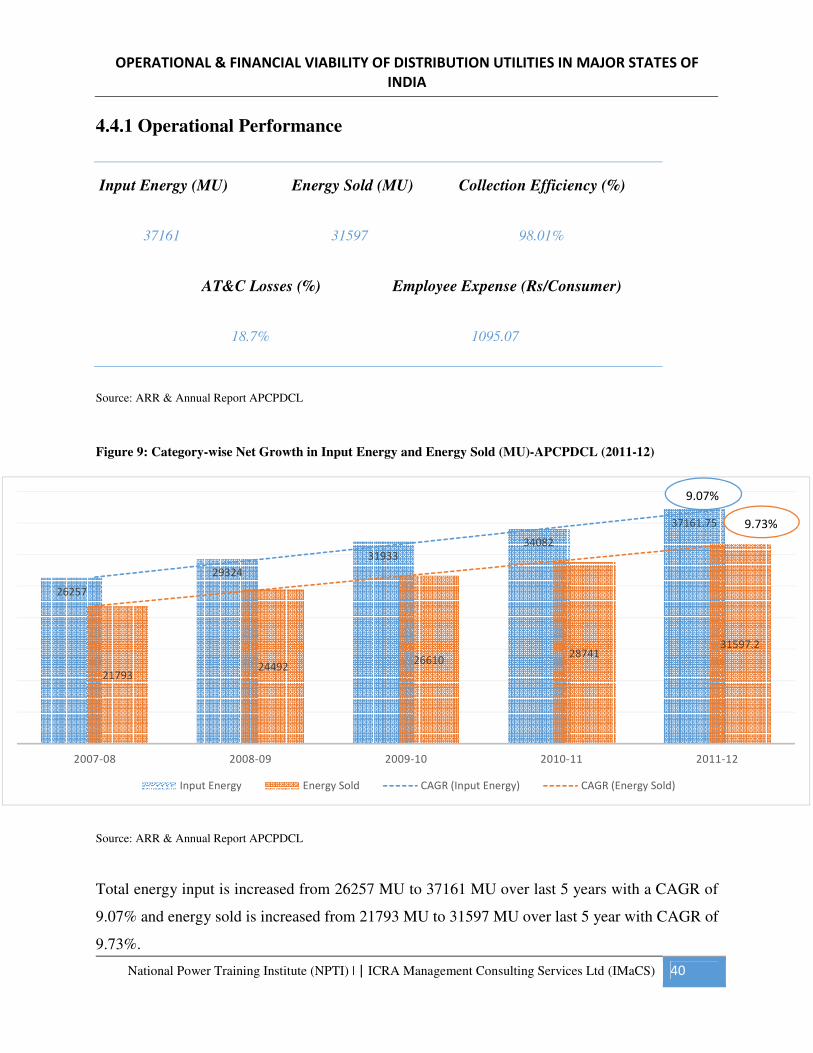
Figure 9: Category-wise Net Growth in Input Energy and Energy Sold (MU)-APCPDCL (2011-12) ...... 40
Figure 10: Cost-wise Break up of ACS and ACS-ARR Gap (Rs/Kwh)-APCPDCL (2011-12) ................. 41
Figure 11: SNAPSHOT – ANDHRA PRADESH ...................................................................................... 42
Figure 12: Distribution Reforms-Gujarat .................................................................................................... 44
Figure 13: Consumer Category-wise Number of Consumers, Connected Load (MW), Sales Mix and
Revenue from Sale of Power-DGVCL (2011-12) ...................................................................................... 45
Figure 14: Category-wise Net Growth in Input Energy and Energy Sold (MU)-DGVCL (2011-12) ........ 46
Figure 15:Cost-wise Break up of ACS and ACS-ARR Gap (Rs/Kwh)-DGVCL (2011-12) ...................... 47
Figure 16: Consumer Category-wise Number of Consumers, Connected Load (MW), Sales Mix and
Revenue from Sale of Power-PGVCL (2011-12) ....................................................................................... 48
Figure 17: Category-wise Net Growth in Input Energy and Energy Sold (MU)-PGVCL (2011-12) ......... 49
OPERATIONAL & FINANCIAL VIABILITY OF DISTRIBUTION UTILITIES IN MAJOR STATES OF
INDIA
National Power Training Institute (NPTI) | | ICRA Management Consulting Services Ltd (IMaCS) 8
Figure 18: Cost-wise Break up of ACS and ACS-ARR Gap (Rs/Kwh)-PGVCL (2011-12) ...................... 50
Figure 19: SNAPSHOT – GUJARAT ........................................................................................................ 51
Figure 20: Distribution Reforms-Maharashtra ............................................................................................ 53
Figure 21: Consumer Category-wise, Sales Mix and Revenue from Sale of Power-MSEDCL (2011-12) 54
Figure 22: Category-wise Net Growth in Input Energy and Energy Sold (MU)-MSEDCL (2011-12) ...... 55
Figure 23:Cost-wise Break up of ACS and ACS-ARR Gap (Rs/Kwh)-MSEDCL (2011-12) .................... 56
Figure 24: SNAPSHOT – MAHARASHTRA ............................................................................................ 57
Figure 25: Operational & Financial Performance ....................................................................................... 58
Figure 26: Risk Matrix ................................................................................................................................ 59
OPERATIONAL & FINANCIAL VIABILITY OF DISTRIBUTION UTILITIES IN MAJOR STATES OF
INDIA
National Power Training Institute (NPTI) | | ICRA Management Consulting Services Ltd (IMaCS) 9
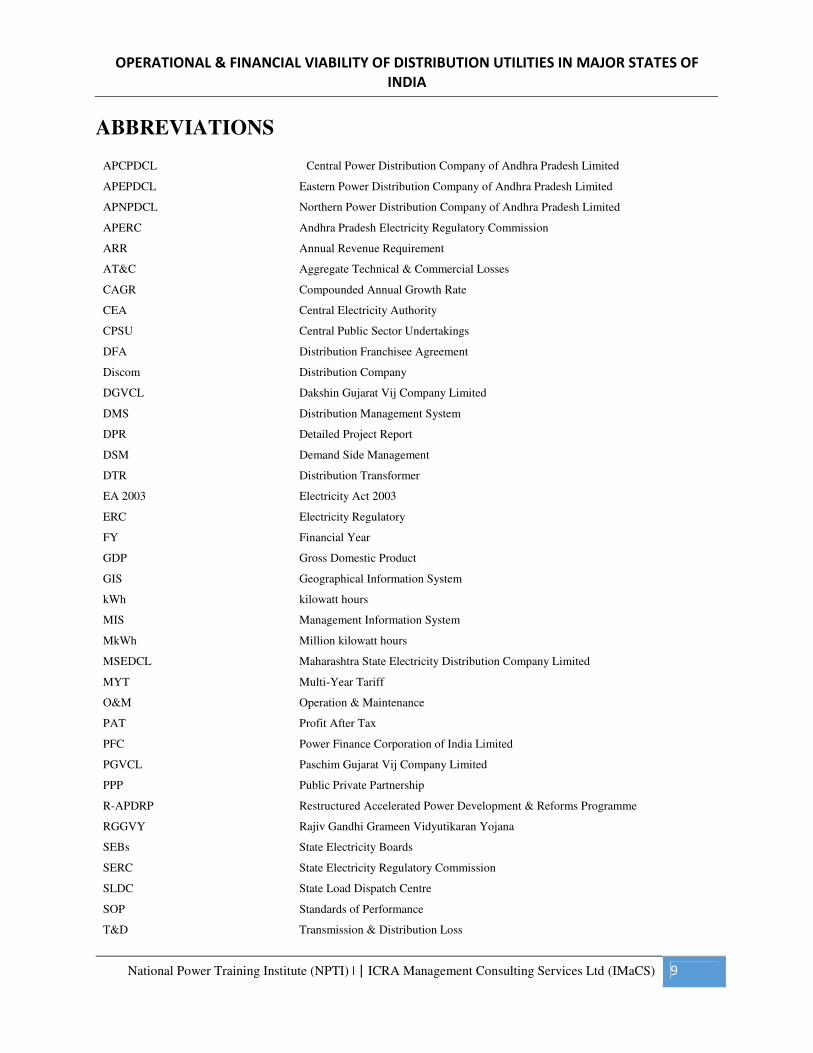
ABBREVIATIONS
APCPDCL Central Power Distribution Company of Andhra Pradesh Limited
APEPDCL Eastern Power Distribution Company of Andhra Pradesh Limited
APNPDCL Northern Power Distribution Company of Andhra Pradesh Limited
APERC Andhra Pradesh Electricity Regulatory Commission
ARR Annual Revenue Requirement
AT&C Aggregate Technical & Commercial Losses
CAGR Compounded Annual Growth Rate
CEA Central Electricity Authority
CPSU Central Public Sector Undertakings
DFA Distribution Franchisee Agreement
Discom Distribution Company
DGVCL Dakshin Gujarat Vij Company Limited
DMS Distribution Management System
DPR Detailed Project Report
DSM Demand Side Management
DTR Distribution Transformer
EA 2003 Electricity Act 2003
ERC Electricity Regulatory
FY Financial Year
GDP Gross Domestic Product
GIS Geographical Information System
kWh kilowatt hours
MIS Management Information System
MkWh Million kilowatt hours
MSEDCL Maharashtra State Electricity Distribution Company Limited
MYT Multi-Year Tariff
O&M Operation & Maintenance
PAT Profit After Tax
PFC Power Finance Corporation of India Limited
PGVCL Paschim Gujarat Vij Company Limited
PPP Public Private Partnership
R-APDRP Restructured Accelerated Power Development & Reforms Programme
RGGVY Rajiv Gandhi Grameen Vidyutikaran Yojana
SEBs State Electricity Boards
SERC State Electricity Regulatory Commission
SLDC State Load Dispatch Centre
SOP Standards of Performance
T&D Transmission & Distribution Loss
OPERATIONAL & FINANCIAL VIABILITY OF DISTRIBUTION UTILITIES IN MAJOR STATES OF
INDIA
National Power Training Institute (NPTI) | | ICRA Management Consulting Services Ltd (IMaCS) 10
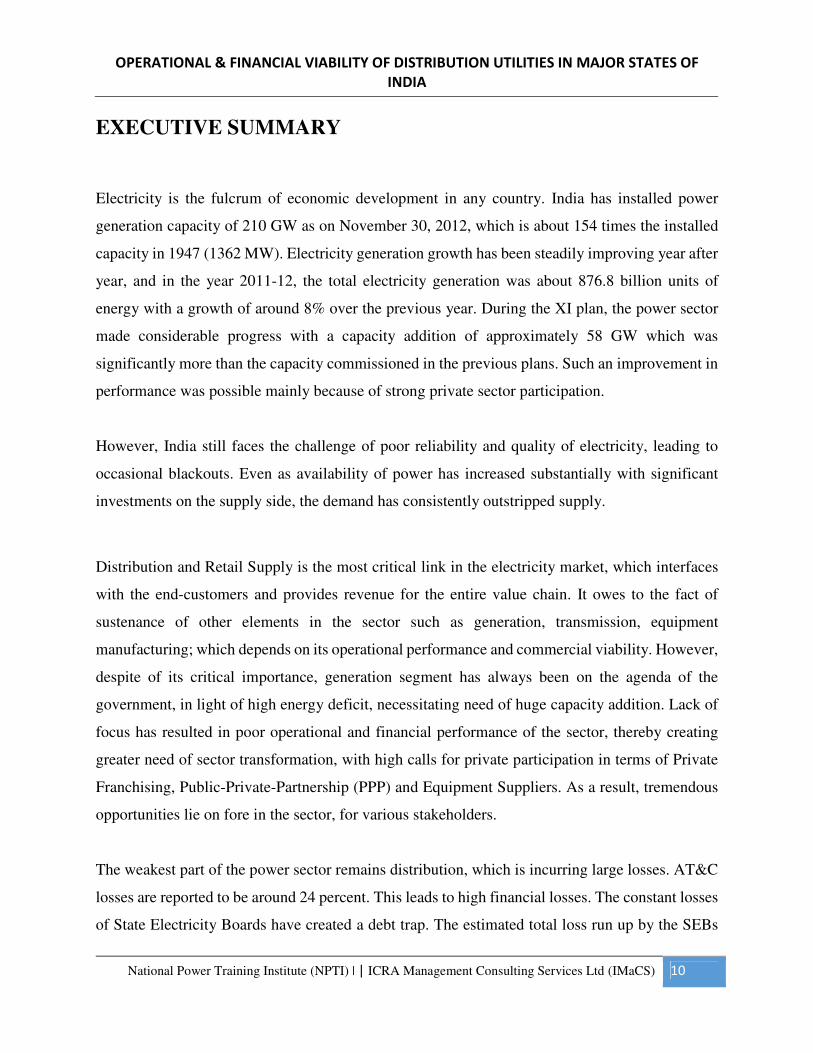
EXECUTIVE SUMMARY
Electricity is the fulcrum of economic development in any country. India has installed power
generation capacity of 210 GW as on November 30, 2012, which is about 154 times the installed
capacity in 1947 (1362 MW). Electricity generation growth has been steadily improving year after
year, and in the year 2011-12, the total electricity generation was about 876.8 billion units of
energy with a growth of around 8% over the previous year. During the XI plan, the power sector
made considerable progress with a capacity addition of approximately 58 GW which was
significantly more than the capacity commissioned in the previous plans. Such an improvement in
performance was possible mainly because of strong private sector participation.
However, India still faces the challenge of poor reliability and quality of electricity, leading to
occasional blackouts. Even as availability of power has increased substantially with significant
investments on the supply side, the demand has consistently outstripped supply.
Distribution and Retail Supply is the most critical link in the electricity market, which interfaces
with the end-customers and provides revenue for the entire value chain. It owes to the fact of
sustenance of other elements in the sector such as generation, transmission, equipment
manufacturing; which depends on its operational performance and commercial viability. However,
despite of its critical importance, generation segment has always been on the agenda of the
government, in light of high energy deficit, necessitating need of huge capacity addition. Lack of
focus has resulted in poor operational and financial performance of the sector, thereby creating
greater need of sector transformation, with high calls for private participation in terms of Private
Franchising, Public-Private-Partnership (PPP) and Equipment Suppliers. As a result, tremendous
opportunities lie on fore in the sector, for various stakeholders.
The weakest part of the power sector remains distribution, which is incurring large losses. AT&C
losses are reported to be around 24 percent. This leads to high financial losses. The constant losses
of State Electricity Boards have created a debt trap. The estimated total loss run up by the SEBs
OPERATIONAL & FINANCIAL VIABILITY OF DISTRIBUTION UTILITIES IN MAJOR STATES OF
INDIA
National Power Training Institute (NPTI) | | ICRA Management Consulting Services Ltd (IMaCS) 11
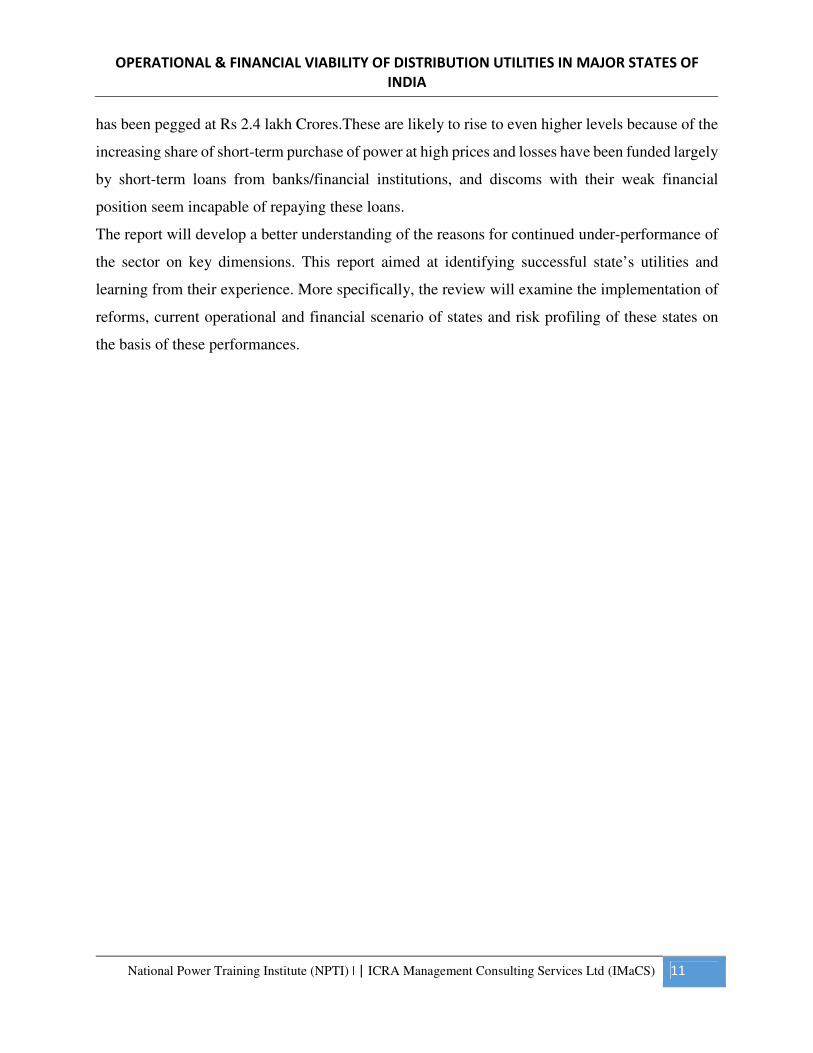
has been pegged at Rs 2.4 lakh Crores.These are likely to rise to even higher levels because of the
increasing share of short-term purchase of power at high prices and losses have been funded largely
by short-term loans from banks/financial institutions, and discoms with their weak financial
position seem incapable of repaying these loans.
The report will develop a better understanding of the reasons for continued under-performance of
the sector on key dimensions. This report aimed at identifying successful state’s utilities and
learning from their experience. More specifically, the review will examine the implementation of
reforms, current operational and financial scenario of states and risk profiling of these states on
the basis of these performances.
OPERATIONAL & FINANCIAL VIABILITY OF DISTRIBUTION UTILITIES IN MAJOR STATES OF
INDIA
National Power Training Institute (NPTI) | | ICRA Management Consulting Services Ltd (IMaCS) 12
CHAPTER 1: INTRODUCTION
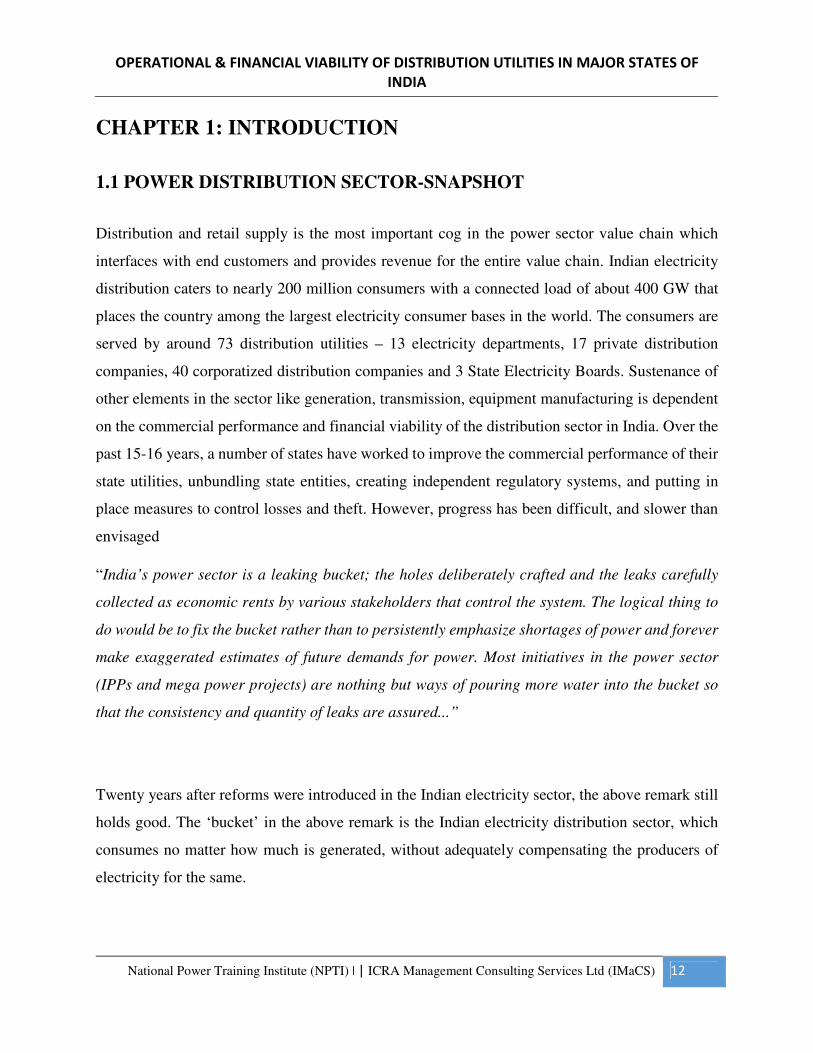
1.1 POWER DISTRIBUTION SECTOR-SNAPSHOT
Distribution and retail supply is the most important cog in the power sector value chain which
interfaces with end customers and provides revenue for the entire value chain. Indian electricity
distribution caters to nearly 200 million consumers with a connected load of about 400 GW that
places the country among the largest electricity consumer bases in the world. The consumers are
served by around 73 distribution utilities – 13 electricity departments, 17 private distribution
companies, 40 corporatized distribution companies and 3 State Electricity Boards. Sustenance of
other elements in the sector like generation, transmission, equipment manufacturing is dependent
on the commercial performance and financial viability of the distribution sector in India. Over the
past 15-16 years, a number of states have worked to improve the commercial performance of their
state utilities, unbundling state entities, creating independent regulatory systems, and putting in
place measures to control losses and theft. However, progress has been difficult, and slower than
envisaged
“India’s power sector is a leaking bucket; the holes deliberately crafted and the leaks carefully
collected as economic rents by various stakeholders that control the system. The logical thing to
do would be to fix the bucket rather than to persistently emphasize shortages of power and forever
make exaggerated estimates of future demands for power. Most initiatives in the power sector
(IPPs and mega power projects) are nothing but ways of pouring more water into the bucket so
that the consistency and quantity of leaks are assured...”
Twenty years after reforms were introduced in the Indian electricity sector, the above remark still
holds good. The ‘bucket’ in the above remark is the Indian electricity distribution sector, which
consumes no matter how much is generated, without adequately compensating the producers of
electricity for the same.
OPERATIONAL & FINANCIAL VIABILITY OF DISTRIBUTION UTILITIES IN MAJOR STATES OF
INDIA
National Power Training Institute (NPTI) | | ICRA Management Consulting Services Ltd (IMaCS) 13
Recently, Planning Commission had appointed a High Level Panel headed by Shri V.K. Shunglu,
former Comptroller &Auditor General in July, 2010 to look into the financial problems of State
Electricity Boards and to identify corrective steps. The terms of reference of this Committee
included reviewing the accounts of State Electricity Boards and State Distribution Companies as
on March, 2010 and to project their losses by 2017, reviewing the electricity tariff and also
examining the role of the State Governments, Electricity Regulatory Commissions and
Distribution Companies, assessing system improvement measures accomplished in distribution of
power etc. and finally, to recommend a plan of action to achieve financial viability in distribution
of power by 2017. The Shunglu Committee presented its Report to the Deputy Chairman, Planning
Commission on 15 December, 2011.It is time that we look at the underlying problems of this sector
and constructively work towards removing the bottlenecks to make it more efficient and customer
oriented.
1.2 OBJECTIVE OF THE PROJECT:
• To get a Policy & Regulatory Overview of the distribution sector in major states of India.
• To analyze the operational and financial performance of the respective state SEBs and compare
them accordingly on various parameters.
1.3 SCOPE OF THE PROJECT:
The scope of this project includes the following:
• This project covers 3 major states and 6 distribution utilities of India which play a key role in
distribution sector.
• To study the various regulations and policies implemented by the state from time to time.
• To assess comparatively, the operational and financial performance of various SEBs
• Risk profiling of the states on the basis of operational and financial performance.
OPERATIONAL & FINANCIAL VIABILITY OF DISTRIBUTION UTILITIES IN MAJOR STATES OF
INDIA
National Power Training Institute (NPTI) | | ICRA Management Consulting Services Ltd (IMaCS) 14
1.4 SIGNIFICANCE OF THE PROJECT:
There have been huge financial losses incurring to the state SEBs in the recent years.
Reduction of AT&C losses remains a major problem in almost every state. It is also very important
that the state actually implements various policies and different regulations from time to time. This
study helps us to locate the various drawbacks of state utilities, their operational and financial
performance and a comparison among the state utilities finally shows where the utilities of the
states stand upon.
OPERATIONAL & FINANCIAL VIABILITY OF DISTRIBUTION UTILITIES IN MAJOR STATES OF
INDIA
National Power Training Institute (NPTI) | | ICRA Management Consulting Services Ltd (IMaCS) 15
CHAPTER 2: INTRODUCTION TO THE ORGANISATION
2.1 ABOUT THE ORGANISATION:
ICRA Management Consulting Services Limited (IMaCS) is a multi-line management consulting
firm headquartered in India. It has an established track record of 17 years in management and
development consulting across various sectors and countries. IMaCS has completed more than
1200 consulting assignments with about 600 clients and has worked in over 40 countries across
the globe. IMaCS is a wholly-owned subsidiary of ICRA Limited (ICRA), one of India‟s leading
credit rating agencies. IMaCS operated as an independent division of ICRA till March 2005, when
it was de-merged from ICRA and became a standalone company in its present form.
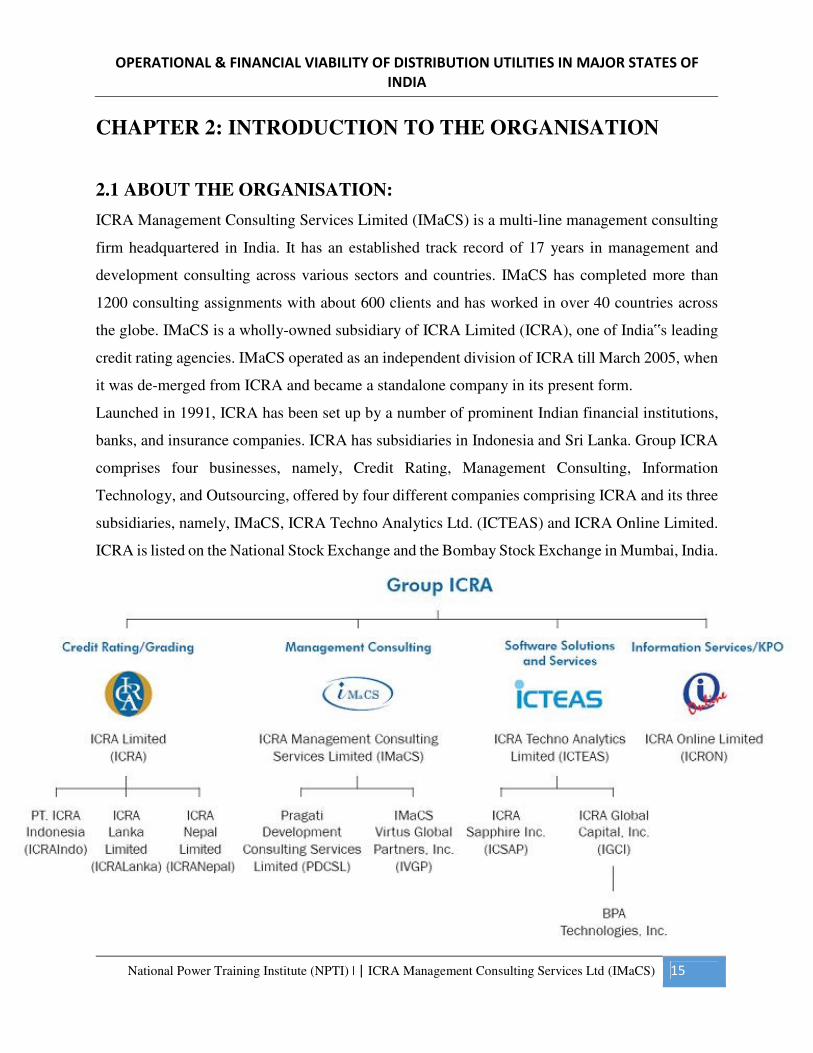
Launched in 1991, ICRA has been set up by a number of prominent Indian financial institutions,
banks, and insurance companies. ICRA has subsidiaries in Indonesia and Sri Lanka. Group ICRA
comprises four businesses, namely, Credit Rating, Management Consulting, Information
Technology, and Outsourcing, offered by four different companies comprising ICRA and its three
subsidiaries, namely, IMaCS, ICRA Techno Analytics Ltd. (ICTEAS) and ICRA Online Limited.
ICRA is listed on the National Stock Exchange and the Bombay Stock Exchange in Mumbai, India.
OPERATIONAL & FINANCIAL VIABILITY OF DISTRIBUTION UTILITIES IN MAJOR STATES OF
INDIA
National Power Training Institute (NPTI) | | ICRA Management Consulting Services Ltd (IMaCS) 16
2.1.1 CONSULTING SERVICES
ICRA Management Consulting Services Limited (IMaCS), a wholly-owned subsidiary of ICRA
Limited, is a multi-line consulting firm with a global operating footprint. IMaCS offers Consulting
Services in Strategy, Risk Management, Regulatory Economics, Transaction Advisory, and
Process Re-engineering. IMaCS' clientele includes Banks & Financial Service Companies,
Corporate Entities, Institutional Investors, Governments, Regulators, and Multilateral Agencies.
Besides India, IMaCS has consulting experience across 35 countries in South East Asia, Northern
Asia, West Asia, Africa, Western Europe, and North America.
2.1.2 SOFTWARE DEVELOPMENT
ICRA Techno Analytics Limited (ICTEAS), a subsidiary of ICRA Limited, offers a complete
portfolio of Information Technology (IT) solutions to meet the dynamic needs of present-day
businesses. The services range from the traditional development of client-server, web-centric and
mobile applications to the generation of cutting-edge business analytics.
Axiom Technologies Private Limited, a wholly-owned subsidiary of ICTEAS specializes in
customization and implementation services on Oracle E-Business Suite. Its services include
process study, fitment analysis, customization, implementation, and post implementation
maintenance services.
2.1.3 ONLINE SOFTWARE & KNOWLEDGE PROCESS OUTSOURCING
ICRA Online Limited (Online) is a leading information services, outsourcing solutions provider
and technology solutions provider and caters for some of the biggest names in the financial services
sector in India and abroad, which is a testimony to its product quality, commitment and credibility.
OPERATIONAL & FINANCIAL VIABILITY OF DISTRIBUTION UTILITIES IN MAJOR STATES OF
INDIA
National Power Training Institute (NPTI) | | ICRA Management Consulting Services Ltd (IMaCS) 17
Online has two Strategic Business Units (SBUs) with a list of reputed global and domestic clients:
• The Information Services and Technology Solutions Division (MFI Division)
• The Knowledge Process Outsourcing Division (KPO Division)
The MFI Division leverages its domain expertise to provide high quality technology solutions, in
the form of products, to a large number of Banks, Mutual Funds, Financial Institutions, Third Party
Products‟ Distributors, Insurance Companies, Investment Advisors, Portfolio Managers, Stock
Brokers, Treasury Managers, and Academic Institutions, among others.
The KPO Division of Online offers Knowledge Process Outsourcing services that combine
advanced analytical abilities and deep domain expertise to deliver value by translating data and
information into structured business inputs.
2.2 THE ICRA FACTOR:
Facilitating efficiency in business ICRA information products, Ratings, and solutions reflect
independent, professional and impartial opinions, which assist businesses enhance the quality of
their decisions and help issuers access a broader investor base and even lesser known companies
approach the money and capital markets. They strongly believe that quality and authenticity of
information are derivatives of an organization’s research base. We have dedicated teams for
Monetary, Fiscal, Industry and Sector research, and a panel of Advisors to enhance our in-house
capabilities. Our research base enables us to maintain the highest standards of quality and
credibility committed to the development of the financial market.
OPERATIONAL & FINANCIAL VIABILITY OF DISTRIBUTION UTILITIES IN MAJOR STATES OF
INDIA
National Power Training Institute (NPTI) | | ICRA Management Consulting Services Ltd (IMaCS) 18
IMACS
(ICRA MANAGEMENT CONSULTING SERVICES LIMITED)
“Two significant feature of IMaCS growth story are that their large
Number of repeat clients and a high level of referral work”
IMaCS (ICRA Management Consulting Services Limited) is a wholly-owned subsidiary of ICRA
Limited (referred to as ICRA in this document)
• IMaCS is a management consulting firm headquartered in India.
• Seven offices in India and an operating footprint across 35 countries.
• Over the past 15 years, IMaCS has completed about 900 projects with 400 clients.
• IMaCS operated as a division of ICRA till March 31, 2005 when it was demerged.
• The clients comprise Governments, multilateral agencies, regulators and banks, corporate
and institutional investors.
• Three lines of service: (1) Consulting (2) Analytics (3) Transaction Advisory.
OPERATIONAL & FINANCIAL VIABILITY OF DISTRIBUTION UTILITIES IN MAJOR STATES OF
INDIA
National Power Training Institute (NPTI) | | ICRA Management Consulting Services Ltd (IMaCS) 19
• Expertise in Strategy, Risk Analytics, Process Re-engineering, Corporate Finance,
Regulatory Economics, and Development Consulting.
• IMaCS has executed assignments for multilateral agencies such as The World Bank, World
Bank Institute (WBI), Commonwealth Development Corporation (CDC), United Nations
Development Programme (UNDP), United States Agency for International Development
(USAID), Department for International Development (DfID), African Development Bank
(AfDB), Asian Development Bank (ADB) and International Finance Corporation (IFC).
• The main driver for IMaCS ‟ growth has been a growing need for unbiased and
professional views on adopting best business practices arising from economic deregulation,
growing international trade & integration, and the increasing need to be globally
competitive. Building on a carefully nurtured knowledge bank of global benchmarks for
business and management practices and a repository of high-quality analytical talent,
iMaCS has executed over 700 consulting assignments for a variety of Indian and
international organizations, Governments, and regulatory authorities
OPERATIONAL & FINANCIAL VIABILITY OF DISTRIBUTION UTILITIES IN MAJOR STATES OF
INDIA
National Power Training Institute (NPTI) | | ICRA Management Consulting Services Ltd (IMaCS) 20
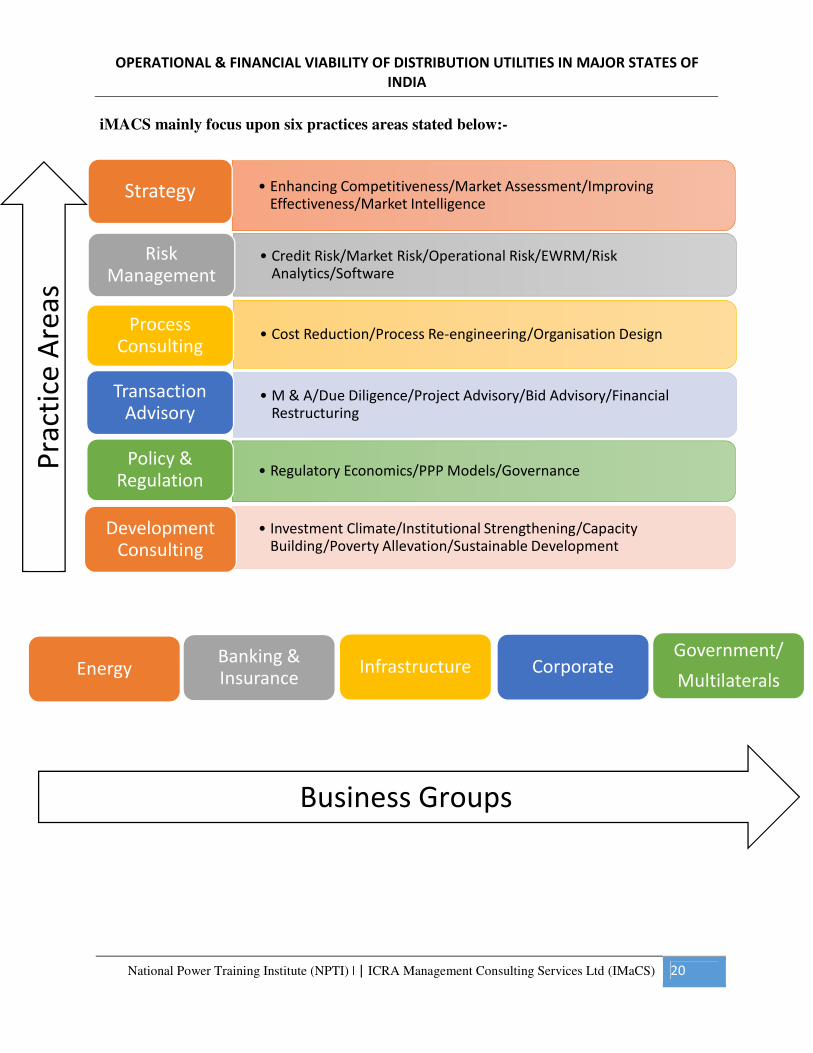
iMACS mainly focus upon six practices areas stated below:-
• Enhancing Competitiveness/Market Assessment/Improving Effectiveness/Market Intelligence
Strategy
• Credit Risk/Market Risk/Operational Risk/EWRM/Risk Analytics/Software
Risk Management
• Cost Reduction/Process Re-engineering/Organisation DesignProcess
Consulting
• M & A/Due Diligence/Project Advisory/Bid Advisory/Financial Restructuring
Transaction Advisory
• Regulatory Economics/PPP Models/GovernancePolicy &
Regulation
• Investment Climate/Institutional Strengthening/Capacity Building/Poverty Allevation/Sustainable Development
Development Consulting
Banking & Insurance
Infrastructure CorporateGovernment/
MultilateralsEnergy
Business Groups
Pra
ctic
e A
rea
s
OPERATIONAL & FINANCIAL VIABILITY OF DISTRIBUTION UTILITIES IN MAJOR STATES OF
INDIA
National Power Training Institute (NPTI) | | ICRA Management Consulting Services Ltd (IMaCS) 21
2.3 IMACS-ENERGY:
IMaCS Consulting Services in the Power Sector
IMaCS Energy Group is a leading provider of policy, regulatory consulting and transaction
advisory services to various stakeholders in the Energy sector. With a core team of in-house
consultants and partnerships with national and international organizations, IMaCS Energy
Group strives to help its clients become more competitive, effective and successful. Service which
ICRA offers are grouped across the following four broad functional areas:
• Reform & Regulation
• Risk Management
• Transaction/Project Advisory and
• Strategy & Operations.
Their services in the Power sector include restructuring vertically integrated state owned
enterprises, privatization of utilities, building capacity of public institutions, developing PPP
mechanisms, assisting project developers by providing project/financial advisory services,
providing strategic advice to utilities, and in fuel management.
2.4 BRIEF DESCRIPTION ABOUT FUNCTIONAL AREAS:
2.4.1 REFORM, REGULATION AND PUBLIC POLICY:
IMaCS assists governments, regulators and utilities seeking to establish and strengthen energy
sector reforms, which involves
• Policy analysis and formulation
• Market structure and competition
OPERATIONAL & FINANCIAL VIABILITY OF DISTRIBUTION UTILITIES IN MAJOR STATES OF
INDIA
National Power Training Institute (NPTI) | | ICRA Management Consulting Services Ltd (IMaCS) 22
• Regulatory frameworks
• Pricing
• Power sector restructuring
• Institutional reform
• Private sector participation
• Financial and operational restructuring
2.4.2 RISK MANAGEMENT:
IMaCS offers diagnostic and advisory services to project sponsors, developers, regulators,
financiers, and other parties by making a comprehensive analysis of project risks, which includes
• Risk assessment and mitigation
• Assessment of project sponsors and JV partners
• Credit risk assessment
• Investment risk assessment for equity/debt
• Payment security mechanisms
• Evaluation of credit structure
• Fuel price risk management
2.4.3 TRANSACTION SUPPORT:
IMaCS assists both governments in promoting private sector participation as well as private
developers to participate in infrastructure development through contract /project structuring,
designing / reviewing concession agreements, and structuring solutions for payment and security
mechanisms, developing financial models, assessing risks and providing assistance in bidding for
energy sector projects. Service offerings in this function include
OPERATIONAL & FINANCIAL VIABILITY OF DISTRIBUTION UTILITIES IN MAJOR STATES OF
INDIA
National Power Training Institute (NPTI) | | ICRA Management Consulting Services Ltd (IMaCS) 23
• Investment advisory
• Project valuation
• Project / structured finance – debt, equity, mezzanine finance, credit enhancement
• Preparation of bid documents
• Evaluation of bids
• Preparation and review of contractual agreements
• EPC bid-process management
• Power Purchase Agreements
• Fuel Supply Agreements
2.4.4 STRATEGY & OPERATIONS:
IMaCS helps its clients to decide which lines of business to pursue; to decide their entry strategy
into the energy sector, to divest assets no longer consistent with their strategy; to improve
operational efficiency and productivity and to develop sourcing, bidding, trading, and contracting
strategies. Service offerings include
• Business plans for utilities
• Power and fuel market assessment
• Organizational design and restructuring
• Performance measurement and benchmarking
• Process improvement
• Operational strategy
• Competitiveness study
OPERATIONAL & FINANCIAL VIABILITY OF DISTRIBUTION UTILITIES IN MAJOR STATES OF
INDIA
National Power Training Institute (NPTI) | | ICRA Management Consulting Services Ltd (IMaCS) 24
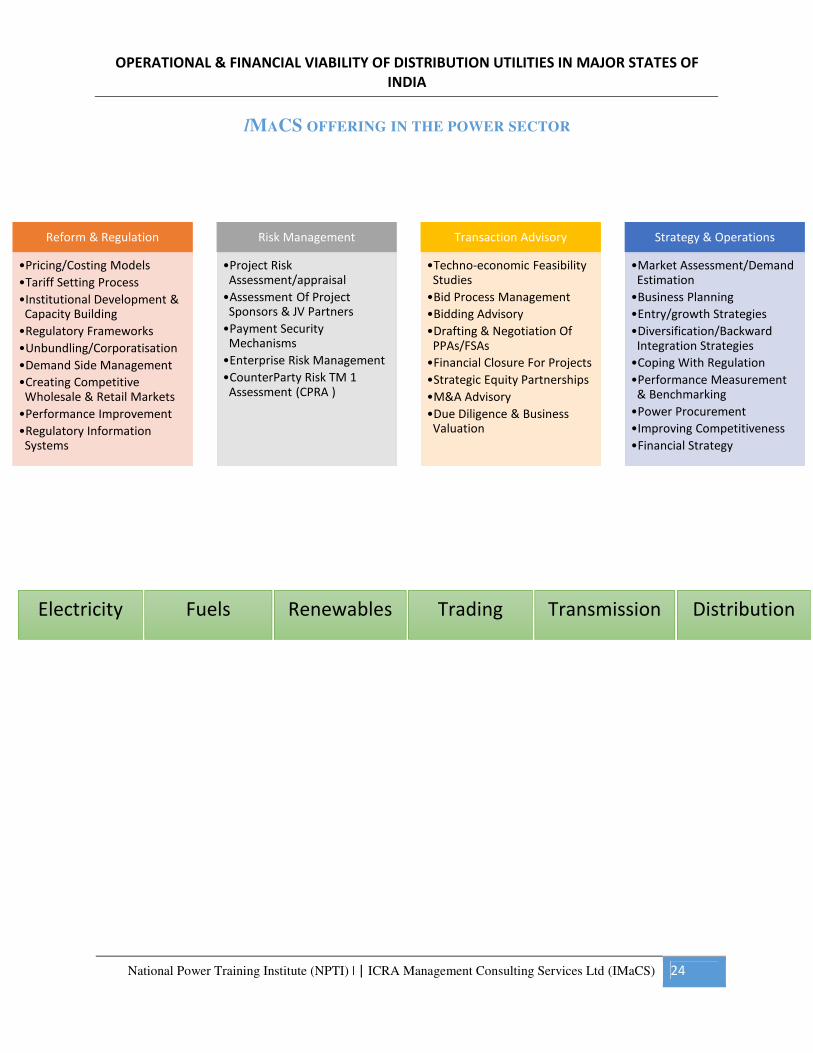
IMACS OFFERING IN THE POWER SECTOR
Reform & Regulation
•Pricing/Costing Models
•Tariff Setting Process
•Institutional Development & Capacity Building
•Regulatory Frameworks
•Unbundling/Corporatisation
•Demand Side Management
•Creating Competitive Wholesale & Retail Markets
•Performance Improvement
•Regulatory Information Systems
Risk Management
•Project Risk Assessment/appraisal
•Assessment Of Project Sponsors & JV Partners
•Payment Security Mechanisms
•Enterprise Risk Management
•CounterParty Risk TM 1 Assessment (CPRA )
Transaction Advisory
•Techno-economic Feasibility Studies
•Bid Process Management
•Bidding Advisory
•Drafting & Negotiation Of PPAs/FSAs
•Financial Closure For Projects
•Strategic Equity Partnerships
•M&A Advisory
•Due Diligence & Business Valuation
Strategy & Operations
•Market Assessment/Demand Estimation
•Business Planning
•Entry/growth Strategies
•Diversification/Backward Integration Strategies
•Coping With Regulation
•Performance Measurement & Benchmarking
•Power Procurement
•Improving Competitiveness
•Financial Strategy
Electricity Fuels Renewables Trading Transmission Distribution
OPERATIONAL & FINANCIAL VIABILITY OF DISTRIBUTION UTILITIES IN MAJOR STATES OF
INDIA
National Power Training Institute (NPTI) | | ICRA Management Consulting Services Ltd (IMaCS) 25
CHAPTER 3: REVIEW OF EXISTING LITERATURE &
RESEARCH METHODOLOGY
3.1 LITERATURE REVIEW
3.1.1 NATIONAL TARIFF POLICY:
Supply of reliable and quality power of specified standards in an efficient manner and at reasonable
rates is one of the main objectives of the National Electricity Policy. The State Commission should
determine and notify the standards of performance of licensees with respect to quality, continuity
and reliability of service for all consumers. Making the distribution segment of the industry
efficient and solvent is the key to success of power sector reforms and provision of services of
specified standards. Therefore, the Regulatory Commissions need to strike the right balance
between the requirements of the commercial viability of distribution licensees and consumer
interests. Loss making utilities need to be transformed into profitable ventures which can raise
necessary resources from the capital markets to provide services of international standards to
enable India to achieve its full growth potential.
• Implementation of MYT Framework
• Framework for revenue and cost requirements
• Tariff design: Linkage of cost to service
• Cross subsidy surcharge and additional surcharge for open access
3.1.2 NATIONAL ELECTRICITY POLICY:
The Act provides for a robust regulatory framework for distribution licensees to safeguard
consumer interests. It also creates a competitive framework for the distribution business, offering
options to consumers, through the concepts of open access and multiple licensees in the same area
of supply. Multi-Year Tariff (MYT) framework is an important structural incentive to minimize
risks for utilities and consumers, promote efficiency and rapid reduction of system losses. It would
serve public interest through economic efficiency and improved service quality. A time-bound
programme should be drawn up by the State Electricity Regulatory Commissions (SERC) for
OPERATIONAL & FINANCIAL VIABILITY OF DISTRIBUTION UTILITIES IN MAJOR STATES OF
INDIA
National Power Training Institute (NPTI) | | ICRA Management Consulting Services Ltd (IMaCS) 26
segregation of technical and commercial losses through energy audits resort to cherry picking by
demanding unreasonable connection charges from consumers.
The Act mandates supply of electricity through a correct meter within a stipulated period. The
Authority should develop regulations as required under Section 55 of the Act within three months.
The Act requires all consumers to be metered within two years. SCADA and data management
systems are useful for efficient working of Distribution Systems. High Voltage Distribution
System is an effective method for reduction of technical losses, prevention of theft, improved
voltage profile and better consumer service. It should be promoted to reduce LT/HT ratios keeping
in view the techno economic considerations.
3.1.3 OTHER LITERATURES
Anoop Singh in his studies - Policy Environment and Regulatory Reforms for Private and Foreign
Investment in Developing Countries: A Case of the Indian Power Sector undertook a review of the
policy and regulatory developments in the Indian power sector. A review of the literature and a
comparative policy analysis helped us to unravel some of the lessons to be learned for the process
of reform in developing countries in general. The initial phase of power sector reform in India
allowed commercially-oriented IPPs to sell power to financially weak SEBs, which do not rely on
sound commercial principles. This marriage of convenience is not sustainable. The experience of
private sector investment in Latin American countries relied on the introduction of commercial
interest in the bulk power market by inviting IPPs as well as introducing commercial principles at
the end of buyer utilities through their divestiture. The long-term interest of the consumers can
only be served if reasonably priced electricity is available over the long-run. Political interests
would best be served by depoliticizing tariffs, which would be beneficial to consumers in the long-
term through improved quality and reliability of supply. Given the objective to electrify all villages
by 2010 and to double the generating capacity in the country by 2012, the need to improve the
policy environment and strengthen the regulatory framework cannot be ignored.
Sanjeeb Kumar Dey in his studies – Revenue Sustainability through Electricity Distribution
Franchisee; suggested that after completing the infrastructure development, improving the quality
OPERATIONAL & FINANCIAL VIABILITY OF DISTRIBUTION UTILITIES IN MAJOR STATES OF
INDIA
National Power Training Institute (NPTI) | | ICRA Management Consulting Services Ltd (IMaCS) 27
of services than the third step of revenue sustainability i.e bridge the gap of revenue and
expenditure is again a mind boggling task. It is imperative to bridge the gap and there are three
easy ways: Increase the Tariff – the consumer has to pay more – impossible for the rural
consumers, Government Subsidies – the taxpayer has to pay more – not acceptable under the
present arena when the taxpayer are paying more and Utilities bearing the gap – till the coffer
extinct- again U turn to the pre-reform era. To address the above it’s only imperative towards the
approach of Revenue sustainability. They also explain the distribution franchisee functioning with
the help of SHGs and contribution towards revenue sustainability in Electricity sector.
OPERATIONAL & FINANCIAL VIABILITY OF DISTRIBUTION UTILITIES IN MAJOR STATES OF
INDIA
National Power Training Institute (NPTI) | | ICRA Management Consulting Services Ltd (IMaCS) 28
3.2. RESEARCH METHODOLOGY
3.2.1 FILTERING OF DATA
Two way filtering has been applied one is for parameters and other is for states. This has been
done to provide more insights into the report.
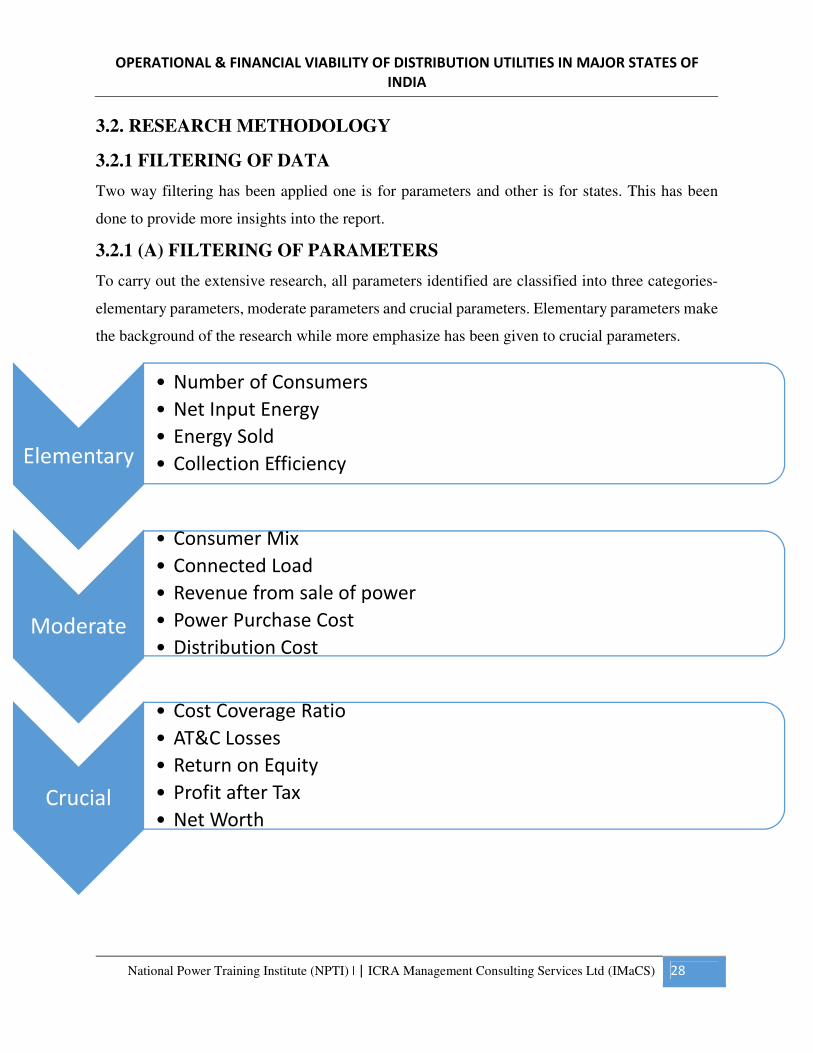
3.2.1 (A) FILTERING OF PARAMETERS
To carry out the extensive research, all parameters identified are classified into three categories-
elementary parameters, moderate parameters and crucial parameters. Elementary parameters make
the background of the research while more emphasize has been given to crucial parameters.
Elementary
• Number of Consumers
• Net Input Energy
• Energy Sold
• Collection Efficiency
Moderate
• Consumer Mix
• Connected Load
• Revenue from sale of power
• Power Purchase Cost
• Distribution Cost
Crucial
• Cost Coverage Ratio
• AT&C Losses
• Return on Equity
• Profit after Tax
• Net Worth
OPERATIONAL & FINANCIAL VIABILITY OF DISTRIBUTION UTILITIES IN MAJOR STATES OF
INDIA
National Power Training Institute (NPTI) | | ICRA Management Consulting Services Ltd (IMaCS) 29
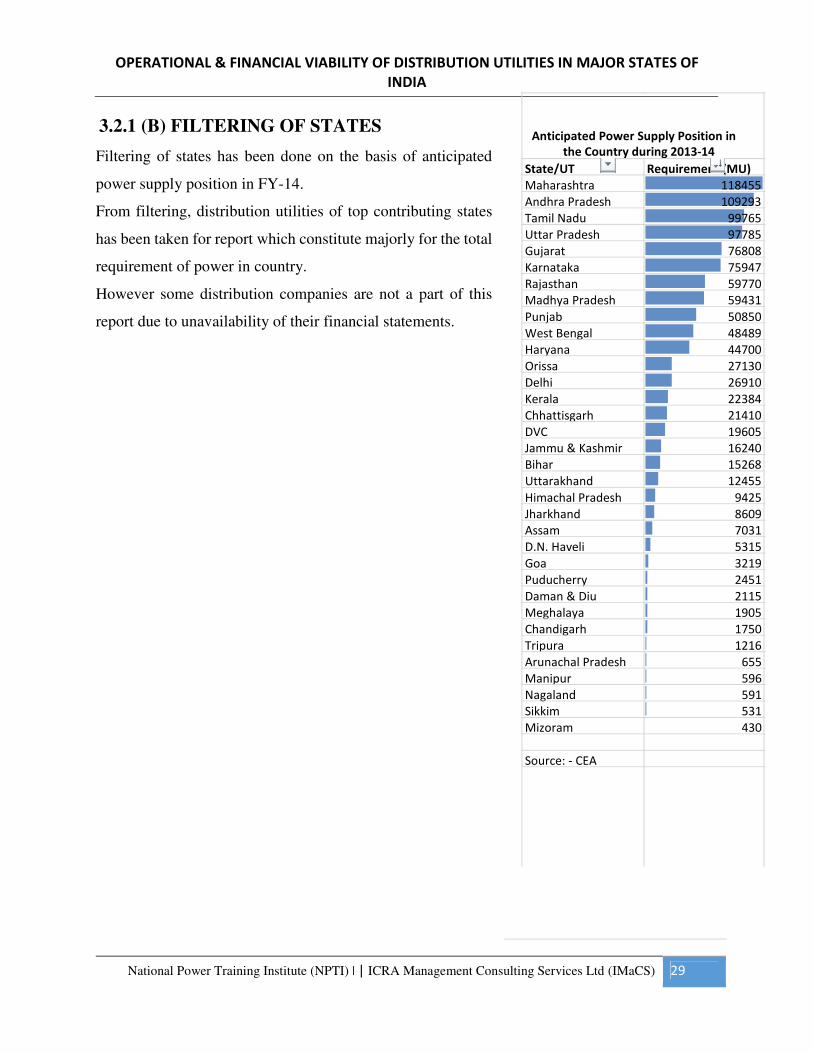
3.2.1 (B) FILTERING OF STATES
Filtering of states has been done on the basis of anticipated
power supply position in FY-14.
From filtering, distribution utilities of top contributing states
has been taken for report which constitute majorly for the total
requirement of power in country.
However some distribution companies are not a part of this
report due to unavailability of their financial statements.
State/UT Requirement (MU)
Maharashtra 118455
Andhra Pradesh 109293
Tamil Nadu 99765
Uttar Pradesh 97785
Gujarat 76808
Karnataka 75947
Rajasthan 59770 Madhya Pradesh 59431
Punjab 50850
West Bengal 48489
Haryana 44700
Orissa 27130
Delhi 26910
Kerala 22384
Chhattisgarh 21410
DVC 19605 Jammu & Kashmir 16240
Bihar 15268
Uttarakhand 12455
Himachal Pradesh 9425
Jharkhand 8609 Assam 7031
D.N. Haveli 5315
Goa 3219
Puducherry 2451
Daman & Diu 2115
Meghalaya 1905
Chandigarh 1750
Tripura 1216
Arunachal Pradesh 655
Manipur 596
Nagaland 591 Sikkim 531
Mizoram 430
Source: - CEA
Anticipated Power Supply Position in the Country during 2013-14
OPERATIONAL & FINANCIAL VIABILITY OF DISTRIBUTION UTILITIES IN MAJOR STATES OF
INDIA
National Power Training Institute (NPTI) | | ICRA Management Consulting Services Ltd (IMaCS) 30
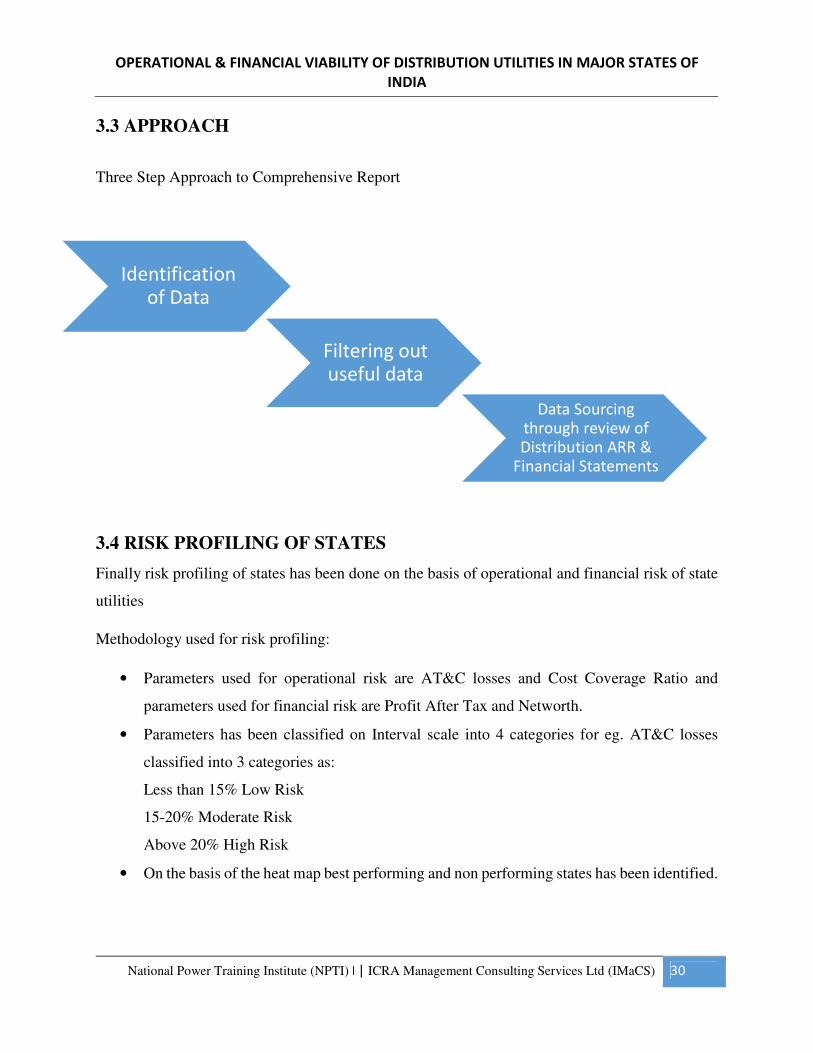
3.3 APPROACH
Three Step Approach to Comprehensive Report
3.4 RISK PROFILING OF STATES
Finally risk profiling of states has been done on the basis of operational and financial risk of state
utilities
Methodology used for risk profiling:
• Parameters used for operational risk are AT&C losses and Cost Coverage Ratio and
parameters used for financial risk are Profit After Tax and Networth.
• Parameters has been classified on Interval scale into 4 categories for eg. AT&C losses
classified into 3 categories as:
Less than 15% Low Risk
15-20% Moderate Risk
Above 20% High Risk
• On the basis of the heat map best performing and non performing states has been identified.
Identification of Data
Filtering out useful data
Data Sourcing through review of Distribution ARR &
Financial Statements
OPERATIONAL & FINANCIAL VIABILITY OF DISTRIBUTION UTILITIES IN MAJOR STATES OF
INDIA
National Power Training Institute (NPTI) | | ICRA Management Consulting Services Ltd (IMaCS) 31
CHAPTER 4: FACTS AND ANALYSIS OF ANDHRA PRADESH
4.1 OVERALL SCENARIO
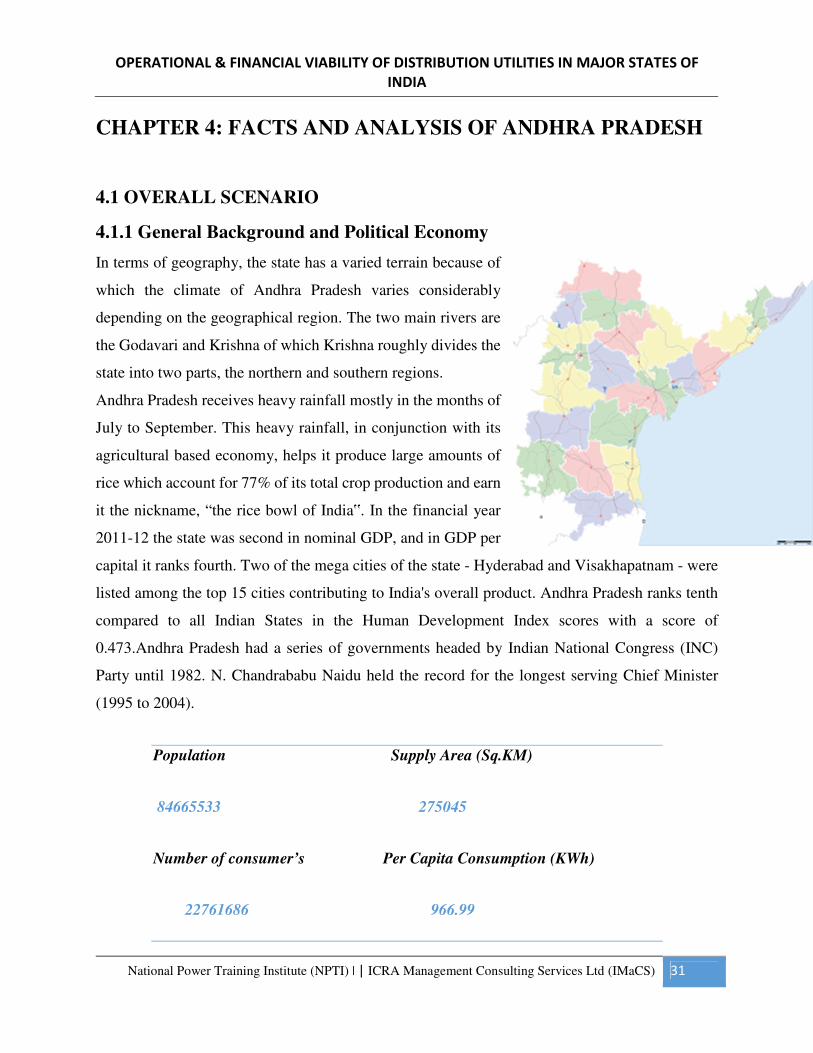
4.1.1 General Background and Political Economy
In terms of geography, the state has a varied terrain because of
which the climate of Andhra Pradesh varies considerably
depending on the geographical region. The two main rivers are
the Godavari and Krishna of which Krishna roughly divides the
state into two parts, the northern and southern regions.
Andhra Pradesh receives heavy rainfall mostly in the months of
July to September. This heavy rainfall, in conjunction with its
agricultural based economy, helps it produce large amounts of
rice which account for 77% of its total crop production and earn
it the nickname, “the rice bowl of India‟. In the financial year
2011-12 the state was second in nominal GDP, and in GDP per
capital it ranks fourth. Two of the mega cities of the state - Hyderabad and Visakhapatnam - were
listed among the top 15 cities contributing to India's overall product. Andhra Pradesh ranks tenth
compared to all Indian States in the Human Development Index scores with a score of
0.473.Andhra Pradesh had a series of governments headed by Indian National Congress (INC)
Party until 1982. N. Chandrababu Naidu held the record for the longest serving Chief Minister
(1995 to 2004).
Population Supply Area (Sq.KM)
84665533 275045
Number of consumer’s Per Capita Consumption (KWh)
22761686 966.99
OPERATIONAL & FINANCIAL VIABILITY OF DISTRIBUTION UTILITIES IN MAJOR STATES OF
INDIA
National Power Training Institute (NPTI) | | ICRA Management Consulting Services Ltd (IMaCS) 32
4.1.2 Power Sector – Overview & Evolution of Reforms
Andhra Pradesh has the fourth largest power generating utility in the country, with an installed
capacity of around 10,650 MW. The two cheapest sources of thermal power generation – coal and
natural gas – are in abundance. The state has a large amount of coal reserves and it ranks first
nationwide in hydro electricity generation, with a national market share of over 11%.
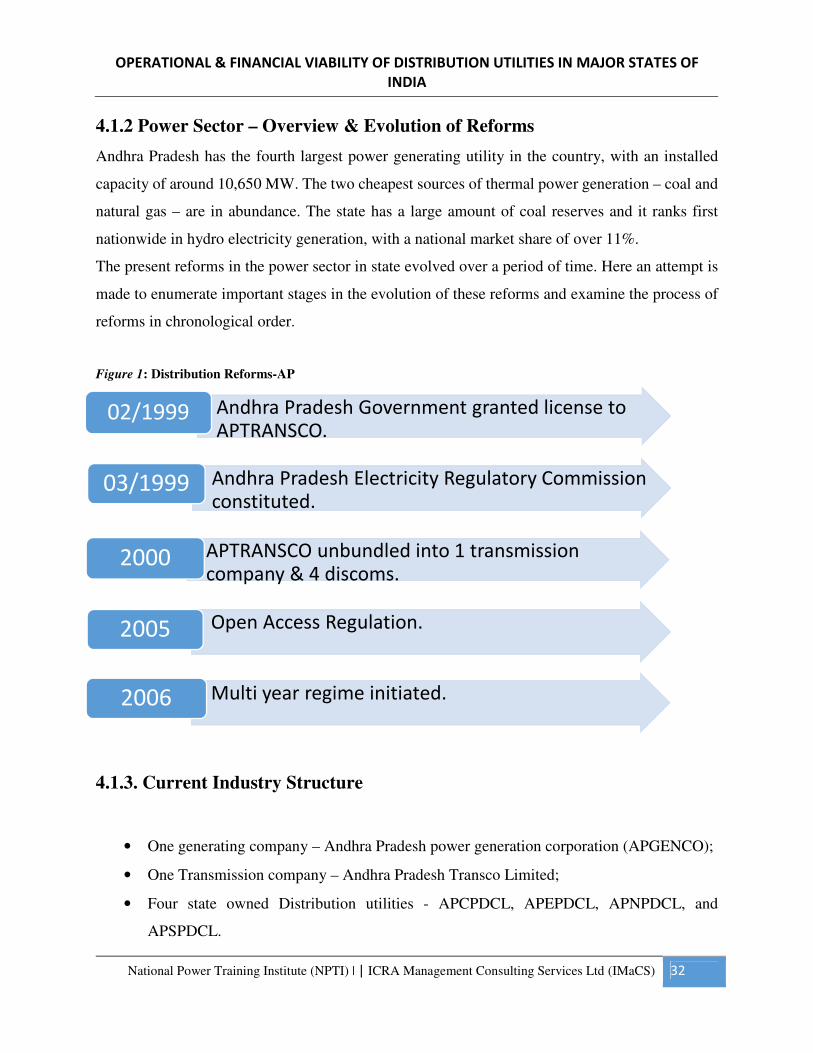
The present reforms in the power sector in state evolved over a period of time. Here an attempt is
made to enumerate important stages in the evolution of these reforms and examine the process of
reforms in chronological order.
Figure 1: Distribution Reforms-AP
4.1.3. Current Industry Structure
• One generating company – Andhra Pradesh power generation corporation (APGENCO);
• One Transmission company – Andhra Pradesh Transco Limited;
• Four state owned Distribution utilities - APCPDCL, APEPDCL, APNPDCL, and
APSPDCL.
• Andhra Pradesh Government granted license to APTRANSCO.
02/1999
• Andhra Pradesh Electricity Regulatory Commission constituted.
03/1999
• APTRANSCO unbundled into 1 transmission company & 4 discoms.
2000
• Open Access Regulation.2005
• Multi year regime initiated.2006
OPERATIONAL & FINANCIAL VIABILITY OF DISTRIBUTION UTILITIES IN MAJOR STATES OF
INDIA
National Power Training Institute (NPTI) | | ICRA Management Consulting Services Ltd (IMaCS) 33
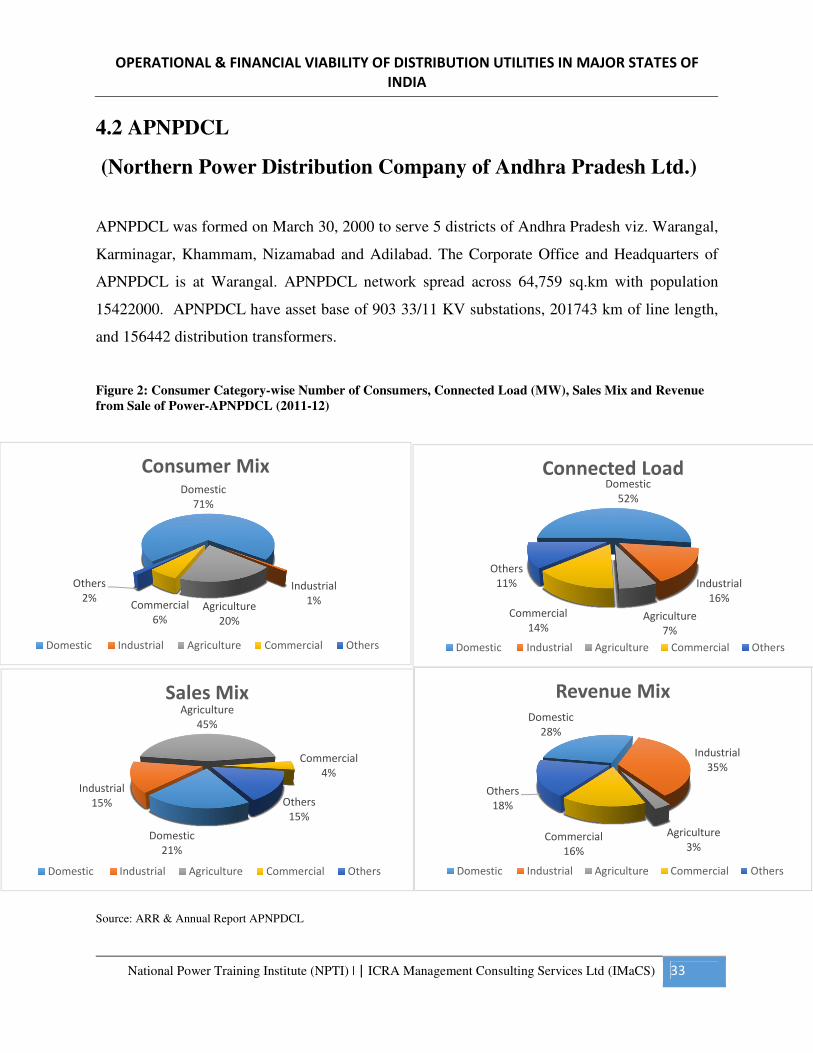
4.2 APNPDCL
(Northern Power Distribution Company of Andhra Pradesh Ltd.)
APNPDCL was formed on March 30, 2000 to serve 5 districts of Andhra Pradesh viz. Warangal,
Karminagar, Khammam, Nizamabad and Adilabad. The Corporate Office and Headquarters of
APNPDCL is at Warangal. APNPDCL network spread across 64,759 sq.km with population
15422000. APNPDCL have asset base of 903 33/11 KV substations, 201743 km of line length,
and 156442 distribution transformers.
Figure 2: Consumer Category-wise Number of Consumers, Connected Load (MW), Sales Mix and Revenue
from Sale of Power-APNPDCL (2011-12)
Source: ARR & Annual Report APNPDCL
Domestic
71%
Industrial
1%Agriculture
20%
Commercial
6%
Others
2%
Consumer Mix
Domestic Industrial Agriculture Commercial Others
Domestic
52%
Industrial
16%
Agriculture
7%
Commercial
14%
Others
11%
Connected Load
Domestic Industrial Agriculture Commercial Others
Domestic
28%
Industrial
35%
Agriculture
3%Commercial
16%
Others
18%
Revenue Mix
Domestic Industrial Agriculture Commercial Others
Domestic
21%
Industrial
15%
Agriculture
45%
Commercial
4%
Others
15%
Sales Mix
Domestic Industrial Agriculture Commercial Others
OPERATIONAL & FINANCIAL VIABILITY OF DISTRIBUTION UTILITIES IN MAJOR STATES OF
INDIA
National Power Training Institute (NPTI) | | ICRA Management Consulting Services Ltd (IMaCS) 34
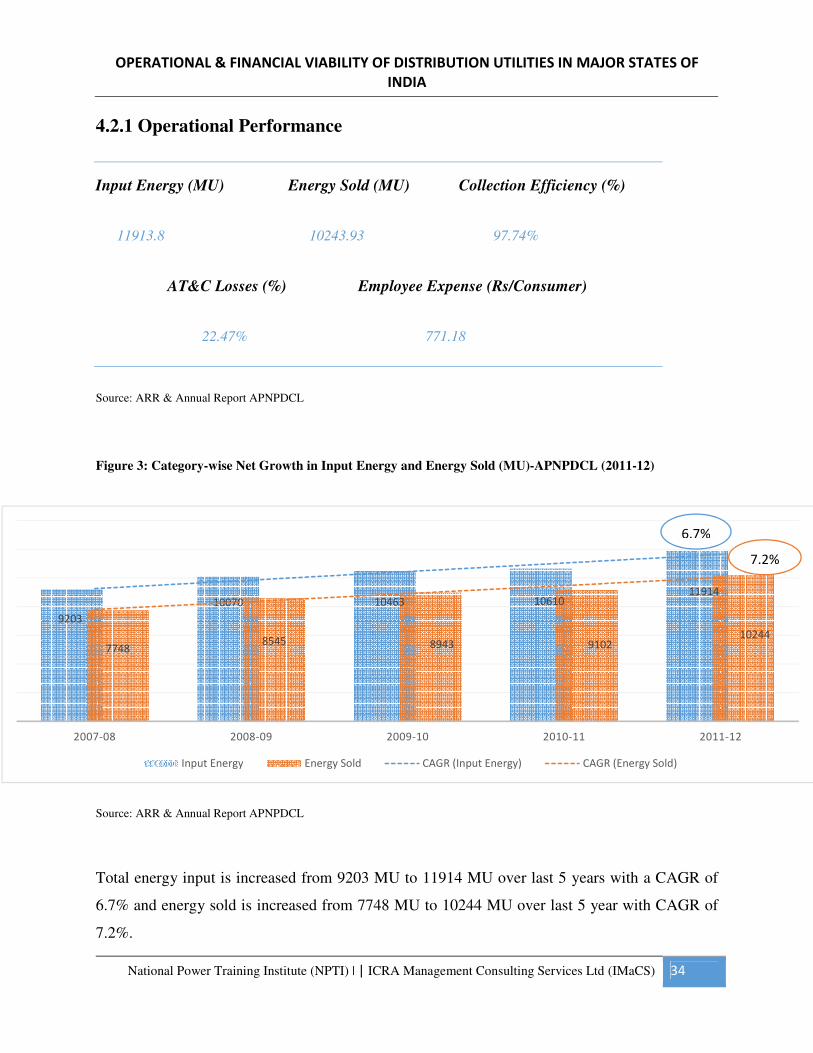
4.2.1 Operational Performance
Input Energy (MU) Energy Sold (MU) Collection Efficiency (%)
11913.8 10243.93 97.74%
AT&C Losses (%) Employee Expense (Rs/Consumer)
22.47% 771.18
Source: ARR & Annual Report APNPDCL
Figure 3: Category-wise Net Growth in Input Energy and Energy Sold (MU)-APNPDCL (2011-12)
Source: ARR & Annual Report APNPDCL
Total energy input is increased from 9203 MU to 11914 MU over last 5 years with a CAGR of
6.7% and energy sold is increased from 7748 MU to 10244 MU over last 5 year with CAGR of
7.2%.
9203
10070 10463 1061011914
77488545 8943 9102
10244
2007-08 2008-09 2009-10 2010-11 2011-12
Input Energy Energy Sold CAGR (Input Energy) CAGR (Energy Sold)
6.7%
7.2%
OPERATIONAL & FINANCIAL VIABILITY OF DISTRIBUTION UTILITIES IN MAJOR STATES OF
INDIA
National Power Training Institute (NPTI) | | ICRA Management Consulting Services Ltd (IMaCS) 35
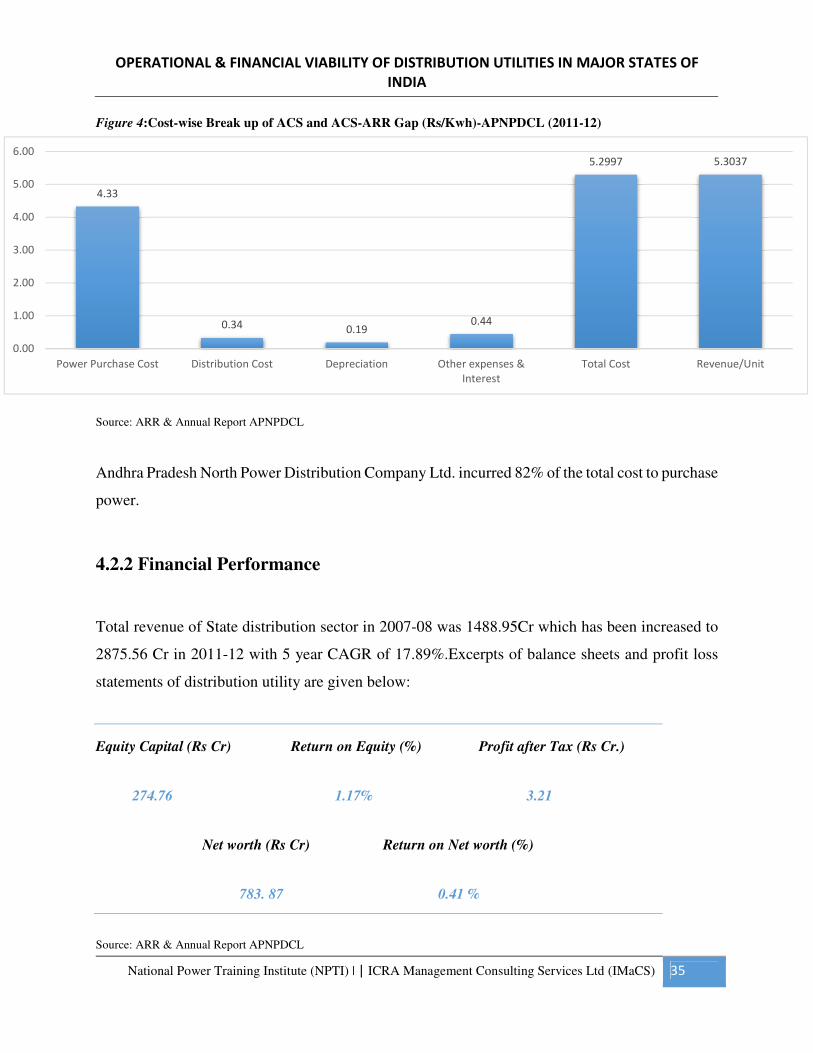
Figure 4:Cost-wise Break up of ACS and ACS-ARR Gap (Rs/Kwh)-APNPDCL (2011-12)
Source: ARR & Annual Report APNPDCL
Andhra Pradesh North Power Distribution Company Ltd. incurred 82% of the total cost to purchase
power.
4.2.2 Financial Performance
Total revenue of State distribution sector in 2007-08 was 1488.95Cr which has been increased to
2875.56 Cr in 2011-12 with 5 year CAGR of 17.89%.Excerpts of balance sheets and profit loss
statements of distribution utility are given below:
Equity Capital (Rs Cr) Return on Equity (%) Profit after Tax (Rs Cr.)
274.76 1.17% 3.21
Net worth (Rs Cr) Return on Net worth (%)
783. 87 0.41 %
Source: ARR & Annual Report APNPDCL
4.33
0.34 0.190.44
5.2997 5.3037
0.00
1.00
2.00
3.00
4.00
5.00
6.00
Power Purchase Cost Distribution Cost Depreciation Other expenses &
Interest
Total Cost Revenue/Unit
OPERATIONAL & FINANCIAL VIABILITY OF DISTRIBUTION UTILITIES IN MAJOR STATES OF
INDIA
National Power Training Institute (NPTI) | | ICRA Management Consulting Services Ltd (IMaCS) 36
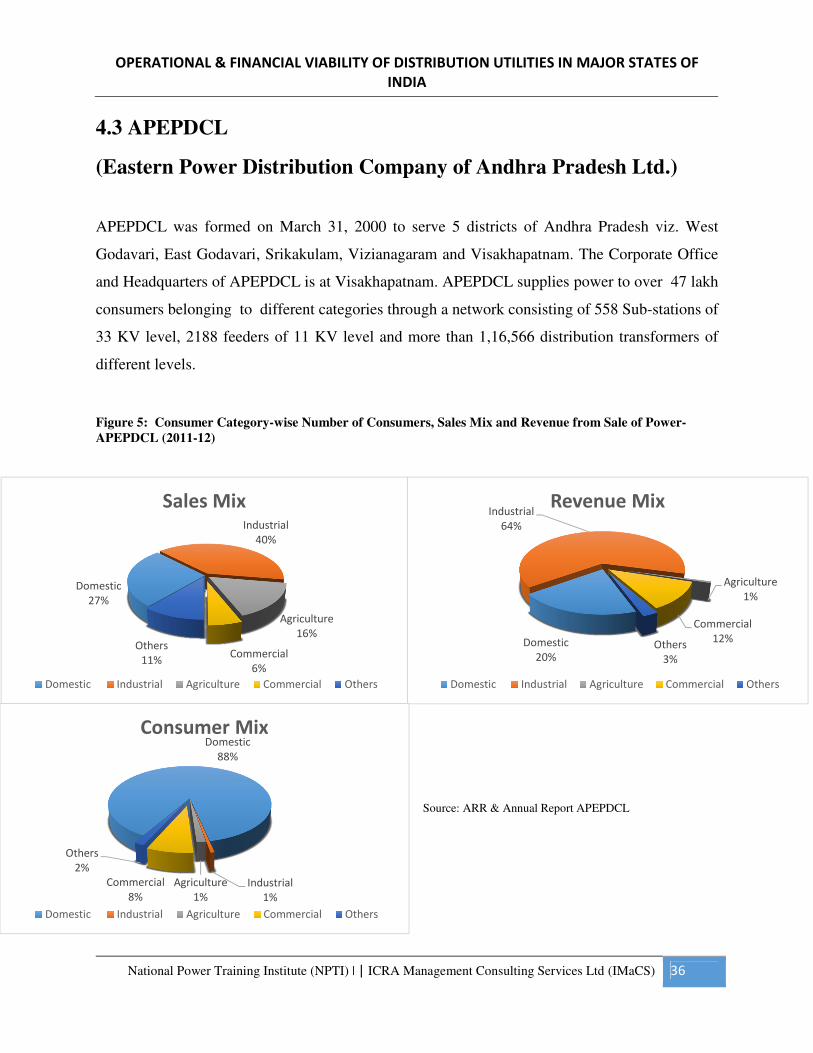
4.3 APEPDCL
(Eastern Power Distribution Company of Andhra Pradesh Ltd.)
APEPDCL was formed on March 31, 2000 to serve 5 districts of Andhra Pradesh viz. West
Godavari, East Godavari, Srikakulam, Vizianagaram and Visakhapatnam. The Corporate Office
and Headquarters of APEPDCL is at Visakhapatnam. APEPDCL supplies power to over 47 lakh
consumers belonging to different categories through a network consisting of 558 Sub-stations of
33 KV level, 2188 feeders of 11 KV level and more than 1,16,566 distribution transformers of
different levels.
Figure 5: Consumer Category-wise Number of Consumers, Sales Mix and Revenue from Sale of Power-
APEPDCL (2011-12)
Source: ARR & Annual Report APEPDCL
Domestic
27%
Industrial
40%
Agriculture
16%
Commercial
6%
Others
11%
Sales Mix
Domestic Industrial Agriculture Commercial Others
Domestic
20%
Industrial
64%
Agriculture
1%
Commercial
12%Others
3%
Revenue Mix
Domestic Industrial Agriculture Commercial Others
Domestic
88%
Industrial
1%
Agriculture
1%
Commercial
8%
Others
2%
Consumer Mix
Domestic Industrial Agriculture Commercial Others
OPERATIONAL & FINANCIAL VIABILITY OF DISTRIBUTION UTILITIES IN MAJOR STATES OF
INDIA
National Power Training Institute (NPTI) | | ICRA Management Consulting Services Ltd (IMaCS) 37
4.3.1 Operational Performance
Input Energy (MU) Energy Sold (MU) Collection Efficiency (%)
12595 11725.82 97.14%
AT&C Losses (%) Employee Expense (Rs/Consumer)
12.9% 939.45
Source: ARR & Annual Report APEPDCL
Figure 6: Category-wise Net Growth in Input Energy and Energy Sold (MU)-APEPDCL (2011-12)
Source: ARR & Annual Report APEPDCL
Total energy input is increased from 9251 MU to 12595 MU over last 5 years with a CAGR of
8.02% and energy sold is increased from 8059 MU to 11726 MU over last 5 year with CAGR of
9.83%.
92519889
11261 1160312595
8059 86929869 10366
11726
2007-08 2008-09 2009-10 2010-11 2011-12
Input Energy Energy Sold CAGR (Input Energy) CAGR (Energy Sold)
8.02%
9.83%
OPERATIONAL & FINANCIAL VIABILITY OF DISTRIBUTION UTILITIES IN MAJOR STATES OF
INDIA
National Power Training Institute (NPTI) | | ICRA Management Consulting Services Ltd (IMaCS) 38
Figure 7:Cost-wise Break up of ACS and ACS-ARR Gap (Rs/Kwh)-APEPDCL (2011-12)
Source: ARR & Annual Report APEPDCL
Andhra Pradesh Eastern Power Distribution Company Ltd. incurred 82% of the total cost to
purchase power.
4.3.2 Financial Performance
Total revenue of State distribution sector in 2007-08 was 2766.23 Cr which has been increased to
5508.23 Cr in 2011-12 with 5 year CAGR of 18.79%.Excerpts of balance sheets and profit loss
statements of distribution utility are given below:
Equity Capital (Rs Cr) Return on Equity (%) Profit after Tax (Rs Cr.)
121.26 20.82% 25.24
Net worth (Rs Cr) Return on Net worth (%)
413.3 6.1 %
Source: ARR & Annual Report APEPDCL
4.43
0.510.19 0.29
5.41 5.43
0.00
1.00
2.00
3.00
4.00
5.00
6.00
Power Purchase Cost Distribution Cost Depreciation Other expenses &
Interest
Total Cost Revenue/Unit
OPERATIONAL & FINANCIAL VIABILITY OF DISTRIBUTION UTILITIES IN MAJOR STATES OF
INDIA
National Power Training Institute (NPTI) | | ICRA Management Consulting Services Ltd (IMaCS) 39
4.4 APCPDCL (Central Power Distribution Company of Andhra
Pradesh Ltd)
APCPDCL was formed on April 1, 2000 to serve 7 districts of Andhra Pradesh viz. Anantapur,
Kurnool, Mahaboobnagar, Nalgonda, Medak and Rangareddy .The Corporate Office and
Headquarters of APCPDCL is at Hyderabad. APCPDCL has a vast infrastructure facility in its
operating area with 1,338 Nos. of 33/11 KV substations, 2,039 Nos. of power transformers, 720
Nos. of 33 KV feeders, 5,257 Nos. of 11 KV feeders and around 246426 Nos. of distribution
transformers of various capacities.
Figure 8: Consumer Category-wise Number of Consumers, Connected Load (MW), Sales Mix and Revenue
from Sale of Power-APCPDCL (2011-12)
Source: ARR & Annual Report APCPDCL
Domestic
75%
Industrial
1%Agriculture
13%
Commercial
10%
Others
1%
Consumer Mix
Domestic Industrial Agriculture Commercial Others
Domestic
49%
Industrial
22%
Agriculture
3%
Commercial
22%
Others
4%
Connected Load
Domestic Industrial Agriculture Commercial Others
Domestic
19%
Industrial
37%
Agriculture
29%
Commercial
12%
Others
3%
Sales Mix
Domestic Industrial Agriculture Commercial Others
Domestic
18%
Commercial
24%
Industrial
53%
Agriculture
1%Others
4%
Revenue Mix
Domestic Commercial Industrial Agriculture Others
OPERATIONAL & FINANCIAL VIABILITY OF DISTRIBUTION UTILITIES IN MAJOR STATES OF
INDIA
National Power Training Institute (NPTI) | | ICRA Management Consulting Services Ltd (IMaCS) 40
4.4.1 Operational Performance
Input Energy (MU) Energy Sold (MU) Collection Efficiency (%)
37161 31597 98.01%
AT&C Losses (%) Employee Expense (Rs/Consumer)
18.7% 1095.07
Source: ARR & Annual Report APCPDCL
Figure 9: Category-wise Net Growth in Input Energy and Energy Sold (MU)-APCPDCL (2011-12)
Source: ARR & Annual Report APCPDCL
Total energy input is increased from 26257 MU to 37161 MU over last 5 years with a CAGR of
9.07% and energy sold is increased from 21793 MU to 31597 MU over last 5 year with CAGR of
9.73%.
26257
29324
31933
34082
37161.75
2179324492
2661028741
31597.2
2007-08 2008-09 2009-10 2010-11 2011-12
Input Energy Energy Sold CAGR (Input Energy) CAGR (Energy Sold)
9.07%
9.73%
OPERATIONAL & FINANCIAL VIABILITY OF DISTRIBUTION UTILITIES IN MAJOR STATES OF
INDIA
National Power Training Institute (NPTI) | | ICRA Management Consulting Services Ltd (IMaCS) 41
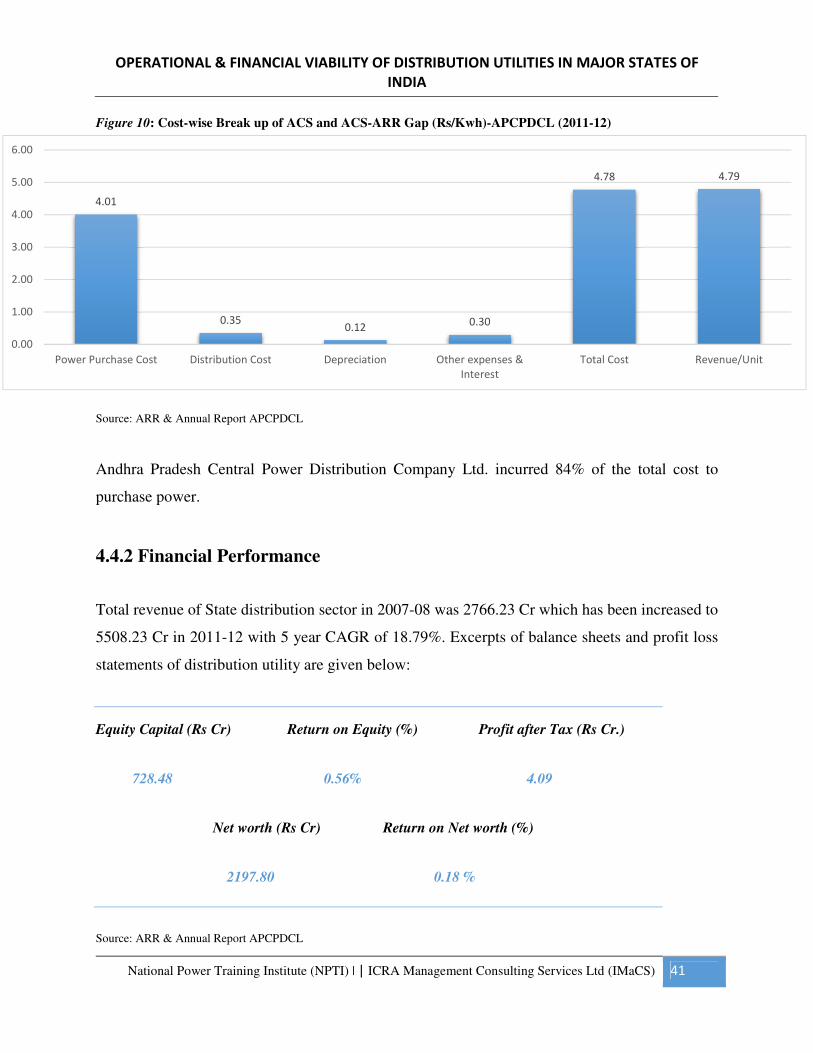
Figure 10: Cost-wise Break up of ACS and ACS-ARR Gap (Rs/Kwh)-APCPDCL (2011-12)
Source: ARR & Annual Report APCPDCL
Andhra Pradesh Central Power Distribution Company Ltd. incurred 84% of the total cost to
purchase power.
4.4.2 Financial Performance
Total revenue of State distribution sector in 2007-08 was 2766.23 Cr which has been increased to
5508.23 Cr in 2011-12 with 5 year CAGR of 18.79%. Excerpts of balance sheets and profit loss
statements of distribution utility are given below:
Equity Capital (Rs Cr) Return on Equity (%) Profit after Tax (Rs Cr.)
728.48 0.56% 4.09
Net worth (Rs Cr) Return on Net worth (%)
2197.80 0.18 %
Source: ARR & Annual Report APCPDCL
4.01
0.350.12
0.30
4.78 4.79
0.00
1.00
2.00
3.00
4.00
5.00
6.00
Power Purchase Cost Distribution Cost Depreciation Other expenses &
Interest
Total Cost Revenue/Unit
OPERATIONAL & FINANCIAL VIABILITY OF DISTRIBUTION UTILITIES IN MAJOR STATES OF
INDIA
National Power Training Institute (NPTI) | | ICRA Management Consulting Services Ltd (IMaCS) 42
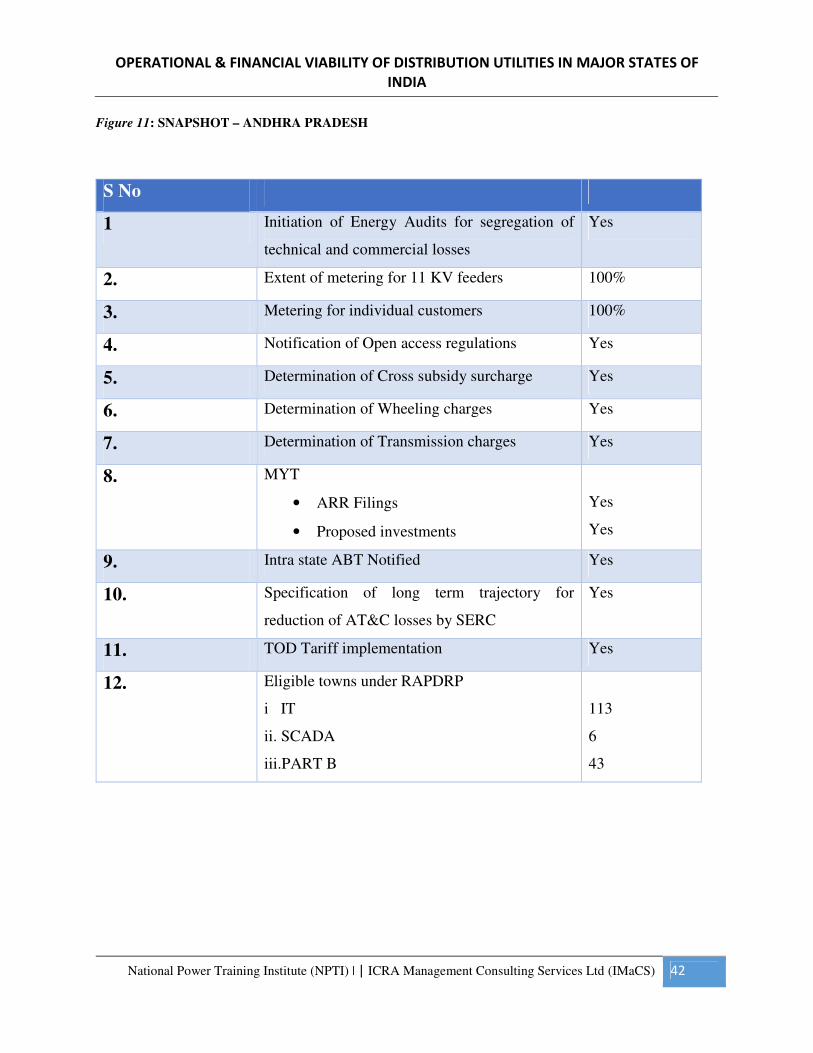
Figure 11: SNAPSHOT – ANDHRA PRADESH
S No
1 Initiation of Energy Audits for segregation of
technical and commercial losses
Yes
2. Extent of metering for 11 KV feeders 100%
3. Metering for individual customers 100%
4. Notification of Open access regulations Yes
5. Determination of Cross subsidy surcharge Yes
6. Determination of Wheeling charges Yes
7. Determination of Transmission charges Yes
8. MYT
• ARR Filings
• Proposed investments
Yes
Yes
9. Intra state ABT Notified Yes
10. Specification of long term trajectory for
reduction of AT&C losses by SERC
Yes
11. TOD Tariff implementation Yes
12. Eligible towns under RAPDRP
i IT
ii. SCADA
iii.PART B
113
6
43
OPERATIONAL & FINANCIAL VIABILITY OF DISTRIBUTION UTILITIES IN MAJOR STATES OF
INDIA
National Power Training Institute (NPTI) | | ICRA Management Consulting Services Ltd (IMaCS) 43
Chapter 5: FACTS AND ANALYSIS OF GUJARAT
5.1 OVERALL SCENARIO
5.1.1 General Background & Political Economy
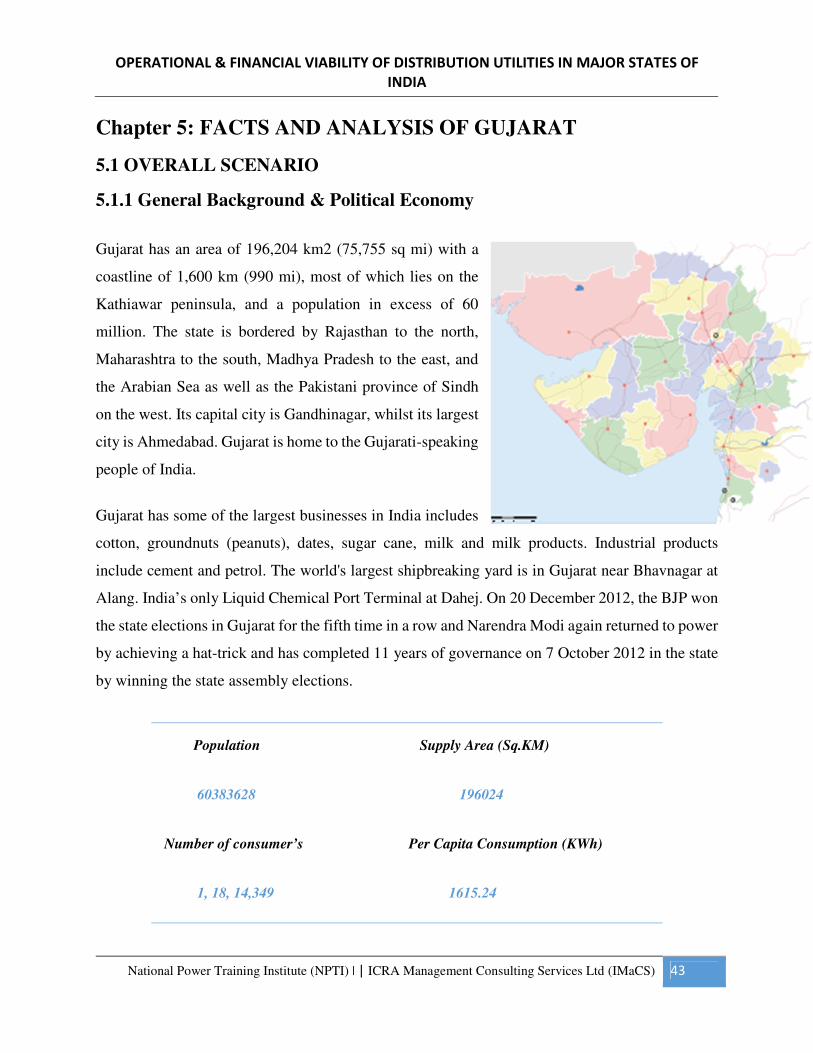
Gujarat has an area of 196,204 km2 (75,755 sq mi) with a
coastline of 1,600 km (990 mi), most of which lies on the
Kathiawar peninsula, and a population in excess of 60
million. The state is bordered by Rajasthan to the north,
Maharashtra to the south, Madhya Pradesh to the east, and
the Arabian Sea as well as the Pakistani province of Sindh
on the west. Its capital city is Gandhinagar, whilst its largest
city is Ahmedabad. Gujarat is home to the Gujarati-speaking
people of India.
Gujarat has some of the largest businesses in India includes
cotton, groundnuts (peanuts), dates, sugar cane, milk and milk products. Industrial products
include cement and petrol. The world's largest shipbreaking yard is in Gujarat near Bhavnagar at
Alang. India’s only Liquid Chemical Port Terminal at Dahej. On 20 December 2012, the BJP won
the state elections in Gujarat for the fifth time in a row and Narendra Modi again returned to power
by achieving a hat-trick and has completed 11 years of governance on 7 October 2012 in the state
by winning the state assembly elections.
Population Supply Area (Sq.KM)
60383628 196024
Number of consumer’s Per Capita Consumption (KWh)
1, 18, 14,349 1615.24
OPERATIONAL & FINANCIAL VIABILITY OF DISTRIBUTION UTILITIES IN MAJOR STATES OF
INDIA
National Power Training Institute (NPTI) | | ICRA Management Consulting Services Ltd (IMaCS) 44
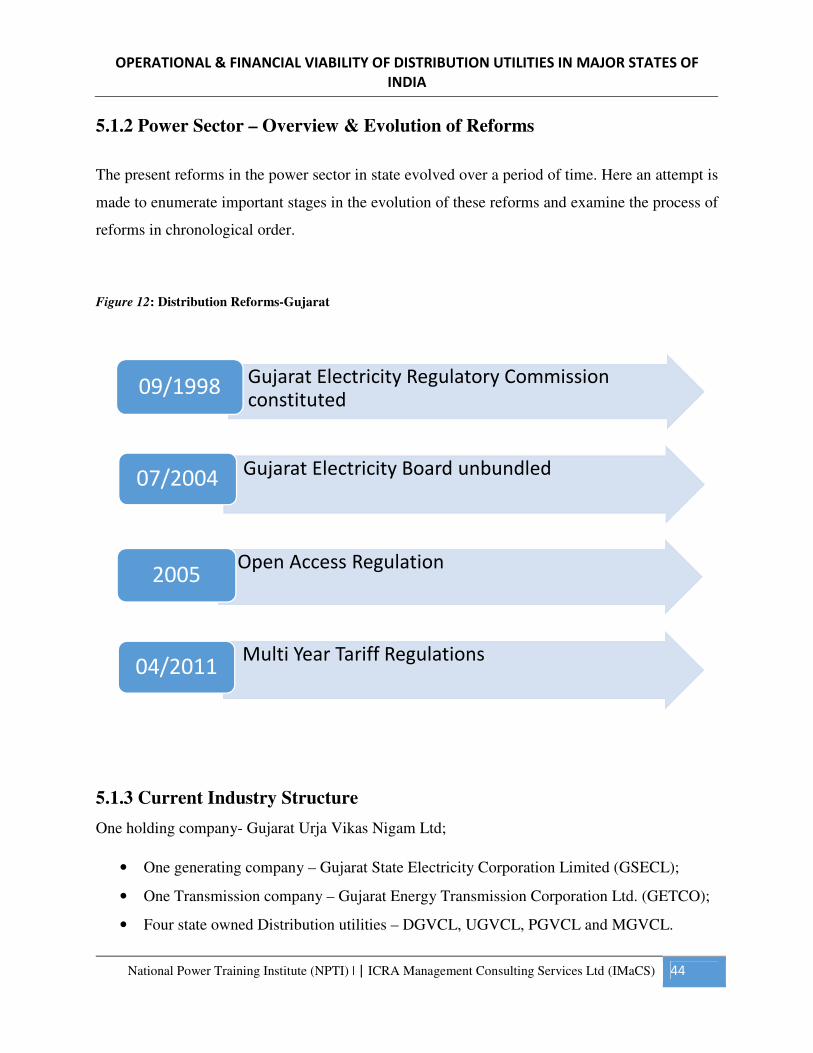
5.1.2 Power Sector – Overview & Evolution of Reforms
The present reforms in the power sector in state evolved over a period of time. Here an attempt is
made to enumerate important stages in the evolution of these reforms and examine the process of
reforms in chronological order.
Figure 12: Distribution Reforms-Gujarat
5.1.3 Current Industry Structure
One holding company- Gujarat Urja Vikas Nigam Ltd;
• One generating company – Gujarat State Electricity Corporation Limited (GSECL);
• One Transmission company – Gujarat Energy Transmission Corporation Ltd. (GETCO);
• Four state owned Distribution utilities – DGVCL, UGVCL, PGVCL and MGVCL.
• Gujarat Electricity Regulatory Commission constituted
09/1998
• Gujarat Electricity Board unbundled07/2004
• Open Access Regulation2005
• Multi Year Tariff Regulations04/2011
OPERATIONAL & FINANCIAL VIABILITY OF DISTRIBUTION UTILITIES IN MAJOR STATES OF
INDIA
National Power Training Institute (NPTI) | | ICRA Management Consulting Services Ltd (IMaCS) 45
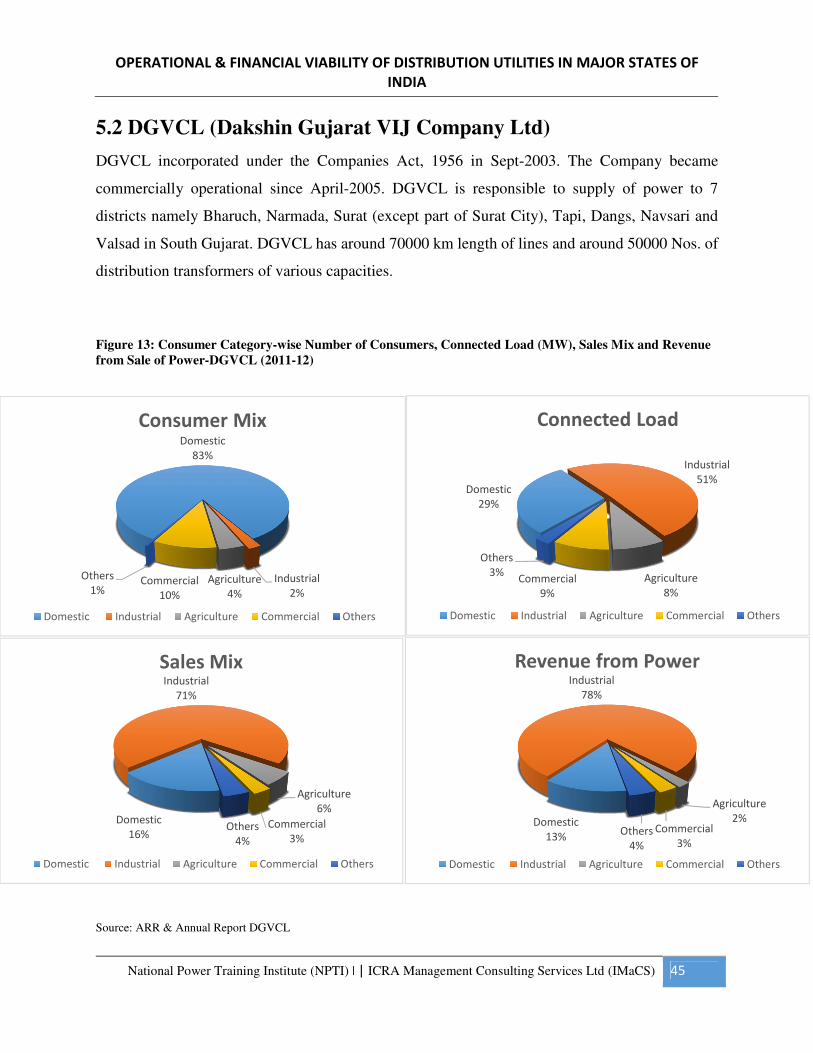
5.2 DGVCL (Dakshin Gujarat VIJ Company Ltd)
DGVCL incorporated under the Companies Act, 1956 in Sept-2003. The Company became
commercially operational since April-2005. DGVCL is responsible to supply of power to 7
districts namely Bharuch, Narmada, Surat (except part of Surat City), Tapi, Dangs, Navsari and
Valsad in South Gujarat. DGVCL has around 70000 km length of lines and around 50000 Nos. of
distribution transformers of various capacities.
Figure 13: Consumer Category-wise Number of Consumers, Connected Load (MW), Sales Mix and Revenue
from Sale of Power-DGVCL (2011-12)
Source: ARR & Annual Report DGVCL
Domestic
83%
Industrial
2%
Agriculture
4%Commercial
10%
Others
1%
Consumer Mix
Domestic Industrial Agriculture Commercial Others
Domestic
29%
Industrial
51%
Agriculture
8%
Commercial
9%
Others
3%
Connected Load
Domestic Industrial Agriculture Commercial Others
Domestic
16%
Industrial
71%
Agriculture
6%
Commercial
3%Others
4%
Sales Mix
Domestic Industrial Agriculture Commercial Others
Domestic
13%
Industrial
78%
Agriculture
2%Commercial
3%Others
4%
Revenue from Power
Domestic Industrial Agriculture Commercial Others
OPERATIONAL & FINANCIAL VIABILITY OF DISTRIBUTION UTILITIES IN MAJOR STATES OF
INDIA
National Power Training Institute (NPTI) | | ICRA Management Consulting Services Ltd (IMaCS) 46
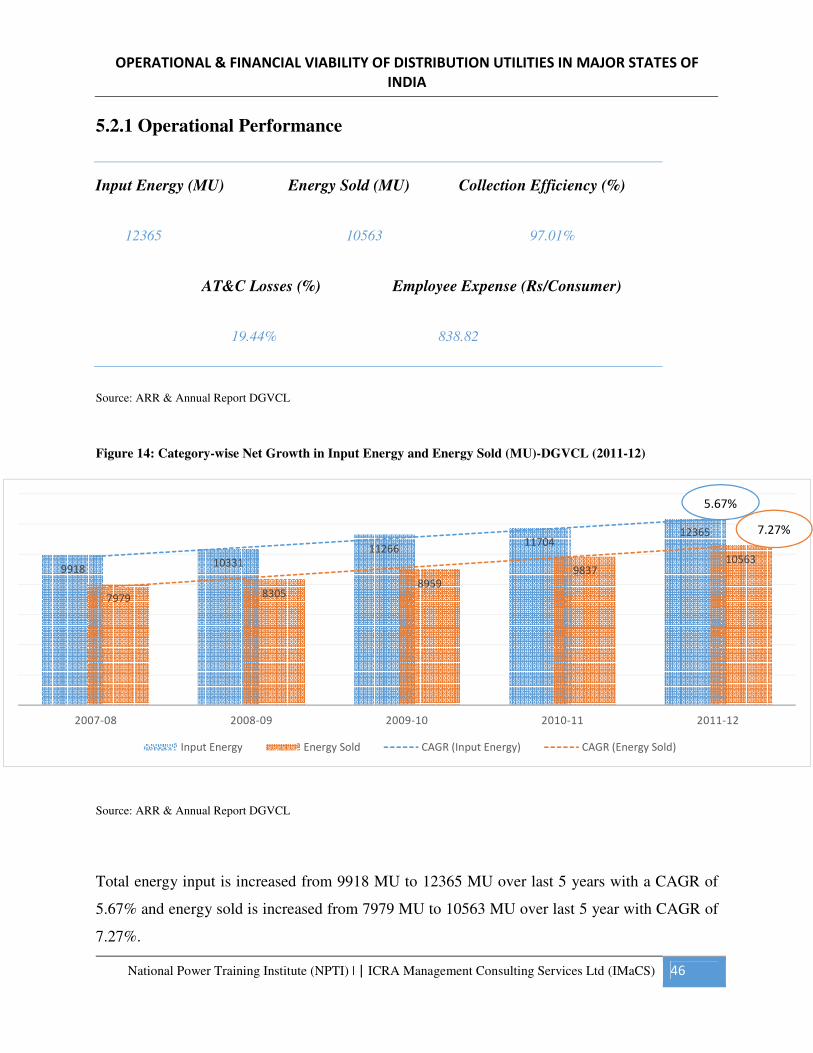
5.2.1 Operational Performance
Input Energy (MU) Energy Sold (MU) Collection Efficiency (%)
12365 10563 97.01%
AT&C Losses (%) Employee Expense (Rs/Consumer)
19.44% 838.82
Source: ARR & Annual Report DGVCL
Figure 14: Category-wise Net Growth in Input Energy and Energy Sold (MU)-DGVCL (2011-12)
Source: ARR & Annual Report DGVCL
Total energy input is increased from 9918 MU to 12365 MU over last 5 years with a CAGR of
5.67% and energy sold is increased from 7979 MU to 10563 MU over last 5 year with CAGR of
7.27%.
991810331
1126611704
12365
7979 83058959
983710563
2007-08 2008-09 2009-10 2010-11 2011-12
Input Energy Energy Sold CAGR (Input Energy) CAGR (Energy Sold)
5.67%
7.27%
OPERATIONAL & FINANCIAL VIABILITY OF DISTRIBUTION UTILITIES IN MAJOR STATES OF
INDIA
National Power Training Institute (NPTI) | | ICRA Management Consulting Services Ltd (IMaCS) 47
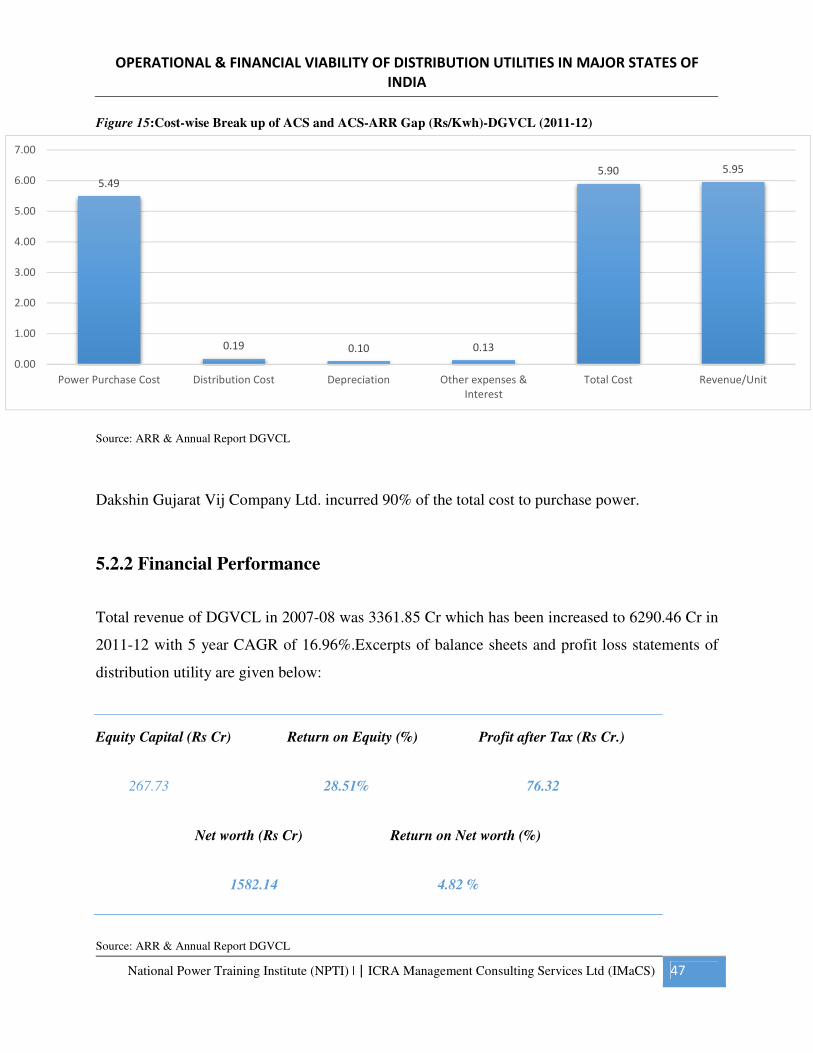
Figure 15:Cost-wise Break up of ACS and ACS-ARR Gap (Rs/Kwh)-DGVCL (2011-12)
Source: ARR & Annual Report DGVCL
Dakshin Gujarat Vij Company Ltd. incurred 90% of the total cost to purchase power.
5.2.2 Financial Performance
Total revenue of DGVCL in 2007-08 was 3361.85 Cr which has been increased to 6290.46 Cr in
2011-12 with 5 year CAGR of 16.96%.Excerpts of balance sheets and profit loss statements of
distribution utility are given below:
Equity Capital (Rs Cr) Return on Equity (%) Profit after Tax (Rs Cr.)
267.73 28.51% 76.32
Net worth (Rs Cr) Return on Net worth (%)
1582.14 4.82 %
Source: ARR & Annual Report DGVCL
5.49
0.19 0.10 0.13
5.90 5.95
0.00
1.00
2.00
3.00
4.00
5.00
6.00
7.00
Power Purchase Cost Distribution Cost Depreciation Other expenses &
Interest
Total Cost Revenue/Unit
OPERATIONAL & FINANCIAL VIABILITY OF DISTRIBUTION UTILITIES IN MAJOR STATES OF
INDIA
National Power Training Institute (NPTI) | | ICRA Management Consulting Services Ltd (IMaCS) 48
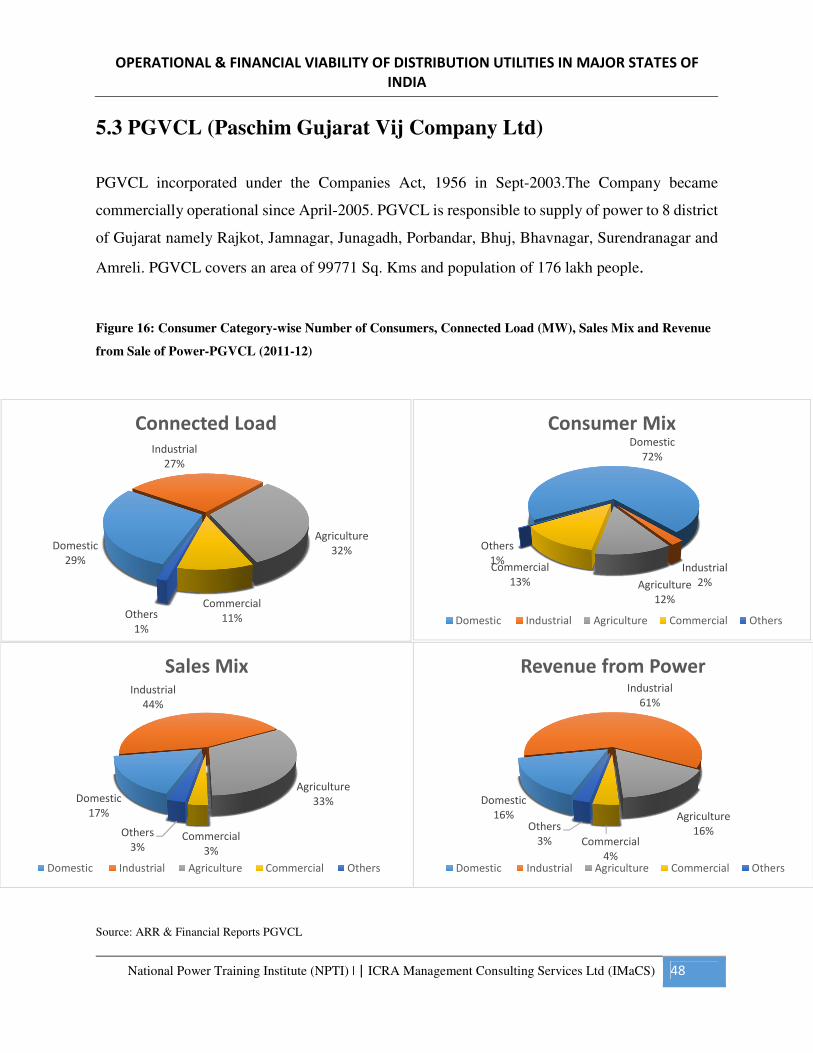
5.3 PGVCL (Paschim Gujarat Vij Company Ltd)
PGVCL incorporated under the Companies Act, 1956 in Sept-2003.The Company became
commercially operational since April-2005. PGVCL is responsible to supply of power to 8 district
of Gujarat namely Rajkot, Jamnagar, Junagadh, Porbandar, Bhuj, Bhavnagar, Surendranagar and
Amreli. PGVCL covers an area of 99771 Sq. Kms and population of 176 lakh people.
Figure 16: Consumer Category-wise Number of Consumers, Connected Load (MW), Sales Mix and Revenue
from Sale of Power-PGVCL (2011-12)
Source: ARR & Financial Reports PGVCL
Domestic
16%
Industrial
61%
Agriculture
16%Commercial
4%
Others
3%
Revenue from Power
Domestic Industrial Agriculture Commercial Others
Domestic
17%
Industrial
44%
Agriculture
33%
Commercial
3%
Others
3%
Sales Mix
Domestic Industrial Agriculture Commercial Others
Domestic
29%
Industrial
27%
Agriculture
32%
Commercial
11%Others
1%
Connected LoadDomestic
72%
Industrial
2%Agriculture
12%
Commercial
13%
Others
1%
Consumer Mix
Domestic Industrial Agriculture Commercial Others
OPERATIONAL & FINANCIAL VIABILITY OF DISTRIBUTION UTILITIES IN MAJOR STATES OF
INDIA
National Power Training Institute (NPTI) | | ICRA Management Consulting Services Ltd (IMaCS) 49
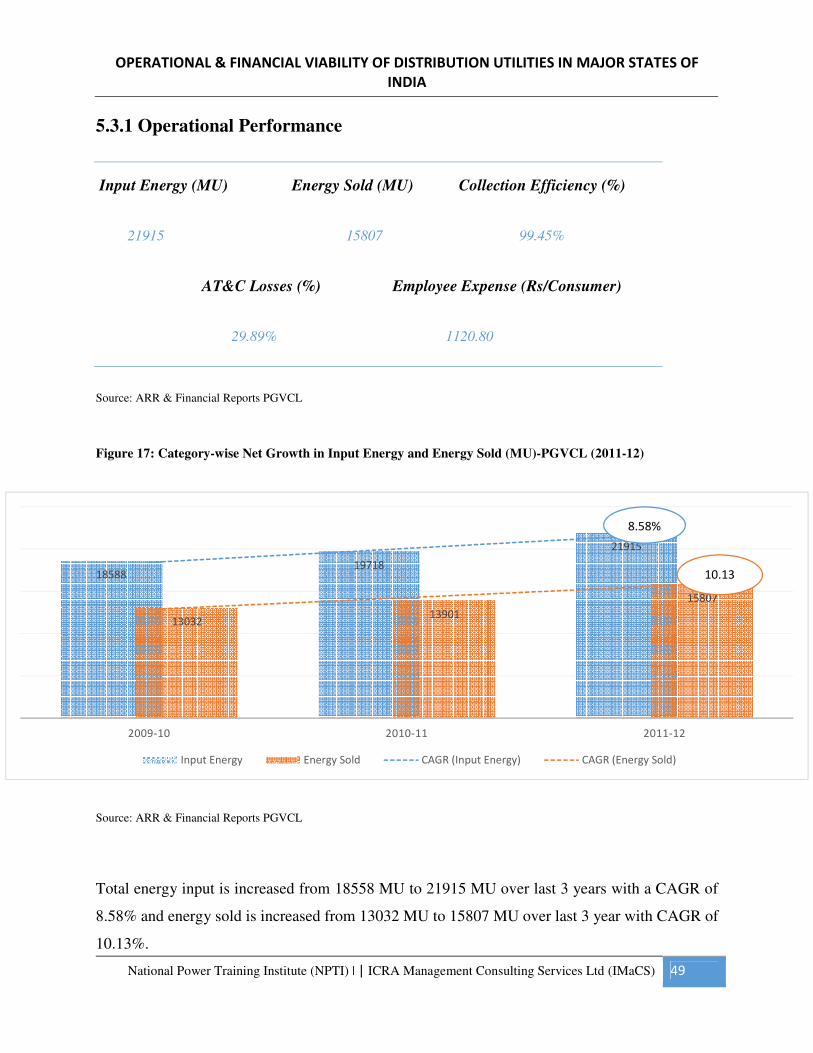
5.3.1 Operational Performance
Input Energy (MU) Energy Sold (MU) Collection Efficiency (%)
21915 15807 99.45%
AT&C Losses (%) Employee Expense (Rs/Consumer)
29.89% 1120.80
Source: ARR & Financial Reports PGVCL
Figure 17: Category-wise Net Growth in Input Energy and Energy Sold (MU)-PGVCL (2011-12)
Source: ARR & Financial Reports PGVCL
Total energy input is increased from 18558 MU to 21915 MU over last 3 years with a CAGR of
8.58% and energy sold is increased from 13032 MU to 15807 MU over last 3 year with CAGR of
10.13%.
1858819718
21915
1303213901
15807
2009-10 2010-11 2011-12
Input Energy Energy Sold CAGR (Input Energy) CAGR (Energy Sold)
8.58%
10.13
OPERATIONAL & FINANCIAL VIABILITY OF DISTRIBUTION UTILITIES IN MAJOR STATES OF
INDIA
National Power Training Institute (NPTI) | | ICRA Management Consulting Services Ltd (IMaCS) 50
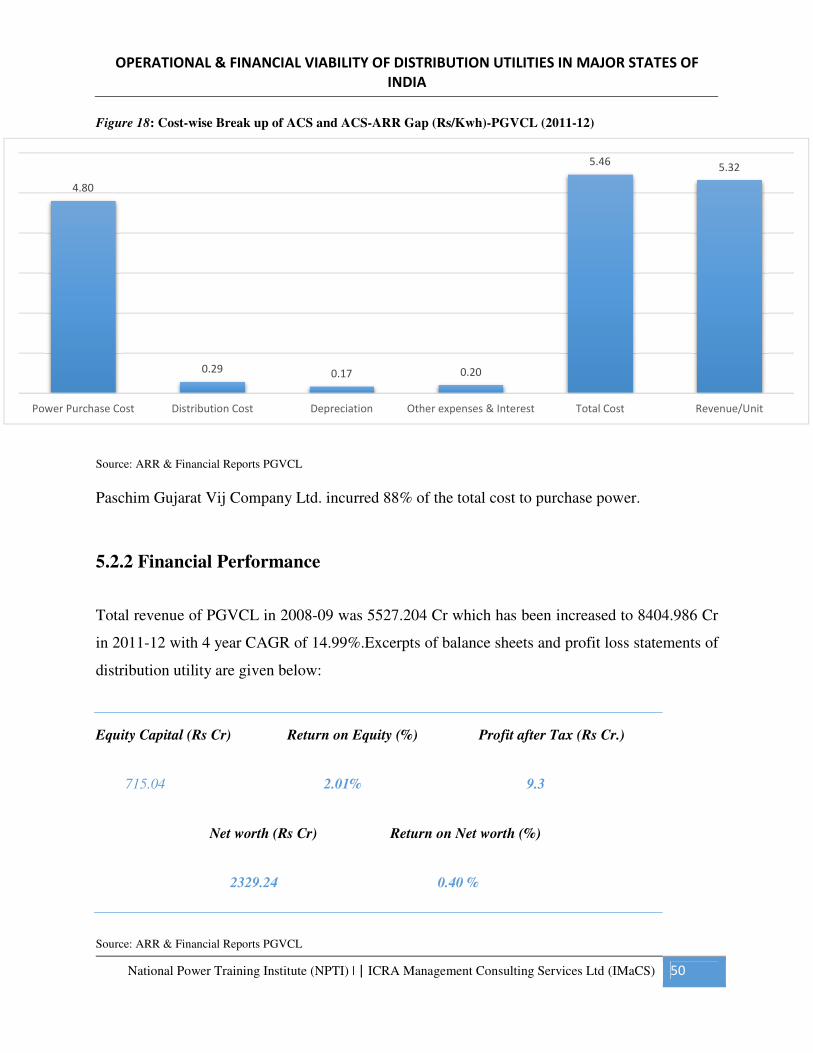
Figure 18: Cost-wise Break up of ACS and ACS-ARR Gap (Rs/Kwh)-PGVCL (2011-12)
Source: ARR & Financial Reports PGVCL
Paschim Gujarat Vij Company Ltd. incurred 88% of the total cost to purchase power.
5.2.2 Financial Performance
Total revenue of PGVCL in 2008-09 was 5527.204 Cr which has been increased to 8404.986 Cr
in 2011-12 with 4 year CAGR of 14.99%.Excerpts of balance sheets and profit loss statements of
distribution utility are given below:
Equity Capital (Rs Cr) Return on Equity (%) Profit after Tax (Rs Cr.)
715.04 2.01% 9.3
Net worth (Rs Cr) Return on Net worth (%)
2329.24 0.40 %
Source: ARR & Financial Reports PGVCL
4.80
0.29 0.17 0.20
5.465.32
Power Purchase Cost Distribution Cost Depreciation Other expenses & Interest Total Cost Revenue/Unit
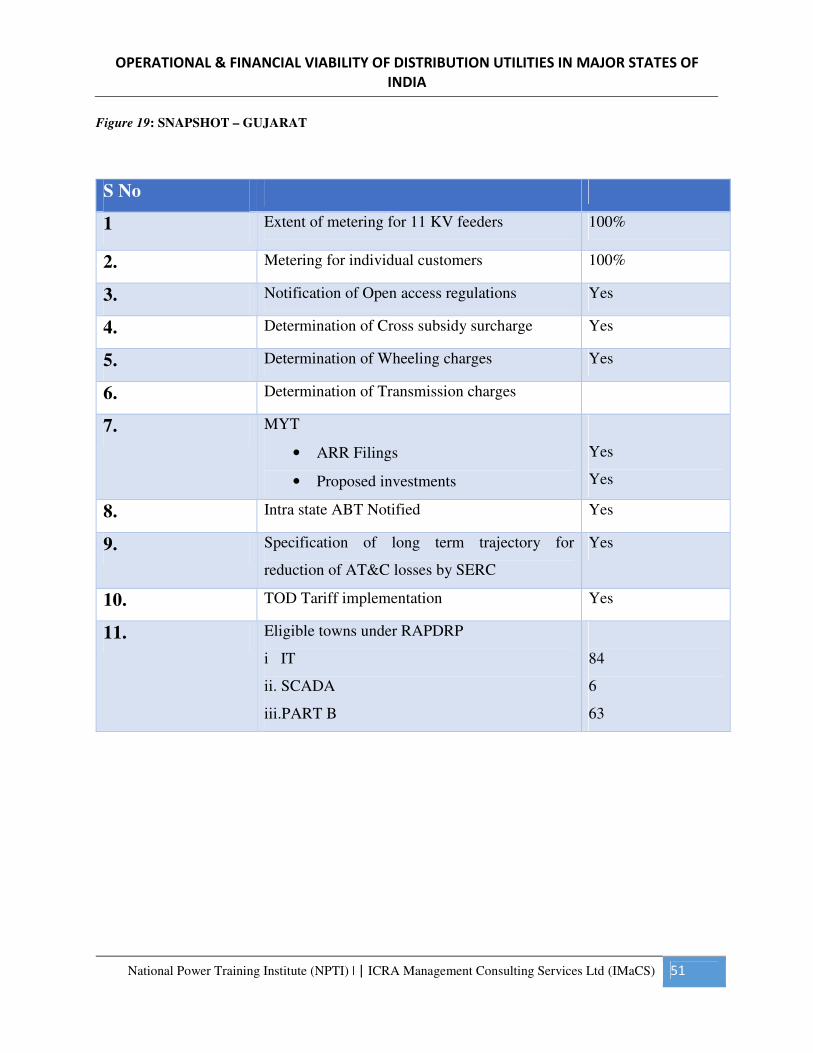
OPERATIONAL & FINANCIAL VIABILITY OF DISTRIBUTION UTILITIES IN MAJOR STATES OF
INDIA
National Power Training Institute (NPTI) | | ICRA Management Consulting Services Ltd (IMaCS) 51
Figure 19: SNAPSHOT – GUJARAT
S No
1 Extent of metering for 11 KV feeders 100%
2. Metering for individual customers 100%
3. Notification of Open access regulations Yes
4. Determination of Cross subsidy surcharge Yes
5. Determination of Wheeling charges Yes
6. Determination of Transmission charges
7. MYT
• ARR Filings
• Proposed investments
Yes
Yes
8. Intra state ABT Notified Yes
9. Specification of long term trajectory for
reduction of AT&C losses by SERC
Yes
10. TOD Tariff implementation Yes
11. Eligible towns under RAPDRP
i IT
ii. SCADA
iii.PART B
84
6
63
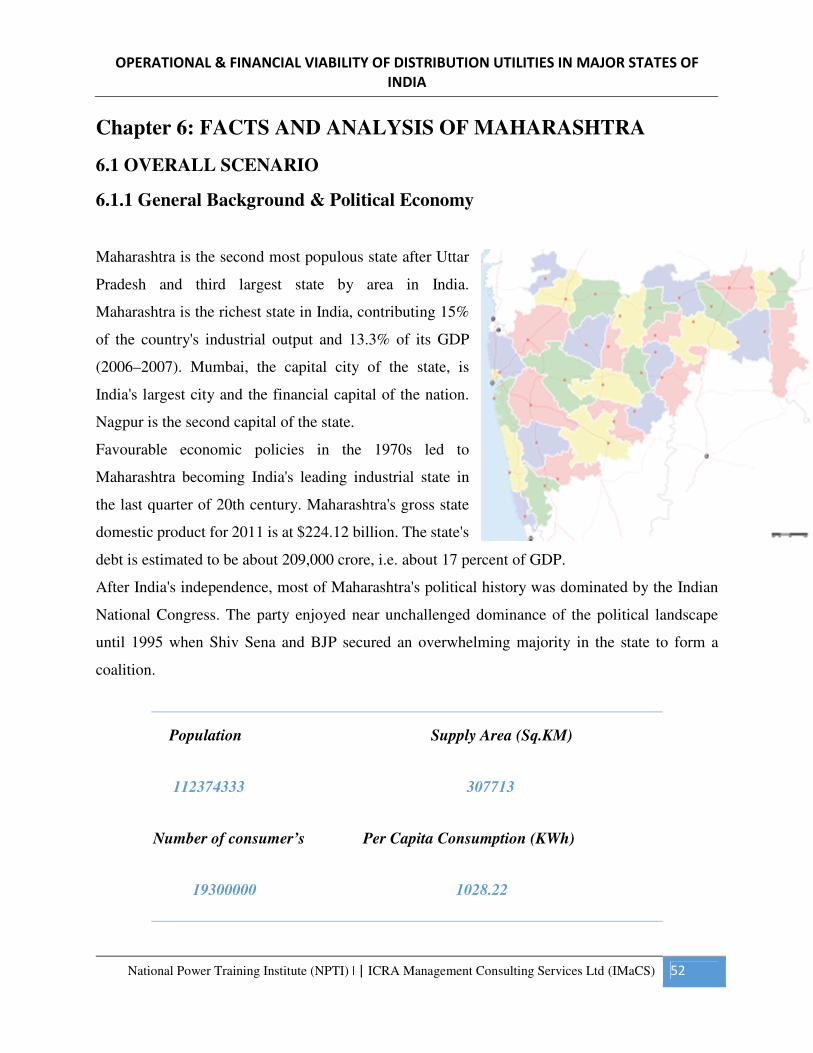
OPERATIONAL & FINANCIAL VIABILITY OF DISTRIBUTION UTILITIES IN MAJOR STATES OF
INDIA
National Power Training Institute (NPTI) | | ICRA Management Consulting Services Ltd (IMaCS) 52
Chapter 6: FACTS AND ANALYSIS OF MAHARASHTRA
6.1 OVERALL SCENARIO
6.1.1 General Background & Political Economy
Maharashtra is the second most populous state after Uttar
Pradesh and third largest state by area in India.
Maharashtra is the richest state in India, contributing 15%
of the country's industrial output and 13.3% of its GDP
(2006–2007). Mumbai, the capital city of the state, is
India's largest city and the financial capital of the nation.
Nagpur is the second capital of the state.
Favourable economic policies in the 1970s led to
Maharashtra becoming India's leading industrial state in
the last quarter of 20th century. Maharashtra's gross state
domestic product for 2011 is at $224.12 billion. The state's
debt is estimated to be about 209,000 crore, i.e. about 17 percent of GDP.
After India's independence, most of Maharashtra's political history was dominated by the Indian
National Congress. The party enjoyed near unchallenged dominance of the political landscape
until 1995 when Shiv Sena and BJP secured an overwhelming majority in the state to form a
coalition.
Population Supply Area (Sq.KM)
112374333 307713
Number of consumer’s Per Capita Consumption (KWh)
19300000 1028.22
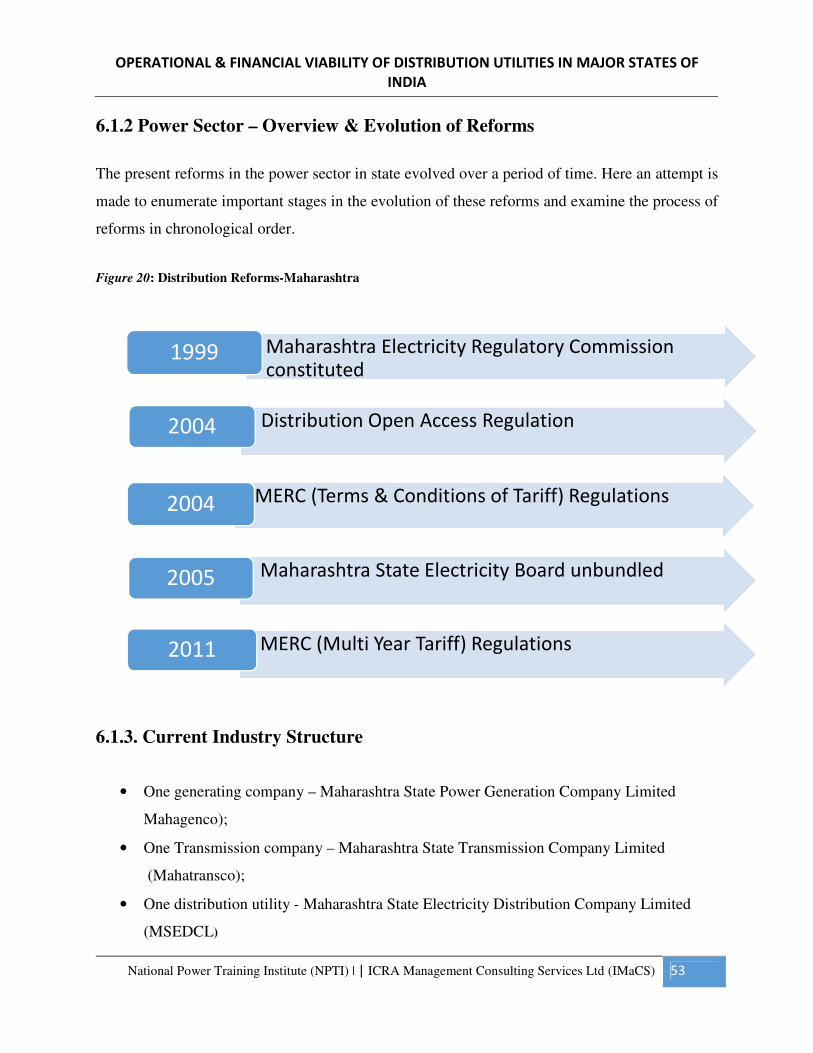
OPERATIONAL & FINANCIAL VIABILITY OF DISTRIBUTION UTILITIES IN MAJOR STATES OF
INDIA
National Power Training Institute (NPTI) | | ICRA Management Consulting Services Ltd (IMaCS) 53
6.1.2 Power Sector – Overview & Evolution of Reforms
The present reforms in the power sector in state evolved over a period of time. Here an attempt is
made to enumerate important stages in the evolution of these reforms and examine the process of
reforms in chronological order.
Figure 20: Distribution Reforms-Maharashtra
6.1.3. Current Industry Structure
• One generating company – Maharashtra State Power Generation Company Limited
Mahagenco);
• One Transmission company – Maharashtra State Transmission Company Limited
(Mahatransco);
• One distribution utility - Maharashtra State Electricity Distribution Company Limited
(MSEDCL)
• Maharashtra Electricity Regulatory Commission constituted
1999
• Distribution Open Access Regulation2004
• MERC (Terms & Conditions of Tariff) Regulations2004
• Maharashtra State Electricity Board unbundled2005
• MERC (Multi Year Tariff) Regulations2011
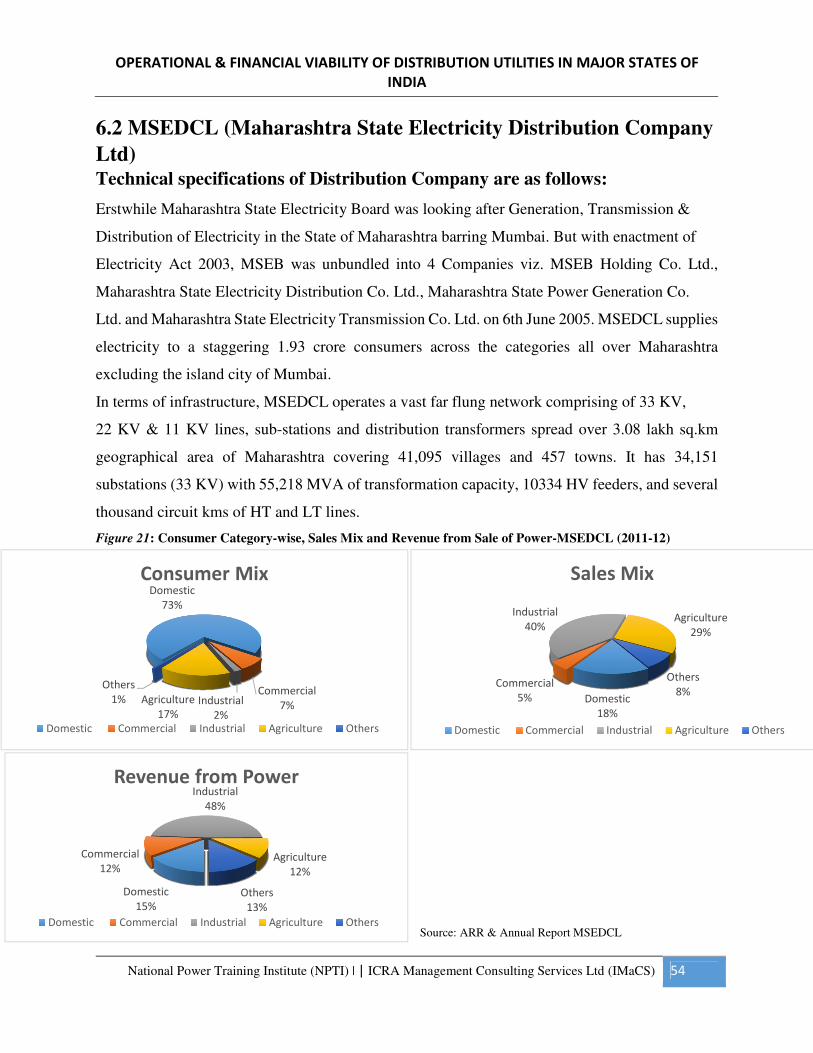
OPERATIONAL & FINANCIAL VIABILITY OF DISTRIBUTION UTILITIES IN MAJOR STATES OF
INDIA
National Power Training Institute (NPTI) | | ICRA Management Consulting Services Ltd (IMaCS) 54
6.2 MSEDCL (Maharashtra State Electricity Distribution Company
Ltd) Technical specifications of Distribution Company are as follows:
Erstwhile Maharashtra State Electricity Board was looking after Generation, Transmission &
Distribution of Electricity in the State of Maharashtra barring Mumbai. But with enactment of
Electricity Act 2003, MSEB was unbundled into 4 Companies viz. MSEB Holding Co. Ltd.,
Maharashtra State Electricity Distribution Co. Ltd., Maharashtra State Power Generation Co.
Ltd. and Maharashtra State Electricity Transmission Co. Ltd. on 6th June 2005. MSEDCL supplies
electricity to a staggering 1.93 crore consumers across the categories all over Maharashtra
excluding the island city of Mumbai.
In terms of infrastructure, MSEDCL operates a vast far flung network comprising of 33 KV,
22 KV & 11 KV lines, sub-stations and distribution transformers spread over 3.08 lakh sq.km
geographical area of Maharashtra covering 41,095 villages and 457 towns. It has 34,151
substations (33 KV) with 55,218 MVA of transformation capacity, 10334 HV feeders, and several
thousand circuit kms of HT and LT lines.
Figure 21: Consumer Category-wise, Sales Mix and Revenue from Sale of Power-MSEDCL (2011-12)
Source: ARR & Annual Report MSEDCL
Domestic
73%
Commercial
7%Industrial
2%
Agriculture
17%
Others
1%
Consumer Mix
Domestic Commercial Industrial Agriculture Others
Domestic
18%
Commercial
5%
Industrial
40%Agriculture
29%
Others
8%
Sales Mix
Domestic Commercial Industrial Agriculture Others
Domestic
15%
Commercial
12%
Industrial
48%
Agriculture
12%
Others
13%
Revenue from Power
Domestic Commercial Industrial Agriculture Others
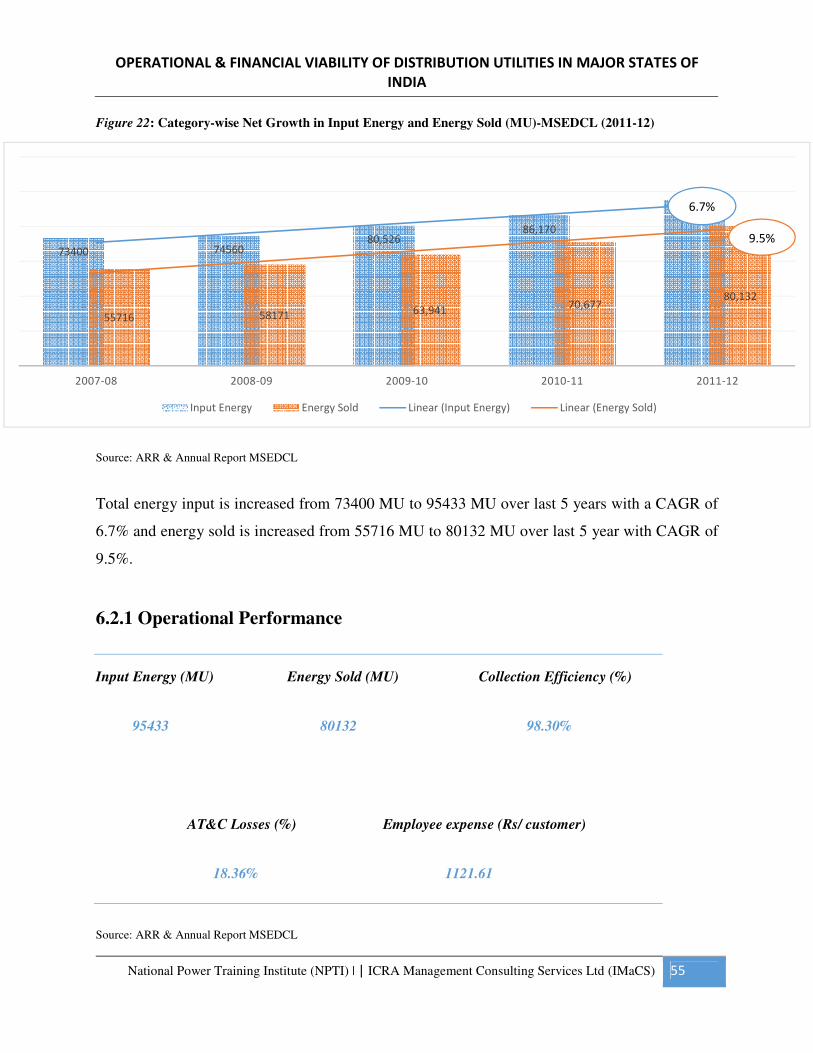
OPERATIONAL & FINANCIAL VIABILITY OF DISTRIBUTION UTILITIES IN MAJOR STATES OF
INDIA
National Power Training Institute (NPTI) | | ICRA Management Consulting Services Ltd (IMaCS) 55
Figure 22: Category-wise Net Growth in Input Energy and Energy Sold (MU)-MSEDCL (2011-12)
Source: ARR & Annual Report MSEDCL
Total energy input is increased from 73400 MU to 95433 MU over last 5 years with a CAGR of
6.7% and energy sold is increased from 55716 MU to 80132 MU over last 5 year with CAGR of
9.5%.
6.2.1 Operational Performance
Input Energy (MU) Energy Sold (MU) Collection Efficiency (%)
95433 80132 98.30%
AT&C Losses (%) Employee expense (Rs/ customer)
18.36% 1121.61
Source: ARR & Annual Report MSEDCL
73400 7456080,526
86,170
95,433
55716 58171 63,94170,677
80,132
2007-08 2008-09 2009-10 2010-11 2011-12
Input Energy Energy Sold Linear (Input Energy) Linear (Energy Sold)
6.7%
9.5%
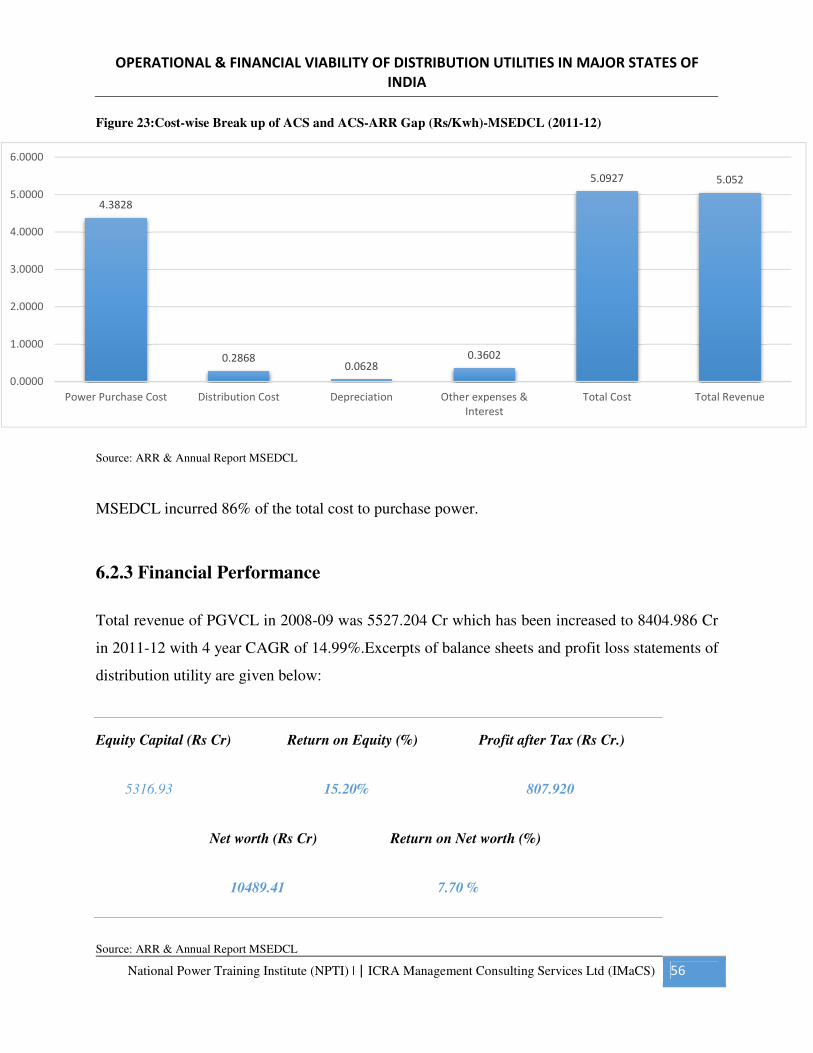
OPERATIONAL & FINANCIAL VIABILITY OF DISTRIBUTION UTILITIES IN MAJOR STATES OF
INDIA
National Power Training Institute (NPTI) | | ICRA Management Consulting Services Ltd (IMaCS) 56
Figure 23:Cost-wise Break up of ACS and ACS-ARR Gap (Rs/Kwh)-MSEDCL (2011-12)
Source: ARR & Annual Report MSEDCL
MSEDCL incurred 86% of the total cost to purchase power.
6.2.3 Financial Performance
Total revenue of PGVCL in 2008-09 was 5527.204 Cr which has been increased to 8404.986 Cr
in 2011-12 with 4 year CAGR of 14.99%.Excerpts of balance sheets and profit loss statements of
distribution utility are given below:
Equity Capital (Rs Cr) Return on Equity (%) Profit after Tax (Rs Cr.)
5316.93 15.20% 807.920
Net worth (Rs Cr) Return on Net worth (%)
10489.41 7.70 %
Source: ARR & Annual Report MSEDCL
4.3828
0.28680.0628
0.3602
5.0927 5.052
0.0000
1.0000
2.0000
3.0000
4.0000
5.0000
6.0000
Power Purchase Cost Distribution Cost Depreciation Other expenses &
Interest
Total Cost Total Revenue
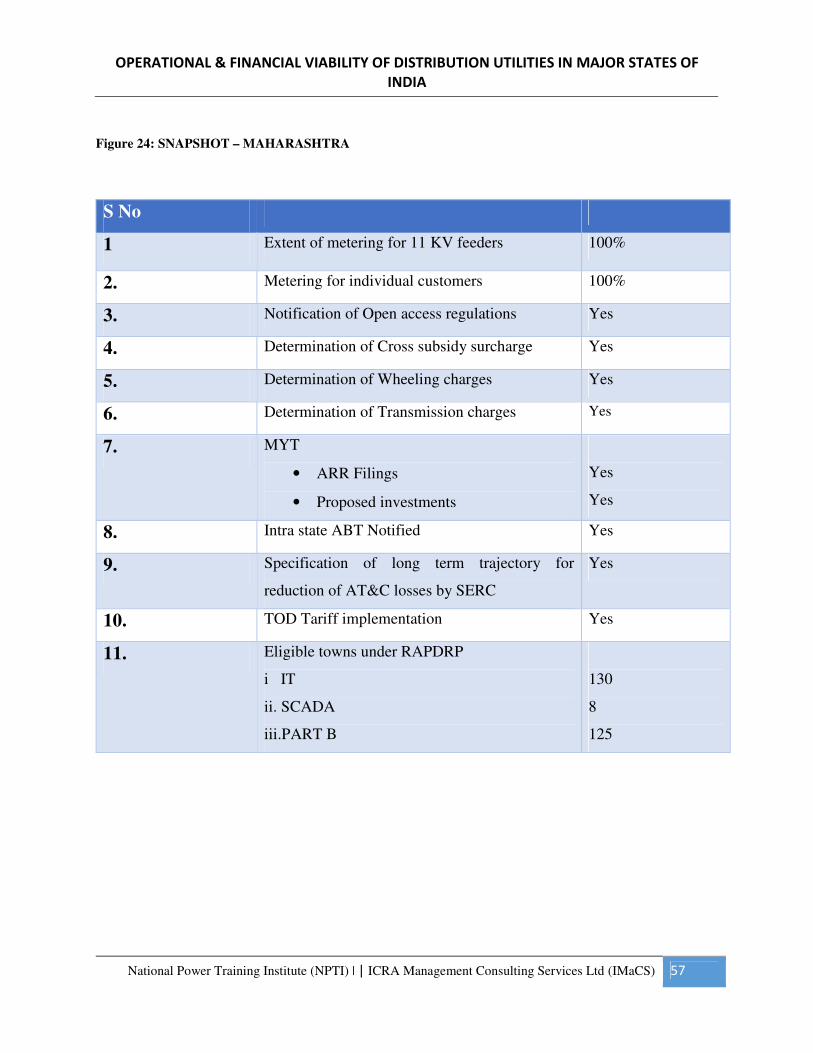
OPERATIONAL & FINANCIAL VIABILITY OF DISTRIBUTION UTILITIES IN MAJOR STATES OF
INDIA
National Power Training Institute (NPTI) | | ICRA Management Consulting Services Ltd (IMaCS) 57
Figure 24: SNAPSHOT – MAHARASHTRA
S No
1 Extent of metering for 11 KV feeders 100%
2. Metering for individual customers 100%
3. Notification of Open access regulations Yes
4. Determination of Cross subsidy surcharge Yes
5. Determination of Wheeling charges Yes
6. Determination of Transmission charges Yes
7. MYT
• ARR Filings
• Proposed investments
Yes
Yes
8. Intra state ABT Notified Yes
9. Specification of long term trajectory for
reduction of AT&C losses by SERC
Yes
10. TOD Tariff implementation Yes
11. Eligible towns under RAPDRP
i IT
ii. SCADA
iii.PART B
130
8
125
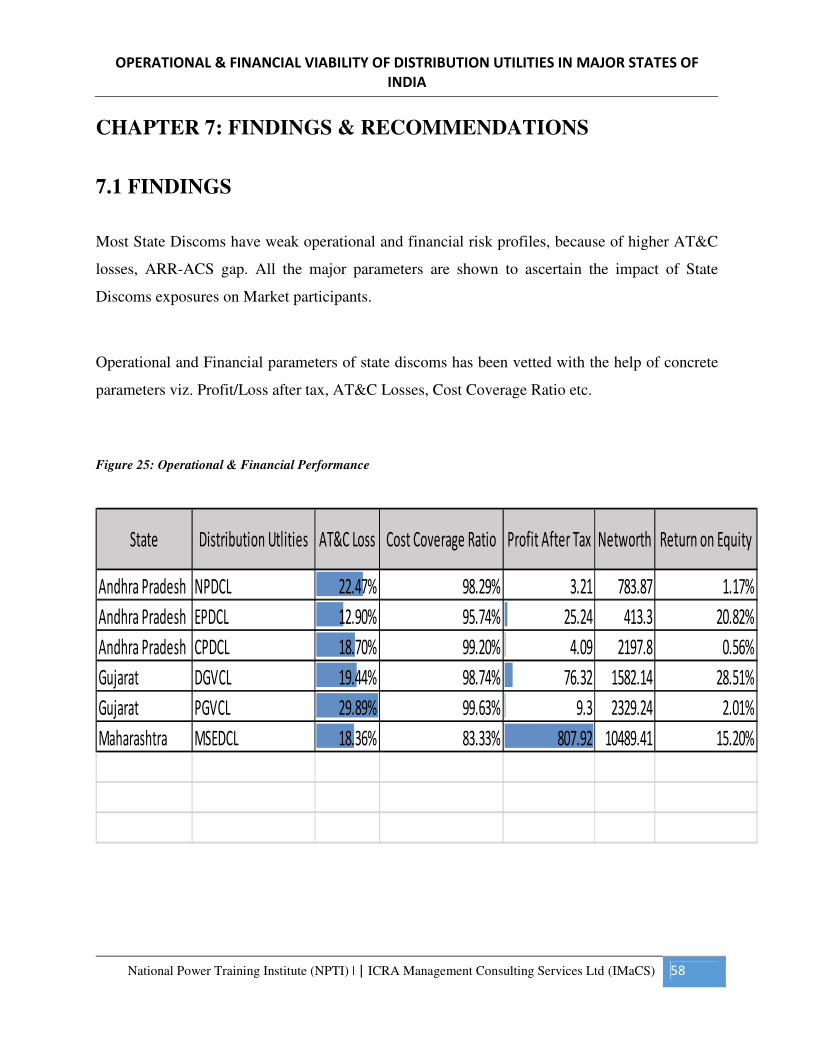
OPERATIONAL & FINANCIAL VIABILITY OF DISTRIBUTION UTILITIES IN MAJOR STATES OF
INDIA
National Power Training Institute (NPTI) | | ICRA Management Consulting Services Ltd (IMaCS) 58
CHAPTER 7: FINDINGS & RECOMMENDATIONS
7.1 FINDINGS
Most State Discoms have weak operational and financial risk profiles, because of higher AT&C
losses, ARR-ACS gap. All the major parameters are shown to ascertain the impact of State
Discoms exposures on Market participants.
Operational and Financial parameters of state discoms has been vetted with the help of concrete
parameters viz. Profit/Loss after tax, AT&C Losses, Cost Coverage Ratio etc.
Figure 25: Operational & Financial Performance
Andhra Pradesh NPDCL 22.47% 98.29% 3.21 783.87 1.17%
Andhra Pradesh EPDCL 12.90% 95.74% 25.24 413.3 20.82%
Andhra Pradesh CPDCL 18.70% 99.20% 4.09 2197.8 0.56%
Gujarat DGVCL 19.44% 98.74% 76.32 1582.14 28.51%
Gujarat PGVCL 29.89% 99.63% 9.3 2329.24 2.01%
Maharashtra MSEDCL 18.36% 83.33% 807.92 10489.41 15.20%
State Return on EquityDistribution Utlities AT&C Loss Cost Coverage Ratio Profit After Tax Networth
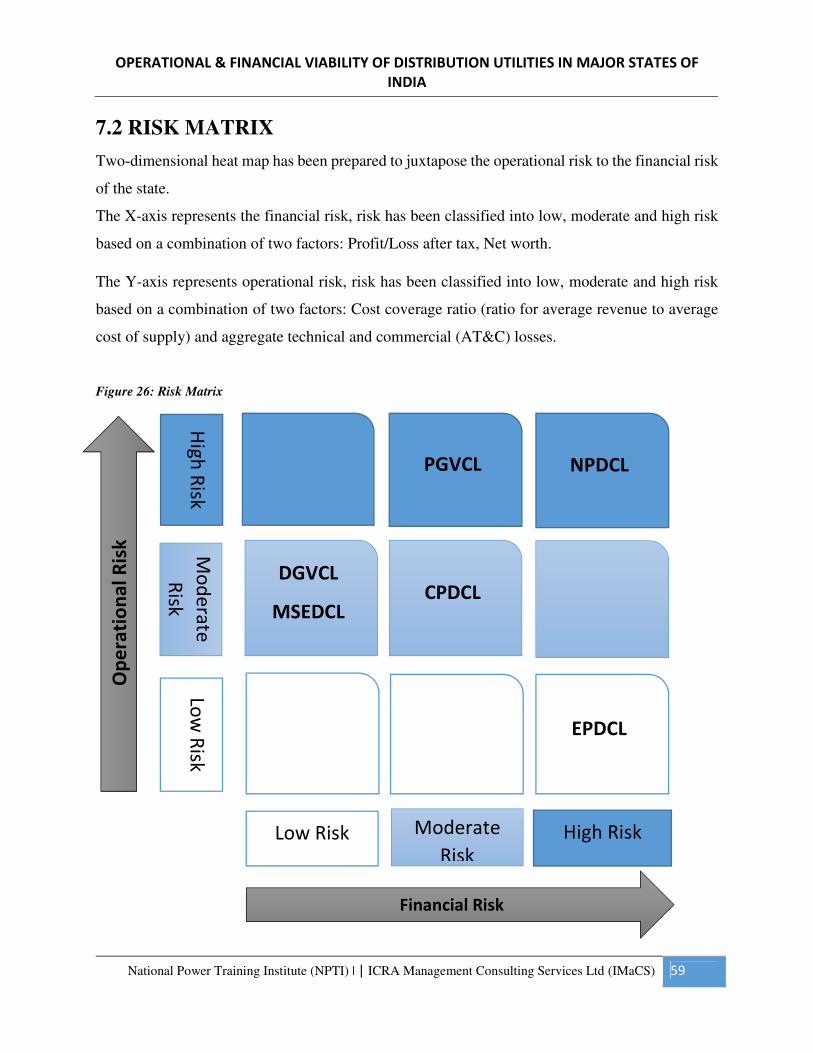
OPERATIONAL & FINANCIAL VIABILITY OF DISTRIBUTION UTILITIES IN MAJOR STATES OF
INDIA
National Power Training Institute (NPTI) | | ICRA Management Consulting Services Ltd (IMaCS) 59
7.2 RISK MATRIX
Two-dimensional heat map has been prepared to juxtapose the operational risk to the financial risk
of the state.
The X-axis represents the financial risk, risk has been classified into low, moderate and high risk
based on a combination of two factors: Profit/Loss after tax, Net worth.
The Y-axis represents operational risk, risk has been classified into low, moderate and high risk
based on a combination of two factors: Cost coverage ratio (ratio for average revenue to average
cost of supply) and aggregate technical and commercial (AT&C) losses.
Figure 26: Risk Matrix
Low Risk Moderate
Risk High Risk
Low
Risk
M
od
era
te
Risk
H
igh
Risk
DGVCL
MSEDCL
CPDCL
PGVCL NPDCL
EPDCL
Financial Risk
Op
era
tio
na
l R
isk
OPERATIONAL & FINANCIAL VIABILITY OF DISTRIBUTION UTILITIES IN MAJOR STATES OF
INDIA
National Power Training Institute (NPTI) | | ICRA Management Consulting Services Ltd (IMaCS) 60
7.3 RECOMMENDATIONS:
The distribution utilities have taken proactive measures for accountability,
measurability and governance which are better than compared to operational and
financial parameters of utilities.
• The adequate tariff determination is a key challenge given the critical need for
tariff revision to improve the financial position of the utilities, and also in view
of the interests of the consumers to avoid any tariff shock.
• Substantial improvement in business planning and forecasting to manage its
finances and operations better.
• The distribution sector needs to improve its network forecasting, planning,
and execution skills on an accelerated pace. Networks need to be strengthened
to ensure that power distribution capabilities are adequate and efficient
• In the short term, government has to bail out the distribution utilities from the
existing financial losses by providing operational autonomy, restructuring
debts, and infusing equity.
• Utilities should continuously focus on network strengthening in terms of asset
mapping, theft reduction schemes like HVDS and ABC cable implementation,
asset augmentation. Adoption of information technology application systems
is become a necessity.
• Customer Awareness is another key factor as change of mindsets among
citizens and society at large on theft is the most challenging aspect.
OPERATIONAL & FINANCIAL VIABILITY OF DISTRIBUTION UTILITIES IN MAJOR STATES OF
INDIA
National Power Training Institute (NPTI) | | ICRA Management Consulting Services Ltd (IMaCS) 61
BIBLIOGRAPHY & REFERENCES
1. CRISIL Infrastructure Advisory Report, “Study of various Power Distribution Models in
India” Jul-2011.
2. Planning Commission - GoI; Report of Sub-group on “PPP in distribution of Electricity”
Oct-2011
3. “The Electricity Act” GoI, 2003
4. Feedback Ventures Pvt. Ltd.; “Final Report on Standardization of Distribution Franchisee
Model” FoR Report; Sep-2009
5. Planning Commission - GoI; Report of Sub-group on “PPP in distribution of Electricity”
Oct-2011
6. Anoop Singh, “Policy Environment and Regulatory Reforms for Private and Foreign
Investment in Developing Countries: A Case of the Indian Power Sector” Asian
Development Bank, Research Paper – 64, April-2007
7. http://www.apdrp.gov.in/Eligible_Town_Utility/Towns_Part-B.aspx
8. http://www.apdrp.gov.in/Eligible_Town_Utility/SCADA_Towns.aspx
9. http://www.apdrp.gov.in/Eligible_Town_Utility/Towns_IT.aspx
10. http://www.pfcindia.com/writereaddata/userfiles/file/ResearchReport/Performance_Repo
rt_State_Power_Utilities_forfy_2008-09to2010-11_03102012.pdf
11. aperc.gov.in/
12. www.apnpdcl.in/
13. www.apeasternpower.com/
14. www.apcentralpower.com/
OPERATIONAL & FINANCIAL VIABILITY OF DISTRIBUTION UTILITIES IN MAJOR STATES OF
INDIA
National Power Training Institute (NPTI) | | ICRA Management Consulting Services Ltd (IMaCS) 62
15. http://gercin.org/
16. http://www.dgvcl.com/
17. http://www.pgvcl.com/
18. http://www.mercindia.org.in/
19. www.mahadiscom.in