Embed Size (px)
Citation preview
06.01.01 Forecast Expenditure Summary – Operating Costs
03.02.01 – Regulatory Model Architecture Summary 1
06.01.01 –Forecast Expenditure Summary – Operating Costs 1
Contents 1 Introduction .......................................................................................................................... 4
1.1 Operating expenditure forecast summary ............................................................................. 4
1.2 Ergon Energy’s approach ..................................................................................................... 6
1.3 Operating expenditure forecasting governance .................................................................... 7
2 Operating expenditure forecasting methodology and application ......................................... 8
2.1 Base Step Trend methodology ............................................................................................. 8
2.2 Base year and approach to adjustments ............................................................................ 10
2.3 Functional Areas for forecasting purposes.......................................................................... 11
2.4 The adjusted base year ...................................................................................................... 11
2.4.1 Movements in provisions ............................................................................................. 11
2.4.2 One-off adjustments to the base year costs ................................................................. 12
2.5 Targeted further reduction to overhead costs ..................................................................... 15
2.6 Non-recurrent expenditure .................................................................................................. 15
2.7 Step changes ..................................................................................................................... 17
2.7.1 Step changes .............................................................................................................. 17
2.8 Growth and trends from base year ..................................................................................... 19
2.8.1 Output growth rates methodology ................................................................................ 19
2.8.2 Real price growth ........................................................................................................ 23
2.8.3 Productivity growth ...................................................................................................... 24
2.9 Forecast and allocation of overhead (support) costs .......................................................... 24
2.10 Bottom-up forecasting methodology ................................................................................... 26
2.10.1 Chumvale (220kV network supplying Cloncurry) ......................................................... 27
2.10.2 Powerlink .................................................................................................................... 27
2.10.3 ICT .............................................................................................................................. 28
2.10.4 Parametric insurance .................................................................................................. 29
2.10.5 Demand Management Innovation Allowance (DMIA) .................................................. 31
2.11 Other Costs ........................................................................................................................ 31
2.11.1 Debt raising costs ........................................................................................................ 31
3 Meeting the operating expenditure objectives, criteria and factors ..................................... 35
3.1 Operating expenditure objectives ....................................................................................... 35

03.02.01 – Regulatory Model Architecture Summary 2
06.01.01 –Forecast Expenditure Summary – Operating Costs 2
3.2 Operating expenditure criteria ............................................................................................ 36
3.3 Operating expenditure factors ............................................................................................ 37
4 List of documents referenced ............................................................................................. 40
03.02.01 – Regulatory Model Architecture Summary 3
06.01.01 –Forecast Expenditure Summary – Operating Costs 3
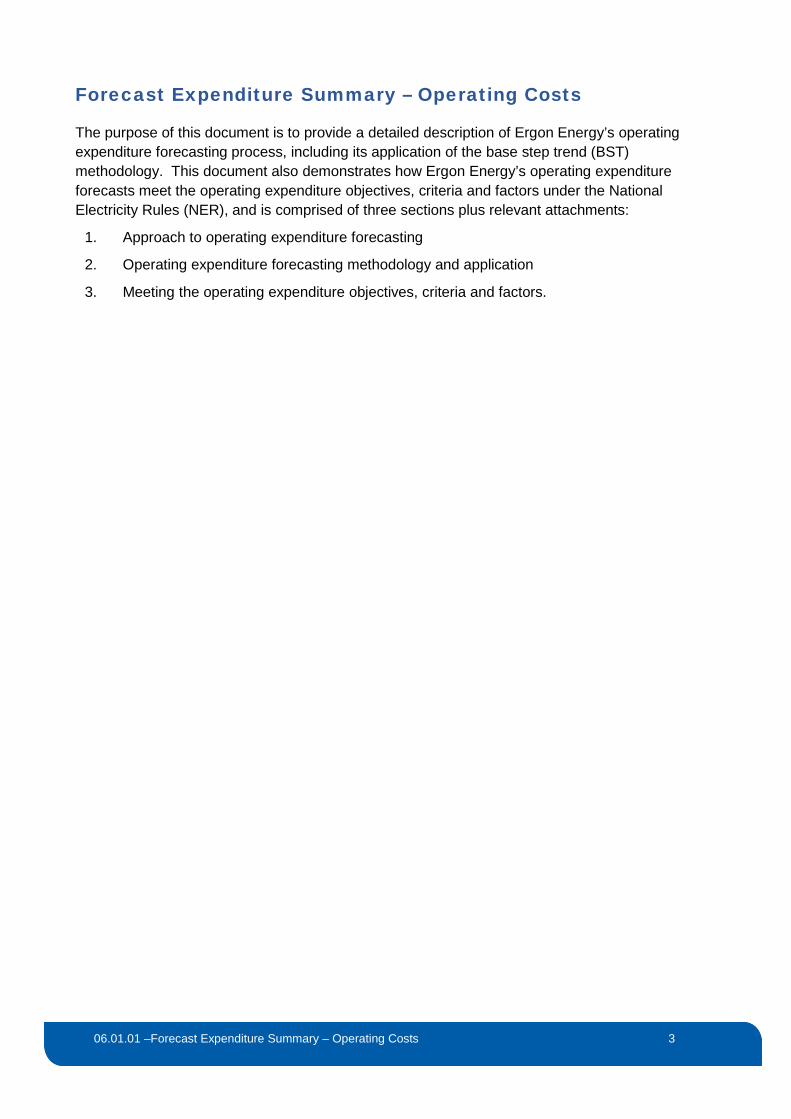
Forecast Expenditure Summary – Operating Costs
The purpose of this document is to provide a detailed description of Ergon Energy’s operating expenditure forecasting process, including its application of the base step trend (BST) methodology. This document also demonstrates how Ergon Energy’s operating expenditure forecasts meet the operating expenditure objectives, criteria and factors under the National Electricity Rules (NER), and is comprised of three sections plus relevant attachments:
1. Approach to operating expenditure forecasting
2. Operating expenditure forecasting methodology and application
3. Meeting the operating expenditure objectives, criteria and factors.
03.02.01 – Regulatory Model Architecture Summary 4
06.01.01 –Forecast Expenditure Summary – Operating Costs 4
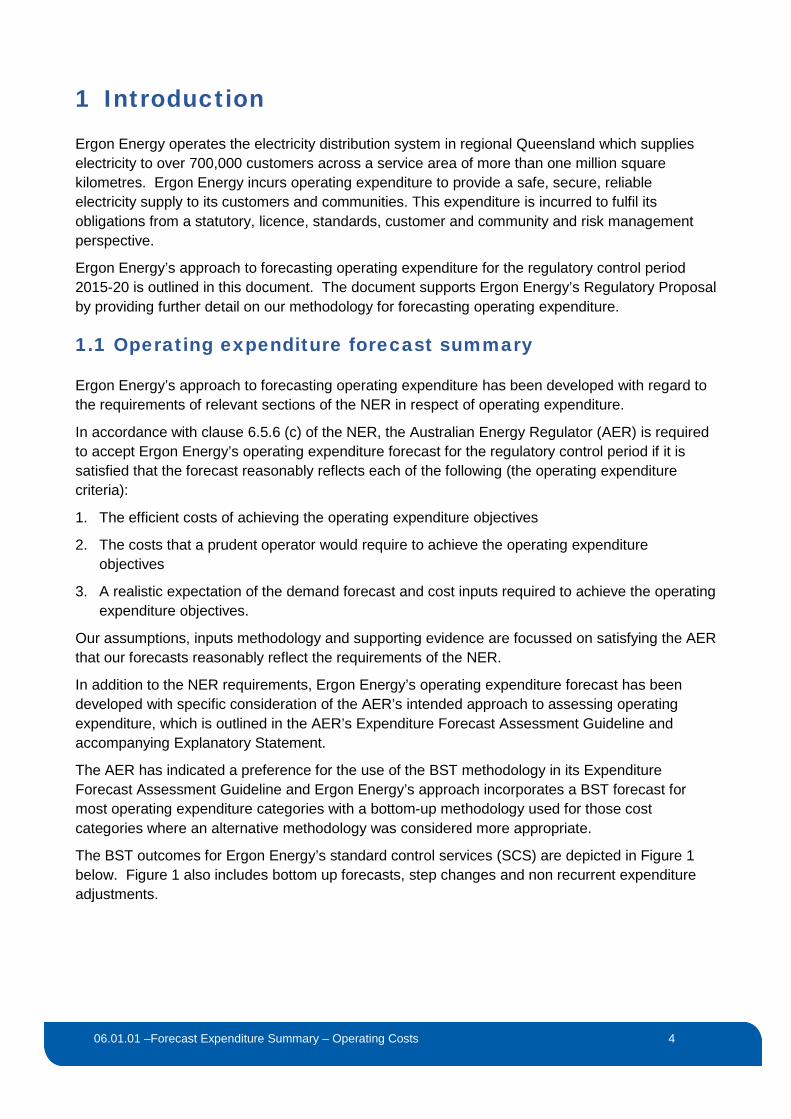
1 Introduction
Ergon Energy operates the electricity distribution system in regional Queensland which supplies electricity to over 700,000 customers across a service area of more than one million square kilometres. Ergon Energy incurs operating expenditure to provide a safe, secure, reliable electricity supply to its customers and communities. This expenditure is incurred to fulfil its obligations from a statutory, licence, standards, customer and community and risk management perspective.
Ergon Energy’s approach to forecasting operating expenditure for the regulatory control period 2015-20 is outlined in this document. The document supports Ergon Energy’s Regulatory Proposal by providing further detail on our methodology for forecasting operating expenditure.
1.1 Operating expenditure forecast summary
Ergon Energy’s approach to forecasting operating expenditure has been developed with regard to the requirements of relevant sections of the NER in respect of operating expenditure.
In accordance with clause 6.5.6 (c) of the NER, the Australian Energy Regulator (AER) is required to accept Ergon Energy’s operating expenditure forecast for the regulatory control period if it is satisfied that the forecast reasonably reflects each of the following (the operating expenditure criteria):
1. The efficient costs of achieving the operating expenditure objectives
2. The costs that a prudent operator would require to achieve the operating expenditure objectives
3. A realistic expectation of the demand forecast and cost inputs required to achieve the operating expenditure objectives.
Our assumptions, inputs methodology and supporting evidence are focussed on satisfying the AER that our forecasts reasonably reflect the requirements of the NER.
In addition to the NER requirements, Ergon Energy’s operating expenditure forecast has been developed with specific consideration of the AER’s intended approach to assessing operating expenditure, which is outlined in the AER’s Expenditure Forecast Assessment Guideline and accompanying Explanatory Statement.
The AER has indicated a preference for the use of the BST methodology in its Expenditure Forecast Assessment Guideline and Ergon Energy’s approach incorporates a BST forecast for most operating expenditure categories with a bottom-up methodology used for those cost categories where an alternative methodology was considered more appropriate.
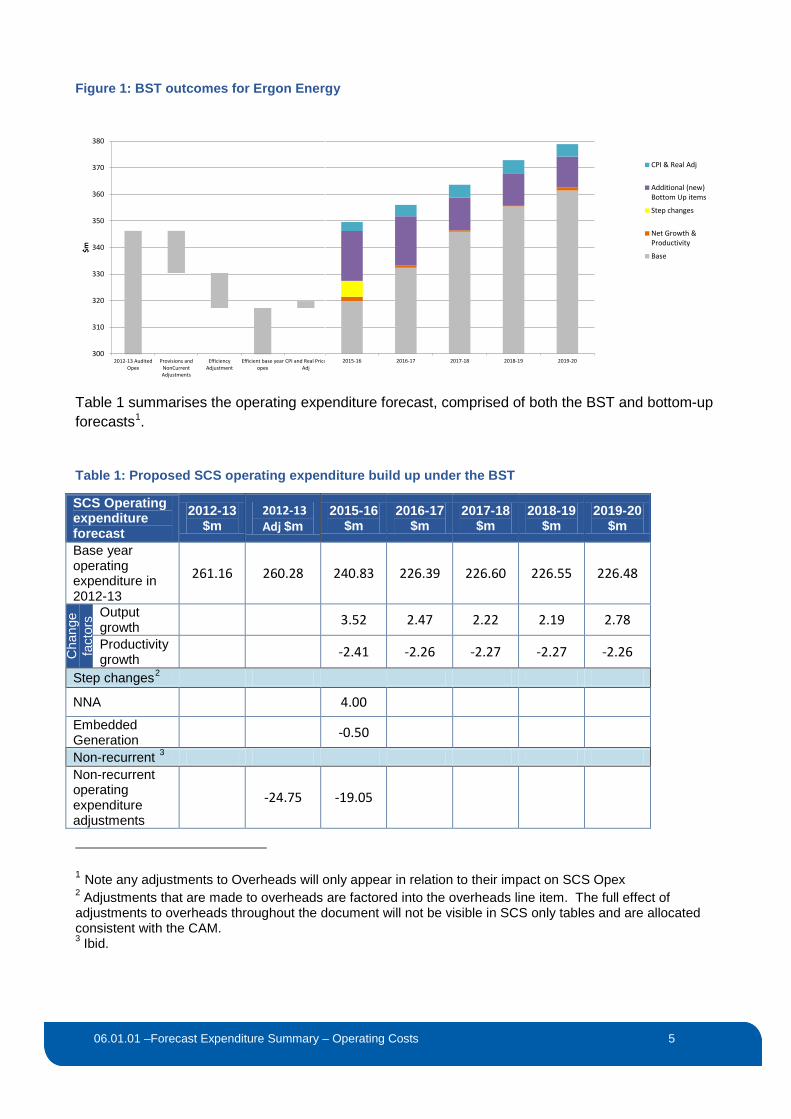
The BST outcomes for Ergon Energy’s standard control services (SCS) are depicted in Figure 1 below. Figure 1 also includes bottom up forecasts, step changes and non recurrent expenditure adjustments.
03.02.01 – Regulatory Model Architecture Summary 5
06.01.01 –Forecast Expenditure Summary – Operating Costs 5
Figure 1: BST outcomes for Ergon Energy
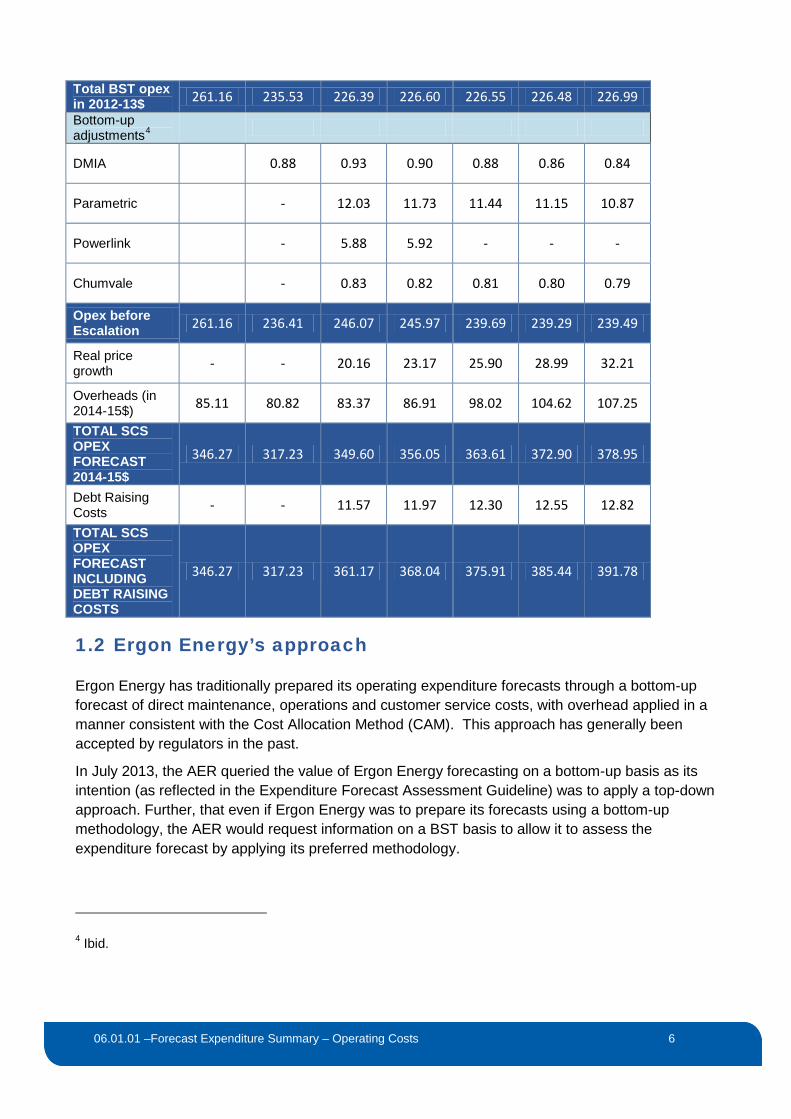
Table 1 summarises the operating expenditure forecast, comprised of both the BST and bottom-up forecasts1.
Table 1: Proposed SCS operating expenditure build up under the BST
SCS Operating expenditure forecast
2012-13 $m
2012-13 Adj $m
2015-16 $m
2016-17 $m
2017-18 $m
2018-19 $m
2019-20 $m
Base year operating expenditure in 2012-13
261.16 260.28 240.83 226.39 226.60 226.55 226.48
Cha
nge
fact
ors Output
growth 3.52 2.47 2.22 2.19 2.78
Productivity growth -2.41 -2.26 -2.27 -2.27 -2.26
Step changes2
NNA 4.00
Embedded Generation -0.50 Non-recurrent 3 Non-recurrent operating expenditure adjustments
-24.75 -19.05
1 Note any adjustments to Overheads will only appear in relation to their impact on SCS Opex 2 Adjustments that are made to overheads are factored into the overheads line item. The full effect of adjustments to overheads throughout the document will not be visible in SCS only tables and are allocated consistent with the CAM. 3 Ibid.
300
310
320
330
340
350
360
370
380
2012-13 AuditedOpex
Provisions andNonCurrentAdjustments
EfficiencyAdjustment
Efficient base yearopex
CPI and Real PriceAdj
$m
2015-16 2016-17 2017-18 2018-19 2019-20
CPI & Real Adj
Additional (new)Bottom Up items
Step changes
Net Growth &Productivity
Base
03.02.01 – Regulatory Model Architecture Summary 6
06.01.01 –Forecast Expenditure Summary – Operating Costs 6
Total BST opex in 2012-13$ 261.16 235.53 226.39 226.60 226.55 226.48 226.99
Bottom-up adjustments4
DMIA 0.88 0.93 0.90 0.88 0.86 0.84
Parametric - 12.03 11.73 11.44 11.15 10.87
Powerlink - 5.88 5.92 - - -
Chumvale - 0.83 0.82 0.81 0.80 0.79
Opex before Escalation 261.16 236.41 246.07 245.97 239.69 239.29 239.49
Real price growth - - 20.16 23.17 25.90 28.99 32.21
Overheads (in 2014-15$) 85.11 80.82 83.37 86.91 98.02 104.62 107.25
TOTAL SCS OPEX FORECAST 2014-15$
346.27 317.23 349.60 356.05 363.61 372.90 378.95
Debt Raising Costs - - 11.57 11.97 12.30 12.55 12.82
TOTAL SCS OPEX FORECAST INCLUDING DEBT RAISING COSTS
346.27 317.23 361.17 368.04 375.91 385.44 391.78
1.2 Ergon Energy’s approach
Ergon Energy has traditionally prepared its operating expenditure forecasts through a bottom-up forecast of direct maintenance, operations and customer service costs, with overhead applied in a manner consistent with the Cost Allocation Method (CAM). This approach has generally been accepted by regulators in the past.
In July 2013, the AER queried the value of Ergon Energy forecasting on a bottom-up basis as its intention (as reflected in the Expenditure Forecast Assessment Guideline) was to apply a top-down approach. Further, that even if Ergon Energy was to prepare its forecasts using a bottom-up methodology, the AER would request information on a BST basis to allow it to assess the expenditure forecast by applying its preferred methodology.
4 Ibid.
03.02.01 – Regulatory Model Architecture Summary 7
06.01.01 –Forecast Expenditure Summary – Operating Costs 7
This position was consistent with the AER’s Explanatory Statement for its Draft Expenditure Forecast Assessment Guideline: 5
In particular, NSPs may find it useful to devote more effort to justifying their proposed opex allowances through the base-step-trend approach, where the AER has a strong preference to rely on revealed costs, if they have not used it in the past.
Therefore, while the AER’s Expenditure Forecast Assessment Guidelines were still being finalised, Ergon Energy initiated the implementation of a new methodology for the development of our operating expenditure forecasts. Our Expenditure Forecast Methodology noted this: 6
Given the substantial change that this represents from its historic practice, Ergon Energy is still designing the approach which will allow forecasts to be presented in a manner consistent with the AER’s anticipated expectations under the base-step-trend approach.
Ergon Energy’s adoption of the BST methodology for forecasting the majority of its recurrent operating expenditure represents a substantial change in approach from that applied in developing its forecasts for the regulatory control period 2010-15. We have attempted to reconcile our approach with the AER’s Expenditure Forecast Assessment Guideline, but have found that some departures have been necessary.
The NER requires that any forecast be developed on a basis that is consistent with Ergon Energy’s approved CAM.7. In order to be consistent with the Guideline and compliant with the NER, it has been necessary for Ergon Energy to apply a BST approach to most of its regulated direct and overhead expenditure that is not direct capital expenditure.
Consequentially, the forecast for standard control service operating expenditure has not been developed using a BST method in isolation. Rather, Ergon Energy’s operating expenditure forecast has been developed through:
• The application of a BST methodology to direct operating standard control service costs
• The allocation of forecast overhead costs for direct operating standard control service costs on a basis consistent with the CAM (noting that relevant overhead costs have been subject to BST).
Ergon Energy has also excluded some costs from the BST methodology. We outline these costs, and the reasons why we have not applied a BST methodology in this document.
1.3 Operating expenditure forecasting governance
An iterative process of scrutiny and refinement has been applied in the development and application of the BST and bottom-up approaches to forecasting operating expenditure for the regulatory control period 2015-20. An internal management committee, comprised of relevant Executive General Managers and Group Managers, was established with responsibility for
5 AER, Better Regulation – Explanatory statement, Draft Expenditure Forecast Assessment Guidelines for electricity transmission and distribution, August 2013, at page 3 6 Ergon Energy, Expenditure Forecast Methodology 2015 to 2020, November 2013, at page 21 7 NER, clause 6.5.7(b)(2)
03.02.01 – Regulatory Model Architecture Summary 8
06.01.01 –Forecast Expenditure Summary – Operating Costs 8
overseeing the operating expenditure forecasting process, including scrutiny of methodology, inputs and outputs.
The total forecast operating expenditure for the regulatory control period 2015-20 is endorsed by the Chief Financial Officer and Chief Executive Officer prior to approval by the Ergon Energy Board.
2 Operating expenditure forecasting methodology and application
Ergon Energy has developed its forecasts taking into account the AER’s Expenditure Forecast Assessment Guideline and the requirements of the NER, as well as in-depth analysis of the key factors driving operating expenditure into the future.
The process of forecast development has been informed by independent econometric and benchmarking analysis, and the outcome of this analysis has either been directly applied or included in the consideration of efficiency adjustments.
In order to assist the AER with its assessment of our forecasts, Ergon Energy has selected the most appropriate combination of BST and bottom up forecasting and other costs applicable to the different categories of expenditure across its operations. We have also provided supporting evidence to satisfy the AER as to the reasonableness of the forecasts proposed.
Customer concerns that been expressed in response to recent increases in prices have influenced our forecast. We have already delivered price relief in 2015-16 through a substantial intervention in underlying costs in this period. Our forecasts commit the business to finding ways to reduce costs further, while bringing forward the benefit of those reduced costs for consumers. This represents a greater sharing of the incentive to reduce costs during the period with customers. We outline how we propose to do this later in this chapter.
The following section outlines the operating expenditure forecasting methodology adopted and its application to developing Ergon Energy’s forecast operating expenditure program.
2.1 Base Step Trend methodology
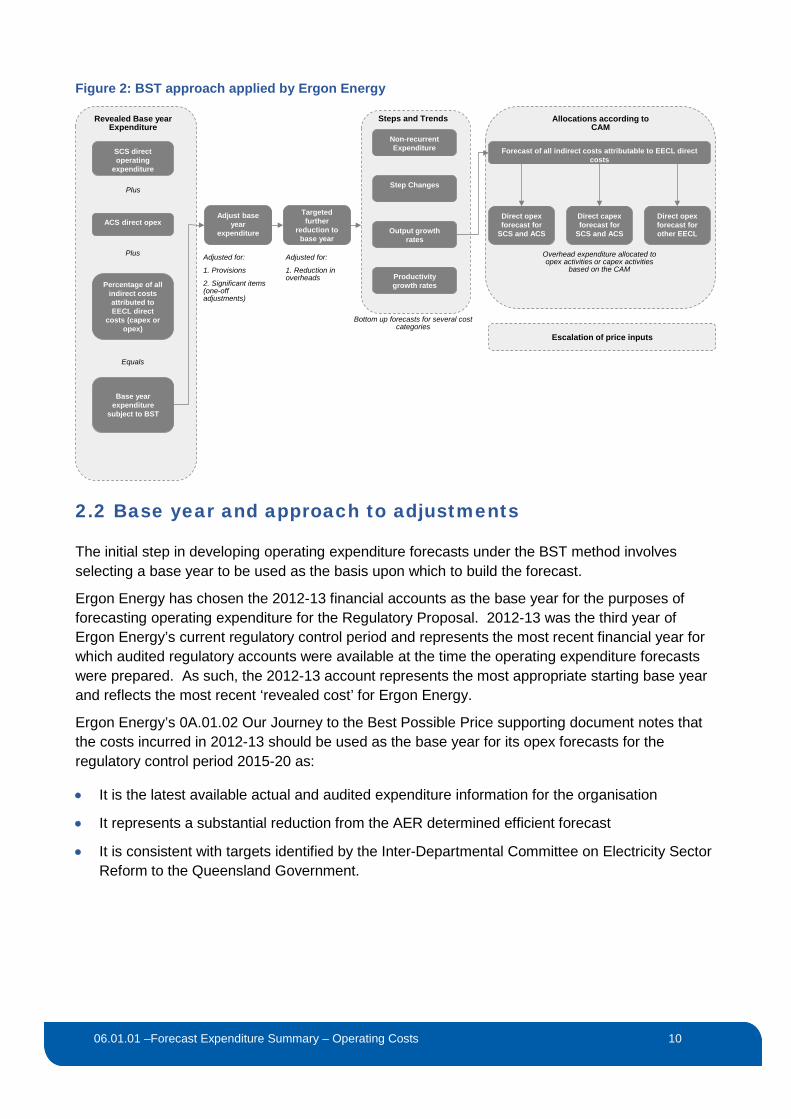
In simple terms, the BST methodology applied by Ergon Energy in preparing its operating expenditure forecasts involves:
• Selecting a base year
• Identifying the direct and indirect costs that need to be applied to BST
• Making appropriate adjustments for movements in provisions
• Making one-off adjustments to the base year
• Making further targeted reductions to the base year

03.02.01 – Regulatory Model Architecture Summary 9
06.01.01 –Forecast Expenditure Summary – Operating Costs 9
• Making appropriate adjustments for non-recurrent expenditure
• Identifying and applying any step changes
• Applying a rate of change consisting of output growth, real price growth and productivity growth to establish the trend.
The BST methodology applied by Ergon Energy is depicted in the Figure 2 below.
03.02.01 – Regulatory Model Architecture Summary 10
06.01.01 –Forecast Expenditure Summary – Operating Costs 10
Figure 2: BST approach applied by Ergon Energy
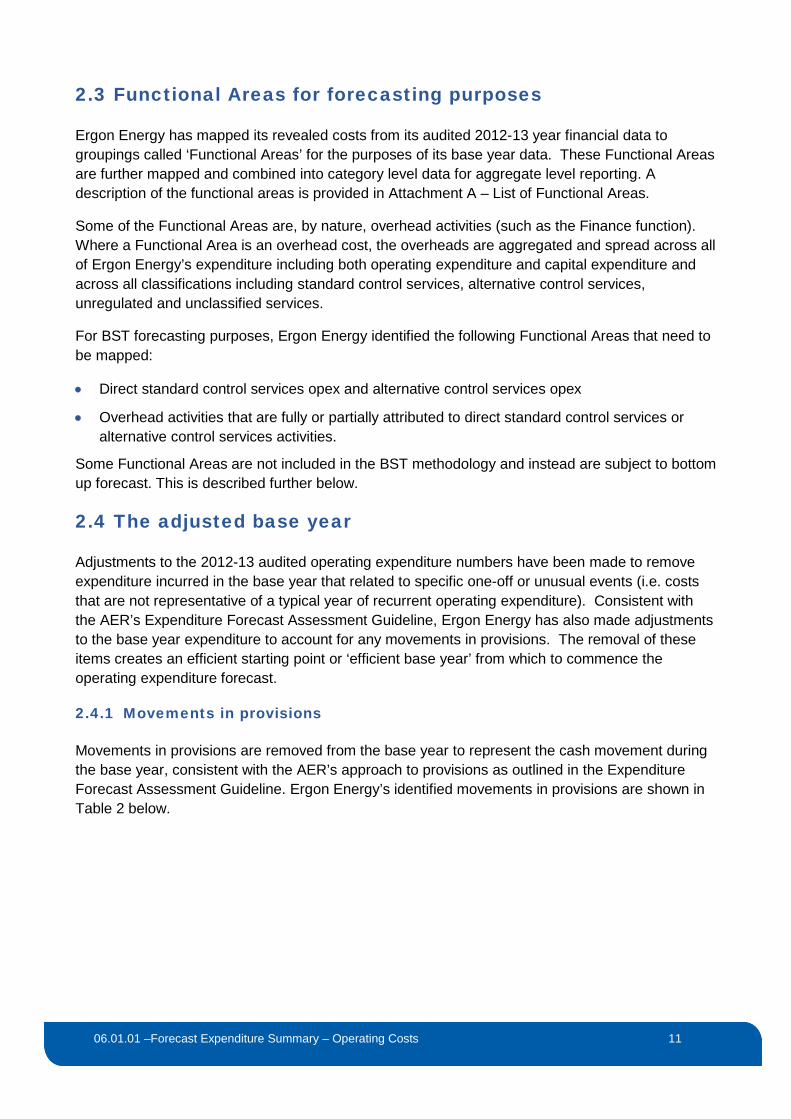
2.2 Base year and approach to adjustments
The initial step in developing operating expenditure forecasts under the BST method involves selecting a base year to be used as the basis upon which to build the forecast.
Ergon Energy has chosen the 2012-13 financial accounts as the base year for the purposes of forecasting operating expenditure for the Regulatory Proposal. 2012-13 was the third year of Ergon Energy’s current regulatory control period and represents the most recent financial year for which audited regulatory accounts were available at the time the operating expenditure forecasts were prepared. As such, the 2012-13 account represents the most appropriate starting base year and reflects the most recent ‘revealed cost’ for Ergon Energy.
Ergon Energy’s 0A.01.02 Our Journey to the Best Possible Price supporting document notes that the costs incurred in 2012-13 should be used as the base year for its opex forecasts for the regulatory control period 2015-20 as:
• It is the latest available actual and audited expenditure information for the organisation
• It represents a substantial reduction from the AER determined efficient forecast
• It is consistent with targets identified by the Inter-Departmental Committee on Electricity Sector Reform to the Queensland Government.
SCS direct operating
expenditure
ACS direct opex
Percentage of all indirect costs attributed to EECL direct
costs (capex or opex)
Base year expenditure
subject to BST
Adjust base year
expenditure
Step Changes
Output growth rates
Productivity growth rates
Forecast of all indirect costs attributable to EECL direct costs
Direct opexforecast for
SCS and ACS
Direct capexforecast for
SCS and ACS
Direct opexforecast for other EECL
Revealed Base year Expenditure
Steps and Trends Allocations according to CAM
Plus
Plus
Equals
Adjusted for:
1. Provisions
2. Significant items (one-off adjustments)
Bottom up forecasts for several cost categories
Overhead expenditure allocated to opex activities or capex activities
based on the CAM
Escalation of price inputs
Non-recurrent Expenditure
Targeted further
reduction to base year
Adjusted for:
1. Reduction in overheads
03.02.01 – Regulatory Model Architecture Summary 11
06.01.01 –Forecast Expenditure Summary – Operating Costs 11
2.3 Functional Areas for forecasting purposes
Ergon Energy has mapped its revealed costs from its audited 2012-13 year financial data to groupings called ‘Functional Areas’ for the purposes of its base year data. These Functional Areas are further mapped and combined into category level data for aggregate level reporting. A description of the functional areas is provided in Attachment A – List of Functional Areas.
Some of the Functional Areas are, by nature, overhead activities (such as the Finance function). Where a Functional Area is an overhead cost, the overheads are aggregated and spread across all of Ergon Energy’s expenditure including both operating expenditure and capital expenditure and across all classifications including standard control services, alternative control services, unregulated and unclassified services.
For BST forecasting purposes, Ergon Energy identified the following Functional Areas that need to be mapped:
• Direct standard control services opex and alternative control services opex
• Overhead activities that are fully or partially attributed to direct standard control services or alternative control services activities.
Some Functional Areas are not included in the BST methodology and instead are subject to bottom up forecast. This is described further below.
2.4 The adjusted base year
Adjustments to the 2012-13 audited operating expenditure numbers have been made to remove expenditure incurred in the base year that related to specific one-off or unusual events (i.e. costs that are not representative of a typical year of recurrent operating expenditure). Consistent with the AER’s Expenditure Forecast Assessment Guideline, Ergon Energy has also made adjustments to the base year expenditure to account for any movements in provisions. The removal of these items creates an efficient starting point or ‘efficient base year’ from which to commence the operating expenditure forecast.
2.4.1 Movements in provisions
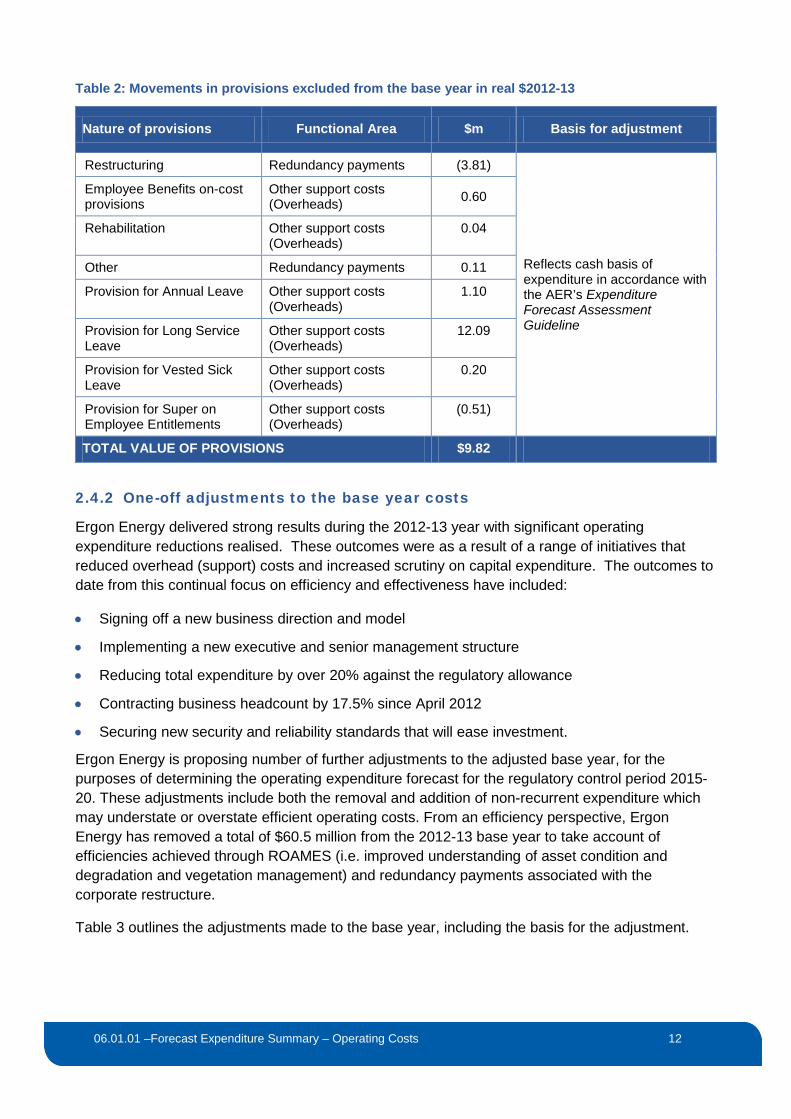
Movements in provisions are removed from the base year to represent the cash movement during the base year, consistent with the AER’s approach to provisions as outlined in the Expenditure Forecast Assessment Guideline. Ergon Energy’s identified movements in provisions are shown in Table 2 below.
03.02.01 – Regulatory Model Architecture Summary 12
06.01.01 –Forecast Expenditure Summary – Operating Costs 12
Table 2: Movements in provisions excluded from the base year in real $2012-13
Nature of provisions Functional Area $m Basis for adjustment
Restructuring Redundancy payments (3.81)
Reflects cash basis of expenditure in accordance with the AER’s Expenditure Forecast Assessment Guideline
Employee Benefits on-cost provisions
Other support costs (Overheads) 0.60
Rehabilitation Other support costs (Overheads)
0.04
Other Redundancy payments 0.11
Provision for Annual Leave Other support costs (Overheads)
1.10
Provision for Long Service Leave
Other support costs (Overheads)
12.09
Provision for Vested Sick Leave
Other support costs (Overheads)
0.20
Provision for Super on Employee Entitlements
Other support costs (Overheads)
(0.51)
TOTAL VALUE OF PROVISIONS $9.82
2.4.2 One-off adjustments to the base year costs
Ergon Energy delivered strong results during the 2012-13 year with significant operating expenditure reductions realised. These outcomes were as a result of a range of initiatives that reduced overhead (support) costs and increased scrutiny on capital expenditure. The outcomes to date from this continual focus on efficiency and effectiveness have included:
• Signing off a new business direction and model
• Implementing a new executive and senior management structure
• Reducing total expenditure by over 20% against the regulatory allowance
• Contracting business headcount by 17.5% since April 2012
• Securing new security and reliability standards that will ease investment.
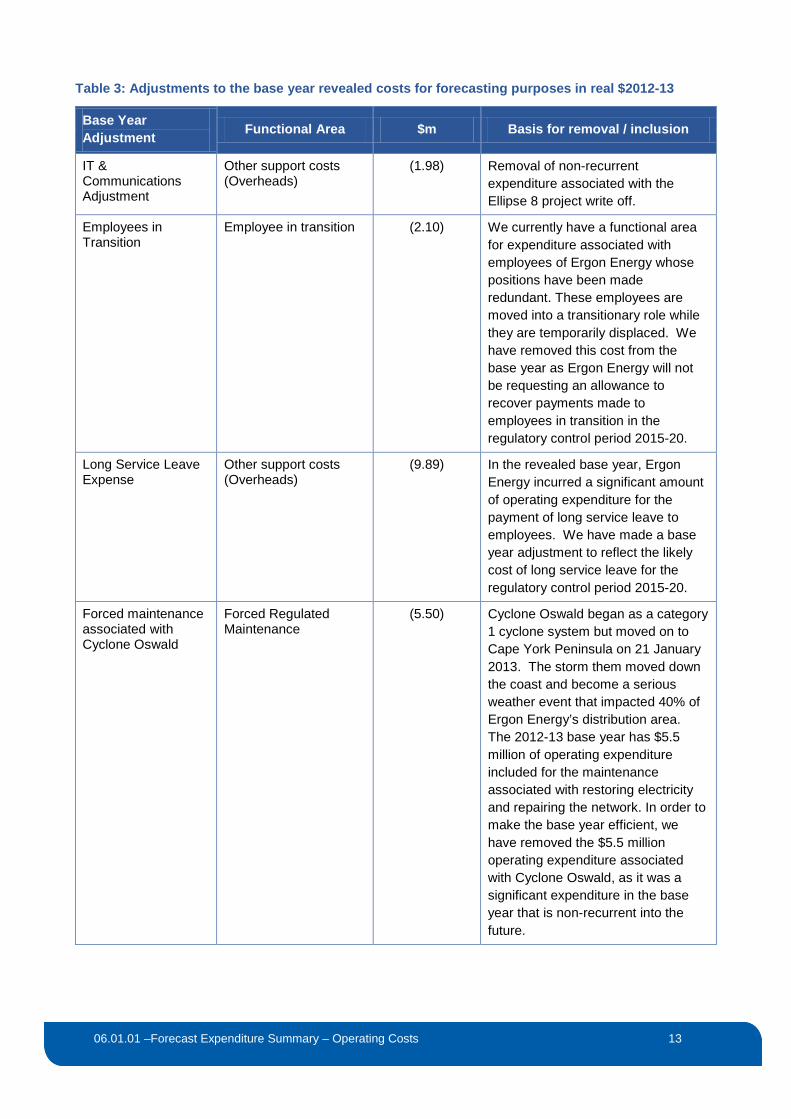
Ergon Energy is proposing number of further adjustments to the adjusted base year, for the purposes of determining the operating expenditure forecast for the regulatory control period 2015-20. These adjustments include both the removal and addition of non-recurrent expenditure which may understate or overstate efficient operating costs. From an efficiency perspective, Ergon Energy has removed a total of $60.5 million from the 2012-13 base year to take account of efficiencies achieved through ROAMES (i.e. improved understanding of asset condition and degradation and vegetation management) and redundancy payments associated with the corporate restructure.
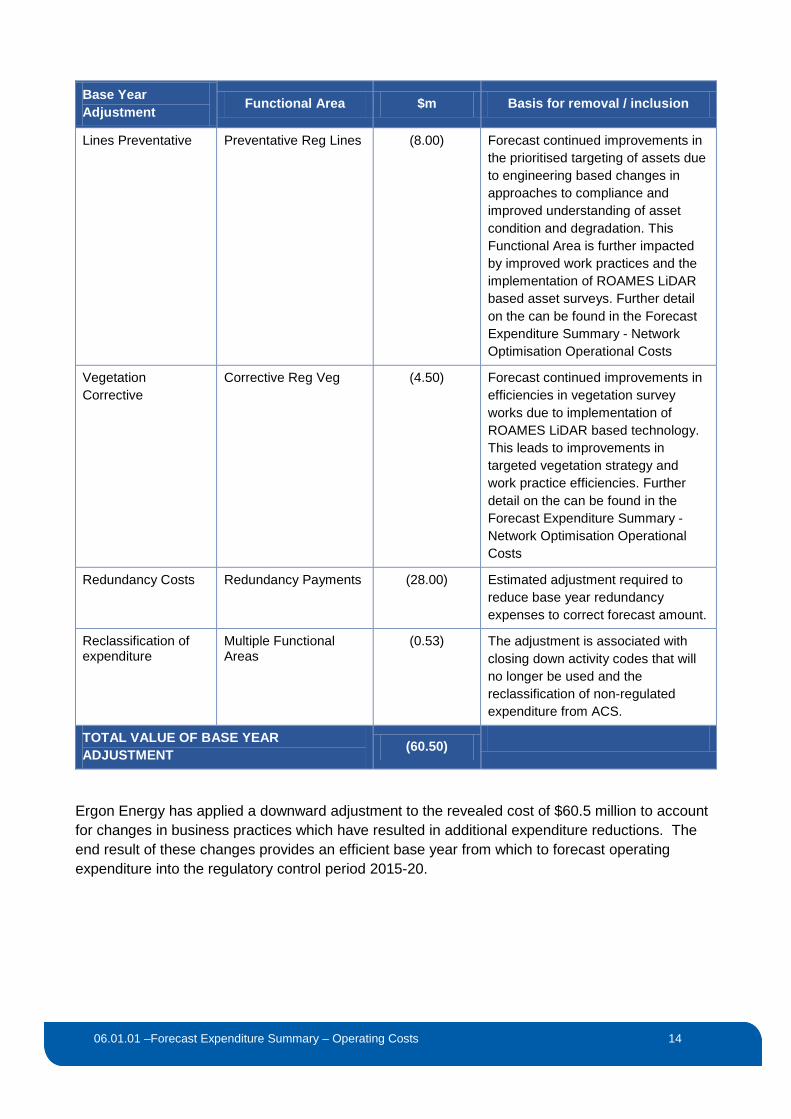
Table 3 outlines the adjustments made to the base year, including the basis for the adjustment.
03.02.01 – Regulatory Model Architecture Summary 13
06.01.01 –Forecast Expenditure Summary – Operating Costs 13
Table 3: Adjustments to the base year revealed costs for forecasting purposes in real $2012-13
Base Year Adjustment Functional Area $m Basis for removal / inclusion
IT & Communications Adjustment
Other support costs (Overheads)
(1.98) Removal of non-recurrent expenditure associated with the Ellipse 8 project write off.
Employees in Transition
Employee in transition (2.10) We currently have a functional area for expenditure associated with employees of Ergon Energy whose positions have been made redundant. These employees are moved into a transitionary role while they are temporarily displaced. We have removed this cost from the base year as Ergon Energy will not be requesting an allowance to recover payments made to employees in transition in the regulatory control period 2015-20.
Long Service Leave Expense
Other support costs (Overheads)
(9.89) In the revealed base year, Ergon Energy incurred a significant amount of operating expenditure for the payment of long service leave to employees. We have made a base year adjustment to reflect the likely cost of long service leave for the regulatory control period 2015-20.
Forced maintenance associated with Cyclone Oswald
Forced Regulated Maintenance
(5.50) Cyclone Oswald began as a category 1 cyclone system but moved on to Cape York Peninsula on 21 January 2013. The storm them moved down the coast and become a serious weather event that impacted 40% of Ergon Energy’s distribution area. The 2012-13 base year has $5.5 million of operating expenditure included for the maintenance associated with restoring electricity and repairing the network. In order to make the base year efficient, we have removed the $5.5 million operating expenditure associated with Cyclone Oswald, as it was a significant expenditure in the base year that is non-recurrent into the future.
03.02.01 – Regulatory Model Architecture Summary 14
06.01.01 –Forecast Expenditure Summary – Operating Costs 14
Base Year Adjustment Functional Area $m Basis for removal / inclusion
Lines Preventative Preventative Reg Lines (8.00) Forecast continued improvements in the prioritised targeting of assets due to engineering based changes in approaches to compliance and improved understanding of asset condition and degradation. This Functional Area is further impacted by improved work practices and the implementation of ROAMES LiDAR based asset surveys. Further detail on the can be found in the Forecast Expenditure Summary - Network Optimisation Operational Costs
Vegetation Corrective
Corrective Reg Veg (4.50) Forecast continued improvements in efficiencies in vegetation survey works due to implementation of ROAMES LiDAR based technology. This leads to improvements in targeted vegetation strategy and work practice efficiencies. Further detail on the can be found in the Forecast Expenditure Summary - Network Optimisation Operational Costs
Redundancy Costs Redundancy Payments (28.00) Estimated adjustment required to reduce base year redundancy expenses to correct forecast amount.
Reclassification of expenditure
Multiple Functional Areas
(0.53) The adjustment is associated with closing down activity codes that will no longer be used and the reclassification of non-regulated expenditure from ACS.
TOTAL VALUE OF BASE YEAR ADJUSTMENT (60.50)
Ergon Energy has applied a downward adjustment to the revealed cost of $60.5 million to account for changes in business practices which have resulted in additional expenditure reductions. The end result of these changes provides an efficient base year from which to forecast operating expenditure into the regulatory control period 2015-20.
03.02.01 – Regulatory Model Architecture Summary 15
06.01.01 –Forecast Expenditure Summary – Operating Costs 15
2.5 Targeted further reduction to overhead costs In seeking to address the long term interests of consumers to achieve further sustainable price reductions, Ergon Energy has proposed a further top down adjustment of 15% to its 2012-13 base year operational overhead costs, coupled with a broad based 1% productivity adjustment going forward.
Ergon Energy’s rationale for these adjustments is set out in 0A.01.02 Our Journey to the Best Possible Price. In summary:
• Like many other utilities, Ergon Energy has a continued focus to reduce costs to match contraction in energy sales volume and demand, suppressed customer network connections and to improve efficiency across the range of Ergon Energy’s operations while meeting regulatory, safety and customer service requirements
• We have also been undertaking further analysis on the evolving operating environment, anticipated regulatory and policy changes, future economic conditions and trends in energy consumption, innovation and consumer expectations to identify where further efficiencies can be achieved
• The changes will provide Ergon Energy with further opportunity to review the way it will meet consumers’ expectations around reliability, performance and the range of services provided
• Additional efficiency savings are expected to be leveraged through the implementation of new management structures, driving a culture of operational and financial efficiency.
We have not fully costed the possible collective impact of these regulatory, structural and technological changes over the regulatory control period 2015-20. However, we are confident of lower cost outcomes and have targeted a lower allowance as a result, equivalent to a reduction of approximately $260 million ($2014-15) or 15% over the regulatory control period 2015-20.
This reduction represents a commitment and challenge to Ergon Energy. However the outcomes are comparable to levels of operating expenditure identified by independent analysis (Independent Review Panel on Network Costs) and benchmarking (Huegin).
2.6 Non-recurrent expenditure
Where expenditure is not incorporated in the base year, but is required in a certain year, we apply a non-recurrent expenditure adjustment. These adjustments differ from step changes, as step changes are applied in a certain year and then continue moving forward. A non-recurrent expenditure item is an adjustment made in one or multiple years for which a specified value is attached. For this reason, these adjustments represent additional expenditure for the year in which the expenditure will occur.
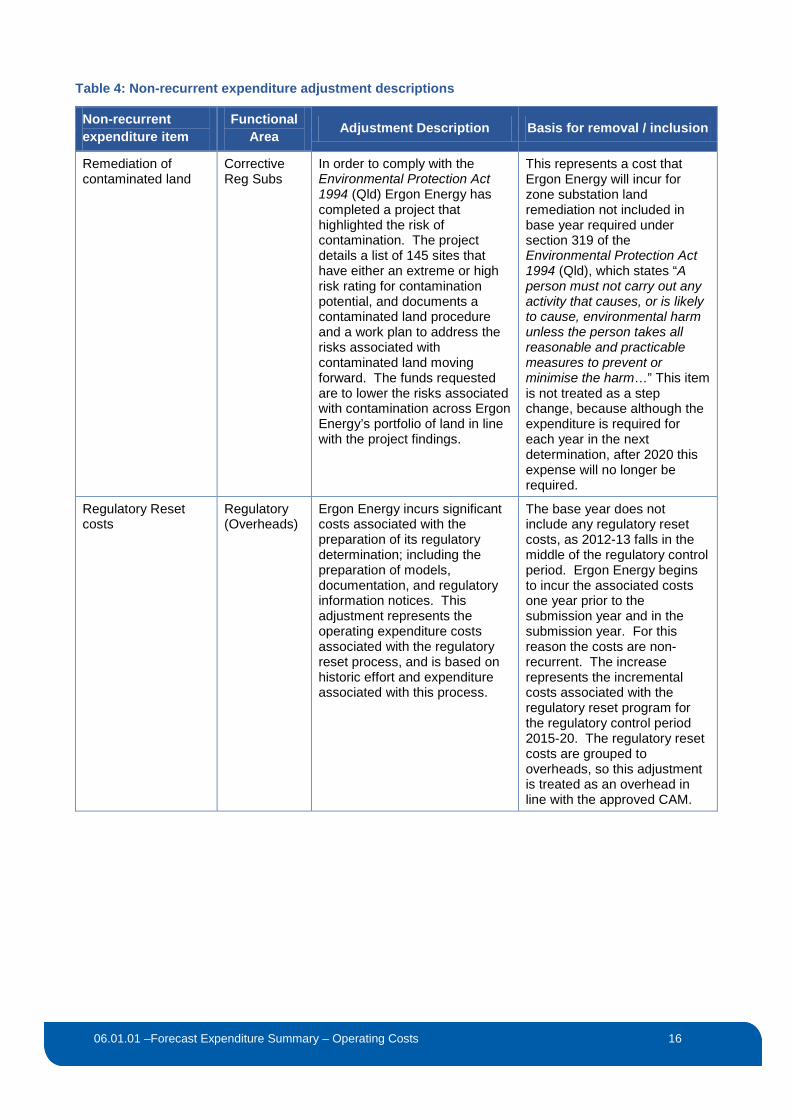
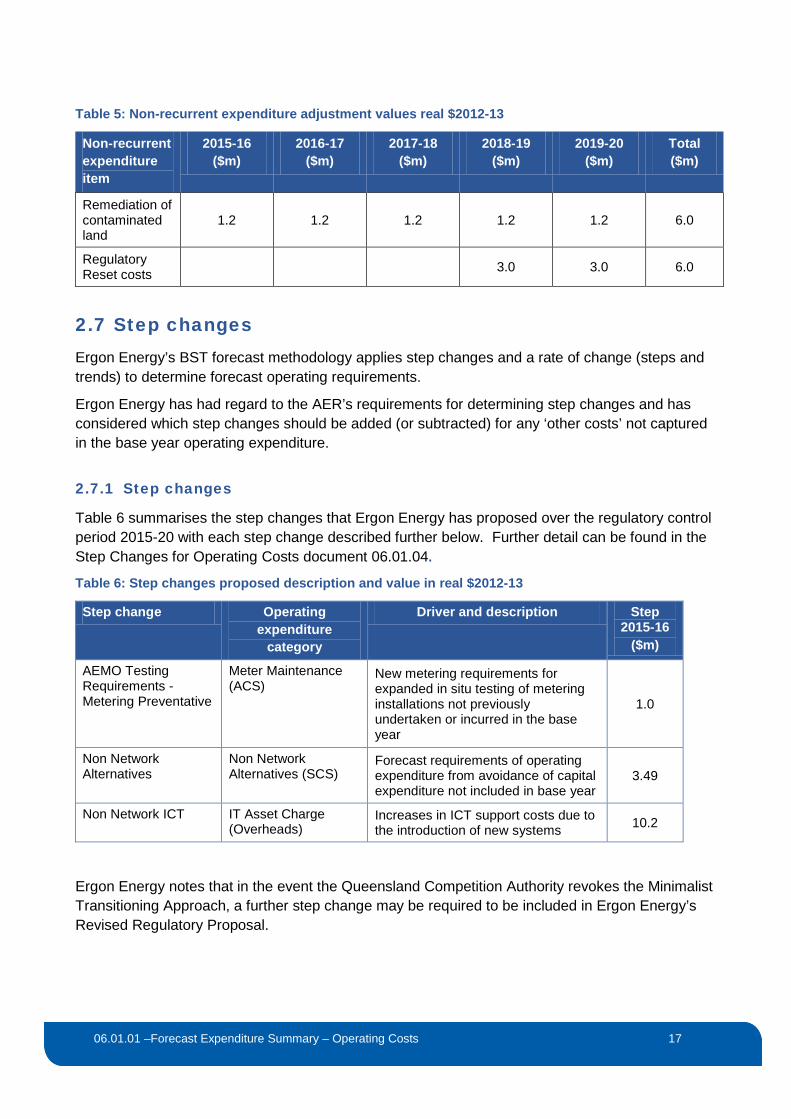
Table 4 below describes each non-recurrent expenditure adjustment and the basis for the adjustment. Table 5 details the value of the adjustment and the year in which it will occur.
03.02.01 – Regulatory Model Architecture Summary 16
06.01.01 –Forecast Expenditure Summary – Operating Costs 16
Table 4: Non-recurrent expenditure adjustment descriptions
Non-recurrent expenditure item
Functional Area Adjustment Description Basis for removal / inclusion
Remediation of contaminated land
Corrective Reg Subs
In order to comply with the Environmental Protection Act 1994 (Qld) Ergon Energy has completed a project that highlighted the risk of contamination. The project details a list of 145 sites that have either an extreme or high risk rating for contamination potential, and documents a contaminated land procedure and a work plan to address the risks associated with contaminated land moving forward. The funds requested are to lower the risks associated with contamination across Ergon Energy’s portfolio of land in line with the project findings.
This represents a cost that Ergon Energy will incur for zone substation land remediation not included in base year required under section 319 of the Environmental Protection Act 1994 (Qld), which states “A person must not carry out any activity that causes, or is likely to cause, environmental harm unless the person takes all reasonable and practicable measures to prevent or minimise the harm…” This item is not treated as a step change, because although the expenditure is required for each year in the next determination, after 2020 this expense will no longer be required.
Regulatory Reset costs
Regulatory (Overheads)
Ergon Energy incurs significant costs associated with the preparation of its regulatory determination; including the preparation of models, documentation, and regulatory information notices. This adjustment represents the operating expenditure costs associated with the regulatory reset process, and is based on historic effort and expenditure associated with this process.
The base year does not include any regulatory reset costs, as 2012-13 falls in the middle of the regulatory control period. Ergon Energy begins to incur the associated costs one year prior to the submission year and in the submission year. For this reason the costs are non-recurrent. The increase represents the incremental costs associated with the regulatory reset program for the regulatory control period 2015-20. The regulatory reset costs are grouped to overheads, so this adjustment is treated as an overhead in line with the approved CAM.
03.02.01 – Regulatory Model Architecture Summary 17
06.01.01 –Forecast Expenditure Summary – Operating Costs 17
Table 5: Non-recurrent expenditure adjustment values real $2012-13
Non-recurrent expenditure item
2015-16 ($m)
2016-17 ($m)
2017-18 ($m)
2018-19 ($m)
2019-20 ($m)
Total ($m)
Remediation of contaminated land
1.2 1.2 1.2 1.2 1.2 6.0
Regulatory Reset costs 3.0 3.0 6.0
2.7 Step changes Ergon Energy’s BST forecast methodology applies step changes and a rate of change (steps and trends) to determine forecast operating requirements.
Ergon Energy has had regard to the AER’s requirements for determining step changes and has considered which step changes should be added (or subtracted) for any ‘other costs’ not captured in the base year operating expenditure.
2.7.1 Step changes
Table 6 summarises the step changes that Ergon Energy has proposed over the regulatory control period 2015-20 with each step change described further below. Further detail can be found in the Step Changes for Operating Costs document 06.01.04.
Table 6: Step changes proposed description and value in real $2012-13
Step change Operating expenditure
category
Driver and description Step 2015-16
($m)
AEMO Testing Requirements - Metering Preventative
Meter Maintenance (ACS)
New metering requirements for expanded in situ testing of metering installations not previously undertaken or incurred in the base year
1.0
Non Network Alternatives
Non Network Alternatives (SCS)
Forecast requirements of operating expenditure from avoidance of capital expenditure not included in base year
3.49
Non Network ICT IT Asset Charge (Overheads)
Increases in ICT support costs due to the introduction of new systems 10.2
Ergon Energy notes that in the event the Queensland Competition Authority revokes the Minimalist Transitioning Approach, a further step change may be required to be included in Ergon Energy’s Revised Regulatory Proposal.
03.02.01 – Regulatory Model Architecture Summary 18
06.01.01 –Forecast Expenditure Summary – Operating Costs 18
AEMO Testing Requirements - Metering Preventative
Metering Preventative costs relate to a change in Ergon Energy’s approach to meeting Australian Energy Market Operator (AEMO) metering requirements for expanded in-situ testing of metering installations not previously undertaken or incurred in the base year.
This is considered to be a step change under the BST methodology as the cost was not part of the operating expenditure for the base year. Furthermore, it is a recurrent operating cost for the regulatory control period 2015-20. These charges have been classified under the Maintenance operating expenditure category.
The step change is due to a change in Ergon Energy’s approach to meeting its regulatory obligations from AEMO from 2015-16. The operating expenditure relates to incremental or additional costs to meet the new specific testing requirements.
The forecast charges for the additional works are $1.0 million from 2015-16.
Non Network Alternatives
Non Network Alternatives costs relate to the operating expenditure initiatives that Ergon Energy undertakes to avoid augmentation capital expenditure, in particular Demand Management. The costs forecast relate to the required operating expenditure for sites where generation is run as an alternative to network augmentation and include fuel costs, running and maintenance costs and certain customer contract costs. The program is supported by cost and benefit analysis of the alternative costs of supply.
This is considered to be a step change under the BST methodology as the cost was not part of the operating expenditure for the base year. Furthermore, it is a recurrent operating cost for the regulatory control period 2015-20. These charges have been classified under the Other operating costs - Network Overheads operating expenditure category.
The step change is due to a capital expenditure / operating expenditure trade-off as the operating expenditure is incurred in the specific avoidance of capital augmentation projects.
The forecast charges for the additional Non Network Alternatives operating expenditure are $4.00 million from 2015-16, offset by a reallocation of embedded generation costs of ($0.50 million).
Non Network ICT
This step change relates to expenditure that is required in the regulatory control period 2015-20 that is not reflected in the 2012-13 base year for BST forecasting purposes and includes:
• Expenditure for the SPARQ support functions for ICT capital works that were approved in the regulatory control period 2010-15 but were delivered after the 2012-13 year
• Expenditure for SPARQ support functions for ICT capital works that were in addition to the approved 2010-15 capital works program but were justified by cost benefit analysis undertaken by Ergon Energy
The driver of the step change has been a change in operating environment, in particular:
03.02.01 – Regulatory Model Architecture Summary 19
06.01.01 –Forecast Expenditure Summary – Operating Costs 19
• For those programs that were approved in the regulatory control period 2010-15, the Queensland Government’s Interdepartmental Committee on Electricity Sector Reform led to a deferral of the programs, resulting in the required operating expenditure not occurring in the revealed base year for BST forecasting purposes
• For those programs which were in addition to the programs approved in the regulatory control period 2010-15, the programs were developed to give the business the ability to cope with additional data and analytic requirements that were not included in the regulatory control period 2010-15 but were supported by a cost benefit analysis for the investment.
These charges have been classified under the other operating costs operating expenditure category.
The forecast charges for the additional Non Network ICT operating expenditure are $10.2 million from 2015-16.
2.8 Growth and trends from base year
Using the Functional Areas of activity, Ergon Energy’s methodology trends the base year expenditure by applying a rate of change to each Functional Area on an annual basis comprised of:
• Output growth
• Real price growth
• Productivity growth.
The change factors that Ergon Energy has applied were developed with reference to the relevant requirements of the NER with respect to realistic expectations of demand and recent AER determinations for other network service providers (NSPs).
2.8.1 Output growth rates methodology
The AER recognises that distribution networks grow in size, and therefore face a corresponding increase in the cost associated with operating and maintaining the network. The annual growth rate of the network is determined with reference to network growth drivers that are considered to approximate the resultant growth in operating expenditure.
Consistent with the AER’s accepted approach to calculating growth, Ergon Energy has calculated two growth drivers: Customer Growth and Network Growth.
Customer growth is calculated as the annual forecast growth in customer numbers over the regulatory control period 2015-20. The customer number forecast is based on an Ergon Energy econometric model described below.
Network Growth has been calculated as a simple average of the forecast annual growth in zone substation capacity, distribution line length and the number of distribution transformers over the forthcoming regulatory control period. The methodology for calculating the composite driver, including the methodology for each factor is discussed below.
03.02.01 – Regulatory Model Architecture Summary 20
06.01.01 –Forecast Expenditure Summary – Operating Costs 20
Customer Growth
In 2009, the AER engaged McLennan Magasanik Associates (MMA) to review Ergon Energy‘s demand forecasts as part of the regulatory determination process. MMA made a number of recommendations, including recommendations regarding the forecast for energy consumption together with customer number forecasts.
Ergon Energy addressed these recommendations by developing a range of demand forecast models in consultation with external parties, including development of a model to forecast customer numbers.
The model and forecast produce energy consumption and customer numbers projections over a forecast horizon of up to 10 years, with a capability of producing both quarterly and annual forecasts.
The model is econometrically driven and captures the relationship between energy and its fundamental drivers. It therefore differs from previous approaches adopted by Ergon Energy that primarily involved the extrapolation of historical trends.
The econometric approach provides details on the flexibility to incorporate new and dynamically changing information. It also provides the basis for a well-specified and transparent modelling tool that is targeted to satisfy regulatory requirements for a best practice approach to forecasting energy demand and customer numbers. Ergon Energy uses the annual change in forecast customer numbers from the economic model for the Customer Growth driver.
Network Growth
Network Growth is calculated as the simple average of the annual growth in zone substation capacity, line length and the number of distribution transformers over the forthcoming regulatory control period. It is noted that the AER adopted this approach in its last determination for the Victorian Distribution Network Service Providers (DNSPs) and Aurora Energy. Ergon Energy’s forecast is based on historic data derived from RIN data and internal strategic data sets. The distribution line length and the zone substation capacity forecasts are reported in the reset RIN.
Distribution line length
The method to forecast the kilometres of conductor for the RIN is used to calculate the percentage year on year change for distribution line length. The methodology is as follows:
• Match the purchased conductor in the requestion orders against historical capital expenditure to find the amount of conductor installed and augmentation expenditure for each year
• Calculate the ratio of conductor installed to capital expenditure over the 2008 – 2014 calendar year period
• Multiply this ratio by forecast capital expenditure each year to forecast the total conductor installed each financial year
03.02.01 – Regulatory Model Architecture Summary 21
06.01.01 –Forecast Expenditure Summary – Operating Costs 21
• Divide the total new conductor according to the current (2014) percentage distribution of conductor across the Overhead and Underground voltage categories
• Accumulate the year on year new conductor to find total circuit lengths for each year in the forecast.
The following assumptions have been made:
• The percentage distribution of conductor across the Overhead and Underground voltage categories will remain constant in the future. Historically, it has been very stable, so Ergon Energy believe this assumption to be reasonable
• Capital expenditure on lines augmentation projects scales in a linear basis with new conductor added, when taken at a network-wide level.
Zone substation capacity
The method to forecast the zone substation capacity for the reset RIN is used to calculate the percentage year on year change. The methodology involves using a linear trend performed over historical years and projected across the forecast years.
Assumptions that have been made are:
• Historical years with significant data corrections have been excluded from linear trend calculation
• Where historical years have been excluded from the trend calculation, the trend has been applied to latest historical value and projected across the forecast years.
Number of distribution transformers
The count of distribution transformers is from Ergon Energy records and is not directly reported in the reset RIN. Ergon Energy method to calculate the forecast is to:
• Average historic distribution transformer rates of change
• The average is used to generate a year-on-year forecast of network measures linked to the customer number forecasts from Ergon Energy’s econometric forecasts.
This forecasting approach provides a link to the forecast of customer numbers normalised for the attributes of Ergon Energy’s network topology.
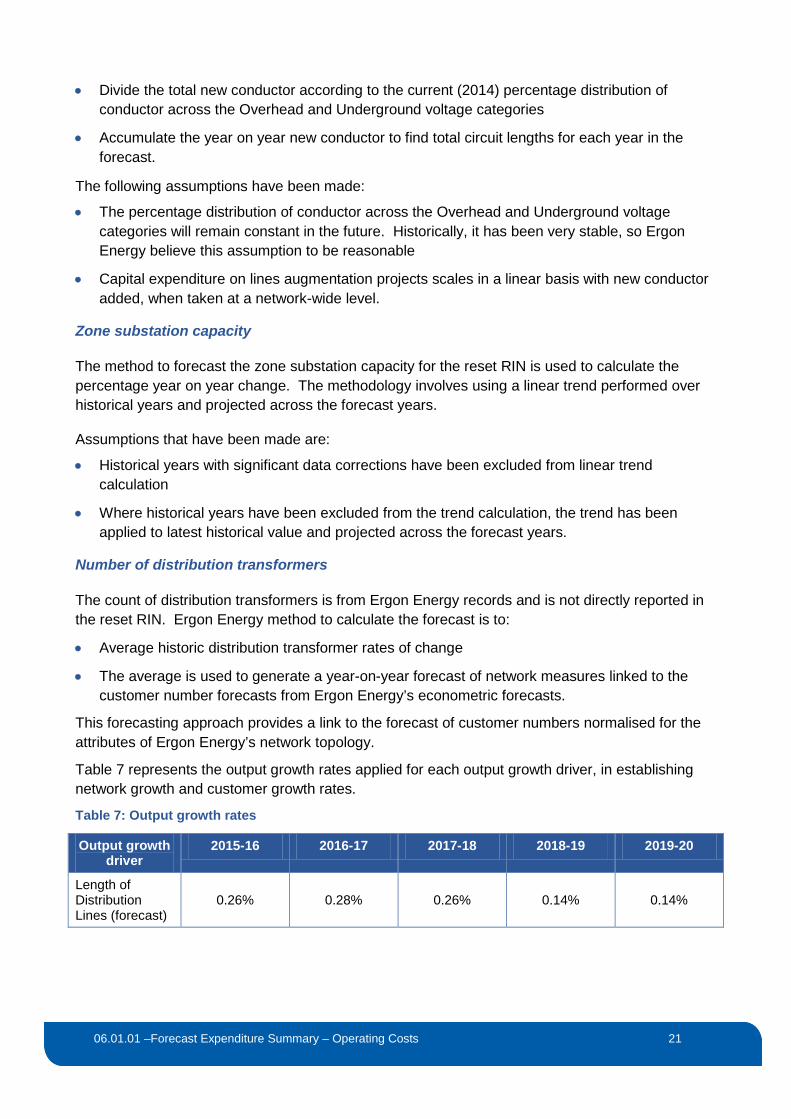
Table 7 represents the output growth rates applied for each output growth driver, in establishing network growth and customer growth rates.
Table 7: Output growth rates
Output growth driver
2015-16 2016-17 2017-18 2018-19 2019-20
Length of Distribution Lines (forecast)
0.26% 0.28% 0.26% 0.14% 0.14%
03.02.01 – Regulatory Model Architecture Summary 22
06.01.01 –Forecast Expenditure Summary – Operating Costs 22
Output growth driver
2015-16 2016-17 2017-18 2018-19 2019-20
Distribution Transformers count (forecast)
2.10% 2.29% 2.10% 2.08% 2.08%
Capacity of Zone substations (forecast)
1.90% 0.40% 0.29% 0.38% 1.27%
Average customer numbers (forecast)
1.64% 1.80% 1.65% 1.64% 1.65%
Network Growth 1.42% 0.99% 0.88% 0.87% 1.16%
Customer Growth
1.64% 1.80% 1.65% 1.64% 1.65%
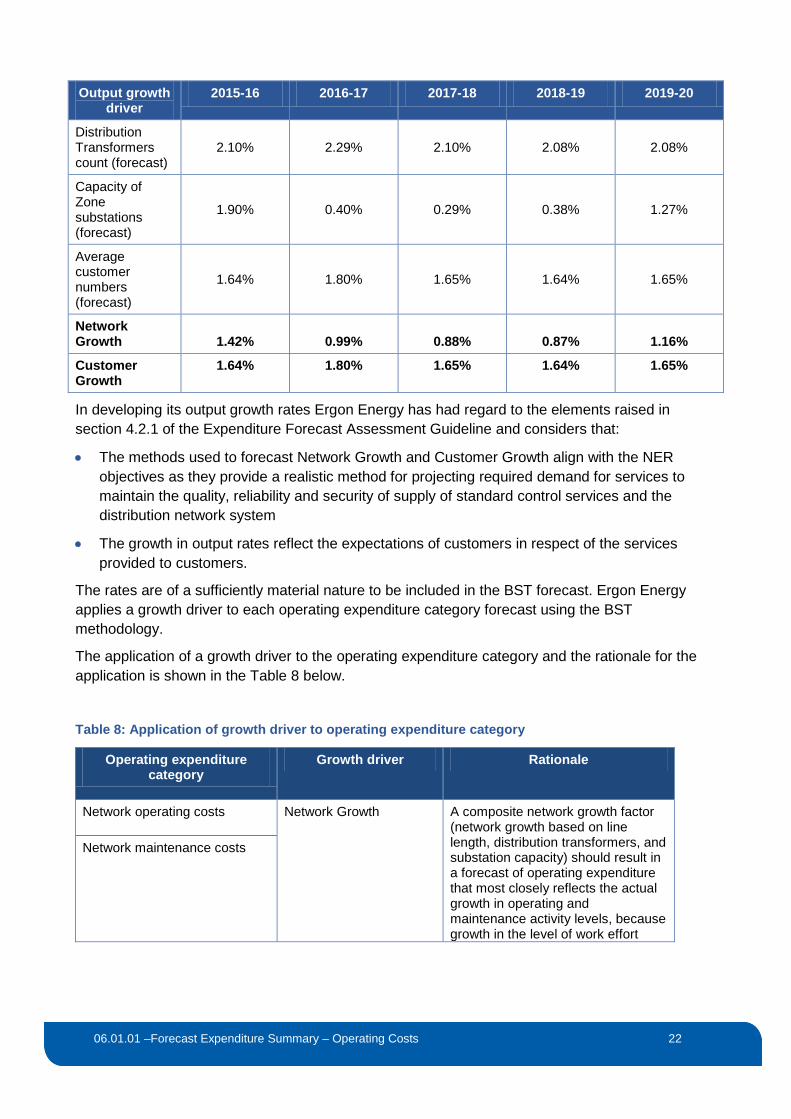
In developing its output growth rates Ergon Energy has had regard to the elements raised in section 4.2.1 of the Expenditure Forecast Assessment Guideline and considers that:
• The methods used to forecast Network Growth and Customer Growth align with the NER objectives as they provide a realistic method for projecting required demand for services to maintain the quality, reliability and security of supply of standard control services and the distribution network system
• The growth in output rates reflect the expectations of customers in respect of the services provided to customers.
The rates are of a sufficiently material nature to be included in the BST forecast. Ergon Energy applies a growth driver to each operating expenditure category forecast using the BST methodology.
The application of a growth driver to the operating expenditure category and the rationale for the application is shown in the Table 8 below.
Table 8: Application of growth driver to operating expenditure category
Operating expenditure category
Growth driver Rationale
Network operating costs Network Growth A composite network growth factor (network growth based on line length, distribution transformers, and substation capacity) should result in a forecast of operating expenditure that most closely reflects the actual growth in operating and maintenance activity levels, because growth in the level of work effort
Network maintenance costs
03.02.01 – Regulatory Model Architecture Summary 23
06.01.01 –Forecast Expenditure Summary – Operating Costs 23
Operating expenditure category
Growth driver Rationale
required to operate and maintain assets is commensurate with growth in the assets themselves8.
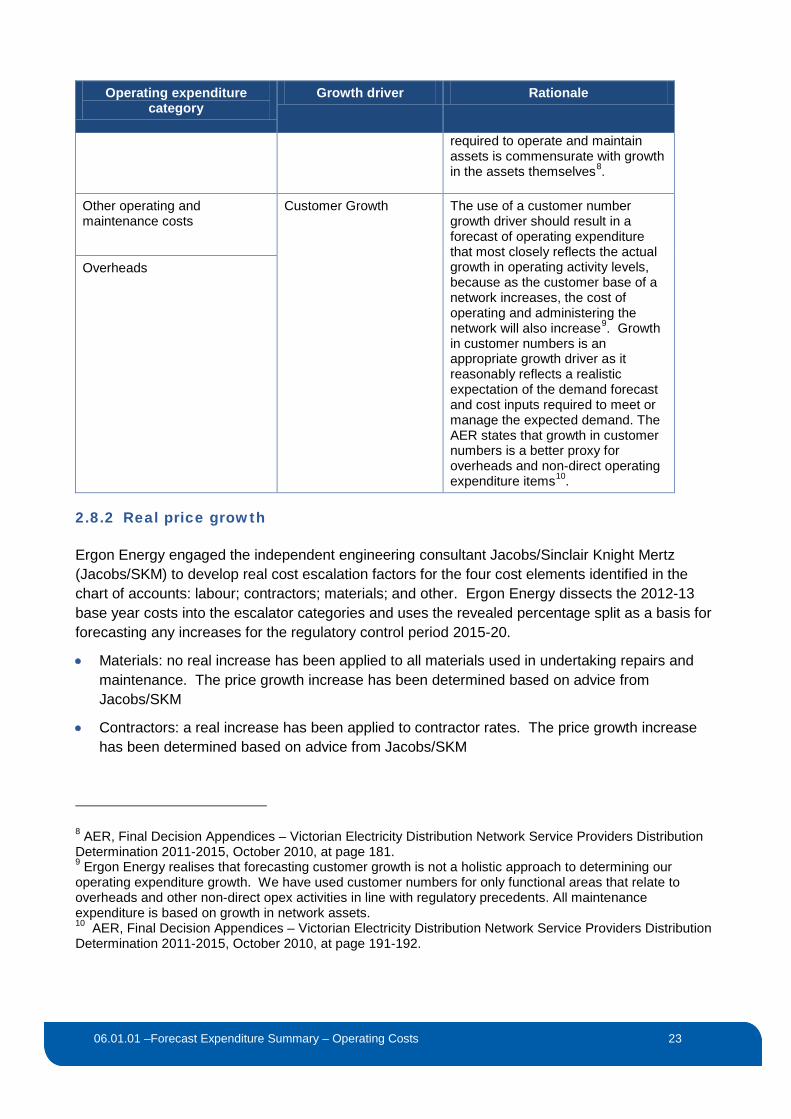
Other operating and maintenance costs
Customer Growth The use of a customer number growth driver should result in a forecast of operating expenditure that most closely reflects the actual growth in operating activity levels, because as the customer base of a network increases, the cost of operating and administering the network will also increase9. Growth in customer numbers is an appropriate growth driver as it reasonably reflects a realistic expectation of the demand forecast and cost inputs required to meet or manage the expected demand. The AER states that growth in customer numbers is a better proxy for overheads and non-direct operating expenditure items10.
Overheads
2.8.2 Real price growth
Ergon Energy engaged the independent engineering consultant Jacobs/Sinclair Knight Mertz (Jacobs/SKM) to develop real cost escalation factors for the four cost elements identified in the chart of accounts: labour; contractors; materials; and other. Ergon Energy dissects the 2012-13 base year costs into the escalator categories and uses the revealed percentage split as a basis for forecasting any increases for the regulatory control period 2015-20.
• Materials: no real increase has been applied to all materials used in undertaking repairs and maintenance. The price growth increase has been determined based on advice from Jacobs/SKM
• Contractors: a real increase has been applied to contractor rates. The price growth increase has been determined based on advice from Jacobs/SKM
8 AER, Final Decision Appendices – Victorian Electricity Distribution Network Service Providers Distribution Determination 2011-2015, October 2010, at page 181. 9 Ergon Energy realises that forecasting customer growth is not a holistic approach to determining our operating expenditure growth. We have used customer numbers for only functional areas that relate to overheads and other non-direct opex activities in line with regulatory precedents. All maintenance expenditure is based on growth in network assets. 10 AER, Final Decision Appendices – Victorian Electricity Distribution Network Service Providers Distribution Determination 2011-2015, October 2010, at page 191-192.
03.02.01 – Regulatory Model Architecture Summary 24
06.01.01 –Forecast Expenditure Summary – Operating Costs 24
• Labour: a real increase has been applied to productive Ergon Energy labour costs. Jacobs/SKM advised that labour costs should increase only by the level of inflation (CPI)
• Other: no real increase has been applied to the cost of all other direct inputs.
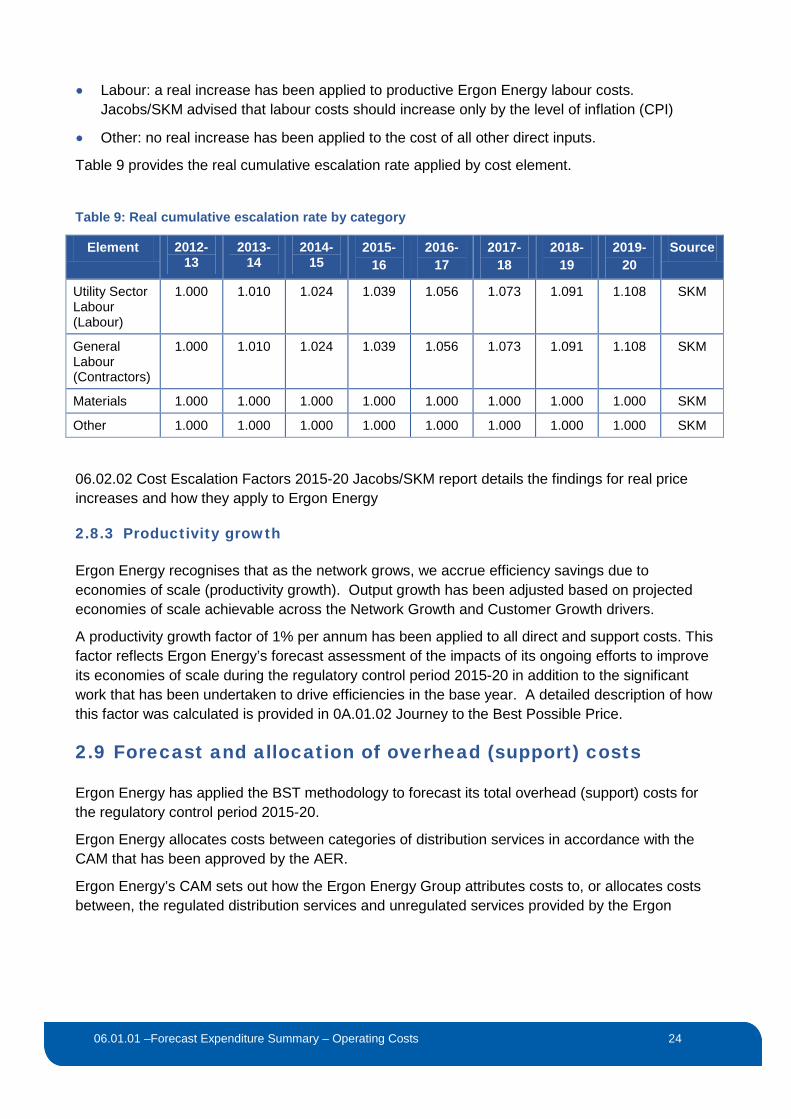
Table 9 provides the real cumulative escalation rate applied by cost element.
Table 9: Real cumulative escalation rate by category
Element 2012-13
2013-14
2014-15
2015-16
2016-17
2017-18
2018-19
2019-20
Source
Utility Sector Labour (Labour)
1.000 1.010 1.024 1.039 1.056 1.073 1.091 1.108 SKM
General Labour (Contractors)
1.000 1.010 1.024 1.039 1.056 1.073 1.091 1.108 SKM
Materials 1.000 1.000 1.000 1.000 1.000 1.000 1.000 1.000 SKM
Other 1.000 1.000 1.000 1.000 1.000 1.000 1.000 1.000 SKM
06.02.02 Cost Escalation Factors 2015-20 Jacobs/SKM report details the findings for real price increases and how they apply to Ergon Energy
2.8.3 Productivity growth
Ergon Energy recognises that as the network grows, we accrue efficiency savings due to economies of scale (productivity growth). Output growth has been adjusted based on projected economies of scale achievable across the Network Growth and Customer Growth drivers.
A productivity growth factor of 1% per annum has been applied to all direct and support costs. This factor reflects Ergon Energy’s forecast assessment of the impacts of its ongoing efforts to improve its economies of scale during the regulatory control period 2015-20 in addition to the significant work that has been undertaken to drive efficiencies in the base year. A detailed description of how this factor was calculated is provided in 0A.01.02 Journey to the Best Possible Price.
2.9 Forecast and allocation of overhead (support) costs
Ergon Energy has applied the BST methodology to forecast its total overhead (support) costs for the regulatory control period 2015-20.
Ergon Energy allocates costs between categories of distribution services in accordance with the CAM that has been approved by the AER.
Ergon Energy’s CAM sets out how the Ergon Energy Group attributes costs to, or allocates costs between, the regulated distribution services and unregulated services provided by the Ergon
03.02.01 – Regulatory Model Architecture Summary 25
06.01.01 –Forecast Expenditure Summary – Operating Costs 25
Energy Group. Ergon Energy applies its CAM to prepare forecast operating expenditure to be submitted to the AER in accordance with clause 6.5.6 of the NER.
Under the CAM, overhead (support) costs are allocated between categories of distribution services using appropriate causal allocators, as required by section 2.2.4 of the Cost Allocation Guideline.
The process for allocation of overhead costs to distribution services is as follows:
1. Allocation of overhead costs between the regulated distribution services provided by Ergon Energy and each of the unregulated services provided by the Ergon Energy Group
2. For the costs allocated to the regulated distribution services provided by Ergon Energy, further allocation of the costs between regulated operating expenditure and regulated capital expenditure
3. Calculation of the Shared Cost Percentage Rate for each of regulated operating expenditure and regulated capital expenditure. The Shared Cost Percentage Rate is the proportion of shared costs for a particular budgeted operating expenditure activity over the total budgeted operating expenditure
4. Application of the Shared Cost Percentage Rate to direct operating expenditure and direct capital expenditure.
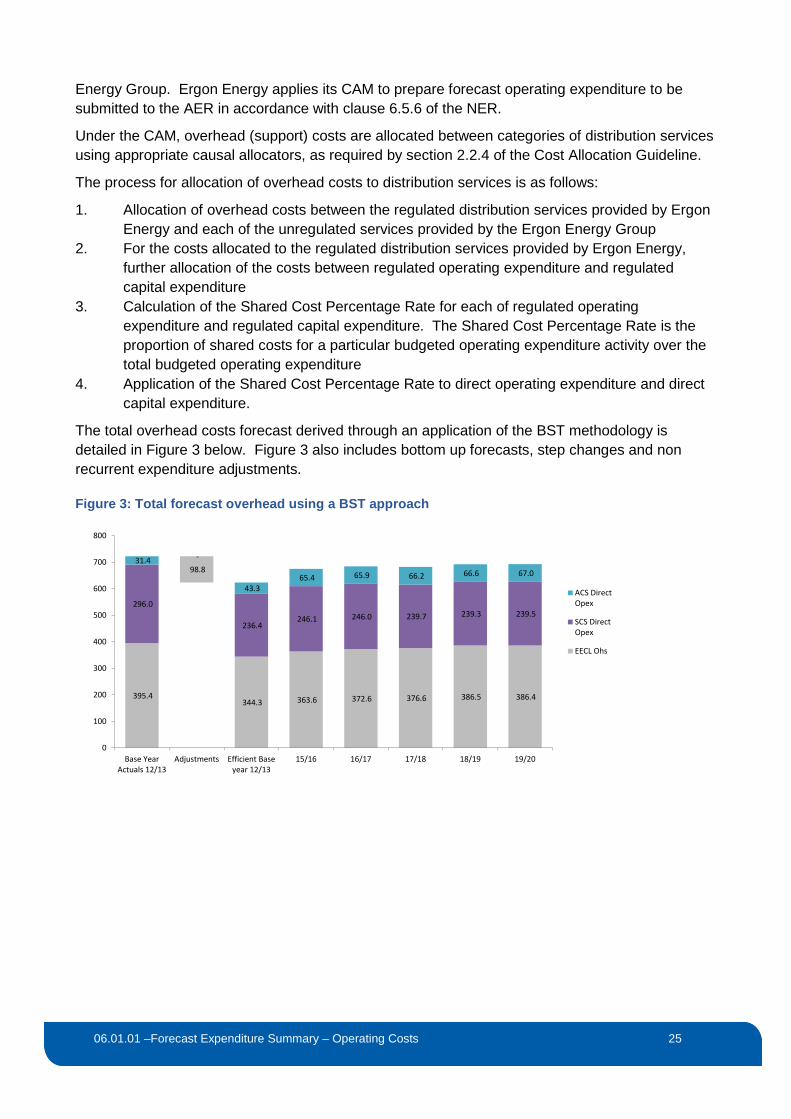
The total overhead costs forecast derived through an application of the BST methodology is detailed in Figure 3 below. Figure 3 also includes bottom up forecasts, step changes and non recurrent expenditure adjustments.
Figure 3: Total forecast overhead using a BST approach
395.4
98.8
344.3 363.6 372.6 376.6 386.5 386.4
296.0
-
236.4 246.1 246.0 239.7 239.3 239.5
31.4
43.3 65.4 65.9 66.2 66.6 67.0
0
100
200
300
400
500
600
700
800
Base YearActuals 12/13
Adjustments Efficient Baseyear 12/13
15/16 16/17 17/18 18/19 19/20
ACS DirectOpex
SCS DirectOpex
EECL Ohs
03.02.01 – Regulatory Model Architecture Summary 26
06.01.01 –Forecast Expenditure Summary – Operating Costs 26
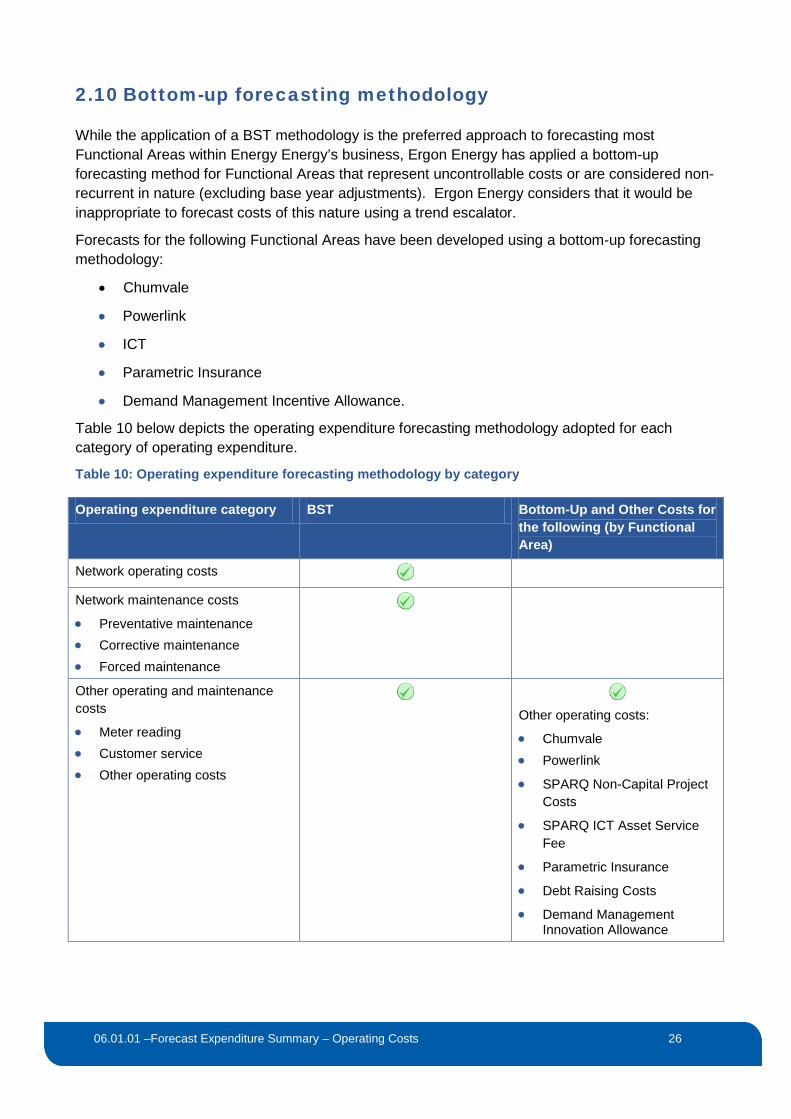
2.10 Bottom-up forecasting methodology
While the application of a BST methodology is the preferred approach to forecasting most Functional Areas within Energy Energy’s business, Ergon Energy has applied a bottom-up forecasting method for Functional Areas that represent uncontrollable costs or are considered non-recurrent in nature (excluding base year adjustments). Ergon Energy considers that it would be inappropriate to forecast costs of this nature using a trend escalator.
Forecasts for the following Functional Areas have been developed using a bottom-up forecasting methodology:
• Chumvale
• Powerlink
• ICT
• Parametric Insurance
• Demand Management Incentive Allowance.
Table 10 below depicts the operating expenditure forecasting methodology adopted for each category of operating expenditure.
Table 10: Operating expenditure forecasting methodology by category
Operating expenditure category BST Bottom-Up and Other Costs for the following (by Functional Area)
Network operating costs
Network maintenance costs
• Preventative maintenance • Corrective maintenance • Forced maintenance
Other operating and maintenance costs
• Meter reading • Customer service • Other operating costs
Other operating costs:
• Chumvale • Powerlink
• SPARQ Non-Capital Project Costs
• SPARQ ICT Asset Service Fee
• Parametric Insurance
• Debt Raising Costs
• Demand Management Innovation Allowance
03.02.01 – Regulatory Model Architecture Summary 27
06.01.01 –Forecast Expenditure Summary – Operating Costs 27
2.10.1 Chumvale (220kV network supplying Cloncurry)
‘Chumvale’ refers to the substation on the unregulated 220kV network which services the Cloncurry Township. Under clause 11.39 of the NER, the charges levied on Ergon Energy for the use of this line are treated as ‘designated pricing proposal charges’. This means that the cost is treated as a cost pass through in Ergon Energy’s annual pricing proposal. The cost is not included in the operating expenditure building block, and is not reflected in the base year operating expenditure.
The transitional rules set out in Chapter 11 of the NER only apply for the regulatory control period 2010-15, which means that the cost will need to be included in the forecast operating expenditure used to determine the maximum allowable revenue (MAR) for the regulatory control period 2015-20. The AER has already acknowledged that Ergon Energy may include these costs in its Regulatory Proposal for the regulatory control period 2015-20.11
This is considered to a bottom up item because the cost was not part of the operating expenditure for the base year in base step trend. Furthermore, it is a recurrent operating cost for the regulatory control period 2015-20 of which the cost is known with certainty and the annual charge is not trended.
The forecast charges for the use of the 220 kV line are $0.8 million from 2015-16.
2.10.2 Powerlink
‘Powerlink’ refers to the cost for entry and exit services charged by Powerlink at four non-prescribed connection points – Queensland Nickel, Stoney Creek, Kings Creek and Oakey Town. Under clause 11.39 of the NER (the transitional Rules), the charges levied on Ergon Energy are treated as ‘designated pricing proposal charges’. This means that the cost is treated as a cost pass through in Ergon Energy’s annual pricing proposal. The cost is not included in the operating expenditure building block, and is not reflected in the base year operating expenditure.
The transitional rules set out in Chapter 11 only apply for the current regulatory control period, which means that the cost will need to be included in the forecast operating expenditure used to determine the MAR for the regulatory control period commencing 1 July 2015. The AER has already acknowledged that Ergon Energy may include these costs in its Regulatory Proposal for the next regulatory control period.
The charges for the entry and exit services for the non-prescribed connection points are treated as adjustments to the base operating expenditure for 2015-16 and 2016-17, as these costs will be incurred as operating expenditure in those two years only. We understand that Powerlink is considering applying to the AER to have these connection services classified as prescribed services for its next regulatory control period, commencing on 1 July 2017. Subject to approval by the AER, the costs will therefore be reflected in the TUOS charges from 2017-18 onwards. The
11 AER, Final Framework and Approach for Energex and Ergon Energy – Regulatory control period commencing 1 July 2015, April 2014.
03.02.01 – Regulatory Model Architecture Summary 28
06.01.01 –Forecast Expenditure Summary – Operating Costs 28
forecast charges for these entry and exit services are $11.8 million (in $2012-13) for 2015-16 and 2016-17.
2.10.3 ICT
SPARQ Non Capital Project Costs and Asset Service Fees
Ergon Energy has identified that the BST forecasting method is considered not suitable for forecasting the following types of ICT operational expenditure:
• ICT Non Capital Project Costs, which consist of non-recurrent major investments that do not meet the capital definitions under relevant accounting standards
• ICT Asset Service Fees (depreciation and finance costs recovered by SPARQ Solutions through charges to Ergon Energy), which represent operational expenses resulting from non-recurrent major investments capitalised in SPARQ Solutions.
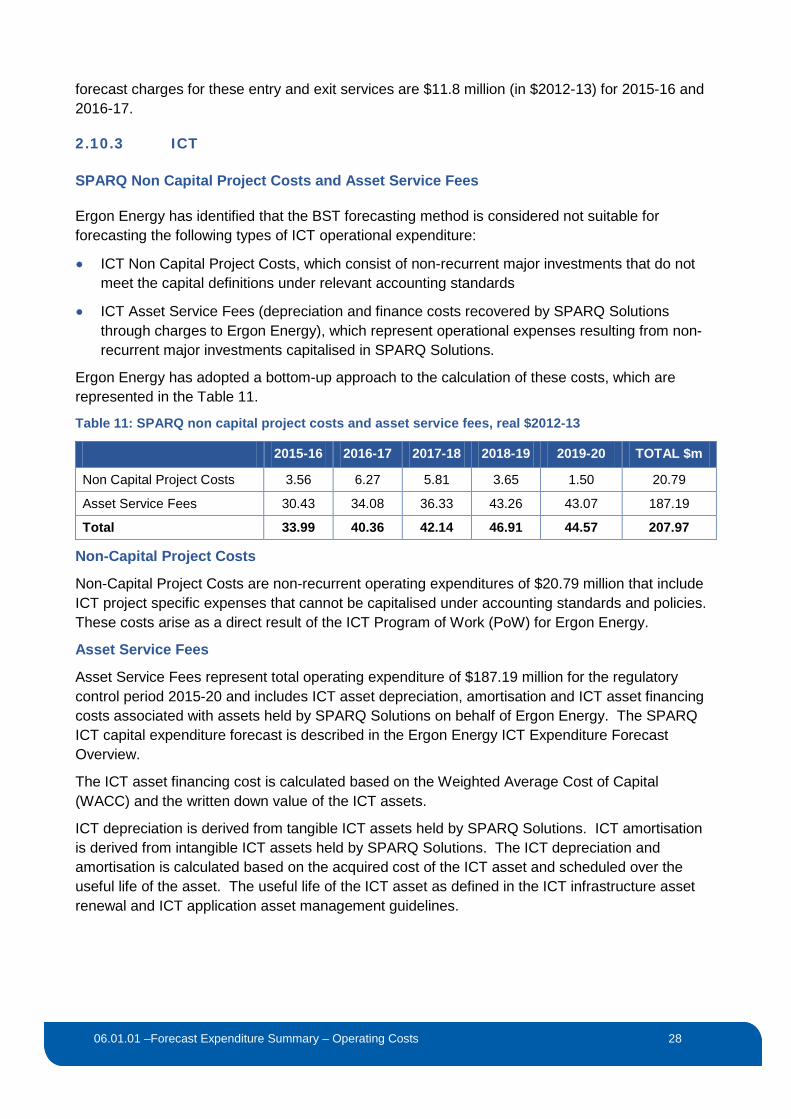
Ergon Energy has adopted a bottom-up approach to the calculation of these costs, which are represented in the Table 11.
Table 11: SPARQ non capital project costs and asset service fees, real $2012-13
2015-16 2016-17 2017-18 2018-19 2019-20 TOTAL $m
Non Capital Project Costs 3.56 6.27 5.81 3.65 1.50 20.79
Asset Service Fees 30.43 34.08 36.33 43.26 43.07 187.19
Total 33.99 40.36 42.14 46.91 44.57 207.97
Non-Capital Project Costs
Non-Capital Project Costs are non-recurrent operating expenditures of $20.79 million that include ICT project specific expenses that cannot be capitalised under accounting standards and policies. These costs arise as a direct result of the ICT Program of Work (PoW) for Ergon Energy.
Asset Service Fees
Asset Service Fees represent total operating expenditure of $187.19 million for the regulatory control period 2015-20 and includes ICT asset depreciation, amortisation and ICT asset financing costs associated with assets held by SPARQ Solutions on behalf of Ergon Energy. The SPARQ ICT capital expenditure forecast is described in the Ergon Energy ICT Expenditure Forecast Overview.
The ICT asset financing cost is calculated based on the Weighted Average Cost of Capital (WACC) and the written down value of the ICT assets.
ICT depreciation is derived from tangible ICT assets held by SPARQ Solutions. ICT amortisation is derived from intangible ICT assets held by SPARQ Solutions. The ICT depreciation and amortisation is calculated based on the acquired cost of the ICT asset and scheduled over the useful life of the asset. The useful life of the ICT asset as defined in the ICT infrastructure asset renewal and ICT application asset management guidelines.
03.02.01 – Regulatory Model Architecture Summary 29
06.01.01 –Forecast Expenditure Summary – Operating Costs 29
These costs are driven by the WACC, ICT PoW, economic life of the asset, and the age profile of the ICT assets held by SPARQ Solutions.
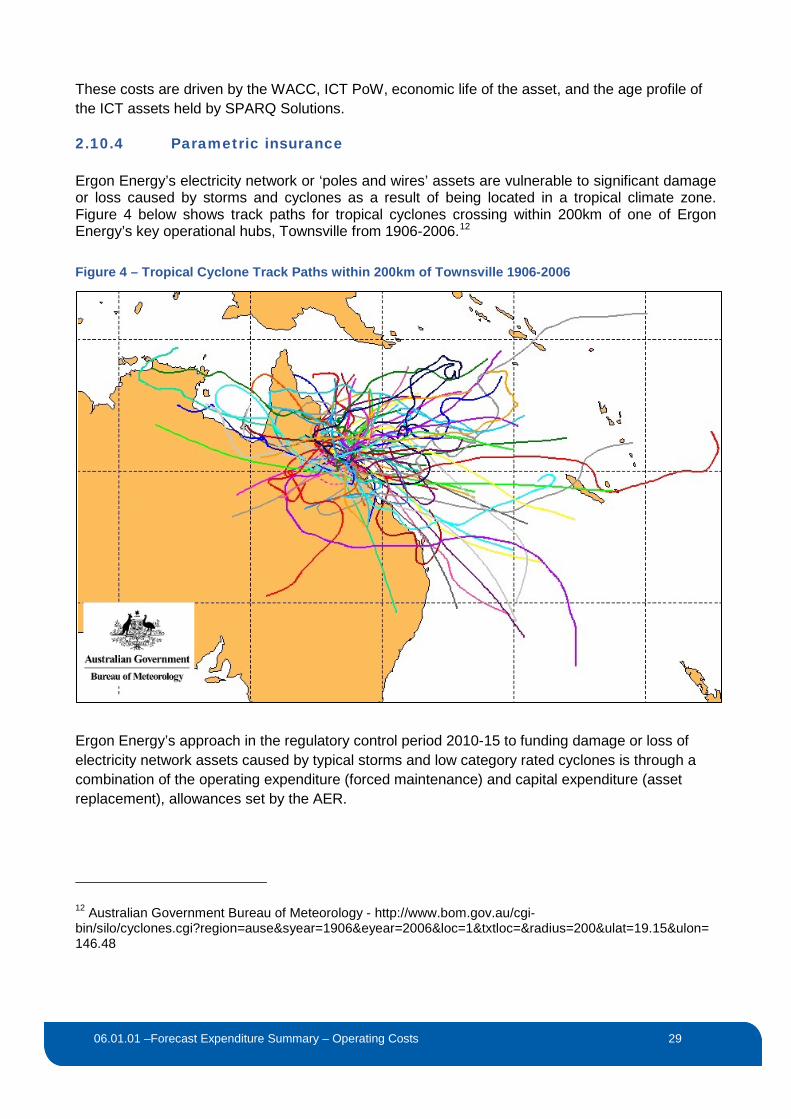
2.10.4 Parametric insurance
Ergon Energy’s electricity network or ‘poles and wires’ assets are vulnerable to significant damage or loss caused by storms and cyclones as a result of being located in a tropical climate zone. Figure 4 below shows track paths for tropical cyclones crossing within 200km of one of Ergon Energy’s key operational hubs, Townsville from 1906-2006.12 Figure 4 – Tropical Cyclone Track Paths within 200km of Townsville 1906-2006
Ergon Energy’s approach in the regulatory control period 2010-15 to funding damage or loss of electricity network assets caused by typical storms and low category rated cyclones is through a combination of the operating expenditure (forced maintenance) and capital expenditure (asset replacement), allowances set by the AER.
12 Australian Government Bureau of Meteorology - http://www.bom.gov.au/cgi-bin/silo/cyclones.cgi?region=ause&syear=1906&eyear=2006&loc=1&txtloc=&radius=200&ulat=19.15&ulon=146.48
03.02.01 – Regulatory Model Architecture Summary 30
06.01.01 –Forecast Expenditure Summary – Operating Costs 30
For large storms and high category rated cyclones, Ergon Energy may fund the cost by using the cost pass through provisions in the NER.13 Historically, Ergon Energy has not insured its electricity network assets against major damage or loss caused by storms and cyclones because of a lack of available and efficiently priced insurance cover in the insurance markets and sought to rely on cost pass through mechanisms, where appropriate.
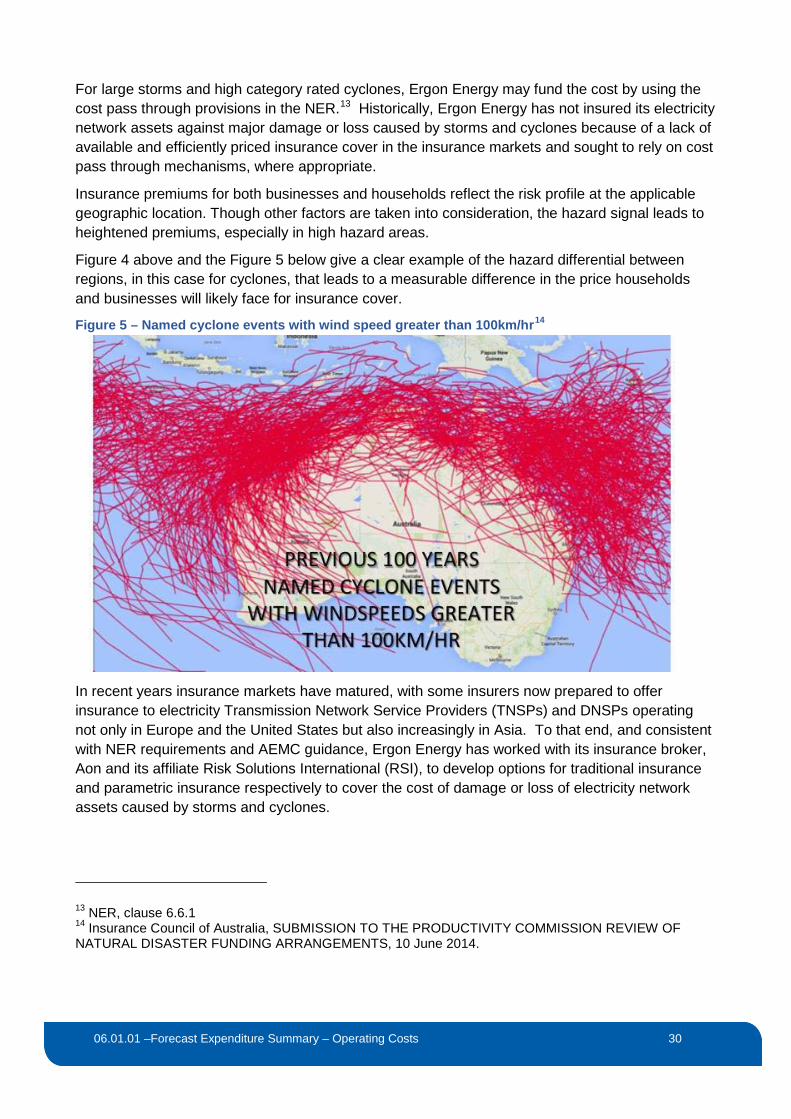
Insurance premiums for both businesses and households reflect the risk profile at the applicable geographic location. Though other factors are taken into consideration, the hazard signal leads to heightened premiums, especially in high hazard areas.
Figure 4 above and the Figure 5 below give a clear example of the hazard differential between regions, in this case for cyclones, that leads to a measurable difference in the price households and businesses will likely face for insurance cover.
Figure 5 – Named cyclone events with wind speed greater than 100km/hr14
In recent years insurance markets have matured, with some insurers now prepared to offer insurance to electricity Transmission Network Service Providers (TNSPs) and DNSPs operating not only in Europe and the United States but also increasingly in Asia. To that end, and consistent with NER requirements and AEMC guidance, Ergon Energy has worked with its insurance broker, Aon and its affiliate Risk Solutions International (RSI), to develop options for traditional insurance and parametric insurance respectively to cover the cost of damage or loss of electricity network assets caused by storms and cyclones.
13 NER, clause 6.6.1 14 Insurance Council of Australia, SUBMISSION TO THE PRODUCTIVITY COMMISSION REVIEW OF NATURAL DISASTER FUNDING ARRANGEMENTS, 10 June 2014.
03.02.01 – Regulatory Model Architecture Summary 31
06.01.01 –Forecast Expenditure Summary – Operating Costs 31
Ergon Energy has identified a parametric insurance product that will address applicable NER requirements and provide an efficient and prudent level of insurance cover to mitigate the financial risks Ergon Energy faces in relation to damage caused to its electricity network by large scale storm and cyclone events. Further details of the proposed approach can be found in 06.02.03 Parametric Insurance Report.
2.10.5 Demand Management Innovation Allowance (DMIA)
The AER has proposed in its Framework and Approach paper to provide Ergon Energy with a $5 million allowance for the DMIA, pursuant to the AER’s Demand Management Incentive Scheme. For revenue modelling purposes, Ergon Energy has included the $5 million (nominal) of DMIA as a bottom up item in its operating expenditure forecast. To avoid double counting of the allowance, no further adjustments have been made to the revenue model.
Further details of this scheme are described in 03.01.03 Ergon Energy’s Application of Incentive Schemes document.
2.11 Other Costs
2.11.1 Debt raising costs
Ergon Energy is proposing a debt raising allowance to compensate for the transactional costs that a prudent service provider acting efficiently incurs whilst raising debt. Ergon Energy engaged Incenta Economic Consulting (Incenta) to undertake an independent review of the benchmark efficient costs for Ergon Energy, recognising the development of regulatory recognition of debt raising costs and its components with specific consideration of the recent PricewaterhouseCoopers (PwC) methodology report written for the Energy Network Association (ENA) and Powerlink.
Based on Ergon Energy’s PTRM, Incenta proposes a debt raising operating cost of 19.7 basis points per annum (bppa) on the regulatory debt comprised of:
• 9.9 bppa for debt raising transaction costs relating to the debt component of the Regulatory Asset Base (RAB) of $6.28 billion
• 4.9 bppa to establish and maintain bank facilities required to meet Standard & Poor’s (S&Ps) liquidity requirement conditions for maintaining an investment grade credit rating
• 5.0 bppa to compensate for the requirement (as a condition of maintaining an investment grade credit rating) to refinance debt three months ahead of the re-financing date.
Although Incenta agrees with the PwC methodology to calculate the transaction costs, Incenta disagrees with the methodology to calculate the S&Ps liquidity requirement and re-financing costs. In the past, these costs have been described as being “indirect costs” by PwC however, Incenta has researched this point and concluded that these are direct costs that any regulated business would incur raising debt.
03.02.01 – Regulatory Model Architecture Summary 32
06.01.01 –Forecast Expenditure Summary – Operating Costs 32
Incenta and S&Ps disagree with PwC’s categorisation of liquidity costs and re-financing three months ahead as being indirect. This cost represents cash costs that regulated entities are required to incur in order to meet and maintain the requirements for an investment grade credit rating and are therefore direct costs. Incenta’s discussion with S&Ps confirms that they too consider these costs to be direct costs, which are fundamentally no different to other direct costs associated with debt raising that have been recognised as direct costs in the past.
The Incenta report is attached for further information at 06.02.04.
Allowance for debt raising transaction costs relating to the debt component of the RAB
Incenta applies PwC’s market research to benchmark a debt-issuing transaction cost allowance for Ergon Energy. PwC found that Australian businesses issuing bonds in the United States (US) are incurring an arrangement fee of 8.51 bppa; this cost is independent of size, term, issuance, and issuance size. The remainder of the transaction fee is based on PwC’s interviews with investment bankers, lawyers, and credit rating agencies.
With a RAB of $10,041.54 million, and a benchmark gearing of 60 percent, our benchmark debt level is $6,024.92 million. The debt level implies that Ergon Energy would require 24 standard bond issues, with a standard bond size $250 million each. Based on the benchmarks employed by PwC, Ergon Energy would incur 9.9 bppa comprised of:
• Arrangement fee of 8.51 bppa
• Bond Master Program (per program) of 0.01 bppa
• Issuer’s legal counsel of 0.09 bppa
• Company credit rating of 0.02 bppa
• Annual surveillance fee of 0.01 bppa
• Up-front issuance fee of 0.77 bppa
• Registration – annual of 0.31 bppa
• Agents out-of pockets of 0.02 bppa.
Allowance for costs associated with maintaining bank facilities required to meet S&Ps liquidity requirement
Incenta has employed S&Ps formula for determining the liquidity requirements by deriving a direct cost estimate of the buffer required for a business whose financing arrangements conform to those of the benchmark entity. This ‘bottom-up’ approach to modelling uses the forward cash flow from the PTRM. That is, Incenta has taken the cash flow forecasts for Ergon Energy, and have solved for the quantum of undrawn committed bank lines that would be required to achieve a cash flow sources / uses ratio of 1.1x in each year of the new regulatory control period, and achieve sources equal to uses if a 15 per cent reduction in EBITDA is modelled, using the cash flow forecasts that are generated by the AER’s PTRM for Ergon Energy’s Regulatory Proposal.
03.02.01 – Regulatory Model Architecture Summary 33
06.01.01 –Forecast Expenditure Summary – Operating Costs 33
Applying this approach, Incenta found that over the forecast regulatory control period, the liquidity reserve required to achieve S&Ps ratio to maintain an investment grade credit rating lies between 6.8 per cent and 8.0 per cent of benchmark RAB debt. The corresponding benchmark cost of maintaining the required liquidity reserve is estimated based on the level of benchmark regulatory debt at a levelised cost of 4.9 bppa.
Allowance for costs associated with S&Ps requirement to finance three months ahead
Incenta has employed the completion methodology to estimate the cost of re-financing bonds three months ahead of their maturity. Incenta also notes that an inclusion of re-financing costs does not represent a ‘double-counting’ of costs that have been provided elsewhere15. Using Ergon Energy’s energy cost of debt assumption of 6.99 per cent, and an assumed re-investment for three months in a BBB rated bond at 3.9 per cent based on the Bloomberg BVAL fair value curve, results in an early re-financing cost of 3.1 percent bppa.
Ergon Energy considers the forecast reasonable considering the AER should be using a minimum period of six months to calculate the early issuance costs due to the implementation new pricing proposal rule changes due in November 2014 which will effectively bring the pricing proposal process forward by three months.
Under the new rules, NSPs’ regulatory resets and debt refinancing will be required to be completed by 31 December each year to allow sufficient time for the cost of debt to be calculated for the next regulatory year and incorporated into the pricing proposals. Ergon Energy considers these Rule changes will impose a regulatory constraint which will require NSPs to refinance debt at least six months ahead of the start of the next regulatory year. NSPs will be required to change their risk management strategies to transact six months ahead (at a minimum) by issuing forward starting swaps or pre-issuing debt, however in practice the early issuance period is likely to be six to nine months. Ergon Energy requested QTC to calculate the likely refinancing six months ahead and QTC benchmarked the cost at 15.5 basis points.
Although Ergon Energy is likely to face higher costs due to rule changes, Ergon Energy is requesting an allowance in line with Incenta’s advice of a three month ahead re-financing cost of 3.1 percent bppa. Ergon Energy believes this allowance will likely be below the actual cost that we will incur over the next control period.
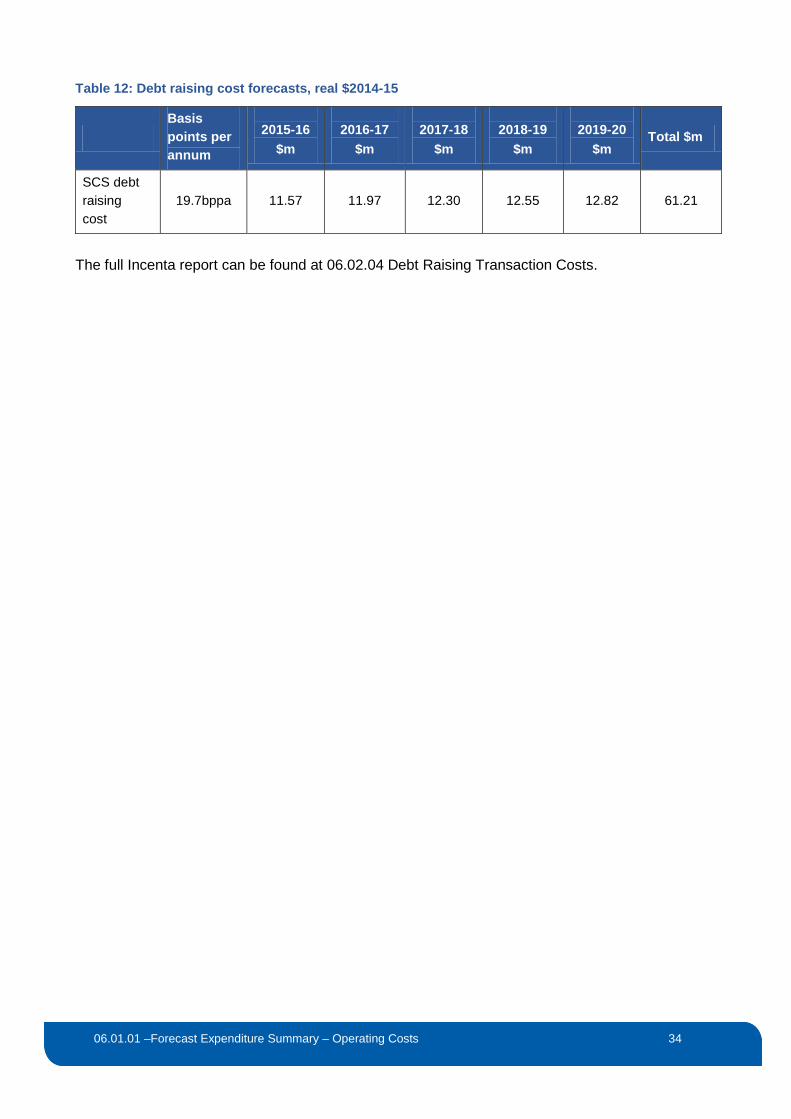
Based on the advice provided, Ergon Energy proposes that a margin of 19.7 basis points per annum should be applied notional value of debt; the application of this margin results in debt raising costs as detailed in Table 12.
15 The AER previously rejected ETSA Utilities’ proposal for a refinancing allowance based on advice that the costs were double counted.
03.02.01 – Regulatory Model Architecture Summary 34
06.01.01 –Forecast Expenditure Summary – Operating Costs 34
Table 12: Debt raising cost forecasts, real $2014-15
Basis points per annum
2015-16
$m
2016-17
$m
2017-18
$m
2018-19
$m
2019-20
$m Total $m
SCS debt raising cost
19.7bppa
11.57 11.97
12.30
12.55
12.82 61.21
The full Incenta report can be found at 06.02.04 Debt Raising Transaction Costs.
03.02.01 – Regulatory Model Architecture Summary 35
06.01.01 –Forecast Expenditure Summary – Operating Costs 35
3 Meeting the operating expenditure objectives, criteria and factors
The AER has indicated it will assess the methodology used by a NSP to derive its expenditure forecasts (including assumptions, inputs and models) in order to determine whether the NSP's methodology is a reasonable basis for developing expenditure forecasts that reasonably reflect the NER objectives and criteria.16
In this section, Ergon Energy demonstrates that the methodologies it has developed and applied are consistent with the operating expenditure objectives and criteria and has taken account of the operating expenditure factors, as appropriate.
A more comprehensive description is provided in Ergon Energy’s “06.01.05 Meeting the Rule Requirements” supporting document.
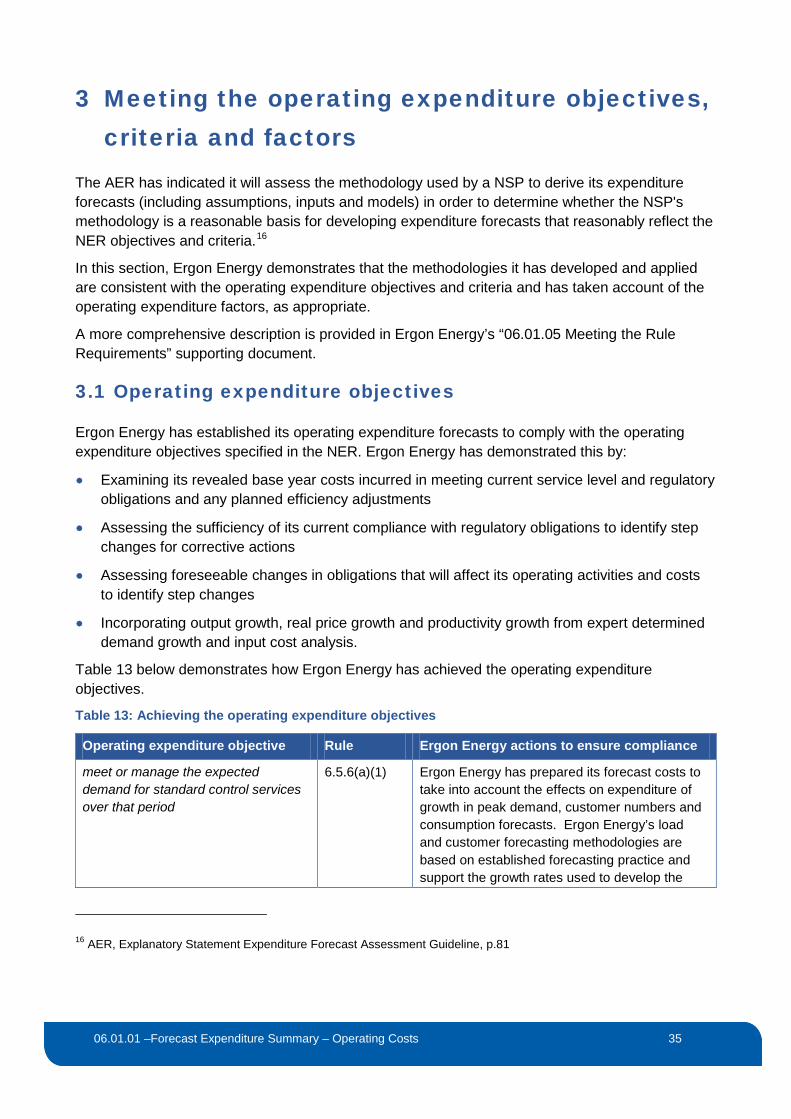
3.1 Operating expenditure objectives
Ergon Energy has established its operating expenditure forecasts to comply with the operating expenditure objectives specified in the NER. Ergon Energy has demonstrated this by:
• Examining its revealed base year costs incurred in meeting current service level and regulatory obligations and any planned efficiency adjustments
• Assessing the sufficiency of its current compliance with regulatory obligations to identify step changes for corrective actions
• Assessing foreseeable changes in obligations that will affect its operating activities and costs to identify step changes
• Incorporating output growth, real price growth and productivity growth from expert determined demand growth and input cost analysis.
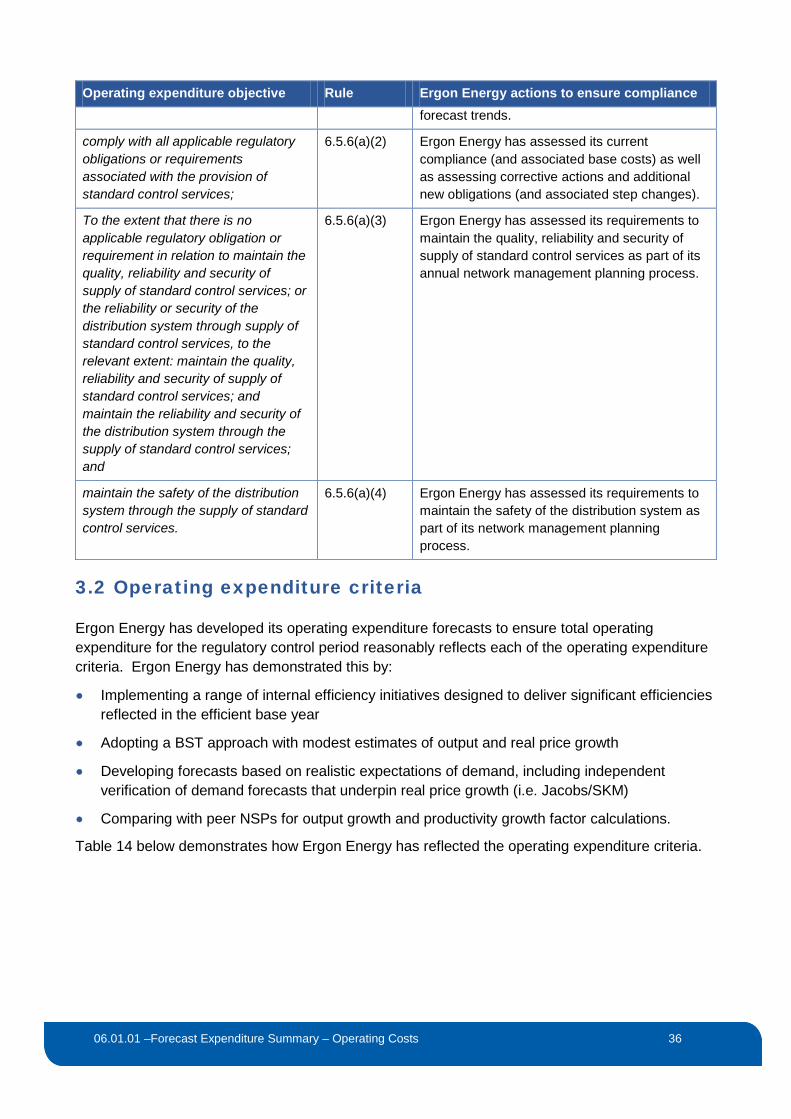
Table 13 below demonstrates how Ergon Energy has achieved the operating expenditure objectives.
Table 13: Achieving the operating expenditure objectives
Operating expenditure objective Rule Ergon Energy actions to ensure compliance
meet or manage the expected demand for standard control services over that period
6.5.6(a)(1) Ergon Energy has prepared its forecast costs to take into account the effects on expenditure of growth in peak demand, customer numbers and consumption forecasts. Ergon Energy’s load and customer forecasting methodologies are based on established forecasting practice and support the growth rates used to develop the
16 AER, Explanatory Statement Expenditure Forecast Assessment Guideline, p.81
03.02.01 – Regulatory Model Architecture Summary 36
06.01.01 –Forecast Expenditure Summary – Operating Costs 36
Operating expenditure objective Rule Ergon Energy actions to ensure compliance forecast trends.
comply with all applicable regulatory obligations or requirements associated with the provision of standard control services;
6.5.6(a)(2) Ergon Energy has assessed its current compliance (and associated base costs) as well as assessing corrective actions and additional new obligations (and associated step changes).
To the extent that there is no applicable regulatory obligation or requirement in relation to maintain the quality, reliability and security of supply of standard control services; or the reliability or security of the distribution system through supply of standard control services, to the relevant extent: maintain the quality, reliability and security of supply of standard control services; and maintain the reliability and security of the distribution system through the supply of standard control services; and
6.5.6(a)(3) Ergon Energy has assessed its requirements to maintain the quality, reliability and security of supply of standard control services as part of its annual network management planning process.
maintain the safety of the distribution system through the supply of standard control services.
6.5.6(a)(4) Ergon Energy has assessed its requirements to maintain the safety of the distribution system as part of its network management planning process.
3.2 Operating expenditure criteria
Ergon Energy has developed its operating expenditure forecasts to ensure total operating expenditure for the regulatory control period reasonably reflects each of the operating expenditure criteria. Ergon Energy has demonstrated this by:
• Implementing a range of internal efficiency initiatives designed to deliver significant efficiencies reflected in the efficient base year
• Adopting a BST approach with modest estimates of output and real price growth
• Developing forecasts based on realistic expectations of demand, including independent verification of demand forecasts that underpin real price growth (i.e. Jacobs/SKM)
• Comparing with peer NSPs for output growth and productivity growth factor calculations.
Table 14 below demonstrates how Ergon Energy has reflected the operating expenditure criteria.
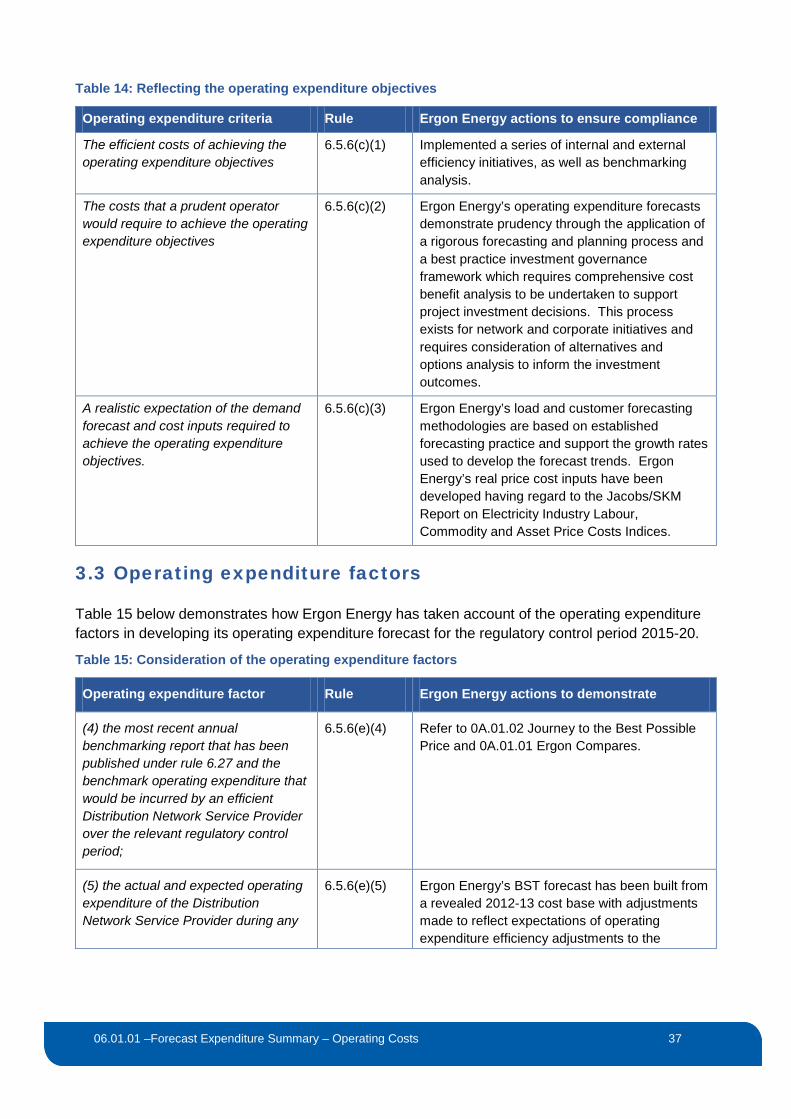
03.02.01 – Regulatory Model Architecture Summary 37
06.01.01 –Forecast Expenditure Summary – Operating Costs 37
Table 14: Reflecting the operating expenditure objectives
Operating expenditure criteria Rule Ergon Energy actions to ensure compliance
The efficient costs of achieving the operating expenditure objectives
6.5.6(c)(1) Implemented a series of internal and external efficiency initiatives, as well as benchmarking analysis.
The costs that a prudent operator would require to achieve the operating expenditure objectives
6.5.6(c)(2) Ergon Energy’s operating expenditure forecasts demonstrate prudency through the application of a rigorous forecasting and planning process and a best practice investment governance framework which requires comprehensive cost benefit analysis to be undertaken to support project investment decisions. This process exists for network and corporate initiatives and requires consideration of alternatives and options analysis to inform the investment outcomes.
A realistic expectation of the demand forecast and cost inputs required to achieve the operating expenditure objectives.
6.5.6(c)(3) Ergon Energy’s load and customer forecasting methodologies are based on established forecasting practice and support the growth rates used to develop the forecast trends. Ergon Energy’s real price cost inputs have been developed having regard to the Jacobs/SKM Report on Electricity Industry Labour, Commodity and Asset Price Costs Indices.
3.3 Operating expenditure factors
Table 15 below demonstrates how Ergon Energy has taken account of the operating expenditure factors in developing its operating expenditure forecast for the regulatory control period 2015-20.
Table 15: Consideration of the operating expenditure factors
Operating expenditure factor Rule Ergon Energy actions to demonstrate
(4) the most recent annual benchmarking report that has been published under rule 6.27 and the benchmark operating expenditure that would be incurred by an efficient Distribution Network Service Provider over the relevant regulatory control period;
6.5.6(e)(4) Refer to 0A.01.02 Journey to the Best Possible Price and 0A.01.01 Ergon Compares.
(5) the actual and expected operating expenditure of the Distribution Network Service Provider during any
6.5.6(e)(5) Ergon Energy’s BST forecast has been built from a revealed 2012-13 cost base with adjustments made to reflect expectations of operating expenditure efficiency adjustments to the
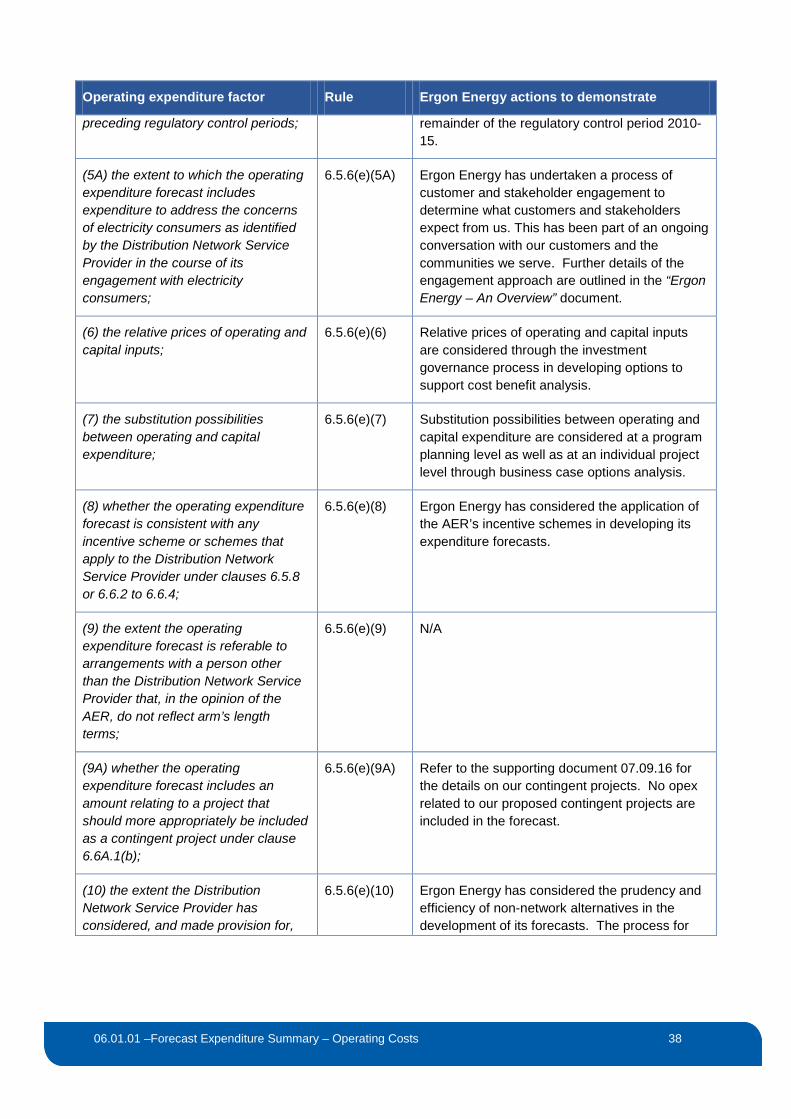
03.02.01 – Regulatory Model Architecture Summary 38
06.01.01 –Forecast Expenditure Summary – Operating Costs 38
Operating expenditure factor Rule Ergon Energy actions to demonstrate
preceding regulatory control periods; remainder of the regulatory control period 2010-15.
(5A) the extent to which the operating expenditure forecast includes expenditure to address the concerns of electricity consumers as identified by the Distribution Network Service Provider in the course of its engagement with electricity consumers;
6.5.6(e)(5A) Ergon Energy has undertaken a process of customer and stakeholder engagement to determine what customers and stakeholders expect from us. This has been part of an ongoing conversation with our customers and the communities we serve. Further details of the engagement approach are outlined in the “Ergon Energy – An Overview” document.
(6) the relative prices of operating and capital inputs;
6.5.6(e)(6) Relative prices of operating and capital inputs are considered through the investment governance process in developing options to support cost benefit analysis.
(7) the substitution possibilities between operating and capital expenditure;
6.5.6(e)(7) Substitution possibilities between operating and capital expenditure are considered at a program planning level as well as at an individual project level through business case options analysis.
(8) whether the operating expenditure forecast is consistent with any incentive scheme or schemes that apply to the Distribution Network Service Provider under clauses 6.5.8 or 6.6.2 to 6.6.4;
6.5.6(e)(8) Ergon Energy has considered the application of the AER’s incentive schemes in developing its expenditure forecasts.
(9) the extent the operating expenditure forecast is referable to arrangements with a person other than the Distribution Network Service Provider that, in the opinion of the AER, do not reflect arm’s length terms;
6.5.6(e)(9) N/A
(9A) whether the operating expenditure forecast includes an amount relating to a project that should more appropriately be included as a contingent project under clause 6.6A.1(b);
6.5.6(e)(9A) Refer to the supporting document 07.09.16 for the details on our contingent projects. No opex related to our proposed contingent projects are included in the forecast.
(10) the extent the Distribution Network Service Provider has considered, and made provision for,
6.5.6(e)(10) Ergon Energy has considered the prudency and efficiency of non-network alternatives in the development of its forecasts. The process for
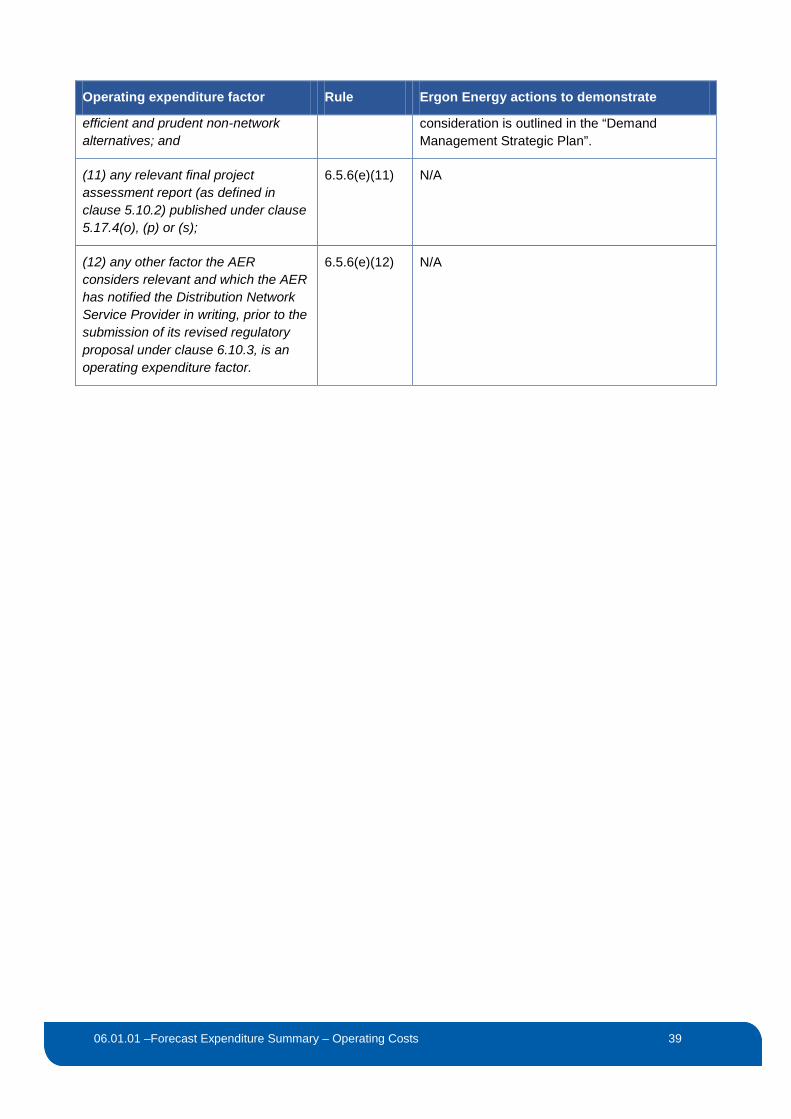
03.02.01 – Regulatory Model Architecture Summary 39
06.01.01 –Forecast Expenditure Summary – Operating Costs 39
Operating expenditure factor Rule Ergon Energy actions to demonstrate
efficient and prudent non-network alternatives; and
consideration is outlined in the “Demand Management Strategic Plan”.
(11) any relevant final project assessment report (as defined in clause 5.10.2) published under clause 5.17.4(o), (p) or (s);
6.5.6(e)(11) N/A
(12) any other factor the AER considers relevant and which the AER has notified the Distribution Network Service Provider in writing, prior to the submission of its revised regulatory proposal under clause 6.10.3, is an operating expenditure factor.
6.5.6(e)(12) N/A
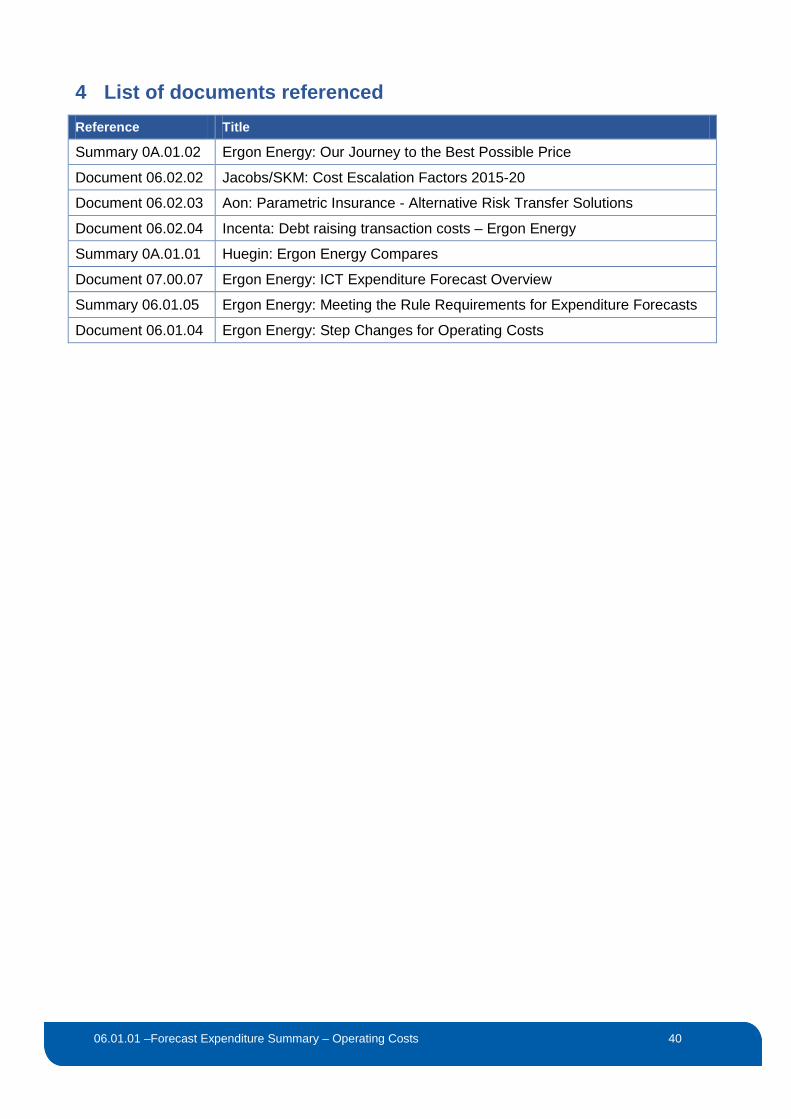
03.02.01 – Regulatory Model Architecture Summary 40
06.01.01 –Forecast Expenditure Summary – Operating Costs 40
4 List of documents referenced Reference Title
Summary 0A.01.02 Ergon Energy: Our Journey to the Best Possible Price
Document 06.02.02 Jacobs/SKM: Cost Escalation Factors 2015-20
Document 06.02.03 Aon: Parametric Insurance - Alternative Risk Transfer Solutions
Document 06.02.04 Incenta: Debt raising transaction costs – Ergon Energy
Summary 0A.01.01 Huegin: Ergon Energy Compares
Document 07.00.07 Ergon Energy: ICT Expenditure Forecast Overview
Summary 06.01.05 Ergon Energy: Meeting the Rule Requirements for Expenditure Forecasts
Document 06.01.04 Ergon Energy: Step Changes for Operating Costs
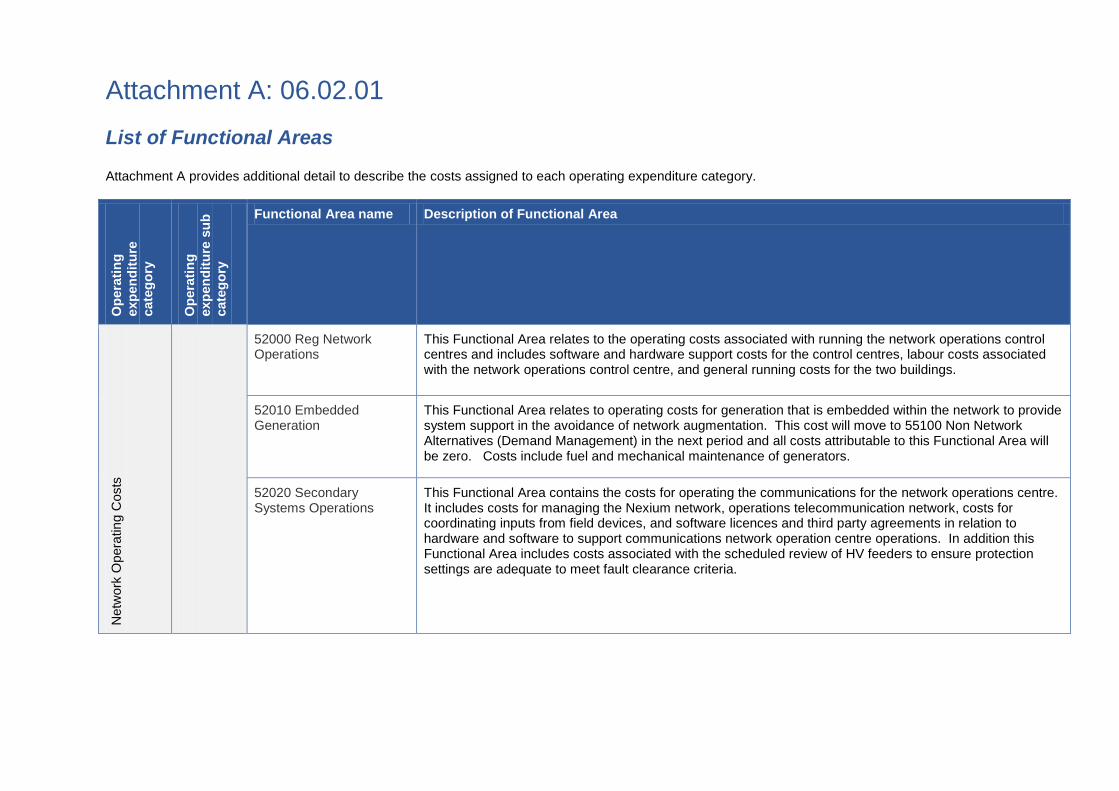
Attachment A: 06.02.01
List of Functional Areas
Attachment A provides additional detail to describe the costs assigned to each operating expenditure category.
Ope
ratin
g ex
pend
iture
ca
tego
ry
Ope
ratin
g ex
pend
iture
sub
ca
tego
ry
Functional Area name Description of Functional Area
Net
wor
k O
pera
ting
Cos
ts
52000 Reg Network Operations
This Functional Area relates to the operating costs associated with running the network operations control centres and includes software and hardware support costs for the control centres, labour costs associated with the network operations control centre, and general running costs for the two buildings.
52010 Embedded Generation
This Functional Area relates to operating costs for generation that is embedded within the network to provide system support in the avoidance of network augmentation. This cost will move to 55100 Non Network Alternatives (Demand Management) in the next period and all costs attributable to this Functional Area will be zero. Costs include fuel and mechanical maintenance of generators.
52020 Secondary Systems Operations
This Functional Area contains the costs for operating the communications for the network operations centre. It includes costs for managing the Nexium network, operations telecommunication network, costs for coordinating inputs from field devices, and software licences and third party agreements in relation to hardware and software to support communications network operation centre operations. In addition this Functional Area includes costs associated with the scheduled review of HV feeders to ensure protection settings are adequate to meet fault clearance criteria.
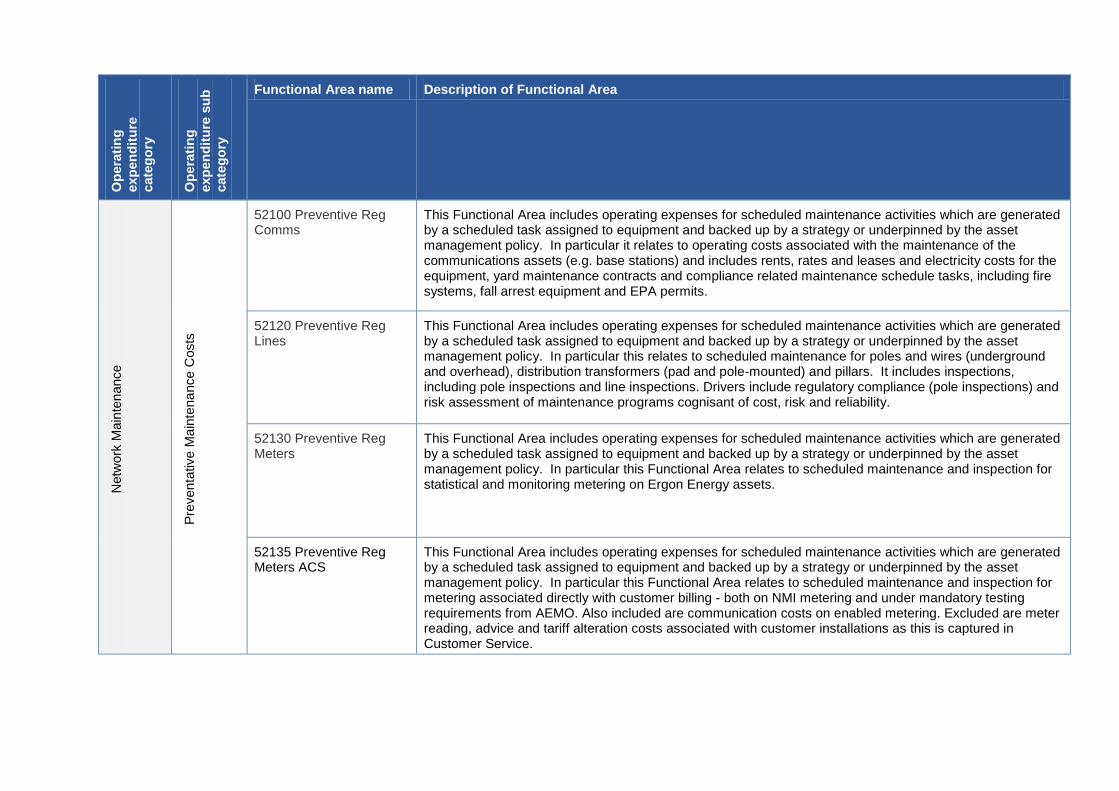
Ope
ratin
g ex
pend
iture
ca
tego
ry
Ope
ratin
g ex
pend
iture
sub
ca
tego
ry
Functional Area name Description of Functional Area
Net
wor
k M
aint
enan
ce
Prev
enta
tive
Mai
nten
ance
Cos
ts
52100 Preventive Reg Comms
This Functional Area includes operating expenses for scheduled maintenance activities which are generated by a scheduled task assigned to equipment and backed up by a strategy or underpinned by the asset management policy. In particular it relates to operating costs associated with the maintenance of the communications assets (e.g. base stations) and includes rents, rates and leases and electricity costs for the equipment, yard maintenance contracts and compliance related maintenance schedule tasks, including fire systems, fall arrest equipment and EPA permits.
52120 Preventive Reg Lines
This Functional Area includes operating expenses for scheduled maintenance activities which are generated by a scheduled task assigned to equipment and backed up by a strategy or underpinned by the asset management policy. In particular this relates to scheduled maintenance for poles and wires (underground and overhead), distribution transformers (pad and pole-mounted) and pillars. It includes inspections, including pole inspections and line inspections. Drivers include regulatory compliance (pole inspections) and risk assessment of maintenance programs cognisant of cost, risk and reliability.
52130 Preventive Reg Meters
This Functional Area includes operating expenses for scheduled maintenance activities which are generated by a scheduled task assigned to equipment and backed up by a strategy or underpinned by the asset management policy. In particular this Functional Area relates to scheduled maintenance and inspection for statistical and monitoring metering on Ergon Energy assets.
52135 Preventive Reg Meters ACS
This Functional Area includes operating expenses for scheduled maintenance activities which are generated by a scheduled task assigned to equipment and backed up by a strategy or underpinned by the asset management policy. In particular this Functional Area relates to scheduled maintenance and inspection for metering associated directly with customer billing - both on NMI metering and under mandatory testing requirements from AEMO. Also included are communication costs on enabled metering. Excluded are meter reading, advice and tariff alteration costs associated with customer installations as this is captured in Customer Service.
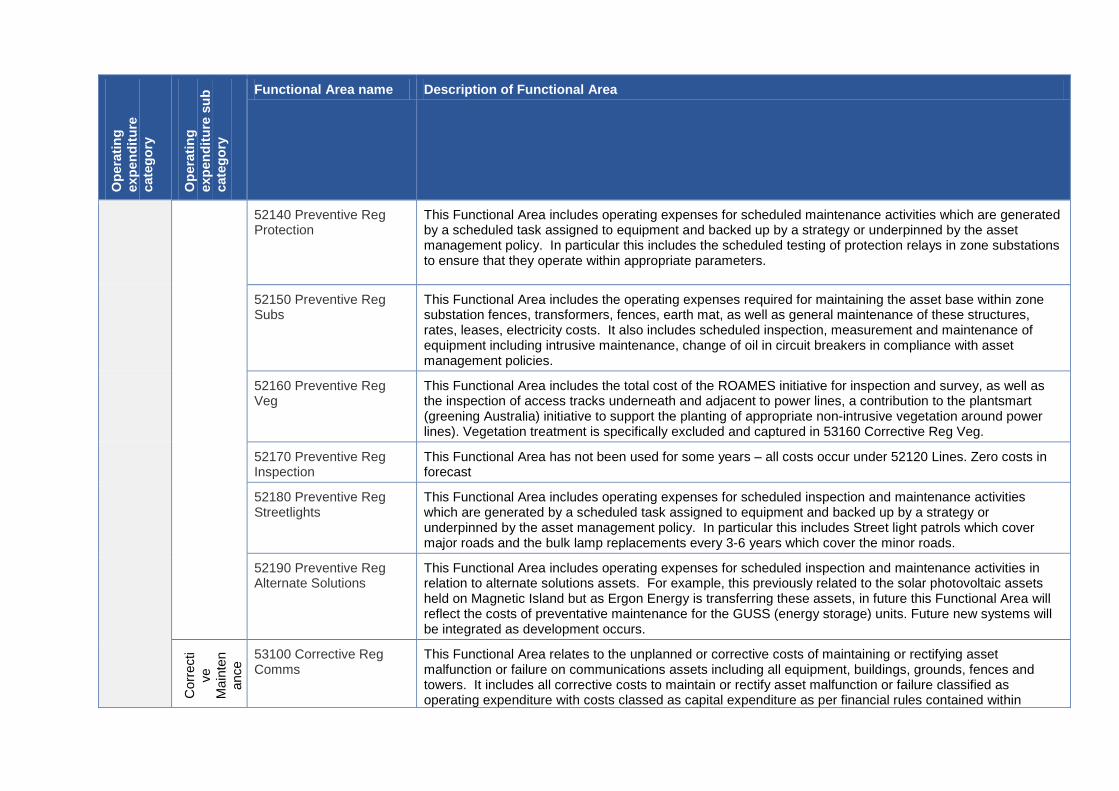
Ope
ratin
g ex
pend
iture
ca
tego
ry
Ope
ratin
g ex
pend
iture
sub
ca
tego
ry
Functional Area name Description of Functional Area
52140 Preventive Reg Protection
This Functional Area includes operating expenses for scheduled maintenance activities which are generated by a scheduled task assigned to equipment and backed up by a strategy or underpinned by the asset management policy. In particular this includes the scheduled testing of protection relays in zone substations to ensure that they operate within appropriate parameters.
52150 Preventive Reg Subs
This Functional Area includes the operating expenses required for maintaining the asset base within zone substation fences, transformers, fences, earth mat, as well as general maintenance of these structures, rates, leases, electricity costs. It also includes scheduled inspection, measurement and maintenance of equipment including intrusive maintenance, change of oil in circuit breakers in compliance with asset management policies.
52160 Preventive Reg Veg
This Functional Area includes the total cost of the ROAMES initiative for inspection and survey, as well as the inspection of access tracks underneath and adjacent to power lines, a contribution to the plantsmart (greening Australia) initiative to support the planting of appropriate non-intrusive vegetation around power lines). Vegetation treatment is specifically excluded and captured in 53160 Corrective Reg Veg.
52170 Preventive Reg Inspection
This Functional Area has not been used for some years – all costs occur under 52120 Lines. Zero costs in forecast
52180 Preventive Reg Streetlights
This Functional Area includes operating expenses for scheduled inspection and maintenance activities which are generated by a scheduled task assigned to equipment and backed up by a strategy or underpinned by the asset management policy. In particular this includes Street light patrols which cover major roads and the bulk lamp replacements every 3-6 years which cover the minor roads.
52190 Preventive Reg Alternate Solutions
This Functional Area includes operating expenses for scheduled inspection and maintenance activities in relation to alternate solutions assets. For example, this previously related to the solar photovoltaic assets held on Magnetic Island but as Ergon Energy is transferring these assets, in future this Functional Area will reflect the costs of preventative maintenance for the GUSS (energy storage) units. Future new systems will be integrated as development occurs.
Cor
rect
ive
M
aint
enan
ce 53100 Corrective Reg
Comms This Functional Area relates to the unplanned or corrective costs of maintaining or rectifying asset malfunction or failure on communications assets including all equipment, buildings, grounds, fences and towers. It includes all corrective costs to maintain or rectify asset malfunction or failure classified as operating expenditure with costs classed as capital expenditure as per financial rules contained within
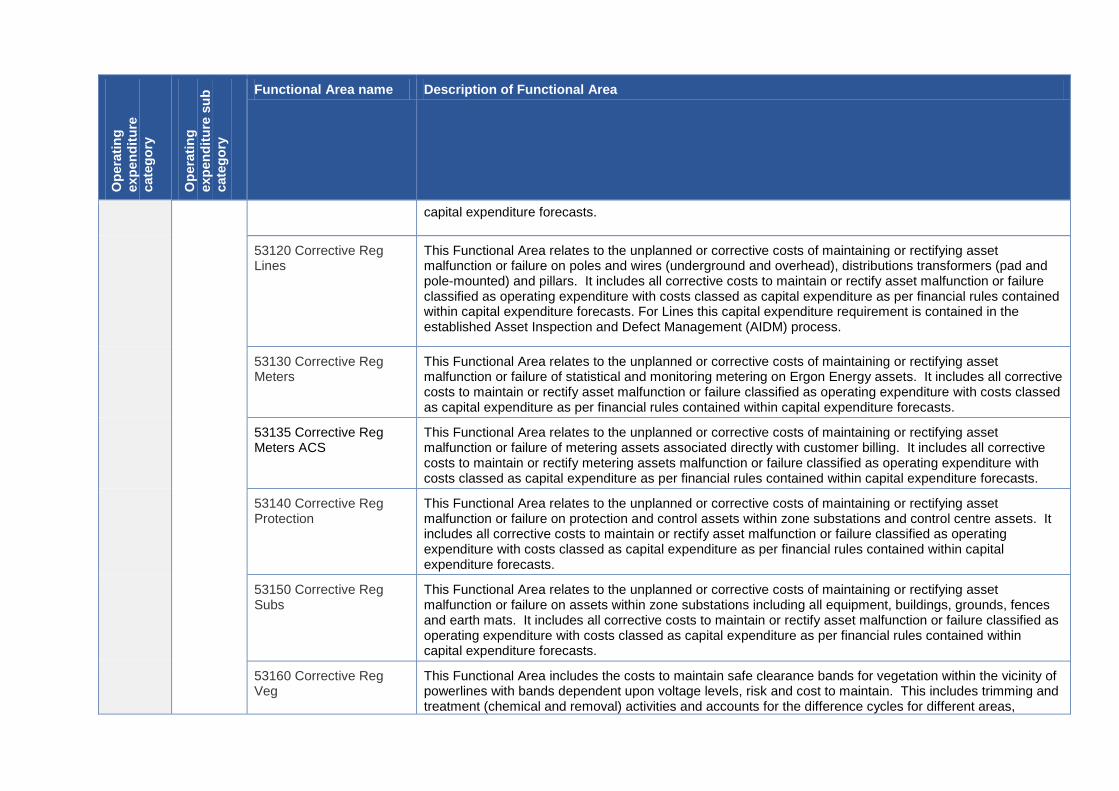
Ope
ratin
g ex
pend
iture
ca
tego
ry
Ope
ratin
g ex
pend
iture
sub
ca
tego
ry
Functional Area name Description of Functional Area
capital expenditure forecasts.
53120 Corrective Reg Lines
This Functional Area relates to the unplanned or corrective costs of maintaining or rectifying asset malfunction or failure on poles and wires (underground and overhead), distributions transformers (pad and pole-mounted) and pillars. It includes all corrective costs to maintain or rectify asset malfunction or failure classified as operating expenditure with costs classed as capital expenditure as per financial rules contained within capital expenditure forecasts. For Lines this capital expenditure requirement is contained in the established Asset Inspection and Defect Management (AIDM) process.
53130 Corrective Reg Meters
This Functional Area relates to the unplanned or corrective costs of maintaining or rectifying asset malfunction or failure of statistical and monitoring metering on Ergon Energy assets. It includes all corrective costs to maintain or rectify asset malfunction or failure classified as operating expenditure with costs classed as capital expenditure as per financial rules contained within capital expenditure forecasts.
53135 Corrective Reg Meters ACS
This Functional Area relates to the unplanned or corrective costs of maintaining or rectifying asset malfunction or failure of metering assets associated directly with customer billing. It includes all corrective costs to maintain or rectify metering assets malfunction or failure classified as operating expenditure with costs classed as capital expenditure as per financial rules contained within capital expenditure forecasts.
53140 Corrective Reg Protection
This Functional Area relates to the unplanned or corrective costs of maintaining or rectifying asset malfunction or failure on protection and control assets within zone substations and control centre assets. It includes all corrective costs to maintain or rectify asset malfunction or failure classified as operating expenditure with costs classed as capital expenditure as per financial rules contained within capital expenditure forecasts.
53150 Corrective Reg Subs
This Functional Area relates to the unplanned or corrective costs of maintaining or rectifying asset malfunction or failure on assets within zone substations including all equipment, buildings, grounds, fences and earth mats. It includes all corrective costs to maintain or rectify asset malfunction or failure classified as operating expenditure with costs classed as capital expenditure as per financial rules contained within capital expenditure forecasts.
53160 Corrective Reg Veg
This Functional Area includes the costs to maintain safe clearance bands for vegetation within the vicinity of powerlines with bands dependent upon voltage levels, risk and cost to maintain. This includes trimming and treatment (chemical and removal) activities and accounts for the difference cycles for different areas,
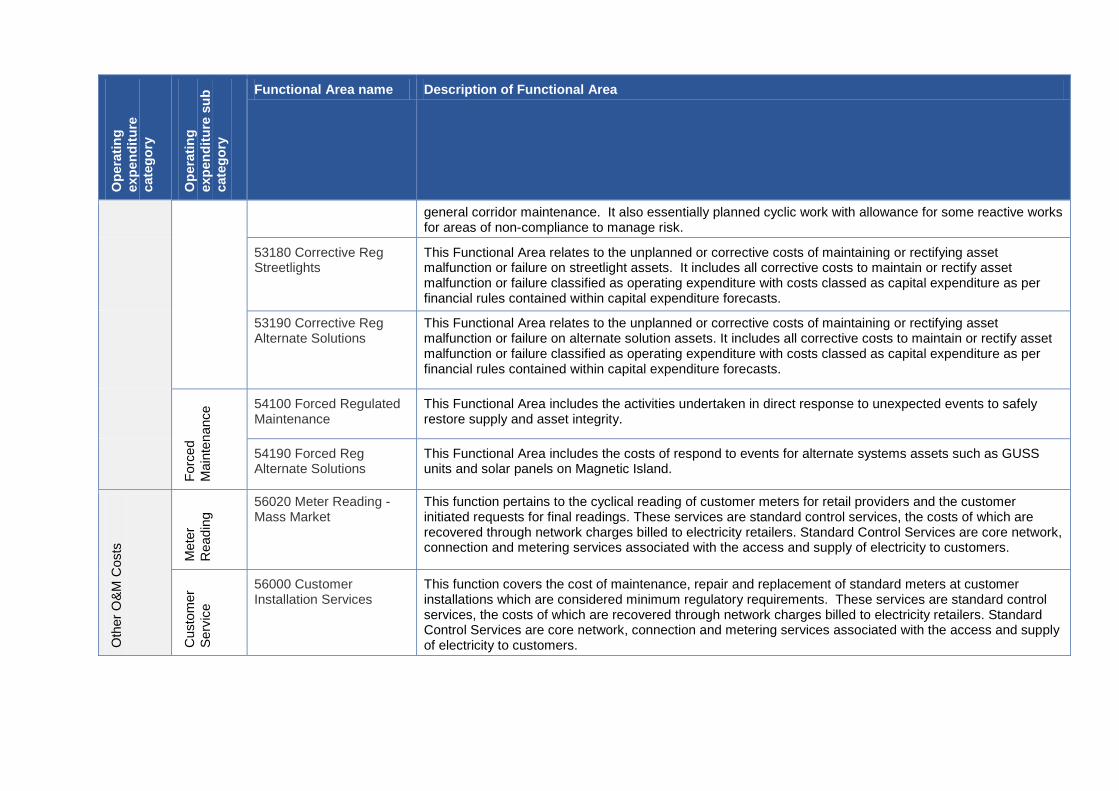
Ope
ratin
g ex
pend
iture
ca
tego
ry
Ope
ratin
g ex
pend
iture
sub
ca
tego
ry
Functional Area name Description of Functional Area
general corridor maintenance. It also essentially planned cyclic work with allowance for some reactive works for areas of non-compliance to manage risk.
53180 Corrective Reg Streetlights
This Functional Area relates to the unplanned or corrective costs of maintaining or rectifying asset malfunction or failure on streetlight assets. It includes all corrective costs to maintain or rectify asset malfunction or failure classified as operating expenditure with costs classed as capital expenditure as per financial rules contained within capital expenditure forecasts.
53190 Corrective Reg Alternate Solutions
This Functional Area relates to the unplanned or corrective costs of maintaining or rectifying asset malfunction or failure on alternate solution assets. It includes all corrective costs to maintain or rectify asset malfunction or failure classified as operating expenditure with costs classed as capital expenditure as per financial rules contained within capital expenditure forecasts.
Forc
ed
Mai
nten
ance
54100 Forced Regulated Maintenance
This Functional Area includes the activities undertaken in direct response to unexpected events to safely restore supply and asset integrity.
54190 Forced Reg Alternate Solutions
This Functional Area includes the costs of respond to events for alternate systems assets such as GUSS units and solar panels on Magnetic Island.
Oth
er O
&M C
osts
Met
er
Rea
ding
56020 Meter Reading - Mass Market
This function pertains to the cyclical reading of customer meters for retail providers and the customer initiated requests for final readings. These services are standard control services, the costs of which are recovered through network charges billed to electricity retailers. Standard Control Services are core network, connection and metering services associated with the access and supply of electricity to customers.
Cus
tom
er
Serv
ice
56000 Customer Installation Services
This function covers the cost of maintenance, repair and replacement of standard meters at customer installations which are considered minimum regulatory requirements. These services are standard control services, the costs of which are recovered through network charges billed to electricity retailers. Standard Control Services are core network, connection and metering services associated with the access and supply of electricity to customers.
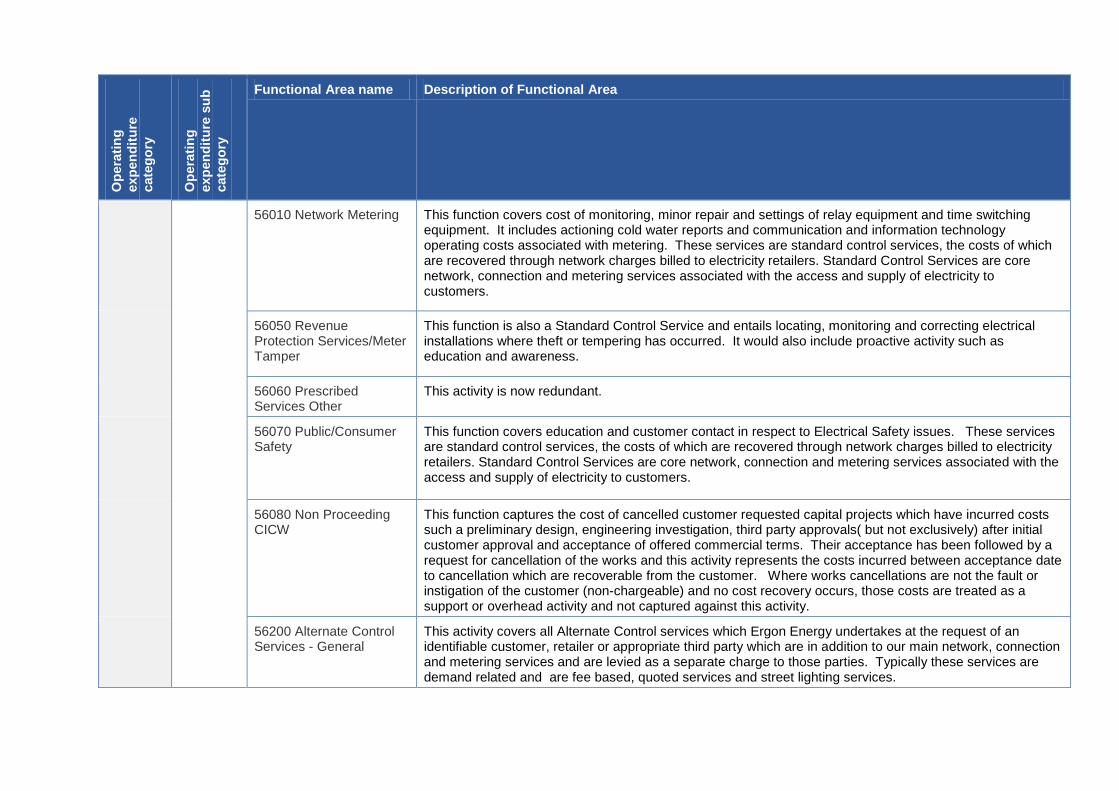
Ope
ratin
g ex
pend
iture
ca
tego
ry
Ope
ratin
g ex
pend
iture
sub
ca
tego
ry
Functional Area name Description of Functional Area
56010 Network Metering This function covers cost of monitoring, minor repair and settings of relay equipment and time switching equipment. It includes actioning cold water reports and communication and information technology operating costs associated with metering. These services are standard control services, the costs of which are recovered through network charges billed to electricity retailers. Standard Control Services are core network, connection and metering services associated with the access and supply of electricity to customers.
56050 Revenue Protection Services/Meter Tamper
This function is also a Standard Control Service and entails locating, monitoring and correcting electrical installations where theft or tempering has occurred. It would also include proactive activity such as education and awareness.
56060 Prescribed Services Other
This activity is now redundant.
56070 Public/Consumer Safety
This function covers education and customer contact in respect to Electrical Safety issues. These services are standard control services, the costs of which are recovered through network charges billed to electricity retailers. Standard Control Services are core network, connection and metering services associated with the access and supply of electricity to customers.
56080 Non Proceeding CICW
This function captures the cost of cancelled customer requested capital projects which have incurred costs such a preliminary design, engineering investigation, third party approvals( but not exclusively) after initial customer approval and acceptance of offered commercial terms. Their acceptance has been followed by a request for cancellation of the works and this activity represents the costs incurred between acceptance date to cancellation which are recoverable from the customer. Where works cancellations are not the fault or instigation of the customer (non-chargeable) and no cost recovery occurs, those costs are treated as a support or overhead activity and not captured against this activity.
56200 Alternate Control Services - General
This activity covers all Alternate Control services which Ergon Energy undertakes at the request of an identifiable customer, retailer or appropriate third party which are in addition to our main network, connection and metering services and are levied as a separate charge to those parties. Typically these services are demand related and are fee based, quoted services and street lighting services.
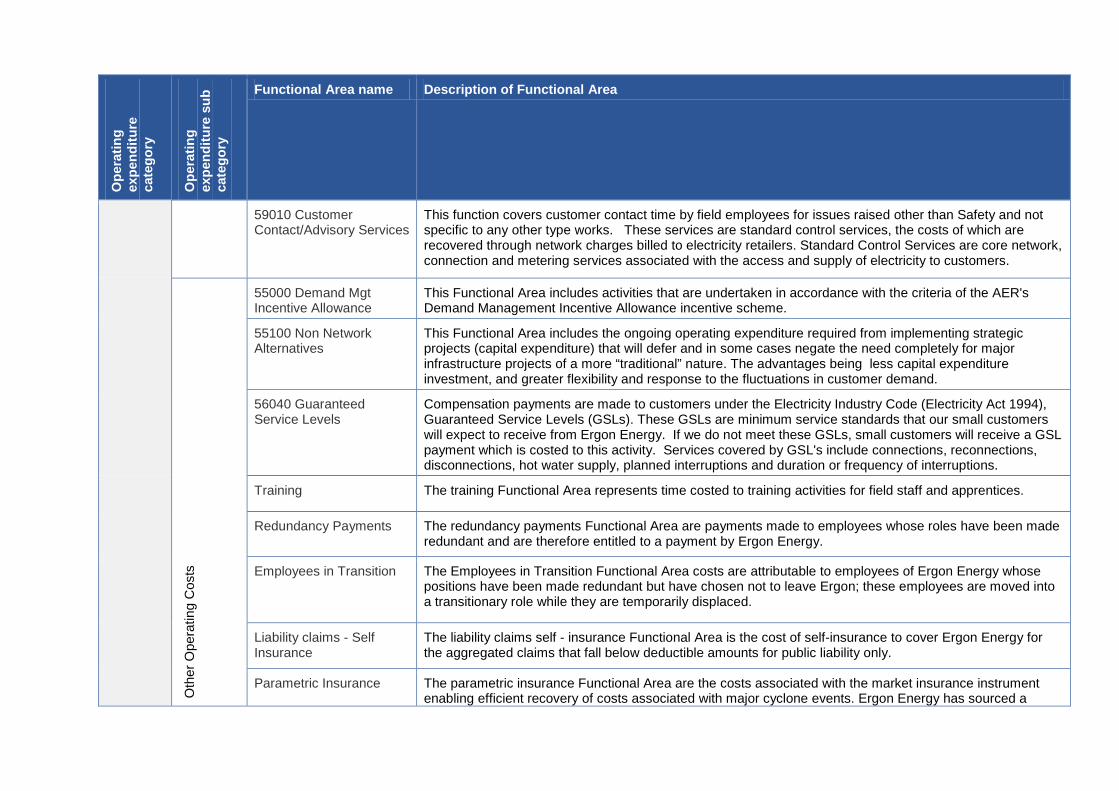
Ope
ratin
g ex
pend
iture
ca
tego
ry
Ope
ratin
g ex
pend
iture
sub
ca
tego
ry
Functional Area name Description of Functional Area
59010 Customer Contact/Advisory Services
This function covers customer contact time by field employees for issues raised other than Safety and not specific to any other type works. These services are standard control services, the costs of which are recovered through network charges billed to electricity retailers. Standard Control Services are core network, connection and metering services associated with the access and supply of electricity to customers.
Oth
er O
pera
ting
Cos
ts
55000 Demand Mgt Incentive Allowance
This Functional Area includes activities that are undertaken in accordance with the criteria of the AER's Demand Management Incentive Allowance incentive scheme.
55100 Non Network Alternatives
This Functional Area includes the ongoing operating expenditure required from implementing strategic projects (capital expenditure) that will defer and in some cases negate the need completely for major infrastructure projects of a more “traditional” nature. The advantages being less capital expenditure investment, and greater flexibility and response to the fluctuations in customer demand.
56040 Guaranteed Service Levels
Compensation payments are made to customers under the Electricity Industry Code (Electricity Act 1994), Guaranteed Service Levels (GSLs). These GSLs are minimum service standards that our small customers will expect to receive from Ergon Energy. If we do not meet these GSLs, small customers will receive a GSL payment which is costed to this activity. Services covered by GSL's include connections, reconnections, disconnections, hot water supply, planned interruptions and duration or frequency of interruptions.
Training The training Functional Area represents time costed to training activities for field staff and apprentices.
Redundancy Payments The redundancy payments Functional Area are payments made to employees whose roles have been made redundant and are therefore entitled to a payment by Ergon Energy.
Employees in Transition The Employees in Transition Functional Area costs are attributable to employees of Ergon Energy whose positions have been made redundant but have chosen not to leave Ergon; these employees are moved into a transitionary role while they are temporarily displaced.
Liability claims - Self Insurance
The liability claims self - insurance Functional Area is the cost of self-insurance to cover Ergon Energy for the aggregated claims that fall below deductible amounts for public liability only.
Parametric Insurance The parametric insurance Functional Area are the costs associated with the market insurance instrument enabling efficient recovery of costs associated with major cyclone events. Ergon Energy has sourced a
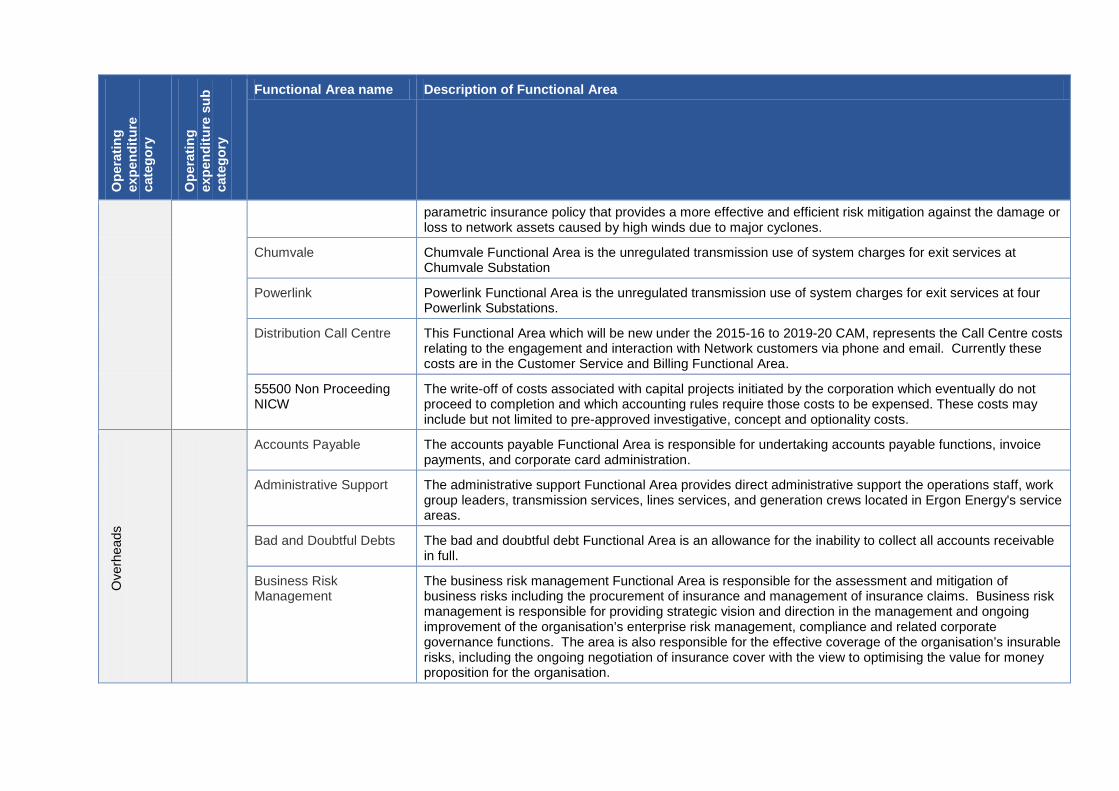
Ope
ratin
g ex
pend
iture
ca
tego
ry
Ope
ratin
g ex
pend
iture
sub
ca
tego
ry
Functional Area name Description of Functional Area
parametric insurance policy that provides a more effective and efficient risk mitigation against the damage or loss to network assets caused by high winds due to major cyclones.
Chumvale Chumvale Functional Area is the unregulated transmission use of system charges for exit services at Chumvale Substation
Powerlink Powerlink Functional Area is the unregulated transmission use of system charges for exit services at four Powerlink Substations.
Distribution Call Centre This Functional Area which will be new under the 2015-16 to 2019-20 CAM, represents the Call Centre costs relating to the engagement and interaction with Network customers via phone and email. Currently these costs are in the Customer Service and Billing Functional Area.
55500 Non Proceeding NICW
The write-off of costs associated with capital projects initiated by the corporation which eventually do not proceed to completion and which accounting rules require those costs to be expensed. These costs may include but not limited to pre-approved investigative, concept and optionality costs.
Ove
rhea
ds
Accounts Payable The accounts payable Functional Area is responsible for undertaking accounts payable functions, invoice payments, and corporate card administration.
Administrative Support The administrative support Functional Area provides direct administrative support the operations staff, work group leaders, transmission services, lines services, and generation crews located in Ergon Energy's service areas.
Bad and Doubtful Debts The bad and doubtful debt Functional Area is an allowance for the inability to collect all accounts receivable in full.
Business Risk Management
The business risk management Functional Area is responsible for the assessment and mitigation of business risks including the procurement of insurance and management of insurance claims. Business risk management is responsible for providing strategic vision and direction in the management and ongoing improvement of the organisation’s enterprise risk management, compliance and related corporate governance functions. The area is also responsible for the effective coverage of the organisation’s insurable risks, including the ongoing negotiation of insurance cover with the view to optimising the value for money proposition for the organisation.
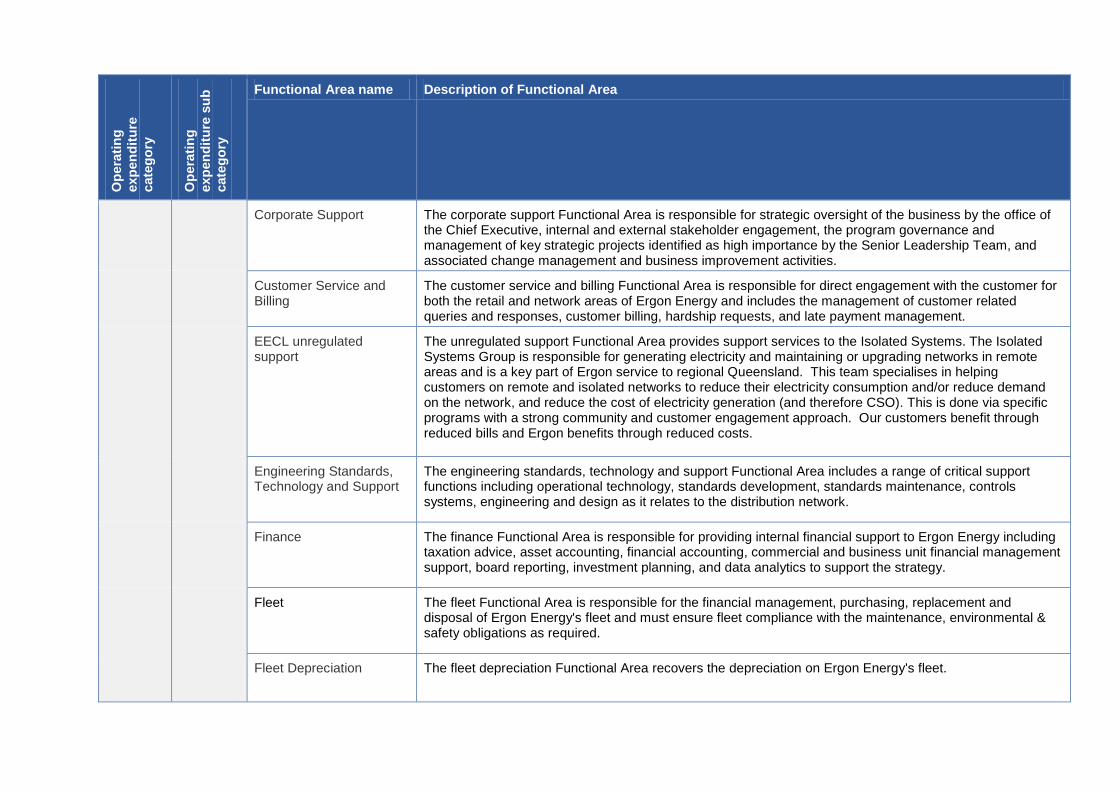
Ope
ratin
g ex
pend
iture
ca
tego
ry
Ope
ratin
g ex
pend
iture
sub
ca
tego
ry
Functional Area name Description of Functional Area
Corporate Support The corporate support Functional Area is responsible for strategic oversight of the business by the office of the Chief Executive, internal and external stakeholder engagement, the program governance and management of key strategic projects identified as high importance by the Senior Leadership Team, and associated change management and business improvement activities.
Customer Service and Billing
The customer service and billing Functional Area is responsible for direct engagement with the customer for both the retail and network areas of Ergon Energy and includes the management of customer related queries and responses, customer billing, hardship requests, and late payment management.
EECL unregulated support
The unregulated support Functional Area provides support services to the Isolated Systems. The Isolated Systems Group is responsible for generating electricity and maintaining or upgrading networks in remote areas and is a key part of Ergon service to regional Queensland. This team specialises in helping customers on remote and isolated networks to reduce their electricity consumption and/or reduce demand on the network, and reduce the cost of electricity generation (and therefore CSO). This is done via specific programs with a strong community and customer engagement approach. Our customers benefit through reduced bills and Ergon benefits through reduced costs.
Engineering Standards, Technology and Support
The engineering standards, technology and support Functional Area includes a range of critical support functions including operational technology, standards development, standards maintenance, controls systems, engineering and design as it relates to the distribution network.
Finance The finance Functional Area is responsible for providing internal financial support to Ergon Energy including taxation advice, asset accounting, financial accounting, commercial and business unit financial management support, board reporting, investment planning, and data analytics to support the strategy.
Fleet The fleet Functional Area is responsible for the financial management, purchasing, replacement and disposal of Ergon Energy's fleet and must ensure fleet compliance with the maintenance, environmental & safety obligations as required.
Fleet Depreciation The fleet depreciation Functional Area recovers the depreciation on Ergon Energy's fleet.
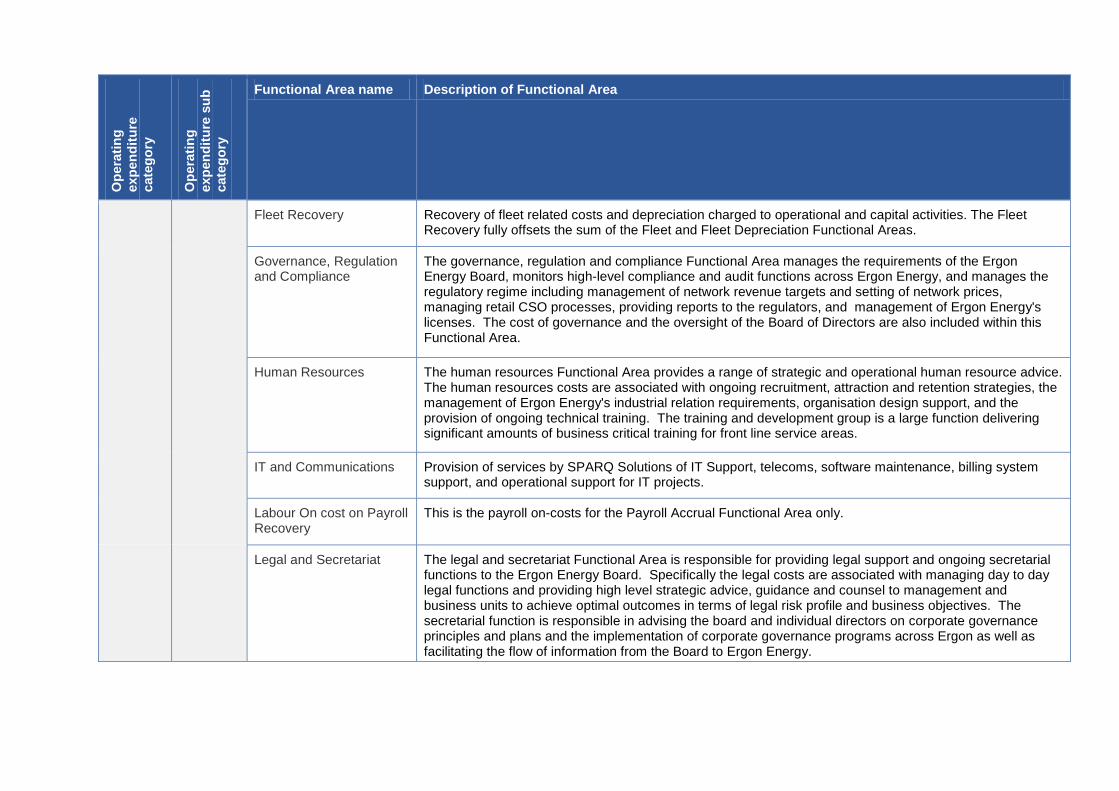
Ope
ratin
g ex
pend
iture
ca
tego
ry
Ope
ratin
g ex
pend
iture
sub
ca
tego
ry
Functional Area name Description of Functional Area
Fleet Recovery Recovery of fleet related costs and depreciation charged to operational and capital activities. The Fleet Recovery fully offsets the sum of the Fleet and Fleet Depreciation Functional Areas.
Governance, Regulation and Compliance
The governance, regulation and compliance Functional Area manages the requirements of the Ergon Energy Board, monitors high-level compliance and audit functions across Ergon Energy, and manages the regulatory regime including management of network revenue targets and setting of network prices, managing retail CSO processes, providing reports to the regulators, and management of Ergon Energy's licenses. The cost of governance and the oversight of the Board of Directors are also included within this Functional Area.
Human Resources The human resources Functional Area provides a range of strategic and operational human resource advice. The human resources costs are associated with ongoing recruitment, attraction and retention strategies, the management of Ergon Energy's industrial relation requirements, organisation design support, and the provision of ongoing technical training. The training and development group is a large function delivering significant amounts of business critical training for front line service areas.
IT and Communications Provision of services by SPARQ Solutions of IT Support, telecoms, software maintenance, billing system support, and operational support for IT projects.
Labour On cost on Payroll Recovery
This is the payroll on-costs for the Payroll Accrual Functional Area only.
Legal and Secretariat The legal and secretariat Functional Area is responsible for providing legal support and ongoing secretarial functions to the Ergon Energy Board. Specifically the legal costs are associated with managing day to day legal functions and providing high level strategic advice, guidance and counsel to management and business units to achieve optimal outcomes in terms of legal risk profile and business objectives. The secretarial function is responsible in advising the board and individual directors on corporate governance principles and plans and the implementation of corporate governance programs across Ergon as well as facilitating the flow of information from the Board to Ergon Energy.
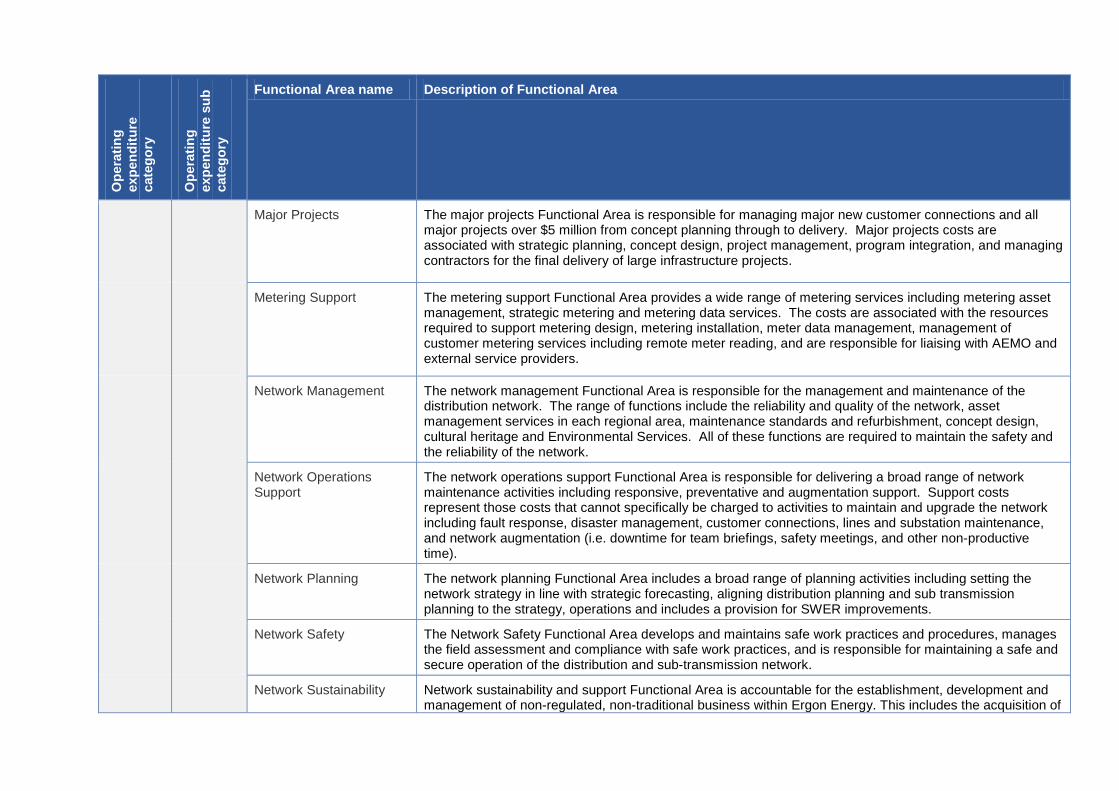
Ope
ratin
g ex
pend
iture
ca
tego
ry
Ope
ratin
g ex
pend
iture
sub
ca
tego
ry
Functional Area name Description of Functional Area
Major Projects The major projects Functional Area is responsible for managing major new customer connections and all major projects over $5 million from concept planning through to delivery. Major projects costs are associated with strategic planning, concept design, project management, program integration, and managing contractors for the final delivery of large infrastructure projects.
Metering Support The metering support Functional Area provides a wide range of metering services including metering asset management, strategic metering and metering data services. The costs are associated with the resources required to support metering design, metering installation, meter data management, management of customer metering services including remote meter reading, and are responsible for liaising with AEMO and external service providers.
Network Management The network management Functional Area is responsible for the management and maintenance of the distribution network. The range of functions include the reliability and quality of the network, asset management services in each regional area, maintenance standards and refurbishment, concept design, cultural heritage and Environmental Services. All of these functions are required to maintain the safety and the reliability of the network.
Network Operations Support
The network operations support Functional Area is responsible for delivering a broad range of network maintenance activities including responsive, preventative and augmentation support. Support costs represent those costs that cannot specifically be charged to activities to maintain and upgrade the network including fault response, disaster management, customer connections, lines and substation maintenance, and network augmentation (i.e. downtime for team briefings, safety meetings, and other non-productive time).
Network Planning The network planning Functional Area includes a broad range of planning activities including setting the network strategy in line with strategic forecasting, aligning distribution planning and sub transmission planning to the strategy, operations and includes a provision for SWER improvements.
Network Safety The Network Safety Functional Area develops and maintains safe work practices and procedures, manages the field assessment and compliance with safe work practices, and is responsible for maintaining a safe and secure operation of the distribution and sub-transmission network.
Network Sustainability Network sustainability and support Functional Area is accountable for the establishment, development and management of non-regulated, non-traditional business within Ergon Energy. This includes the acquisition of
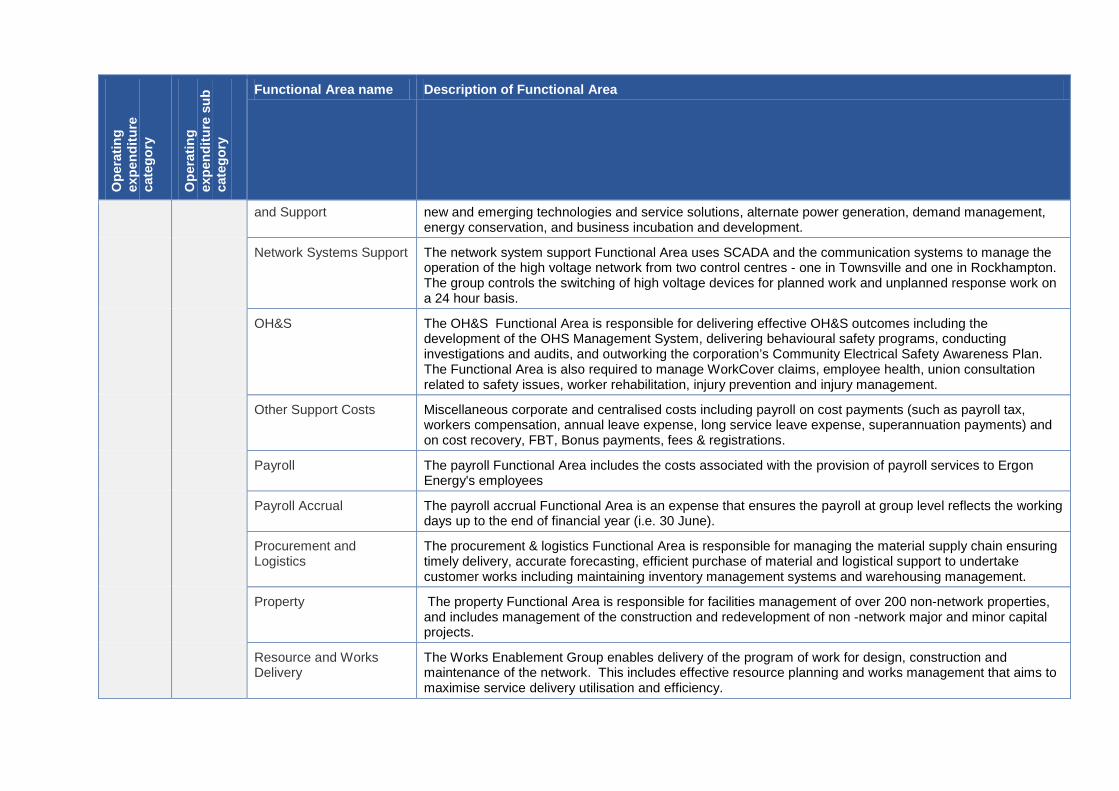
Ope
ratin
g ex
pend
iture
ca
tego
ry
Ope
ratin
g ex
pend
iture
sub
ca
tego
ry
Functional Area name Description of Functional Area
and Support new and emerging technologies and service solutions, alternate power generation, demand management, energy conservation, and business incubation and development.
Network Systems Support The network system support Functional Area uses SCADA and the communication systems to manage the operation of the high voltage network from two control centres - one in Townsville and one in Rockhampton. The group controls the switching of high voltage devices for planned work and unplanned response work on a 24 hour basis.
OH&S The OH&S Functional Area is responsible for delivering effective OH&S outcomes including the development of the OHS Management System, delivering behavioural safety programs, conducting investigations and audits, and outworking the corporation’s Community Electrical Safety Awareness Plan. The Functional Area is also required to manage WorkCover claims, employee health, union consultation related to safety issues, worker rehabilitation, injury prevention and injury management.
Other Support Costs Miscellaneous corporate and centralised costs including payroll on cost payments (such as payroll tax, workers compensation, annual leave expense, long service leave expense, superannuation payments) and on cost recovery, FBT, Bonus payments, fees & registrations.
Payroll The payroll Functional Area includes the costs associated with the provision of payroll services to Ergon Energy's employees
Payroll Accrual The payroll accrual Functional Area is an expense that ensures the payroll at group level reflects the working days up to the end of financial year (i.e. 30 June).
Procurement and Logistics
The procurement & logistics Functional Area is responsible for managing the material supply chain ensuring timely delivery, accurate forecasting, efficient purchase of material and logistical support to undertake customer works including maintaining inventory management systems and warehousing management.
Property The property Functional Area is responsible for facilities management of over 200 non-network properties, and includes management of the construction and redevelopment of non -network major and minor capital projects.
Resource and Works Delivery
The Works Enablement Group enables delivery of the program of work for design, construction and maintenance of the network. This includes effective resource planning and works management that aims to maximise service delivery utilisation and efficiency.
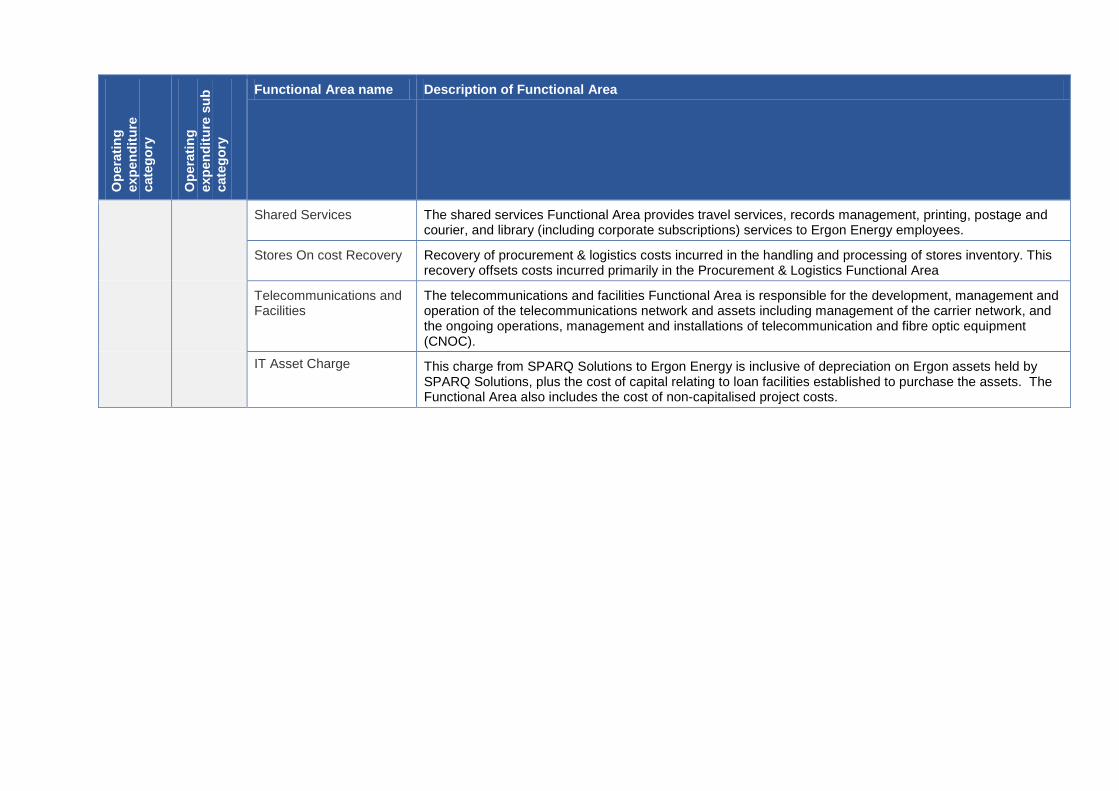
Ope
ratin
g ex
pend
iture
ca
tego
ry
Ope
ratin
g ex
pend
iture
sub
ca
tego
ry
Functional Area name Description of Functional Area
Shared Services The shared services Functional Area provides travel services, records management, printing, postage and courier, and library (including corporate subscriptions) services to Ergon Energy employees.
Stores On cost Recovery Recovery of procurement & logistics costs incurred in the handling and processing of stores inventory. This recovery offsets costs incurred primarily in the Procurement & Logistics Functional Area
Telecommunications and Facilities
The telecommunications and facilities Functional Area is responsible for the development, management and operation of the telecommunications network and assets including management of the carrier network, and the ongoing operations, management and installations of telecommunication and fibre optic equipment (CNOC).
IT Asset Charge
This charge from SPARQ Solutions to Ergon Energy is inclusive of depreciation on Ergon assets held by SPARQ Solutions, plus the cost of capital relating to loan facilities established to purchase the assets. The Functional Area also includes the cost of non-capitalised project costs.