Embed Size (px)
Citation preview

1
Overhead Costs in Building Construction in Saudi Arabia
Sadi A. Assaf, Abdulaziz Bubshait, Sulaiman Atiyah & Mohammed Al-Shehri
1. INTRODUCTION
In the construction industry, there is no single skill of greater
importance than cost estimation. Inadequate project cost estimation is the
second major cause of contractor failure in the US (Adrian 1979).
Construction cost estimation, however, is the process of forecasting the
probable costs of a given project. Hence, accuracy in estimation is
fundamental to success in contracting. Unfortunately accuracy and
comprehensiveness in cost estimation are delicate issues and can be easily
affected by many different parameters. Each parameter must be properly
addressed to maintain an acceptable level of accuracy in the process.
Overhead (OH) costs are only one side of estimation in construction but are
extremely important because they can be easily overlooked. In fact,
neglecting OH has forced some contractors out of business because these
costs constitute a significant portion of total construction costs (Dagostino
1989). Total OH costs may vary from 8 to 30 percent of the sum of
materials, labor, and equipment costs or from 12 to 50 percent of the labor
costs, depending on the project characteristics (Pulver 1969).
The construction industry in Saudi Arabia has come under severe
pressure due to declining government spending on construction, which
accounts for approximately 67 percent of the nation’s construction volume
(Bubshait and Al-Musaid 1992). In the late 1970’s and early 1980’s
government spending on construction projects reached 15 percent of the

2
gross national product (GNP), which placed a high demand on contractors’
services leading them to bid high, realizing a comfortable rate of return
(Shash and Zamel 1993, and United Nation National Accounts 1982). At
that time, accuracy in cost estimation did not mean much to many
contractors. OH costs were even at a lower level of importance. Now,
construction is in recession due to the near completion of huge
infrastructure projects and to a steep decline in oil prices (Shash and Zamel
1993). According to the ASHARQ ALAWSAT newspaper No. 6223 dated 12
Dec. 1995, the average government spending on the construction sector,
including operation and maintenance contracts, has dropped to only 8.7
percent of the gross national product in the past five years, which still
means billions of Saudi Riyals every year but which represent almost half
the previous demand on contractors’ services. This has forced contractors
to work under severely competitive conditions to deliver projects at
minimum cost and higher quality, leaving only a minimal profit margin.
At all times, high efficiency and total cost management are
fundamental to success in any free market economy, which has been the
case in Saudi Arabia since the start of the five year development plans
thirty years ago. However, the issue becomes extremely important with the
emergence of a global economy and the free trade agreements that are
expected to be implemented in the near future. Under these conditions,
contractors will be compelled to trim out the fat that has accumulated
during more comfortable times and find ways of reducing OH burden non-
billable costs. In the light of this discussion, the importance of studying OH
costs cannot be under-estimated.
In an environment of intense competition, declining profit margins,
and shrinking market shares, the only way to stay competitive is to reduce
and control costs while maintaining quality products. OH costs constitute a
good starting point for achieving cost reduction because they act as a silent

3
harvester of retained earnings. Furthermore, OH costs rise continuously
and never go down on their own, producing ever higher production costs
(Snodgrass 1991). Given this scenario, finding ways to reduce and control
OH costs will continue to gain importance as a vital management tool.
2. LITERATURE REVIEW
OH costs are those charges which cannot be attributed exclusively to
a single product or service (Tipper, 1966), or the summary of expenses that
benefit more than one cost objective (Fultz, 1980). A third definition is that
OH costs are those costs which are not a component of the actual
construction work but are incurred by the contractor to support the work
(Cilensek, 1991). There are, however, two types of OH costs in
construction: company OH costs and project OH costs.
2.1 COMPANY OVERHEAD COSTS
Company OH is also called general and administrative OH (G&A OH)
and includes all costs incurred by the construction firm in maintaining the
firm in business and supporting the production process but are not
directly related to a specific project (Adrian, 1982). According to A. E. Lew,
company OH is perhaps one of the main reasons why so many contractors
are unable to realize a profit, or even to stay in business. Obviously, if the
company does not know its true OH costs, then a failure in recovering
these costs will result in financial collapse. Company OH costs vary
considerably from time to time but range from 8 to 15 percent of the total
construction volume (Pulver, 1969). These expenses must be paid back to
the company or else financial difficulties are inevitable. No doubt the best
approach in dealing with company OH costs is to directly charge each

4
project the actual expenses that will be incurred, provided an accurate
estimation is reachable. Unfortunately this is not the case with company
OH costs and thus, contractors are forced to allocate their general expenses
proportionally among undertaken projects (Pulver,1969).
Probably, the most commonly used allocation mechanism is to total all
company OH costs for a given accounting period (fiscal year) and scale
them against the total direct costs for the same period, which gives the
percentage of company OH costs that can be applied to forthcoming
projects (Adrian 1982 and Franks 1984). After the OH rate is calculated, it is
added to the total estimated direct costs of the project in hand as explained
in the following example. Example calculations are shown in Figure 1.
Step 1 : Estimate of company annual OH costs Last year’s company OH costs $270,000 10 % Inflation $27,000 Firm Growth $23,000 Estimated company OH costs this year $320,000
Step 2 : Estimate of value of basis for allocation Estimated construction volume $4,000,000 Gross margin 20% $800,000 Labor & material costs $3,200,000
Step 3 : Company OH allocation rate Estimated company OH costs (320,000) = 10%
Labor & material costs (3,200,000) Step 4 : Company OH cost to apply to a specific project Project estimated labor & material costs $500,000 OH to apply (500,000 X 10 %) 50,000 Project cost $550,000

5
FIGURE 1. Overhead Allocation Process (Adrian 1982, p. 469)
6
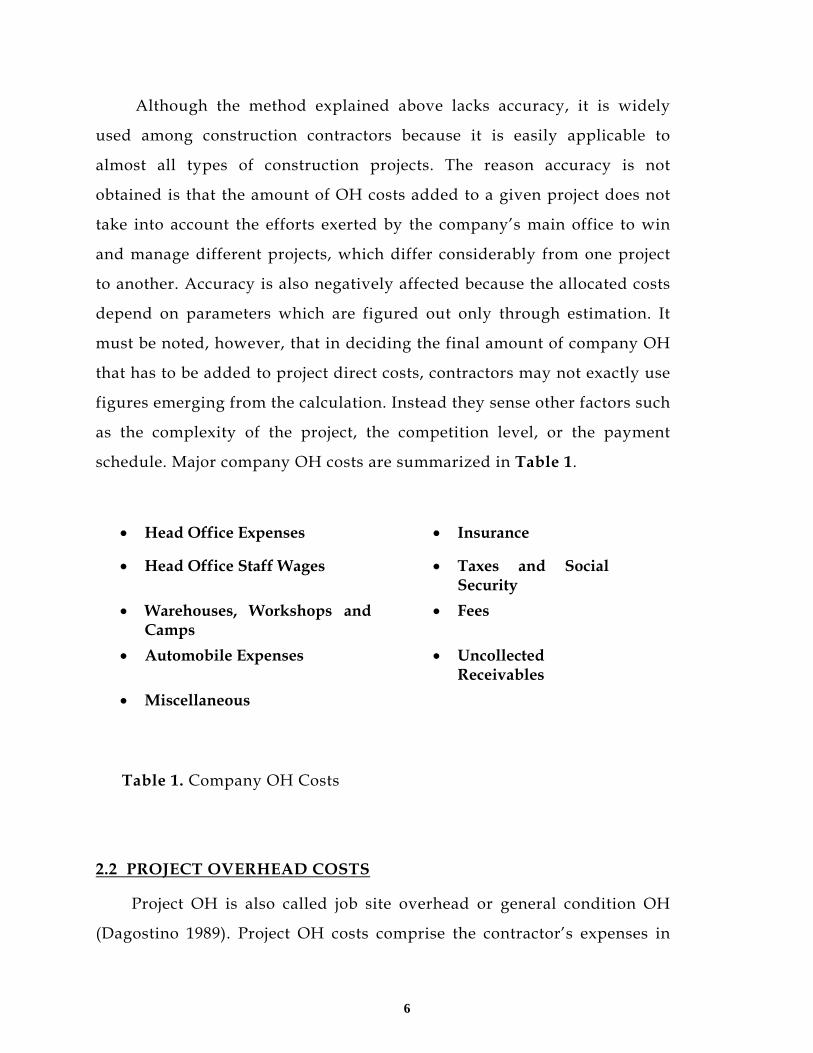
Although the method explained above lacks accuracy, it is widely
used among construction contractors because it is easily applicable to
almost all types of construction projects. The reason accuracy is not
obtained is that the amount of OH costs added to a given project does not
take into account the efforts exerted by the company’s main office to win
and manage different projects, which differ considerably from one project
to another. Accuracy is also negatively affected because the allocated costs
depend on parameters which are figured out only through estimation. It
must be noted, however, that in deciding the final amount of company OH
that has to be added to project direct costs, contractors may not exactly use
figures emerging from the calculation. Instead they sense other factors such
as the complexity of the project, the competition level, or the payment
schedule. Major company OH costs are summarized in Table 1.
• Head Office Expenses • Insurance
• Head Office Staff Wages • Taxes and Social Security
• Warehouses, Workshops and Camps
• Fees
• Automobile Expenses • Uncollected Receivables
• Miscellaneous
Table 1. Company OH Costs
2.2 PROJECT OVERHEAD COSTS
Project OH is also called job site overhead or general condition OH
(Dagostino 1989). Project OH costs comprise the contractor’s expenses in

7
managing the project at the job site. It is the cost specific to a project , but
not specific to a trade or work item (Cilensek 1991 and Taylor 1994). Unlike
company OH costs, project OH costs can be estimated with fair accuracy,
which means that contractors should carefully examine contract conditions
to properly cover project OH costs. Contractors who choose to go the easy
way and recover project OH costs through setting a percentage of direct
costs may end up over- or under-estimating these costs, leading to an
inaccurate bid. The components of project OH costs vary considerably
among projects, depending upon project size, type, location, consultant,
and project owner (Walker 1973). This situation works against the inclusion
of project OH costs as a percentage of project direct costs. The amount of
project OH differs from one project to another but goes from 10 to 30
percent or more of the sum of material, labor, and equipment costs (Means
Interior Estimating 1987). In the US the most common types of project OH
costs, which are also the most significant with regard to their amounts, are
bonds, insurance, and financing costs (Adrian 1982).
Project OH discussion is never complete without discussing project
planning because many items in project OH costs are directly proportional
to project duration. Components such as supervision and project financing
costs are estimated based on the forecasted duration of the project. In order
for the contractor to be competitive and win the bid, a project plan has to
be prepared with the best combination of resources to finish the job in
optimal time. This optimal time is the base for estimating many project OH
costs. It must be clear that the project OH cost estimate is as accurate as the
project planning and for that reason it is said that estimating project OH
cost is perhaps the most difficult type of cost to estimate with reasonable
accuracy especially for big and complex projects (Collier 1984). Major
project OH costs are shown in Table 2.

8
• Surety Bonds • Temporary Constructions
• Project Insurance • Repair Works • Financing Cost • Equipment Costs • Supervision Cost • Miscellaneous
Costs
Table 2 Project OH Costs
2.3 OH COST MANAGEMENT
OH costs, like all costs, are subject to the usual cost management
efforts. The management objective regarding OH costs is to succeed in
controlling them as a means of accomplishing company objectives. It
should be noted, however, that much of the past OH cost control efforts
were focused on cost allocation methods. Finding a better way of allocating
company OH costs is not necessarily the best solution to controlling ever-
increasing OH costs. Instead, companies’ efforts should focus on
eliminating unnecessary OH costs or at least reducing them, which cannot
be achieved unless the true causes of OH costs are identified and judged in
accordance with companies’ overall strategies. Cost allocation should be
used only when elimination, reduction, or tractability efforts are exhausted
(Tatikonda,L.U. and Tatikonda,R.J. 1991). Cost allocation, as a practice to
incorporate indirect costs into the product cost used to satisfy managers in
pricing their products because indirect costs were in general much lower
than current levels. This implied that the result of cost allocation would not
significantly affect the final bid. Product costs used to consist primarily of
direct material and labor costs. Today OH costs constitute up to 30 percent
of the production costs and even this figure is on the rise, which makes

9
cost allocation an invalid approach simply because extremely important
decisions are based on distorted cost information. Furthermore, if
substantial advances take place in an industry, then the costing system
must also incorporate these advances if it is for provide valuable
information to decision makers.
2.3.1 Activity Based Costing. In an effort to minimize the drawbacks
of traditional accounting systems, an alternative accounting method called
Activity Based Costing (ABC) could be tried. The premise of this method is
simply to obtain a better understanding of cost behavior by tracing
activities that incur costs, especially indirect costs, which helps in
accurately pricing products. Under ABC, costs are either short-term or
long-term variable costs. Short- term variable costs are volume related and
traditionally called variable costs or direct costs. On the other hand, long-
term variable costs only vary with the extent to which the activity is
performed. Moreover, this variation is limited and takes time to obtain. For
example, the head office cost for a construction contractor is really a long-
term variable cost which changes slowly even if the contractor is not
working at full capacity. Furthermore, the change in this cost is limited
unless there is a vital change in work load (Drury 1990).
ABC tries to obtain a greater understanding of cost behavior so as to
accurately determine product costs. It does so by understanding the forces
behind costs which are called cost drivers. A cost driver is defined as the
activity or transaction which significantly determines the magnitude of the
cost. Therefore, if head office cost is driven, presumably, by marketing,
new projects pricing, support site operations, accounting, etc...., then these
activities would be the cost drives for head office cost. ABC suggests that
an accurate and fair recovery of this indirect cost is possible if cost is
assigned to different projects based on these cost drives by knowing how

10
much of each activity is directed to a particular project. Cost drivers are
thus used as a cost assigning base instead of traditional allocation bases
and it is from that concept to ABC gets its strength. It should be added that
short-term variable costs are more easily assigned to product total cost
using volume related cost drivers such as material or man-hours
consumed.
The major distinction between ABC and traditional costing systems is
that ABC claims that volume related cost drivers are not necessarily the
correct way to incorporate long-term variable costs, that is, OH costs
(Copper and Kaplan 1988, and Drury 1990). The reason is that ABC is a
more relevant approach for costing products than traditional costing
systems simply because it forces deeper traspility of costs to products. The
main factors here are activities and their associated drivers. The logic
behind the ABC approach is that if an activity is not used by a product,
then the product should not absorb any of that activity’s cost (Raffish
1991).
According to Copper and Kaplan, introducing the ABC system results
in far more accurate product costing. However, the use of the ABC system
in construction is not yet documented and may have some limitations due
to the fact that the construction industry has unique characteristics. First,
unlike the case in many industries, construction costs are determined
before the production process starts, which means that almost all costs are
only predicted. Second, each construction project is unique and thus has
different production arrangements, which cause different cost components.
Third, company OH costs significantly vary from time to time depending
on many factors and the number of projects, which is not known when
project costing is performed. Fourth, there are, sometimes, many cost
drivers for the same OH cost. This leads to inconsistency in the amount of

11
OH costs each project has to handle. In spite of that, the ABC system may
be used to reduce the severity of the problem by concentrating on major
company OH costs and trying to overcome obstacles in the implementation
of ABC in construction. In any event, this important approach will be
examined in the survey so that it can be better evaluated.
2.5.2 OH COST REDUCTION. Although much of the past OH cost
control effort was focused on finding more appropriate cost allocation
methods, sound OH cost management needs to focus on eliminating or at
least reducing OH costs to their optimal level through the use of traditional
cost control measures. After all, cost allocation is only a way to incorporate
a company’s indirect costs into project cost and not intended to reduce OH
costs, which is the real objective in an environment of ever-increasing
competition. An optimal OH level is one that allows the firm to accomplish
its strategic goals at the lowest possible general expense. In the February
1989 issue of the Australian Accountant, Dale explained why it seems to be
difficult to measure the effectiveness of OH costs and thus to reduce them
(Dale 1989):
• OH costs are generated by indirect activities which are not clearly
defined.
• All indirect activities are considered vital for the survival of the
company and thus any reduction in activity level or quality will
render the affected department inoperable.
• The costs of indirect activities are never accurately known. In
addition the share of the individual product is only predicted using

12
cost allocation which leads to distorted product cost. This situation
makes any effort to reduce OH costs lack clarity.
• Cutting OH costs usually affects executives first, which sometimes
generates a defensive mechanism among top management and may
shift the blame for excess OH costs to misleading causes.
• Some companies lack clear long term plans regarding business
orientation, which causes confusion regarding OH spending
priorities.
There are, nevertheless, some signs which indicate that OH costs are
reaching unacceptable levels. The first and foremost sign is when a
contractor finds it is difficult to realize profit although estimated direct
costs are close to actual costs according to cost control reports or when
competitors’ prices are unrealistically low (Raffish 1991). Practical steps to
eliminate or reduce OH costs are then needed to avoid unwanted
sequences. Some of traditional cost reduction steps are as follows :
2.3.2.1 Organization Auditing
The first and foremost step is to identify the real causes of OH costs,
which can be achieved through internal or external auditing. In
order to achieve this goal, contractors can use one or more of the
following techniques (Tatikonda, Lakshmi and Tatikonda, Rao 1993):
1. Cause and Effect (Fish Bone) Diagram.
2. Pareto Analysis
3. Value Engineering
2.5.2.2 Controlling OH Costs

13
Controlling business costs should always be an important management
concern. Contractors can control OH costs through some traditional
common sense measures that significantly reduce OH costs because
these measures are easy to practice on a day-by-day level without
special arrangements (Gandhi 1996). Following are some of these
measures:
1- Employ The Most Qualified Staff.
2- Maintain an Open Office Environment.
3- Provide Complete, Up-to-date Training and Resources.
4- Place a Very High Priority on Quality.
5- Link Spending on OH Costs With Strategic Goals.
6- Challenge the Starting Base.
7- Employ Budget Details.
8- Adopt a Multitasking Management Approach.
9- Avoid Premature Spending Cuts.
10- Employ Benchmark Costing Techniques.
It should be noted, however, that none of these steps is particularly
new or totally sufficient. The idea here is to obtain a cumulative effect
from traditional cost control measures (Gandhi 1996).
3. RESEARCH METHODOLOGY

14
Data needed for the research was collected via a questionnaire
which was developed based on a thorough review of the related literature
to reflect the existing level of OH costs and how local contractors deal with
them.
The questionnaire has four parts, covering the construction firm,
OH costs in general, company OH costs, and project OH costs. The first
part contains 22 questions eliciting general information about the
participating contractor. The second part contains 8 questions about OH in
general which explores the contractors’ background regarding OH in its
broad aspects and how contractors feel about it, which will mainly satisfy
the second objective. The third part has 17 questions asking specifically
about company OH costs. The questions cover the following items:
definition of company OH, the percentage of company OH costs to annual
construction volume and to project direct costs, whether the existing level
of company OH is satisfactory, the method of allocating company OH costs
to the project bid and why this method is used, what factors affect the
amount of company OH costs allocated to a given project, what constitutes
company OH costs, whether company OH has increased or decreased in
the past years and what factors have led to that, whether contractors
believe that their existing cost accounting system is effective in estimating
and allocating company OH costs or whether there is a need for a more
accurate allocation method such as activity based costing (ABC) system
and, finally, whether contractors believe that company OH can be
controlled. The fourth and final part contains 11 questions tackling
important issues regarding project OH costs. It addresses issues such as:
the percentage of project OH costs to direct costs of the project, whether
project OH has increased or decreased in the past years and for what
causes, what the components of project OH costs are, and in what
percentage, the method of estimating project OH costs and why it is used,

15
factors affecting the amount of project OH costs, and whether contractors
are taking practical steps to reduce them. Interview questions appear in
appendix A.
The population of this study is all the building contractors classified by
MPWH in the first three grades for Saudi contractors and in the first five
grades for foreign contractors who, according to MPWH, can bid for
projects of up to SR 50 million. The total number of those contractors is 230
(MPWH classification 1989). Based on that population, a sample of 61
contractors participated in the research.
4. RESULTS and ANALYSIS
4.1 OH COST AWARENESS
In order for any contractor to properly reflect his judgment on OH
issues, it is first important to check what the contractor’s basic
understanding is of OH costs in general. This awareness is investigated in
this section and the results are as follows:
4.1.1 What is an OH Cost?
Results reveal that 64 % of the sample did not properly define OH costs
and directly crossed to examples of OH costs. Another 23 % of the sample
defined OH cost with a reasonably accurate definition by stating that OH
cost is not part of the actual construction production cost but is an indirect
cost. Only 13 % of the sample have the proper definition of OH cost.
Results indicate that even large contractors do not have a unified or even
proper understanding of the term OH costs.

16
4.1.2 Types of OH Costs
About 87 percent have co. OH and project OH costs. The remaining
percentage considers all OH costs together without segregation.
4.1.3 Percentage of OH Costs
As mentioned earlier, total OH costs do not usually exceed 15 percent
of the annual construction volume in the United States. Locally, only 48
percent of the contractors have 15 percent OH costs or less. The remaining
52 percent have a higher percentage, indicating that OH costs present a
serious challenge locally. The overall percentage is 16.8 which is also
higher than the ratio found in the literature.
Ratio of OH to const. Volume
Freq Percent Cum. Freq.
Cum. Percent
10 or less 04 06.6 04 06.6
11- 15 25 41.0 29 47.6
16- 20 16 26.2 45 73.8
21- 25 13 21.3 58 95.1
Above 25 03 04.9 61 100.0
Not Calculated 00 00 61 100.0
Table 3 Ratio of Total OH Costs to Annual Construction Volume
4.1.4 Contractors’ Perception Regarding OH Costs
The overall perception the contractors have regarding OH costs is
investigated in this question as shown in Table 4:

17
Parameter under investigation
1 2 3 4 5 Total Ave.
OH level is now acceptable
08 13 %
09 15 %
09 15 %
23 38 %
12 20 %
61 100 %
3.36
OH badly affects performance
14 23 %
26 43 %
13 21 %
07 11 %
01 02 %
61 100 %
2.26
OH was not an important issue in the past
05 09 %
13 22 %
13 22 %
19 32 %
09 15 %
59 100 %
3.24
OH will be of greater importance in the future
39 67 %
14 24 %
05 09 %
00 00 %
00 00 %
58 100 %
1.41
OH can be monitored and controlled
05 09 %
03 05 %
18 31 %
23 40 %
09 15 %
58 100 %
3.48
1 = Strongly agree 2 = Agree 3 = Neutral 4 = Disagree 5 = Strongly disagree Table 4 Contractors’ Perception Regarding OH Costs
4.2 COMPANY OH COSTS
Company OH (co. OH) costs are by far the most important type of OH
costs because as explained earlier in Chapter 2 they constitute a serious
challenge to contractors as to how to recover them in a balanced manner
and because they, unlike project OH costs, affect contractors’ performance
in all projects. This section contains results pertaining to co. OH costs.
4.2.1 What is Company OH Cost ?
The answers reveal that 43 percent of the sample successfully
defined co. OH costs whereas the remaining 57 percent went directly to
examples of co. OH costs without really defining them. Neither party

18
clearly stated that a co. OH cost cannot be solely caused by a single project
and thus has to be recovered by letting many projects share the cost.
4.2.2 Ratio of Company OH Cost to Project Direct Cost
The percentage of co. OH costs to project direct costs is an important
measure which quantifies the cost the project at hand has to carry in
sharing company expenses. Results for this question are shown in Table 5:
Ratio of Co. OH to direct cost
Freq Percent Cum. Freq.
Cum. Percent
00- 05 00 00 00 00
06- 10 16 26.2 16 26.2
11- 15 23 37.3 39 63.5
16- 20 09 14.8 48 78.3
Above 20 04 06.6 52 84.9
Not calculated 09 15.1 61 100.0
Table 5 Ratio of Company OH to Project Direct Costs
The reviewed literature did not specify a particular percentage of co. OH in
the project final bid value. However, there are indications that 6 to 10 percent is
an acceptable range (Means Estimating Handbook 1990). Results from the
survey show that while 15.1 percent of contractors do not calculate the ratio, only
26.2 percent of the contractors have 10 (or less) percent of their project bid value
as costs initiated by company expenses. The remaining 58.7 percent add more
than 10 percent of the project direct costs as a co. OH cost. In fact, 14.8 percent of
the contractors surveyed reported that their ratio is 16-20 percent and 6.6 percent

19
have 20 or above of their bid value as co. OH costs, which is a dangerous level.
The overall percentage is 12.9 which is higher than the available literature
figures. Again this indicates how serious the issue of co. OH is and the need to
focus efforts on reducing co. OH costs.
4.2.3 Ratio of Company OH Cost to Annual Construction Volume The construction literature shows that the ratio of co. OH costs to annual
construction volume differs greatly but, for large contractors ranges from 8 to 15
percent. Results for this question are shown in Table 6. Looking at the results, it
can be seen that 54.1 percent of the respondent contractors have 15 percent (or
less) of their annual construction volume as a co. OH, which is an acceptable
range if compared to the figures found in the literature. However, the remaining
significant percentage of the contractors (45.9%) have more than 15 percent of
their annual construction volume as co. OH. The result emphasizes the need to
reduce construction indirect costs. The overall ratio is 14.3 percent.
Ratio of Co. OH to construction volume
Freq. Percent Cum. Freq.
Cum. Percent
00- 05 02 03.3 02 03.3 06- 10 10 16.4 12 19.7 11- 15 21 34.4 33 54.1 16- 20 25 41.0 58 95.1 Above 20 03 04.9 61 100.0 Not calculated 00 00 61 100.0
Table 6 Ratio of Company OH to Annual Construction Volume

20
4.2.4 Perceptions Regarding Company OH Cost
4.2.4.1 Level of Acceptance of Company OH
Results in Table 7 indicate that only 28.3 percent of the contractors accept
the current level of co. OH whereas 45.0 percent think the current level is
high. Having this impression helps in pursuing efforts to study and
reduce co. OH costs.
Level of Acceptance of Co. OH
Freq Percent Cum. Freq.
Cum. Percent
Strongly accepted 03 05.0 03 05.0 Accepted 14 23.3 17 28.3 Neutral 16 26.7 33 55.0 Not accepted 22 36.7 55 91.7 Strongly not accepted 05 08.3 60 100.0
Table 7 Level of Acceptance of Current Company OH Cost
4.2.4.2 Changes in Company OH Costs Results on whether contractors believe that co. OH has increased or decreased
lately are shown in Table 8. It is clear that the majority of contractors think that
co. OH costs have increased during the past years.
Trend Freq. Percent
Cum. Freq.
Cum. Percent
Increased 47 77.0 47 77.0 Decreased 08 13.2 55 90.2 Didn’t change
06 09.8 61 100.0
Table 8: Changes in Company OH Costs

21
4.2.4.3 Reasons for Increased Co. OH costs Potential causes for increased co. OH costs are investigated in this question.
Knowing the major sources of high co. OH costs helps in concentrating efforts
towards specific causes. Seven potential causes were identified and evaluated as
shown in Table 9. In evaluating these results (and similar results) an important
index was calculated to reflect the relative effectiveness of the criteria under
investigation. The importance index was calculated using the following formula:
I =i=1∑
5
[(ai xi) / 5 ] 100 %
where I = importance index; ai = constant expressing the weight of the ith
response, where ai = 1,2,3,4,5 for i = 1,2,3,4,5 respectively; xi = frequency of the i
response given as a percentage of total responses for each cause or factor; i =
response category index where i=1,2,3,4,5; x1 = frequency of strongly agree
responses; x2= frequency of agree responses; x3= frequency of neutral responses;
x4= frequency of disagree responses; x5= frequency of strongly disagree
responses.
Reason for Increased Co. OH costs
5 4 3 2 1 Total Index %
Rank
A) Lack of new projects (recession)
27 44 %
15 25 %
06 10 %
07 11 %
06 10 %
61 100 %
76.4 2
B) Cost inflation 14 23 %
19 32 %
13 21 %
10 16 %
05 08 %
61 100 %
68.8 3
C) Delayed payments 24 39 %
18 30 %
11 18 %
06 10 %
02 03 %
61 100 %
78.4 1
D) Government regulation
10 16 %
19 31 %
20 34 %
05 08 %
07 11 %
61 100 %
67.2 4
E) Increased marketing cost
17 28 %
06 10 %
17 28 %
11 18 %
10 16 %
61 100 %
63.0 7
F) Client related reasons 19 31 %
10 16 %
12 20 %
05 08 %
15 25 %
61 100 %
64.2 6
G) Firm’s growth 23 37 %
04 07 %
16 26 %
03 05 %
15 25 %
61 100 %
65.6 5
H) Other (internal mistakes)
00 00 %
08 42 %
06 32 %
05 26 %
00 00 %
19 100 %
N/A N/A
5 = Strongly agree 4 = Agree 3 = Neutral 2 = Disagree 1= Strongly disagree

22
Table 9 Reasons for Increased Company OH Costs

23
When analyzing causes of increased co. OH, it must be noted that some
causes of increased co. OH costs are interrelated, which makes it difficult to
evaluate them individually. For example, a decision to expand the company,
which stands as a cause of increased co. OH costs by itself, involves also
marketing costs and constitutes an inter-organization mistake if taken at the
wrong time. Looking at the results, causes of increased co. OH costs can be
arranged in their order of effectiveness as follows:
1. Delayed payments
2. Lack of new projects
3. Cost inflation
4. Government regulations
5. Firm’s growth
6. Client related requirements
7. Increased spending on marketing
8. Wrong management decisions
4.2.5 Distribution of Company OH Cost
Co. OH costs have many possible components that can be considered. In the
following question the percentage of the most commonly included items are
determined. The importance of this analysis is that it gives a chance to know
which co. OH cost items consume most of company expenses and as a result
identifies where to concentrate efforts to reduce co. OH costs. Seven major cost
categories were identified from the construction literature and an eighth open
category was also added for a possible additional cost category. Results are
shown in Table 10:

24
Distribution of Co. OH cost
0- 5 %
6-10%
11-15%
16-20%
Over 20%
Total
Index %
Rank
Head office staff
08 13 %
34 56 %
03 05 %
11 18 %
05 08 %
61 100 %
50.4 5
Travel expenses 38 63 %
15 24 %
08 13 %
00 00 %
00 00 %
61 100 %
30.2 6
Auto. & Eq. Expenses
00 00 %
10 16 %
22 37 %
13 21 %
16 26 %
61 100 %
71.4 1
Head office expenses
01 02 %
08 13 %
23 38 %
21 34 %
08 13 %
61 100 %
68.8 2
Insurance & taxes
42 68 %
14 23 %
04 07 %
01 02 %
00 00 %
61 100 %
28.2 7
Labor health, travel, recruitment
00 00 %
05 08 %
37 61 %
16 26 %
03 05 %
61 100 %
65.6 3
Marketing 47 77 %
14 23 %
00 00 %
00 00 %
00 00 %
61 100 %
24.6 8
Financing cost 00 00 %
05 18 %
12 43 %
11 39 %
00 00 %
28 00 %
64.2 4
Other ………… 00 00 %
00 00 %
00 00 %
00 00 %
00 00 %
00 00 %
00 N/A
Ranges from very low (0 to 5 %) =1 To very high (over 20 %) =5
Table 10 Classification of Company OH Costs
Survey results show factors affecting co. OH costs can be arranged as
follows:
1. Automobile and equipment costs
2. Head office expenses
3. Labor related costs
4. Financing costs
5. Head office staff expenses
25
6. Insurance costs
7. Marketing costs
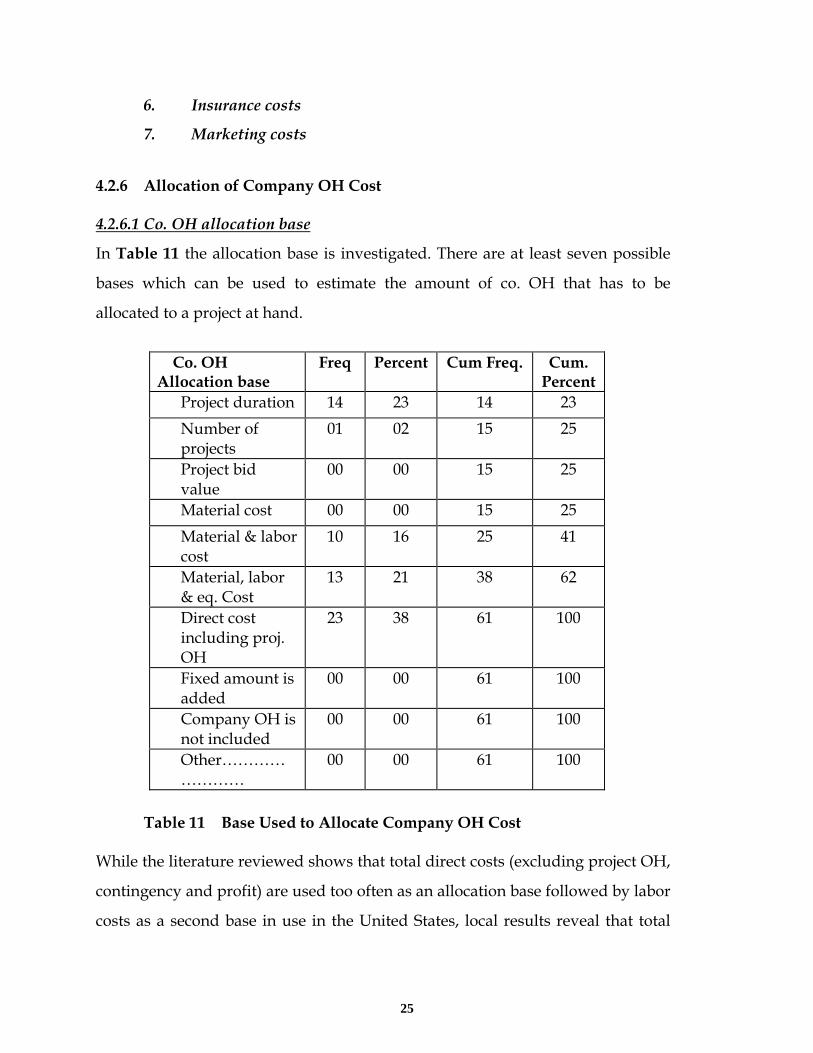
4.2.6 Allocation of Company OH Cost
4.2.6.1 Co. OH allocation base
In Table 11 the allocation base is investigated. There are at least seven possible
bases which can be used to estimate the amount of co. OH that has to be
allocated to a project at hand.
Co. OH Allocation base
Freq Percent Cum Freq. Cum. Percent
Project duration 14 23 14 23 Number of
projects 01 02 15 25
Project bid value
00 00 15 25
Material cost 00 00 15 25 Material & labor
cost 10 16 25 41
Material, labor & eq. Cost
13 21 38 62
Direct cost including proj. OH
23 38 61 100
Fixed amount is added
00 00 61 100
Company OH is not included
00 00 61 100
Other……………………
00 00 61 100
Table 11 Base Used to Allocate Company OH Cost
While the literature reviewed shows that total direct costs (excluding project OH,
contingency and profit) are used too often as an allocation base followed by labor
costs as a second base in use in the United States, local results reveal that total
26
direct costs including project OH is the most frequently used base (38%). In
second place comes the project duration (23%). In the third sequence come the
direct costs for material, labor and equipment but excluding project OH (21%),
followed by material and labor costs (16%). In the fifth and last place comes the
expected number of projects with a very low frequency (2%). It must be noted,
however that labor cost is not used as a base although it comes in the second
place in the literature. The other listed bases are not used locally.
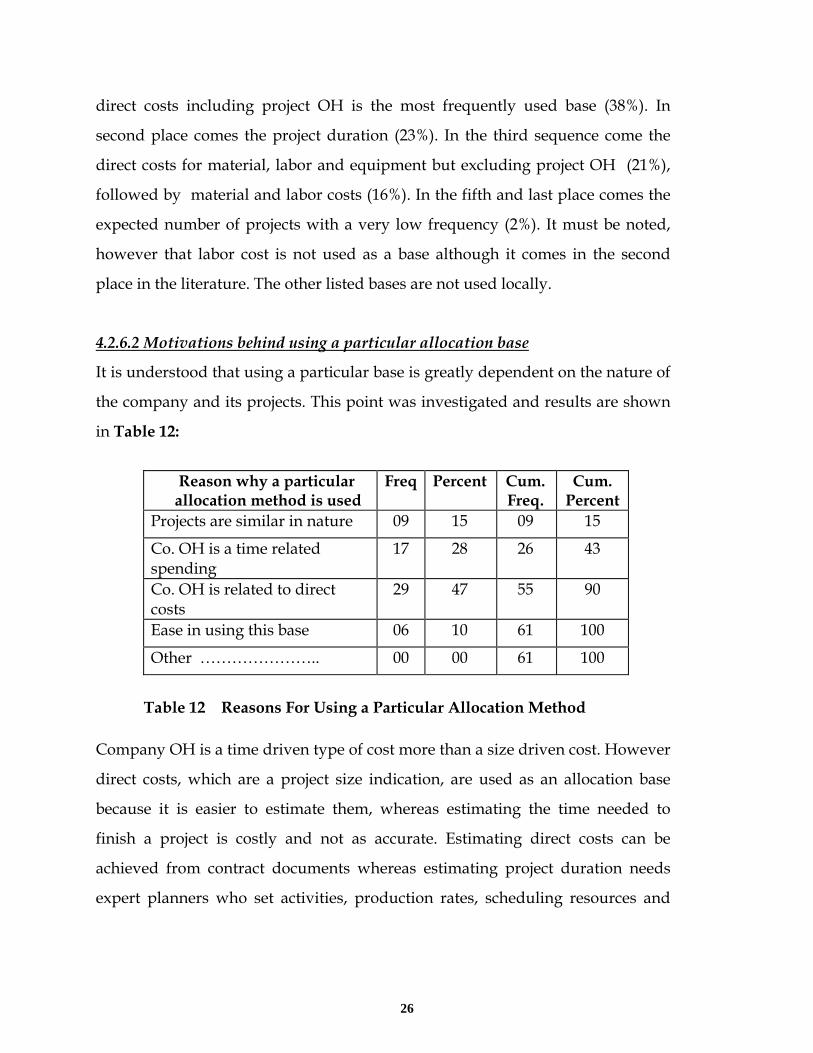
4.2.6.2 Motivations behind using a particular allocation base
It is understood that using a particular base is greatly dependent on the nature of
the company and its projects. This point was investigated and results are shown
in Table 12:
Reason why a particular allocation method is used
Freq Percent Cum. Freq.
Cum. Percent
Projects are similar in nature 09 15 09 15
Co. OH is a time related spending
17 28 26 43
Co. OH is related to direct costs
29 47 55 90
Ease in using this base 06 10 61 100
Other ………………….. 00 00 61 100
Table 12 Reasons For Using a Particular Allocation Method
Company OH is a time driven type of cost more than a size driven cost. However
direct costs, which are a project size indication, are used as an allocation base
because it is easier to estimate them, whereas estimating the time needed to
finish a project is costly and not as accurate. Estimating direct costs can be
achieved from contract documents whereas estimating project duration needs
expert planners who set activities, production rates, scheduling resources and

27
other steps which are time consuming and costly, especially at the bidding stage.
As a result, contractors use direct costs as a measure for co. OH costs.
28
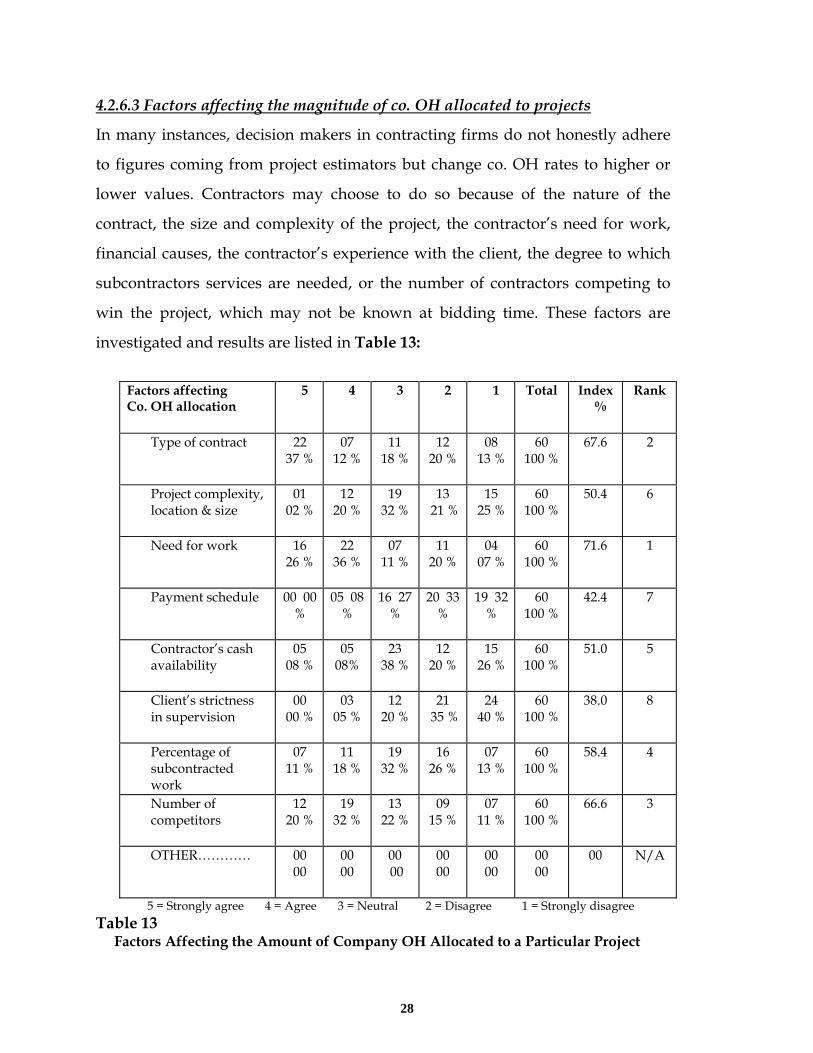
4.2.6.3 Factors affecting the magnitude of co. OH allocated to projects
In many instances, decision makers in contracting firms do not honestly adhere
to figures coming from project estimators but change co. OH rates to higher or
lower values. Contractors may choose to do so because of the nature of the
contract, the size and complexity of the project, the contractor’s need for work,
financial causes, the contractor’s experience with the client, the degree to which
subcontractors services are needed, or the number of contractors competing to
win the project, which may not be known at bidding time. These factors are
investigated and results are listed in Table 13:
Factors affecting Co. OH allocation
5 4 3 2 1 Total Index %
Rank
Type of contract 22 37 %
07 12 %
11 18 %
12 20 %
08 13 %
60 100 %
67.6 2
Project complexity, location & size
01 02 %
12 20 %
19 32 %
13 21 %
15 25 %
60 100 %
50.4 6
Need for work 16 26 %
22 36 %
07 11 %
11 20 %
04 07 %
60 100 %
71.6 1
Payment schedule 00 00 %
05 08 %
16 27 %
20 33 %
19 32 %
60 100 %
42.4 7
Contractor’s cash availability
05 08 %
05 08%
23 38 %
12 20 %
15 26 %
60 100 %
51.0 5
Client’s strictness in supervision
00 00 %
03 05 %
12 20 %
21 35 %
24 40 %
60 100 %
38.0 8
Percentage of subcontracted work
07 11 %
11 18 %
19 32 %
16 26 %
07 13 %
60 100 %
58.4 4
Number of competitors
12 20 %
19 32 %
13 22 %
09 15 %
07 11 %
60 100 %
66.6 3
OTHER………… 00 00
00 00
00 00
00 00
00 00
00 00
00 N/A
5 = Strongly agree 4 = Agree 3 = Neutral 2 = Disagree 1 = Strongly disagree Table 13 Factors Affecting the Amount of Company OH Allocated to a Particular Project

29
Results reveal that factors affecting the amount of co. OH loaded to a given
project can be arranged as follows :
1. Contractor need for work
2. Type of contract
3. Number of competitors
4. Percentage of subcontracted work
5. Contractor’s cash availability
6. Project complexity, location and size
7. Payment schedule
8. Client’s strictness in supervision
4.2.6.4 Frequency of checking OH rate Results shown in Table 14 indicate that 85 % of the contractors surveyed do the
same. The rest of the sample check OH rate arbitrarily when they feel it is
needed.
Company OH rate is checked every
Freq.
Percent Cum. Freq.
Cum. Percent
06 months 00 00 00 00
12 months 52 85 52 85
18 months 00 00 52 85
24 months 00 00 52 85
No fixed schedule 09 15 61 100
Table 14 Intervals for Checking Company OH Rate

30
4.2.6.5 Contractors’ perception regarding OH cost allocation In this section four points which reflect contractors’ perceptions regarding co.
OH cost allocation are examined. Survey results in Table 15 cite that 80 percent
of the contractors do appreciate the importance of using the right allocation
approach. The remaining 20 percent gave a neutral response. The second
statement investigates contractors’ evaluation of their current allocation method.
In this respect, 64 percent of the sample regard the currently-in-use methods
sufficient but 7 percent of the sample totally disagree with this idea. In the third
question, only 48 percent of the contractors expressed their agreement with the
idea that more cost pools, as bases for co. OH allocation, yield a better cost
tractability and thus result in a more accurate OH cost allocation. A neutral
response, however, represents 35 percent of all answers, which is a high
percentage.
Factors related to allocation method
1 2 3 4 5 Tot.
• Using the right allocation method is vital for the contractors
00 00 %
00 00 %
12 20 %
26 42 %
23 38 %
61 100 %
• Currently used method is effective
04 07 %
00 00 %
18 29 %
25 41 %
14 23 %
61 100%
• Accurate allocation can be achieved if more cost pools are used
00 00 %
10 17 %
21 35 %
17 28 %
12 20 %
61 100%
• Better allocation can be achieved if activity based costing (ABC) is used
06 11 %
00 00 %
22 42 %
16 30 %
09 17 %
53 100%
1 = Strongly disagree 2 = Disagree 3 = Neutral 4 = Agree 5 = Strongly agree
Table 15 Contractors’ Perception Regarding Company OH Allocation

31
Activity based costing (ABC) was investigated as a relatively new cost
accounting method which relies on the concept of relating costs to the activities
causing them. The idea was totally new to many contractors, which meant that
the concepthad to be explained to them in order to gauge their perceptions. In
spite of this, only 53 contractors made their judgment on the issue. Results show
that while 47 percent of the contractors surveyed agree or strongly agree on the
ABC approach, 11 percent strongly disagree but 42 percent of the sample have
neutral response. In discussing the concept, many contractors had the impression
that although the theory behind ABC is valid, it may be difficult to apply in the
construction industry because company resources are continuously performing
many activities in a manner which makes tractability very difficult. 4.2.7 Controlling Company OH Cost This question asks contractors to specify efforts taken to reduce or control co. OH
costs. Results are summarized in Table 16:
Efforts to reduce co. OH costs
Freq Percent Cum. Freq.
Cum. Percent
A) No efforts are exerted
14 23 14 23
B) Steps are taken to
reduce co. OH
47 77 61 100
Table 16 Rate of Applying Steps to Reduce co. OH Costs
Results in Table 16 indicate that 77 percent of the contractors do apply a cost
control plan for co. OH costs. In the second part of this question contractors were
asked to explain their cost control plans. Answers can be divided into two

32
groups. First, the majority of contractors (87 percent) explained their cost control
plans as an instantaneous decision aimed at cutting co. OH costs which came as a
reaction to high OH rates. Such actions cannot be called a cost control plan as
they are not part of a comprehensive understanding of the issue. A
comprehensive understanding should have an objective setting, an execution
plan, and monitoring and correction. Those contractors have the impression that
they have cost control plans while they do not. Many examples are mentioned in
this regard such as : reducing the size and staff of main office, renting facilities
for offices and accommodation instead of building them, recruiting manpower
with lower wages and who can handle a wider range of tasks, sharing head office
resources with sister companies, reducing equipment and plant costs by selling
surplus equipment, and reducing or canceling overtime and bonuses.
On the other hand, 13 percent of contractors who report having cost control
plans for co. OH costs described comprehensive plans which have a cost target to
be met, a work plan to achieve a target, checking variances to evaluate progress
and taking necessary corrective actions. The described cost control plans have
two aspects. The first is reducing co. OH costs by eliminating unneeded expenses
on the spot to achieve quick results to safeguard the firm against bankruptcy
during the peak period of the problem. The second is a cost control process
implemented for all expenses, including co. OH costs. This process is greatly
affected by the overall business objectives which sense available chances and
potential clients. The co. OH part of the process does not significantly differ from
other cost control processes; it includes setting a target cost for co. OH, putting
rules and regulations for spending, monitoring progress periodically, and taking
corrective actions when needed. There are times, however, when sudden changes
in the work load occur, and that flexible measures are instantaneously
implemented to cope with the changes because contractors cannot afford to lose
new work opportunities as a result of implementing an OH cost control plan.

33
4.2.8 Additional Comments and Recommendations
Participants were also asked if they have additional comments or
suggestions regarding company OH costs. Only six contractors answered.
Two points can be drawn from their answers. First, the unstable
construction market makes it difficult for contractors to decide on the
optimum level of OH costs that enables contractors to win and administer
large projects and at the same time does not financially drain the company.
This factor was also sensed as a major reason for increased co. OH costs
when lack of new projects was evaluated second among causes of increased
co. OH costs. Second, there are new types of OH costs which were not
previously known to Saudi contractors, such as insurance and financial
costs which are project OH costs in general but can be considered company
OH costs in many instances. These costs are on the rise and local
contractors have minimal control over them. Contractors who mentioned
these costs suggested that government should be involved to help
contractors find a middle way with banks and other surety groups.
4.3 PROJECT OH COSTS
In this section, survey results regarding project OH costs are presented.
Results discuss the definition of project OH, its percentage to project direct
costs, contractors’ perception regarding project OH, types of project OH
costs, how it is estimated, factors affecting the size of project OH, and
efforts exerted to control project OH costs.
4.3.1 What is Project OH Cost?
Contractors were asked to identify project OH costs in the first
question. This was an open-ended question and 61 answers were obtained.
All contractors defined project OH costs correctly but with different

34
degrees of clarity. In fact all contractors surveyed defined the term as those
costs specific to a project but not to a work item within the project. Many
examples were mentioned among which are supervision cost and
temporary constructions.
4.3.2 Ratio of Project OH Cost to Project Direct Cost
According to the literature, project OH costs vary from one project to
another but range from 5 to 30 percent of material, labor, and equipment
total costs as detailed in chapter 2. Results in Table 17 indicate that project
OH costs for the majority of contractors range from 11 to 20 percent of
direct costs, which is an acceptable range compared to data found in the
literature. The overall ratio is 14.9 percent.
Ratio of project OH to project direct costs
Freq. Percent
Cum. Freq.
Cum.
Percent 00- 05 01 02 01 02
06- 10 11 18 12 20
11- 15 23 38 35 58
16- 20 16 26 51 84
21-25 10 16 61 100
26-30 00 00 61 100
NOT CALCULATED 00 00 61 100
Table 17 Ratio of Project OH to Project Direct Costs

35
4.3.3 Contractors’ Perception Regarding Project OH Costs
4.3.3.1 Changes in project OH costs
Results in Table 18 clearly show that the overwhelming majority of
contractors believe that project OH has increased during the past years.
Directions in
project OH cost Freq. Percent Cum.
Freq. Cum.
Percent Increased 56 92 56 92
Decreased 02 03 58 95
No change 03 05 61 100
Table 18 Directions in Project OH Cost
4.3.3.2 Reasons for increased project OH costs
Knowing reasons for increased project OH costs helps in directing the
efforts needed to control them. Seven potential causes for increased
project OH costs were identified and examined as shown in Table 19.
Results order potential causes are as follows :
Reasons for increased project OH
5 4 3 2 1 Total Index %
Rank
A) Lack of new projects
07 11 %
06 10 %
16 26 %
21 35 %
11 18 %
61 100 %
52.4 6
B) Cost inflation 21 35 %
07 11 %
06 10 %
16 26 %
11 18 %
61 100 %
63.6 4
C) Delayed payments 40 65 %
12 20 %
09 15 %
00 00 %
00 00 %
61 100 %
90.2 1
D) Government regulation
07 11 %
13 21 %
16 26 %
22 37 %
03 05 %
61 100 %
59.6 5
E) Increased financing cost
34 56 %
02 03 %
11 18 %
10 16 %
04 07 %
61 100 %
77.0 2
F) Client related requirements
09 15 %
18 30 %
20 32 %
05 08 %
09 15 %
61 100 %
64.2 3

36
Reasons for increased project OH
5 4 3 2 1 Total Index %
Rank
G) Firm’s growth 00 00 %
12 20 %
10 16 %
13 21 %
26 43 %
61 100 %
42.6 7
H) Other………… 00 00 %
00 00 %
00 00 %
00 00 %
00 00 %
61 100 %
00 N/A
5 = Strongly agree 4 = Agree 3 = Neutral 2 = Disagree 1 = Strongly disagree
Table 19 Reasons for Increased Project OH Costs
1. Delayed payments and financing costs
2. Client requirements
3. Cost inflation
4. Government regulations
5. Lack of new projects
6. Firm’s growth
4.3.3.3 Acceptance of current rate of project OH
The amount of project OH differs from one project to another, which
makes it difficult to sense its acceptance among contractors. However, because
the contractors surveyed usually use government or semi-government contracts
in their projects, project requirements are similar in their nature. Results in Table
20 reflect contractors’ opinion on the issue.
Level of acceptance
Freq Percent
Cum. Freq.
Cum. Percent
Strongly accepted 27 45 27 45
Accepted 13 21 40 66
Neutral 16 26 56 92
Not accepted 05 08 61 100

37
Level of acceptance
Freq Percent
Cum. Freq.
Cum. Percent
Strongly not accepted 00 00 100 100
Table 20 Level of Acceptance of Current Project OH Costs
4.3.4 Distribution of Project OH Cost
Results for project OH distribution are shown in Table 21. Results arrange
types of project OH costs as follows :
Types of project OH costs
0- 5 %
6- 10 %
11- 15 %
16-20 %
Over 20 %
Item not include
d
Index %
Rank
Supervision cost including staff wages
00 00 %
02 03 %
03 05 %
23 38 %
33 54 %
00 00 %
88.6 1
Insurance, taxes & bonds
38 62 %
21 34 %
02 04 %
00 00 %
00 00 %
00 00 %
29.2 7
Estimate contingency & unforeseen conditions
16 26 %
37 61 %
08 13 %
00 00 %
00 00 %
00 00 %
37.4 6
Temporary construction
04 07 %
10 16 %
06 10 %
14 23 %
27 44 %
00 00 %
76.4 3
Cost of rework 00 00 %
00 00 %
00 00 %
00 00 %
00 00 %
61 100 %
28.2* 8
Financing cost 00 00 %
00 00 %
28 46 %
09 15 %
00 00 %
24 39 %
64.8* 4
Profit 00 00 %
07 11 %
00 00 %
00 00 %
00 00 %
54 89 %
40.0* 5
Equipment cost 00 00 %
00 00 %
02 03 %
01 02 %
07 11 %
51 84 %
82.0* 2
Other ……………… 00 00 %
00 00 %
00 00 %
00 00 %
00 00 %
00 00 %
N/A N/A
N=61 0-5 % (very low) =1 & over 20%(very high) =5
* For contractors who include this item as a project OH cost
Table 21 Classification of Project OH Costs

38
1. Supervision costs
2. Equipment costs
3. Temporary constructions
4. Financing costs
5. Profit
6. Estimate contingency and unforeseen conditions
7. Insurance, taxes, and bonds
8. Cost of rework 4.3.5 Estimation of Project OH Costs
4.3.5.1 Estimating project OH costs.
In this question, contractors were asked to identify the method used to
incorporate project OH in the project estimate. Results in Table 22 indicate that
the contractors surveyed use only two methods. The majority estimate project
OH costs directly from the contract documents by checking contract
requirements and estimate resources needed by the project such as manpower
needed to supervise work at the construction site or temporary construction. The
other method uses project total direct costs as a base to calculate project OH costs
and is used by 29 percent of the contractors surveyed.
Methods used to include project OH costs in the project bid
Freq Percent Cum
Freq
Cum. Percent
Estimate from contract documents 42 71 42 71 Relatively fixed amount 00 00 42 71 Percentage of labor cost 00 00 42 71 Percentage of material cost 00 00 42 71 Percentage of material & labor cost 00 00 42 71 Percentage of all direct costs 17 29 59 100 Project OH is not estimated 00 00 59 100

39
Methods used to include project OH costs in the project bid
Freq Percent Cum
Freq
Cum. Percent
Other………………………… 00 00 59 100
Table 22 Method Used to Estimate Project OH Cost
4.3.5.2 Why a particular method to estimate project OH costs is used?
Contractors were also asked why they use these methods to estimate project OH
costs. Answers in Table 23 show that 67 of the contractors do so because contract
documents, particularly contract special conditions and bill of quantities, allow
them to directly or indirectly quantify project OH costs. Another 21 percent of
the surveyed contractors use direct costs as a base for calculating project OH
costs because the two costs are related. Only 12 percent of the respondents gave
other reasons for their philosophy behind using a particular cost estimation
method for project OH costs. In fact, most project OH costs are time-related but
the time factor was not appreciated in contractors’ response.
Reasons why a particular method is used
Freq Percent Cum Freq
Cum. Percent
Projects are similar in nature
04 07 04 07
Project OH is mainly a time related expense
03 05 07 12
Project OH can be easily related to direct costs
13 21 20 33
Contract documents allow for estimation
41 67 61 100
Other ………………………..
00 00 61 100
Table 23 Reasons Behind Using a Particular Method in Estimating
Project OH Costs

40
4.3.5.3 Factors affecting project OH costs Usually, contractors depend upon contract documents and check lists to
figure out project OH costs. But like co. OH costs, there are other factors which
affect contractors’ final decisions in determining project OH costs. These factors
could be contract type, the amount of subcontracted work, project nature,
payment schedule, contractor’s need for work, number of competitors, and
client’s reputation in supervision of the work. Survey results regarding these
factors are presented in table 24:
Factors Affecting project OH
5 4 3 2 1 Tot Index %
Rank
Type of contract 03 05 %
10 16 %
11 18 %
37 61 %
00 00 %
61 100 %
53.2 6
Project complexity, location & size
29 47 %
15 25 %
16 26 %
01 02 %
00 00 %
61 100 %
83.6 1
Need for work 10 16 %
17 28 %
12 20 %
10 16 %
12 20 %
61 100 %
61.0 4
Payment schedule
02 03 %
22 36 %
33 54 %
04 07 %
00 00 %
61 100 %
64.6 3
Contractor cash availability
00 00 %
07 11 %
23 38 %
04 07 %
27 44 %
61 100 %
43.2 8
Client’s strictness in supervision
11 20 %
14 25 %
08 14 %
00 00 %
23 41 %
56 100 %
56.4 5
Subcontracted work ratio
28 46 %
13 21 %
12 20 %
07 11 %
01 02 %
61 100 %
79.6 2
Number of competitors
07 12 %
14 24 %
10 17 %
09 15 %
19 32 %
59 100 %
50.2 7
Other…………… 00 00
00 00
00 00
00 00
00 00
61 100 %
00 N/A
5 = Strongly agree 4 = Agree 3 = Neutral 2 = Disagree 1 = Strongly disagree
Table 24 Factors Affecting the Project OH Costs

41
Results reveal that factors affecting project OH can be arranged in the following
order :
1. Project complexity, location & size
2. Percentage of subcontracted work
3. Payment schedule
4. Need for work
5. Client’s strictness in supervision
6. Type of contract
7. Number of competitors
8. Contractors cash availability
4.3.6 Controlling Project OH Costs
Some project OH costs are to a great extent affected by factors beyond the
contractor’s control. However, there are measures which, if implemented, lead to
reduced project OH costs. In this question, contractors were asked whether they
implement a cost control plan for project OH or not and to explain such plans if
in use. Results are presented in Table 25:
Rate of implementing a cost control plan
Freq Percent Cum. Freq
Cum. Percent
A) Not implemented 47 77 42 69
B) Implemented 14 23 61 100
Table 25 Rate of Implementing a Cost control Plan on Project OH
Costs
The percentage of contractors who claim to implement cost control plans on
project OH costs is only 23 percent whereas the percentage for implementing cost

42
control plans on co. OH costs is 77 percent. However, explanations presented for
such plans only show some common cost reduction measures which cannot
formulate a real cost control plan because they lack the four major components of
any cost control plan: target cost, execution, monitoring, and correction.
Contractors may exert less effort to control project OH costs because they have
the impression that project OH costs are project, not company, driven which
means owners will compensate contractors for them like any other direct costs.
Furthermore, the consequences of high project OH costs are not as serious as
those for co. OH costs. Contractors who implement cost reduction measures
mentioned the following actions :
• accurately estimating project OH costs from documents and check lists in
the first place;
• practicing proper activity planning and scheduling to help in accurately
estimating project duration, which deeply affects supervision and
financing costs;
• proper site management to maintain progress as scheduled and to limit
delays;
• planning for mobilization or temporary constructions, by saving site
offices, camps, and workshops for future projects;
• recruit engineers and supervisors on low wages and deploying the lowest
possible number of staff to administer the project;
• using the client’s available resources whenever possible on a rental basis
rather than arranging for new facilities;
4.3.7 Additional Comments and Recommendations
Participants were asked if they have additional comments or
suggestions regarding project OH costs. Only two contractors answered

43
this question. Their main concern is rising financing and insurance costs,
which was also reported in section 4.2.8 for co. OH costs. These costs
constitute a significant amount (15 to 25 percent for some contractors) of
the project OH cost, yet contractors have no control over them.
5. RECOMMENDATIONS
Based on information found in the reviewed literature and research
findings, the following measures are recommended so that construction
OH costs can be better contained:
5.3.1 Recommendations for Company OH Costs:
1. Contractors need to be better informed about OH costs through
short courses, seminars, professional and scientific societies.
Contractors should be aware of the benefits of reduced co. OH costs
to their organization and to the construction industry. Less OH a
means more efficient organization.
2. Contractors should, practically speaking, plan to maintain optimal
levels of co. OH costs, thus reaching two objectives at the same time:
eliminating unneeded spending and securing or increase the firm’s
market share in accordance with its strategic objectives.
3. Activity based costing can be used to achieve a more accurate
recovery of co. OH costs.
4. Contractors are recommended to establish cost control plans to help
reduce co. OH costs. Such plans should contain cost objectives,
implementation steps, monitoring, and corrective actions.
5. Contractors should not underestimate the benefits of the following
measures in reducing co. OH costs:

44
• maintaining sound safety programs to help reduce insurance
costs;
• increasing cost awareness among their employees, setting group
cost targets with incentive plans and subsequently share the
success with employees to motivate their interest in cost saving
strategies;
• maintaining customer satisfaction via a good reputation, which
helps in obtaining loans and other financial services at lower
costs;
• applying the right combination of resources, which allows
maximum utilization of co. head office manpower.
5.3.2 Recommendations for project OH costs:
1. Contractors and project owners should try to resolve the problem of
delayed payments in order to reduce financing costs.
2. Contractors should implement cost control measures on supervision
costs, equipment costs, temporary constructions, and financing costs, as
these items constitute the major project OH costs.
3. Project owners should minimize OH related requirements in their
contract documents so that project OH costs can be reduced. This would be
of reciprocal benefit to project owners.

45
APPENDIX A: REFERENCES 1. Adrian, J. J. (1979). Construction Accounting. Reston Pub.co., Reston,
VA.
2. Adrian, J. J. (1982 ). Construction Estimating. Reston Pub.co., Reston, VA.
3. Adrian, J. J. (1983). Building Construction Handbook. Reston Pub. co., Reston, VA.
4. Al-Bassam, M. (1996). “Saudi Contracting Section Benefits From Improved Economy”. Asharq Alawsat Newspaper (Arabic), No. 6574 dated 27 Nov. 1996.
5. Al-Dokail, A. (1996). “ Forecasting for Construction Projects for the Coming Five Years ”. Riyadh Newspaper (Arabic), No. 10417 dated 31 Dec. 1996.
6. Al-Jarallah, M. (1983 ). “ Construction Industry in Saudi Arabia ” J. of Const. Eng. & Manag. (ASCE), Vol. 109 , No. 4, 355-368.
7. Azzam, H. (1995). “ Directions in the Saudi Construction Sector”. Asharq Alawsat Newspaper (Arabic), No. 6223 dated 12 Dec. 1995.
8. Barrie, D. and Paulson, B. (1992). Professional Construction Management. McGraw-Hill, Inc., New York, N.Y.
9. Bubshait , A. A. and Al-Musaid, A. A. (1992 ).” Owner Involvement In Construction Projects In Saudi Arabia.” J. of Manag. in Eng. (ASCE), Vol. 8, No. 2, 176-185.
10. Cilensek , R. ( 1991 ). “ Understanding Contractor Overhead.” Cost Engineering (AACE), Vol. 33, No.12, 21-23.
11. Collier, K. (1984 ). Estimating Construction Costs. Reston Pub. co. Inc, Reston, VA.
12. Collier, K. (1974). Fundamentals Of Construction Estimating And Cost Accounting. Prentice-Hall Inc., Englewood Cliffs, NJ
13. Cooper, R. and Kaplan, R. (1988). “Measure Cost Right : Make the Right Decisions”. Harvard Business Review, 96-103.
14. Cooper, R. and Kaplan, R. (1991). The Design of Cost Management System. Prentice-Hall, Inc., Englewood Cliffs, NJ.

46
15. Cushman, R. and Bigda, J. (1985). The McGraw-Hill Construction Business Handbook. McGraw-Hill, Inc., New York, N.Y.
16. Dale, D. (1989). “Controlling Overheads Without Killing The Business”. Australian Accountant, 74-77.
17. Dagostino, F.R.(1989). Estimating In Building Construction. Prentice-Hall, Englewood Cliffs,NJ.
18. Drury, C. (1990). “Product Costing In the 1990s”. Accountancy, 122-126.
19. General Organization for Social Insurance. (1984). Social Insurance Program. Ministry of Work and Social Affairs, Riyadh.
20. Fisk, E. (1992). Construction Project Administration. Prentice Hall, Englewood Cliffs, New Jersey.
21. Franks, J. (1984). Building Sub-contract Management : purpose, tasks, skills, and responsibilities. Construction Press, New York, NY.
22. Fultz, J.F. (1980). Overhead, What It Is and How It Works? Abt Association Inc., Cambridge, MA .
23. Gandhi, K. (1996) “Controlling Overhead Costs” J. of Manag. in Eng. (ASCE), Vol. 12, No. 4, 18-22.
24. Gilbert, N. (1976). Statistics. W. B. Saunders Co., Philadelphia, PA. 19105.
25. Goldman, J. (1990). Means Estimating Handbook. Kingston, Mass. : R. S. Means Co.
26. Helton, J. E. (1985). Simplified Estimating for Builders and Engineers. Prentice-Hall , Englewood Cliffs, N. J.
27. Jones, W. (1996). “A Spreadsheet Checklist to Analyze and Estimate Prime Contractor Overhead”. Cost Engineering (AACE), Vol. 38, No. 8, 22-26.
28. Just, M.R. and Grdgon, M.J. (1992). “Home Office Overhead Recovery in Construction Delay Claim”. AACE Transactions D01-D07.
29. Kangari, R. (1988). “ Business Failure in Construction Industry”. J. of Const. Eng. & Manag. (ASCE), Vol. 114, No. 2, 172-190.
30. Kish, L. (1965). Survey Sampling. John Wiley & Sons Inc., New York, NY.
31. Kish, L. (1995). Survey Sampling. John Wiley & Sons Inc., New York, NY.

47
32. Landeros, R., Reck, R.F., and Griggs, F.T. (1994). “ Evaluating Suppliers’ Overhead Allocations “. Int. J. of Purchasing and Material Management, April 1994, 40-50.
33. Lew, A.E. (1987). Means Interior Estimating. Kingston, Mass. :R. S. Means Co.
34. Ministry of Public Works and Housing (MPWH). (1989). Master List for Saudi Contractors. MPWH Agency for Classification of Contractors, Riyadh 11151.
35. Nelson, D. (1992). “Overhead Under Analysis”. Accountancy, 117-118.
36. Norris, W.E. (1987). “Coping With The Market Place“ J. of Manag. in Eng. (ASCE), Vol. 3, No. 3 , 194-200.
37. O’Brien, J. and Zilly, R. (1971). Contractor’s Management Handbook. McGraw-Hill, Inc., New York, N.Y.
38. Pulver, H. E. (1969). Construction Estimates and Costs. McGraw-Hill, Inc., New York, N.Y.
39. Raffish, N. (1991). “How Much Does That Product Really Cost?”. Management Accounting, 36-39.
40. Sarvi, H. (1992). “ Overhead and Profit On Change Orders” Civil Engineering (ASCE), Vol. 62, No. 8, 59-61.
41. Shash, A. A. and Zamel, S. A. (1993 ). “Construction Cost Control Systems in Saudi Arabia”. AACE Transaction, C.12.1-C.12.8
42. Sheridan, J.H. (1988). “ Attacking Overhead”. Industry Week, July 18. 1988, 49-55.
43. Snodgrass, T. (1991). “ Ideal Overhead : Lean and Mean. “ Credit Union Management, April 1991, 44 -45.
44. Stevens, J.D. and Al-Dulaijan, S.U. (1989) “Contractor Financing, Public Works In Saudi Arabia”. J. of Const. Eng. and Manag. (ASCE), Vol. 115, No. 1 , 1-14.
45. Tatikonda,L.U. and Tatikonda,R.J. (1991). “Overhead Cost Control - Through Allocation Or Elimination?” Production and Inventory Management Journal, 37-41.
46. Tatikonda,L.U. and Tatikonda,R.J. (1993). “ Overhead Cost Containment. “ Internal Auditor, 51-55.
47. Taylor,G.R. (1994). “The Importance of Estimating OH”. Cost Engineering (AACE), Vol. 36, No. 2, 15-18.

48
48. Tipper, H. (1966). Controlling Overhead. American Management Ass, Inc.
49. Tishlias, D. (1992). “How to Measure Your Organization’s Efficiency”. Nonprofit World, Vol. 10, No. 3, 27-31.
50. United Nations. (1982). 1980 Yearbook of National Accounts Statistics. United Nations, New York, N. Y.
51. Walker, F. (1973). Walker. Frank R. Walker Co., Chicago, Ill. 60656.
52. 52. Zaki, M. A. (1992). Enforcing the Role of Construction Insurance in Saudi Arabia. MS Thesis, Construction Engineering and Management Department, King Fahd University of Petroleum and Minerals, Dhahran 31261.