Embed Size (px)
Citation preview
Spark New Zealand Limited ARBN 050 611 277 Spark City, 167 Victoria Street West, Private Bag 92028, Auckland, New Zealand
MARKET RELEASE 18 August 2017
SPARK NEW ZEALAND FY17 RESULTS
Ongoing Spark transformation delivering positive financial results in line with targets • Improved customer experience on back of greater focus on
digitisation and simplification
• Big operational moves and contract wins in FY17 improved long-term positioning of business for the future but added extra cost
Spark New Zealand Chairman Mark Verbiest said today the financial results for the year
ended 30 June 2017 were in line with expectations and mark further positive progress in
its long-term digital transformation.
“It’s been another year of relentless focus on delivering for our customers in very
competitive retail markets and on positioning Spark well for the digital future.”
Reported revenue growth for FY17 was solid at 3.3% taking revenue to $3.614 billion,
on the back of continued strong performances in IT services, up 19.0%, and mobile, up
5.6%. This top-line performance, together with a continued focus on cost, helped to
drive overall earnings before interest, tax and depreciation (EBITDA) growth of 3.0%, to
$1.016 billion. Included in the FY17 EBITDA was a $20 million gain from the sale of
surplus land at Mayoral Drive in Auckland. The shareholder dividend for the full year
was 25 cents per share.
Mr Verbiest said, “The increased EBITDA, combined with a reduction in depreciation,
resulted in overall net earnings increasing a pleasing 13.0% to $418 million. That said,
costs were up on last year, reflecting higher short-term costs needed to successfully
address customer service challenges experienced last winter and to manage the
For
per
sona
l use
onl
y
Spark New Zealand Limited ARBN 050 611 277 Spark City, 167 Victoria Street West, Private Bag 92028, Auckland, New Zealand
workload arising from strong growth in Telecommunications-as-a-Service and IT service
contract wins. In addition, there were costs related to the large-scale migration of
customers off copper to wireless or fibre, and from Yahoo to SMX email.
“While we’re proud of what we have achieved so far, and we’ve continued to execute
our long-term strategy well and deliver good financial results, there are signs that fresh
impetus is needed for the next phase of our transformation.”
Spark Managing Director Simon Moutter said, “Operationally, we have made some big
moves. The successful launch of our ‘Upgrade New Zealand‘ programme saw wireless
broadband connections grow to 84,000 (up 72,000), and fibre connections grow to
172,000 (up 73,000) –meaning around 37% of Spark’s broadband base is now off
copper.
“We also successfully migrated 800,000 customer email accounts safely to New
Zealand-based provider SMX, and entered new partnerships with Netflix and Spark
Arena to complement our Lightbox and Spotify value add-ons.
“We have seen a strong take-up of Telecommunications-as-a-service offerings to
Government with 100+ customers connected to solutions that contribute towards
delivering more customer-centric public services. Importantly, we also made material
improvements in key customer service metrics including call wait times.
“But we still have a long way to go. In an exponentially evolving digital world, where
change is the new normal, the complexity of fast-changing technology has customers
grappling with the pace of change. Meanwhile, customer preference is shifting rapidly to
wireless, enabled by high-speed mobile coverage. In mobile and broadband particularly,
commoditisation pressures mean more and more New Zealanders are buying their
mobile or broadband services based primarily on price.
“Increasingly, the companies most likely to win are those that cut through complexity to
deliver a highly automated and slick digital self-service customer experience, and who
have a simpler proposition to sell, maintain and support than their competitors.
“These are the forces and trends driving Spark to target three new focus areas in its
strategy. First, over the next few years, Spark will put even more resource into radically
For
per
sona
l use
onl
y

Spark New Zealand Limited ARBN 050 611 277 Spark City, 167 Victoria Street West, Private Bag 92028, Auckland, New Zealand
digitising and simplifying our products and services to materially lower our cost of
operating and put more power into the hands of customers.
“Our second new area of focus will be to better leverage all our brands, meeting the
needs of all parts of the market - from those who want services packed with extra value,
to the more price sensitive who want the basics done well with no frills.
“Our third new area of focus will be to meet the growing customer appetite for wireless
technologies. We will increase our emphasis on investment in this area to deliver
improved mobile and wireless broadband services. By 2020 we aim to have 85% of our
broadband customers migrated away from copper onto fibre or wireless technologies.
“At the same time, we will not limit our investment in other areas, including our Optical
Transport Network and associated fibre assets, our Cloud and data centre services and
the migration from the old PSTN network to the new Converged Communications
Network (CCN) that will enable us to deliver the IP-based voice services into the future.”
Mr Verbiest said the future looked bright for Spark. “Spark is in a great position to
navigate the new digital era. We have a strong balance sheet. We have invested well in
fibre and wireless data network leadership.
“Our aim is to accelerate change at Spark, and work hardest where we can make the
biggest difference for our customers. It’s a straightforward game plan. By embracing
simplicity and turning the complex into the easy, we believe we can deliver for our
customers, our shareholders, our people and for New Zealand.”
- ENDS –
For media queries, please contact:
Richard Llewellyn
Head of Corporate Communications +64 (0) 27 523 2362
For investor relations queries, please contact:
Dean Werder
General Manager Finance & Performance +64 (0) 27 259 7176 For
per
sona
l use
onl
y

1
Spark New ZealandFY17 Results SummarySimon Moutter, Managing DirectorDavid Chalmers, Chief Financial Officer
For
per
sona
l use
onl
y
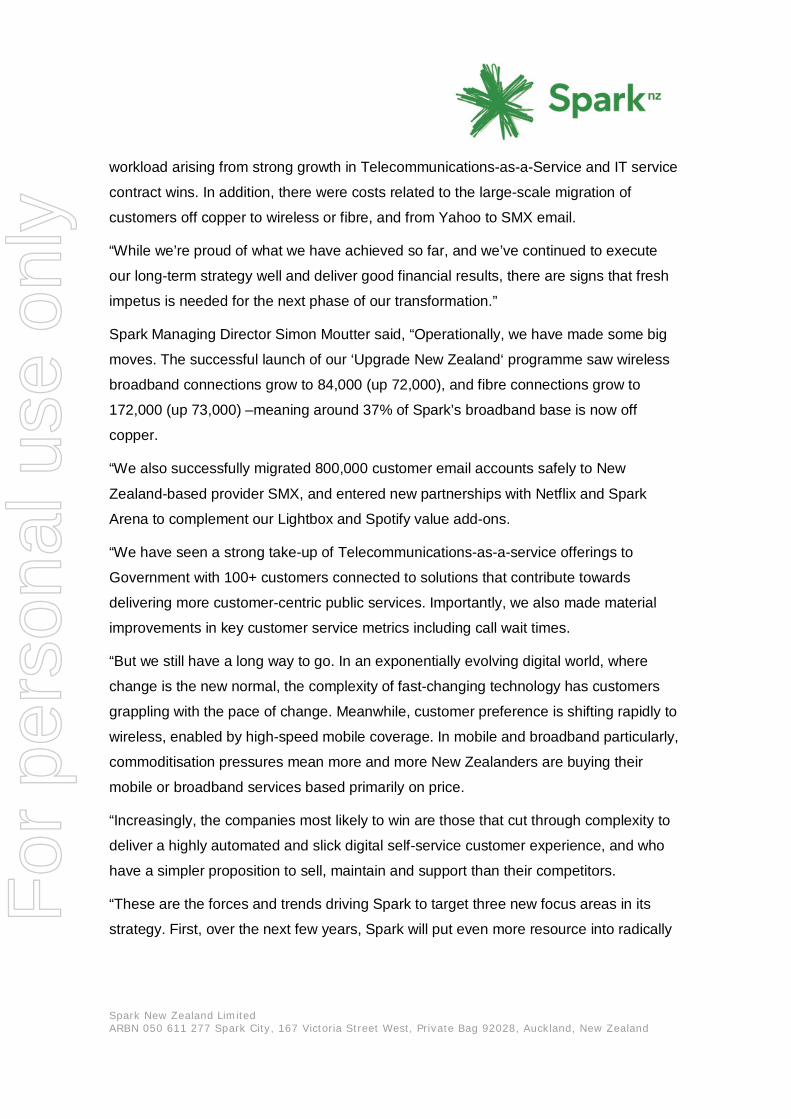
Overall PerformanceFinancial Summary
2
Continued revenue and EBITDA growth driven by mobile and IT servicesAnother period of solid financial performance with all guidance metrics met:• Reported YoY revenue growth of $117m, or 3.3%, taking revenue to $3,614m on
the back of continued strong performances in IT services , up 19.0%(1), and mobile, up 5.6%, further boosted by a $20m net gain from sale of surplus land
• Reported YoY EBITDA growth of $30m, or 3.0%, to $1,016m• Increase in reported EBITDA, combined with a reduction in depreciation, increasing
reported NPAT by $48m YoY, or $13.0%, to $418m
Prudent capital management continues to provide operating and strategic flexibility:• Cash conversion ratio(2) improved to 89% in FY17; H2 FY17 saw average cash
conversion improve to 94% due to cyclical impact of prepayments• FY17 capex at 11.5% of revenue compares favourably to peers and within long
term target of 11% to 12% capex to revenue• Net debt increased by $117m during FY17 but declined by $16m during H2 FY17
due to divestment proceeds and improved cash conversion; current 0.96x gearing(3)
provides ~$270m of debt headroom within our A- credit rating
H2 FY17 total dividend per share of 12.5c will be made up of a fully imputed ordinary dividend per share of 11.0c and a 75% imputed special dividend per share of 1.5c.
Subject to no adverse change in operating outlook Spark anticipates paying a total FY18 dividend per share of 25.0c that is at least 75% imputed. This dividend is likely to be made up of an ordinary dividend determined by earnings, topped up by a special dividend to maintain a total dividend per share of 25.0c
Reported Revenue growth
vs. FY16
3.3%
Reported EBITDA growth
vs. FY16
3.0%
Reported NPAT growth
vs. FY16
13.0%
(1) Includes $22m increase in revenue from having twelve months of CCL Group in FY17 versus seven months in FY16 (acquired in December 2015). YoY IT Services revenue growth excluding annualisation impact from CCL is $103m or 15.7%.(2) calculated as operating cash-flow (adjusted for tax and interest) divided by EBITDA (excluding net gains from sale of Mayoral Drive carpark)(3) calculated as Net Debt/EBITDA
For
per
sona
l use
onl
y
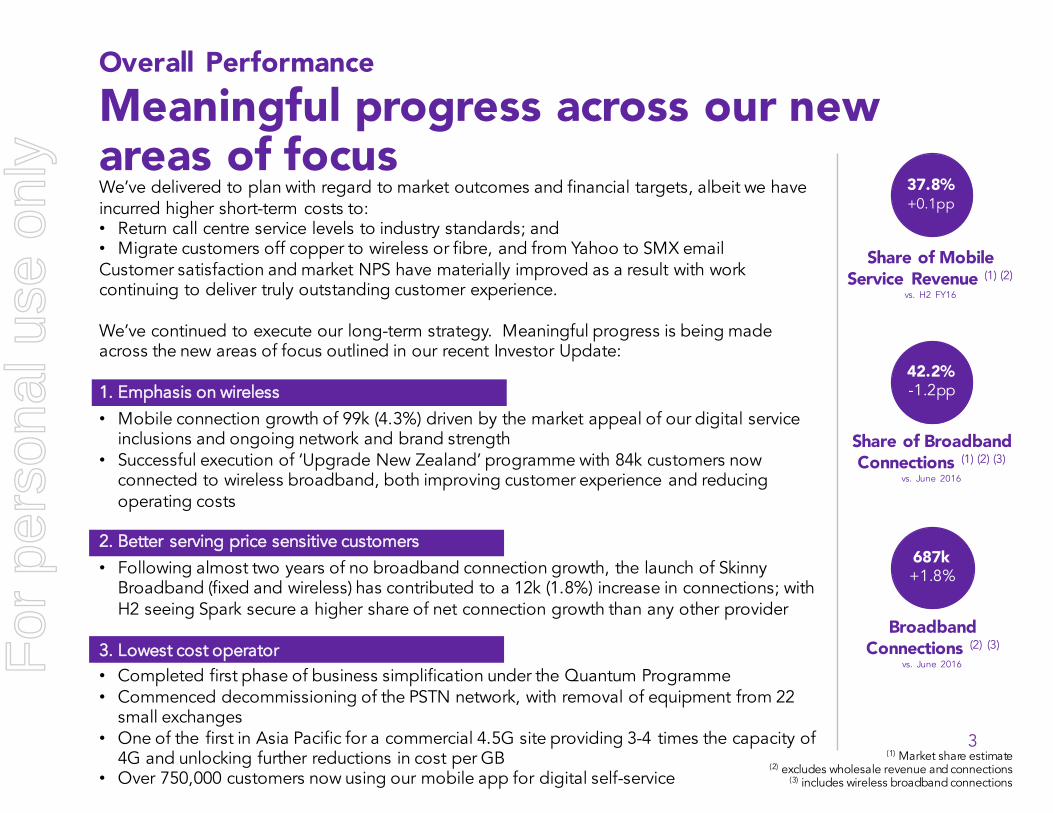
Overall Performance Meaningful progress across our new areas of focus
3
We’ve delivered to plan with regard to market outcomes and financial targets, albeit we have incurred higher short-term costs to:• Return call centre service levels to industry standards; and• Migrate customers off copper to wireless or fibre, and from Yahoo to SMX email Customer satisfaction and market NPS have materially improved as a result with work continuing to deliver truly outstanding customer experience.
We’ve continued to execute our long-term strategy. Meaningful progress is being made across the new areas of focus outlined in our recent Investor Update:
1. Emphasis on wireless
• Mobile connection growth of 99k (4.3%) driven by the market appeal of our digital service inclusions and ongoing network and brand strength
• Successful execution of ‘Upgrade New Zealand’ programme with 84k customers now connected to wireless broadband, both improving customer experience and reducing operating costs
2. Better serving price sensitive customers
• Following almost two years of no broadband connection growth, the launch of Skinny Broadband (fixed and wireless) has contributed to a 12k (1.8%) increase in connections; with H2 seeing Spark secure a higher share of net connection growth than any other provider
3. Lowest cost operator• Completed first phase of business simplification under the Quantum Programme• Commenced decommissioning of the PSTN network, with removal of equipment from 22
small exchanges• One of the first in Asia Pacific for a commercial 4.5G site providing 3-4 times the capacity of
4G and unlocking further reductions in cost per GB• Over 750,000 customers now using our mobile app for digital self-service
Share of Mobile Service Revenue (1) (2)
vs. H2 FY16
37.8%+0.1pp
Share of Broadband Connections (1) (2) (3)
vs. June 2016
42.2%-1.2pp
(1) Market share estimate(2) excludes wholesale revenue and connections
(3) includes wireless broadband connections
Broadband Connections (2) (3)
vs. June 2016
687k+1.8%
For
per
sona
l use
onl
y
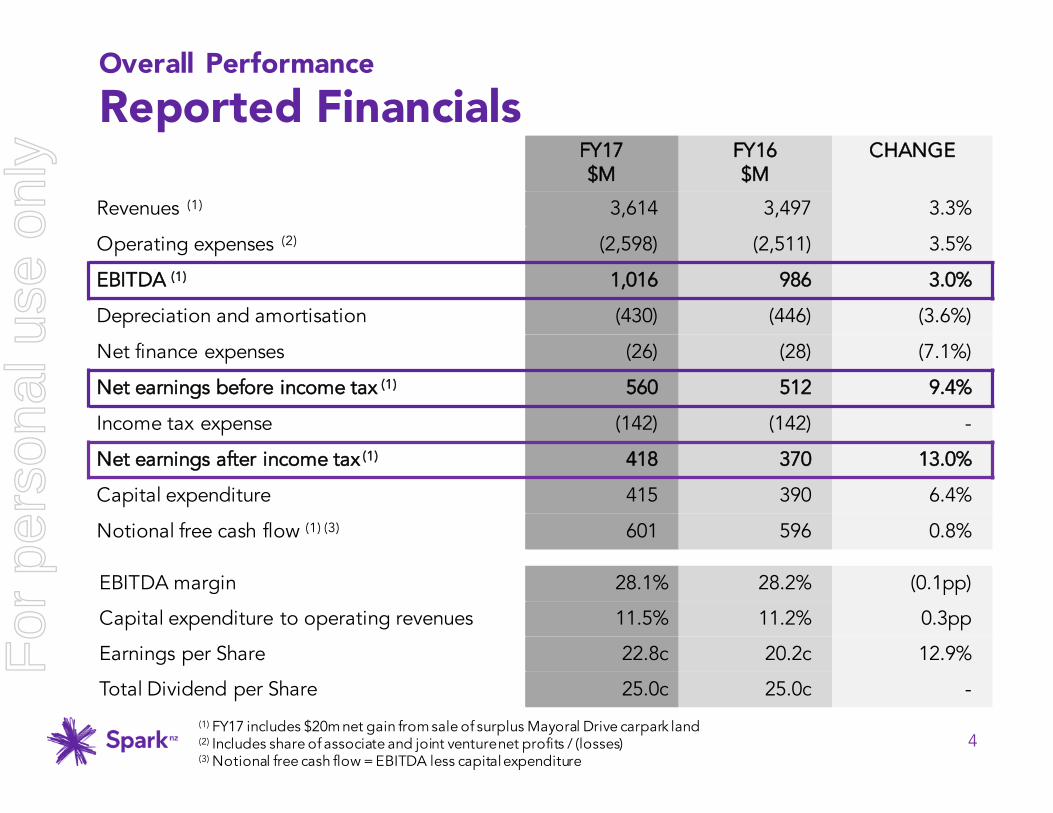
Overall PerformanceReported Financials
4
FY17$M
FY16$M
CHANGE
Revenues (1) 3,614 3,497 3.3%
Operating expenses (2) (2,598) (2,511) 3.5%
EBITDA (1) 1,016 986 3.0%
Depreciation and amortisation (430) (446) (3.6%)
Net finance expenses (26) (28) (7.1%)
Net earnings before income tax (1) 560 512 9.4%
Income tax expense (142) (142) -
Net earnings after income tax (1) 418 370 13.0%
Capital expenditure 415 390 6.4%
Notional free cash flow (1) (3) 601 596 0.8%
EBITDA margin 28.1% 28.2% (0.1pp)
Capital expenditure to operating revenues 11.5% 11.2% 0.3pp
Earnings per Share 22.8c 20.2c 12.9%
Total Dividend per Share 25.0c 25.0c -
(1) FY17 includes $20m net gain from sale of surplus Mayoral Drive carpark land(2) Includes share of associate and joint venture net profits / (losses)(3) Notional free cash flow = EBITDA less capital expenditure
For
per
sona
l use
onl
y

Overall PerformanceRevenue
5
Mobile and IT services revenue growth more than offsetting declines in fixed voice and managed data
Mobile growth driven by:• 4.1% increase in high margin service
revenues off the back of 4.3% growth in total connections
• Improved handset economics following further increases in unsubsidised device sales in HMB and growth in high-end device sales in Digital
IT services growth due to acquisition of CCL and continued transition of major customers to Cloud services
Absolute rate of decline in fixed voice and data slightly higher than prior periods, due to increases in wholesale customer churn
Other revenue growth from: • Progress of Spark Ventures’ businesses; • Full acquisition of Connect8; partially
offset by• Decline in dividends received from
Southern Cross Cables Ltd
3,497
3,393
3,594 3,614
63
125
4 14 20
(80)
(24)
(5)
3,300
3,350
3,400
3,450
3,500
3,550
3,600
3,650
FY16 Voice Managed
Data
Mobile IT services Broadband Other Southern
Cross dividend
Mayoral
Drive carpark
sale
FY17
RevenuesFY16 vs FY17
$m
+ 3.3%
+ 2.8%
(1) Includes $22m increase in revenue from having twelve months of CCL Group in FY17 versus seven months in FY16 (acquired in December 2015). YoY IT Services revenue growth excluding annualisation impact from CCL is $103m or 15.7%.(2) Southern Cross dividends are externally reported within other operating revenue(3) Net gains from sale of surplus Mayoral Drive carpark land are externally reported within other gains
(1)
(3)
(2)For
per
sona
l use
onl
y
2,511
2,598 18
59
53
(22) (12)
(9)
2,400
2,450
2,500
2,550
2,600
2,650
FY16 Fixed voice and
managed data cost of sales
Broadband cost
of sales
Mobile cost of
sales
IT services cost
of sales
Labour Other operating
expenses
FY17
$($m
)
ExpensesFY16 vs FY17
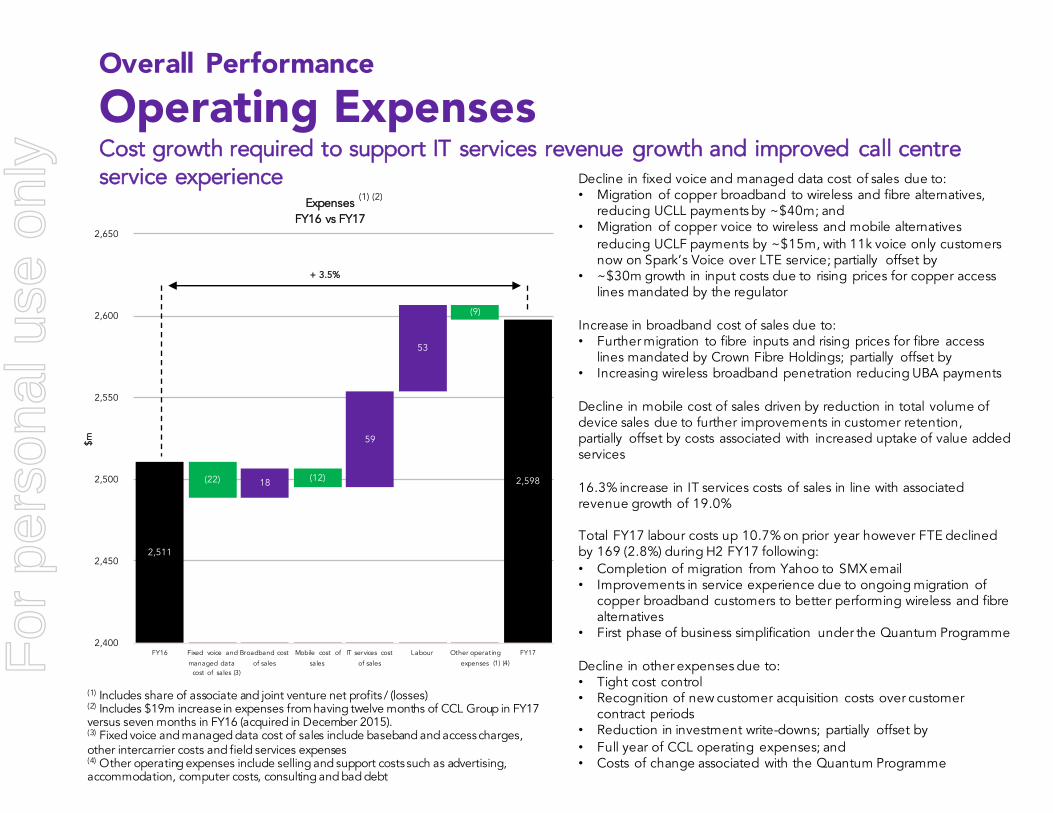
Overall PerformanceOperating Expenses
6
Decline in fixed voice and managed data cost of sales due to:• Migration of copper broadband to wireless and fibre alternatives,
reducing UCLL payments by ~$40m; and• Migration of copper voice to wireless and mobile alternatives
reducing UCLF payments by ~$15m, with 11k voice only customers now on Spark’s Voice over LTE service; partially offset by
• ~$30m growth in input costs due to rising prices for copper access lines mandated by the regulator
Increase in broadband cost of sales due to: • Further migration to fibre inputs and rising prices for fibre access
lines mandated by Crown Fibre Holdings; partially offset by • Increasing wireless broadband penetration reducing UBA payments
Decline in mobile cost of sales driven by reduction in total volume of device sales due to further improvements in customer retention, partially offset by costs associated with increased uptake of value added services
16.3% increase in IT services costs of sales in line with associated revenue growth of 19.0%
Total FY17 labour costs up 10.7% on prior year however FTE declined by 169 (2.8%) during H2 FY17 following:• Completion of migration from Yahoo to SMX email• Improvements in service experience due to ongoing migration of
copper broadband customers to better performing wireless and fibre alternatives
• First phase of business simplification under the Quantum Programme
Decline in other expenses due to:• Tight cost control• Recognition of new customer acquisition costs over customer
contract periods • Reduction in investment write-downs; partially offset by • Full year of CCL operating expenses; and• Costs of change associated with the Quantum Programme
+ 3.5%
Cost growth required to support IT services revenue growth and improved call centre service experience
(1) Includes share of associate and joint venture net profits / (losses)(2) Includes $19m increase in expenses from having twelve months of CCL Group in FY17 versus seven months in FY16 (acquired in December 2015). (3) Fixed voice and managed data cost of sales include baseband and access charges, other intercarrier costs and field services expenses(4) Other operating expenses include selling and support costs such as advertising, accommodation, computer costs, consulting and bad debt
(1) (2)
(1) (4)
$m
(3)For
per
sona
l use
onl
y
986 996
1,016
102
20
(87)
(5)
950
1,000
1,050
1,100
1,150
FY16 Operating revenue
Operating expenses
Southern Cross dividend
Mayoral Drive carpark sale
FY17
$($m
)
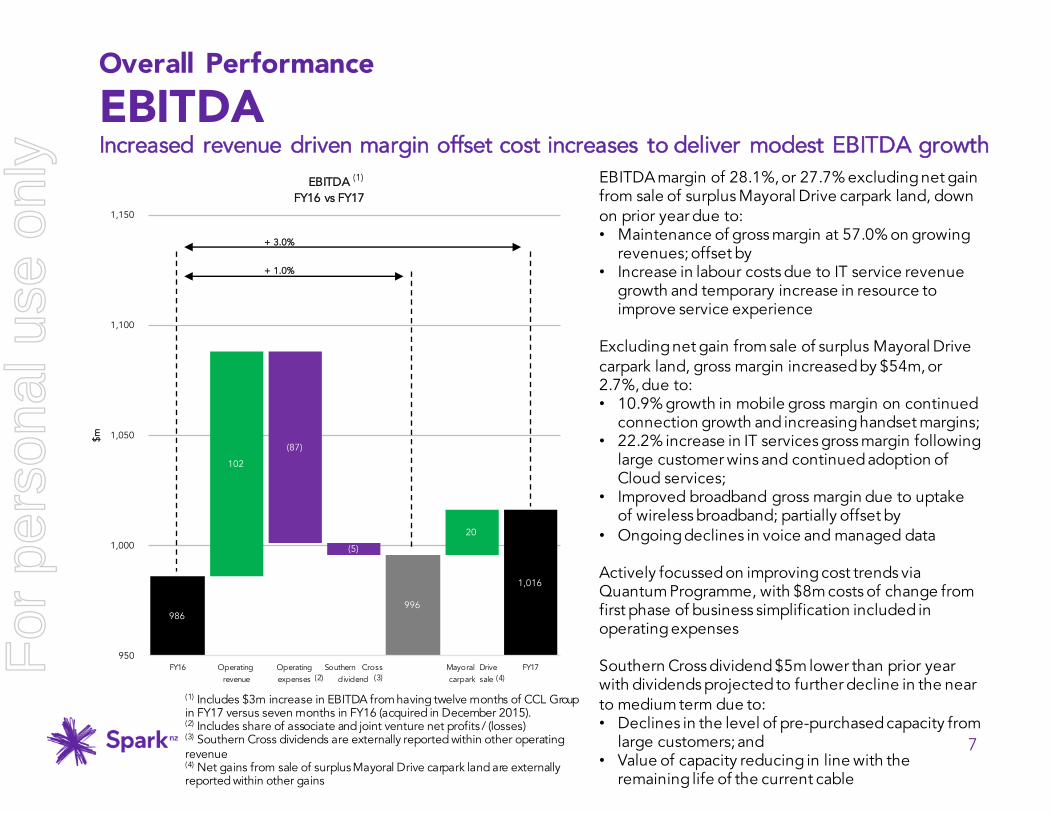
EBITDAFY16 vs FY17
7
Overall PerformanceEBITDAIncreased revenue driven margin offset cost increases to deliver modest EBITDA growth
EBITDA margin of 28.1%, or 27.7% excluding net gain from sale of surplus Mayoral Drive carpark land, down on prior year due to:• Maintenance of gross margin at 57.0% on growing
revenues; offset by• Increase in labour costs due to IT service revenue
growth and temporary increase in resource to improve service experience
Excluding net gain from sale of surplus Mayoral Drive carpark land, gross margin increased by $54m, or 2.7%, due to:• 10.9% growth in mobile gross margin on continued
connection growth and increasing handset margins;• 22.2% increase in IT services gross margin following
large customer wins and continued adoption of Cloud services;
• Improved broadband gross margin due to uptake of wireless broadband; partially offset by
• Ongoing declines in voice and managed data
Actively focussed on improving cost trends via Quantum Programme, with $8m costs of change from first phase of business simplification included in operating expenses
Southern Cross dividend $5m lower than prior year with dividends projected to further decline in the near to medium term due to:• Declines in the level of pre-purchased capacity from
large customers; and• Value of capacity reducing in line with the
remaining life of the current cable
+ 1.0%
+ 3.0%
(1) Includes $3m increase in EBITDA from having twelve months of CCL Group in FY17 versus seven months in FY16 (acquired in December 2015). (2) Includes share of associate and joint venture net profits / (losses)(3) Southern Cross dividends are externally reported within other operating revenue(4) Net gains from sale of surplus Mayoral Drive carpark land are externally reported within other gains
(4)(3)
$m
(1)
(2)
For
per
sona
l use
onl
y
8
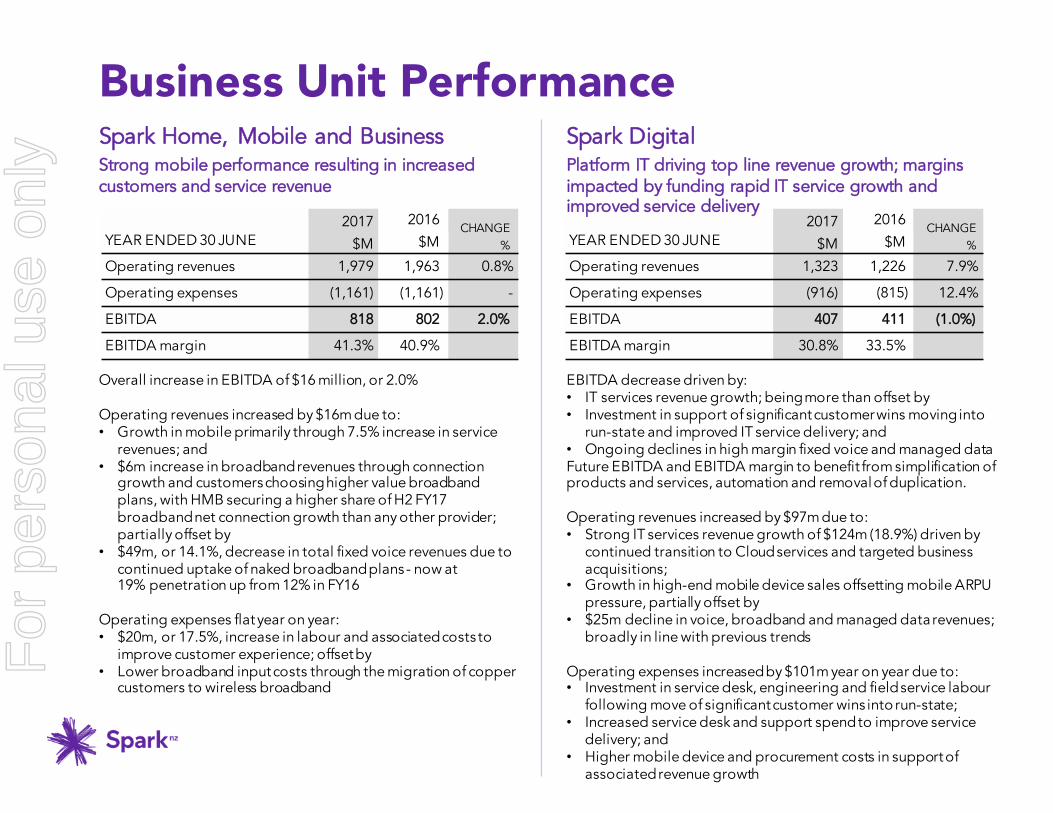
Overall increase in EBITDA of $16 million, or 2.0%
Operating revenues increased by $16m due to:• Growth in mobile primarily through 7.5% increase in service
revenues; and• $6m increase in broadband revenues through connection
growth and customers choosing higher value broadband plans, with HMB securing a higher share of H2 FY17 broadband net connection growth than any other provider; partially offset by
• $49m, or 14.1%, decrease in total fixed voice revenues due to continued uptake of naked broadband plans - now at 19% penetration up from 12% in FY16
Operating expenses flat year on year:• $20m, or 17.5%, increase in labour and associated costs to
improve customer experience; offset by• Lower broadband input costs through the migration of copper
customers to wireless broadband
YEAR ENDED 30 JUNE2017 2016
CHANGE %$M $M
Operating revenues 1,979 1,963 0.8%
Operating expenses (1,161) (1,161) -
EBITDA 818 802 2.0%
EBITDA margin 41.3% 40.9%
Spark Home, Mobile and Business
EBITDA decrease driven by:• IT services revenue growth; being more than offset by• Investment in support of significant customer wins moving into
run-state and improved IT service delivery; and • Ongoing declines in high margin fixed voice and managed dataFuture EBITDA and EBITDA margin to benefit from simplification of products and services, automation and removal of duplication.
Operating revenues increased by $97m due to:• Strong IT services revenue growth of $124m (18.9%) driven by
continued transition to Cloud services and targeted business acquisitions;
• Growth in high-end mobile device sales offsetting mobile ARPU pressure, partially offset by
• $25m decline in voice, broadband and managed data revenues; broadly in line with previous trends
Operating expenses increased by $101m year on year due to: • Investment in service desk, engineering and field service labour
following move of significant customer wins into run-state;• Increased service desk and support spend to improve service
delivery; and• Higher mobile device and procurement costs in support of
associated revenue growth
YEAR ENDED 30 JUNE2017 2016
CHANGE %$M $M
Operating revenues 1,323 1,226 7.9%
Operating expenses (916) (815) 12.4%
EBITDA 407 411 (1.0%)
EBITDA margin 30.8% 33.5%
Spark DigitalPlatform IT driving top line revenue growth; margins impacted by funding rapid IT service growth and improved service delivery
Strong mobile performance resulting in increased customers and service revenue
Business Unit PerformanceF
or p
erso
nal u
se o
nly
9
Business Unit Performance
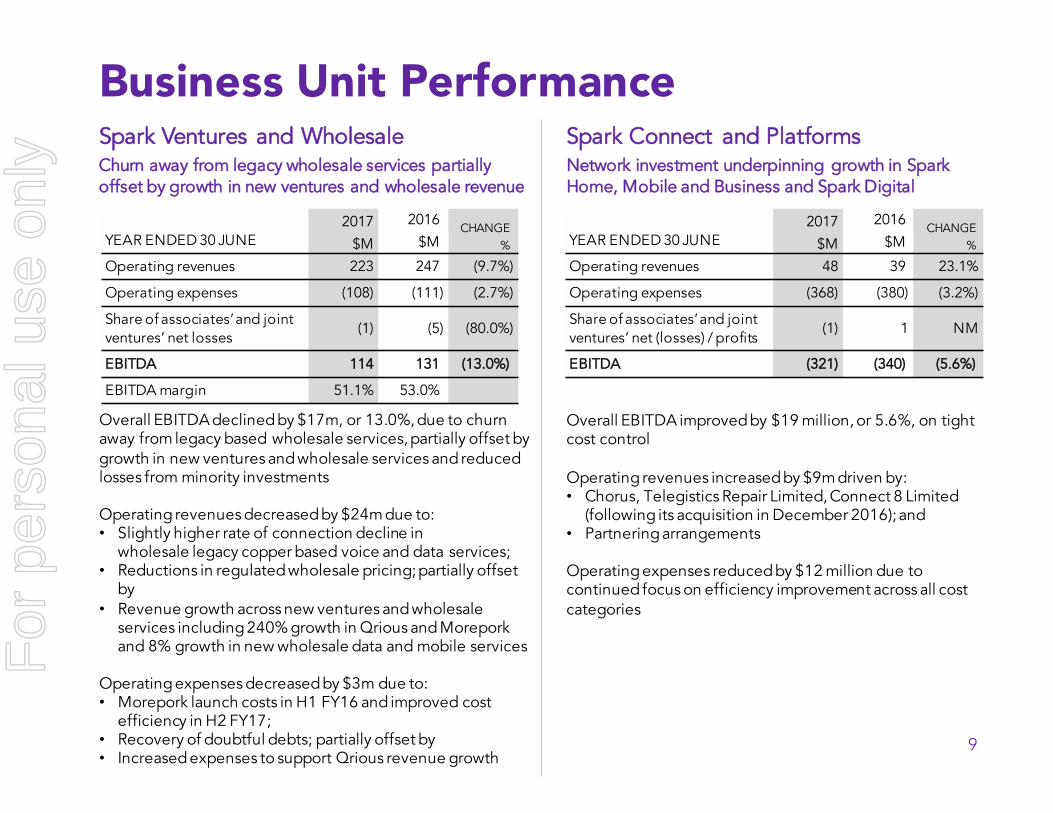
Overall EBITDA declined by $17m, or 13.0%, due to churn away from legacy based wholesale services, partially offset by growth in new ventures and wholesale services and reduced losses from minority investments
Operating revenues decreased by $24m due to:• Slightly higher rate of connection decline in
wholesale legacy copper based voice and data services;• Reductions in regulated wholesale pricing; partially offset
by• Revenue growth across new ventures and wholesale
services including 240% growth in Qrious and Morepork and 8% growth in new wholesale data and mobile services
Operating expenses decreased by $3m due to:• Morepork launch costs in H1 FY16 and improved cost
efficiency in H2 FY17;• Recovery of doubtful debts; partially offset by • Increased expenses to support Qrious revenue growth
YEAR ENDED 30 JUNE2017 2016
CHANGE %$M $M
Operating revenues 223 247 (9.7%)
Operating expenses (108) (111) (2.7%)
Share of associates’ and joint ventures’ net losses
(1) (5) (80.0%)
EBITDA 114 131 (13.0%)
EBITDA margin 51.1% 53.0%
Spark Ventures and Wholesale
Overall EBITDA improved by $19 million, or 5.6%, on tight cost control
Operating revenues increased by $9m driven by:• Chorus, Telegistics Repair Limited, Connect 8 Limited
(following its acquisition in December 2016); and • Partnering arrangements
Operating expenses reduced by $12 million due to continued focus on efficiency improvement across all cost categories
YEAR ENDED 30 JUNE2017 2016
CHANGE %$M $M
Operating revenues 48 39 23.1%
Operating expenses (368) (380) (3.2%)
Share of associates’ and joint ventures’ net (losses) / profits
(1) 1 NM
EBITDA (321) (340) (5.6%)
Spark Connect and PlatformsNetwork investment underpinning growth in Spark Home, Mobile and Business and Spark Digital
Churn away from legacy wholesale services partially offset by growth in new ventures and wholesale revenue
For
per
sona
l use
onl
y
24% 28% 35%
0%
20%
40%
60%
80%
100%
June 2015 June 2016 June 2017
HMB pay-monthly plan mix
less than $55 $55 or greater
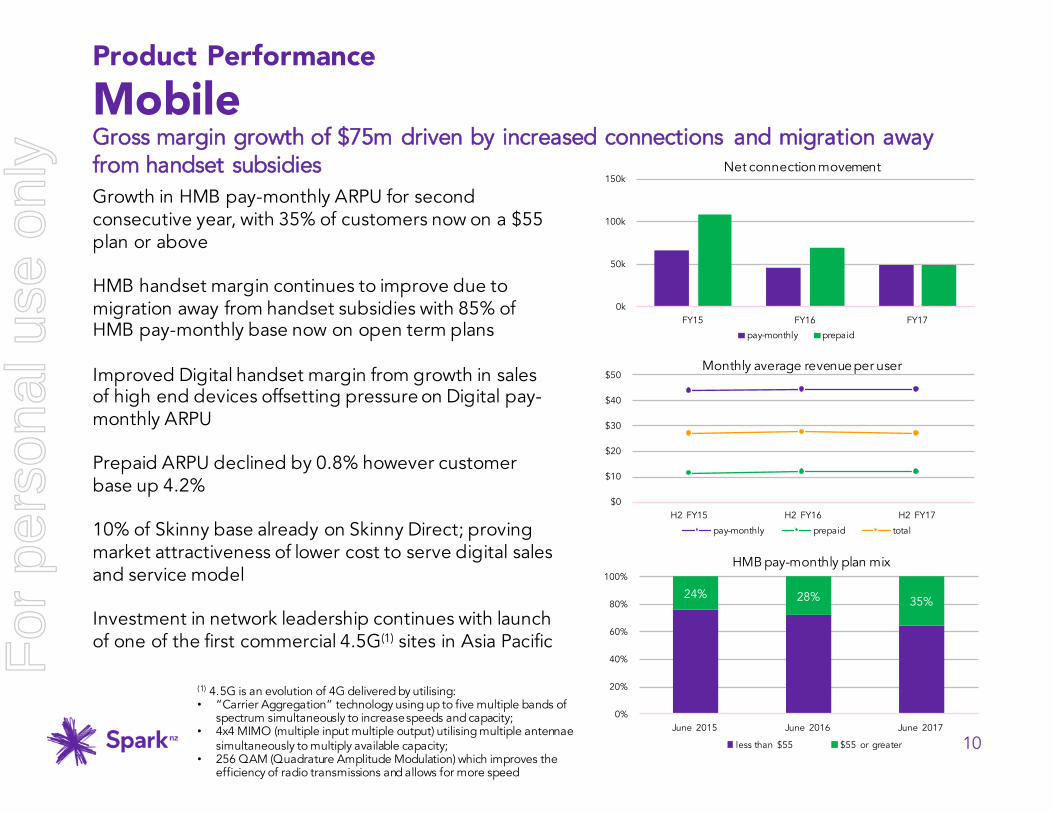
Product PerformanceMobile
10
Growth in HMB pay-monthly ARPU for secondconsecutive year, with 35% of customers now on a $55 plan or above
HMB handset margin continues to improve due to migration away from handset subsidies with 85% of HMB pay-monthly base now on open term plans
Improved Digital handset margin from growth in sales of high end devices offsetting pressure on Digital pay-monthly ARPU
Prepaid ARPU declined by 0.8% however customer base up 4.2%
10% of Skinny base already on Skinny Direct; proving market attractiveness of lower cost to serve digital sales and service model
Investment in network leadership continues with launch of one of the first commercial 4.5G(1) sites in Asia Pacific
Gross margin growth of $75m driven by increased connections and migration away from handset subsidies
$667m
$736m
0k
50k
100k
150k
FY15 FY16 FY17
Net connection movement
pay-monthly prepaid
(1) 4.5G is an evolution of 4G delivered by utilising: • “Carrier Aggregation” technology using up to five multiple bands of
spectrum simultaneously to increase speeds and capacity;• 4x4 MIMO (multiple input multiple output) utilising multiple antennae
simultaneously to multiply available capacity;• 256 QAM (Quadrature Amplitude Modulation) which improves the
efficiency of radio transmissions and allows for more speed
$0
$10
$20
$30
$40
$50
H2 FY15 H2 FY16 H2 FY17
Monthly average revenue per user
pay-monthly prepaid total
For
per
sona
l use
onl
y
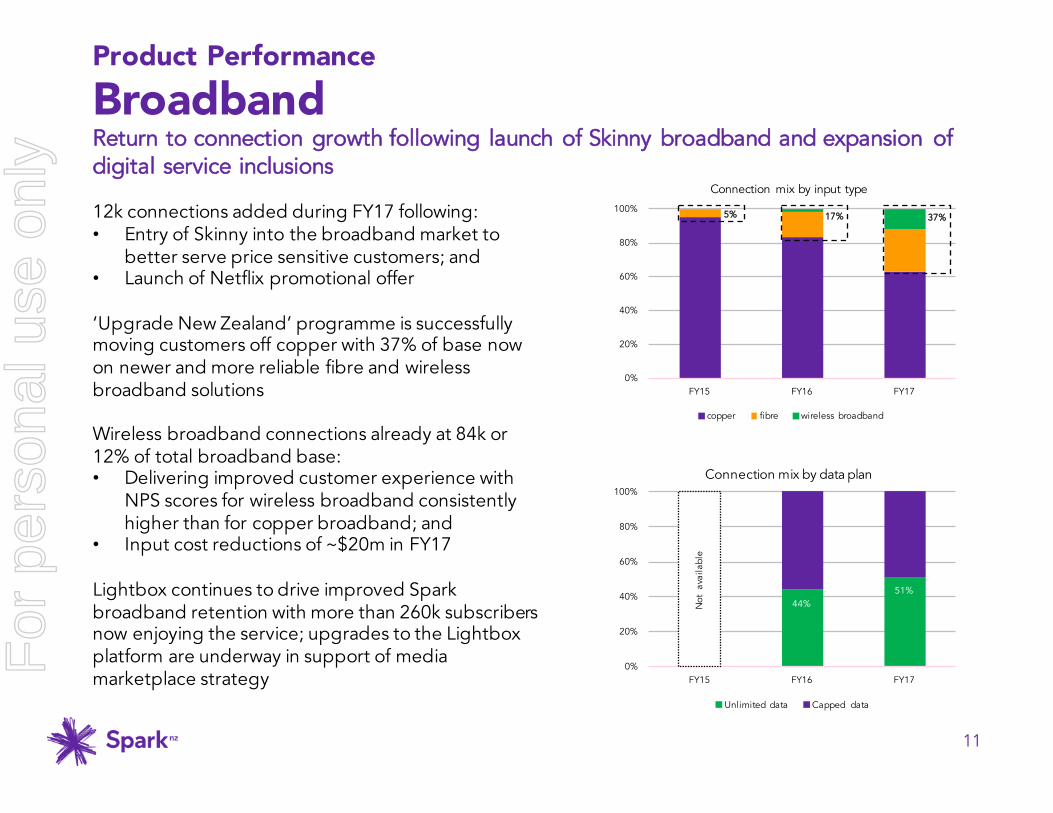
Product PerformanceBroadband
11
12k connections added during FY17 following:• Entry of Skinny into the broadband market to
better serve price sensitive customers; and• Launch of Netflix promotional offer
‘Upgrade New Zealand’ programme is successfully moving customers off copper with 37% of base now on newer and more reliable fibre and wireless broadband solutions
Wireless broadband connections already at 84k or 12% of total broadband base:• Delivering improved customer experience with
NPS scores for wireless broadband consistently higher than for copper broadband; and
• Input cost reductions of ~$20m in FY17
Lightbox continues to drive improved Spark broadband retention with more than 260k subscribers now enjoying the service; upgrades to the Lightbox platform are underway in support of media marketplace strategy
Return to connection growth following launch of Skinny broadband and expansion of digital service inclusions
$667m60%
$736m63%
5% 17% 37%
0%
20%
40%
60%
80%
100%
FY15 FY16 FY17
Connection mix by input type
copper fibre wireless broadband
44%51%
0%
20%
40%
60%
80%
100%
FY15 FY16 FY17
Connection mix by data plan
Unlimited data Capped dataN
ot a
vaila
ble
For
per
sona
l use
onl
y

Product EconomicsBroadband
12
Mandated increases in wholesale access charges are taking effect every year up to 2019:• $1.00 plus GST extra for most fibre inputs each
July since 2015 (schedule of annual increases built into initial UFB contracts with Chorus/LFCs)
• ~$0.30 plus GST extra for Chorus copper inputs each December since 2016 (part of ComComFPP determination in Dec 2015)
On top of these increases, the retail market for fibre plans has also moved to more expensive higher speed inputs:• “100 is the new 30”• Fibre 100/20 Mbps input $2.50 - $4.50 more
expensive than 30/10 (cost varies between Chorus/ LFCs)
Higher wholesale access charges are squeezing retail margins even harder at the lower end of the market:• Wholesale charges now account for almost two-
thirds of the price of a basic broadband plan (up from about half of the price of a basic broadband plan two years ago)
Higher wholesale access charges for both fibre and copper are putting further pressure on broadband retail margins in a fiercely competitive market
$667m60%
$736m63%
*Chorus 100/20 fibre charge. Skinny uses fastest fixed input available up to 100/20 Mbps (fibre, VDSL or ADSL). Charges range $41.44 to $45.00 depending on input.
For
per
sona
l use
onl
y
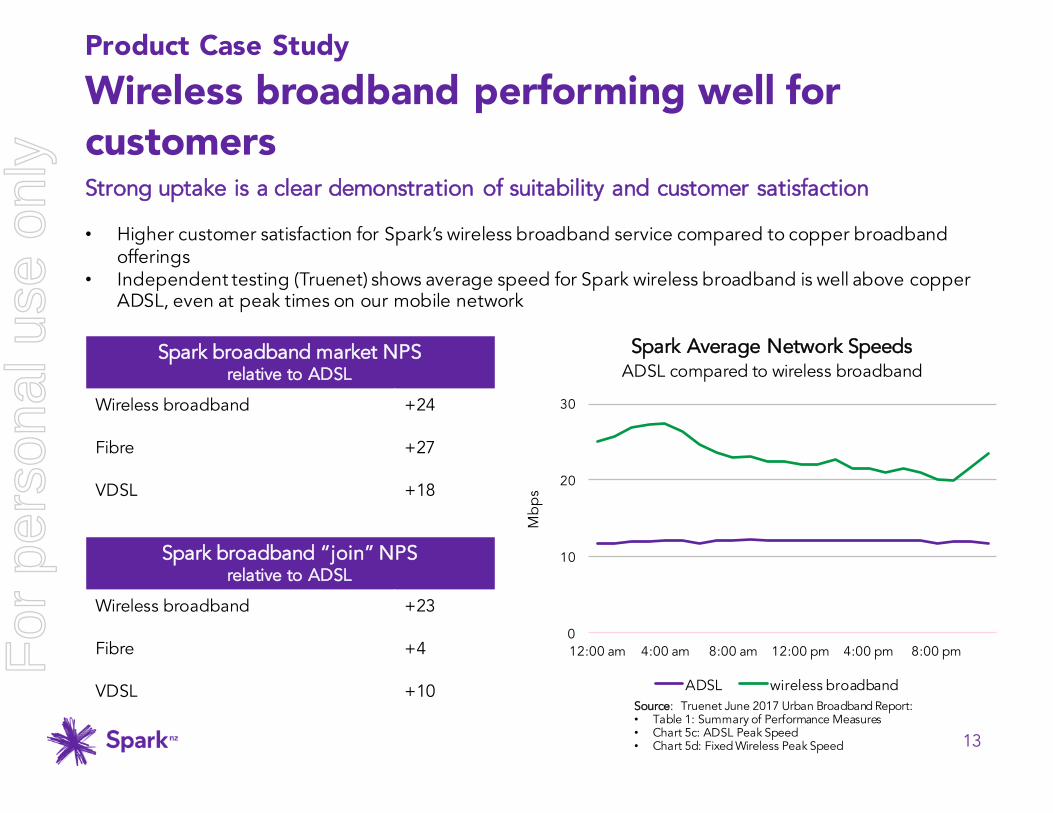
Product Case StudyWireless broadband performing well for customers
13
$667m60%
$736m63%
• Higher customer satisfaction for Spark’s wireless broadband service compared to copper broadband offerings
• Independent testing (Truenet) shows average speed for Spark wireless broadband is well above copper ADSL, even at peak times on our mobile network
Spark broadband market NPS relative to ADSL
Wireless broadband +24
Fibre +27
VDSL +18
Spark broadband “join” NPS relative to ADSL
Wireless broadband +23
Fibre +4
VDSL +10
Strong uptake is a clear demonstration of suitability and customer satisfaction
0
10
20
30
12:00 am 4:00 am 8:00 am 12:00 pm 4:00 pm 8:00 pm
Mb
ps
Spark Average Network SpeedsADSL compared to wireless broadband
ADSL wireless broadbandSource: Truenet June 2017 Urban Broadband Report:• Table 1: Summary of Performance Measures• Chart 5c: ADSL Peak Speed• Chart 5d: Fixed Wireless Peak Speed
For
per
sona
l use
onl
y
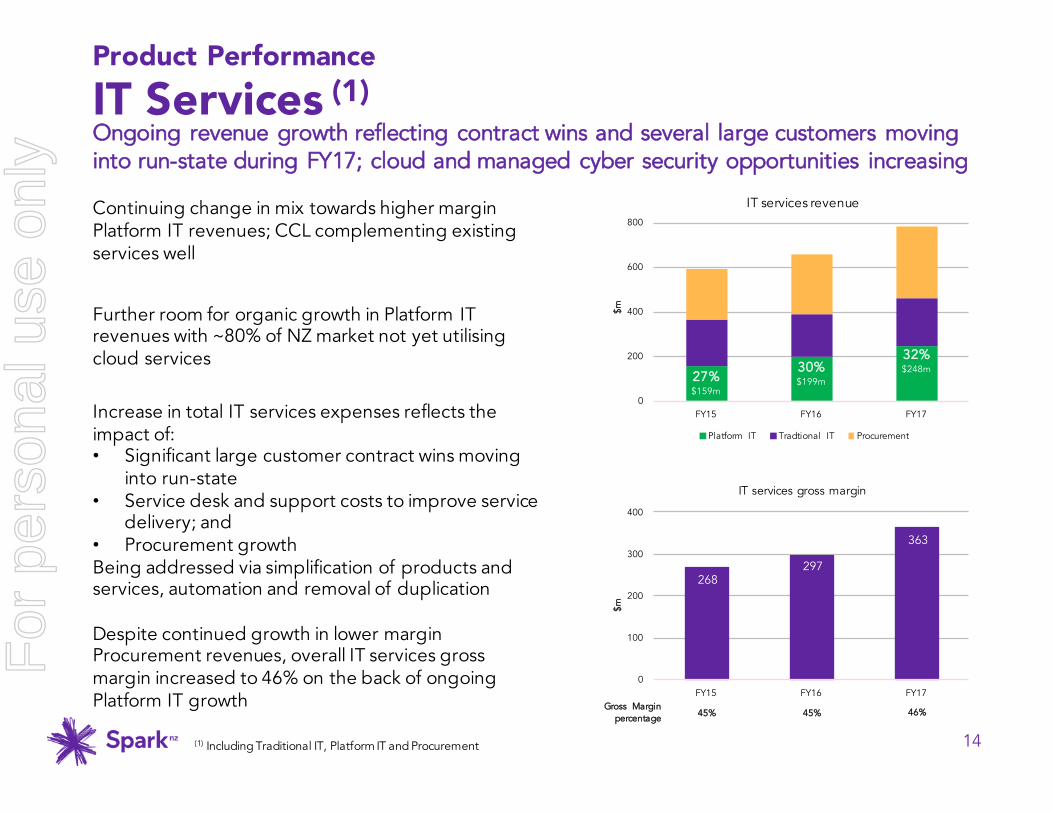
Product PerformanceIT Services (1)
14
Continuing change in mix towards higher margin Platform IT revenues; CCL complementing existing services well
Further room for organic growth in Platform IT revenues with ~80% of NZ market not yet utilising cloud services
Increase in total IT services expenses reflects the impact of:• Significant large customer contract wins moving
into run-state• Service desk and support costs to improve service
delivery; and• Procurement growthBeing addressed via simplification of products and services, automation and removal of duplication
Despite continued growth in lower margin Procurement revenues, overall IT services gross margin increased to 46% on the back of ongoing Platform IT growth
Ongoing revenue growth reflecting contract wins and several large customers moving into run-state during FY17; cloud and managed cyber security opportunities increasing
$605m60%
$667m60%
0
200
400
600
800
FY15 FY16 FY17
IT services revenue
Platform IT Tradtional IT Procurement
$m
268 297
363
0
100
200
300
400
FY15 FY16 FY17
IT services gross margin
$m
30%$199m
32%$248m
27%$159m
Gross Margin percentage 45% 45% 46%
(1) Including Traditional IT, Platform IT and Procurement
For
per
sona
l use
onl
y

Product PerformanceFixed Voice and Managed Data
15
Total fixed voice and managed data revenues declined by $104m (12.0%) in FY17; versus a $90m (9.4%) decline in FY16(1)
FY17 voice revenue (2) decline of $80m (11.7%) higher than prior period:• Good performance in newer product revenues
with 11k voice only connections already on Spark’s Voice over LTE service; more than offset by
• 7pp increase in adoption of naked broadband offerings – now at 19% penetration of total broadband base;
• Increased wholesale PSTN churn
FY17 managed data revenue decline of $24m (12.8%) higher than prior period due to:• Accelerated migration of business and
wholesale customers off higher margin copper based products to lower margin fibre based products
Recent acceleration in rate of decline, due to continued adoption of naked broadband plans and migration away from traditional data products
$605m60%
$667m60%
(1) FY16 revenues normalised for divestment of International Voice business and change in primary service(2) Voice revenue includes connections delivered over the mobile network (Voice over LTE)
0
200
400
600
800
FY15 FY16 FY17
Total voice revenue
HMB Digital Wholesale Other
0
50
100
150
200
250
FY15 FY16 FY17
Total managed data revenue
Digital Wholesale
$m$m
751681
601
164
188
208
For
per
sona
l use
onl
y
16
$605m60%
$667m60%
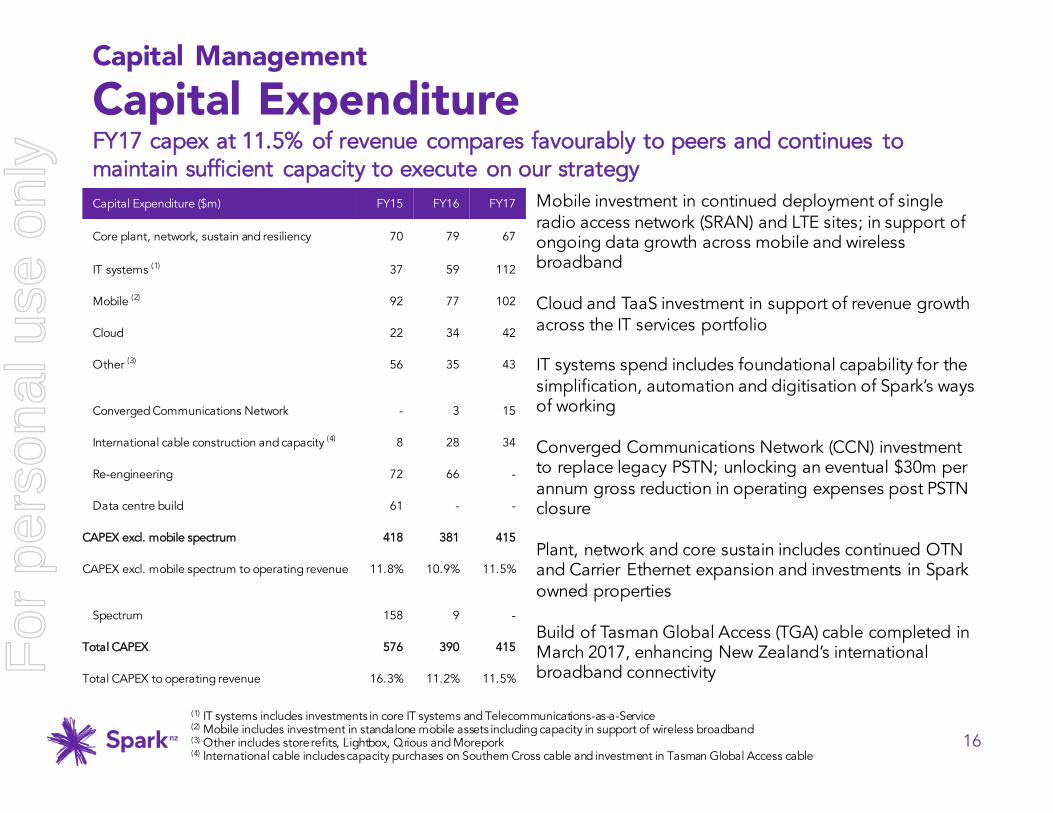
Capital ManagementCapital Expenditure
Mobile investment in continued deployment of single radio access network (SRAN) and LTE sites; in support of ongoing data growth across mobile and wireless broadband
Cloud and TaaS investment in support of revenue growth across the IT services portfolio
IT systems spend includes foundational capability for the simplification, automation and digitisation of Spark’s ways of working
Converged Communications Network (CCN) investment to replace legacy PSTN; unlocking an eventual $30m per annum gross reduction in operating expenses post PSTN closure
Plant, network and core sustain includes continued OTN and Carrier Ethernet expansion and investments in Spark owned properties
Build of Tasman Global Access (TGA) cable completed in March 2017, enhancing New Zealand’s international broadband connectivity
FY17 capex at 11.5% of revenue compares favourably to peers and continues to maintain sufficient capacity to execute on our strategy
(1) IT systems includes investments in core IT systems and Telecommunications-as-a-Service(2) Mobile includes investment in standalone mobile assets including capacity in support of wireless broadband(3) Other includes store refits, Lightbox, Qrious and Morepork(4) International cable includes capacity purchases on Southern Cross cable and investment in Tasman Global Access cable
Capital Expenditure ($m) FY15 FY16 FY17
Core plant, network, sustain and resiliency 70 79 67
IT systems (1) 37 59 112
Mobile (2) 92 77 102
Cloud 22 34 42
Other (3) 56 35 43
Converged Communications Network - 3 15
International cable construction and capacity (4) 8 28 34
Re-engineering 72 66 -
Data centre build 61 - -
CAPEX excl. mobile spectrum 418 381 415
CAPEX excl. mobile spectrum to operating revenue 11.8% 10.9% 11.5%
Spectrum 158 9 -
Total CAPEX 576 390 415
Total CAPEX to operating revenue 16.3% 11.2% 11.5%
For
per
sona
l use
onl
y
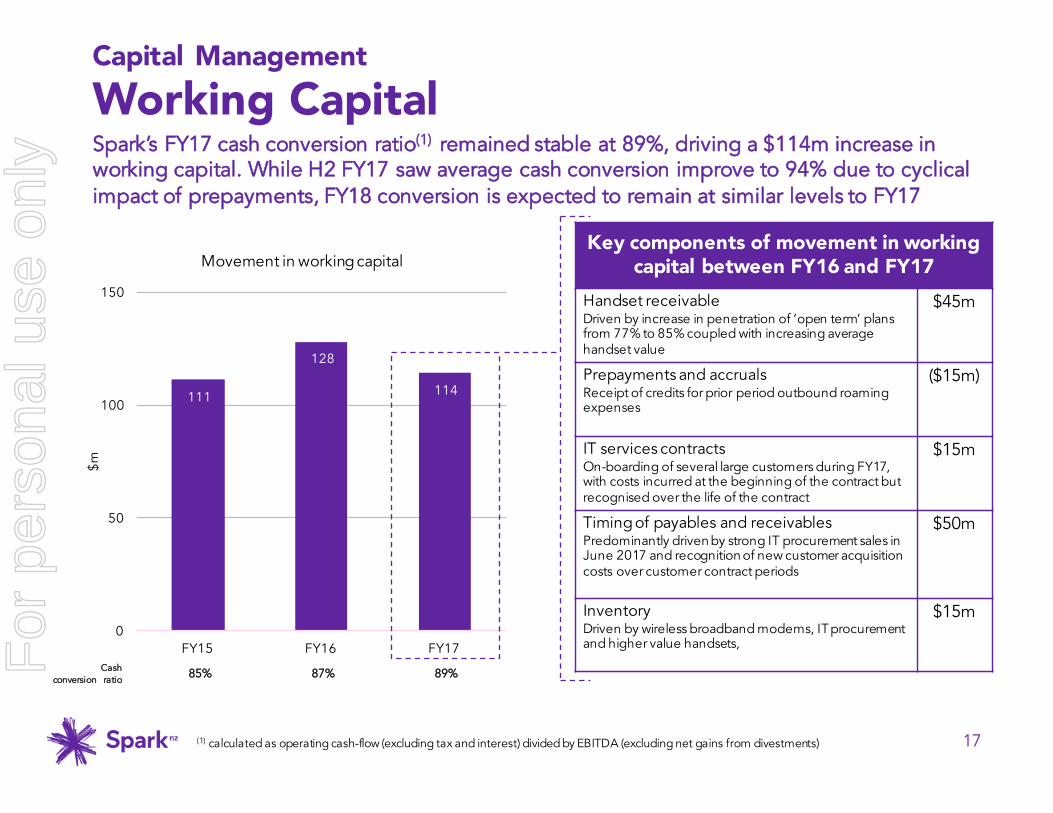
111
128
114
0
50
100
150
FY15 FY16 FY17
$m
Movement in working capital
17
$667m60%
Capital ManagementWorking CapitalSpark’s FY17 cash conversion ratio(1) remained stable at 89%, driving a $114m increase in working capital. While H2 FY17 saw average cash conversion improve to 94% due to cyclical impact of prepayments, FY18 conversion is expected to remain at similar levels to FY17
(1) calculated as operating cash-flow (excluding tax and interest) divided by EBITDA (excluding net gains from divestments)
Key components of movement in working capital between FY16 and FY17
Handset receivableDriven by increase in penetration of ‘open term’ plans from 77% to 85% coupled with increasing average handset value
$45m
Prepayments and accrualsReceipt of credits for prior period outbound roaming expenses
($15m)
IT services contracts On-boarding of several large customers during FY17,with costs incurred at the beginning of the contract but recognised over the life of the contract
$15m
Timing of payables and receivablesPredominantly driven by strong IT procurement sales in June 2017 and recognition of new customer acquisition costs over customer contract periods
$50m
Inventory Driven by wireless broadband modems, IT procurement and higher value handsets,
$15m
Cash conversion ratio 85% 87% 89%F
or p
erso
nal u
se o
nly
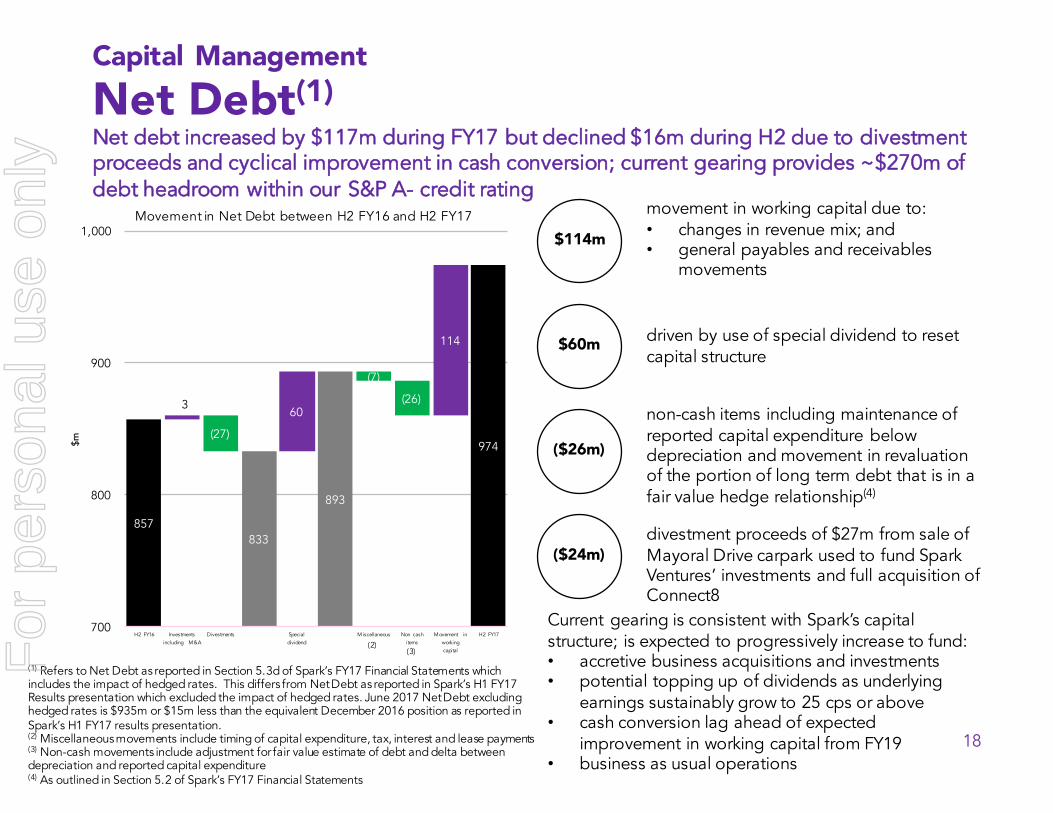
857 833
893
974
3 60
114
(27)
(7)
(26)
700
800
900
1,000
H2 FY16 Investments including M&A
Divestments Special dividend
Miscellaneous Non cash items
Movement in working capital
H2 FY17
Movement in Net Debt between H2 FY16 and H2 FY17
18
$667m60%
Capital ManagementNet Debt(1)Net debt increased by $117m during FY17 but declined $16m during H2 due to divestment proceeds and cyclical improvement in cash conversion; current gearing provides ~$270m of debt headroom within our S&P A- credit rating
Current gearing is consistent with Spark’s capital structure; is expected to progressively increase to fund:• accretive business acquisitions and investments• potential topping up of dividends as underlying
earnings sustainably grow to 25 cps or above• cash conversion lag ahead of expected
improvement in working capital from FY19• business as usual operations
$114m
$60m
movement in working capital due to:• changes in revenue mix; and• general payables and receivables
movements
driven by use of special dividend to resetcapital structure
non-cash items including maintenance of reported capital expenditure below depreciation and movement in revaluation of the portion of long term debt that is in a fair value hedge relationship(4)
divestment proceeds of $27m from sale of Mayoral Drive carpark used to fund Spark Ventures’ investments and full acquisition of Connect8
$m ($26m)
($24m)
(1) Refers to Net Debt as reported in Section 5.3d of Spark’s FY17 Financial Statements which includes the impact of hedged rates. This differs from Net Debt as reported in Spark’s H1 FY17 Results presentation which excluded the impact of hedged rates. June 2017 Net Debt excluding hedged rates is $935m or $15m less than the equivalent December 2016 position as reported in Spark’s H1 FY17 results presentation.(2) Miscellaneous movements include timing of capital expenditure, tax, interest and lease payments (3) Non-cash movements include adjustment for fair value estimate of debt and delta between depreciation and reported capital expenditure(4) As outlined in Section 5.2 of Spark’s FY17 Financial Statements
(2)(3)F
or p
erso
nal u
se o
nly
19
$667m60%
Capital ManagementDividendOur preferred method of shareholder distribution is to sustainably grow total dividends over time in line with earnings growth
As part of our recent Investor Update we outlined our dividend aspiration:• To deliver a sustainable total dividend that is fully
funded by earnings per share of 25c or above -timing uncertain
• While earnings per share remain below 25c Spark may choose to use debt to supplement earnings
The primary use of any debt to supplement earnings per share will therefore change:• from resetting capital structure• to topping up dividends as underlying earnings
sustainably grow to 25 cps or above
Spark also confirms:• H2 FY17 ordinary dividend per share of 11.0c to be
fully imputed• H2 FY17 special dividend per share of 1.5c to be
75% imputed
16
17
20
22
22
3
3
FY13
FY14
FY15
FY16
FY17
Dividend payout (cps)
Ordinary Special
For
per
sona
l use
onl
y
20
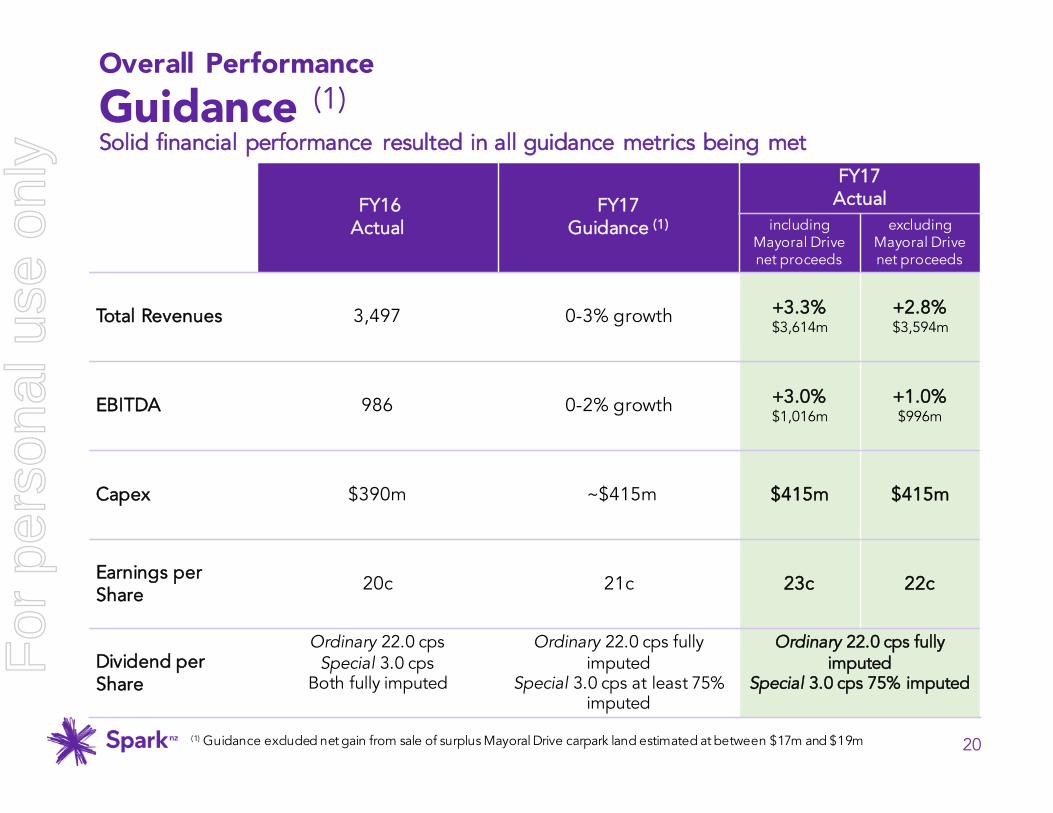
FY16 Actual
FY17 Guidance (1)
FY17 Actual
including Mayoral Drive net proceeds
excluding Mayoral Drive net proceeds
Total Revenues 3,497 0-3% growth +3.3%$3,614m
+2.8%$3,594m
EBITDA 986 0-2% growth +3.0% $1,016m
+1.0% $996m
Capex $390m ~$415m $415m $415m
Earnings per Share
20c 21c 23c 22c
Dividend per Share
Ordinary 22.0 cpsSpecial 3.0 cps
Both fully imputed
Ordinary 22.0 cps fully imputed
Special 3.0 cps at least 75% imputed
Ordinary 22.0 cps fully imputed
Special 3.0 cps 75% imputed
(1) Guidance excluded net gain from sale of surplus Mayoral Drive carpark land estimated at between $17m and $19m
Overall PerformanceGuidance (1)Solid financial performance resulted in all guidance metrics being met
For
per
sona
l use
onl
y

21
Desired Outcome Measures Target 30 June 2017
Actual 30 June 2017
Restore call centre service levels to world class
Answer Time 90% in 180 seconds Materially Improved but not yet achieved
First call resolution 75% Materially Improved but not yet achieved
Advance toward amazing customer experiencesthrough digital sales and service
Market NPS 5 point lift Achieved
Reduction in call volumes 7.5% reduction Exceeded
Launch a new, more feature rich Spark App Q3 FY17 Achieved
Introduce pro-active faults management for mass market Q3 FY17 Achieved
Adopt and scale dev-ops model Adopt H1 FY17; Scale H2 FY17 Achieved
Average daily log-ins to Spark App 20% increase Materially Improved but not yet achieved
Proportion of Skinny sales via Digital Channels 10% Exceeded
Expand margins and improve service experience through reduced reliance on third party access
Drive uptake of Wireless Broadband 70,000 connections Exceeded
Implement ‘owned’ CBD fibre model AKL and WLG CBDs ‘owned’ Not yet achieved
Expand coverage of 4G 95% population Achieved
Maintain revenue growth momentum to deliver long-term sustainable growth
Market share of UFB orders 45% Not achieved but getting close in Q4
Mobile total revenue growth 5% Exceeded
Platform IT revenue growth 20% Exceeded
Proportion of BB and Mobile customers using inclusions 20% Exceeded
Enter adjacent high-growth market Significant entry into one additional market
Considering options
Overall PerformanceIndicators of Success Focus on execution and targeted investment has driven improvement in key metrics; work continues on service experience, ‘owned’ CBD fibre and adjacencies
For
per
sona
l use
onl
y

Strategy UpdateThree key insights are motivating our next strategic moves
22
Rapid advances in wireless capability and economics, together with scale uptake of mobile apps, means customers are now strongly preferring wireless connectivity and digital self service
A larger than expected portion of the market is buying primarily on price which is fuelling price competition and consequent margin pressure
Our work to reduce unit costs to date has been good, but not enough for the future. Customers are getting “more for less” and therefore profitability must be underpinned by further cost reduction
4G/5G
For
per
sona
l use
onl
y

Strategy UpdateKey areas of focus
23
We have set our sights on… Which means we will…
Up-weight our emphasis on wireless services and investment
Do better at serving price-sensitive customers, by further developing our multi-brand strategy
Become the lowest cost operator, through radically simplified and digitisedprocesses, products and services
Execute our Quantum Programme to develop and implement the initiatives required to effect these new areas of focus
Lowest cost operatorTop 10
global telco
Strong culture
+30NPS
Outstanding customer experience
Holdingmarket share
Growingkey segments
Holding market share
Growingkey segments
+30NPS
Outstanding customer experience
Top-decile culture
Lowest cost operatorTop 10
global telco ROI
NB: +30 NPS is the minimum standard we aspire to for all NPS measures including market, relationship, interaction, journey and employee metrics
For
per
sona
l use
onl
y
24
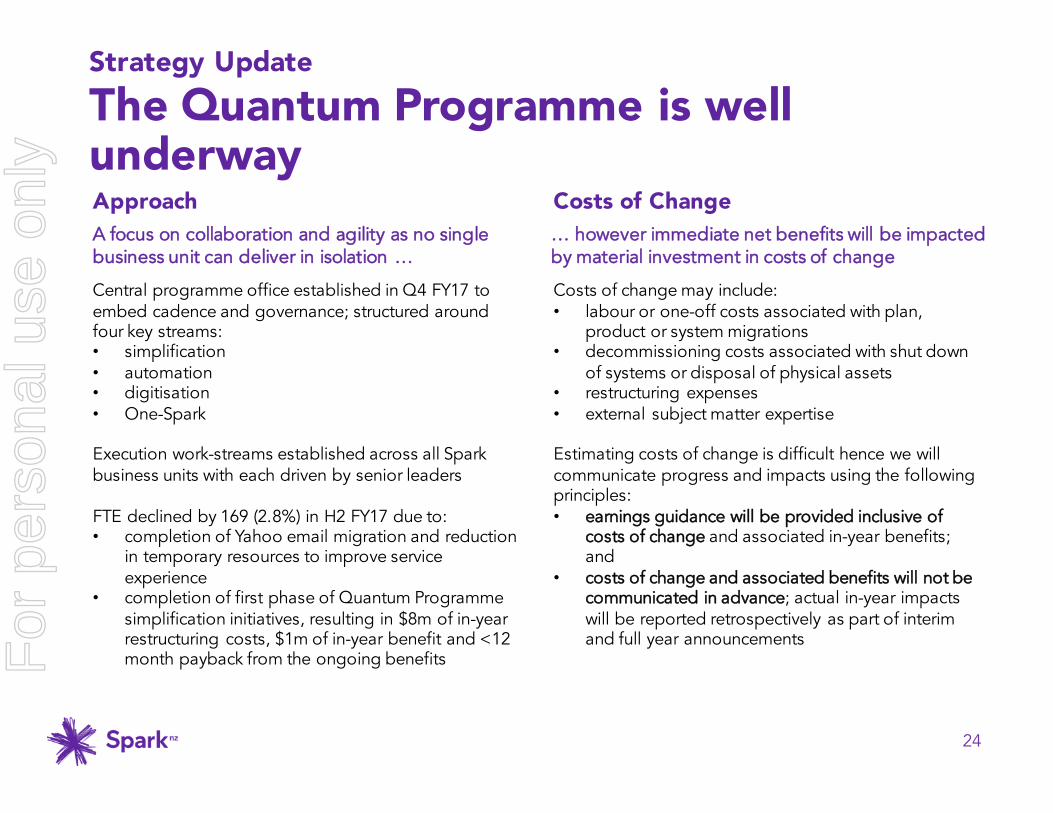
Strategy UpdateThe Quantum Programme is well underway
… however immediate net benefits will be impacted by material investment in costs of change
Costs of change may include:• labour or one-off costs associated with plan,
product or system migrations• decommissioning costs associated with shut down
of systems or disposal of physical assets• restructuring expenses• external subject matter expertise
Estimating costs of change is difficult hence we will communicate progress and impacts using the following principles:• earnings guidance will be provided inclusive of
costs of change and associated in-year benefits; and
• costs of change and associated benefits will not be communicated in advance; actual in-year impacts will be reported retrospectively as part of interim and full year announcements
Costs of ChangeA focus on collaboration and agility as no single business unit can deliver in isolation …
Central programme office established in Q4 FY17 to embed cadence and governance; structured around four key streams:• simplification• automation• digitisation• One-Spark
Execution work-streams established across all Spark business units with each driven by senior leaders
FTE declined by 169 (2.8%) in H2 FY17 due to:• completion of Yahoo email migration and reduction
in temporary resources to improve service experience
• completion of first phase of Quantum Programme simplification initiatives, resulting in $8m of in-year restructuring costs, $1m of in-year benefit and <12 month payback from the ongoing benefits
Approach
For
per
sona
l use
onl
y

25
FY17 Actual FY18 Guidance (1) (2)
excluding net gain from sale of Mayoral Drive carpark
versus FY17 actual excluding net gain from sale of Mayoral Drive carpark
Total Revenues $3,594m 0-2% growth
EBITDA $996m 0-2% growth
Capex $415m ~$410m
Earnings per Share 22c ~22c
Dividend per Share Ordinary 22.0 cps fully imputedSpecial 3.0 cps 75% imputed
Total 25.0 cps at least 75% imputed(3)
(1) Guidance subject to no adverse change in operating outlook(2) Guidance is relative to reported FY17 results excluding net gain from sale of surplus Mayoral Drive carpark land(3) Likely to be made up of an ordinary dividend determined by earnings, topped up by a special dividend to maintain a total dividend per share of 25.0c
FY18 OutlookGuidance (1) (2)
For
per
sona
l use
onl
y
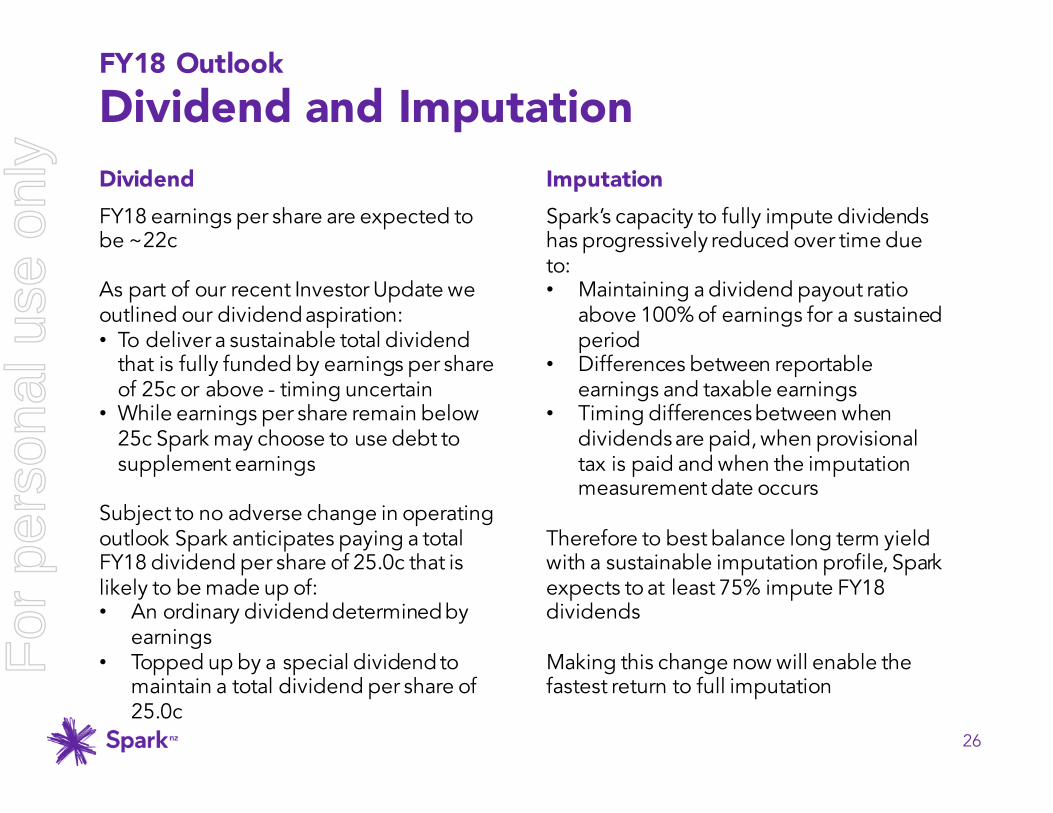
FY18 earnings per share are expected to be ~22c
As part of our recent Investor Update we outlined our dividend aspiration:• To deliver a sustainable total dividend
that is fully funded by earnings per share of 25c or above - timing uncertain
• While earnings per share remain below 25c Spark may choose to use debt to supplement earnings
Subject to no adverse change in operating outlook Spark anticipates paying a total FY18 dividend per share of 25.0c that is likely to be made up of:• An ordinary dividend determined by
earnings• Topped up by a special dividend to
maintain a total dividend per share of 25.0c
26
FY18 OutlookDividend and Imputation
Spark’s capacity to fully impute dividends has progressively reduced over time due to:• Maintaining a dividend payout ratio
above 100% of earnings for a sustained period
• Differences between reportable earnings and taxable earnings
• Timing differences between when dividends are paid, when provisional tax is paid and when the imputation measurement date occurs
Therefore to best balance long term yield with a sustainable imputation profile, Spark expects to at least 75% impute FY18 dividends
Making this change now will enable the fastest return to full imputation
ImputationDividend
For
per
sona
l use
onl
y
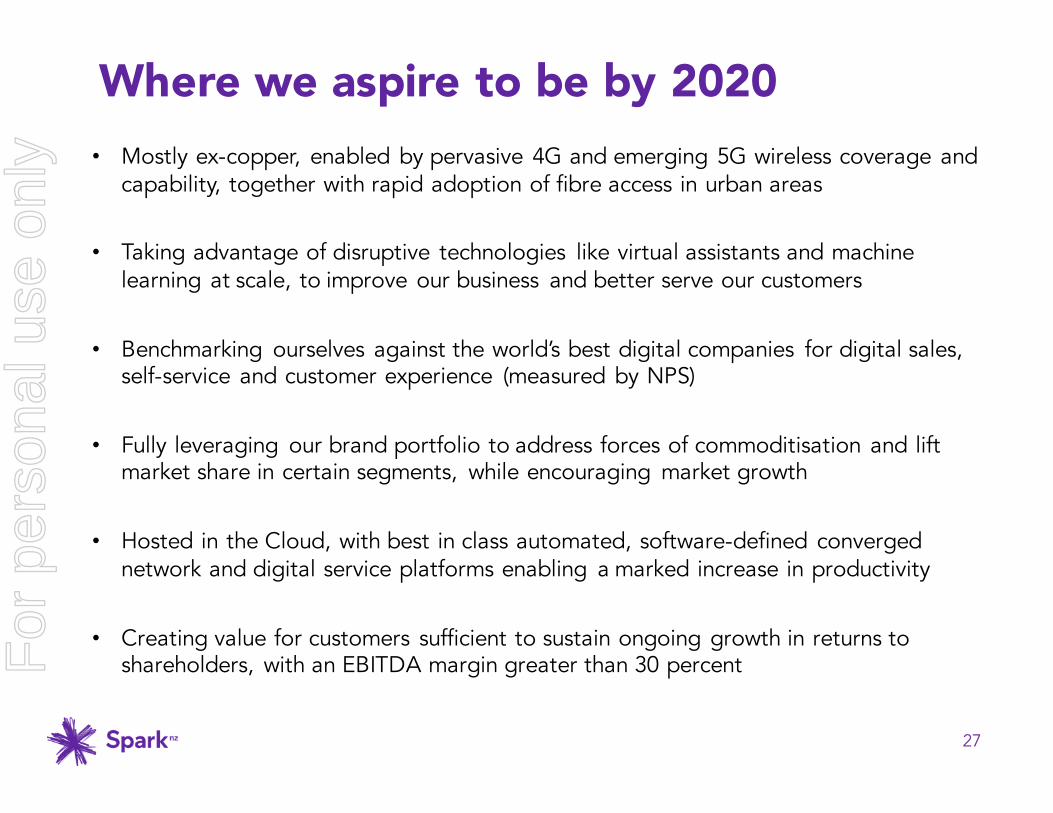
Where we aspire to be by 2020
27
• Mostly ex-copper, enabled by pervasive 4G and emerging 5G wireless coverage and capability, together with rapid adoption of fibre access in urban areas
• Taking advantage of disruptive technologies like virtual assistants and machine learning at scale, to improve our business and better serve our customers
• Benchmarking ourselves against the world’s best digital companies for digital sales, self-service and customer experience (measured by NPS)
• Fully leveraging our brand portfolio to address forces of commoditisation and lift market share in certain segments, while encouraging market growth
• Hosted in the Cloud, with best in class automated, software-defined converged network and digital service platforms enabling a marked increase in productivity
• Creating value for customers sufficient to sustain ongoing growth in returns to shareholders, with an EBITDA margin greater than 30 percentF
or p
erso
nal u
se o
nly
28
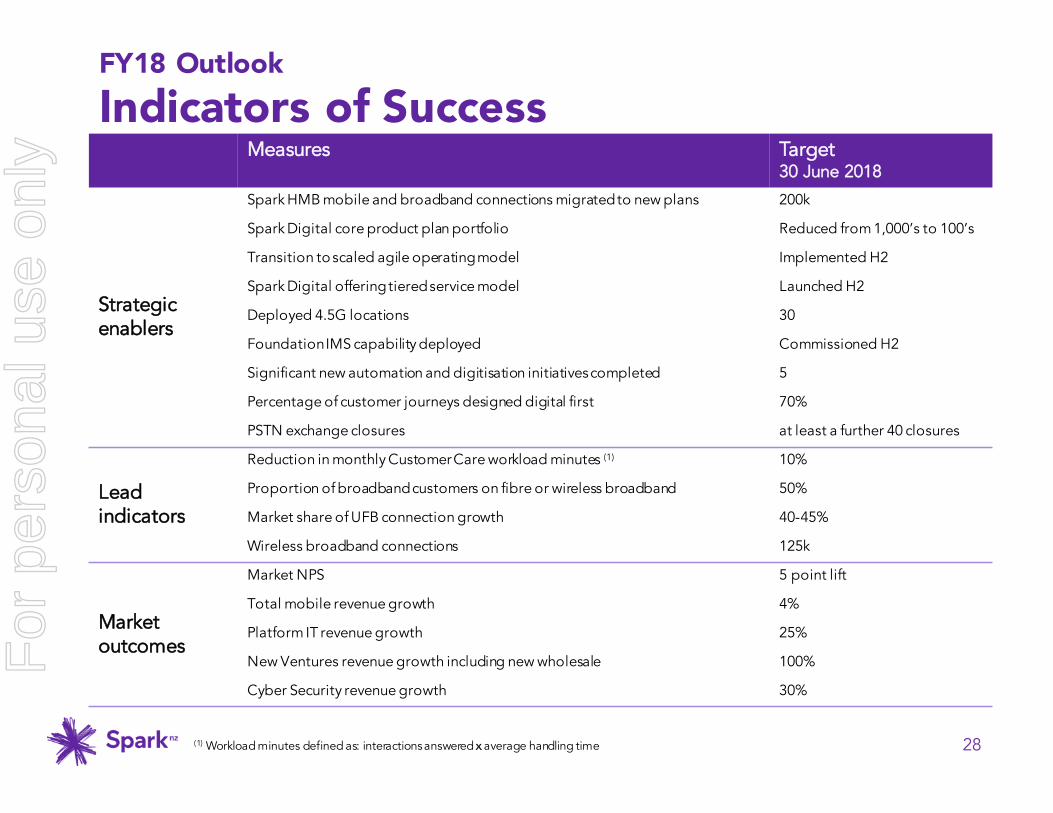
Measures Target 30 June 2018
Strategic enablers
Spark HMB mobile and broadband connections migratedto new plans 200k
Spark Digital core product plan portfolio Reduced from 1,000’s to 100’s
Transition toscaled agile operating model Implemented H2
Spark Digital offering tiered service model Launched H2
Deployed 4.5G locations 30
Foundation IMS capability deployed Commissioned H2
Significant new automation and digitisation initiatives completed 5
Percentage of customer journeys designed digital first 70%
PSTN exchange closures at least a further 40 closures
Lead indicators
Reduction in monthly Customer Care workload minutes (1) 10%
Proportion of broadband customers on fibre or wireless broadband 50%
Market share of UFB connection growth 40-45%
Wireless broadband connections 125k
Market outcomes
Market NPS 5 point lift
Total mobile revenue growth 4%
Platform IT revenue growth 25%
New Ventures revenue growth including new wholesale 100%
Cyber Security revenue growth 30%
FY18 OutlookIndicators of Success
(1) Workload minutes defined as: interactions answered x average handling time
For
per
sona
l use
onl
y
Appendix
29
For
per
sona
l use
onl
y

Changes to Chair and Board
30
Spark Chairman Mark Verbiest will stand down later this year and be replaced by current director Justine Smyth
$667m
$736m
This change is part of a well considered transition and succession plan. With Spark positioned well for the future and with Mr Verbiest being the director with the longest association with Spark, now is the optimal time to renew the leadership of the Board.
The Spark Board has appointed current director Justine Smyth as the new Chair, effective on 3 November 2017. Ms Smyth has extensive governance experience, including with Spark as the Chair of the Audit and Risk Management Committee and Chair of the Human Resources and Compensation Committee.
Ms Smyth will also succeed Mr Verbiest as Chair of the Nominations and Corporate Governance Committee. Current director Alison Gerry will succeed Ms Smyth as the Chair of the Audit and Risk Management Committee, while current director Alison Barrass will succeed Ms Smyth as the Chair of the Human Resources and Compensation Committee.
The Board will commence a recruitment process for a new director in due course, and will take the time to ensure the right person with the right set of skills is found.F
or p
erso
nal u
se o
nly
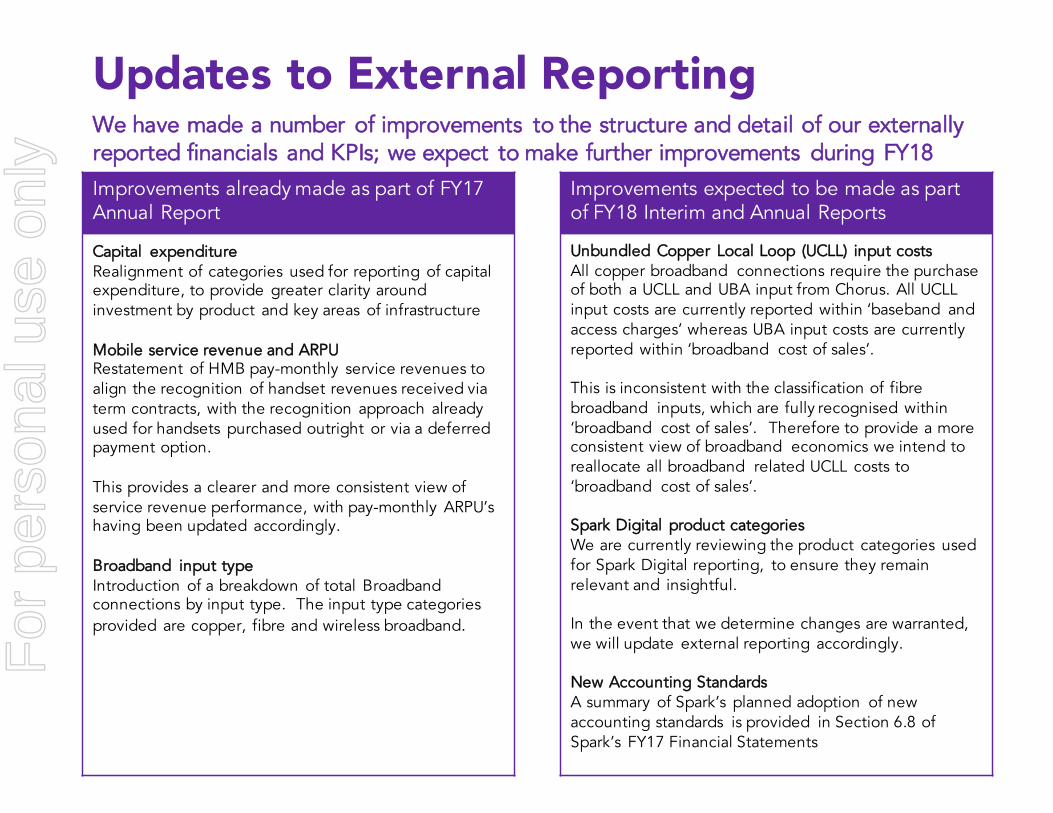
Updates to External Reporting
31
We have made a number of improvements to the structure and detail of our externally reported financials and KPIs; we expect to make further improvements during FY18
$667m
$736m
Improvements expected to be made as part of FY18 Interim and Annual Reports
Unbundled Copper Local Loop (UCLL) input costsAll copper broadband connections require the purchase of both a UCLL and UBA input from Chorus. All UCLL input costs are currently reported within ‘baseband and access charges’ whereas UBA input costs are currently reported within ‘broadband cost of sales’.
This is inconsistent with the classification of fibrebroadband inputs, which are fully recognised within ‘broadband cost of sales’. Therefore to provide a more consistent view of broadband economics we intend to reallocate all broadband related UCLL costs to ‘broadband cost of sales’.
Spark Digital product categoriesWe are currently reviewing the product categories used for Spark Digital reporting, to ensure they remain relevant and insightful.
In the event that we determine changes are warranted, we will update external reporting accordingly.
New Accounting StandardsA summary of Spark’s planned adoption of new accounting standards is provided in Section 6.8 of Spark’s FY17 Financial Statements
Improvements already made as part of FY17 Annual Report
Capital expenditureRealignment of categories used for reporting of capital expenditure, to provide greater clarity around investment by product and key areas of infrastructure
Mobile service revenue and ARPURestatement of HMB pay-monthly service revenues to align the recognition of handset revenues received via term contracts, with the recognition approach already used for handsets purchased outright or via a deferred payment option.
This provides a clearer and more consistent view of service revenue performance, with pay-monthly ARPU’s having been updated accordingly.
Broadband input typeIntroduction of a breakdown of total Broadband connections by input type. The input type categories provided are copper, fibre and wireless broadband.
For
per
sona
l use
onl
y
Disclaimer
32
This announcement may include forward-looking statements regarding future events and the future financial performance of Spark New Zealand. Such forward-looking statements are based on the beliefs of and assumptions made by management along with information currently available at the time such statements were made.
These forward-looking statements may be identified by words such as ‘guidance’, ‘anticipate’, ‘believe’, ‘estimate’, ‘expect’, ‘intend’, ‘will’, ‘plan’, ‘may’, ‘could’, ‘ambition’, ‘aspiration’ and similar expressions. Any statements in this announcement that are not historical facts are forward-looking statements. These forward-looking statements are not guarantees or predictions of future performance, and involve known and unknown risks, uncertainties and other factors, many of which are beyond Spark New Zealand’s control, and which may cause actual results to differ materially from those projected in the forward-looking statements contained in this announcement.
Factors that could cause actual results or performance to differ materially from those expressed or implied in the forward-looking statements are discussed herein and also include Spark New Zealand's anticipated growth strategies, Spark New Zealand's future results of operations and financial condition, economic conditions and the regulatory environment in New Zealand, competition in the markets in which Spark New Zealand operates, risks related to the sharing arrangements with Chorus, other factors or trends affecting the telecommunications industry generally and Spark New Zealand’s financial condition in particular and risks detailed in Spark New Zealand's filings with NZX and ASX. Except as required by law or the listing rules of the stock exchanges on which Spark New Zealand is listed, Spark New Zealand undertakes no obligation to update any forward-looking statements whether as a result of new information, future events or otherwise. F
or p
erso
nal u
se o
nly
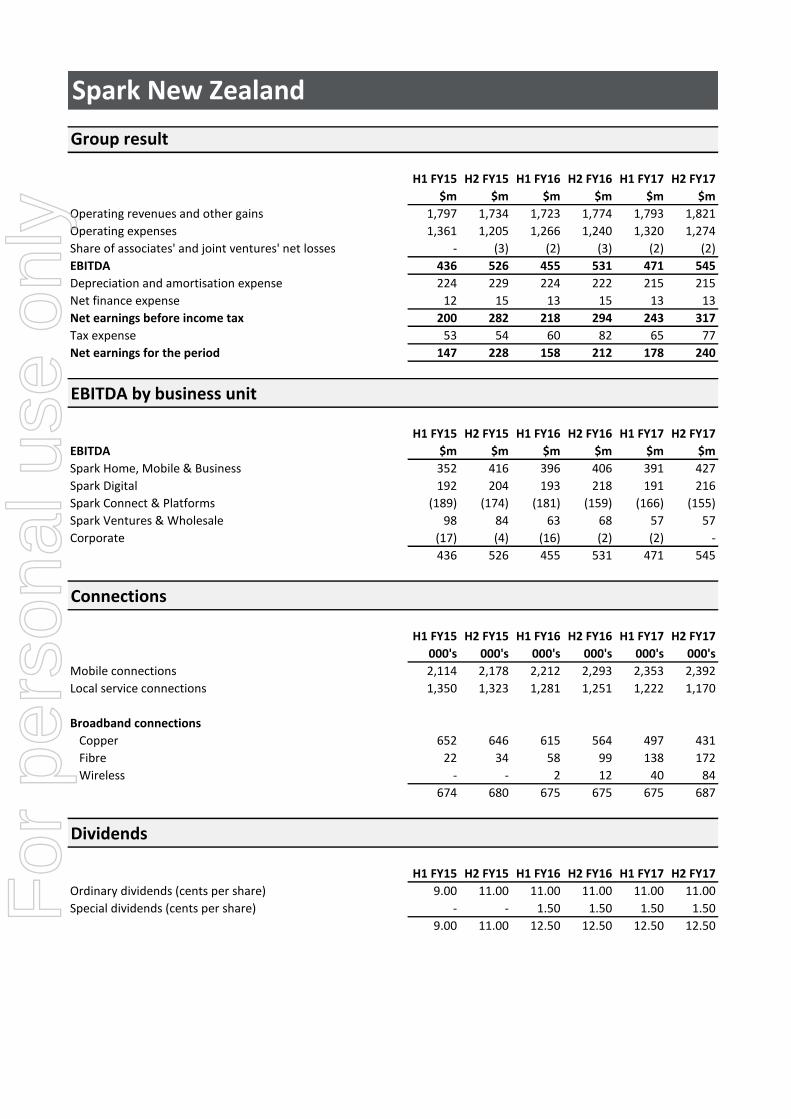
Spark New Zealand
Group result
H1 FY15 H2 FY15 H1 FY16 H2 FY16 H1 FY17 H2 FY17
$m $m $m $m $m $m
Operating revenues and other gains 1,797 1,734 1,723 1,774 1,793 1,821
Operating expenses 1,361 1,205 1,266 1,240 1,320 1,274
Share of associates' and joint ventures' net losses - (3) (2) (3) (2) (2)
EBITDA 436 526 455 531 471 545
Depreciation and amortisation expense 224 229 224 222 215 215
Net finance expense 12 15 13 15 13 13
Net earnings before income tax 200 282 218 294 243 317
Tax expense 53 54 60 82 65 77
Net earnings for the period 147 228 158 212 178 240
EBITDA by business unit
H1 FY15 H2 FY15 H1 FY16 H2 FY16 H1 FY17 H2 FY17
EBITDA $m $m $m $m $m $m
Spark Home, Mobile & Business 352 416 396 406 391 427
Spark Digital 192 204 193 218 191 216
Spark Connect & Platforms (189) (174) (181) (159) (166) (155)
Spark Ventures & Wholesale 98 84 63 68 57 57
Corporate (17) (4) (16) (2) (2) -
436 526 455 531 471 545
Connections
H1 FY15 H2 FY15 H1 FY16 H2 FY16 H1 FY17 H2 FY17
000's 000's 000's 000's 000's 000's
Mobile connections 2,114 2,178 2,212 2,293 2,353 2,392
Local service connections 1,350 1,323 1,281 1,251 1,222 1,170
Broadband connections
Copper 652 646 615 564 497 431
Fibre 22 34 58 99 138 172
Wireless - - 2 12 40 84
674 680 675 675 675 687
Dividends
H1 FY15 H2 FY15 H1 FY16 H2 FY16 H1 FY17 H2 FY17
Ordinary dividends (cents per share) 9.00 11.00 11.00 11.00 11.00 11.00
Special dividends (cents per share) - - 1.50 1.50 1.50 1.50
9.00 11.00 12.50 12.50 12.50 12.50
For
per
sona
l use
onl
y
Spark New Zealand
Operating revenues and other gains by business unit
H1 FY15 H2 FY15 H1 FY16 H2 FY16 H1 FY17 H2 FY17
Operating revenues and other gains $m $m $m $m $m $m
Spark Home, Mobile & Business 910 932 971 992 985 994
Spark Digital 625 599 607 619 658 665
Spark Connect & Platforms 22 19 19 20 22 26
Spark Ventures & Wholesale 248 174 121 126 112 111
Corporate 47 65 26 41 35 46
Eliminations (55) (55) (21) (24) (19) (21)
1,797 1,734 1,723 1,774 1,793 1,821
Group operating revenues and other gains
H1 FY15 H2 FY15 H1 FY16 H2 FY16 H1 FY17 H2 FY17
$m $m $m $m $m $m
Operating revenues
Voice 479 401 337 344 311 290
Broadband 324 326 339 346 344 345
Managed data 110 98 96 92 85 79
Mobile
Service revenue 345 354 371 379 383 398
Other mobile revenue 159 161 192 192 205 211
504 515 563 571 588 609
IT services
Traditional IT services 101 103 92 97 104 110
Platform IT services 73 86 93 106 117 131
Procurement 121 108 137 133 163 158
295 297 322 336 384 399
Other operating revenue 85 65 66 85 81 79
Total operating revenues 1,797 1,702 1,723 1,774 1,793 1,801
Other gains - 32 - - - 20
Total operating revenues and other gains 1,797 1,734 1,723 1,774 1,793 1,821
Wireless broadband revenues and connections are included in broadband revenues and connections.
H1 FY15 H2 FY15 H1 FY16 H2 FY16 H1 FY17 H2 FY17
Voice revenue by type $m $m $m $m $m $m
Landline only 221 177 169 166 155 143
Calling 241 209 153 164 142 134
Other voice revenue 17 15 15 14 14 13
479 401 337 344 311 290
For
per
sona
l use
onl
y
Spark New Zealand
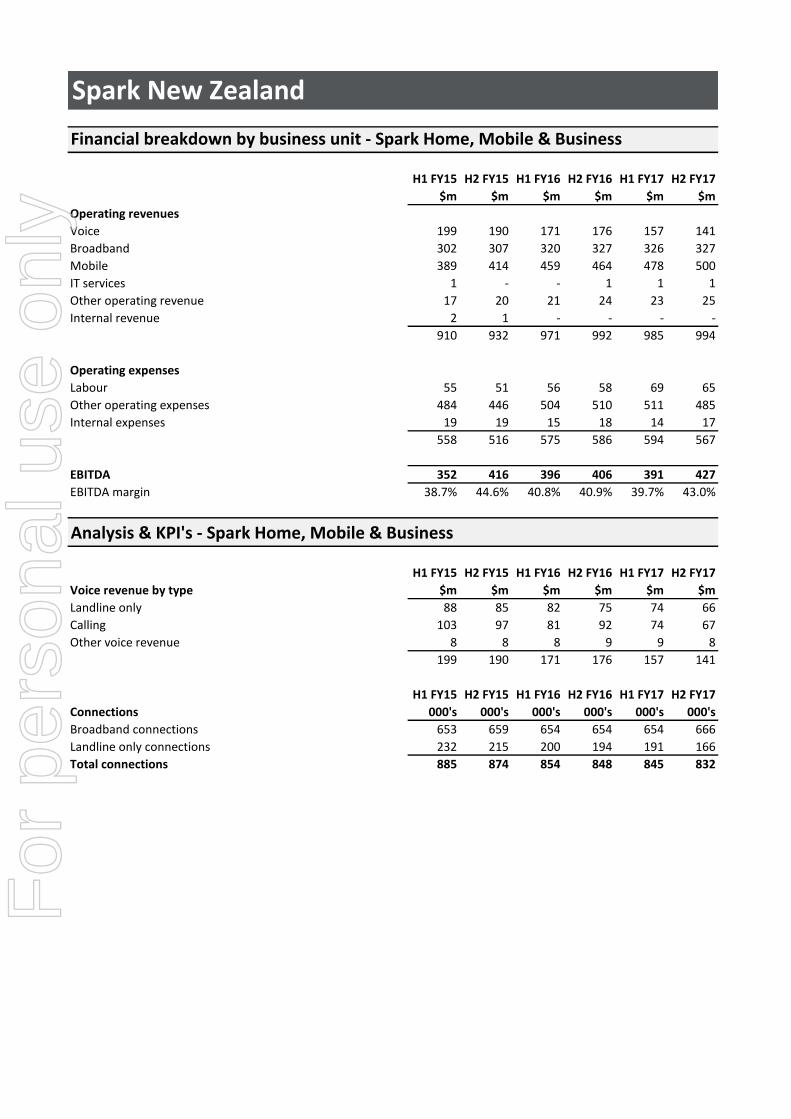
Financial breakdown by business unit - Spark Home, Mobile & Business
H1 FY15 H2 FY15 H1 FY16 H2 FY16 H1 FY17 H2 FY17
$m $m $m $m $m $m
Operating revenues
Voice 199 190 171 176 157 141
Broadband 302 307 320 327 326 327
Mobile 389 414 459 464 478 500
IT services 1 - - 1 1 1
Other operating revenue 17 20 21 24 23 25
Internal revenue 2 1 - - - -
910 932 971 992 985 994
Operating expenses
Labour 55 51 56 58 69 65
Other operating expenses 484 446 504 510 511 485
Internal expenses 19 19 15 18 14 17
558 516 575 586 594 567
EBITDA 352 416 396 406 391 427
EBITDA margin 38.7% 44.6% 40.8% 40.9% 39.7% 43.0%
Analysis & KPI's - Spark Home, Mobile & Business
H1 FY15 H2 FY15 H1 FY16 H2 FY16 H1 FY17 H2 FY17
Voice revenue by type $m $m $m $m $m $m
Landline only 88 85 82 75 74 66
Calling 103 97 81 92 74 67
Other voice revenue 8 8 8 9 9 8
199 190 171 176 157 141
H1 FY15 H2 FY15 H1 FY16 H2 FY16 H1 FY17 H2 FY17
Connections 000's 000's 000's 000's 000's 000's
Broadband connections 653 659 654 654 654 666
Landline only connections 232 215 200 194 191 166
Total connections 885 874 854 848 845 832
For
per
sona
l use
onl
y
Spark New Zealand
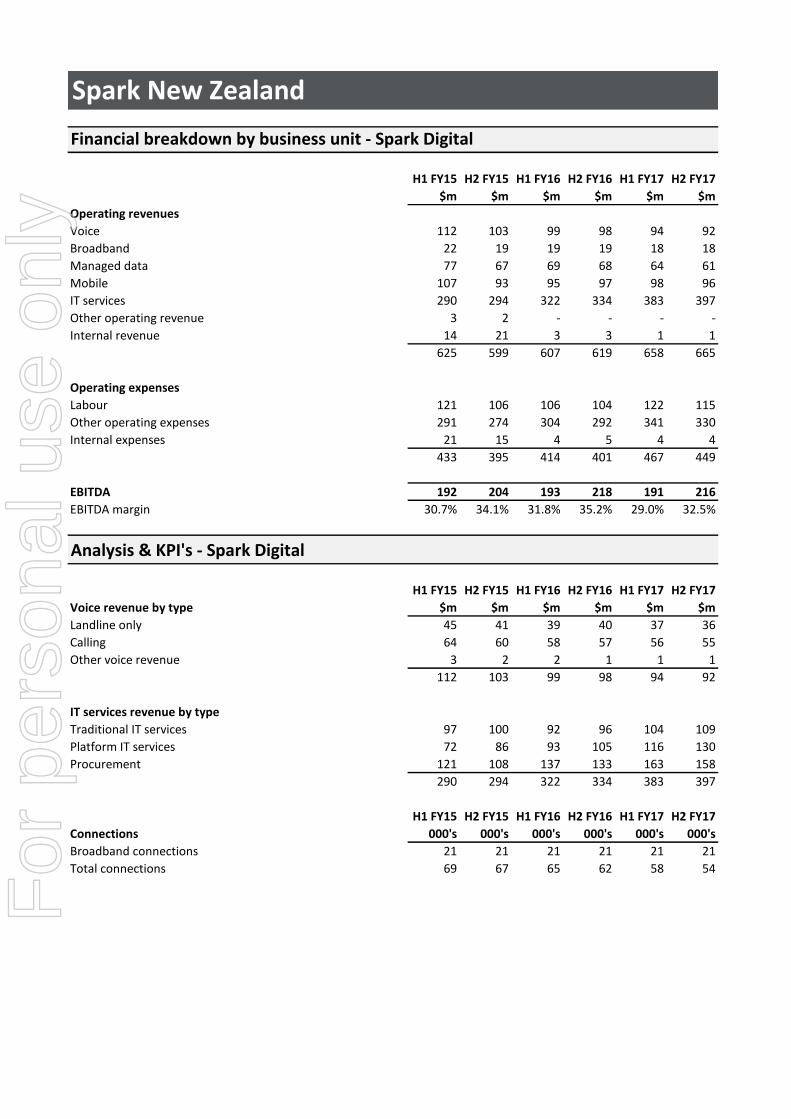
Financial breakdown by business unit - Spark Digital
H1 FY15 H2 FY15 H1 FY16 H2 FY16 H1 FY17 H2 FY17
$m $m $m $m $m $m
Operating revenues
Voice 112 103 99 98 94 92
Broadband 22 19 19 19 18 18
Managed data 77 67 69 68 64 61
Mobile 107 93 95 97 98 96
IT services 290 294 322 334 383 397
Other operating revenue 3 2 - - - -
Internal revenue 14 21 3 3 1 1
625 599 607 619 658 665
Operating expenses
Labour 121 106 106 104 122 115
Other operating expenses 291 274 304 292 341 330
Internal expenses 21 15 4 5 4 4
433 395 414 401 467 449
EBITDA 192 204 193 218 191 216
EBITDA margin 30.7% 34.1% 31.8% 35.2% 29.0% 32.5%
Analysis & KPI's - Spark Digital
H1 FY15 H2 FY15 H1 FY16 H2 FY16 H1 FY17 H2 FY17
Voice revenue by type $m $m $m $m $m $m
Landline only 45 41 39 40 37 36
Calling 64 60 58 57 56 55
Other voice revenue 3 2 2 1 1 1
112 103 99 98 94 92
IT services revenue by type
Traditional IT services 97 100 92 96 104 109
Platform IT services 72 86 93 105 116 130
Procurement 121 108 137 133 163 158
290 294 322 334 383 397
H1 FY15 H2 FY15 H1 FY16 H2 FY16 H1 FY17 H2 FY17
Connections 000's 000's 000's 000's 000's 000's
Broadband connections 21 21 21 21 21 21
Total connections 69 67 65 62 58 54
For
per
sona
l use
onl
y

Spark New Zealand
Financial breakdown by business unit - Spark Connect & Platforms
H1 FY15 H2 FY15 H1 FY16 H2 FY16 H1 FY17 H2 FY17
$m $m $m $m $m $m
Operating revenues
Voice 1 1 1 1 1 1
Mobile 2 2 2 2 3 4
Other operating revenue 19 16 16 17 18 21
22 19 19 20 22 26
Operating expenses
Labour 68 64 68 63 65 71
Other operating expenses 141 128 132 116 123 109
Internal expenses 2 2 1 - - -
211 194 201 179 188 180
Share of associates' and joint ventures' net profits / (losses) - 1 1 - - (1)
EBITDA (189) (174) (181) (159) (166) (155)
Analysis & KPI's - Spark Connect & Platforms
H1 FY15 H2 FY15 H1 FY16 H2 FY16 H1 FY17 H2 FY17
Voice revenue by type $m $m $m $m $m $m
Calling 1 1 1 1 1 1
For
per
sona
l use
onl
y
Spark New Zealand
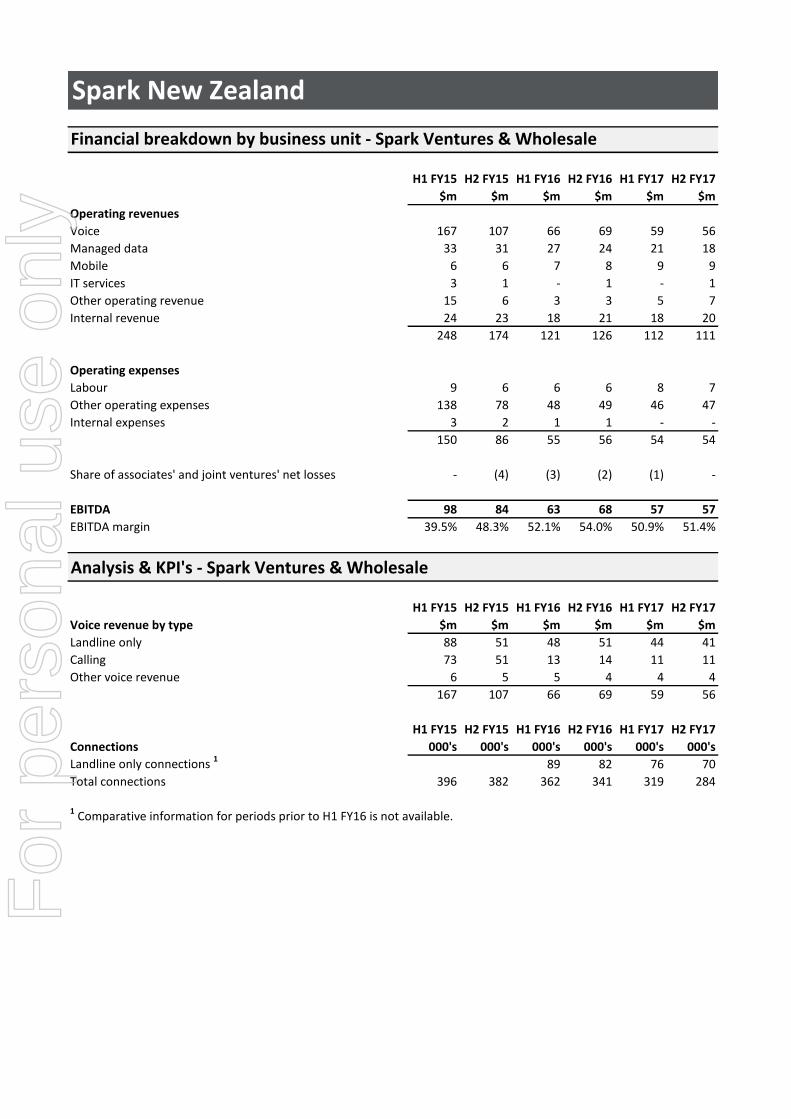
Financial breakdown by business unit - Spark Ventures & Wholesale
H1 FY15 H2 FY15 H1 FY16 H2 FY16 H1 FY17 H2 FY17
$m $m $m $m $m $m
Operating revenues
Voice 167 107 66 69 59 56
Managed data 33 31 27 24 21 18
Mobile 6 6 7 8 9 9
IT services 3 1 - 1 - 1
Other operating revenue 15 6 3 3 5 7
Internal revenue 24 23 18 21 18 20
248 174 121 126 112 111
Operating expenses
Labour 9 6 6 6 8 7
Other operating expenses 138 78 48 49 46 47
Internal expenses 3 2 1 1 - -
150 86 55 56 54 54
Share of associates' and joint ventures' net losses - (4) (3) (2) (1) -
EBITDA 98 84 63 68 57 57
EBITDA margin 39.5% 48.3% 52.1% 54.0% 50.9% 51.4%
Analysis & KPI's - Spark Ventures & Wholesale
H1 FY15 H2 FY15 H1 FY16 H2 FY16 H1 FY17 H2 FY17
Voice revenue by type $m $m $m $m $m $m
Landline only 88 51 48 51 44 41
Calling 73 51 13 14 11 11
Other voice revenue 6 5 5 4 4 4
167 107 66 69 59 56
H1 FY15 H2 FY15 H1 FY16 H2 FY16 H1 FY17 H2 FY17
Connections 000's 000's 000's 000's 000's 000's
Landline only connections 1 89 82 76 70
Total connections 396 382 362 341 319 284
1 Comparative information for periods prior to H1 FY16 is not available.
For
per
sona
l use
onl
y

Spark New Zealand
Financial breakdown by business unit - Corporate
H1 FY15 H2 FY15 H1 FY16 H2 FY16 H1 FY17 H2 FY17
$m $m $m $m $m $m
Operating revenues and other gains
IT services 1 2 - - - -
Other operating revenue 31 21 26 41 35 26
Other gains - 32 - - - 20
Internal revenue 15 10 - - - -
47 65 26 41 35 46
Operating expenses
Labour 18 20 16 14 14 14
Other operating expenses 36 32 26 28 21 31
Internal expenses 10 17 - - 1 -
64 69 42 42 36 45
Share of associates' and joint ventures' net losses - - - (1) (1) (1)
EBITDA (17) (4) (16) (2) (2) -
Analysis & KPI's - Corporate
H1 FY15 H2 FY15 H1 FY16 H2 FY16 H1 FY17 H2 FY17
$m $m $m $m $m $m
Southern cross dividends 31 22 26 40 35 26
For
per
sona
l use
onl
y
Spark New Zealand
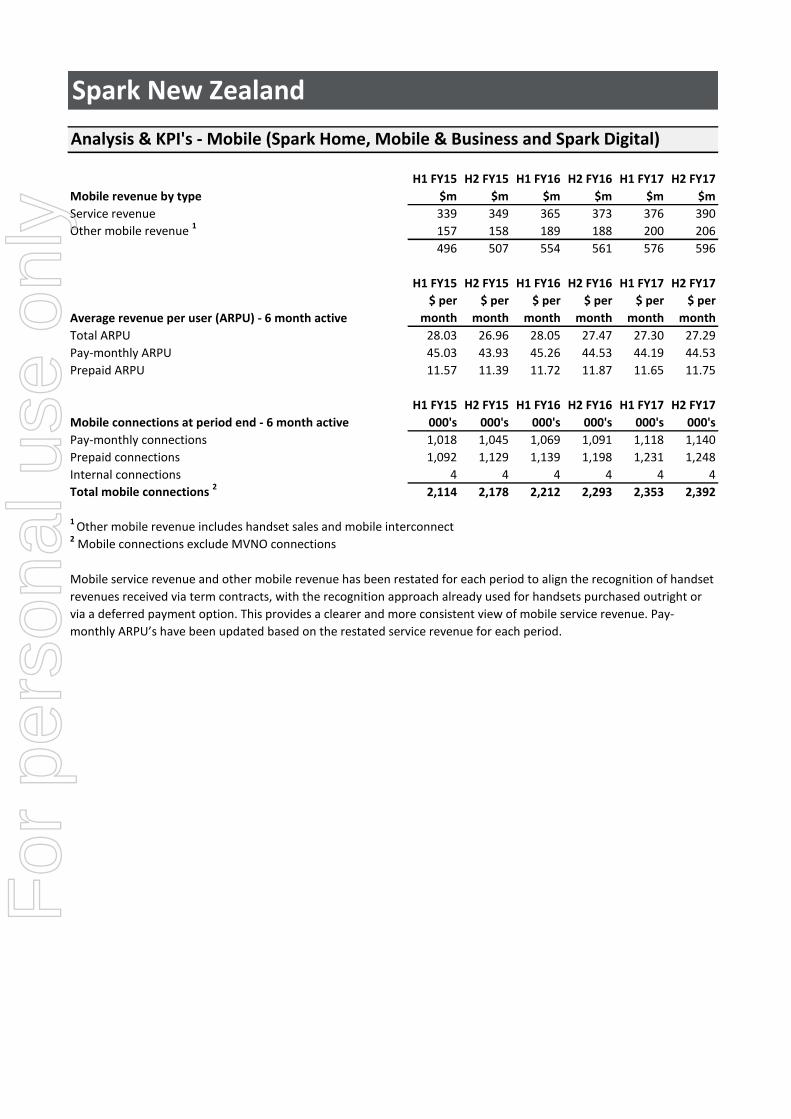
Analysis & KPI's - Mobile (Spark Home, Mobile & Business and Spark Digital)
H1 FY15 H2 FY15 H1 FY16 H2 FY16 H1 FY17 H2 FY17
Mobile revenue by type $m $m $m $m $m $m
Service revenue 339 349 365 373 376 390
Other mobile revenue 1 157 158 189 188 200 206
496 507 554 561 576 596
H1 FY15 H2 FY15 H1 FY16 H2 FY16 H1 FY17 H2 FY17
Average revenue per user (ARPU) - 6 month active
$ per
month
$ per
month
$ per
month
$ per
month
$ per
month
$ per
month
Total ARPU 28.03 26.96 28.05 27.47 27.30 27.29
Pay-monthly ARPU 45.03 43.93 45.26 44.53 44.19 44.53
Prepaid ARPU 11.57 11.39 11.72 11.87 11.65 11.75
H1 FY15 H2 FY15 H1 FY16 H2 FY16 H1 FY17 H2 FY17
Mobile connections at period end - 6 month active 000's 000's 000's 000's 000's 000's
Pay-monthly connections 1,018 1,045 1,069 1,091 1,118 1,140
Prepaid connections 1,092 1,129 1,139 1,198 1,231 1,248
Internal connections 4 4 4 4 4 4
Total mobile connections 2 2,114 2,178 2,212 2,293 2,353 2,392
1 Other mobile revenue includes handset sales and mobile interconnect2 Mobile connections exclude MVNO connections
Mobile service revenue and other mobile revenue has been restated for each period to align the recognition of handset
revenues received via term contracts, with the recognition approach already used for handsets purchased outright or
via a deferred payment option. This provides a clearer and more consistent view of mobile service revenue. Pay-
monthly ARPU’s have been updated based on the restated service revenue for each period.
For
per
sona
l use
onl
y

Spark New Zealand
Group expenses
H1 FY15 H2 FY15 H1 FY16 H2 FY16 H1 FY17 H2 FY17
$m $m $m $m $m $m
Payments to telecommunications operators
Baseband and access charges 205 169 162 184 170 153
Other intercarrier costs 97 73 43 48 47 49
Broadband cost of sales 140 114 119 120 127 130
Field services 11 8 10 8 7 7
453 364 334 360 351 339
Mobile acquisition, procurement and IT services
Mobile cost of sales 204 194 229 219 222 214
IT services cost of sales 164 160 184 177 215 205
368 354 413 396 437 419
Labour 271 247 252 245 278 272
Other operating expenses
Direct network costs 31 18 38 31 31 29
Computer costs 37 39 38 36 40 42
Accommodation costs 48 44 47 45 50 49
Advertising, promotions and communication 46 32 45 32 41 28
Bad debts 7 6 11 11 9 9
Impairment expense - - - 9 2 -
Other 100 101 88 75 81 87
269 240 267 239 254 244
Total operating expenses 1,361 1,205 1,266 1,240 1,320 1,274
Depreciation and amortisation expense
Depreciation 126 130 126 122 122 128
Amortisation 98 99 98 100 93 87
224 229 224 222 215 215
Net finance expense
Finance income (14) (13) (9) (9) (8) (8)
Finance expense 26 28 22 24 21 21
12 15 13 15 13 13
Group FTE's
H1 FY15 H2 FY15 H1 FY16 H2 FY16 H1 FY17 H2 FY17
FTE permanent 5,297 4,792 5,023 5,241 5,664 5,554
FTE contractors 321 300 301 328 279 220
Total FTE 5,618 5,092 5,324 5,569 5,943 5,774
For
per
sona
l use
onl
y

Spark New Zealand
Group capital expenditure
H1 FY15 H2 FY15 H1 FY16 H2 FY16 H1 FY17 H2 FY17
$m $m $m $m $m $m
Cloud 15 7 10 24 22 20
Converged Communications Network (CCN) - - 3 3 12
Data centre build 61 - - - - -
International cable construction and capacity purchases 8 - 21 7 14 20
IT systems 24 13 17 42 60 52
Re-engineering of IT systems 29 43 42 24 - -
Mobile network 57 35 58 19 69 33
Plant, network and core sustain and resiliency 28 42 53 26 36 31
Other 27 29 15 20 20 23
Total capital expenditure excluding mobile spectrum 249 169 216 165 224 191
Mobile spectrum 158 - - 9 - -
Total capital expenditure 407 169 216 174 224 191
Capital expenditure is presented on an accruals basis.
For
per
sona
l use
onl
y


![ARB STEEL ARBN PLATED ARBX2 ARBNX2 RB · 2 T ® TENBLATT iornmno in 2//22 sistemi di fissaggio ARB ARBX2 RB TORX ARBN ARBNX2 LEGEND d [mm] Diametro filettatura > Thread diameter](https://img.pdfslide.us/doc/110x75/5fcdc26d1660a01dba083d04/arb-steel-arbn-plated-arbx2-arbnx2-rb-2-t-tenblatt-iornmno-in-222-sistemi-di.jpg)


![[Spark meetup] Spark Streaming Overview](https://img.pdfslide.us/doc/110x75/55a457161a28ab057e8b45fd/spark-meetup-spark-streaming-overview.jpg)