Embed Size (px)
Citation preview
Spark New Zealand Limited ARBN 050 611 277 Spark City, 167 Victoria Street West, Private Bag 92028, Auckland, New Zealand
MARKET RELEASE
30 June 2017
Spark New Zealand Investor Day
Update on strategy
Please find attached the third presentation of three from the Spark New Zealand
investor day.
- ENDS –
For media queries, please contact:
Richard Llewellyn
Head of Corporate Communications
+64 (0) 27 523 2362
For investor relations queries, please contact:
Dean Werder
General Manager Finance and Business Performance
+64 (0) 27 259 7176

INVESTOR UPDATE
30 JUNE 2017
SPARK NEW ZEALAND LTD
SESSION 3 OF 3
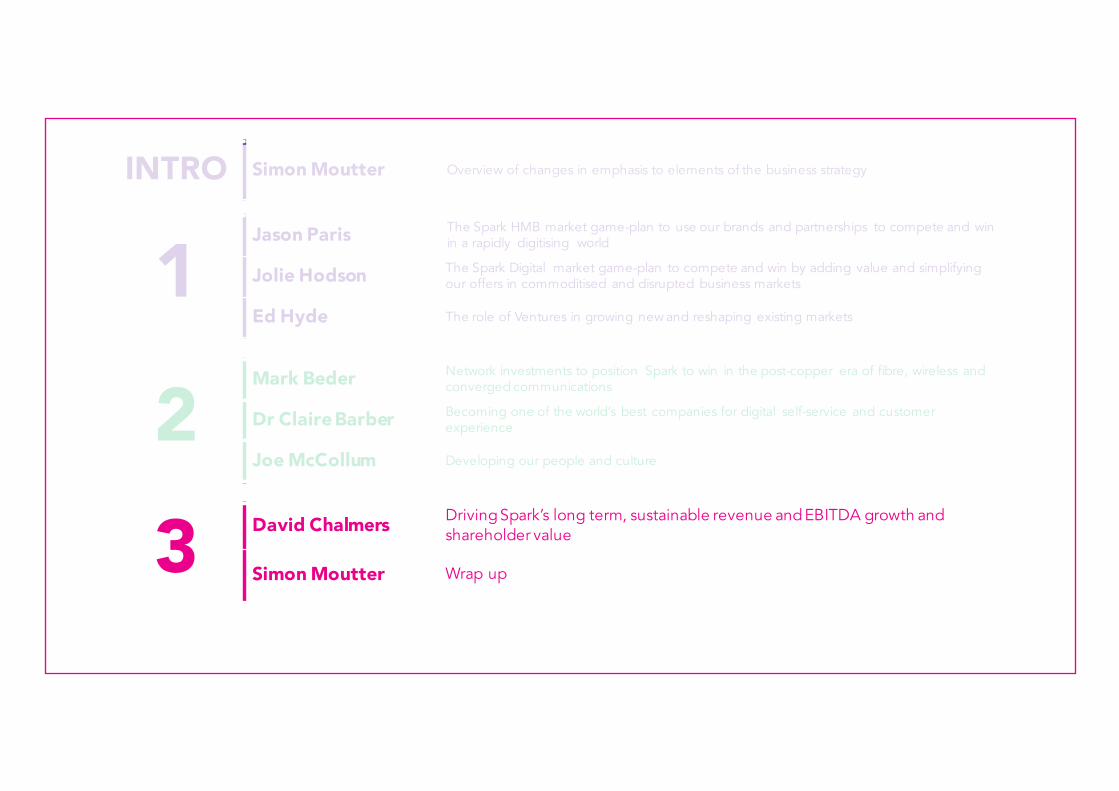
3 David Chalmers Driving Spark’s long term, sustainable revenue and EBITDA growth and shareholder value
Simon Moutter Wrap up
2Mark Beder Network investments to position Spark to win in the post-copper era of fibre, wireless and
converged communications
Dr Claire Barber Becoming one of the world’s best companies for digital self-service and customer experience
Joe McCollum Developing our people and culture
1Jason Paris The Spark HMB market game-plan to use our brands and partnerships to compete and win
in a rapidly digitising world
Jolie Hodson The Spark Digital market game-plan to compete and win by adding value and simplifying our offers in commoditised and disrupted business markets
Ed Hyde The role of Ventures in growing new and reshaping existing markets
INTRO Simon Moutter Overview of changes in emphasis to elements of the business strategy
DAVID CHALMERSCHIEF FINANCIAL OFFICER
FINANCIAL ASPIRATION3 YEAROUR
4
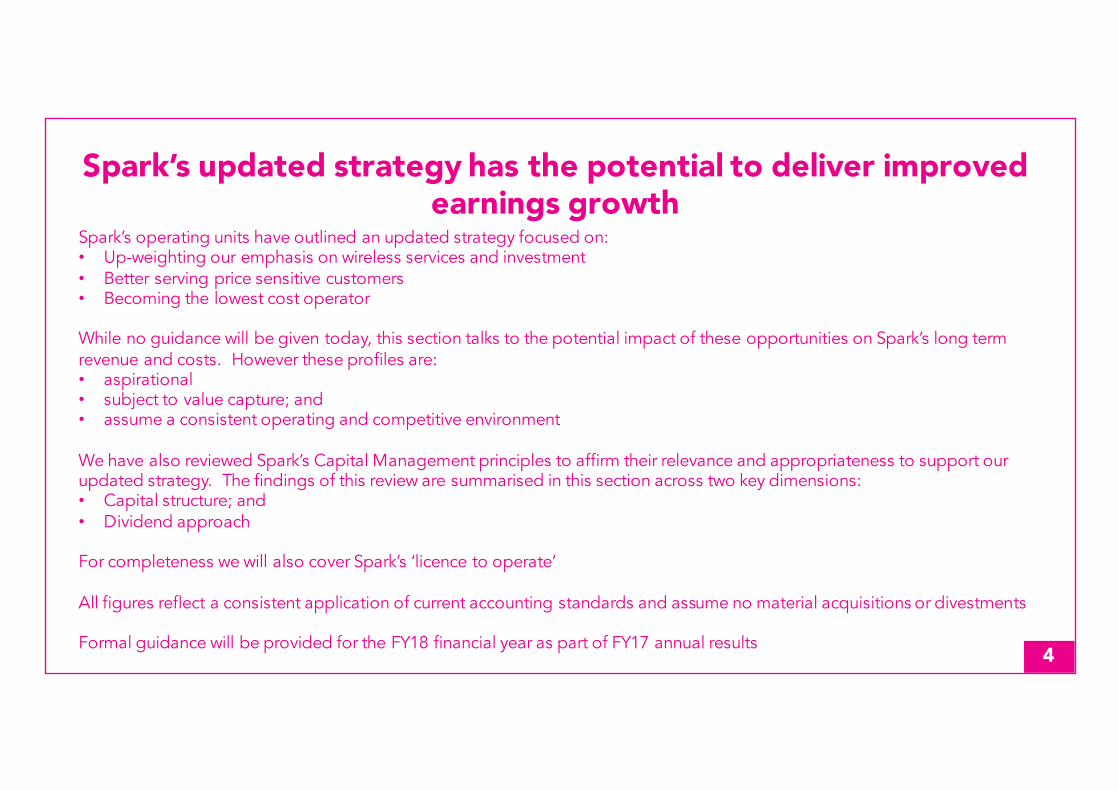
Spark’s operating units have outlined an updated strategy focused on:• Up-weighting our emphasis on wireless services and investment• Better serving price sensitive customers• Becoming the lowest cost operator
While no guidance will be given today, this section talks to the potential impact of these opportunities on Spark’s long term revenue and costs. However these profiles are:• aspirational• subject to value capture; and• assume a consistent operating and competitive environment
We have also reviewed Spark’s Capital Management principles to affirm their relevance and appropriateness to support our updated strategy. The findings of this review are summarised in this section across two key dimensions:• Capital structure; and • Dividend approach
For completeness we will also cover Spark’s ‘licence to operate’
All figures reflect a consistent application of current accounting standards and assume no material acquisitions or divestments
Formal guidance will be provided for the FY18 financial year as part of FY17 annual results
Spark’s updated strategy has the potential to deliver improved earnings growth
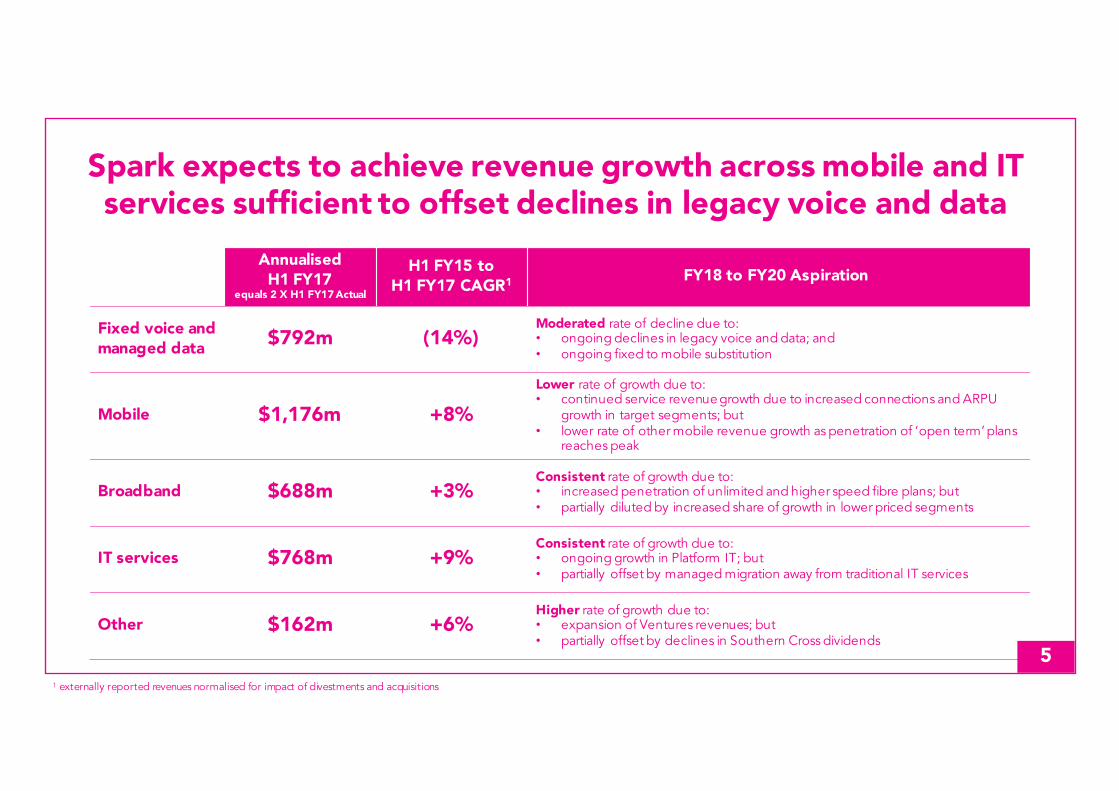
Spark expects to achieve revenue growth across mobile and IT services sufficient to offset declines in legacy voice and data
Annualised H1 FY17
equals 2 X H1 FY17 Actual
H1 FY15 toH1 FY17 CAGR1 FY18 to FY20 Aspiration
Fixed voice and managed data $792m (14%)
Moderated rate of decline due to:• ongoing declines in legacy voice and data; and• ongoing fixed to mobile substitution
Mobile $1,176m +8%Lower rate of growth due to:• continued service revenue growth due to increased connections and ARPU
growth in target segments; but• lower rate of other mobile revenue growth as penetration of ‘open term’ plans
reaches peak
Broadband $688m +3%Consistent rate of growth due to:• increased penetration of unlimited and higher speed fibre plans; but• partially diluted by increased share of growth in lower priced segments
IT services $768m +9%Consistent rate of growth due to:• ongoing growth in Platform IT; but• partially offset by managed migration away from traditional IT services
Other $162m +6%Higher rate of growth due to:• expansion of Ventures revenues; but• partially offset by declines in Southern Cross dividends
51 externally reported revenues normalised for impact of divestments and acquisitions
6
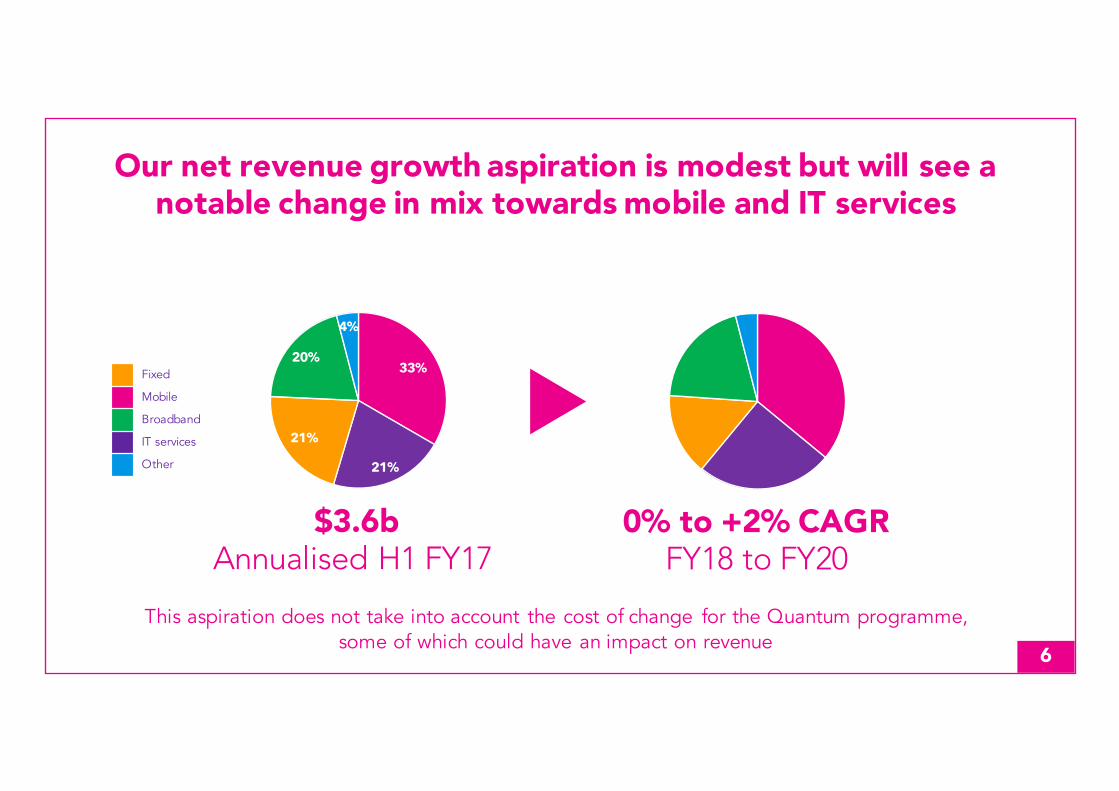
Our net revenue growth aspiration is modest but will see a notable change in mix towards mobile and IT services
33%
21%
21%
20%
4%
Fixed
Mobile
Broadband
IT services
Other
$3.6bAnnualised H1 FY17
0% to +2% CAGRFY18 to FY20
This aspiration does not take into account the cost of change for the Quantum programme, some of which could have an impact on revenue
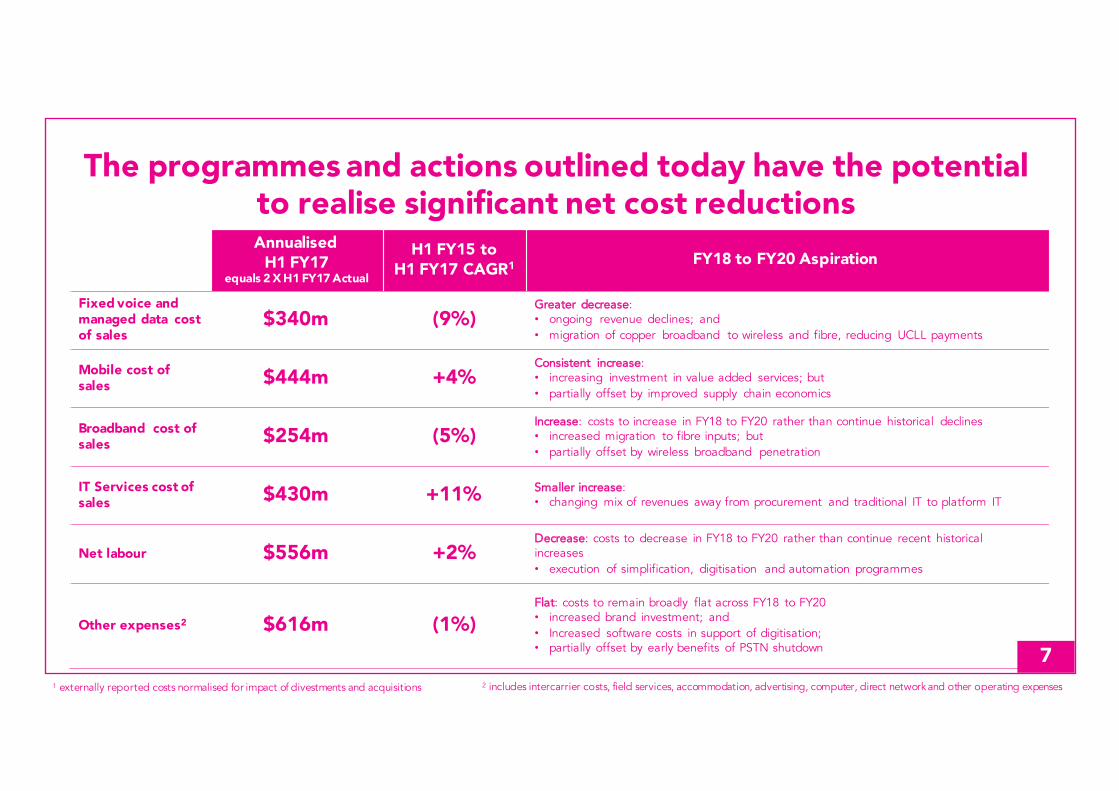
The programmes and actions outlined today have the potential to realise significant net cost reductionsAnnualised
H1 FY17 equals 2 X H1 FY17 Actual
H1 FY15 to H1 FY17 CAGR1 FY18 to FY20 Aspiration
Fixed voice and managed data cost of sales
$340m (9%)Greater decrease:• ongoing revenue declines; and• migration of copper broadband to wireless and fibre, reducing UCLL payments
Mobile cost of sales $444m +4%
Consistent increase:• increasing investment in value added services; but• partially offset by improved supply chain economics
Broadband cost of sales $254m (5%)
Increase: costs to increase in FY18 to FY20 rather than continue historical declines• increased migration to fibre inputs; but• partially offset by wireless broadband penetration
IT Services cost of sales $430m +11% Smaller increase:
• changing mix of revenues away from procurement and traditional IT to platform IT
Net labour $556m +2%Decrease: costs to decrease in FY18 to FY20 rather than continue recent historical increases• execution of simplification, digitisation and automation programmes
Other expenses2 $616m (1%)Flat: costs to remain broadly flat across FY18 to FY20• increased brand investment; and• Increased software costs in support of digitisation; • partially offset by early benefits of PSTN shutdown
2 includes intercarrier costs, field services, accommodation, advertising, computer, direct network and other operating expenses1 externally reported costs normalised for impact of divestments and acquisitions
7
8
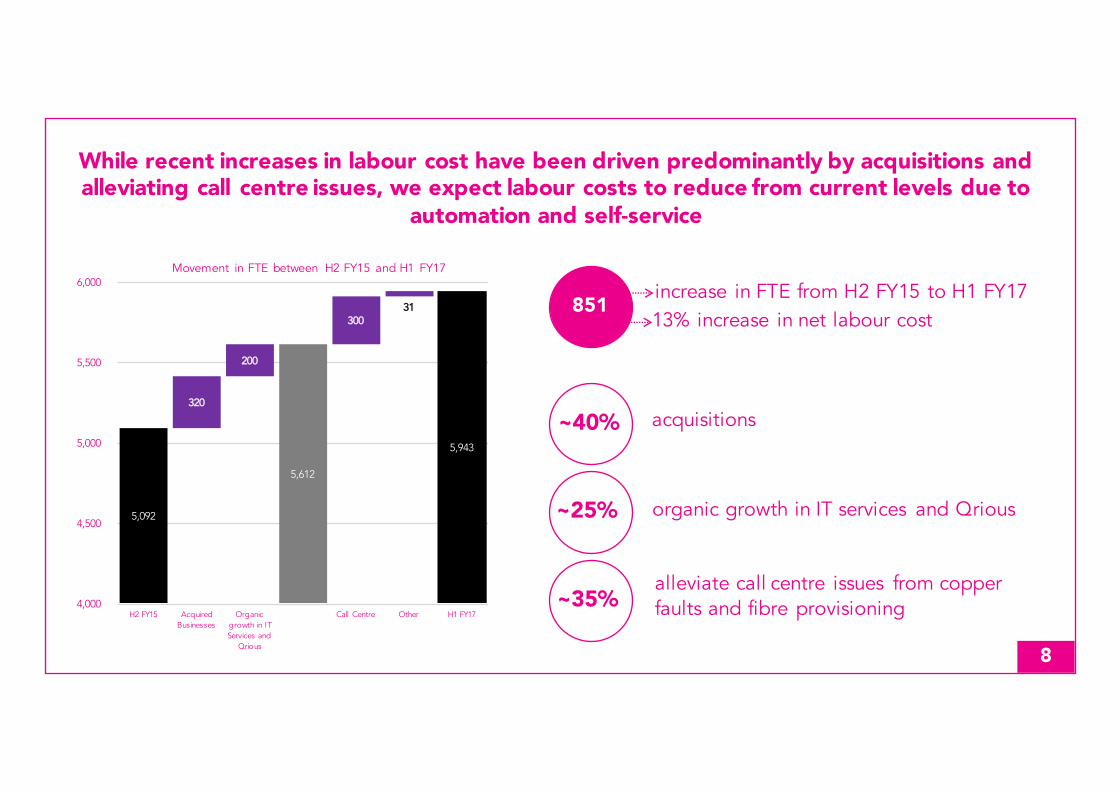
While recent increases in labour cost have been driven predominantly by acquisitions and alleviating call centre issues, we expect labour costs to reduce from current levels due to
automation and self-service
851 increase in FTE from H2 FY15 to H1 FY1713% increase in net labour cost
acquisitions
alleviate call centre issues from copper faults and fibre provisioning
~40%
~35%
5,092
5,612
5,943
320
200
300 31
4,000
4,500
5,000
5,500
6,000
H2 FY15 Acquired Businesses
Organic growth in IT Services and
Qrious
Call Centre Other H1 FY17
Movement in FTE between H2 FY15 and H1 FY17
organic growth in IT services and Qrious~25%
9
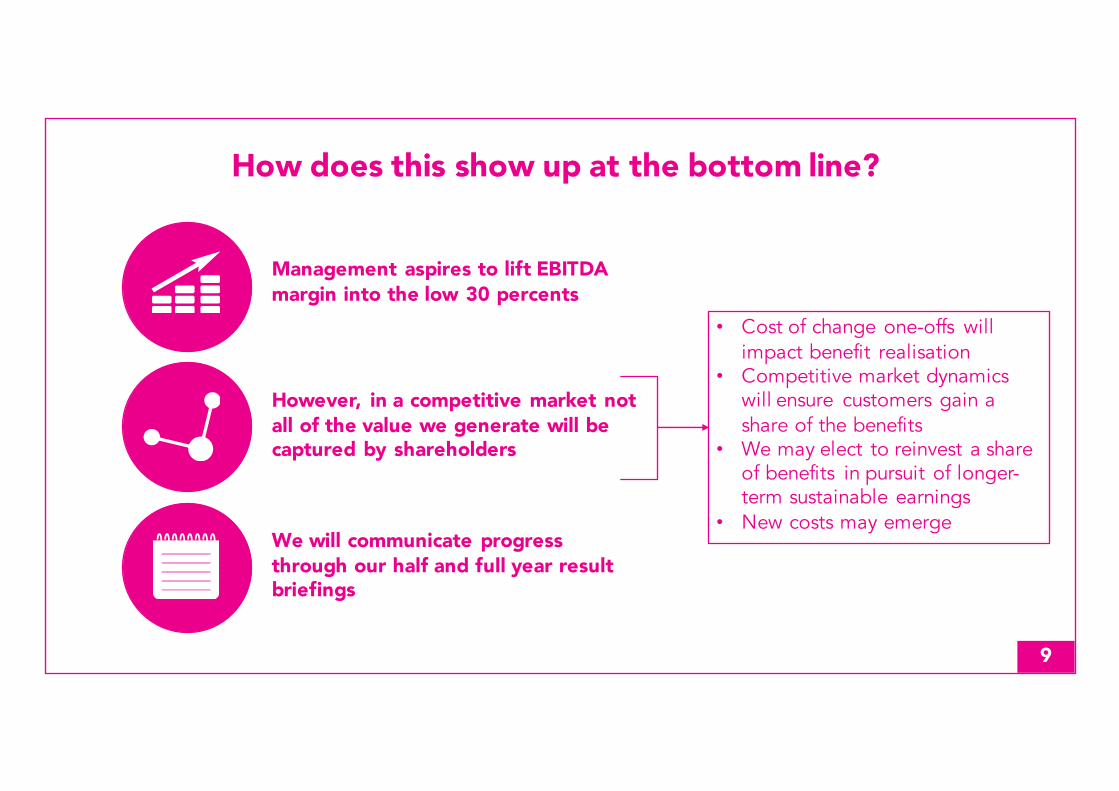
How does this show up at the bottom line?
Management aspires to lift EBITDA margin into the low 30 percents
We will communicate progress through our half and full year result briefings
• Cost of change one-offs will impact benefit realisation
• Competitive market dynamics will ensure customers gain a share of the benefits
• We may elect to reinvest a share of benefits in pursuit of longer-term sustainable earnings
• New costs may emerge
However, in a competitive market not all of the value we generate will be captured by shareholders
10
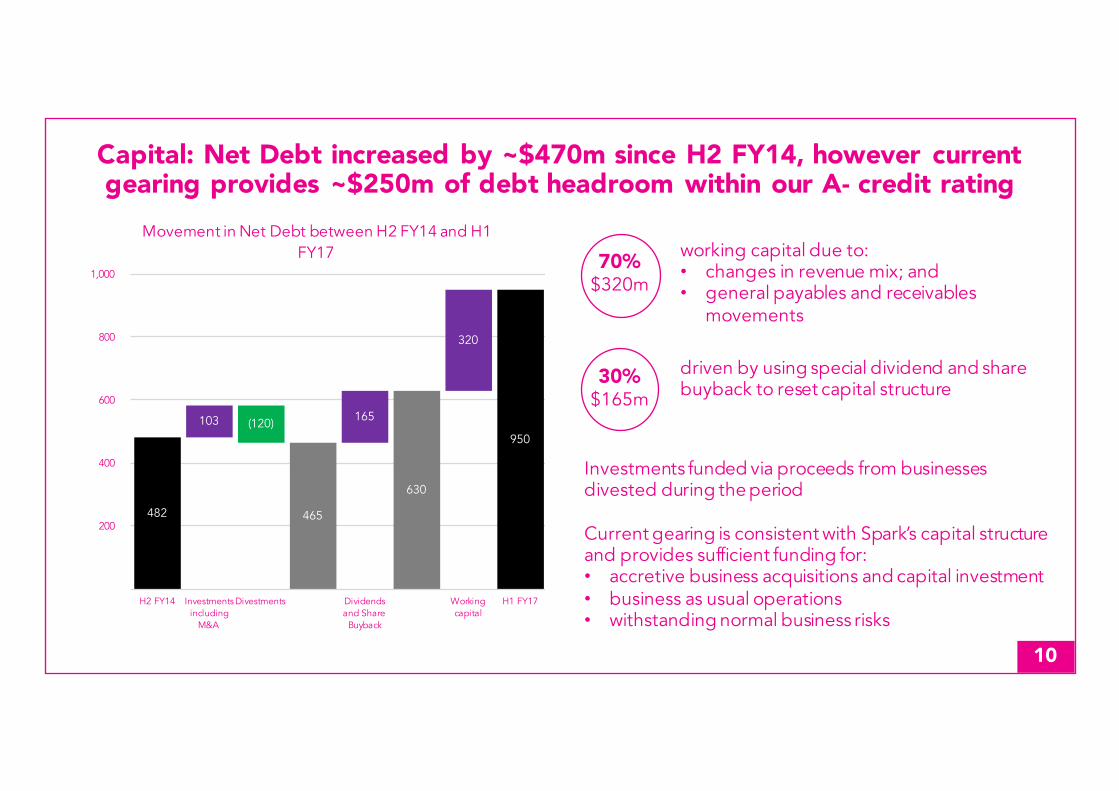
Capital: Net Debt increased by ~$470m since H2 FY14, however current gearing provides ~$250m of debt headroom within our A- credit rating
482 465
630
950
103 165
320
(120)
200
400
600
800
1,000
H2 FY14 Investments including
M&A
Divestments Dividends and Share
Buyback
Working capital
H1 FY17
Movement in Net Debt between H2 FY14 and H1 FY17
Investments funded via proceeds from businesses divested during the period
Current gearing is consistent with Spark’s capital structure and provides sufficient funding for:• accretive business acquisitions and capital investment• business as usual operations• withstanding normal business risks
working capital due to:• changes in revenue mix; and• general payables and receivables
movements
driven by using special dividend and share buyback to reset capital structure
70%$320m
30%$165m
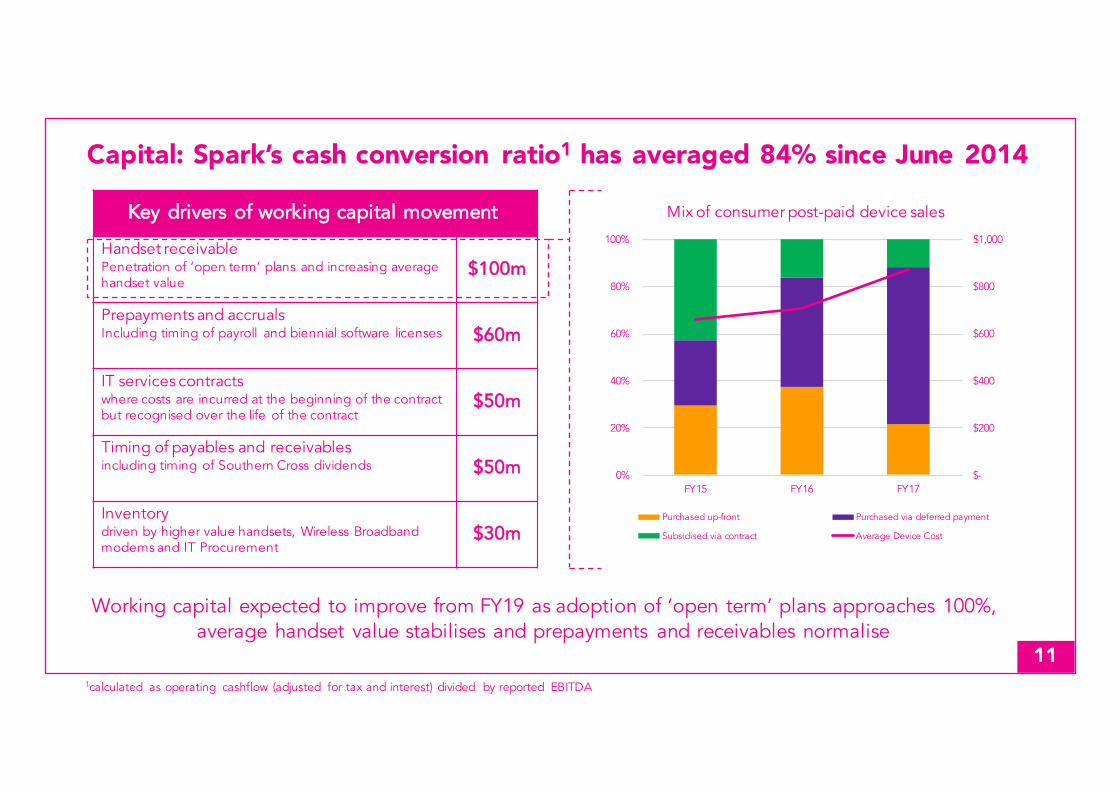
Capital: Spark’s cash conversion ratio1 has averaged 84% since June 2014
1calculated as operating cashflow (adjusted for tax and interest) divided by reported EBITDA
11
Key drivers of working capital movement
Handset receivablePenetration of ‘open term’ plans and increasing average handset value
$100m
Prepayments and accrualsIncluding timing of payroll and biennial software licenses $60m
IT services contracts where costs are incurred at the beginning of the contract but recognised over the life of the contract
$50m
Timing of payables and receivablesincluding timing of Southern Cross dividends $50m
Inventory driven by higher value handsets, Wireless Broadband modems and IT Procurement
$30m
$-
$200
$400
$600
$800
$1,000
0%
20%
40%
60%
80%
100%
FY15 FY16 FY17
Mix of consumer post-paid device sales
Purchased up-front Purchased via deferred payment
Subsidised via contract Average Device Cost
Working capital expected to improve from FY19 as adoption of ‘open term’ plans approaches 100%, average handset value stabilises and prepayments and receivables normalise
12
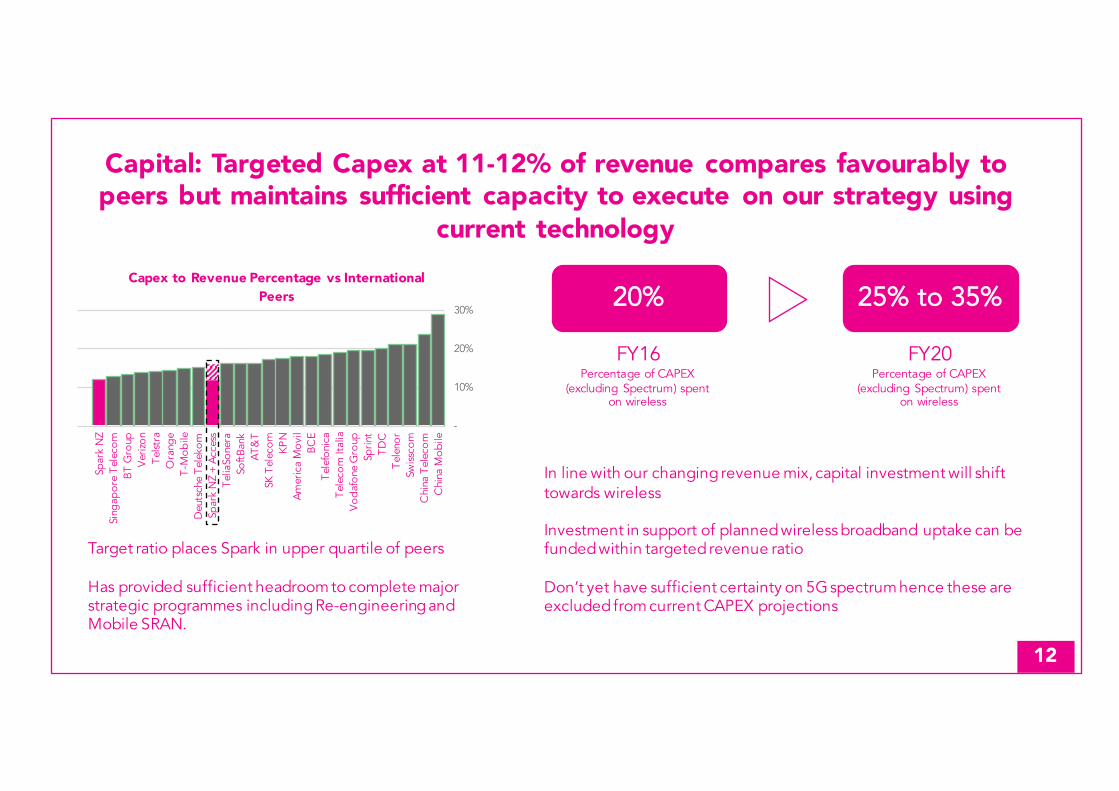
Capital: Targeted Capex at 11-12% of revenue compares favourably to peers but maintains sufficient capacity to execute on our strategy using
current technology
-
10%
20%
30%
Chi
na M
ob
ileC
hina
Tel
eco
mSw
issc
om
Tel
eno
rT
DC
Spri
ntV
od
afo
ne G
roup
Tel
eco
m It
alia
Tel
efo
nica
BC
EA
mer
ica
Mo
vil
KP
NSK
Tel
eco
mA
T&
TSo
ftB
ank
Tel
iaSo
nera
Spar
k N
Z +
Acc
ess
Deu
tsch
e T
elek
om
T-M
ob
ileO
rang
eT
elst
raV
eriz
on
BT
Gro
upSi
ngap
ore
Tel
eco
mSp
ark
NZ
Capex to Revenue Percentage vs International Peers
Target ratio places Spark in upper quartile of peers
Has provided sufficient headroom to complete major strategic programmes including Re-engineering and Mobile SRAN.
20% 25% to 35%
In line with our changing revenue mix, capital investment will shift towards wireless
Investment in support of planned wireless broadband uptake can be funded within targeted revenue ratio
Don’t yet have sufficient certainty on 5G spectrum hence these are excluded from current CAPEX projections
FY16Percentage of CAPEX
(excluding Spectrum) spent on wireless
FY20Percentage of CAPEX
(excluding Spectrum) spent on wireless
13
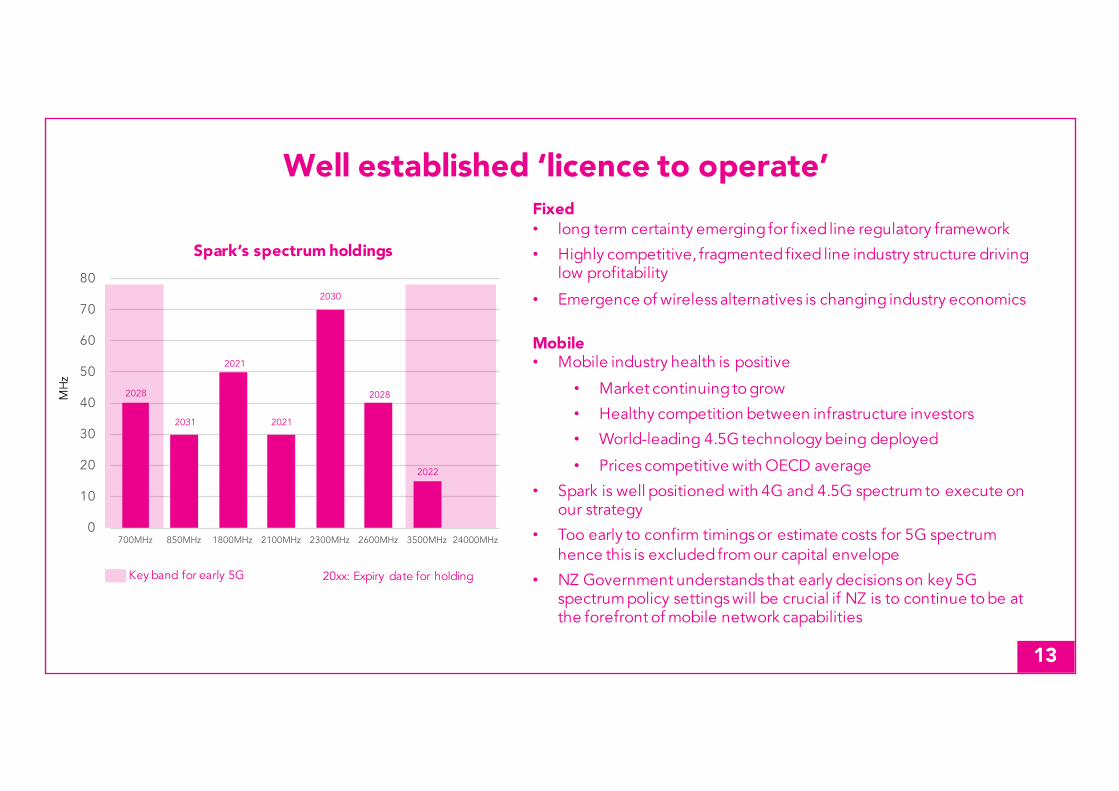
Well established ‘licence to operate’Fixed• long term certainty emerging for fixed line regulatory framework
• Highly competitive, fragmented fixed line industry structure driving low profitability
• Emergence of wireless alternatives is changing industry economics
Mobile• Mobile industry health is positive
• Market continuing to grow
• Healthy competition between infrastructure investors
• World-leading 4.5G technology being deployed
• Prices competitive with OECD average
• Spark is well positioned with 4G and 4.5G spectrum to execute on our strategy
• Too early to confirm timings or estimate costs for 5G spectrum hence this is excluded from our capital envelope
• NZ Government understands that early decisions on key 5G spectrum policy settings will be crucial if NZ is to continue to be at the forefront of mobile network capabilities
0
10
20
30
40
50
60
70
80
700MHz 850MHz 1800MHz 2100MHz 2300MHz 2600MHz 3500MHz 24000MHz
Spark’s spectrum holdings
2028 2028
2031
2021
2021
2030
2022
MH
z
20xx: Expiry date for holdingKey band for early 5G
14
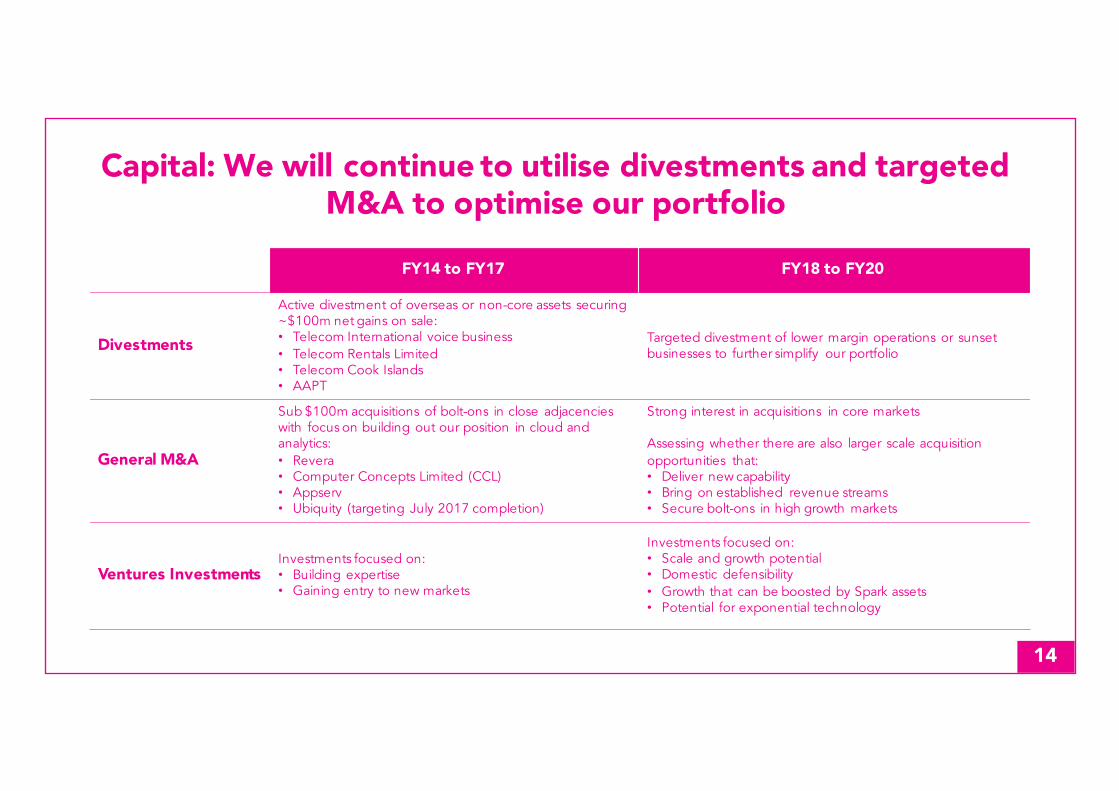
Capital: We will continue to utilise divestments and targeted M&A to optimise our portfolio
FY14 to FY17 FY18 to FY20
Divestments
Active divestment of overseas or non-core assets securing ~$100m net gains on sale:• Telecom International voice business• Telecom Rentals Limited• Telecom Cook Islands• AAPT
Targeted divestment of lower margin operations or sunset businesses to further simplify our portfolio
General M&A
Sub $100m acquisitions of bolt-ons in close adjacencies with focus on building out our position in cloud and analytics:• Revera• Computer Concepts Limited (CCL)• Appserv• Ubiquity (targeting July 2017 completion)
Strong interest in acquisitions in core markets
Assessing whether there are also larger scale acquisition opportunities that:• Deliver new capability• Bring on established revenue streams• Secure bolt-ons in high growth markets
Ventures InvestmentsInvestments focused on:• Building expertise• Gaining entry to new markets
Investments focused on:• Scale and growth potential• Domestic defensibility• Growth that can be boosted by Spark assets• Potential for exponential technology
15
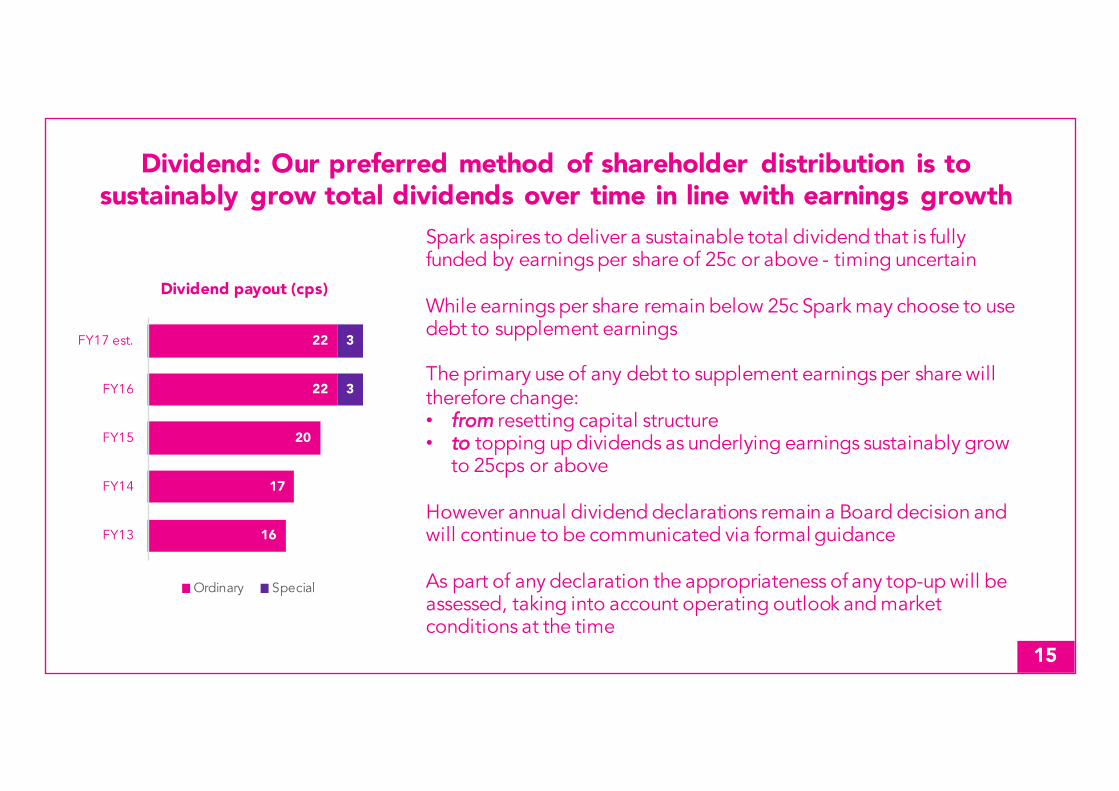
Dividend: Our preferred method of shareholder distribution is to sustainably grow total dividends over time in line with earnings growth
16
17
20
22
22
3
3
FY13
FY14
FY15
FY16
FY17 est.
Dividend payout (cps)
Ordinary Special
Spark aspires to deliver a sustainable total dividend that is fully funded by earnings per share of 25c or above - timing uncertain
While earnings per share remain below 25c Spark may choose to use debt to supplement earnings
The primary use of any debt to supplement earnings per share will therefore change:• from resetting capital structure• to topping up dividends as underlying earnings sustainably grow
to 25cps or above
However annual dividend declarations remain a Board decision and will continue to be communicated via formal guidance
As part of any declaration the appropriateness of any top-up will be assessed, taking into account operating outlook and market conditions at the time
16
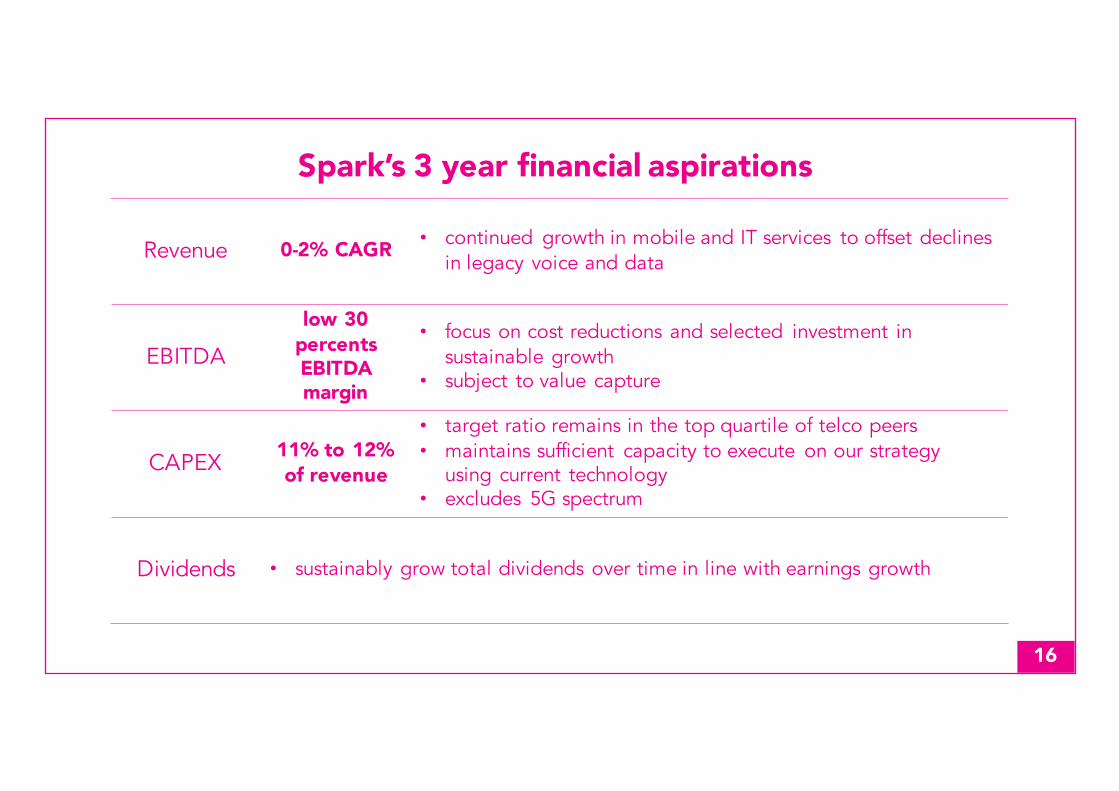
Spark’s 3 year financial aspirations
Revenue 0-2% CAGR • continued growth in mobile and IT services to offset declines in legacy voice and data
EBITDA
low 30percentsEBITDA margin
• focus on cost reductions and selected investment in sustainable growth
• subject to value capture
CAPEX 11% to 12% of revenue
• target ratio remains in the top quartile of telco peers• maintains sufficient capacity to execute on our strategy
using current technology• excludes 5G spectrum
Dividends • sustainably grow total dividends over time in line with earnings growth
SIMON MOUTTERMANAGING DIRECTOR
18
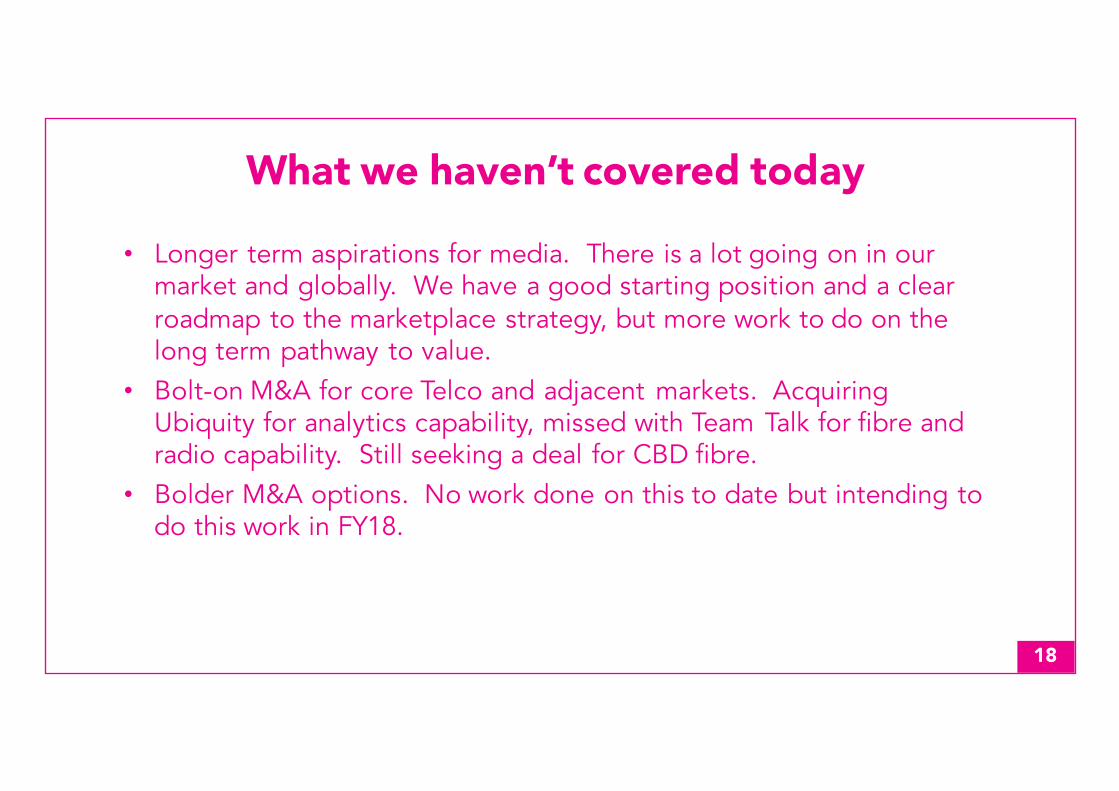
What we haven’t covered today
• Longer term aspirations for media. There is a lot going on in our market and globally. We have a good starting position and a clear roadmap to the marketplace strategy, but more work to do on the long term pathway to value.
• Bolt-on M&A for core Telco and adjacent markets. Acquiring Ubiquity for analytics capability, missed with Team Talk for fibre and radio capability. Still seeking a deal for CBD fibre.
• Bolder M&A options. No work done on this to date but intending to do this work in FY18.
19
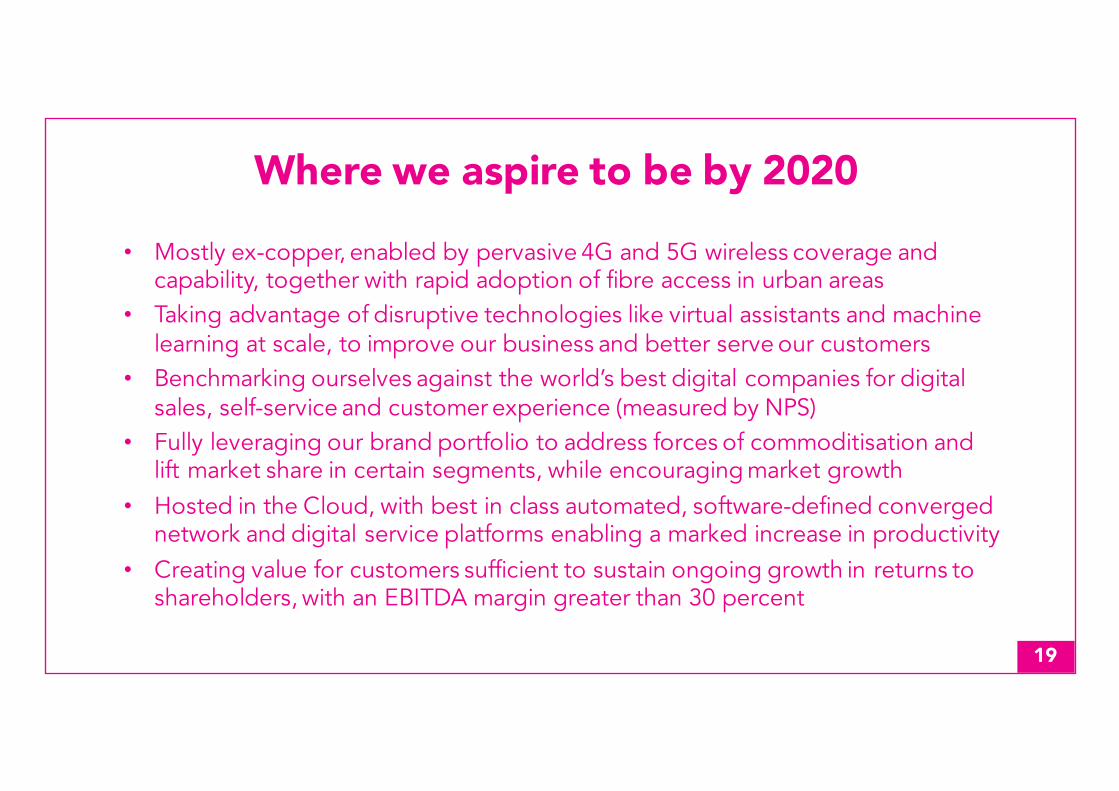
Where we aspire to be by 2020
• Mostly ex-copper, enabled by pervasive 4G and 5G wireless coverage and capability, together with rapid adoption of fibre access in urban areas
• Taking advantage of disruptive technologies like virtual assistants and machine learning at scale, to improve our business and better serve our customers
• Benchmarking ourselves against the world’s best digital companies for digital sales, self-service and customer experience (measured by NPS)
• Fully leveraging our brand portfolio to address forces of commoditisation and lift market share in certain segments, while encouraging market growth
• Hosted in the Cloud, with best in class automated, software-defined converged network and digital service platforms enabling a marked increase in productivity
• Creating value for customers sufficient to sustain ongoing growth in returns to shareholders, with an EBITDA margin greater than 30 percent
20
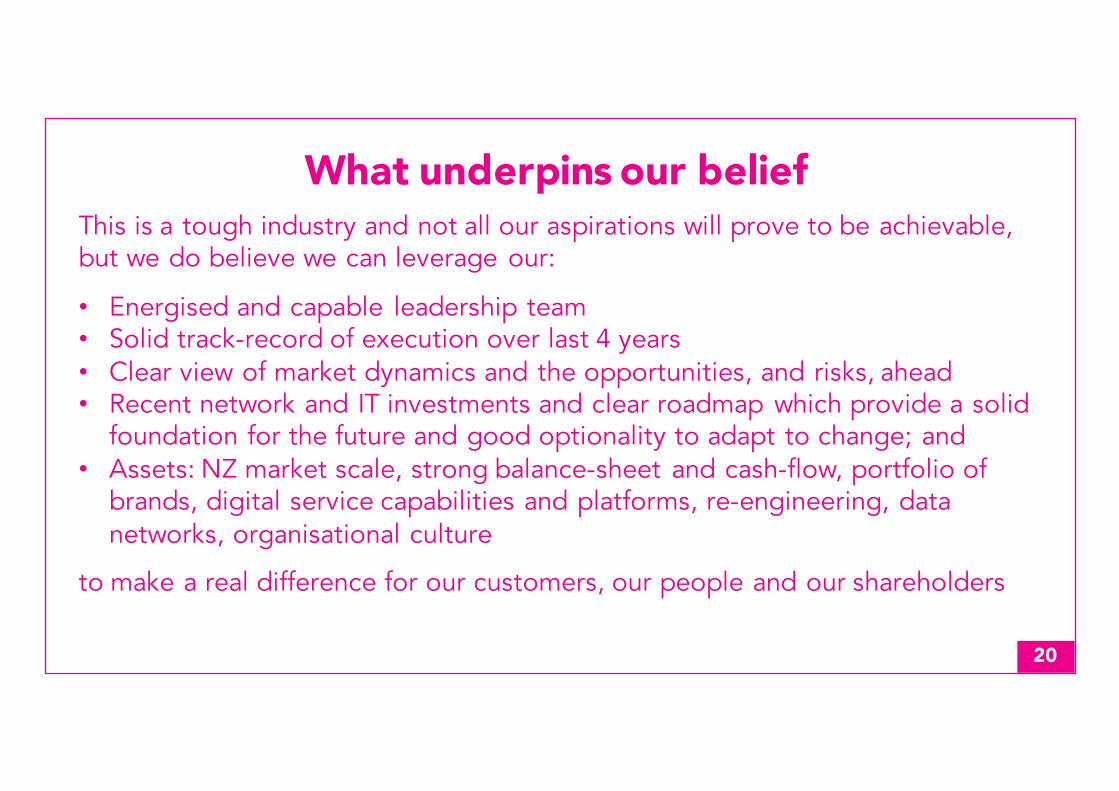
What underpins our beliefThis is a tough industry and not all our aspirations will prove to be achievable, but we do believe we can leverage our:
• Energised and capable leadership team• Solid track-record of execution over last 4 years• Clear view of market dynamics and the opportunities, and risks, ahead• Recent network and IT investments and clear roadmap which provide a solid
foundation for the future and good optionality to adapt to change; and• Assets: NZ market scale, strong balance-sheet and cash-flow, portfolio of
brands, digital service capabilities and platforms, re-engineering, data networks, organisational culture
to make a real difference for our customers, our people and our shareholders
21
DisclaimerThis announcement may include forward-looking statements regarding future events and the future financial performance of Spark New Zealand. Such forward-looking statements are based on the beliefs of and assumptions made by management along with information currently available at the time such statements were made.
These forward-looking statements may be identified by words such as ‘anticipate’, ‘believe’, ‘estimate’, ‘expect’, ‘intend’, ‘will’, ‘plan’, ‘may’, ‘could’, ‘ambition’, ‘aspiration’ and similar expressions. Any statements in this announcement that are not historical facts are forward-looking statements. These forward-looking statements are not guarantees or predictions of future performance, and involve known and unknown risks, uncertainties and other factors, many of which are beyond Spark New Zealand’s control, and which may cause actual results to differ materially from those projected in the forward-looking statements contained in this announcement.
Factors that could cause actual results or performance to differ materially from those expressed or implied in the forward-looking statements are discussed herein and also include Spark New Zealand's anticipated growth strategies, Spark New Zealand's future results of operations and financial condition, economic conditions and the regulatory environment in New Zealand, competition in the markets in which Spark New Zealand operates, risks related to the sharing arrangements with Chorus, other factors or trends affecting the telecommunications industry generally and Spark New Zealand’s financial condition in particular and risks detailed in Spark New Zealand's filings with NZX and ASX. Except as required by law or the listing rules of the stock exchanges on which Spark New Zealand is listed, Spark New Zealand undertakes no obligation to update any forward-looking statements whether as a result of new information, future events or otherwise.


![[Spark meetup] Spark Streaming Overview](https://img.pdfslide.us/doc/110x75/55a457161a28ab057e8b45fd/spark-meetup-spark-streaming-overview.jpg)
![Spark New Zealand [PDF 573KB]](https://img.pdfslide.us/doc/110x75/58a1ab8b1a28ab5c788bf8e3/spark-new-zealand-pdf-573kb.jpg)