Embed Size (px)
Citation preview
Spark New Zealand Limited ARBN 050 611 277 Spark City, 167 Victoria Street West, Private Bag 92028, Auckland, New Zealand
SILVANA ROEST Company Secretary Client Market Services NZX Limited Level 1, NZX Centre 11 Cable Street Wellington 6011 ASX Market Announcements Australian Securities Exchange 4th Floor, 20 Bridge Street Sydney NSW 2000 Australia 18 August 2017 SPARK NEW ZEALAND LIMITED FY17 RESULTS AND ANNUAL REPORT Dear Sir/Madam In accordance with the NZSX Listing Rules, I enclose the following for release to the market in relation to Spark New Zealand Limited’s FY17 results:
1. Appendix 1 2. Annual Report 3. Section 209 Notice 4. Appendix 7 (x2) 5. ESG Report 6. Media Release 7. FY17 Results Summary (containing FY18 earnings and dividend guidance) 8. Detailed financial information
Spark New Zealand’s Managing Director, Simon Moutter, and Chief Financial Officer, David Chalmers, will discuss the FY17 Results at 10:00am New Zealand time today. Spark New Zealand’s 2017 Annual Report is now available at: investors.sparknz.co.nz. ASX Appendix 3A.1 will follow this release. Yours sincerely
Silvana Roest Company Secretary
For
per
sona
l use
onl
y
1
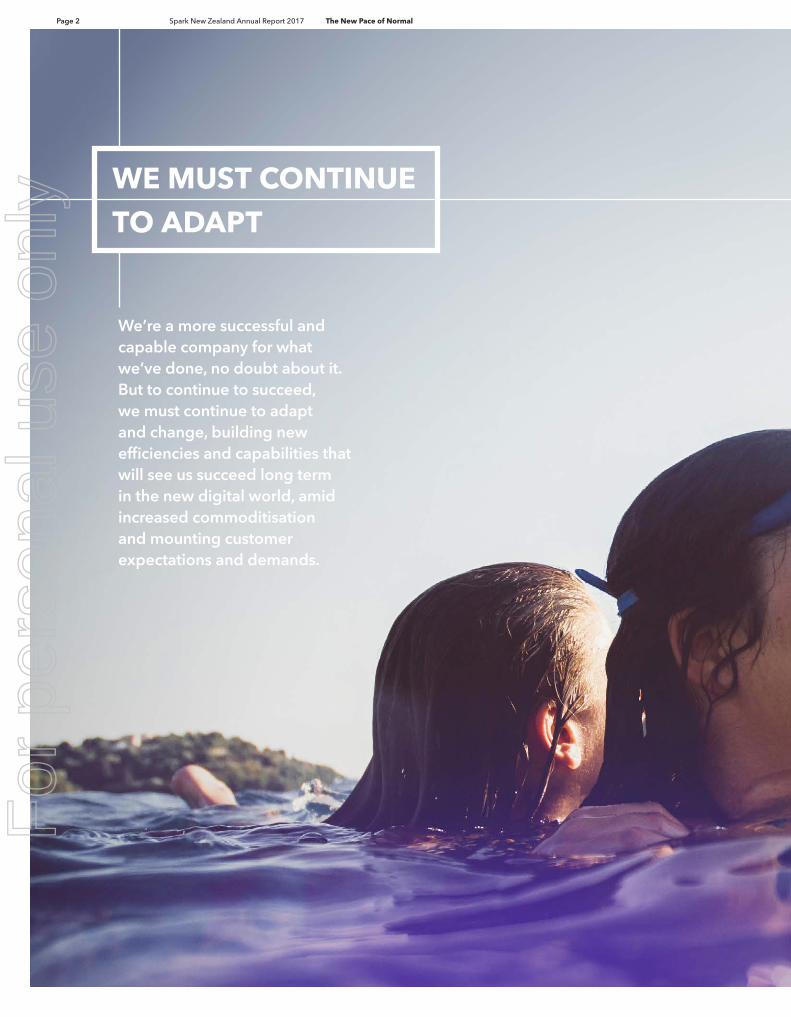
Spark New Zealand Limited Results for announcement to the market
Basis of Report: Audited financial statements Reporting Period: 12 months to 30 June 2017 Previous Reporting Period: 12 months to 30 June 2016
12 months ended
30 June 2017 (NZ$000)
Percentage change
Operating revenues and other gains
3,614,000 Up 3.3%
Earnings before interest, income tax, depreciation and amortisation
1,016,000 Up 3.0%
Net earnings after income tax attributable to security holders
418,000 Up 13.0%
Dividends
Amount per security (NZ$)
Imputed amount per security
Interim dividend Interim first half-year ordinary dividend 11.0cps 4.2778cps Interim first half-year special dividend 1.5cps 0.4375cps Final dividend Final second half-year ordinary dividend 11.0cps 4.2778cps1 Final second half-year special dividend 1.5cps 0.4375cps2 Total dividend 25.0cps 9.4306cps Final dividend record date 22 September 2017 Final dividend payment date 6 October 2017 1 A supplementary dividend of 1.9412 cents per security will be payable to shareholders who are not resident in New Zealand. 2 A supplementary dividend of 0.1985 cents per security will be payable to shareholders who are not resident in New Zealand.
For
per
sona
l use
onl
y

ANNUAL REPORT 2017
THE NEW PACE OF NORMAL
For
per
sona
l use
onl
y

THE NEW PACE OF NORMAL
Performance snapshot 2017 8
Chairman and Managing Director report 10
Board of Directors 14
Leadership Team 18
ENVIRONMENT, SOCIAL & GOVERNANCE REPORTING
22
Long-term growth 24
People & remuneration 26
Community 28
Environment 30
Governance 32
Risk 34
PERFORMANCE 36
Spark result overview 36
Spark Home, Mobile & Business 42
Spark Digital 43
Spark Connect & Platforms 44
Spark Ventures & Wholesale 45
FINANCIAL STATEMENTS 46
Financial statements 47
Notes to the financial statements 51
Independent auditor’s report 78
OTHER INFORMATION 83
Corporate governance and disclosures 83
Glossary 92
Directory 93
This report is dated 18 August 2017 and is signed on behalf of the Board of Spark New Zealand Limited by Mark Verbiest, Chairman, and Simon Moutter, Managing Director.
Mark VerbiestChairman
Simon MoutterManaging Director
Annual Meeting03.11.17
Half-year results announcement21.02.18
Financial year-end30.06.18
Contents
Key Dates
For
per
sona
l use
onl
y

Page 1
The speed at which consumers and businesses now expect to see change for the better continues to increase. Meeting their expectations requires us to continue to transform. In May 2013 we made the huge call to shift from being a traditional telecommunications infrastructure company to a future-oriented digital services provider. That decision prompted us to sell out of other markets and non-core businesses. It also saw us invest heavily in our mobile and fixed data networks and systems, develop new businesses like Qrious and Lightbox, buy Cloud businesses like Revera and CCL and partner with Spotify and Netflix.
TRANSFORMATION IS NOW BUSINESS AS USUAL
For
per
sona
l use
onl
y
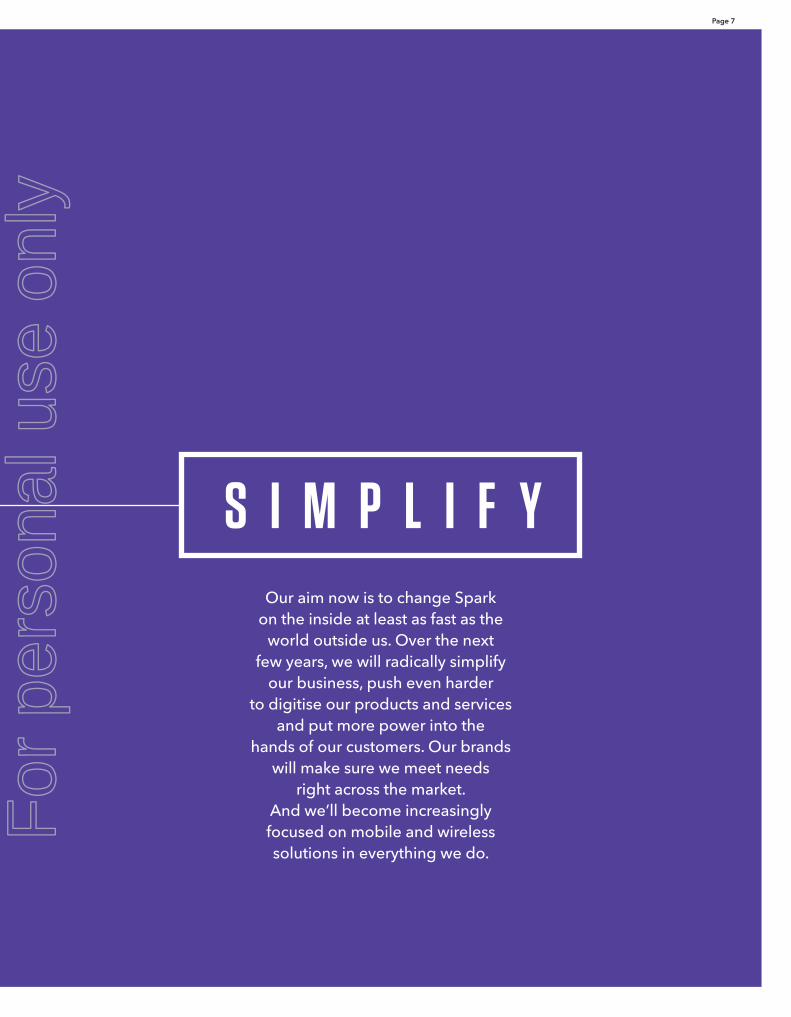
Page 2 Spark New Zealand Annual Report 2017 The New Pace of Normal
WE MUST CONTINUE TO ADAPT
We’re a more powerful and capable company for what we’ve done, no doubt about it. But to continue to succeed, we must continue to adapt and change, building new efficiencies and capabilities that will see us succeed long term in the new digital world, amid increased commoditisation and mounting customer expectations and demands.
We’re a more successful and capable company for what we’ve done, no doubt about it. But to continue to succeed, we must continue to adapt and change, building new efficiencies and capabilities that will see us succeed long term in the new digital world, amid increased commoditisation and mounting customer expectations and demands.
WE MUST CONTINUE TO ADAPT
For
per
sona
l use
onl
y

Page 3
For
per
sona
l use
onl
y

Page 4 Spark New Zealand Annual Report 2017 The New Pace of Normal
THINKING MORE AND MORE LIKE A TECH COMPANY
For
per
sona
l use
onl
y

Page 5
As consumers change how they consume content and demand more for less, as copper declines and next-generation fibre and wireless heads our way, Spark is increasingly thinking and planning as a technology company; digitising and simplifying our business to make it faster, more innovative and more efficient; seeking out ways to unleash the potential in all New Zealanders.
For
per
sona
l use
onl
y

Page 6 Spark New Zealand Annual Report 2017
TH E N E W G A M E
The New Pace of Normal
For
per
sona
l use
onl
y
Page 7
Our aim now is to change Spark on the inside at least as fast as the
world outside us. Over the next few years, we will radically simplify
our business, push even harder to digitise our products and services
and put more power into the hands of our customers. Our brands
will make sure we meet needs right across the market.
And we’ll become increasingly focused on mobile and wireless solutions in everything we do.
S I M P L I F Y
For
per
sona
l use
onl
y
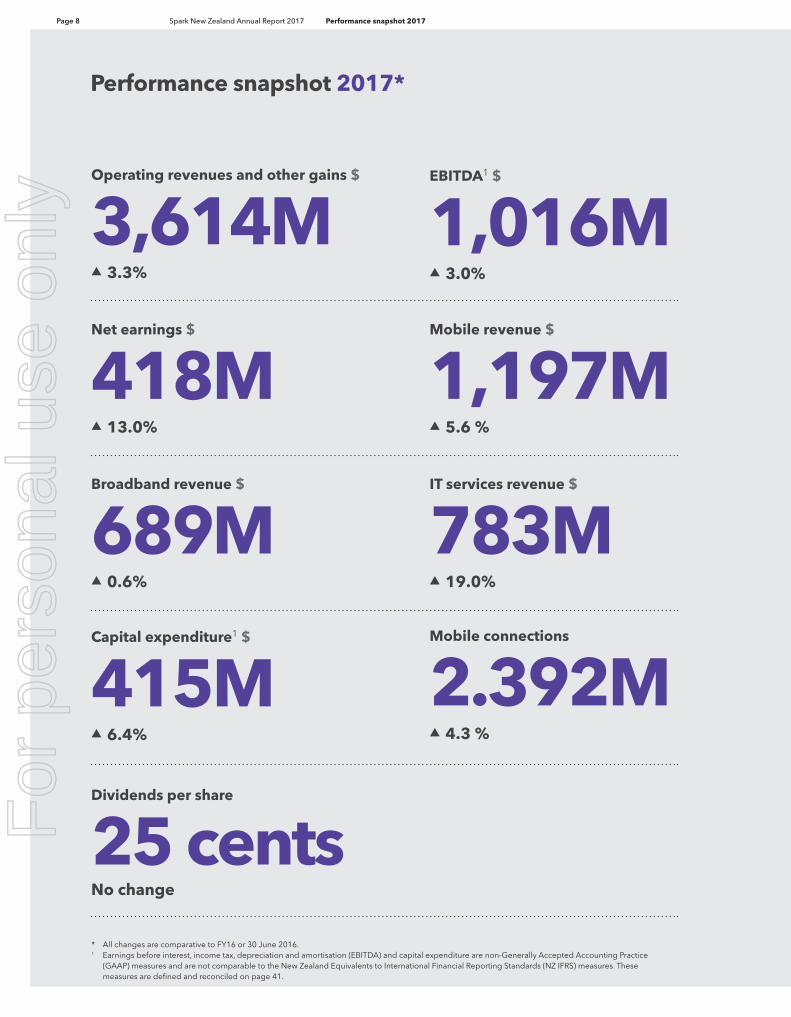
Page 8 Spark New Zealand Annual Report 2017 Performance snapshot 2017
Operating revenues and other gains $
3,614M▲ 3.3%
Net earnings $
418M▲ 13.0%
Dividends per share
25 centsNo change
IT services revenue $
783M▲ 19.0%
Mobile connections
2.392M▲ 4.3 %
Mobile revenue $
1,197M▲ 5.6 %
Broadband revenue $
689M▲ 0.6%
Capital expenditure1 $
415M▲ 6.4%
EBITDA1 $
1,016M▲ 3.0%
Performance snapshot 2017*
* All changes are comparative to FY16 or 30 June 2016.1 Earnings before interest, income tax, depreciation and amortisation (EBITDA) and capital expenditure are non-Generally Accepted Accounting Practice
(GAAP) measures and are not comparable to the New Zealand Equivalents to International Financial Reporting Standards (NZ IFRS) measures. These measures are defined and reconciled on page 41.
For
per
sona
l use
onl
y
Page 9
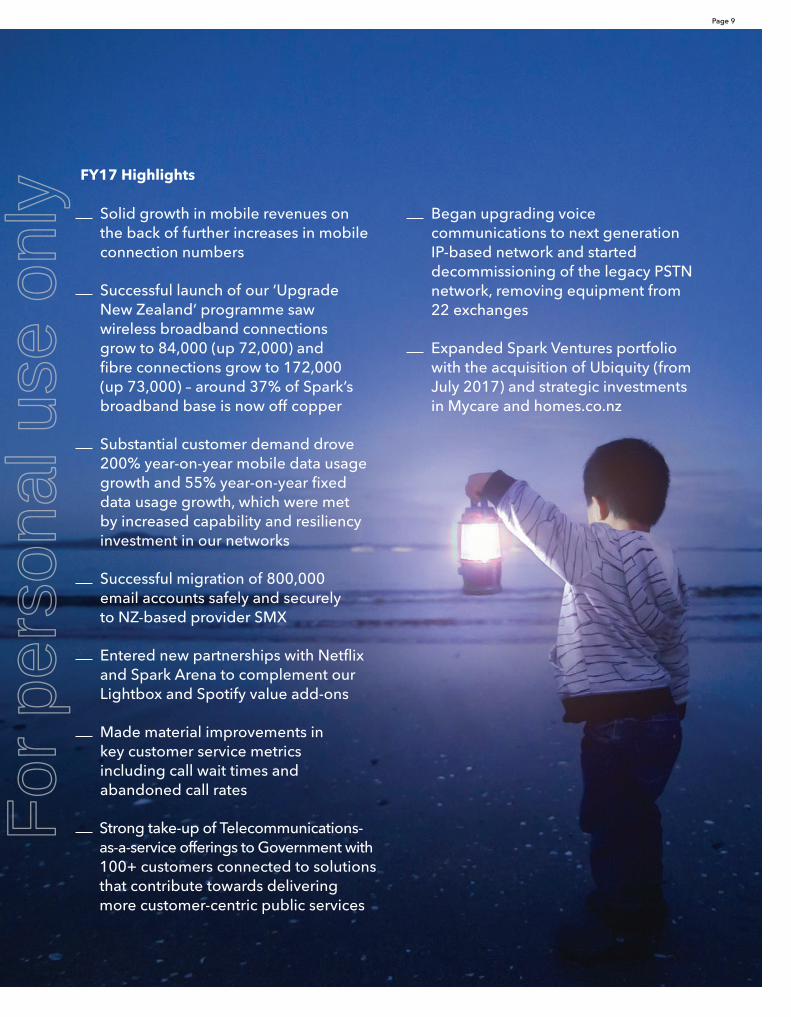
FY17 Highlights
Solid growth in mobile revenues on the back of further increases in mobile connection numbers
Successful launch of our ‘Upgrade New Zealand‘ programme saw wireless broadband connections grow to 84,000 (up 72,000) and fibre connections grow to 172,000 (up 73,000) – around 37% of Spark’s broadband base is now off copper
Substantial customer demand drove 200% year-on-year mobile data usage growth and 55% year-on-year fixed data usage growth, which were met by increased capability and resiliency investment in our networks
Successful migration of 800,000 email accounts safely and securely to NZ-based provider SMX
Entered new partnerships with Netflix and Spark Arena to complement our Lightbox and Spotify value add-ons
Made material improvements in key customer service metrics including call wait times and abandoned call rates
Strong take-up of Telecommunications-as-a-service offerings to Government with 100+ customers connected to solutions that contribute towards delivering more customer-centric public services
Began upgrading voice communications to next generation IP-based network and started decommissioning of the legacy PSTN network, removing equipment from 22 exchanges
Expanded Spark Ventures portfolio with the acquisition of Ubiquity (from July 2017) and strategic investments in Mycare and homes.co.nz
For
per
sona
l use
onl
y
Page 10 Spark New Zealand Annual Report 2017 Chairman and Managing Director report
In an exponentially evolving digital world, where change is the new normal, Spark must keep transforming itself to make the complex simple for customers and to help them make the most of possibilities offered by new technologies.
In 2013 we made the big call to shift from being a traditional infrastructure-focused telecommunications company to a future-oriented digital services provider. Since then we’ve reduced our costs so we can invest in new growth areas and offer more compelling propositions to our customers in competitive markets. We’ve sold out of other markets, like Australia, and out of non-core businesses to focus exclusively on unleashing the potential in all New Zealanders. We’ve invested heavily in our wireless and fibre data networks and IT systems to get fit for the digital future. We’ve developed new businesses, like Qrious and Lightbox; we’ve bought new Cloud businesses, like Revera and CCL; and we’ve partnered with the likes of Spotify and Netflix.
The result? We’ve halted years of financial decline and returned to sustainable, albeit modest, earnings growth. We have much fresher and stronger brands in the market, we’ve invested in the right areas to position Spark well for the future and our customers are increasingly telling us we’re doing a better job.
This has been reflected in the FY17 financial results, which were in line with our guidance for the year.
FY17 results on-planTop-line revenue growth for FY17 was solid at 3.3% taking revenue to $3.614 billion, on the back of continued strong performances in IT services, up 19.0%, and mobile, up 5.6%. This top-line performance, together with a continued focus on cost, helped to drive overall earnings before interest, income tax and depreciation and amortisation (EBITDA) growth of 3.0%, to $1.016 billion. Included in FY17 EBITDA was a $20 million gain from the sale of surplus land at Mayoral Drive in Auckland. This increased EBITDA, combined with a reduction in depreciation and amortisation, resulted in overall net earnings increasing a pleasing 13.0% to $418 million.
Higher short-term costs were incurred to address customer service challenges and to manage the workload arising from strong growth in Telecommunications-as-a-Service and IT service contract wins. In addition, there were costs related to the migration of customers off copper to wireless or fibre and from Yahoo to SMX email.
While Spark is performing well relative to its competitors, the market remains very competitive and the average profitability
Mark Verbiest Chairman
Simon Moutter Managing Director
The new pace of normal. FOR OUR
CUSTOMERS. FOR OUR BUSINESS.
For
per
sona
l use
onl
y
Page 11
of the wider industry has continued to be poor relative to the level of invested capital. In mobile and broadband particularly, commoditisation pressures mean that New Zealand consumers are getting significantly more data for their dollar every year.
While we’re proud of what we have achieved so far, and we’ve continued to execute our long-term strategy well and deliver good financial results, there are signs that fresh impetus is needed for the next phase of our transformation.
The world is more complex than everExponential change is being driven by digital technologies and new business models – and all industries are being impacted. In this new world, customer experience is the new source of market power, with disruptive digitally-oriented businesses putting more choice and control in the hands of consumers.
The role of digital services companies, like Spark, has never been more pivotal. Data connectivity has become pervasive and inexpensive, and customer demand for data is exploding. As an example, we’ve seen 200% year-on-year growth in data consumed on our mobile network over the past twelve months. Artificial intelligence,
machine learning, big data analytics and virtual assistants are no longer just theoretical but seriously changing the way businesses serve customers. The complexity of fast-changing technology has customers grappling with the pace of change, be it at home as they embrace video streaming, or at work moving their business into the Cloud with cyber security risks managed.
Meanwhile, customer preference is shifting rapidly to wireless, enabled by high-speed mobile coverage. In most homes, and increasingly in businesses, people are used to connecting wirelessly, whether by Wi-Fi to a fixed modem or through the mobile network to the nearest cell site. Most people want to be ‘always on’ and ‘always connected’ and able to do business anytime, anywhere. Spark is committed to delivering its customers the best possible experience, whether they are on wireless or fibre.
Increasingly, the companies most likely to win are those that cut through complexity to deliver a highly automated and slick digital self-service customer experience (ideally in a way that means customers can help themselves when and where they need to) and who have a simpler proposition to sell, maintain and support than their competitors.
So we’re fine-tuning our game plan and embracing simplicityThese are the forces and trends driving Spark to target three new focus areas in its strategy.
First, over the next few years, Spark will put even more resource into radically digitising and simplifying our products and services to put more power into the hands of customers and materially lower our cost of operating. This will not be at the expense of service quality – we will continue to invest in our people, networks, IT systems and platforms to ensure an excellent service experience.
Already we have successfully introduced Tinkerbot, an automated machine-learning fault diagnostic robot. Tinkerbot constantly monitors our networks, looking for patterns that indicate common faults, which it then automatically reports. This is already helping reduce the number of fault-based enquiries to our call centres.
...over the next few years, Spark will put even more resource into radically digitising and simplifying our products and services to put more power into the hands of customers and materially lower our cost of operating.
The reality is that exponential change is being driven by digital technologies and new business models – and all industries are being impacted. In this new world, customer experience is the new source of market power, with disruptive digitally-oriented businesses putting more choice and control in the hands of consumers.
For
per
sona
l use
onl
y
Page 12 Spark New Zealand Annual Report 2017
This reduction has been achieved despite the additional call centre service demands from the complex migration of hundreds of thousands of Xtra email accounts from Yahoo to NZ-based provider SMX completed during the year. Expect to see many more initiatives to digitise and simplify our products and services.
Our second new area of focus will be to better leverage all our brands, meeting the needs of all parts of the market – from those who want services packed with extra value, to the more price sensitive who want the basics done well with no frills. With more and more New Zealanders buying mobile or broadband services based primarily on price, being able to serve all market segments well is critically important. The FY17 year saw us take some big strides in this area, expanding the role of Skinny into broadband as well as mobile and we intend to make further such moves leveraging Skinny and other brands.
Our third new area of focus will be to meet the growing customer appetite for wireless technologies and the service experience they offer. We will increase our emphasis on investment in this area by pushing forward with new 4.5G capabilities and preparing the pathway to 5G, using speed and capacity advantages to deliver improved mobile and wireless broadband services and customer experiences. Our aspiration is to have 20%–25% of our broadband base on wireless broadband by 2020. Combined with our ongoing migration of customers to fibre broadband, we aim by this date to have 85% of our customers migrated away from copper on to new technologies.
While we will lift our emphasis on wireless broadband, we will not shirk our investment in other areas, including our Optical Transport Network and associated fibre assets, our Cloud and data centre
services, our software-defined networking and the migration from the old PSTN network to the new Converged Communications Network (CCN) that will enable us to deliver the IP-based voice services into the future.
To succeed, we’ll also need the right leaders and the right culture to drive ongoing change. We will continue to work on improving organisational health and culture and developing better and more diverse leadership. We have already seen improvements in the diversity of our Leadership Team and Directors and we expect that to continue. Within the business, we’re rapidly developing new ways of working, using agile methodologies and customer-centred design processes. We’re building the digital skills we believe will be needed for the Spark workforce of the future.
We know where we are going and how we are going to get there: by emphasising wireless and mobility; by using our portfolio of brands to better serve the growing number of price-sensitive customers; and by becoming the lowest cost operator through radically simplified and digitised processes, products and services.
The future looks bright.Spark is in a great position to navigate the new digital era. We have a strong balance sheet. We have invested well in our wireless and fibre data network leadership. Mobile and wireless broadband technology is rapidly advancing, with significant research and development investment going on globally. And with 4.5G mobile now a reality, and a pathway to 5G clearly emerging, we believe we are even better placed than previously for a wireless future.
Chairman and Managing Director report
Mark VerbiestChairman
Simon MoutterManaging Director
We’ve set ourselves up well to compete in the new digital services world. We’ve invested in all the right areas for the long term and we want to embrace the opportunities created by rapid change in technologies to keep driving better outcomes for our customers and to stay ahead of competitors. Our aim is to accelerate change at Spark and work hardest where we can make the biggest difference for our customers.
It’s a straightforward game plan. By embracing simplicity and turning the complex into the easy, we believe we can deliver for our customers, our shareholders, our people and for New Zealand.
18 August 2017
For
per
sona
l use
onl
y
Page 13
Mark VerbiestChairman
With best practice governance succession planning in mind, I have decided I will retire from the Board of Directors of Spark New Zealand at the Annual Meeting of shareholders in November this year.
More than half of the current Board, including myself, was appointed upon the demerger with Chorus in December 2011. At some point, it will be appropriate for each of the long-serving Directors to transition off the Board. As a consequence, I do not believe it would be good governance to risk having several directors potentially retiring in short order, and, as the director with the longest association with Spark and its predecessor Telecom I prefer to lead by example. In my view, the foundation for future success is solid, and I feel the time to renew the Chairmanship is now.
I am personally pleased the Board has decided to appoint current director Justine Smyth as the new Chair, effective on 3 November 2017. Justine has extensive governance experience, including as Chair of the Audit and Risk Management and the Human Resources and Compensation Committees of Spark.
In other changes that reinforce the strength and diversity of Board succession planning, on my retirement Justine will succeed me as Chair of the Nominations and Corporate Governance Committee,
Alison Gerry will succeed Justine as the Chair of the Audit and Risk Management Committee, while Alison Barrass will succeed Justine as the Chair of the Human Resources and Compensation Committee. The Board will commence a recruitment process for a new director in due course, and will take the time to ensure the right person with the right set of skills is found.
I have been in a fortunate position to see the full extent of the transformation that this business has undergone. From the days when Telecom was reborn as a single entity to the transformation from Telecom to Spark, through to its current incarnation as a highly competitive and innovative digital services company focused only on New Zealand customers, the change has been enormous.
With Justine as the new Chair alongside the diverse skills of our other talented directors, I believe the future of the Board is in very good hands.
Thank you for your continued support of Spark as a shareholder. Spark is a business that I firmly believe will continue to play a major role in our country’s future in the decades to come. It’s been an absolute privilege to serve as the Chairman of this iconic New Zealand business, and I look forward to watching its continued success in future as a Spark shareholder and customer.
Governance changes
For
per
sona
l use
onl
y
Page 14 Spark New Zealand Annual Report 2017 Board of Directors
.1 Mark Verbiest CHAIRMAN Non-executive Director
.2 Alison Barrass Non-executive Director
.3 Paul Berriman Non-executive Director
.4 Alison Gerry Non-executive Director
.5 Ido Leffler Non-executive Director
.6 Charles Sitch Non-executive Director
.7 Justine Smyth Non-executive Director
.8 Simon Moutter Managing Director
Our Board remains focused on delivering better outcomes for our customers, our shareholders, our people and for New Zealand.
For
per
sona
l use
onl
y

Page 15
.1
.3
.5
.7 .8
.4
.2
.6
For
per
sona
l use
onl
y
Page 16 Spark New Zealand Annual Report 2017
Mark Verbiest, ChairmanNon-executive Director
Mark joined the Board in December 2011. Mark’s experience in the telecommunications sector extends over more than a decade, including 7½ years on the Company’s senior executive team from 2000. Mark is an experienced company director, serving as director of ANZ Bank New Zealand Limited, Meridian Energy Limited and Freightways Limited, Chairman of Willis Bond Capital Partners Limited and Willis Bond General Partner Limited, a member of the Commercial Operations Advisory Board of the New Zealand Treasury and the Treasury Board and is a former board member of the Financial Markets Authority. He is also a trustee of the Southern Lakes Arts Festival Trust and a consultant to national law firm Simpson Grierson. Mark has a law degree from Victoria University of Wellington.
Alison BarrassNon-executive Director
Alison joined the Board in September 2016. With over 20 years’ experience at major international fast-moving consumer goods (FMCG) companies, including PepsiCo, Kimberley Clark, Watties and Goodman Fielder, Alison has considerable experience in the fast-moving consumer goods sector and in governance, leadership and marketing-led innovation. Currently on the boards of plumbing hardware manufacturer Methven, Gough Group, Heilala Vanilla and Rockit Global, Alison brings a broad range of skills to the Spark Board, including an extensive marketing career and the execution of a number of significant business transformation projects in privately owned and publicly-listed organisations. Alison was also Chairperson of the Breast Cancer Research Trust for three years, a director of The Parenting Place and of the New Zealand Food and Grocery Council.
Paul BerrimanNon-executive Director
Paul joined the Board in December 2011, bringing over 25 years of international experience in telecommunications, media and convergence. Paul is the Group Chief Technology Officer of the HKT Trust, the listed telecommunications arm of PCCW. He is primarily responsible for leading the group’s product and technology roadmap and strategic development. In 2009 Paul was recognised by the IPTV World Forum with their Special Merit Award for Outstanding Industry Contribution and in 2008 he was listed as one of the Global Telecoms Business Magazine’s top 100 “most influential persons in telecoms”. Before joining PCCW in 2002, Paul was Managing Director of management consultancy Arthur D. Little in Hong Kong and also held roles in Reuters and several major Hong Kong service providers. Paul holds a Bachelor of Science degree in electro-acoustics from the University of Salford in the United Kingdom and a Master of Business Administration degree from the University of Hong Kong. A Chartered Engineer, he is a current or former member of a number of industry working groups and advisory boards.
Alison GerryNon-executive Director
Alison joined the Board in July 2016. Alison has more than 20 years of experience working for both corporates and financial institutions in Auckland, Sydney, Hong Kong, Tokyo and London in trading, finance and risk roles. Alison was also a Visiting Fellow at Macquarie University for 12 years until 2011. From 2007 Alison has been a professional company director and is currently also a director of Infratil and Vero and on the board of Wellington Airport. Alison is also former Deputy Chair of Kiwibank and a former director of TVNZ and NZX. Alison has an honours degree in Management Studies from Waikato University and a Masters of Applied Finance from Macquarie University.
Board of Directors
For
per
sona
l use
onl
y
Page 17
Ido Leffler Non-executive Director
Ido joined the Board in July 2014. He is a serial entrepreneur, splitting his time between Australia and the United States with experience developing digital brands and extensive networks in the start-up communities of Silicon Valley and Australasia. Ido is the co-founder and Chief Executive Officer at Yoobi, a school supplies company that engages kids through bright colours, cool designs and, most importantly, cause. He is also co-founder of Yes To Inc. – a leading global natural beauty brand, Co-founder and Chairman of Brandless – a disruptive consumer packaged goods company and the Chairman of Beach House Group, a global consumer products solutions house. Ido sits on numerous corporate/advisory boards, including The United Nations Foundation Global Entrepreneur Council.
Charles SitchNon-executive Director
Charles joined the Board in December 2011. He worked for McKinsey & Company from 1987 and in 2000 became a senior director, primarily working with CEOs and boards on strategy and operations turnarounds, before retiring in 2010. Since 2006 he has been involved in various new business ventures. Charles is also Chairman of the board of Trinity College at the University of Melbourne and a committee member of the Melbourne Cricket Club. Charles holds an MBA from Columbia Business School and an LLB and BCom from Melbourne University. He is also a graduate of the Australian Institute of Company Directors.
Justine SmythNon-executive Director
Justine joined the Board in December 2011. Her background is in finance and business management (with Deloitte and Lion Nathan). She is currently a director of Auckland International Airport Limited and Chair of Breast Cancer Foundation NZ. Former governance roles include being a board member of the Financial Markets Authority and Deputy Chair of New Zealand Post Limited. Justine’s experience in governance, mergers and acquisitions, taxation and financial performance of large corporate enterprises, as well as actively investing in small and medium enterprises underpins her contribution as a Director. Justine has a Bachelor of Commerce from Auckland University and is a fellow of the New Zealand Institute of Chartered Accountants.
Simon MoutterManaging Director
As Managing Director Simon is responsible for the overall leadership, strategic direction and management of Spark New Zealand, through its various business divisions and the brands that provide digital services to millions of New Zealanders and thousands of New Zealand businesses. Simon has led the reinvention of Telecom to Spark, to better reflect the fast-changing new world of digital services in which the business now operates. As a passionate and committed Kiwi, his ambition is for Spark to help all New Zealanders live more amazing lives and build more successful businesses, through the power of digital technology. Simon returned to the company in mid-2012, having managed most parts of Telecom as Chief Operating Officer during the years 2003–2008. In the intervening years he led Auckland International Airport for a period of four years, during which he transformed the customer experience and delivered a significant uplift in its growth trajectory. Simon also spent 13 years in the electricity and gas industry, including as Chief Executive of Powerco (1992 to 1999). Simon has a Master's degree in Engineering from the University of Canterbury and a Bachelor's degree in Science from Massey University. He lives with his wife Sophie and two of his children, Ben and Jack, in Auckland. Together they are into school activities, sports, fishing and travel and sometimes the family indulges Simon’s interest in race horses.
For
per
sona
l use
onl
y
Page 18 Spark New Zealand Annual Report 2017 Leadership Team
.1 Claire Barber Chief Digital Officer, Spark Platforms
.2 Mark Beder Chief Operating Officer, Spark Connect
.3 David Chalmers Chief Financial Officer
.4 Jolie Hodson CEO Spark Digital
.5 Ed Hyde CEO Spark Ventures & Wholesale
.6 Joe McCollum Group HR Director
.7 Jason Paris CEO Spark Home, Mobile & Business
The Leadership of Spark is committed to achieving ambitious goals and to playing an active part in New Zealand’s future success.
For
per
sona
l use
onl
y

Page 19
.1 .2
.3
.5
.7
.4
.6
For
per
sona
l use
onl
y
Page 20 Spark New Zealand Annual Report 2017
Claire Barber Chief Digital Officer, Spark Platforms
Claire Barber is the Chief Digital Officer for Spark and leads Spark Platforms. A key partner to Spark Home, Mobile & Business, Spark Digital and Spark Ventures & Wholesale, and drawing on expertise from across the company, Spark Platforms is responsible for ensuring Spark’s products and services are truly digital and that our customers’ needs are at the centre of everything Spark does. Claire joined Spark in July 2011 as General Manager of Change and Technology, where she led strategic initiatives that include IT in-sourcing, developing new operating models and simplifying processes and products. Her team was responsible for a three-year, multi-million dollar re-engineering programme that has successfully modernised Spark’s legacy IT systems and migrated millions of customer records to those systems, resulting in faster delivery of customer services. Claire’s team was also critical in managing Spark’s rebrand in 2014. Claire brings to the role more than 20 years of experience in international technology and telecommunications, having held sales and management roles at IBM, working with clients in China and India and the Asia Pacific region. Prior to that she was a lecturer and Assistant Dean at the University of Auckland and has a PhD from the University of Northumbria in the United Kingdom (UK).
Mark BederChief Operating Officer, Spark Connect
Mark Beder is the Chief Operating Officer of Spark and leads Spark Connect, which designs, builds and maintains Spark’s core networks, IT and physical infrastructure, including property and data centres. Mark is responsible for building the best network experience and optimising the huge investments in data networks, mobile and IT to set Spark up for success and growth and to enable New Zealand’s digital future. Since joining the company in 2003 Mark has held several senior roles. His previous role was General Manager Value Management, with responsibility for Group Procurement, IT and network investment, management of the Chorus relationship and mobile capacity. Mark successfully drove major initiatives and innovation, such as Spark’s mobile network, cost management improvements and the upgrade of the Optical Transport Network. Prior to that Mark was the General Manager responsible for demerger of the operations of Telecom from Chorus in 2011. Before joining Spark Mark worked as a Senior Manager for Ernst and Young Consulting in Auckland. He has a Bachelor’s Degree in Commerce from the University of Auckland.
David ChalmersChief Financial Officer
David joined Spark in October 2016 as the Chief Financial Officer. Drawing on extensive digital and online experience, David’s role is to drive clear insights into what customers value, what makes the business more competitive and what delivers value for Spark in competitive and rapidly changing digital markets. Prior to joining Spark David was Chief Financial Officer for Mediaworks, including a period of time as interim Chief Executive Officer. Prior to Mediaworks he held a number of senior financial and general management roles with iSelect Limited, DuluxGroup Limited and Macquarie Capital. David has an MBA from INSEAD Business School and a Bachelor of Commerce (Hons) from the University of Melbourne.
Jolie HodsonCEO Spark Digital
Jolie succeeded Tim Miles as Chief Executive of Spark Digital in October 2016 after serving as the Chief Financial Officer for Spark for three years. Spark Digital provides converged ICT solutions for the rapidly evolving needs of business, enterprise and government customers, as they meet the demands of an increasingly globalised, connected and mobile customer base. Spark Digital’s unique capability in delivering the best ICT solutions in New Zealand, inspired and fully supported by the power of Spark, makes it possible for its customers to contribute to the overall economic success of New Zealand. Jolie understands dynamic, competitive markets and focuses on developing clear insight into what customers value, what makes the business more competitive and what delivers value for Spark. Prior to joining the company as Chief Financial Officer, Jolie worked for 12 years with the Lion group, Australasia's largest beverages group, in a range of senior financial roles. Most recently she was Finance Director of the Beer, Spirits & Wine Australia division. Before joining Lion in 2000 Jolie spent eight years with Deloitte's audit division based in Auckland, rising to Senior Audit Manager. She gained a Bachelor of Commerce from the University of Auckland and has attended the Strategic Management Program at Sydney's Macquarie Graduate School of Management.
Leadership Team
For
per
sona
l use
onl
y
Page 21
Ed HydeCEO Spark Ventures & Wholesale
Ed is the CEO of Spark Ventures & Wholesale, a business unit formed in early 2013 to accelerate the company’s pace of innovation and to deliver the connected digital experiences customers love. The business has recently extended its strategy to accelerate growth and broaden its portfolio across invest, partner and build options. Since inception the Spark Ventures portfolio has included a range of businesses that have been spun back into the broader Spark group. The current portfolio includes Wholesale, Qrious and Morepork, as well as a growing portfolio of direct investments in early stage businesses.
Ed joined Spark in 2006 and was most recently CEO of Qrious, a big data and analytics business which launched in March 2014 tasked with delivering value to customers through the better use of data. Prior to this he was responsible for the development of a number of start-ups in the data and mobile domain in both the UK and New Zealand and spent a number of years as GM of Mobile for Spark. He has a passion for digital, transformational technologies and disruptive business models. He is a keen runner and cyclist with his most notable sporting achievement being 10th place in the 2010 Xterra World Trail running championships in Hawaii. Ed has a BSc in Materials and Engineering gained from the University of Manchester.
Joe McCollumGroup HR Director
Joe McCollum joined Spark in November 2012 as Group HR Director, bringing over 30 years of global experience in leading transformational HR initiatives at companies undergoing significant change and operating in rapidly changing markets. Joe understands the critical importance of organisational culture on success and is influencing the cultural shift under way within Spark. Prior to joining Spark he worked in the UK in the music and media businesses – initially with EMI in 2004, managing the sale of EMI to a private equity company, before joining news media group DMGT in 2008. He remained with DMGT until returning to New Zealand in 2012, where he had previously worked in the hospitality industry as HR Director for Lion Nathan between 1989 and 1996. At the end of 1997 he returned to the UK to take up the role of worldwide HR Director for ICI, a global chemical company with 65,000 employees. He joined Misys in 1999 – a global software company recognised as a world leader in various segments. Joe also worked in Saudi Arabia for five years in the 1970s as the HR Director for a 4,500-staff hospital company before joining Pepsi initially in Cyprus and then in the headquarters in New York. He obtained his MSc in Business Studies from Columbia University.
Jason ParisCEO Spark Home, Mobile & Business
Jason Paris is the CEO of Spark Home, Mobile & Business, leading the Spark, Skinny, Big Pipe and Lightbox teams that provide more than two million New Zealand consumers and small and medium enterprises (SMEs) with access to the technology, digital and entertainment services they need to unleash their potential. Jason joined Spark in 2011 and was pivotal in the transformation from Telecom to Spark and in securing a number of our partnerships with global brands, such as Spotify and Netflix. Passionate about our customers and our people, Jason is the executive sponsor of Spark’s Emerging Women Leaders programme and has a strong commercial, strategy and marketing background, particularly in the technology, retail and media sectors from executive roles in New Zealand and Europe.
For
per
sona
l use
onl
y

Page 22 Spark New Zealand Annual Report 2017 Environment, Social & Governance Reporting
Our environmental, social & governance commitments
For
per
sona
l use
onl
y
Page 23
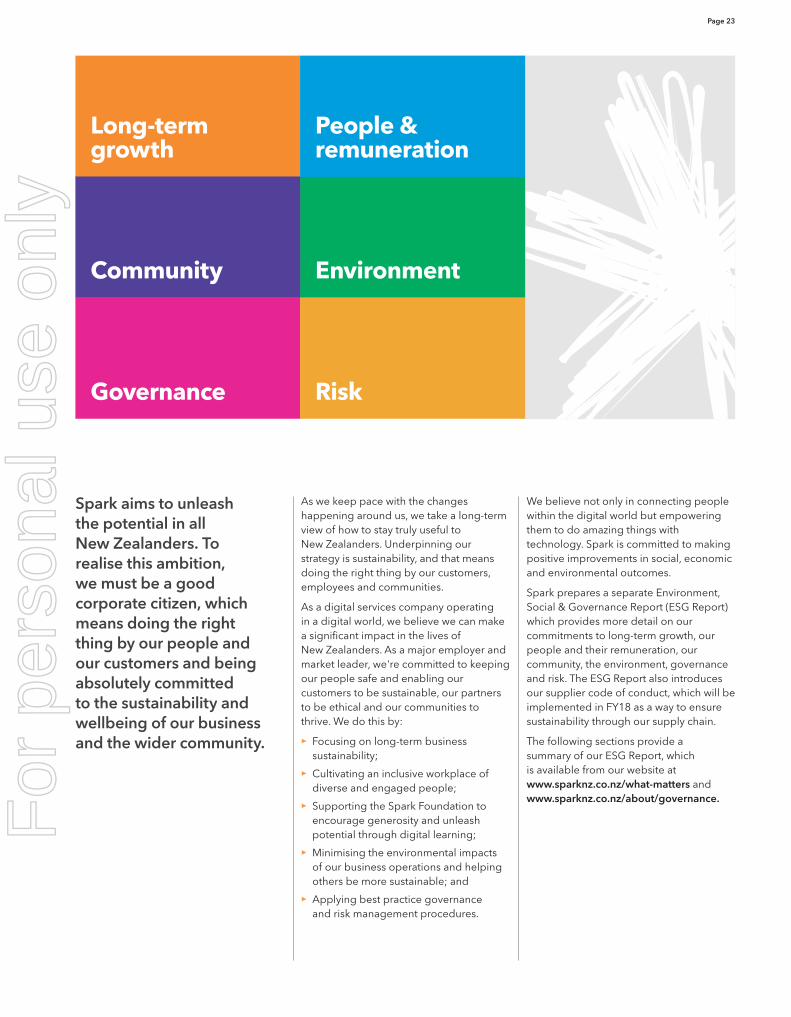
As we keep pace with the changes happening around us, we take a long-term view of how to stay truly useful to New Zealanders. Underpinning our strategy is sustainability, and that means doing the right thing by our customers, employees and communities.
As a digital services company operating in a digital world, we believe we can make a significant impact in the lives of New Zealanders. As a major employer and market leader, we're committed to keeping our people safe and enabling our customers to be sustainable, our partners to be ethical and our communities to thrive. We do this by:
>> Focusing on long-term business sustainability;
>> Cultivating an inclusive workplace of diverse and engaged people;
>> Supporting the Spark Foundation to encourage generosity and unleash potential through digital learning;
>> Minimising the environmental impacts of our business operations and helping others be more sustainable; and
>> Applying best practice governance and risk management procedures.
Spark aims to unleash the potential in all New Zealanders. To realise this ambition, we must be a good corporate citizen, which means doing the right thing by our people and our customers and being absolutely committed to the sustainability and wellbeing of our business and the wider community.
We believe not only in connecting people within the digital world but empowering them to do amazing things with technology. Spark is committed to making positive improvements in social, economic and environmental outcomes.
Spark prepares a separate Environment, Social & Governance Report (ESG Report) which provides more detail on our commitments to long-term growth, our people and their remuneration, our community, the environment, governance and risk. The ESG Report also introduces our supplier code of conduct, which will be implemented in FY18 as a way to ensure sustainability through our supply chain.
The following sections provide a summary of our ESG Report, which is available from our website at www.sparknz.co.nz/what-matters and www.sparknz.co.nz/about/governance.
IMAGE
Long-term growth
People & remuneration
Community Environment
Governance Risk
For
per
sona
l use
onl
y
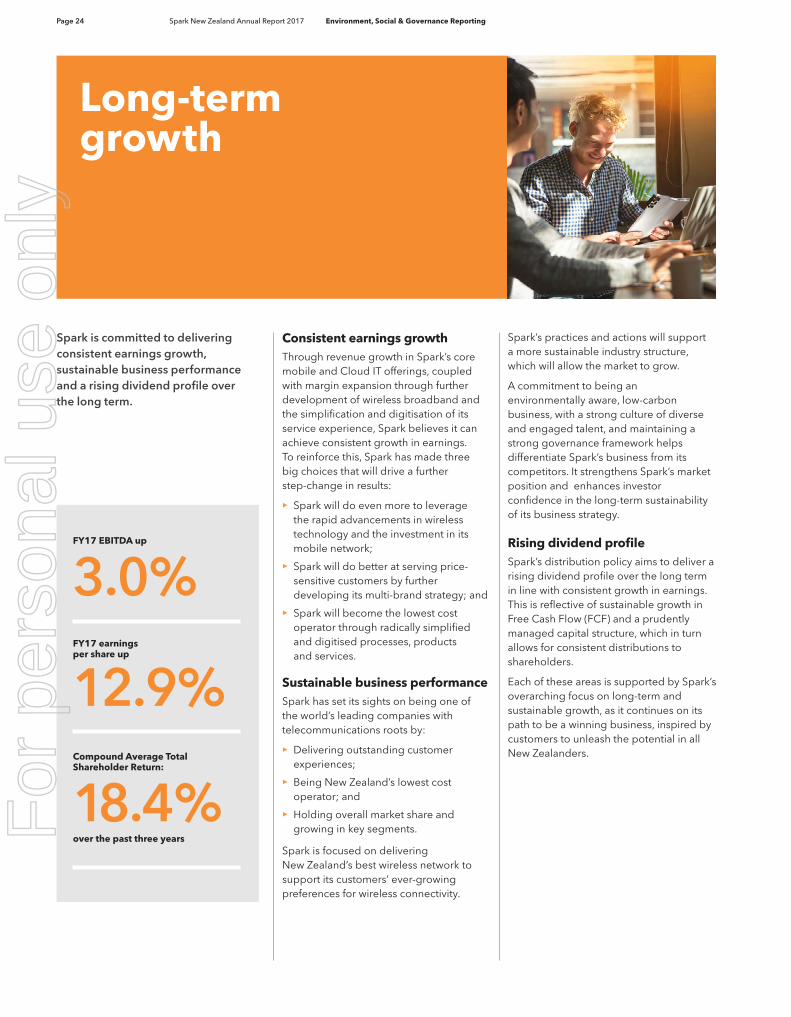
Page 24 Spark New Zealand Annual Report 2017 Environment, Social & Governance Reporting
Consistent earnings growthThrough revenue growth in Spark’s core mobile and Cloud IT offerings, coupled with margin expansion through further development of wireless broadband and the simplification and digitisation of its service experience, Spark believes it can achieve consistent growth in earnings. To reinforce this, Spark has made three big choices that will drive a further step-change in results:
>> Spark will do even more to leverage the rapid advancements in wireless technology and the investment in its mobile network;
>> Spark will do better at serving price-sensitive customers by further developing its multi-brand strategy; and
>> Spark will become the lowest cost operator through radically simplified and digitised processes, products and services.
Sustainable business performanceSpark has set its sights on being one of the world’s leading companies with telecommunications roots by:
>> Delivering outstanding customer experiences;
>> Being New Zealand’s lowest cost operator; and
>> Holding overall market share and growing in key segments.
Spark is focused on delivering New Zealand’s best wireless network to support its customers’ ever-growing preferences for wireless connectivity.
Spark is committed to delivering consistent earnings growth, sustainable business performance and a rising dividend profile over the long term.
Spark’s practices and actions will support a more sustainable industry structure, which will allow the market to grow.
A commitment to being an environmentally aware, low-carbon business, with a strong culture of diverse and engaged talent, and maintaining a strong governance framework helps differentiate Spark’s business from its competitors. It strengthens Spark’s market position and enhances investor confidence in the long-term sustainability of its business strategy.
Rising dividend profileSpark’s distribution policy aims to deliver a rising dividend profile over the long term in line with consistent growth in earnings. This is reflective of sustainable growth in Free Cash Flow (FCF) and a prudently managed capital structure, which in turn allows for consistent distributions to shareholders.
Each of these areas is supported by Spark’s overarching focus on long-term and sustainable growth, as it continues on its path to be a winning business, inspired by customers to unleash the potential in all New Zealanders.
over the past three years
FY17 EBITDA up
FY17 earnings per share up
Compound Average Total Shareholder Return:
3.0%
12.9%
18.4%
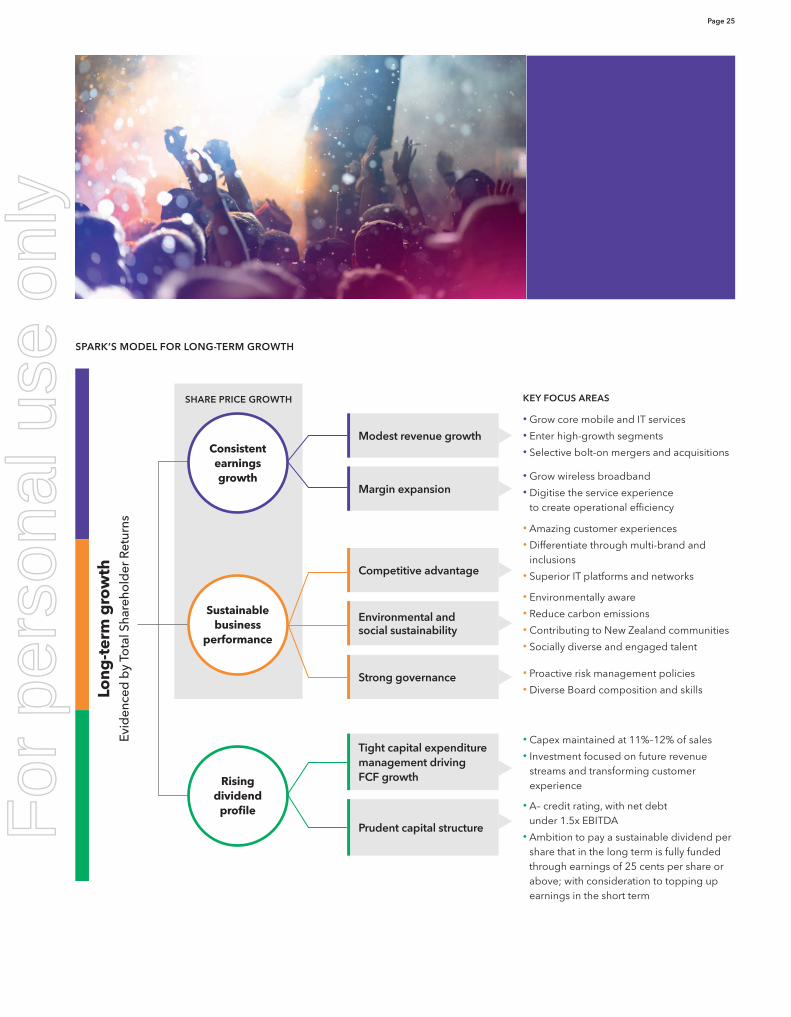
Long-term growth
For
per
sona
l use
onl
y
Page 25
Modest revenue growth
Tight capital expenditure management driving FCF growth
Competitive advantage
Margin expansion
Prudent capital structure
Environmental and social sustainability
Strong governance
• Grow core mobile and IT services• Enter high-growth segments• Selective bolt-on mergers and acquisitions
• Grow wireless broadband• Digitise the service experience
to create operational efficiency
• Amazing customer experiences• Differentiate through multi-brand and
inclusions• Superior IT platforms and networks
• Environmentally aware • Reduce carbon emissions• Contributing to New Zealand communities• Socially diverse and engaged talent
• Proactive risk management policies• Diverse Board composition and skills
• Capex maintained at 11%–12% of sales• Investment focused on future revenue
streams and transforming customer experience
• A– credit rating, with net debt under 1.5x EBITDA
• Ambition to pay a sustainable dividend per share that in the long term is fully funded through earnings of 25 cents per share or above; with consideration to topping up earnings in the short term
Rising dividend
profile
KEY FOCUS AREAS
Long
-ter
m g
row
thEv
iden
ced
by
Tota
l Sha
reho
lder
Ret
urns
SHARE PRICE GROWTH
Sustainable business
performance
Consistent earnings growth
SPARK’S MODEL FOR LONG-TERM GROWTH
For
per
sona
l use
onl
y
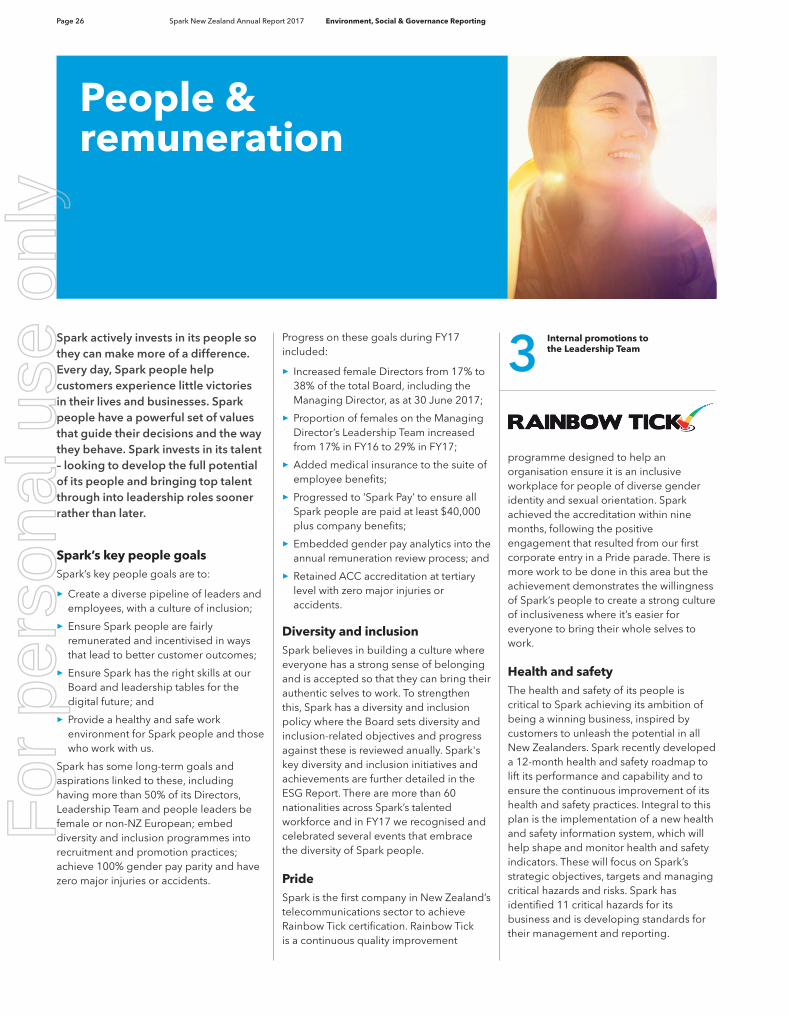
Page 26 Spark New Zealand Annual Report 2017 Environment, Social & Governance Reporting
Progress on these goals during FY17 included:
> Increased female Directors from 17% to 38% of the total Board, including the Managing Director, as at 30 June 2017;
> Proportion of females on the Managing Director’s Leadership Team increased from 17% in FY16 to 29% in FY17;
> Added medical insurance to the suite of employee benefits;
> Progressed to ‘Spark Pay’ to ensure all Spark people are paid at least $40,000 plus company benefits;
> Embedded gender pay analytics into the annual remuneration review process; and
> Retained ACC accreditation at tertiary level with zero major injuries or accidents.
Diversity and inclusion Spark believes in building a culture where everyone has a strong sense of belonging and is accepted so that they can bring their authentic selves to work. To strengthen this, Spark has a diversity and inclusion policy where the Board sets diversity and inclusion-related objectives and progress against these is reviewed anually. Spark's key diversity and inclusion initiatives and achievements are further detailed in the ESG Report. There are more than 60 nationalities across Spark’s talented workforce and in FY17 we recognised and celebrated several events that embrace the diversity of Spark people.
PrideSpark is the first company in New Zealand’s telecommunications sector to achieve Rainbow Tick certification. Rainbow Tick is a continuous quality improvement
Spark actively invests in its people so they can make more of a difference. Every day, Spark people help customers experience little victories in their lives and businesses. Spark people have a powerful set of values that guide their decisions and the way they behave. Spark invests in its talent – looking to develop the full potential of its people and bringing top talent through into leadership roles sooner rather than later.
Spark’s key people goalsSpark’s key people goals are to:
> Create a diverse pipeline of leaders and employees, with a culture of inclusion;
> Ensure Spark people are fairly remunerated and incentivised in ways that lead to better customer outcomes;
> Ensure Spark has the right skills at our Board and leadership tables for the digital future; and
> Provide a healthy and safe work environment for Spark people and those who work with us.
Spark has some long-term goals and aspirations linked to these, including having more than 50% of its Directors, Leadership Team and people leaders be female or non-NZ European; embed diversity and inclusion programmes into recruitment and promotion practices; achieve 100% gender pay parity and have zero major injuries or accidents.
programme designed to help an organisation ensure it is an inclusive workplace for people of diverse gender identity and sexual orientation. Spark achieved the accreditation within nine months, following the positive engagement that resulted from our first corporate entry in a Pride parade. There is more work to be done in this area but the achievement demonstrates the willingness of Spark’s people to create a strong culture of inclusiveness where it’s easier for everyone to bring their whole selves to work.
Health and safetyThe health and safety of its people is critical to Spark achieving its ambition of being a winning business, inspired by customers to unleash the potential in all New Zealanders. Spark recently developed a 12-month health and safety roadmap to lift its performance and capability and to ensure the continuous improvement of its health and safety practices. Integral to this plan is the implementation of a new health and safety information system, which will help shape and monitor health and safety indicators. These will focus on Spark’s strategic objectives, targets and managing critical hazards and risks. Spark has identified 11 critical hazards for its business and is developing standards for their management and reporting.
People & remuneration
Internal promotions to the Leadership Team3
For
per
sona
l use
onl
y
Page 27
MANAGING DIRECTOR REMUNERATION
The Managing Director’s remuneration is structured in a slightly different way to reflect the long-term performance focus of his role.
Short
Short-Term IncentiveSTI
Long-Term IncentiveLTI
Salary
Performance Equity Incentive PEI
Base
56% of base
44% of base
71% of base
PERFORMANCE EQUITY INCENTIVE (PEI) In addition to the three factors applied to the Leadership Team, the Managing Director has a further PEI, essentially a deferred STI, set at 44% of his base. The PEI has the same performance criteria as the STI scheme, but the award is deferred for two years and delivered in Spark shares.
All incentive targets and outcomes for the Managing Director and his Leadership Team are reviewed and approved by the Spark Board.
FY17 SHORT-TERM INCENTIVES PERFORMANCE OUTCOME
Spark’s overall performance dictated the size of the ‘funding pool’ for STI, with the targets comprising of EBITDA and market Net Promoter Score (our measure of customer satisfaction). The FY17 group performance outcome, as approved by the Board, for determining the size of the overall funding pool is summarised as follows:
Performance metric % Outcome Result
Group EBITDA 50 Target almost achieved
46.4%
Market Net Promoter Score (mNPS)
50 Target almost achieved
33.0%
Board discretion for business unit overperformance
10.6%
Total 100 90%
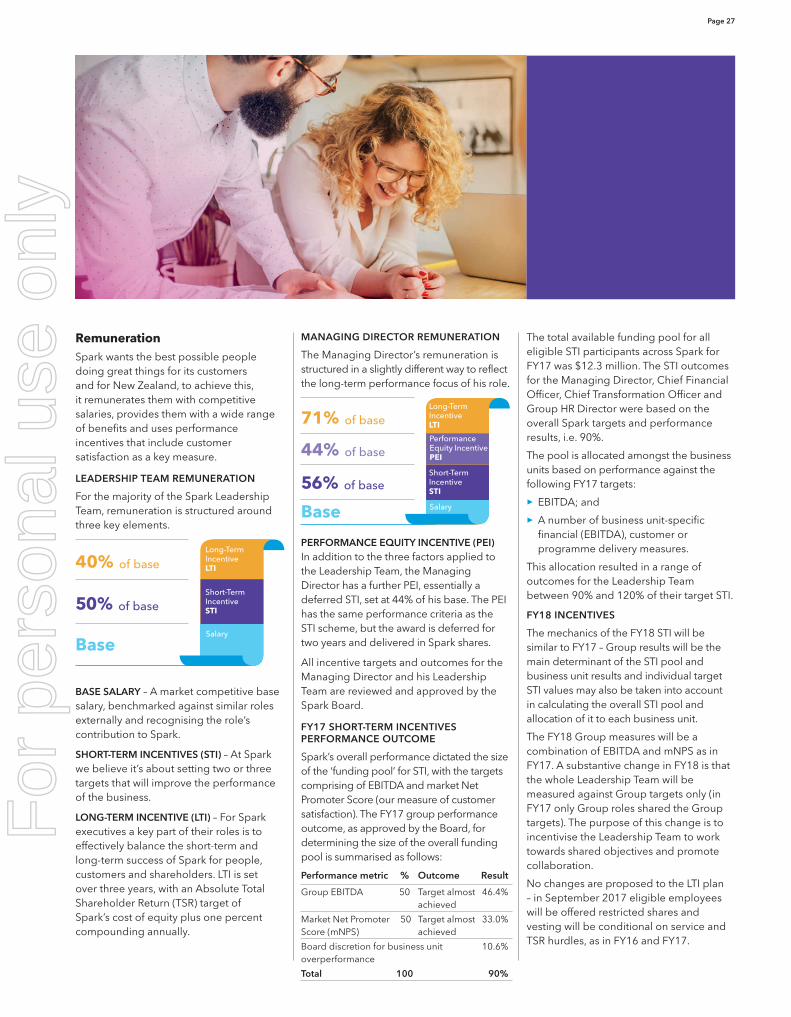
RemunerationSpark wants the best possible people doing great things for its customers and for New Zealand, to achieve this, it remunerates them with competitive salaries, provides them with a wide range of benefits and uses performance incentives that include customer satisfaction as a key measure.
LEADERSHIP TEAM REMUNERATION
For the majority of the Spark Leadership Team, remuneration is structured around three key elements.
Base
50% of base
40% of base
ShortShort-Term IncentiveSTI
Long-Term IncentiveLTI
Salary
BASE SALARY – A market competitive base salary, benchmarked against similar roles externally and recognising the role’s contribution to Spark.
SHORT-TERM INCENTIVES (STI) – At Spark we believe it’s about setting two or three targets that will improve the performance of the business.
LONG-TERM INCENTIVE (LTI) – For Spark executives a key part of their roles is to effectively balance the short-term and long-term success of Spark for people, customers and shareholders. LTI is set over three years, with an Absolute Total Shareholder Return (TSR) target of Spark’s cost of equity plus one percent compounding annually.
The total available funding pool for all eligible STI participants across Spark for FY17 was $12.3 million. The STI outcomes for the Managing Director, Chief Financial Officer, Chief Transformation Officer and Group HR Director were based on the overall Spark targets and performance results, i.e. 90%.
The pool is allocated amongst the business units based on performance against the following FY17 targets:
> EBITDA; and
> A number of business unit-specific financial (EBITDA), customer or programme delivery measures.
This allocation resulted in a range of outcomes for the Leadership Team between 90% and 120% of their target STI.
FY18 INCENTIVES
The mechanics of the FY18 STI will be similar to FY17 – Group results will be the main determinant of the STI pool and business unit results and individual target STI values may also be taken into account in calculating the overall STI pool and allocation of it to each business unit.
The FY18 Group measures will be a combination of EBITDA and mNPS as in FY17. A substantive change in FY18 is that the whole Leadership Team will be measured against Group targets only (in FY17 only Group roles shared the Group targets). The purpose of this change is to incentivise the Leadership Team to work towards shared objectives and promote collaboration.
No changes are proposed to the LTI plan – in September 2017 eligible employees will be offered restricted shares and vesting will be conditional on service and TSR hurdles, as in FY16 and FY17.
For
per
sona
l use
onl
y
Page 28 Spark New Zealand Annual Report 2017 Environment, Social & Governance Reporting
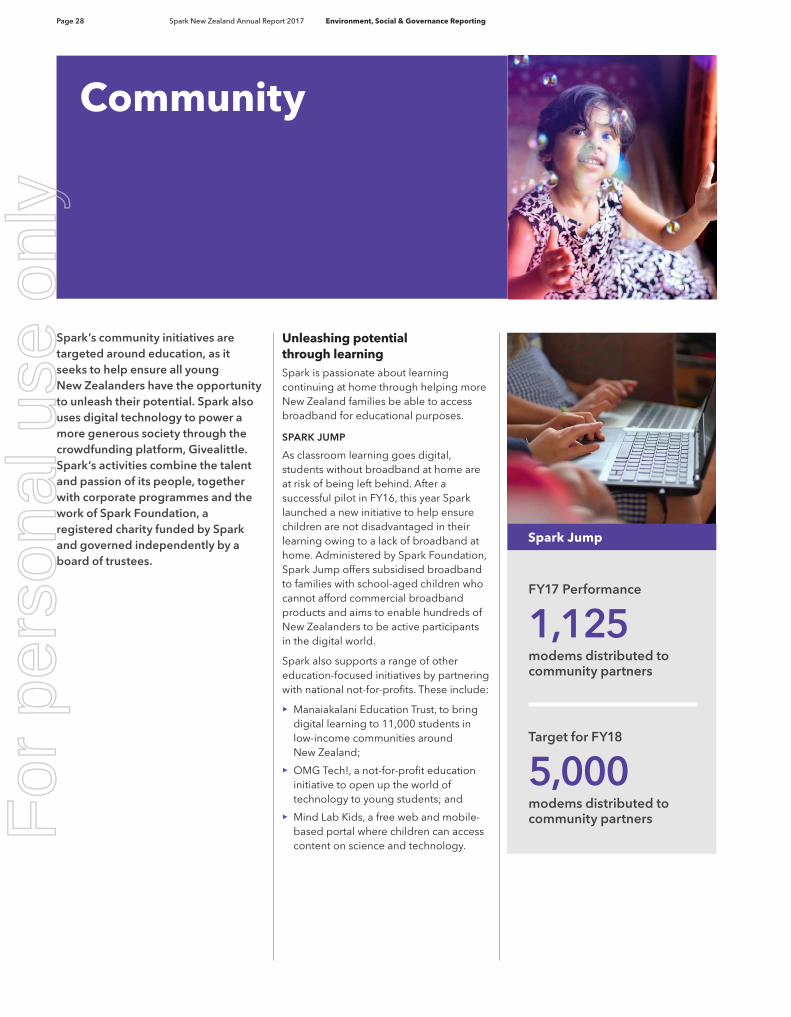
Unleashing potential through learning Spark is passionate about learning continuing at home through helping more New Zealand families be able to access broadband for educational purposes.
SPARK JUMP
As classroom learning goes digital, students without broadband at home are at risk of being left behind. After a successful pilot in FY16, this year Spark launched a new initiative to help ensure children are not disadvantaged in their learning owing to a lack of broadband at home. Administered by Spark Foundation, Spark Jump offers subsidised broadband to families with school-aged children who cannot afford commercial broadband products and aims to enable hundreds of New Zealanders to be active participants in the digital world.
Spark also supports a range of other education-focused initiatives by partnering with national not-for-profits. These include:
>> Manaiakalani Education Trust, to bring digital learning to 11,000 students in low-income communities around New Zealand;
>> OMG Tech!, a not-for-profit education initiative to open up the world of technology to young students; and
>> Mind Lab Kids, a free web and mobile-based portal where children can access content on science and technology.
Spark’s community initiatives are targeted around education, as it seeks to help ensure all young New Zealanders have the opportunity to unleash their potential. Spark also uses digital technology to power a more generous society through the crowdfunding platform, Givealittle. Spark’s activities combine the talent and passion of its people, together with corporate programmes and the work of Spark Foundation, a registered charity funded by Spark and governed independently by a board of trustees.
Community
FY17 Performance
1,125modems distributed to community partners
Target for FY18
5,000modems distributed to community partners
Spark Jump
For
per
sona
l use
onl
y
Page 29
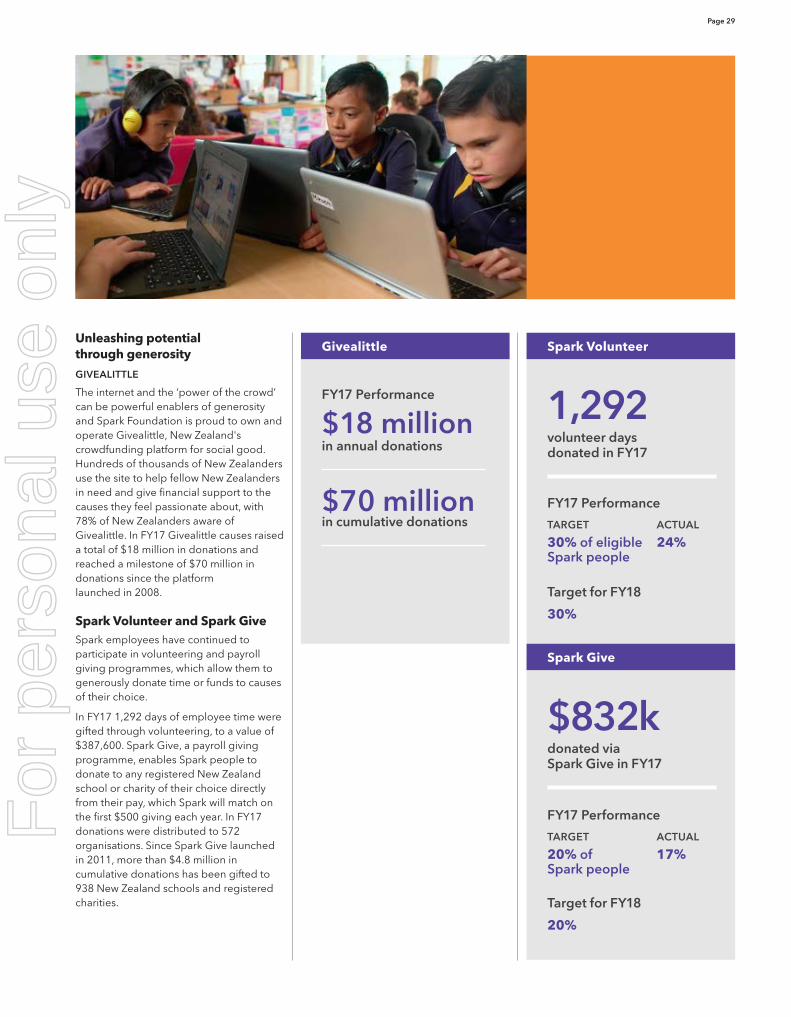
Unleashing potential through generosity
GIVEALITTLE
The internet and the ‘power of the crowd’ can be powerful enablers of generosity and Spark Foundation is proud to own and operate Givealittle, New Zealand's crowdfunding platform for social good. Hundreds of thousands of New Zealanders use the site to help fellow New Zealanders in need and give financial support to the causes they feel passionate about, with 78% of New Zealanders aware of Givealittle. In FY17 Givealittle causes raised a total of $18 million in donations and reached a milestone of $70 million in donations since the platform launched in 2008.
Spark Volunteer and Spark Give Spark employees have continued to participate in volunteering and payroll giving programmes, which allow them to generously donate time or funds to causes of their choice.
In FY17 1,292 days of employee time were gifted through volunteering, to a value of $387,600. Spark Give, a payroll giving programme, enables Spark people to donate to any registered New Zealand school or charity of their choice directly from their pay, which Spark will match on the first $500 giving each year. In FY17 donations were distributed to 572 organisations. Since Spark Give launched in 2011, more than $4.8 million in cumulative donations has been gifted to 938 New Zealand schools and registered charities.
1,292volunteer days donated in FY17
$832kdonated via Spark Give in FY17
FY17 Performance
TARGET
30% of eligible Spark people
ACTUAL
24%
FY17 Performance
TARGET
20% of Spark people
ACTUAL
17%
Target for FY18
30%
FY17 Performance
$18 million in annual donations
$70 million in cumulative donations
Target for FY18
20%
Spark VolunteerGivealittle
Spark Give
For
per
sona
l use
onl
y
Page 30 Spark New Zealand Annual Report 2017 Environment, Social & Governance Reporting
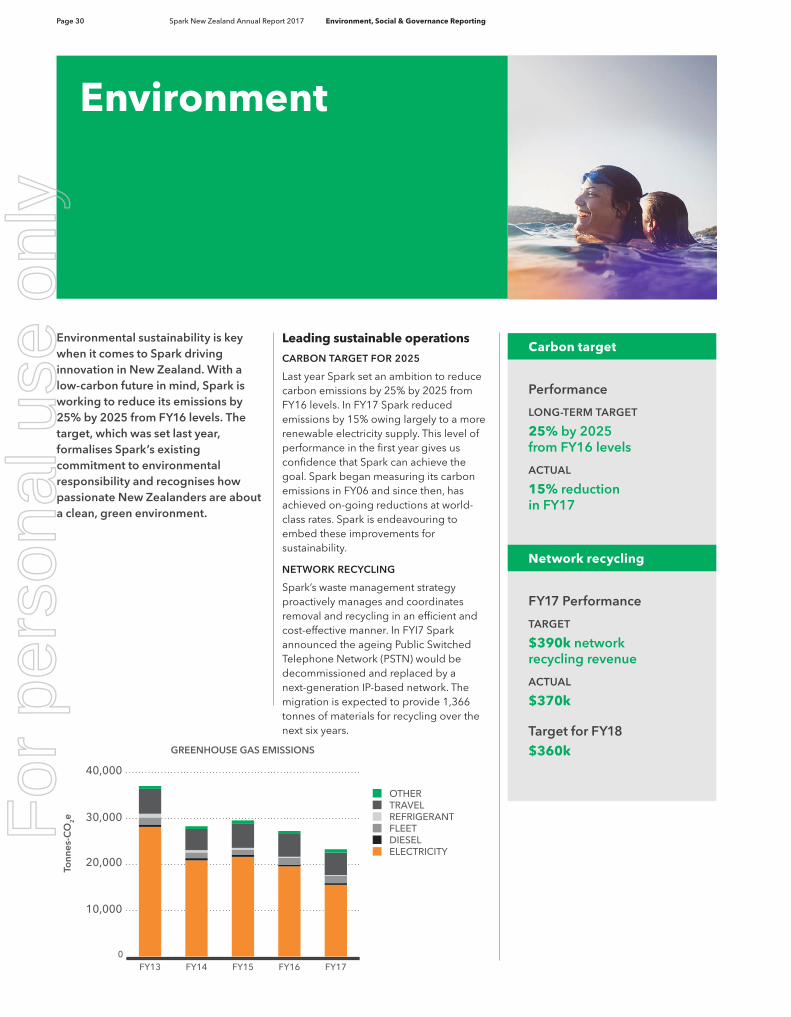
Leading sustainable operations
CARBON TARGET FOR 2025
Last year Spark set an ambition to reduce carbon emissions by 25% by 2025 from FY16 levels. In FY17 Spark reduced emissions by 15% owing largely to a more renewable electricity supply. This level of performance in the first year gives us confidence that Spark can achieve the goal. Spark began measuring its carbon emissions in FY06 and since then, has achieved on-going reductions at world-class rates. Spark is endeavouring to embed these improvements for sustainability.
NETWORK RECYCLING
Spark’s waste management strategy proactively manages and coordinates removal and recycling in an efficient and cost-effective manner. In FYI7 Spark announced the ageing Public Switched Telephone Network (PSTN) would be decommissioned and replaced by a next-generation IP-based network. The migration is expected to provide 1,366 tonnes of materials for recycling over the next six years.
Environmental sustainability is key when it comes to Spark driving innovation in New Zealand. With a low-carbon future in mind, Spark is working to reduce its emissions by 25% by 2025 from FY16 levels. The target, which was set last year, formalises Spark’s existing commitment to environmental responsibility and recognises how passionate New Zealanders are about a clean, green environment.
Environment
0FY17FY16FY15FY14FY13
10,000
20,000
30,000
40,000
OTHERTRAVELREFRIGERANTFLEETDIESELELECTRICITY
GREENHOUSE GAS EMISSIONS
Tonn
es-C
O2e
Performance
LONG-TERM TARGET
25% by 2025 from FY16 levels
ACTUAL
15% reduction in FY17
FY17 Performance
TARGET
$390k network recycling revenue
ACTUAL
$370k
Target for FY18$360k
Carbon target
Network recycling
For
per
sona
l use
onl
y
Page 31
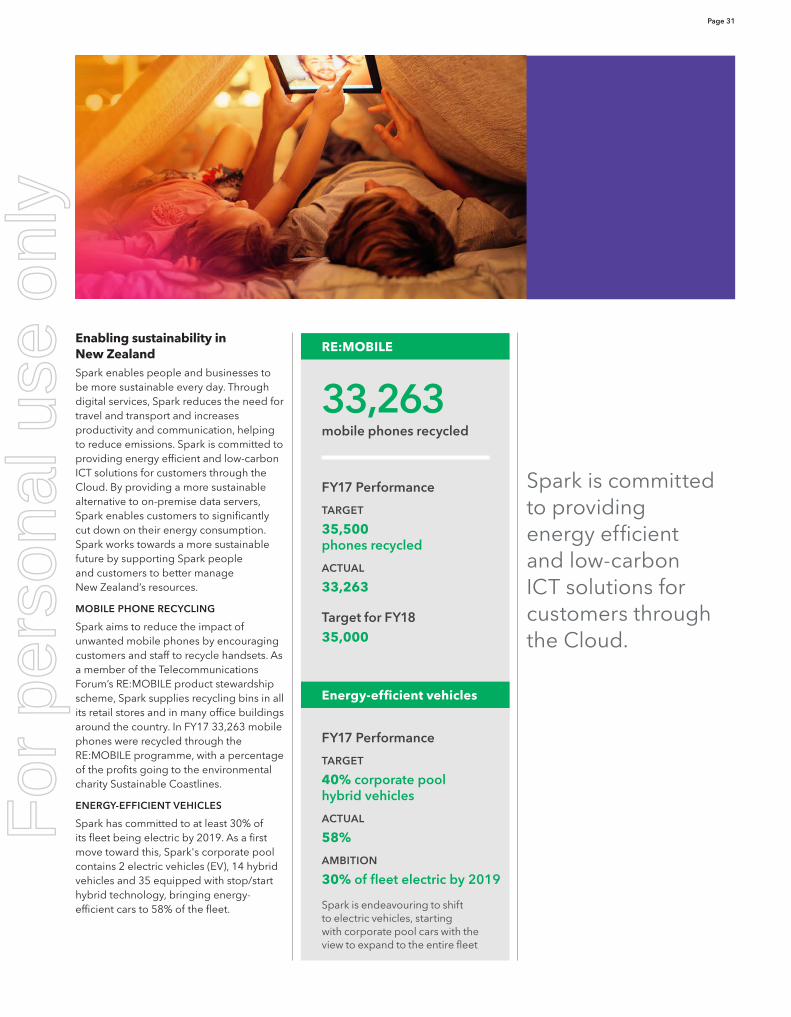
Enabling sustainability in New ZealandSpark enables people and businesses to be more sustainable every day. Through digital services, Spark reduces the need for travel and transport and increases productivity and communication, helping to reduce emissions. Spark is committed to providing energy efficient and low-carbon ICT solutions for customers through the Cloud. By providing a more sustainable alternative to on-premise data servers, Spark enables customers to significantly cut down on their energy consumption. Spark works towards a more sustainable future by supporting Spark people and customers to better manage New Zealand’s resources.
MOBILE PHONE RECYCLING
Spark aims to reduce the impact of unwanted mobile phones by encouraging customers and staff to recycle handsets. As a member of the Telecommunications Forum’s RE:MOBILE product stewardship scheme, Spark supplies recycling bins in all its retail stores and in many office buildings around the country. In FY17 33,263 mobile phones were recycled through the RE:MOBILE programme, with a percentage of the profits going to the environmental charity Sustainable Coastlines.
ENERGY-EFFICIENT VEHICLES
Spark has committed to at least 30% of its fleet being electric by 2019. As a first move toward this, Spark's corporate pool contains 2 electric vehicles (EV), 14 hybrid vehicles and 35 equipped with stop/start hybrid technology, bringing energy-efficient cars to 58% of the fleet.
FY17 Performance
TARGET
35,500 phones recycled
ACTUAL
33,263
Target for FY1835,000
FY17 Performance
TARGET
40% corporate pool hybrid vehicles
ACTUAL
58%
AMBITION
30% of fleet electric by 2019
Spark is endeavouring to shift to electric vehicles, starting with corporate pool cars with the view to expand to the entire fleet
RE:MOBILE
Energy-efficient vehicles
33,263mobile phones recycled
Spark is committed to providing energy efficient and low-carbon ICT solutions for customers through the Cloud.
For
per
sona
l use
onl
y
Alison Barrass Non-Executive Director
Early adoption of the NZX Corporate Governance Best Practice Code
Page 32 Spark New Zealand Annual Report 2017 Environment, Social & Governance Reporting
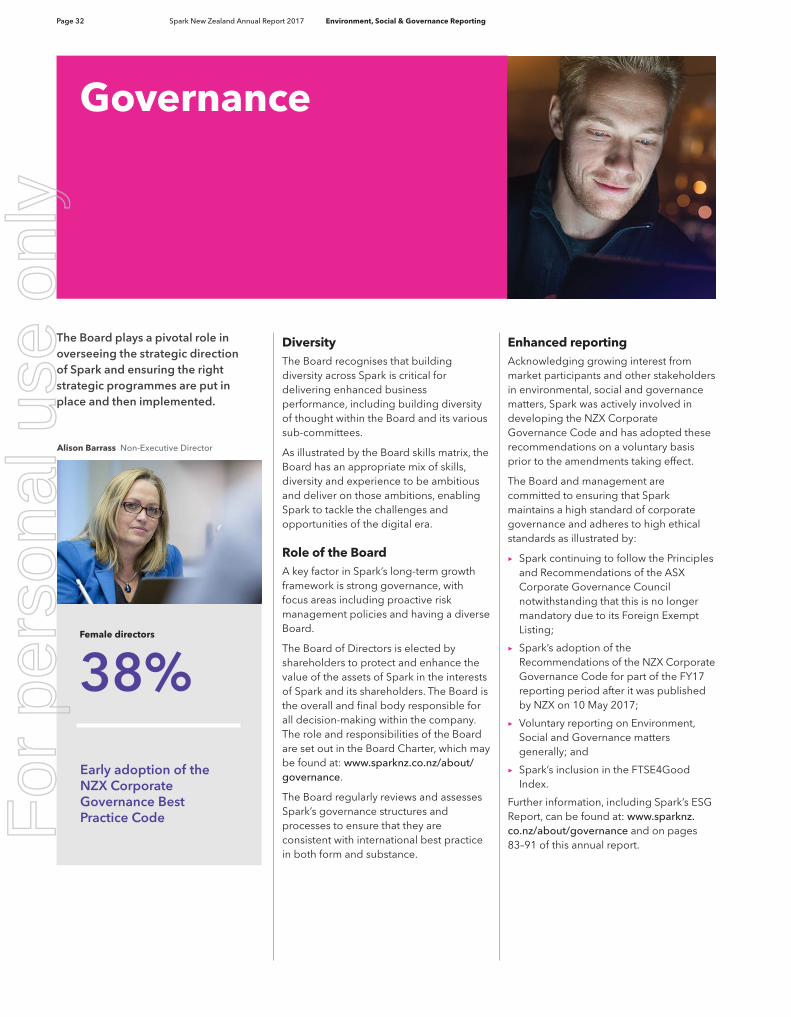
The Board plays a pivotal role in overseeing the strategic direction of Spark and ensuring the right strategic programmes are put in place and then implemented.
Enhanced reporting Acknowledging growing interest from market participants and other stakeholders in environmental, social and governance matters, Spark was actively involved in developing the NZX Corporate Governance Code and has adopted these recommendations on a voluntary basis prior to the amendments taking effect.
The Board and management are committed to ensuring that Spark maintains a high standard of corporate governance and adheres to high ethical standards as illustrated by:
> Spark continuing to follow the Principles and Recommendations of the ASX Corporate Governance Council notwithstanding that this is no longer mandatory due to its Foreign Exempt Listing;
> Spark’s adoption of the Recommendations of the NZX Corporate Governance Code for part of the FY17 reporting period after it was published by NZX on 10 May 2017;
> Voluntary reporting on Environment, Social and Governance matters generally; and
> Spark’s inclusion in the FTSE4Good Index.
Further information, including Spark’s ESG Report, can be found at: www.sparknz.co.nz/about/governance and on pages 83–91 of this annual report.
Governance
Female directors
38%
DiversityThe Board recognises that building diversity across Spark is critical for delivering enhanced business performance, including building diversity of thought within the Board and its various sub-committees.
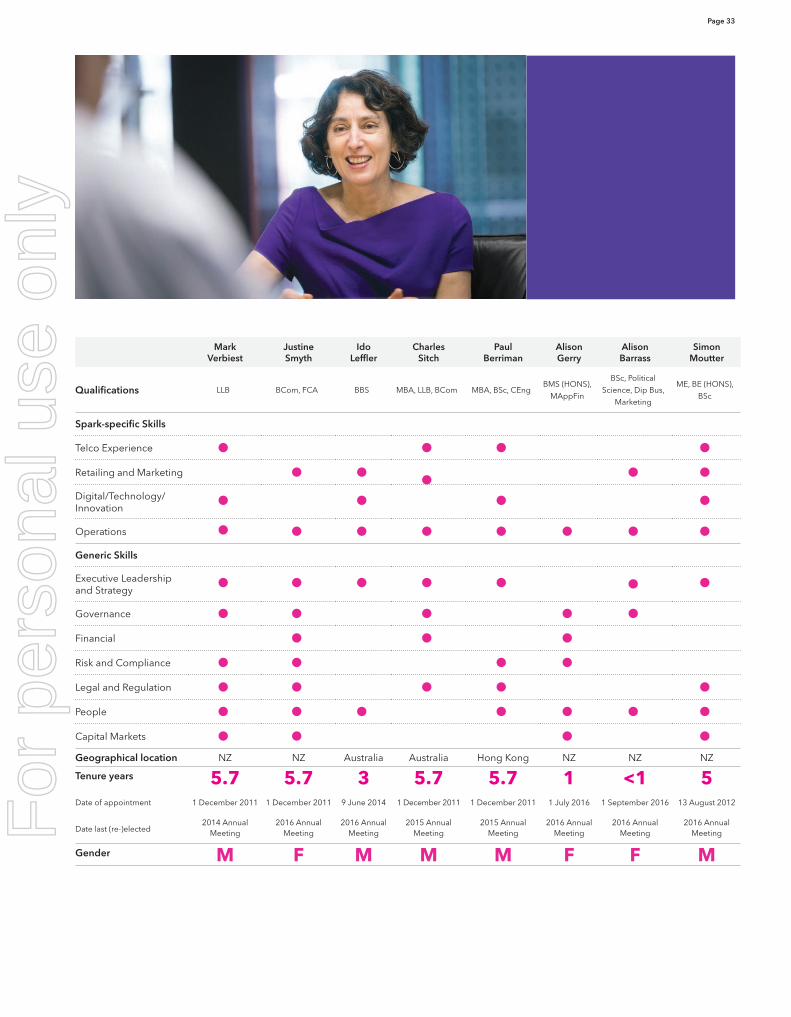
As illustrated by the Board skills matrix, the Board has an appropriate mix of skills, diversity and experience to be ambitious and deliver on those ambitions, enabling Spark to tackle the challenges and opportunities of the digital era.
Role of the BoardA key factor in Spark’s long-term growth framework is strong governance, with focus areas including proactive risk management policies and having a diverse Board.
The Board of Directors is elected by shareholders to protect and enhance the value of the assets of Spark in the interests of Spark and its shareholders. The Board is the overall and final body responsible for all decision-making within the company. The role and responsibilities of the Board are set out in the Board Charter, which may be found at: www.sparknz.co.nz/about/governance.
The Board regularly reviews and assesses Spark’s governance structures and processes to ensure that they are consistent with international best practice in both form and substance.
For
per
sona
l use
onl
y
Page 33
Mark
VerbiestJustine Smyth
Ido Leffler
Charles Sitch
Paul Berriman
Alison Gerry
Alison Barrass
Simon Moutter
Qualifications LLB BCom, FCA BBS MBA, LLB, BCom MBA, BSc, CEngBMS (HONS),
MAppFin
BSc, Political
Science, Dip Bus,
Marketing
ME, BE (HONS),
BSc
Spark-specific Skills
Telco Experience
Retailing and Marketing
Digital/Technology/Innovation
Operations
Generic Skills
Executive Leadership and Strategy
Governance
Financial
Risk and Compliance
Legal and Regulation
People
Capital Markets
Geographical location NZ NZ Australia Australia Hong Kong NZ NZ NZ
Tenure years 5.7 5.7 3 5.7 5.7 1 <1 5Date of appointment 1 December 2011 1 December 2011 9 June 2014 1 December 2011 1 December 2011 1 July 2016 1 September 2016 13 August 2012
Date last (re-)elected2014 Annual
Meeting2016 Annual
Meeting2016 Annual
Meeting2015 Annual
Meeting2015 Annual
Meeting2016 Annual
Meeting2016 Annual
Meeting2016 Annual
Meeting
Gender M F M M M F F M
For
per
sona
l use
onl
y
Page 34 Spark New Zealand Annual Report 2017 Environment, Social & Governance Reporting
Spark helps to unleash the potential in all New Zealanders by offering customers the best data network and digital services capability. To achieve this, Spark must successfully execute its business strategies and plans, while maintaining high standards of operational performance. Strong corporate governance, including a highly effective and integrated risk management framework, helps Spark to successfully manage the risks associated with operating in a complex and challenging environment.
Risk
Spark’s risk management framework exists to improve its underlying business performance and strengthen its corporate governance. It comprises an integrated set of responsibilities spanning the Board of Directors through to line managers.
These are implemented through Spark’s policies and guidelines, organisational design, operating procedures and individual accountabilities. Specialist support groups and oversight processes monitoring and reporting its effectiveness underpin its operation.
Principal risksSpark’s current principal risks and their mitigations are summarised below.
CUSTOMER EXPERIENCE
If Spark is unable to offer its customers the standard of customer care they expect, Spark risks churn to competitors, reducing revenues and gross margins. Spark has three major initiatives to uplift customer experience quality. These involve:
1. Simplifying product and service portfolios;
2. Introducing new digitised (self-service) service propositions; and
3. Moving customers onto mobile and fibre networks to improve service performance and reliability.
MOBILE
Hyper competition may intensify value-destructive market offers that commoditise New Zealand’s mobile markets and slash margins. Spark is re-balancing its multi-brand strategy to become more competitive in increasingly price-sensitive markets. Business simplification and
digitisation programmes reduce operating costs and create the margin relief required to invest for network leadership. The Net Promoter Score (NPS) system allows Spark to measure brand strength and match mobile services to customer preferences.
BROADBAND
Spark’s market scale may be eroded by intense retail competition contributing to an increasingly commoditised market. To preserve scale and margin, Spark is better leveraging all of its brands, so it can succeed in price-sensitive markets. Spark is also migrating many customers onto fibre and wireless access technologies to improve customer experience and service economics.
IT SERVICES
Improving IT services delivery and margin is critical to achieving sustainable earnings. Spark Digital’s game plan improves these by simplifying its product and solution portfolios and service propositions. Its Future of Cloud strategy adapts its Cloud businesses for future earnings growth. Its customer outcomes teams remain focused on improving service delivery and financial performance.
FIXED MARGIN DECLINE
Spark’s earnings performance is becoming less sensitive to declining demand for legacy fixed network products. In 2016 the combined earnings from its mobile and IT businesses exceeded those from fixed voice for the first time. As with broadband Spark is migrating many of its legacy fixed customers off copper onto fibre and wireless access technologies to realise the same benefits.
For
per
sona
l use
onl
y
Page 35
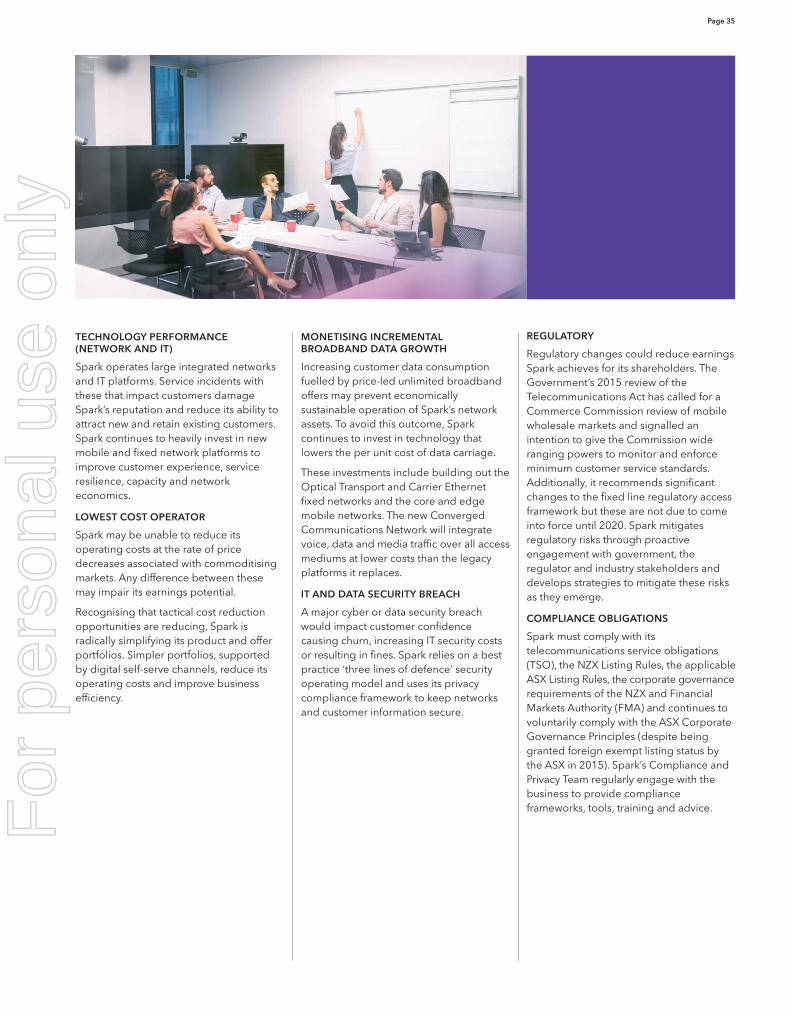
TECHNOLOGY PERFORMANCE (NETWORK AND IT)
Spark operates large integrated networks and IT platforms. Service incidents with these that impact customers damage Spark’s reputation and reduce its ability to attract new and retain existing customers. Spark continues to heavily invest in new mobile and fixed network platforms to improve customer experience, service resilience, capacity and network economics.
LOWEST COST OPERATOR
Spark may be unable to reduce its operating costs at the rate of price decreases associated with commoditising markets. Any difference between these may impair its earnings potential.
Recognising that tactical cost reduction opportunities are reducing, Spark is radically simplifying its product and offer portfolios. Simpler portfolios, supported by digital self-serve channels, reduce its operating costs and improve business efficiency.
MONETISING INCREMENTAL BROADBAND DATA GROWTH
Increasing customer data consumption fuelled by price-led unlimited broadband offers may prevent economically sustainable operation of Spark’s network assets. To avoid this outcome, Spark continues to invest in technology that lowers the per unit cost of data carriage.
These investments include building out the Optical Transport and Carrier Ethernet fixed networks and the core and edge mobile networks. The new Converged Communications Network will integrate voice, data and media traffic over all access mediums at lower costs than the legacy platforms it replaces.
IT AND DATA SECURITY BREACH
A major cyber or data security breach would impact customer confidence causing churn, increasing IT security costs or resulting in fines. Spark relies on a best practice ‘three lines of defence’ security operating model and uses its privacy compliance framework to keep networks and customer information secure.
REGULATORY
Regulatory changes could reduce earnings Spark achieves for its shareholders. The Government’s 2015 review of the Telecommunications Act has called for a Commerce Commission review of mobile wholesale markets and signalled an intention to give the Commission wide ranging powers to monitor and enforce minimum customer service standards. Additionally, it recommends significant changes to the fixed line regulatory access framework but these are not due to come into force until 2020. Spark mitigates regulatory risks through proactive engagement with government, the regulator and industry stakeholders and develops strategies to mitigate these risks as they emerge.
COMPLIANCE OBLIGATIONS
Spark must comply with its telecommunications service obligations (TSO), the NZX Listing Rules, the applicable ASX Listing Rules, the corporate governance requirements of the NZX and Financial Markets Authority (FMA) and continues to voluntarily comply with the ASX Corporate Governance Principles (despite being granted foreign exempt listing status by the ASX in 2015). Spark’s Compliance and Privacy Team regularly engage with the business to provide compliance frameworks, tools, training and advice. F
or p
erso
nal u
se o
nly
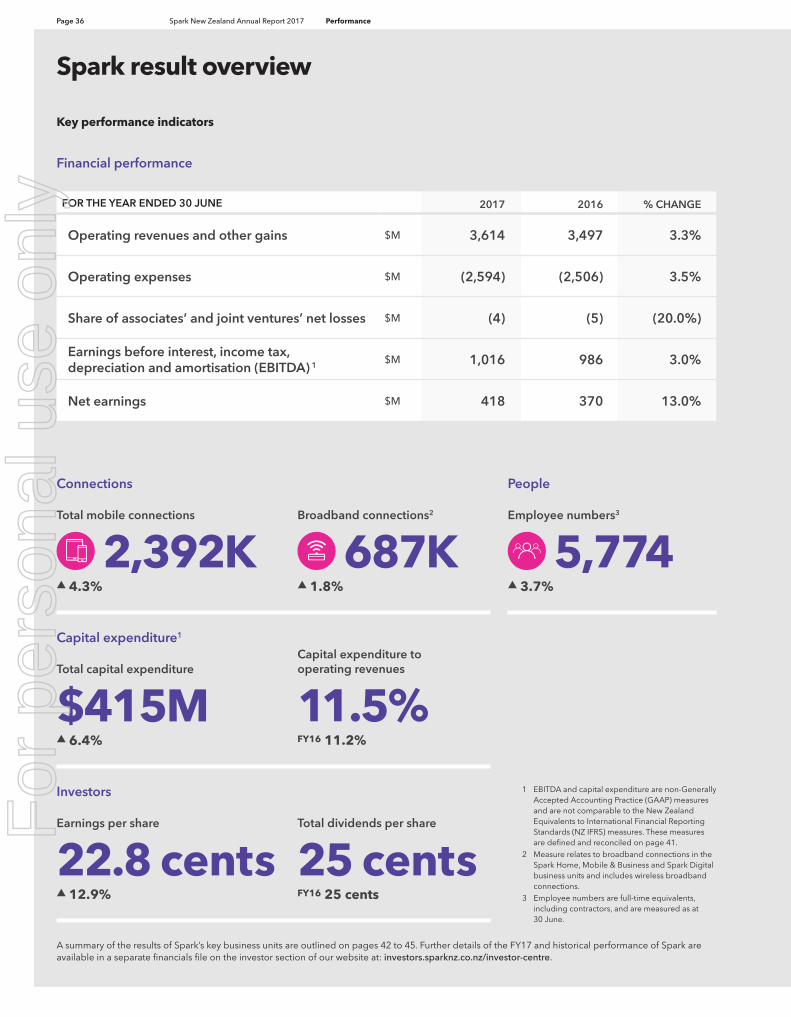
Page 36 Spark New Zealand Annual Report 2017 Performance
FOR THE YEAR ENDED 30 JUNE 2017 2016 % CHANGE
Operating revenues and other gains $M 3,614 3,497 3.3%
Operating expenses $M (2,594) (2,506) 3.5%
Share of associates’ and joint ventures’ net losses $M (4) (5) (20.0%)
Earnings before interest, income tax, depreciation and amortisation (EBITDA) 1 $M 1,016 986 3.0%
Net earnings $M 418 370 13.0%
Key performance indicators
Spark result overview
1 EBITDA and capital expenditure are non-Generally Accepted Accounting Practice (GAAP) measures and are not comparable to the New Zealand Equivalents to International Financial Reporting Standards (NZ IFRS) measures. These measures are defined and reconciled on page 41.
2 Measure relates to broadband connections in the Spark Home, Mobile & Business and Spark Digital business units and includes wireless broadband connections.
3 Employee numbers are full-time equivalents, including contractors, and are measured as at 30 June.
Total mobile connections
2,392K▲ 4.3%
Total capital expenditure
$415M▲ 6.4%
Earnings per share
22.8 cents▲ 12.9%
Total dividends per share
25 centsFY16 25 cents
Broadband connections2
687K▲ 1.8%
Capital expenditure to operating revenues
11.5%FY16 11.2%
Employee numbers3
5,774▲ 3.7%
Connections
Financial performance
Capital expenditure1
Investors
People
A summary of the results of Spark’s key business units are outlined on pages 42 to 45. Further details of the FY17 and historical performance of Spark are available in a separate financials file on the investor section of our website at: investors.sparknz.co.nz/investor-centre.
For
per
sona
l use
onl
y
Page 37
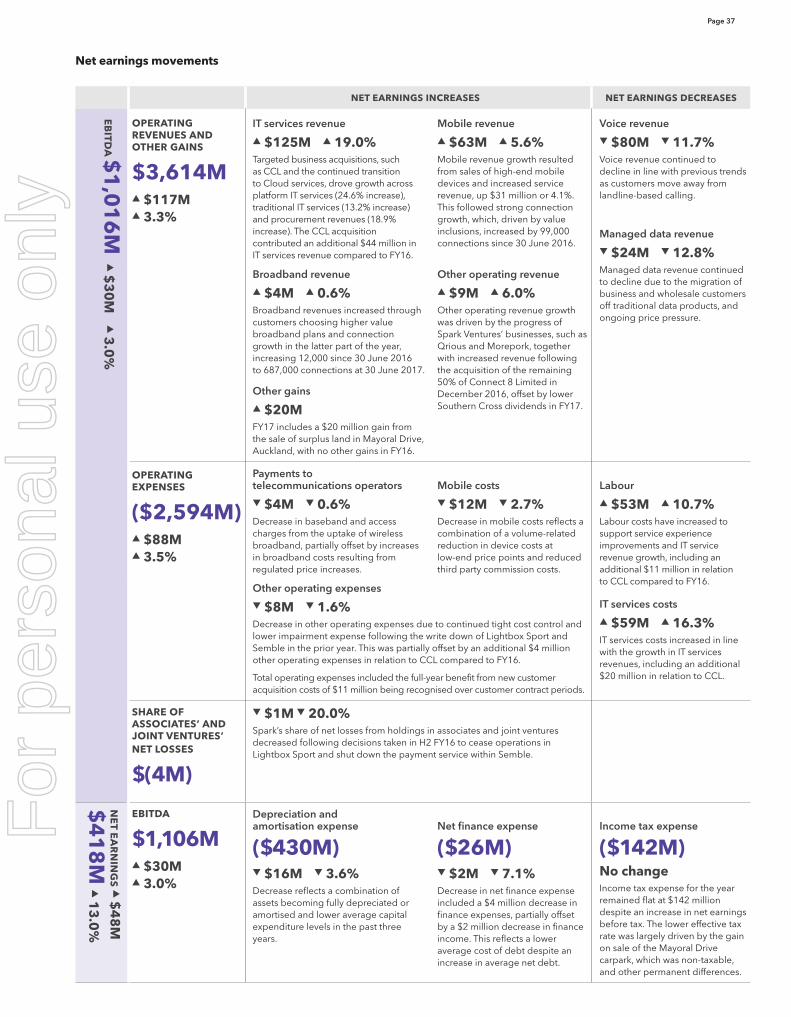
Net earnings movements
NET EARNINGS INCREASES NET EARNINGS DECREASES
EB
ITDA
$1
,01
6M
▲ $
30
M
▲ 3
.0%
OPERATING REVENUES AND OTHER GAINS
$3,614M▲ $117M▲ 3.3%
IT services revenue
▲ $125M ▲ 19.0%Targeted business acquisitions, such as CCL and the continued transition to Cloud services, drove growth across platform IT services (24.6% increase), traditional IT services (13.2% increase) and procurement revenues (18.9% increase). The CCL acquisition contributed an additional $44 million in IT services revenue compared to FY16.
Mobile revenue
▲ $63M ▲ 5.6%Mobile revenue growth resulted from sales of high-end mobile devices and increased service revenue, up $31 million or 4.1%. This followed strong connection growth, which, driven by value inclusions, increased by 99,000 connections since 30 June 2016.
Voice revenue
▼ $80M ▼ 11.7%Voice revenue continued to decline in line with previous trends as customers move away from landline-based calling.
Managed data revenue
▼ $24M ▼ 12.8%Managed data revenue continued to decline due to the migration of business and wholesale customers off traditional data products, and ongoing price pressure.
Broadband revenue
▲ $4M ▲ 0.6%Broadband revenues increased through customers choosing higher value broadband plans and connection growth in the latter part of the year, increasing 12,000 since 30 June 2016 to 687,000 connections at 30 June 2017.
Other gains
▲ $20MFY17 includes a $20 million gain from the sale of surplus land in Mayoral Drive, Auckland, with no other gains in FY16.
Other operating revenue
▲ $9M ▲ 6.0%Other operating revenue growth was driven by the progress of Spark Ventures’ businesses, such as Qrious and Morepork, together with increased revenue following the acquisition of the remaining 50% of Connect 8 Limited in December 2016, offset by lower Southern Cross dividends in FY17.
OPERATING EXPENSES
($2,594M)▲ $88M▲ 3.5%
Payments to telecommunications operators
▼ $4M ▼ 0.6%Decrease in baseband and access charges from the uptake of wireless broadband, partially offset by increases in broadband costs resulting from regulated price increases.
Mobile costs
▼ $12M ▼ 2.7%Decrease in mobile costs reflects a combination of a volume-related reduction in device costs at low-end price points and reduced third party commission costs.
Labour
▲ $53M ▲ 10.7%Labour costs have increased to support service experience improvements and IT service revenue growth, including an additional $11 million in relation to CCL compared to FY16.
IT services costs
▲ $59M ▲ 16.3%IT services costs increased in line with the growth in IT services revenues, including an additional $20 million in relation to CCL.
Other operating expenses
▼ $8M ▼ 1.6%Decrease in other operating expenses due to continued tight cost control and lower impairment expense following the write down of Lightbox Sport and Semble in the prior year. This was partially offset by an additional $4 million other operating expenses in relation to CCL compared to FY16.
Total operating expenses included the full-year benefit from new customer acquisition costs of $11 million being recognised over customer contract periods.
SHARE OF ASSOCIATES’ AND JOINT VENTURES’ NET LOSSES
$(4M)
▼ $1M ▼ 20.0%Spark’s share of net losses from holdings in associates and joint ventures decreased following decisions taken in H2 FY16 to cease operations in Lightbox Sport and shut down the payment service within Semble.
NE
T EA
RN
ING
S ▲
$4
8M
$4
18
M
▲ 1
3.0
%
EBITDA
$1,106M▲ $30M▲ 3.0%
Depreciation and amortisation expense
($430M)▼ $16M ▼ 3.6%Decrease reflects a combination of assets becoming fully depreciated or amortised and lower average capital expenditure levels in the past three years.
Net finance expense
($26M)▼ $2M ▼ 7.1%Decrease in net finance expense included a $4 million decrease in finance expenses, partially offset by a $2 million decrease in finance income. This reflects a lower average cost of debt despite an increase in average net debt.
Income tax expense
($142M)No changeIncome tax expense for the year remained flat at $142 million despite an increase in net earnings before tax. The lower effective tax rate was largely driven by the gain on sale of the Mayoral Drive carpark, which was non-taxable, and other permanent differences.
For
per
sona
l use
onl
y
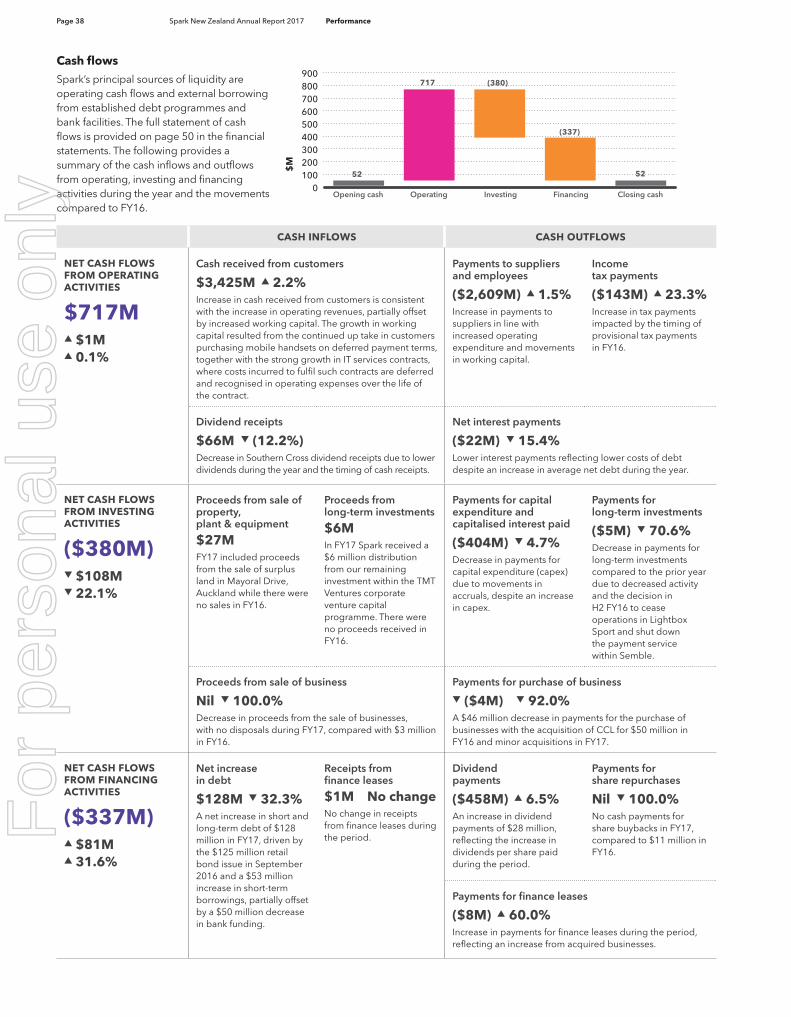
Page 38 Spark New Zealand Annual Report 2017 Performance
CASH INFLOWS CASH OUTFLOWS
NET CASH FLOWS FROM OPERATING ACTIVITIES
$717M▲ $1M▲ 0.1%
Cash received from customers
$3,425M ▲ 2.2%Increase in cash received from customers is consistent with the increase in operating revenues, partially offset by increased working capital. The growth in working capital resulted from the continued up take in customers purchasing mobile handsets on deferred payment terms, together with the strong growth in IT services contracts, where costs incurred to fulfil such contracts are deferred and recognised in operating expenses over the life of the contract.
Payments to suppliers and employees
($2,609M) ▲ 1.5%Increase in payments to suppliers in line with increased operating expenditure and movements in working capital.
Income tax payments
($143M) ▲ 23.3%Increase in tax payments impacted by the timing of provisional tax payments in FY16.
Dividend receipts
$66M ▼ (12.2%)Decrease in Southern Cross dividend receipts due to lower dividends during the year and the timing of cash receipts.
Net interest payments
($22M) ▼ 15.4%Lower interest payments reflecting lower costs of debt despite an increase in average net debt during the year.
NET CASH FLOWS FROM INVESTING ACTIVITIES
($380M)▼ $108M▼ 22.1%
Proceeds from sale of property, plant & equipment
$27MFY17 included proceeds from the sale of surplus land in Mayoral Drive, Auckland while there were no sales in FY16.
Proceeds from long-term investments
$6MIn FY17 Spark received a $6 million distribution from our remaining investment within the TMT Ventures corporate venture capital programme. There were no proceeds received in FY16.
Payments for capital expenditure and capitalised interest paid
($404M) ▼ 4.7%Decrease in payments for capital expenditure (capex)due to movements in accruals, despite an increase in capex.
Payments for long-term investments
($5M) ▼ 70.6%Decrease in payments for long-term investments compared to the prior year due to decreased activity and the decision in H2 FY16 to cease operations in Lightbox Sport and shut down the payment service within Semble.
Proceeds from sale of business
Nil ▼ 100.0%Decrease in proceeds from the sale of businesses, with no disposals during FY17, compared with $3 million in FY16.
Payments for purchase of business
▼ ($4M) ▼ 92.0%A $46 million decrease in payments for the purchase of businesses with the acquisition of CCL for $50 million in FY16 and minor acquisitions in FY17.
NET CASH FLOWS FROM FINANCING ACTIVITIES
($337M)▲ $81M▲ 31.6%
Net increase in debt
$128M ▼ 32.3%A net increase in short and long-term debt of $128 million in FY17, driven by the $125 million retail bond issue in September 2016 and a $53 million increase in short-term borrowings, partially offset by a $50 million decrease in bank funding.
Receipts from finance leases
$1M No changeNo change in receipts from finance leases during the period.
Dividend payments
($458M) ▲ 6.5%An increase in dividend payments of $28 million, reflecting the increase in dividends per share paid during the period.
Payments for share repurchases
Nil ▼ 100.0%No cash payments for share buybacks in FY17, compared to $11 million in FY16.
Payments for finance leases
($8M) ▲ 60.0%Increase in payments for finance leases during the period, reflecting an increase from acquired businesses.
Cash flowsSpark’s principal sources of liquidity are operating cash flows and external borrowing from established debt programmes and bank facilities. The full statement of cash flows is provided on page 50 in the financial statements. The following provides a summary of the cash inflows and outflows from operating, investing and financing activities during the year and the movements compared to FY16.
$M
52 52
717 (380)
(337)
Opening cash Closing cashOperating Investing Financing0
100200300400500600700800900
For
per
sona
l use
onl
y
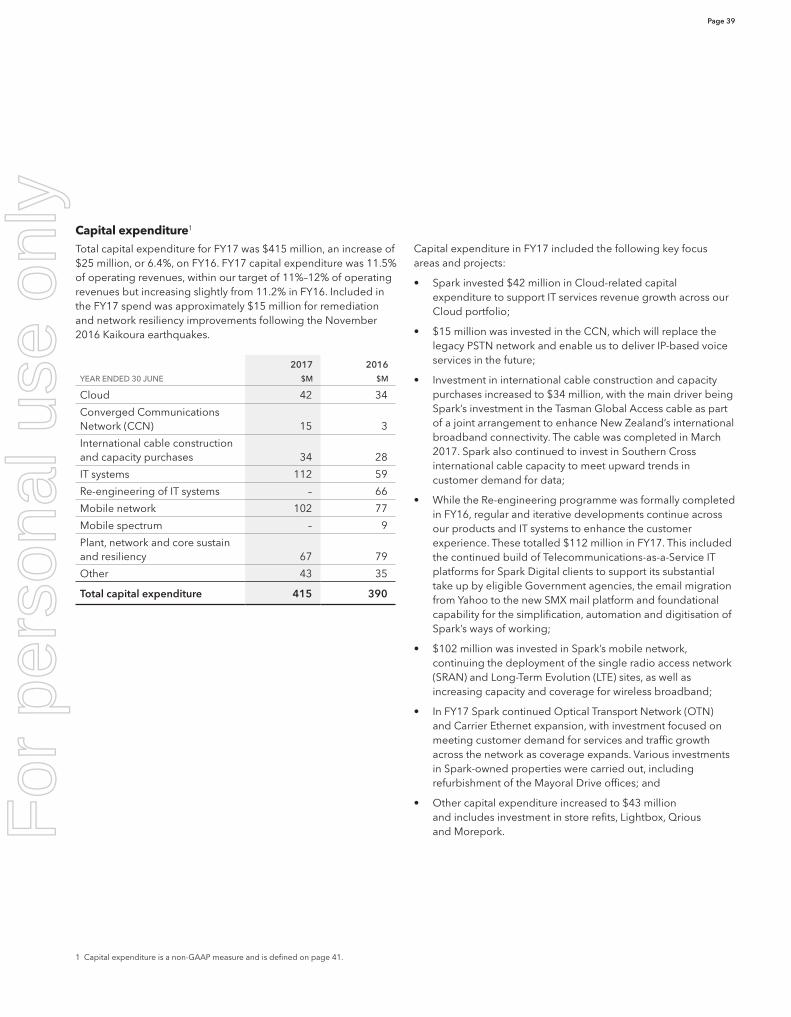
Page 39
Capital expenditure1 Total capital expenditure for FY17 was $415 million, an increase of $25 million, or 6.4%, on FY16. FY17 capital expenditure was 11.5% of operating revenues, within our target of 11%–12% of operating revenues but increasing slightly from 11.2% in FY16. Included in the FY17 spend was approximately $15 million for remediation and network resiliency improvements following the November 2016 Kaikoura earthquakes.
2017 2016YEAR ENDED 30 JUNE $M $M
Cloud 42 34
Converged Communications Network (CCN) 15 3
International cable construction and capacity purchases 34 28
IT systems 112 59
Re-engineering of IT systems – 66
Mobile network 102 77
Mobile spectrum – 9
Plant, network and core sustain and resiliency 67 79
Other 43 35
Total capital expenditure 415 390
1 Capital expenditure is a non-GAAP measure and is defined on page 41.
Capital expenditure in FY17 included the following key focus areas and projects:
• Spark invested $42 million in Cloud-related capital expenditure to support IT services revenue growth across our Cloud portfolio;
• $15 million was invested in the CCN, which will replace the legacy PSTN network and enable us to deliver IP-based voice services in the future;
• Investment in international cable construction and capacity purchases increased to $34 million, with the main driver being Spark’s investment in the Tasman Global Access cable as part of a joint arrangement to enhance New Zealand’s international broadband connectivity. The cable was completed in March 2017. Spark also continued to invest in Southern Cross international cable capacity to meet upward trends in customer demand for data;
• While the Re-engineering programme was formally completed in FY16, regular and iterative developments continue across our products and IT systems to enhance the customer experience. These totalled $112 million in FY17. This included the continued build of Telecommunications-as-a-Service IT platforms for Spark Digital clients to support its substantial take up by eligible Government agencies, the email migration from Yahoo to the new SMX mail platform and foundational capability for the simplification, automation and digitisation of Spark’s ways of working;
• $102 million was invested in Spark’s mobile network, continuing the deployment of the single radio access network (SRAN) and Long-Term Evolution (LTE) sites, as well as increasing capacity and coverage for wireless broadband;
• In FY17 Spark continued Optical Transport Network (OTN) and Carrier Ethernet expansion, with investment focused on meeting customer demand for services and traffic growth across the network as coverage expands. Various investments in Spark-owned properties were carried out, including refurbishment of the Mayoral Drive offices; and
• Other capital expenditure increased to $43 million and includes investment in store refits, Lightbox, Qrious and Morepork.F
or p
erso
nal u
se o
nly
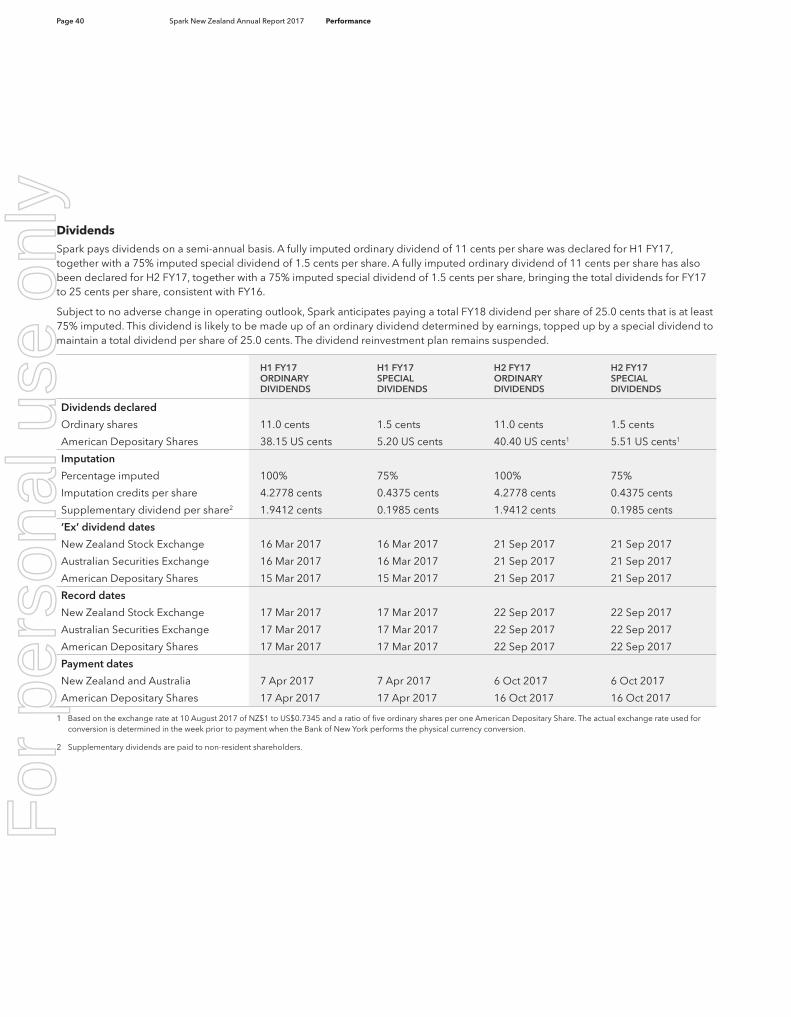
Page 40 Spark New Zealand Annual Report 2017 Performance
Dividends Spark pays dividends on a semi-annual basis. A fully imputed ordinary dividend of 11 cents per share was declared for H1 FY17, together with a 75% imputed special dividend of 1.5 cents per share. A fully imputed ordinary dividend of 11 cents per share has also been declared for H2 FY17, together with a 75% imputed special dividend of 1.5 cents per share, bringing the total dividends for FY17 to 25 cents per share, consistent with FY16.
Subject to no adverse change in operating outlook, Spark anticipates paying a total FY18 dividend per share of 25.0 cents that is at least 75% imputed. This dividend is likely to be made up of an ordinary dividend determined by earnings, topped up by a special dividend to maintain a total dividend per share of 25.0 cents. The dividend reinvestment plan remains suspended.
H1 FY17 ORDINARY DIVIDENDS
H1 FY17 SPECIAL DIVIDENDS
H2 FY17 ORDINARY DIVIDENDS
H2 FY17 SPECIAL DIVIDENDS
Dividends declared
Ordinary shares 11.0 cents 1.5 cents 11.0 cents 1.5 cents
American Depositary Shares 38.15 US cents 5.20 US cents 40.40 US cents1 5.51 US cents1
Imputation
Percentage imputed 100% 75% 100% 75%
Imputation credits per share 4.2778 cents 0.4375 cents 4.2778 cents 0.4375 cents
Supplementary dividend per share2 1.9412 cents 0.1985 cents 1.9412 cents 0.1985 cents
‘Ex’ dividend dates
New Zealand Stock Exchange 16 Mar 2017 16 Mar 2017 21 Sep 2017 21 Sep 2017
Australian Securities Exchange 16 Mar 2017 16 Mar 2017 21 Sep 2017 21 Sep 2017
American Depositary Shares 15 Mar 2017 15 Mar 2017 21 Sep 2017 21 Sep 2017
Record dates
New Zealand Stock Exchange 17 Mar 2017 17 Mar 2017 22 Sep 2017 22 Sep 2017
Australian Securities Exchange 17 Mar 2017 17 Mar 2017 22 Sep 2017 22 Sep 2017
American Depositary Shares 17 Mar 2017 17 Mar 2017 22 Sep 2017 22 Sep 2017
Payment dates
New Zealand and Australia 7 Apr 2017 7 Apr 2017 6 Oct 2017 6 Oct 2017
American Depositary Shares 17 Apr 2017 17 Apr 2017 16 Oct 2017 16 Oct 2017
1 Based on the exchange rate at 10 August 2017 of NZ$1 to US$0.7345 and a ratio of five ordinary shares per one American Depositary Share. The actual exchange rate used for conversion is determined in the week prior to payment when the Bank of New York performs the physical currency conversion.
2 Supplementary dividends are paid to non-resident shareholders.
For
per
sona
l use
onl
y
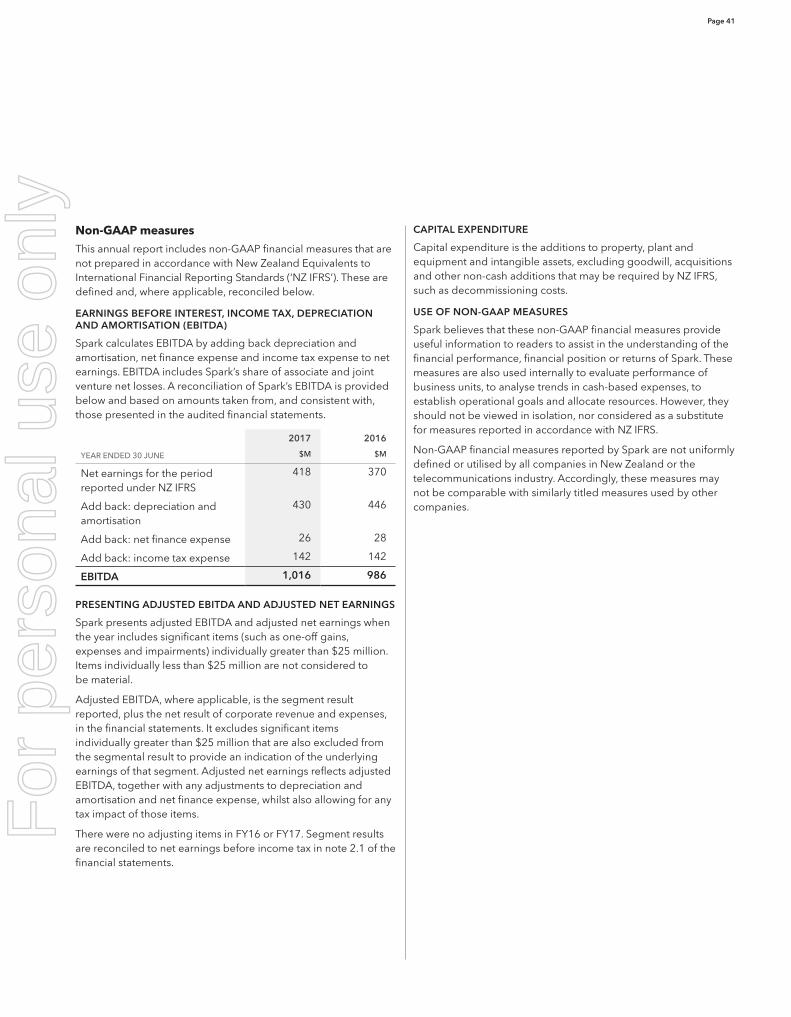
Page 41
Non-GAAP measuresThis annual report includes non-GAAP financial measures that are not prepared in accordance with New Zealand Equivalents to International Financial Reporting Standards (‘NZ IFRS’). These are defined and, where applicable, reconciled below.
EARNINGS BEFORE INTEREST, INCOME TAX, DEPRECIATION AND AMORTISATION (EBITDA)
Spark calculates EBITDA by adding back depreciation and amortisation, net finance expense and income tax expense to net earnings. EBITDA includes Spark’s share of associate and joint venture net losses. A reconciliation of Spark’s EBITDA is provided below and based on amounts taken from, and consistent with, those presented in the audited financial statements.
2017 2016
YEAR ENDED 30 JUNE $M $M
Net earnings for the period reported under NZ IFRS
418 370
Add back: depreciation and amortisation
430 446
Add back: net finance expense 26 28
Add back: income tax expense 142 142
EBITDA 1,016 986
PRESENTING ADJUSTED EBITDA AND ADJUSTED NET EARNINGS
Spark presents adjusted EBITDA and adjusted net earnings when the year includes significant items (such as one-off gains, expenses and impairments) individually greater than $25 million. Items individually less than $25 million are not considered to be material.
Adjusted EBITDA, where applicable, is the segment result reported, plus the net result of corporate revenue and expenses, in the financial statements. It excludes significant items individually greater than $25 million that are also excluded from the segmental result to provide an indication of the underlying earnings of that segment. Adjusted net earnings reflects adjusted EBITDA, together with any adjustments to depreciation and amortisation and net finance expense, whilst also allowing for any tax impact of those items.
There were no adjusting items in FY16 or FY17. Segment results are reconciled to net earnings before income tax in note 2.1 of the financial statements.
CAPITAL EXPENDITURE
Capital expenditure is the additions to property, plant and equipment and intangible assets, excluding goodwill, acquisitions and other non-cash additions that may be required by NZ IFRS, such as decommissioning costs.
USE OF NON-GAAP MEASURES
Spark believes that these non-GAAP financial measures provide useful information to readers to assist in the understanding of the financial performance, financial position or returns of Spark. These measures are also used internally to evaluate performance of business units, to analyse trends in cash-based expenses, to establish operational goals and allocate resources. However, they should not be viewed in isolation, nor considered as a substitute for measures reported in accordance with NZ IFRS.
Non-GAAP financial measures reported by Spark are not uniformly defined or utilised by all companies in New Zealand or the telecommunications industry. Accordingly, these measures may not be comparable with similarly titled measures used by other companies.
For
per
sona
l use
onl
y
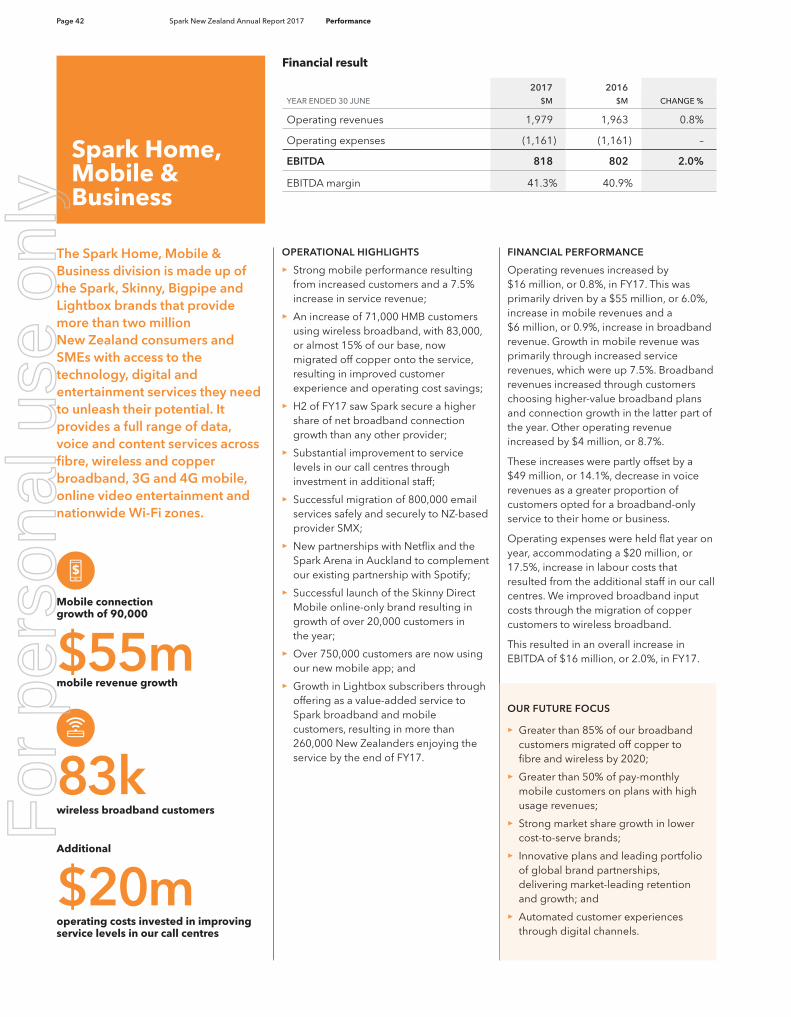
Page 42 Spark New Zealand Annual Report 2017 Performance
OPERATIONAL HIGHLIGHTS
>> Strong mobile performance resulting from increased customers and a 7.5% increase in service revenue;
>> An increase of 71,000 HMB customers using wireless broadband, with 83,000, or almost 15% of our base, now migrated off copper onto the service, resulting in improved customer experience and operating cost savings;
>> H2 of FY17 saw Spark secure a higher share of net broadband connection growth than any other provider;
>> Substantial improvement to service levels in our call centres through investment in additional staff;
>> Successful migration of 800,000 email services safely and securely to NZ-based provider SMX;
>> New partnerships with Netflix and the Spark Arena in Auckland to complement our existing partnership with Spotify;
>> Successful launch of the Skinny Direct Mobile online-only brand resulting in growth of over 20,000 customers in the year;
>> Over 750,000 customers are now using our new mobile app; and
>> Growth in Lightbox subscribers through offering as a value-added service to Spark broadband and mobile customers, resulting in more than 260,000 New Zealanders enjoying the service by the end of FY17.
FINANCIAL PERFORMANCE
Operating revenues increased by $16 million, or 0.8%, in FY17. This was primarily driven by a $55 million, or 6.0%, increase in mobile revenues and a $6 million, or 0.9%, increase in broadband revenue. Growth in mobile revenue was primarily through increased service revenues, which were up 7.5%. Broadband revenues increased through customers choosing higher-value broadband plans and connection growth in the latter part of the year. Other operating revenue increased by $4 million, or 8.7%.
These increases were partly offset by a $49 million, or 14.1%, decrease in voice revenues as a greater proportion of customers opted for a broadband-only service to their home or business.
Operating expenses were held flat year on year, accommodating a $20 million, or 17.5%, increase in labour costs that resulted from the additional staff in our call centres. We improved broadband input costs through the migration of copper customers to wireless broadband.
This resulted in an overall increase in EBITDA of $16 million, or 2.0%, in FY17.
OUR FUTURE FOCUS
>> Greater than 85% of our broadband customers migrated off copper to fibre and wireless by 2020;
>> Greater than 50% of pay-monthly mobile customers on plans with high usage revenues;
>> Strong market share growth in lower cost-to-serve brands;
>> Innovative plans and leading portfolio of global brand partnerships, delivering market-leading retention and growth; and
>> Automated customer experiences through digital channels.
Spark Home, Mobile & Business
2017 2016YEAR ENDED 30 JUNE $M $M CHANGE %
Operating revenues 1,979 1,963 0.8%
Operating expenses (1,161) (1,161) –
EBITDA 818 802 2.0%
EBITDA margin 41.3% 40.9%
Financial result
The Spark Home, Mobile & Business division is made up of the Spark, Skinny, Bigpipe and Lightbox brands that provide more than two million New Zealand consumers and SMEs with access to the technology, digital and entertainment services they need to unleash their potential. It provides a full range of data, voice and content services across fibre, wireless and copper broadband, 3G and 4G mobile, online video entertainment and nationwide Wi-Fi zones.
Mobile connection growth of 90,000
$55mmobile revenue growth
83kwireless broadband customers
Additional
$20moperating costs invested in improving service levels in our call centres
For
per
sona
l use
onl
y
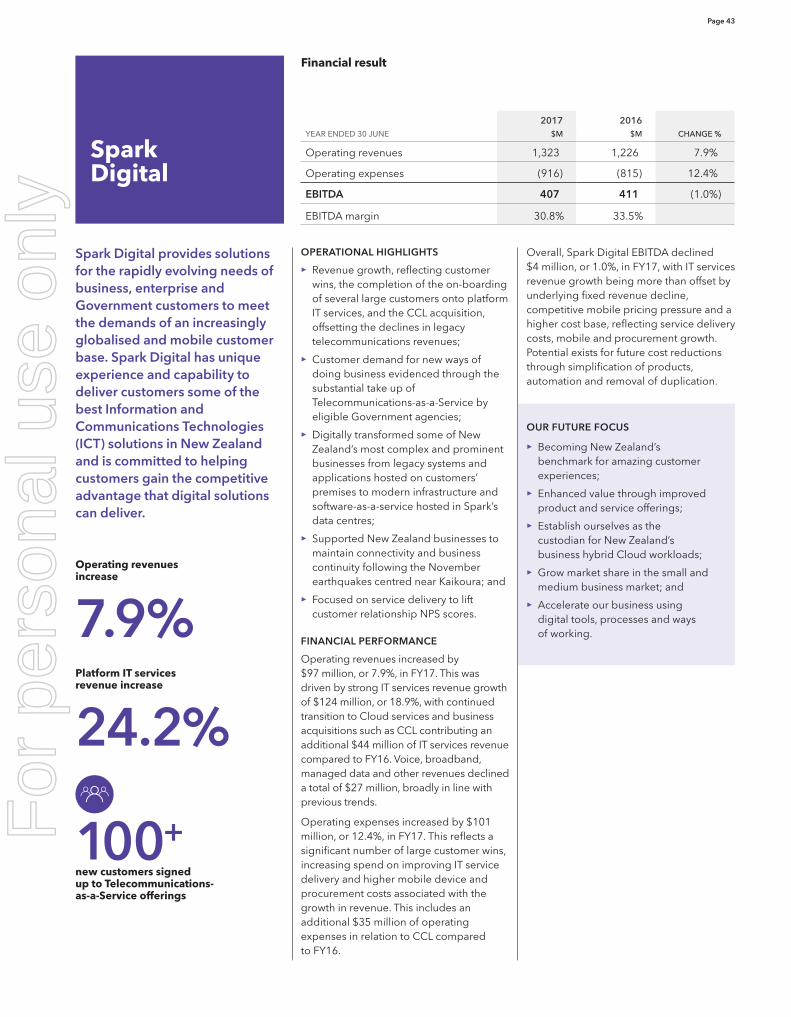
Page 43
OPERATIONAL HIGHLIGHTS
>> Revenue growth, reflecting customer wins, the completion of the on-boarding of several large customers onto platform IT services, and the CCL acquisition, offsetting the declines in legacy telecommunications revenues;
>> Customer demand for new ways of doing business evidenced through the substantial take up of Telecommunications-as-a-Service by eligible Government agencies;
>> Digitally transformed some of New Zealand’s most complex and prominent businesses from legacy systems and applications hosted on customers’ premises to modern infrastructure and software-as-a-service hosted in Spark’s data centres;
>> Supported New Zealand businesses to maintain connectivity and business continuity following the November earthquakes centred near Kaikoura; and
>> Focused on service delivery to lift customer relationship NPS scores.
FINANCIAL PERFORMANCE
Operating revenues increased by $97 million, or 7.9%, in FY17. This was driven by strong IT services revenue growth of $124 million, or 18.9%, with continued transition to Cloud services and business acquisitions such as CCL contributing an additional $44 million of IT services revenue compared to FY16. Voice, broadband, managed data and other revenues declined a total of $27 million, broadly in line with previous trends.
Operating expenses increased by $101 million, or 12.4%, in FY17. This reflects a significant number of large customer wins, increasing spend on improving IT service delivery and higher mobile device and procurement costs associated with the growth in revenue. This includes an additional $35 million of operating expenses in relation to CCL compared to FY16.
Overall, Spark Digital EBITDA declined $4 million, or 1.0%, in FY17, with IT services revenue growth being more than offset by underlying fixed revenue decline, competitive mobile pricing pressure and a higher cost base, reflecting service delivery costs, mobile and procurement growth. Potential exists for future cost reductions through simplification of products, automation and removal of duplication.
OUR FUTURE FOCUS
>> Becoming New Zealand’s benchmark for amazing customer experiences;
>> Enhanced value through improved product and service offerings;
>> Establish ourselves as the custodian for New Zealand’s business hybrid Cloud workloads;
>> Grow market share in the small and medium business market; and
>> Accelerate our business using digital tools, processes and ways of working.
Spark Digital
Financial result
Spark Digital provides solutions for the rapidly evolving needs of business, enterprise and Government customers to meet the demands of an increasingly globalised and mobile customer base. Spark Digital has unique experience and capability to deliver customers some of the best Information and Communications Technologies (ICT) solutions in New Zealand and is committed to helping customers gain the competitive advantage that digital solutions can deliver.
2017 2016YEAR ENDED 30 JUNE $M $M CHANGE %
Operating revenues 1,323 1,226 7.9%
Operating expenses (916) (815) 12.4%
EBITDA 407 411 (1.0%)
EBITDA margin 30.8% 33.5%
Operating revenues increase
7.9% Platform IT services revenue increase
24.2%
100+ new customers signed up to Telecommunications- as-a-Service offerings
For
per
sona
l use
onl
y
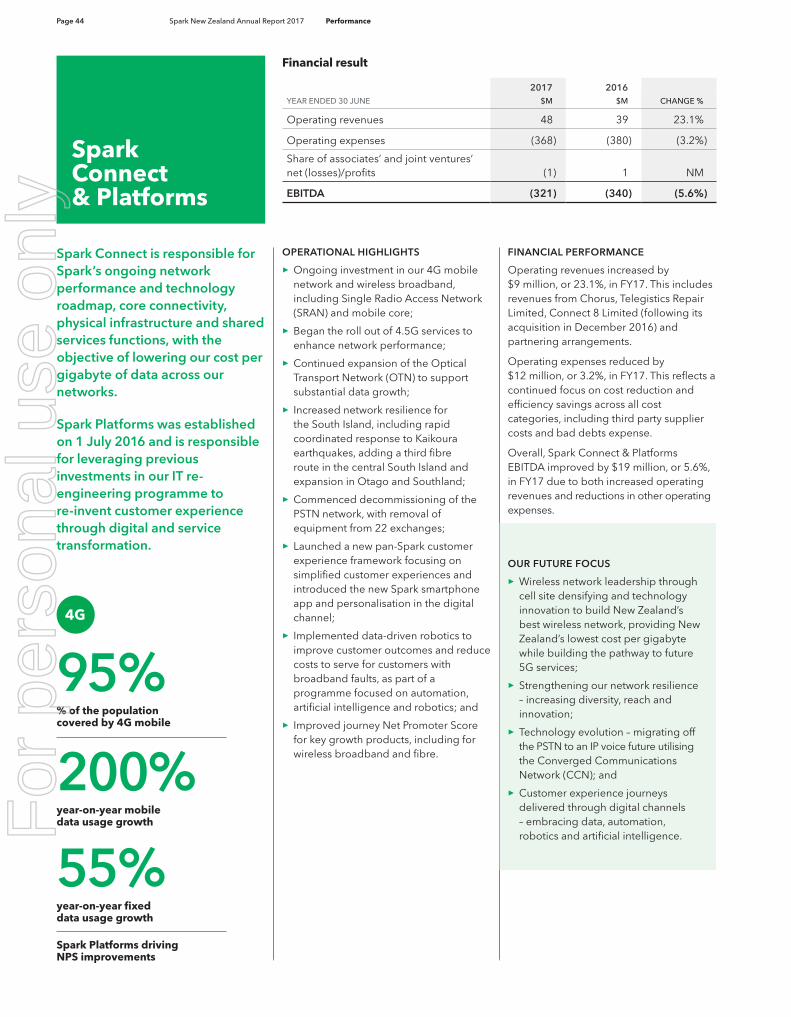
Page 44 Spark New Zealand Annual Report 2017 Performance
OPERATIONAL HIGHLIGHTS
> Ongoing investment in our 4G mobile network and wireless broadband, including Single Radio Access Network (SRAN) and mobile core;
> Began the roll out of 4.5G services to enhance network performance;
> Continued expansion of the Optical Transport Network (OTN) to support substantial data growth;
> Increased network resilience for the South Island, including rapid coordinated response to Kaikoura earthquakes, adding a third fibre route in the central South Island and expansion in Otago and Southland;
> Commenced decommissioning of the PSTN network, with removal of equipment from 22 exchanges;
> Launched a new pan-Spark customer experience framework focusing on simplified customer experiences and introduced the new Spark smartphone app and personalisation in the digital channel;
> Implemented data-driven robotics to improve customer outcomes and reduce costs to serve for customers with broadband faults, as part of a programme focused on automation, artificial intelligence and robotics; and
> Improved journey Net Promoter Score for key growth products, including for wireless broadband and fibre.
FINANCIAL PERFORMANCE
Operating revenues increased by $9 million, or 23.1%, in FY17. This includes revenues from Chorus, Telegistics Repair Limited, Connect 8 Limited (following its acquisition in December 2016) and partnering arrangements.
Operating expenses reduced by $12 million, or 3.2%, in FY17. This reflects a continued focus on cost reduction and efficiency savings across all cost categories, including third party supplier costs and bad debts expense.
Overall, Spark Connect & Platforms EBITDA improved by $19 million, or 5.6%, in FY17 due to both increased operating revenues and reductions in other operating expenses.
OUR FUTURE FOCUS
> Wireless network leadership through cell site densifying and technology innovation to build New Zealand’s best wireless network, providing New Zealand’s lowest cost per gigabyte while building the pathway to future 5G services;
> Strengthening our network resilience – increasing diversity, reach and innovation;
> Technology evolution – migrating off the PSTN to an IP voice future utilising the Converged Communications Network (CCN); and
> Customer experience journeys delivered through digital channels – embracing data, automation, robotics and artificial intelligence.
Spark Connect & Platforms
2017 2016YEAR ENDED 30 JUNE $M $M CHANGE %
Operating revenues 48 39 23.1%
Operating expenses (368) (380) (3.2%)
Share of associates’ and joint ventures’ net (losses)/profits (1) 1 NM
EBITDA (321) (340) (5.6%)
Financial result
Spark Connect is responsible for Spark’s ongoing network performance and technology roadmap, core connectivity, physical infrastructure and shared services functions, with the objective of lowering our cost per gigabyte of data across our networks.
Spark Platforms was established on 1 July 2016 and is responsible for leveraging previous investments in our IT re-engineering programme to re-invent customer experience through digital and service transformation.
95%% of the population covered by 4G mobile
200% year-on-year mobile data usage growth
55% year-on-year fixed data usage growth
Spark Platforms driving NPS improvements
For
per
sona
l use
onl
y
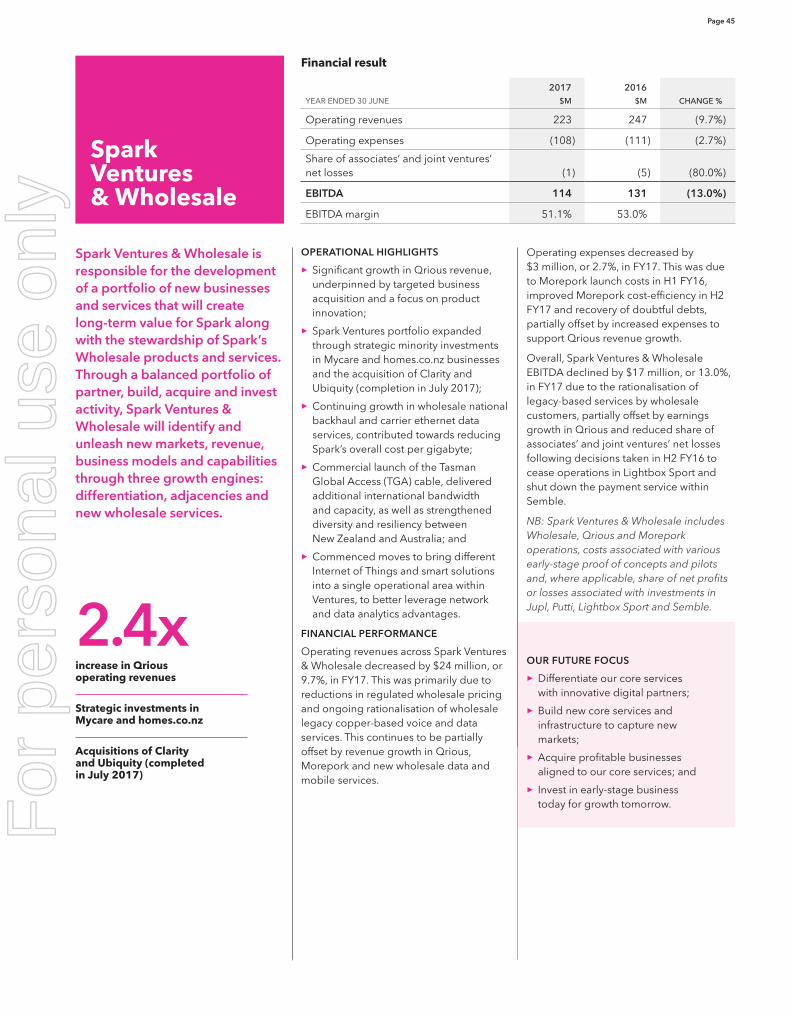
Page 45
OPERATIONAL HIGHLIGHTS
> Significant growth in Qrious revenue, underpinned by targeted business acquisition and a focus on product innovation;
> Spark Ventures portfolio expanded through strategic minority investments in Mycare and homes.co.nz businesses and the acquisition of Clarity and Ubiquity (completion in July 2017);
> Continuing growth in wholesale national backhaul and carrier ethernet data services, contributed towards reducing Spark’s overall cost per gigabyte;
> Commercial launch of the Tasman Global Access (TGA) cable, delivered additional international bandwidth and capacity, as well as strengthened diversity and resiliency between New Zealand and Australia; and
> Commenced moves to bring different Internet of Things and smart solutions into a single operational area within Ventures, to better leverage network and data analytics advantages.
FINANCIAL PERFORMANCE
Operating revenues across Spark Ventures & Wholesale decreased by $24 million, or 9.7%, in FY17. This was primarily due to reductions in regulated wholesale pricing and ongoing rationalisation of wholesale legacy copper-based voice and data services. This continues to be partially offset by revenue growth in Qrious, Morepork and new wholesale data and mobile services.
Operating expenses decreased by $3 million, or 2.7%, in FY17. This was due to Morepork launch costs in H1 FY16, improved Morepork cost-efficiency in H2 FY17 and recovery of doubtful debts, partially offset by increased expenses to support Qrious revenue growth.
Overall, Spark Ventures & Wholesale EBITDA declined by $17 million, or 13.0%, in FY17 due to the rationalisation of legacy-based services by wholesale customers, partially offset by earnings growth in Qrious and reduced share of associates’ and joint ventures’ net losses following decisions taken in H2 FY16 to cease operations in Lightbox Sport and shut down the payment service within Semble.
NB: Spark Ventures & Wholesale includes Wholesale, Qrious and Morepork operations, costs associated with various early-stage proof of concepts and pilots and, where applicable, share of net profits or losses associated with investments in Jupl, Putti, Lightbox Sport and Semble.
OUR FUTURE FOCUS
> Differentiate our core services with innovative digital partners;
> Build new core services and infrastructure to capture new markets;
> Acquire profitable businesses aligned to our core services; and
> Invest in early-stage business today for growth tomorrow.
Spark Ventures& Wholesale
2017 2016YEAR ENDED 30 JUNE $M $M CHANGE %
Operating revenues 223 247 (9.7%)
Operating expenses (108) (111) (2.7%)
Share of associates’ and joint ventures’ net losses (1) (5) (80.0%)
EBITDA 114 131 (13.0%)
EBITDA margin 51.1% 53.0%
Financial result
Spark Ventures & Wholesale is responsible for the development of a portfolio of new businesses and services that will create long-term value for Spark along with the stewardship of Spark’s Wholesale products and services. Through a balanced portfolio of partner, build, acquire and invest activity, Spark Ventures & Wholesale will identify and unleash new markets, revenue, business models and capabilities through three growth engines: differentiation, adjacencies and new wholesale services.
2.4x increase in Qrious operating revenues
Strategic investments in Mycare and homes.co.nz
Acquisitions of Clarity and Ubiquity (completed in July 2017)
For
per
sona
l use
onl
y

Page 46 Spark New Zealand Annual Report 2017 Financial statements
Financial statements
Financial statements 47
Notes to the financial statements 51
Section 1 – General information
1.1 About this report
1.2 Key estimates and assumptions
1.3 Significant transactions and events in the financial year
Section 2 – Financial performance information
2.1 Segment information
2.2 Operating revenues and other gains
2.3 Operating expenses
2.4 Net finance expense
Section 3 – Operating assets and liabilities
3.1 Receivables and prepayments
3.2 Inventories
3.3 Payables, accruals and provisions
3.4 Property, plant and equipment
3.5 Intangible assets
Section 4 – Group structure
4.1 Long-term investments
4.2 Subsidiaries
4.3 Joint operation
Section 5 – Funding and risk
5.1 Debt
5.2 Derivatives
5.3 Financial and capital risk management
5.4 Equity and dividends
Section 6 – Other information
6.1 Net tangible assets
6.2 Taxation
6.3 Employee share schemes
6.4 Related party transactions
6.5 Reconciliation of net earnings to net cash flows from operating activities
6.6 Commitments
6.7 Contingencies
6.8 New accounting standards not yet adopted
Independent auditor's report 78
For
per
sona
l use
onl
y
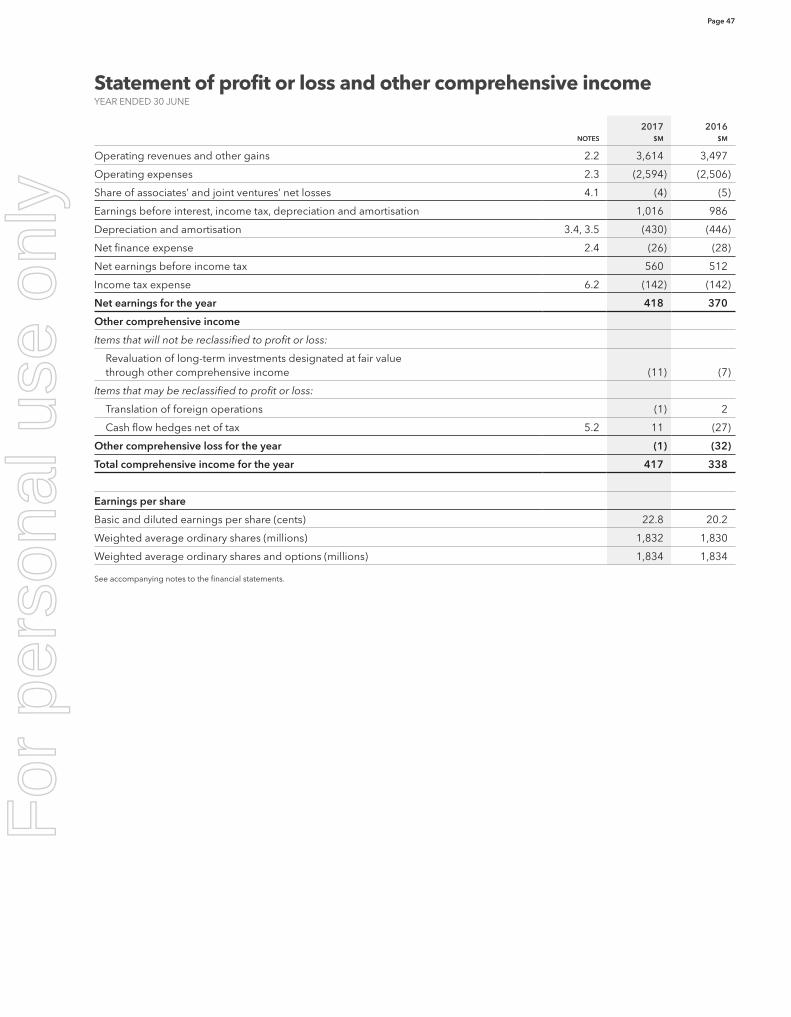
Page 47
Statement of profit or loss and other comprehensive incomeYEAR ENDED 30 JUNE
2017 2016NOTES $M $M
Operating revenues and other gains 2.2 3,614 3,497
Operating expenses 2.3 (2,594) (2,506)
Share of associates’ and joint ventures’ net losses 4.1 (4) (5)
Earnings before interest, income tax, depreciation and amortisation 1,016 986
Depreciation and amortisation 3.4, 3.5 (430) (446)
Net finance expense 2.4 (26) (28)
Net earnings before income tax 560 512
Income tax expense 6.2 (142) (142)
Net earnings for the year 418 370
Other comprehensive income
Items that will not be reclassified to profit or loss:
Revaluation of long-term investments designated at fair value through other comprehensive income (11) (7)
Items that may be reclassified to profit or loss:
Translation of foreign operations (1) 2
Cash flow hedges net of tax 5.2 11 (27)
Other comprehensive loss for the year (1) (32)
Total comprehensive income for the year 417 338
Earnings per share
Basic and diluted earnings per share (cents) 22.8 20.2
Weighted average ordinary shares (millions) 1,832 1,830
Weighted average ordinary shares and options (millions) 1,834 1,834
See accompanying notes to the financial statements.
For
per
sona
l use
onl
y
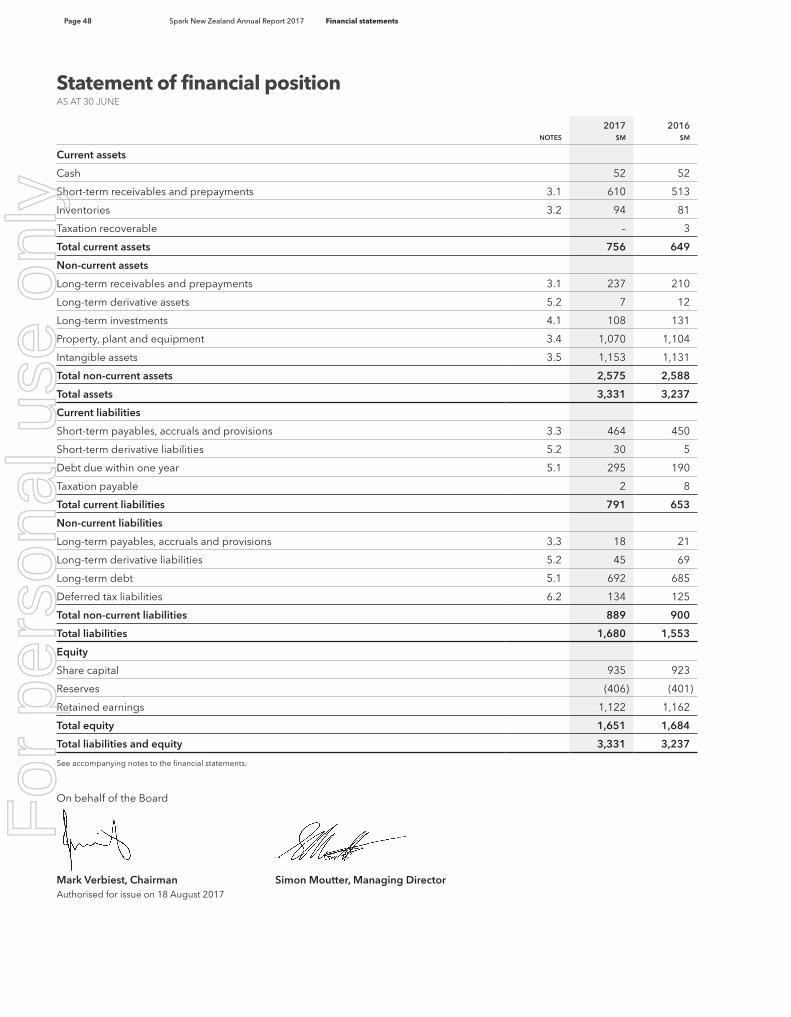
Page 48 Spark New Zealand Annual Report 2017 Financial statements
On behalf of the Board
Mark Verbiest, Chairman Simon Moutter, Managing DirectorAuthorised for issue on 18 August 2017
Statement of financial position AS AT 30 JUNE
2017 2016NOTES $M $M
Current assets
Cash 52 52
Short-term receivables and prepayments 3.1 610 513
Inventories 3.2 94 81
Taxation recoverable – 3
Total current assets 756 649
Non-current assets
Long-term receivables and prepayments 3.1 237 210
Long-term derivative assets 5.2 7 12
Long-term investments 4.1 108 131
Property, plant and equipment 3.4 1,070 1,104
Intangible assets 3.5 1,153 1,131
Total non-current assets 2,575 2,588
Total assets 3,331 3,237
Current liabilities
Short-term payables, accruals and provisions 3.3 464 450
Short-term derivative liabilities 5.2 30 5
Debt due within one year 5.1 295 190
Taxation payable 2 8
Total current liabilities 791 653
Non-current liabilities
Long-term payables, accruals and provisions 3.3 18 21
Long-term derivative liabilities 5.2 45 69
Long-term debt 5.1 692 685
Deferred tax liabilities 6.2 134 125
Total non-current liabilities 889 900
Total liabilities 1,680 1,553
Equity
Share capital 935 923
Reserves (406) (401)
Retained earnings 1,122 1,162
Total equity 1,651 1,684
Total liabilities and equity 3,331 3,237
See accompanying notes to the financial statements.
For
per
sona
l use
onl
y
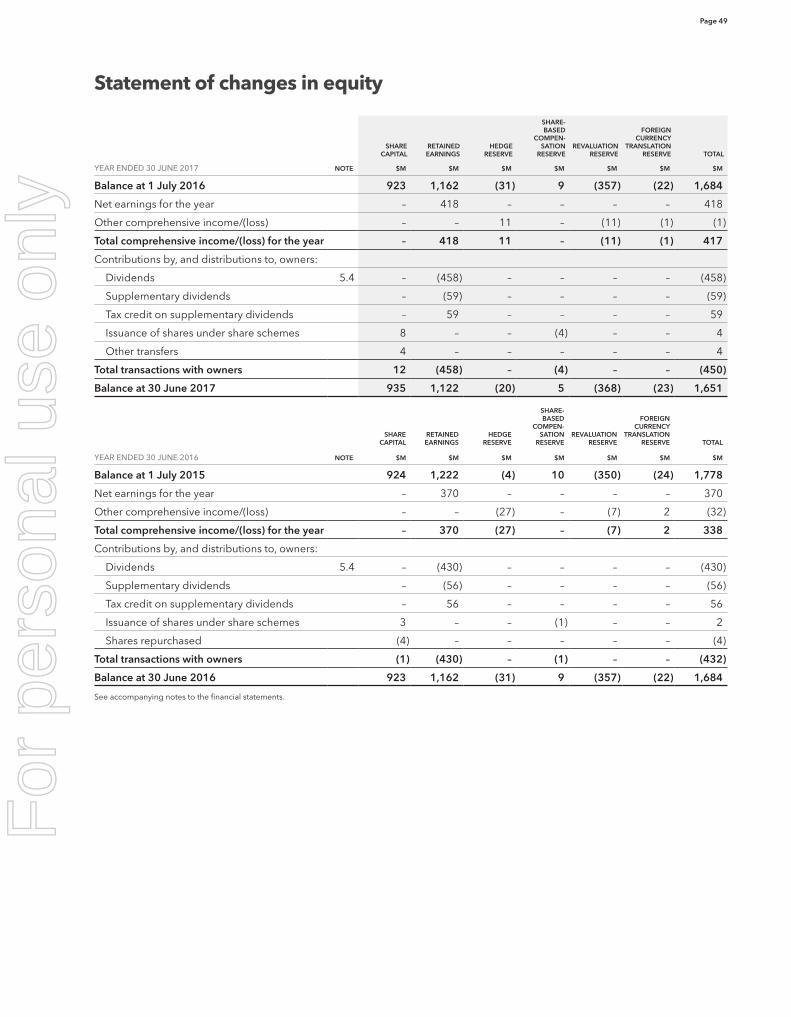
Page 49
Statement of changes in equity
SHARE CAPITAL
RETAINED EARNINGS
HEDGE RESERVE
SHARE- BASED
COMPEN-SATION
RESERVEREVALUATION
RESERVE
FOREIGN CURRENCY
TRANSLATION RESERVE TOTAL
YEAR ENDED 30 JUNE 2017 NOTE $M $M $M $M $M $M $M
Balance at 1 July 2016 923 1,162 (31) 9 (357) (22) 1,684
Net earnings for the year – 418 – – – – 418
Other comprehensive income/(loss) – – 11 – (11) (1) (1)
Total comprehensive income/(loss) for the year – 418 11 – (11) (1) 417
Contributions by, and distributions to, owners:
Dividends 5.4 – (458) – – – – (458)
Supplementary dividends – (59) – – – – (59)
Tax credit on supplementary dividends – 59 – – – – 59
Issuance of shares under share schemes 8 – – (4) – – 4
Other transfers 4 – – – – – 4
Total transactions with owners 12 (458) – (4) – – (450)
Balance at 30 June 2017 935 1,122 (20) 5 (368) (23) 1,651
SHARE CAPITAL
RETAINED EARNINGS
HEDGE RESERVE
SHARE- BASED
COMPEN-SATION
RESERVEREVALUATION
RESERVE
FOREIGN CURRENCY
TRANSLATION RESERVE TOTAL
YEAR ENDED 30 JUNE 2016 NOTE $M $M $M $M $M $M $M
Balance at 1 July 2015 924 1,222 (4) 10 (350) (24) 1,778
Net earnings for the year – 370 – – – – 370
Other comprehensive income/(loss) – – (27) – (7) 2 (32)
Total comprehensive income/(loss) for the year – 370 (27) – (7) 2 338
Contributions by, and distributions to, owners:
Dividends 5.4 – (430) – – – – (430)
Supplementary dividends – (56) – – – – (56)
Tax credit on supplementary dividends – 56 – – – – 56
Issuance of shares under share schemes 3 – – (1) – – 2
Shares repurchased (4) – – – – – (4)
Total transactions with owners (1) (430) – (1) – – (432)
Balance at 30 June 2016 923 1,162 (31) 9 (357) (22) 1,684
See accompanying notes to the financial statements.
For
per
sona
l use
onl
y
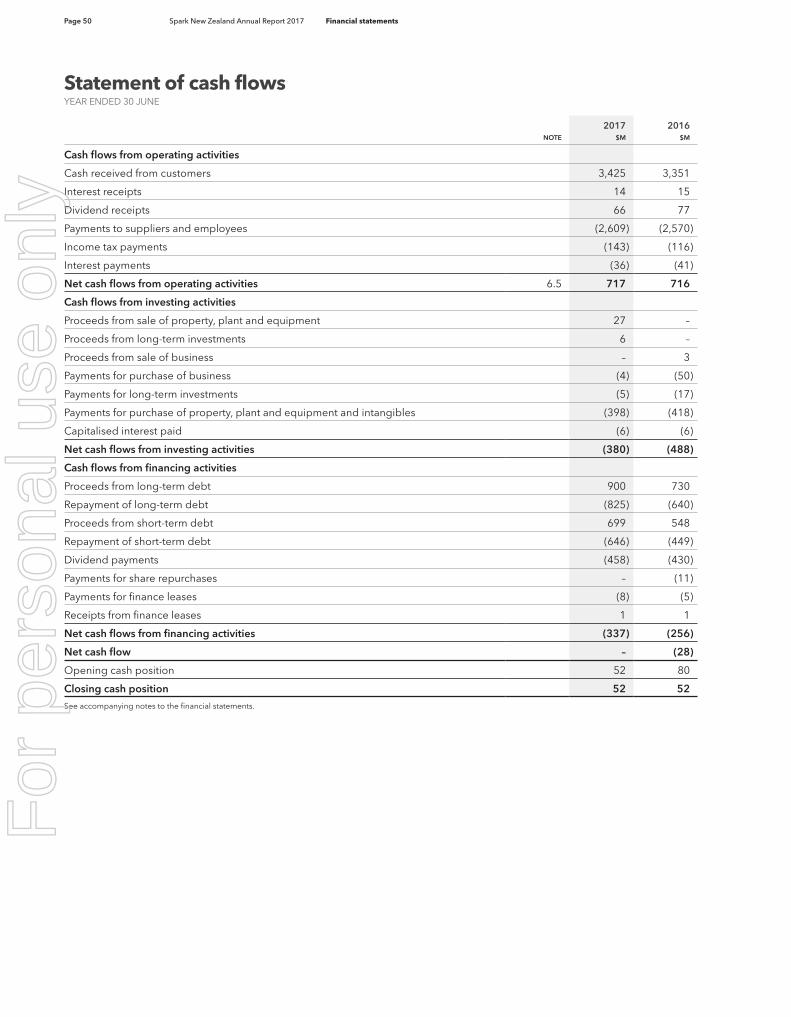
Page 50 Spark New Zealand Annual Report 2017 Financial statements
Statement of cash flowsYEAR ENDED 30 JUNE
2017 2016NOTE $M $M
Cash flows from operating activities
Cash received from customers 3,425 3,351
Interest receipts 14 15
Dividend receipts 66 77
Payments to suppliers and employees (2,609) (2,570)
Income tax payments (143) (116)
Interest payments (36) (41)
Net cash flows from operating activities 6.5 717 716
Cash flows from investing activities
Proceeds from sale of property, plant and equipment 27 –
Proceeds from long-term investments 6 –
Proceeds from sale of business – 3
Payments for purchase of business (4) (50)
Payments for long-term investments (5) (17)
Payments for purchase of property, plant and equipment and intangibles (398) (418)
Capitalised interest paid (6) (6)
Net cash flows from investing activities (380) (488)
Cash flows from financing activities
Proceeds from long-term debt 900 730
Repayment of long-term debt (825) (640)
Proceeds from short-term debt 699 548
Repayment of short-term debt (646) (449)
Dividend payments (458) (430)
Payments for share repurchases – (11)
Payments for finance leases (8) (5)
Receipts from finance leases 1 1
Net cash flows from financing activities (337) (256)
Net cash flow – (28)
Opening cash position 52 80
Closing cash position 52 52
See accompanying notes to the financial statements.
For
per
sona
l use
onl
y
Page 51
1
Notes to the financial statements: General information
Section 1 General information
In this sectionThis section includes general information to assist in understanding how these financial statements were prepared. A summary of significant transactions and events provides a snapshot of what affected the financial performance and position of Spark during the year.
1.1 About this reportReporting entityThese financial statements are for Spark New Zealand Limited (the Company) and its subsidiaries (together ‘Spark’ or ‘the Group’).
Spark is a major supplier of telecommunications and digital services in New Zealand. Spark provides a full range of telecommunications and information and communications technology products and services, including: local, national, international and value-added telephone services; mobile services, data networks, broadband services, internet TV; IT services and procurement; equipment sales; and installation services.
The Company is incorporated and domiciled in New Zealand, registered under the Companies Act 1993 and is an FMC reporting entity under the Financial Markets Conduct Act 2013. The Company is listed on the New Zealand Main Board equity security market and the Australian Securities Exchange and the address of its registered office is Spark City, 167 Victoria Street West, Auckland 1010, New Zealand.
Basis of preparationThe financial statements have been prepared in accordance with Generally Accepted Accounting Practice in New Zealand (‘NZ GAAP’). They comply with New Zealand equivalents to International Financial Reporting Standards (‘NZ IFRS’) and other applicable Financial Reporting Standards, as appropriate for profit-oriented entities. The financial statements also comply with International Financial Reporting Standards (‘IFRS’).
The measurement basis adopted in the preparation of these financial statements is historical cost, modified by the revaluation of certain investments and financial instruments as identified in the accompanying notes. These financial statements are expressed in New Zealand dollars, which is Spark’s functional and presentation currency. All financial information has been rounded to the nearest million, unless otherwise stated. Certain comparative information has been updated to conform with the current year’s presentation.
The principal accounting policies applied in the preparation of these financial statements are set out in the accompanying notes where an accounting policy choice is provided by NZ IFRS. A policy is also included when it is new or has changed, is specific to Spark’s operations or is significant or material. Where NZ IFRS does not provide an accounting policy choice, Spark has applied the requirements of NZ IFRS but a detailed accounting policy is not included.
New and amended standards adopted by SparkSpark early adopted Part 1 of NZ IFRS 9 (2009) Financial Instruments from the year ended 30 June 2010. NZ IFRS 9 specifies that financial assets should be measured at either amortised cost or fair value, on the basis of both the business model for managing these assets and the nature of any contractual cash flows. The recognition and measurement of financial liabilities currently remains in accordance with NZ IAS 39 Financial Instruments.
See note 6.8 for details on new accounting standards issued but not yet adopted.
1.2 Key estimates and assumptionsThe preparation of these financial statements requires management to make estimates and assumptions. These affect the amounts of revenues and expenses reported for the period and the measurement of assets and liabilities as at 30 June. Actual results could differ from these estimates.
The principal areas of judgement for Spark in preparing these financial statements are found in the following notes:
• Note 2.2 Operating revenues and other gains
• Note 3.4 Property, plant and equipment
• Note 3.5 Intangible assets.
For
per
sona
l use
onl
y
Page 52 Spark New Zealand Annual Report 2017 Notes to the financial statements
1.3 Significant transactions and events in the financial yearThe following significant transactions and events affected the financial performance and financial position of Spark for the year ended 30 June 2017:
Segment changes• From 1 July 2016 Spark’s operating segments altered to
reflect changes in the structure of our business units and to ensure they continue to reflect the way we analyse our business results. We have restated the comparative segment results as outlined in Note 2.1 and there was no change to the overall Spark reported result because of these changes.
Debt programme• On 7 September 2016 Spark issued $125 million of
unsecured, unsubordinated fixed rate bonds with a coupon rate of 3.94%, maturing on 7 September 2026.
• On 30 November 2016 Spark established a $125 million committed revolving facility with Westpac New Zealand Limited, to mature on 30 November 2020. This replaced the $100 million committed revolving facility with Westpac New Zealand Limited that matured on 30 November 2016.
Capital expenditure• Spark’s additions to property, plant and equipment during
the year were $219 million and to intangible assets $196 million, a total of $415 million. This included $102 million in relation to Spark’s mobile network, $112 million on IT systems, $42 million on Cloud and $34 million on international cable construction and capacity purchases.
• Capital expenditure during the year included approximately $15 million for remediation and network resiliency improvements following the November 2016 Kaikoura earthquakes.
Acquisitions and investments• Spark acquired the remaining 50% of Connect 8 Limited, a
fibre construction business, from joint venture partner Vocus (New Zealand) Limited on 1 December 2016 and it was fully consolidated from this date. The joint venture was originally formed in February 2015 to provide additional fibre construction and delivery capability. Connect 8 Limited continues to construct fibre and telecommunications assets for Spark and other telecommunications providers in New Zealand.
• Spark acquired 100% of Clarity Information Management Limited on 1 August 2016 and it was subsequently amalgamated into Qrious Limited on 31 October 2016.
Notes to the financial statements: General information
• During the period Spark acquired a 15% holding in Mycare Limited, an online platform changing the way people find healthcare support in New Zealand, and a 14% holding in PropertyNZ Limited that has developed homes.co.nz, a website that pulls together property data that is simple to use.
• Spark’s net earnings for the year includes $4 million from our share of the net losses of associates and joint ventures. Spark also made small additional investments in Vigil Monitoring Limited (known as Jupl) and App La Carte Limited (known as Putti) and recognised a $2 million impairment expense to fully write down our investment in TSM NZ Limited (known as Semble) as its operations have ceased.
• Spark received a $6 million distribution from our remaining investment within the TMT Ventures corporate venture capital programme, being the final proceeds from the sale of its underlying holdings.
Dividends• Dividends paid during the year ended 30 June 2017 in
relation to the H2 FY16 second-half dividend (ordinary dividend of 11 cents per share and special dividend of 1.5 cents per share) and H1 FY17 first-half dividend (ordinary dividend of 11 cents per share and special dividend of 1.5 cents per share) totalled $458 million or 25.0 cents per share. Dividends paid during the prior year ended 30 June 2016 totalled $430 million or 23.5 cents per share.
For
per
sona
l use
onl
y
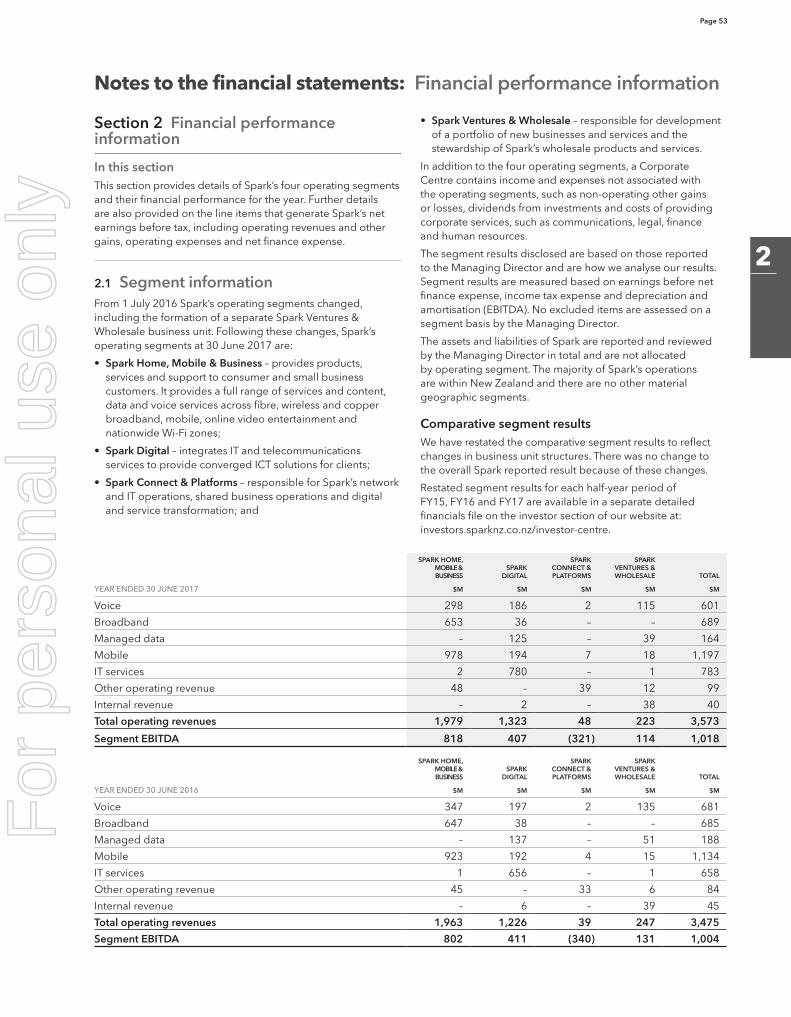
Page 53
2
Notes to the financial statements: Financial performance information
Section 2 Financial performance information
In this sectionThis section provides details of Spark’s four operating segments and their financial performance for the year. Further details are also provided on the line items that generate Spark’s net earnings before tax, including operating revenues and other gains, operating expenses and net finance expense.
2.1 Segment informationFrom 1 July 2016 Spark’s operating segments changed, including the formation of a separate Spark Ventures & Wholesale business unit. Following these changes, Spark’s operating segments at 30 June 2017 are:
• Spark Home, Mobile & Business – provides products, services and support to consumer and small business customers. It provides a full range of services and content, data and voice services across fibre, wireless and copper broadband, mobile, online video entertainment and nationwide Wi-Fi zones;
• Spark Digital – integrates IT and telecommunications services to provide converged ICT solutions for clients;
• Spark Connect & Platforms – responsible for Spark’s network and IT operations, shared business operations and digital and service transformation; and
• Spark Ventures & Wholesale – responsible for development of a portfolio of new businesses and services and the stewardship of Spark’s wholesale products and services.
In addition to the four operating segments, a Corporate Centre contains income and expenses not associated with the operating segments, such as non-operating other gains or losses, dividends from investments and costs of providing corporate services, such as communications, legal, finance and human resources.
The segment results disclosed are based on those reported to the Managing Director and are how we analyse our results. Segment results are measured based on earnings before net finance expense, income tax expense and depreciation and amortisation (EBITDA). No excluded items are assessed on a segment basis by the Managing Director.
The assets and liabilities of Spark are reported and reviewed by the Managing Director in total and are not allocated by operating segment. The majority of Spark’s operations are within New Zealand and there are no other material geographic segments.
Comparative segment resultsWe have restated the comparative segment results to reflect changes in business unit structures. There was no change to the overall Spark reported result because of these changes.
Restated segment results for each half-year period of FY15, FY16 and FY17 are available in a separate detailed financials file on the investor section of our website at: investors.sparknz.co.nz/investor-centre.
SPARK HOME, MOBILE & BUSINESS
SPARK DIGITAL
SPARK CONNECT & PLATFORMS
SPARK VENTURES & WHOLESALE TOTAL
YEAR ENDED 30 JUNE 2017 $M $M $M $M $M
Voice 298 186 2 115 601
Broadband 653 36 – – 689
Managed data – 125 – 39 164
Mobile 978 194 7 18 1,197
IT services 2 780 – 1 783
Other operating revenue 48 – 39 12 99
Internal revenue – 2 – 38 40
Total operating revenues 1,979 1,323 48 223 3,573
Segment EBITDA 818 407 (321) 114 1,018
SPARK HOME, MOBILE & BUSINESS
SPARK DIGITAL
SPARK CONNECT & PLATFORMS
SPARK VENTURES & WHOLESALE TOTAL
YEAR ENDED 30 JUNE 2016 $M $M $M $M $M
Voice 347 197 2 135 681
Broadband 647 38 – – 685
Managed data – 137 – 51 188
Mobile 923 192 4 15 1,134
IT services 1 656 – 1 658
Other operating revenue 45 – 33 6 84
Internal revenue – 6 – 39 45
Total operating revenues 1,963 1,226 39 247 3,475
Segment EBITDA 802 411 (340) 131 1,004
For
per
sona
l use
onl
y
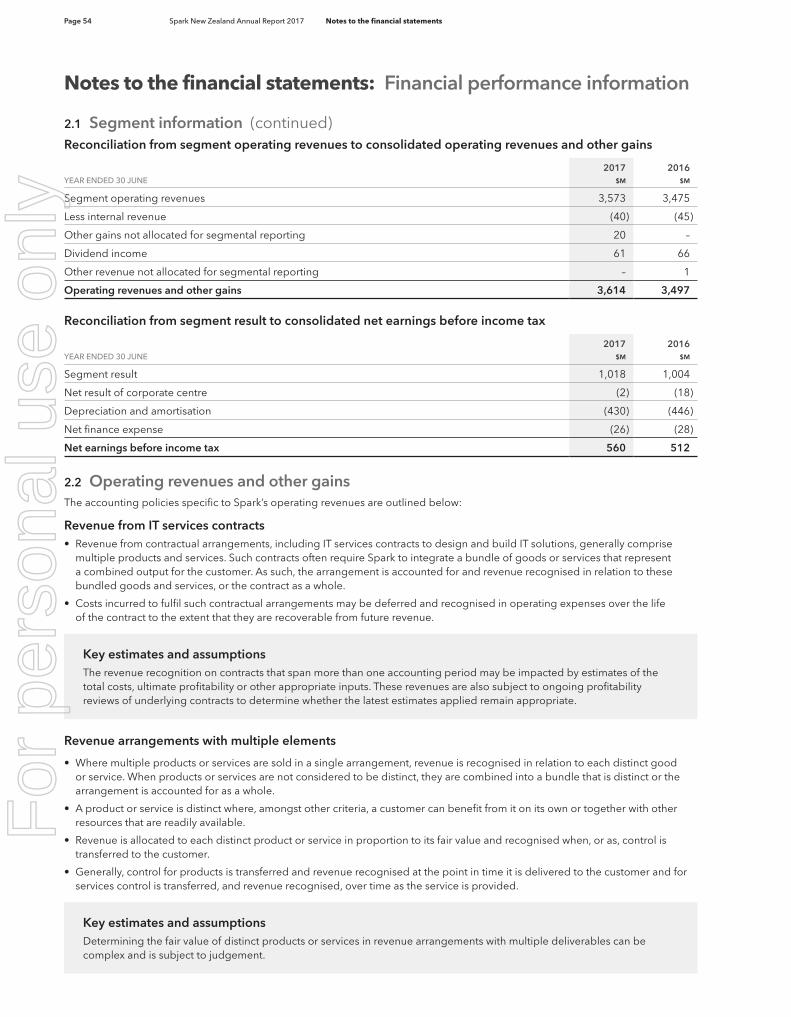
Page 54 Spark New Zealand Annual Report 2017 Notes to the financial statements
Notes to the financial statements: Financial performance information
Reconciliation from segment operating revenues to consolidated operating revenues and other gains
2017 2016YEAR ENDED 30 JUNE $M $M
Segment operating revenues 3,573 3,475
Less internal revenue (40) (45)
Other gains not allocated for segmental reporting 20 –
Dividend income 61 66
Other revenue not allocated for segmental reporting – 1
Operating revenues and other gains 3,614 3,497
Reconciliation from segment result to consolidated net earnings before income tax
2017 2016YEAR ENDED 30 JUNE $M $M
Segment result 1,018 1,004
Net result of corporate centre (2) (18)
Depreciation and amortisation (430) (446)
Net finance expense (26) (28)
Net earnings before income tax 560 512
2.2 Operating revenues and other gainsThe accounting policies specific to Spark’s operating revenues are outlined below:
Revenue from IT services contracts• Revenue from contractual arrangements, including IT services contracts to design and build IT solutions, generally comprise
multiple products and services. Such contracts often require Spark to integrate a bundle of goods or services that represent a combined output for the customer. As such, the arrangement is accounted for and revenue recognised in relation to these bundled goods and services, or the contract as a whole.
• Costs incurred to fulfil such contractual arrangements may be deferred and recognised in operating expenses over the life of the contract to the extent that they are recoverable from future revenue.
Key estimates and assumptionsThe revenue recognition on contracts that span more than one accounting period may be impacted by estimates of the total costs, ultimate profitability or other appropriate inputs. These revenues are also subject to ongoing profitability reviews of underlying contracts to determine whether the latest estimates applied remain appropriate.
Revenue arrangements with multiple elements
• Where multiple products or services are sold in a single arrangement, revenue is recognised in relation to each distinct good or service. When products or services are not considered to be distinct, they are combined into a bundle that is distinct or the arrangement is accounted for as a whole.
• A product or service is distinct where, amongst other criteria, a customer can benefit from it on its own or together with other resources that are readily available.
• Revenue is allocated to each distinct product or service in proportion to its fair value and recognised when, or as, control is transferred to the customer.
• Generally, control for products is transferred and revenue recognised at the point in time it is delivered to the customer and for services control is transferred, and revenue recognised, over time as the service is provided.
Key estimates and assumptionsDetermining the fair value of distinct products or services in revenue arrangements with multiple deliverables can be complex and is subject to judgement.
2.1 Segment information (continued)
For
per
sona
l use
onl
y
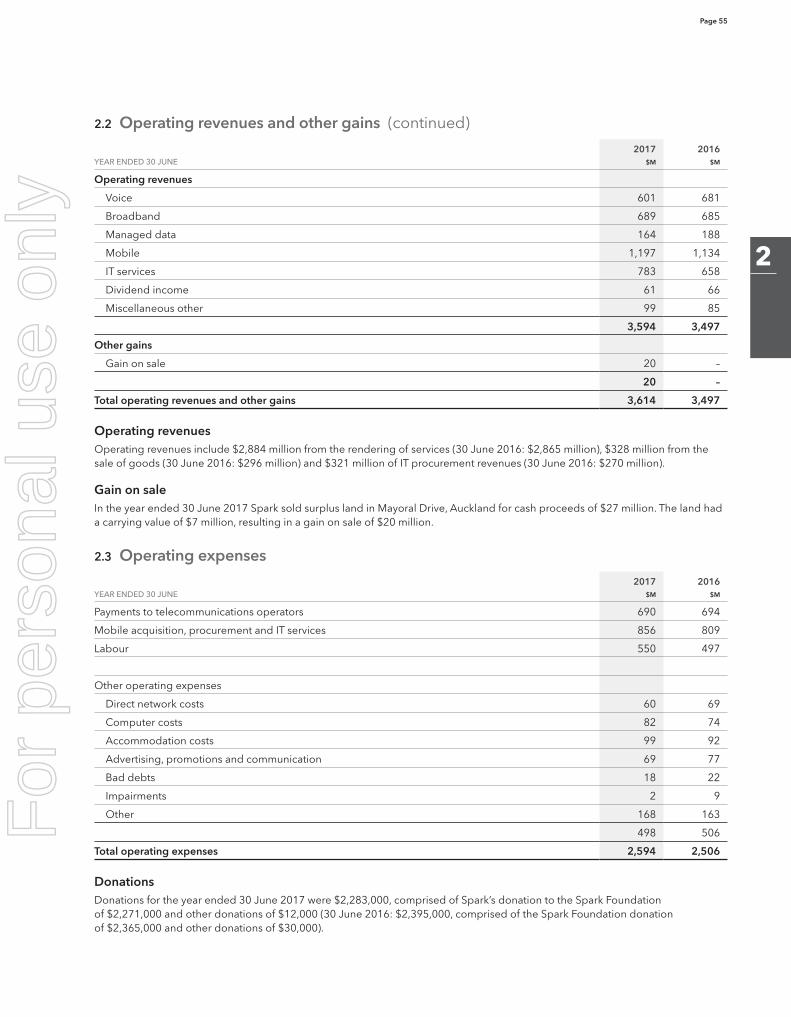
Page 55
2
2.2 Operating revenues and other gains (continued)
2017 2016YEAR ENDED 30 JUNE $M $M
Operating revenues
Voice 601 681
Broadband 689 685
Managed data 164 188
Mobile 1,197 1,134
IT services 783 658
Dividend income 61 66
Miscellaneous other 99 85
3,594 3,497
Other gains
Gain on sale 20 –
20 –
Total operating revenues and other gains 3,614 3,497
Operating revenuesOperating revenues include $2,884 million from the rendering of services (30 June 2016: $2,865 million), $328 million from the sale of goods (30 June 2016: $296 million) and $321 million of IT procurement revenues (30 June 2016: $270 million).
Gain on saleIn the year ended 30 June 2017 Spark sold surplus land in Mayoral Drive, Auckland for cash proceeds of $27 million. The land had a carrying value of $7 million, resulting in a gain on sale of $20 million.
2.3 Operating expenses2017 2016
YEAR ENDED 30 JUNE $M $M
Payments to telecommunications operators 690 694
Mobile acquisition, procurement and IT services 856 809
Labour 550 497
Other operating expenses
Direct network costs 60 69
Computer costs 82 74
Accommodation costs 99 92
Advertising, promotions and communication 69 77
Bad debts 18 22
Impairments 2 9
Other 168 163
498 506
Total operating expenses 2,594 2,506
DonationsDonations for the year ended 30 June 2017 were $2,283,000, comprised of Spark’s donation to the Spark Foundation of $2,271,000 and other donations of $12,000 (30 June 2016: $2,395,000, comprised of the Spark Foundation donation of $2,365,000 and other donations of $30,000).
For
per
sona
l use
onl
y
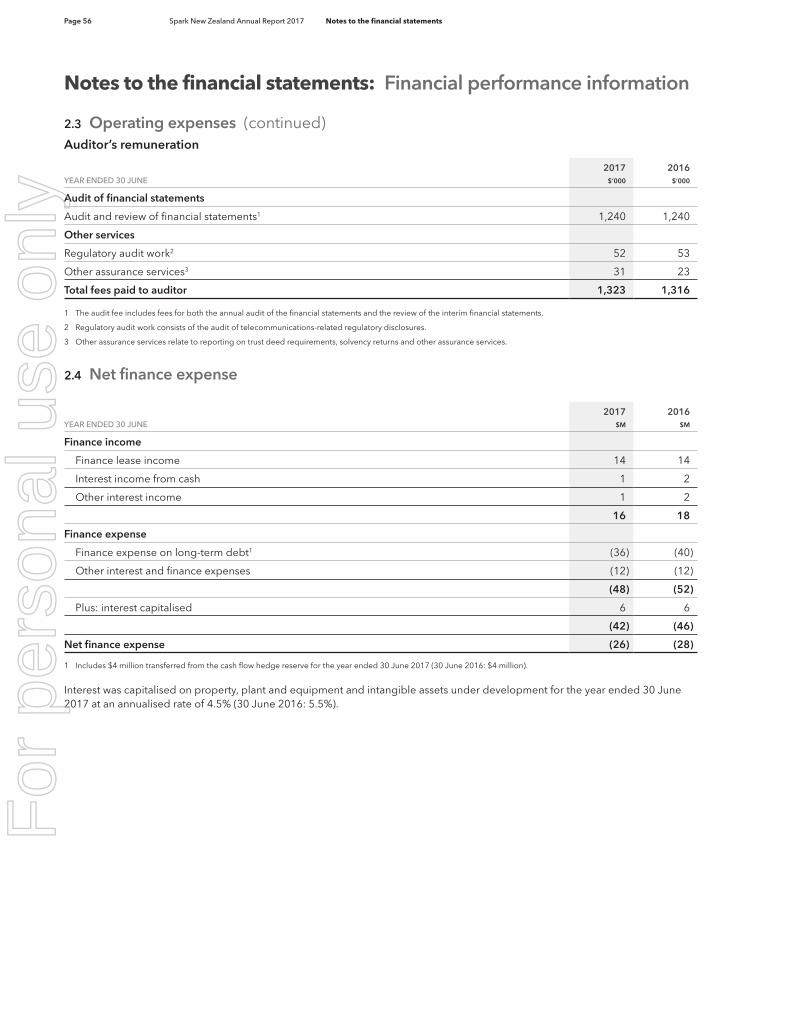
Page 56 Spark New Zealand Annual Report 2017 Notes to the financial statements
Auditor’s remuneration
2017 2016YEAR ENDED 30 JUNE $’000 $’000
Audit of financial statements
Audit and review of financial statements1 1,240 1,240
Other services
Regulatory audit work2 52 53
Other assurance services3 31 23
Total fees paid to auditor 1,323 1,316
1 The audit fee includes fees for both the annual audit of the financial statements and the review of the interim financial statements.
2 Regulatory audit work consists of the audit of telecommunications-related regulatory disclosures.
3 Other assurance services relate to reporting on trust deed requirements, solvency returns and other assurance services.
2.4 Net finance expense
2017 2016YEAR ENDED 30 JUNE $M $M
Finance income
Finance lease income 14 14
Interest income from cash 1 2
Other interest income 1 2
16 18
Finance expense
Finance expense on long-term debt1 (36) (40)
Other interest and finance expenses (12) (12)
(48) (52)
Plus: interest capitalised 6 6
(42) (46)
Net finance expense (26) (28)
1 Includes $4 million transferred from the cash flow hedge reserve for the year ended 30 June 2017 (30 June 2016: $4 million).
Interest was capitalised on property, plant and equipment and intangible assets under development for the year ended 30 June 2017 at an annualised rate of 4.5% (30 June 2016: 5.5%).
2.3 Operating expenses (continued)
Notes to the financial statements: Financial performance information
For
per
sona
l use
onl
y
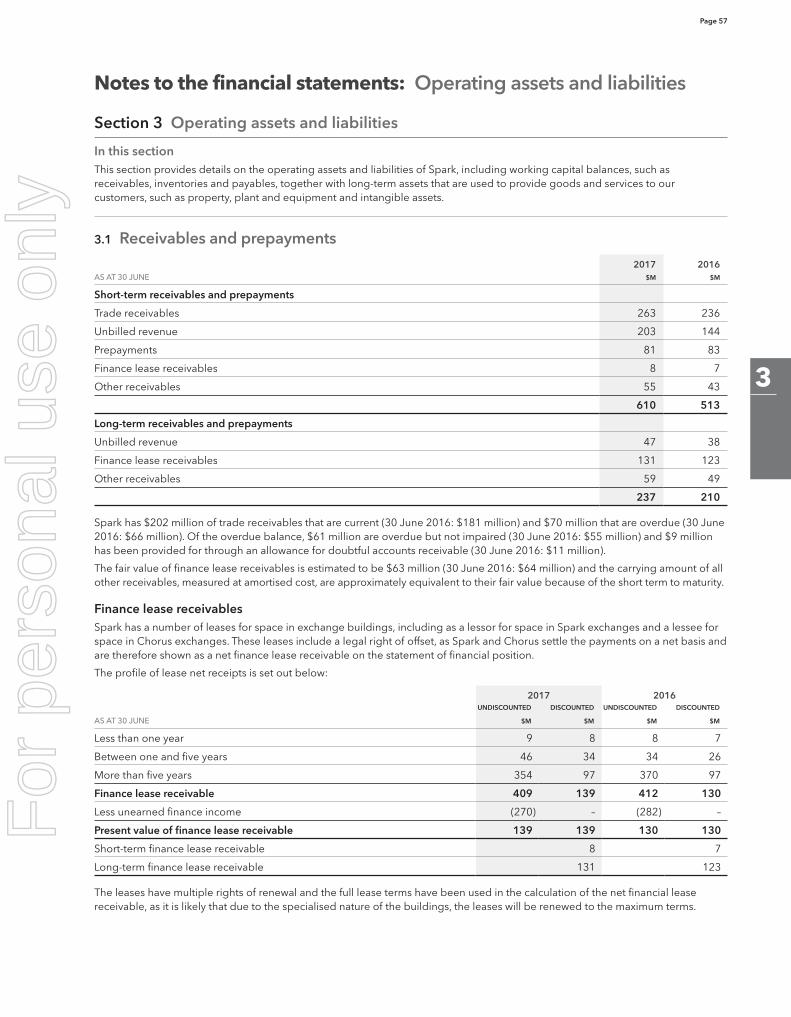
Page 57
3
Notes to the financial statements: Operating assets and liabilities
Section 3 Operating assets and liabilities
In this sectionThis section provides details on the operating assets and liabilities of Spark, including working capital balances, such as receivables, inventories and payables, together with long-term assets that are used to provide goods and services to our customers, such as property, plant and equipment and intangible assets.
3.1 Receivables and prepayments2017 2016
AS AT 30 JUNE $M $M
Short-term receivables and prepayments
Trade receivables 263 236
Unbilled revenue 203 144
Prepayments 81 83
Finance lease receivables 8 7
Other receivables 55 43
610 513
Long-term receivables and prepayments
Unbilled revenue 47 38
Finance lease receivables 131 123
Other receivables 59 49
237 210
Spark has $202 million of trade receivables that are current (30 June 2016: $181 million) and $70 million that are overdue (30 June 2016: $66 million). Of the overdue balance, $61 million are overdue but not impaired (30 June 2016: $55 million) and $9 million has been provided for through an allowance for doubtful accounts receivable (30 June 2016: $11 million).
The fair value of finance lease receivables is estimated to be $63 million (30 June 2016: $64 million) and the carrying amount of all other receivables, measured at amortised cost, are approximately equivalent to their fair value because of the short term to maturity.
Finance lease receivablesSpark has a number of leases for space in exchange buildings, including as a lessor for space in Spark exchanges and a lessee for space in Chorus exchanges. These leases include a legal right of offset, as Spark and Chorus settle the payments on a net basis and are therefore shown as a net finance lease receivable on the statement of financial position.
The profile of lease net receipts is set out below:
2017 2016UNDISCOUNTED DISCOUNTED UNDISCOUNTED DISCOUNTED
AS AT 30 JUNE $M $M $M $M
Less than one year 9 8 8 7
Between one and five years 46 34 34 26
More than five years 354 97 370 97
Finance lease receivable 409 139 412 130
Less unearned finance income (270) – (282) –
Present value of finance lease receivable 139 139 130 130
Short-term finance lease receivable 8 7
Long-term finance lease receivable 131 123
The leases have multiple rights of renewal and the full lease terms have been used in the calculation of the net financial lease receivable, as it is likely that due to the specialised nature of the buildings, the leases will be renewed to the maximum terms.
For
per
sona
l use
onl
y
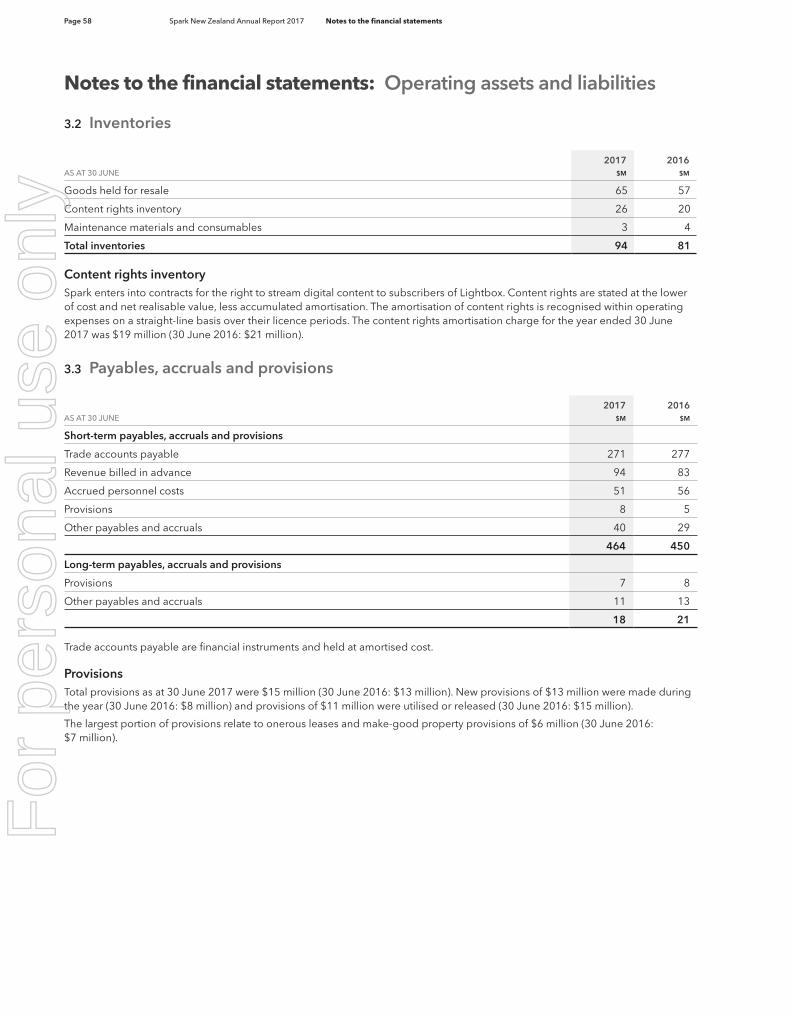
Page 58 Spark New Zealand Annual Report 2017 Notes to the financial statements
Notes to the financial statements: Operating assets and liabilities
3.2 Inventories
2017 2016AS AT 30 JUNE $M $M
Goods held for resale 65 57
Content rights inventory 26 20
Maintenance materials and consumables 3 4
Total inventories 94 81
Content rights inventorySpark enters into contracts for the right to stream digital content to subscribers of Lightbox. Content rights are stated at the lower of cost and net realisable value, less accumulated amortisation. The amortisation of content rights is recognised within operating expenses on a straight-line basis over their licence periods. The content rights amortisation charge for the year ended 30 June 2017 was $19 million (30 June 2016: $21 million).
3.3 Payables, accruals and provisions
2017 2016AS AT 30 JUNE $M $M
Short-term payables, accruals and provisions
Trade accounts payable 271 277
Revenue billed in advance 94 83
Accrued personnel costs 51 56
Provisions 8 5
Other payables and accruals 40 29
464 450
Long-term payables, accruals and provisions
Provisions 7 8
Other payables and accruals 11 13
18 21
Trade accounts payable are financial instruments and held at amortised cost.
ProvisionsTotal provisions as at 30 June 2017 were $15 million (30 June 2016: $13 million). New provisions of $13 million were made during the year (30 June 2016: $8 million) and provisions of $11 million were utilised or released (30 June 2016: $15 million).
The largest portion of provisions relate to onerous leases and make-good property provisions of $6 million (30 June 2016: $7 million).
For
per
sona
l use
onl
y
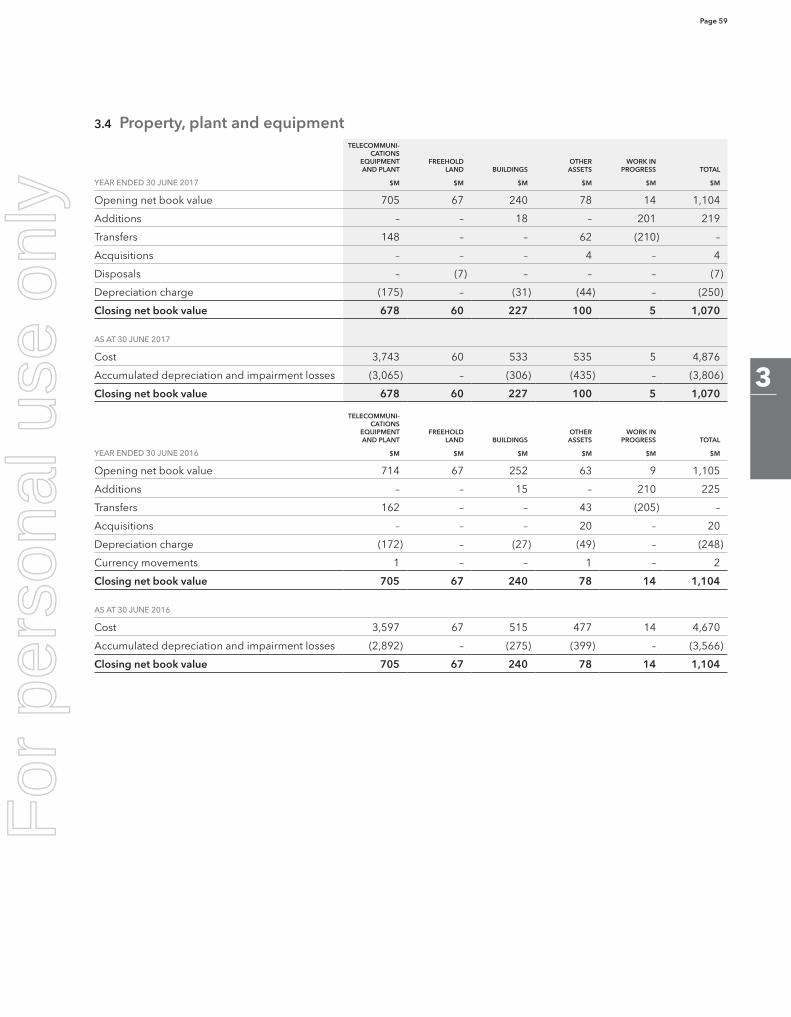
Page 59
3
3.4 Property, plant and equipmentTELECOMMUNI-
CATIONS EQUIPMENT AND PLANT
FREEHOLD LAND BUILDINGS
OTHER ASSETS
WORK IN PROGRESS TOTAL
YEAR ENDED 30 JUNE 2017 $M $M $M $M $M $M
Opening net book value 705 67 240 78 14 1,104
Additions – – 18 – 201 219
Transfers 148 – – 62 (210) –
Acquisitions – – – 4 – 4
Disposals – (7) – – – (7)
Depreciation charge (175) – (31) (44) – (250)
Closing net book value 678 60 227 100 5 1,070
AS AT 30 JUNE 2017
Cost 3,743 60 533 535 5 4,876
Accumulated depreciation and impairment losses (3,065) – (306) (435) – (3,806)
Closing net book value 678 60 227 100 5 1,070
TELECOMMUNI-CATIONS
EQUIPMENT AND PLANT
FREEHOLD LAND BUILDINGS
OTHER ASSETS
WORK IN PROGRESS TOTAL
YEAR ENDED 30 JUNE 2016 $M $M $M $M $M $M
Opening net book value 714 67 252 63 9 1,105
Additions – – 15 – 210 225
Transfers 162 – – 43 (205) –
Acquisitions – – – 20 – 20
Depreciation charge (172) – (27) (49) – (248)
Currency movements 1 – – 1 – 2
Closing net book value 705 67 240 78 14 1,104
AS AT 30 JUNE 2016
Cost 3,597 67 515 477 14 4,670
Accumulated depreciation and impairment losses (2,892) – (275) (399) – (3,566)
Closing net book value 705 67 240 78 14 1,104
For
per
sona
l use
onl
y
Page 60 Spark New Zealand Annual Report 2017 Notes to the financial statements
Notes to the financial statements: Operating assets and liabilities
Key estimates and assumptionsSpark’s property, plant and equipment is measured at cost and depreciation charged on a straight-line basis over the estimated useful lives. Determining the appropriate useful life of an asset of property, plant and equipment requires management judgement, including the expected period of service potential, the likelihood technological advances will make the asset obsolete, the likelihood of Spark ceasing to use it and the effect of government regulation.
The estimated useful lives of Spark’s property, plant and equipment is as follows:
Telecommunications equipment and plantJunctions and trunk transmission systems 10 – 50 yearsSwitching equipment 5 – 12 yearsCustomer premises equipment 3 – 5 yearsOther network equipment 2 – 25 years
Buildings 9 – 50 years
Other assetsMotor vehicles 6 yearsFurniture and fittings 2 – 25 yearsComputer equipment 3 – 5 years
The assessment of assets for impairment is based on a large number of factors; such as changes in current competitive conditions, expectations of growth in the telecommunications industry, the discontinuance of services, the expected future cash flows an asset is expected to generate and other changes in circumstances that indicate an impairment exists.
Key judgements include rates of expected revenue growth or decline, expected future margins and the selection of an appropriate discount rate for valuing future cash flows.
3.4 Property, plant and equipment (continued)
For
per
sona
l use
onl
y
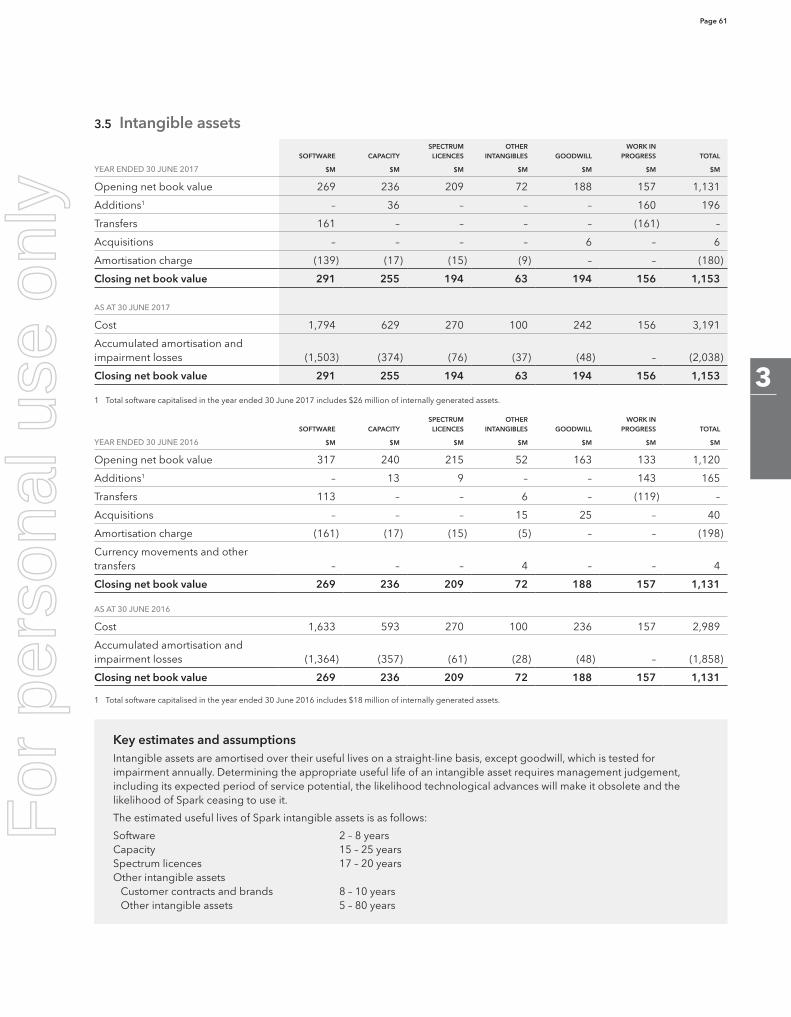
Page 61
3
3.5 Intangible assets
SOFTWARE CAPACITYSPECTRUM
LICENCESOTHER
INTANGIBLES GOODWILLWORK IN
PROGRESS TOTAL
YEAR ENDED 30 JUNE 2017 $M $M $M $M $M $M $M
Opening net book value 269 236 209 72 188 157 1,131
Additions1 – 36 – – – 160 196
Transfers 161 – – – – (161) –
Acquisitions – – – – 6 – 6
Amortisation charge (139) (17) (15) (9) – – (180)
Closing net book value 291 255 194 63 194 156 1,153
AS AT 30 JUNE 2017
Cost 1,794 629 270 100 242 156 3,191
Accumulated amortisation and impairment losses (1,503) (374) (76) (37) (48) – (2,038)
Closing net book value 291 255 194 63 194 156 1,153
1 Total software capitalised in the year ended 30 June 2017 includes $26 million of internally generated assets.
SOFTWARE CAPACITYSPECTRUM
LICENCESOTHER
INTANGIBLES GOODWILLWORK IN
PROGRESS TOTAL
YEAR ENDED 30 JUNE 2016 $M $M $M $M $M $M $M
Opening net book value 317 240 215 52 163 133 1,120
Additions1 – 13 9 – – 143 165
Transfers 113 – – 6 – (119) –
Acquisitions – – – 15 25 – 40
Amortisation charge (161) (17) (15) (5) – – (198)
Currency movements and other transfers – – – 4 – – 4
Closing net book value 269 236 209 72 188 157 1,131
AS AT 30 JUNE 2016
Cost 1,633 593 270 100 236 157 2,989
Accumulated amortisation and impairment losses (1,364) (357) (61) (28) (48) – (1,858)
Closing net book value 269 236 209 72 188 157 1,131
1 Total software capitalised in the year ended 30 June 2016 includes $18 million of internally generated assets.
Key estimates and assumptionsIntangible assets are amortised over their useful lives on a straight-line basis, except goodwill, which is tested for impairment annually. Determining the appropriate useful life of an intangible asset requires management judgement, including its expected period of service potential, the likelihood technological advances will make it obsolete and the likelihood of Spark ceasing to use it.
The estimated useful lives of Spark intangible assets is as follows:
Software 2 – 8 yearsCapacity 15 – 25 yearsSpectrum licences 17 – 20 yearsOther intangible assets
Customer contracts and brands 8 – 10 yearsOther intangible assets 5 – 80 years
For
per
sona
l use
onl
y
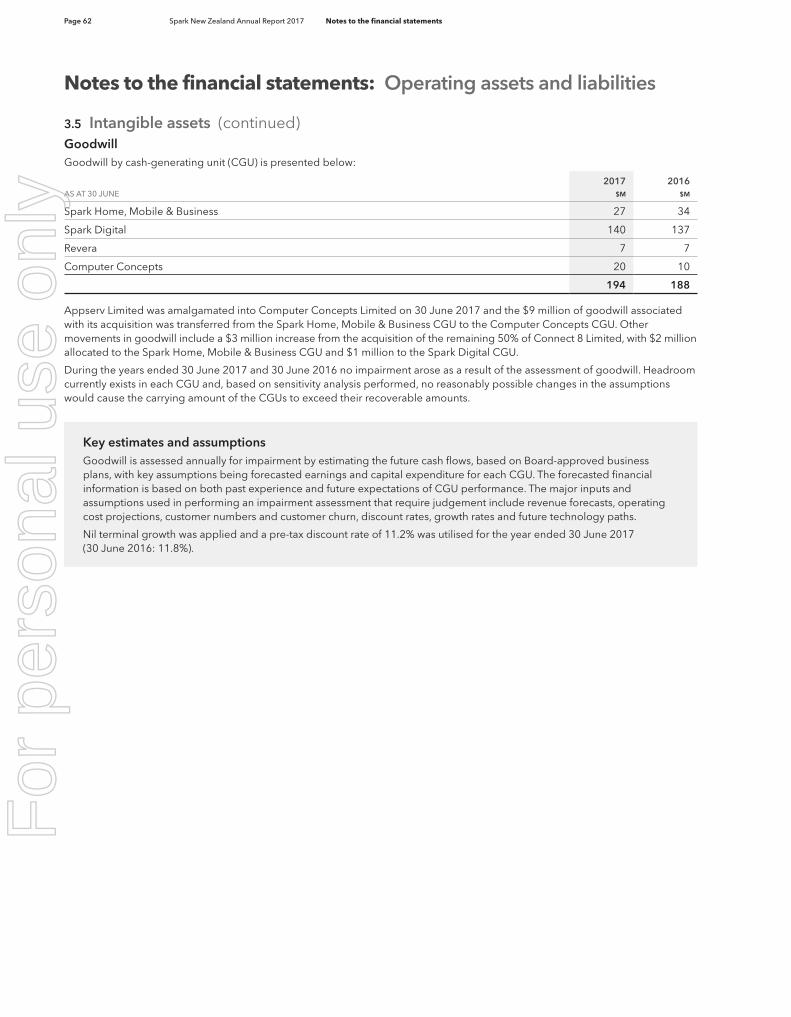
Page 62 Spark New Zealand Annual Report 2017 Notes to the financial statements
3.5 Intangible assets (continued)GoodwillGoodwill by cash-generating unit (CGU) is presented below:
2017 2016AS AT 30 JUNE $M $M
Spark Home, Mobile & Business 27 34
Spark Digital 140 137
Revera 7 7
Computer Concepts 20 10
194 188
Appserv Limited was amalgamated into Computer Concepts Limited on 30 June 2017 and the $9 million of goodwill associated with its acquisition was transferred from the Spark Home, Mobile & Business CGU to the Computer Concepts CGU. Other movements in goodwill include a $3 million increase from the acquisition of the remaining 50% of Connect 8 Limited, with $2 million allocated to the Spark Home, Mobile & Business CGU and $1 million to the Spark Digital CGU.
During the years ended 30 June 2017 and 30 June 2016 no impairment arose as a result of the assessment of goodwill. Headroom currently exists in each CGU and, based on sensitivity analysis performed, no reasonably possible changes in the assumptions would cause the carrying amount of the CGUs to exceed their recoverable amounts.
Key estimates and assumptionsGoodwill is assessed annually for impairment by estimating the future cash flows, based on Board-approved business plans, with key assumptions being forecasted earnings and capital expenditure for each CGU. The forecasted financial information is based on both past experience and future expectations of CGU performance. The major inputs and assumptions used in performing an impairment assessment that require judgement include revenue forecasts, operating cost projections, customer numbers and customer churn, discount rates, growth rates and future technology paths.
Nil terminal growth was applied and a pre-tax discount rate of 11.2% was utilised for the year ended 30 June 2017 (30 June 2016: 11.8%).
Notes to the financial statements: Operating assets and liabilities
For
per
sona
l use
onl
y
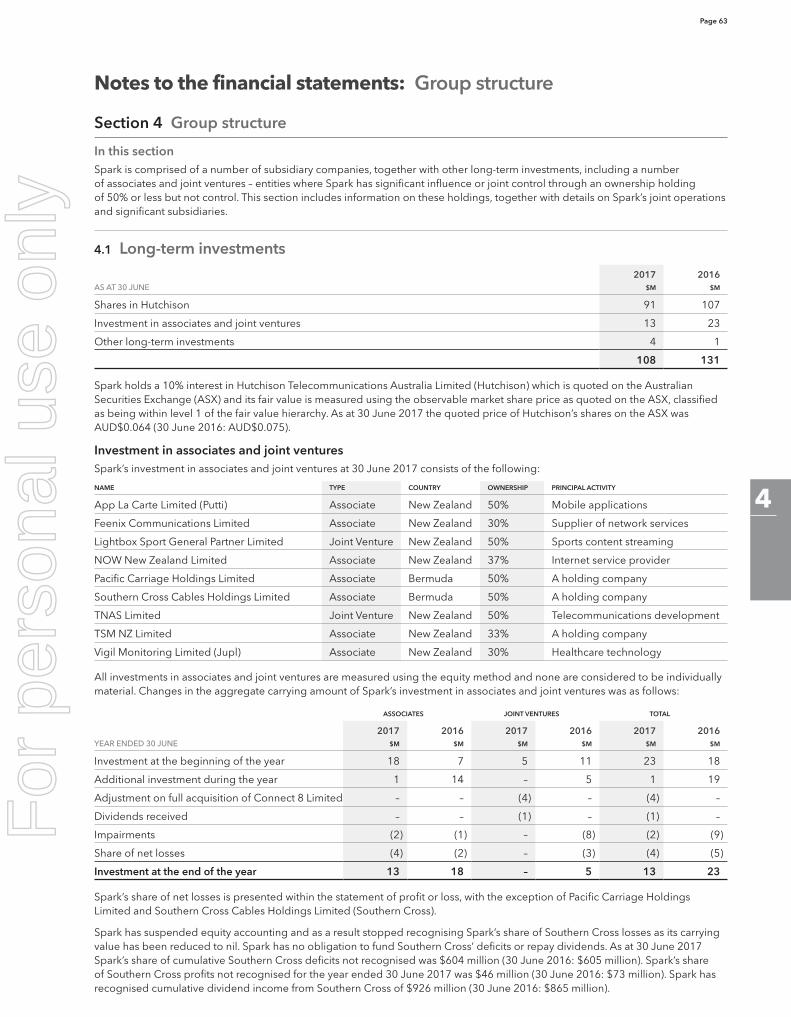
Page 63
4
Notes to the financial statements: Group structure
Section 4 Group structure
In this sectionSpark is comprised of a number of subsidiary companies, together with other long-term investments, including a number of associates and joint ventures – entities where Spark has significant influence or joint control through an ownership holding of 50% or less but not control. This section includes information on these holdings, together with details on Spark’s joint operations and significant subsidiaries.
4.1 Long-term investments2017 2016
AS AT 30 JUNE $M $M
Shares in Hutchison 91 107
Investment in associates and joint ventures 13 23
Other long-term investments 4 1
108 131
Spark holds a 10% interest in Hutchison Telecommunications Australia Limited (Hutchison) which is quoted on the Australian Securities Exchange (ASX) and its fair value is measured using the observable market share price as quoted on the ASX, classified as being within level 1 of the fair value hierarchy. As at 30 June 2017 the quoted price of Hutchison’s shares on the ASX was AUD$0.064 (30 June 2016: AUD$0.075).
Investment in associates and joint venturesSpark’s investment in associates and joint ventures at 30 June 2017 consists of the following:
NAME TYPE COUNTRY OWNERSHIP PRINCIPAL ACTIVITY
App La Carte Limited (Putti) Associate New Zealand 50% Mobile applications
Feenix Communications Limited Associate New Zealand 30% Supplier of network services
Lightbox Sport General Partner Limited Joint Venture New Zealand 50% Sports content streaming
NOW New Zealand Limited Associate New Zealand 37% Internet service provider
Pacific Carriage Holdings Limited Associate Bermuda 50% A holding company
Southern Cross Cables Holdings Limited Associate Bermuda 50% A holding company
TNAS Limited Joint Venture New Zealand 50% Telecommunications development
TSM NZ Limited Associate New Zealand 33% A holding company
Vigil Monitoring Limited (Jupl) Associate New Zealand 30% Healthcare technology
All investments in associates and joint ventures are measured using the equity method and none are considered to be individually material. Changes in the aggregate carrying amount of Spark’s investment in associates and joint ventures was as follows:
ASSOCIATES JOINT VENTURES TOTAL
2017 2016 2017 2016 2017 2016YEAR ENDED 30 JUNE $M $M $M $M $M $M
Investment at the beginning of the year 18 7 5 11 23 18
Additional investment during the year 1 14 – 5 1 19
Adjustment on full acquisition of Connect 8 Limited – – (4) – (4) –
Dividends received – – (1) – (1) –
Impairments (2) (1) – (8) (2) (9)
Share of net losses (4) (2) – (3) (4) (5)
Investment at the end of the year 13 18 – 5 13 23
Spark’s share of net losses is presented within the statement of profit or loss, with the exception of Pacific Carriage Holdings Limited and Southern Cross Cables Holdings Limited (Southern Cross).
Spark has suspended equity accounting and as a result stopped recognising Spark’s share of Southern Cross losses as its carrying value has been reduced to nil. Spark has no obligation to fund Southern Cross’ deficits or repay dividends. As at 30 June 2017 Spark’s share of cumulative Southern Cross deficits not recognised was $604 million (30 June 2016: $605 million). Spark’s share of Southern Cross profits not recognised for the year ended 30 June 2017 was $46 million (30 June 2016: $73 million). Spark has recognised cumulative dividend income from Southern Cross of $926 million (30 June 2016: $865 million).
For
per
sona
l use
onl
y
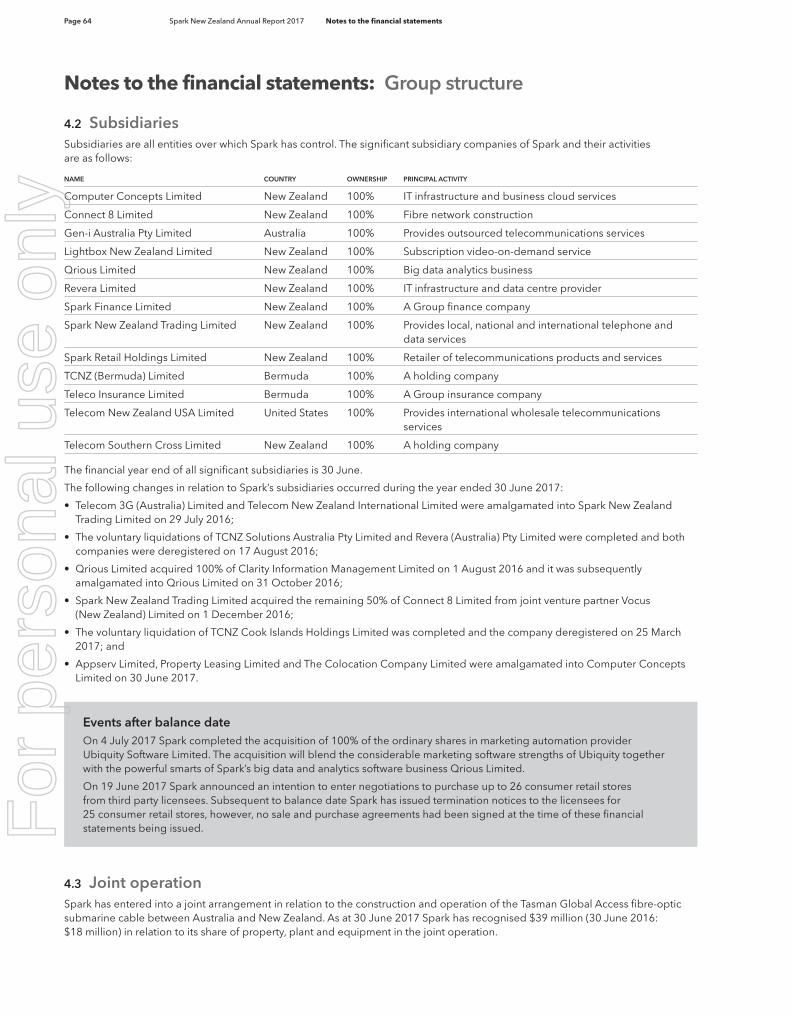
Page 64 Spark New Zealand Annual Report 2017 Notes to the financial statements
4.2 SubsidiariesSubsidiaries are all entities over which Spark has control. The significant subsidiary companies of Spark and their activities are as follows:
NAME COUNTRY OWNERSHIP PRINCIPAL ACTIVITY
Computer Concepts Limited New Zealand 100% IT infrastructure and business cloud services
Connect 8 Limited New Zealand 100% Fibre network construction
Gen-i Australia Pty Limited Australia 100% Provides outsourced telecommunications services
Lightbox New Zealand Limited New Zealand 100% Subscription video-on-demand service
Qrious Limited New Zealand 100% Big data analytics business
Revera Limited New Zealand 100% IT infrastructure and data centre provider
Spark Finance Limited New Zealand 100% A Group finance company
Spark New Zealand Trading Limited New Zealand 100% Provides local, national and international telephone and data services
Spark Retail Holdings Limited New Zealand 100% Retailer of telecommunications products and services
TCNZ (Bermuda) Limited Bermuda 100% A holding company
Teleco Insurance Limited Bermuda 100% A Group insurance company
Telecom New Zealand USA Limited United States 100% Provides international wholesale telecommunications services
Telecom Southern Cross Limited New Zealand 100% A holding company
The financial year end of all significant subsidiaries is 30 June.
The following changes in relation to Spark’s subsidiaries occurred during the year ended 30 June 2017:
• Telecom 3G (Australia) Limited and Telecom New Zealand International Limited were amalgamated into Spark New Zealand Trading Limited on 29 July 2016;
• The voluntary liquidations of TCNZ Solutions Australia Pty Limited and Revera (Australia) Pty Limited were completed and both companies were deregistered on 17 August 2016;
• Qrious Limited acquired 100% of Clarity Information Management Limited on 1 August 2016 and it was subsequently amalgamated into Qrious Limited on 31 October 2016;
• Spark New Zealand Trading Limited acquired the remaining 50% of Connect 8 Limited from joint venture partner Vocus (New Zealand) Limited on 1 December 2016;
• The voluntary liquidation of TCNZ Cook Islands Holdings Limited was completed and the company deregistered on 25 March 2017; and
• Appserv Limited, Property Leasing Limited and The Colocation Company Limited were amalgamated into Computer Concepts Limited on 30 June 2017.
Events after balance dateOn 4 July 2017 Spark completed the acquisition of 100% of the ordinary shares in marketing automation provider Ubiquity Software Limited. The acquisition will blend the considerable marketing software strengths of Ubiquity together with the powerful smarts of Spark’s big data and analytics software business Qrious Limited.
On 19 June 2017 Spark announced an intention to enter negotiations to purchase up to 26 consumer retail stores from third party licensees. Subsequent to balance date Spark has issued termination notices to the licensees for 25 consumer retail stores, however, no sale and purchase agreements had been signed at the time of these financial statements being issued.
4.3 Joint operationSpark has entered into a joint arrangement in relation to the construction and operation of the Tasman Global Access fibre-optic submarine cable between Australia and New Zealand. As at 30 June 2017 Spark has recognised $39 million (30 June 2016: $18 million) in relation to its share of property, plant and equipment in the joint operation.
Notes to the financial statements: Group structure
For
per
sona
l use
onl
y
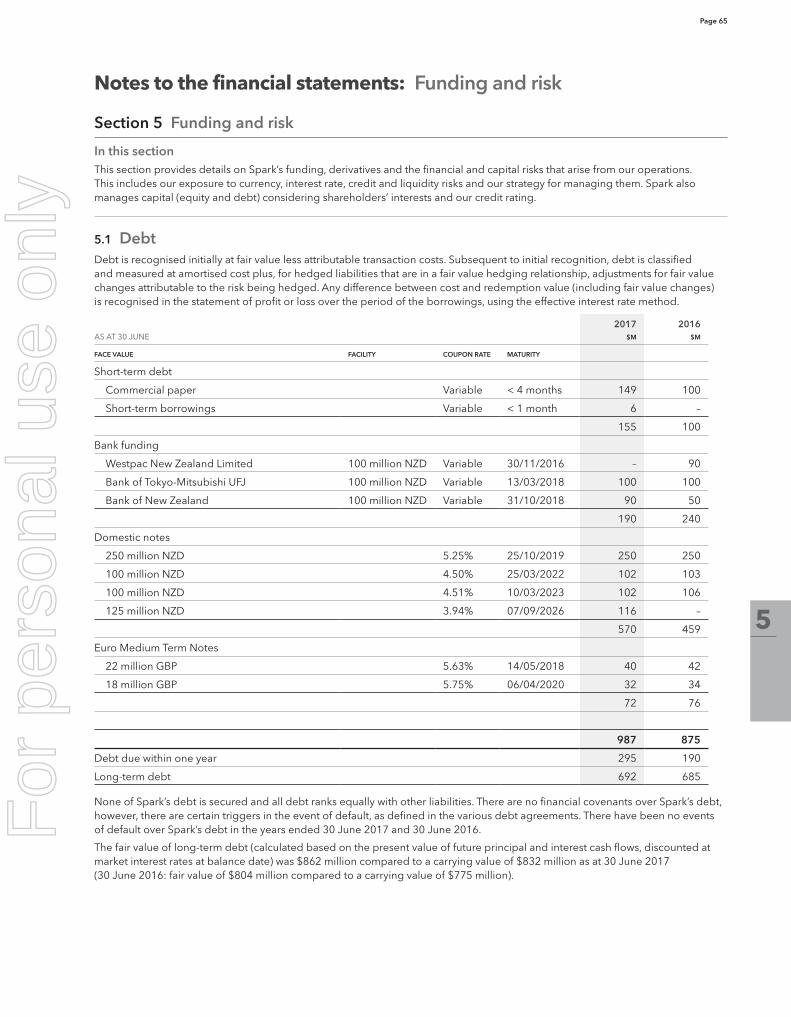
Page 65
5
Notes to the financial statements: Funding and risk
Section 5 Funding and risk
In this sectionThis section provides details on Spark’s funding, derivatives and the financial and capital risks that arise from our operations. This includes our exposure to currency, interest rate, credit and liquidity risks and our strategy for managing them. Spark also manages capital (equity and debt) considering shareholders’ interests and our credit rating.
5.1 DebtDebt is recognised initially at fair value less attributable transaction costs. Subsequent to initial recognition, debt is classified and measured at amortised cost plus, for hedged liabilities that are in a fair value hedging relationship, adjustments for fair value changes attributable to the risk being hedged. Any difference between cost and redemption value (including fair value changes) is recognised in the statement of profit or loss over the period of the borrowings, using the effective interest rate method.
2017 2016AS AT 30 JUNE $M $M
FACE VALUE FACILITY COUPON RATE MATURITY
Short-term debt
Commercial paper Variable < 4 months 149 100
Short-term borrowings Variable < 1 month 6 –
155 100
Bank funding
Westpac New Zealand Limited 100 million NZD Variable 30/11/2016 – 90
Bank of Tokyo-Mitsubishi UFJ 100 million NZD Variable 13/03/2018 100 100
Bank of New Zealand 100 million NZD Variable 31/10/2018 90 50
190 240
Domestic notes
250 million NZD 5.25% 25/10/2019 250 250
100 million NZD 4.50% 25/03/2022 102 103
100 million NZD 4.51% 10/03/2023 102 106
125 million NZD 3.94% 07/09/2026 116 –
570 459
Euro Medium Term Notes
22 million GBP 5.63% 14/05/2018 40 42
18 million GBP 5.75% 06/04/2020 32 34
72 76
987 875
Debt due within one year 295 190
Long-term debt 692 685
None of Spark’s debt is secured and all debt ranks equally with other liabilities. There are no financial covenants over Spark’s debt, however, there are certain triggers in the event of default, as defined in the various debt agreements. There have been no events of default over Spark’s debt in the years ended 30 June 2017 and 30 June 2016.
The fair value of long-term debt (calculated based on the present value of future principal and interest cash flows, discounted at market interest rates at balance date) was $862 million compared to a carrying value of $832 million as at 30 June 2017 (30 June 2016: fair value of $804 million compared to a carrying value of $775 million).
For
per
sona
l use
onl
y
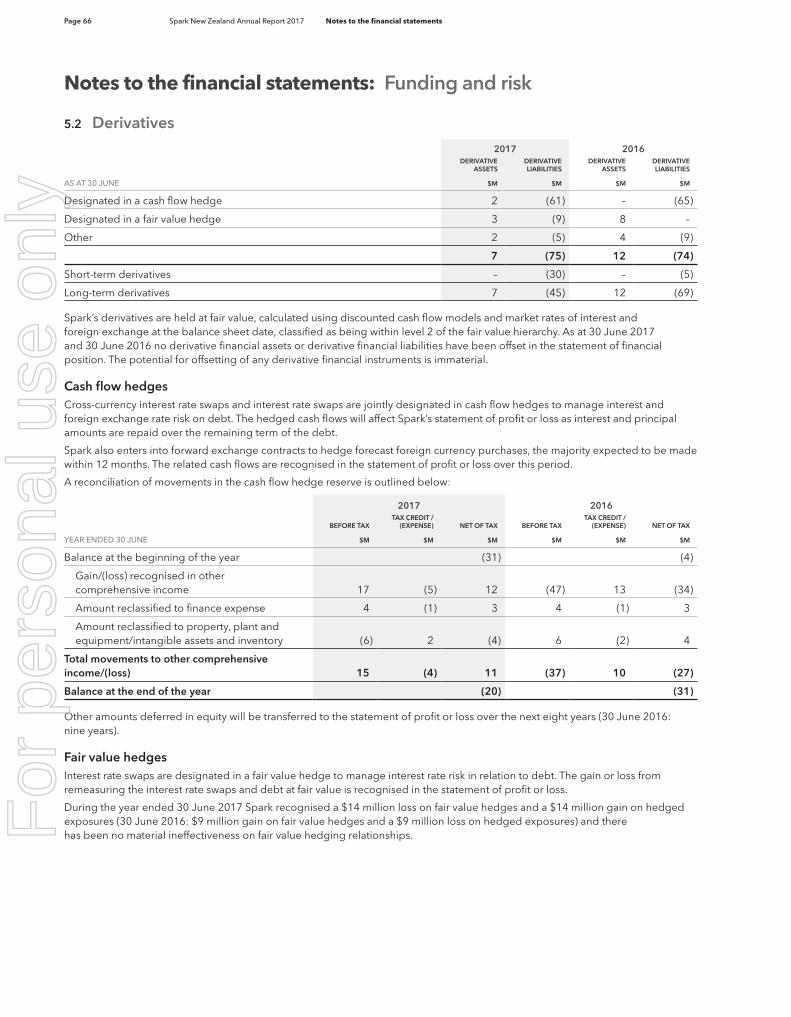
Page 66 Spark New Zealand Annual Report 2017 Notes to the financial statements
5.2 Derivatives 2017 2016
DERIVATIVE ASSETS
DERIVATIVE LIABILITIES
DERIVATIVE ASSETS
DERIVATIVE LIABILITIES
AS AT 30 JUNE $M $M $M $M
Designated in a cash flow hedge 2 (61) – (65)
Designated in a fair value hedge 3 (9) 8 –
Other 2 (5) 4 (9)
7 (75) 12 (74)
Short-term derivatives – (30) – (5)
Long-term derivatives 7 (45) 12 (69)
Spark’s derivatives are held at fair value, calculated using discounted cash flow models and market rates of interest and foreign exchange at the balance sheet date, classified as being within level 2 of the fair value hierarchy. As at 30 June 2017 and 30 June 2016 no derivative financial assets or derivative financial liabilities have been offset in the statement of financial position. The potential for offsetting of any derivative financial instruments is immaterial.
Cash flow hedgesCross-currency interest rate swaps and interest rate swaps are jointly designated in cash flow hedges to manage interest and foreign exchange rate risk on debt. The hedged cash flows will affect Spark’s statement of profit or loss as interest and principal amounts are repaid over the remaining term of the debt.
Spark also enters into forward exchange contracts to hedge forecast foreign currency purchases, the majority expected to be made within 12 months. The related cash flows are recognised in the statement of profit or loss over this period.
A reconciliation of movements in the cash flow hedge reserve is outlined below:
2017 2016
BEFORE TAXTAX CREDIT /
(EXPENSE) NET OF TAX BEFORE TAXTAX CREDIT /
(EXPENSE) NET OF TAX
YEAR ENDED 30 JUNE $M $M $M $M $M $M
Balance at the beginning of the year (31) (4)
Gain/(loss) recognised in other comprehensive income 17 (5) 12 (47) 13 (34)
Amount reclassified to finance expense 4 (1) 3 4 (1) 3
Amount reclassified to property, plant and equipment/intangible assets and inventory (6) 2 (4) 6 (2) 4
Total movements to other comprehensive income/(loss) 15 (4) 11 (37) 10 (27)
Balance at the end of the year (20) (31)
Other amounts deferred in equity will be transferred to the statement of profit or loss over the next eight years (30 June 2016: nine years).
Fair value hedgesInterest rate swaps are designated in a fair value hedge to manage interest rate risk in relation to debt. The gain or loss from remeasuring the interest rate swaps and debt at fair value is recognised in the statement of profit or loss.
During the year ended 30 June 2017 Spark recognised a $14 million loss on fair value hedges and a $14 million gain on hedged exposures (30 June 2016: $9 million gain on fair value hedges and a $9 million loss on hedged exposures) and there has been no material ineffectiveness on fair value hedging relationships.
Notes to the financial statements: Funding and risk
For
per
sona
l use
onl
y
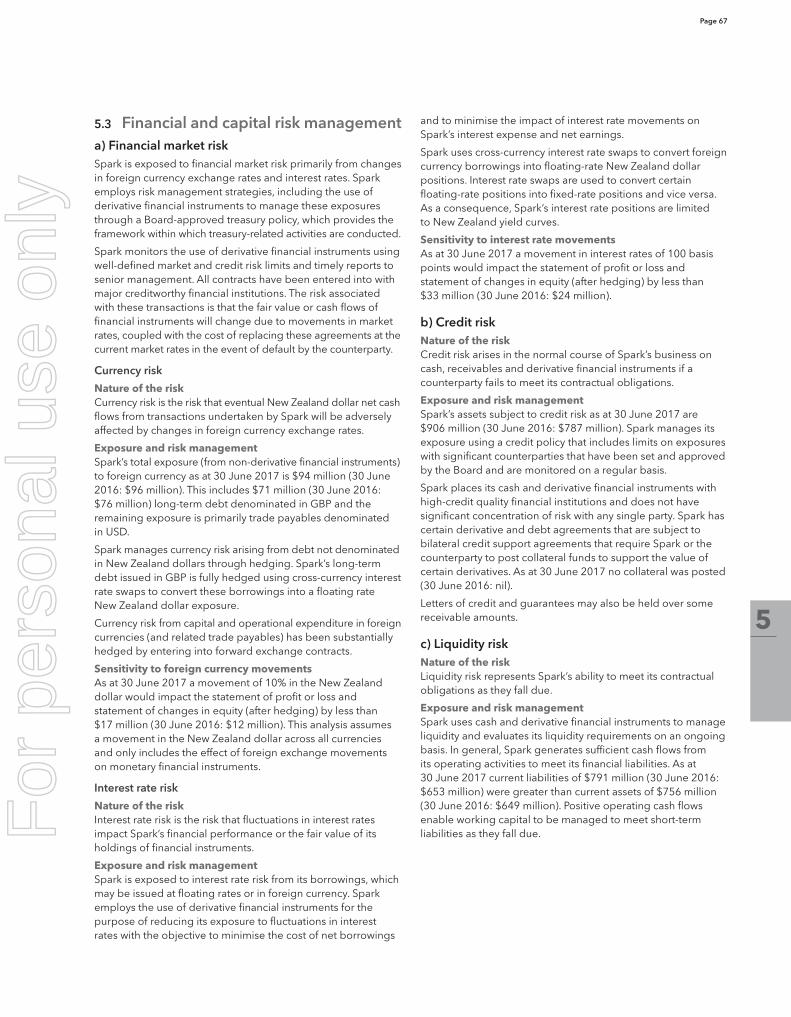
Page 67
5
5.3 Financial and capital risk managementa) Financial market riskSpark is exposed to financial market risk primarily from changes in foreign currency exchange rates and interest rates. Spark employs risk management strategies, including the use of derivative financial instruments to manage these exposures through a Board-approved treasury policy, which provides the framework within which treasury-related activities are conducted.
Spark monitors the use of derivative financial instruments using well-defined market and credit risk limits and timely reports to senior management. All contracts have been entered into with major creditworthy financial institutions. The risk associated with these transactions is that the fair value or cash flows of financial instruments will change due to movements in market rates, coupled with the cost of replacing these agreements at the current market rates in the event of default by the counterparty.
Currency risk
Nature of the riskCurrency risk is the risk that eventual New Zealand dollar net cash flows from transactions undertaken by Spark will be adversely affected by changes in foreign currency exchange rates.
Exposure and risk managementSpark’s total exposure (from non-derivative financial instruments) to foreign currency as at 30 June 2017 is $94 million (30 June 2016: $96 million). This includes $71 million (30 June 2016: $76 million) long-term debt denominated in GBP and the remaining exposure is primarily trade payables denominated in USD.
Spark manages currency risk arising from debt not denominated in New Zealand dollars through hedging. Spark’s long-term debt issued in GBP is fully hedged using cross-currency interest rate swaps to convert these borrowings into a floating rate New Zealand dollar exposure.
Currency risk from capital and operational expenditure in foreign currencies (and related trade payables) has been substantially hedged by entering into forward exchange contracts.
Sensitivity to foreign currency movementsAs at 30 June 2017 a movement of 10% in the New Zealand dollar would impact the statement of profit or loss and statement of changes in equity (after hedging) by less than $17 million (30 June 2016: $12 million). This analysis assumes a movement in the New Zealand dollar across all currencies and only includes the effect of foreign exchange movements on monetary financial instruments.
Interest rate risk
Nature of the riskInterest rate risk is the risk that fluctuations in interest rates impact Spark’s financial performance or the fair value of its holdings of financial instruments.
Exposure and risk managementSpark is exposed to interest rate risk from its borrowings, which may be issued at floating rates or in foreign currency. Spark employs the use of derivative financial instruments for the purpose of reducing its exposure to fluctuations in interest rates with the objective to minimise the cost of net borrowings
and to minimise the impact of interest rate movements on Spark’s interest expense and net earnings.
Spark uses cross-currency interest rate swaps to convert foreign currency borrowings into floating-rate New Zealand dollar positions. Interest rate swaps are used to convert certain floating-rate positions into fixed-rate positions and vice versa. As a consequence, Spark’s interest rate positions are limited to New Zealand yield curves.
Sensitivity to interest rate movementsAs at 30 June 2017 a movement in interest rates of 100 basis points would impact the statement of profit or loss and statement of changes in equity (after hedging) by less than $33 million (30 June 2016: $24 million).
b) Credit riskNature of the riskCredit risk arises in the normal course of Spark’s business on cash, receivables and derivative financial instruments if a counterparty fails to meet its contractual obligations.
Exposure and risk managementSpark’s assets subject to credit risk as at 30 June 2017 are $906 million (30 June 2016: $787 million). Spark manages its exposure using a credit policy that includes limits on exposures with significant counterparties that have been set and approved by the Board and are monitored on a regular basis.
Spark places its cash and derivative financial instruments with high-credit quality financial institutions and does not have significant concentration of risk with any single party. Spark has certain derivative and debt agreements that are subject to bilateral credit support agreements that require Spark or the counterparty to post collateral funds to support the value of certain derivatives. As at 30 June 2017 no collateral was posted (30 June 2016: nil).
Letters of credit and guarantees may also be held over some receivable amounts.
c) Liquidity riskNature of the riskLiquidity risk represents Spark’s ability to meet its contractual obligations as they fall due.
Exposure and risk managementSpark uses cash and derivative financial instruments to manage liquidity and evaluates its liquidity requirements on an ongoing basis. In general, Spark generates sufficient cash flows from its operating activities to meet its financial liabilities. As at 30 June 2017 current liabilities of $791 million (30 June 2016: $653 million) were greater than current assets of $756 million (30 June 2016: $649 million). Positive operating cash flows enable working capital to be managed to meet short-term liabilities as they fall due. F
or p
erso
nal u
se o
nly
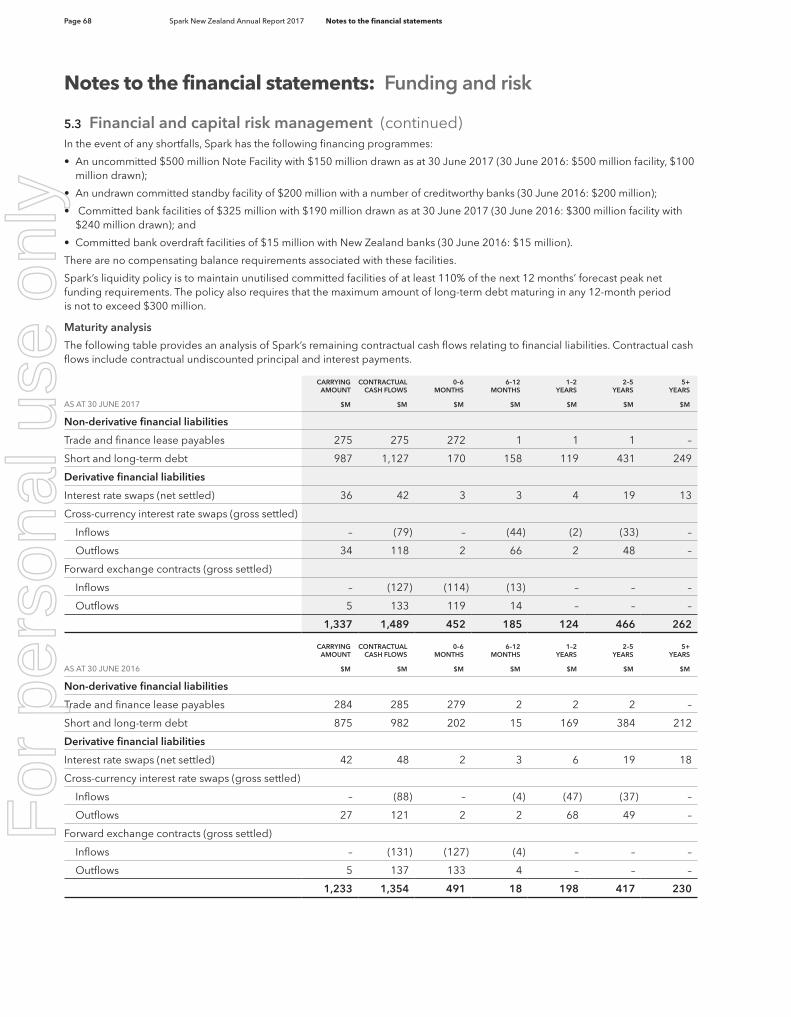
Page 68 Spark New Zealand Annual Report 2017 Notes to the financial statements
5.3 Financial and capital risk management (continued)In the event of any shortfalls, Spark has the following financing programmes:
• An uncommitted $500 million Note Facility with $150 million drawn as at 30 June 2017 (30 June 2016: $500 million facility, $100 million drawn);
• An undrawn committed standby facility of $200 million with a number of creditworthy banks (30 June 2016: $200 million);
• Committed bank facilities of $325 million with $190 million drawn as at 30 June 2017 (30 June 2016: $300 million facility with $240 million drawn); and
• Committed bank overdraft facilities of $15 million with New Zealand banks (30 June 2016: $15 million).
There are no compensating balance requirements associated with these facilities.
Spark’s liquidity policy is to maintain unutilised committed facilities of at least 110% of the next 12 months’ forecast peak net funding requirements. The policy also requires that the maximum amount of long-term debt maturing in any 12-month period is not to exceed $300 million.
Maturity analysis
The following table provides an analysis of Spark’s remaining contractual cash flows relating to financial liabilities. Contractual cash flows include contractual undiscounted principal and interest payments.
CARRYING AMOUNT
CONTRACTUAL CASH FLOWS
0–6 MONTHS
6–12 MONTHS
1–2 YEARS
2–5 YEARS
5+ YEARS
AS AT 30 JUNE 2017 $M $M $M $M $M $M $M
Non-derivative financial liabilities
Trade and finance lease payables 275 275 272 1 1 1 –
Short and long-term debt 987 1,127 170 158 119 431 249
Derivative financial liabilities
Interest rate swaps (net settled) 36 42 3 3 4 19 13
Cross-currency interest rate swaps (gross settled)
Inflows – (79) – (44) (2) (33) –
Outflows 34 118 2 66 2 48 –
Forward exchange contracts (gross settled)
Inflows – (127) (114) (13) – – –
Outflows 5 133 119 14 – – –
1,337 1,489 452 185 124 466 262
CARRYING AMOUNT
CONTRACTUAL CASH FLOWS
0–6 MONTHS
6–12 MONTHS
1–2 YEARS
2–5 YEARS
5+ YEARS
AS AT 30 JUNE 2016 $M $M $M $M $M $M $M
Non-derivative financial liabilities
Trade and finance lease payables 284 285 279 2 2 2 –
Short and long-term debt 875 982 202 15 169 384 212
Derivative financial liabilities
Interest rate swaps (net settled) 42 48 2 3 6 19 18
Cross-currency interest rate swaps (gross settled)
Inflows – (88) – (4) (47) (37) –
Outflows 27 121 2 2 68 49 –
Forward exchange contracts (gross settled)
Inflows – (131) (127) (4) – – –
Outflows 5 137 133 4 – – –
1,233 1,354 491 18 198 417 230
Notes to the financial statements: Funding and risk
For
per
sona
l use
onl
y
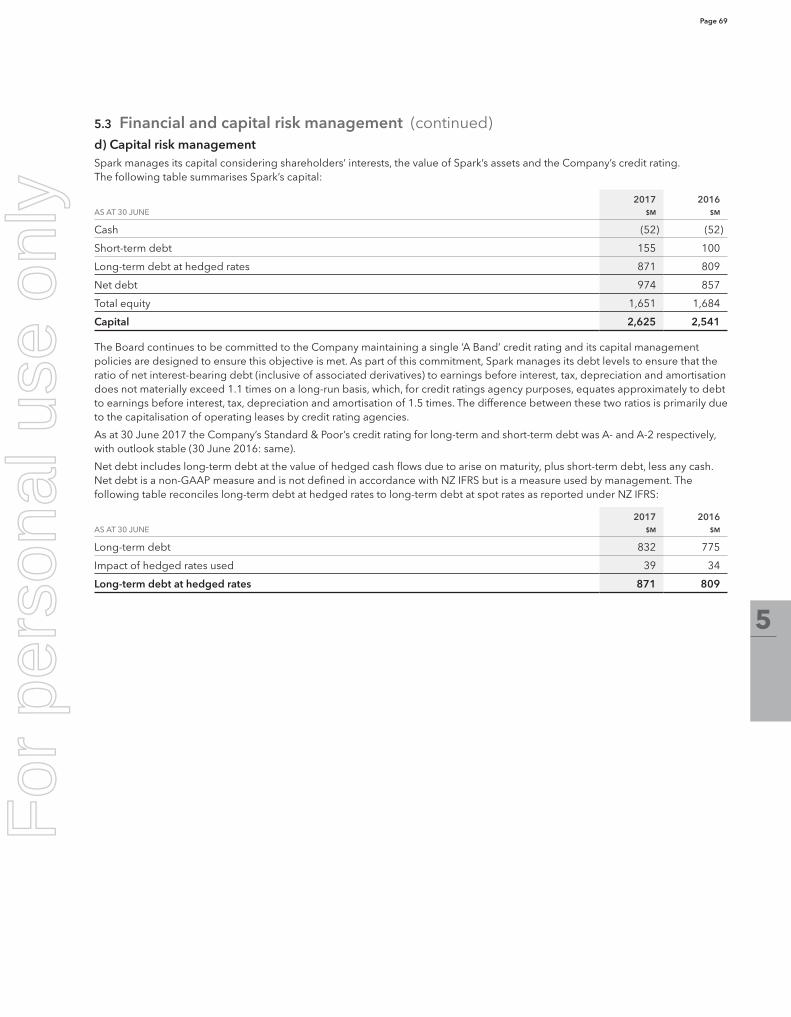
Page 69
5
5.3 Financial and capital risk management (continued)d) Capital risk managementSpark manages its capital considering shareholders’ interests, the value of Spark’s assets and the Company’s credit rating. The following table summarises Spark’s capital:
2017 2016AS AT 30 JUNE $M $M
Cash (52) (52)
Short-term debt 155 100
Long-term debt at hedged rates 871 809
Net debt 974 857
Total equity 1,651 1,684
Capital 2,625 2,541
The Board continues to be committed to the Company maintaining a single ‘A Band’ credit rating and its capital management policies are designed to ensure this objective is met. As part of this commitment, Spark manages its debt levels to ensure that the ratio of net interest-bearing debt (inclusive of associated derivatives) to earnings before interest, tax, depreciation and amortisation does not materially exceed 1.1 times on a long-run basis, which, for credit ratings agency purposes, equates approximately to debt to earnings before interest, tax, depreciation and amortisation of 1.5 times. The difference between these two ratios is primarily due to the capitalisation of operating leases by credit rating agencies.
As at 30 June 2017 the Company’s Standard & Poor’s credit rating for long-term and short-term debt was A- and A-2 respectively, with outlook stable (30 June 2016: same).
Net debt includes long-term debt at the value of hedged cash flows due to arise on maturity, plus short-term debt, less any cash. Net debt is a non-GAAP measure and is not defined in accordance with NZ IFRS but is a measure used by management. The following table reconciles long-term debt at hedged rates to long-term debt at spot rates as reported under NZ IFRS:
2017 2016AS AT 30 JUNE $M $M
Long-term debt 832 775
Impact of hedged rates used 39 34
Long-term debt at hedged rates 871 809
For
per
sona
l use
onl
y
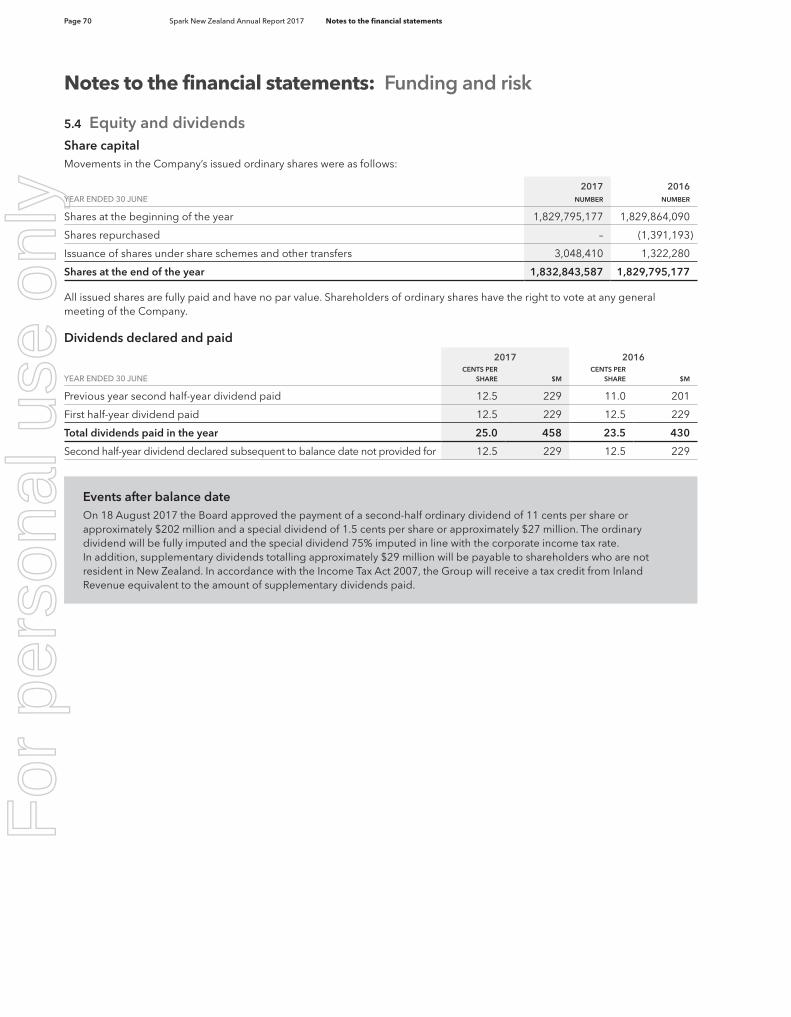
Page 70 Spark New Zealand Annual Report 2017 Notes to the financial statements
5.4 Equity and dividendsShare capitalMovements in the Company’s issued ordinary shares were as follows:
2017 2016YEAR ENDED 30 JUNE NUMBER NUMBER
Shares at the beginning of the year 1,829,795,177 1,829,864,090
Shares repurchased – (1,391,193)
Issuance of shares under share schemes and other transfers 3,048,410 1,322,280
Shares at the end of the year 1,832,843,587 1,829,795,177
All issued shares are fully paid and have no par value. Shareholders of ordinary shares have the right to vote at any general meeting of the Company.
Dividends declared and paid2017 2016
YEAR ENDED 30 JUNECENTS PER
SHARE $MCENTS PER
SHARE $M
Previous year second half-year dividend paid 12.5 229 11.0 201
First half-year dividend paid 12.5 229 12.5 229
Total dividends paid in the year 25.0 458 23.5 430
Second half-year dividend declared subsequent to balance date not provided for 12.5 229 12.5 229
Events after balance dateOn 18 August 2017 the Board approved the payment of a second-half ordinary dividend of 11 cents per share or approximately $202 million and a special dividend of 1.5 cents per share or approximately $27 million. The ordinary dividend will be fully imputed and the special dividend 75% imputed in line with the corporate income tax rate. In addition, supplementary dividends totalling approximately $29 million will be payable to shareholders who are not resident in New Zealand. In accordance with the Income Tax Act 2007, the Group will receive a tax credit from Inland Revenue equivalent to the amount of supplementary dividends paid.
Notes to the financial statements: Funding and risk
For
per
sona
l use
onl
y
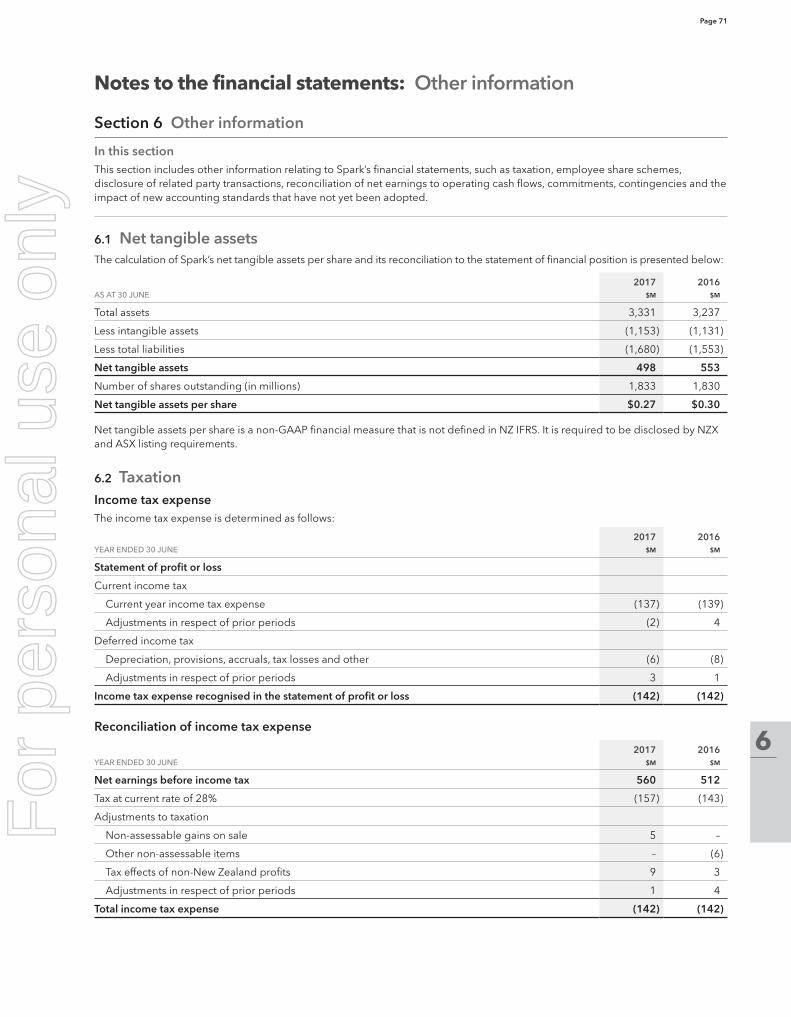
Page 71
6
Notes to the financial statements: Other information
Section 6 Other information
In this sectionThis section includes other information relating to Spark’s financial statements, such as taxation, employee share schemes, disclosure of related party transactions, reconciliation of net earnings to operating cash flows, commitments, contingencies and the impact of new accounting standards that have not yet been adopted.
6.1 Net tangible assetsThe calculation of Spark’s net tangible assets per share and its reconciliation to the statement of financial position is presented below:
2017 2016AS AT 30 JUNE $M $M
Total assets 3,331 3,237
Less intangible assets (1,153) (1,131)
Less total liabilities (1,680) (1,553)
Net tangible assets 498 553
Number of shares outstanding (in millions) 1,833 1,830
Net tangible assets per share $0.27 $0.30
Net tangible assets per share is a non-GAAP financial measure that is not defined in NZ IFRS. It is required to be disclosed by NZX and ASX listing requirements.
6.2 TaxationIncome tax expenseThe income tax expense is determined as follows:
2017 2016YEAR ENDED 30 JUNE $M $M
Statement of profit or loss
Current income tax
Current year income tax expense (137) (139)
Adjustments in respect of prior periods (2) 4
Deferred income tax
Depreciation, provisions, accruals, tax losses and other (6) (8)
Adjustments in respect of prior periods 3 1
Income tax expense recognised in the statement of profit or loss (142) (142)
Reconciliation of income tax expense
2017 2016YEAR ENDED 30 JUNE $M $M
Net earnings before income tax 560 512
Tax at current rate of 28% (157) (143)
Adjustments to taxation
Non-assessable gains on sale 5 –
Other non-assessable items – (6)
Tax effects of non-New Zealand profits 9 3
Adjustments in respect of prior periods 1 4
Total income tax expense (142) (142)
For
per
sona
l use
onl
y
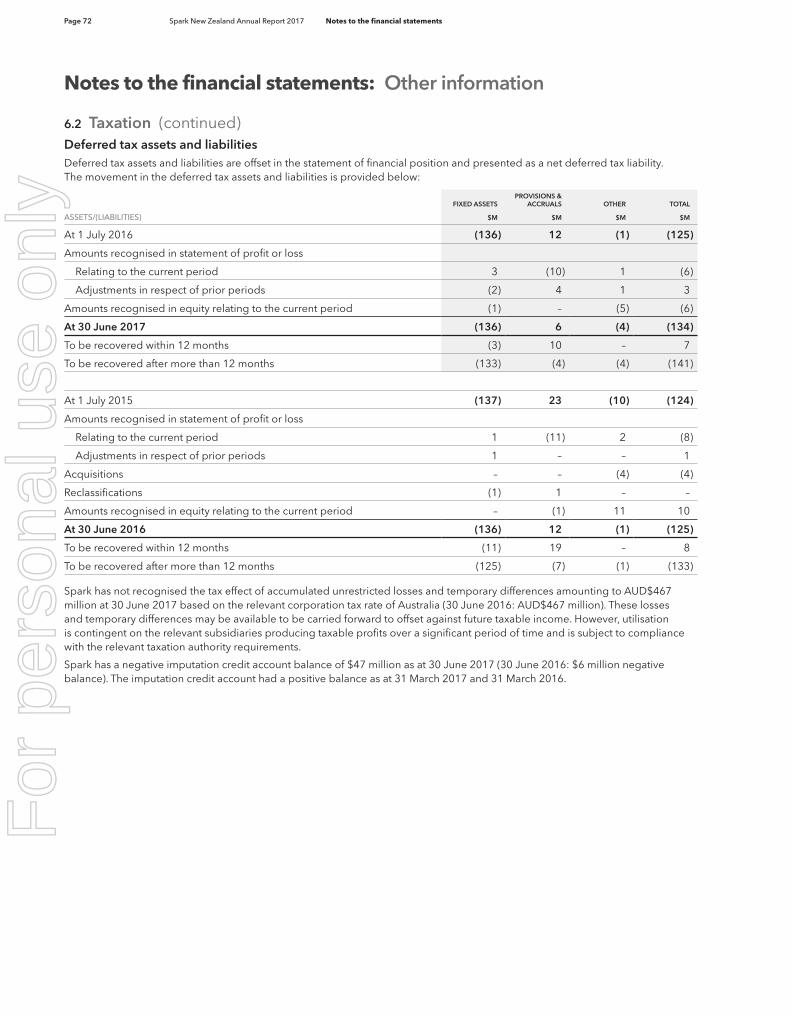
Page 72 Spark New Zealand Annual Report 2017 Notes to the financial statements
6.2 Taxation (continued)Deferred tax assets and liabilitiesDeferred tax assets and liabilities are offset in the statement of financial position and presented as a net deferred tax liability. The movement in the deferred tax assets and liabilities is provided below:
FIXED ASSETSPROVISIONS &
ACCRUALS OTHER TOTAL
ASSETS/(LIABILITIES) $M $M $M $M
At 1 July 2016 (136) 12 (1) (125)
Amounts recognised in statement of profit or loss
Relating to the current period 3 (10) 1 (6)
Adjustments in respect of prior periods (2) 4 1 3
Amounts recognised in equity relating to the current period (1) – (5) (6)
At 30 June 2017 (136) 6 (4) (134)
To be recovered within 12 months (3) 10 – 7
To be recovered after more than 12 months (133) (4) (4) (141)
At 1 July 2015 (137) 23 (10) (124)
Amounts recognised in statement of profit or loss
Relating to the current period 1 (11) 2 (8)
Adjustments in respect of prior periods 1 – – 1
Acquisitions – – (4) (4)
Reclassifications (1) 1 – –
Amounts recognised in equity relating to the current period – (1) 11 10
At 30 June 2016 (136) 12 (1) (125)
To be recovered within 12 months (11) 19 – 8
To be recovered after more than 12 months (125) (7) (1) (133)
Spark has not recognised the tax effect of accumulated unrestricted losses and temporary differences amounting to AUD$467 million at 30 June 2017 based on the relevant corporation tax rate of Australia (30 June 2016: AUD$467 million). These losses and temporary differences may be available to be carried forward to offset against future taxable income. However, utilisation is contingent on the relevant subsidiaries producing taxable profits over a significant period of time and is subject to compliance with the relevant taxation authority requirements.
Spark has a negative imputation credit account balance of $47 million as at 30 June 2017 (30 June 2016: $6 million negative balance). The imputation credit account had a positive balance as at 31 March 2017 and 31 March 2016.
Notes to the financial statements: Other information
For
per
sona
l use
onl
y
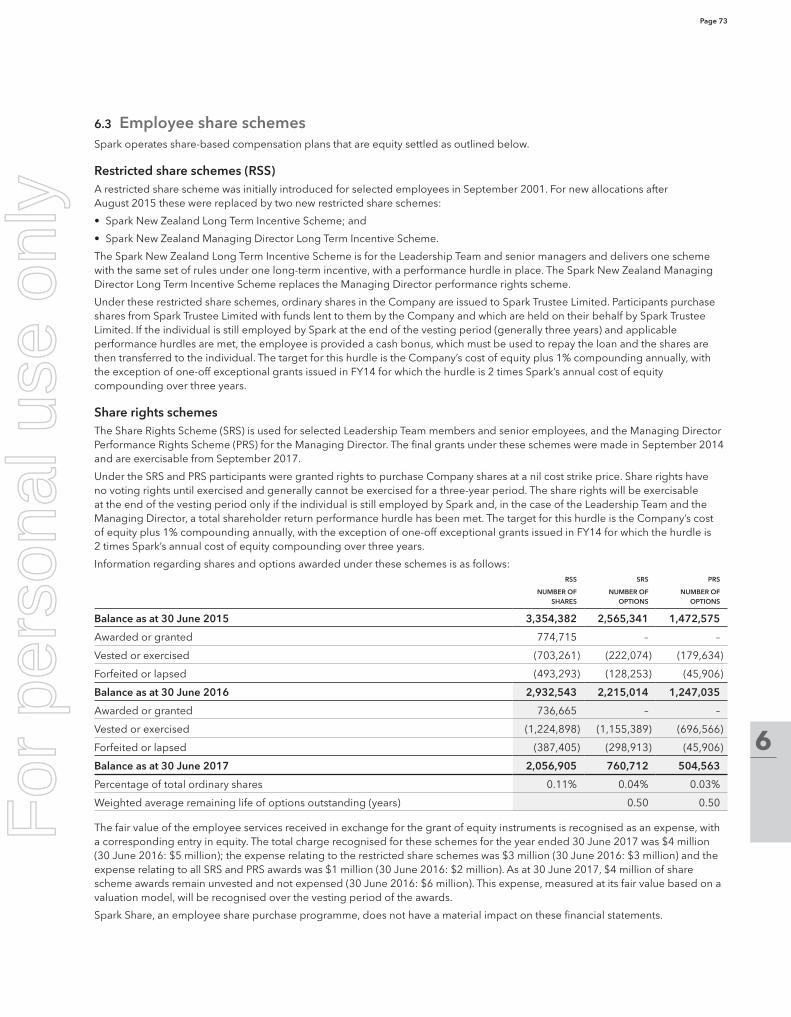
Page 73
6
6.3 Employee share schemesSpark operates share-based compensation plans that are equity settled as outlined below.
Restricted share schemes (RSS)A restricted share scheme was initially introduced for selected employees in September 2001. For new allocations after August 2015 these were replaced by two new restricted share schemes:
• Spark New Zealand Long Term Incentive Scheme; and
• Spark New Zealand Managing Director Long Term Incentive Scheme.
The Spark New Zealand Long Term Incentive Scheme is for the Leadership Team and senior managers and delivers one scheme with the same set of rules under one long-term incentive, with a performance hurdle in place. The Spark New Zealand Managing Director Long Term Incentive Scheme replaces the Managing Director performance rights scheme.
Under these restricted share schemes, ordinary shares in the Company are issued to Spark Trustee Limited. Participants purchase shares from Spark Trustee Limited with funds lent to them by the Company and which are held on their behalf by Spark Trustee Limited. If the individual is still employed by Spark at the end of the vesting period (generally three years) and applicable performance hurdles are met, the employee is provided a cash bonus, which must be used to repay the loan and the shares are then transferred to the individual. The target for this hurdle is the Company’s cost of equity plus 1% compounding annually, with the exception of one-off exceptional grants issued in FY14 for which the hurdle is 2 times Spark’s annual cost of equity compounding over three years.
Share rights schemesThe Share Rights Scheme (SRS) is used for selected Leadership Team members and senior employees, and the Managing Director Performance Rights Scheme (PRS) for the Managing Director. The final grants under these schemes were made in September 2014 and are exercisable from September 2017.
Under the SRS and PRS participants were granted rights to purchase Company shares at a nil cost strike price. Share rights have no voting rights until exercised and generally cannot be exercised for a three-year period. The share rights will be exercisable at the end of the vesting period only if the individual is still employed by Spark and, in the case of the Leadership Team and the Managing Director, a total shareholder return performance hurdle has been met. The target for this hurdle is the Company’s cost of equity plus 1% compounding annually, with the exception of one-off exceptional grants issued in FY14 for which the hurdle is 2 times Spark’s annual cost of equity compounding over three years.
Information regarding shares and options awarded under these schemes is as follows:RSS SRS PRS
NUMBER OF SHARES
NUMBER OF OPTIONS
NUMBER OF OPTIONS
Balance as at 30 June 2015 3,354,382 2,565,341 1,472,575
Awarded or granted 774,715 – –
Vested or exercised (703,261) (222,074) (179,634)
Forfeited or lapsed (493,293) (128,253) (45,906)
Balance as at 30 June 2016 2,932,543 2,215,014 1,247,035
Awarded or granted 736,665 – –
Vested or exercised (1,224,898) (1,155,389) (696,566)
Forfeited or lapsed (387,405) (298,913) (45,906)
Balance as at 30 June 2017 2,056,905 760,712 504,563
Percentage of total ordinary shares 0.11% 0.04% 0.03%
Weighted average remaining life of options outstanding (years) 0.50 0.50
The fair value of the employee services received in exchange for the grant of equity instruments is recognised as an expense, with a corresponding entry in equity. The total charge recognised for these schemes for the year ended 30 June 2017 was $4 million (30 June 2016: $5 million); the expense relating to the restricted share schemes was $3 million (30 June 2016: $3 million) and the expense relating to all SRS and PRS awards was $1 million (30 June 2016: $2 million). As at 30 June 2017, $4 million of share scheme awards remain unvested and not expensed (30 June 2016: $6 million). This expense, measured at its fair value based on a valuation model, will be recognised over the vesting period of the awards.
Spark Share, an employee share purchase programme, does not have a material impact on these financial statements.
For
per
sona
l use
onl
y
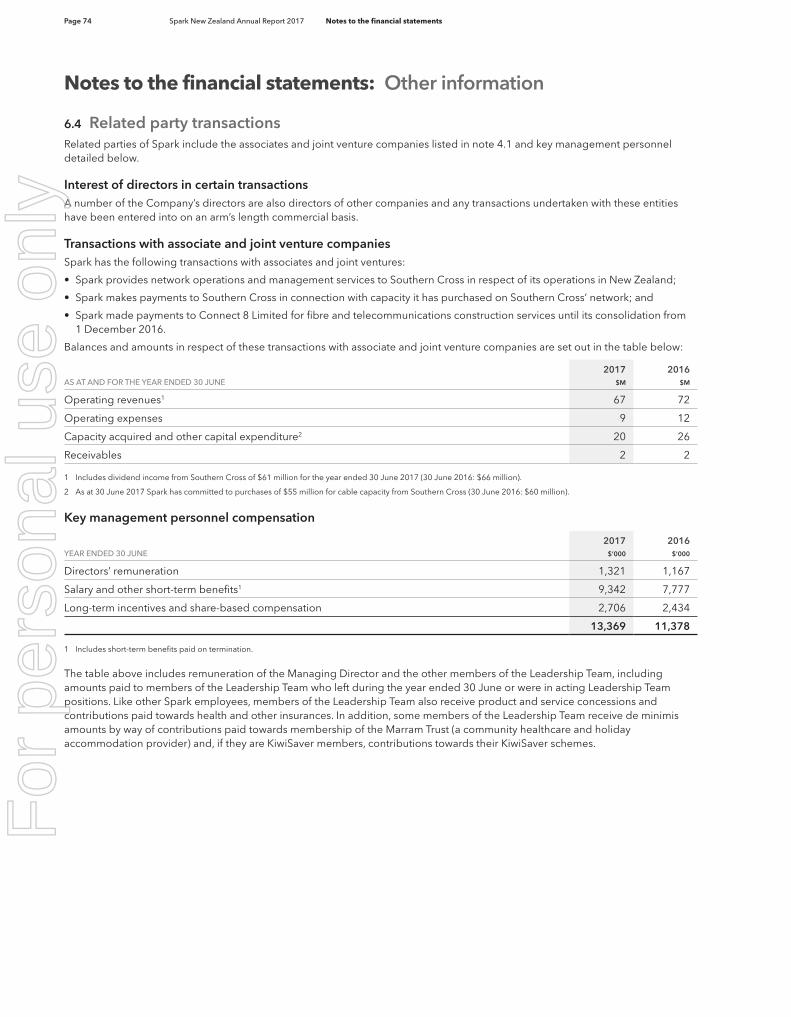
Page 74 Spark New Zealand Annual Report 2017 Notes to the financial statements
6.4 Related party transactionsRelated parties of Spark include the associates and joint venture companies listed in note 4.1 and key management personnel detailed below.
Interest of directors in certain transactionsA number of the Company’s directors are also directors of other companies and any transactions undertaken with these entities have been entered into on an arm’s length commercial basis.
Transactions with associate and joint venture companiesSpark has the following transactions with associates and joint ventures:
• Spark provides network operations and management services to Southern Cross in respect of its operations in New Zealand;
• Spark makes payments to Southern Cross in connection with capacity it has purchased on Southern Cross’ network; and
• Spark made payments to Connect 8 Limited for fibre and telecommunications construction services until its consolidation from 1 December 2016.
Balances and amounts in respect of these transactions with associate and joint venture companies are set out in the table below:
2017 2016AS AT AND FOR THE YEAR ENDED 30 JUNE $M $M
Operating revenues1 67 72
Operating expenses 9 12
Capacity acquired and other capital expenditure2 20 26
Receivables 2 2
1 Includes dividend income from Southern Cross of $61 million for the year ended 30 June 2017 (30 June 2016: $66 million).
2 As at 30 June 2017 Spark has committed to purchases of $55 million for cable capacity from Southern Cross (30 June 2016: $60 million).
Key management personnel compensation
2017 2016YEAR ENDED 30 JUNE $’000 $’000
Directors’ remuneration 1,321 1,167
Salary and other short-term benefits1 9,342 7,777
Long-term incentives and share-based compensation 2,706 2,434
13,369 11,378
1 Includes short-term benefits paid on termination.
The table above includes remuneration of the Managing Director and the other members of the Leadership Team, including amounts paid to members of the Leadership Team who left during the year ended 30 June or were in acting Leadership Team positions. Like other Spark employees, members of the Leadership Team also receive product and service concessions and contributions paid towards health and other insurances. In addition, some members of the Leadership Team receive de minimis amounts by way of contributions paid towards membership of the Marram Trust (a community healthcare and holiday accommodation provider) and, if they are KiwiSaver members, contributions towards their KiwiSaver schemes.
Notes to the financial statements: Other information
For
per
sona
l use
onl
y
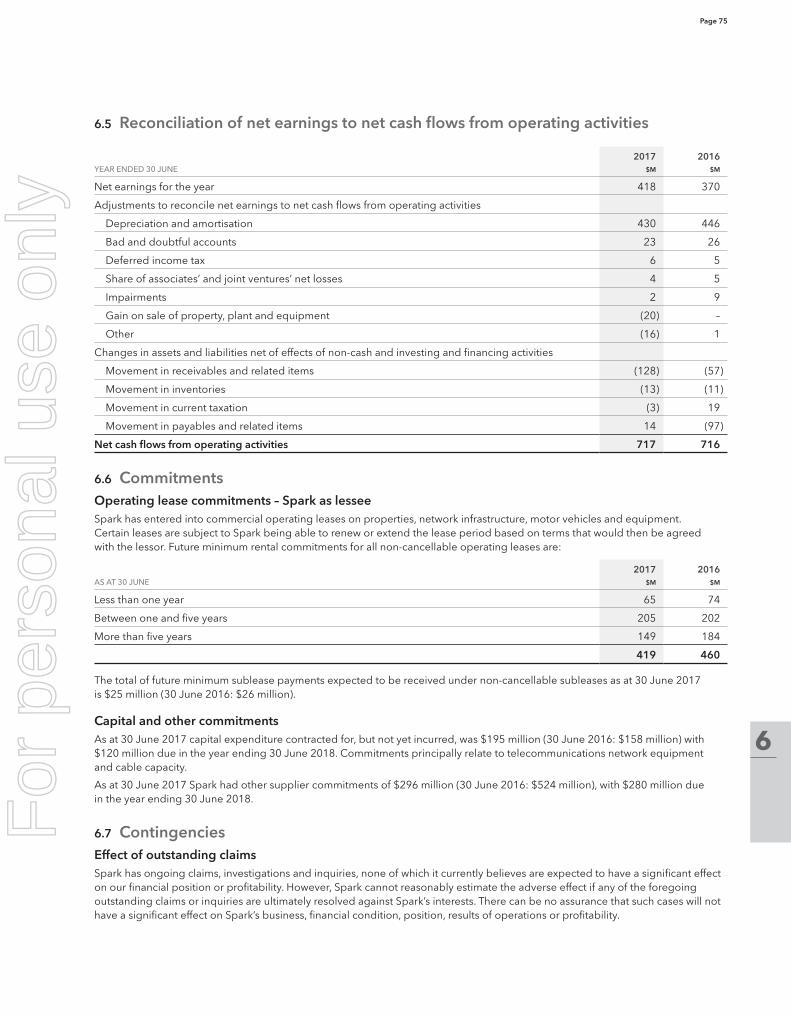
Page 75
6
6.5 Reconciliation of net earnings to net cash flows from operating activities
2017 2016YEAR ENDED 30 JUNE $M $M
Net earnings for the year 418 370
Adjustments to reconcile net earnings to net cash flows from operating activities
Depreciation and amortisation 430 446
Bad and doubtful accounts 23 26
Deferred income tax 6 5
Share of associates’ and joint ventures’ net losses 4 5
Impairments 2 9
Gain on sale of property, plant and equipment (20) –
Other (16) 1
Changes in assets and liabilities net of effects of non-cash and investing and financing activities
Movement in receivables and related items (128) (57)
Movement in inventories (13) (11)
Movement in current taxation (3) 19
Movement in payables and related items 14 (97)
Net cash flows from operating activities 717 716
6.6 CommitmentsOperating lease commitments – Spark as lessee Spark has entered into commercial operating leases on properties, network infrastructure, motor vehicles and equipment. Certain leases are subject to Spark being able to renew or extend the lease period based on terms that would then be agreed with the lessor. Future minimum rental commitments for all non-cancellable operating leases are:
2017 2016AS AT 30 JUNE $M $M
Less than one year 65 74
Between one and five years 205 202
More than five years 149 184
419 460
The total of future minimum sublease payments expected to be received under non-cancellable subleases as at 30 June 2017 is $25 million (30 June 2016: $26 million).
Capital and other commitmentsAs at 30 June 2017 capital expenditure contracted for, but not yet incurred, was $195 million (30 June 2016: $158 million) with $120 million due in the year ending 30 June 2018. Commitments principally relate to telecommunications network equipment and cable capacity.
As at 30 June 2017 Spark had other supplier commitments of $296 million (30 June 2016: $524 million), with $280 million due in the year ending 30 June 2018.
6.7 ContingenciesEffect of outstanding claimsSpark has ongoing claims, investigations and inquiries, none of which it currently believes are expected to have a significant effect on our financial position or profitability. However, Spark cannot reasonably estimate the adverse effect if any of the foregoing outstanding claims or inquiries are ultimately resolved against Spark’s interests. There can be no assurance that such cases will not have a significant effect on Spark’s business, financial condition, position, results of operations or profitability.
For
per
sona
l use
onl
y
Page 76 Spark New Zealand Annual Report 2017 Notes to the financial statements
6.8 New accounting standards not yet adopted
NZ IFRS 9 Financial Instruments (2014)NZ IFRS 9 Financial Instruments (2014) (NZ IFRS 9), representing the final version of the standard, replaces earlier versions of NZ IFRS 9 and completes the replacement of NZ IAS 39 Financial Instruments: Recognition and Measurement. NZ IFRS 9 would be required to be adopted by Spark from the year ending 30 June 2019, however, we have elected to early adopt the remainder of NZ IFRS 9 in the year ending 30 June 2018.
The new standard includes three areas of change:
1. Classification and measurement of financial instruments;
2. A single, forward-looking, ‘expected loss’ impairment model; and
3. Substantially reformed approach to hedge accounting.
1. Classification of financial instruments
Spark early adopted Part 1 of NZ IFRS 9 (2009) Financial Instruments from the year ended 30 June 2010 and the adoption of the final NZ IFRS 9 standard will not require any changes to Spark’s current classification and measurement of its financial assets. The classification and measurement of financial liabilities under NZ IFRS 9 remains the same as in NZ IAS 39, except where we have chosen to measure a financial liability at fair value through profit or loss. For Spark, this will include derivative financial liabilities and movements in fair value related to changes in own credit risk that will be required to be presented separately in other comprehensive income. This is not expected to be material.
2. New impairment model
NZ IFRS 9 prescribes an ‘expected credit loss’ model instead of the current incurred loss model, so it is no longer necessary for a trigger event to have occurred before recognising credit losses. NZ IFRS 9 will require Spark to base its measurement of expected credit losses on forecast/forward-looking information, as well as current and historic information. This will result in increased provisioning for doubtful debts, as losses are recognised earlier, and greater volatility in provision levels.
NZ IFRS 9 includes a ‘general approach’ and a ‘simplified approach’ for the calculation and recognition of impairment of financial assets and we have elected to apply the simplified approach to all balances, which requires the recognition of lifetime expected credit losses at all times.
We have performed a preliminary high-level assessment of the impact of NZ IFRS 9 on the measurement of expected credit losses on adoption. We assessed historic, current and forecast information to estimate an expected credit loss for each class of receivable. The new standard will result in an increase in Spark’s provision for doubtful debts, however, based on this assessment, it is not expected to be material. The cumulative impact of the change will be adjusted through opening retained earnings.
3. Hedge accounting
NZ IFRS 9 will require hedge accounting relationships to align with Spark’s risk management objectives and strategy and includes a more qualitative and forward-looking approach to assessing hedge effectiveness. Under the new model, it is possible that more risk management strategies, particularly those involving hedging a risk component (other than foreign currency risk) of a non-financial item, will be likely to qualify for hedge accounting.
Spark’s preliminary assessment indicated that the types of transactions included in hedge accounting relationships that Spark currently designates will be expanded based on the concept of aggregated exposures in NZ IFRS 9, which will allow more transactions to be designated in new hedge relationships.
NZ IFRS 16 LeasesNZ IFRS 16 Leases (NZ IFRS 16) replaces NZ IAS 17 Leases and will be required to be adopted by Spark no later than for the year ending 30 June 2020, with early adoption permitted. Spark currently intends to early adopt NZ IFRS 16 in the year ending 30 June 2019 and apply the full retrospective transition method, with restatement of the year ending 30 June 2018.
NZ IFRS 16 will require Spark to recognise most leases where Spark is a lessee on the statement of financial position, like the current finance lease model, resulting in ‘right of use’ assets and related finance lease payables balances. The expense previously recorded in relation to operating leases will move from being included in operating expenses (and within EBITDA), to depreciation and finance expense. The impact on net earnings before income tax of an individual lease over its term remains the same, however, the new standard will result in a higher interest expense in early years, and lower in later years of a lease, compared with the current even expense profile of an operating lease.
The new standard will have a significant impact on the financial position and performance of Spark on adoption. Spark has a large number of operating leases, including property leases, such as our office buildings and retail stores, network leases, such as cell sites, motor vehicle leases and equipment leases as detailed in note 6.6.
We have performed a preliminary high-level estimate of the financial impact on Spark based on leases in effect as at 30 June 2016. For the year ended 30 June 2016 we estimate the new standard would have resulted in a $70 million decrease in operating expenses, $50 million increase in depreciation and $22 million increase in interest expense. The overall impact on net earnings before tax would have been a reduction of $2 million. The impact on the statement of financial position as at 30 June 2016 would have been an increase in assets of approximately $200 million, liabilities of approximately $240 million and a decrease in equity of $40 million.
Notes to the financial statements: Other information
For
per
sona
l use
onl
y
Page 77
6
These high-level estimates may differ materially to the actual impact on adoption in the year ending 30 June 2019. A number of leases in place at 30 June 2016 will end or not be renewed and new leases may be entered into. Further, our estimate required several judgements, including determining the lease term, the lease payments (which may be variable) and the discount rate applicable to each lease. Determining the lease term can be complex where leases include rights of renewal or cancellation. Spark also has a number of lease arrangements where lease payments may not be fixed and may vary depending on an index or sales. The appropriateness of these judgements will continue to be assessed until adoption.
NZ IFRS 15 Revenue from contracts with customersNZ IFRS 15 Revenue from contracts with customers (NZ IFRS 15) will replace NZ IAS 18 Revenue and related interpretations and may have a material impact on Spark. Spark is planning to adopt the standard in the year it becomes effective, being in the year ending 30 June 2019.
NZ IFRS 15 sets out the requirements for recognising revenue from contracts with customers. The standard requires entities to apportion revenue earned from contracts to individual promises, or performance obligations, on a relative standalone selling price basis, based on a five-step model.
Spark is continuing to quantify the implications of this standard, however, we expect the following indicative impacts:
• Where multiple products or services are sold in a single arrangement, Spark currently recognises revenue in relation to each distinct good or service in proportion to its fair value. Under NZ IFRS 15, revenue will be allocated with reference to the distinct good or service’s relative stand-alone selling price, being the price Spark would sell it separately to a customer. As a result, on adoption of NZ IFRS 15, the allocation of revenue to these distinct goods or services may vary to the current allocation;
• Costs to obtain a contract, such as sales commissions and costs resulting directly from securing contracts with customers, will be required to be initially recognised as an asset which is expensed over the life of a customer contract; and
• NZ IFRS 15 gives greater detail on how to account for contract modifications than the current revenue standards. Changes must be accounted for either as a retrospective change, prospectively with a reallocation of revenues amongst identified performance obligations or prospectively as separate contracts that will not require any reallocation.
Spark is continuing analysis of the expected impact of transition to NZ IFRS 15.
6.8 New accounting standards not yet adopted (continued)
For
per
sona
l use
onl
y
Page 78 Spark New Zealand Annual Report 2017 Financial Statements
© 2017 KPMG, a New Zealand partnership and a member firm of the KPMG network of independent member firms affiliated with KPMG International Cooperative (“KPMG International”), a Swiss entity.
Independent Auditor’s Report To the shareholders of Spark New Zealand Limited
Report on the consolidated financial statements
Opinion In our opinion, the accompanying consolidated financial statements of Spark New Zealand Limited (the company) and its subsidiaries (the group or Spark) on pages 47 to 77:
i. Present fairly in all material respects the group’s financial position as at 30 June 2017 and its financial performance and cash flows for the year ended on that date; and
ii. Comply with New Zealand Equivalents to International Financial Reporting Standards and International Financial Reporting Standards.
We have audited the accompanying consolidated financial statements which comprise:
— the consolidated statement of financial position as at 30 June 2017;
— the consolidated statement of profit or loss and other comprehensive income, statement of changes in equity and statement of cash flows for the year then ended; and
— notes, including a summary of significant accounting policies and other explanatory information.
Basis for opinion
We conducted our audit in accordance with International Standards on Auditing (New Zealand) (ISA (NZ)). We believe that the audit evidence we have obtained is sufficient and appropriate to provide a basis for our opinion.
We are independent of the group in accordance with Professional and Ethical Standard 1 (Revised) Code of Ethics for Assurance Practitioners issued by the New Zealand Auditing and Assurance Standards Board and the International Ethics Standards Board for Accountants’ Code of Ethics for Professional Accountants (IESBA Code), and we have fulfilled our other ethical responsibilities in accordance with these requirements and the IESBA Code.
Our responsibilities under ISA (NZ) are further described in the Auditor’s Responsibilities for the Audit of the consolidated financial statements section of our report.
Our firm has also provided other services to the group in relation to regulatory audit and other assurance related services (such as trustee reporting). Subject to certain restrictions, partners and employees of our firm do deal with the group on normal terms within the ordinary course of trading activities of the business of the group. These matters have not impaired our independence as auditor of the group. The firm has no other relationship with, or interest in, the group.
Materiality
The scope of our audit was influenced by our application of materiality. Materiality helped us to determine the nature, timing and extent of our audit procedures and to evaluate the effect of misstatements, both individually and on the consolidated financial statements as a whole. The materiality for the consolidated financial
For
per
sona
l use
onl
y
Page 79
statements as a whole was set at $26 million determined with reference to a benchmark of group profit before tax. We chose the benchmark because, in our view, this is a key measure of the group’s performance.
Key Audit Matters
Key audit matters are those matters that, in our professional judgement, were of most significance in our audit of the consolidated financial statements in the current period. We summarise below those matters, our key audit procedures to address those matters and our findings from those procedures in order that the shareholders as a body may better understand the process by which we arrived at our audit opinion. Our procedures were undertaken in the context of and solely for the purpose of our statutory audit opinion on the consolidated financial statements as a whole and we do not express discrete opinions on separate elements of the consolidated financial statements.
The key audit matter How the matter was addressed in our audit
Revenue recognition
Refer to note 2.2 to the financial statements which discloses total revenues of $3,614 million (2016: $3,497 million) including:
- Mobile $1,197 million (2016: $1,134 million)
- Broadband $689 million (2016: $685 million)
- Voice $601million (2016: $681 million)
- IT services $783 million (2016: $658 million).
Revenue recognition is considered to be a key audit matter due to the complexity of the revenue recognition accounting standards as applied to the telecommunications industry, involving key judgements and estimates, principally surrounding:
Multiple products bundled into a single offer from Spark’s Home, Mobile & Business unit:
• identifying the separate components of a
bundled transaction and whether those components have stand-alone value to the customer; and
• allocating total transaction consideration to the multiple components in the bundled transaction.
Contractual arrangements in Spark IT services, involving the design, build and offering of ongoing Information Technology solutions, including ‘as a service’ offerings:
• identifying the separate components of a
bundled transaction and whether those components have stand-alone value to the customer; and
Our audit procedures included:
For multiple products bundled into a single offer from Spark’s Home, Mobile & Business unit:
• reviewing a sample of customer contracts to understand each of the components in the bundled offering;
• challenging the group’s assessment for each component about whether the product or service has stand-alone value to the customer by considering the extent the products and services are interrelated;
• comparing the allocated fair value assigned to each component of the bundle to observed market prices for the respective component; and
• examining the stages at which revenue for each component is recognised, with reference to the group’s operational systems and data.
For contractual arrangements for Spark IT services:
• reviewing a sample of contracts to understand the services the group has contracted to deliver;
• agreeing revenue recognised to a sample of customer contracts and agreed customer contract variations;
• evaluating the cost and revenue forecasts that support the anticipated revenue recognition to be applied for each contract reviewed by discussion with and challenging of the project managers, reviewing project summary reports, customer correspondence and historical customer profitability analyses; and
• evaluating the status of implementation of each contract, through discussion with project managers and reviewing project summary reports.
For
per
sona
l use
onl
y
Page 80 Spark New Zealand Annual Report 2017
The key audit matter How the matter was addressed in our audit
• determining the quantum and timing of contract profit. The latter includes assessing the assumptions underpinning the individual project profitability forecasts over the life of the contract.
For the bundled offerings from Spark’s Home, Mobile & Business unit, we identified no errors with the assessment of each component in the bundled offerings and reasonable assumptions were used to reflect the customer contract and fair value allocated to each component.
For the Spark IT services contracts, we consider the estimates of projected revenue and costs or the assessments of the stage of completion of the projectsto be balanced.
We identified no errors with revenue recognition.
Impact of changes in technology and the group’s network strategy on the carrying value of property, plant & equipment and intangible assets
Refer to notes 3.4 and 3.5 to the financial statements.
The group has property, plant & equipment and intangible assets of $2,223 million (2016: $2,235 million) with additions during the year of $415 million (2016: $390 million). The capitalisation and carrying value of property, plant & equipment and intangible assets is considered to be a key audit matter due to the significance of the assets to the group’s statement of financial position, and due to the level of judgement involved in determining the carrying value of these assets, principally: • the capitalisation or expensing of costs; • the useful economic lives assigned to the
assets capitalised; and • the impact of planned or unexpected
replacement technology on the carrying value of property, plant & equipment and intangible assets.
Our audit procedures included:
• examining controls surrounding application of accounting policies to capitalise or expense project spend;
• assessing the capitalisation of costs incurred on capital projects, by examining a sample of additions to identify if the spend meets the definition of an asset as per the applicable accounting standards;
• assessing the allocated useful economic lives, by comparing to industry benchmarks and our knowledge of the business and its operations and the technology life-cycles anticipated; and
• assessing the need for accelerated depreciation or impairment of assets, by considering the impact of developments in technology and changes to the group’s technology transformation strategy.
We found no issues as a result of our audit procedures over the amounts capitalised to property, plant & equipment and intangible assets. We found asset useful lives used by the group were within an acceptable range when compared to those commonly used in the industry, and appropriately reflected technological developments within the group’s intended capital roadmap. We considered the impact of developments in technology and changes to the group’s technology transformation strategy on useful lives and carrying value and considered the carrying value to be appropriate.
Strategic shift
Spark is continuing on its strategic shift that commenced in 2013 from a traditional
Our procedures in respect of the restructuringprovision included:
For
per
sona
l use
onl
y
Page 81
The key audit matter How the matter was addressed in our audit
telecommunications company to a digital services company. As a consequence, Spark is:
- continuing to simplify and digitise processes, products and services under the newly established execution programme office ‘Quantum’;
- pursuing acquisitions in adjacent industries and investing in new ventures in adjacent industries; and
- pursuing acquisitions to implement Spark’s ‘owned’ metro fibre strategy.
For the year ended 30 June 2017, the above has manifested itself in the financial statements as a restructuring expense and provision. In the year ending 30 June 2018 and beyond, it may have broader financial impacts.
Business simplification
Restructuring expenses are included within operating expenses in note 2.3. The restructuring expense and provision are considered immaterial for the year ended 30 June 2017. This is a key audit matter due to the judgement in determining the extent of redundancies in light of the timing of decisions to restructure the business, the ongoing impact of the initiative, and whether the year ended 30 June 2017 or subsequent years are affected.
• obtaining an in-depth understanding of the elements of the restructuring announcement, including the build-up of the estimate of the expected personnel restructure;
• understanding the timing of decisions made to restructure in relation to the announcement date and the detail surrounding the restructuring programme (such as the identification of individuals identified and business units affected); and
• vouching a sample of termination costs to employee contracts.
Overall we consider the restructuring provision is a reasonable estimate of the future redundancy payments the group is committed to undertake at 30 June 2017. The restructuring announcements were made prior to 30 June 2017 and therefore have been appropriately recorded in the year ended 30 June 2017 and the pay-out was calculated with reference to the affected employees’ contractual entitlement.
We consider there are no other charges or provisions required in relation to the Quantum programme for the year ended 30 June 2017.
Other Information
The Directors, on behalf of the group, are responsible for the other information included in the entity’s Annual Report. Other information includes the Chairman and Managing Director Report, Environmental, Social & Governance Reporting, Performance and Other Information including disclosures relating to corporate governance and statutory information. Our opinion on the consolidated financial statements does not cover any other information and we do not express any form of assurance conclusion thereon.
In connection with our audit of the consolidated financial statements our responsibility is to read the other information and, in doing so, consider whether the other information is materially inconsistent with the consolidated financial statements or our knowledge obtained in the audit or otherwise appears materially misstated. If, based on the work we have performed, we conclude that there is a material misstatement of this other information, we are required to report that fact. We have nothing to report in this regard.
Use of this Audit Report
This report is made solely to the shareholders as a body. Our audit work has been undertaken so that we might state to the shareholders those matters we are required to state to them in the Auditor’s Report and for no other
For
per
sona
l use
onl
y
Page 82 Spark New Zealand Annual Report 2017
purpose. To the fullest extent permitted by law, we do not accept or assume responsibility to anyone other than the shareholders as a body for our audit work, this report, or any of the opinions we have formed.
Responsibilities of Directors for the consolidated financial statements
The Directors, on behalf of the group, are responsible for:
— the preparation and fair presentation of the consolidated financial statements in accordance with generally accepted accounting practice in New Zealand (being New Zealand Equivalents to International Financial Reporting Standards) and International Financial Reporting Standards;
— implementing necessary internal control to enable the preparation of a set of consolidated financial statements that is fairly presented and free from material misstatement, whether due to fraud or error; and
— assessing the ability to continue as a going concern. This includes disclosing, as applicable, matters related to going concern and using the going concern basis of accounting unless they either intend to liquidate or to cease operations, or have no realistic alternative but to do so.
Auditor’s Responsibilities for the Audit of the consolidated financial statements
Our objective is:
— to obtain reasonable assurance about whether the consolidated financial statements as a whole are free from material misstatement, whether due to fraud or error; and
— to issue an Auditor’s Report that includes our opinion.
Reasonable assurance is a high level of assurance, but is not a guarantee that an audit conducted in accordance with International Standards on Auditing (New Zealand) will always detect a material misstatement when it exists.
Misstatements can arise from fraud or error. They are considered material if, individually or in the aggregate, they could reasonably be expected to influence the economic decisions of users taken on the basis of these consolidated financial statements.
A further description of our responsibilities for the Audit of these consolidated financial statements is located at the External Reporting Board (XRB) website at:
https://www.xrb.govt.nz/Site/Auditing_Assurance_Standards/Current_Standards/Page1.aspx
This description forms part of our Auditor’s Report.
Malcolm Downes - Partner
For and on behalf of
KPMG Auckland
18 August 2017
For
per
sona
l use
onl
y
Page 83
Corporate governanceThe Board and management are committed to ensuring that Spark New Zealand Limited (Spark) maintains a high standard of corporate governance and adheres to high ethical standards. The Board regularly reviews and assesses Spark’s governance structures and processes to ensure that they are consistent with international best practice, in both form and substance.
Spark has adopted the NZX Corporate Governance Best Practice Code, the ASX Corporate Governance Council’s Principles and Recommendations (3rd Edition) and the Financial Markets Authority handbook – Corporate Governance in New Zealand Principles and Guidelines. As at 18 August 2017 the Board considers that Spark has complied with these practices for the FY17 reporting period.
Spark has also adopted the NZX Corporate Governance Code for part of the FY17 reporting period after it was published on 10 May 2017. As at 18 August 2017 the Board considers that Spark has followed the recommendations set by the NZX Corporate Governance Code as further detailed in Spark’s ESG Report, which incorporates Spark’s corporate governance statement, found at: www.sparknz.co.nz/about/governance.
Spark has published its corporate governance policies, practices and processes on its website: www.sparknz.co.nz/about/governance. This includes: Spark’s ESG Report and further information on the role and responsibilities of the Board and Board committees (including their charters); audit and independence; risks; remuneration; diversity; ethics and other key Spark policies.
The Board of Directors is elected by shareholders to protect and enhance the value of the assets of Spark in the interests of Spark and its shareholders. The role and responsibilities of the Board are set out in the Board Charter, which may be found at: www.sparknz.co.nz/about/governance.
Three Board committees assist in the execution of the Board’s responsibilities: the Human Resources and Compensation Committee (HRCC); the Nominations and Corporate Governance Committee (NOMs); and the Audit and Risk Management Committee (ARMC). Each Board committee has a charter summarising the role, rights, responsibilities and membership requirements for that committee. Committee charters may be found at: www.sparknz.co.nz/about/governance.
Stock exchange listingsSpark ordinary shares are listed on the NZSX and ASX and Spark continues to comply with NZSX Listing Rules and applicable ASX Listing Rules.
Spark is incorporated in New Zealand and is not subject to Chapters 6, 6A, 6B and 6C of the Australian Corporations Act 2001. The acquisition of Spark shares may be limited by the New Zealand Takeovers Code and the Overseas Investment Act 2005. Spark does not operate additional ownership restrictions.
Spark’s American Depositary Shares, each representing five ordinary Spark shares and evidenced by American Depositary Receipts (ADRs), are traded over-the-counter in the United States. Spark deregistered its ADRs and shares under the United States Securities Exchange Act of 1934 (Securities Exchange Act) on 2 September 2014, at which point its United States Securities and Exchange Commission (SEC) reporting obligations under the Securities Exchange Act and the United States Sarbanes-Oxley Act of 2002 ceased.
Director remuneration The total remuneration available to non-executive directors is fixed by shareholders. The current annual fee pool limit is $1,500,000 and has not been increased since it was approved by shareholders at the annual meeting in October 2003.
The fees payable to non-executive directors during FY17 were:
BOARD/COMMITTEE1 CHAIR MEMBER2
Board of Directors $357,099 $140,675
Audit and Risk Management Committee $37,874 $18,396
Human Resources and Compensation Committee $32,463 $16,232
Nominations and Corporate Governance Committee – –
1 Committee chair and member fees were not payable to the Chair of the Board. Committee member fees were not payable to committee chairs.
2 Member fees were payable for each committee.
The above non-executive directors’ fees were paid out of the current shareholder-approved annual fee pool of $1,500,000.
Corporate governance and disclosures
For
per
sona
l use
onl
y
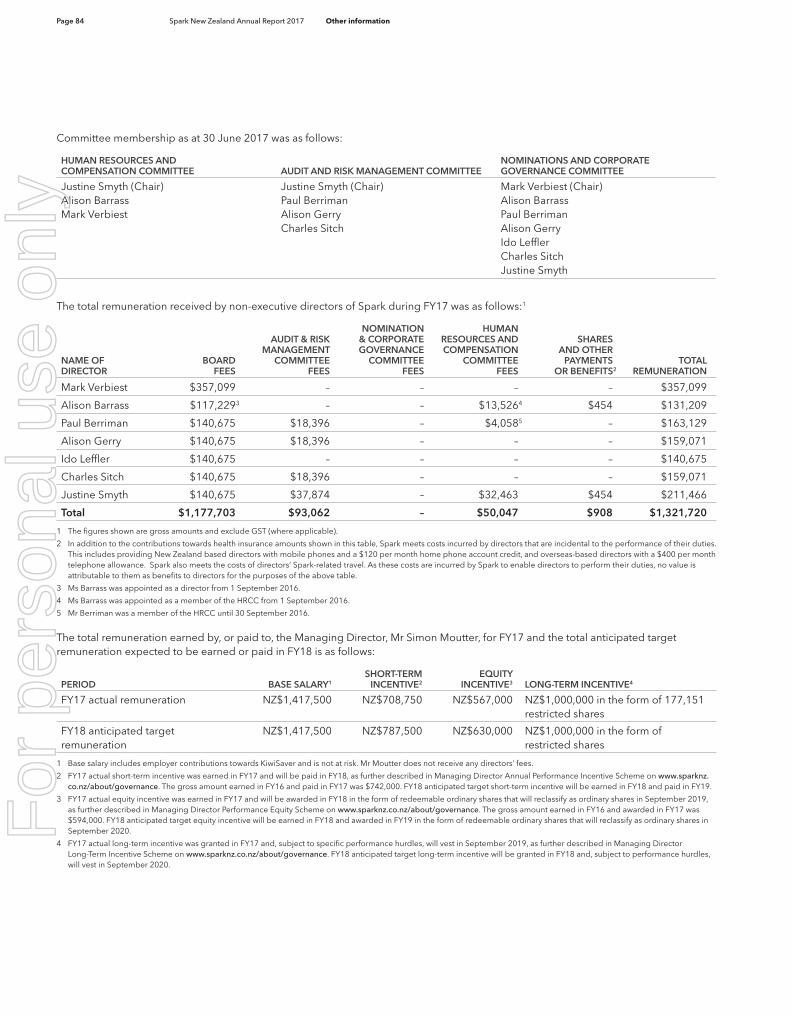
Page 84 Spark New Zealand Annual Report 2017 Other information
Committee membership as at 30 June 2017 was as follows:
HUMAN RESOURCES AND COMPENSATION COMMITTEE AUDIT AND RISK MANAGEMENT COMMITTEE
NOMINATIONS AND CORPORATE GOVERNANCE COMMITTEE
Justine Smyth (Chair)Alison BarrassMark Verbiest
Justine Smyth (Chair)Paul BerrimanAlison GerryCharles Sitch
Mark Verbiest (Chair)Alison BarrassPaul BerrimanAlison GerryIdo LefflerCharles SitchJustine Smyth
The total remuneration received by non-executive directors of Spark during FY17 was as follows:1
NAME OF DIRECTOR
BOARD FEES
AUDIT & RISK MANAGEMENT
COMMITTEE FEES
NOMINATION & CORPORATE GOVERNANCE
COMMITTEE FEES
HUMAN RESOURCES AND COMPENSATION
COMMITTEE FEES
SHARES AND OTHER
PAYMENTSOR BENEFITS2
TOTAL REMUNERATION
Mark Verbiest $357,099 – – – – $357,099
Alison Barrass $117,2293 – – $13,5264 $454 $131,209
Paul Berriman $140,675 $18,396 – $4,0585 – $163,129
Alison Gerry $140,675 $18,396 – – – $159,071
Ido Leffler $140,675 – – – – $140,675
Charles Sitch $140,675 $18,396 – – – $159,071
Justine Smyth $140,675 $37,874 – $32,463 $454 $211,466
Total $1,177,703 $93,062 – $50,047 $908 $1,321,720
1 The figures shown are gross amounts and exclude GST (where applicable).
2 In addition to the contributions towards health insurance amounts shown in this table, Spark meets costs incurred by directors that are incidental to the performance of their duties. This includes providing New Zealand based directors with mobile phones and a $120 per month home phone account credit, and overseas-based directors with a $400 per month telephone allowance. Spark also meets the costs of directors’ Spark-related travel. As these costs are incurred by Spark to enable directors to perform their duties, no value is attributable to them as benefits to directors for the purposes of the above table.
3 Ms Barrass was appointed as a director from 1 September 2016.
4 Ms Barrass was appointed as a member of the HRCC from 1 September 2016.
5 Mr Berriman was a member of the HRCC until 30 September 2016.
The total remuneration earned by, or paid to, the Managing Director, Mr Simon Moutter, for FY17 and the total anticipated target remuneration expected to be earned or paid in FY18 is as follows:
PERIOD BASE SALARY1SHORT-TERM
INCENTIVE2 EQUITY
INCENTIVE3 LONG-TERM INCENTIVE4
FY17 actual remuneration NZ$1,417,500 NZ$708,750 NZ$567,000 NZ$1,000,000 in the form of 177,151 restricted shares
FY18 anticipated target remuneration
NZ$1,417,500 NZ$787,500 NZ$630,000 NZ$1,000,000 in the form of restricted shares
1 Base salary includes employer contributions towards KiwiSaver and is not at risk. Mr Moutter does not receive any directors’ fees.
2 FY17 actual short-term incentive was earned in FY17 and will be paid in FY18, as further described in Managing Director Annual Performance Incentive Scheme on www.sparknz.co.nz/about/governance. The gross amount earned in FY16 and paid in FY17 was $742,000. FY18 anticipated target short-term incentive will be earned in FY18 and paid in FY19.
3 FY17 actual equity incentive was earned in FY17 and will be awarded in FY18 in the form of redeemable ordinary shares that will reclassify as ordinary shares in September 2019, as further described in Managing Director Performance Equity Scheme on www.sparknz.co.nz/about/governance. The gross amount earned in FY16 and awarded in FY17 was $594,000. FY18 anticipated target equity incentive will be earned in FY18 and awarded in FY19 in the form of redeemable ordinary shares that will reclassify as ordinary shares in September 2020.
4 FY17 actual long-term incentive was granted in FY17 and, subject to specific performance hurdles, will vest in September 2019, as further described in Managing Director Long-Term Incentive Scheme on www.sparknz.co.nz/about/governance. FY18 anticipated target long-term incentive will be granted in FY18 and, subject to performance hurdles, will vest in September 2020.
For
per
sona
l use
onl
y
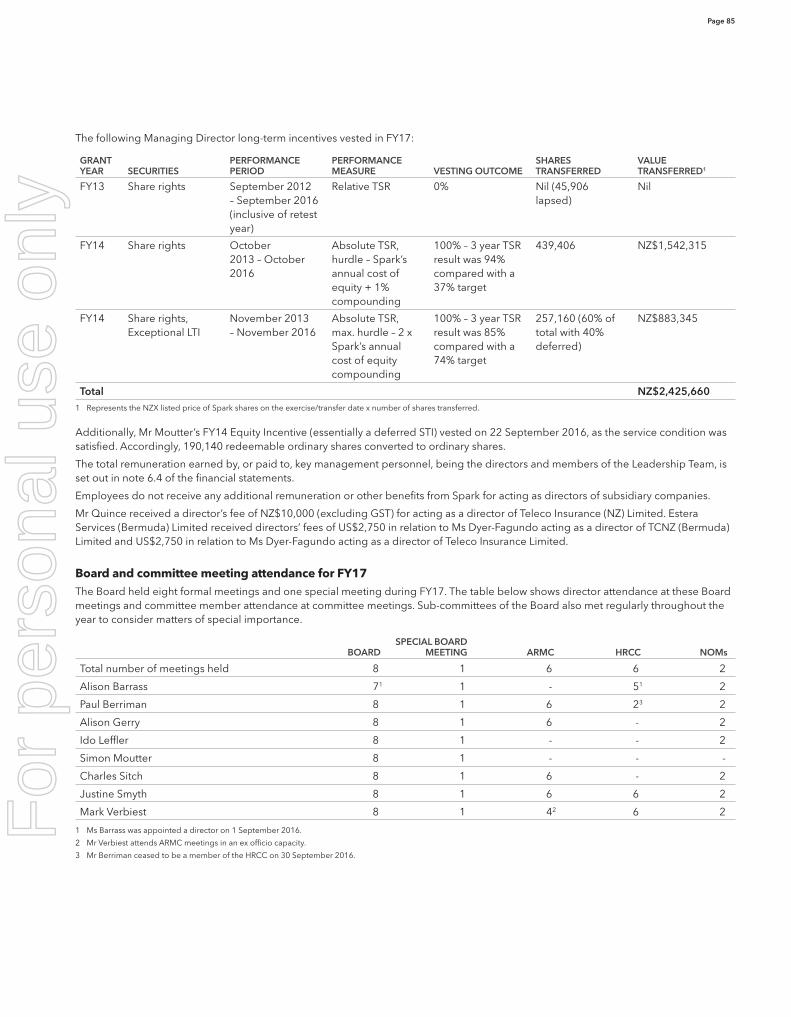
Page 85
The following Managing Director long-term incentives vested in FY17:
GRANT YEAR SECURITIES
PERFORMANCE PERIOD
PERFORMANCE MEASURE VESTING OUTCOME
SHARES TRANSFERRED
VALUE TRANSFERRED1
FY13 Share rights September 2012 – September 2016 (inclusive of retest year)
Relative TSR 0% Nil (45,906 lapsed)
Nil
FY14 Share rights October 2013 – October 2016
Absolute TSR, hurdle – Spark’s annual cost of equity + 1% compounding
100% – 3 year TSR result was 94% compared with a 37% target
439,406 NZ$1,542,315
FY14 Share rights, Exceptional LTI
November 2013 – November 2016
Absolute TSR, max. hurdle – 2 x Spark’s annual cost of equity compounding
100% – 3 year TSR result was 85% compared with a 74% target
257,160 (60% of total with 40% deferred)
NZ$883,345
Total NZ$2,425,6601 Represents the NZX listed price of Spark shares on the exercise/transfer date x number of shares transferred.
Additionally, Mr Moutter’s FY14 Equity Incentive (essentially a deferred STI) vested on 22 September 2016, as the service condition was satisfied. Accordingly, 190,140 redeemable ordinary shares converted to ordinary shares.
The total remuneration earned by, or paid to, key management personnel, being the directors and members of the Leadership Team, is set out in note 6.4 of the financial statements.
Employees do not receive any additional remuneration or other benefits from Spark for acting as directors of subsidiary companies.
Mr Quince received a director’s fee of NZ$10,000 (excluding GST) for acting as a director of Teleco Insurance (NZ) Limited. Estera Services (Bermuda) Limited received directors’ fees of US$2,750 in relation to Ms Dyer-Fagundo acting as a director of TCNZ (Bermuda) Limited and US$2,750 in relation to Ms Dyer-Fagundo acting as a director of Teleco Insurance Limited.
Board and committee meeting attendance for FY17 The Board held eight formal meetings and one special meeting during FY17. The table below shows director attendance at these Board meetings and committee member attendance at committee meetings. Sub-committees of the Board also met regularly throughout the year to consider matters of special importance.
BOARD SPECIAL BOARD
MEETING ARMC HRCC NOMs
Total number of meetings held 8 1 6 6 2
Alison Barrass 71 1 - 51 2
Paul Berriman 8 1 6 23 2
Alison Gerry 8 1 6 - 2
Ido Leffler 8 1 - - 2
Simon Moutter 8 1 - - -
Charles Sitch 8 1 6 - 2
Justine Smyth 8 1 6 6 2
Mark Verbiest 8 1 42 6 2
1 Ms Barrass was appointed a director on 1 September 2016.
2 Mr Verbiest attends ARMC meetings in an ex officio capacity.
3 Mr Berriman ceased to be a member of the HRCC on 30 September 2016.
For
per
sona
l use
onl
y
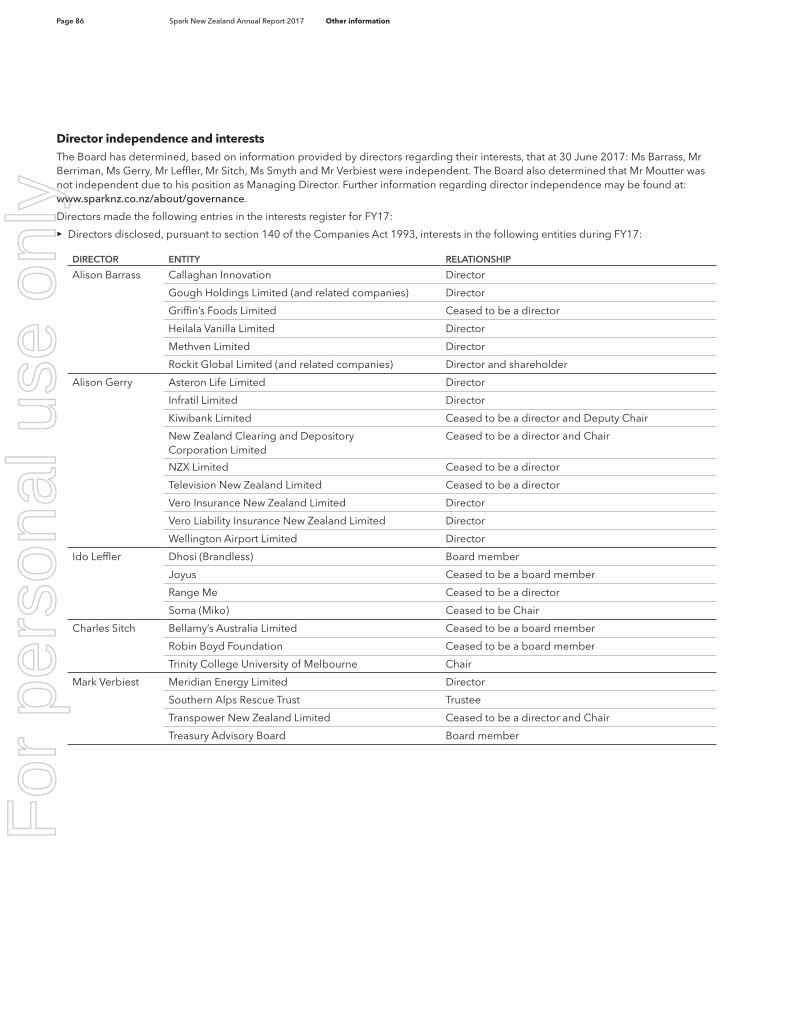
Page 86 Spark New Zealand Annual Report 2017 Other information
Director independence and interestsThe Board has determined, based on information provided by directors regarding their interests, that at 30 June 2017: Ms Barrass, Mr Berriman, Ms Gerry, Mr Leffler, Mr Sitch, Ms Smyth and Mr Verbiest were independent. The Board also determined that Mr Moutter was not independent due to his position as Managing Director. Further information regarding director independence may be found at: www.sparknz.co.nz/about/governance.
Directors made the following entries in the interests register for FY17:
>> Directors disclosed, pursuant to section 140 of the Companies Act 1993, interests in the following entities during FY17:
DIRECTOR ENTITY RELATIONSHIP
Alison Barrass Callaghan Innovation Director
Gough Holdings Limited (and related companies) Director
Griffin’s Foods Limited Ceased to be a director
Heilala Vanilla Limited Director
Methven Limited Director
Rockit Global Limited (and related companies) Director and shareholder
Alison Gerry Asteron Life Limited Director
Infratil Limited Director
Kiwibank Limited Ceased to be a director and Deputy Chair
New Zealand Clearing and Depository Corporation Limited
Ceased to be a director and Chair
NZX Limited Ceased to be a director
Television New Zealand Limited Ceased to be a director
Vero Insurance New Zealand Limited Director
Vero Liability Insurance New Zealand Limited Director
Wellington Airport Limited Director
Ido Leffler Dhosi (Brandless) Board member
Joyus Ceased to be a board member
Range Me Ceased to be a director
Soma (Miko) Ceased to be Chair
Charles Sitch Bellamy’s Australia Limited Ceased to be a board member
Robin Boyd Foundation Ceased to be a board member
Trinity College University of Melbourne Chair
Mark Verbiest Meridian Energy Limited Director
Southern Alps Rescue Trust Trustee
Transpower New Zealand Limited Ceased to be a director and Chair
Treasury Advisory Board Board member
For
per
sona
l use
onl
y
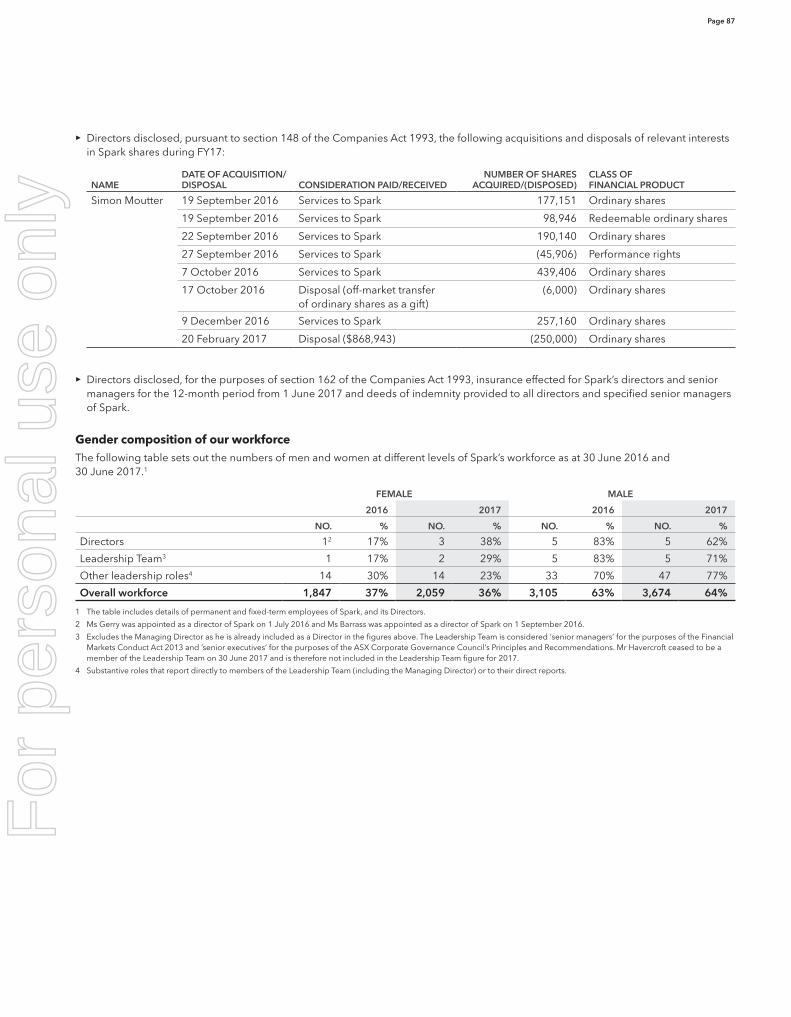
Page 87
>> Directors disclosed, pursuant to section 148 of the Companies Act 1993, the following acquisitions and disposals of relevant interests in Spark shares during FY17:
NAMEDATE OF ACQUISITION/DISPOSAL CONSIDERATION PAID/RECEIVED
NUMBER OF SHARES ACQUIRED/(DISPOSED)
CLASS OF FINANCIAL PRODUCT
Simon Moutter 19 September 2016 Services to Spark 177,151 Ordinary shares
19 September 2016 Services to Spark 98,946 Redeemable ordinary shares
22 September 2016 Services to Spark 190,140 Ordinary shares
27 September 2016 Services to Spark (45,906) Performance rights
7 October 2016 Services to Spark 439,406 Ordinary shares
17 October 2016 Disposal (off-market transfer of ordinary shares as a gift)
(6,000) Ordinary shares
9 December 2016 Services to Spark 257,160 Ordinary shares
20 February 2017 Disposal ($868,943) (250,000) Ordinary shares
>> Directors disclosed, for the purposes of section 162 of the Companies Act 1993, insurance effected for Spark’s directors and senior managers for the 12-month period from 1 June 2017 and deeds of indemnity provided to all directors and specified senior managers of Spark.
Gender composition of our workforce The following table sets out the numbers of men and women at different levels of Spark’s workforce as at 30 June 2016 and 30 June 2017.1
FEMALE MALE
2016 2017 2016 2017
NO. % NO. % NO. % NO. %
Directors 12 17% 3 38% 5 83% 5 62%
Leadership Team3 1 17% 2 29% 5 83% 5 71%
Other leadership roles4 14 30% 14 23% 33 70% 47 77%
Overall workforce 1,847 37% 2,059 36% 3,105 63% 3,674 64%
1 The table includes details of permanent and fixed-term employees of Spark, and its Directors.
2 Ms Gerry was appointed as a director of Spark on 1 July 2016 and Ms Barrass was appointed as a director of Spark on 1 September 2016.
3 Excludes the Managing Director as he is already included as a Director in the figures above. The Leadership Team is considered ‘senior managers’ for the purposes of the Financial Markets Conduct Act 2013 and ’senior executives’ for the purposes of the ASX Corporate Governance Council’s Principles and Recommendations. Mr Havercroft ceased to be a member of the Leadership Team on 30 June 2017 and is therefore not included in the Leadership Team figure for 2017.
4 Substantive roles that report directly to members of the Leadership Team (including the Managing Director) or to their direct reports.
For
per
sona
l use
onl
y
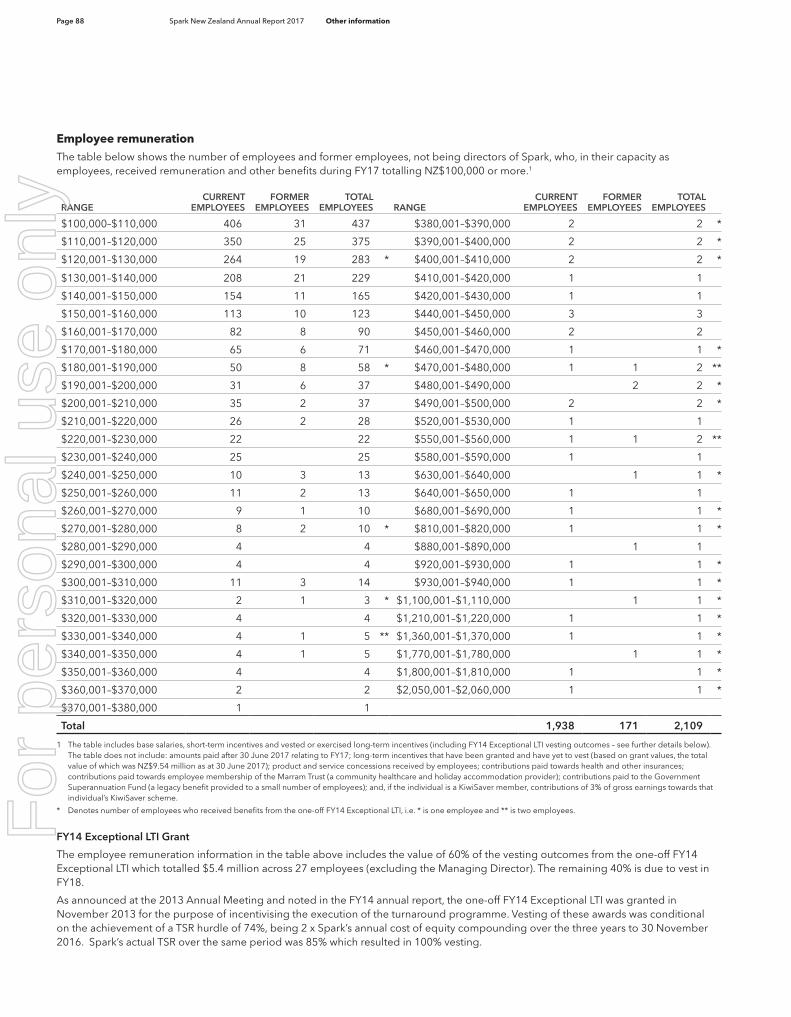
Page 88 Spark New Zealand Annual Report 2017 Other information
Employee remunerationThe table below shows the number of employees and former employees, not being directors of Spark, who, in their capacity as employees, received remuneration and other benefits during FY17 totalling NZ$100,000 or more.1
RANGECURRENT
EMPLOYEESFORMER
EMPLOYEESTOTAL
EMPLOYEES RANGECURRENT
EMPLOYEESFORMER
EMPLOYEESTOTAL
EMPLOYEES
$100,000–$110,000 406 31 437 $380,001–$390,000 2 2 *
$110,001–$120,000 350 25 375 $390,001–$400,000 2 2 *
$120,001–$130,000 264 19 283 * $400,001–$410,000 2 2 *
$130,001–$140,000 208 21 229 $410,001–$420,000 1 1
$140,001–$150,000 154 11 165 $420,001–$430,000 1 1
$150,001–$160,000 113 10 123 $440,001–$450,000 3 3
$160,001–$170,000 82 8 90 $450,001–$460,000 2 2
$170,001–$180,000 65 6 71 $460,001–$470,000 1 1 *
$180,001–$190,000 50 8 58 * $470,001–$480,000 1 1 2 **
$190,001–$200,000 31 6 37 $480,001–$490,000 2 2 *
$200,001–$210,000 35 2 37 $490,001–$500,000 2 2 *
$210,001–$220,000 26 2 28 $520,001–$530,000 1 1
$220,001–$230,000 22 22 $550,001–$560,000 1 1 2 **
$230,001–$240,000 25 25 $580,001–$590,000 1 1
$240,001–$250,000 10 3 13 $630,001–$640,000 1 1 *
$250,001–$260,000 11 2 13 $640,001–$650,000 1 1
$260,001–$270,000 9 1 10 $680,001–$690,000 1 1 *
$270,001–$280,000 8 2 10 * $810,001–$820,000 1 1 *
$280,001–$290,000 4 4 $880,001–$890,000 1 1
$290,001–$300,000 4 4 $920,001–$930,000 1 1 *
$300,001–$310,000 11 3 14 $930,001–$940,000 1 1 *
$310,001–$320,000 2 1 3 * $1,100,001–$1,110,000 1 1 *
$320,001–$330,000 4 4 $1,210,001–$1,220,000 1 1 *
$330,001–$340,000 4 1 5 ** $1,360,001–$1,370,000 1 1 *
$340,001–$350,000 4 1 5 $1,770,001–$1,780,000 1 1 *
$350,001–$360,000 4 4 $1,800,001–$1,810,000 1 1 *
$360,001–$370,000 2 2 $2,050,001–$2,060,000 1 1 *
$370,001–$380,000 1 1
Total 1,938 171 2,109
1 The table includes base salaries, short-term incentives and vested or exercised long-term incentives (including FY14 Exceptional LTI vesting outcomes – see further details below). The table does not include: amounts paid after 30 June 2017 relating to FY17; long-term incentives that have been granted and have yet to vest (based on grant values, the total value of which was NZ$9.54 million as at 30 June 2017); product and service concessions received by employees; contributions paid towards health and other insurances; contributions paid towards employee membership of the Marram Trust (a community healthcare and holiday accommodation provider); contributions paid to the Government Superannuation Fund (a legacy benefit provided to a small number of employees); and, if the individual is a KiwiSaver member, contributions of 3% of gross earnings towards that individual’s KiwiSaver scheme.
* Denotes number of employees who received benefits from the one-off FY14 Exceptional LTI, i.e. * is one employee and ** is two employees.
FY14 Exceptional LTI Grant
The employee remuneration information in the table above includes the value of 60% of the vesting outcomes from the one-off FY14 Exceptional LTI which totalled $5.4 million across 27 employees (excluding the Managing Director). The remaining 40% is due to vest in FY18.
As announced at the 2013 Annual Meeting and noted in the FY14 annual report, the one-off FY14 Exceptional LTI was granted in November 2013 for the purpose of incentivising the execution of the turnaround programme. Vesting of these awards was conditional on the achievement of a TSR hurdle of 74%, being 2 x Spark’s annual cost of equity compounding over the three years to 30 November 2016. Spark’s actual TSR over the same period was 85% which resulted in 100% vesting.
For
per
sona
l use
onl
y
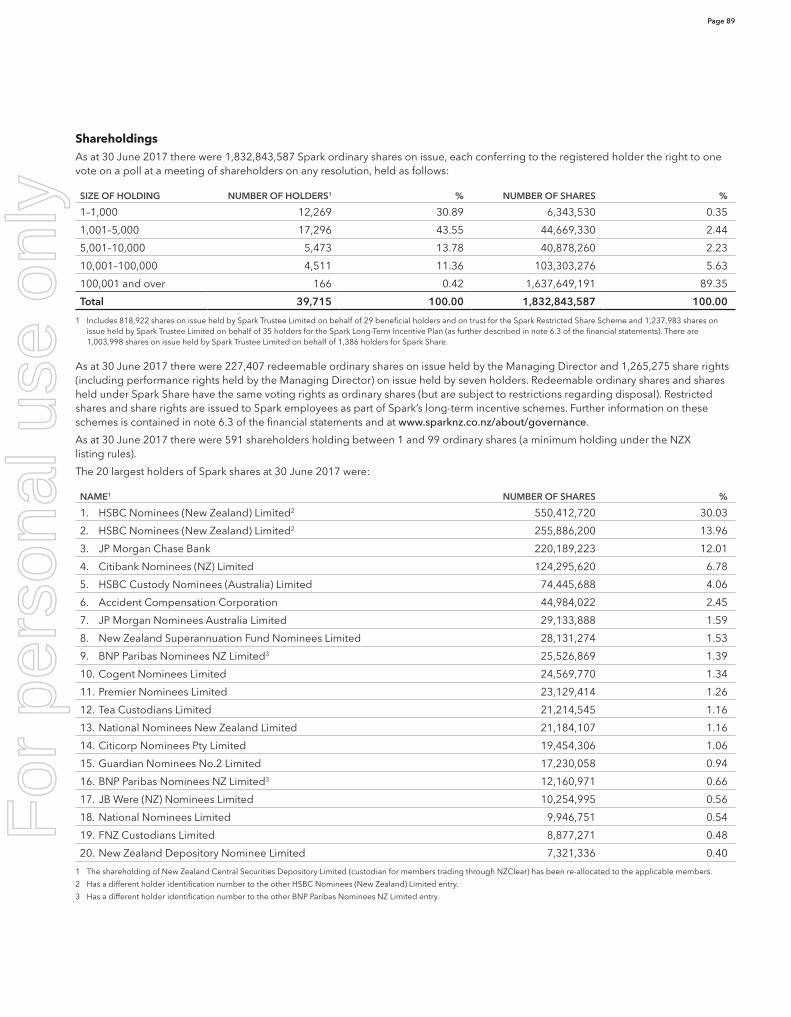
Page 89
Shareholdings As at 30 June 2017 there were 1,832,843,587 Spark ordinary shares on issue, each conferring to the registered holder the right to one vote on a poll at a meeting of shareholders on any resolution, held as follows:
SIZE OF HOLDING NUMBER OF HOLDERS1 % NUMBER OF SHARES %
1–1,000 12,269 30.89 6,343,530 0.35
1,001–5,000 17,296 43.55 44,669,330 2.44
5,001–10,000 5,473 13.78 40,878,260 2.23
10,001–100,000 4,511 11.36 103,303,276 5.63
100,001 and over 166 0.42 1,637,649,191 89.35
Total 39,715 100.00 1,832,843,587 100.00
1 Includes 818,922 shares on issue held by Spark Trustee Limited on behalf of 29 beneficial holders and on trust for the Spark Restricted Share Scheme and 1,237,983 shares on issue held by Spark Trustee Limited on behalf of 35 holders for the Spark Long-Term Incentive Plan (as further described in note 6.3 of the financial statements). There are 1,003,998 shares on issue held by Spark Trustee Limited on behalf of 1,386 holders for Spark Share.
As at 30 June 2017 there were 227,407 redeemable ordinary shares on issue held by the Managing Director and 1,265,275 share rights (including performance rights held by the Managing Director) on issue held by seven holders. Redeemable ordinary shares and shares held under Spark Share have the same voting rights as ordinary shares (but are subject to restrictions regarding disposal). Restricted shares and share rights are issued to Spark employees as part of Spark’s long-term incentive schemes. Further information on these schemes is contained in note 6.3 of the financial statements and at www.sparknz.co.nz/about/governance.
As at 30 June 2017 there were 591 shareholders holding between 1 and 99 ordinary shares (a minimum holding under the NZX listing rules).
The 20 largest holders of Spark shares at 30 June 2017 were:
NAME1 NUMBER OF SHARES %
1. HSBC Nominees (New Zealand) Limited2 550,412,720 30.03
2. HSBC Nominees (New Zealand) Limited2 255,886,200 13.96
3. JP Morgan Chase Bank 220,189,223 12.01
4. Citibank Nominees (NZ) Limited 124,295,620 6.78
5. HSBC Custody Nominees (Australia) Limited 74,445,688 4.06
6. Accident Compensation Corporation 44,984,022 2.45
7. JP Morgan Nominees Australia Limited 29,133,888 1.59
8. New Zealand Superannuation Fund Nominees Limited 28,131,274 1.53
9. BNP Paribas Nominees NZ Limited3 25,526,869 1.39
10. Cogent Nominees Limited 24,569,770 1.34
11. Premier Nominees Limited 23,129,414 1.26
12. Tea Custodians Limited 21,214,545 1.16
13. National Nominees New Zealand Limited 21,184,107 1.16
14. Citicorp Nominees Pty Limited 19,454,306 1.06
15. Guardian Nominees No.2 Limited 17,230,058 0.94
16. BNP Paribas Nominees NZ Limited3 12,160,971 0.66
17. JB Were (NZ) Nominees Limited 10,254,995 0.56
18. National Nominees Limited 9,946,751 0.54
19. FNZ Custodians Limited 8,877,271 0.48
20. New Zealand Depository Nominee Limited 7,321,336 0.40
1 The shareholding of New Zealand Central Securities Depository Limited (custodian for members trading through NZClear) has been re-allocated to the applicable members.
2 Has a different holder identification number to the other HSBC Nominees (New Zealand) Limited entry.
3 Has a different holder identification number to the other BNP Paribas Nominees NZ Limited entry.
For
per
sona
l use
onl
y
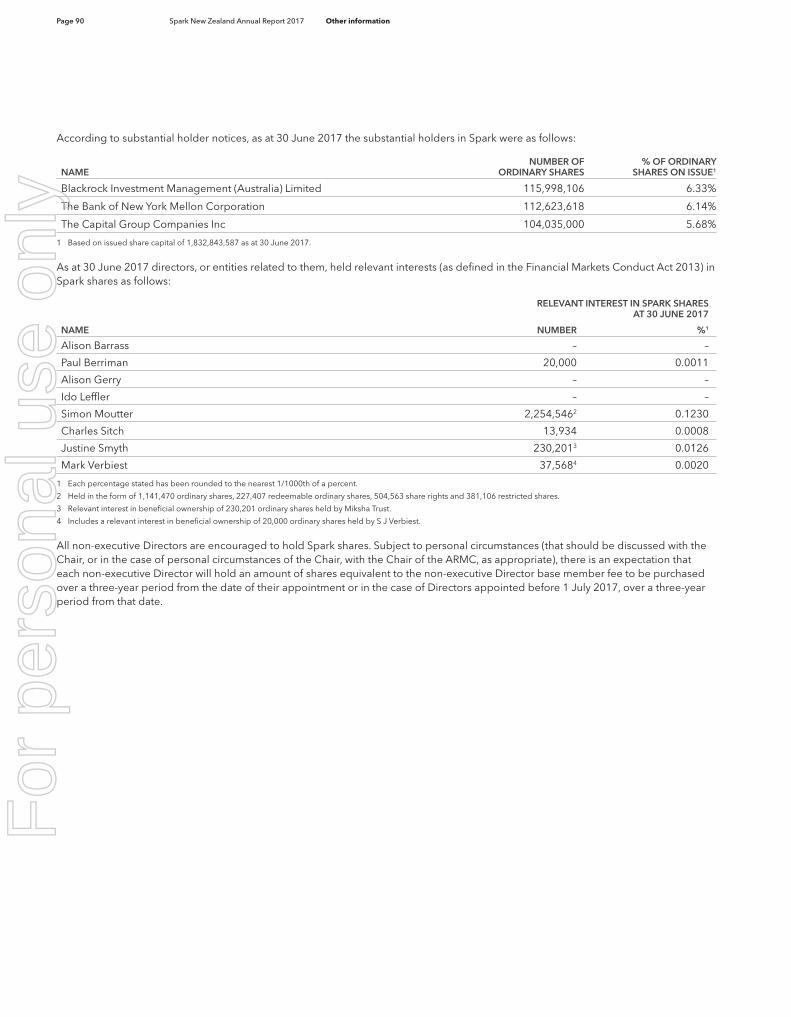
Page 90 Spark New Zealand Annual Report 2017 Other information
According to substantial holder notices, as at 30 June 2017 the substantial holders in Spark were as follows:
NAMENUMBER OF
ORDINARY SHARES% OF ORDINARY
SHARES ON ISSUE1
Blackrock Investment Management (Australia) Limited 115,998,106 6.33%
The Bank of New York Mellon Corporation 112,623,618 6.14%
The Capital Group Companies Inc 104,035,000 5.68%
1 Based on issued share capital of 1,832,843,587 as at 30 June 2017.
As at 30 June 2017 directors, or entities related to them, held relevant interests (as defined in the Financial Markets Conduct Act 2013) in Spark shares as follows:
NAME
RELEVANT INTEREST IN SPARK SHARES AT 30 JUNE 2017
NUMBER %1
Alison Barrass – –
Paul Berriman 20,000 0.0011
Alison Gerry – –
Ido Leffler – –
Simon Moutter 2,254,5462 0.1230
Charles Sitch 13,934 0.0008
Justine Smyth 230,2013 0.0126
Mark Verbiest 37,5684 0.0020
1 Each percentage stated has been rounded to the nearest 1/1000th of a percent.
2 Held in the form of 1,141,470 ordinary shares, 227,407 redeemable ordinary shares, 504,563 share rights and 381,106 restricted shares.
3 Relevant interest in beneficial ownership of 230,201 ordinary shares held by Miksha Trust.
4 Includes a relevant interest in beneficial ownership of 20,000 ordinary shares held by S J Verbiest.
All non-executive Directors are encouraged to hold Spark shares. Subject to personal circumstances (that should be discussed with the Chair, or in the case of personal circumstances of the Chair, with the Chair of the ARMC, as appropriate), there is an expectation that each non-executive Director will hold an amount of shares equivalent to the non-executive Director base member fee to be purchased over a three-year period from the date of their appointment or in the case of Directors appointed before 1 July 2017, over a three-year period from that date.
For
per
sona
l use
onl
y
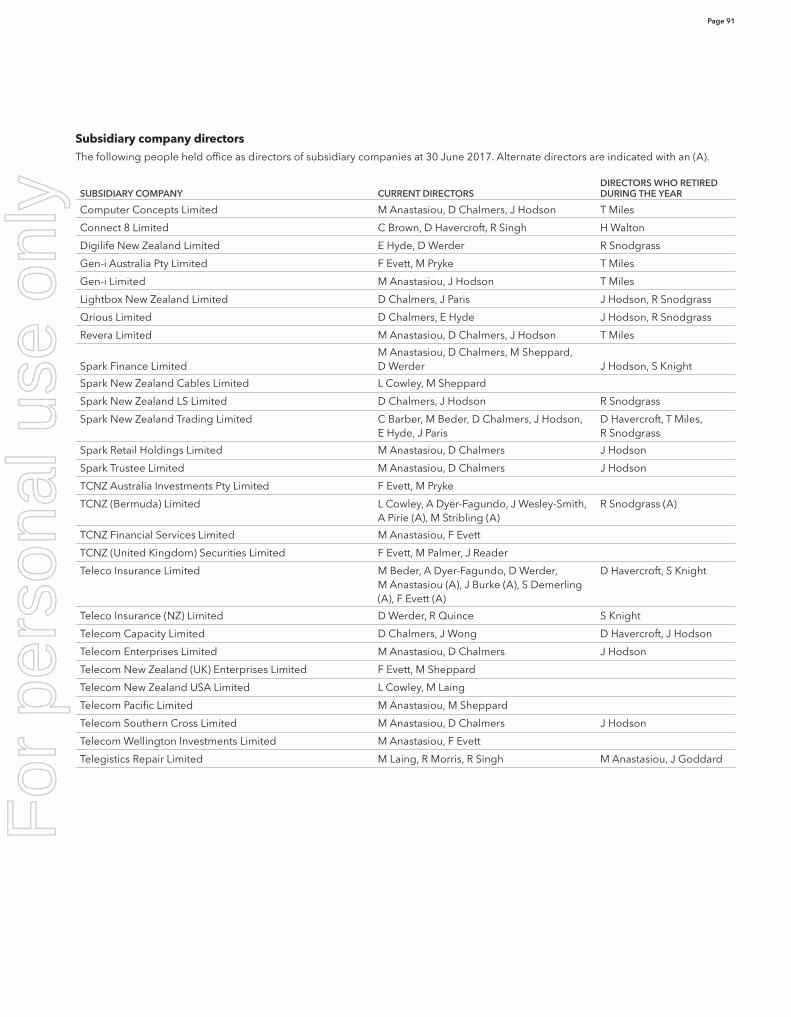
Page 91
Subsidiary company directorsThe following people held office as directors of subsidiary companies at 30 June 2017. Alternate directors are indicated with an (A).
SUBSIDIARY COMPANY CURRENT DIRECTORSDIRECTORS WHO RETIRED DURING THE YEAR
Computer Concepts Limited M Anastasiou, D Chalmers, J Hodson T Miles
Connect 8 Limited C Brown, D Havercroft, R Singh H Walton
Digilife New Zealand Limited E Hyde, D Werder R Snodgrass
Gen-i Australia Pty Limited F Evett, M Pryke T Miles
Gen-i Limited M Anastasiou, J Hodson T Miles
Lightbox New Zealand Limited D Chalmers, J Paris J Hodson, R Snodgrass
Qrious Limited D Chalmers, E Hyde J Hodson, R Snodgrass
Revera Limited M Anastasiou, D Chalmers, J Hodson T Miles
Spark Finance LimitedM Anastasiou, D Chalmers, M Sheppard, D Werder J Hodson, S Knight
Spark New Zealand Cables Limited L Cowley, M Sheppard
Spark New Zealand LS Limited D Chalmers, J Hodson R Snodgrass
Spark New Zealand Trading Limited C Barber, M Beder, D Chalmers, J Hodson, E Hyde, J Paris
D Havercroft, T Miles, R Snodgrass
Spark Retail Holdings Limited M Anastasiou, D Chalmers J Hodson
Spark Trustee Limited M Anastasiou, D Chalmers J Hodson
TCNZ Australia Investments Pty Limited F Evett, M Pryke
TCNZ (Bermuda) Limited L Cowley, A Dyer-Fagundo, J Wesley-Smith, A Pirie (A), M Stribling (A)
R Snodgrass (A)
TCNZ Financial Services Limited M Anastasiou, F Evett
TCNZ (United Kingdom) Securities Limited F Evett, M Palmer, J Reader
Teleco Insurance Limited M Beder, A Dyer-Fagundo, D Werder, M Anastasiou (A), J Burke (A), S Demerling (A), F Evett (A)
D Havercroft, S Knight
Teleco Insurance (NZ) Limited D Werder, R Quince S Knight
Telecom Capacity Limited D Chalmers, J Wong D Havercroft, J Hodson
Telecom Enterprises Limited M Anastasiou, D Chalmers J Hodson
Telecom New Zealand (UK) Enterprises Limited F Evett, M Sheppard
Telecom New Zealand USA Limited L Cowley, M Laing
Telecom Pacific Limited M Anastasiou, M Sheppard
Telecom Southern Cross Limited M Anastasiou, D Chalmers J Hodson
Telecom Wellington Investments Limited M Anastasiou, F Evett
Telegistics Repair Limited M Laing, R Morris, R Singh M Anastasiou, J Goddard
For
per
sona
l use
onl
y
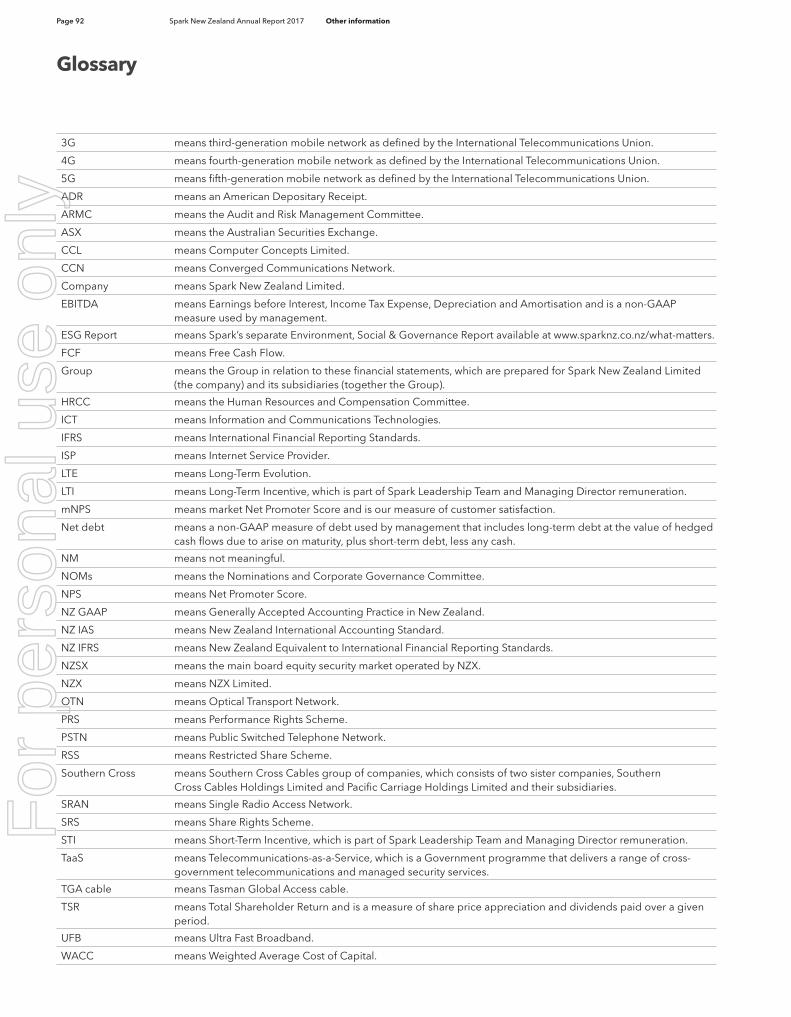
Page 92 Spark New Zealand Annual Report 2017 Other information
3G means third-generation mobile network as defined by the International Telecommunications Union.
4G means fourth-generation mobile network as defined by the International Telecommunications Union.
5G means fifth-generation mobile network as defined by the International Telecommunications Union.
ADR means an American Depositary Receipt.
ARMC means the Audit and Risk Management Committee.
ASX means the Australian Securities Exchange.
CCL means Computer Concepts Limited.
CCN means Converged Communications Network.
Company means Spark New Zealand Limited.
EBITDA means Earnings before Interest, Income Tax Expense, Depreciation and Amortisation and is a non-GAAP measure used by management.
ESG Report means Spark’s separate Environment, Social & Governance Report available at www.sparknz.co.nz/what-matters.
FCF means Free Cash Flow.
Group means the Group in relation to these financial statements, which are prepared for Spark New Zealand Limited (the company) and its subsidiaries (together the Group).
HRCC means the Human Resources and Compensation Committee.
ICT means Information and Communications Technologies.
IFRS means International Financial Reporting Standards.
ISP means Internet Service Provider.
LTE means Long-Term Evolution.
LTI means Long-Term Incentive, which is part of Spark Leadership Team and Managing Director remuneration.
mNPS means market Net Promoter Score and is our measure of customer satisfaction.
Net debt means a non-GAAP measure of debt used by management that includes long-term debt at the value of hedged cash flows due to arise on maturity, plus short-term debt, less any cash.
NM means not meaningful.
NOMs means the Nominations and Corporate Governance Committee.
NPS means Net Promoter Score.
NZ GAAP means Generally Accepted Accounting Practice in New Zealand.
NZ IAS means New Zealand International Accounting Standard.
NZ IFRS means New Zealand Equivalent to International Financial Reporting Standards.
NZSX means the main board equity security market operated by NZX.
NZX means NZX Limited.
OTN means Optical Transport Network.
PRS means Performance Rights Scheme.
PSTN means Public Switched Telephone Network.
RSS means Restricted Share Scheme.
Southern Cross means Southern Cross Cables group of companies, which consists of two sister companies, Southern Cross Cables Holdings Limited and Pacific Carriage Holdings Limited and their subsidiaries.
SRAN means Single Radio Access Network.
SRS means Share Rights Scheme.
STI means Short-Term Incentive, which is part of Spark Leadership Team and Managing Director remuneration.
TaaS means Telecommunications-as-a-Service, which is a Government programme that delivers a range of cross-government telecommunications and managed security services.
TGA cable means Tasman Global Access cable.
TSR means Total Shareholder Return and is a measure of share price appreciation and dividends paid over a given period.
UFB means Ultra Fast Broadband.
WACC means Weighted Average Cost of Capital.
GlossaryF
or p
erso
nal u
se o
nly
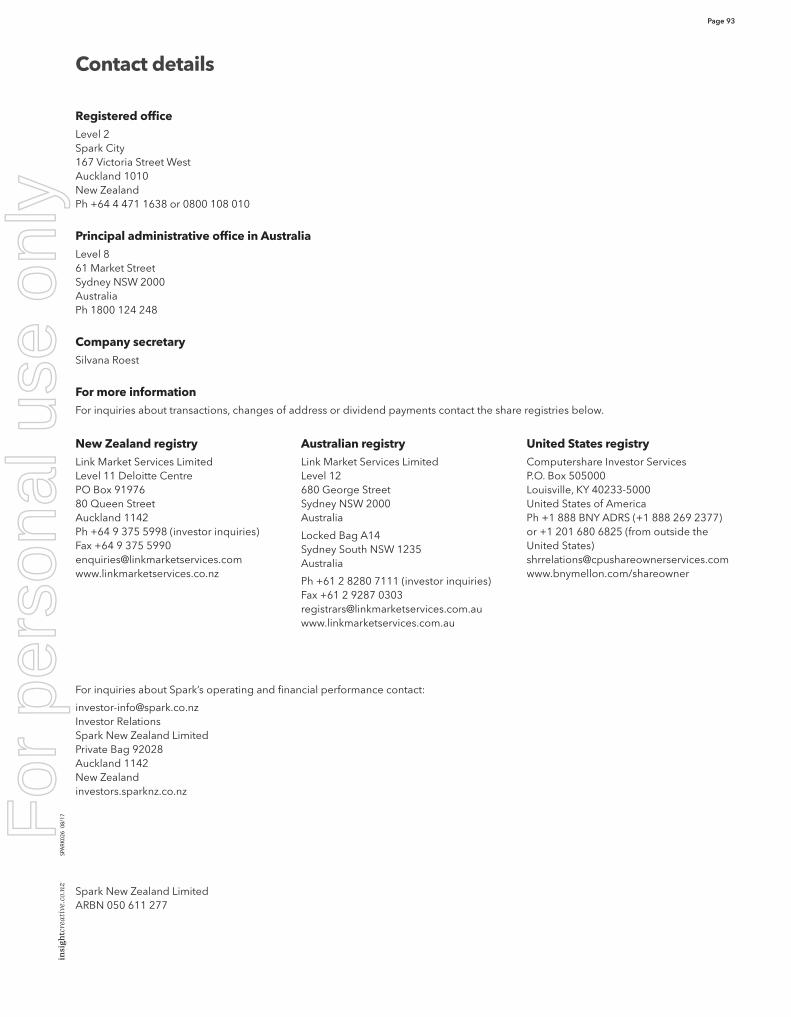
Page 93
Contact details
Spark New Zealand Limited ARBN 050 611 277
Registered officeLevel 2Spark City167 Victoria Street WestAuckland 1010New ZealandPh +64 4 471 1638 or 0800 108 010
Principal administrative office in Australia Level 8 61 Market StreetSydney NSW 2000AustraliaPh 1800 124 248
Company secretarySilvana Roest
For more informationFor inquiries about transactions, changes of address or dividend payments contact the share registries below.
New Zealand registry Link Market Services Limited Level 11 Deloitte Centre PO Box 91976 80 Queen Street Auckland 1142 Ph +64 9 375 5998 (investor inquiries) Fax +64 9 375 5990 [email protected] www.linkmarketservices.co.nz
Australian registry Link Market Services Limited Level 12 680 George Street Sydney NSW 2000 Australia
Locked Bag A14 Sydney South NSW 1235 Australia
Ph +61 2 8280 7111 (investor inquiries) Fax +61 2 9287 0303 [email protected] www.linkmarketservices.com.au
United States registry Computershare Investor ServicesP.O. Box 505000Louisville, KY 40233-5000United States of AmericaPh +1 888 BNY ADRS (+1 888 269 2377) or +1 201 680 6825 (from outside the United States)[email protected]/shareowner
For inquiries about Spark’s operating and financial performance contact:
[email protected] Investor RelationsSpark New Zealand LimitedPrivate Bag 92028Auckland 1142New Zealandinvestors.sparknz.co.nz
insightcreative.co.nz
SP
ARK
026
08/1
7For
per
sona
l use
onl
y

investors.sparknz.co.nzARBN 050 611 277
For
per
sona
l use
onl
y
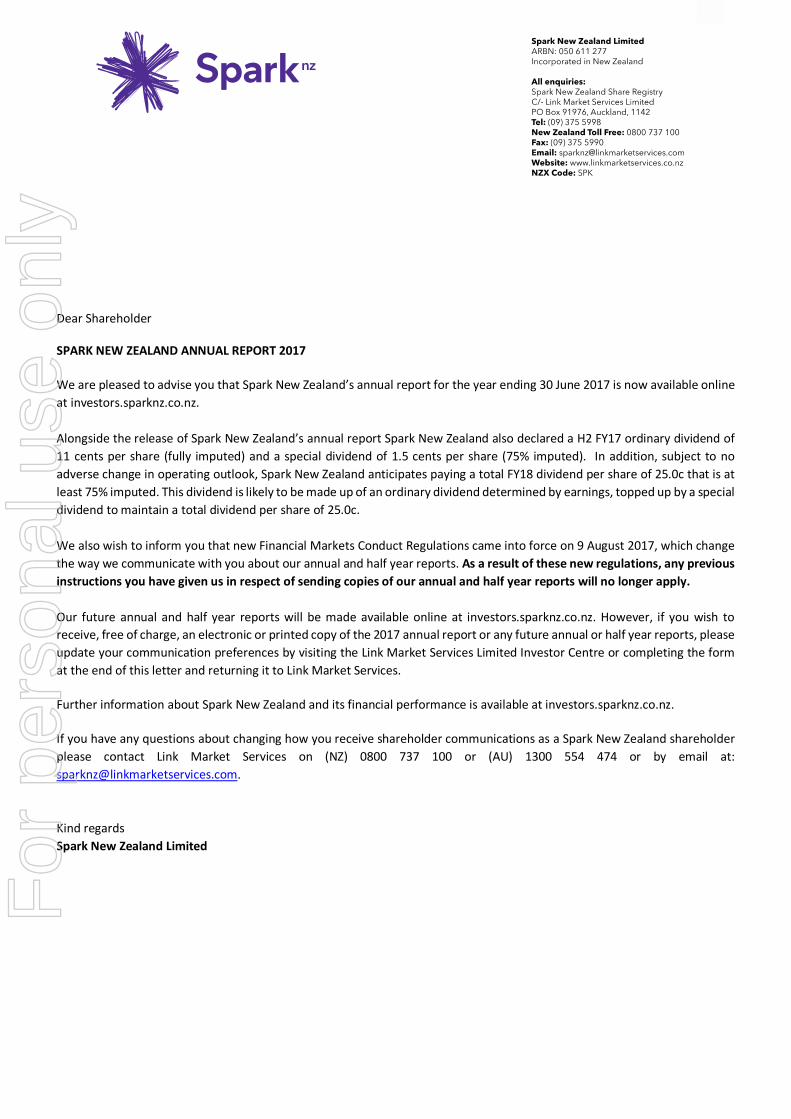
Dear Shareholder SPARK NEW ZEALAND ANNUAL REPORT 2017 We are pleased to advise you that Spark New Zealand’s annual report for the year ending 30 June 2017 is now available online at investors.sparknz.co.nz. Alongside the release of Spark New Zealand’s annual report Spark New Zealand also declared a H2 FY17 ordinary dividend of 11 cents per share (fully imputed) and a special dividend of 1.5 cents per share (75% imputed). In addition, subject to no adverse change in operating outlook, Spark New Zealand anticipates paying a total FY18 dividend per share of 25.0c that is at least 75% imputed. This dividend is likely to be made up of an ordinary dividend determined by earnings, topped up by a special dividend to maintain a total dividend per share of 25.0c. We also wish to inform you that new Financial Markets Conduct Regulations came into force on 9 August 2017, which change the way we communicate with you about our annual and half year reports. As a result of these new regulations, any previous instructions you have given us in respect of sending copies of our annual and half year reports will no longer apply. Our future annual and half year reports will be made available online at investors.sparknz.co.nz. However, if you wish to receive, free of charge, an electronic or printed copy of the 2017 annual report or any future annual or half year reports, please update your communication preferences by visiting the Link Market Services Limited Investor Centre or completing the form at the end of this letter and returning it to Link Market Services. Further information about Spark New Zealand and its financial performance is available at investors.sparknz.co.nz. If you have any questions about changing how you receive shareholder communications as a Spark New Zealand shareholder please contact Link Market Services on (NZ) 0800 737 100 or (AU) 1300 554 474 or by email at: [email protected]. Kind regards Spark New Zealand Limited F
or p
erso
nal u
se o
nly

Request for copies of reports If you wish to receive, free of charge, an electronic or printed copy of the 2017 annual report or any future annual or half year reports, please update your communication preference by visiting the Link Market Services Limited Investor Centre. Alternatively, please complete the form below and return it to Link Market Services Limited in the envelope provided, by fax to +64 9 375 5990, or by scanning and emailing it to: [email protected] (please include “Spark New Zealand Annual Report” as the subject). I/We wish to receive all Spark New Zealand shareholder communications electronically and my/our email address for this purpose is: _____________________________________________________________________________________________________ We encourage you to receive your Spark New Zealand shareholder communications electronically. This will enable you to receive important shareholder and company information faster, reduce the impact on the environment, access all documents conveniently, securely at any time and contribute to reducing the company’s costs associated with print and mail. If you request a printed copy we will send you a copy of our annual report and half year report each year until you request us not to.
I/We would like to receive a printed copy of Spark New Zealand’s annual report and half-year report (when available) each year.
Please tick only if you wish to receive a printed copy of the reports.
For
per
sona
l use
onl
y
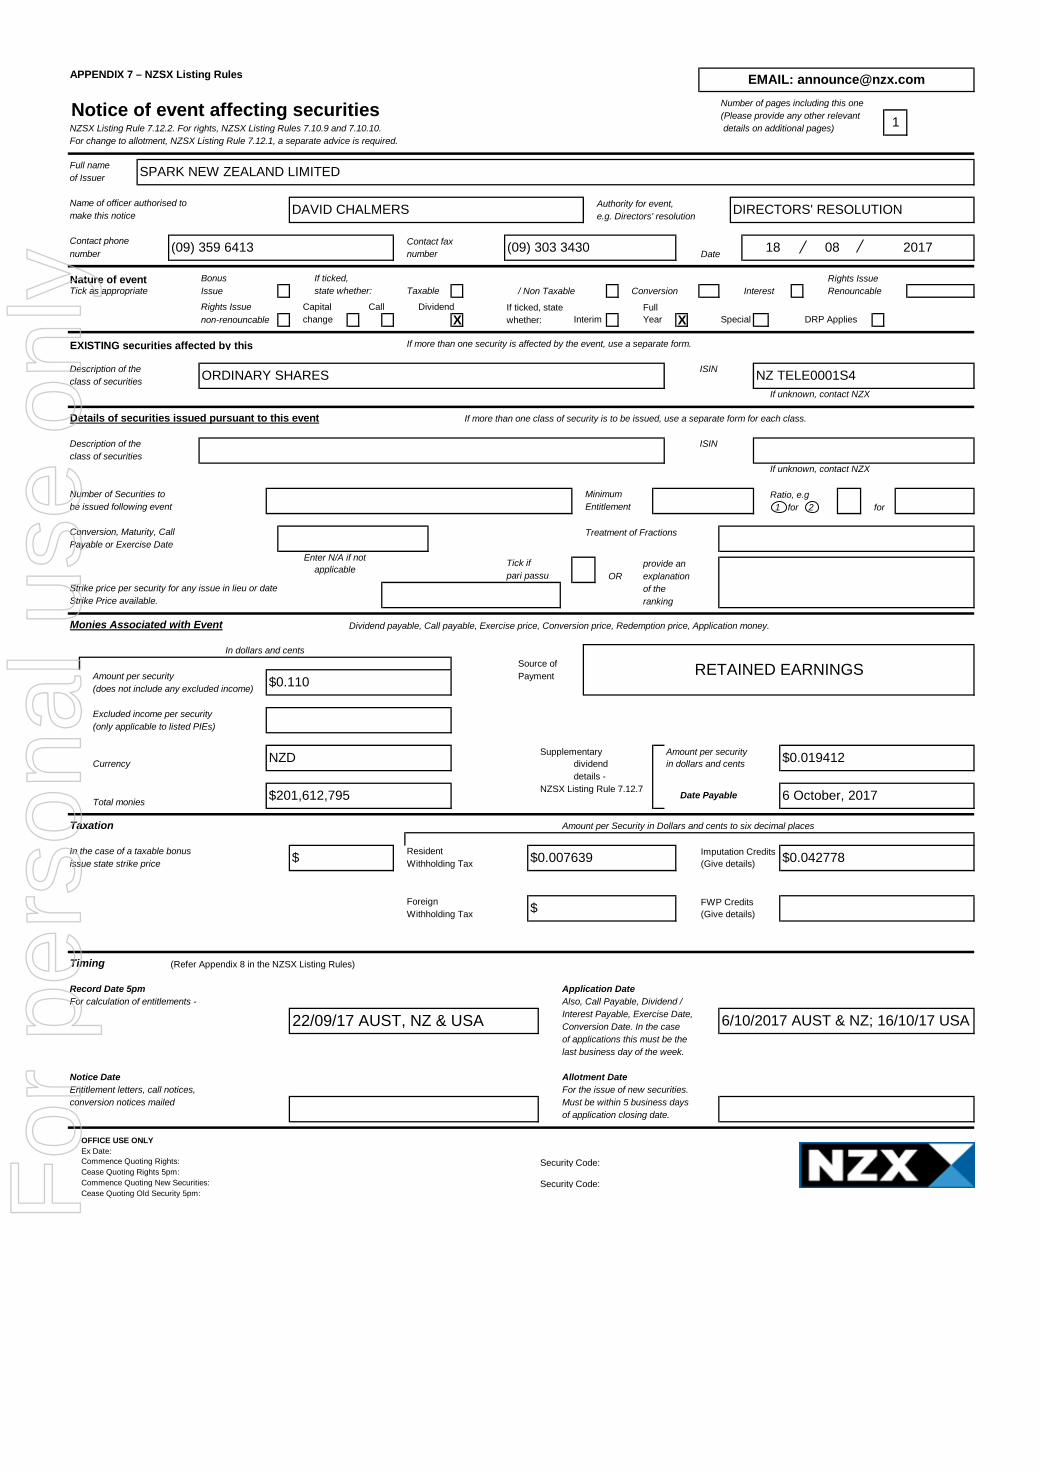
APPENDIX 7 – NZSX Listing Rules
Number of pages including this one(Please provide any other relevant
NZSX Listing Rule 7.12.2. For rights, NZSX Listing Rules 7.10.9 and 7.10.10. details on additional pages)For change to allotment, NZSX Listing Rule 7.12.1, a separate advice is required.
Full nameof Issuer
Name of officer authorised to Authority for event,make this notice e.g. Directors' resolution
Contact phone Contact faxnumber number Date
Nature of event Bonus If ticked, Rights IssueTick as appropriate Issue state whether: Taxable / Non Taxable Conversion Interest Renouncable
Rights Issue Capital Call Dividend If ticked, state Fullnon-renouncable change X whether: Interim Year X Special DRP Applies
EXISTING securities affected by this If more than one security is affected by the event, use a separate form.
Description of the ISINclass of securities
If unknown, contact NZX
Details of securities issued pursuant to this event If more than one class of security is to be issued, use a separate form for each class.
Description of the ISINclass of securities
If unknown, contact NZX
Number of Securities to Minimum Ratio, e.gbe issued following event Entitlement 1 for 2 for
Conversion, Maturity, Call Treatment of FractionsPayable or Exercise Date
Tick if provide anpari passu OR explanation
Strike price per security for any issue in lieu or date of theStrike Price available. ranking
Monies Associated with Event Dividend payable, Call payable, Exercise price, Conversion price, Redemption price, Application money.
Source ofAmount per security Payment(does not include any excluded income)
Excluded income per security(only applicable to listed PIEs)
Supplementary Amount per securityCurrency dividend in dollars and cents
details -NZSX Listing Rule 7.12.7
Total monies
Taxation Amount per Security in Dollars and cents to six decimal places
In the case of a taxable bonus Resident Imputation Creditsissue state strike price Withholding Tax (Give details)
Foreign FWP CreditsWithholding Tax (Give details)
Timing (Refer Appendix 8 in the NZSX Listing Rules)
Record Date 5pm Application DateFor calculation of entitlements - Also, Call Payable, Dividend /
Interest Payable, Exercise Date,Conversion Date. In the caseof applications this must be thelast business day of the week.
Notice Date Allotment DateEntitlement letters, call notices, For the issue of new securities.conversion notices mailed Must be within 5 business days
of application closing date.
OFFICE USE ONLYEx Date:Commence Quoting Rights: Security Code:Cease Quoting Rights 5pm:Commence Quoting New Securities: Security Code:Cease Quoting Old Security 5pm:
22/09/17 AUST, NZ & USA 6/10/2017 AUST & NZ; 16/10/17 USA
$ $0.007639 $0.042778
$
NZD $0.019412
$201,612,795 Date Payable 6 October, 2017
In dollars and cents
RETAINED EARNINGS$0.110
Enter N/A if not applicable
ORDINARY SHARES NZ TELE0001S4
(09) 359 6413 (09) 303 3430 18 08 2017
EMAIL: [email protected]
Notice of event affecting securities1
SPARK NEW ZEALAND LIMITED
DAVID CHALMERS DIRECTORS' RESOLUTION
For
per
sona
l use
onl
y

APPENDIX 7 – NZSX Listing Rules
Number of pages including this one(Please provide any other relevant
NZSX Listing Rule 7.12.2. For rights, NZSX Listing Rules 7.10.9 and 7.10.10. details on additional pages)For change to allotment, NZSX Listing Rule 7.12.1, a separate advice is required.
Full nameof Issuer
Name of officer authorised to Authority for event,make this notice e.g. Directors' resolution
Contact phone Contact faxnumber number Date
Nature of event Bonus If ticked, Rights IssueTick as appropriate Issue state whether: Taxable / Non Taxable Conversion Interest Renouncable
Rights Issue Capital Call Dividend If ticked, state Fullnon-renouncable change X whether: Interim Year Special X DRP Applies
EXISTING securities affected by this If more than one security is affected by the event, use a separate form.
Description of the ISINclass of securities
If unknown, contact NZX
Details of securities issued pursuant to this event If more than one class of security is to be issued, use a separate form for each class.
Description of the ISINclass of securities
If unknown, contact NZX
Number of Securities to Minimum Ratio, e.gbe issued following event Entitlement 1 for 2 for
Conversion, Maturity, Call Treatment of FractionsPayable or Exercise Date
Tick if provide anpari passu OR explanation
Strike price per security for any issue in lieu or date of theStrike Price available. ranking
Monies Associated with Event Dividend payable, Call payable, Exercise price, Conversion price, Redemption price, Application money.
Source ofAmount per security Payment(does not include any excluded income)
Excluded income per security(only applicable to listed PIEs)
Supplementary Amount per securityCurrency dividend in dollars and cents
details -NZSX Listing Rule 7.12.7
Total monies
Taxation Amount per Security in Dollars and cents to six decimal places
In the case of a taxable bonus Resident Imputation Creditsissue state strike price Withholding Tax (Give details)
Foreign FWP CreditsWithholding Tax (Give details)
Timing (Refer Appendix 8 in the NZSX Listing Rules)
Record Date 5pm Application DateFor calculation of entitlements - Also, Call Payable, Dividend /
Interest Payable, Exercise Date,Conversion Date. In the caseof applications this must be thelast business day of the week.
Notice Date Allotment DateEntitlement letters, call notices, For the issue of new securities.conversion notices mailed Must be within 5 business days
of application closing date.
OFFICE USE ONLYEx Date:Commence Quoting Rights: Security Code:Cease Quoting Rights 5pm:Commence Quoting New Securities: Security Code:Cease Quoting Old Security 5pm:
EMAIL: [email protected]
Notice of event affecting securities1
SPARK NEW ZEALAND LIMITED
DAVID CHALMERS DIRECTORS' RESOLUTION
(09) 359 6413 (09) 303 3430 18 08 2017
ORDINARY SHARES NZ TELE0001S4
In dollars and cents
RETAINED EARNINGS$0.015
Enter N/A if not applicable
NZD $0.001985
$27,492,654 Date Payable 6 October, 2017
22/09/17 AUST, NZ & USA 06/10/2017 AUST & NZ; 16/10/17 USA
$ $0.002019 $0.004375
$
For
per
sona
l use
onl
y


![[Spark meetup] Spark Streaming Overview](https://img.pdfslide.us/doc/110x75/55a457161a28ab057e8b45fd/spark-meetup-spark-streaming-overview.jpg)


![Spark New Zealand [PDF 573KB]](https://img.pdfslide.us/doc/110x75/58a1ab8b1a28ab5c788bf8e3/spark-new-zealand-pdf-573kb.jpg)
