Embed Size (px)
Citation preview

ONGOING GOVERNMENT FAILURES IN AIR TRANSPORTATION
Kenneth Button

This study is a publication of the Mercatus Center at George Mason University. The opinions expressed in it do not necessarily represent the opinions of the Mercatus Center or George Mason University.
Mercatus CenterGeorge Mason University3351 North Fairfax Drive, 4th FloorArlington, VA 22201-4433(703) 993-4930mercatus.org
first release, May 17, 2012
ABOUT THE MERCATUS CENTER AT GEORGE MASON UNIVERSITY
For over 25 years, the Mercatus Center at George Mason University has been the world’s premier university source for market-oriented ideas—bridging the gap between academic ideas and real-world problems. A university-based research center, Mercatus works to advance knowledge about how markets work to improve our lives by training graduate stu-dents, conducting research, and applying sound economics to offer solutions to society’s most pressing problems.
ABOUT THE AUTHOR
Kenneth Button is an Academician of the Academy of Social Sciences, Fellow of the Institution of Highways and Transportation, and Fellow of the Chartered Institute of Logistics and Transport. He is recipient of the Transportation Research Forum Distinguished Researcher Award and the Distinguished Scholarship Award, Transportation and Public Utilities Group, American Economics Association. He is currently university professor at George Mason University. His experience of policy making includes: Conseiller in the Advisory Unit to the Secretary General of the OECD and Special Advisor to the UK House of Common Transport Committee. He has been Professor of Applied Economics and Transport at Loughborough University; VSB Visiting Professor of Transport and the Environment at the Tinbergen Institute, Amsterdam. He has held visiting posts at the Universities of British Columbia, Porto, Bergamo, Ihna, Bologna, and California at Berkley. Professor Button has published some 120 books, over 400 papers in academic jour-nals. He is editor of the journals Transportation Research D: Transport and the Environment and Journal of Air Transport Management.

ABSTRACT
Reforms to the U.S. air transportation market since the late 1970s have brought about important economic improvements, including lower fares for travelers, lower freight rates for shippers, and access to a more extensive range of destinations with greater frequency and quality of service. However, the Airlines Deregulations Act of 1978 is something of a misnomer because today many economic regulations over important aspect of air transportation remain. Some have been significantly broad-ened, including subsidies for certain local markets and regulations affecting con-sumer protection, safety, security, and the environment. While recent regulatory expansions may have been motivated by perceived market imperfections, some regulations are of doubtful social value, and some seem to have caused serious harm. At the same time, much of the air transportation infrastructure, including airports and the navigation system, remain largely government owned, despite mounting evidence from other countries that there are more efficient options.
5
The enactment of the 1978 Airline Deregulation Act saw the first disman-tling of a comprehensive system of government control in the United States since 1935: the sun-setting of the Civil Aeronautics Board (CAB). It freed
interstate passenger airlines from most economic regulation of market entry and price setting. Freight carriers had been freed in 1977. The overall results have been generally lower fares, more services, and more diverse types of service. Moves to deregulate U.S. international airlines began with the initiation of Open Skies policies in 1979, but only really gained momentum in the early 1990s, again with significant consumer benefits. The large transatlantic market was largely deregulated in 2007.
Despite these changes, and the significant economic and social benefits that have come with them, there are still pockets of powerful government intervention in the air transportation sector. Some of these relate to the nature and growth of what is often generically called social regulation and pertains to such things as the environ-ment, safety, security, consumer protection, and the provision of social services. These are not, however, the main concern here, although some comments will be made with a particular focus on issues of consumer protection, the environment, and security in terms of their implications for the airline industry’s performance.1 There are also generic economic regulations governing things such as minimum wages and working age that extend across the entire American economy; these non-specific interventions are not reviewed here.
Our concern is thus with situations where the involvement of government through the use of regulation and public ownership stymies the full potential ben-efits air transportation can generate. We focus primarily on a number of areas where direct economic regulation still exists and is detrimental to the efficient workings of the air transportation sector.2 For example, competition within the U.S. airline
1. Suboptimal social regulation can, however, impact the economic performance of the air transportation sector. For example, excessive safety regulations have implications through the costs they impose, both for the scale of overall sectors and, because the incidents of these costs will not be spread evenly, for spe-cific types of air service.2. Discussion of regulatory policy is often divided between economic (or “quantity” in Europe) regula-tions aimed at confronting inefficiency that can arise when there is potential monopoly power, predatory pricing, empty core problems, and public goods; and social (“quality” in Europe) regulations when there

MERC ATUS CENTER AT GEORGE M A SON UNIVER SIT Y
6
market, so-called cabotage, is confined to that between national carriers, limiting the potentially beneficial effects of more efficient foreign carriers entering the mar-ket. Restrictions on the ownership of U.S. airlines also prevent the potential gains from free factor mobility—in this case, foreign capital being injected into U.S. carri-ers—from being realized.
In addition to the residual economic regulation of airlines, there are government failures in the provision of aviation infrastructure. All the major airports in the United States, save one, are municipal entities or are owned by quasi-public bod-ies like the New York Port Authority. They are not run on a commercial basis and are not subject to the full rigors of the market. Air navigation services that provide air traffic control come under the auspices of the state-controlled Federal Aviation Administration (FAA), financed through taxation rather than user fees. Basically, the prices charged by the infrastructure providers have little to do with market prin-ciples, and the largely political mechanisms for financing infrastucture are almost arbitrary, often depending on the outcome of pork-barrel decision-making.
The aim of this work is not to collect a vast amount of new data, but to focus on the nature of some remaining distortions in the provision of air transportation services in the United States and to offer some very general quantification for what this may mean, appreciating that, by definition, the free-market counterfactual cannot be accurately determined. Also, international experiences can be drawn upon to high-light what has happened elsewhere. We make no attempt here to place hard figures on the costs of the distortions that exist: by definition, we have no real idea of what the market outcomes would be. If we did, we could simply regulate for them. Where possible, we offer some quantification of orders of magnitude.
A BRIEF OVERVIEW OF DEREGULATION
The studies of the impacts of the 1977 and 1978 acts in the United States are numer-ous, as are those of similar measures enacted in other countries. This is not the place to review them in detail. There are many good reviews available, but some facts are offered as an aide-mémoire.3
are issues of externalities and the distribution of economic rents. These do not entirely overlap with more traditional ideas of normative and positive approaches to regulation. The focus in this paper is primarily on economic regulation.3. Early positive assessments of deregulation can be found in Steven Morrison and Clifford Winston, The Economic Effects of Airline Deregulation (Washington, DC: The Brookings Institution, 1986); Severin Borenstein, “The Evolution of U.S. Airline Competition,” Journal of Economic Perspectives 6 (1992): 45–73; and Airline Deregulation: The Early Experience, ed. John R. Meyer and Clinton V. Oster (Boston: Auburn House, 1981). Good, Röller, and Sickles compare the efficiency of U.S. airlines in a deregulated market with European airlines in a regulated environment. See David H. Good, Lars-Hendrik Röller, and Robin C. Sickles, “Airline Efficiency Differences between Europe and the U.S.: Implications for the Pace of EC Integration and Domestic Regulation,” European Journal of Operations Research 80 (1995): 508–18.

MERC ATUS CENTER AT GEORGE M A SON UNIVER SIT Y
7
The situation before 1977–1978 saw the economic oversight of the American air-line industry in the hands of the CAB. The CAB issued interstate licenses to airlines on a route-by-route basis, with new entrants having to demonstrate a commercial need for their services. Inevitably, there was little direct competition on existing routes, in part because of the natural advantage incumbents enjoyed over informa-tion, but also because of the fare-setting regime in place. There was a single coach fare and a single business class fare for a service established by the CAB, based on rate-of-return calculations. Namely, these were costs incurred plus a “normal rate of return.” This provided limited incentive for cost minimization and made it dif-ficult for potential new entrants to demonstrate the commercial viability of their services except on the cost side. The allocation of licenses on a route-by-route basis meant suboptimal networks and very little competition to direct services from one-stop services with airlines moving passengers through hubs. The regulatory reforms removed these types of restrictions by phasing out the CAB by 1984.4
The adoption of a “big bang” approach, with all domestic interstate markets hav-ing price and entry control removed over a very short period, is in contrast to the phased reforms found in the European Union (EU), and was in part intended to minimize any political gaming by airlines that may have occurred with a longer phasing-in period.5 This was possible because the United States is a single federal entity, whereas the EU comprises numerous nation states where politics dictates a more gradualist approach.6
What emerges from the vast majority of the studies of regulatory reform, not only in the United States but also more generally, is that users of air services, both pas-sengers and freight consignors, have, on average, benefited considerably. Although counterfactuals are inevitably difficult to specify, and become more so as time passes, Steven Morrison and Clifford Winston provide widely accepted estimates
For a less positive view of the impacts of deregulation, see Paul S. Dempsey, Flying Blind: The Failure of Airline Deregulation (Washington, DC: Economic Policy Institute, 1990). Dempsey argues that there were already downward trends in fares before 1978, and that subsequent studies simply took existing CAB fare-setting parameters as their basis for comparison rather than acknowledging that the fare’s for-mula was regularly updated.4. This very brief description of the policies of the CAB is something of a straw man. There were, for instance, some de facto relaxations of fare controls before 1977, but this description nevertheless gives a reasonable picture of the situation. For more details, see Elizabeth E. Bailey, David R. Graham, and Daniel R. Kaplan, Deregulating the Airlines (Cambridge, MA: MIT Press, 1985).5. See Kenneth Button and Kirk Johnson, “Incremental versus Trend-Break Change in Airline Regulation,” Transportation Journal 37 (1998): 25–34. The pressures to reform airline regulation and to do it quickly were not entirely generated by concern about strict economic efficiency. The late 1970s saw a period of stagflation with unemployment at 7.5 percent in 1977 and inflation at 5.8 percent and both rising. Deregulation was part of a general move to combat what was seen as cost-push inflation, and extended to other sectors with the advent of Reaganomics in the 1980s.6. Kenneth Button, Wings Across Europe: Toward an Efficient European Air Transport System (Burlington, VT: Ashgate, 2004).
MERC ATUS CENTER AT GEORGE M A SON UNIVER SIT Y
8
for the United States that the welfare gains to travelers amount to $12.4 billion annu-ally (in 1993 prices), with business travelers being the greatest beneficiaries.7 Put another way, 58 percent of the decline in airfares between 1976 and 1993 can be attributed to deregulation; the rest is attributed to ongoing technological improve-ments such as more fuel-efficient engines and enhanced air traffic control. The use of aircraft (the metal) has increased, with passenger-load factors rising from between 50 and 55 percent in the early 1970s to levels often exceeding 80 percent in the 2000s.
Although many of the changes associated with deregulation were foreseen, in part because low-cost carriers were already providing intrastate services in places like Texas and California, giving guidance to some of the underlying characteristics of a freer market, others were not. That economies of scope and density existed in airline markets was implicitly recognized, and carriers such as Delta had sought to develop limited hub-and-spoke operations under the old regulatory structure to exploit them. This trend accelerated after deregulation and has continued with mergers and takeovers, the latest of which have been between Delta and Northwest (in 2008), United and Continental (in 2011), and Southwest and Air Tran (in 2011). It was also largely forseen that competition would lead to more low-cost carriage, but the speed and extent of the growth of low-cost carriers was largely unexpected, even by Alfred Kahn who chaired the CAB.8
That there would be something of an overall J-curve effect, with short-term adjustment costs being incurred before benefits emerged, was also generally pre-dicted, although its exact form, and who the ultimate winners and losers would be, generally was not. The degree of managerial inventiveness unleashed by deregula-tion in both the freight and passenger airline business was largely neglected in ex ante studies by Kahn and others; this was not surprising, perhaps, because there were no real incentives for innovation before 1977. The legacy passenger carriers already in the market very rapidly introduced frequent-flier programs, developed computer reservation systems, combined in various forms of alliances to provide seamless services, deployed yield management pricing, and, in some cases, intro-duced two-tier pay structures for employees to keep down the costs of new hires. Subsequently, this has led to developing sophisticated international strategic alli-ances, unbundling the services that they offer, and expanding their frequent-flier programs into a wider commodity-based product.9
7. Steven Morrison and Clifford Winston, The Evolution of the Airline Industry (Washington, DC: Brookings Institution, 1995).8. Alfred Kahn, “Surprises of Airline Deregulation,” American Economic Review, Papers, and Proceedings 78 (1988): 316–22.9. Michael Levine offers a review of the major changes from a legal and industrial economics perspec-tive: Michael E. Levine, “Airline Competition in Deregulated Markets: Theory, Firm Strategy, and Public Policy,” Yale Journal on Regulation 4 (1987): 393–494. The effects of liberalization in most other major

MERC ATUS CENTER AT GEORGE M A SON UNIVER SIT Y
9
Although the passenger sector has received the most attention, air cargo services morphed from being a marginal form of freight transportation to being a major car-rier of perishable and high-value goods over medium and long distances and over physically challenging terrain. According to the United Nation’s International Civil Aviation Organization, about 35 percent of global trade in cargo by value now goes by air. Innovations that U.S.—and, increasingly, international—deregulation have fostered are often similar to those seen in passenger transportation: yield manage-ment of rates, hub-and-spoke services, computerized booking and tracking systems, and alliances. In addition to this, and helped by regulatory reforms of the rail and trucking industries, consolidated carriers that provide multimodal, door-to-door freight services have grown. The removal of restrictions on the routes operated by all-cargo airlines in 1977, for example, enabled FedEx to purchase large aircraft, and, in 1980 alone, it added 90 cities to its network.
The outcome of the 1970s reforms has been a much more competitive environ-ment for U.S. airlines, initially domestically but increasingly internationally. The result has also been an industry, domestically and in most other markets, that has difficulty earning a significant return. Figure 1 provides details on the U.S. domestic, European, and global markets. Operating margins have been volatile, largely in sync with the business cycle, but overall they have been about zero.10 This compares with operating margins for U.S. industry as a whole of about 5.6 percent over the period illustrated. As a consequence, many carriers have entered or left the market over time, leading to a degree of instability. This inevitably adds to insecurity about the reliability of local air services for regular users of air transportation, and for those making decisions about where to build homes and industries.
airline markets in the 1990s, although differing in detail, have largely been the same. See Kenneth Button and Roger Stough, Air Transport Networks: Theory and Policy Implications (Northampton, MA: Edward Elgar Publishing, 2000).10. Numerous explanations have been put forward for this; many of them, however, tend to be short-term explanations related to the context of the time. Kenneth Button, “The Economics of Cost Recovery in Transport,” Journal of Transport Economics and Policy 39 (2005): 241–57, however, posited that there is an “empty core” problem, whereby in a highly competitive environment, airlines have the fixed and com-mitted cost to provide a scheduled air service at a future date, but competitors will emerge before takeoff and compete fares down to marginal cost. Actions like the introduction of frequent-flier programs and business lounges are aimed at taking the edge off this competition. Borenstein offers a somewhat differ-ent perspective, arguing that the traditional carriers have found it more difficult to cope with supply and demand shocks since 2000 than low-cost carriers such as Southwest Airlines, and that the fare premiums they previously enjoyed had been eroded. See Severin Borenstein, “Why Can’t Airlines Make Money?,” American Economic Review, Papers, and Proceedings 101 (2011): 233–37.

MERC ATUS CENTER AT GEORGE M A SON UNIVER SIT Y
10
FIGURE 1. AIRLINE OPERATING MARGINS: GLOBAL, EUROPEAN, AND UNITED STATES
Sources: Boeing Commercial Airplane, Association of European Airlines, Air Transport Association of America, and International Air Transport Association.
Notes: (i) The lack of a bar indicates a missing observation and not a zero operating margin. (ii) Memberships of the various reporting bodies vary over time, and thus the reported margins reflect the associated carriers at the time of reporting. This means that losses are underestimated because bankrupt airlines leave their respective data pools, carrying with them an infinite negative return.
Despite the poor financial record, however, airline services have expanded for a number of reasons. First, while the industry has suffered from low returns, indi-vidual airlines have not: Southwest is an example in the United States and Ryanair in Europe. As in any competitive market, there are risks for investors—some win and others lose; that is the key element in Schumpeter’s notion of “creative destruc-tion”—but the potential of making a significant return from investing in a successful airline pulls in investment. Additionally, airlines are at the end of one of Michael
-14
-12
-10
-8
-6
-4
-2
0
2
4
6
8
Europe United States Global
1988
1989
1990
1991
1992
1993
1994
1995
1996
1997
1998
1999
2000
2001
2002
2003
2004
2005
2006
2007
2008

MERC ATUS CENTER AT GEORGE M A SON UNIVER SIT Y
11
Porter’s value chains: the air transportation chain.11 Given the overall profits in this chain, those further up, such as aircraft frame and engine builders, will invest in airlines in some way to sell their products. Airlines, in this context, can be seen as the cash register that allows these other actors to profit. There is also an indefinable appeal in air transportation, often hidden away in the economist’s notion of taste, that attracts what many may see as irrational behavior.12 These factors, coupled with such American institutional foibles as the Chapter 11 bankruptcy law that allows a company to restructure while shedding burdens of debt and previous contractual commitments, have seen the airline industry continue to expand without any need for explicit government protection.13
Despite these apparent problems, the market, albeit with the uncertainty and lack of apparent order that generally goes with competition, has allowed airline consumers to benefit from lower fares14 and freight rates and to gain access to a more extensive range of destinations with greater frequency and quality of ser-vice. Directly, this has led to increased benefits for the vast majority of passengers. Indirectly, through lower freight rates, this has led to lower final costs of production for many goods and services.
Where some concern has been expressed about the impact of deregulation, it has often had more to do with the distribution of benefits, and in particular with the higher fares that appear to be levied for services, than the fact that on average fares fell with deregulation. Of course, given different conditions of supply and demand in myriad airline markets, one would anticipate variations in fares and service lev-els. But the concern is particularly about the possible monopoly exploitation by dominant carriers at hubs. A number of official studies a decade or more after the enactment of the 1978 legislation found fares to be significantly higher at major
11. Michael E. Porter, Competitive Advantage: Creating and Sustaining Superior Performance (New York: Free Press, 1985).12. As Warren Buffet, who lost about $300 million in 1995 prices investing in U.S. Airways, put it, “I have an 800 number now that I call if I get the urge to buy an airline stock. I call at two in the morning and I say: ‘My name is Warren and I’m an aeroholic.’ And then they talk me down.” Quoted in “Buffet: ‘My Elephant Gun is Loaded,’” Sunday Telegraph, September 22, 2002.13. The bankruptcy of American Airlines in 2011 means that all the major carriers, except Southwest, have been through the Chapter 11 process at least once. For a discussion of the impact of bankruptcies on airline services, see Severin Borenstein and Nancy L. Rose, “The Impact of Bankruptcy on Airline Service Levels,” American Economic Review, Papers, and Proceedings 93 (2003): 415–19.14. For example, before deregulation, most services only offered coach and first-class fares. By 1984, 96 percent of the top 50 airline markets and 90 percent of the top 100 carriers were offering discount fares with average discounts of 61 percent and 63 percent, respectively. See John R. Meyer and Clinton V. Oster Jr., with Marni Clippinger, Andrew McKey, Don H. Pickrell, John Strong, and C. Kurt Zorn, Deregulation and the New Airline Entrepreneurs (Cambridge, MA: MIT Press, 1984); or John R. Meyer and Clinton V. Oster,Jr., with John S. Strong, Jose A. Gomez-Ibanez, Don H. Pickrell, Marni Clippinger, and Ivor P. Morgan, Deregulation and the Future of Intercity Passenger Travel (Cambridge, MA: MIT Press, 1987).

MERC ATUS CENTER AT GEORGE M A SON UNIVER SIT Y
12
hubs: the U.S. General Accounting Office found them to be 88 percent higher than the national average.15 Academic studies by Morrison and Winston, William Evans and Ionnais Kessides, and others nuanced the early findings about hub premiums by looking at, for example, the implications of the average distance of flights, the proportion of connecting services, and the preponderance of frequent-flier tickets.16
More recently, the work of Darin Lee and Maria Jose Luengo-Prado focused on the composition of travelers and found that much of the difference between fares for going to and from hubs as opposed to traveling elsewhere in the system can be attributed to the business-leisure traffic mix.17 One may speculate why this is so; perhaps airlines are attracted to hubs in cities with solid business-traveler markets, or their presence may attract more business travelers, but if allowance is made for the type of traveler, premiums seem to have been overstated.18 More recently, the growth of low-cost carriers in the United States and the emergence of “hub busting” direct services, together with the near ubiquitous online availability of information about alternative flight and fare combinations, have reduced the ability of hub car-riers to exploit any monopoly power they may have had.19
Clearly, regulations are needed to ensure that the maximum practical benefits of market forces are realized; without them is anarchy. Nobel Laureate Ronald Coase made this point when discussing the immediate aftermath of the decline of the Soviet Union.20 At that time, institutions to secure property rights were absent, and the fabric of society virtually collapsed for a period. At issue is whether the cur-rent institutional structure tackles genuine market imperfections or merely exists because of inertia, because of misinformation, or because the system has been cap-tured by suppliers and bureaucrats while disregarding social welfare. Within the Anglo-Saxon economic philosophy that has underwritten the development of the U.S. economy, the onus of proof should always be that regulation should be used
15. U.S. General Accounting Office, “Airline Deregulation: Changes in Airfares, Service Quality and Barriers to Entry,” GAO/RCED 99-92, Washington, DC, 1999.16. Steven Morrison and Clifford Winston, “The Remaining Role of Government Policy in the Deregulated Airline Industry,” in Deregulation of Network Industries: What’s Next?, ed. Clifford Winston and Sam Peltzman (Washington, DC: AEI-Brookings Joint Center for Regulatory Studies, 2000), 1–40; William Evans and Ionnais Kessides, “Localized Market Power in the U.S. Airline Industry,” Review of Economics and Statistics 75 (1993): 66–75.17. Darin Lee and Maria Jose Luengo-Prado, “The Impact of Passenger Mix on the Reported ‘Hub Premiums’ in the U.S. Airline Industry,” Southern Economic Journal 72 (2005): 372–94.18. Causal analysis of U.S. cities with and without hub airports offers tentative evidence that the size of an airport has a positive effect on developing business travel. See Kenneth Button, S. Lall, Roger Slough, and M. Trice, “High-Technology Employment and Hub Airports,” Journal of Air Transport Management 5 (1999): 53–9.19. For details on the early impact Southwest had on airfares, see Steven Morrison, “Actual, Adjacent, and Potential Competition: Estimating the Full Effect of Southwest Airlines,” Journal of Transport Economics and Policy 35 (2001): 239–56.20. Ronald H. Coase, “The Institutional Structure of Production,” American Economic Review 82 (1992): 713–19.

MERC ATUS CENTER AT GEORGE M A SON UNIVER SIT Y
13
only when shown superior to a malfunctioning market. The fact that a market may not be perfect is itself insufficient reason for regulation; the regulations must pro-vide a better situation. If not, there is a government-intervention failure.
Some economic regulations remain in the airline industry. Some are of doubtful social value and some seem to be of serious harm. Are significant government fail-ures overriding any perceived market failures that these regulations are meant to be ameliorating?21 We address this issue, but we begin with some recent reregulation acts.
REGULATING THE ATTRIBUTES OF SERVICES
No markets are perfect in the economic sense, and the results of the 1978 legisla-tion have produced a number of perceived problems. As a result, a number of explicit regulations have been initiated since the demise of the CAB that have affected the nature of the airline industry. Three have attracted particular attention for being designed to handle market imperfections that are said to have emerged in the past decade. The issue in these cases is not so much that the market may not be work-ing perfectly—we know that—but whether the introduction of new regulations has resulted in government intervention failures that are producing greater distortions than would exist were things left to the forces of supply and demand.
Flight Delays
Since June 2003, the major airlines have had to report delays exceeding 15 minutes involving nonstop domestic scheduled-service flights to and from 29 U.S. airports to the Department of Transportation’s (DOT) Bureau of Transportation Statistics. They must specify whether the cause was (a) within the air carrier’s control, (b) because of extreme weather, (c) due to the national aviation system, (d) because of late-arriving aircraft, or (e) due to security matters. These data cover delays in departure and arrival times.22 To give some context, the reported delays attributed to factors within the airlines’ control amounted to 3.97 percentage points for the 14.7 percent of flights that were delayed in November 2011, compared with 4.90 percentage points attributable to the national aviation system.
Although there are often sound economic reasons for transparency in markets, the private sector has become adept at providing this, given the widespread use of modern communications. The emergence of websites such as Kayak, Expedia,
21. Clifford Winston, “Government Failure versus Market Failure: Microeconomic Policy Research and Government Performance,” Brookings Institution, 2006.22. Airlines have reported on-time performance to the U.S. DOT since 1987. Reporting was modified in 1995 to include the reporting of mechanical delays, which had not been included in the original rule. Current data are available at Aviation Consumer Protection and Enforcement, U.S. DOT, “Air Travel Consumer Report,” http://airconsumer.ost.dot.gov/reports/index.htm.

MERC ATUS CENTER AT GEORGE M A SON UNIVER SIT Y
14
Priceline, and others that offer fare and service options across a range of airline services exemplify this fact. In the particular context of delays, data scraping of information provided on airport or airline websites is simple. This could be done commercially should potential airline users wish to know about delays. In addition, the data provided may ultimately be expensive for passengers because of the reac-tion of airlines. Carriers have a tendency to “pad” schedules so delays appear less frequently to passengers, but this adds costs to the provision of services. There is also evidence that airlines have an increased proclivity to cancel flights rather than record delays or be fined for long delays on the tarmac.23 Both of these actions add to the costs of providing airline services and, ultimately, to airfares. When belly-hold cargo is incidentally concerned, it also adds to freight costs.
Furthermore, the types of information provided may not be of great use. For most travelers, delays in takeoff are not relevant. Only delays at arrival have any real sig-nificance. Indeed, a late departure may be beneficial if a passenger is delayed reach-ing the airport. Even information provided on the incidence of late arrivals might be of limited use, because it only relates to the time of arrival at the gate and not to the time passengers clear the airport. Greater reliability in getting off the plane is of limited use if there are extended delays in collecting checked baggage or, in the case of international flights, in clearing immigration and customs. If some members of the public were interested in flight delays at airports, then a company tapping into airline or airport flight information could collate this and sell it commercially. Potential passengers’ interest in the information would then pay for it with no bur-den on others; after all, this is the era of the app.
Tarmac Delays
Because of a small number of high-profile incidents, most notably that of Valentine’s Day 2007, when snow and ice in the northeast led to JetBlue Airways’ stranding hundreds of passengers in 10 planes on the tarmac at New York’s John F. Kennedy International Airport for up to 10.5 hours, laws have been introduced with the intent of reducing tarmac delays. Since April 2010, the federal government has been able to impose fines on airlines that have held passengers in planes for what is deemed an unacceptable amount of time: three hours for domestic flights and four for international.24 Onboard refreshments are required after a two-hour delay. The first enforcement of this, in November 2011, was on American Eagle, a subsidiary of American Airlines that kept 608 passengers on 15 flights grounded at Chicago
23. U.S. Government Accountability Office, “Airline Passenger Protections: More Data and Analysis Needed to Understand Effects of Flight Delays,” GAO-07-793T, Washington, DC, 2011.24. There is no precise definition for when a fine should be imposed. Basically, the U.S. DOT reviews each case separately. Furthermore, the cost of the fine, $27,000, is not set out in the regulation.

MERC ATUS CENTER AT GEORGE M A SON UNIVER SIT Y
15
O’Hare Airport for more than three hours in May 2011.25 Overall, tarmac delays of more than three hours fell in the first year of the law from 693 in the preceding 12 months to 20. Eleven were deemed due to unavoidable circumstances, four warn-ings were issued, one fine was imposed, and, at the time of writing, four are still under investigation.
The cases of extended tarmac waits have always been rare (some 6,740 between 2004 and 2010), involving less than 0.1 percent of flights and generally at times of taxiing-out rather than taxiing-in, although the latter has often attracted attention because a significant number of planes are sometimes involved at once. The vast majority of delays, about 83 percent, did not exceed four hours. The situation has also been improving. Incidents involving three-hour delays or more peaked in 2007 and then fell well before legislation was introduced. At least in part, the improve-ment resulted from travelers’ complaints, which led to voluntary action by airlines and the introduction of new technology at airports. This played a role in improve-ment before any actions on the part of the authorities after 2007.
The difficulty with the regulations is that they are aimed at tackling rare events—events that the airlines themselves have a commercial incentive to avoid. It costs airlines money to have crew and planes effectively idle, it has knock-on effects throughout the network of services offered by airlines, and it attracts adverse pub-licity. Generally, these events are clustered around severe weather conditions, either at the airport where the delays occur or because traffic has been diverted to a small airport—one unable to handle the unexpectedly large flow of passengers, often requiring customs and immigration facilities—because of bad weather at the intended destination.
The economic response of airlines has been to hold back flights at the gate or to cancel them. According to the U.S. Bureau of Transportation Statistics database, canceled flights rose from 1.26 percent to 2.01 percent between 2009 and 2011, with the number canceled after sitting on the runway for between two and three hours rising from 6.19 percent to 17.34 percent over a similar period. The new regulations correlated with more planes returning to the gate after one hour, because airlines have sought to maintain the integrity of their schedules as a preemptive action. From the passengers’ perspective, canceled flights mean time spent rebooking and waiting for the next available flight. But even for passengers delayed at the gate or brought back to the gate to await a late departure, these actions can result in longer delays because planes are not in position on the tarmac to move to take off. As a result of the legislation, there have been fewer recorded tarmac delays, but this does not indicate any consumer gains. Instead, consumers have seen more gate delays, canceled flights, and longer takeoff delays because planes are out of position when slots become available.
25. GAO, “Airline Passenger Protections.”
MERC ATUS CENTER AT GEORGE M A SON UNIVER SIT Y
16
Ticketing Information
The ultimate price a passenger pays for a ticket embodies a number of elements; some are the direct responsibility of airlines whereas others, such as local and gov-ernment taxes, are de facto passed-on costs. The consumer protection concern is that airlines have not been transparent about the final cost of a ticket, but have focused their advertising on their costs. The issue has become more controversial in recent years as airlines have unbundled the services they offer, with separate fees for checked bag, meals, early boarding, and so on. In 2012, it became law that the full costs of tickets had to be shown in airline marketing material, along with details of some about the many add-on services, including payments for checked bags.
A secondary motivation for the government acting on fees for optional services is that they are diluting tax revenue flows used to fund the FAA, since the Internal Revenue Service determined that many fees are not related to “transportation of person” and thus are not subject to the excise tax. The airlines not only gained at least $3 billion from such fees in 2009 (albeit at possibly lower base fares), but they also probably added traffic because overall fares fell with the lower taxes paid.26 Although this adds impetus to the arguments introduced later about funding air transportation infrastructure in the United States, the debate also raises questions about appropriate marginal cost pricing of passengers, cross subsidization, and taxation policy that have not been resolved by changes in rulemaking.
THE ISSUE OF SUBSIDIES
Compared with the airline industries in many countries, the U.S. airline industry has never received large sums in direct subsidies from the federal government. The industry, however, has been subsidized in a number of indirect ways. Early mail services were subsidized to some extent, and there have been a variety of indirect subsidies, for example, for aircraft development. The traditional mechanism for manipulating the market to meet nonmarket objectives was through the CAB, which granted monopoly rights to carriers on routes with a degree of cross-subsidization built into the process. The 1978 Airline Deregulation Act effectively ended that practice. There are now a number of mechanisms by which the federal government directly subsidizes airlines, though; some are a result of the 1978 legislation.27
26. The airlines have also enjoyed cost savings resulting from passengers traveling with less weight, thus reducing fuel burn, and with fewer checked items, which have reduced handling costs. Travelers without any checked bags have gained from not having to cross-subsidize the costs of carrying the “free” bags of others. For more discussion of these issues, see GAO, “Commercial Aviation: Consumers Could Benefit from Better Information about Airline-Imposed Fees and Refundability of Government-Imposed Taxes and Fees,” GAO-10-785, Washington, DC, 2010.27. There was a one-time payout in 2001 of $5 billion in grants and $10 billion in loan guarantees to air-lines following the attacks on New York City and Arlington, VA. These were basically seen as compen-sation for the closure of air space following the attacks; the argument was that the government had an

MERC ATUS CENTER AT GEORGE M A SON UNIVER SIT Y
17
Essential Air Services
The Essential Air Services (EAS) program was established under a 1978 amend-ment to the 1958 Federal Aviation Act and provides for the U.S. DOT to subsidize airlines to serve rural communities across the country that it deems would other-wise not receive any scheduled air service. As of June 1, 2009, 152 communities were being served because of a subsidy. Of these, 45 were in Alaska, whose guidelines for service are separate and distinct from those of the rest of the country. The Surface and Air Transportation Program Extension Act of 2011 includes about $190 million in funding for the EAS program through 2015. The decision as to what degree of subsidized service a community requires is made based on identifying a specific medium or large hub for the community. This determines the number of trips, seats, and the type of aircraft necessary to reach that hub.
Critics point out that some subsidized airports are less than an hour’s drive from an unsubsidized airport, and they question the economic efficiency of the service.
According to an October 6, 2006, New York Times article on the program, the subsidy per passenger, averaged across the entire program excluding Alaska, was approxi-mately $74 and much higher on some particularly poorly patronized flights.28 In some cases, subsidies were as high as $801 per passenger. As a U.S. Government Accountability Office (GAO) study has shown, patronage in many locations is very low; for example, in 2006, Brooking, South Dakora, had a subsidy of $677 per pas-senger, and Lewistown, Montana, had a subsidy of $473. In both cases, there were fewer than three passengers a day. At that time, 17 subsidized airports had fewer than five passengers a day. Not surprisingly, however, the program is politically popular in the cities receiving the subsidized flights.29
The GAO has argued that revising the EAS program and reexamining the need for air service across the country could increase program efficiency and reduce costs.30 In fiscal year 2009, Congress appropriated $136.2 million for the EAS program, and in 2010, the amount increased to $200 million. Costs could continue to increase for a number of reasons. For example, some eligible communities may lose existing unsubsidized air service if the commercial airline market does not recover rapidly from the “Great Recession” that began in 2007.
Eligibility criteria set in 1978 are now dated and not well targeted; they are set
implicit contract with the airlines to provide air traffic control and so forth. We do not go into detail about this payout, but do note that $20 million was received by bankrupt airlines like Vanguard, Midway, and Reliant and $165 million went to package-delivery companies. Another $5 million went to helicop-ter companies that, among other things, ferry workers to oil rigs and run tours to the Grand Canyon. The money was also given at a time when the airlines were already moving into a trough in their business cycle, and it may well have discouraged carriers like U.S. Airways from restructuring. 28. Jeff Bailey, “Subsidies Keep Airlines Flying to Small Towns,” New York Times, October 6, 2006. 29. GAO, “Commercial Aviation: Programs and Options for Providing Air Service to Small Communities,” GAO-11-733, Washington, DC, 2007.30. Ibid.

MERC ATUS CENTER AT GEORGE M A SON UNIVER SIT Y
18
and largely based on communities that had or could have scheduled air service at that time. Communities have been added and removed from EAS funding, but the approach to determining EAS eligibility has remained the same and affects the cost of the program. For example, EAS currently uses distance to medium- and large-hub airports as a basis for eligibility. If the criteria also considered the distance to small-hub airports and used a 125-mile distance instead of the current 70 miles, fewer communities would be eligible for EAS, but the loss of access to the national air sys-tem would be small. In addition, because communities located near each other are eligible for EAS flights, in some regions federal subsidies are paid to air carriers at a number of nearby airfields when a single subsidy involving just one airport could provide adequate air service. In 2002, 21 EAS-subsidized communities were located within 70 highway miles of at least one other subsidized airport. Communities and states have been reticent to select one regional airport to serve the needs of a greater region; for political reasons, they do not want to give up any services for which they are eligible.
The program has operating requirements that are inefficient and increase costs. For example, legislation mandates that airlines use larger aircraft when smaller, less expensive hardware could meet passenger demand. In addition, the program requires a certain number of flights, regardless of passenger demand, with flights operating with aircraft that are largely empty; as we have seen, some EAS airports operate with fewer than five passengers per day. In fiscal year 2008, 37 percent of the available seats on EAS flights were filled by passengers.
Alternative transportation options could be more cost effective. Some commu-nities have not been able to generate sufficient demand to justify costly air service, resulting in rising per-passenger subsidies. Because potentially cost-effective alter-natives, such as bus service to other airports, are not used, subsidies may be higher than necessary to link these communities to the nation’s transportation network. Additionally, some communities have considered it important enough to ensure that local air services are maintained that local businesses have voluntarily combined to guarantee sufficient ticket sales to make services commercially viable.31
The recognition of some of these issues has led to reforms embodied in the 2012 FAA Air Transportation Modernization and Safety Improvement Act that limit air service subsidies to the 150 or so communities that already receive subsidized ser-vice. It also trims about a dozen communities from the program after a year if they are within 175 miles of a hub airport and average fewer than 10 passengers a day. This saves about $20 million a year.32
31. James Nolan, Pamela Ritchie, and John Rowcroft, “Small Market Air Service and Regional Policy,” Journal of Transport Economics and Policy 39 (2005): 363–78.32. Simple arithmetic indicates that these latter services are currently costing about $460 per passenger in subsidies, assuming that the threshold of 10 passengers a day is actually being reached. The program requires that subsidies do not exceed $200 per person unless the community involved is more than 210

MERC ATUS CENTER AT GEORGE M A SON UNIVER SIT Y
19
Small Community Air Service Development Program
The Small Community Air Service Development Program initiated in 2000 pro-vides up to 40 grant awards each year, and in 2011 it cost an estimated $15 million. Each state may receive a maximum of four grants in each year the program is funded. The number of individual awards is unlimited and varies depending upon the fea-tures and merits of the proposals selected. Unlike the EAS program, the financial assistance available under the program is not limited to basic air carrier subsidies. It can involve financial assistance for, among other things, marketing programs, additional personnel, studies, and aircraft acquisitions.
In each fiscal year 2002–2005, the program was funded and implemented at a cost of $20 million. The DOT’s budget appropriation for 2006–2007 provided $10 mil-lion to administer the program. In 2008–2009, $8 million of funding was provided. Over the first eight years of the program’s operation, the U.S. DOT’s individual grants ranged from $20,000 to nearly $1.6 million. For fiscal year 2010, the DOT made $7 million available for grant awards, and up to $15 million for fiscal year 2011. The Small Community Air Service Development Program is authorized at $6 million per year through 2015 under the Surface and Air Transportation Program Extension Act of 2011. Generally, individual grant awards have not exceeded a three- to four-year period.33
There has been very little analysis of the success of the Small Community Air Service Development Program in meeting its stated objectives. In part, this is attrib-utable to the difficulty of defining the counterfactual of natural development that may have occurred without the grants.34 In any case, little money is involved, and the effect on local development would be difficult to isolate. Further, the sums awarded are arbitrary, and the limitation to a maximum of four grants per state is not necessarily in line with the goal of spending money where development returns will be the great-est. Furthermore, in some years the budget for the program has not been exhausted, indicating that there may be few locations that feel the grants would be useful.
Civil Reserve Air Fleet
The U.S. military supplements its airlift on occasion by hiring aircraft and crew from the commercial airlines. Some U.S. airlines contractually pledge aircraft to the various segments of the Civil Reserve Air Fleet (CRAF) to be ready for activa-
highway miles from a hub airport.33. Website of the Small Community Air Service Development Program, Office of Aviation Analysis, 2011, http://ostpxweb.dot.gov/aviation/X-50%20Role_files/smallcommunity.htm.34. There is evidence that enhanced air services at small airports may be correlated with local econom-ic development, but this comes largely from averaging over cross-section or pooled data studies that have considerable variation. See Kenneth Button, Soogwan Doh, and Junyang Yuan, “The Role of Small Airports in Economic Development,” Journal of Airport Management 4 (2010): 125–36. Further, there is no indication of the opportunity costs involved in funding the grants or of whether there may have been a more efficient way to use the resources to bring about the local economic growth.
MERC ATUS CENTER AT GEORGE M A SON UNIVER SIT Y
20
tion when needed. To provide incentives for civil carriers to commit to CRAF and to ensure the United States has adequate airlift reserves, the government makes peacetime airlift business available to civilian airlines that offer aircraft to CRAF. The U.S. Department of Defense offers business through the International Airlift Services. For fiscal year 2005, the guaranteed portion of the contract was $418 mil-lion. Air Mobility Command previously reported that throughout fiscal year 2005, it planned to award more than $1.5 billion in additional business beyond the guar-anteed portion of the contract.35
In January 2012, according to the U.S. Department of Defense, there were 1,025 aircraft enrolled in the CRAF, including 787 international passenger planes and 159 international cargo planes, with the remainder for aeromedical evacuation segments and domestic use. The benefits to the airlines are in the form of additional revenues. For freight carriers, the use of CRAF during the years before 2007 amounted to an average of less than 5 percent of the estimated cargo revenues of American air car-riers, although this was larger than the approximately 1.5 percent share of revenues seen before 2002.36
That the military requires significant airlift in the 21st century is not an issue, although its scale may be. Further, the monies involved are not large. The issue is more one of whether CRAF is the most effective way of providing airlift. For example, would airlines enter the system for less? Or are there alternative systems of the kind other countries use? Could the United States adopt a system that is applied elsewhere in countries that also have international military policing roles?
COMPETITION POLICY
As a form of regulation, antitrust laws have influenced the shape of the post-dereg-ulation restructuring efforts of airlines. Antitrust regulations may limit the restruc-turing of corporations and block needed consolidation; the antitrust authorities are often seen to view with suspicion efforts to retain higher prices. Historically, the CAB had antitrust jurisdiction over airline mergers. When Congress disbanded the CAB in 1985, it temporarily transferred merger-review authority to the U.S. DOT. In 1989, the Department of Justice (DOJ) assumed merger-review jurisdiction from the DOT that, when combined with its antitrust authority under the Sherman Act, made it the primary antitrust regulator of the airline industry.
Although there is extensive entry to and exit from the U.S. airline industry, there have also been considerable mergers and acquisitions since deregulation, especially in the years immediately after 1978. Over the past 15 years, there have been fewer
35. GAO, “Military Airlift: DOD Should Take Steps to Strengthen Management of the Civil Reserve Air Fleet Program,” GAO-09-625, Washington, DC, 2009.36. Ibid.

MERC ATUS CENTER AT GEORGE M A SON UNIVER SIT Y
21
mergers and acquisitions, in part because the industry has undoubtedly stabilized and there had been considerable learning from doing.37 However, this is also because the U.S. DOJ opposed many of the proposed unions, most notably between United Airlines and US Airways in 2000. The proposed United–US Airways merger was ulti-mately abandoned by the carriers themselves over concerns with management inte-gration, though. The DOJ position has changed somewhat in recent years. Of note are Delta’s acquisition of Northwest and the merger of United Airlines and Continental; the poor financial state of many carriers has been a major consideration. It is difficult to judge whether these actions have reduced the efficiency of the industry to any great extent. The difficulties involved in merging,38 though, have in some cases made the often-easier option of forming alliances a better choice. Of course, had mergers not been prevented, then any external discussion of mergers versus alliances would have been moot; the market would have provided the answer.
The issue has been more serious with regard to international aviation. One aspect of globalization has been the greater internationalization of capital markets, but this has had limited effect on U.S. airlines because of their limited ability to merge or invest in foreign carriers. The United States allows 25 percent foreign ownership of voting shares in its carriers, although, in particular circumstances, ownership may be as high as 49 percent. These ownership restrictions and de facto limitations on factor mobility have a number of adverse consequences for U.S. carriers. The imme-diate consequence is the inherent imperfections in the capital market that prevent optimal amounts of foreign money from being put into U.S. airlines that would likely occur without the restriction. From an operations perspective, it also means there is no foreign-carrier competition within the U.S. market with implications for the degree to which U.S. carriers are kept on their toes.
U.S. competition policy also has implications for international services, although in this case it is the State Department that has the legal responsibility. Because of the difficulties of international mergers—of which the U.S. ownership rules are but one element39—the major airlines have built up three strategic alliances: Star Alliance, Oneworld, and SkyTeam. These alliances have to be sanctioned by the U.S. State Department to gain exemption from antitrust laws. The United States has often used these exemptions, which can have significant commercial benefits for foreign carriers, as a bargaining tool in pursuing the country’s open skies policy
37. Many of the mergers were not completely successful. They had often been premised on network economies from reduced costs associated with reducing capacity and additional revenue from enhanced market presence, but practical issues involving labor in particular generally mooted the gains that were foreseen. For a consideration of some of these problems, see GAO, “Airline Mergers: Issues Raised by the Proposed Mergers of United and Continental Airlines,” GAO-10-778T, Washington, DC, 2011.38. For some of the practical challenges of merging United and Continental Airlines, see Drake Bennet, “Marriage at 30,000 Ft.,” Bloomberg BusinessWeek, February 6–12, 2012, 58–63. 39. These are also imposed by the nature of the bilateral air service agreement regime that has grown up since the 1944 Chicago Convention, that essentially means that airlines have to have a nationality if they are to participate in most international markets.

MERC ATUS CENTER AT GEORGE M A SON UNIVER SIT Y
22
since 1979. The policy gives both countries on a route unrestricted landing rights on each other’s soil. Setting aside the fact that open skies policies do not imply open markets because they do nothing to liberalize factor movements or cabotage, the tying of antitrust immunity for airlines with national agreements of traffic rights has led to market distortions. In particular, because the United Kingdom refused to sign an open skies agreement with the United States, the Oneworld alliance (which includes American Airlines) did not receive antitrust immunity until 2010. In con-trast, carriers such as United (in the Star Alliance) and Delta (part of SkyTeam) had already received such immunity. This limited American Airlines’ ability to integrate its services with those of its alliance partners, such as British Airways, to the extent rivals could on the important North Atlantic routes.40
Agreements covering competition on international routes date back to the end of World War II. Every signatory to the 1944 Chicago Convention on International Civil Aviation agreed to national sovereignty over air space. The result was a pleth-ora of bilateral agreements that in a variety of ways regulated scheduled fares and cargo rates between countries, the airlines that could serve the market, the capac-ity that could be provided, and the proportion of revenues to which each carrier was entitled. This system gradually broke down as the benefits of the U.S. domestic deregulation emanated positive demonstration effects. The United States fostered the move after 1979 with its bilateral open skies agreements, of which there are now more than 100, and limited ventures into multilateral agreements, as with the EU.
The EU–U.S. Open Skies Agreement, initially signed on April 30, 2007, with phase two signed in June 2010, is of particular importance because it involves the largest air market in the world—that within the United States—and the largest inter-national market—the transatlantic. But it also highlights some of the limitations of the American approach to markets outside of the country. The agreement allows any airline of the EU and any airline of the United States to fly between any point in the EU and any point in the United States. U.S. airlines are also allowed to fly between points in the EU. EU airlines are allowed to fly between the United States and non-EU countries like Switzerland. The treaty tilts trade in favor of U.S. air-lines: while they are allowed to operate intra-EU flights, European airlines are not permitted to operate intra-U.S. flights, nor are they allowed to purchase a control-ling stake in any U.S. operator.
The agreement is relatively new and its complete impact is not yet clear, given the current mire of a global recession; the completion of mergers between various large U.S. carriers; the mergers between European strategic alliance partners, such as Oneworld’s Iberia and British Airways; and the granting of antitrust immunity to the Oneworld alliance. There is no reason, however, to expect that many of the ex ante predictions of the benefits of the agreement, such as more openness of U.K.
40. American Airlines sued for Chapter 11 bankruptcy in late 2011, although this was mainly an attempt to renegotiate labor contracts and not related to the alliance situation.

MERC ATUS CENTER AT GEORGE M A SON UNIVER SIT Y
23
airports, lower fares, and more coordinated services, will not be realized in the lon-ger term.41 The approach of the U.S. State Department in its negotiations, however, was very much one of de facto protectionism; basically, it gained the most favorable short-term institutional arrangements for U.S. carriers. Its goal was not to enhance consumer welfare by allowing the greater competition in the larger marketplace that would come about if European airlines had access to the U.S. domestic market or by allowing greater investment opportunities in its airlines. In the larger inter-national arena, the moves of the United States toward a free market in air services have, to date, been partial. In consequence, the gains are likely to be limited.
REGULATIONS OVER INFRASTRUCTURE
Airlines rely on two major forms of infrastructure to operate: airports and air traf-fic control (technically air navigation services). Although airlines in the United States were freed from many economic regulations in the 1970s and only relatively minor new ones have since been introduced, their associated infrastructure has remained heavily regulated and largely held in public ownership. They have generally been treated more as a public service than as an economic asset with services requiring cost-effective, efficient allocation. The pricing of the air transportation infrastruc-ture services does not ensure optimal use, provide signals about where additional capacity would be beneficial, or generate the revenues to carry out investment.42
Airports
The vast majority of commercial airports in the United States are either owned munic-ipally or by government-created port authorities. Some involve a degree of private-sector participation though concessionary arrangements to manage all or part of the airport, or through long-term leases for facilities such as terminals (see table 1).43 This differs from the situation in many parts of the Western world where there is often direct commercial ownership of airports, as in the United Kingdom, or their corpora-tization as nonprofit entities, as in many continental European countries; see table 1.44
41. Kenneth Button, “The Impact of EU–U.S. ‘Open Skies’ Agreement on Airline Market Structures and Airline Networks,” Journal of Air Transport Management 15 (2009): 59–71.42. This is not to say that some airports do not cover their accountancy costs, but rather that any addi-tional revenues are not put back into capacity expansion.43. Kenneth Button, “The Implications of the Commercialization of Air Transport Infrastructure,” in The Economics of Airline Institutions, Operations, and Marketing, ed. Darin Lee (Oxford: Elsevier, 2007), 171–92; and Kenneth Button, “Air Transportation Infrastructure in Developing Countries: Privatization and Deregulation,” in Aviation Infrastructure Performance: A Study in Comparative Political Economy, ed. C. Winston and G. de Rus (Washington, DC: Brookings Institution, 2007), 193–221.44. D. Gillen, “Airport Governance and Regulation: Three Decades of Aviation System Reform,” in A Handbook of Transport Economics, ed. A. de Palma, R. Lindsey, E. Quinet, and R. Vickerman (Cheltenham, U.K.: Edward Elgar Publishing, 2011), 779–96.

MERC ATUS CENTER AT GEORGE M A SON UNIVER SIT Y
24
TABLE 1. TYPES OF AIRPORT GOVERNANCE
Form of Governance
Management Contract Long-Term Contracting Full or Part Privatization
Control device Periodic tendering Rate-of-return regulationRate-of-return regulation plus market for corporate control
Management responsibility
Operational Operational and financialOperational, financial, and strategic
Time frame 5–10 years 15-plus years 99-year lease or indefinite
Examples Management concessions
Burbank (5 years)Indianapolis (10 years)Westchester, New York (10 years)
Build-operate-transfer
Toronto Terminal 3Ataturk Long-term leaseBolivia (3 airports for 25 years)Argentina (33 air-ports for 30 years)JFK New York Terminal 4 (30 years)Macao (33 years)
Initial public offerings
U.K.–BAA (100%)Vienna (27%)Copenhagen (25%)Trade salesSydney (100%)Auckland (25%)Naples (30%)
Source: Michael Carney and Keith Mew, “Airport Governance Reform: A Strategic Management Perspective,” Journal of Air Transport Management 9 (2003): 221–32.
There are some clear challenges to ensuring efficiency in the provision of trans-portation infrastructure. In Wealth of Nations, Adam Smith’s third reason for government relates to providing infrastructure. But the world has changed since Smith’s time, and his arguments, which mainly revolved around the need to consoli-date finance, have largely evaporated. Private ownership offers several advantages: diverse sources of funds can be raised and a more commercial approach to manage-ment can be engendered. The various alternative ownership models outside of the United States offer some insights not only into what has been adopted but also into the ways other countries are thinking about airport ownership and regulation.
In addition to Smith’s concern that infrastructure would be too difficult to finance, long-standing concerns persist about the potential monopoly power own-ers of airports may enjoy. Indeed, in Europe, where there is more private investment in airports, there is also more regulation of landing fees. However, the extent of monopoly power is often exaggerated for number of reasons.45 First, with the advent of hub-and-spoke operations, competition between origin-destination pairs has not only been between direct services but also between indirect services through an intermediate airport. Second, in many cases, there are airports within about a two-hour drive of each other, and this provides de facto competition between them. Third, airlines are mobile, and if an airport tries to push up landing fees, then its resident carriers may simply move to another airport; in many cases airports and
45. Kenneth Button, “Countervailing Power to Airport Monopolies,” in Competition in European Airports: The German Experience, German Aviation Research Seminar Series no. 4, ed. P. Forsyth, et al. (Burlington, VT: Ashgate, 2010), 59–77.

MERC ATUS CENTER AT GEORGE M A SON UNIVER SIT Y
25
airlines operate with a bilateral monopoly structure.46 Airports often have signifi-cant sources of supplementary income from activities such as onsite concessions or car parking lots, as well as from landing fees, and they can juggle these to maximize income. They serve a two-sided market of airlines and passengers and often have an incentive to keep air traffic fees down to attract more business and extract more income directly from passengers.
At a more micro level, the ways in which landing and takeoff slots are allocated is only gradually embracing economic principles.47 Traditionally, slots have been allocated on a first-come, first-served basis with resultant congestion at peak times. The growth of hub-and-spoke operations, leading to banks of flights converging on an airport within a narrow time window, has attracted particular attention. The result is congestion at certain times of the day and at some large airports, although this may be mitigated when a single carrier dominates traffic. A dominant carrier has a commercial incentive to maximize the use of its capacity. Jan Brueckner, for example, finds that delays of 15 minutes or more decrease where one airline domi-nates a major hub airport.48 Using excess of flight time over the minimum feasible flight time as their indicator of delay, Christopher Mayer and Todd Sinai come to the same conclusion.49
To combat flight delays, the FAA introduced the high-density rule in 1969, which restricted the number of slots at the designated high-density airports: New York LaGuardia, Reagan Washington National, Kennedy Airport, and Chicago O’Hare.50 This ended early in the first decade of the 21st century. In 2008, the U.S. DOT initi-ated an auction system for a limited number of slots as LaGuardia. Two packages of eight slot pairs have also been the subject of a Dutch auction at LaGuardia and Reagan Washington National as part of a regulatory requirement for a slot swap at the airports between Delta Air Lines and US Airways.
Since 1986, airlines and non-airlines have been allowed to trade or lease slots. The only restriction is attributable to ring fences. The large carriers’ slots can be traded freely; however, large carriers are not allowed to buy commuter slots. Other slots, such as those for international flights, may not be traded or leased. Furthermore,
46. For example, Southwest Airlines withdrew services from San Francisco International Airport for six years because of increased landing fees; it restored the services in 2007.47. Kenneth Button, “Issues in Airport Runway Capacity Charging and Allocation,” Journal of Transport Economics and Policy 42 (2008): 563–85.48. Jan K. Brueckner, “Airport Congestion When Carriers Have Market Power,” American Economic Review 92 (2002): 1357–75.49. Christopher Mayer and Todd Sinai, “Network Effects, Congestion Externalities, and Air Traffic Delays: Or, Why Not All Delays Are Evil,” American Economic Review 93 (2003): 1194–215. The situation is not altogether clear, however, and case study work by Joseph Daniel indicates that a dominant carrier may not try to minimize delays to its own services but rather use delay as a tactic to prevent competi-tors from entering the market. See Joseph I. Daniel, “Distributional Consequences of Airport Congestion Pricing,” Journal of Urban Economics 50 (2001): 230–58.50. David Starkie, “Allocating Airport Slots: A Role for the Market?” Journal of Air Transport Management 4 (1998): 111–16.

MERC ATUS CENTER AT GEORGE M A SON UNIVER SIT Y
26
a use-it-or-lose-it rule requires that new or free slots be allocated using a lottery after 25 percent of them have been offered to newcomer airlines. This structure, embodying what amounts to an allocation of capacity using a largely arbitrary set of parameters, seems unlikely to maximize economic efficiency in regards to which slots are used.
The slot and leasing rates airports can charge are regulated in the sense that they must be applied to all carriers at a facility. This has posed problems. For exam-ple, in 2004, the Allegheny County Airport Authority in Pennsylvania rejected US Airways’ demands for reduced landing fees and lower lease payments.51 In part, this was because antitrust and FAA regulations required the airport operator to extend the same financial terms to all carriers if it accepted US Airways’ demands. US Airways threatened to move traffic to rival hubs in Philadelphia and Charlotte, and the airline made good on its threat in November 2004. It reduced flights at Pittsburgh International Airport from primary-hub to secondary-hub status and has subsequently reduced services further. The regulations essentially prevent the normal forces of supply and demand from working in individual markets where there may be different mixes of customers, for example, leisure and business trav-elers, and airlines, for example, low cost and legacy carriers, that require different prices for efficiency.
The Air Navigation System
The federal government became involved with air traffic control in 1936 by pro-viding en-route service while municipal authorities operated towers at airports. Congress passed the Federal Aviation Act in 1958, which gave responsibility for managing the nation’s navigable airspace to the new Federal Aviation Agency (renamed the Federal Aviation Administration in 1966, when it was brought into the U.S. DOT). Financial support for the air traffic control system comes from airline ticket tax revenues that comprise the Airport and Airway Trust Fund, from interest on assets, and from general revenues.
The FAA is the monopoly provider of air navigation services in the United States. This is not an unusual situation; monopoly control over air traffic management is the norm throughout the world. It is generally justified by its strategic importance, the existence of network and scale economies, and the need to ensure safety. These arguments can be disputed on intellectual grounds, but because comparisons with pure competitive sys-tems are not possible, empirical analysis is difficult. Certainly, there are arguments that some elements of the system are amenable for competition in the market, such as tower control at airports; outsourcing of other elements may also be advantageous.52
51. Landing fees are largely based on weight to reflect the physical engineering costs on a runway. Thus, they do not account for the congestion costs that different types of aircraft impose at various levels of demand.52. See Kenneth Button, “Comparative Inefficiency of Various Air Navigation Systems,” in Liberalizing

MERC ATUS CENTER AT GEORGE M A SON UNIVER SIT Y
27
The scale of the U.S. air navigation system is also very large. It handles more flights but has fewer centers and airports and is less labor intensive than the European system (see table 2).53 This makes it difficult to modify and update, and the situation is made worse by the regular involvement of government in its investment and pricing policies. Although there is no direct user charge, the system is funded by passenger taxes. These provide little incentive for efficient use and minimal guid-ance as to where investments would best be made. As Dorothy Robyn points out, a 140-seat Airbus A320 flying from Denver to Phoenix contributed $1,498 in taxes in 2006, yet a 50-seat regional jet paid only $502, although the costs to the air naviga-tion system were roughly the same.54 Economics pricing, while discussed from time to time, is not seriously considered.
TABLE 2. U.S. AND EUROPEAN AIR NAVIGATION SYSTEMS (2008)
Europe United StatesDifference:U.S. vs. Europe
Area (million km2) 11.5 10.4 –10 percent
Number of air service navigation providers 38 1
Number of air traffic controllers 16,800 14,000 –17 percent
Total staff 56,000 33,600 –40 percent
Controlled flights (million) 10 17 +70 percent
Share of flights to/from top 34 airports 68 percent 64 percent –5 percent
Share of general air traffic 4 percent 23 percent +450 percent
Flight hours controlled (million) 14 25 +80 percent
Relative density (flight hours per km) 1.2 2.4 +100 percent
Average length of flight (within respective airspace) 541NM 497NM –8 percent
Number of en-route centers 65 20 –70 percent
En-route sectors at maximum configuration 679 955 +40 percent
Number of airports with air traffic control services 450 263 –42 percent
Slot controlled >73 3
Source: Eurocontrol and U.S. Federal Aviation Administration, “European Comparison of ATM Related Operational Performance,” Eurocontrol, Brussels, and FAA, Washington, DC, 2009.
Air Transport, ed. H. M. Niemeier, et al. (Burlington, VT: Ashgate, 2012 [forthcoming]).There has been some limited appreciation of this in the United States. For example, in 2005, the FAA awarded a contract to Lockheed Martin to run 58 flight service stations that provide information to but do not control flights.53. Richard Gloaszewaki outlines the nature of the U.S. air navigation system in detail and also gives a comparative analysis of the interactions between air navigation service providers and airport regula-tions in the United States and Europe. See Richard Gloaszewaki, “Reforming Air Traffic Control: An Assessment from the American Perspective,” Journal of Air Transport and Management 8 (2002): 3–11.54. Dorothy Robyn, “Reforming the Air Traffic Control System to Promote Efficiency and Reduce Delays,” The Brattle Group, Washington, DC, 2007.

MERC ATUS CENTER AT GEORGE M A SON UNIVER SIT Y
28
At another level, there are issues concerning the efficiency of the various forms of monopoly ownership now in place.55 At one end of the spectrum is the public and private model of the National Air Traffic System Ltd., which handles air traffic con-trol in the United Kingdom, has access to private finance markets, and levies user fees. At the other end is the FAA, which is state owned and financed from taxation. There are also divergences in the ways the systems are regulated and the nature of the bodies responsible for the regulation (see table 3).
TABLE 3. BASIC FEATURES OF SELECTED AIR NAVIGATION SERVICE PROVIDERS
Country Air Navigation Systems Provider Name
Ownership Rate Regulation
Australiaa Airservices Australia Government corporation Commission oversight
Canadab Nav Canada Nonprofit private corpo-ration
Legislated principles/appeals
Francec Direction des Services de la Navigation
State department Approved by transport ministry
Germanyd Deutsche Flugsicherung GmbH
Government corporation Approved by transport ministry
Irelande Irish Aviation Authority Government corporation Regulatory commission
Netherlandsf Luchtverkeersleiding Nederland
Nonprofit government corporation
Approved by transport ministry
New Zealandg Airways Corporation of New Zealand
Corporation Self-regulating/appeals
South Africa Air Traffic and Navigation Services Ltd.
Nonprofit joint-stock cor-poration
Transport ministry com-mittee
Switzerlandh Skyguide Nonprofit government corporation
Approved by transport ministry
United Kingdomi National Air Traffic System Ltd.
Public-private partnership Price capping
United States FAA’s Air Traffic Organization
State Department Financing from taxation
Source: Kenneth Button and Glen McDougall, “Institutional and Structural Changes in Air Navigation Service Providing Organiza-tions,” Journal of Air Transport Management 12 (2006): 236–52.
Notes: (a) Corporatized in 1988; (b) Corporatized in 1996; (c) Consolidated in 2003; (d) Established in 1993 and was to be priva-tized in 2006 but since aborted; (e) Corporatized in 1993; (f) Corporatized in 1993;(g) Corporatized in 1987; (h) Incorporated in 2001, predecessor established in 1921; (i) Public-private partnership in 2001; Excluding national, generic antitrust, and similar regulations. All air navigation system providers are financed by user fees except for the U.S. FAA, which is funded by taxation.
55. Kenneth Button and Glen McDougall, “Institutional and Structural Changes in Air Navigation Service Providing Organizations,” Journal of Air Transport Management 12 (2006): 236–52; and Clinton V. Oster and John S. Strong, Managing the Skies: Public Policy, Organization, and Financing of Air Navigation (Surrey, U.K.: Ashgate, 2008).
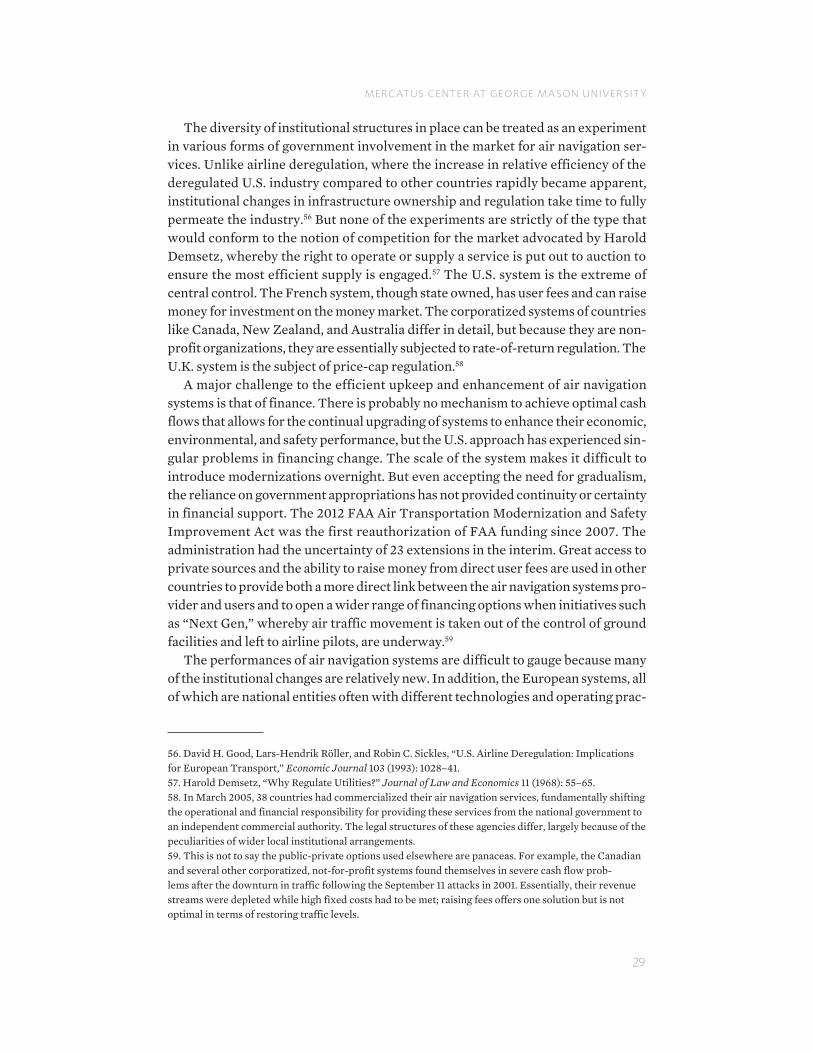
MERC ATUS CENTER AT GEORGE M A SON UNIVER SIT Y
29
The diversity of institutional structures in place can be treated as an experiment in various forms of government involvement in the market for air navigation ser-vices. Unlike airline deregulation, where the increase in relative efficiency of the deregulated U.S. industry compared to other countries rapidly became apparent, institutional changes in infrastructure ownership and regulation take time to fully permeate the industry.56 But none of the experiments are strictly of the type that would conform to the notion of competition for the market advocated by Harold Demsetz, whereby the right to operate or supply a service is put out to auction to ensure the most efficient supply is engaged.57 The U.S. system is the extreme of central control. The French system, though state owned, has user fees and can raise money for investment on the money market. The corporatized systems of countries like Canada, New Zealand, and Australia differ in detail, but because they are non-profit organizations, they are essentially subjected to rate-of-return regulation. The U.K. system is the subject of price-cap regulation.58
A major challenge to the efficient upkeep and enhancement of air navigation systems is that of finance. There is probably no mechanism to achieve optimal cash flows that allows for the continual upgrading of systems to enhance their economic, environmental, and safety performance, but the U.S. approach has experienced sin-gular problems in financing change. The scale of the system makes it difficult to introduce modernizations overnight. But even accepting the need for gradualism, the reliance on government appropriations has not provided continuity or certainty in financial support. The 2012 FAA Air Transportation Modernization and Safety Improvement Act was the first reauthorization of FAA funding since 2007. The administration had the uncertainty of 23 extensions in the interim. Great access to private sources and the ability to raise money from direct user fees are used in other countries to provide both a more direct link between the air navigation systems pro-vider and users and to open a wider range of financing options when initiatives such as “Next Gen,” whereby air traffic movement is taken out of the control of ground facilities and left to airline pilots, are underway.59
The performances of air navigation systems are difficult to gauge because many of the institutional changes are relatively new. In addition, the European systems, all of which are national entities often with different technologies and operating prac-
56. David H. Good, Lars-Hendrik Röller, and Robin C. Sickles, “U.S. Airline Deregulation: Implications for European Transport,” Economic Journal 103 (1993): 1028–41.57. Harold Demsetz, “Why Regulate Utilities?” Journal of Law and Economics 11 (1968): 55–65.58. In March 2005, 38 countries had commercialized their air navigation services, fundamentally shifting the operational and financial responsibility for providing these services from the national government to an independent commercial authority. The legal structures of these agencies differ, largely because of the peculiarities of wider local institutional arrangements.59. This is not to say the public-private options used elsewhere are panaceas. For example, the Canadian and several other corporatized, not-for-profit systems found themselves in severe cash flow prob-lems after the downturn in traffic following the September 11 attacks in 2001. Essentially, their revenue streams were depleted while high fixed costs had to be met; raising fees offers one solution but is not optimal in terms of restoring traffic levels.

MERC ATUS CENTER AT GEORGE M A SON UNIVER SIT Y
30
tices, are in a state of transition to become a single entity: the “Single European Sky” initiative. A U.S. GAO study of the systems in Germany, Australia, New Zealand, Canada, and the United Kingdom found that commercialization had led to con-solidation of facilities, investment in new technologies, and increased productivity, with user fees being structured more in line with the financial costs incurred.60 In contrast, the United States has made a number of efforts to upgrade and update its air traffic control system, but with limited success.61 Although the costs of failure in these efforts have not been fully assessed, if for no other reason than that devel-oping reasonable counterfactuals is difficult, Robyn does produce data suggesting that the productivity of the system did not improve in the 25 years up to 2005, while production costs rose considerably.62 Morrison and Winston, taking a more micro perspective, find a loss of $1 billion in travelers’ time and airline costs because FAA expenditures had not been focused on the most congested tower controls at the most congested airports.63
SECURITY64
At the time of the Airline Deregulation Act, the notion of air transportation secu-rity was somewhat different from that of the post-9/11 period. Before the 2001 attacks, security concerns focused primarily on theft and damage to cargo; skyjack-ing at the time had been undertaken largely for political visibility purposes, asylum seeking, or financial gain.65 Since 2001, aircraft have been seen as potential weapons of attack with those on the ground—as well as air travelers—potential victims of terrorism. This change in focus has led to a transformation in the approach to air transport security, that included an extensive array of new security measures.66 The
60. GAO, “Air Traffic Control: Characteristics and Performance of Selected International Air Navigation Service Providers and Lessons Learned from Their Commercialization,” GAO-05-769, Washington, DC, 2005.61. Gerald Dillingham, “Air Traffic Control, FAA’s Modernization Efforts—Past, Present, and Future. Statement before the Subcommittee on Aviation, Committee on Transportation and Infrastructure, U.S. House of Representatives,” GAO-04-227T, Washington, DC, 2003.62. Dorothy Robyn, “Reforming the Air Traffic Control System to Promote Efficiency and Reduce Delays,” The Brattle Group, Washington, DC, 2007.63. Steven Morrison and Clifford Winston, “The Effect of FAA Expenditure on Airport Delays,” Journal of Urban Economics 63 (2008): 669–78.64. This section relates to what has conventionally been treated as security, not safety. Based on the evidence, the deregulations of the U.S. air transportation market did nothing to reduce the long-term temporal increase in air transportation safety. Richard B. McKenzie and William. F. Shughart, “Deregulation’s Impact on Air Safety: Separating Fact from Fiction,” Regulation 11 (1988): 42–51. 65. Skyjackings are not new. The first recorded skyjacking took place February 21, 1931, in Peru. Between 1948 and 1957, there were 15 skyjackings, but this rose to 48 in the following decade. The trend then accelerated, with 38 skyjackings in 1968 and 82 the following year. From 1968 to 1977, there were 414 skyjackings, averaging more than 40 per year. 66. Garrick Blalock, Vrinda Kadiyali, and Daniel H. Simon, “The Impact of Post-9/11 Airport Security Measures on the Demand for Air Travel,” Journal of Law and Economics 50 (2007): 731–55.

MERC ATUS CENTER AT GEORGE M A SON UNIVER SIT Y
31
implications of this extend well beyond the scope of this paper, but one or two issues particularly affect the costs of air travel.67
There are both private and public good aspects to airline security, and these may vary according to the dimension of security considered, ranging from pilfering cargo to skyjacking aircraft to be used as weapons of terror. We comment only on the latter because it has been a major preoccupation of security since 2001.
The main problem with handling terrorism is the uncertainty involved.68 Many acts of terrorism are essentially unique, such as the 9/11 attacks, and perpetra-tors react to measures designed to prevent similar attacks. In contrast, there are many automobile accidents with numerous common features that, combined with a lack of real feedback mechanisms to counteract new safety measures, allow an actuarial calculation of risk.69 Thus, there are private markets that offer car insur-ance. Uncertainty allows no such calculation, and, in a way, government acts as the insurer of last resort against many aspects of terrorism.
Airline security involves both a degree of uncertainty and risk, and the challenge is to decide the extent to which responsibility for handling this is a public good issue and the extent to which it is a matter of private good. In the sense that airlines suffer losses in the event of a terrorist attack, there is a manifest vested commercial interest in airlines’ taking some responsibility for the security of their passengers and cargos. Equally, a large part of security is intelligence-gathering that involves features of non-rivalry and non-excludability, indicating a need for government involvement.70 The intellectual arguments are relatively clear; the challenge has been one of alloca-tion in practice. The role of the private sector has differed somewhat in air transpor-tation compared to maritime transportation, where there has been a concerted effort to engage those involved in the supply chain in ensuring its security.71
The current full costs of transport security are difficult to quantify, but seem to be substantial and extend well beyond those borne by the government.72 The benefits
67. The issue of whether CRAF is the most efficient way of maintaining airlift for emergencies is also ger-mane here.68. For the traditional economic distinction between risk and uncertainty, see Frank Knight, “Some Fallacies in the Interpretation of Social Costs,” Quarterly Journal of Economics 38 (1924): 582–606.69. The traditional ways of looking at uncertainty and quantifying it to some extent are through the use of Monte Carlo simulations or expert opinion analysis. Both involve considerable value judgment.70. Non-rivalry means that consumption of the good by one individual does not reduce availability of the good for consumption by others. Non-excludability means that no one can effectively be excluded from using the good.71. Mary R. Brooks, Kenneth Button, and Marc Thibault, “The Response of the U.S. Maritime Industry to the New Container Security Initiatives,” Transportation Journal 45 (2006): 5–15.72. The annual costs of security in 2006 were estimated to include a large part of the Transportation Security Administration budget of $6.3 billion, several billions of dollars in time costs incurred by pas-sengers waiting to be screened, and $1.1 billion in lost revenue to airlines from reduced passenger vol-ume at major airports. See Garrick Blalock, Vrinda Kadiyali, and Daniel H. Simon, “Impact of Post-9/11 Airport Security Measures on the Demand for Air Travel,” Journal of Law and Economics 50 (2007). These estimates exclude other costs, including such things as costs to airlines for additional training of staff, the fitting of secure cabin devices, and, especially in Israel and the United States, the requirement
MERC ATUS CENTER AT GEORGE M A SON UNIVER SIT Y
32
are even more opaque if for no other reason than that a large element of security involves deterrence. Attempting anything like a cost-benefit analysis is challenging, and the outcome is inevitably soft. Essentially, such an outcome can be squeezed in a multitude of ways depending on the interpretation or the motivations of those com-missioning the analysis.73 A number of studies do suggest that the current regime of aviation security is not always cost efficient, although again, caveats inevitably surround these types of quantification.
In a study of the Federal Air Marshal Service, Mark Stewart and John Mueller estimated that the annual costs amount to $180 million, greatly in excess of the social willingness to pay.74 The Office of Inspection reported in 2009 that the Transportation Security Administration (TSA) had spent more than $800 million on new air passenger screening technology between 2002 and 2008, but had not used any of it. The GAO and the TSA routinely test airport screeners’ ability to intercept weapons smuggled through checkpoints. The results have been poor. Both the GAO and the TSA found that screening was no more effective by April 2005 than before 9/11, and, in 2006, screeners failed 20 of the TSA’s 22 tests.75 The GAO reported that covert tests through June 2007 conducted by the TSA’s Office of Inspection identified vulnerabilities in the commercial aviation system at airports of all sizes. The GAO also reported that the TSA apparently lacks a systematic process to ensure that the Office of Inspection’s recommendations are appropriately incorporated to improve airport security.76
This sort of evidence does point to a lack of cost efficiency in meeting institution-ally stipulated security standards, but efficiency also involves less-tangible elements. At its roots, terrorism is not about harming people; rather, it focuses on scaring them to change their behavior. Thus, counterterrorism is at least partly about instilling confidence that flying is safe. This may well involve measures that have no effect on the actions of terrorists, but convince airline passengers that they do. It could be argued, therefore, that at least part of the time and inconvenience costs of airport security is visible to reassure travelers that they are being protected. The evidence for this is unclear, but there are certainly concerns that many aspects of “security”
to carry air marshals who take up otherwise revenue-earning seats. There are also wider network costs due, for example, to passengers switching from higher-priced air transportation to other modes that may have environmental and safety implications. See Adriana Rossiter and Martin Dresner, “The Impact of the September 11th Security Fee and Passenger Wait Time on Traffic Diversion and Highway Fatalities,” Journal of Air Transport Management 10 (2004): 225–30.73. For a discussion of some of the main economic issues, see Cletus C. Coughlin, Jeffrey P. Cohen, and Sarosh R. Khan, “Aviation Security and Terrorism: A Review of the Economic Issues,” Federal Bank of St. Louis Review 84 (September/October 2002): 9–24.74. Mark G. Stewart and John Mueller, “A Risk and Cost-Benefit Assessment of United States Aviation Security Measures,” Journal of Transportation Security 1 (2008): 143–59.75. Becky Akers, “A Better Way Than the Transportation Security Administration,” Christian Science Monitor, March 21, 2007.76. GAO, “TSA Has Developed a Risk-Based Covert Testing Program, but Could Better Mitigate Aviation Security Vulnerabilities Identified through Covert Tests,” GAO-08-958, Washington, DC, 2008.

MERC ATUS CENTER AT GEORGE M A SON UNIVER SIT Y
33
are seen as cumbersome at best and in some cases serve no useful purpose.77 There are also issues about how security is best financed by cost efficiency and
in the context of the incentives financing creates. Countries differ in the way they finance airport security (see table 4). Clearly, direct charges to air travelers vary, although there seems to have been little effort to examine even in a general way whether value for money is being attained. Additionally, the effectiveness of the U.K. system, for example, where responsibility is with the airport to finance and stipulate security measures, seems to be lacking compared with the approaches of the United States, Canada, and other countries where the state provides security.
TABLE 4. AVERAGE SECURITY CHARGES AT AIRPORTS, PER TRAVELER (2002)
Country Average Charge per Passenger
Canada $14.50
Germany $10.57
Israel $8.03
France $6.88
Australia $5.19
United States $5.00
Netherlands $4.13
Russia $2.04
Italy $1.90
United Kingdom $0.00 Source: William G. Waters and Chunyan Yu, “Air Security and Highway Safety” (Proceedings of the 38th Canadian Transportation Research Forum Annual Conference, 2003).
Overall, security is an incredibly difficult attribute to provide, and, collectively, we are almost certain that nothing can be made completely secure, including air travel. The events of 2001 brought in new security initiatives, but their impact is extremely difficult to assess. We are naïve to treat the issue as one of the risk/risk analysis used in safety, where the reduction in the risk of an accident is set against the possible risks of serious side effects. Seatbelts reduce the damage to drivers in individual accidents but also possibly make drivers more confident of their driving skills, leading to more accidents. The risks from terrorism, however, are unknown, making assessments of policies difficult. This lack of scientific exactitude applies on both sides of the equation. We may be able to quantify some adverse side effects of a policy—for example, in the case of aviation, the implications of a reduced demand for air travel because of security costs may cause a switch to more dangerous modes of transportation—by looking at similar shocks resulting from, say, rapid rises in fuel prices. Yet this example is incomplete, and the comparisons are seldom perfect. On the other side of the equation, we have little understanding of what measures actu-ally work to stop terrorism. The practical issue comes down to whether the actions
77. Charles C. Mann, “Smoke Screening,” Vanity Fair, December 20, 2011.

MERC ATUS CENTER AT GEORGE M A SON UNIVER SIT Y
34
of the government have been cost effective in making air travelers feel more secure. The answer to that certainly is not an unambiguous yes, although the introduction of measures such as the TSA Preϑ™ screening initiative to speed security clearance of regular travelers indicates that the TSA is aware of some of these issues.
THE ENVIRONMENT
Air transportation affects the environment; for example, it introduces noise around airports and contributes about 2 to 3 percent of the carbon emissions cred-ited with climate change. That the external environmental costs of air transportation should be brought within the decision-making frameworks of airlines seems to be widely accepted. The problems lie in how this is to be done in an efficient manner. Noise nuisance, for example, has traditionally been dealt with in the United States by paying compensation to those affected or insulating their homes when an airport is developed, imposing noise limits on aircraft, giving rise to land-use planning, and lim-iting airline activities by curfews and flight path restrictions.78 The approaches used have often been voluntary and at the local level. This pattern has continued since the airlines’ deregulation in the 1970s and the resultant increase in traffic. Given variations in local conditions and aircraft movement patterns, a high degree of policy-making for individual airports seems appropriate, with broader guidelines provided by the FAA.79
There are fundamental issues in environmental regulation because it has become increasingly international. U.S. airlines not only fly large numbers of international routes—depending on the basis of measurement, 20 percent of the U.S. industry is international—but also deal in international markets for aircraft. A number of recent events have highlighted the policy challenges this poses for the United States. Staying with noise, aircraft have gradually become quieter over time, a trend accel-erated by legal requirements to move from stage 1 to stage 4 noise levels perfor-mance. Using hush kits, redesigning existing engines, or introducing new engines can produce similar results. In 1999, however, the EU sought to freeze the number of hush kit–equipped transports in its airspace that would have reduced the value of unsold hush kits, which are primarily U.S. made, to scrap. Because hush kits add weight and limit performance, the EU aimed to “improve the situation regarding fuel burn and gaseous emissions.”80 The EU has withdrawn the rule, although subse-
78. For some indication of the economic costs associated with airliners taking off and landing, see Jon Nelson, “Meta-Analysis of Airport Noise and Hedonic Property Values: Problems and Prospects,” Journal of Transport Economics and Policy 38 (2004): 1–27. For ways the United States has addressed air traffic noise pollution, see GAO, “Aviation and the Environment: Impact of Aviation Noise on Communities Presents Challenges for Airport Operations and Future Growth of the National System,” GAO-08-216T, Washington, DC, 2007.79. An indication of the success of the regime is that, according to FAA data, in 1975 with 202 million enplanements in the United States, 7 million people suffered from significant airport noise, yet in 2005, with 731 million enplanements, only 0.5 million suffered.80. Federal Express’s hush kits on its Boeing 727s add 900 pounds, resulting in a 0.5 percent increase in

MERC ATUS CENTER AT GEORGE M A SON UNIVER SIT Y
35
quently it added regulations about such things as definitions of noise under existing laws and the institutional structures that set local noise limits.
Environmental regulation debates highlight a major shift in an important aspect of U.S. air transportation policy: increasing internationalization. Additionally, although the measures essentially have to do with social regulation, they affect the economic costs of U.S. airlines in a variety ways. This is a new trend in regulation that has developed since the 1978 Airline Deregulation Act, and thinking of regula-tions pertaining to the environment and possibly other areas as a purely domestic matter becomes difficult. As such, this trend is vulnerable to government failures that extend outside the United States.
CONCLUSION
The Airline Deregulation Act of 1978 is something of a misnomer. Many eco-nomic regulations over such things as airline ownership and international air movements remain today. In addition, regulations governing consumer protection, safety, and the environment have been broadened and deepened, and security con-trols have tightened significantly. If one extends the idea of airline deregulation to embrace complementary activities, the act’s name is an even bigger misnomer; U.S. airports remain largely municipally owned, and the air navigation system is still part of the FAA.
The reforms to the U.S. air transportation market since the late 1970s have clearly brought about economic improvements, including lower average prices for users, and greater choice among suppliers, and service attributes more in line with what customers seek. However, the market remains far from perfect, with a range of resid-ual economic regulations stymieing the full potential of the sector. Although many of these continuing regulations relate to infrastructure, a number of serious constraints remain on the direct market for airline services. Indeed, there are some additional constraints that have been added in recent years. These are in addition to imperfec-tions associated with policies related to the environment, security, and safety.
The deregulation of the airlines in the 1970s, though influenced by academic work showing some of the costs of the regulatory regime, was largely a reaction to the macroeconomic stagflation of the day and the belief that inflation was a cost-push phenomenon. In many ways, it was also an easy quick fix. The regulatory structure that replaced it focused, initially through social subsidies and later through supposed measures of consumer protection, on meeting the concerns of vocal but relatively small groups. The remainder of the U.S. air transportation system has not seen signifi-cant changes in its institutional structure: public ownership in one form or another is the norm, and economic pricing and commercial investing is largely absent. This is despite mounting evidence from other countries that there are more efficient options.
fuel burn for short trips and no measurable increase for long flights.

MERC ATUS CENTER AT GEORGE M A SON UNIVER SIT Y
36