Embed Size (px)
Citation preview
One Gateway Plaza Los Angeles, CA 90012-2952
213.922.2000 Tel metro. net
SYSTEM SAFETY, SECURITY & OPERATIONS COMMITTEE MARCH 19,2015
SUBJECT: MONTHLY UPDATE ON TRANSIT POLICING PERFORMANCE
ACTION: RECEIVE AND FILE
RECOMMENDATION
Receive and file monthly update on transit policing performance.
ISSUE
On September 4, 2014, the board requested that staff provide a monthly update on transit policing performance to Systems Safety and Operations Committee. Specifically, the board requested monthly updates on criminal activity, fare enforcement, response time, deployment and perception of safety.
DISCUSSION
In March 2015, staff continues to be proactive in working with Operations and Los Angeles County Sheriff's Department in addressing perception of safety, criminal activity, fare enforcement, response time, and deployment Below are key highlights:
Perception of Safety:
• The ridership survey was developed to allow staff and law enforcement to receive feedback from the public to their perceptions of the safety. The feedback from the public will help staff in deployment of resources to appropriate areas and enhancing customer interface, such as increase presence in areas identified to be of concerns by the public. The new survey is due back by April 2015.
• The LA Metro Transit Watch app is an extension of the Metro's Transit Watch L.A. Website, www.transitwatchla.org. The app is a quick, easy and anonymous way for L.A. Metro transit riders to communicate directly to Metro Sheriff's about suspicious activity or quality of ride problems at a Metro station or while riding a bus or rail line. LA Metro Transit Watch app users have the option of directly calling Metro Sheriffs or instantly sending them a photo or an incident message. Currently, staff is working on updating the app to add three new categories: Sexual Assault- Physical Contact, Sexual Harassment- Non Physical, and Indecent Exposure as an option for the type of incident occurring. This effort is
Monthly Transit Policing Contract Performance Update
31

part of an agency-wide Sexual Harassment Campaign aimed at decreasing sexual harassment on-board Metro.
Operator Safety:
• Los Angeles Metro Protective Services (LAMPS) is working with Metro Information Technology Department to develop a proof-of-concept for live on-bus video streaming. The live on-bus video capabilities will allow security and law enforcement the ability to gain situation awareness and deploy accordingly to the incident reported as reported by our operators. This exploratory approach will continue for the next four to five months.
• Deterring fare evasion on the bus system is extremely labor and cost intensive. As of January 2015, Transit Security Officers (TSO) have been deployed at high boarding locations in order to facilitate fare compliance. The current pilot program are yielding the following results:
• In the month of January 2015, Transit Security Officers conducted approximately 1, 779 bus boardings, fare checked 12,046 patrons, and ejected 12 patrons due to invalid fare. During February 2-25, 2015, Transit Security Officers conducted approximately 2,018 bus boardings, fare checked 9,67 4 patrons, and ejected 13 patrons due to invalid fare. Since January, TAP reports indicate total fares collected were up by 11% and fares collected from stored value on TAP cards was up by 10% at the bus boarding locations TSO's were deployed to.
Criminal Activity:
System-wide, Part 1 crimes have increased by 3.6% from January 2014-January 2015. The Green, Expo, and Red Lines had a decrease in Part 1 crimes per 1,000,000 riders, while the Blue and Gold Lines increased.
Part 1 Crimes per 1.000.000 Riders
2015 201<4 2013 2012
Jan J~n J~ n J~n
Blue 18 6 1)- 16.0 16.3 10.5
26 1 '1. 29.9 31 6 24 7
Red 4.2 • 51 45 42
15 9 77 100 1 8
14 5 ..;.. 156 00 NA
Oo 1ng 5.9 • 60 28 00
00 8 00 00 4 0
Bus 1 7 • 1 39 1.0 0.8
Monthly Transit Policing Contract Performance Update 2

Overall, buses had an increase in Part 1 crimes per 1,000,000 riders from the same period last year, or for every 3,000,000 riders, we had 1 more Part 1 crime in comparison to last year.
Fare Enforcement:
• In January 2015, law enforcement performed 628,485 fare checks on the rails and Orange Line. In comparison , law enforcement performed 624,691 fare checks on the rails and Orange line in December 2014, resulting in an increase of 3,794 fare checks from December 2014 to January 2015.
FARE CHECK DATA FARE MONTHLY FARE MONTHLY
DEC CHECKS TARGET TARGET RIDERSHIP JAN CHECKS TARGET TARGET RIDERSHIP
Red/Purple 269,907 220,000 123% 4,136,063 Red/Purple 203,111 220,000 88% 4,041,267
Blue 86,213 212,000 41% 2,275,151 Blue 134,068 212,000 41% 2,205,297
Green 95,087 136,000 70% 1,075,163 Green 88,301 136,000 68% 1,032,823 (JOIG 86,507 116,000 75% 1,220,228 c,o d 93,168 116,000 82% 1,197,832
xpo 41,311 90,000 46% 841,756 tX 45,778 90,000 61% 827,887
Orange 45,666 92,000 50% 683,470 Orange 64,059 92,000 54% 680,855
Total 624,691 Total 628,485
Response Time:
• In January 2015, the average response time for "Calls for Service" (Emergency, Priority, and Routine) for all rail lines and buses is 18.6 minutes. LASD currently complies with Metro's Performance Metrics requirement of average 30 minutes for call for service. Specifically, the response time for emergent calls was 5.1 minutes.
Deployment:
• LASD's deployment is based on their Intelligence Led Policing (ILP) strategy. ILP is a policing model created from law enforcement reports, trends, and feedback to identify hot spots that are in critical needs of law enforcement services such as crime and fare enforcement. From month to month , deputies are redeployed to specific lines based on the ILP to ensure the safety of Metro patrons.
NEXT STEPS
Metro Security will continue working with Metro Strategic Initiatives department to explore additional methods in order to obtain more data regarding Metro ridership perception of safety and discuss survey results as they become available. Metro Security will also continue the bus policing pilot program with TSOs, which has proved
Monthly Transit Poli cing Contract Performance Update 3

to extremely effective. Metro will continue working with LASD to establish measurable perception of safety criteria. Staff will provide monthly performance updates.
ATTACHMENT
A: MTA Monthly Report
Prepared by: Duane Martin, DEO Project Management, Office of the CEO
Monthly Transit Policing Contract Performance Update 4

' t ~ Duane H. Martin Deputy Executive 0 cer Project Management
Arthur T. Leahy Chief Executive Offic
Monthly Transit Policing Contract Performance Update 5

LOS ANGELES COUNTY SHERIFF'S DEPARTMENT
TRANSIT POLICING DIVISION RONENE M. ANDA, CHIEF
mMetro
MTA MONTHLY REPORT
January 2015
Prepared by the Crime Analysis Unit

Monthly Statistics
LOS ANGELES COUNTY SHERIFF'S DEPARTMENT
TRANSIT POLICING DIVISION RONENE M. ANDA, CHIEF
TABLE OF CONTENTS
Summary...................................................................................... 3
Part 1 Crimes by Month - Rail.. . . . . . . . . . . . . . . . . . . . . . . . . . . . . . . . . . . . . . . . . .. . . . . . . . . . . . . . . . . 4
Part 1 Crimes by Month- Bus............................................................ 5
Blue Line.................................................................................... 6
Green Line . . . . . . . . . . . . . . . . . . . . . . . . . . . . . . . . . . . . . . . . . . . . . . . . . . . . . . . . . . . . . . . . . . . . . . . . . . . . . . . . . . 7
Expo Line...................................................................................... 8
Red Line.................................................................................... 9
Gold Line . . . . . . . . . . . . . . . . . . . . . . . . . . . . . . . . . . . . . . . . . . . . . . . . . . . . . . . . . . . . . . . . . . . . . . . . .. . . . . . .. .. . 1 o Orange Line . . . . . . . . . . . . .. . . . . . . . . . . . . . . . . . . . . . . . . . . . . . . . . . . . . . . . . . . . . . . . . . . . . . . . . .. . . . . . . . . 11
Silver Line . . . . . . . . . . . . . . . ... . . . . . . . ... . . ..................................................... 12
South Bus....................................................................................... 13
North Bus . . ... . . . . . . . . . . . . . . . . . . .. . . . . . . . . . . .. . . . . . . . . . . . . . . . . . . . . . . . . . . . . . . . . ... 14
Union Station.................................................................... 15
Reserve Company Services..................................................... 16

TRANSIT POLICING DIVISION- January 2015
Jan Crimes - 345
70 Selected Part 2 - 171
60 29 • Part1 - 174
50
40
30
20
10
0
Blue Green Red Gold Expo Orange Silver
M 0 « B ~ U 1 67
p art 1 c· nmes per 1 ,000,000 R"d I ers
2015 2014 2013 2012
Jan Jan Jan jan
Blue 18.6 . 16.0 16.3 10.5
Green 26.1 .0. 29.9 31 .6 24.7
Red 4.2 • 5.1 4.5 4.2
15.9 7.7 10.0 1.8
Expo 14.5 • 15.6 0.0 N!A
Orange 5.9 • 6.0 2.8 0.0
Silver 0.0 = 0.0 0.0 4.0 = Bus 1.7 • 1.39 1.0 0.8 Arrow mdtcates an mcrease or decrease from last year.
Jan Citations - 6565 YTD Citations - 6565 500 1000 1500 2000
Blue
Green
Red
Gold
Expo
Orange
Silver
South Bus
North Bus
Union
January :
Ridership 2,205,297 Fare Checks* 88,226 %Passengers Inspected 4.00% Boardings 936 Rides 0 Fare Warnings 656
Blue
Green
Red
Gold
Expo
Orange
Silver
South Bus
North Bus
Union
0 500 1,000 1,500 2,000
SATURATION RATE GREEN GOLD
1,032,823 4,041,267 1,197,832 93,027 194,369 95,917 9.01% 4.81% 8.01%
660 2,036 1,265 0 0 0
292 1,495 992
YTD Crimes - 345
70
Selected Part 2 · 171 60
29 . Partl - 174
so 41
40
30 21
20
10 1
0 0 Blue 7o:lreen 41Red 44Gold 33Expo l.Drange 12iilver Sc1uth Bus NHrth Bullnion 21
Jan Arrests - 678
Blue
Green
Red
Gold
Expo
Orange
Silver
l South Bus
North Bus
Union
50 100 150 200
Jan Calls For Service - 2303
Blue
Green
Red
Gold
Expo
Orange
Silver
South Bus
North Bus
Union
EXPO 827,887 55,385 6.69% 635
0 205
3
200 400 600 800
ORG TOTAL 680,855 9,985,961 63,372 590,296 9.31% 5.91% 1,387 6,919
0 0 52 3,692
YTD Calls For Service - 2303
0 200 400 600 800
--t- ~
Blue
Green
Red
Gold
Expo
Orange
Silver o19
South Bus
North Bus
Union
System-Wide Highlights
Part 1 Crimes have increased by 3.6% in Jan 2015 compared to Jan 2014.
The Green, Expo, and Red lines had a decrease in part 1 crimes per 1,000,000 riders, while the Blue and Gold Lines increased .
Overall, buses had an increase in part 1 crimes per 1,000,000 riders from the same period last year.
Transit Policing Division Monthly Activ~ ies Report - January, 2015
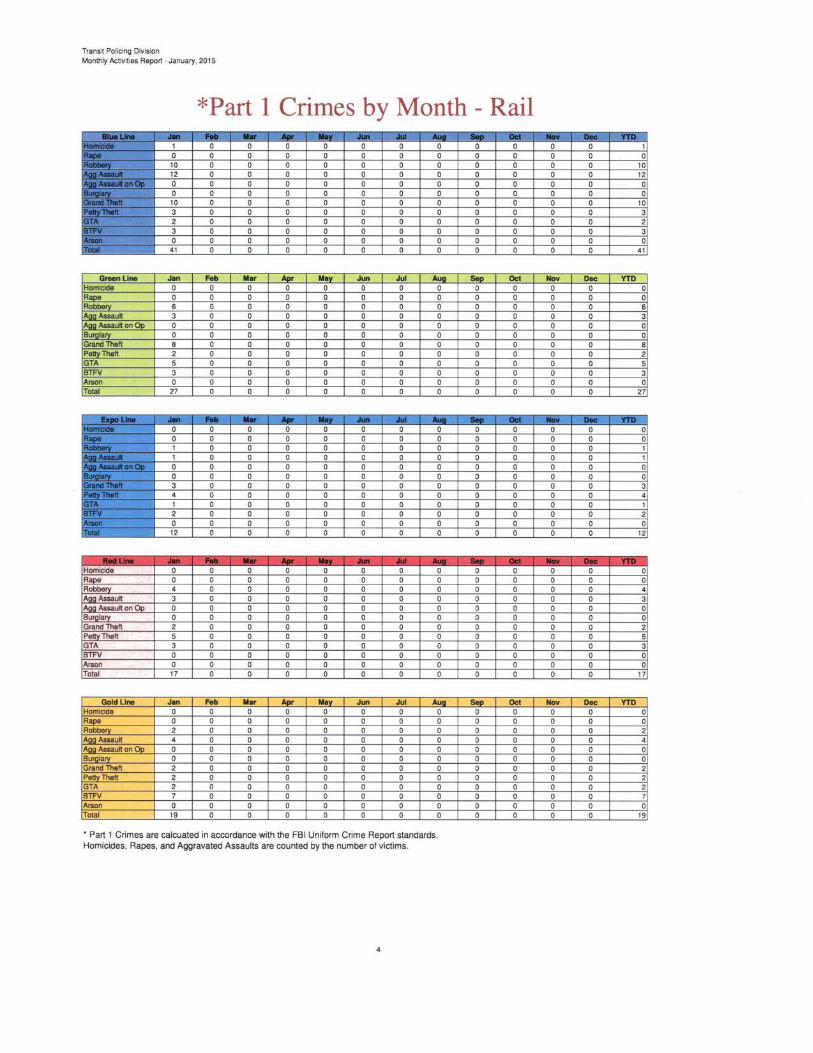
*Part 1 Crimes by Month - Rail
-- M . --- -~ ""' ......_ ...... -- -,, 'F 0 0 0 0 0 0 0 ... ,.,._..,. 0 0 0 0 0 0 •' 10 0 0 0 0 0 0 0
12 0 0 0 0 0 0 0 0 0 0 0 0
).IL~ 0 0 0 0 0 0 0 0 10 0 0 0 0 0
·::T 3 0 0 0 0 0 0 'i' 2 0 0 0 0 0 0
:,:- , ... 3 0 0 0 0 0 0 ,'• 0 0 0 0 0
> 4' 0 0 0 0 0
Q...,.Line Jan Feb Mar l4>r May J ... Jul Aua Homicide 0 0 0 0 0 0 0 0 Rape 0 0 0 0 0 0 0 0 Robbery 6 0 0 0 0 0 0 0 IAaaAssautt 3 0 0 0 0 0 0 0 jAgg Assautt on ::>p 0 0 0 0 0 0 0 0 Buralary 0 0 0 0 0 0 0 0 Grand Theft 8 0 0 0 0 0 0 0 Petty Theft 2 0 0 0 0 0 0 0 GTA 5 0 0 0 0 0 0 0 BTFV 3 0 0 0 0 0 0 0 Arson 0 0 0 0 0 0 0 0 Total 27 0 0 0 0 0 0 0 _ .... --- .... -- --- - - . M ... IDntlllltla 0 0 0 0 0 0 0 IIIII 0 0 0 0 0 0 Iaiii , 0 0 0 0 0
0 0 0 0 0 0 0 0 0 0 0 0 0
,i • 0 0 0 0 0 0 0 3 0 0 0 0 0 0 0 4 0 0 0 0 0 , .. 0 0 0 0 0 0
IIJJI'Y 2 0 0 0 0 0 0 0
R: 0 0 0 0 0 0 12 0 0 0 0 0 0 0
Homicide 0 0 0 0 0 0 0 0 Rape 0 0 0 0 0 0 0 0 Robbery 4 0 0 0 0 0 0 0 Agg Assautt 3 0 0 0 0 0 0 0 Aaa Assautt on Op 0 0 0 0 0 0 0 0 Burglary 0 0 0 0 0 0 0 0 Grand Theft 2 0 0 0 0 0 0 0 Petty Theft 5 0 0 0 0 0 0 0 GTA 3 0 0 0 0 0 0 0 BTFV 0 0 0 0 0 0 0 0 Arson 0 0 0 0 0 0 0 0 Total 17 0 0 0 0 0 0 0
Gold Line Jan Feb Mar l4>r May J ... Jul Aua Homicide 0 0 0 0 0 0 0 0 Rape 0 0 0 0 0 0 0 0 Robbery 2 0 0 0 0 0 0 0 Aaa Assautt 4 0 0 0 0 0 0 0 Agg Assautt on Op 0 0 0 0 0 0 0 0 Burglary 0 0 0 0 0 0 0 0 Grand Theft 2 0 0 0 0 0 0 0 Petty Theft 2 0 0 0 0 0 0 0 GTA 2 0 0 0 0 0 0 0 BTFV 7 0 0 0 0 0 0 0 Arson 0 0 0 0 0 0 0 0 Total 19 0 0 0 0 0 0 0
• Part 1 Crimes are calcuated in accordance with the FBI Uniform Crime Report standards. Homicides, Rapes, and Aggravated Assaults are counted by the number of victims.
4
-- --0 0 0 0 0 0 0 0 0 0 0 0 0 0 0_ 0
Sell Oct 0 0 0 0 0 0 0 0 0 0 0 0 0 0 0 0 0 0 0 0 0 0 0 0
-- . Gtlt" 0 0 0 0 0 0 0 0 0
0 0 0 0 0 0 0
0 0 0 0 0 0 0 0 0 0 0 0 0 0 0 0 0 0 0 0 0 0 0 0
Sell Oct 0 0 0 0 0 0 0 0 0 0 0 0 0 0 0 0 0 0 0 0 0 0 0 0
t---1"-..- .:!.. .no, 0 0 0 tO 0 0 0 0 0 0 10 0 0 0 0 0 0 0 0 41
Nov Dec YTD 0 0 0 0 0 0 0 0 6 0 0 3 0 0 0 0 0 0 0 0 8 0 0 2 0 0 5 0 0 3 0 0 0 0 0 27
-.... ~!Iii: ~no: 0 0 0 0 0 0 0 0 0 0 0 0 0 0 0 0 0 0 0 0 0
0 0 0 0 0 0 0 0 4 0 0 3 0 0 0 0 0 0 0 0 2 0 0 5 0 0 3 0 0 0 0 0 0 0 0 17
Nov Dec YTD 0 0 0 0 0 0 0 0 2 0 0 4 0 0 0 0 0 0 0 0 2 0 0 2 0 0 2 0 0 7 0 0 0 0 0 19

Transit Policing Division Monthly Activ~ ies Report - January, 2015
Part 1 Crimes by Month - Bus a.-u. .... ..... ... - - ..... .lui - - 0111 Nov Dec YTD
Hamcide 0 0 0 0 0 0 0 0 0 0 0 0 0 - 0 0 0 0 0 0 0 0 0 0 0 0 0 labbiiY 1 0 0 0 0 0 0 0 0 0 0 0 1 laiiAIIaull 0 0 0 0 0 0 0 0 0 0 0 0 0 11111"-lltanOD 0 0 0 0 0 0 0 0 0 0 0 0 0 lulallrY 0 0 0 0 0 0 0 0 0 0 0 0 0
Onllldlhd 0 0 0 0 0 0 0 0 0 0 0 0 0 :PeiiY Theft 2 0 0 0 0 0 0 0 0 0 0 0 2 GTA 1 0 0 0 0 0 0 0 0 0 0 0 1 B11'V 0 0 0 0 0 0 0 0 0 0 0 0 0 Anion 0 0 0 0 0 0 0 0 0 0 0 0 0 ,... 4 0 0 0 0 0 0 0 0 0 0 0 4
Silver Line Jan Feb Mar Apr May Jun Jul Aug Sep Oct Nov Dec YTD Homicide 0 0 0 0 0 0 0 0 0 0 0 0 0 Rape 0 0 0 0 0 0 0 0 0 0 0 0 0 Robbery 0 0 0 0 0 0 0 0 0 0 0 0 0 Agg Assau~ 0 0 0 0 0 0 0 0 0 0 0 0 0 Aaa Assau~ on ()p 0 0 0 0 0 0 0 0 0 0 0 0 0 Buralary 0 0 0 0 0 0 0 0 0 0 0 0 0 Grand Theft 0 0 0 0 0 0 0 0 0 0 0 0 0 Pettvlheft 0 0 0 0 0 0 0 0 0 0 0 0 0 GTA 0 0 0 0 0 0 0 0 0 0 0 0 0 BTFV 0 0 0 0 0 0 0 0 0 0 0 0 0 Arson 0 0 0 0 0 0 0 0 0 0 0 0 0 Total 0 0 0 0 0 0 0 0 0 0 0 0 0
Union Station Jan Feb Mar Apr May Jun Jul Aug Sep Oct Nov Dec YTD Homicide 0 0 0 0 0 0 0 0 0 0 0 0 0 Rap<> 0 0 0 0 0 0 0 0 0 0 0 0 0 Robbery 0 0 0 0 0 0 0 0 0 0 0 0 0 Aaa Assau~ 3 0 0 0 0 0 0 0 0 0 0 0 3 Agg Assau~ on Op 0 0 0 0 0 0 0 0 0 0 0 0 0 Burglary 0 0 0 0 0 0 0 0 0 0 0 0 0 Grand Theft 1 0 0 0 0 0 0 0 0 0 0 0 1 Petty Theft 3 0 0 0 0 0 0 0 0 0 0 0 3 GTA 0 0 0 0 0 0 0 0 0 0 0 0 0 BTFV 1 0 0 0 0 0 0 0 0 0 0 0 1 Arson 0 0 0 0 0 0 0 0 0 0 0 0 0 Total 8 0 0 0 0 0 0 0 0 0 0 0 8
Total Jan Feb Mar Apr May Jun Jul Aug Sep Oct Nov Dec YTD Homicide 1 0 0 0 0 0 0 0 0 0 0 0 1 Race 0 0 0 0 0 0 0 0 0 0 0 0 0 Robbery 38 0 0 0 0 0 0 0 0 0 0 0 38 Aaa Assauft 40 0 0 0 0 0 0 0 0 0 0 0 40 Agg Assau~ on Op 0 0 0 0 0 0 0 0 0 0 0 0 0 Burglary 1 0 0 0 0 0 0 0 0 0 0 0 1 Grand Theft 34 0 0 0 0 0 0 0 0 0 0 0 34 Petty Theft 27 0 0 0 0 0 0 0 0 0 0 0 27 GTA 17 0 0 0 0 0 0 0 0 0 0 0 17 BTFV 16 0 0 0 0 0 0 0 0 0 0 0 16 Arson 0 0 0 0 0 0 0 0 0 0 0 0 0 Total 174 0 0 0 0 0 0 0 0 0 0 0 174

Transit Policing Division B,LUE LINE Monthly Activities Report - January, 2015
REPORTED CRIME Part 1 Crimes per Station PART 1 CRIMES Jan YTD Station Jan YTD Homicide 1 1 7th/Metro 1 1 Rape 0 0 Assault Victims YTD Pi co 2 2 Robbery 10 10
@ Grand ~
Agg Assault* 12 12 O Patron
San Pedro i1
I~ D Domestic
Agg Assault on Op 0 0 Operator Washington 1 Burglary 0 0 O Deputy Vernon 0 Grand Theft 10 10 I!IOther Non-Patron Slauson 2 Petty Theft 3 3 Florence 3 Motor Vehicle Theft 2 2 Firestone BurgfTheft From Vehicle 3 3 103rd St 12 Arson 0 0 Willowbrook 15 SUB-TOTAL 41 41 Compton 3 Selected Part 2 Crimes Artesia 7
Battery* 6 6 Battery Victims YTD Del Amo •3 Battery Rail Operator 0 0 Wardlow 0 Sex Offenses 2 2
""'= ffi Willow 2 Weapons 2 2 O Domest1c 2 PCH 0 Narcotics 6 6 Ope rator 3
Anaheim j
Trespassing 7 7 D Deputy 1
5th St 2 1!J Other Non-Patron 0 Vandalism 6 6 1st St 0 0 SUB-TOTAL 29 29 Transit Mall 2 2 TOTAL 70 70 Pacific 0 0
Total 41 41
1 45
40 I 41
35
30 31.0
25
20 .i'3 - *5YrAvg
15
10
5
Part 1 Crimes - 2015 ~ so c AI --
0 ~ 01 01 01 81 81 81 81 81 81 01 0 • · -
0 Jan Feb Mar Aor M11_y Jun Jul Aug~e._ Oct Nov Dec J
2010 2011 2012 2013 2014 2015
•s yr average is based on the average of part 1 crimes from 2010 - 2014.
6
ARRESTS Type Jan YTD Felony 34 34 Misdemeanor 144 144 TOTAL 178 178
CITATIONS Type Jan YTD Fare Evasion Citations 1 '1 01 1 '1 01 Other Citations 45 45 Vehicle Code Citations 280 280 TOTAL 1,426 1,426
CALLS FOR SERVICE TYPE Jan YTD
Total Avg Total Avg Emergency 27 4.5 27 4.5 Priority 180 18.6 180 18.6 Routine 190 21.2 190 21.2 Total 397 18.9 397 18.9
FARE ENFORCEMENT -··
Jan YTD Ridership 2,205,297 2,205,297 Fare Checks 88,226 % of Patrons Inspected 4.00 Boardings 936 Ride 0 Fare Warning 656
Blue Line Hi hli hts The Blue Line had 5 more part 1 crimes,which is a 14% increase from the same period last year.
Part 1 crimes per 1,000,000 riders were up from the same period last year.
88,226 4.00
936 0
656

Transit Policing Division Monthly Activities Report - January, 2015 GREEN INE
REPORTED CRIME PART 1 CRIMES Jan Homicide 0 Rape 0 Robbery 6 Agg Assault 3 Agg Assault on Op 0
Burglary 0 Grand Theft 8 Petty Theft 2 Motor Vehicle Theft 5 -Burg/Theft From Vehicle 3 Affion 0 SUB-TOTAL 27 Selected Part 2 Crimes
Battery 3 Battery Rail Operator 0 Sex Offenses 0 VVeapons 1 Narcotics 5 Trespassing 2 Vandalism 3 SUB-TOTAL 14 TOTAL 41
40
YTD 0 0 6 3 0 0 8 2 5 3 0
27
3 0 0
5 2 3 14 41
Assault Victims YTD
D Patron cg 0 Domesttc 1
111
Operator
D Deputy 2 oO
1!!!1 Other Non-Patron
Battery Victims YTD
D Patron ® O Domesttc 1
Operator
D Deputy 2
111 0ther Non-Patron °
Part 1 Crimes - YTD 35 ~
30
25
20 ~
19 15 I7
Part 1 Crimes per Station Station Jan VTD Redondo Beach 1 1 Douglas 0 0 EISegundo 0 0 Mariposa · 0 0 Aviation 3 3 Hawthorne Crenshaw Vermont Harbor Avalon Willowbrook Long Beach Lakewood
Norwalk Total
4 1 0 3 0 7 5 1
2 27
I -<>- YTD Totals I
4 1 0 3 0 7 5 1
2 27
10 50
5
Part 1 Crim:::e::_s _- _:2:.:0:::1::_5 _____________ _ I~ Jan Feb Mar Jun Jul Aui Se Oct Nov Dec
0
2010 2011 2012 2013 2014 2015
·s yr average is based on the average of part 1 crimes from 2010 - 2014.
7
ARRESTS Type Felony Misdemeanor TOTAL
Jan 15 36 51
YTD 15 36 51
CITATIONS Type Fare Evasion Citations Other Citations Vehicle Code Citations TOTAL
Jan 810 83 51
944
YTD 810 83 51
944
CALLS FOR SERVICE TYPE
Emergency Priority Routine Total
Jan Total Avg
6 4 .7 78 10.9 115 22.5 199 17.4
YTD Total
6 78 115 199
Avg 4.7 10.9 22.5 17.4
FARE ENFORCEMENT
Ridership Fare Checks % of Patrons Inspected Boardings Ride Fare VVarning
Jan 1,032,823
93,027 9.01
660 0
292
Green line Hi hli hts
YTD 1,032,823
93,027 9.01
660 0
292
The Green Line had 8 less part 1 crimes, which is a 23% decrease from the same period last year.
Part 1 crimes per 1,000,000 riders were down from the same period last year.

Transit Policing Division Monthly Activities Report - January, 2015 EXPO LINE
REPORTED CRIME Part 1 Crimes per Station PART 1 CRIMES Jan VTD Station Jan VTD Homicide 0 0 7th/Metro 0 0 Rape 0 0 Assault Victims YTD Pi co 0 0 Robbery 1 1 23rd St 1 1 Agg Assault 1 1 0~~· CD Jefferson/USC 0 0 Agg Assault on Op 0 0 D Domest1c Expo/USC 0 0 Burglary 0 0 Operator Expo/Vermont 0 0 Grand Theft 3 3
O Deputy 1 Expo/Western 1 1 Petty Theft 4 4
~ Other Non-Patron Expo/Crenshaw 0 0 -Motor Vehicle Theft 1 1 Farmdale 0 0
Burg/Theft From Vehicle 2 2 1 1 Arson 0 0 3 3 SUB-TOTAL 12 12 6 6 Selected Part 2 Crimes 12 12
Battery 0 0 Battery Victims YTD
Battery Rail Operator 0 0 0
Sex Offenses 0 0 D Patron
Weapons 0 0 O Domestic
Operator Narcotics 0 0 O Deputy Trespassing 2 2 ~ Other Non-Patron
Vandalism 1 1 SUB-TOTAL 3 3 TOTAL 15 15
Part 1 Crimes - YTD 12 -r= -- orr
....... ?"!' I -<>-YTD Totals
--*2Yr Avg
6
4 20
[ ____!art 1 Crimes- 2015 _
o -~ e. e. e, e. e, e. e. e. a, e. ~ 2
Jan Feb Mar Apr May" Jun Jul Aug Sep Oct Nov Dec
0
2012 2013 2014 2015
•Expo line opened in April 2012, so a 2 yr average from 2013 - 2014 is calculated"
8
ARRESTS Type Jan VTD Felony 8 3 Misdemeanor 26 21 TOTAL 34 24
CITATIONS Type Jan VTD Fare Evasion Citations 391 391 Other Citations 31 31 Vehicle Code Citations 68 68 TOTAL 490 490
CALLS FOR SERVICE TYPE
Emergency Priority Routine Total
Jan Total Avg
3 7.0 42 12.9 59 27.1 104 20.7
FARE ENFORCEMENT Jan
Ridership 827,887 Fare Checks 55,385 %of Patrons Inspected 6.69
Boardings 635 Ride 0 Fare Warning 205
Total 3
42 59 104
VTD
VTD
Avg 7.0 12.9 27.1 20.7
827,887 55,385
6.69
635 0
205

Transit Policing Division Monthly Activities Report - January, 2015 RED~ LINE
REPORTED CRIME Part 1 Crimes per Station PART 1 CRIMES Jan YTD Station Jan YTD Homicide 0 0 Union Station 2 2 Rape 0 0 Robbery 4 4
Assault Victims YTD Civic Center 0 0 Pershing Square 1 1
Agg Assault 3 3 Agg Assault on Op 0 0
Burglary 0 0
Grand Theft 2 2 Petty Theft 5 5
.~.-.... ~(!) O Patron
O Domestic
Operator
D Deputy
7th/Metro 0 0 Westlake 0 0
Wilshire/Vermont 2 2 Wilshlre/Normandle 1 1 Vermont/Beverly 0 0
Motor Vehicle Theft 3 3 Wilshire/Western Burg/Theft From Vehicle 0 0 Vermont/Santa Monica Arson 0 0 Vermont/Sunset 0 IO SUB-TOTAL 17 17 Hollywood/Western Selected Part 2 Crimes
Battery 7 7
Hollywood/Vine 1 1
Hollywood/Highland 3 3 Battery Victims YTD
Battery Rail Operator 0 0 Sex Offenses 2 2 Weapons 1 1 Narcotics 7 7 Trespassing 5 5
Universal 1 1 North Holl ood 3 3 Total 17 17
0
O Patron ® . 1 D Domestic 1 .
Operator ·
O Deputy 1 4
1!!!1 Other Non-Patron "
Vandalism 5 5 SUB-TOTAL 27 27 TOTAL 44 44
25
Part 1 Crimes - YTD
20
15
-~~~- - -~:s;:o;;:::-----
~ _:;;:::::==-" __ 19 v 171.2
1~ ---- ----
10 12
- YTDTotals
--•5vrAvg
0 2010 2011 2012 2013 2014 2015
'5 yr average is based on the average of part t crimes from 201 0 - 2014.
9
ARRESTS Type Jan YTD Felony 21 23 Misdemeanor 73 81 TOTAL 94 104
CITATIONS Type Jan YTD Fare Evasion Citations 1,165 1,165 Other Citations 108 108 Vehicle Code Citations 228 228 TOTAL 1,501 1,501
CALLS FOR SERVICE TYPE Jan YTD
Total Avg Total Avg Emergency 15 5.6 Priority 174 13.7 Routine 218 24.7 Total 407 19.3
FARE ENFORCEMENT
Ridership Fare Checks % of Patrons Inspected
Boardings Ride Fare Warning
Jan 4,041,267 194,369
4.81
2,036 0
1,495
15 5.6 174 13.7 218 24.7 407 19.3
YTD 4,041,267 194,369
4.81
2,036 0
1,495

Transit Policing Division Monthly Activities Report - January, 2015 GO~LD· INE
REPORTED CRIME Part 1 Crimes per Station ARRESTS PART 1 CRIMES Jan VTD Station Homicide 0 0 Sierra Madre Rape 0 0 Allen Robbery 2 2 Agg Assault 4 4
Assau lt Victims YTD Lake Memorial Park
Agg Assault on Op 0 0 Burglary 0 0 Grand Theft 2 2 Petty Theft 2 2 Motor Vehicle Theft 2 2
0 0
Operator m2
D Deputy
~ Other Non-Patron . ::...
O Patron
O Domestic
Del Mar
Fillmore South Pasadena Highland Park SW Museum
Burgffheft From Vehicle 7 7 Heritage Square Arson 0 0 Lincoln Heights SUB-TOTAL 19 19 Chinatown Selected Part 2 Crimes Union Station Battery 3 3 Battery Victims YTD Little Tokyo Battery Rail Operator 0 0 Sex Offenses Weapons 2 2 Narcotics 3 3 Trespassing
0
D Patron cg O Domest1c 1
Operator
D Deputy 2
!ill Other Non-Patron °
Plco Mariachi Soto Indiana Maravilla
Vandalism 4 4 East La SUB-TOTAL 14 14 Atlantic TOTAL 33 33 Total
20
18 Part 1 Crimes -VTD
~~~-~::..:_::__=--::::
:: I] I Jan
12
Part 1 Crimes- 2015 19
00000000000 .Feb Mar Apr May Jun Jul ~ug Sep Oct Nov Dec
10 11
8
6
4 --YTD Totals
2 --•svrAvg
0
2010 2011 2012 2013 2014
·s yr average is based on the average of part 1 crimes from 2010-2014.
10
Jan VTD 0 0 1 1 0 0 1 1 1
0 0 0 0 2 2 0 0 2 2 2 2 0 0 2 2 1 1 0 0 0 0 1 1 6 6 0 0 0 0 0 0 19 19
19
6.2
2015
Type Jan VTD Felony 10 10 Misdemeanor 28 40 TOTAL 38 50
CITATIONS Type Jan VTD Fare Evasion Citations 554 554 Other Citations 75 75 Vehicle Code Citations 134 134 TOTAL 763 763
CALLS FOR SERVICE TYPE Jan VTD
Total Avg Total Avg Emergency 6 4.8 6 4.8 Priority 87 16.2 87 16.2 Routine 65 30.0 65 30.0 Total 158 21 .4 158 21.4
FARE ENFORCEMENT Jan VTD
Ridership 1 '197,832 1,197,832 Fare Checks 95,917 95,917 % of Patrons Inspected 8.01 8.01
Boardings 1,265 1,265 Ride 0 0 Fare Warning 992 992
Gold Line Highlights The Gold Line had 10 more part 1 crimes, which is an 111% increase of from the same period last year.
Part 1 crimes per 1,000,000 riders were up from the same period last year.

Transit Policing Division Monthly Activities Report - January, 2015 ORANGE LINE
I 1rt:DCRIME PART 1 CRIMES Homicide Rape Robbery Agg Assault Agg Assault on Op
Burglary Grand Theft Petty Theft Motor Vehicle Theft Burg!Theft From Vehicle Arson SUB-TOTAL Selected Part 2 Crimes
Battery Battery Bus Operator Sex Offenses Weapons Narcotics Trespassing Vandalism SUB-TOTAL TOTAL
Jan 0 0 1 0 0 0 0 2 1 0 0 4
3 0 0 0 2 1 2 8 12
VTD 0 0 1
0 0
0 0 2 1 0 0 4
3 0 0 0 2 1 2 8 12
I
Assault Victims YTD
O Patron
O Domestic
Operator
D Deputy
II Other Non-Patron
0
Battery Victims YTD
0
D Patron @ D DomestJc 1
Operator
D Deputy 2
1!1 Other Non-Patron °
Part 1 Crimes Station North Hollywood Laurel Canyon 0 Valley College 0 Woodman 0 Van Nuys 0
Sepulveda 0 Woodley 0 Balboa 0 Reseda 2 Tampa 0 Pierce College 0 DeSoto 0 Canoga
Warner Center Sherman Way Roscoe Nordhoff Chatsworth Total
1
0 0 0 0
4
0 0 0 0
0 0 0 2 0 0 0 1
0 0 0 0
4
1: ~ _part 1 Crimes - YTD
1J --YTD Totals
8 I : I
Part 1 Crimes - 2015 --•svrAvg
~~. B B• 6 1 B• 9 1 0 1 er=- e, 6 ~ I Jan Feb Mar Apr May Jun Jul Aug Sep Oct Nov Dec
5
:r -~-- -- z 4 4---
2.6 - . ·- 2
~ ,./ ........__ 0 e
2010 2011 2012 2013 2014 2015
11
I ARREl ns I Type Jan VTD Felony 1 3 Misdemeanor 18 25 TOTAL 19 28
I CIT AllONS I Type Jan VTD Fare Evasion Citations 233 233 Other Citations 7 7 Vehicle Code Citations 92 92 TOTAL 332 I 332
I CALLS FOR SERVICE TYPE Jan VTD
Total Avg Total Avg Emergency 3 7.0 3 7.0 Priority 30 14.0 30 14.0 Routine 32 28.2 32 28.2 Total 65 20.7 65 20.7
FARE ENFORCEMENT Jan
Ridership 680,855 680,855 Fare Checks 63,372 63,372 % of Patrons Inspected 9.31 9.31 Boardings 1,387 1,387 Ride 0 0 Fare Warning 52 52
Orange Line Highl ights The Orange Line had the same amount of part 1 crimes from t he same period last year.
Part 1 crimes per 1,000,000 were down from the same period last year .
I

Transit Policing Division Monthly Activities Report - January, 2015
REPORTED CRIME PART 1 CRIMES Jan YTD Homicide 0 0 Rape 0 0 Robbery 0 0 Agg Assault 0 0 Agg Assault on Op 0 0 Burglary 0 0 Grand Theft 0 0 Petty Theft 0 0 Motor Vehicle Theft 0 0 Burg!Theft From Vehicle 0 0 Arson 0 0 SUB-TOTAL 0 0 Selected Part 2 Crimes
Battery 1 1 Battery Bus Operator 0 0 Sex Offenses 0 0 Weapons 0 0 Narcotics 0 0 Trespassing 0 0 Vandalism 0 0 SUB-TOTAL 1 TOTAL 1
SILVER LINE
Assault Victims YTD
0
D Patron
I O Domestic
Operator
O Deputy
Other Non-Patron
Battery Victims YTD
O Patron
D Domestic
Operator
O Deputy
Other Non-Patron
0
Part 1 Crimes per Station Station Jan YTD El Monte 0 0 Cal State LA 0 0 LAC/USC 0 0 Alameda 0 0 Downtown 0 0 37th St!USC 0 0 Slauson 0 0 Manchester 0 0 Harbor Fwy 0 0 Rosecrans 0 0 Harbor/Gateway 0 0 Total 0 0
5 Part 1 Crimes- YTD
4 L - YTDTotals
3 o +---o a e a a a e a e a a a ~------------------------~ - ·4YrAvg
2
0 I W-.c: o ,..~ a ~-3 ~--3 ~-
2011 2012 2013 2014 2015
•4 yr average is based on the average of part 1 crimes from 2011 - 2014.
12
ARRESTS Type Jan YTD Felony 0 0 Misdemeanor 2 3 TOTAL 2 3
CITATIONS Type Jan YTD Fare Evasion Citations 0 0 Other Citations 1 1 Vehicle Code Citations 16 16 TOTAL 17 17
CALLS FOR SERVICE TYPE
Emergency Priority Routine Total
Jan Total Avg
1 4.0 11 9.1 7 23.6 19 14.2
YTD Total
1 11 7 19
FARE ENFORCEMENT Jan YTD
Avg 4.0 9.1
23.6 14.2
Ridership 349,956 349,956 Fare Checks 317 317 % of Patrons Inspected 0.09 0.09 Boardings 19 19 Ride 0 0 Fare Warning 0 0
Silver Line Highlights
The Silver Li ne had 0 part 1 crimes, which is the same as last year.

Transit Policing Division Monthly Activities Report- January, 2015 South Bus Patrol
REPORTED CRIME PART 1 CRIMES Jan Homicide 0 Rape 0 Robbery 8 Agg Assault 5 Agg Assault on Op 0 Burglary Grand Theft 4 Petty Theft 1 Motor Vehicle Theft 1 Burg/Theft From Vehicle 0 Arson 0 SUB-TOTAL 20 Selected Part 2 Crimes
Battery Battery Bus Operator Sex Offenses Weapons Narcotics Trespassing Vandalism SUB-TOTAL TOTAL
25
20
6 4 1 0 9 0 1
21 41
YTD 0 0 8 5 0
4 1 1 0 0 20
6 4 1 0 9 0 1
21 41
Assault Victims YTD
O Patron
O Domestic
Operator
O Deputy
Other Non~Patron
0 -) 0
Battery Victims YTD
0
4r orn"'"""'"'"" - ) 0
O Patron
[) Domestic
Operator
O Deputy
Part 1 Crimes - YTD
5: l _ l'art LCriinl!c_2015_
15 ~ e e a a a e e e s so Jan Feb Mar Apr May Jun Jul Aug Sep Oct Nov Dec
10
Part 1 Crimes per Sector
Sector Jan IYTD Gateway Cities 4 4 South Bav 16 16 Total 20 120
J
j \~ (
\ \ : l ,_Gatcway Cities
~ south sa)- I / /
1.)
' ' ~----.... '. ' .l'f:.~~ '·J·?'~
20
5
~ 8.4
1 -o-YTD Totals
--•svrAvg
0
2010 2011 2012 2013 2014 2015
·s yr average is based on the average of part 1 crimes from 2010 - 2014.
13
ARRESTS Type Jan YTD Felony 16 16 Misdemeanor 80 80 TOTAL 96 96
CITATIONS Type Jan YTD Fare Evasion Citations 4 4 Other Citations 0 0 Vehicle Code Citations 118 118 TOTAL
TYPE
Emergency Priority Routine Total
Ridership*
122 122
CALLS FOR SERVICE Jan
Total Avg 7 6.4
94 16.3 97 30.6 198 22.9
FARE ENFORCEMENT Jan
0
Total 7
94 97 198
YTD
YTD 0
Avg 6.4 16.3 30.6 22.9
Fare Checks 12,941 12,941 % of Patrons Inspected N/A N/A Boardings 493 493 Ride 671 671 Fare Warning 72 72
*Ridership data is combined with North Bus on next page. All other Fare Enforcement data is for South Bus only.
South Bus Highlights The South bus Lines had 9 more part 1 crimes, which is an 82% increase from the same period last year.

Transit Policing Division Monthly Activities Report - January, 2015 North Bus Patrol
REPORTED CRIME PART 1 CRIMES Jan YTD Homicide 0 0 Rape 0 0
Assault Victims YTD Robbery 6 6 Agg Assault 9 9
o•·~· () Agg Assault on Op 0 0 Burglary 0 0
O Domestic
Grand Theft 4 4 Operator
O Deputy 8
Petty Theft 5 5 Other Non-Patron
Motor Vehicle Theft 2 2 Burgffheft From Vehicle 0 0 Arson 0 0 . SUB-TOTAL 26 26 " -Selected Part 2 Crimes
Battery 15 15 Battery Victims VTD
Battery Bus Operator 5 5 0 0
Sex Offenses 5 5 O Patron IJ 5 Weapons 1 1 O Domestic
Narcotics 8 8 Operator \
Trespassing 0 0 O Deputy
Other Non-Patron Vandalism 7 7 SUB-TOTAL 41 41 TOTAL 67 67
40
35
30
25
20
15
10 so I e e e ~ 8 8 8 8 9 8 8 9 0
ParULrlmes_..lOli
Jan Feb Mar Apr May Jun Jul Aug Sep Oct Nov Dec 5
0
2010 2011 2012 2013 2014
•s yr average is based on the average of part 1 crimes from 2010 · 2014.
Part 1 Crimes per Sector Sector Jan San Gabriel 5 Westside 3
I San Fernando 0 Central 18
', Total 26
I San Fcmando ~ \_l t,
( #•. ,/"
"t .,_
' ..?~ Central L ( Westaldo
r I..__, ,J '..,
Ill \
26.0
I - YTD Totals
--•svrAvg
2015
14
·-r·- ~::
J
YTD 5 3 0 18 26
San Gabnel Valley
ARRESTS Type Jan YTD Felony 27 27 Misdemeanor 77 77 TOTAL 104 104
CITATIONS Type Jan YTD Fare Evasion Citations 13 13 Other Citations 28 28 Vehicle Code Citations 861 861 TOTAL 902 902
CALLS FOR SERVICE TYPE Jan
Total Avg Emergency 15 6.5 Priority 332 15.7 Routine 322 29.1 Total 669 21.9
FARE ENFORCEMENT
Ridership* Fare Checks % of Patrons Inspected
Boardings Ride Fare Warning
Jan 26,643,412
135,807 0.51
5,090 723 452
*Ridership is for both South and North buses
YTD Total Avg
15 6.5 332 15.7 322 29.1 669 21 .9
YTD 26,643,412
135,807 0.51
5,090 723 452
All other Fare Enforcement data is for North Bus only.
North Bus Highlights The North bus Lines had 12 less part 1 crimes, which is a 32% decrease from t he same period last year.

Transit Policing Division Monthly Activities Report - January, 2015
REPORTED CRIME PART 1 CRIMES Jan Homicide 0 Rape 0 Robbery 0 Agg Assault 3 Agg Assault on Op 0 Burglary 0 Grand Theft 1 Petty Theft 3 Motor Vehicle Theft 0 BurgfTheft From Vehicle 1 Arson 0 SUB-TOTAL 8 Selected Part 2 Crimes
Battery 7 Battery Bus Operator 0 Sex Offenses 0 Weapons 2 Narcotics 2 Trespassing 2 Vandalism 0 SUB-TOTAL 13 TOTAL 21
1 14
YTD 0 0 0 3 0
0 1 3 0 1 0 8
7 0 0 2 2 2 0
13 21
Assault Victims YTD
.0
O Patron
O DomestiC
Operator '
0 Deputy 0 1!!1 Other Non-Patron
I)
Battery Victims YTD
O Patron
O Domest ic
Operator
0 Deputy
Part 1 Crimes - YTD
12 Part 1 Crimes - 2015
10 1: l 8 0 o. 0 0 0 o. 0 • o. o. o. -e.
8 Jan Feb Mar Apr May Jun Jul Aug Sep Oct Nov Dec
Part 1 Crimes at Union Station
Westside 2 12 Eastside 6 6 Total 8 18
Westside ''-·•- -..., ...
<> YTD Totals
--*3YrAvg
6 - -- ---- --- -~
4
0 -·()-0
2012
~
/
2013
"3 yr average is based on the average of part 1 crimes from 2012 · 2014.
2.7
2014 2015
15
ARRESTS Type Jan YTD Felony 7 13 Misdemeanor 22 27 TOTAL 29 40
CITATIONS Type Jan YTD Fare Evasion Citations 9 9 Other Citations 15 15 Vehicle Code Citations 44 44 TOTAL 68 68
CALLS FOR SERVICE TYPE
Emergency Priority Routine Total
Jan Total Avg
3 1.0 35 6.0 49 11.8 87 9.1
Union Station Highlights
YTD Total Avg
3 1.0 35 6.0 49 11 .8 87 9.1
Union Station had 6 more part 1 crimes, which is a
300% increase from the same period last year.

LOS ANGELES COUNTY SHERIFF'S DEPARTMENT
TRANSIT POLICING DIVISION RONENE M. ANOA, CHIEF
ALLOCATION OF LAW ENFORCEMENT SERVICES RESERVE COMPANY SERVICES
January 2015
I JAN FEB MAR APR MAY JUN JUL AUG SEP OCT NOV DEC TSB San Fernando Valley 121
Westside/Central Motors 156 SGV Volunteer Company 437
Blue/Green Line Sector 32 TOTAL 746 0 0 0 0 0 0 0 0 0 0 0
YTD 121 156 437 32 746
•Each month, Reserve totals Will display totals from the prev1ous month because totals are not subm1tted unt1l the end of each month.
The LASD reserve units are attached to regular LASD units of assignments. The reserves are there. to perform the same function as any deputy. In that way, the reserves augment the force at no increase in cost. Contract agencies benefit significantly by the presence of reserves since they are directly paying for the LASD contract and do not have to pay for the additional reserve force .
www .lasdreserve.org.
16