Embed Size (px)
Citation preview
24
Chapter 3
On the Theory of the CO+OH Reaction: Tunneling Effect
and the O-isotope Anomaly
[This chapter submitted to the Journal of Chemical Physics.]
25
Abstract
The kinetic oxygen isotope effect (KIE) in the HO+CO reaction is different from the value
expected in the Bigeleisen-Mayer formula. The possible factors influencing the small KIE in
H18O+CO are discussed. Since these factors can differ in their sign, the calculation results are
sensitive to the theoretical input. Qualitative features are described for comparing with the
experimental results. An experiment that avoids a possible role of vibrationally excited OH
radicals as reactants is also suggested. The effect of H-tunneling on the well-known Bigeleisen-
Mayer formula for the KIE is also discussed. The results reduce to the expected from that B-M
result when the tunneling is omitted.
26
I. INTRODUCTION
The CO+OH→CO2+H reaction is known to be the principal reaction for oxidizing
CO in the atmosphere and controlling the OH radical concentration.1
It has been ex-
tensively studied both by experiments2–16
and by theoretical calculations.16–24
Our own
interest in the reaction from: it having been occasionally identified as a reaction showing
a “mass-independent” oxygen isotope fraction. This result appeared strange since it is
unlike ozone fractionation that has a symmetry effect and whose mass-independent frac-
tionation (MIF) has this origin. We shall see that, in fact, a three-isotope plot points to
an isotopic anomaly rather than an MIF.
In our previous papers,25,26
many experimental observations, including the pressure
and temperature dependence of the reaction rate constants, and the H- and C-isotope
effects, were treated using the RRKM theory and a nonstatistical modification and agreed
with the experimental data. Previous evidence for a nonstatistical behavior of the reverse
reaction at higher energies was seen in the molecular beam experiments of Simons and co-
workers27,28
Experimentally there is an anomalous oxygen kinetic isotope effect (KIE),29,30
anomalous in the sense of not obeying the Bigeleisen-Mayer rule.31,32
The present study
was undertaken to explore this issue, as well as to study another aspects of the Bigeleisen-
Mayer rule, namely the effect of molecular tunneling, here of H and D.
The currently accepted mechanism for the reaction is that an OH radical reacts with
CO, producing a vibrationally excited energetic trans-HOCO*.4,12,15,16,20,21
This step is
followed by cis-trans isomerization, and the final competitive steps are the dissociation to
27
H and CO2, the back reaction to OH and CO, and a collisional stabilization of HOCO*.
When the pressure is increased, collisional stabilization of the energetic HOCO* com-
petes increasingly favorably with the forward dissociation channel and the back reaction.
When OH and CO react in air or oxygen, both the dissociation channel and collision
stabilization lead to the same products, HO2 and CO2, due to the follow-up reactions of
the H and HOCO with O2.33–35
A theoretical treatment of the oxygen KIE has not been given previously. Kurylo and
Laufer appear to be the first group who used heavy oxygen isotopes to study the reaction
experimentally.36
They produced18
OH radicals photochemically photolyzing H218
O with
184.9 nm radiation, then leaving them reacting with CO in a static cell. They reported
that C18
O was produced at low pressure, and disappeared in the presence of 760 torr of
SF6, suggesting that there was isotopic exchange between the C16
O and the18
OH, but
did not report a rate constant. Using a thermal source of18
OH, namely from H atoms re-
acting with NO2 or F atoms reacting with H2O in a flow tube, Greenblatt and Howard37
did not observe a measurable isotopic exchange and concluded that the rate constant for
the isotopic exchange of18
OH with C16
O was no larger than 10−15
cm3
molecule−1
s−1
.
Thus, there are two different observations of the O-exchange although it has been sug-
gested by the latter group that other reactions on the walls of the static cell may have
caused the exchange in the Kurylo and Laufer study.37
However, the issue has not yet
been resolved in the literature. Whereas these two groups of authors studied isotopic
exchange, Stevens and co-workers used mass spectroscopy and, importantly, used a pho-
tolytic source of OH radicals to study the oxygen KIE in C18
O.29
They measured the
28
isotopic ratios of the unreacted CO, and obtained pressure-dependent enrichment of the
18O/16
O ratio over the pressure range of 150 to 800 torr.
Later experimental studies of the heavy oxygen KIE using C18
O, were made by
Rockmann et al. using a photolytic source of OH radicals30
and by Feilberg et al. us-
ing photolytic ozone reacting with water to form OH radicals.38
The pressure-dependent
fractionation results of18
O by Rockmann et al. are comparable to those by Stevens et
al., but differ from those of Feilberg et al.38
The precursors generating the OH radicals
differed in the two studies. The experimental conditions by Rockmann et al. are simpler,
in that no ozone is added and many fewer chemical reactions contribute to the overall
reaction scheme. While HO2 may be a dominant product in the studies of Rockmann et
al.30
and Stevens et al.29
due to the reaction of the source material H2O2 with OH and
in principle could have interfered, the rate constant for the reaction of CO with HO2
is extremely small, about 10−27
cm3
molecule−1
s−1
at room temperature.39
Thus, it is
about 14 orders of magnitude smaller than that of CO with OH and would not interfere
in the studies in references 29 and 30.
The anomalous oxygen KIE in the CO+OH reaction is examined in the present work.
Our calculated result shows that the KIE in this reaction is a compromise between two
opposing effects: (1) a heavy isotope favors the formation of TS2 (the transition state
from HOCO* to CO2+H) due to an increase the number of states of a transition state
relative to the partition of reactants, and (2) a light isotope (12
C and16
O) favors the
formation of TS2 because of the reduced imaginary frequency in the tunneling reaction
coordinate. The present article discusses the dominance of these two effects in various
29
isotopomers. The calculation result shows that the carbon KIE is dominated qualitatively
by the former and the oxygen KIE at CO by the latter.
The article is organized as follows: The calculational methods are outlined in section II.
The results are given in section III and discussed in section IV.
II. CALCULATIONAL METHODS
The calculational methods are the same as those described previously,25,26
and are
briefly summarized here. At any energy E and total angular momentum J, we have
CO + OHk1(EJ)
⇀↽
k−1(EJ)
HOCO∗
(EJ), (1)
HOCO∗
(EJ)k2(EJ)−→ H + CO2. (2)
The transition states for reactions (1) and (2) are abbreviated as TS1 and TS2, respec-
tively. In the kinetic scheme, the density of states of the energetic intermediate HOCO*
includes density of states of the both cis-HOCO* and trans-HOCO*, since the rotational
barrier for cis-trans conversion is far lower than the energy of reactants and a rapid con-
version can be assumed. At finite pressures an additional series of kinetic equations is
added:
HOCO∗
(EJ) + Mω(EJ→E′J′)
−→ HOCO(E ′J ′
) + M, (3)
where M is a third body. The total rotational-vibrational energy E and the total an-
gular momentum J are conserved in reaction steps (1) and (2). The rate constants are
all E- and J-dependent; ω(EJ → E ′J ′
) is the rate constant per unit E for forming
HOCO at (E ′J ′
) from (EJ) by collision with a third body M. The collision frequency
30
ω(EJ → E ′J ′
) is factored approximately into the total collision frequency ω, the energy
transfer probability PE → E′ , and the rotational angular momentum transfer probability
PJ → J ′ . Thereby, the energy transfer probability is ω(EJ → E ′J ′
) = ωPE → E′PJ → J ′ .
PE → E′ is approximated by a stepladder model,40,41
in which a certain amount of energy
α is transferred between the intermediate HOCO* and a bath molecule in each collision.
Because of the smallness of the C and O isotope effect, it is necessary to use a fine division
of energies. The use of the stepladder instead of a continuous model in this treatment of
very small isotope effects saves a factor of 10 in computational time and resources, as dis-
cussed in reference 41. The α value is taken as dependent on the bath gas but independent
of pressure and isotopic substitution in HOCO. The α values of various bath gases were
obtained in our previous paper by best fit to the experimental data.25
For angular mo-
mentum transfer a strong collision was assumed. Thereby, the transfer probability PJ→J ′
equals the thermal distribution of rotational states of the intermediate HOCO*, at the
given temperature,40
i.e., PJ → J ′ = (2J ′
+1) exp(−BJ [J ′
(J ′
+1)−J(J+1)]/kBT )/(2J+1),
where BJ is the rotational constant of J .
The rate constants of the CO+OH reaction were calculated as a function of pressure
by solving the rate equations for reactions (1)–(3) using microcanonical RRKM calcu-
lations. Tunnelling corrections for both TS1 and TS2, and a steady-state equation for
pressure effects were included. The H-tunneling correction was estimated from a trans-
mission through an Eckart potential42
passing through the saddle-point. (For the given
ab initio potential energy surfaces the TS2 lies in the exit channel, and so there is little or
no “corner cutting.”) At room temperature the tunneling at TS1 contributes about 20%
31
of the total rate constant.25
An ab initio potential energy for the important equilibrium
structures was calculated by Lin and co-workers,20
who used the modified Gaussian-2
method (G2M). To obtain the more accurate vibrational frequencies and rotational con-
stants for all equilibrium structures for the various isotopes we used, as before,25,26
a
coupled-cluster method,43,44
abbreviated as CC.45
The optimized structures and vibra-
tional frequencies of all stationary structures are given in Table I of reference 25. In our
earlier work,25
the potential energy of TS1 and TS2 were shifted vertically slightly by two
independent constants to match the experimental rate constants with the non-Arrhenius
effect at low temperature and the energy transfer parameters used to described the pres-
sure effect at room temperature in various bath gases. We made no further change here.
The above results are compared in appendix A with another potential energy surface
for all stationary structures (LTSH by Schatz and co-workers23,46
). The robustness was
tested using other methods, as discussed in appendix A.
III. RESULTS
A. Slopes of the Three-Isotope Plot and “Mass-Independent” Fractionation
Apparently not mentioned before in the isotope reaction-rate literature is the effect
of H-tunneling on the well-known three-isotope plot and the Bigeleisen-Mayer laws.31,32
The enrichment or depletion is defined as
δQ ≡
(
(Q/16O)
sample
(Q/16O)standard
− 1
)
× 1000 per mil, (4)
32
where the “Q” in the equations denotes17
O or18
O. A plot of δ17O vs δ18
O constitutes the
well known three-isotope plot for O isotopes. According to the usual “mass-dependent”
theory of Bigeleisen and Mayer,31,32
the slope is about 0.52 for oxygen isotopes, a result
well established in the experimental literature for systems with no mass-anomaly. A MIF
has been defined in two ways. A technically rigorous definition is a slope of unity for the
3-isotope δ17O vs δ18
O plot (“mass-independent”). In a second definition the deviation
from mass-dependence often used is when a ∆17
O defined in equation (5) differs from
zero:
∆17
O ≡ δ17O − 0.52 × δ18
O 6= 0. (5)
The ∆17
O is popularly used since it requires only a pair of (δ17O, δ18
O) measurements,
whereas a 3-isotope plot requires a whole series of measurements.
Two fractionation properties for the KIE of oxygen, εCQ and εHQ, can be defined,
according as the heavy oxygen is in the CO or in the OH:
εCQ ≡
(
kCO+OH
kCQ+OH
− 1
)
× 1000 per mil; (6)
εHQ ≡
(
kCO+OH
kCO+QH
− 1
)
× 1000 per mil. (7)
In a kinetic-controlled reaction with a small amount of reaction, the enrichment de-
fined in equations (6) and (7) approximately equals the fractionation defined in equation
(4), i.e., εCQ∼= δCQ and εHQ∼= δHQ. The experimental and calculated slopes of the
three-isotope plots in the present study are listed in Table I, together with the range
of fractionations ∆17
O of the CQ+OH reaction in two bath gases, He and N2, at total
pressures below 1000 torr. The slope of εH17O vs εH18
O in He obtained by RRKM the-
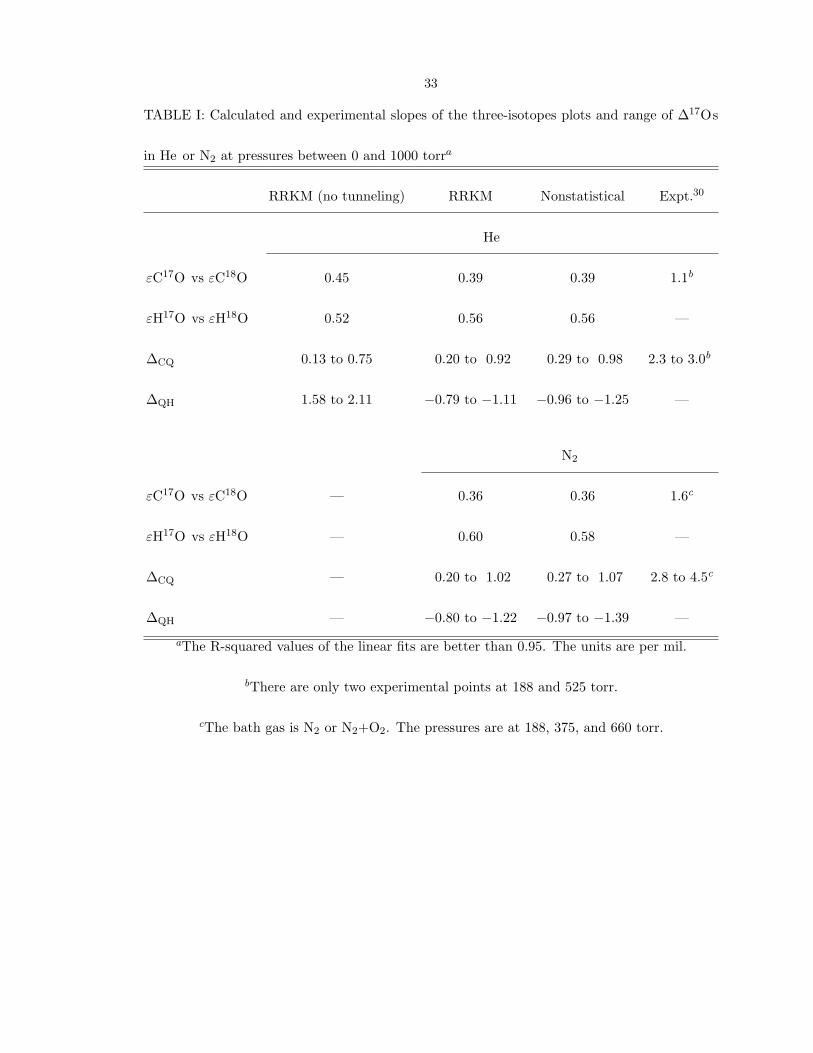
33
TABLE I: Calculated and experimental slopes of the three-isotopes plots and range of ∆17Os
in He or N2 at pressures between 0 and 1000 torra
RRKM (no tunneling) RRKM Nonstatistical Expt.30
He
εC17O vs εC18O 0.45 0.39 0.39 1.1b
εH17O vs εH18O 0.52 0.56 0.56 —
∆CQ 0.13 to 0.75 0.20 to 0.92 0.29 to 0.98 2.3 to 3.0b
∆QH 1.58 to 2.11 −0.79 to −1.11 −0.96 to −1.25 —
N2
εC17O vs εC18O — 0.36 0.36 1.6c
εH17O vs εH18O — 0.60 0.58 —
∆CQ — 0.20 to 1.02 0.27 to 1.07 2.8 to 4.5c
∆QH — −0.80 to −1.22 −0.97 to −1.39 —
aThe R-squared values of the linear fits are better than 0.95. The units are per mil.
bThere are only two experimental points at 188 and 525 torr.
cThe bath gas is N2 or N2+O2. The pressures are at 188, 375, and 660 torr.
34
ory without including tunneling has the usual mass-dependent value, as seen in Table I.
All other slopes of the fractionation show an “anomalous” mass effect, i.e., they differ
from the Bigeleisen and Mayer rule. The calculated εHQ is larger than the εCQ. The
deviation of the experimental result from the Bigeleisen-Mayer rule is consistent with the
importance of H-tunneling in TS2. The importance of TS2 at low pressure supported by
the H/D effect.
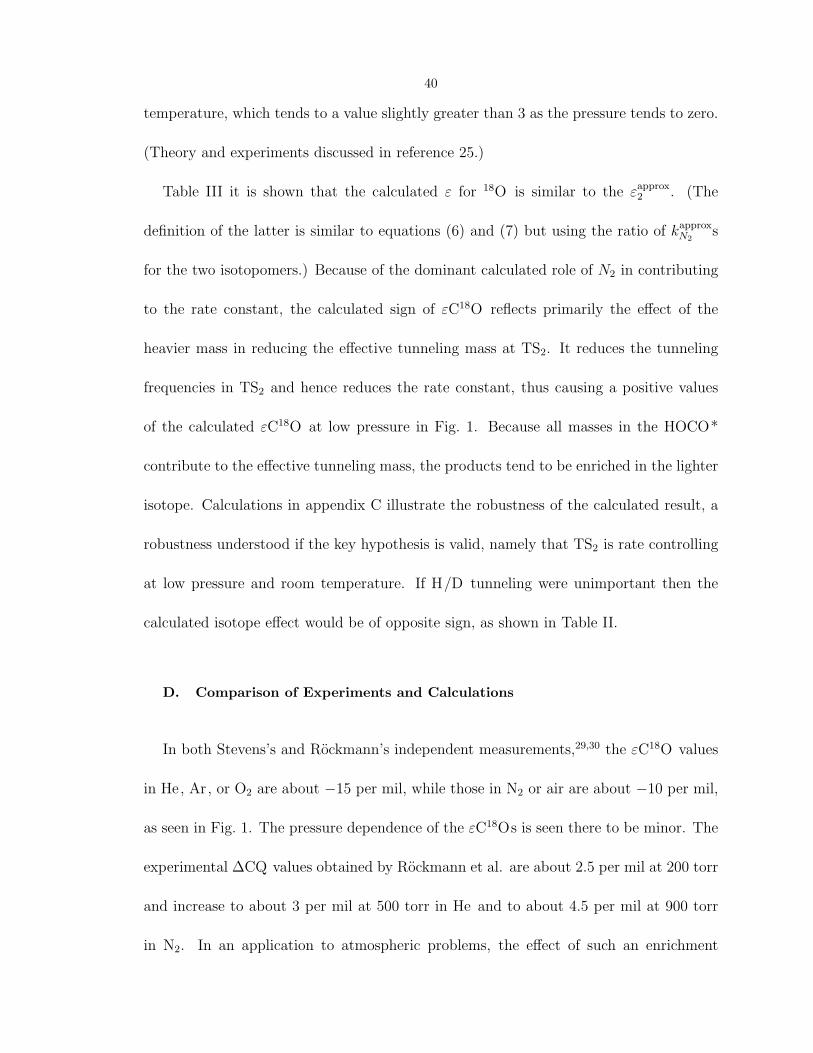
B. KIE for Oxygen
Only the εCQ values have been measured experimentally thus far. The εC18O values
in Fig. 1 calculated by the RRKM method and by a nonstatistical modification are about
+4 and +3 per mil, respectively, at low pressure. As the pressure is increased, the values
calculated by both models decrease monotonically to around −2 per mil at 1000 torr
(Fig. 1). The calculated pressure dependence of the18
O KIE in different bath gases
(N2 and He) is very similar. The robustness of the calculated18
O values is seen in
appendix A. All the calculated results made with the different ab initio methods give
similar εC18O values, all positive and 5 to 7 per mil, at low pressure. We consider in
section IV C a qualitative explanation for the sign of this result rather than focusing on
small differences in quantitative. The agreement largely rests on one key assumption;
the same argument explaining why the KIE of18
O and13
C have opposite signs at low
pressure (The possible reasons are given in appendix B.).
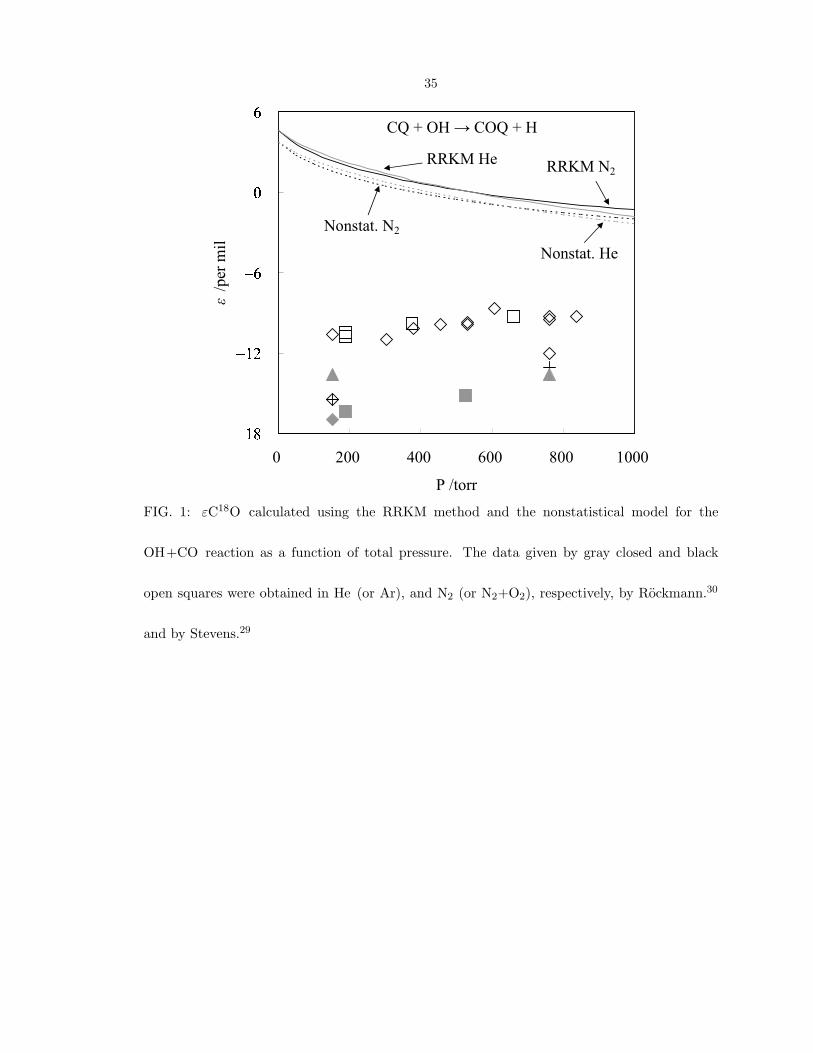
35
FIG. 1: εC18O calculated using the RRKM method and the nonstatistical model for the
OH+CO reaction as a function of total pressure. The data given by gray closed and black
open squares were obtained in He (or Ar), and N2 (or N2+O2), respectively, by Rockmann.30
and by Stevens.29
36
IV. DISCUSSION
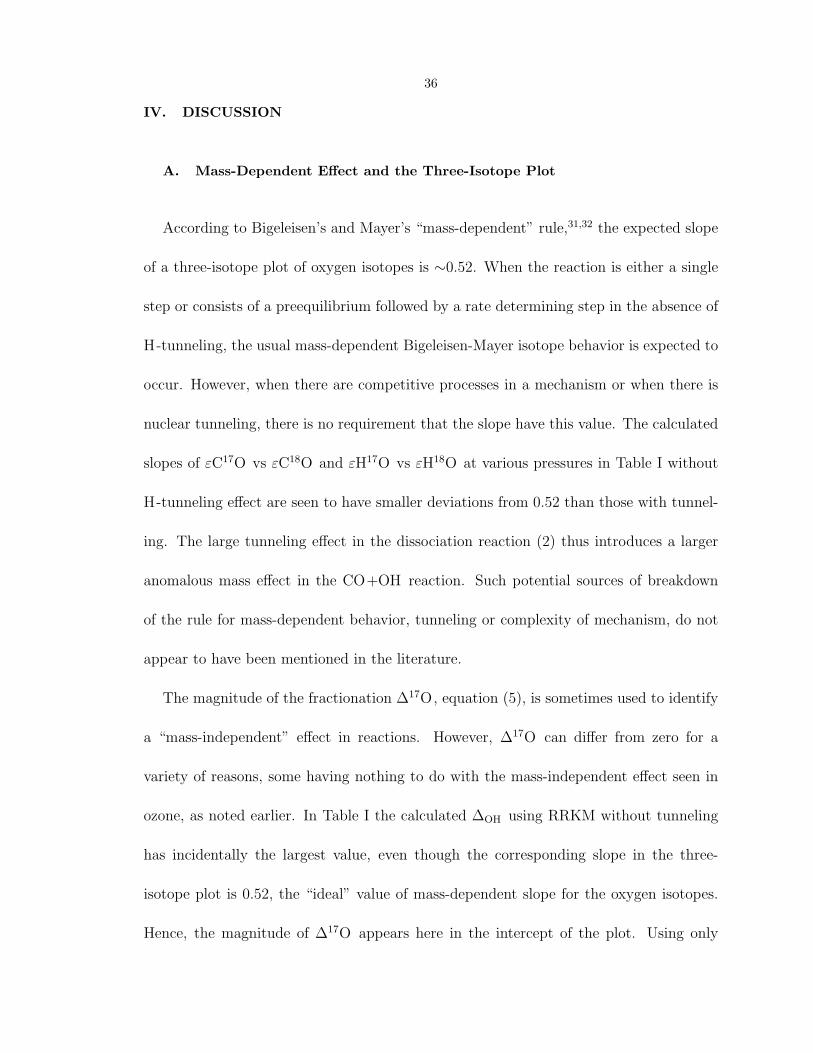
A. Mass-Dependent Effect and the Three-Isotope Plot
According to Bigeleisen’s and Mayer’s “mass-dependent” rule,31,32
the expected slope
of a three-isotope plot of oxygen isotopes is ∼0.52. When the reaction is either a single
step or consists of a preequilibrium followed by a rate determining step in the absence of
H-tunneling, the usual mass-dependent Bigeleisen-Mayer isotope behavior is expected to
occur. However, when there are competitive processes in a mechanism or when there is
nuclear tunneling, there is no requirement that the slope have this value. The calculated
slopes of εC17O vs εC18
O and εH17O vs εH18
O at various pressures in Table I without
H-tunneling effect are seen to have smaller deviations from 0.52 than those with tunnel-
ing. The large tunneling effect in the dissociation reaction (2) thus introduces a larger
anomalous mass effect in the CO+OH reaction. Such potential sources of breakdown
of the rule for mass-dependent behavior, tunneling or complexity of mechanism, do not
appear to have been mentioned in the literature.
The magnitude of the fractionation ∆17
O, equation (5), is sometimes used to identify
a “mass-independent” effect in reactions. However, ∆17
O can differ from zero for a
variety of reasons, some having nothing to do with the mass-independent effect seen in
ozone, as noted earlier. In Table I the calculated ∆OH using RRKM without tunneling
has incidentally the largest value, even though the corresponding slope in the three-
isotope plot is 0.52, the “ideal” value of mass-dependent slope for the oxygen isotopes.
Hence, the magnitude of ∆17
O appears here in the intercept of the plot. Using only
37
∆17
O as a criterion for a “mass-independent fractionation” is convenient, but does not
distinguish among alternative sources of the deviation, H-tunneling and complexity of
mechanism, and is different from the current (symmetry-based) molecular basis of the
mass-independent effect. In fact, even when ∆17
O is appreciable in Table I, the slope
of the three-isotope plot can still be far from the real mass-independent value of unity.
As a generic term, values of ∆17
O different from zero can be termed “mass-anomalous,”
rather than a special class of which–those with unit slope–“mass-independent.”
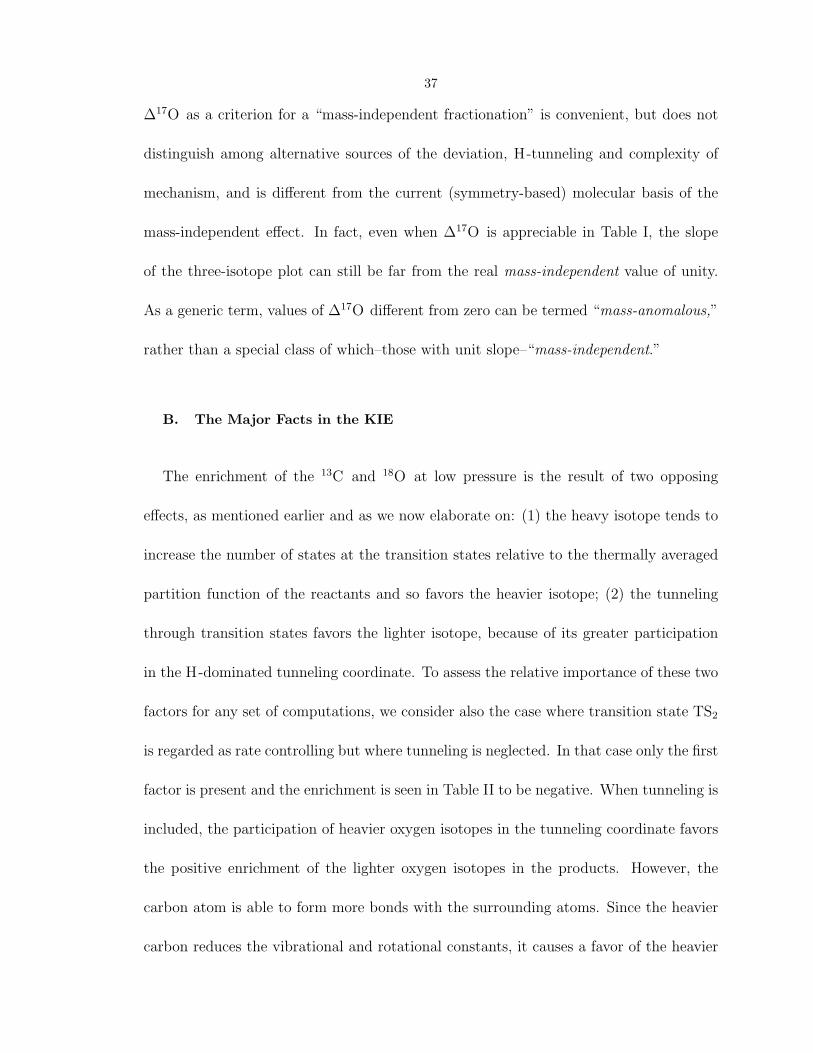
B. The Major Facts in the KIE
The enrichment of the13
C and18
O at low pressure is the result of two opposing
effects, as mentioned earlier and as we now elaborate on: (1) the heavy isotope tends to
increase the number of states at the transition states relative to the thermally averaged
partition function of the reactants and so favors the heavier isotope; (2) the tunneling
through transition states favors the lighter isotope, because of its greater participation
in the H-dominated tunneling coordinate. To assess the relative importance of these two
factors for any set of computations, we consider also the case where transition state TS2
is regarded as rate controlling but where tunneling is neglected. In that case only the first
factor is present and the enrichment is seen in Table II to be negative. When tunneling is
included, the participation of heavier oxygen isotopes in the tunneling coordinate favors
the positive enrichment of the lighter oxygen isotopes in the products. However, the
carbon atom is able to form more bonds with the surrounding atoms. Since the heavier
carbon reduces the vibrational and rotational constants, it causes a favor of the heavier
38
TABLE II: Comparison between calculated RRKM fractionation with and without tunneling
in the low-pressure limita
Without Tunnellingb With Tunnelling
C17O+OH −2.30 2.60
C18O+OH −5.54 4.62
CO+17OH −24.62 8.58
CO+18OH −50.38 18.32
13CO+OH −59.25 −3.97
aUnits are in per mil.
bThere are few changes of the enrichment values as the barrier of TS2 is lowered by 340 cm−1.
It shows that the enrichment is insensitive to the exact value of barrier high as long as the
TS2 is the rate-determining step.
39
carbon isotopomer in the reaction constant at low pressure.
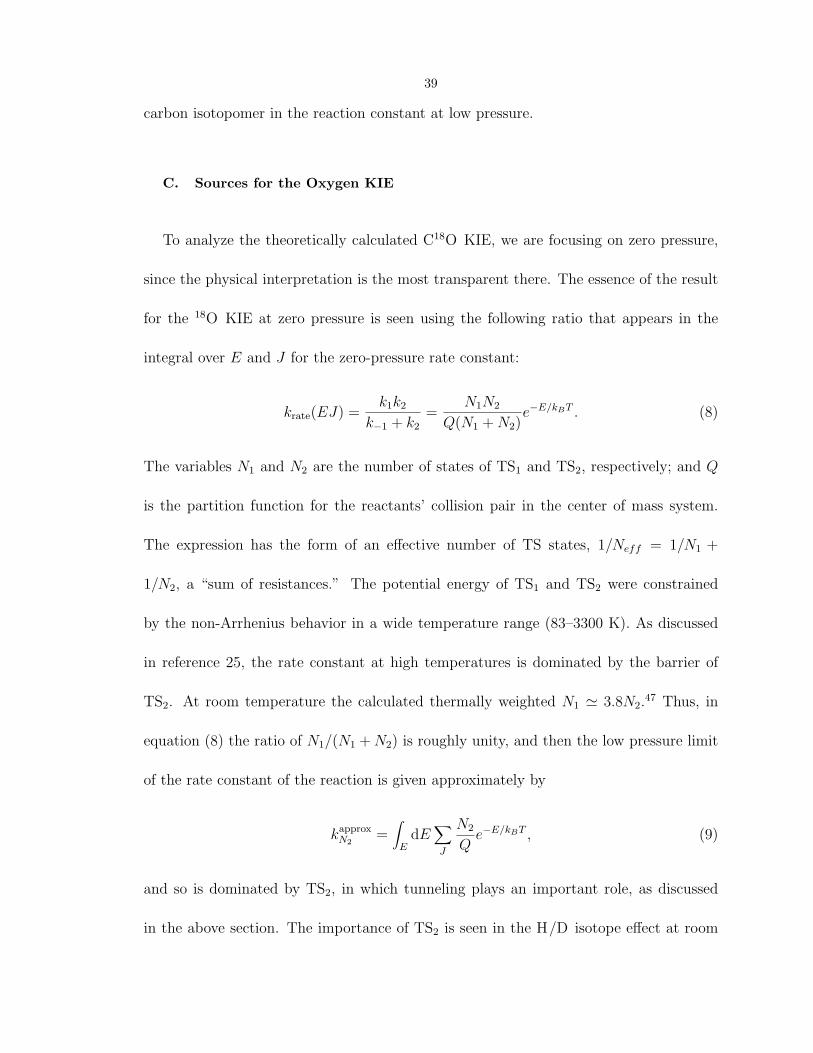
C. Sources for the Oxygen KIE
To analyze the theoretically calculated C18
O KIE, we are focusing on zero pressure,
since the physical interpretation is the most transparent there. The essence of the result
for the18
O KIE at zero pressure is seen using the following ratio that appears in the
integral over E and J for the zero-pressure rate constant:
krate(EJ) =k1k2
k−1 + k2
=N1N2
Q(N1 + N2)e−E/kBT . (8)
The variables N1 and N2 are the number of states of TS1 and TS2, respectively; and Q
is the partition function for the reactants’ collision pair in the center of mass system.
The expression has the form of an effective number of TS states, 1/Neff = 1/N1 +
1/N2, a “sum of resistances.” The potential energy of TS1 and TS2 were constrained
by the non-Arrhenius behavior in a wide temperature range (83–3300 K). As discussed
in reference 25, the rate constant at high temperatures is dominated by the barrier of
TS2. At room temperature the calculated thermally weighted N1 ' 3.8N2.47
Thus, in
equation (8) the ratio of N1/(N1 + N2) is roughly unity, and then the low pressure limit
of the rate constant of the reaction is given approximately by
kapprox
N2=
∫
E
dE∑
J
N2
Qe−E/kBT , (9)
and so is dominated by TS2, in which tunneling plays an important role, as discussed
in the above section. The importance of TS2 is seen in the H/D isotope effect at room
40
temperature, which tends to a value slightly greater than 3 as the pressure tends to zero.
(Theory and experiments discussed in reference 25.)
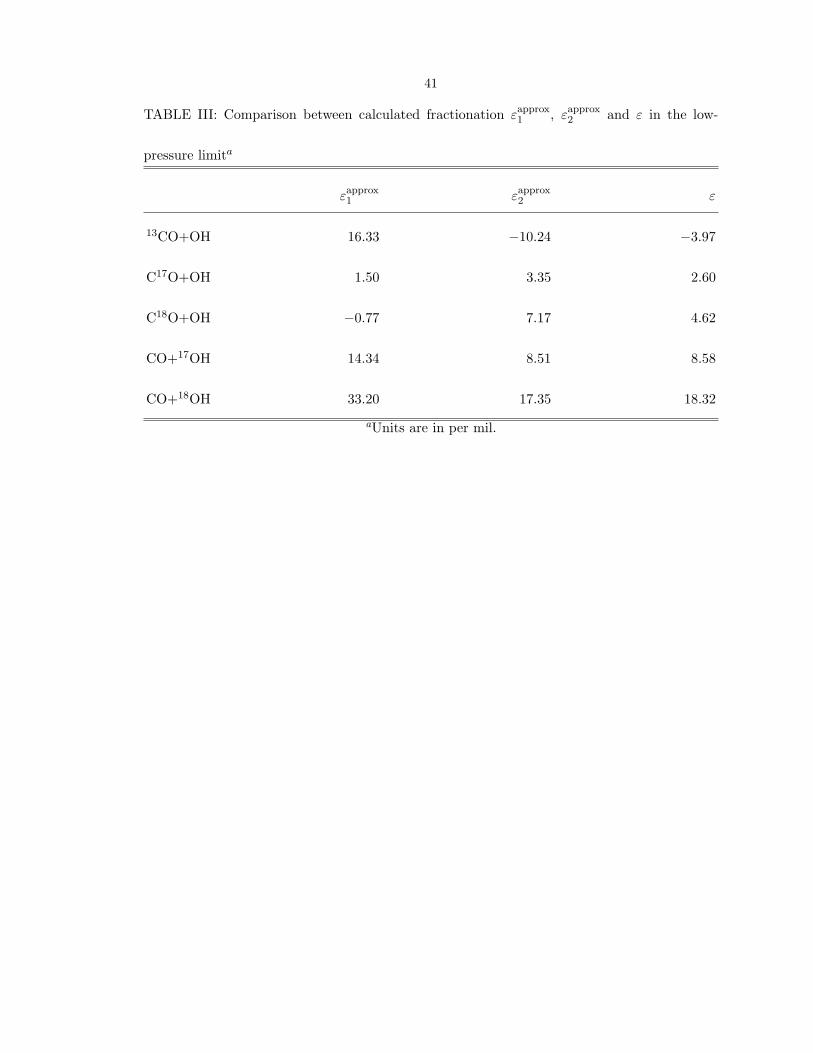
Table III it is shown that the calculated ε for18
O is similar to the εapprox
2 . (The
definition of the latter is similar to equations (6) and (7) but using the ratio of kapprox
N2s
for the two isotopomers.) Because of the dominant calculated role of N2 in contributing
to the rate constant, the calculated sign of εC18O reflects primarily the effect of the
heavier mass in reducing the effective tunneling mass at TS2. It reduces the tunneling
frequencies in TS2 and hence reduces the rate constant, thus causing a positive values
of the calculated εC18O at low pressure in Fig. 1. Because all masses in the HOCO*
contribute to the effective tunneling mass, the products tend to be enriched in the lighter
isotope. Calculations in appendix C illustrate the robustness of the calculated result, a
robustness understood if the key hypothesis is valid, namely that TS2 is rate controlling
at low pressure and room temperature. If H/D tunneling were unimportant then the
calculated isotope effect would be of opposite sign, as shown in Table II.
D. Comparison of Experiments and Calculations
In both Stevens’s and Rockmann’s independent measurements,29,30
the εC18O values
in He, Ar, or O2 are about −15 per mil, while those in N2 or air are about −10 per mil,
as seen in Fig. 1. The pressure dependence of the εC18Os is seen there to be minor. The
experimental ∆CQ values obtained by Rockmann et al. are about 2.5 per mil at 200 torr
and increase to about 3 per mil at 500 torr in He and to about 4.5 per mil at 900 torr
in N2. In an application to atmospheric problems, the effect of such an enrichment
41
TABLE III: Comparison between calculated fractionation εapprox
1, ε
approx
2and ε in the low-
pressure limita
εapprox
1εapprox
2ε
13CO+OH 16.33 −10.24 −3.97
C17O+OH 1.50 3.35 2.60
C18O+OH −0.77 7.17 4.62
CO+17OH 14.34 8.51 8.58
CO+18OH 33.20 17.35 18.32
aUnits are in per mil.
42
on the seasonal fractionation changes in the oxygen isotopes of the atmospheric carbon
monoxide was discussed in reference 30. The calculated ∆CQ values are in the range
0.2–1.1 per mil, as seen in Table I, which is slightly smaller than experimental values,
2.3–3.0 per mil.
In our calculations using both the RRKM and the nonstatistical models, the results for
the calculated εC18O values are offset from the experimental values by about +15 per mil,
as seen in Fig. 1. As discussed in the above section and in the additional information
in appendix C, the compact structure of TS2 leads a well-defined transition state and
to a calculated εC18O at low pressure that is dominated by TS2 and is positive. This
calculational result is different from experiment. A possible origin of this discrepancy
is discussed in the section IV E. Although the sign of εC18O in low-pressure limit are
different in calculation and experiments, both calculated and experimental of εC18O show
minor pressure dependence as pressure is varied from 0 to 1000 torr, as seen in Fig. 1.
E. A Possible Explanation of the16
O/18
O Discrepancies and a Proposed Ex-
periment
One possible explanation of this16
O/18O discrepancy is in the theory. Another possi-
bility is that this discrepancy in the εC18O in the CO+OH reaction is experimental, due
to a nonthermal effect. In particular the OH radicals in the experiments in references 29
and 30 are formed photochemically and if they are vibrationally hot, the mass dependence
of heavier oxygen isotopes in CO in the reaction would be affected, since intramolecular
H-transfer reaction in the energetic HOCO* may occur. This isotope exchange effect
43
would not change the mass dependence of carbon isotopes, and so our previous work
that reproduced the sign and pressure dependence of latter would be unaffected.25
It
would also be consistent with the experiments in reference 36.
When the HOCO* has a large excess energy, an isotopic exchange of the oxygen atoms
between CO and OH in the vibrationally excited HOCO* molecule becomes possible.
This reorganization can reform the reactants without forming products. Two possibilities
for the intramolecular H-transfer are:
trans-HOCQ∗
−→ HCO2 −→ trans-OCQH∗, (10)
cis-HOCQ∗
−→ cis-OCQH∗. (11)
In reaction (10) the intermediate HCO2 has the hydrogen atom close to the carbon atom
instead of an oxygen atom, but might occur by “roaming.” Reaction (10) recalls the new
“roaming” H-atom mechanism seen in the photodissociation of formaldehyde.48–50
Al-
though when zero-point energy is not included reaction (10) had a shallow well, calculated
as 840 cm−1
, but the zero-point energy of HCO2 makes the effective well disappear.20
Reaction (11) is a direct intramolecular H-transfer reaction from one oxygen atom to the
other, possible for the cis geometry but not for the trans.
The calculated geometries and vibrational frequencies of the structures in reactions
(10) and (11) are listed in Table IV. In our ab initio CC calculations, relative to the
separated reactants, the barrier of reaction (10) without zero-point corrections is about
3500 cm−1
, and that of reaction (11) is more than 8000 cm−1
, so only reaction (10)
needs to be considered in an intramolecular mechanism. The barrier in reaction (10)
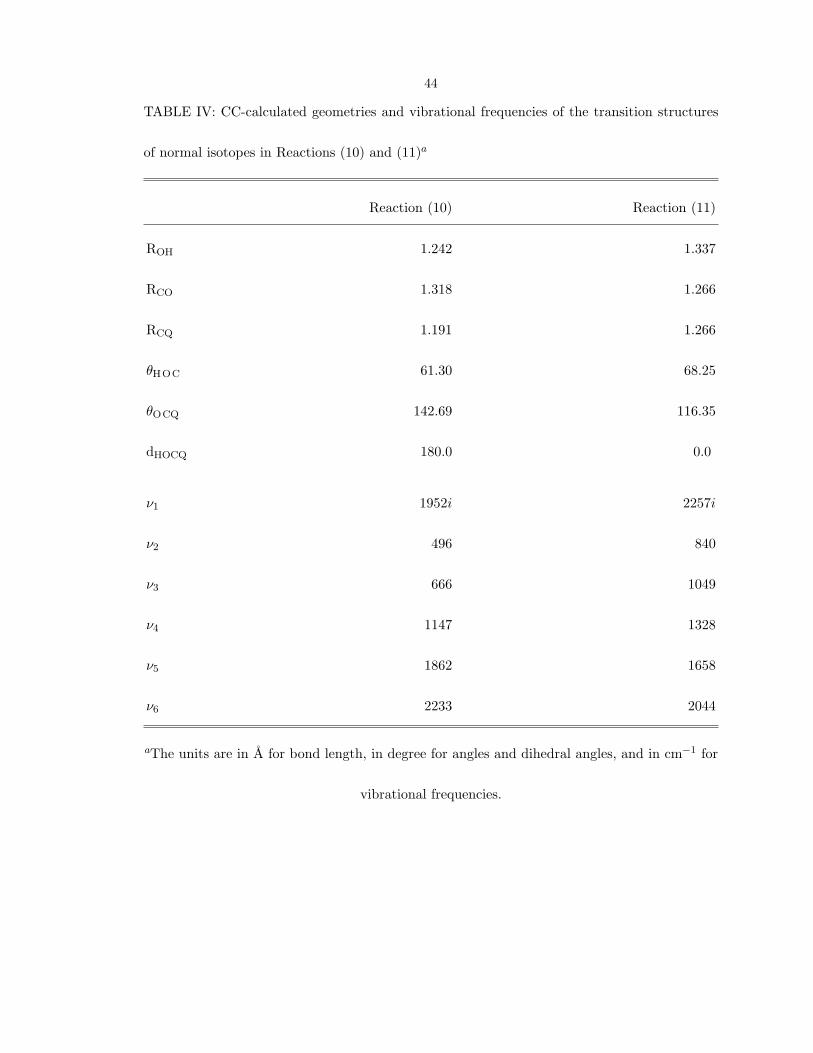
44
TABLE IV: CC-calculated geometries and vibrational frequencies of the transition structures
of normal isotopes in Reactions (10) and (11)a
Reaction (10) Reaction (11)
ROH 1.242 1.337
RCO 1.318 1.266
RCQ 1.191 1.266
θHOC 61.30 68.25
θOCQ 142.69 116.35
dHOCQ 180.0 0.0
ν1 1952i 2257i
ν2 496 840
ν3 666 1049
ν4 1147 1328
ν5 1862 1658
ν6 2233 2044
aThe units are in A for bond length, in degree for angles and dihedral angles, and in cm−1 for
vibrational frequencies.
45
has a large value of the imaginary frequency with H-transfer, and so both tunneling and
dynamic effects would be important when the internal energy of HOCO* is high enough
for reaction (10) to occur. When thermalized OH radicals at room temperature are used,
the calculated rate constant for forming HCO2 is less than 10−17
cm3
molecule−1
s−1
,
reaction (10) would contribute only about 0.1 per mil to the ε of the CO+OH reaction
so be negligible.
In the experiments of Kurylo and Laufer,36
oxygen isotopic exchange of OH and CO
was reported in the depleted reactants at low pressure. Due to the photolysis used to
generate OH radicals, some of the radicals may be vibrationally hot when they react later
with CO. Since HOCO* is now at a higher energy, the reaction rate of the intramolecular
hydrogen exchange, reaction (10), could be enhanced. This presumption is consistent
with Kurylo and Laufer’s observation,36
which implies H-transfer reaction involving in
the CO+OH reaction at low pressure. In contrast to Kurylo and Laufer’s experiment,
there was no observable H-transfer reaction in Greenblatt and Howard’s study,37
but in
the latter the OH radicals were generated by chemical reactions rather than by photolysis.
The OH radicals in both Stevens’s and Rockmann’s experiments were generate by
photolysis of H2O2 with an Hg or Xe lamp,29,30
so the resulting OH radicals may have
excess vibrational energy. Even if the excess energy results in the reaction rates of
hydrogen transfer of only about 1.5% of the rate of the ordinary CO+OH reaction,
namely has a rate constant of 2 × 10⁻¹⁵
to 3 × 10⁻¹⁵
cm3
molecule−1
s−1
, it would
decrease the εC18O values in the present calculations to values nearly the same as those
in the experimental results, and would also change the ∆CO value to about 7 per mil,
46
and so be of the same order as the experimental value. Thus, new measurements of the
εC18O and ∆CO using a thermalized source of OH could offer useful insight into this
issue and also resolve the difference between the experiments of Stevens and Rockmann
on one hand and those of Kurylo and Laufer on the other.
F. Oxygen KIE in QH
Using a spectroscopic detection of OH, Greenblatt and Howard measured rate coef-
ficients for the reaction of18
OH and16
OH with CO to be (1.49 ± 0.15) × 10−13
and
(1.44 ± 0.15) × 10−13
cm3
molecule−1
s−1
, respectively.37
This kind of measurement
of absolute rather than relative values of the rate constants for the different isotopes
gives too large an error to compare with the present calculations. However, using mass-
spectroscopy, such as in Stevens’s and Rockmann’s measurements,29,30
the accuracy of
measuring KIE is sufficient to determine the oxygen isotope effect.
Although the KIE in QH is not the main focus of this paper does not appear in
the literature yet, we compare it with the KIE in CQ. The reduction in the imaginary
frequency due to heavier oxygen leads to a decreased tunneling. The effect is seen in
Table V to be greater when the heavier oxygen is in OH than when it is in CO, a result
qualitatively expected because the O in OH is closer to the H in HOCO* than when it is
in CO, and so contributes more dynamically to the effective tunneling mass. Accordingly
the calculated εHQ is larger than the calculated εCQ at all pressures, a result seen in
both the RRKM and the nonstatistical models, as seen in Fig. 2. The effect of the
imaginary frequency of TS2 dominating the difference between εHQ and εCQ is also
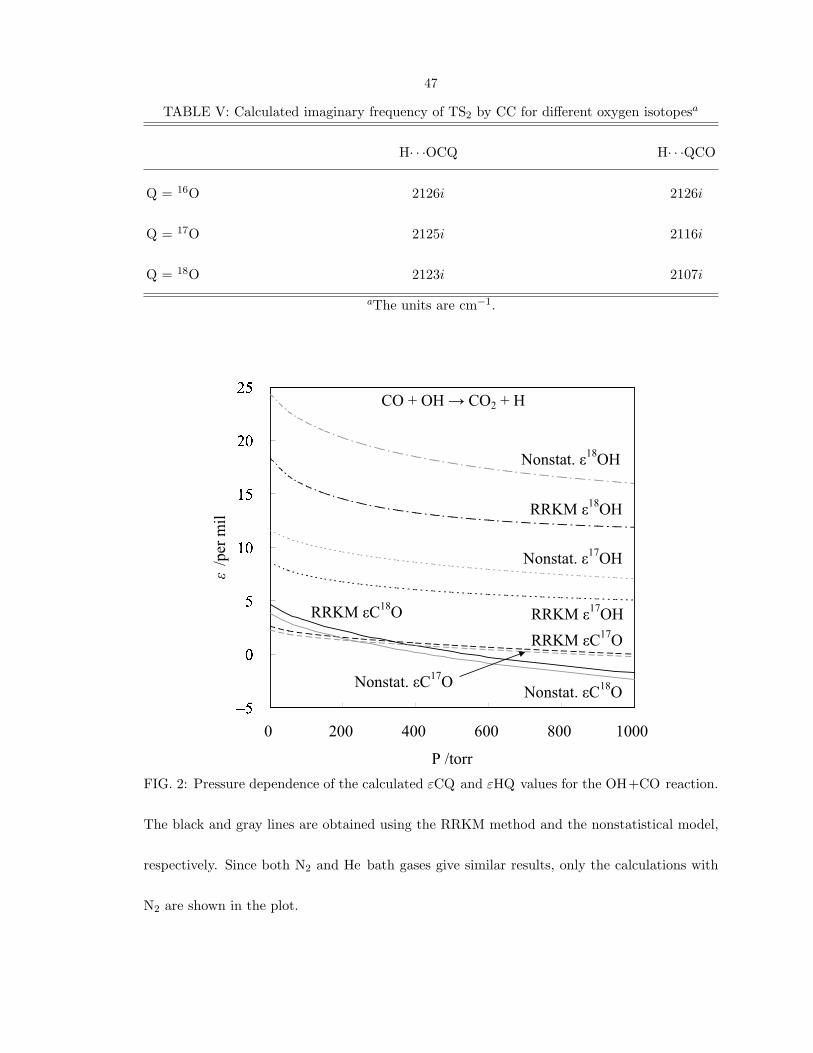
47
TABLE V: Calculated imaginary frequency of TS2 by CC for different oxygen isotopesa
H· · ·OCQ H· · ·QCO
Q = 16O 2126i 2126i
Q = 17O 2125i 2116i
Q = 18O 2123i 2107i
aThe units are cm−1.
FIG. 2: Pressure dependence of the calculated εCQ and εHQ values for the OH+CO reaction.
The black and gray lines are obtained using the RRKM method and the nonstatistical model,
respectively. Since both N2 and He bath gases give similar results, only the calculations with
N2 are shown in the plot.
48
seen in the calculations made with other ab initio methods (Appendices). Therefore,
using thermalized source of QH could be helpful in comparing with this prediction and
so testing further the importance of the H-tunneling effect in the reaction.
V. CONCLUSIONS
The mass-independent character in a reaction is better defined by the slope in a
three-isotope plot, instead the magnitude of fractionation, ∆, since a reaction such as
CO+OH may have peculiar mass-dependence with nonzero ∆ value. The CO+OH
reaction is better described as a mass-anomalous reaction, instead of mass-independent.
Since it involves an energetic HOCO intermediate without a preequilibrium followed by
a rate-determinate step, the slope in a three-isotope plot is expected to be different from
the ideal mass-dependent value, ∼0.52.
Its oxygen KIE is a compromise between two opposing effect: (1) a heavy isotope
tends to increase the ratio between the number of state at transition states and the
thermally average partition function of reactants; (2) a light isotope tends to increase
the tunneling effect at transition states. Their importance in the reaction at room tem-
perature and at pressures below 1000 torr was studied with RRKM theory and with a
nonstatistical modification, both including and excluding the nuclear tunneling of H at
the TSs, using a potential energy surface and the parameters that are the same as those
used previously.25
The reaction in the current calculation favors lighter oxygen isotope
since tunneling dominates the calculated fractionation, which is different in the heavier
carbon isotopomer. The different dominated effect between the carbon and oxygen KIE
49
is qualitatively explained by the bond-order properties in these two elements. Although
the same treatment as that given in our previous paper25
reproduced a large body of
experimental data discussed there, there is a discrepancy between the measured and cal-
culated anomalous mass dependence of oxygen isotopes in the reaction. The calculated
sign of18
O enrichments at low pressure and room temperature rests on only one key
assumption, namely that the TS2 with tunneling dominate TS1.
The discrepancy for oxygen from experiments may instead be due to an intramolec-
ular hydrogen transfer reaction (10) arising from vibrationally hot OH radicals. This
hypothesis can be tested by measuring the O-isotope effect using thermalized OH radi-
cals, perhaps such as those used in the work of Greenblatt and Howard.37
Since the OH
radicals in Stevens’s and in Rockmann’s experiments were produced by photolysis,29,30
the OH radicals may have had excess vibrational energy, introducing the possibility of
the intramolecular H-atom transfer “roaming” reaction (10), with an immediate conse-
quence for the O-isotope effect discussed in Section IV E. Using thermalized OH radicals
to study the kinetic oxygen isotope effects would eliminate such a high-energy mechanism
and so be an appropriate for testing the present theory regarding the dominance of TS2
at low pressure and room temperature.
Acknowledgments
It is a pleasure to acknowledge the support of this research by the National Science
Foundation. We also thank Dr. Muckerman for providing the F matrix for the structures
in their paper,17
which were used to check the accuracy of rate-constant calculation with
50
our previous vibrational frequencies.
APPENDIX A: CALCULATED RESULTS FOR DIFFERENT PES’S
The robustness of the results of the present calculations was explored using other
electronic structure methods. In particular, to test the sensitivity of certain aspects of the
calculations, different, albeit less accurate, methods were used. They are discussed in this
appendix. Apart from the transition state structure of the entrance channel TS1,51
the
vibrational frequencies and rotational constants of all structures for the various isotopes
were calculated by three methods, CCSD(T) with 6-31G(d,p), B3LYP with cc-pVTZ,
and MP2 with 6-31++G(d,p). The properties of TS1 are obtained only from the results
of MP2 or CC, since DFT gives an unrealistic structure.51
The acronym DFT denotes the
calculation by B3LYP, DFT-MP denotes the calculations combining the structure data
of TS1 from MP2 and the structures from B3LYP, while DFT-CC is similar but with the
data for TS1 obtained from CCSD(T). The GAUSSIAN 98 program52
was employed for
all three ab initio calculations (CC, MP2, and B3LYP) to obtain the principal equilibrium
structures and their rotational and vibrational constants.
With the force constants and rotational constants at the same ab initio level, both
G2M and LTSH potentials give very similar calculated results for the oxygen isotope
effect. At the low pressure limit at room temperature, the calculated εC18O values
are about 6, 7, 5, and 2 per mil for DFT-CC, DFT-MP, CC, and MP2, respectively,
with G2M or LTSH potentials. The RRKM and nonstatistical modification give similar
results. In the pressure range from 0 to 1000 torr the values for all PESs except MP2 are
51
greater than −2 per mil, as shown in Fig. 3. The imaginary frequency of TS2 by MP2 is
unreasonably large, 3176i, and so gives lower calculated values of εC18O, monotonically
decreasing from 2 to −6 per mil as the pressure changes from 0 to 1000 torr. Because of
the unreasonable OH frequency in MP2, the MP2 results are omitted in Fig. 3.
The calculated fractionation for the oxygen atom in OH, εH18O at low pressure is
again positive and is about 4, 11, 18, and 39 per mil with force constants obtained by
using DFT-CC, DFT-MP, CC, and MP2, respectively. The large difference in εH18O and
εC18O is similar to the trend of the values of the imaginary frequency in TS2 obtained
for various calculational levels.53
This trend is also similar to the trend of the difference
between εH18O and εC18
O at low pressure.
APPENDIX B: COMPARISON OF O AND C KIE
Compared oxygen KIE with the carbon’s in reference 25, both calculation and ex-
periments shows that the ε13CO values have a larger pressure dependence than εC18
O
when the pressure is varied from 0 to 1000 torr. At low pressure limit, the ε13CO value
is negative, as discussed in the above two sections, because the TS2 still dominates the
reaction and the heavier isotope decreases the vibrational and rotational constants, its
number of states in13
C increases more than that in normal isotope, shown in Table III.
Although reducing tunneling effect due to13
C also contributes to reducing the number
of states in TS2, similar to that in heavier oxygen isotope, increasing number of states of
TS2 by reducing vibrational and rotational constants dominates in the13
C isotopomer.
The dominance effect in number of states in13
C is different from that in heavy oxygen
52
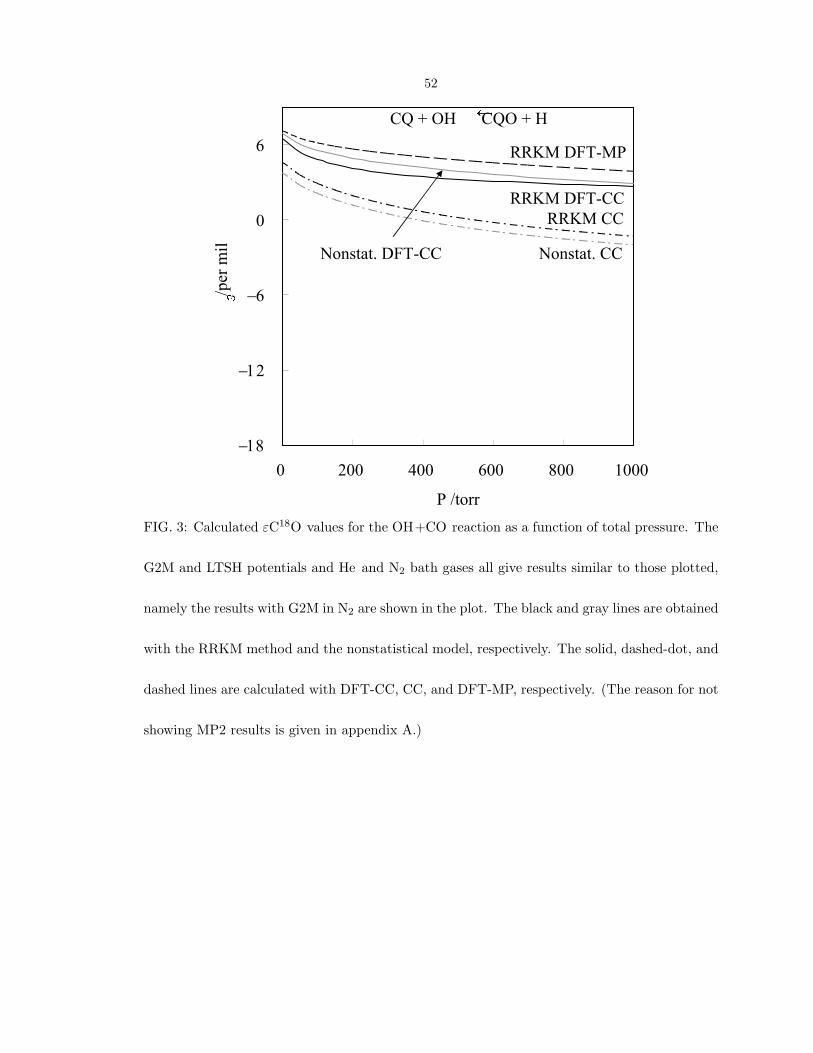
���
���
��
�
�
0 200 400 600 800 1000
P /torr
� /per milCQ + OH � CQO + H
RRKM DFT-MP
Nonstat. DFT-CC
RRKM DFT-CC
RRKM CC
Nonstat. CC
FIG. 3: Calculated εC18O values for the OH+CO reaction as a function of total pressure. The
G2M and LTSH potentials and He and N2 bath gases all give results similar to those plotted,
namely the results with G2M in N2 are shown in the plot. The black and gray lines are obtained
with the RRKM method and the nonstatistical model, respectively. The solid, dashed-dot, and
dashed lines are calculated with DFT-CC, CC, and DFT-MP, respectively. (The reason for not
showing MP2 results is given in appendix A.)
53
isotopomers because the carbon atom can form more bond with surrounding atoms than
oxygen atom. This crucial difference leads to the different fractionation behavior at low
pressure limit in our present calculation.
As the discussion in our previous article of the non-Arrhenius behavior,25
the barrier of
TS2 dominates rate constants at high temperature regions, and both barriers contribute
rate constants at low temperature regions. Although the usual KIE is smaller at higher
temperature, due to the non-Arrhenius behavior the absolute value of the calculated
εC18O and ε13
CO at low pressure limit show that as increasing temperature, instead of
monotonic decreasing in the usual KIE, they reach a maximum at ∼400 K, as seen in
Table VI.
Another parameter is introduced here to show the robustness in the fractionation at
low pressure limit, especially the oxygen KIE. Since TS2 involves dissociation of a hydro-
gen atom from HOCO*, the imaginary frequencies is difficult to obtain precisely using
ab initio methods.20,25
The imaginary frequency of TS2 is scaled by a factor. Using the
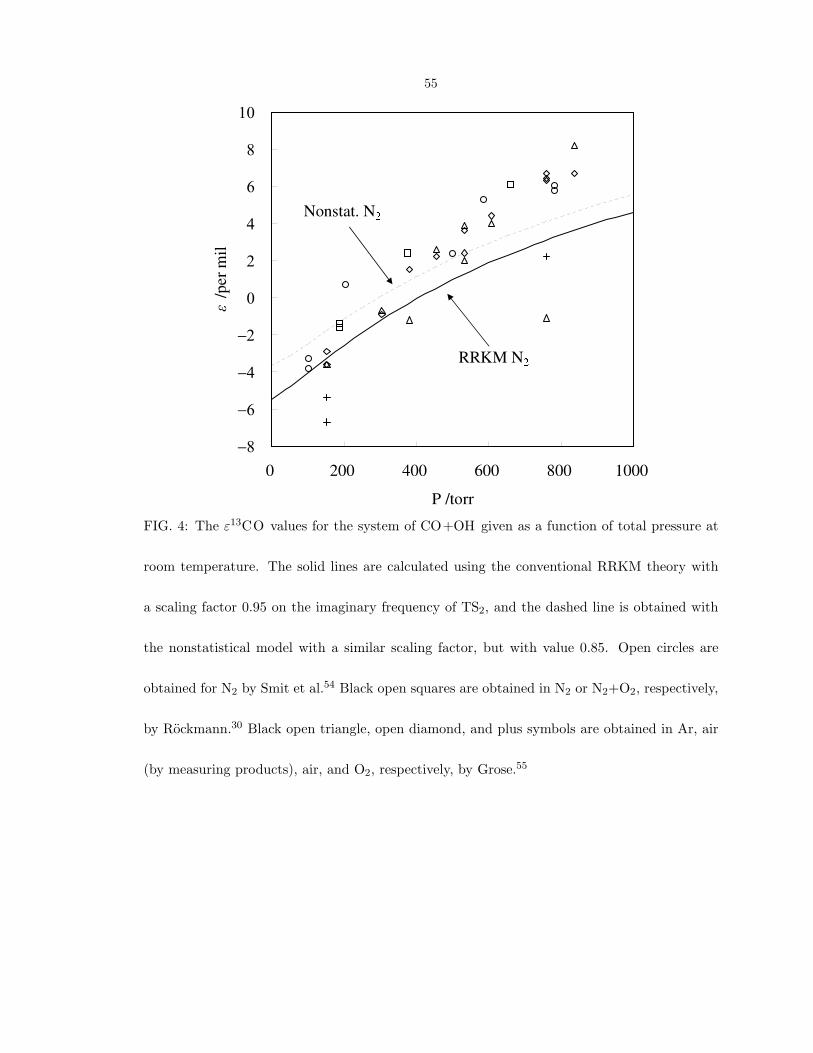
same fitting procedures of the two vertical shifted parameters of TS1 and TS2 described
in reference 25, The scaling factor to best represent the calculated pressure dependence
of carbon KIE, as shown in Fig. 4, is 0.95 and 0.85 for RRKM and nonstatistical mod-
ification, respectively. Although changing the value of imaginary frequency has some
improvements on the carbon KIE, Table VII shows that the scaling factor has negligible
effect on the oxygen KIE. This result is expected since, as discussed in section IV C and
shown in Table III, both εapprox
1 and εapprox
2 have contribution on the carbon fractionation,
but the oxygen fractionation is mainly dominated by εapprox
2 in our present calculation.
54
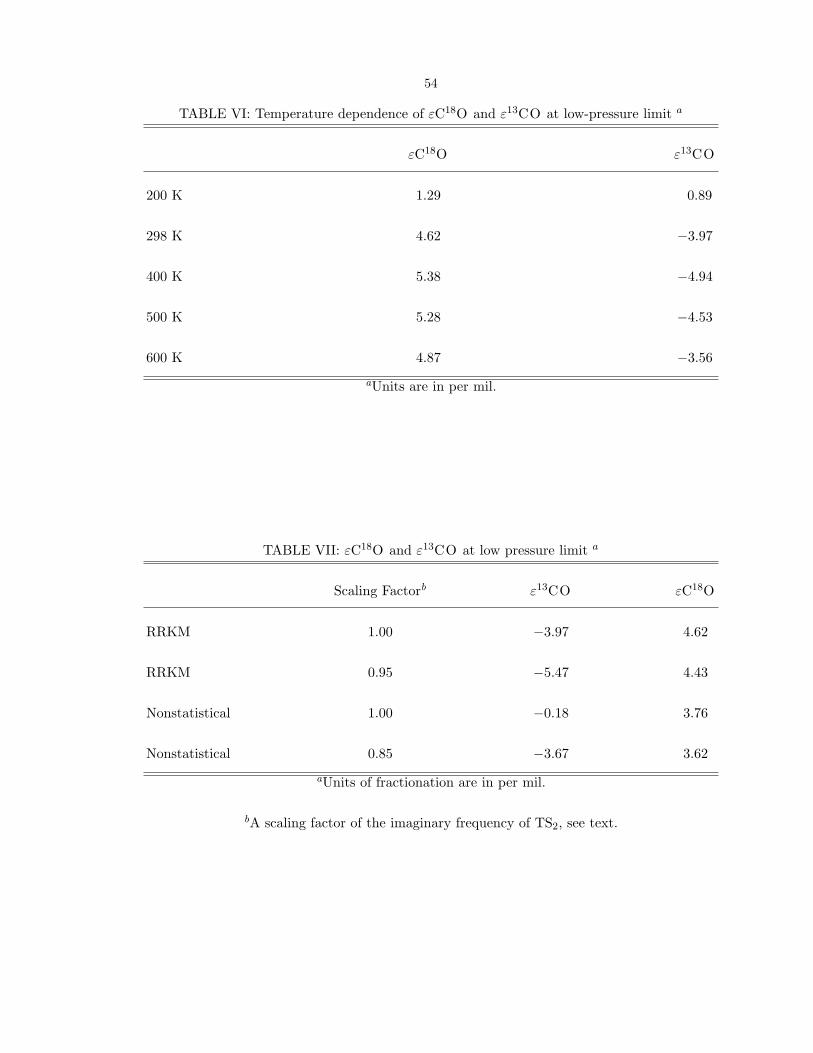
TABLE VI: Temperature dependence of εC18O and ε13CO at low-pressure limit a
εC18O ε13CO
200 K 1.29 0.89
298 K 4.62 −3.97
400 K 5.38 −4.94
500 K 5.28 −4.53
600 K 4.87 −3.56
aUnits are in per mil.
TABLE VII: εC18O and ε13CO at low pressure limit a
Scaling Factorb ε13CO εC18O
RRKM 1.00 −3.97 4.62
RRKM 0.95 −5.47 4.43
Nonstatistical 1.00 −0.18 3.76
Nonstatistical 0.85 −3.67 3.62
aUnits of fractionation are in per mil.
bA scaling factor of the imaginary frequency of TS2, see text.
55
FIG. 4: The ε13CO values for the system of CO+OH given as a function of total pressure at
room temperature. The solid lines are calculated using the conventional RRKM theory with
a scaling factor 0.95 on the imaginary frequency of TS2, and the dashed line is obtained with
the nonstatistical model with a similar scaling factor, but with value 0.85. Open circles are
obtained for N2 by Smit et al.54 Black open squares are obtained in N2 or N2+O2, respectively,
by Rockmann.30 Black open triangle, open diamond, and plus symbols are obtained in Ar, air
(by measuring products), air, and O2, respectively, by Grose.55
56
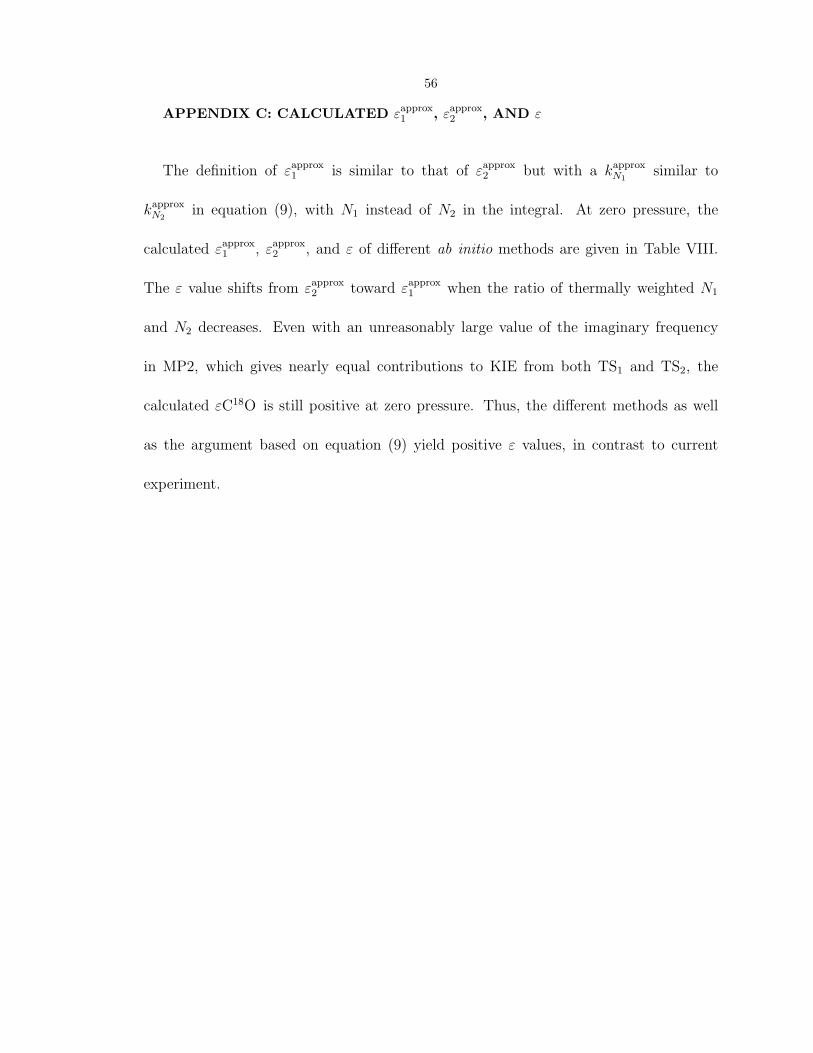
APPENDIX C: CALCULATED εapprox
1, ε
approx
2, AND ε
The definition of εapprox
1 is similar to that of εapprox
2 but with a kapprox
N1similar to
kapprox
N2in equation (9), with N1 instead of N2 in the integral. At zero pressure, the
calculated εapprox
1 , εapprox
2 , and ε of different ab initio methods are given in Table VIII.
The ε value shifts from εapprox
2 toward εapprox
1 when the ratio of thermally weighted N1
and N2 decreases. Even with an unreasonably large value of the imaginary frequency
in MP2, which gives nearly equal contributions to KIE from both TS1 and TS2, the
calculated εC18O is still positive at zero pressure. Thus, the different methods as well
as the argument based on equation (9) yield positive ε values, in contrast to current
experiment.
57
TABLE VIII: Calculated N1/N2, εapprox
1, ε
approx
2, and ε at low pressure limit of different ab
initio methodsa
N1/N2b
εapprox
1εapprox
2ε
CC
C17O+OH 3.80 1.50 3.35 2.60
C18O+OH 3.82 −0.77 7.17 4.62
CO+17OH 3.77 14.34 8.51 8.58
CO+18OH 3.73 33.20 17.35 18.32
DFT-CC
C17O+OH 5.75 2.68 3.96 4.04
C18O+OH 5.77 2.66 7.05 6.49
CO+17OH 5.64 16.35 −1.94 2.20
CO+18OH 5.54 31.19 −4.79 3.62
DFT-MP
C17O+OH 2.72 2.19 3.95 3.82
C18O+OH 2.73 4.15 7.02 7.13
CO+17OH 2.67 16.52 −2.07 5.67
CO+18OH 2.62 34.69 −5.03 11.21
MP2
C17O+OH 1.07 −0.10 3.31 1.31
C18O+OH 1.08 −2.37 5.22 1.61
CO+17OH 1.08 17.18 21.77 19.72
CO+18OH 1.08 33.15 41.85 38.65
aThe units of εapprox
1, ε
approx
2, and ε are in per mil.
bThe ratios of thermally weighted N1 and N2 at room temperature is listed in the N1/N2
column.
58
1 R. P. Wayne, Chemistry of Atmospheres (New York: Oxford University Press, 2000), 3rd
ed.
2 A. Miyoshi, H. Matsui, and N. Washida, J. Chem. Phys. 100, 3532 (1994).
3 C. D. Jonah, W. A. Mulac, and P. Zeglinski, J. Phys. Chem. 88, 4100 (1984).
4 D. Fulle, H. F. Hamann, H. Hippler, and J. Troe, J. Chem. Phys. 105, 983 (1996).
5 A. R. Ravishankara and R. L. Thompson, Chem. Phys. Lett. 99, 377 (1983).
6 V. Lissianski, H. Yang, Z. Qin, M. R. Mueller, and K. S. Shin, Chem. Phys. Lett. 240, 57
(1995).
7 M. S. Wooldridge, R. K. Hanson, and C. T. Bowman, Int. J. Chem. Kinet. 28, 361 (1996).
8 M. S. Wooldridge, R. K. Hanson, and C. T. Bowman, in 25th Symp. (Intl.) Combust. (1994),
pp. 741–748.
9 T. A. Brabbs, F. E. Belles, and R. S. Brokaw, in 13th Symp. (Intl.) Combust. (1971), pp.
129–136.
10 M. J. Frost, P. Sharkey, and I. W. M. Smith, J. Phys. Chem. 97, 12254 (1993).
11 M. J. Frost, P. Sharkey, and I. W. M. Smith, Faraday Discuss. Chem. Soc. 91, 305 (1991).
12 A. J. Hynes, P. H. Wine, and A. R. Ravishankara, J. Geophys. Res. 91, 11815 (1986).
13 A. Hofzumahaus and F. Stuhl, Ber. Bunsenges. Phys. Chem. 88, 557 (1984).
14 R. Forster, M. Frost, D. Fulle, H. F. Hamann, H. Hippler, A. Schlepegrell, and J. Troe, J.
Chem. Phys. 103, 2949 (1995).
59
15 N. F. Scherer, C. Sipes, R. B. Bernstein, and A. H. Zewail, J. Chem. Phys. 92, 5239 (1990).
16 D. M. Golden, G. P. Smith, A. B. McEwen, C. L. Yu, B. Eiteneer, M. Frenklach, G. L.
Vaghjiani, A. R. Ravishankara, and F. P. Tully, J. Phys. Chem. A 102, 8598 (1998).
17 H. G. Yu, J. T. Muckerman, and T. J. Sears, Chem. Phys. Lett. 349, 547 (2001).
18 T. V. Duncan and C. E. Miller, J. Chem. Phys. 113, 5138 (2000).
19 R. Valero and G. J. Kroes, J. Chem. Phys. 117, 8736 (2002).
20 R. S. Zhu, E. G. W. Diau, M. C. Lin, and A. M. Mebel, J. Phys. Chem. A 105, 11249
(2001).
21 J. P. Senosiain, C. B. Musgrave, and D. M. Golden, Int. J. Chem. Kinet. 35, 464 (2003).
22 R. Valero, D. A. McCormack, and G. J. Kroes, J. Chem. Phys. 120, 4263 (2004).
23 M. J. Lakin, D. Troya, G. C. Schatz, and L. B. Harding, J. Chem. Phys. 119, 5848 (2003).
24 D. M. Medvedev, S. K. Gray, E. M. Goldfield, M. J. Lakin, D. Troya, and G. C. Schatz, J.
Chem. Phys. 120, 1231 (2004).
25 W. C. Chen and R. A. Marcus, J. Chem. Phys. 123, 094307 (2005).
26 W. C. Chen and R. A. Marcus, J. Chem. Phys. 124, 024306 (2006).
27 M. Brouard, D. W. Hughes, K. S. Kalogerakis, and J. P. Simons, J. Chem. Phys. 112, 4557
(2000).
28 M. Brouard, I. Burak, D. W. Hughes, K. S. Kalogerakis, J. P. Simons, and V. Stavros, J.
Chem. Phys. 113, 3173 (2000).
29 C. M. Stevens, L. Kaplan, R. Gorse, S. Durkee, M. Compton, S. Cohen, and K. Bielling,
Int. J. Chem. Kinet. 12, 935 (1980).
60
30 T. Rockmann, C. A. M. Brenninkmeijer, G. Saueressig, P. Bergamaschi, J. N. Crowley,
H. Fischer, and P. J. Crutzen, Science 281, 544 (1998).
31 J. Bigeleisen and M. G. Mayer, J. Chem. Phys. 15, 261 (1947).
32 J. Bigeleisen, M. G. Mayer, P. C. Stevenson, and J. Turkevich, J. Chem. Phys. 16, 442
(1948).
33 J. T. Petty, J. A. Harrison, and C. B. Moore, J. Phys. Chem. 97, 11194 (1993).
34 J. Nolte, J. Grussdorf, E. Temps, and H. G. Wagner, Z. Naturforsch. A: Phys. Sci. 48, 1234
(1993).
35 G. Poggi and J. S. Francisco, J. Chem. Phys. 120, 5073 (2004).
36 M. J. Kurylo and A. H. Laufer, J. Chem. Phys. 70, 2032 (1979).
37 G. D. Greenblatt and C. J. Howard, J. Phys. Chem. 93, 1035 (1989).
38 K. L. Feilberg, S. R. Sellevag, C. J. Nielsen, D. W. T. Griffith, and M. S. Johnson, Phys.
Chem. Chem. Phys. 4, 4687 (2002).
39 D. H. Volman, J. Photochem. Photobiol. A-Chem. 100, 1 (1996).
40 Y. Q. Gao and R. A. Marcus, J. Chem. Phys. 114, 9807 (2001).
41 Although there are other methods treating for collisional energy transfer, such as the
exponential-down model, a stepladder model is computationally less intensive for the current
purpose of treating small isotope effects. Since the difference of vibrational frequencies and
rotational constants between isotopomers are small, the energy grain size for either model
needs to be small enough to distinguish the difference between isotopomers. The energy
grain size is 1 cm−1 in the current work to cover the 8000 cm−1 in the E range.25 Using a
61
stepladder model with a typical energy transfer parameter α (∼200 cm−1), there are 200
40×40 square matrices to be solved in the master equation. However, in the test calculation
the energy grain size for the exponential-down model to reach similar accuracy is around
5 cm−1, requiring, thereby, a single 1600×1600 matrix in the master equation. Although the
step-down model needs to have 200 matrices and the exponential-down model has only one,
the size of matrix in the exponential down model is considerably larger than those in the
stepladder model. Thereby, the stepladder model needed about one order of magnitude less
computational resources than the exponential-down model. Test calculations showed that
as long as the energy grain size is small enough to describe the properties of isotopomers,
both models gave similar pressure dependence for the fractionation. The fractionation at
low pressure is, of course, independent of the deactivation model.
42 C. Eckart, Phys. Rev. 35, 1303 (1930).
43 The vibrational frequencies and rotational constants of all stationary structures are calcu-
lated by the CCSD(T) method with the 6-31G(d,p) basis set.
44 The difference of rotational constants and most vibraitonal frequencies between our CC
and Yu’s CCSD(T)/cc-pVTZ17 in the equlibrium structures is less than 5%. The calculated
values of oxygen isotope fractionation by CC is higher than the other by around 0.5 per mil at
low pressure and around 1 per mil at 1 atm. Thus, the structures and vibrational frequencies
by CC is sufficiently good for the present study.
45 Compared with the experimental result by Forney et al.,56 the calculated vibrational fre-
quencies in trans-HOCO. are larger by less than 5%, except for the OH stretching (6%).
62
Since the offset is small, no scaling factor of vibrational frequencies was used in calculat-
ing the number of states. However, to account approximately for the anharmonicity of the
energetic intermediates, the density of states of trans- and cis-HOCO were increased by a
constant factor, 1.5.57 Again, this factor does not affect the low pressure fractionation.
46 Recent high level ab initio calculations were used for the energies of stationary points in the
LTSH potential.23 Since the imaginary frequency of TS2 in the LTSH potential is anoma-
lously low, the vibrational frequencies and rotational constants of all stationary structures
are calculated instead by ab initio methods. Only the energies without ZPE corrections of
the stationary structures are obtained from the LTSH potential.
47 The barrier heights of both TSs are robust with respective to the different calculations. Since
the classical barrier of TS1 at J=0 is lower than that of TS2, and the structure of TS2 is
more compact than TS1, the classical barrier of TS1 is lower than TS2 at all J . That is,
there is no rotational channel switching58 (change of principal exit channel with J).
48 S. D. Chambreau, D. Townsend, S. A. Lahankar, S. K. Lee, and A. G. Suits, Physica Scripta
73, C89 (2006).
49 S. A. Lahankar, S. D. Chambreau, D. Townsend, F. Suits, J. Farnum, X. B. Zhang, J. M.
Bowman, and A. G. Suits, J Chem. Phys. 125, 044303 (2006).
50 D. Townsend, S. A. Lahankar, S. K. Lee, S. D. Chambreau, A. G. Suits, X. Zhang, J. Rhei-
necker, L. B. Harding, and J. M. Bowman, Science 306, 1158 (2004).
51 The HO−CO distance of TS1 optimized by B3LYP is too long, about 2.99 A in B3LYP, so
doubtful frequencies would be expected. A similar result happened when Lin used B3LYP/6-
63
311G(d,p) to calculate TS1.20 The calculated HO−CO distance of TS1 calculated by CC and
MP is 2.03 and 1.95 A, respectively.
52 Gaussian 98, Revision A.11.3, M. J. Frisch, G. W. Trucks, H. B. Schlegel, G. E. Scuseria,
M. A. Robb, J. R. Cheeseman, V. G. Zakrzewski, J. A. Montgomery, Jr., R. E. Stratmann,
J. C. Burant, S. Dapprich, J. M. Millam, A. D. Daniels, K. N. Kudin, M. C. Strain, O.
Farkas, J. Tomasi, V. Barone, M. Cossi, R. Cammi, B. Mennucci, C. Pomelli, C. Adamo,
S. Clifford, J. Ochterski, G. A. Petersson, P. Y. Ayala, Q. Cui, K. Morokuma, N. Rega, P.
Salvador, J. J. Dannenberg, D. K. Malick, A. D. Rabuck, K. Raghavachari, J. B. Foresman,
J. Cioslowski, J. V. Ortiz, A. G. Baboul, B. B. Stefanov, G. Liu, A. Liashenko, P. Piskorz, I.
Komaromi, R. Gomperts, R. L. Martin, D. J. Fox, T. Keith, M. A. Al-Laham, C. Y. Peng,
A. Nanayakkara, M. Challacombe, P. M. W. Gill, B. Johnson, W. Chen, M. W. Wong, J.
L. Andres, C. Gonzalez, M. Head-Gordon, E. S. Replogle, and J. A. Pople, Gaussian, Inc,
Pittsburgh PA, 2002.
53 The equlibrium imaginary frequency of TS2 is 1526i, 2125i, and 3176i for DFT, CC, and
MP2, respectively.
54 H. G. J. Smit, A. Volz, D. H. Ehhalt, and H. Knappe, in Stable Isotopes, edited by
H. Schmidt, H. Forstel, and K. Heinzinger (Elsevier Scientific Publishing Company, 1982),
pp. 147–152.
55 C. M. Stevens, L. Kaplan, R. Gorse, S. Durkee, M. Compton, S. Cohen, and K. Bielling,
Int. J. Chem. Kinet. 12, 935 (1980).
56 D. Forney, M. E. Jacox, and W. E. Thompson, J. Chem. Phys. 119, 10814 (2003).

64
57 J. Troe, J. Chem. Phys. 79, 6017 (1983).
58 J. Troe, J Chem. Soc. Faraday Trans. 90, 2303 (1994).


![Physics and Modelling of Nanocrystalline Silicon Thin-Film ... · FET Field-efiect Transistor - A transistor which operates via the fleld-efiect, modulating ... switch[2]1. Intrinsica-Si:Hsatisflesthisrequirement](https://img.pdfslide.us/doc/110x75/5f7ed93f907945508032be14/physics-and-modelling-of-nanocrystalline-silicon-thin-film-fet-field-eiect.jpg)