Embed Size (px)
Citation preview
On the physical and chemical details of alumina atomic layer deposition: A combinedexperimental and numerical approachDongqing Pan, Lulu Ma, Yuanyuan Xie, Tien Chien Jen, and Chris Yuan Citation: Journal of Vacuum Science & Technology A 33, 021511 (2015); doi: 10.1116/1.4905726 View online: http://dx.doi.org/10.1116/1.4905726 View Table of Contents: http://scitation.aip.org/content/avs/journal/jvsta/33/2?ver=pdfcov Published by the AVS: Science & Technology of Materials, Interfaces, and Processing Articles you may be interested in Dynamic order reduction of thin-film deposition kinetics models: A reaction factorization approach J. Vac. Sci. Technol. A 34, 01A104 (2016); 10.1116/1.4930591 Hydrophilic mechanical buffer layers and stable hydrophilic finishes on polydimethylsiloxane using combinedsequential vapor infiltration and atomic/molecular layer deposition J. Vac. Sci. Technol. A 30, 01A156 (2012); 10.1116/1.3670963 Chemical and structural properties of atomic layer deposited La 2 O 3 films capped with a thin Al 2 O 3 layer J. Vac. Sci. Technol. A 27, L1 (2009); 10.1116/1.3079632 Reaction mechanisms during plasma-assisted atomic layer deposition of metal oxides: A case study for Al 2 O 3 J. Appl. Phys. 103, 103302 (2008); 10.1063/1.2924406 Island growth in the atomic layer deposition of zirconium oxide and aluminum oxide on hydrogen-terminatedsilicon: Growth mode modeling and transmission electron microscopy J. Appl. Phys. 96, 4878 (2004); 10.1063/1.1787624
Redistribution subject to AVS license or copyright; see http://scitation.aip.org/termsconditions. Download to IP: 129.89.130.91 On: Mon, 21 Sep 2015 15:10:53

On the physical and chemical details of alumina atomic layerdeposition: A combined experimental and numerical approach
Dongqing Pan, Lulu Ma, and Yuanyuan XieDepartment of Mechanical Engineering, University of Wisconsin-Milwaukee, Milwaukee, Wisconsin 53201
Tien Chien JenDepartment of Mechanical Engineering, University of Wisconsin-Milwaukee, Milwaukee, Wisconsin 53201and School of Engineering, University of Alaska Anchorage, Anchorage, Alaska 99508
Chris Yuana)
Department of Mechanical Engineering, University of Wisconsin-Milwaukee, Milwaukee, Wisconsin 53201
(Received 27 October 2014; accepted 29 December 2014; published 9 January 2015)
Alumina thin film is typically studied as a model atomic layer deposition (ALD) process due to its
high dielectric constant, high thermal stability, and good adhesion on various wafer surfaces.
Despite extensive applications of alumina ALD in microelectronics industries, details on the
physical and chemical processes are not yet well understood. ALD experiments are not able to shed
adequate light on the detailed information regarding the transient ALD process. Most of current
numerical approaches lack detailed surface reaction mechanisms, and their results are not well
correlated with experimental observations. In this paper, the authors present a combined
experimental and numerical study on the details of flow and surface reactions in alumina ALD
using trimethylaluminum and water as precursors. Results obtained from experiments and
simulations are compared and correlated. By experiments, growth rate on five samples under
different deposition conditions is characterized. The deposition rate from numerical simulation
agrees well with the experimental results. Details of precursor distributions in a full cycle of ALD
are studied numerically to bridge between experimental observations and simulations. The 3D
transient numerical model adopts surface reaction kinetics and mechanisms based on atomic-level
studies to investigate the surface deposition process. Surface deposition is shown as a strictly
self-limited process in our numerical studies. ALD is a complex strong-coupled fluid, thermal
and chemical process, which is not only heavily dependent on the chemical kinetics and surface
conditions but also on the flow and material distributions. VC 2015 American Vacuum Society.
[http://dx.doi.org/10.1116/1.4905726]
I. INTRODUCTION
Atomic layer deposition (ALD) has been adopted exten-
sively in silicon microelectronics and thin-film device indus-
tries and is on rapid expansion to more industrial
applications.1 ALD is operated by injecting two or more
chemical precursors into a chamber alternately to enable ma-
terial deposition on substrates layer by layer. The sequential
saturated surface reaction makes ALD process highly self-
limited, and thus, the resultant films are perfectly uniform in
surface geometry. Film thickness can be accurately con-
trolled in Angstrom or monolayer level with high preci-
sions.1 Thanks to its high dielectric constant, high thermal
stability, and good adhesion on various wafer surfaces,
Al2O3 thin film is typically studied as a model ALD pro-
cess.1,2 The Al2O3 dielectric film was first reported to be de-
posited by ALD using trimethylaluminum (TMA) and
H2O,3,4 and recently, more researchers adopt TMA and
ozone as precursors.2,5–7 Our study focuses on the typical
Al2O3 ALD using TMA and H2O, whose surface deposition
process can be represented as following two half reactions:
�Al�OHþAlðCH3Þ3!�Al�O�AlðCH3Þ2þCH4; (1)
�Al� CH3 þ H2O! �Al� OHþ CH4; (2)
where * items denote surface species.
Although a lot of materials are being deposited by ALD,
details on its physical and chemical processes are not yet
well understood.8 In general, studies of ALD process have
been developing into two domains: experimental and numer-
ical. Experimental researchers improve the deposited films
by adjusting experimental conditions, e.g., process pressure,
temperature, and dosage.9–14 Li et al. studied the effects of
process temperature and pressure on Al2O3 film properties
by characterizing the film thickness uniformity, impurity
incorporation, and the step coverage in high aspect ratio fea-
tures.2 Mousa et al. presented a study of the effects of tem-
perature and gas velocity on film growth in Al2O3 and ZnO
ALD, respectively.15 Sammelselg et al. studied the growth
unevenness and film compositions in ALD of TiO2 thin
films.16 Influence of growth temperature on properties of zir-
conium dioxide films by ALD was examined by Kukli
et al.17 Similar research was conducted by Scarel et al. to
study the electric properties of ZrO2 films.18 Confined by
technical, economic and time infeasibilities in experimental
implementations, ALD experiments are always facing a
“black box” without knowing enough details about the
a)Author to whom correspondence should be addressed; electronic mail:
021511-1 J. Vac. Sci. Technol. A 33(2), Mar/Apr 2015 0734-2101/2015/33(2)/021511/11/$30.00 VC 2015 American Vacuum Society 021511-1
Redistribution subject to AVS license or copyright; see http://scitation.aip.org/termsconditions. Download to IP: 129.89.130.91 On: Mon, 21 Sep 2015 15:10:53

transient process, and thus, they only focus on the “output,”
such as growth rate, film properties. Consequently, they are
not able to shed adequate light on the detailed information of
ALD process.
With progresses in computing technologies, many
researchers are devoted to studying physical interactions and
chemical kinetics of ALD by numerical approaches. ALD
process is in essence a multiscale process, which not only
involves atomic bonds formations, species chemisorptions,
and nanofilm deposition (in molecular scale), but also
includes material interactions and energy transport in macro-
scopic scale (in chamber scale).
In molecular scale, most numerical investigations adopt
the first principle methods, such as the density function
theory (DFT) method to explore surface reaction mecha-
nisms and chemical reaction pathways.19 In the paper of
Delabie et al., ALD of Al2O3 using TMA and water was
studied using DFT to investigate reaction pathways and pos-
sible mechanisms for growth inhibition in ALD cycles.20
The atomic-scale structure of alumina film by ALD was also
studied by Elliott and Greer using the DFT method.21
Besides DFT, Puurunen derived a mathematical model to
describe the growth rate in ALD.22 In the cited paper,
“ligand exchange” and “dissociation or association” were
proposed as two types of chemisorption mechanisms.22 The
above atomic-level models revealed certain microscopic
details of the surface reaction mechanisms and chemical
kinetics, but few of them considered the material and energy
transfer processes in ALD.
Some researchers took the macroscopic transport proc-
esses into consideration using other methods such as Monte
Carlo method, molecular dynamics, and Lattice Boltzmann
method. Gilmer et al. applied the Monte Carlo models to
simulate film deposition in atomic scale.23 Kinetic Monte
Carlo methods were proposed in Refs. 24 and 25 to investi-
gate ALD process of HfO2 and Al2O3, respectively. Hu et al.used molecular dynamics model to study the structure of
Al2O3 film in the aspects of surface composition, roughness
and growth rate.26 Similar method was adopted by Gou et al.to simulate surface interactions on silicon wafer in ALD.27
Lattice Boltzmann method is a relatively new but rapidly
developing mesoscopic approach, which uses the lattice
schemes to solve the Boltzmann equation.28 He et al. first
applied the Lattice Boltzmann method to simulate diffusion-
convection processes with surface chemical reactions on
solid surfaces.29 Finally, we extended the method and used it
in simulating the gas flow in ALD.28
Due to multiple scales both in space and time, ALD simu-
lation in chamber scale remains challenging. In this filed,
Adomaitis developed numerical models to describe the
ballistic transport of chemical precursor species in ALD
process.30 Holmqvist et al. claimed a mechanistic model of
continuous flow reactors.31,32 By continuum-based models
in the cited papers, gas-phase fluid dynamics, mass transport,
and heterogeneous gas–surface reaction mechanisms were
analyzed numerically. We recently constructed a similar
mechanistic model with detailed chemical kinetics to study
alumina ALD process.33 In a paper published by Adomaitis,
a multiscale model of ALD was developed by coupling the
lattice Monte Carlo method with a continuum approach of
precursor transport.34
These chamber-scale models can fundamentally describe
the ALD process together with the chemical kinetics in a
larger picture. However, most of them lack detailed surface
reaction mechanisms and numerical results are not well cor-
related with the experimental observations. In this paper, we
perform a combined experimental and numerical study on
the details of flow and surface reactions in ALD and the
results from both experiments and simulations are correlated.
By experiments, the growth rate under different deposition
conditions is studied and characterized. Details regarding
precursor pulsing and purging processes in a full cycle of
ALD simulation are studied numerically to bridge between
growth rate and precursor distributions. The 3D transient
numerical model adopts surface reaction kinetics and mecha-
nisms based on the atomic-level calculations20,22 to study
the surface deposition process. The combined experimental
and numerical methodology could be applied in further
research for in-depth understanding of ALD process.
II. METHODS
A. Experiments
The surface reaction process and Al2O3 film growth rate
are characterized by the Cambridge NanoTech Savannah
100 ALD system using TMAþH2O reactions. The ALD
system shown in Fig. 1 consists of precursor cylinders, pre-
cursor manifold, carrier gas manifold, chamber, outlet pipe,
and a vacuum pump. TMA and water stored in separate pre-
cursor cylinders are injected into chamber by their own
vapor pressure at room temperature (25 �C), and pulsing (in
milliseconds) is controlled by ALD stop valves. Nitrogen is
FIG. 1. (Color online) Cambridge Nanotech Savannah S100 ALD system
consists of precursor cylinders, precursor manifold, carrier gas manifold,
chamber, outlet manifold, and a vacuum pump (not shown in the figure).
021511-2 Pan et al.: On the physical and chemical details of alumina ALD 021511-2
J. Vac. Sci. Technol. A, Vol. 33, No. 2, Mar/Apr 2015
Redistribution subject to AVS license or copyright; see http://scitation.aip.org/termsconditions. Download to IP: 129.89.130.91 On: Mon, 21 Sep 2015 15:10:53

the carrier gas flowing through the system continuously dur-
ing all the operations. A vacuum pump is connected with
outlet pipe to maintain the low vacuum pressure
(�10�1 Torr) in chamber. The reactor chamber (with
150 mm inner diameter) is designed for deposition of films
on substrates with diameter up to 100 mm and can be heated
from 100 to 250 �C depending on specific deposition
conditions.
In our experiments, alumina films are deposited on sub-
strates of crystal silicon 100 with dimensions of 10 mm �10 mm, using 99.9% TMA as the metal provider and 99.0%
distilled water as the oxidizer. The wafers are prepared by
first being immersed in 5% HF acid solution for 5 min, and
rinsed in distilled water. With HF treatment, the layers of
native oxide are removed.35 Then, the wafers are immersed
in 30% H2O2 and 70% H2SO4 mixed acid solution for 5 min
and washed by distilled water. For each experiment, five
samples are placed inside the chamber, with one in the cen-
ter, the other four around equilaterally. Specifically, sub-
strate A is placed at the inlet, C at the outlet, B and D at the
upper and lower positions, and E in the center of chamber.
Before depositions, each component of ALD system is
heated to the prescribed temperature and the system is stabi-
lized for 300 s. Pulsing time for both TMA and water vapor is
0.015 s, while purging time for both TMA and water vapor is
tested with 8 and 20 s, respectively. In our ALD cycle, TMA
is pulsed, and then purged in the first half cycle, and in the
second half cycle, water is injected and purged. To be spe-
cific, the ALD cycle in 8 s purging experiment is TMA/purge/
water/purge¼ 0.015 s/8 s/0.015 s/8 s and in 20 s purging
experiment, TMA/purge/water/purge¼ 0.015 s/20 s/0.015 s/
20 s. Nitrogen is flowing through the system at 20 sccm. A
total of 60 cycles are deposited in our experiments. The accu-
mulated film thickness by ALD is characterized by the
UVISEL Spectroscopic Ellipsometer (HORIBA, Ltd.).
B. Mathematical modeling
ALD cycle can be decoupled into several physical and
chemical procedures, such as momentum transport (material
flow), convective heat transfer (system heating), mass trans-
fer (species transport), as well as chemical reactions (surface
species chemisorption). Each process is governed by corre-
sponding partial differential equations (PDEs), which can be
solved numerically on the defined domain. These PDEs are
derived using the finite volume method (FVM). The surface
reaction kinetics and mechanisms are defined on surface
sites to simulate the material deposition process.
1. Fluid dynamics
The continuum-based Finite Volume Method assumes the
concerned domain as a continuum. The continuity equation
conserves mass36,37
@q@tþr � qV
*� �
¼ Sm; (3)
where q is the density, V*
is the velocity vector, and Sm is a
mass source term.
The flow in S100 ALD system was confirmed as a lami-
nar flow.28 The process of momentum transport within the
laminar flow in the ALD chamber is governed by the mo-
mentum conservation equation36,37
@
@tqV*
� �þr � qV
*
V*
� �¼ �rPþr � ~s þ qg
*þ F*
; (4)
where P is the static pressure; qg*
and F*
are the gravitational
body force and external body forces, respectively; and ~s is
the stress tensor, which is defined as36,37
~s ¼ l rV*
þrV*T
� �� 2
3r � V
*~I
� �; (5)
where l is the fluid dynamic viscosity, ~I is the unit tensor,
and the term ð2=3Þr � V*
~I is the effect of volume dilation.
To model the species transport in ALD system, the con-
vection–diffusion equation is adopted. In ALD system, the
two-component gaseous mixture is concerned: (1) water
vapor and nitrogen; (2) TMA vapor and nitrogen. The con-
vection–diffusion equation for species i takes the following
form:38
@
@tqcið Þ þ r � qciV
*� �
¼ �r � J*
m;i þ Ri þ Si; (6)
where ci is the local molar fraction of species i, Ri is the net
rate of production of species i by chemical reaction, and Si is
the source of species i.The diffusion flux, J
*
m;i, is the mass diffusion due to the
gradients of concentration and temperature. In a mixture,
when concentration of one species is much lower than the
major component, the dilute approximation is satisfied, and
Fick’s law is used to model mass diffusive flux of the dilute
species.38 In ALD system, although each precursor is pulsed
in a very short time (e.g., 0.015 s), the amount of precursor
injection is shown large in our numerical flow characteriza-
tion and experimental observations. The dilute approximation
does not hold in our case, so the Maxwell–Stefan equation
for full multicomponent diffusion is more appropriate38
J*
m;i ¼ �XN�1
j ¼ 1
j 6¼ i
qDijrci � DT;irT
T; (7)
where Dij is the binary Maxwell–Stefan diffusive coefficient
of species i and j; N is the total number of species in the
mixture.
2. Heat transfer
In ALD process, heat transfer is in forms of conduction
between chamber and pipe, and convection between wall
and gaseous mixture. Also, there is heat transfer by species
diffusion, e.g., heat transfer because of mass diffusion
caused by material concentration gradients.38–40
With the very small portion of radiation between chamber
and gases neglected, the overall heat transfer within ALD
chamber is governed by the energy equation
021511-3 Pan et al.: On the physical and chemical details of alumina ALD 021511-3
JVST A - Vacuum, Surfaces, and Films
Redistribution subject to AVS license or copyright; see http://scitation.aip.org/termsconditions. Download to IP: 129.89.130.91 On: Mon, 21 Sep 2015 15:10:53

@
@tqEð Þ þ r � V
*
qEþ Pð Þh i
¼ r � krT �X
i
hiJ*
h;i þ ~s � V*
� �� �þ S; (8)
where k is the material thermal conductivity and hi is the en-
thalpy of mixture species i; and J*
h;i is the diffusion heat flux
of mixture species i. S is the source term of heat, which is
due to chemical reaction or other heat sources. The term E is
defined as39,40
E ¼ h� P
qþ V2
2: (9)
In summary, precursor distribution in the ALD system is
achieved by solving the species transport Eq. (6) with incor-
poration of the momentum conservation Eq. (4) and energy
Eq. (8).
3. Chemical kinetics
Because gas flow in the concerned ALD system is shown
as laminar, the laminar finite-rate method is adopted to cou-
ple the surface reactions with species transport. In laminar
finite-rate model, the effect of turbulent fluctuations is
ignored and the finite reaction rates are determined by
Arrhenius expressions. To model the reactions accompany-
ing species transport in ALD chamber, the production rate of
species i by chemical reactions, Ri in Eq. (6) is calculated
through the laminar finite-rate model using Arrhenius
expressions
Ri ¼ Mw;i
XNr
i¼1
Ri;r; (10)
where Mw;i is the molecular weight of species i and Ri;r is
the Arrhenius molar rate of creation or destruction of species
i in reaction r.
In real ALD system, there are two kinds of reactions
involved: gaseous volumetric reaction and solid surface
reaction. However, in alumina ALD, gaseous volumetric
reactions happen only when the two gaseous precursors
(TMA and water) coexist in ALD chamber. Since surface
reactions enable film depositions, gaseous reactions are not
the main concerns for studying the film deposition process.
The general form of the rth irreversible surface reaction in
ALD chamber takes the form as
XNg
i¼1
g0i;rGi þXNb
i¼1
b0i;rBi þXNs
i¼1
s0i;rSi!krXNg
i¼1
g00i;rGi
þXNb
i¼1
b00i;rBi þXNs
i¼1
s00i;rSi; (11)
where G, B, and S denote gaseous species, bulk (solid) spe-
cies, and surface species, respectively; Ng, Nb, and Ns are
the total number of the corresponding gaseous, bulk and sur-
face species; g0i;rb0i;r and s0i;r are the stoichiometric
coefficients for each reactant species i; g00i;rb00i;r and s00i;r are the
stoichiometric coefficients for each product species i; the
rate constant kr is evaluated by the Arrhenius expression
kr ¼ ArTbr exp
�Er
RT
� ; (12)
where Ar is the pre-exponential factor; br is the temperature
exponent; Er is the activation energy; and R is the universal
gas constant.
The reaction rate of surface reaction <r represented by
Eq. (11) is calculated as
<r ¼ kf ;r
YNg
i¼1
½Gi�g0i;rw
YNs
j¼1
½Sj�s0i;rw ; (13)
where, for gaseous species, []w represents molar concentra-
tions on wall surfaces and for surface species, and []w is the
surface coverage. The bulk species are not included, because
reaction rate is independent of bulk species. The net molar
rate of production or consumption of each species i is given
by
Ri;g ¼XNR
r¼1
ðg00i;r � g0i;rÞ<r; i ¼ 1; 2:::Ng;
Ri;b ¼XNR
r¼1
ðb00i;r � b0i;rÞ<r; i ¼ 1; 2:::Nb;
Ri;s ¼XNR
r¼1
ðs00i;r � s0i;rÞ<r; i ¼ 1; 2:::Ns;
(14)
where NR represents the total number of surface reactions in
ALD chamber.
By substituting Eq. (14) into Eq. (10), the production (or
destruction) rate of species i, Ri in Eq. (6) can be evaluated.
4. Surface reaction mechanisms
The surface deposition mechanisms of alumina ALD are
quite complicated. In a theoretical model by Puurunen, two
possible chemisorption mechanisms of ALD surface reac-
tions were proposed: “ligand exchange” and “dissociation
and association.”8,22 Delabie et al. studied the pathways of
TMA and H2O surface reactions using DFT method.20 ALD
surface reactions are accomplished through two possible
mechanisms, namely, “ligand exchange reaction” and
“chemisorption reaction.”20 At the initial state, wafer surface
is covered by hydroxyl group. In the ligand exchange mecha-
nism, surface species *OH sites are exchanged with a methyl
group of TMA
AlðCH3Þ3 þ �OH! �CH3 þ AlðCH3Þ2OH: (15)
For the chemisorption reaction type, the H atom from the
surface sites is transferred to one of the methyl groups of
TMA, resulting in gaseous CH4 and Al-O bond
AlðCH3Þ3 þ �OH! �O–AlCH3ðsÞ þ CH4: (16)
021511-4 Pan et al.: On the physical and chemical details of alumina ALD 021511-4
J. Vac. Sci. Technol. A, Vol. 33, No. 2, Mar/Apr 2015
Redistribution subject to AVS license or copyright; see http://scitation.aip.org/termsconditions. Download to IP: 129.89.130.91 On: Mon, 21 Sep 2015 15:10:53
It has been shown by the DFT calculations the chemisorp-
tion reactions are strongly favored kinetically over the ligand
exchange reactions.20 Therefore, in this study, we adopted
the chemisorption reaction mechanisms to study the reac-
tions in TMA and water pulsing steps. The corresponding
complete surface reactions are formulated by two half reac-
tions as
TMA pulse : 2AlðCH3Þ3ðgÞ þ 3�OHðsÞ ! �AlCH3ðsÞþ �AlðCH3Þ2ðsÞ þ 3Ohsi þ 3CH4ðgÞ;
Water pulse : 3H2OðgÞ þ �Al–CH3ðsÞ þ �Al–ðCH3Þ2ðsÞ! 3�OHðsÞ þ 2Alhsi þ 3CH4ðgÞ;
(17)
where hsi denotes solid (or bulk) species and g stands for the
gaseous species. The two half reactions involve two gaseous
species, three surface species, and two bulk species.
Besides, for the numerical model in this paper, the fol-
lowing assumptions are presumed for the reaction mecha-
nisms: (1) Only surface reactions are considered; (2) both
half surface reactions are irreversible considering genera-
tions of gaseous methane; and (3) at the initial state, full cov-
erage of hydroxyl group on wafer surfaces is assumed.
C. Numerical solution details
A transient 3D numerical model based on the Cambridge
Nanotech S100 ALD system is created and solved under the
framework of ANSYS Fluent. The computational domain is
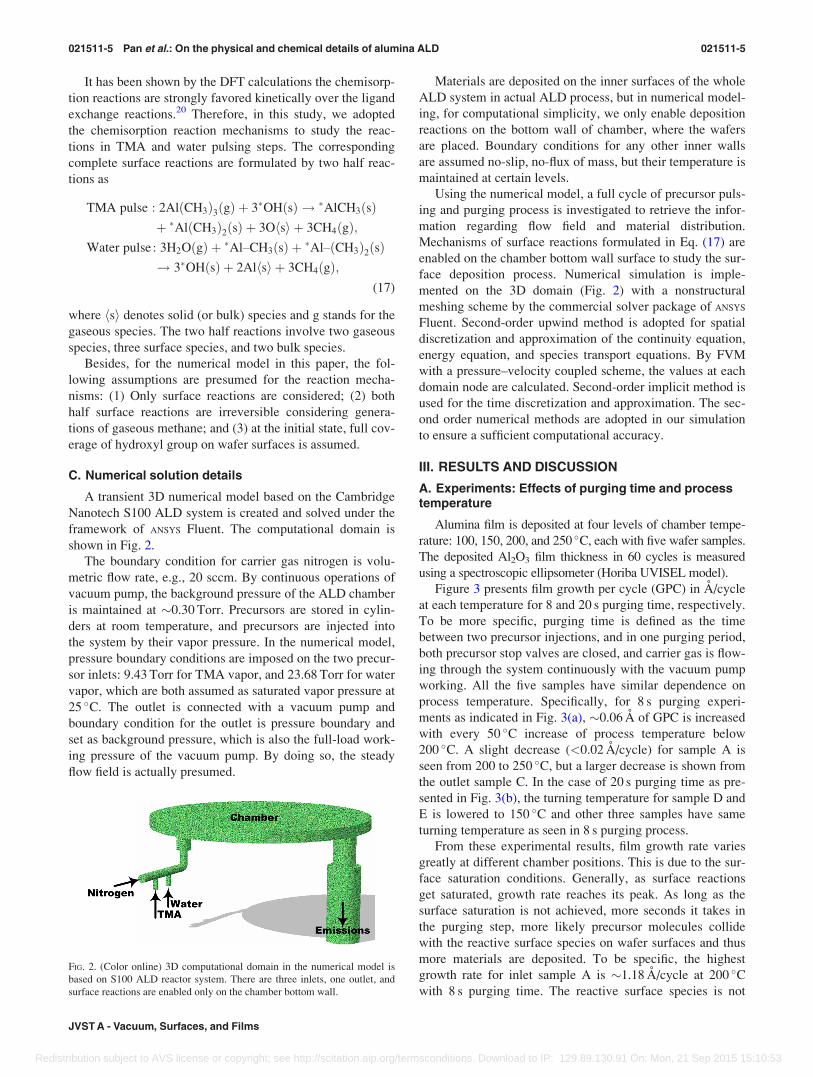
shown in Fig. 2.
The boundary condition for carrier gas nitrogen is volu-
metric flow rate, e.g., 20 sccm. By continuous operations of
vacuum pump, the background pressure of the ALD chamber
is maintained at �0.30 Torr. Precursors are stored in cylin-
ders at room temperature, and precursors are injected into
the system by their vapor pressure. In the numerical model,
pressure boundary conditions are imposed on the two precur-
sor inlets: 9.43 Torr for TMA vapor, and 23.68 Torr for water
vapor, which are both assumed as saturated vapor pressure at
25 �C. The outlet is connected with a vacuum pump and
boundary condition for the outlet is pressure boundary and
set as background pressure, which is also the full-load work-
ing pressure of the vacuum pump. By doing so, the steady
flow field is actually presumed.
Materials are deposited on the inner surfaces of the whole
ALD system in actual ALD process, but in numerical model-
ing, for computational simplicity, we only enable deposition
reactions on the bottom wall of chamber, where the wafers
are placed. Boundary conditions for any other inner walls
are assumed no-slip, no-flux of mass, but their temperature is
maintained at certain levels.
Using the numerical model, a full cycle of precursor puls-
ing and purging process is investigated to retrieve the infor-
mation regarding flow field and material distribution.
Mechanisms of surface reactions formulated in Eq. (17) are
enabled on the chamber bottom wall surface to study the sur-
face deposition process. Numerical simulation is imple-
mented on the 3D domain (Fig. 2) with a nonstructural
meshing scheme by the commercial solver package of ANSYS
Fluent. Second-order upwind method is adopted for spatial
discretization and approximation of the continuity equation,
energy equation, and species transport equations. By FVM
with a pressure–velocity coupled scheme, the values at each
domain node are calculated. Second-order implicit method is
used for the time discretization and approximation. The sec-
ond order numerical methods are adopted in our simulation
to ensure a sufficient computational accuracy.
III. RESULTS AND DISCUSSION
A. Experiments: Effects of purging time and processtemperature
Alumina film is deposited at four levels of chamber tempe-
rature: 100, 150, 200, and 250 �C, each with five wafer samples.
The deposited Al2O3 film thickness in 60 cycles is measured
using a spectroscopic ellipsometer (Horiba UVISEL model).
Figure 3 presents film growth per cycle (GPC) in A/cycle
at each temperature for 8 and 20 s purging time, respectively.
To be more specific, purging time is defined as the time
between two precursor injections, and in one purging period,
both precursor stop valves are closed, and carrier gas is flow-
ing through the system continuously with the vacuum pump
working. All the five samples have similar dependence on
process temperature. Specifically, for 8 s purging experi-
ments as indicated in Fig. 3(a), �0.06 A of GPC is increased
with every 50 �C increase of process temperature below
200 �C. A slight decrease (<0.02 A/cycle) for sample A is
seen from 200 to 250 �C, but a larger decrease is shown from
the outlet sample C. In the case of 20 s purging time as pre-
sented in Fig. 3(b), the turning temperature for sample D and
E is lowered to 150 �C and other three samples have same
turning temperature as seen in 8 s purging process.
From these experimental results, film growth rate varies
greatly at different chamber positions. This is due to the sur-
face saturation conditions. Generally, as surface reactions
get saturated, growth rate reaches its peak. As long as the
surface saturation is not achieved, more seconds it takes in
the purging step, more likely precursor molecules collide
with the reactive surface species on wafer surfaces and thus
more materials are deposited. To be specific, the highest
growth rate for inlet sample A is �1.18 A/cycle at 200 �Cwith 8 s purging time. The reactive surface species is not
FIG. 2. (Color online) 3D computational domain in the numerical model is
based on S100 ALD reactor system. There are three inlets, one outlet, and
surface reactions are enabled only on the chamber bottom wall.
021511-5 Pan et al.: On the physical and chemical details of alumina ALD 021511-5
JVST A - Vacuum, Surfaces, and Films
Redistribution subject to AVS license or copyright; see http://scitation.aip.org/termsconditions. Download to IP: 129.89.130.91 On: Mon, 21 Sep 2015 15:10:53

saturated under this condition. With extra 12 s purging time,
its growth rate reaches to its peak of �1.24 A/cycle at same
temperature in the case of 20 s purging time. For the sample
at outlet (sample C), surface reaction has been already satu-
rated in 8 s purging process, and hence, its highest growth
rate is kept at �1.09 A/cycle in 20 s purging.
The possible reason for different turning temperature
observed in samples D and E is that collision probabilities
are increased by the extra time in 20 s purging, and the sur-
face deposition process is expedited so that surface species
have been saturated at lower temperature (150 �C). The
slightly increased peak growth rate (sample D from 1.16 to
1.18 A/cycle; sample E from 1.15 to 1.19 A/cycle) is also
due to the longer contacting time of precursor molecules
with wafer surfaces.
The overall temperature effect on GPC presented in Fig. 3
can be well interpreted by the concept of “ALD window.”1 At
lower temperature, e.g., 100 �C, the growth rate is low
because the precursor would condense on the surface in liquid
state or there is no sufficient thermal energy to enable and fin-
ish the surface reactions.1 The decreased growth rate at higher
temperature (250 �C) is attributed to the enhanced desorption
of the formed surface species at higher temperature.1
Another interesting feature exposed by the growth rate
experiments is that at each deposition temperature, materials
are deposited faster on inlet wafers than outlet substrates. In
8 s purging time, growth rate of outlet sample is �0.10 A/
cycle lower than the inlet sample. The lower deposition rate
on sample C is possibly attributed to the following facts: (1)
The outlet sample C is close to the vacuum pump, and the
flow at outlet is much faster than at inlets. The convective
effect on precursor transport is much stronger at outlet, and
consequently, weaker diffusive effect decreases the deposi-
tion rate; (2) For the sample C, although all the precursor
molecules gather at outlet, most precursor molecules are
consumed in the surface reactions on the wafers and also the
system inner surfaces. In fact, the amount of precursor mole-
cules reaching at outlet would be much smaller than the inlet
area. Furthermore, precursors are diluted by the resultant gas
product CH4, and hence, its concentration is largely
decreased at the outlet. Therefore, lower GPCs are observed
at outlet sample. Additional light is also shed on this obser-
vation in the aspect of unevenness of precursor distributions
inside the chamber by simulations and numerical analysis in
Sec. III B.
Surface-averaged growth rates from both experimental
and numerical investigations are demonstrated in Fig. 4.
Deposition rates obtained from numerical simulation are
very close to the experimental results. The numerical alu-
mina growth rate is achieved by considering the resulted
bulk species from both half reactions described in Eq. (17)
and is averaged for the five sample surfaces. The numerical
GPC increases from �1.10 A/cycle at 100 �C to �1.22 A/
cycle at 200 �C. A slight decrease is also seen at 250 �C as
the experimental curves.
The numerical GPC is �0.05 A/cycle larger than the ex-
perimental results averagely. The larger values are mainly
due to the presumed assumptions in numerical modeling.
The theoretical modeling process has simplified the
actual process with several assumptions listed in Sec. II B,
while in experiments several factors are involved to hinder
the deposition process. For instance, at the initial state,
FIG. 3. (Color online) Al2O3 film growth rate in A/cycle for: (a) 8 s purging
experiments; (b) 20 s purging experiments. Sample A is located in the inlet
area and sample C in the outlet area.
FIG. 4. (Color online) Comparisons of surface-averaged Al2O3 film growth
rates in A/cycle by experimental and numerical investigations.
021511-6 Pan et al.: On the physical and chemical details of alumina ALD 021511-6
J. Vac. Sci. Technol. A, Vol. 33, No. 2, Mar/Apr 2015
Redistribution subject to AVS license or copyright; see http://scitation.aip.org/termsconditions. Download to IP: 129.89.130.91 On: Mon, 21 Sep 2015 15:10:53
hydroxylization of the wafer surfaces cannot be perfectly
100% (which is assumed in numerical modeling). Also, cal-
culations based on DFT showed that complex intermediate
products are generated in ALD reactions.20 However, for
computational feasibility and simplicity, numerical model
neglects these intermediate species. The involvement of in-
termediate reactions is difficult to be predicted without
actual experimental conditions, because they are heavily de-
pendent on precursor dosage, purging time, local precursor
concentration, surface species coverage, and local tempera-
ture, etc.8–14 The agreement of GPC between experimental
and numerical results confirms the validity of our numerical
model, which are used for further exploration of ALD pro-
cess in detail.
B. Numerical investigations
1. Full cycle flow simulation: effect of carrier gas flowrate
To correlate the growth rate observed in experiments
(Fig. 3) with material distributions, precursor concentrations
are obtained by solving the species transport Eq. (6) with
incorporation of the momentum conservation Eq. (4) and the
energy Eq. (8). The numerical study is implemented by run-
ning a full cycle of ALD simulation.
Molar concentrations of TMA and water are probed dur-
ing the transient calculations at five spots corresponding to
the samples in experiments. Figures 5(a) and 5(b) show
TMA distribution for purging flow rate 20 and 200 sccm,
respectively. At the initial state, only N2 exists in chamber.
TMA vapor is injected into the system by opening the ALD
stop valve for 0.015 s. The inlet sample (point A) responds
much faster than any other samples. TMA at both point C
and E reach to the highest concentration within the pulsing
step, but the peak molar fraction at B and D is only �60%.
In the following 10 s precursor purging step, TMA is
diluted in chamber by the continuously incoming carrier gas
and purged by the vacuum pump. TMA concentration at
point A decreases dramatically from its peak value, but
molar fractions at B and D increase to nearly 80% at the end
of purging process (10.015 s) after a slight decrease. In the
first half ALD cycle (0.015 s/10 s), TMA at point A remains
at higher concentration level for longer time than any other
samples. Higher concentration increases the collision proba-
bilities of precursor molecules with the surface sites and
results in higher deposition rates in the inlet area observed in
experimental GPC results (Fig. 3). On the other hand, the
lower deposition rates at sample B and D are due to the
lower precursor concentration levels.
By comparing Figs. 5(a) and 5(b), it is concluded carrier
gas flow rate exerts little influence on pulsing step, but it
largely determines precursor distributions during purging
step. In the case of 20 sccm flow rate, TMA concentrations
remain high in the most area of chamber (at B, D, and
E> 50%), while much lower concentrations (all the
samples< 20%) are observed for 200 sccm flow rate.
In the second-half cycle, water vapor is introduced into
chamber. Figures 5(c) and 5(d) demonstrate water vapor
distribution for carrier gas flow rate of 20 and 200 sccm,
respectively. Comparing with TMA, water vapor molecules
take the whole chamber space much faster. Different purging
gas flow rate makes no difference on water distributions in
the pulsing step, neither. However, for 20 sccm flow rate as
shown in Fig. 5(c), precursor concentrations at the four sam-
ples except A are kept at higher levels through the 10 s purg-
ing step. This implies that 20 sccm flow rate is not sufficient
to purge all the precursor material out of ALD system. By
200 sccm flow rate, the situation is much improved as shown
in Fig. 5(d).
From simulations, it has been shown the driving force to
inject precursors into ALD system is mainly due to the rela-
tively strong flow field caused by high precursor vapor pres-
sure, but after the very rapid pulsing (0.015 s) process,
precursor molecules are mainly driven by the relatively
weak flow field formed from carrier gas. During the slow
purging procedure, precursor molecules still have chances to
collide and react with the reactive surface sites. This is why
longer purging time slightly increases the growth rate as
seen in experiments.
Increasing carrier gas flow rate will speed up the purging
procedure, but this will also shorten collision time of precur-
sor molecules with surface species which hence will result in
lower deposition rate. An alternative way is to increase the
purging time. However, this implies longer ALD cycle time,
which is usually unfeasible in real applications considering
hundreds of cycles needed to deposit a film.
2. Surface chemistry simulation: effect of processtemperature
To further study the surface reaction details numerically,
ALD surface chemical kinetics modeled by Eqs. (14) and
(10) is integrated into species transport and flow simulation
by evaluating the production or destruction rate of species i,Ri in Eq. (6).
Figure 6 shows the correlations of surface deposition rate
of Ohsi and TMA molar fraction with surface coverage of
*Al(CH3)2(s) for TMA pulsing step at 100, 150, 200, and
250 �C, respectively. Coverage of species *Al(CH3)2(s)
increases in the first 0.005 s, and Ohsi deposition rate reaches
its peak. When *Al(CH3)2(s) is saturated to 50% [another
half is taken by *AlCH3 (s)], the deposition rate declines
drastically. Thereafter, despite the increasing TMA concen-
tration, the surface coverage and deposition rate remain
unchanged.
The gray dotted lines indicated in Fig. 6 show tempera-
ture effect on surface reactions. The mass deposition rate
increases with temperature from 100 to 250 �C in the first
0.004 s. However, at 0.004 s, deposition rate of 250 �C is
seen slightly lower than that of 200 �C. The reason can be
found by observing *Al(CH3)2(s) surface coverage at
250 �C. At 0.004 s, surface species has already been satu-
rated at 250 �C, compared to an unsaturated condition at
200 �C. This implies that surface deposition is highly de-
pendent on surface coverage conditions.
021511-7 Pan et al.: On the physical and chemical details of alumina ALD 021511-7
JVST A - Vacuum, Surfaces, and Films
Redistribution subject to AVS license or copyright; see http://scitation.aip.org/termsconditions. Download to IP: 129.89.130.91 On: Mon, 21 Sep 2015 15:10:53

FIG. 6. (Color online) Correlations of surface deposition rate of Ohsi and TMA molar fraction with coverage of *Al(CH3)2(s) for TMA pulsing step at 100,
150, 200, and 250 �C, respectively. The gray dotted lines show the temperature effect on surface deposition. Surface deposition rate of Ohsi in mass per area
per second is achieved by substituting Eq. (14) into Eq. (10).
FIG. 5. (Color online) Precursor distributions during the full cycle of flow simulations for: (a) TMA molar fraction for carrier gas flow rate of 20 sccm;
(b) TMA molar fraction for carrier gas flow rate of 200 sccm; (c) water molar fraction for carrier gas flow rate of 20 sccm; and (d) water molar fraction for car-
rier gas flow rate of 200 sccm. A is located in inlet area and C in the outlet area.
021511-8 Pan et al.: On the physical and chemical details of alumina ALD 021511-8
J. Vac. Sci. Technol. A, Vol. 33, No. 2, Mar/Apr 2015
Redistribution subject to AVS license or copyright; see http://scitation.aip.org/termsconditions. Download to IP: 129.89.130.91 On: Mon, 21 Sep 2015 15:10:53
It is also worthwhile to point out that the peak deposition
rate is independent of process temperature. With temperature
changing from 100 to 200 �C, the peak values of deposition
rate are mostly the same. However, higher temperature
indeed accelerates the deposition process before surface spe-
cies get saturated.
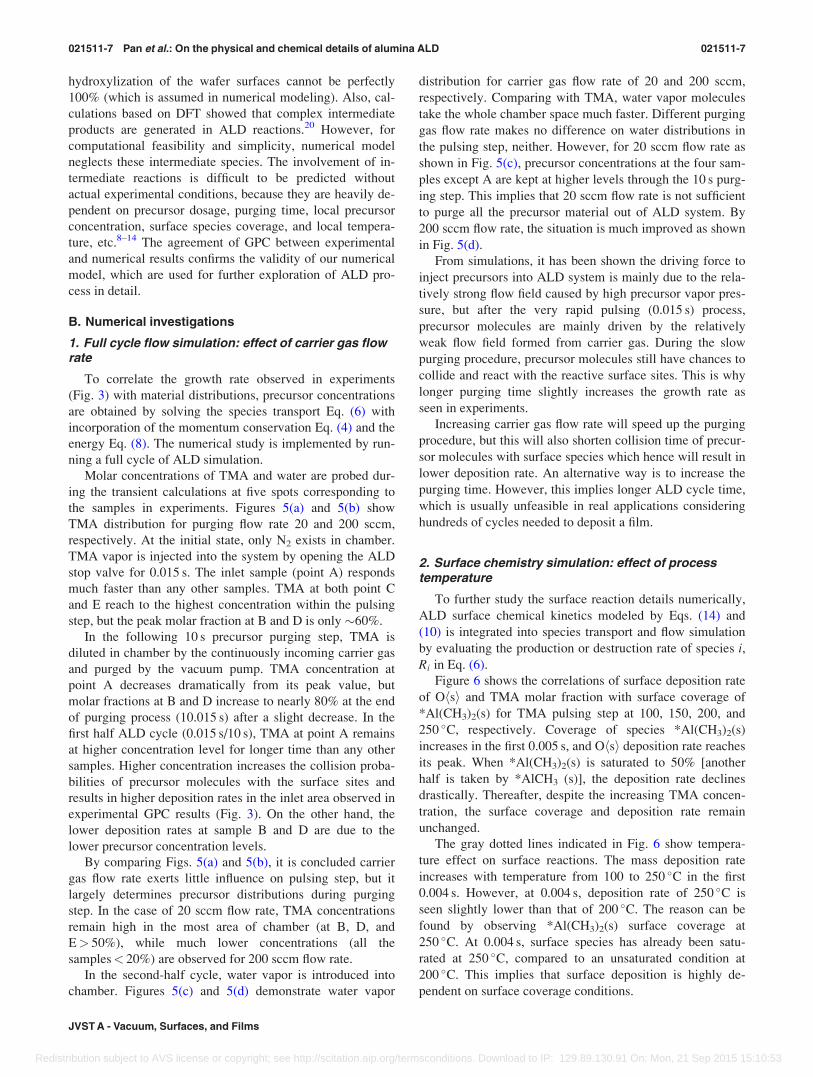
Figure 7 presents the relation of mass deposition rate of
Alhsi with H2O concentration and surface coverage of spe-
cies *OH during water pulsing step. As water vapor is
injected into the system, water concentration is increased
and *OH coverage is approaching its saturation status. The
mass deposition rate increases and then is restrained as sur-
face sites are saturated with *OH.
Temperature effect on the second half surface reaction
shows more complicated features. Surface deposition rate is
increasing with temperature only in a very short time, and af-
ter 0.003 s, the surface deposition becomes hindered by
higher temperature. This could be explained by surface spe-
cies coverage in Fig. 7. With increasing temperature, higher
deposition rate corresponds to higher coverage (�50%) of
*OH at 250 �C. Surface species *OH at 250 �C gets saturated
much faster than other temperature conditions. Decreased
deposition rates are resulted from smaller coverage of reac-
tive species *Al(CH3)2(s) and *AlCH3(s). However, the
peak value of surface deposition rate in pulsing process is
increased by higher temperature.
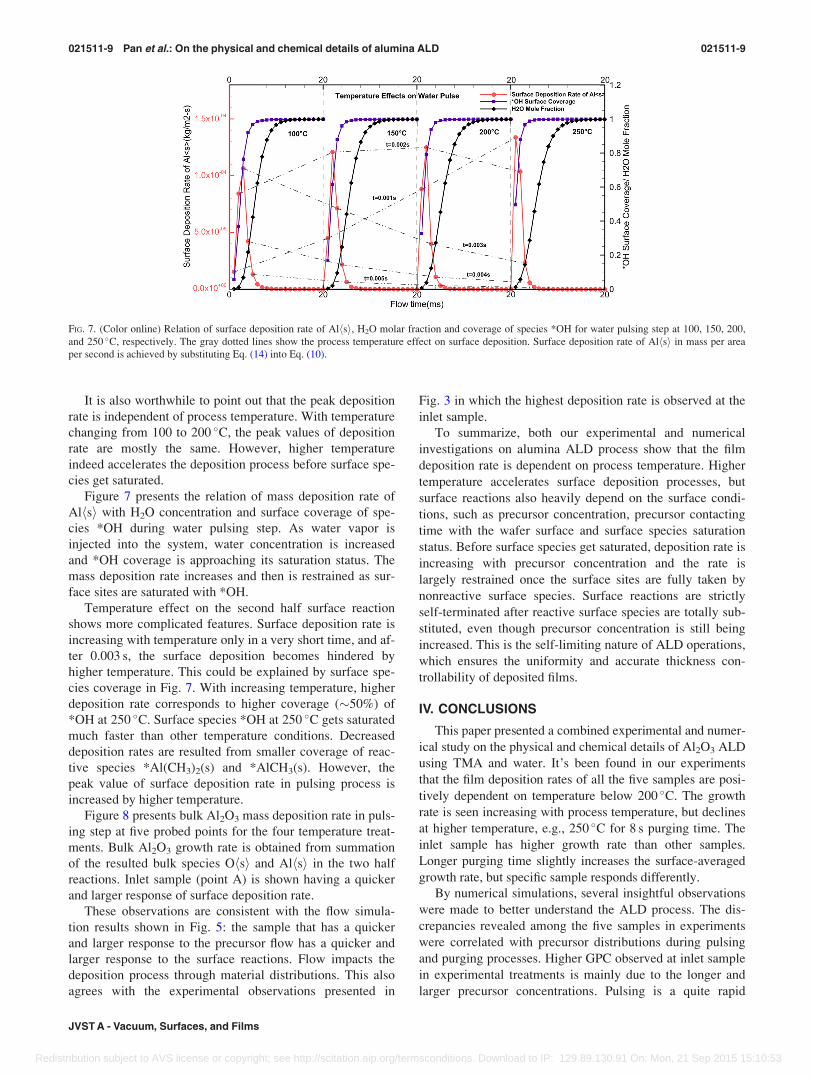
Figure 8 presents bulk Al2O3 mass deposition rate in puls-
ing step at five probed points for the four temperature treat-
ments. Bulk Al2O3 growth rate is obtained from summation
of the resulted bulk species Ohsi and Alhsi in the two half
reactions. Inlet sample (point A) is shown having a quicker
and larger response of surface deposition rate.
These observations are consistent with the flow simula-
tion results shown in Fig. 5: the sample that has a quicker
and larger response to the precursor flow has a quicker and
larger response to the surface reactions. Flow impacts the
deposition process through material distributions. This also
agrees with the experimental observations presented in
Fig. 3 in which the highest deposition rate is observed at the
inlet sample.
To summarize, both our experimental and numerical
investigations on alumina ALD process show that the film
deposition rate is dependent on process temperature. Higher
temperature accelerates surface deposition processes, but
surface reactions also heavily depend on the surface condi-
tions, such as precursor concentration, precursor contacting
time with the wafer surface and surface species saturation
status. Before surface species get saturated, deposition rate is
increasing with precursor concentration and the rate is
largely restrained once the surface sites are fully taken by
nonreactive surface species. Surface reactions are strictly
self-terminated after reactive surface species are totally sub-
stituted, even though precursor concentration is still being
increased. This is the self-limiting nature of ALD operations,
which ensures the uniformity and accurate thickness con-
trollability of deposited films.
IV. CONCLUSIONS
This paper presented a combined experimental and numer-
ical study on the physical and chemical details of Al2O3 ALD
using TMA and water. It’s been found in our experiments
that the film deposition rates of all the five samples are posi-
tively dependent on temperature below 200 �C. The growth
rate is seen increasing with process temperature, but declines
at higher temperature, e.g., 250 �C for 8 s purging time. The
inlet sample has higher growth rate than other samples.
Longer purging time slightly increases the surface-averaged
growth rate, but specific sample responds differently.
By numerical simulations, several insightful observations
were made to better understand the ALD process. The dis-
crepancies revealed among the five samples in experiments
were correlated with precursor distributions during pulsing
and purging processes. Higher GPC observed at inlet sample
in experimental treatments is mainly due to the longer and
larger precursor concentrations. Pulsing is a quite rapid
FIG. 7. (Color online) Relation of surface deposition rate of Alhsi, H2O molar fraction and coverage of species *OH for water pulsing step at 100, 150, 200,
and 250 �C, respectively. The gray dotted lines show the process temperature effect on surface deposition. Surface deposition rate of Alhsi in mass per area
per second is achieved by substituting Eq. (14) into Eq. (10).
021511-9 Pan et al.: On the physical and chemical details of alumina ALD 021511-9
JVST A - Vacuum, Surfaces, and Films
Redistribution subject to AVS license or copyright; see http://scitation.aip.org/termsconditions. Download to IP: 129.89.130.91 On: Mon, 21 Sep 2015 15:10:53
procedure in milliseconds, but purging is a relative slow pro-
cedure during which precursor materials also react with the
reactive surface sites. This was confirmed by the increased
growth rate with extra purging time observed in the
experiments.
By tuning the carrier gas flow rate from 20 to 200 sccm, it
was observed the flow rate has little influence on pulsing
process. However, the amount of residual precursors left in
the system after purging procedure is largely determined by
carrier gas, because purging process is mainly driven by the
flow field formed from carrier gas. The purpose of introduc-
ing inert gases such as nitrogen and argon into ALD system
is more to “purge” the precursor out of ALD system than to
“carry” the precursor molecules into the chamber.
The results from numerical chemistry simulations con-
firmed the self-limiting feature of ALD cycles. Surface depo-
sition was seen a strictly self-limited process: surface
deposition reactions are restrained once the surface species
get saturated, even though the precursor material is still
being introduced into the system. By the transient numerical
simulations, effect of chamber temperature was shown to
increase the deposition rate, but this effect is confined by the
saturation conditions of surfaces sites. The differences of
surface reactions among the five samples are consistent with
the observations from experiments. ALD is a complex
strong-coupled fluid, thermal and chemical process, which
is not only heavily dependent on the chemical kinetics
and surface conditions but also on the flow and material
distributions.
ACKNOWLEDGMENT
Support from National Science Foundation (CMMI-
1200940) is gratefully acknowledged.
1S. M. George, Chem. Rev. 110, 111 (2010).2M. Y. Li, Y. Y. Chang, H. C. Wu, C. S. Huang, J. C. Chen, J. L. Lue, and
S. M. Chang, J. Electrochem. Soc. 154, H967 (2007).3C. Soto and W. T. Tysoe, J. Vac. Sci. Technol., A 9, 2686 (1991).4G. S. Higashi and C. G. Fleming, Appl. Phys. Lett. 55, 1963 (1989).5M. B. M. Mousa, C. J. Oldham, and G. N. Parsons, Langmuir 30, 3741
(2014).6S. McDonnell, A. Pirkle, J. Kim, L. Colombo, and R. M. Wallace, J. Appl.
Phys. 112, 104110 (2012).7D. N. Goldstein, J. A. McCormick, and S. M. George, J. Phys. Chem. C
112, 19530 (2008).
FIG. 8. (Color online) Surface deposition rate of bulk Al2O3hsi at five different positions in TMA pulsing step for 100, 150, 200, and 250 �C, respectively. The
bulk Al2O3 growth rate is obtained from summation of the resulted bulk species Ohsi and Alhsi in the two half reactions described in Eq. (17). Point A is
located in the inlet area and point C in the outlet area.
021511-10 Pan et al.: On the physical and chemical details of alumina ALD 021511-10
J. Vac. Sci. Technol. A, Vol. 33, No. 2, Mar/Apr 2015
Redistribution subject to AVS license or copyright; see http://scitation.aip.org/termsconditions. Download to IP: 129.89.130.91 On: Mon, 21 Sep 2015 15:10:53

8R. L. Puurunen, J. Appl. Phys. 97, 121301 (2005).9H. E. Cheng, W. J. Lee, and C. M. Hsu, Thin Solid Films 485, 59 (2005).
10P. J. King et al., Thin Solid Films 519, 4192 (2011).11T. Krajewski et al., Microelectron. J. 40, 293 (2009).12K. Kukli, M. Ritala, T. Uustare, J. Aarik, K. Forsgren, T. Sajavaara, M.
Leskela, and A. Harsta, Thin Solid Films 410, 53 (2002).13V. R. Rai, V. Vandalon, and S. Agarwal, Langmuir 28, 350 (2012).14R. A. Wind and S. M. George, J. Phys. Chem. A 114, 1281 (2010).15M. B. M. Mousa, C. J. Oldham, J. S. Jur, and G. N. Parsons, J. Vac. Sci.
Technol., A 30, 01A155 (2012).16V. Sammelselg, A. Rosental, A. Tarre, L. Niinisto, K. Heiskanen, K.
Ilmonen, L. S. Johansson, and T. Uustare, Appl. Surf. Sci. 134, 78 (1998).17K. Kukli, M. Ritala, J. Aarik, T. Uustare, and M. Leskela, J. Appl. Phys.
92, 1833 (2002).18G. Scarel, S. Ferrari, S. Spiga, C. Wiemer, G. Tallarida, and M. Fanciulli,
J. Vac. Sci. Technol., A 21, 1359 (2003).19A. Afshar and K. C. Cadien, Appl. Phys. Lett. 103, 251906 (2013).20A. Delabie, S. Sioncke, J. Rip, S. Van Elshocht, G. Pourtois, M. Mueller,
B. Beckhoff, and K. Pierloot, J. Vac. Sci. Technol., A 30, 01A127 (2012).21S. D. Elliott and J. C. Greer, J. Mater. Chem. 14, 3246 (2004).22R. L. Puurunen, Chem. Vap. Deposition 9, 249 (2003).23G. H. Gilmer, H. C. Huang, T. D. de la Rubia, J. Dalla Torre, and F.
Baumann, Thin Solid Films 365, 189 (2000).24A. Dkhissi, A. Esteve, C. Mastail, S. Olivier, G. Mazaleyrat, L. Jeloaica,
and M. D. Rouhani, J. Chem. Theory Comput. 4, 1915 (2008).
25G. Mazaleyrat, A. Esteve, L. Jeloaica, and M. Djafari-Rouhani, Comput.
Mater. Sci. 33, 74 (2005).26Z. Hu, J. X. Shi, and C. Heath Turner, Mol. Simul. 35, 270 (2009).27F. Gou, A. W. Kleyn, and M. A. Gleeson, Int. Rev. Phys. Chem. 27, 229
(2008).28D. Q. Pan, T. Li, T. C. Jen, and C. Yuan, J. Vac. Sci. Technol., A 32,
01A110 (2014).29X. Y. He, N. Li, and B. Goldstein, Mol. Simul. 25, 145 (2000).30R. A. Adomaitis, Chem. Vap. Deposition 17, 353 (2011).31A. Holmqvist, T. Torndahl, and S. Stenstrom, Chem. Eng. Sci. 94, 316 (2013).32A. Holmqvist, T. Torndahl, and S. Stenstrom, Chem. Eng. Sci. 81, 260
(2012).33Y. Xie, L. Ma, D. Pan, and C. Yuan, Chem. Eng. J. 259, 213 (2015).34R. A. Adomaitis, J. Cryst. Growth 312, 1449 (2010).35A. S. Kurhekar and P. Apte, Int. Nano Lett. 3, 10 (2013).36B. R. Munson, Fundamentals of Fluid Mechanics 6th Edition with Wiley
Plus 5th Edition Set (Wiley, Toronto, Canada, 2008).37R. W. Fox, A. T. McDonald, and P. J. Pritchard, Introduction to Fluid
Mechanics (Wiley, Toronto, Canada, 2009).38A. F. Mills, Basic Heat and Mass Transfer: Pearson New International
Edition (Pearson, Boston, MA, 2013).39W. Kays, M. Crawford, and B. Weigand, Convective Heat and Mass
Transfer W/Engineering Subscription Card (McGraw-Hill, New York, 2005).40T. L. Bergman and F. P. Incropera, Fundamentals of Heat and Mass
Transfer (Wiley, Hoboken, NJ, 2011).
021511-11 Pan et al.: On the physical and chemical details of alumina ALD 021511-11
JVST A - Vacuum, Surfaces, and Films
Redistribution subject to AVS license or copyright; see http://scitation.aip.org/termsconditions. Download to IP: 129.89.130.91 On: Mon, 21 Sep 2015 15:10:53