Embed Size (px)
Citation preview
On the Development of the Stratificationof the Inner Plexiform Layer in
the Chick Retina
ULRICH DRENHAUS,1* PATRIZIA MORINO,1AND RUDIGER W. VEH2
1Department of Medicine, Division of Anatomy, University of Fribourg,CH-1700 Fribourg, Switzerland
2Institute of Anatomy, Humboldt University, D-10098 Berlin, Germany
ABSTRACTThis study investigated the development of the subdivision of the chick inner plexiform
layer (IPL). The approach included an immunohistological analysis of the temporal andspatial expressions of choline acetyltransferase, of the neural–glial-related and neural–glialcell adhesion molecules (NrCAM and NgCAM, respectively) and axonin-1, and of inwardlyrectifying potassium (Kir) channels in 5- to 19-day-old (E5–E19) embryos. Ultrastructuralinvestigations evaluated whether synaptogenesis accompanies the onset of differentiation ofthe IPL. We found that the differentiation of the IPL started at E9. Distinct cholinergic strataappeared, NrCAM immunoreactivity showed a poorly defined stratification, and Kir3.2 wasexpressed in the IPL and in the inner nuclear layer. From E10 until late E14, NgCAM- andaxonin-1–immunoreactive strata emerged in an alternating sequence from the outer to theinner IPL. During this period, the NrCAM pattern sharpened, and eventually five bands ofweaker and stronger immunoreactivity were found. Conventional synapses formed at thebeginning of E9, and stratification of the IPL also began on the same day at the same location.Synaptogenesis and stratification followed a gradient from the central to the peripheralretina. The topographic course of differentiation of the IPL generally corresponded to thecourse of maturation of ganglion and amacrine cells. Synaptogenesis and the expression ofG-protein–gated Kir3.2 channels accompanied the onset of stratification. These events coin-cide with the occurrence of robust and rhythmic spontaneous neuronal activity. The subse-quent differentiation of the IPL seemed to be orchestrated by several mechanisms. J. Comp.Neurol. 460:1–12, 2003. © 2003 Wiley-Liss, Inc.
Indexing terms: cell adhesion molecules; development; inwardly rectifying potassium channels;
synaptogenesis
The retinal inner plexiform layer (IPL) is a highly orga-nized synaptic zone, where visual information is transmit-ted from bipolar cells onto ganglion cells (GCs) and iscontrolled and modified by amacrine cells (ACs) throughlaterally interconnecting branches. AC arborizations over-lap at specific depths of the IPL and appear in transversalsections as circumscribed horizontal bands extending con-tinuously from the central to the peripheral retina. Theyjoin stratified GC dendrites and terminal clusters of bipo-lar cells. Cajal (1972) previously established the existenceof five sublayers in vertebrates and that each sublayercomprises two strata: AC terminations in the upper stra-tum and GC dendrites in the lower stratum. He assumedthat the pattern reflects zones where specific sets of cellsinterconnect. This organizational scheme has been gener-ally confirmed (Gabriel and Wilhelm, 1994; Kolb, 1997).
The development of these sublayers is not well known.The chick may serve as a suitable model for studying thisdevelopment because it has a particularly broad IPL anddefined embryologic stages are easily available. The chickIPL is subdivided into five sublayers (Millar et al., 1987;
Grant sponsor: Deutsche Forschungsgemeinschaft; Grant number:Ve-187/1-3.
*Correspondence to: Ulrich Drenhaus, Department of Medicine, Divisionof Anatomy, University of Fribourg, Rte A, Gockel 1, CH-1700 Fribourg,Switzerland. E-mail: [email protected]
Received 9 July 2003; Revised 29 October 2002; Accepted 9 December2002
DOI 10.1002/cne.10602Published online the week of March 31, 2003 in Wiley InterScience
(www.interscience.wiley.com).
THE JOURNAL OF COMPARATIVE NEUROLOGY 460:1–12 (2003)
© 2003 WILEY-LISS, INC.
Spira et al., 1987). Stratification at different levels hasbeen observed from about embryonic day (E) 9 or 10 on-ward. However, information on cells or sublayers is oftenlacking. GC dendrites are the first elements to form theprospective IPL at E6 (Nishimura, 1980; Rager, 1980).They begin to stratify at E10 and are restricted to certainstrata at E16 (Vanselow et al., 1990). AC processes appearin the IPL by E7 (Prada et al., 1987). The first AC stratumis formed by cholinergic cells at E9 or E10, and a secondone appears simultaneously or up to 1 day later (Spira etal., 1987; Reiss et al., 1996). They are confined to sublay-ers 2 and 4, corresponding to the homologous mammaliansublayers (Spira et al., 1987; Reiss et al., 1996). The firstAC strata in sublayers 1, 3, and 5 have been found insubstance P–expressing cells by E13 (Tahara et al., 1986).
In the chick embryo, ACs and GCs express cell adhesionmolecules (CAMs). In situ hybridization detects mRNAscoding for axonin-1 and NgCAM (neuron–glia CAM) inGCs from E3 and in AC subpopulations from E8 onwarduntil shortly after hatching (Morino et al., 1996). In GCsexpression of the proteins is restricted to the somata andaxons, whereas immunoreactivity in ACs shows the entirecells (Rager et al., 1996; Drenhaus et al., 2001). The firstAC band forms at E11, and at hatching each proteinoccurs in three thin bands that are not related to thesublayers (Rager et al., 1996). A third CAM, NrCAM(neural–glia related CAM), is expressed in GCs, but de-tailed information about the immunoreactive pattern inthe IPL is lacking (Grumet et al., 1991; Morales et al.,1996). Each of these CAMs is capable of undergoing ho-mophilic and heterophilic molecular interactions that cantrigger intercellular signals influencing the behavior of acell (reviews by Sonderegger, 1997; Brummendorf andRathjen, 1998). They are thought to control neurite elon-gation, arborization of axons, fasciculation, target recog-nition, and formation and remodeling of synaptic contacts(Kuhn et al., 1991; Grumet, 1997; Stoeckli et al., 1997;Sonderegger et al., 1998; Treubert and Brummendorf,1998; Fitzli et al., 2000; Lustig et al., 2001). Consequently,we investigated the expression of the three differentCAMs in relation to the development of the IPL sublayers.Cholinergic ACs, immunolabeled with choline acetyltrans-ferase (ChAT), served as a reference to grade the temporaland spatial appearances of immunoreactivity of theCAMs.
In several vertebrates, structural patterning of the IPLhas been related to spontaneous electrical activity thatoccurs in GCs before photoreceptors are mature(Bodnarenko and Chalupa, 1993; Feller et al., 1996; Ser-nagor and Grzywacz, 1996; Wong et al., 2000b). Synaptictransmission mediated by acetylcholine and related tocholinergic ACs has been regarded as a major excitatorydrive of this activity (Feller et al., 1996; Zhou, 1998; Ser-nagor et al., 2000; Catsicas and Mobbs, 2001). In the chickretina, spontaneous activity occurs by E7 or E8 and be-comes rhythmic in most embryos at E9 (Wong et al., 1998;Catsicas and Mobbs, 2001). Neuronal excitation regularlyincreases extracellular potassium (K�) ions, which altersneuronal excitability. Inwardly rectifying K� (Kir) chan-nels subserve functions essential for redistribution of theaccumulated extracellular K� ions and for regulation ofneuronal excitability (Nichols and Lopatin, 1997). Func-tional channels are homo- or heterotetrameric aggregatesof subunits (Nichols and Lopatin, 1997; Kusaka et al.,2001), presently classified into seven subfamilies (Kir1–
Kir7). They are found in the membranes of glial cells andneurons throughout the nervous system including theretina (Karschin et al., 1996; Biedermann et al., 1998;Skatchkov et al., 2001; Raap et al., 2002). In relation tothese observations and with the aim of gaining furtherinsight into the development of the IPL, we screened forthe presence of several Kir channel subunits to find outwhether this correlates with the age when neuronal activ-ity initiates and when differentiation of the IPL begins. Inaddition, ultrastructural examinations of the IPL investi-gated whether synaptogenesis accompanies these events.
MATERIALS AND METHODS
One hundred fifty white leghorn chick embryos betweenE5 and E19 were used for this study. They were stagedaccording to the criteria given by Hamburger and Hamil-ton (1951). All embryos received a lethal dose of the anes-thetic Nembutal (150 mg/kg body weight, intraperitone-ally) before fixation. For the investigation of axonin-1,NgCAM, NrCAM, and Kir3.2 immunoreactivities, dissectedeyes were immersed for 2 hours in a modified Bouin-Hollandsolution (prepared with 4% picric acid, 4% paraformalde-hyde [PFA], and 1.5% acetic acid, adjusted to pH 7.4). Foreasier penetration of the fixative, the iris and lens wereremoved. For ChAT immunoreactivity, the embryos wereperfused with a 4% PFA solution, adjusted to pH 7.4.
For transmission electron microscopy, the embryos wereperfused with a solution containing 2.5% glutaraldehyde,2% PFA, and 0.02% acetic acid (pH 7.4). The dissectedeyes were flat mounted, postfixed with osmium tetroxide,dehydrated, and embedded in Epon 812. For ultrathinsections, the usual combined uranyl acetate and lead ci-trate staining was used, and, in parallel series, stainingwas preceded by treatment with potassium permanganate(0.25%, pH 9) for 5 minutes.
Immunolabeling
The eyes were cryoprotected in sucrose, frozen in liquidnitrogen, and cut with a cryostat into 20-�m-thick sec-tions. The sections were mounted on gelatin-coated slidesand subsequently processed for labeling. For immunoflu-orescence labeling, the cryosections were incubated over-night at 4°C with a primary antibody diluted in phosphatebuffered saline (PBS; pH 7.4) containing 0.1% Tween 20,4% bovine serum albumin, and 4% normal serum, whichalways corresponded to the host of the second antibody.After extensive washes in PBS, the specimens were incu-bated for 1 day with a secondary antibody coupled toan immunofluorescence marker. These markers, theirsources, the working dilutions, the respective second an-tibodies, and the coupled fluorophores are listed in Table1. For double and triple labeling, the respective mixtureswere used. All sections were protected with the ProlongAntifade kit (Molecular Probes, Eugene, OR).
Avidin–biotin complex (ABC) labeling was applied forthe detection of Kir subunits and for ChAT immunoreac-tivity, as described by Veh at al. (1995). Briefly, the pri-mary antibody was diluted in PBS (pH 7.4) containing10% normal serum, 0.1% sodium acid, and 0.01% Thimo-sal. The sections were incubated for 36 hours. After exten-sive washes in PBS, the secondary antibody was appliedfor 24 hours. It was diluted in PBS, bovine serum albumin,and 0.1% sodium acid. The sections were incubated inVectastain Elite ABC (1:1,000) for 6 hours. Peroxidase
2 U. DRENHAUS ET AL.
activity was demonstrated by 1.4 mM 3,3� diaminobenzi-dine, 10 mM imidazole, 0.3% nickel ammonium sulfate,and 0.015% H2O2 in 50 nM Tris-HCl (pH 7.6) for 5 min-utes at room temperature. The anti-Kir antibodies againstKir2.4 and Kir3.1 to 3.4 were polyclonal, monospecific, andaffinity purified. Anti-Kir4.1 was obtained from commer-cial sources (Table 1).
Controls were performed by omission of the primary orthe secondary antibody and, in the case of Kir3.2, byabsorbing the corresponding antibody with its specific an-tigen before application.
Microscopy
For normal light microscopy a Leitz DM RBE micro-scope was used. Confocal laser scan microscopic analysiswas carried out with a Bio-Rad MRC-1024 or a � Radiance2000 confocal laser scan microscope equipped with thekrypton/argon laser system and filter sets, which wereappropriate for the applied fluorophores (Bio-Rad, Rich-mond, CA). In double- and triple-labeled sections, bleed-through was controlled on single-labeled sections and sub-stantially removed by sequential laser excitation. Fortransmission electron microscopy, a Zeiss EM10 C (Zeiss,Zurich, Switzerland) was used.
RESULTS
Immunohistochemistry
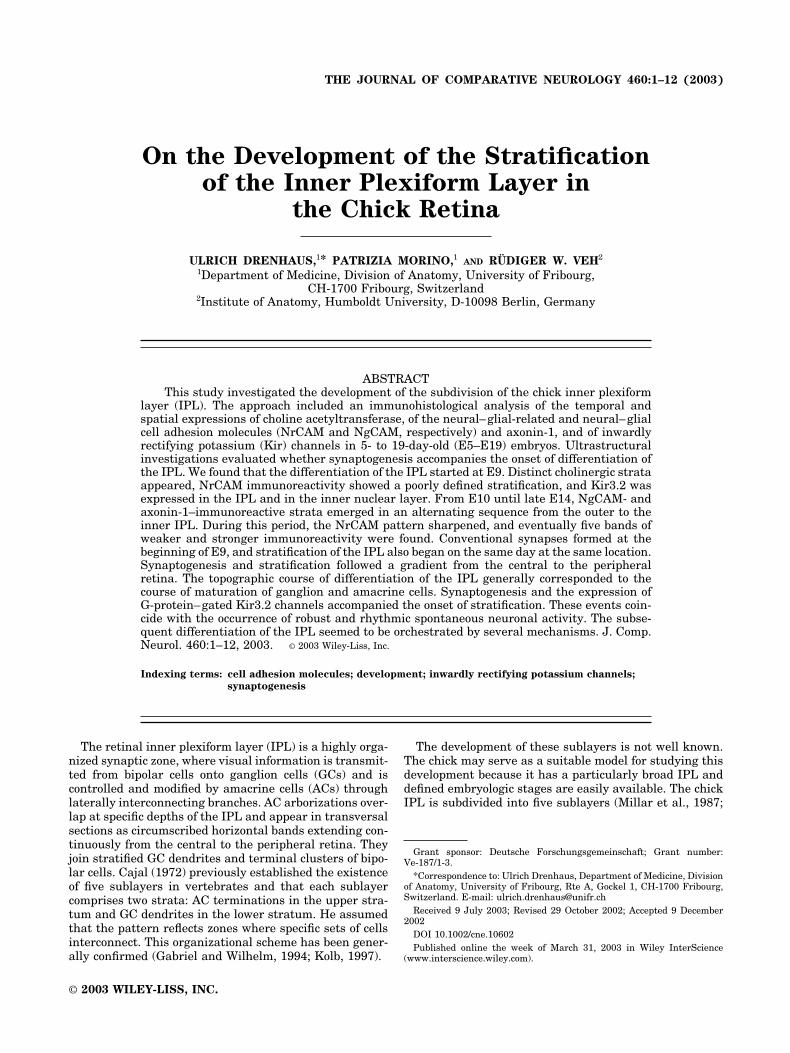
E5. Until late E5, strong NrCAM immunoreactivitydemarcated the optic fiber layer (OFL; Fig. 1A). It also
occurred to a lesser extent in regularly spaced, radiallyoriented stripes (visible in Fig. 1B) that spanned the en-tire width of the neural retina. These stripes showedslightly thicker parts in the central part of the innernuclear layer (INL) at older stages. NgCAM displayed apattern in the INL that was similar to, but weaker than,that observed in NrCAM. In addition, NgCAM andaxonin-1 antibodies demarcated fibers in the OFL and cellsomata in the adjacent retinal layer (not shown).
E6 (stages 28–30). At stage 30, irregularly distrib-uted NrCAM-immunoreactive patches formed a brokenline near to and parallel to the OFL. This labeling firstoccurred in the central retina close to the apex of the opticfissure (Fig. 1B) and extended rapidly about halfway to-ward the periphery (Fig. 1C,D). NgCAM and axonin-1labeling showed that the space between these patches andthe OFL corresponded to the ganglion cell layer (GCL; notshown). Thus, the patches assumed the initial develop-ment of the prospective IPL.
E7 and E8 (stages 31–35). At early E7 (stage 31), theNrCAM-positive patches began to fuse into a confluentband in the central retina. At stage 33, this band wasthicker and was more distant from the OFL due to thethickening of the GCL (Fig. 2A,B). Until the end of E8, thefuture IPL increased in thickness (Fig. 2D) and ap-proached the periphery of the growing eye. Immunoreac-tivity was more advanced in the dorsal retina than in theventral retina and more advanced in the temporal retinathan in the nasal retina. NgCAM was expressed at E7(stage 33) in cell somata in the innermost zone of the INL,
Fig. 1. Confocal laser scan micrographs show neural–glia-relatedcell adhesion molecule (NrCAM) immunoreactivity in the chick retinaat embryonic day (E) 5 and E6. A: At late E5 (stage 28), NrCAMimmunoreactivity is found in the optic fiber layer (OFL). B–D: At E6
(stage 30), immunoreactive patches form a broken line parallel to theOFL in the central retina (B), up to about halfway to the periphery(C), but not in the periphery (D). B: Faint, radially oriented stripescross the width of the retina. Scale bars � 100 �m.
TABLE 1. List of Antibodies Applied in the Current Immunohistochemical Study
Antigen Antibody: Working Dilution (source) Antibody, fluorophore: Working dilution (source)
Axonin-1 Goat anti-axonin-1: 1:800 (P. Sonderegger, Zurich,Switzerland); rabbit anti-axonin-1: 1:800 (E. Stoeckli,Basel, Switzerland)
Anti-goat IgG, Alexa 488: 2 �/ml (Molecular Probes, Eugene, OR); anti-rabbit IgG, Cy3: 1:70 (Molecular Probes)
NgCAM1 Mouse anti-NgCAM/code: 1214E-311, 1:500 (P.Sonderegger)
Anti-mouse IgG, Cy3: 1:70 (Jackson ImmunoResearch Laboratories, WestGrove, PA; 19390)
NrCAM2 Rabbit anti-NrCAM/1:5,000 (P. Sonderegger) Goat anti-NrCAM/1:3,000 (E. Stoeckli)
Anti-rabbit IgG, Cy3/1:70 (Molecular Probes); anti-goat IgG, Alexa 488/2�/ml (Molecular Probes)
Cholineacetyltransferase
Goat anti-ChAT/code: 144P, 1:100 (ChemiconInternational, Temecula, CA)
Anti-goat IgG, Alexa 488: 2 �/ml (Jackson Immuno Research Laboratories);ABC protocol: biotinylated rabbit anti-goat IgG: 1:500 (Molecular Probes)
Kir2.43 Rabbit anti-Kir2.4: 1:2,500 to 1:10,000 (R.W. Veh,Berlin, Germany)
ABC protocol: biotinylated goat anti-rabbit IgG: 1:500 (Molecular probes)Elite-ABC: 1:1,000 (Vector, Burlingame, CA)
Kir3.1 Rabbit anti-Kir3.1: 1:250 to 1:1,000 (R.W. Veh)Kir3.2 Rabbit anti-Kir3.2: 1:200 (R.W. Veh)Kir3.3 Rabbit anti-Kir3.3: 1:1,000 to 1:5,000 (R.W. Veh)Kir3.4 Rabbit anti-Kir3.4: 1:100 to 1:200 (R.W. Veh)Kir4.1 Rabbit anti-Kir4.1: 1:250 to 1:2,000 (Alomone Co, Israel)
1Neuron–glia cell adhesion molecule.2Neuron–glia-related cell adhesion molecule.3Inwardly rectifying potassium channel proteins.
3IPL DEVELOPMENT
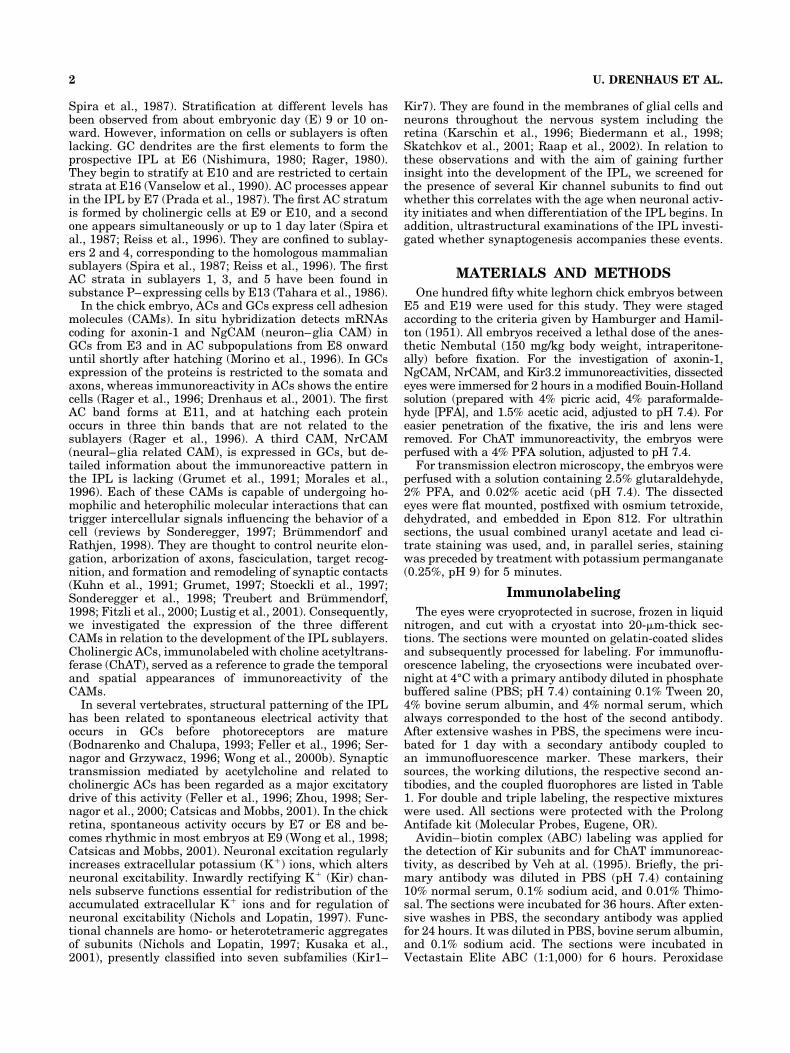
and immunoreactivity overlapped the outer part of theNrCAM-positive band in the prospective IPL (Fig. 2B, C).At E8, this overlap was nearly complete (Fig. 2E,F). UntilE8, axonin-1 labeling was restricted to the GCL and theOFL. Then labeled somata also occurred in the inner partof the INL of the central retina, which occasionally dis-played short processes that penetrated into the IPL (notshown).
Until stage 35, no ChAT immunoreactivity was found.Then two rows of cells appeared in the IPL in quick suc-cession. One row was close to the border toward the INL,and the other occurred at about two-thirds of the depth ofthe IPL (Fig. 6A).
E9 (stage 35). The NrCAM pattern in the IPL hadbecome broader and started to modify in the central retinatoward the end of that day (Fig. 2G). Two narrow, hori-zontally oriented stripes of weaker immunoreactivitycould be discerned, separating zones of stronger immuno-reactivity. NgCAM immunoreactivity still overlapped theNrCAM pattern (Fig. 2I). In the outermost part of the IPL,a small band seemed to separate from the otherwise dif-fuse NgCAM pattern (Fig. 2H). Axonin-1 immunoreactiv-ity was similar to that at E8, but more labeled cells hadappeared distributing their processes diffusely within theIPL (not shown).
At early E9, ChAT immunoreactivity still reflected thetwo cell rows in the IPL. During the course of that day, inthe central retina, an immunoreactive band formed in theouter part of the IPL, and very faint immunoreactivity ata deeper level of the IPL seemed to indicate the develop-ment of a second band (Fig. 6B). This phenomenon oc-curred earlier in the dorsal retina than in the ventralretina. Toward the end of E9, a second immunoreactiveband started to form in the inner part of the IPL. At thesame time, we detected the first, faintly labeled Kir3.2-immunoreactive band at a similar location to that of ChAT(Fig. 7A). In the INL, rather faintly stained, radially ori-ented streaks were discernible just above background. Theother Kir subunits were not detected throughout the de-velopmental period studied.
E10 to E11 (stages 36–37). At E10, NrCAM stratifi-cation did not extend far beyond the central retina (Fig. 3).The narrow stripes of weaker NrCAM immunoreactivitybecame slightly more distinct. They were located at about20% to 25% and 55% to 60% of the depth of the IPL.NgCAM was still found across the entire IPL and reflecteda stronger immunoreactive band in the outer IPL, wherewe observed the small separated layer at E9. A secondimmunoreactive band followed at late E10 closer to theGCL. This band was still rather faint at early E11 (Fig.
Fig. 2. Confocal laser scan micrographs show neural–glial-related(green) and neural–glial (red) cell adhesion molecule (NrCAM andNgCAM, respectively) immunoreactivity in the chick inner plexiformlayer (IPL; central retina) from embryonic day (E) 7 until E9. Yellowindicates overlap of both immunoreactivities. A–C: At late E7 (stage33), NrCAM immunoreactivity displays a thick band. At the same age,the first NgCAM immunoreactivity appears in the IPL (B), whichoverlaps with NrCAM immunoreactivity (C). D–F: At late E8 (stage
35), the IPL in the central retina has become thicker and shows strongNrCAM and NgCAM immunoreactivities, which overlap nearly com-pletely (F). G–I: At late E9 (stage 35), the pattern of NrCAM immu-noreactivity has become broader and indicates a vague horizontalstratification (G). NgCAM immunoreactivity is still rather diffuse, butnote the beginning of a separation of a small NgCAM band in theouter IPL (H). Scale bars � 100 �m.
4 U. DRENHAUS ET AL.
4A). Slightly before the second NgCAM band became vis-ible, a first axonin-1–immunoreactive band started toform below the first NgCAM-immunoreactive band. It be-came distinct at early E11 (Fig. 4B,C).
Early at E10, ChAT immunoreactivity was very strong.Two bands were conspicuous; one was within the outerhalf and the other was within the inner half of the IPL atabout 22% to 27% and 55% to 60% of the depth of theIPL (Fig. 6C). On the same day, a second Kir3.2-immunoreactive band appeared at about the same level asthe second ChAT band (Fig. 7A).
E12 to E14 (stages 38–40). The NrCAM pattern be-came more distinct (Fig. 4G), and the two NgCAM immu-noreactive bands were thicker (Fig. 4D). The outer bandoverlapped the innermost cell row of the INL (Fig. 4F).With age, NgCAM immunoreactivity extended toward theinner part of the IPL and showed a faint stratification atthe very beginning of E14 (Fig. 4I). From late E14 onward,this part of the IPL indicated two bands of strongerNgCAM immunoreactivity separated by a stratum ofweaker immunoreactivity. In about one-fourth of the em-bryos, the outer band of stronger immunoreactivity waspartly subdivided by a very narrow unlabeled stripe, asshown in the E18 retina (Fig. 5A). At E12, a secondaxonin-1–positive band had appeared, which overlappedthe second NgCAM band until E13 (Fig. 4E,F). At earlyE14, it was situated below the second NgCAM-immunoreactive band (Fig. 4J, K). A third axonin-1–positive band appeared closer to the GCL on late E14.Triple labeling with NrCAM, NgCAM, and axonin-1 atE13 showed a prominent NrCAM-positive band at thelevel of the first axonin-1–immunoreactive band (Fig. 4F,G, H). Adjacent on both sides, NgCAM bands were visible.The NgCAM- and axonin-1–immunoreactive bands ex-tended from the central to the peripheral retina with age,similar to the topographic spreading found in NrCAM.
ChAT and Kir3.2 immunoreactivities displayed the pre-viously described bands. Kir3.2 immunoreactivity in theINL became more prominent.
E15 to E19 (stages 41–45). From E16 (stage 42) on-ward, five alternating horizontal bands of stronger andweaker NrCAM immunoreactivity were apparent. Theybecame thicker until E18 (Fig. 5D). From E17 (stage 43)onward, the second NgCAM band, located at about thecenter of the IPL, was divided into two substrata (Fig. 5A).Triple labeling at E18 with NrCAM, NgCAM, andaxonin-1 showed that NgCAM and axonin-1 immunoreac-tivities alternated, except in the innermost part of the
IPL. There, axonin-1 overlapped with NgCAM immunore-activity, thus subdividing this zone into three parts (Fig.5C). The first and second axonin-1–positive bands wereseparated from the NgCAM bands above them by fineunlabeled stripes. The NrCAM strata of stronger immu-noreactivity overlaid the NgCAM bands; those of weakerimmunoreactivity superposed the axonin-1–positivebands, except for the innermost band, which colocalizedwith NgCAM (Fig. 5E).
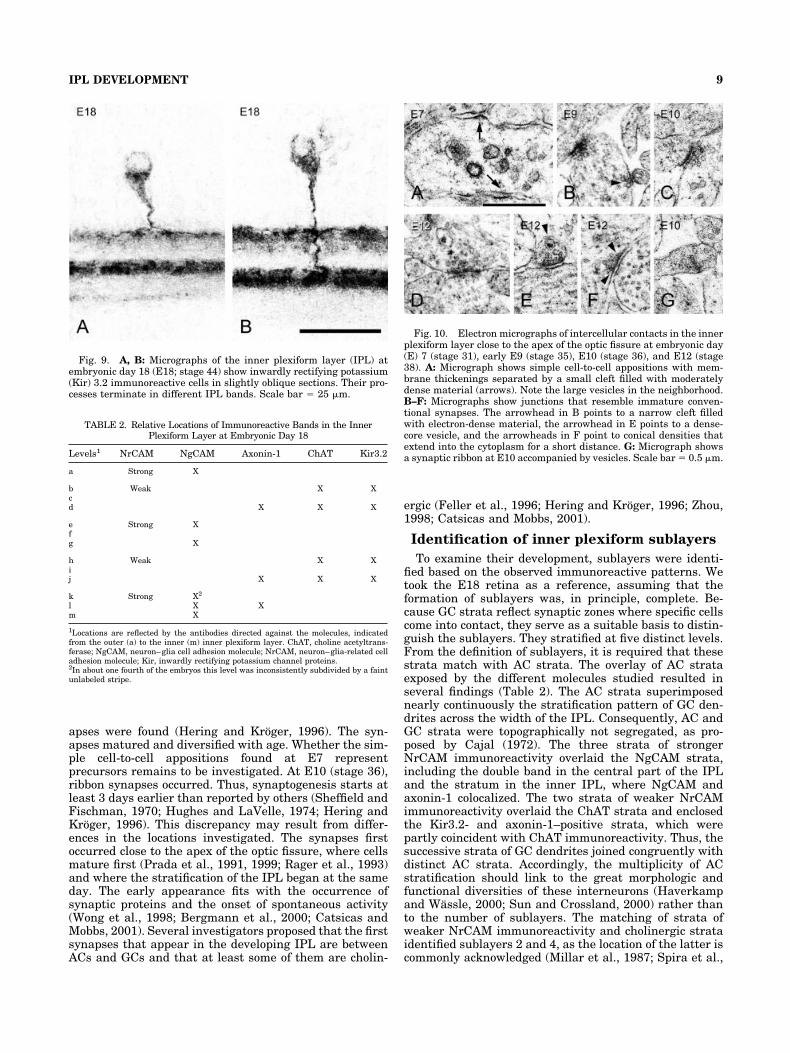
The ChAT-immunoreactive bands seemed to remain un-changed until E17. Then each of the two bands dividedinto a double band (Fig. 8A). The expression of Kir3.2 inthe INL reached its climax by E15 (stage 41) and dimin-ished thereafter (Fig. 7C,D). At E17 (stage 43), the Kir3.2bands divided into lines of stronger and weaker immuno-reactivity, similar to the split found in ChAT (Fig. 8).From that age onward, the anti-Kir3.2 antibody stronglylabeled cells in the INL, which terminated in the two IPLbands (Fig. 9).
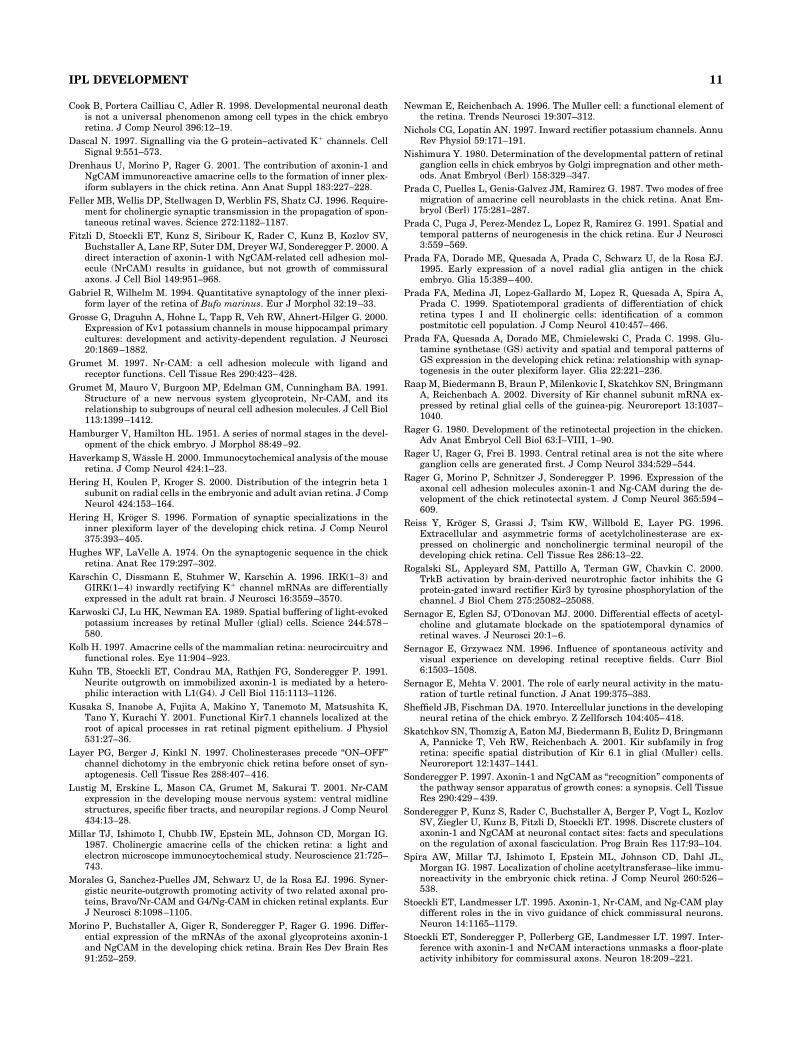
To identify the levels of CAM-immunoreactive bands,we double labeled an E18 (stage 44) retina with anti–axonin-1 and anti-ChAT antibodies. ChAT and axonin-1were coexpressed in a subpopulation of cells, and theaxonin-1 strata overlaid the inner substrata of both ChATdouble bands (Fig. 8A). The interweaving space seemed tobe unoccupied. This allowed us to determine the relativelocations of the different immunoreactive strata across thewidth of the IPL in reference to the ChAT strata (Table 2).The ChAT and Kir3.2 double bands were located at corre-sponding levels (b, d and h, j), separated by an emptyspace (c and i). Axonin-1 colocated with ChAT at levels dand j and with NgCAM in the inner part of the IPL (levell). The outer two NgCAM strata were separated from theaxonin-1 strata below by a space occupied by ChAT-positive substrata (b and h). These NgCAM strata wereaffiliated to levels a, e, and g, and the empty space withinthe double band was considered level f. Three NgCAMbands (k–m) were distinguished in the innermost IPL.Hence, 13 strata (a–m) could be discerned. The strata ofstronger NrCAM immunoreactivity superimposed levelsa, e through g, and k through m; those of weaker immu-noreactivity superimposed the interweaving levels bthrough d and h through j.
Transmission electron microscopy
We investigated two embryos of each stage: 31 (E7),35 (early E9 and E9.5), E36 (E10), and 38 (E12). At E7(stage 31), a few connections were found that displayed
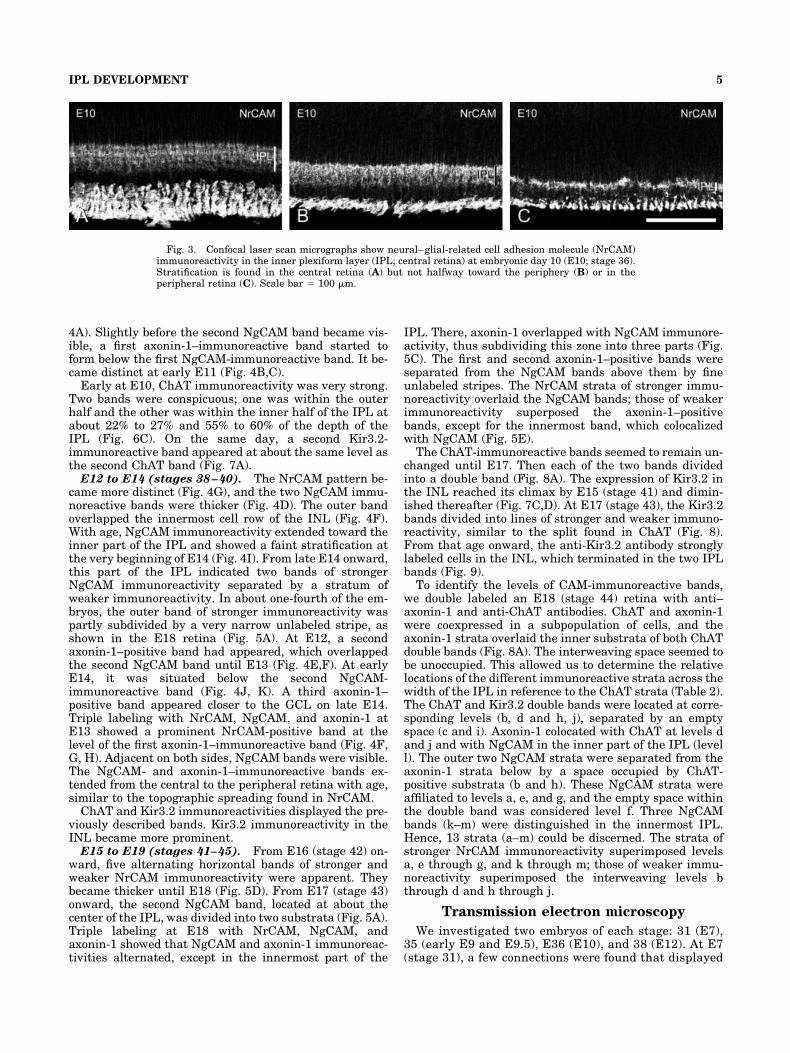
Fig. 3. Confocal laser scan micrographs show neural–glial-related cell adhesion molecule (NrCAM)immunoreactivity in the inner plexiform layer (IPL; central retina) at embryonic day 10 (E10; stage 36).Stratification is found in the central retina (A) but not halfway toward the periphery (B) or in theperipheral retina (C). Scale bar � 100 �m.
5IPL DEVELOPMENT
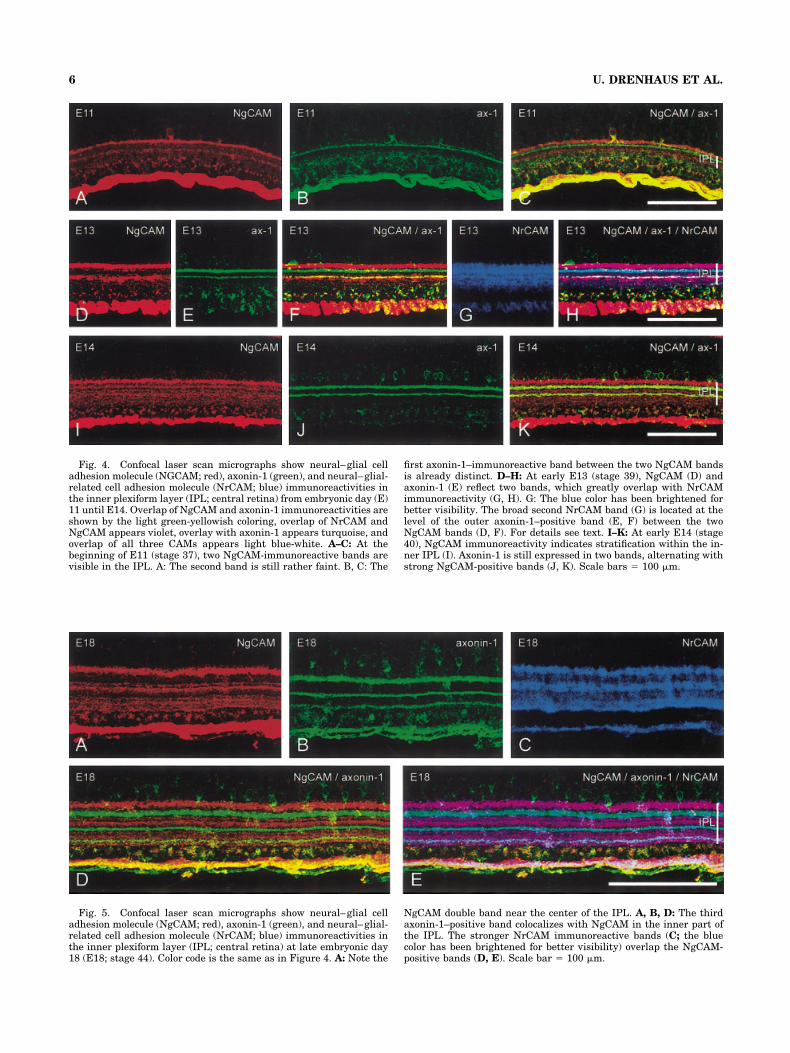
Fig. 4. Confocal laser scan micrographs show neural–glial celladhesion molecule (NGCAM; red), axonin-1 (green), and neural–glial-related cell adhesion molecule (NrCAM; blue) immunoreactivities inthe inner plexiform layer (IPL; central retina) from embryonic day (E)11 until E14. Overlap of NgCAM and axonin-1 immunoreactivities areshown by the light green-yellowish coloring, overlap of NrCAM andNgCAM appears violet, overlay with axonin-1 appears turquoise, andoverlap of all three CAMs appears light blue-white. A–C: At thebeginning of E11 (stage 37), two NgCAM-immunoreactive bands arevisible in the IPL. A: The second band is still rather faint. B, C: The
first axonin-1–immunoreactive band between the two NgCAM bandsis already distinct. D–H: At early E13 (stage 39), NgCAM (D) andaxonin-1 (E) reflect two bands, which greatly overlap with NrCAMimmunoreactivity (G, H). G: The blue color has been brightened forbetter visibility. The broad second NrCAM band (G) is located at thelevel of the outer axonin-1–positive band (E, F) between the twoNgCAM bands (D, F). For details see text. I–K: At early E14 (stage40), NgCAM immunoreactivity indicates stratification within the in-ner IPL (I). Axonin-1 is still expressed in two bands, alternating withstrong NgCAM-positive bands (J, K). Scale bars � 100 �m.
Fig. 5. Confocal laser scan micrographs show neural–glial celladhesion molecule (NgCAM; red), axonin-1 (green), and neural–glial-related cell adhesion molecule (NrCAM; blue) immunoreactivities inthe inner plexiform layer (IPL; central retina) at late embryonic day18 (E18; stage 44). Color code is the same as in Figure 4. A: Note the
NgCAM double band near the center of the IPL. A, B, D: The thirdaxonin-1–positive band colocalizes with NgCAM in the inner part ofthe IPL. The stronger NrCAM immunoreactive bands (C; the bluecolor has been brightened for better visibility) overlap the NgCAM-positive bands (D, E). Scale bar � 100 �m.
6 U. DRENHAUS ET AL.
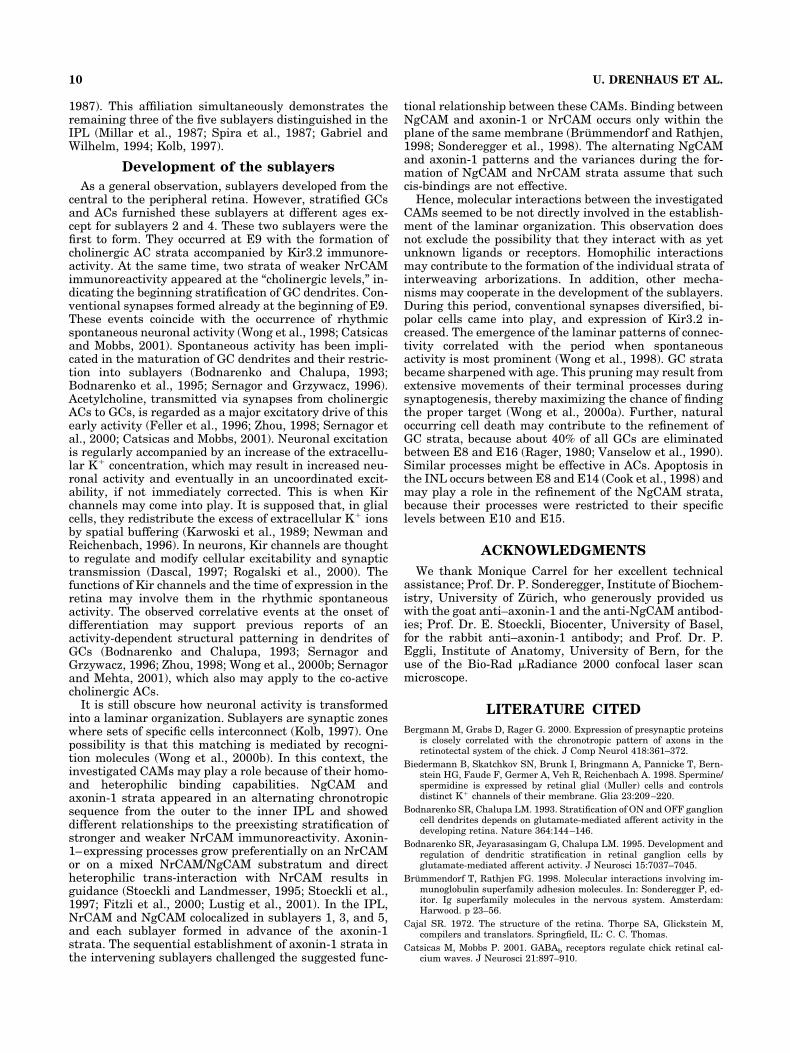
simple membrane thickenings separated by a cleft filledwith moderately dense material. Occasionally, largevesicles occurred in the neighborhood (Fig. 10A). At thevery beginning of E9, such contacts became more prom-inent, and some were accompanied by cytoplasmic den-sities. Occasionally, clustered vesicles were associatedwith the density (Fig. 10B). During the next few hours,the frequency of such contacts increased by more thansixfold from 0.02– 0.27/100 �m2 at the beginning of E9to 0.4 –1.5/100 �m2 at E9.5. Thereby, the contacts be-came more frequent in the outer and inner parts of theIPL. At E12, they varied in the shape of the vesicles andthe appearance of the pre- and postsynaptic densities(Fig. 10D–F). At E10 (stage 36), connections appearedhaving ribbon-shaped densities accompanied by vesicles(Fig. 10G). All the junctions described first appearedclose to the apex of the optic fissure and spread into theperiphery with age, first in the dorsal and then in theventral retina.
DISCUSSION
Origin and temporospatial expression ofCAMs and ChAT in the IPL
The prospective IPL was detected by NrCAM immuno-reactivity at early E6 (stage 30). It appeared as a poorly
defined stratification at E9 (stage 35). Eventually, fromabout E16 (stage 42) onward, five distinct alternatingstrata of stronger and weaker immunoreactivity were ap-parent. NrCAM occurs in GCs and Muller cells (Grumet etal., 1991; Morales et al., 1996). The immunoreactivity inthe IPL derived not from glial or Muller cells, respectively,because their lateral processes are first seen shortly beforehatching (Prada et al., 1995, 1998; Hering et al., 2000).The onset of NrCAM immunoreactivity and its develop-ment corresponded to the course of generation and matu-ration of GC dendrites (Nishimura, 1980; Rager, 1980;Vanselow et al., 1990). It remains to be clarified whetherthe alternating strength of immunoreactivity is correlatedto different dendritic densities or whether it indicates thatNrCAM labels only a subpopulation of GCs.
ChAT immunoreactivity is confined to AC subpopula-tions (Millar et al., 1987; Spira et al., 1987; Reiss et al.,1996). The first cholinergic stratum at E9 (stage 35) wasquickly followed by a second stratum produced by invertedACs. At E17 (stage 43), both strata split into two sub-strata. Layer et al. (1997) claimed that enzyme histochem-istry detects an acetylcholinesterase (AChE) band by E7.However, this may be due to amacrine neuroblasts andtheir diffusely distributed expansions in the narrow IPL(Prada et al., 1987, 1999; Spira et al., 1987). At E10, Layeret al. found a strong AChE band and a second band beganto form, which became clearly distinguishable by E11.Both AChE bands were split into two substrata at E17(Layer et al., 1997). Previous immunologic studies de-tected the first cholinergic stratum at E9 and the secondone simultaneously or up to 1 day later (Spira et al., 1987;Reiss et al., 1996). Hence, our findings reliably indicatedthe development of cholinergic strata.
The mRNAs coding for NgCAM and axonin-1 are ex-pressed in GCs and ACs but not in bipolar or interplexi-form cells (Morino et al., 1996). GC dendrites do not ex-press the corresponding proteins, whereas ACs areentirely labeled (Rager et al., 1996; Drenhaus et al., 2001).Therefore, the NgCAM and axonin-1 immunoreactivitiesin the IPL must be related to the labeled ACs. In accordwith Rager et al. (1996), axonin-1 was represented inthree bands. NgCAM occurred regularly in six bands afterthe middle NgCAM band split at E17. The bands formedfrom E10 until late E14 in an alternating chronotropicsequence, starting with NgCAM in the outer IPL. Doublelabeling showed the outer two NgCAM and axonin-1strata at different IPL levels. The innermost axonin-1band, however, overlapped with NgCAM immunoreactiv-ity. This overlap may result from ACs, which coexpressboth proteins (Morino et al., 1996).
All strata first occurred in the central retina and pro-ceeded toward the periphery, approximately following thecourse described for the generation and maturation of GCsand ACs (Prada et al., 1991, 1999; Rager et al., 1993). Thestrata thickened with age and withdrew from each other,probably as a consequence of the addition of cell processes.
G-protein–gated inwardly rectifyingpotassium channels occur simultaneously
with cholinergic strata
This study, for the first time, ascertained the presence ofKir channel proteins in the bird retina. Only Kir3.2 im-munoreactivity has been found, indicating the presence ofa G-protein–gated channel subunit. Immunoreactivity
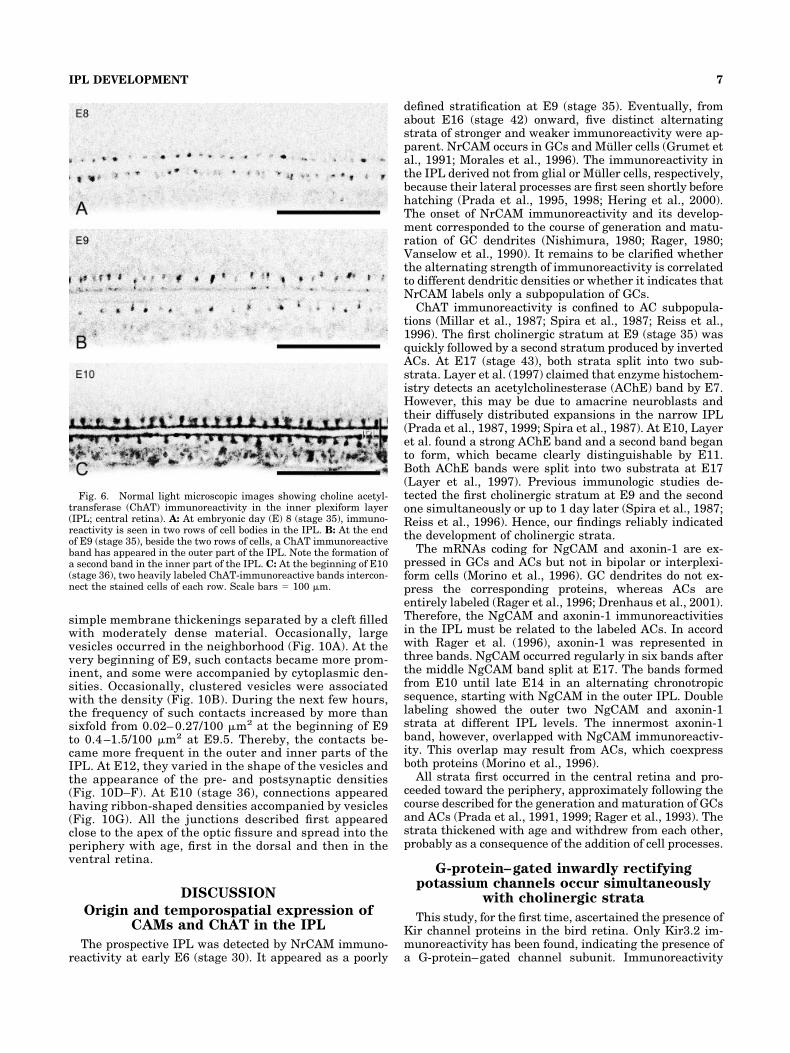
Fig. 6. Normal light microscopic images showing choline acetyl-transferase (ChAT) immunoreactivity in the inner plexiform layer(IPL; central retina). A: At embryonic day (E) 8 (stage 35), immuno-reactivity is seen in two rows of cell bodies in the IPL. B: At the endof E9 (stage 35), beside the two rows of cells, a ChAT immunoreactiveband has appeared in the outer part of the IPL. Note the formation ofa second band in the inner part of the IPL. C: At the beginning of E10(stage 36), two heavily labeled ChAT-immunoreactive bands intercon-nect the stained cells of each row. Scale bars � 100 �m.
7IPL DEVELOPMENT
was first observed at E9 (stage 35) in the INL and the IPL.The expression in the INL became more prominent untilE15 (stage 41), and the pattern resembled that of Mullercells. The corresponding mRNA has been found in Mullercells in the guinea pig (Raap et al., 2002). The patterndiminished thereafter. From E18 onward, strongly labeledcells appeared in the INL, which terminated in two im-munoreactive bands in the IPL. Their location and mor-phological phenotype identified them as ACs. The bandsformed simultaneously with cholinergic strata at similarlocations and displayed a similar splitting at E17. Thispattern was not linked to glial cells (see above) but mayrefer to AC terminations, as in the frog (Skatchkov et al.,2001). The age of first expression matched the onset ofrhythmic spontaneous neuronal activity in the retina.Thus, the expression of the retinal Kir channels may bedependent on neuronal activity, as previously shown forvoltage-gated K� channels of the Kv family (Grosse et al.,2000).
Synaptogenesis accompanies theformation of first strata
At the very beginning of E9 (stage 35), contacts showingspecializations resembling immature conventional syn-
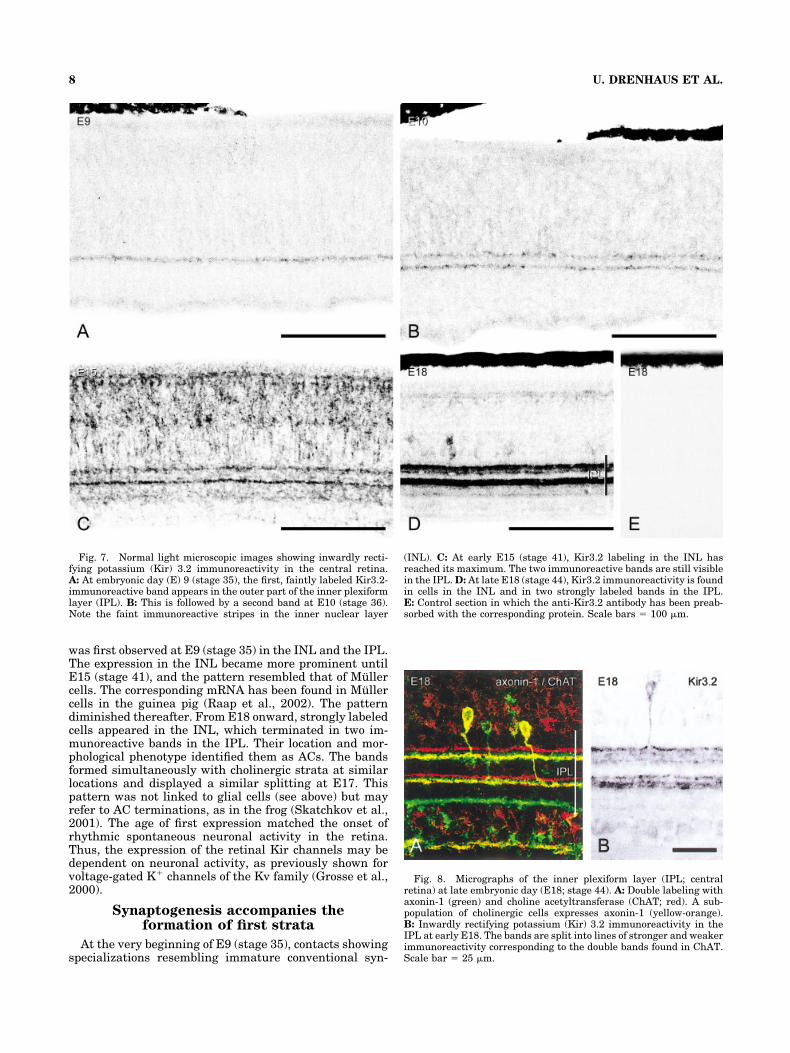
Fig. 7. Normal light microscopic images showing inwardly recti-fying potassium (Kir) 3.2 immunoreactivity in the central retina.A: At embryonic day (E) 9 (stage 35), the first, faintly labeled Kir3.2-immunoreactive band appears in the outer part of the inner plexiformlayer (IPL). B: This is followed by a second band at E10 (stage 36).Note the faint immunoreactive stripes in the inner nuclear layer
(INL). C: At early E15 (stage 41), Kir3.2 labeling in the INL hasreached its maximum. The two immunoreactive bands are still visiblein the IPL. D: At late E18 (stage 44), Kir3.2 immunoreactivity is foundin cells in the INL and in two strongly labeled bands in the IPL.E: Control section in which the anti-Kir3.2 antibody has been preab-sorbed with the corresponding protein. Scale bars � 100 �m.
Fig. 8. Micrographs of the inner plexiform layer (IPL; centralretina) at late embryonic day (E18; stage 44). A: Double labeling withaxonin-1 (green) and choline acetyltransferase (ChAT; red). A sub-population of cholinergic cells expresses axonin-1 (yellow-orange).B: Inwardly rectifying potassium (Kir) 3.2 immunoreactivity in theIPL at early E18. The bands are split into lines of stronger and weakerimmunoreactivity corresponding to the double bands found in ChAT.Scale bar � 25 �m.
8 U. DRENHAUS ET AL.
apses were found (Hering and Kroger, 1996). The syn-apses matured and diversified with age. Whether the sim-ple cell-to-cell appositions found at E7 representprecursors remains to be investigated. At E10 (stage 36),ribbon synapses occurred. Thus, synaptogenesis starts atleast 3 days earlier than reported by others (Sheffield andFischman, 1970; Hughes and LaVelle, 1974; Hering andKroger, 1996). This discrepancy may result from differ-ences in the locations investigated. The synapses firstoccurred close to the apex of the optic fissure, where cellsmature first (Prada et al., 1991, 1999; Rager et al., 1993)and where the stratification of the IPL began at the sameday. The early appearance fits with the occurrence ofsynaptic proteins and the onset of spontaneous activity(Wong et al., 1998; Bergmann et al., 2000; Catsicas andMobbs, 2001). Several investigators proposed that the firstsynapses that appear in the developing IPL are betweenACs and GCs and that at least some of them are cholin-
ergic (Feller et al., 1996; Hering and Kroger, 1996; Zhou,1998; Catsicas and Mobbs, 2001).
Identification of inner plexiform sublayers
To examine their development, sublayers were identi-fied based on the observed immunoreactive patterns. Wetook the E18 retina as a reference, assuming that theformation of sublayers was, in principle, complete. Be-cause GC strata reflect synaptic zones where specific cellscome into contact, they serve as a suitable basis to distin-guish the sublayers. They stratified at five distinct levels.From the definition of sublayers, it is required that thesestrata match with AC strata. The overlay of AC strataexposed by the different molecules studied resulted inseveral findings (Table 2). The AC strata superimposednearly continuously the stratification pattern of GC den-drites across the width of the IPL. Consequently, AC andGC strata were topographically not segregated, as pro-posed by Cajal (1972). The three strata of strongerNrCAM immunoreactivity overlaid the NgCAM strata,including the double band in the central part of the IPLand the stratum in the inner IPL, where NgCAM andaxonin-1 colocalized. The two strata of weaker NrCAMimmunoreactivity overlaid the ChAT strata and enclosedthe Kir3.2- and axonin-1–positive strata, which werepartly coincident with ChAT immunoreactivity. Thus, thesuccessive strata of GC dendrites joined congruently withdistinct AC strata. Accordingly, the multiplicity of ACstratification should link to the great morphologic andfunctional diversities of these interneurons (Haverkampand Wassle, 2000; Sun and Crossland, 2000) rather thanto the number of sublayers. The matching of strata ofweaker NrCAM immunoreactivity and cholinergic strataidentified sublayers 2 and 4, as the location of the latter iscommonly acknowledged (Millar et al., 1987; Spira et al.,
TABLE 2. Relative Locations of Immunoreactive Bands in the InnerPlexiform Layer at Embryonic Day 18
Levels1 NrCAM NgCAM Axonin-1 ChAT Kir3.2
a Strong X
b Weak X Xcd X X X
e Strong Xfg X
h Weak X Xij X X X
k Strong X2
l X Xm X
1Locations are reflected by the antibodies directed against the molecules, indicatedfrom the outer (a) to the inner (m) inner plexiform layer. ChAT, choline acetyltrans-ferase; NgCAM, neuron–glia cell adhesion molecule; NrCAM, neuron–glia-related celladhesion molecule; Kir, inwardly rectifying potassium channel proteins.2In about one fourth of the embryos this level was inconsistently subdivided by a faintunlabeled stripe.
Fig. 9. A, B: Micrographs of the inner plexiform layer (IPL) atembryonic day 18 (E18; stage 44) show inwardly rectifying potassium(Kir) 3.2 immunoreactive cells in slightly oblique sections. Their pro-cesses terminate in different IPL bands. Scale bar � 25 �m.
Fig. 10. Electron micrographs of intercellular contacts in the innerplexiform layer close to the apex of the optic fissure at embryonic day(E) 7 (stage 31), early E9 (stage 35), E10 (stage 36), and E12 (stage38). A: Micrograph shows simple cell-to-cell appositions with mem-brane thickenings separated by a small cleft filled with moderatelydense material (arrows). Note the large vesicles in the neighborhood.B–F: Micrographs show junctions that resemble immature conven-tional synapses. The arrowhead in B points to a narrow cleft filledwith electron-dense material, the arrowhead in E points to a dense-core vesicle, and the arrowheads in F point to conical densities thatextend into the cytoplasm for a short distance. G: Micrograph showsa synaptic ribbon at E10 accompanied by vesicles. Scale bar � 0.5 �m.
9IPL DEVELOPMENT
1987). This affiliation simultaneously demonstrates theremaining three of the five sublayers distinguished in theIPL (Millar et al., 1987; Spira et al., 1987; Gabriel andWilhelm, 1994; Kolb, 1997).
Development of the sublayers
As a general observation, sublayers developed from thecentral to the peripheral retina. However, stratified GCsand ACs furnished these sublayers at different ages ex-cept for sublayers 2 and 4. These two sublayers were thefirst to form. They occurred at E9 with the formation ofcholinergic AC strata accompanied by Kir3.2 immunore-activity. At the same time, two strata of weaker NrCAMimmunoreactivity appeared at the “cholinergic levels,” in-dicating the beginning stratification of GC dendrites. Con-ventional synapses formed already at the beginning of E9.These events coincide with the occurrence of rhythmicspontaneous neuronal activity (Wong et al., 1998; Catsicasand Mobbs, 2001). Spontaneous activity has been impli-cated in the maturation of GC dendrites and their restric-tion into sublayers (Bodnarenko and Chalupa, 1993;Bodnarenko et al., 1995; Sernagor and Grzywacz, 1996).Acetylcholine, transmitted via synapses from cholinergicACs to GCs, is regarded as a major excitatory drive of thisearly activity (Feller et al., 1996; Zhou, 1998; Sernagor etal., 2000; Catsicas and Mobbs, 2001). Neuronal excitationis regularly accompanied by an increase of the extracellu-lar K� concentration, which may result in increased neu-ronal activity and eventually in an uncoordinated excit-ability, if not immediately corrected. This is when Kirchannels may come into play. It is supposed that, in glialcells, they redistribute the excess of extracellular K� ionsby spatial buffering (Karwoski et al., 1989; Newman andReichenbach, 1996). In neurons, Kir channels are thoughtto regulate and modify cellular excitability and synaptictransmission (Dascal, 1997; Rogalski et al., 2000). Thefunctions of Kir channels and the time of expression in theretina may involve them in the rhythmic spontaneousactivity. The observed correlative events at the onset ofdifferentiation may support previous reports of anactivity-dependent structural patterning in dendrites ofGCs (Bodnarenko and Chalupa, 1993; Sernagor andGrzywacz, 1996; Zhou, 1998; Wong et al., 2000b; Sernagorand Mehta, 2001), which also may apply to the co-activecholinergic ACs.
It is still obscure how neuronal activity is transformedinto a laminar organization. Sublayers are synaptic zoneswhere sets of specific cells interconnect (Kolb, 1997). Onepossibility is that this matching is mediated by recogni-tion molecules (Wong et al., 2000b). In this context, theinvestigated CAMs may play a role because of their homo-and heterophilic binding capabilities. NgCAM andaxonin-1 strata appeared in an alternating chronotropicsequence from the outer to the inner IPL and showeddifferent relationships to the preexisting stratification ofstronger and weaker NrCAM immunoreactivity. Axonin-1–expressing processes grow preferentially on an NrCAMor on a mixed NrCAM/NgCAM substratum and directheterophilic trans-interaction with NrCAM results inguidance (Stoeckli and Landmesser, 1995; Stoeckli et al.,1997; Fitzli et al., 2000; Lustig et al., 2001). In the IPL,NrCAM and NgCAM colocalized in sublayers 1, 3, and 5,and each sublayer formed in advance of the axonin-1strata. The sequential establishment of axonin-1 strata inthe intervening sublayers challenged the suggested func-
tional relationship between these CAMs. Binding betweenNgCAM and axonin-1 or NrCAM occurs only within theplane of the same membrane (Brummendorf and Rathjen,1998; Sonderegger et al., 1998). The alternating NgCAMand axonin-1 patterns and the variances during the for-mation of NgCAM and NrCAM strata assume that suchcis-bindings are not effective.
Hence, molecular interactions between the investigatedCAMs seemed to be not directly involved in the establish-ment of the laminar organization. This observation doesnot exclude the possibility that they interact with as yetunknown ligands or receptors. Homophilic interactionsmay contribute to the formation of the individual strata ofinterweaving arborizations. In addition, other mecha-nisms may cooperate in the development of the sublayers.During this period, conventional synapses diversified, bi-polar cells came into play, and expression of Kir3.2 in-creased. The emergence of the laminar patterns of connec-tivity correlated with the period when spontaneousactivity is most prominent (Wong et al., 1998). GC stratabecame sharpened with age. This pruning may result fromextensive movements of their terminal processes duringsynaptogenesis, thereby maximizing the chance of findingthe proper target (Wong et al., 2000a). Further, naturaloccurring cell death may contribute to the refinement ofGC strata, because about 40% of all GCs are eliminatedbetween E8 and E16 (Rager, 1980; Vanselow et al., 1990).Similar processes might be effective in ACs. Apoptosis inthe INL occurs between E8 and E14 (Cook et al., 1998) andmay play a role in the refinement of the NgCAM strata,because their processes were restricted to their specificlevels between E10 and E15.
ACKNOWLEDGMENTS
We thank Monique Carrel for her excellent technicalassistance; Prof. Dr. P. Sonderegger, Institute of Biochem-istry, University of Zurich, who generously provided uswith the goat anti–axonin-1 and the anti-NgCAM antibod-ies; Prof. Dr. E. Stoeckli, Biocenter, University of Basel,for the rabbit anti–axonin-1 antibody; and Prof. Dr. P.Eggli, Institute of Anatomy, University of Bern, for theuse of the Bio-Rad �Radiance 2000 confocal laser scanmicroscope.
LITERATURE CITED
Bergmann M, Grabs D, Rager G. 2000. Expression of presynaptic proteinsis closely correlated with the chronotropic pattern of axons in theretinotectal system of the chick. J Comp Neurol 418:361–372.
Biedermann B, Skatchkov SN, Brunk I, Bringmann A, Pannicke T, Bern-stein HG, Faude F, Germer A, Veh R, Reichenbach A. 1998. Spermine/spermidine is expressed by retinal glial (Muller) cells and controlsdistinct K� channels of their membrane. Glia 23:209–220.
Bodnarenko SR, Chalupa LM. 1993. Stratification of ON and OFF ganglioncell dendrites depends on glutamate-mediated afferent activity in thedeveloping retina. Nature 364:144–146.
Bodnarenko SR, Jeyarasasingam G, Chalupa LM. 1995. Development andregulation of dendritic stratification in retinal ganglion cells byglutamate-mediated afferent activity. J Neurosci 15:7037–7045.
Brummendorf T, Rathjen FG. 1998. Molecular interactions involving im-munoglobulin superfamily adhesion molecules. In: Sonderegger P, ed-itor. Ig superfamily molecules in the nervous system. Amsterdam:Harwood. p 23–56.
Cajal SR. 1972. The structure of the retina. Thorpe SA, Glickstein M,compilers and translators. Springfield, IL: C. C. Thomas.
Catsicas M, Mobbs P. 2001. GABAb receptors regulate chick retinal cal-cium waves. J Neurosci 21:897–910.
10 U. DRENHAUS ET AL.
Cook B, Portera Cailliau C, Adler R. 1998. Developmental neuronal deathis not a universal phenomenon among cell types in the chick embryoretina. J Comp Neurol 396:12–19.
Dascal N. 1997. Signalling via the G protein–activated K� channels. CellSignal 9:551–573.
Drenhaus U, Morino P, Rager G. 2001. The contribution of axonin-1 andNgCAM immunoreactive amacrine cells to the formation of inner plex-iform sublayers in the chick retina. Ann Anat Suppl 183:227–228.
Feller MB, Wellis DP, Stellwagen D, Werblin FS, Shatz CJ. 1996. Require-ment for cholinergic synaptic transmission in the propagation of spon-taneous retinal waves. Science 272:1182–1187.
Fitzli D, Stoeckli ET, Kunz S, Siribour K, Rader C, Kunz B, Kozlov SV,Buchstaller A, Lane RP, Suter DM, Dreyer WJ, Sonderegger P. 2000. Adirect interaction of axonin-1 with NgCAM-related cell adhesion mol-ecule (NrCAM) results in guidance, but not growth of commissuralaxons. J Cell Biol 149:951–968.
Gabriel R, Wilhelm M. 1994. Quantitative synaptology of the inner plexi-form layer of the retina of Bufo marinus. Eur J Morphol 32:19–33.
Grosse G, Draguhn A, Hohne L, Tapp R, Veh RW, Ahnert-Hilger G. 2000.Expression of Kv1 potassium channels in mouse hippocampal primarycultures: development and activity-dependent regulation. J Neurosci20:1869–1882.
Grumet M. 1997. Nr-CAM: a cell adhesion molecule with ligand andreceptor functions. Cell Tissue Res 290:423–428.
Grumet M, Mauro V, Burgoon MP, Edelman GM, Cunningham BA. 1991.Structure of a new nervous system glycoprotein, Nr-CAM, and itsrelationship to subgroups of neural cell adhesion molecules. J Cell Biol113:1399–1412.
Hamburger V, Hamilton HL. 1951. A series of normal stages in the devel-opment of the chick embryo. J Morphol 88:49–92.
Haverkamp S, Wassle H. 2000. Immunocytochemical analysis of the mouseretina. J Comp Neurol 424:1–23.
Hering H, Koulen P, Kroger S. 2000. Distribution of the integrin beta 1subunit on radial cells in the embryonic and adult avian retina. J CompNeurol 424:153–164.
Hering H, Kroger S. 1996. Formation of synaptic specializations in theinner plexiform layer of the developing chick retina. J Comp Neurol375:393–405.
Hughes WF, LaVelle A. 1974. On the synaptogenic sequence in the chickretina. Anat Rec 179:297–302.
Karschin C, Dissmann E, Stuhmer W, Karschin A. 1996. IRK(1–3) andGIRK(1–4) inwardly rectifying K� channel mRNAs are differentiallyexpressed in the adult rat brain. J Neurosci 16:3559–3570.
Karwoski CJ, Lu HK, Newman EA. 1989. Spatial buffering of light-evokedpotassium increases by retinal Muller (glial) cells. Science 244:578–580.
Kolb H. 1997. Amacrine cells of the mammalian retina: neurocircuitry andfunctional roles. Eye 11:904–923.
Kuhn TB, Stoeckli ET, Condrau MA, Rathjen FG, Sonderegger P. 1991.Neurite outgrowth on immobilized axonin-1 is mediated by a hetero-philic interaction with L1(G4). J Cell Biol 115:1113–1126.
Kusaka S, Inanobe A, Fujita A, Makino Y, Tanemoto M, Matsushita K,Tano Y, Kurachi Y. 2001. Functional Kir7.1 channels localized at theroot of apical processes in rat retinal pigment epithelium. J Physiol531:27–36.
Layer PG, Berger J, Kinkl N. 1997. Cholinesterases precede “ON–OFF”channel dichotomy in the embryonic chick retina before onset of syn-aptogenesis. Cell Tissue Res 288:407–416.
Lustig M, Erskine L, Mason CA, Grumet M, Sakurai T. 2001. Nr-CAMexpression in the developing mouse nervous system: ventral midlinestructures, specific fiber tracts, and neuropilar regions. J Comp Neurol434:13–28.
Millar TJ, Ishimoto I, Chubb IW, Epstein ML, Johnson CD, Morgan IG.1987. Cholinergic amacrine cells of the chicken retina: a light andelectron microscope immunocytochemical study. Neuroscience 21:725–743.
Morales G, Sanchez-Puelles JM, Schwarz U, de la Rosa EJ. 1996. Syner-gistic neurite-outgrowth promoting activity of two related axonal pro-teins, Bravo/Nr-CAM and G4/Ng-CAM in chicken retinal explants. EurJ Neurosci 8:1098–1105.
Morino P, Buchstaller A, Giger R, Sonderegger P, Rager G. 1996. Differ-ential expression of the mRNAs of the axonal glycoproteins axonin-1and NgCAM in the developing chick retina. Brain Res Dev Brain Res91:252–259.
Newman E, Reichenbach A. 1996. The Muller cell: a functional element ofthe retina. Trends Neurosci 19:307–312.
Nichols CG, Lopatin AN. 1997. Inward rectifier potassium channels. AnnuRev Physiol 59:171–191.
Nishimura Y. 1980. Determination of the developmental pattern of retinalganglion cells in chick embryos by Golgi impregnation and other meth-ods. Anat Embryol (Berl) 158:329–347.
Prada C, Puelles L, Genis-Galvez JM, Ramirez G. 1987. Two modes of freemigration of amacrine cell neuroblasts in the chick retina. Anat Em-bryol (Berl) 175:281–287.
Prada C, Puga J, Perez-Mendez L, Lopez R, Ramirez G. 1991. Spatial andtemporal patterns of neurogenesis in the chick retina. Eur J Neurosci3:559–569.
Prada FA, Dorado ME, Quesada A, Prada C, Schwarz U, de la Rosa EJ.1995. Early expression of a novel radial glia antigen in the chickembryo. Glia 15:389–400.
Prada FA, Medina JI, Lopez-Gallardo M, Lopez R, Quesada A, Spira A,Prada C. 1999. Spatiotemporal gradients of differentiation of chickretina types I and II cholinergic cells: identification of a commonpostmitotic cell population. J Comp Neurol 410:457–466.
Prada FA, Quesada A, Dorado ME, Chmielewski C, Prada C. 1998. Glu-tamine synthetase (GS) activity and spatial and temporal patterns ofGS expression in the developing chick retina: relationship with synap-togenesis in the outer plexiform layer. Glia 22:221–236.
Raap M, Biedermann B, Braun P, Milenkovic I, Skatchkov SN, BringmannA, Reichenbach A. 2002. Diversity of Kir channel subunit mRNA ex-pressed by retinal glial cells of the guinea-pig. Neuroreport 13:1037–1040.
Rager G. 1980. Development of the retinotectal projection in the chicken.Adv Anat Embryol Cell Biol 63:I–VIII, 1–90.
Rager U, Rager G, Frei B. 1993. Central retinal area is not the site whereganglion cells are generated first. J Comp Neurol 334:529–544.
Rager G, Morino P, Schnitzer J, Sonderegger P. 1996. Expression of theaxonal cell adhesion molecules axonin-1 and Ng-CAM during the de-velopment of the chick retinotectal system. J Comp Neurol 365:594–609.
Reiss Y, Kroger S, Grassi J, Tsim KW, Willbold E, Layer PG. 1996.Extracellular and asymmetric forms of acetylcholinesterase are ex-pressed on cholinergic and noncholinergic terminal neuropil of thedeveloping chick retina. Cell Tissue Res 286:13–22.
Rogalski SL, Appleyard SM, Pattillo A, Terman GW, Chavkin C. 2000.TrkB activation by brain-derived neurotrophic factor inhibits the Gprotein-gated inward rectifier Kir3 by tyrosine phosphorylation of thechannel. J Biol Chem 275:25082–25088.
Sernagor E, Eglen SJ, O’Donovan MJ. 2000. Differential effects of acetyl-choline and glutamate blockade on the spatiotemporal dynamics ofretinal waves. J Neurosci 20:1–6.
Sernagor E, Grzywacz NM. 1996. Influence of spontaneous activity andvisual experience on developing retinal receptive fields. Curr Biol6:1503–1508.
Sernagor E, Mehta V. 2001. The role of early neural activity in the matu-ration of turtle retinal function. J Anat 199:375–383.
Sheffield JB, Fischman DA. 1970. Intercellular junctions in the developingneural retina of the chick embryo. Z Zellforsch 104:405–418.
Skatchkov SN, Thomzig A, Eaton MJ, Biedermann B, Eulitz D, BringmannA, Pannicke T, Veh RW, Reichenbach A. 2001. Kir subfamily in frogretina: specific spatial distribution of Kir 6.1 in glial (Muller) cells.Neuroreport 12:1437–1441.
Sonderegger P. 1997. Axonin-1 and NgCAM as “recognition” components ofthe pathway sensor apparatus of growth cones: a synopsis. Cell TissueRes 290:429–439.
Sonderegger P, Kunz S, Rader C, Buchstaller A, Berger P, Vogt L, KozlovSV, Ziegler U, Kunz B, Fitzli D, Stoeckli ET. 1998. Discrete clusters ofaxonin-1 and NgCAM at neuronal contact sites: facts and speculationson the regulation of axonal fasciculation. Prog Brain Res 117:93–104.
Spira AW, Millar TJ, Ishimoto I, Epstein ML, Johnson CD, Dahl JL,Morgan IG. 1987. Localization of choline acetyltransferase–like immu-noreactivity in the embryonic chick retina. J Comp Neurol 260:526–538.
Stoeckli ET, Landmesser LT. 1995. Axonin-1, Nr-CAM, and Ng-CAM playdifferent roles in the in vivo guidance of chick commissural neurons.Neuron 14:1165–1179.
Stoeckli ET, Sonderegger P, Pollerberg GE, Landmesser LT. 1997. Inter-ference with axonin-1 and NrCAM interactions unmasks a floor-plateactivity inhibitory for commissural axons. Neuron 18:209–221.
11IPL DEVELOPMENT
Sun H, Crossland WJ. 2000. Quantitative assessment of localization andcolocalization of glutamate, aspartate, glycine, and GABA immunore-activity in the chick retina. Anat Rec 260:158–179.
Tahara Y, Kumoi Y, Kiyama H, Tohyama M. 1986. Ontogeny of substanceP–containing structures in the chicken retina: immunohistochemicalanalysis. Brain Res 395:37–45.
Treubert U, Brummendorf T. 1998. Functional cooperation of beta1-integrins and members of the Ig superfamily in neurite outgrowthinduction. J Neurosci 18:1795–1805.
Vanselow J, Dutting D, Thanos S. 1990. Target dependence of chick retinalganglion cells during embryogenesis: cell survival and dendritic devel-opment. J Comp Neurol 295:235–247.
Veh RW, Lichtinghagen R, Sewing S, Wunder F, Grumbach IM, Pongs O.1995. Immunohistochemical localization of five members of the Kv1
channel subunits: contrasting subcellular locations and neuron-specificcolocalizations in rat brain. Eur J Neurosci 7:2189–2205.
Wong WT, Sanes JR, Wong RO. 1998. Developmentally regulated sponta-neous activity in the embryonic chick retina. J Neurosci 18:8839–8852.
Wong WT, Faulkner-Jones BE, Sanes JR, Wong RO. 2000a. Rapid den-dritic remodeling in the developing retina: dependence on neurotrans-mission and reciprocal regulation by Rac and Rho. J Neurosci 20:5024–5036.
Wong WT, Myhr KL, Miller ED, Wong RO. 2000b. Developmental changesin the neurotransmitter regulation of correlated spontaneous retinalactivity. J Neurosci 20:351–360.
Zhou ZJ. 1998. Direct participation of starburst amacrine cells in sponta-neous rhythmic activities in the developing mammalian retina. J Neu-rosci 18:4155–4165.
12 U. DRENHAUS ET AL.


![Solitary Intraparotid Facial Nerve Plexiform Neurofibroma · peripheral nerve sheath tumor, which occurs in 2% - 5% of patients with plexiform neurofibroma [8]. Malignat peripheral](https://img.pdfslide.us/doc/110x75/5f7de695ec881b64331afe7f/solitary-intraparotid-facial-nerve-plexiform-neurofibroma-peripheral-nerve-sheath.jpg)