Embed Size (px)
Citation preview

International Journal of Energy and Power Engineering 2015; 4(2): 51-64
Published online March 2, 2015 (http://www.sciencepublishinggroup.com/j/ijepe)
doi: 10.11648/j.ijepe.20150402.16
ISSN: 2326-957X (Print); ISSN: 2326-960X (Online)
On the Assessment of Power System Stability Using Matlab/Simulink Model
Abel Ehimen Airoboman1, Ignatius Kema Okakwu
1, Akintude Samson Alayande
2,
Oluwasogo Emmanuel Seun3
1Department of Electrical/Electronics Engineering, University of Benin, Nigeria 2Department of Electrical Engineering, Faculty of Engineering and the Built Environment, Tshwane University of Technology, Private
Bag X680, Pretoria 0001, Staatsartillerie Road, South Africa 3Department of Electrical and Computer Engineering, Kwara State University, Malete, Nigeria
Email address: [email protected] (A. E. Airoboman), [email protected] (I. K. Okakwu), [email protected] (A. S. Alayande),
[email protected] (E. S. Oluwasogo)
To cite this article: Abel Ehimen Airoboman, Ignatius Kema Okakwu, Akintude Samson Alayande, Oluwasogo Emmanuel Seun. On the Assessment of Power
System Stability Using Matlab/Simulink Model. International Journal of Energy and Power Engineering. Vol. 4, No. 2, 2015, pp. 51-64.
doi: 10.11648/j.ijepe.20150402.16
Abstract: Several voltage collapses have been experienced by most practical power systems in recent times in Nigeria.
These have been mostly attributed to island formation within the network as a result of switching out of critical buses within
the network. This paper assesses the stability of a practical power network of the Nigerian National Grid (NNG) with reference
to a critical transmission line which could cause island formation as a result of fault within the NNG network. The Matlab/
Simulink model for both the steady-state and dynamic behaviours of the critical bus within NNG network is presented. The
simulations for various fault conditions are also presented. The results obtained from the simulations are discussed. From the
simulation results, high flow of reactive power and current, as a result of various faults along the transmission lines, were
observed. Furthermore, non-sinusoidal waveforms generated from the simulation results show an indication that a high degree
of compensation is required at the studied bus. The study uses Benin bus of NNG with respect to Benin-Onitsha-Alaoji 330-kV
transmission network due to its location and sensitivity within the grid.
Keywords: Nigerian National Grid, Voltage Collapse, Island Formation, Critical Buses, Simulink Model
1. Introduction
Power system stability is a subject of great interest to
power system planners and operators in recent times. In
practical power systems, it is expected that power generation
must be equal to power demand including losses to ensure
constant speed and frequency of operation. Unfortunately, the
load impressed on the system does fluctuate in a random
fashion. It is therefore virtually impossible to accomplish
equilibrium of power generation and power demand. An
excess or deficiency in active power generation will always
manifest. This mismatch normally results in frequency
fluctuation which could culminate in system instability [1] .
The load of the system may change gradually or suddenly.
Sudden changes of load may be due to quick switching
operations or sudden faults followed by tripping of lines,
circuit breaker or load. Dynamic stability studies the system
for a period of 4-10 seconds following a large disturbance
such as a short circuit or loss of generation or loss of load
because it leads to serious threat to system security and
creates very difficult operating conditions [7].
The transmission system in Nigeria is characterized by
several outages which may lead to disruption in the lives of
the citizenry [2]. The Nigerian National Grid NNG has been
characterized by so many constraints. These include ageing
of transmission line [6], long transmission line lengths and
lack of redundancy within the system. In addition to these,
inadequacy in hydroelectric plants particularly during the dry
season and vandalisation of electricity equipment are other
challenges facing NNG [3].
This paper presents the stability of NNG with reference to
the critical bus within the system. In section 2, brief

International Journal of Energy and Power Engineering 2015; 4(2): 51-64 52
description of the NNG network is presented. Section 3 gives
the modelling and performance analysis of the system under
study. The simulation results and analysis are presented in
section 4. The results obtained are discussed in section 5;
while the study is concluded in section 6.
2. The Nigerian Grid Network
Figure 1 shows the one-line diagram of a Nigerian 330KV
grid network. The single circuit, Benin-Onitsha-Alaoji
330KV transmission network, is the critical line within the
NNG network. Thus, it has no level of redundancy due to it
single nature circuit unlike the double circuit transmission
lines that has some level of redundancy [1]. The Nigerian
330KV transmission grid system is characterized by high
power losses due to the very long transmission lines and its
radial structure. Because only some of the lines has long
transmission compared to others Some of the lines with their
associated long transmission line lengths include Benin to
Ikeja-West (280 Km), Oshogbo to Benin (251 Km), Oshogbo
to Jebba (249 Km), Jebba to Shiroro (244 Km) Birnin-Kebbi
to Kainji 310 Km (310km), Jos to Gombe (265 Km), Kaduna
to Kano (230 Km). There could also be power loss along
medium transmission lines such as Benin to Onitsha (137
Km), Onitsha to Alaoji (138 Km) [1]. Hence, it could
therefore be concluded that the sensitivity of the Benin bus in
the NNG cannot be overemphasized because of its
connectivity to the northern, eastern, southern and western
part of the country thereby making the bus a very sensitive
bus in the grid as shown in figure 1. Thus, any fault along the
bus could cause island formation and hence bring the entire
grid to a total black out.
Figure 1. One-line diagram of Nigerian 330-kV Transmission Network [4]
3. Modelling and Performance Analysis
of Benin-Onitsha-Alaoji 330-kV
Transmission Network
Benin-Onitsha-Alaoji is a single circuit 330-kV
transmission line. Therefore, faults along this line shall cause
instability in the grid. In the case of a double circuit, load
demand during fault could be served temporarily by the other
circuit. A careful study of figure 1 shows that the Benin bus
connects the Southern, Western, Eastern and Northern parts
of NNG network. This connectivity thus makes the bus to be
sensitive, and therefore prone to faults and voltage collapse
of NNG system. Hence, there is the need for the stability
assessment of the grid with respect to Benin bus. Table 1
shows the connection of Benin bus to other buses within
NNG and their associated line lengths, resistances and
reactances in per unit [8].
Many voltage collapses and faults have been experience
and recorded by NNG. For instance, from the years 2009 to
2010, about 19.8% of the total voltage collapse is attributed
to fault on Benin bus which is an indication that the bus is
critical and needs to be studied [1]. Because this is a
percentage value and could not possibly be compared with a
simulated one. Also the scope of the work is more on analysis
while future work will be carried out with respect to
comparism.
The modelling of Benin-Onitsha-Alaoji 330-kV
transmission network within NNG is carried out using a
Matlab/Simulink model. The equivalent circuit of the
network is modelled in Matlab/Simulink window as shown in
figure 2, and the parameters of the network such as
impedance, voltage rating, power and loads at the various
buses, of the network are feed into the model and simulation
carried out.
The model consists of two generating plants one of 1902
MVA and the second of1430 MVA operating at 12 kV line-to-
line rating voltage. Plant 1 represents Delta and Sapele
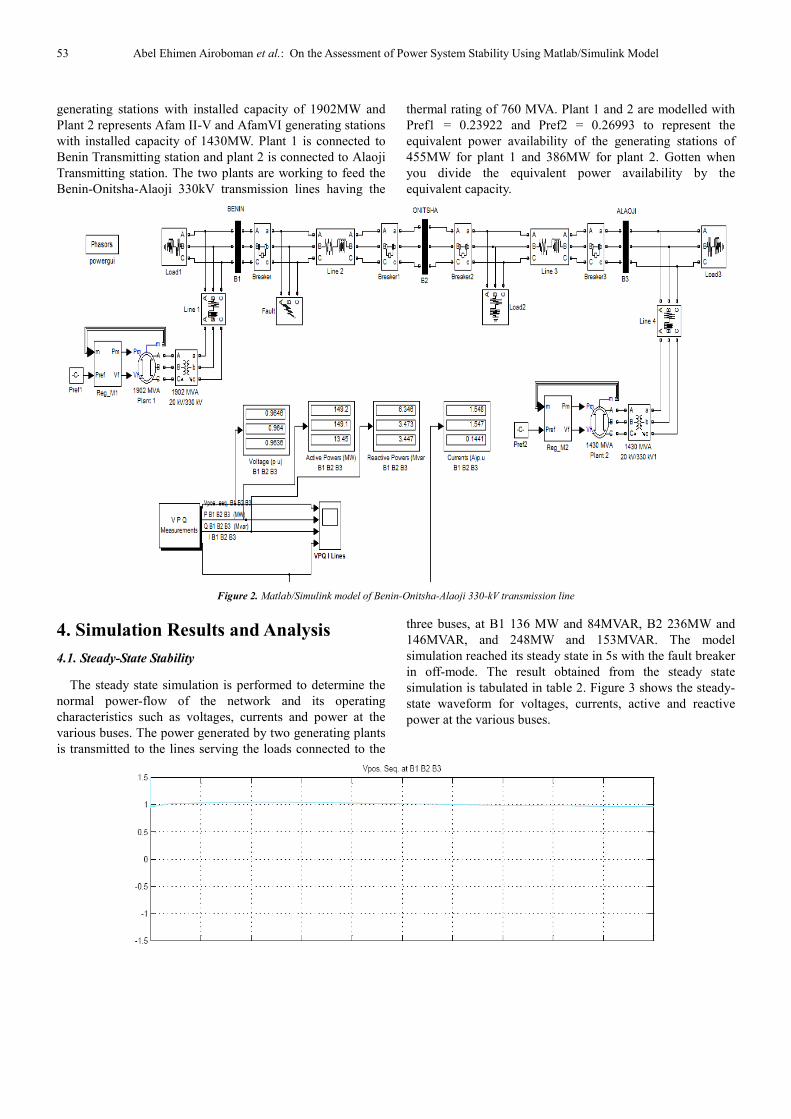
53 Abel Ehimen Airoboman et al.: On the Assessment of Power System Stability Using Matlab/Simulink Model
generating stations with installed capacity of 1902MW and
Plant 2 represents Afam II-V and AfamVI generating stations
with installed capacity of 1430MW. Plant 1 is connected to
Benin Transmitting station and plant 2 is connected to Alaoji
Transmitting station. The two plants are working to feed the
Benin-Onitsha-Alaoji 330kV transmission lines having the
thermal rating of 760 MVA. Plant 1 and 2 are modelled with
Pref1 = 0.23922 and Pref2 = 0.26993 to represent the
equivalent power availability of the generating stations of
455MW for plant 1 and 386MW for plant 2. Gotten when
you divide the equivalent power availability by the
equivalent capacity.
Figure 2. Matlab/Simulink model of Benin-Onitsha-Alaoji 330-kV transmission line
4. Simulation Results and Analysis
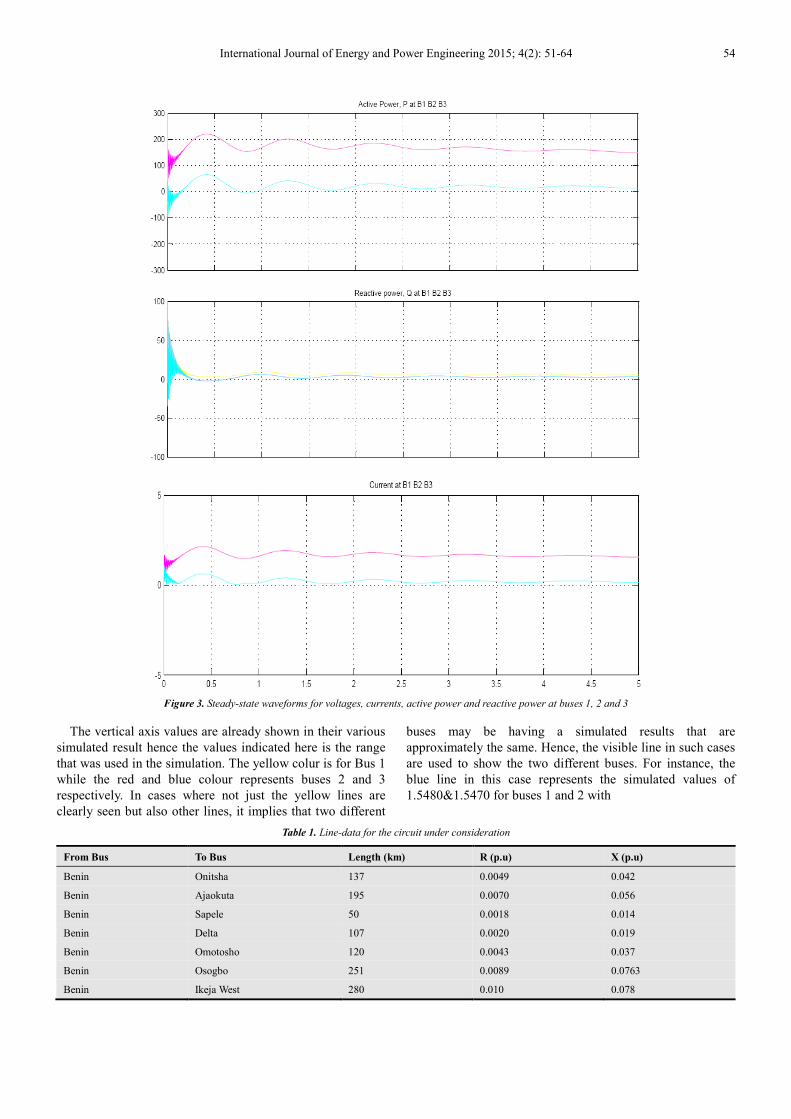
4.1. Steady-State Stability
The steady state simulation is performed to determine the
normal power-flow of the network and its operating
characteristics such as voltages, currents and power at the
various buses. The power generated by two generating plants
is transmitted to the lines serving the loads connected to the
three buses, at B1 136 MW and 84MVAR, B2 236MW and
146MVAR, and 248MW and 153MVAR. The model
simulation reached its steady state in 5s with the fault breaker
in off-mode. The result obtained from the steady state
simulation is tabulated in table 2. Figure 3 shows the steady-
state waveform for voltages, currents, active and reactive
power at the various buses.
International Journal of Energy and Power Engineering 2015; 4(2): 51-64 54
Figure 3. Steady-state waveforms for voltages, currents, active power and reactive power at buses 1, 2 and 3
The vertical axis values are already shown in their various
simulated result hence the values indicated here is the range
that was used in the simulation. The yellow colur is for Bus 1
while the red and blue colour represents buses 2 and 3
respectively. In cases where not just the yellow lines are
clearly seen but also other lines, it implies that two different
buses may be having a simulated results that are
approximately the same. Hence, the visible line in such cases
are used to show the two different buses. For instance, the
blue line in this case represents the simulated values of
1.5480&1.5470 for buses 1 and 2 with
Table 1. Line-data for the circuit under consideration
From Bus To Bus Length (km) R (p.u) X (p.u)
Benin Onitsha 137 0.0049 0.042
Benin Ajaokuta 195 0.0070 0.056
Benin Sapele 50 0.0018 0.014
Benin Delta 107 0.0020 0.019
Benin Omotosho 120 0.0043 0.037
Benin Osogbo 251 0.0089 0.0763
Benin Ikeja West 280 0.010 0.078
55 Abel Ehimen Airoboman et al.: On the Assessment of Power System Stability Using Matlab/Simulink Model
Table 2. Steady State Simulation Result
Bus Name Bus No Voltage (p.u) Current (p.u) P (MW) Q (MVAR)
Benin 1 0.96 1.55 149.20 6.35
Onitsha 2 0.96 1.55 149.10 3.47
Alaoji 3 0.96 0.14 13.45 3.45
4.2. Dynamic Stability
The dynamic state simulation is carried out with the same
model putting the fault breaker into On-mode to simulate
different fault conditions at the three buses. The faults
simulated are single line-to-ground fault, double line-to-
ground fault, three-phase-to-ground fault, line-to-line short
circuit fault, and sudden drop out of generating plant. The
various faults conditions simulated are used to ascertain and
analysed the system collapse. The simulation time was set to
20s; the fault breaker was initiated at 5s and last for 2s Based
on the mathematical solver used, the 20s helps us to get the
best overview of the system anything short or less will not
yield a desirable result before the fault is cleared by the
circuit breakers. The automatic reclosure of the lines is
initiated after 5s when the fault has been cleared.
Table 3. Dynamic State Simulation Results
Bus No Voltage (p.u) Current (p.u) P (MW) Q (MVAR)
Single line-to-ground fault results at bus 1
1 0.71 16.03 126.06 61.10
2 0.80 7.16 125.50 -146.10
3 0.88 7.10 8.95 -352.50
(B) Line-to-line short circuit fault result at bus 1
1 0.63 21.38 124.90 106.80
2 0.74 9.54 124.40 -155.00
3 0.86 9.5 8.30 -416.30
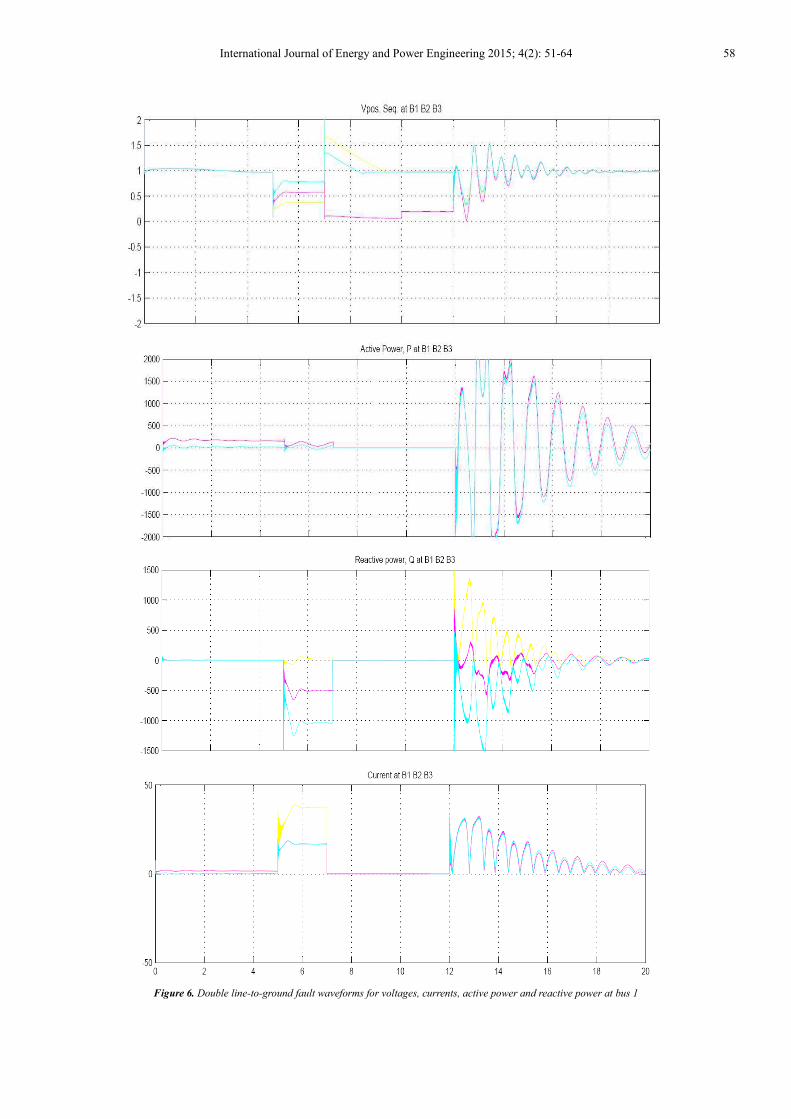
(C) Double line-to-ground fault results at bus 1
1 0.38 37.50 137.10 37.25
2 0.58 16.89 135.90 -505.10
3 0.78 16.83 65.14 -1048
(D) Three Phase-to-ground results at bus 1
1 8.806e-5 61.71 0.5433 0.013
2 0.33 27.64 -0.3279 -917
3 0.67 27.64 -16.87 -1840

International Journal of Energy and Power Engineering 2015; 4(2): 51-64 56
Figure 4. Single line-to-ground fault waveforms for voltages, currents, active power and reactive power at bus 1
5. Discussion of Results
The simulation results of the steady state and dynamic
faults analysis of Benin-Onitsha-Alaoji 330kV transmission
line within NNG have been considered. Based on the
steady-state simulation results, the highest fault current was
observed in the three-phase-to-ground fault simulated in bus
1 while the single line-to-ground fault simulated into bus 1
has a voltage value close to the normal operating condition.
The power-flow and the voltage for the line-to-line fault were
within the normal condition of 330 KV while the lowest
voltage profile was observed in the three-phase-to-ground
fault. The three phase-to-ground faults into buses 1, 2 and 3
respectively have been simulated and their respective
waveforms presented.
57 Abel Ehimen Airoboman et al.: On the Assessment of Power System Stability Using Matlab/Simulink Model
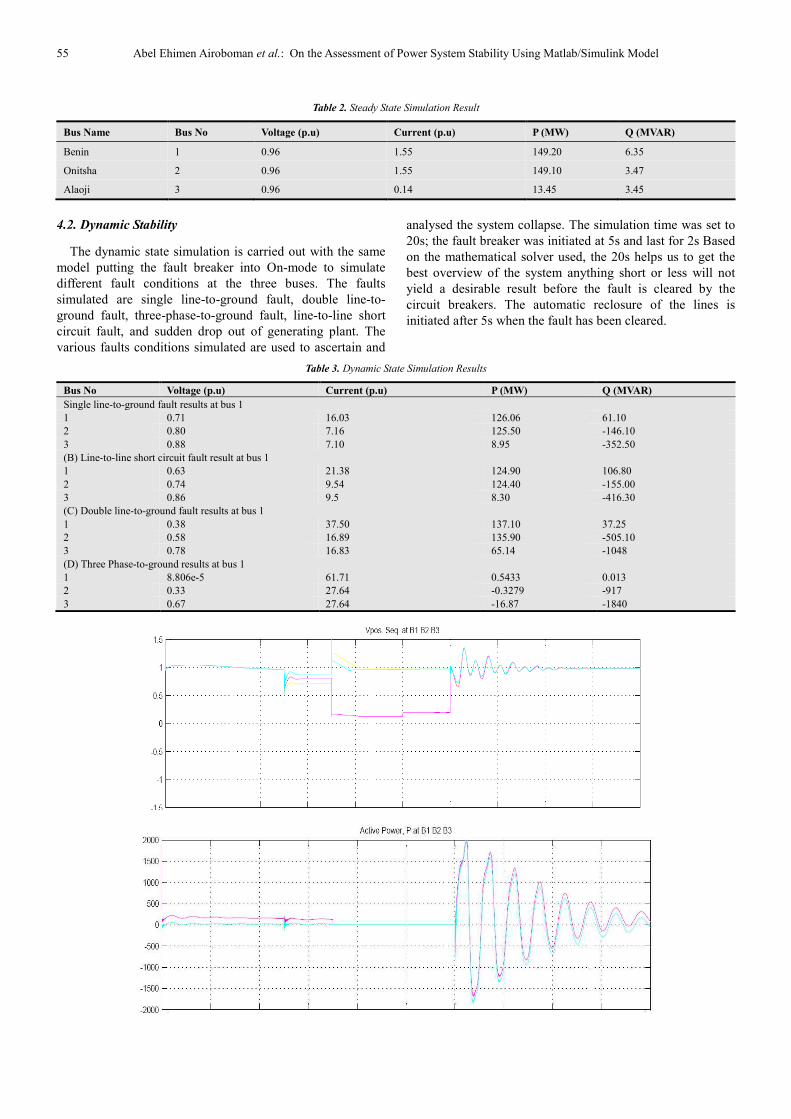
Figure 5. line-to-line short circuit fault waveforms for voltages, currents, active power and reactive power at bus 1
Table 4. Three phase-to-ground faults Result at Bus 1
Bus No Voltage (p.u) Current (p.u) P (MW) Q(Mvar)
1 8.806e-5 61.71 0.54 0.013
2 0.33 27.64 -0.33 -916.70
3 0.67 27.64 -16.87 -1840
When the fault was simulated into bus 1, a high current
flow was observed. The result of the same fault simulated
into bus 2 shows that a high reactive power flow was
observed in bus 1 as well as a low voltage profile when
compared to bus 3. The three phase-to-ground fault simulated
into bus 3 also records a high reactive power flow when
compared to other buses and also bus 3 records the highest
power-flow. Interestingly, when there was a sudden drop in
generating plant 1, a high reactive power-flow was observed
in bus 1 when compared to buses 2 and 3.
International Journal of Energy and Power Engineering 2015; 4(2): 51-64 58
Figure 6. Double line-to-ground fault waveforms for voltages, currents, active power and reactive power at bus 1
59 Abel Ehimen Airoboman et al.: On the Assessment of Power System Stability Using Matlab/Simulink Model
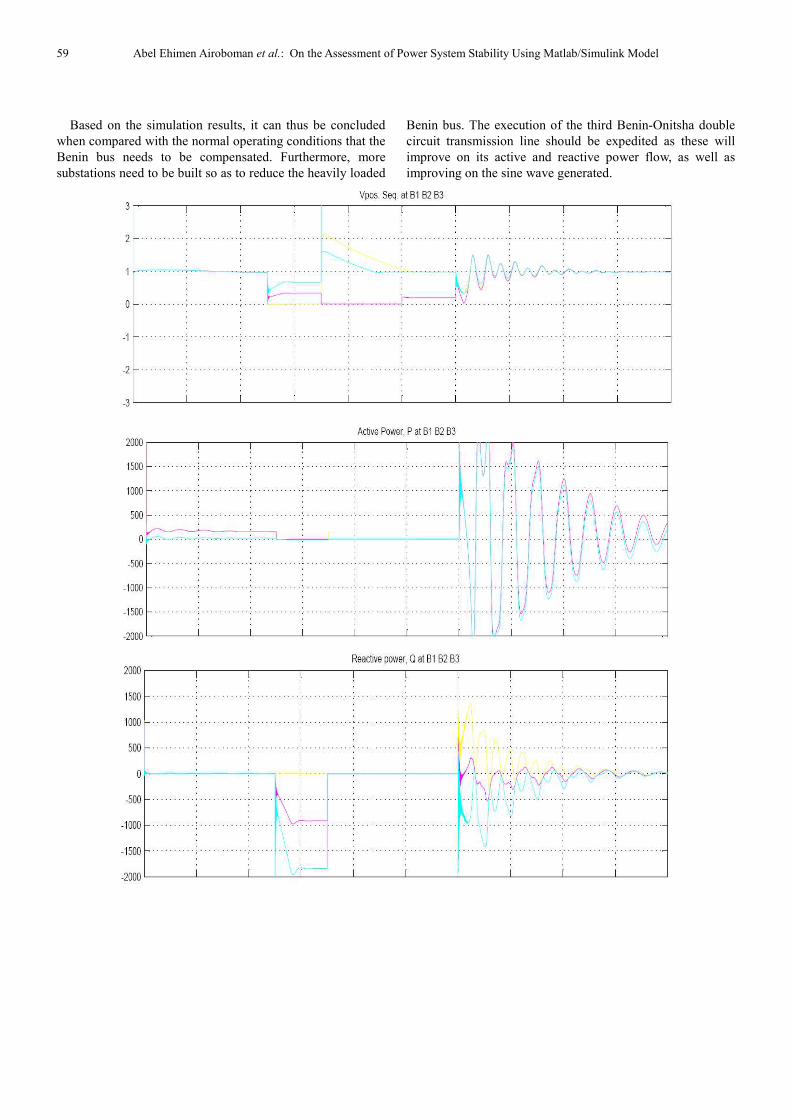
Based on the simulation results, it can thus be concluded
when compared with the normal operating conditions that the
Benin bus needs to be compensated. Furthermore, more
substations need to be built so as to reduce the heavily loaded
Benin bus. The execution of the third Benin-Onitsha double
circuit transmission line should be expedited as these will
improve on its active and reactive power flow, as well as
improving on the sine wave generated.

International Journal of Energy and Power Engineering 2015; 4(2): 51-64 60
Figure 7. Three phase-to-ground fault waveforms for voltages, currents, active power and reactive power at bus 1
Table 5. Three phase to ground faults Result at Bus 2
Bus No Voltage (p.u) Current (p.u) P (MW) Q (MVAR)
1 0.42 35.03 0.79 1473
2 2.765e-5 35.03 0.01597 -0.0955
3 0.51 42.27 -1.20 -2160
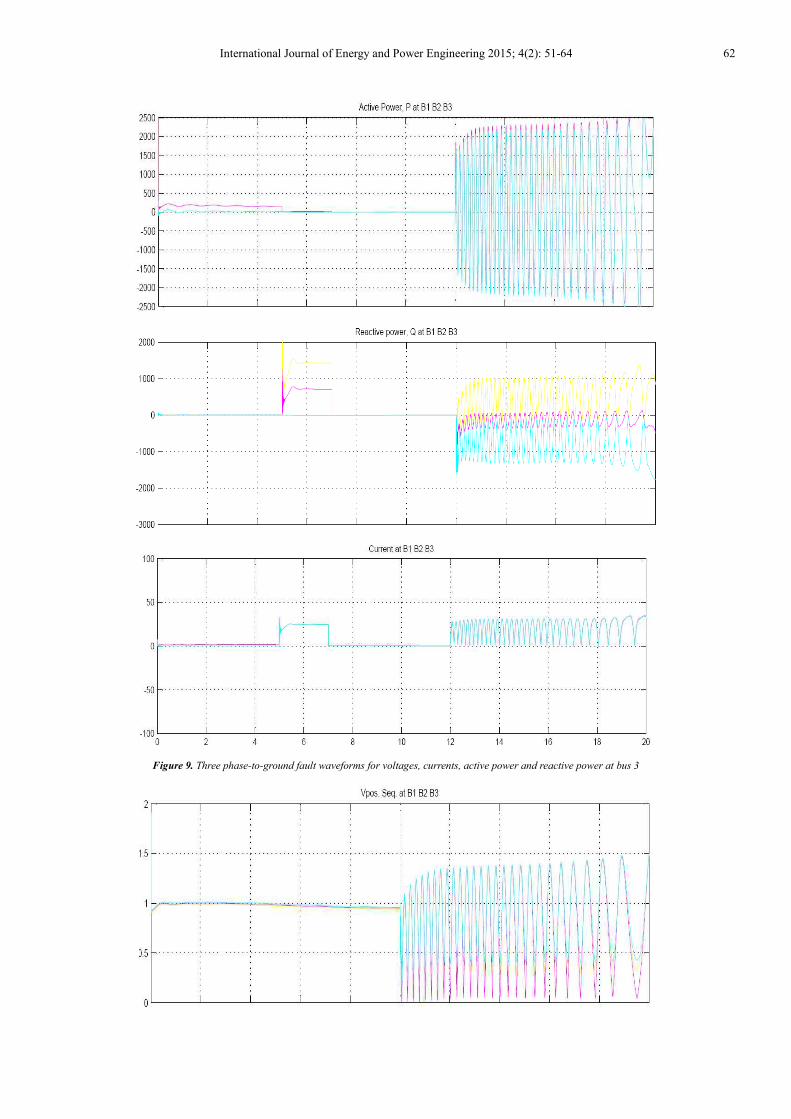
Table 6. Three phase to ground faults Result at Bus 3
Bus No Voltage (p.u) Current (p.u) P (MW) Q (MVAR)
1 0.59 24.37 13.47 1430
2 0.29 2 4.37 13.10 717.30
3 6.228e-5 24.36 0.064 -0.14
61 Abel Ehimen Airoboman et al.: On the Assessment of Power System Stability Using Matlab/Simulink Model
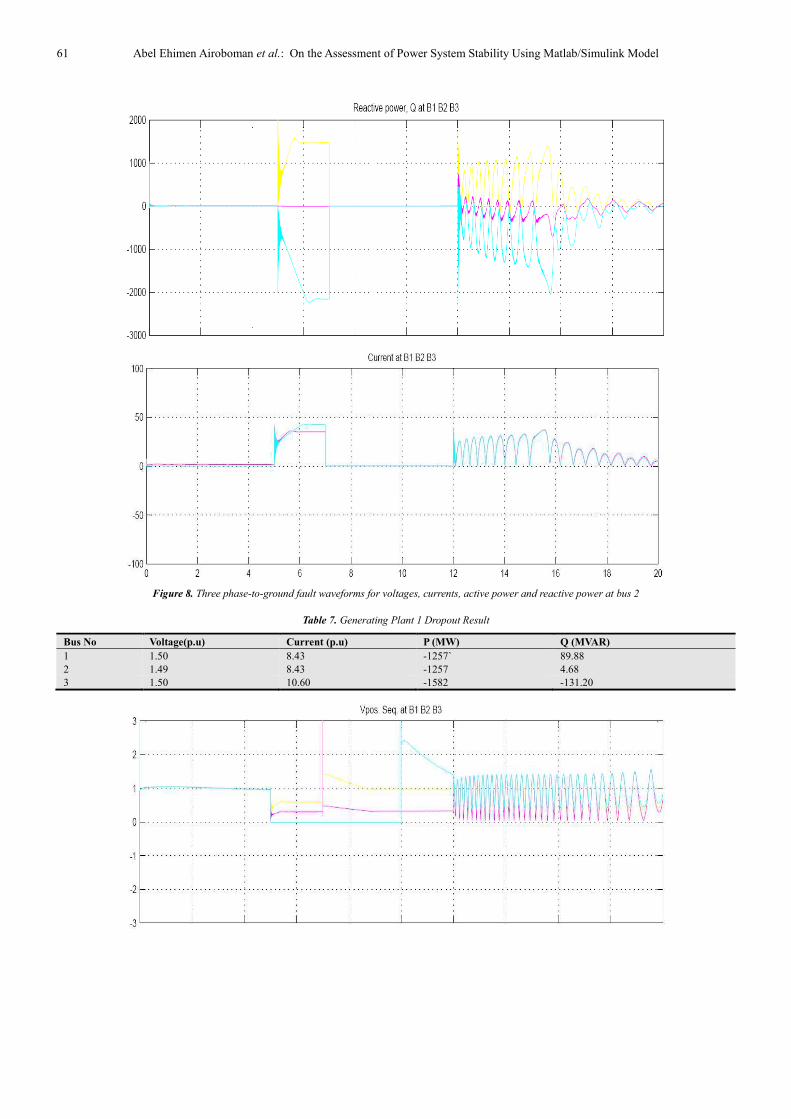
Figure 8. Three phase-to-ground fault waveforms for voltages, currents, active power and reactive power at bus 2
Table 7. Generating Plant 1 Dropout Result
Bus No Voltage(p.u) Current (p.u) P (MW) Q (MVAR)
1 1.50 8.43 -1257` 89.88
2 1.49 8.43 -1257 4.68
3 1.50 10.60 -1582 -131.20
International Journal of Energy and Power Engineering 2015; 4(2): 51-64 62
Figure 9. Three phase-to-ground fault waveforms for voltages, currents, active power and reactive power at bus 3
63 Abel Ehimen Airoboman et al.: On the Assessment of Power System Stability Using Matlab/Simulink Model
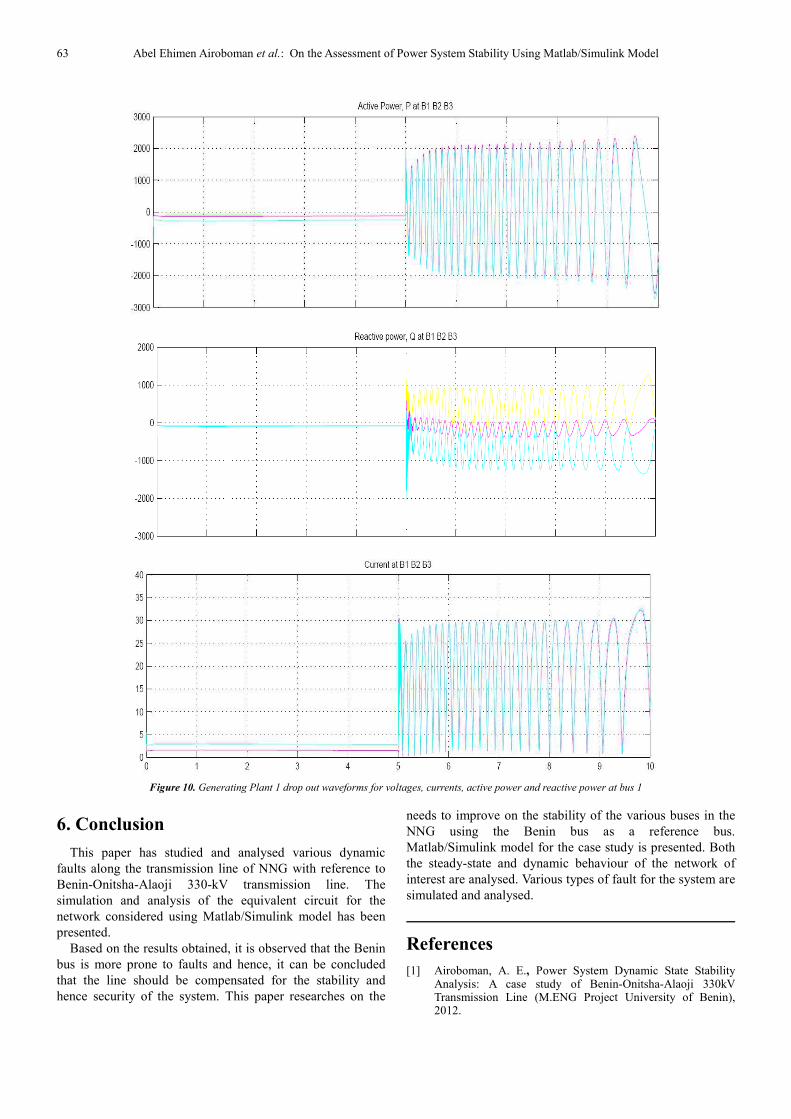
Figure 10. Generating Plant 1 drop out waveforms for voltages, currents, active power and reactive power at bus 1
6. Conclusion
This paper has studied and analysed various dynamic
faults along the transmission line of NNG with reference to
Benin-Onitsha-Alaoji 330-kV transmission line. The
simulation and analysis of the equivalent circuit for the
network considered using Matlab/Simulink model has been
presented.
Based on the results obtained, it is observed that the Benin
bus is more prone to faults and hence, it can be concluded
that the line should be compensated for the stability and
hence security of the system. This paper researches on the
needs to improve on the stability of the various buses in the
NNG using the Benin bus as a reference bus.
Matlab/Simulink model for the case study is presented. Both
the steady-state and dynamic behaviour of the network of
interest are analysed. Various types of fault for the system are
simulated and analysed.
References
[1] Airoboman, A. E., Power System Dynamic State Stability Analysis: A case study of Benin-Onitsha-Alaoji 330kV Transmission Line (M.ENG Project University of Benin), 2012.

International Journal of Energy and Power Engineering 2015; 4(2): 51-64 64
[2] Anil, P., Mark, H. & Graunt, T. R., .Estimation of Outages in Overhead Distribution Systems of South Africa and of Manhattan, Kansa, USA 7th International Conference on Power System Operation and Planning, Cape Town, South Africa, 2007.
[3] Ekeh, J.C., Electric Power Principles, 2003.
[4] Onohaebi, S. O., Power Transmission constraints and faults analysis in Nigeria Power System, 2007.
[5] Ndiagwalukwe, J. U., Frequency Control and Grid Stability.
[6] Ibe, A.O, & Okedu, E. K, A Critical Review of Grid Operations in Nigeria, Pacific Journal of Science and Technology, 2009.
[7] Gupta, B. R., Power System Analysis and Design, 1998.
[8] Ademola, A, Awosope, C.O.A, Adoghe, A.U & Okelola, M. O., Reliability Analysis of Circuit Breaker in the Nigerian 330-kV Transmission Network, 2014.
[9] A. S. Alayande, A. A. Jimoh & A. A. Yusuff, Voltage Profile Enhancement and Loss Reduction in Weak Meshed Networks, Proceedings of the IA STED International Conference, Power and Energy Systems (AfricaPES 2014), Gaborone, Botswana, September 2014.
[10] A. A. Fouad, V. Vittal and T.K.Oh, “Critical energy for the direct transient stability assessment of multi-machine power systems”, IEEE Trans.1984.
[11] L. Gyugyi, “Dynamic compensation of AC transmission line by solid-state synchronous voltage sources”, IEEE Trans. on Power Delivery, Vol. 9, No. 2, 1994.
[12] Kothari, M.L. and Tambey, N., Unified Power Flow Controller (UPFC) Based Damping Controller for Damping Low Frequency Oscilliation in a Power System, 2003.


![Karnacki wearables 3_ways-20150402[1]](https://img.pdfslide.us/doc/110x75/55c047d9bb61ebcc398b4679/karnacki-wearables-3ways-201504021.jpg)