Embed Size (px)
Citation preview

Tommi Ristinen
Expert Elicitation in TechnologyReadiness Assessment
Faculty of Electronics, Communications and Automation
Thesis submitted for examination for the degree of Master ofScience in Technology.
22.10.2010
Thesis supervisor:
Prof. Jouko Lampinen
Thesis instructor:
D.Sc.(Tech.) Laura Kauhanen
A’’ Aalto UniversitySchool of Scienceand Technology

aalto-yliopisto
teknillinen korkeakoulu
diplomityön
tiivistelmä
Tekijä: Tommi Ristinen
Työn nimi: Asiantuntijamielipiteiden hyödyntäminen teknologian valmiustasonmäärityksessä
Päivämäärä: 22.10.2010 Kieli: Englanti Sivumäärä:10+73
Elektroniikan, tietoliikenteen ja automaation tiedekunta
Professuuri: Laskennallinen tekniikka Koodi: S-114
Valvoja: Prof. Jouko Lampinen
Ohjaaja: TkT Laura Kauhanen
Tässä työssä käsitellään asiantuntijamielipiteiden hyödyntämistä teknologianvalmiustason määrityksessä. Työssä suunnitellaan ja toteutetaan prosessi sekäkäytännön työkalu asiantuntija-arvioiden hankkimiseen, analysointiin ja ra-portointiin. Asiantuntijamielipiteet kerätään sähköpostikyselyiden avulla jasyötetään analyysiä varten kehitettyyn ohjelmaan, joka tiivistää tiedon hel-posti ymmärrettäviksi kuviksi ja tunnusluvuiksi. Työssä vertaillaan eri ana-lyysimenetelmiä ja niiden paremmuutta sekä arvioidaan yleisesti asiantunti-jamielipiteiden hyödyntämisen luotettavuutta ja prosessiin liittyviä harhoja.Erot erilaisten analyysimenetelmien välillä todetaan varsin pieniksi ja tärkeim-mät huomion kohteet asiantuntijamielipiteiden hyödyntämisessä liittyvät datankeräykseen ja epävarmuustekijöiden arviointiin ja niiden minimointiin. Lopputu-loksena työssä toteutettu prosessi ja analyysiohjelma ovat käyttökelpoinen jatoimiva tapa teknologian valmiustason määritykseen.
Avainsanat: teknologian valmiustason arviointi, teknologia-arviointi, asiantun-tijamielipiteiden hyödyntäminen, asiantuntijamielipide, päätösana-lyysi, latenttimuuttujamalli, ordinaaliasteikko

aalto university
school of science and technology
abstract of the
master's thesis
Author: Tommi Ristinen
Title: Expert Elicitation in Technology Readiness Assessment
Date: 22.10.2010 Language: English Number of pages:10+73
Faculty of Electronics, Communications and Automation
Professorship: Computational Engineering Code: S-114
Supervisor: Prof. Jouko Lampinen
Instructor: D.Sc.(Tech.) Laura Kauhanen
This thesis covers expert opinion elicitation for Technology Readiness Assessment.A process and a tool is designed and implemented for obtaining, analysing andreporting expert opinion. The experts are contacted by web questionnaires andthe data is inputted in the analysis program, which composes the data in easily in-terpretable diagrams and �gures. This thesis compares di�erent analysis methodsin terms of their performance and discusses in general the usage of expert opinion,its reliability and related biases. The di�erences between the analysis methodsare found to very small and most important indications of the �nal results arethat most attention in expert elicitation should be paid to collection of data andestimating and minimising the uncertainties in the process. In conclusion, theprocess and analysis tool developed in this thesis are a practical and well workingtechnique for Technology Readiness Assessment.
Keywords: Technology Readiness Level, Technology Readiness Assessment, ex-pert elicitation, expert opinion, decision analysis, latent variablemodel, ordinal data
iv
Preface
This work was done at Spinverse Oy as part of my studies in the Department ofBiomedical Engineering and Computational Science of Aalto University. The workis closely related to European Commission FP7 funded project ObservatoryNANO.The thesis was instructed by Dr. Laura Kauhanen at Spinverse and supervised byProf. Jouko Lampinen at the Aalto University.
I would like to express my gratitude to Laura Kauhanen for all guidance and dedi-cation throughout the whole process. I also want to thank Jouko Lampinen for hissupervision and valuable comments and Tom Crawley from Spinverse for his help inde�ning the work and making it possible altogether.
Finally, I want to thank Riikka and my parents for supporting me during the wholecourse of my studies.
Otaniemi, 22.10.2010
Tommi Ristinen

v
Contents
Abstract (in Finnish) ii
Abstract iii
Preface iv
Contents v
List of Figures viii
List of Tables ix
Abbreviations x
1 Introduction 11.1 General introduction . . . . . . . . . . . . . . . . . . . . . . . . . . . 11.2 Concept of technology readiness . . . . . . . . . . . . . . . . . . . . . 3
1.2.1 Technology in this context . . . . . . . . . . . . . . . . . . . . 31.2.2 Technology Readiness Level and technology impact . . . . . . 6
1.3 Technology assessment . . . . . . . . . . . . . . . . . . . . . . . . . . 81.3.1 Introduction to technology assessment . . . . . . . . . . . . . 81.3.2 Key methodology . . . . . . . . . . . . . . . . . . . . . . . . . 101.3.3 Summary and integration of methods . . . . . . . . . . . . . . 14
1.4 Use of expert opinion in decision analysis . . . . . . . . . . . . . . . . 151.4.1 Decision analysis . . . . . . . . . . . . . . . . . . . . . . . . . 151.4.2 Expert use in decision analysis . . . . . . . . . . . . . . . . . . 171.4.3 Assessment of uncertainty . . . . . . . . . . . . . . . . . . . . 181.4.4 Sources of bias . . . . . . . . . . . . . . . . . . . . . . . . . . 191.4.5 Summary and implications . . . . . . . . . . . . . . . . . . . . 20
1.5 Expert opinion aggregation . . . . . . . . . . . . . . . . . . . . . . . . 211.5.1 Measuring and modeling expert opinion . . . . . . . . . . . . 211.5.2 Axiomatic and Bayesian models . . . . . . . . . . . . . . . . . 241.5.3 Measures for rater agreement . . . . . . . . . . . . . . . . . . 261.5.4 Latent variable models for ordinal data . . . . . . . . . . . . . 261.5.5 Subjective logic . . . . . . . . . . . . . . . . . . . . . . . . . . 281.5.6 Other methods . . . . . . . . . . . . . . . . . . . . . . . . . . 30
2 Method 312.1 Introduction to methodology . . . . . . . . . . . . . . . . . . . . . . . 312.2 Requirements speci�cation . . . . . . . . . . . . . . . . . . . . . . . . 312.3 Data . . . . . . . . . . . . . . . . . . . . . . . . . . . . . . . . . . . . 33
2.3.1 Collection and description . . . . . . . . . . . . . . . . . . . . 332.3.2 Interpretation and analysis . . . . . . . . . . . . . . . . . . . . 36
2.4 Modeling . . . . . . . . . . . . . . . . . . . . . . . . . . . . . . . . . . 382.4.1 Multinomial and weighted multinomial models . . . . . . . . . 38
vi
2.4.2 Judge-speci�c model . . . . . . . . . . . . . . . . . . . . . . . 392.4.3 Intraclass correlation based model - "ICC" . . . . . . . . . . . 402.4.4 Rater behaviour based model - "Ratings" . . . . . . . . . . . . 412.4.5 Subjective logic . . . . . . . . . . . . . . . . . . . . . . . . . . 41
2.5 Reliability . . . . . . . . . . . . . . . . . . . . . . . . . . . . . . . . . 442.5.1 Sensitivity analysis . . . . . . . . . . . . . . . . . . . . . . . . 442.5.2 Veri�cation and validation . . . . . . . . . . . . . . . . . . . . 452.5.3 Estimating and reducing uncertainty and bias . . . . . . . . . 46
2.6 Implementation . . . . . . . . . . . . . . . . . . . . . . . . . . . . . . 47
3 Results 483.1 Comparison . . . . . . . . . . . . . . . . . . . . . . . . . . . . . . . . 483.2 Reliability, robustness and sensitivity . . . . . . . . . . . . . . . . . . 503.3 Final estimates . . . . . . . . . . . . . . . . . . . . . . . . . . . . . . 543.4 Validation of results: case universal memory . . . . . . . . . . . . . . 563.5 Other means for estimating technology readiness level . . . . . . . . . 58
4 Discussion 604.1 Process . . . . . . . . . . . . . . . . . . . . . . . . . . . . . . . . . . . 604.2 Methodology . . . . . . . . . . . . . . . . . . . . . . . . . . . . . . . 614.3 Future research . . . . . . . . . . . . . . . . . . . . . . . . . . . . . . 62
References 64
Appendix A 68
Appendix B 70
Appendix C 71
Appendix D 73

vii
List of Figures
1 ObservatoryNANO TRL scheme (left) corresponding to the defencestandard nine-point scheme (NASA, right)(ObservatoryNANO, 2010d) 7
2 A Framework for Technology Futures Analysis shows relations be-tween business or public policy, decision makers and decision studies.The outputs of TFA are used to e.g. increase awareness or inputs inpolicy making and the �ndings may be the starting point for a newTFA study. Adapted from Porter et al. (2004). . . . . . . . . . . . . . 9
3 The evaluation and organisation of futures research methodology adaptedfrom Aaltonen (2009). The �gure shows relative position of relevantfutures research methodology regarding this work in terms of natureof the system and level of ambiguity. . . . . . . . . . . . . . . . . . . 10
4 A decision-analysis process �owchart adapted from (Clemen, 1996).The process is followed in the structure of this study. . . . . . . . . . 16
5 Normal latent trait for four category ordinal data. Numbered x axisdenotes the true value of the measured variable and the letters be-tween vertical lines (cuto� points) mark the ordinal categories. . . . . 27
6 Example of a frame of discernment (Jøsang and Knapskog, 1998).Each xi presents an elementary state for which the belief, disbelief anduncertainty is de�ned by 9. Elementary states can also be overlappingand subjective logic provides operators for computing the opiniontuple for any combination (union, intersection, etc.) of the elementarystates. . . . . . . . . . . . . . . . . . . . . . . . . . . . . . . . . . . . 29
7 Triangle showing the opinion space in subjective logic. Adapted fromJøsang and Knapskog (1998). Variable ω denotes the opinion de�nedin equation 9. . . . . . . . . . . . . . . . . . . . . . . . . . . . . . . . 29
8 Mapping of TRL data to subjective logic framework. The dots rep-resent the e�ect of uncertainty in the values of belief and disbelief.When uncertainty approaches 1 in the top corner of the triangle, thenumerical di�erences in belief values between di�erent categories be-come smaller. Therefore opinions with high uncertainty possess lessinformation than opinions with low uncertainty. . . . . . . . . . . . . 42
9 Median Absolute Percentage Error (MAPE) (a) and Median Abso-lute Deviation (MAD)(b) for estimates of methods compared. Cleargroups with di�erent performance levels are present in �gure (a)whereas the results in (b) are more dispersed. Both measures, how-ever, lead to same conclusion of methods' performances. . . . . . . . . 51
10 MAPE for TRL 1 probability of Nanoimprint lithography as functionof number of respondents. Sampling with replacement (bootstrap),number of samples 100. . . . . . . . . . . . . . . . . . . . . . . . . . . 52

viii
11 Distribution of the �nal estimate of TRL 1 for Nanoimprint lithogra-phy. (a) Sampling with replacement (bootstrap), (b) sampling with-out replacement. Number of samples 100. The most averaging sub-jective logic variant has least variation whereas the basic subjectivelogic has most variation. . . . . . . . . . . . . . . . . . . . . . . . . . 53
12 Final estimates obtained by the tool. Analysis method used is sub-jective logic . . . . . . . . . . . . . . . . . . . . . . . . . . . . . . . . 54
13 Final estimates obtained by the tool for Universal Memory technolo-gies. Original �gure provided by the tool slightly modi�ed manuallyin order to �t it in report template. Circle size denotes the number ofrespondents to the questionnaire, which is directly related to reliabil-ity of the results. Therefore the conclusion for RRAM, PCRAM andMRAM can be considered most reliable. Red color used shows whatare the most potential technologies according to qualitative feedbackfrom the experts. The number inside circles tells the median estimateof time to market entry or maturation. . . . . . . . . . . . . . . . . . 57
A.1 Data on TRL related claims for printed electronic manufacturingtechnologies: Nanoimprint lithography (a) and ink-jet printing (b) . . 68
A.2 Data on TRL related claims for printed electronic manufacturingtechnologies: gravure printing (a) and �exography printing (b) . . . . 69
ix
List of Tables
1 NASA de�nition of Technology Readiness Levels (DoD, 2009; Mank-ins, 1995) . . . . . . . . . . . . . . . . . . . . . . . . . . . . . . . . . 6
2 Classi�cation of scales of measurement (Stevens, 1946) . . . . . . . . 233 Response rates for questionnaires conducted . . . . . . . . . . . . . . 354 Basic statistics for printed electronics data. Barplots of category fre-
quencies for each technology can be found in Appendix A. . . . . . . 375 Sample data for TRL 1 of Nanoimprint lithography in printed elec-
tronics . . . . . . . . . . . . . . . . . . . . . . . . . . . . . . . . . . . 376 Suggested TRL interpretation scheme. The pattern describes ordinal
category frequencies for: strongly agree-moderately agree-moderatelydisagree-strongly disagree. The sum of probabilities exceeds 100% dueto rounding. . . . . . . . . . . . . . . . . . . . . . . . . . . . . . . . . 38
7 The e�ect of models in comparison to the basic multinomial model.The �rst row indicates the share of individual TRL scores being closerto neutral opinion. The second row contains the average e�ect ofthe model: e.g. -4% means that on average subjective logic scoreswere 4 percentage points closer to neutral than with the basic model.Notable deviations from expected value labeled by exclamation marks. 49
8 Results broken down on the level of individual technologies show thatnanoimprint lithography is drawn most aggressively towards neutralvalues. Weighed multinomial model on the other hand provides moreextreme results for each technology. ICC and Judge-speci�c modelsprovide the most robust results in broad sense. Notable deviationsfrom expected value labeled by exclamation marks. . . . . . . . . . . 49
9 Impact values for nanoscale printing technologies for the moment be-ing and at estimated time of market entry. Resulting impacts areplotted in �gure 12 . . . . . . . . . . . . . . . . . . . . . . . . . . . . 55
10 TRL level estimates on di�erent decision limits. The limit settinggreatly a�ects the results, which need to be considered when analysingthe results. . . . . . . . . . . . . . . . . . . . . . . . . . . . . . . . . . 55
11 TRL level estimates on di�erent decision limits. The limit settinggreatly a�ects the results, which need to be considered when analysingthe results. . . . . . . . . . . . . . . . . . . . . . . . . . . . . . . . . . 56
12 Estimating TRL by year estimates. Experts gave their answer onscale {Now, 1-3 years (Short), 4-7 years (Medium), Later (Long),Never}. The scale is also transformed to numerical values and meansare calculated for the values. TRL estimated from expert given yearestimates gives slightly more optimistic results than the detailed claims. 58
B.1 A simple taxonomy of Futures Research Methods (Glenn and Gordon,2009) . . . . . . . . . . . . . . . . . . . . . . . . . . . . . . . . . . . . 70
D.1 Full results of method comparisons for the printed electronics data . . 73

x
Abbreviations
AHP Analytic Hierarchy ProcessCBRAM Conductive Bridging RAMCEO Chief Executive O�cerCNT RAM Carbon Nanotube RAMCTO Chief Technology O�cerCTE Critical Technology ElementDoD United States Department of DefenseESA European Space AgencyFeRAM Ferroelectric RAMFLE Flexography printingGRA Gravure printingICC Intraclass Correlation Coe�cientICT Information and Communication TechnologyIRL Innovation Readiness LevelINK Ink-jet printingMAD Mean Absolute DeviationMAPE Mean Absolute Percentage ErrorMCMC Markov Chain Monte CarloMRAM Magnetoresistive RAMMRL Manufacturing Readiness LevelMSA Measure System AnalysisNASA National Aeronautics and Space AdministrationNIL Nanoimprint LithographyPCRAM Phase-change RAMQD RAM Quantum dot RAMR&D Research and DevelopmentRAM Random Access MemoryRRAM Resistive RAMRDM Robust DecisionmakingSL Subjective logicSONOS Silicon-Oxide-Nitride-Oxide-SiliconSRL System Readiness LevelTFA Technology Futures AnalysisTRA Technology Readiness AssessmentTSA Technology Sequence AnalysisTRL Technology Readiness LevelVAS Visual Analog Scale

1 Introduction
1.1 General introduction
The knowledge of technological development stage is crucial in all decision makingrelated to emerging technologies. Moreover, the assessment of technological devel-opment stage is a di�cult decision making problem itself mainly due to data andinformation available for decision making. There is a huge amount of informationavailable in the form of patents, scienti�c publications and news articles but it isvery di�cult for the decision maker to �nd the relevant information for the problemin hand.
Technology Readiness Assessment (TRA) is a concept developed by NASA in the1970s for risk management purposes in research and technology development pro-grammes (Mankins, 2009). The aim of TRA is to �nd out the Technology ReadinessLevel (TRL) for all technologies in a system (e.g. a space shuttle) and the infor-mation of individual TRLs is used for estimating whether the system is ready tobe used in missions. The TRL is de�ned on a nine point scale ranging from theobservation and reporting of basic scienti�c principles to the actual system provento work through successful mission operations. The basic idea behind the scale isthat a system consisting of components still under development is more likely tofail than a system consisting of components that are proven to work in previousmissions.
Among many other organisations, the concept of TRLs has been adopted by the Eu-ropean Commission's ObservatoryNANO project1, which aims to support Europeandecision makers with information and analysis on developments in nanoscience andnanotechnology. The �nal goal of the project is to provide ongoing and indepen-dent support to European decision makers by analysing scienti�c and technologicaltrends as well as economic realities and expectations. This information is used tohelp the EU make strategic judgements on funding priorities, prioritise research andtechnology development programmes and provide investors with early indicators ofopportunities.
Within the ObservatoryNANO project, there is a need for assessing the TRL as wellas the potential impact of certain nanotechnologies. TRL scale used by the projectresembles the NASA scale but is simpli�ed to �ve levels due to more market orientedand more future looking approach of the project. Most of the technologies assessedby the project are still in very early stage of development but it is necessary fordecision makers in Europe to know what are the technologies that will have highestimpact in �ve to twenty years of time and what will be their impact for applicationsand the community.
So far, most of the TRL assessment has been based on interviews and desk researchconducted by analysts. The sources of information include patents and scienti�c
1http://www.observatorynano.eu/project/
2
publications along with statistical information from respective databases. Most ofthe analyst work and decision making is, however, based on subjective opinions.TRL assessment conducted by a single analyst both takes a lot of time and issubject to many sources of bias and uncertainty. This study aims to create a moresystematic and automatic process for the TRL assessment and provide a simpletool for conducting the TRL analysis quickly, economically and reliably. The toolis intended to visualise the technological development stage by linking together theTRL and technology impact in a visually e�ective way. The manual analyst work,however, cannot be fully replaced by an automatic tool but the goal is rather tosupport the TRL assessment process by providing information in a compact form.This information is then supported by links to relevant publications and descriptionsrelated to the technologies being assessed.
Technology assessment can be considered as a part of larger �eld of futures researchwhere one aim is to �nd out how technological development will a�ect the soci-ety. Technology Futures Analysis (TFA) and futures research methodology includegeneral decision support methods for various purposes. Along with NASA's TRAscheme, they represent the background of this study in the sense of collecting andanalysing data for future looking decision making problems. Relevant methodologyfor TRL assessment is very diverse including quantitative, qualitative, normativeand exploratory methods as well as di�erent kinds of mixtures of these. Section 1.2of this study gives a general introduction to the concept of technology readiness andTRL from both NASA and ObservatoryNANO project point of view. Methodologyused for TFA and futures research is reviewed in section 1.3 in order to �nd outwhat kind of approaches have been successful for decision making problems similarto this study.
The use of expert opinion is important to decision making problems where littleor no data is available or it is very di�cult to use. This applies for this study,as there is no clear set of data describing the TRL of a certain nanotechnology,for instance quantum dot technology for optical interconnects in microprocessorchips. A straightforward approach is to use relevant experts such as researchers inuniversities, research organisations and companies to give their assessment on thetechnological development stage on a quantitative scale. The use of expert opinionhas been widely studied in literature which is reviewed in section 1.4. This includesan introduction to decision analysis and expert use, modeling of uncertainties andbias as well as presenting relevant methodology that will be used in section 2.
The aim of this study is to develop a robust decision making process and tool forTRL assessment for the ObservatoryNANO project. This includes designing of aweb questionnaire for expert data collection, developing a method for analysing andreporting the data and producing the analysis along with estimation of di�erentuncertainties in the process. Moreover, this study aims to �nd out whether there isa need for advanced mathematical methods for combining expert opinion or if simpleaggregation schemes such as calculating the average of expert opinion is enough.
Section 2 of this study speci�es the requirements for the tool, introduces the data

3
and its collection process, presents di�erent methods for analysing the data andassessing the reliability of the results. The results, that is TRL and technologyimpact estimates, for three technology areas are presented in Section 3. Technolo-gies assessed as part of this study are printed electronics manufacturing technolo-gies, nanostructures for on-chip and chip-to-chip optical interconnects and universalmemory technologies. Discussion and suggestions for future research are in section4.
1.2 Concept of technology readiness
1.2.1 Technology in this context
In order to assess technological readiness, the term technology needs to be de�ned.The European Space Agency de�nes technology as our species' ability to make anduse new tools: "Technology is the practical application of knowledge so that some-thing entirely new can be done, or so that something can be done in a completelynew way" (ESA, 2009). Another de�nition by Merriam-Webster Online Dictionary(2010b) de�nes technology as "a capability given by the practical application ofknowledge" and "a manner of accomplishing a task especially using technical pro-cesses, methods, or knowledge". Di�erent �elds of technology include informationand communication technology or ICT, construction technology and energy technol-ogy to name a few. On the other hand the word technology can be found in di�erentfunctions such as manufacturing technology, measurement technology or materialstechnology.
Another concept closely related to technology is science. By the de�nition ofMerriam-Webster Online Dictionary (2010a), science means "knowledge or a sys-tem of knowledge covering general truths or the operation of general laws especiallyas obtained and tested through scienti�c method" and "such knowledge or such asystem of knowledge concerned with the physical world and its phenomena". Dif-ferent �elds of science include physics, chemistry or information sciences and dealwith, for instance, theories about di�erent physical properties and interactions. Ina nutshell, science is about knowledge of the physical world and its phenomena andtechnology is the practical application of this knowledge for accomplishing tasks andsolving problems.
Nanotechnology is a relatively new area of technology that originates from the 1950s.In 1959, Richard Feynman gave his famous speech where he presented a technolog-ical vision of extreme miniaturisation (Bhushan, 2006). However, the emergence ofappropriate methods of fabrication of nanostructures in 1980s made a number ofsigni�cant technological developments possible. In a nutshell, nanotechnology canbe de�ned as dealing with various structures of matter having dimensions of theorder of a billionth of a meter (1 × 10⁻⁹m = 1nm) (Poole et al., 2003). Nanoscalestructures as themselves are not a novel thing as they exist in nature but controllingthe matter at nanoscale provides novel properties of materials that are not present

4
in the larger scales. Nanoparticles are aggregates of atoms bonded together witha radius between 1 and 100nm (Bhushan, 2006). In summary, nanotechnology hasbeen de�ned by National Nanotechnology Initiative as "Research and technologydevelopment at the atomic, molecular or macromolecular levels, in the length scaleof approximately 1 - 100 nanometer range, to provide a fundamental understandingof phenomena and materials at the nanoscale and to create and use structures, de-vices and systems that have novel properties and functions because of their smalland/or intermediate size" (Roco, 2001).
For assessing the technological development stage, there must be a distinction be-tween nanoscience and nanotechnology. An application focused approach is used inthis study because it o�ers a practical starting point for de�ning technology areasand furthermore the questions in expert elicitation. In this approach, a nanoscalefeature or structure is not meaningful alone and it requires an application or aproblem its solves. This can be, for instance, a novel feature that nanotechnologyenables for given technology area or performance increment that cannot be achievedusing non-nanotechnology. A few examples of technology de�nitions in this studyare given below.
Technology areas assessed as part of this study include printed electronics, opticalinterconnects and universal memory technologies. Printed electronics is about print-ing electronic systems on a substrate by methods similar to conventional printingtechniques (ObservatoryNANO, 2010c). Printed electronics as a whole is not nan-otechnology but nanotechnology will likely have a positive e�ect on various printedelectronics applications as it provides miniaturisation of printed devices and novelfeatures as well as o�ers cost savings and performance increase. Optical intercon-nect technology is used for data transmission in very short range connections suchas on and between microprocessor chips (ObservatoryNANO, 2010b). Due to na-ture of light, optical interconnects are naturally nanotechnology. Universal memorytechnologies are a group of emerging technologies that potentially o�er very highspeed operation, high density storage and non-volatility with low power consumption(ObservatoryNANO, 2010a).
There are several �elds of nanoscience that are present in printed electronics, opticalinterconnects and universal memory. For all these, relevant �elds of nanoscience in-clude (but are not limited to) semiconductor physics, materials science and nanopho-tonics. All of these areas are, however, too broad for conducting Technology Readi-ness Assessment. For example, quantum dots are a three dimensional nanostructure(sometimes referred as a nanomaterial) that can be fabricated of various materialssuch as Silicon or III-V semiconducting materials. Quantum dots are a discoveryoriginating from scienti�c research but they have no relevance as such and thereforeit does not make sense to assign a TRL for them.
As technologies are closely related to application of science, a fruitful viewpointfor choosing technologies to be assessed is to start from the real applications. Inthis approach, a discovery typically from scienti�c research is applied to some realworld challenge, which eventually de�nes a nanotechnology for which Technology

5
Readiness Assessment is feasible. Quantum dots can be applied in several areas ofnanotechnology, for instance in optical interconnects or photovoltaics. Moreover,the material used for fabrication of quantum dots is also important and with theseconstraints a nanotechnology called "Silicon quantum dot laser" can be de�ned.Similarly "Quantum dot laser based on III-V materials" makes sense.
As a fundamental feature of nanotechnology is that controlling the matter in nanoscalechanges the properties of matter, the role of materials in de�ning nanotechnologiesis di�cult. A good example are nanoparticle inks, which are used for printed elec-tronics. As the properties of the ink depend on the material used in the ink and thediameter of particles, conducting Technology Readiness Assessment does not makesense for nanoparticle inks. If one were to assess and compare the technologicalreadiness of nanoparticle inks, there would be in theory in�nite amount of di�erenttechnologies for assessment.
In conclusion, the following list of nanotechnologies are assessed and used as practicalexamples for developing the TRA framework:
• Manufacturing technologies for nanoscale printed electronics
� Roll-to-roll nanoimprint lithography
� Ink-jet printing
� Gravure printing
� Flexography printing
• Nanotechnologies/nanostructures for optical interconnects
� Quantum wells of Silicon
� Quantum dots of Silicon
� Quantum wells of III-V materials
� Quantum dots of III-V materials
� High index-contrast structures (e.g. photonic crystals)
� Surface plasmon polaritons
• Universal Memory technologies
� Magnetoresistive RAM (MRAM)
� Phase-change RAM (PCRAM)
� Ferroelectric RAM (FeRAM)
� Resistive RAM (RRAM)
� SONOS
� Conductive Bridging RAM (CBRAM)
� Carbon nanotube based RAM (CNT RAM)
� Quantum dot RAM (QD RAM)
� Racetrack memory

6
1.2.2 Technology Readiness Level and technology impact
The success of advanced technology research and development (R&D) e�orts is cru-cial for the development of new system capabilities. The main challenges any systemdevelopment project face inevitably are related to performance, schedule and bud-get. The National Aeronautics and Space Administration (NASA) introduced theconcept of Technology Readiness Levels (TRLs) in the mid 1970's to allow more ef-fective assessment of, and communication regarding the maturity of new technologies(Mankins, 2009). Technology Readiness Assessment (TRA) is a formal, systematic,metrics-based process for assessing and reporting the maturity of technologies. TheUnited States Department of Defense (DoD) and NASA use TRA for assessing thematurity of certain technologies called Critical Technology Elements (CTEs) to beused in systems. TRLs are the metric used assessing the maturity of CTEs and theyare based on a scale from one through nine (see table 1)(DoD, 2009). In additionto measuring the technological development stage, TRLs provide a systematic mea-surement system for consistent comparison of maturity between di�erent types oftechnology (Mankins, 1995).
Table 1: NASA de�nition of Technology Readiness Levels (DoD, 2009; Mankins,1995)
TRL Description1 Basic principles observed and reported2 Technology concept and/or application formulated3 Analytical and experimental critical function and/or characteristic
proof-of-concept4 Component and/or breadboard validation in laboratory environment5 Component and/or breadboard validation in relevant environment6 System/subsystem model or prototype demonstration in a relevant
environment7 System prototype demonstration in an operational environment8 Actual system completed and quali�ed through test and demonstra-
tion9 Actual system proven through successful mission operations
As the concept of TRL has originated from military organisations and defence in-dustry, it is still mostly used for such applications. Organisations using TRLs as atool for managing their research and development e�orts include national defenceorganisations such as UK Ministry of Defence (UK MOD, 2010), NATO, AustralianDefence Organisation and recently the Turkish defence industry (Altunok and Cak-mak, 2010). The main reason for using TRLs in military organisations is technologyrelated risk management for multiple interdependent technologies. The users amongthese organisations include especially the technology management and systems en-gineering.
In addition to defence organisations, both the European Space Agency (ESA) and

7
NASA in United States are among the users of TRLs. Both use TRLs for technol-ogy risk management that is especially important for missions in space. In industry,TRLs have been applied by Institut national d'optique and Brio Conseils in Canadaand by Network Rail in the United Kingdom. The former uses TRLs for technol-ogy transfer and managing innovation e�ciently. Bene�ts can be found in projectmanagement, business development, intellectual property strategies and resourcesallocation. The latter employs TRLs as part of new product introduction processwith business bene�ts, safety assurance, asset protection and supply diversity.
For some uses, the concept of TRL has been considered too restrictive and similarapplication speci�c measures are suggested to solve this issue. These include Manu-facturing Readiness Levels (MRL), System Readiness Levels (SRL) and InnovationReadiness Level (IRL). These measures extend the original TRL framework and arenot considered any further in this study.
Di�erent organisations use TRLs for di�erent purposes and a few parallel systemsfor measuring TRLs are used. NASA and DoD use a 9 level scale, which is mainlyused for risk management purposes in technology development. The de�nition ofTRLs used by NASA and DoD are listed in table 1. The ObservatoryNANO projectuses a simpler 5 level scheme that is more suitable for market oriented technologyassessment because it describes the technology readiness by intuitively named levelsthat are easy to understand. The downside in the 5 level scheme is that there a lotof di�erent operations performed under each TRL and transitions between di�erentlevels require a large e�ort. The mapping between the schemes can be found in�gure 1.
Figure 1: ObservatoryNANO TRL scheme (left) corresponding to the defence stan-dard nine-point scheme (NASA, right)(ObservatoryNANO, 2010d)
The �rst level in ObservatoryNANO scale is fundamental research that correspondsto the �rst level in NASA scale. Fundamental research phase includes the observa-tion and reporting of basic principles of the technology. Applied research phase (lev-

8
els 2-5 in NASA scale) includes formulation of the technology concept and demon-strating the main components of the technology in both laboratory and relevantenvironments. The prototype level includes prototype demonstration in a relevantand in the �nal operating environment, which are levels 6 and 7 in the NASA scale.Despite very di�erent naming schemes for the last two levels of technology readiness,the same idea exists behind both ObservatoryNANO and NASA scales. The secondto last level, "Market entry" or "Flight quali�cation" means that the actual productor system is successfully demonstrated in its �nal operating environment. Similarlythe last TRL, either "Mature markets" or "Flight proven" means that the technol-ogy is successfully operated in the �nal operating environment for several times.Mature markets phase also implies that there are several technology providers inthe market.
NASA's TRL calculator2 originated from the need to have a standard, consistentmethod for assessing and implementing the TRLs. The TRL Calculator attemptsto address the issue of lacking guide on "How to use TRLs" by providing technologyprogram managers with a tool that can be used to provide a snapshot of technologymaturity at a given point of time (Nolte et al., 2003). According to a survey byGraettinger et al. (2002), TRLs account to 30% of the factors needed in makingtechnology selections and in total up to 50 di�erent factors need to be consideredin technology transfer from university research to commercial use. The authors didnot manage to �nd any commercially available tool suitable for DoD in their TRA.Statistical validity of the TRL Calculator has not been demonstrated and Nolteet al. (2003) suggests that a formal validation should be performed.
1.3 Technology assessment
1.3.1 Introduction to technology assessment
Technology Readiness Assessment can be considered a part of a broader area of Tech-nology Futures Analysis. According to Porter et al. (2004) the analysis of emergingtechnologies and their implications are vital to today's economies, societies andcompanies. Decision makers in organisations need to be well-informed in order toprioritising research and development (R&D) e�orts, understanding and managingrisks, exploiting intellectual property and enhancing technological competitiveness.
Multiple, often overlapping methodologies are used for technology intelligence, fore-casting, roadmapping, assessment and foresight. Porter et al. (2004) introducethe umbrella concept Technology Futures Analysis (TFA) to cover the �eld oftechnology-oriented forecasting methods and practices. They divide the �eld into"Technology foresight", "Technology forecasting" and "Technology assessment".TFA itself intersects with a wider concept of futures research. Most methodol-ogy used for futures research can be applied in technology futures analysis, too
2The most recent version of the calculator can be found in https://acc.dau.mil/
CommunityBrowser.aspx?id=25811&lang=en-US

9
and technology futures analysis can be considered as a subset of futures research.A framework of TFA in Fig. 2 summarises the inputs, outputs, applications andrelationships between di�erent players of the TFA process.
Figure 2: A Framework for Technology Futures Analysis shows relations betweenbusiness or public policy, decision makers and decision studies. The outputs of TFAare used to e.g. increase awareness or inputs in policy making and the �ndings maybe the starting point for a new TFA study. Adapted from Porter et al. (2004).
As their primary reference of Technology Futures Analysis, Porter et al. use the Fu-tures Research Methodology V2.0 (version cited is V3.0)(Glenn and Gordon, 2009)by the United Nations' Millennium Project. The book includes a large collectionof futures research methods for various di�erent situations where forecasting the fu-ture is necessary. A simple taxonomy suggested by the book suggests classifying themethods in quantitative, qualitative, normative and exploratory categories. Thisclassi�cation and listing of methods included in the book can be found in AppendixB.
Another way for classifying and organising futures research methodology is suggestedby Aaltonen (2009). Aaltonen classi�es the methods in a two by two matrix (Fig.3) which includes the means of controlling or directing the system on horizontaldimension and nature of possible understanding of system on vertical dimension.The measure used in the evaluation of controlling or directing the system is basedon the level of ambiguity of the results. The nature of possible understanding takes

10
into account the standpoint of the researcher trying to understand the system. Withdesigned systems the expert can stand outside the system whereas with emergentsystems the system cannot be understood or managed as a whole by the researcher.This is because the system emerges through the interaction of the agents involved:people, processes, technology, etc.
Figure 3: The evaluation and organisation of futures research methodology adaptedfrom Aaltonen (2009). The �gure shows relative position of relevant futures researchmethodology regarding this work in terms of nature of the system and level ofambiguity.
1.3.2 Key methodology
This section presents relevant key methodology for futures research. The methodsintroduced in this section will not be used as such later on in this thesis but theyprovide an important insight to the methodology used in similar forecasting or tech-nology assessment problems. All methods have both advantages and disadvantagesfor any given decision making problem and therefore they provide a valuable inputfor the development of e�cient methodology. Descriptions of methods presented arebased on Glenn and Gordon (2009).
Delphi is a forecasting method using expert panels originally developed by RANDCorporation in the early 1960s. Delphi method begins with inviting a set of experts
11
from di�erent disciplines to participate in a study to establish a forecast on, forinstance, the date by which a manned Mars landing would occur. Delphi techniqueis based on several rounds of sequential questionnaires used for re�ning relevantquestions, providing new insights from the experts and �nally reaching a consensusbetween the expert panel. To eliminate biases in the process, there is no directexpert to expert interaction in Delphi and the communication between experts isachieved through the researchers.
The questions are �rst re�ned by the researchers conducting the study and presentedto each expert individually in a form of a questionnaire. The experts then providetheir feedback to the questionnaire, e.g. their judgement on the date of the Marslanding, and researchers analyse the results of the �rst questionnaire and presentthe range of opinions to the experts in the form of a second round questionnaire.The experts having extreme opinions are then asked to reassess their opinion andprovide reasons for their initial assessments. After the second round, researchersynthesises the group opinion and forms the third questionnaire based on it, whichis again presented to the group. Several rounds of questionnaires can be performedbut �nally the group opinion is expected to reach a consensus.
The Delphi methodology by no means provides statistically signi�cant results butits strength lies in the ideas it generates whether or not a consensus is reached. Itis di�cult to perform Delphi studies well and a great deal of time is required forexecuting multiple rounds of questionnaires. A lot of e�ort needs to be put in theselection of experts and designing the questionnaire.
Environmental scanning is a general monitoring procedure that is involved inall futures research in one way or another. Plans for future are typically based onforecasts and forecasts are based on assumptions. Environmental scanning systemsprovide information on future threats and opportunities as well as make it possibleto detect weak signals or get early warnings about important changes.
Environmental scanning is based on de�ning a set of sources from which the infor-mation on future is acquired. This information is then analysed and synthesised bya scanning team that forwards the conclusions to decision makers. Sources used inenvironmental scanning may include expert panels (e.g. Delphi), database litera-ture reviews, web based alert systems (e.g. Google Alerts or web crawlers), websites,electronic or hard-copy literature reviews, essays by experts or key person tracking.Requirements for the environmental scanning team are set by the decision makersand they also give feedback to the team for adjusting the scanning process and setof sources.
The work in ObservatoryNANO project can be considered environmental scanningas it combines information from multiple sources including literature, websites, ex-perts as well as scienti�c publication and patents databases. On the other hand,reports produced by ObservatoryNANO members could be used as part of a largerenvironmental scanning scheme.

12
Robust decisionmaking (RDM) is essentially what this study is all about. Inthe context of futures research, RDM is a theoretic framework aiming to makesystematic use of a large number of highly imperfect forecasts of the future. Insteadof probabilistic predictions, RDM tries to produce a best possible representationof the future using the information that is available. Robustness means that thepredictions given by RDM promise to do a reasonable job of achieving the decisionmakers' goals.
The methodology has been applied in a wide variety of decision problems includingdefence, climate change and science and technology planning. In summary, "RDMis an iterative, quantitative approach for identifying decision strategies whose goodperformance is relatively insensitive to key uncertainties facing decision makers andcharacterising the residual vulnerabilities of these strategies."
Technology Sequence Analysis (TSA) is a method for forecasting the timeof technology dependent system becomes available. This system based approachsomewhat resembles the TRL scheme used by NASA. The main di�erence is thatTRL scheme used by NASA assigns a TRL to all components of a system in orderto assess the technological risks related to the whole system. In TSA, the estimatesof time required to achieve intermediate technology steps are combined statisticallyto produce an estimate when the full system could become available. The TSA is atrademark of The Futures Group and therefore the software is not available to thepublic.
In TSA a model network of subsystems, components and related technologies isbuilt representing the structure of the system. The network uses boolean logicfor relationships (paths) between subsystems and technologies, which means that aworking subsystem may require multiple mature technologies (AND gate) or onlyone technology might be required (OR gate). In case of a harvesting robot, afully working system needs guidance technology, position sensing, ripeness sensing,cleaning technology and packaging technology. If one of these subsystems is missing,the robot is not functional. On the other hand, there is only need for one ripenesssensing technology, which could be one of hormonal content sensor, color sensor orodour sensor.
A typical TSA network may consist of hundreds of nodes and hundreds of pathsof either "AND" or "OR" relationship. The analysis is performed using a MonteCarlo method, which produces a probabilistic estimate of availability of intermediatetechnologies and components as well as the �nal system. TSA can be used forestimating the costs related to use of di�erent technologies, identifying technologicalrisks to be considered in R&D programmes and for estimating uncertainties in thedevelopment schedule. The TRL estimates produced by the methodology of thisstudy could be used as inputs for TSA. The main disadvantage, however, is thatacquiring large amount of data for building a network of hundreds of nodes andpaths is very costly.

13
Decision modeling is a very general framework that attempts to model the hu-man behaviour in decision making. It is based on identi�cation of speci�c criteria forthe decision task and assessing how well competing technologies meet those criteria.Each criteria is weighed by its relative importance and each technology is given ascore per criteria. In case of technology assessment, decision modeling can be usedfor estimating the market potential by comparing new technologies to current mar-ket requirements. Based on the criteria weightings and item scores, a compoundscore can be calculated for each technology.
The main weaknesses of decision modeling are related to the modeling process itself.First of all, identifying the criteria and their weights is not an easy task and psycho-logical factors distort the selection of what is important. A lot of information is alsoneeded for establishing the criteria and their weights. Moreover, the perceptions ofdecision makers and the markets or customers change over time and therefore boththe criteria and weights need to be evaluated again at a later point of time.
The main strength of decision modeling is that market research data can easily beused as an input. Both the decision criteria and their weights can be determined bycustomer feedback acquired through a questionnaire. This fact also promotes the useof questionnaires as a tool for this study. One practical example of decision modelingis the Analytic Hierarchy Process (AHP), which models the problem in hand as ahierarchy structuring decision into smaller parts. These parts can include social,political, technical and economic factors. The decision makers then perform theassessment by making simple pairwise comparisons on the lowest level of hierarchy,which result in the �nal high level assessment done by the software used. Using alight hierarchy for both TRL and technology impact is considered later on in thisstudy.
Patent analysis, publication analysis and text mining Patent and publica-tion analysis along with text mining share similar targets with methodology consid-ered in this study. They all aim at providing information on technology readinessby well de�ned processes and report their �ndings in compact form, for instance instatistical tables. Patent and publication analysis o�er a simple temporal perspec-tive for technology readiness by measuring the number of patents and publicationson a certain technology area during a period of time.
Publication count data is a purely quantitative measure of scienti�c productionbut its problem is that it does not capture scienti�c progress very well. Patentdata can be better used for measuring innovation but its main �aw is that everytechnological innovation does not receive a patent. Martin and Daim (2007). Despitetheir �aws, they are a good addition to any TRA process because they can beincluded in the process by relatively simple means and as the outputs are numerical,they can be used as independent variables in regression models. Moreover, patentand publication data can be used to produce time series on how the R&D e�orts ona certain technology have developed over time.
14
Text mining, or tech mining, is a bibliometric method that goes deeper than purepatent or publication analysis by taking into account the content of those documentsas well. Text mining for TRA can also include data sources such as news articles,commercial documents released by companies or even blogs from experts dedicatedto follow certain technology areas. The information sources for text mining canbe divided in ones tracking developments in fundamental research (e.g. publica-tion databases) and others in applied research (engineering oriented publications),invention (patent databases) and commercial application (product databases andmarketing data).
Text mining along with patent and publication analysis can be potentially a verypowerful tool for TRA. However, it faces signi�cant challenges in terms of costsof obtaining data, assessment of its credibility and the process for automating andusing the results obtained. The quality of results achieved by text mining is alsonaturally limited by the quality of data sources used. Subscription fees to the bestavailable patent and publication databases are very high, which limit the usability ofstatistical analysis for low intensity use. A practical implementation of text miningis presented in Britt et al. (2008), where automatic document classi�cation is usedfor Technology Readiness Level analysis achieving accuracy of 86%.
1.3.3 Summary and integration of methods
This section has presented a number of methods for assessing technology future andtechnology readiness. In conclusion, a complete TRA scheme would consist of amultitude of methods including environmental scanning, the use of expert opinionsuch as Delphi and quantitative methods in form of patent and publication analysisalong with text mining. All these methods are situated in the bottom of �gure3, which states that they try to understand the technology readiness by standingoutside the system.
Implementing statistical or decision making models moves the decision maker closerto the system and requires the decision making scheme to understand and model theinteractions between di�erent agents in the system. Technology sequence analysis,for instance, requires careful design when it comes to understanding the systemstructure and results in a model that de�nes interactions between components andsubsystems, which correspond to the agents in the system. In summary, the useof decision modeling techniques ultimately means that the decision maker needs tounderstand the relations between data and the technology under assessment well. Itis always easy to collect large amount of data using independent measures but thework becomes increasingly di�cult when a conclusion needs to made.
Technology readiness and estimated impact of new technologies are arguably a veryimportant part of predicting technology success. However, it is not only the tech-nological side that will determine what are the technologies having largest impactin future. Galbraith et al. (2006) develop a model for estimating technology successincluding a number of factors such as: company size, age, R&D strategy, external

15
funding, level of education of research team and formal partnerships. They achievealmost 50% goodness-of-�t with their model, where company age, technological de-velopment stage and amount of external funding (with a negative coe�cient) arethe most signi�cant variables. Company age and amount of external funding canin most cases be determined quite easily. Therefore the assessment of technologicaldevelopment stage is crucial in predicting technology success.
1.4 Use of expert opinion in decision analysis
1.4.1 Decision analysis
The fundamental background of this thesis lies in the area of decision analysis. Theobject of decision analysis is to help a decision maker think hard about the speci�cproblem at hand, including the overall structure of the problem as well as his or herpreferences or beliefs. Decision analysis provides both an overall paradigm and a setof tools with which a decision maker can construct and analyse a model of a decisionsituation. The main idea of decision analysis is to be able to represent real-worldproblems using models that can be analysed to gain insight and understanding. Theultimate goal of decision analysis is then that the decisions can be improved usingthis insight and understanding gained (Clemen, 1996).
Di�erent problems in decision making involve di�erent and often case-speci�c dif-�culties. According to Clemen (1996), there are four basic sources of di�culty indecision analysis problems. First, the decision making problem can be hard becauseof its complexity, which means that there may be, for instance, multiple di�erentsources of uncertainties, di�erent possible courses of action and economic impactsto name a few. In complex problems, keeping all of the issues in mind at one timeis nearly impossible and decision analysis aims to provide tools to structuring com-plex problems to make them possible to analyse. Second, decision making can bedi�cult due to uncertainties involved in the decision making. Uncertainties can befound in data as well as in the projected consequences of the decision. Therefore,the decision maker can never be sure about the basis of his decision nor the impactof his decision.
Third is the trade-o� between multiple objectives found in some decision makingproblems. In these cases, the decision maker must trade o� bene�ts in one areaagainst costs in others. Typical trade-o� situations include economic versus envi-ronmental e�ects in environmental decision making as well as expected return andriskiness in investment decisions. Finally, di�erent approaches in decision makingmay often lead to di�erent conclusions and small changes in the input data may leadto di�erent choices and decisions. Di�erent views of individuals are also a challengein decision making as they may disagree on the uncertainty or value of the variousoutcomes. The use of decision making tools aims to resolve these di�erences whetherthe decision maker is an individual or a group of stakeholders with diverse opinions.

16
Figure 4: A decision-analysis process �owchart adapted from (Clemen, 1996). Theprocess is followed in the structure of this study.
The advantage of decision analysis is to make complex problems easier to under-stand. Clemen (1996) presents a �owchart (Fig. 4) that de�nes the decision analysisprocess in simple steps that are: identifying the problem, identifying di�erent alter-natives for decision making, decomposing and modeling the problem, choosing thebest decision alternative and inspecting its sensitivity and �nally implementing thebest alternative. The decision situation and alternatives were discussed earlier inthe introduction section. Modeling the problem, uncertainties and preferences arepresented in the following sections.

17
1.4.2 Expert use in decision analysis
Decision making problems often include a signi�cant amount of uncertainty. Asstated earlier, one elemental part of decision making is modeling of the problem,which requires the de�nition of data to be used. TRL is an arti�cial concept createdto help decision making in various situations and therefore there is no fundamentallyclear set of data that can be used for assessing it. There are, of course, publiclyavailable databases such as patent or scienti�c publication databases but using themfor assessing the Technology Readiness Level of a certain technology would requirea signi�cant amount of e�ort. Moreover, data retrieved from patent or publicationdatabases can in general cases be included in technology readiness assessment as aqualitative source, which is taken into account by the decision maker.
The fact that quantitative data is in practice not available for technology readinessassessment gives rise to the use of expert opinion in decision making. Expert opin-ion is often used in real world decision making problems that include a signi�cantamount of uncertainty (Morris, 1974). The uncertainty can be attempted to resolveby relying upon the judgement of one or more other persons referred as experts.An expert can be de�ned simply as a person who provides a judgement concerninguncertain matters (Morris, 1974).
Another view for using expert opinion in technology readiness assessment is thatexperts can be considered to re�ect the state of the TRL of a certain technologybecause they have a large amount of knowledge on the contents of relevant informa-tion, such as patents and scienti�c publications. Similar grounds are also discussedin Daneshkhah (2004) who suggest that expert judgement is appropriate when dataare sparse or di�cult to obtain, data are too costly to obtain, data are open todi�erent interpretations or there is need to perform an initial screening of problems.
In most situations requiring decision making under uncertainty, there is no abso-lutely correct answer to the question involved. Moreover, consulting multiple personsoften produces contradictory opinions which make the decision making process di�-cult despite the increased amount of information received from the experts. Johnsonand Albert (2001) compare combining of multiple expert opinions to having morethan one wristwatch. "With one watch, you know the time � or at least you thinkyou do. But with two watches, you are never sure."
There are several ways for obtaining expert opinion including mail/email surveys,expert interviews, expert meetings, interactive groups and the Delphi. Each of thesituations have both advantages and disadvantages extensively discussed in Meyerand Booker (1991). In this study, only email questionnaires are used even thoughthe process designed is not limited to using any particular form of communicationand it is also suitable for a Delphi study. The mail surveys are good for elicitingsimple data from a large sample (Meyer and Booker, 1991). The disadvantage isnaturally the lack of communication with the expert and typically low response rates.Face-to-face communication and telephone on the other hand requires much moretime and e�ort but results in larger amount of qualitative data and observations.

18
Obviously, no single best method exists and email questionnaire is a good startingpoint for TRA because of its low cost nature. Individual interviews should be usedif interaction between the analyst and expert is required and meetings with a groupof experts can be established if expert to expert interaction is considered helpful.These can also be achieved by interactive group sessions or workshops. The Delpi,as presented earlier, tries to combine advantages of questionnaires and group workand as such can be considered as a natural extension to questionnaire based TRA.
1.4.3 Assessment of uncertainty
The mathematical way for measuring, quantifying and modeling uncertainty is prob-ability. Mathematical rules of probability are based on a simple set of axioms andthey are well understood and noncontroversial. However, the interpretation of prob-ability for modeling uncertainties is controversial and so are di�erent attempts fortrying to distinct between types of uncertainty. (Winkler, 1996) The types of un-certainty can be divided in aleatory and epistemic (i.e. reducible and irreducibleor stochastic and subjective) uncertainties, and even though for instance Winklerdoes not consider this kind of classi�cations useful they provide an insight into thesources of uncertainty in probabilistic models.
Aleatory uncertainty is a type of uncertainty that cannot be expected to reducebecause it comes from natural, unpredictable variation in the system under study(Daneshkhah, 2004). In modeling, there is no way one could obtain informationthat could be used for reducing aleatory uncertainty because of physical or eveneconomic reasons. Winkler (1996) gives an example of tossing a coin where, at �rst,the uncertainty about how a fair coin lands can be thought as aleatory. However, ifone knew all the conditions surrounding the toss one could use the laws of physicsfor predicting the outcome of the toss. Measuring all the initial conditions is inpractice infeasible and therefore there is always some aleatory uncertainty includedin the process of predicting the outcome of the toss of a fair coin.
Epistemic uncertainty originates from the lack of knowledge about the system understudy and can be conceptually resolved (Daneshkhah, 2004). Epistemic uncertaintycan be decreased or eliminated by collecting a su�cient amount of information fromthe system under study. In practice decreasing epistemic uncertainty could meanobserving the system for a longer period of time or by collecting data from as manysources (e.g. experts) as possible. The fundamental reason Winkler (1996) does notconsider the distinctions between types of uncertainty fruitful is that there is alwaysuncertainty in the �nal probabilistic model and it is more important to improve themodeling and analysis part, including data collection, rather than focusing on thesemantics.
Instead of using aleatory and epistemic uncertainties, Winkler (1996) argues that itcan be useful to think about certain types of uncertainties that are related to themodeling process itself. First of all, he distinguishes between uncertainties aboutevents or variables that are observable and uncertainties that are not. Outside

19
temperature can be considered as an observable variable that can be measured to�nd out how good was the model used for forecasting tomorrow's temperature.There may also be some unobservable variables in the model trying to forecastthe temperature and these parameters might not be easy to understand and theymight not have an intuitively reasonable interpretation. Winkler (1996) furthermorepoints out that it is easier for experts to think about their subjective probabilitiesfor observable quantities than about unobservable ones such as parameters in theprobabilistic model.
This reasoning has an important role in this context. TRLs are an abstract conceptand clearly unobservable variables as such. Therefore asking experts to try to assessthe TRL straight away is a di�cult task. Instead, a decomposition of the TRLassessment problem into smaller subproblems makes it easier for experts to expresstheir opinion (Kynn, 2008). The discussion of question setting for TRL assessmentis continued in later parts of this study.
1.4.4 Sources of bias
In addition to uncertainty, every decision analysis problem includes several sourcesof bias, which can be de�ned as skewing of results in an unfavourable direction.Based on this, one can say that a result in decision making that is not biased isreality or truth (Meyer and Booker, 1991). Bias is a common term in statistics,where estimates that are biased are generally considered harmful. Biases can occurin many forms and from many sources but in using expert opinion, biases originatefrom human decision making processes where the experts interpret reality throughtheir previous experiences or mental models. It is important to take the e�ect ofbias into account in modeling by identifying di�erent sources of bias and controllingbias properly when modeling the problem and interpreting the results.
The sources of bias can be classi�ed in two categories: motivational bias and cog-nitive bias (Meyer and Booker, 1991; Clemen, 1996). Motivational bias typicallyoriginates from other people or factors a�ecting experts thinking and results in ex-perts not reporting their actual opinions. When other people, such as the intervieweror other experts, are involved when expert is expressing her opinion there tends tobe social pressure for answering what people expect the expert to answer. More-over, in group working situations, the group may steer towards a consensus whichincreases the bias of expert opinion due to an e�ect called group think. Sometimes,an experts wants to answer in a way that is favourable to them, which is called thewishful thinking e�ect. Wishful thinking might occur for instance when the expertreceives money from assessing the results of her own work. Another good exampleof motivational bias is a salesperson doing the sales forecast for future. The personmay be tempted to estimate the sales lower than the actual expectation to makehim look good when results are assessed (Clemen, 1996).
Motivational bias is also included in the decision maker side in the form of misinter-pretation. Human interpretation of incoming information is selective and decision
20
makers tend to trust information that supports their original views (Meyer andBooker, 1991). In an interview situation, for instance, the analyst is already some-what familiar with the expert's �eld and therefore interprets the expert opinionbased on her current knowledge on the subject. Misinterpretation bias can alsooriginate from problem modeling. The decision maker often encodes expert opinionand forms a mathematical model to combine collected data and is subject to intro-ducing misinterpretation bias when making subjective assumptions in the modelingphase.
Cognitive biases originate from human mind not being able to process and rememberall information available. People tend to make solving of complex problems easier bytaking short cuts to reduce the cognitive burden (Meyer and Booker, 1991). Formingan opinion starts with the �rst impression which is then adjusted slightly based onnew information received and therefore subsequent information is not used as muchas the �rst impression. This e�ect is called anchoring bias referring to anchoringthe opinion on the �rst impression. In case of the salesperson, it is likely that salesforecasts are based on past results rather than the person really trying to predictwhat factors a�ect future sales. The salesperson is, on other words, anchoring topast results (Clemen, 1996).
Other sources of cognitive bias include inconsistency bias that deals with humansforgetting their assumptions and therefore being inconsistent in the problem solvingprocess. Some information is also easier to remember than other, which results inavailability bias. This means that people tend to overestimate frequencies of eventsbased on familiar, concrete or recent events. Finally, people are poor in estimatinguncertainties and probabilities in general.
1.4.5 Summary and implications
The previous section makes many relevant points with important implications re-garding the expert elicitation process. The decision analysis process �owchart byClemen (1996) (Fig. 4) can be used in de�ning the TRA scheme in this study.Assessing TRL of competing technologies is a task where the real answer cannot bederived from any traditional information source because the TRL is a very abstractconcept. Therefore, TRL assessment needs to be done by either qualitative researchconducted by the analyst or by expert elicitation that can be either qualitative orquantitative.
There are several alternatives for data collection, analysis and modeling that willbe discussed later on in this study. Biases can be e�ectively reduced by usingmultiple experts instead of one (Kuhnert et al., 2009) but choosing the experts isnon trivial when many of them are needed for the assessment. Daneshkhah (2004)suggestion for general principles that should be applied in expert elicitation includenoteworthy points in using expert elicitation, expert selection, modeling and dealingwith uncertainties. As stated before, expert elicitation is appropriate when data aresparse, costly to obtain, subject to di�erent interpretations or an initial screening

21
of the problem is required. In risk assessment, experts are used to either structurethe problem or provide estimates, which is the case in this thesis.
In the analysis process, only an expert's opinion is worth eliciting and therefore e�ortneeds to be put in the selection of experts. The questions asked should considerobservable variables to make experts more comfortable with their task. Signi�cantattention must be paid on reducing or at least accounting for expert biases anduncertainties. In order to do this, the elicitation process should involve feedback andan uncertainty model to deal with e.g. overcon�dence or anchoring (Daneshkhah,2004).
Both Daneshkhah (2004) and Kuhnert et al. (2009) also point out that the use ofmultiple experts should be taken into account in models. The experts are and shouldbe dependent at least to some extent. Modeling of dependencies has been dealtwidely in literature but it is left out from the scope of this study because dependencyconsiderations would signi�cantly increase the complexity of the models. Calibrationis a technique used in both single-expert and multi-expert models to ensure that theexpert opinion is interpreted correctly. Similarly to dependency modeling, there is noclear de�nition of correct calibration of the expert and therefore it is not consideredin this study either.
1.5 Expert opinion aggregation
1.5.1 Measuring and modeling expert opinion
The format for collecting expert opinion plays a big role in expert opinion aggrega-tion. A number of data acquisition techniques are suggested by Meyer and Booker(1991). All techniques have their advantages and disadvantages, which are �rstdealt in this section and later relevant methodology related to each type of data ispresented.
• Probability estimates and probability distributions
• Odds ratio
• Continuous scales
• Pairwise comparisons
• Ranks or ratings
• Estimate of physical quantity
• Bayesian updating
Probability estimates and probability distributions are very commonly used in deci-sion analysis because they allow �exible use of statistical methods by nature. Their

22
main disadvantage is that most people are not good at estimating probabilitiesand estimating probabilities or probability distributions is very fatiguing and time-consuming to the expert (Meyer and Booker, 1991). Mathematical aggregation ofprobability distributions re�ecting expert opinion has been widely studied in litera-ture especially for risk analysis purposes (Clemen and Winkler, 1999). The expertsmay also be asked to assess quantiles instead of full probability distributions, whichmakes the assessment simpler. This approach is presented, for instance, by Garth-waite and Dickey (1985).
Other common expert opinion acquisition methods are di�erent sort of scales. Con-tinuous scales have continuous number lines and the experts mark their answers inbetween the extreme values of the scale. Continuous scales might additionally be la-beled with integers, text, probabilities or categories. Their main advantages includeease of use for the expert and simple mathematical representation. According toMeyer and Booker (1991) they may be, di�cult to develop and care must be takento guard against biased wording of the labels or their de�nitions.
Ranks, ratings and pairwise comparisons are among the easiest for the expert toperform (Meyer and Booker, 1991). Pairwise comparison is about the expert com-paring two objects at a time. People are generally good at estimating pairwisecomparisons but the disadvantage is that pairwise comparisons are time consumingwhen the amount of objects is large. Pairwise comparisons also provide only relativedi�erences between objects compared and no absolute quantities, which might be anissue for some analysis. This problem is addressed with ranks and ratings, which in-volve assigning numbers or descriptions to the objects in question. The descriptionscan be used to provide the baseline scale required for absolute assessment of theobject. The main disadvantage of ranks and ratings is that the di�erence betweendi�erent ratings is not de�ned and therefore a numerical representation of results isnot mathematically valid.
The acquisition techniques are closely related to the classi�cation of scales of mea-surement presented by Stevens (1946). The type of data collected has importantimplications on the mathematical and statistical methods allowed for manipulationof the data. The scales can be either nominal, ordinal, interval or ratio and they arepresented in table 2.
The nominal scale is the most unrestricted in terms of assignment of numerals butis the most restrictive in terms of mathematical operations that can be performedon them. The numbers assigned on nominal data are only used as labels in iden-ti�cation and they have no mathematical meaning. The ordinal scale includes arank-ordering and it is widely used in, for instance, psychology. Because of the rankordering, means and standard deviations are strictly speaking prohibited statisticswhen dealing with ordinal data.
For instance, the di�erence between an expert agreeing strongly versus agreeingmoderately cannot be explicitly de�ned to have the same distance as the di�erencebetween the expert agreeing moderately versus having a neutral opinion. The use
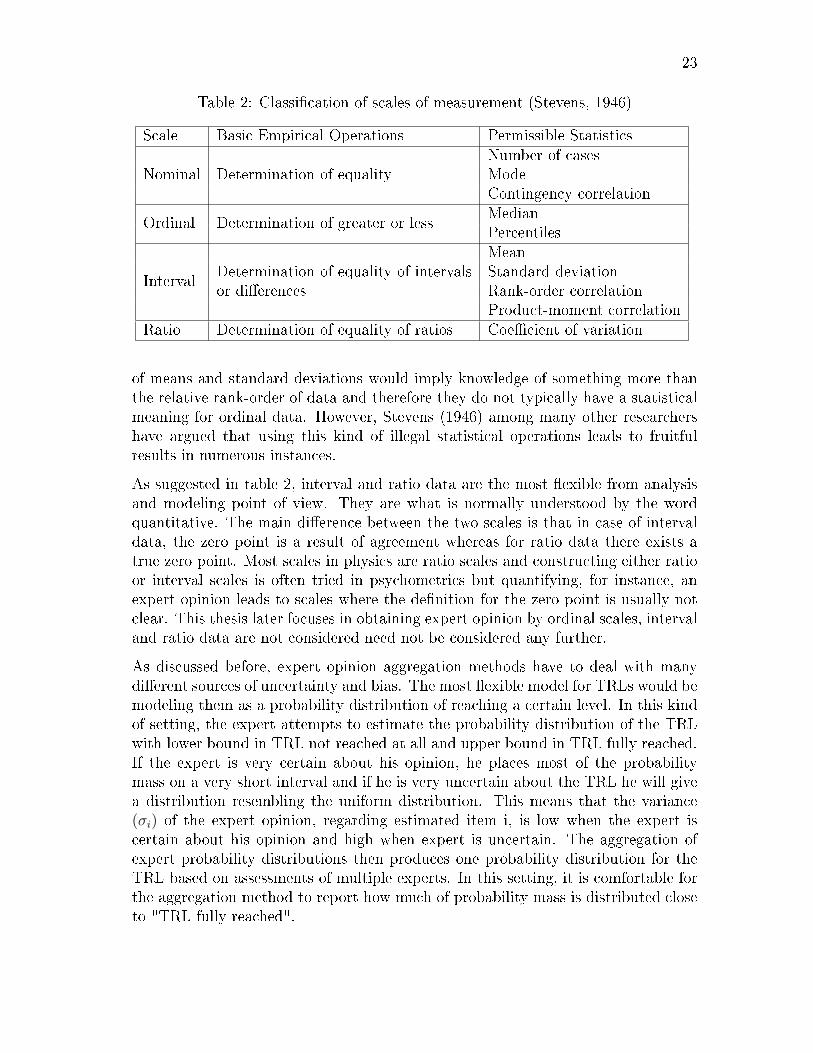
23
Table 2: Classi�cation of scales of measurement (Stevens, 1946)
Scale Basic Empirical Operations Permissible Statistics
NominalNumber of cases
Determination of equality ModeContingency correlation
Ordinal Determination of greater or lessMedianPercentiles
Interval
MeanDetermination of equality of intervals Standard deviationor di�erences Rank-order correlation
Product-moment correlationRatio Determination of equality of ratios Coe�cient of variation
of means and standard deviations would imply knowledge of something more thanthe relative rank-order of data and therefore they do not typically have a statisticalmeaning for ordinal data. However, Stevens (1946) among many other researchershave argued that using this kind of illegal statistical operations leads to fruitfulresults in numerous instances.
As suggested in table 2, interval and ratio data are the most �exible from analysisand modeling point of view. They are what is normally understood by the wordquantitative. The main di�erence between the two scales is that in case of intervaldata, the zero point is a result of agreement whereas for ratio data there exists atrue zero point. Most scales in physics are ratio scales and constructing either ratioor interval scales is often tried in psychometrics but quantifying, for instance, anexpert opinion leads to scales where the de�nition for the zero point is usually notclear. This thesis later focuses in obtaining expert opinion by ordinal scales, intervaland ratio data are not considered need not be considered any further.
As discussed before, expert opinion aggregation methods have to deal with manydi�erent sources of uncertainty and bias. The most �exible model for TRLs would bemodeling them as a probability distribution of reaching a certain level. In this kindof setting, the expert attempts to estimate the probability distribution of the TRLwith lower bound in TRL not reached at all and upper bound in TRL fully reached.If the expert is very certain about his opinion, he places most of the probabilitymass on a very short interval and if he is very uncertain about the TRL he will givea distribution resembling the uniform distribution. This means that the variance(σi) of the expert opinion, regarding estimated item i, is low when the expert iscertain about his opinion and high when expert is uncertain. The aggregation ofexpert probability distributions then produces one probability distribution for theTRL based on assessments of multiple experts. In this setting, it is comfortable forthe aggregation method to report how much of probability mass is distributed closeto "TRL fully reached".

24
Another aspect of uncertainty is related to the expertise level of experts. A universityprofessor studying ink-jet printing is likely to be more aware of TRL of ink-jetprinting than a junior researcher studying nanoimprint lithography. From the TRLassessment point of view, it is still important to get both to give their TRL estimatefor both technologies given that they both are familiar with each others �eld ofresearch. Otherwise, it would be very di�cult to perform pairwise comparisonsbetween TRL estimates of nanoimprint lithography and ink-jet printing. This aspectcan be taken into account by including the level of expertise in the model. The levelof expertise tries to assess how likely the expert is to correctly assess di�erent TRLitems. Mathematically this means that the variance (σj) of an expert j is lowerfor more experienced experts and higher for more junior ones. More examples ofincluding expert uncertainty are given along with introduction of models.
The methodology for combining expert opinion can be classi�ed in two categories:mathematical and behavioural approaches. Furthermore, mathematical approachescan be further classi�ed in three groups: non-Bayesian axiomatic models, Bayesianmodels and psychological scaling models (Ouchi, 2004). Various methods for com-bining expert opinion in risk analysis are reviewed by Clemen and Winkler (1999)and Ouchi (2004). Combination of expert opinion is a popular subject in risk anal-ysis because in many cases "hard" quantitative data is not available for decisionmaking and the experts can provide valuable information in the decision makingprocess. Application areas of using expert judgement include environmental risk as-sessment, military intelligence, nuclear engineering and various types of forecasting(economic, technological, etc.) among many others.
1.5.2 Axiomatic and Bayesian models
Axiomatic approaches are the simplest methods for combining probability distri-butions. In axiomatic approaches, certain properties and regularity conditions areestablished for combining probability distributions (Ouchi, 2004). The simplestaxiomatic combination schemes are opinion pools that can be either linear or loga-rithmic. A linear opinion pool corresponds to the calculation of a simple weightedarithmetic mean whereas the logarithmic opinion pool corresponds to weighted ge-ometric mean. The de�nitions of these opinion pools are in equations 1 and 2,respectively. The problem with opinion pools is that the weights need to be set sub-jectively case by case. Typical interpretation of the weights is "the better an expert,the heavier the weight"(Morris, 1977), which leads to a problem of measuring andbalancing between expert goodness.
p(θ) =∑i
wipi(θ) (1)
p(θ) = k∏i
pi(θ)wi (2)

25
The basic Bayesian approach for expert opinion combination allows much more �ex-ibility than the axiomatic models. A model developed by Morris (1977) is illustratedin equation 3. Opinions fn from multiple experts about interesting quantity x arecombined in the likelihood function and the decision maker can a�ect the processby choosing the model for the likelihood function p(f1, . . . , fn|x, d) as well as byincluding his own prior beliefs d in the prior density function p(x|d).
p(x|f1, . . . , fn, d) ∝ p(f1, . . . , fn|x, d)p(x|d) (3)
Most of the early work, in 1970's and 1980's, on using Bayesian aggregation schemeshas focused on using independent normal distributions for experts' assessments(Ouchi, 2004). The assumption of independence between experts' probability distri-butions makes it easy to form the likelihood function because independence impliesp(f1, . . . , fn|x, d) =
∏i p(fi|x, d). Independence between experts is, however, a prop-
erty di�cult to satisfy because they are assessing the same object x and thereforeusing overlapping sets of information for making their conclusion on the probabilitydistribution. In case of normal model for data, the dependencies can be modelledsimply in a covariance matrix (Clemen, 1987). One can argue that dependencies be-tween experts are by no means linear and their modelling would be a very di�culttask for example in the setting of this study and therefore they are not consideredfurther.
A more recent study by Lipscomb et al. (1998) develops a hierarchical Bayesianmodel for physician sta�ng. The hierarchical model means that a set of hyper-parameters are used for estimating probability distributions for real parameters.Hierarchical modeling approach makes it possible to take into account dependen-cies among the experts as well as each expert's ability to accurately estimate thetime required for performing certain medical procedures. This approach essentiallydecreases the sensitivity of the model to small variations of data, which is also afavourable requirements for this study, too. Similar problems of the one handledin Lipscomb et al. (1998) have been typically solved by Delphi processes and theauthors discuss it could be possible to replace the interactive Delphi process by us-ing the simple hierarchical approach that produces statistically interpretable results.The main advantage in Delphi process is that errors and misunderstandings can beeasily detected and corrected during the interactive process.
Most of the traditional theory on Bayesian models does not apply for this studybecause of the type of data collected. The traditional Bayesian settings expectthe data in the form of probability distributions, either full or quantile based. Asthe data used for this study is ordinal, there are some fundamental limitations onmathematical operations that can be applied (Table 2). Most of the models designedfor ordinal data use logits of cumulative probabilities also called cumulative logits.They are, however, often intended for regression problems where the goal is toestimate the behaviour of a dependent variable by one or more independent variables.For an extensive review of ordinal regression models for di�erent purposes, see Liuand Agresti (2005).

26
1.5.3 Measures for rater agreement
Measurement System Analysis (MSA) studies the quality of measurements and waysto improve their usefulness, accuracy, precision and meaningfulness. Precision ofmeasurement system means a di�erent thing for di�erent users. In industry, mostemphasis is on measurement spread whereas psychometrics focuses on reliability.When analysing ordinal data, the goal is often to draw one concluding �gure of thedata available and therefore measurements for the rate of agreement among dataare needed. Mast and Wieringen (2004) present the concept of intraclass correlationcoe�cient (ICC) and Kappa that are commonly used for measuring reliability andagreement and used as a background for more advanced latent variable models (e.g.in (Johnson and Albert, 2001)) that are presented later in this section.
In ICC the observations Xij are assumed to follow the model
Xij = Zi + εij, (4)
where Zi ∼ N(µp, σ2p) denotes the true value of an item i and εij ∼ N(0, σ2
e) themeasurement error. Index j denotes the di�erent measurements, e.g. experts, thathave rated item i. ICC (Eq. 5) is then de�ned as the correlation between di�erentmeasurements Xij of an object i.
ICC =Cov(Xij, Xik)√V ar(Xij)V ar(Xik)
=σ2p
σ2p + σ2
e
(5)
By equation 5, ICC is de�ned as the ratio between variance of interest over the totalvariance.
Kappa is a measure used for evaluating rater agreement typically for nominal scales.It is a measure of agreement corrected for agreement by chance. The de�nition ofKappa is
κ =Po − Pe1− Pe
. (6)
In the equation (6), Po denotes the observed proportion of agreement and Pe theexpected proportion of agreement, i.e. the agreement by change. The basic versionof Kappa is not intended for multivariate data and the theory has been developedfurther for solving this issue. ICC and Kappa play an important role in developmentof latent variable models used in this study but the multivariate version is out ofthe scope of this study.
1.5.4 Latent variable models for ordinal data
One possible view to ordinal data is to understand the data as a representation of anunderlying latent (i.e. unobserved) variable associated with each response. This issomewhat against the strict statistical requirements set in table 2 but o�ers greater�exibility in modeling. In the latent variable approach, the data is assumed to be

27
drawn from a continuous distribution centred on a mean value that is di�erent foreach individual respondent. Figure 5 represents the latent variable approach in caseof ordinal data with four categories A-D. Each expert expresses his opinion of thelatent variable by one of the categories. The data is then combined to form a latentprobability distribution that is assumed to be behind the expert opinion. Verticallines in the �gure denote the category cuto� points.
In latent variable models (e.g Johnson and Albert (2001)), the true value of themeasured property is denoted by Z ∈ R. The quantity t = Z + ε denotes theperception of the latent trait on the underlying trait scale where ε denotes themeasurement error. The latent variable model is linked to the ordinal scale usedaccording to equation 7. Measured variable is assigned the category c if it satis�es thecondition in the equation. The category cuto�s are denoted by γj, where γ0 = −∞,γK =∞ and γj = {γ1, . . . , γK−1}. The number of categories is denoted by K.
γc−1 < t ≤ γc (7)
Figure 5: Normal latent trait for four category ordinal data. Numbered x axisdenotes the true value of the measured variable and the letters between verticallines (cuto� points) mark the ordinal categories.
Three latent variable models are considered in more detail in this study. Theirfeatures and applications are brie�y presented here and more thoroughly in section2. All models presented here have a di�erent approach and applications but theyare also closely linked with each other and the subject of this study regarding thefundamental problem of �nding out the underlying variable from a dataset. Moremodels for ordinal data, especially for regression purposes, are presented in Liu andAgresti (2005).
Mast and Wieringen (2004) base their model on the ICC, which is modi�ed forordinal data. They use a link function similar to one used in logistic regression for
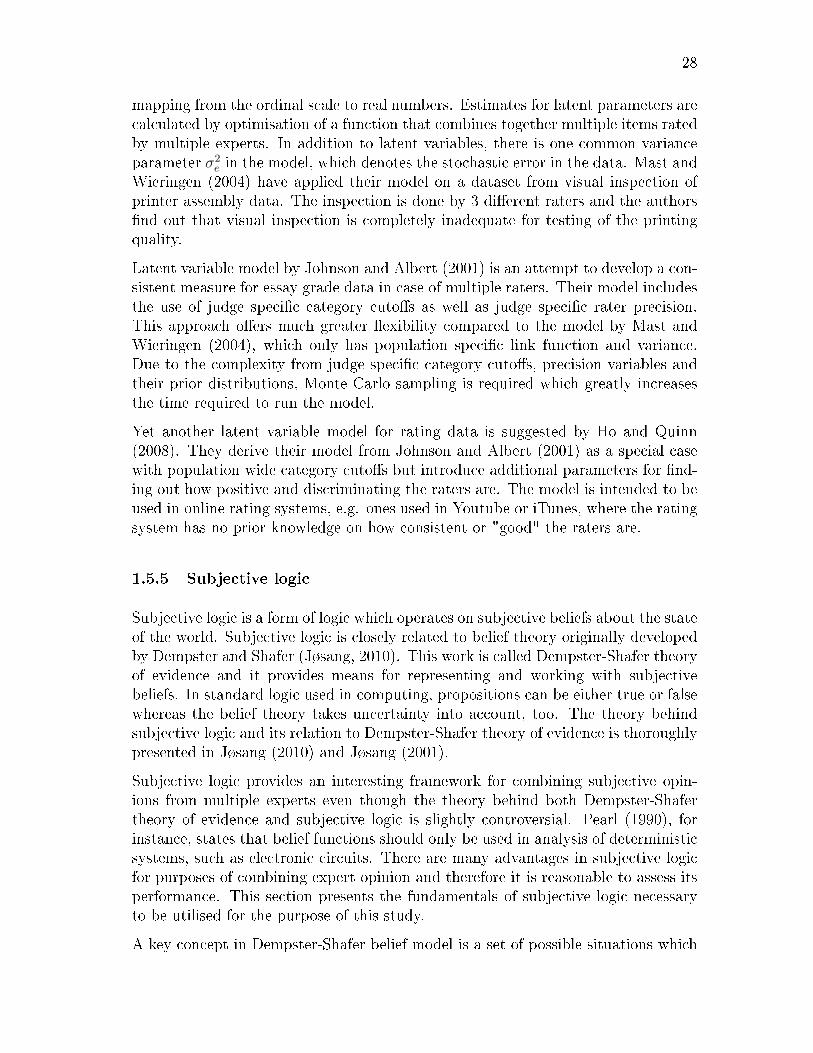
28
mapping from the ordinal scale to real numbers. Estimates for latent parameters arecalculated by optimisation of a function that combines together multiple items ratedby multiple experts. In addition to latent variables, there is one common varianceparameter σ2
e in the model, which denotes the stochastic error in the data. Mast andWieringen (2004) have applied their model on a dataset from visual inspection ofprinter assembly data. The inspection is done by 3 di�erent raters and the authors�nd out that visual inspection is completely inadequate for testing of the printingquality.
Latent variable model by Johnson and Albert (2001) is an attempt to develop a con-sistent measure for essay grade data in case of multiple raters. Their model includesthe use of judge speci�c category cuto�s as well as judge speci�c rater precision.This approach o�ers much greater �exibility compared to the model by Mast andWieringen (2004), which only has population speci�c link function and variance.Due to the complexity from judge speci�c category cuto�s, precision variables andtheir prior distributions, Monte Carlo sampling is required which greatly increasesthe time required to run the model.
Yet another latent variable model for rating data is suggested by Ho and Quinn(2008). They derive their model from Johnson and Albert (2001) as a special casewith population wide category cuto�s but introduce additional parameters for �nd-ing out how positive and discriminating the raters are. The model is intended to beused in online rating systems, e.g. ones used in Youtube or iTunes, where the ratingsystem has no prior knowledge on how consistent or "good" the raters are.
1.5.5 Subjective logic
Subjective logic is a form of logic which operates on subjective beliefs about the stateof the world. Subjective logic is closely related to belief theory originally developedby Dempster and Shafer (Jøsang, 2010). This work is called Dempster-Shafer theoryof evidence and it provides means for representing and working with subjectivebeliefs. In standard logic used in computing, propositions can be either true or falsewhereas the belief theory takes uncertainty into account, too. The theory behindsubjective logic and its relation to Dempster-Shafer theory of evidence is thoroughlypresented in Jøsang (2010) and Jøsang (2001).
Subjective logic provides an interesting framework for combining subjective opin-ions from multiple experts even though the theory behind both Dempster-Shafertheory of evidence and subjective logic is slightly controversial. Pearl (1990), forinstance, states that belief functions should only be used in analysis of deterministicsystems, such as electronic circuits. There are many advantages in subjective logicfor purposes of combining expert opinion and therefore it is reasonable to assess itsperformance. This section presents the fundamentals of subjective logic necessaryto be utilised for the purpose of this study.
A key concept in Dempster-Shafer belief model is a set of possible situations which
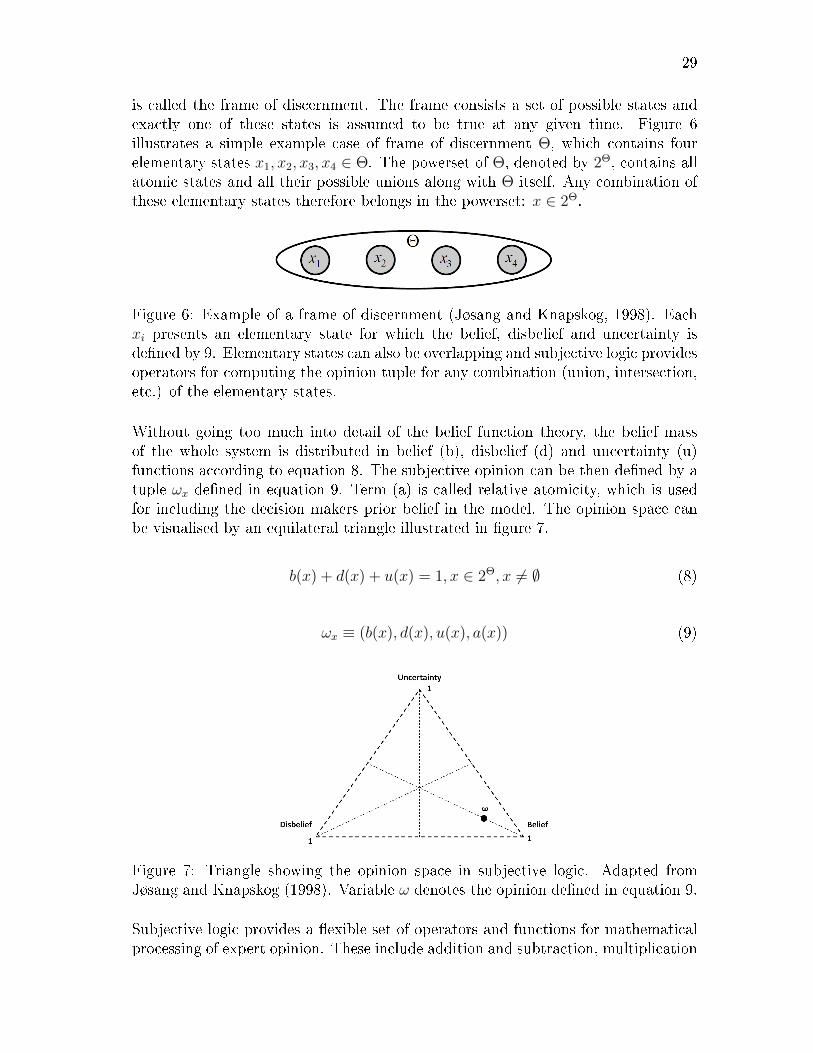
29
is called the frame of discernment. The frame consists a set of possible states andexactly one of these states is assumed to be true at any given time. Figure 6illustrates a simple example case of frame of discernment Θ, which contains fourelementary states x1, x2, x3, x4 ∈ Θ. The powerset of Θ, denoted by 2Θ, contains allatomic states and all their possible unions along with Θ itself. Any combination ofthese elementary states therefore belongs in the powerset: x ∈ 2Θ.
Figure 6: Example of a frame of discernment (Jøsang and Knapskog, 1998). Eachxi presents an elementary state for which the belief, disbelief and uncertainty isde�ned by 9. Elementary states can also be overlapping and subjective logic providesoperators for computing the opinion tuple for any combination (union, intersection,etc.) of the elementary states.
Without going too much into detail of the belief function theory, the belief massof the whole system is distributed in belief (b), disbelief (d) and uncertainty (u)functions according to equation 8. The subjective opinion can be then de�ned by atuple ωx de�ned in equation 9. Term (a) is called relative atomicity, which is usedfor including the decision makers prior belief in the model. The opinion space canbe visualised by an equilateral triangle illustrated in �gure 7.
b(x) + d(x) + u(x) = 1, x ∈ 2Θ, x 6= ∅ (8)
ωx ≡ (b(x), d(x), u(x), a(x)) (9)
Figure 7: Triangle showing the opinion space in subjective logic. Adapted fromJøsang and Knapskog (1998). Variable ω denotes the opinion de�ned in equation 9.
Subjective logic provides a �exible set of operators and functions for mathematicalprocessing of expert opinion. These include addition and subtraction, multiplication

30
and division, deduction and abduction as well as fusion of opinions. Subjectivelogic, by de�nition, makes it possible to include expert uncertainties in the datacollection phase which is very favourable for expert opinion aggregation. Moredetailed explanation of applying subjective logic is presented in section 2.
1.5.6 Other methods
Traditional statistics o�er a multitude of methods more or less suitable for analysisof ordinal data. The most advanced methods in traditional statistics, such as vari-ance analysis are not to be used for ordinal data and therefore one needs to relyon non-parametric methodology. Non-parametric statistical tests permissible forordinal data include Mann-Whitney U test, Wilcoxon matched pairs tests, Kruskal-Wallis tests and Friedman's test. Contingency tables are also a popular method forpresenting categorical and original data in a nonparametric way but they do noto�er the possibility for combining expert opinion especially needed in this study.
Nonparametric tests, as well as other traditional statistics, are best suited for relativecomparisons between groups. This kind of information is helpful but does not solvethe problem for deriving a point estimate for decision making. Therefore, traditionalstatistics methods are left out of the scope of this study.
Elicitator (James et al., 2010a,b) is a recent tool for eliciting expert opinion fromone or multiple experts. Elicitator is based on Bayesian framework using logisticsregression and beta distributions for deriving the �nal expert opinion on the mea-sured quantity. The expert is presented a number of covariates and he is to assessthe probability of success for several cases based on these covariates.
A very practical approach for analysing ordinal questionnaire data has been takenby Hassall (1999), who uses so called triangular fuzzy numbers for combination ofmultiple ordinal values. Triangular numbers include a centre point in the originalordinal value and minimum and maximum arti�cially set by the analyst. In case ofordinal value of 3, the minimum could be 2 and maximum 4. The fuzzy approacho�ers the advantage of mapping the numerical results with linguistic values of thescale. However, the approach means in practice no more than computing a weightedaverage of the results and does not o�er any added value for this work.
31
2 Method
2.1 Introduction to methodology
This section describes the methodology of the TRL assessment scheme that is de-veloped as part of this thesis. The section is divided in 5 subsections covering therequirements, data collection and analysis, modeling, estimation of reliability andpractical implementation. The subsections are described in di�erent levels of detailre�ecting their importance of the thesis.
The requirements speci�cation subsection explicitly speci�es the requirements setbroadly in the general introduction of this thesis. It combines the theoretical back-ground from literature review with practical requirements from the Observatory-NANO project. The main high level requirements for the method are economicapproach, robustness and reliability of the model as well as practical implementa-tion. The analysis tool produced as part of this study is �nally evaluated againstthe requirements speci�ed.
Data subsection introduces the collection, interpretation and analysis of TRL dataused in this study. The approach to data collection is very practical due to thefact that there was no prior information on how one should collect expert opiniondata for TRL assessment purposes from a group of experts all around the world.All the methods chosen are suitable for analysing ordinal data. Multinomial modelswere chosen because of their simplicity and they are used as a reference for morecomplex models. Subjective logic was chosen because of its simple structure andeasy practical implementation. Latent variable models o�er very good performancefor some similar problems and therefore three di�erent methods were selected forcomparison.
Modeling subsection describes 5 di�erent models for analysing expert opinion data.The models included are brie�y described in literature review and more thoroughmathematical description is given in this section. The models are then comparedand assessed in section 3 based on the reliability measures described in this section.Reliability of the methodology is mainly discussed from sensitivity viewpoint buthigh level schemes for veri�cation and validation are also introduced.
Finally, a practical implementation of the tool developed as part of this study is de-scribed. The implementation ties together data collection, its preprocessing, analysisand visualisation of TRL estimates.
2.2 Requirements speci�cation
An important part of the tool development is the de�nition of requirements. Aspresented before, there are multiple di�erent methods for conducting technologyfutures assessment or technology readiness assessment. Each of these methods have
32
features that are advantageous for some purposes but disadvantageous for other pur-poses. First of all, there is a clear distinction between quantitative and qualitativemethods. In the context of ObservatoryNANO project, most focus is on qualitativeresearch and quantitative research methods should be designed so that they supportthe qualitative research e�ciently and economically.
Most part of the research related to the work in ObservatoryNANO project is quali-tative research based on interviews and text based sources. This part of the researchcannot and should not be replaced by any means as it provides the readers groundsfor their decision making. The role of quantitative research considered in this workis supportive. Quantitative results as such should not be the basis of any deci-sion making but they can be and should be used to summarise the �ndings of theanalyst work. Moreover, �gures and estimates provided by the quantitative analy-sis can be used for e�cient representation of the research �ndings in, for instance,presentations.
Another important aspect of the quantitative research is its reliability. The amountof data is seldom the same in case of di�erent studies. Data collected from di�erentsources for foresight purposes is typically contradictory and therefore the goal of thequantitative analysis is to give the best possible estimate given the data togetherwith a reliability estimate of results.
The requirements presented here are summarised in the listing below.
• Data collection
� Method shall collect data economically
� Method shall collect data from a large group (n ≥ 100) of relevant experts
� Data collected shall include TRL estimates, technology impact estimatesand estimates of when to reach a TRL
• Analysis
� Method shall take into account the reliability of data entry
� Method shall estimate the reliability of the results
� Method shall be robust, i.e. not sensitive to small variations in data
• Results
� Method shall express the results for each technology in two dimensions:TRL and technology impact
� Method shall represent the results in visual form
� Numeric results behind the visual results shall be available to the user
� Numeric reliability estimates shall be available to the user

33
The main requirements for the methods are clearly contradictory with each other.On one hand, data should be collected from as many experts as possible but onthe other hand there is only a limited number of relevant experts in the world.The quality of results will improve only to a certain point when the number ofexperts invited to participate is increased. At some point, inviting a larger numberof experts does not improve the quality of the results because the quality of expertsdrops. Moreover, increasing the number of experts invited to participate increasesthe costs of conducting TRL assessment. Therefore, the number of experts that canbe invited to participate in the study is limited by total number of relevant experts,the quality of experts and resources available for conducting the study.
2.3 Data
2.3.1 Collection and description
An integral part of the development of methodology for this study is collectionof expert opinion data. There are several di�erent methods for data collectionsuggested in futures research including interviews, surveys, Delphi and the use ofexpert reports and publications. The selected approach for this study is a webquestionnaire because of its simple implementation and relatively low cost of theprocess.
The data collection procedure for collecting expert data is called sampling, whichmeans selecting a subgroup of a population to be invited to participate in the study.A population can be de�ned as an aggregate of all the elements sharing a commonset of characteristics and comprising the universe for the purpose of the decisionmaking problem, e.g. technology assessment. Information about a population maybe obtained by either sampling or by taking a census, which means involving thewhole population in the study. Malhotra (2004) summarises the conditions whensampling should be used instead of census. Generally, sampling is more economic oftwo and census is only favourable when the population is small. In case of technologyassessment, it is not possible to know every researcher or company working with acertain technology and therefore the census approach is not possible in practice.
Malhotra (2004) divides the sampling process in �ve steps: de�nition of population,determining the sample frame, selecting a sampling technique, determining the sam-ple size and executing the sampling. Target population is the collection of elements,in this case experts, that possess information sought by the researches, which in thisstudy means knowledge on technological development stage. Therefore the relevantexpert population for technology assessment are all researchers and people employedby companies or other organisations that possess information about technologicaldevelopment stage of technology or technologies being assessed.
A sampling frame is a representation of the elements of the target population andconsists a list or set of directions for identifying the target population. For instance,

34
a sampling frame might be a telephone book from which the researcher chooses thenumbers to be dialled. It is often possible to compile a list of population elementsbut using this kind of list may lead to sampling frame error, which should be takeninto account when analysing the results (Malhotra, 2004).
Sampling techniques can be generally classi�ed in two classes, nonprobability andprobability sampling. In nonprobability samples, the researcher subjectively choosesthe elements whereas in probability sampling the sampling units are selected bychance. Probability sampling techniques have many favourable properties and theyallow the calculation of con�dence intervals and other statistics by nature. On theother hand, they require a precise de�nition of target population and a general spec-i�cation of sampling frame. By the nature of this study, it is generally di�cult todetermine the whole population for technology assessment and therefore nonproba-bility sampling techniques are more convenient. Moreover, it is likely that a realistictarget population is at maximum thousands of people and therefore every expertidenti�ed can be included in the study. (Malhotra, 2004)
The most relevant nonprobabilistic sampling method is therefore judgement sam-pling, in which the population elements are selected based on the judgement of theresearcher. The researcher chooses the elements exercising judgement or expertisewith a belief that they are representative of the population of interest. Commonexamples for using judgement sampling listed by Malhotra (2004) include testingmarket potential of a new product or expert witnesses used in court, which closelyresemble the requirements of technology assessment.
The data was collected by two email questionnaires sent to groups of relevant expertson the technology areas studied: (1) printed electronics, (2) optical interconnectsand (3) universal memory. The study on printed electronics focuses on manufac-turing technology capabilities for printing nanoscale features. The study on opticalinterconnects focuses on di�erent nanostructures that can be used for building on-chip and chip-to-chip optical interconnect systems to replace traditional electricalinterconnects. The focus reports related to this data can be found on the Observa-toryNANO project website (ObservatoryNANO, 2010b,c).
The population for each study was the people working with or studying the selectedtechnology area. This includes professors and researchers in universities and researchorganisations as well as people employed by companies developing the selected tech-nologies (typically CEOs, CTOs, managers or senior sta� working in research anddevelopment). Most of the invited people were based in Europe because of the Ob-servatoryNANO project's focus on the European situation. The sample of invitedpeople was gathered from sources such as company databases or publicly availableinformation in the Internet.
Table 3 contains the number of invited people, number of respondents and thecorresponding response rate for the surveys conducted. Based on several sources(Kaplowitz et al., 2004; Sheehan, 2001; Hamilton, 2009), the response rates of 26%and 31% can be considered very good when taking into account the length of the

35
questionnaires. The response rates in the reference studies range from 13% to 33%.The response rates are also very good from economic point of view because they ba-sically indicate that getting one more response to the questionnaire requires invitingof 3-4 new people to take part. The experts invited also used a fair share of theirtime to answer the questionnaire. They used roughly 25 minutes to answer (by meanand median), which means that the total expert contribution was between 10 to 20hours depending on the respondent count. This much contribution is often verycostly to obtain by other means. However, it is likely that the response rates andother �gure for these kind of surveys are very case-speci�c and the results cannotnot yet be considered as a general guideline.
Table 3: Response rates for questionnaires conducted
Questionnaire Invited Clicked Responded Bounced Un-subbed Responded/Clicked
Printed electronics 110 46% 26% 6% 1% 56%Optical interconnects 85 53% 31% 7% 0% 58%Universal memory 264 31% 18 % 6% 0% 58%
List below gives an example of the data types collected by the questionnaires. Thestructure given is used in the printed electronics case. One part of the data containsthe expert opinion related to several claims related to TRLs, time in years to reachthe TRLs, technology impact as well as several open-ended questions. The focus inthis study is the quantitative data and therefore the open-ended questions are notconsidered in more detail.
• Expert performance
� Expert's own assessment of his expertise{Not familiar, Know how the technology works, Have been working with orstudying the technology}
• Expert opinion
� Expert opinion on several claims related to TRLs{Strongly disagree, Moderately disagree, Moderately agree, Strongly agree}
� Expert opinion on time to reach TRLs{Now, 1-3 years, 4-7 years, Later, Never}
� Expert opinion on several claims related to technology status{Very bad, Bad, Neutral, Good, Very good}
� Several open-ended questions
Expert opinion is measured on an ordinal scale from strongly disagree to stronglyagree. Neutral option was omitted in the questionnaire because it would not pro-vide any extra information to the assessment. Neutral opinion was allowed in theassessment of technology status because it is possible that a technology o�ers nei-ther negative or positive impact on some property (e.g. performance) but has a

36
signi�cant impact on some other property (e.g. cost). In addition to expert opinion,the respondents were asked to assess their own level of expertise on a three levelordinal scale.
2.3.2 Interpretation and analysis
Before any analysis can be performed, the interpretation of data must be de�ned.As suggested by Stevens (1946), stretching the strict rules of mathematical methodsallowed for ordinal data a bit may lead to fruitful results. The basic structure ofdata collected is a group of ordinal responses for a number of questions regardingthe TRL status of a certain technology. Each question corresponds to one level ofTRL and there are 1-4 questions for each TRL.
This is the case in data collected for assessing the status of printed electronicsnanoscale manufacturing methods, which is used as a sample for later developmentof the expert opinion aggregation model. The printed electronics dataset is the mostcomplex of the data collected and the same principles apply in the analysis of otherdatasets as well. This applies also for assessing the impact of technologies becausea similar ordinal scale is used.
The �nal goal of the analysis in this study is to draw a conclusion on the TRL oftechnologies assessed. As the proposed TRL assessment scheme consists of multiplequestions per one level of TRL, the expert opinions need to be combined to form the�nal conclusion. Moreover, it is important for the analyst to know something more,preferably the probability distribution, about the expert opinion collected becausethere is seldom a yes or no answer in the assessment. Probabilistic modeling isalso necessary for estimating the uncertainties related to the process. Based on thisreasoning, several schemes for interpreting the TRL data collected were considered.
The simplest interpretation for the data is one presented in table 4 in the formof basic statistics. Even though their use cannot be argued mathematically, theyo�er a compact presentation of the dataset. For calculating the basic statistics, thefollowing mapping was used between the ordinal categories and integers: stronglyagree=4, moderately agree=3, moderately disagree=2, strongly disagree=1. By asimple visual inspection of the table, it can easily be stated that gravure printingand �exography printing are nowhere near of reaching even TRL 1 because boththeir median and mean score lie under the average value of 2.5. On the other hand,all claims related to nanoimprint lithography on TRL 1 seem to indicate that all ofthe requirements for this TRL would already be reached.
Drawing conclusions directly from descriptive statistics such as mean or medianleads to a clearly biased estimate, though. Fundamentally, the data collected ismultinomial because there are four categories of possible responses and the frequencyof answers observed for each category is known for each question. In the very basicmultinomial interpretation, a probability of experts agreeing of reaching a certainTRL can be calculated by a simple multiplication. Table 5 contains the frequencies

37
Table 4: Basic statistics for printed electronics data. Barplots of category frequenciesfor each technology can be found in Appendix A.
Nanoimprint lithography Ink-jet printingmedian mean stdev count median mean stdev count
Fundamental 1 3 2,8 0,9 27 3 2,8 1,0 29Fundamental 2 3 3,2 0,9 27 3 2,6 0,9 29Fundamental 3 3 2,7 0,9 27 2 2,5 1,0 29
Applied 1 3 2,7 1,0 27 2 2,5 0,9 29Applied 2 3 2,8 1,1 26 2,5 2,5 1,0 28Applied 3 2 2,4 0,9 25 2 2,4 1,0 27Applied 4 2 2,2 0,9 24 2 2,1 1,0 26
Prototype 1 2 2,2 0,8 24 2 2,4 0,9 26Prototype 2 1,5 1,8 0,9 24 2 2,1 1,0 25Prototype 3 1,5 1,7 0,8 24 1,5 1,6 0,7 24Markets 1 4 3,6 0,7 23 3 2,9 1,1 26Markets 2 1 1,7 1,0 24 1 1,4 0,8 21Markets 3 1,5 1,8 0,9 24 1,5 2,0 1,2 22
Gravure printing Flexography printingmedian mean stdev count median mean stdev count
Fundamental 1 2 2,2 1,2 21 2 2,2 1,2 22Fundamental 2 2 2,3 1,1 21 2 2,3 1,0 22Fundamental 3 2 2,1 1,0 21 2 2,1 0,9 22
Applied 1 2 2,1 1,0 20 2 2,1 0,9 21Applied 2 2 2,0 1,1 20 2 2,0 1,0 21Applied 3 2,5 2,4 0,8 18 2 2,2 0,9 19Applied 4 1,5 1,7 1,0 18 2 1,6 0,8 19
Prototype 1 2 2,3 1,0 19 2 2,1 0,9 20Prototype 2 2 2,1 1,1 19 1,5 1,8 1,0 20Prototype 3 1 1,8 1,0 17 1 1,6 0,7 18Markets 1 4 3,0 1,3 17 3 2,8 1,1 19Markets 2 1 1,6 1,0 16 1 1,5 0,7 16Markets 3 1 1,5 0,9 14 1 1,6 0,8 16
for each category of TRL 1 (Fundamental research) for the Nanoimprint lithographytechnology. Direct probability calculation suggests that the probability of an expertstrongly agreeing with each claim is only 2%. The probability of an expert agreeingstrongly or moderately to each claim is 33%. Therefore one cannot draw a conclusionthat TRL 1 would be reached because the average value of responses for each TRL1 related question is above the average value of 2.5.
Table 5: Sample data for TRL 1 of Nanoimprint lithography in printed electronics
Stronglyagree
Moderatelyagree
Moderatelydisagree
Stronglydisagree
Fundamental 1 22% 44% 26% 7%Fundamental 2 41% 44% 7% 7%Fundamental 3 22% 37% 33% 7%
By the reasoning above, it seems necessary that the multinomial format of datais retained throughout the process to achieve unbiased estimates in the modelingpoint of view. This implies that the ordinal nature of data is retained, too. For the�nal analysis of TRL and related uncertainties, the probabilities assigned for eachTRL related question need to be combined to conclude the probability of reachingthe speci�c TRL. In order to achieve this, the scheme in table 6 is suggested. This

38
kind of interpretation is not needed for subjective logic as the framework containsoperators for combination of beliefs of independent (or dependent) items.
The suggested scheme is based on the assumption that individual TRL related itemswould be independent. This is of course not the case but it greatly simpli�es theanalysis and it would be very di�cult to model the dependencies between the TRLclaims. The independence between claims should be considered in the questionnairedesign.
The scheme for agreement consists of four di�erent groups based on the number ofexperts agreeing with the claims. The highest category consists of the events whereall three items are agreed and the lowest category consists of the events where allthree items are disagreed. The uncertainty is taken into account in a similar mappingthat classi�es responses based on the certainty of the respondent.
Table 6: Suggested TRL interpretation scheme. The pattern describes ordinal cate-gory frequencies for: strongly agree-moderately agree-moderately disagree-stronglydisagree. The sum of probabilities exceeds 100% due to rounding.
(a)
Agreement Patterns Probability
3 items
3-0-0-0 2%2-1-0-0 9%1-2-0-0 15%0-3-0-0 7%total 33%
2 items
2-0-1-0 6%1-1-1-0 17%0-2-1-0 12%2-0-0-1 2%1-1-0-1 5%0-2-0-1 3%total 45%
1 item
1-0-2-0 6%0-1-2-0 8%1-0-1-1 3%0-1-1-1 4%1-0-0-2 0%0-1-0-2 1%total 22%
0 items
0-0-3-0 1%0-0-2-1 1%0-0-1-2 0%0-0-0-3 0%total 2%
(b)
Uncertainty Patterns Probability
3 items
0-2-1-0 12%0-3-0-0 7%0-0-3-0 1%0-1-2-0 8%total 28%
2 items
1-2-0-0 15%1-1-1-0 17%0-1-1-1 4%1-0-2-0 6%0-2-0-1 3%0-0-2-1 1%total 46%
1 item
2-1-0-0 9%2-0-1-0 6%0-1-0-2 1%1-1-0-1 5%1-0-1-1 3%0-0-1-2 0%total 24%
0 items
3-0-0-0 2%2-0-0-1 2%0-0-0-3 0%1-0-0-2 0%total 4%
2.4 Modeling
2.4.1 Multinomial and weighted multinomial models
Multinomial model for TRL data is very simple and is for most parts already de-scribed in data interpretation subsection. The main idea in the multinomial model

39
is that the probability of each ordinal category is its relative frequency among theresponse data to one item. The multinomial data frame for item i can be de�ned as
mi = {fi1, fi2, . . . , fiK} = {ni1N,ni2N, . . . ,
niKN} (10)
where K denotes the number of categories, n the number of responses per categoryper item and N the total number of responses per item. For convenient comparisonof performance between di�erent models, an expected value or a point estimate canbe calculated to the multinomial data frame:
E[mi] =∑k
k · fik. (11)
This is di�erent from the true expectation operator for multinomial data and is usedonly for comparing of model performances. Another approach for comparing modelperformances is comparing the shares of experts agreeing and experts disagreeing,which better retains the ordinal nature of data.
The basic multinomial model does not allow any weighing of experts to be done.To apply weighing, the basic model can be modi�ed by including weights in thecalculation of category frequencies:
mwi = {fi1,w, fi2,w, . . . , fiK,w} = {∑
j wijIij1∑j wij
,
∑j wijIij2∑j wij
, . . . ,
∑j wijIijK∑j wij
}, (12)
where the indicator function Iijk gets value one if judge j has responded to itemi by the category k and is otherwise zero. Parameter wij denotes the judge anditem speci�c weight of each judge and is used weighing the scores and normalisingthe results. Multinomial expectation function in eq. 11 works for weighted multino-mial model, too. The practical comparison between models is performed in R andimplementation is done according to equations 10 and 12.
2.4.2 Judge-speci�c model
All multi-rater latent variable models discussed here are based on the assumptionthat judge j observes the true value of the item Zi with an additive judge-speci�cerror εij. The quantity tij = Zi + εij denotes the perception of the judge, which isassigned in one of the ordinal categories c by the following equation:
γj,c−1 < tij ≤ γj,c. (13)
The variable γj,c denotes the judge-speci�c category cuto� for category c. For themodel presented in Johnson and Albert (2001), extreme cuto�s are de�ned γj,0 =−∞ and γj,K =∞.
Based on category cuto�s, the following likelihood function can be written for thedata:
L(Z, {tij}, γ, {σ2j}) =
n∏i=1
J∏j=1
1
σjf(tij − Ziσj
)I(γj,yij−1< tij ≤ γj,yij), (14)

40
where f denotes the standard normal distribution density function and I the indi-cator function that gets the value 1 when the perceived value tij lies in between thecategories and 0 when it does not.
Rater variances σ2j are assumed to be independent by Johnson and Albert (2001)
and their prior distribution when f is the standard normal distribution is de�ned asan inverse-gamma density:
g(σ2j , λ, α) =
λα
Γ(α)(σ2
j )−α−1 exp(− λ
σ2j
), α, λ > 0. (15)
Category cuto�s γ are assumed to be independent and distributed uniformly a priori.The prior for true values of items Zi is the standard normal distribution denoted byφ. The joint prior density distribution in the model by Johnson and Albert (2001)is therefore given by:
g(Z, γ, {σ2j}) =
2∏i=1
φ(Zi, 0, 1)J∏j=1
g(σ2j , λ, α) (16)
and the joint posterior density is formed by combining equations 14 and 16 into:
g(Z, {tij}, γ, {σ2j}|y) ∝ L(Z, {tij}, γ, {σ2
j}g(Z, γ, {σ2j})) (17)
Due to the complexity of the model, its joint posterior probability cannot be evalu-ated directly and an MCMC sampling scheme is needed. As the sampling procedureis relatively complex and not in the main focus of this study, it is not presentedin detail. The complete scheme including MATLAB source code can be found inJohnson and Albert (2001). The R implementation of the model strictly follows theoriginal MATLAB source code.
2.4.3 Intraclass correlation based model - "ICC"
Mast and Wieringen (2004) base their model for bounded ordinal data on the intra-class correlation coe�cient (ICC, Eq. 5). Instead of de�ning category cuto�s, theyemploy a much simpler approach by two maps, LRD(Z) and LDR(k), between thelatent variables Z ∈ R and ordinal variables k ∈ D, where D is assumed a �niteset whose categories are labeled 1, 2, . . . , a. The maps are de�ned in the followingequations:
LRD(Z) =
⌈a expZ
1 + expZ
⌉(18)
LDR(k) = logk − 1/2
a− k + 1/2(19)
Based on the log-likelihood function, estimates for true latent values Zi and themeasurement error σ2
e can be established by maximisation:
Z1, . . . , Zn, ˆσ2e,ml = arg max
n∑i=1
a∑k=1
nik log Φ(A(+))− Φ(A(−)). (20)

41
Function Φ denotes the cumulative standard normal distribution and function A isde�ned by:
A(±) =LDR(k ± 1/2)− Zi
σe(21)
The R implementation of the ICC method is done according to equations speci�edin this subsection and Mast and Wieringen (2004).
2.4.4 Rater behaviour based model - "Ratings"
Another possible approach for latent variable modeling is suggested by Ho andQuinn (2008), who use a model with �xed category cuto� points but include ratercritical and discriminative behaviour in the model. In the model yobsij denotes theobserved judgements that belong to one of the ordinal categories. Correspondinglatent variables are de�ned by
y∗ij = αj + βjθi + εij. (22)
Parameters αj take real values and are used to model the central point of rater jscale. If αj of a rater j is larger than α of other raters, the rater j gives on averagehigher estimates for values of items. Similarly, if αj is lower, the rater tends to givelower estimates on average. Parameter θi denotes the latent value of item i andparameter βj the rater's ability to be able to discriminate between di�erent valuesof items. Raters with high discrimination value are sensitive to small di�erences initem values whereas raters with low discrimination value estimate the item valuesclose to random.
A Bayesian MCMC approach is used for �tting the model that has the likelihoodfunction of:
p(Yobs|α, β, θ, γ) =∏i,j
{Φ(γyobsij
− αj − βjθi)− Φ(γyobsij −1 − αj − βjθi)}, (23)
where Φ denotes again the standard normal distribution function. Prior distribu-tions used by Ho and Quinn (2008) are αr N(1, 1), βr N(−5, 20) truncated to thepositive half of real line, uniform distribution for γ and standard normal distribu-tion for θp. After running the simulation and obtaining MCMC samples, ordinalcategory probabilities are their relative proportion among all MCMC samples. Rimplementation for the ratings method is provided as an R library named "Ratings"by the authors of Ho and Quinn (2008).
2.4.5 Subjective logic
Subjective logic is based on representing beliefs by a vector of four components:belief, disbelief, uncertainty and relative atomicity. Mathematically the belief infor-mation of event x is de�ned by ωx = (b(x), d(x), u(x), a(x)). The use of subjective

42
logic for TRL assessment with ordinal data requires the de�nition of a mapping be-tween the ordinal data and subjective logic framework. The mapping used for thisstudy is visualised in �gure 8 and is based on ordinal data received by experts, expertevaluation of his own expertise and analysts evaluation of an expert's expertise.
Figure 8: Mapping of TRL data to subjective logic framework. The dots representthe e�ect of uncertainty in the values of belief and disbelief. When uncertaintyapproaches 1 in the top corner of the triangle, the numerical di�erences in beliefvalues between di�erent categories become smaller. Therefore opinions with highuncertainty possess less information than opinions with low uncertainty.
In case of 4 category ordinal scale, the line between belief and disbelief can bedivided in 5 equally long segments. The centre points of these segments denotethe di�erent ordinal categories expect the line that is in the middle of belief anddisbelief, which corresponds to the omitted neutral category. By this de�nition, theprobabilities assigned for the belief of ordinal categories are: 0.9 for strongly agree,0.7 for moderately agree, 0.3 for moderately disagree and 0.1 for strongly disagree.The belief of omitted neutral category would be 0.5. By de�nition, disbelief insubjective logic is d(x) = 1− b(x).
As the data acquired by the questionnaire does not include an uncertainty value forexperts' assessments of each item, the uncertainty needs to be based on estimatedexpert value. For this, a simple scheme is suggested where both expert's own andanalysts assessment of expertise, on 0-2 integer scale, are summed to get a 0-4integer scale. This score is directly mapped to uncertainty values by: u(0) = 1,u(1) = 0.8, u(2) = 0.6, u(3) = 0.4 and u(4) = 0.2. This gives a linear, monotonouslyincreasing certainty value as the function of expertise. To meet the requirement ofbelief vector components summing to one, belief and disbelief scores need to bemultiplied by (1 − u(x). To summarise the procedure, a level 3 expert moderatelydisagreeing with an item would get a belief vector of ωx = (b(x), d(x), u(x), a(x)) =(0.18, 0.42, 0.4, 0.5). The base rate or relative atomicity is always set to 0.5 becauseno prior information on any item or expert is assumed.
As a result of applying the procedure described above, there is a list of beliefvectors for each TRL assessment item. To reach a consensus between experts,subjective logic o�ers a consensus operator combining con�icting beliefs (Jøsang,

43
2002). This operator is de�ned between opinions of agents A and by with beliefs,ωAx = (bAx , d
Ax , u
Ax , a
Ax ) and ωBx = (bBx , d
Bx , u
Bx , a
Bx ). The common denominator is de-
�ned κ = uAx + uBx − uAx uBx , which is assumed to be larger than zero throughout thisstudy.
bA,Bx = (bAx uBx + bBx u
Ax )/κ
dA,Bx = (dAx uBx + dBx u
Ax )/κ
uA,Bx = (uAx uBx )/κ (24)
aA,Bx =aAx u
Bx + aBx u
Ax − (aAx + aBx )uAx u
Bx
uAx + uBx − 2uAx uBx
The consensus operator is both commutative and associative, which means that thesame consensus between multiple opinions is reached by any order of application ofthe operator.
Calculation of a single TRL value requires the combination of di�erent questionsrelated to the TRLs. As presented earlier in the subsection 2.3, the questionnaireconsists of 13 TRL related questions per each technology which are distributed as:3 questions per TRL 1, 4 questions per TRL 2, 3 questions per TRL 3, 2 questionsper TRL 4 and one question per TRL 5. Beliefs about independent individual TRLquestions can be combined by the multiplication operator in subjective logic (Jøsang,2010). The operator is de�ned as ωx∧y for the belief frames ωx = (bx, dx, ux, ax) andωy = (by, dy, uy, ay):
bx∧y = bxby +(1− ax)aybxuy + ax(1− ay)uxby
1− axaydx∧y = dx + dy − dxdy
ux∧y = uxuy +(1− ay)bxuy + (1− ax)uxby
1− axay(25)
ax∧y = axay.
Consensus and multiplication operators allow the combination of TRL related beliefsby calculating the belief of experts agreeing with all claims related to a single TRL.This is equal to performing the operation ωx∧y∧z, where x, y and z are the TRLrelated claims for which the belief vector is achieved by the consensus operator.In order to �nd out the belief for events such as ωx∧y∧z, which corresponds to asituation where TRL items x and y have been reached but z has not. The negationor complement operator, ω¬x needed here is de�ned (Jøsang, 2001):
b¬x = dx
d¬x = bx
u¬x = ux (26)
a¬x = 1− ax

44
2.5 Reliability
2.5.1 Sensitivity analysis
There are many views on how to measure reliability of a decision analysis tool suchas the one suggested in this study. However, in this case two measures are byfar more important than the others. Firstly, the analyst does not have any priorknowledge on how many respondents there will be for the questionnaire. Moreover,it is usually even unknown how many experts there are regarding the technologiesto be assessed. Therefore, the robustness of the decision support models is the mostimportant individual measure for comparing model performances. Robustness inpractice means that the model should vary as little as possible as the function ofnumber of respondents. The robustness is measured as the model's sensitivity todata available.
Clemen (1996) de�nes sensitivity analysis as �nding out what inputs of the modelreally matter in the �nal decision. As all the data in this study is considered equal,we can only compare the models on how they perform when di�erent sets of datais used. The comparison is done using two di�erent schemes: using a random setof data sampled from the whole set of data both using and not using replacement.The former is called bootstrap sampling. The best model in robustness sense is theone that has least variation in the function of experts available to the study.
The reasoning behind the suggested scheme is to �nd out how much the results couldchange if more experts had responded to the study. The comparison is performedby item level and the performance of best available method is then compared on�nal decision level as the decision making is based on item values.
Two measures for sensitivity analysis will be used in the results section of thisstudy. Mean Absolute Percentage Error (MAPE) compares the estimates to thebest estimates achieved by each method and presents the result in percentages.The use of percentages is essential because the use of di�erent methods lead todi�erent estimates and therefore the absolute values as such would not results in afair comparison. MAPE can be de�ned by:
MAPE =n∑i=1
∣∣∣∣Ai − FiAi
∣∣∣∣ , (27)
where Ai denotes the actual value for item i and Fi the forecasted value. There aresome weaknesses in MAPE, most notably its inability to handle zero actual valuesand the fact that there is no upper limit to the percentage error, which might lead tohighly skewed error estimates. The estimates in this study will be limited betweenzero and one and most of the items to be estimated will be considerably higher thanzero.
To assess the robustness in case of biased estimators, the methods will be comparedagainst each other also using Median Absolute Deviation or MAD. MAD is a measure

45
of variability, which does not take into account the reference value of the data asMAPE does. MAD is de�ned by:
MAD = mediani(|Xi −medianj(Xj)|), (28)
which corresponds to taking the median from the absolute deviation of the data fromits median. The use of median values makes MAD robust to outliers and thereforea favourable choice for this study.
2.5.2 Veri�cation and validation
Validation of the results is not straightforward because there is naturally no referencedata available. There are in practice two strategies for validation of results, by usingall available cues of TRL status to manually validate the results or by asking the agroup of experts their opinion on the �nal results.
Validation using cues means trying to �nd publicly available information such asnews articles and scienti�c publications to get cues on the TRL. These might in-clude for example news of companies starting to manufacture a new product (i.e.market entry phase), R&D organisations successfully demonstrating a componentor prototype (i.e. applied research or prototype phase). This kind of validation isalways case speci�c and relies solely on the information available. It can be e�ec-tively used for rejecting the results because if completely contradicting informationis available, it is likely that the TRL estimates are incorrect. Searching news articlesand browsing scienti�c publications or patents is very time consuming and di�cultfor a non-technology expert making this validation scheme sometimes di�cult toapply.
Another strategy for validation is to ask the experts what they think about theresults. The experts may or may not be the same as in the assessment phase. Thisapproach closely resembles the Delphi methodology, where subsequent assessmentrounds are performed to reach a group consensus. The expert validation gives ex-perts a chance to revise their opinion and indicate if there is something very wrongwith the results. Even though the expert review is widely used for the validationof academic studies, it may still provide incorrect information for TRA purposes.The experts may not always be aware of the latest advancements and would then belikely to argue that the assessment is incorrect. It is also possible that two or moreexperts give contradictory comments in the review phase. In conclusion, there is noperfect way for validating and no method can guarantee that the estimates wouldbe indisputably valid.
Both publicly available information and expert reviews were successfully used duringthe process of TRA. Findings related to validation are presented in section 3 anddiscussed in 4.

46
2.5.3 Estimating and reducing uncertainty and bias
As discussed in literature review, there are multiple sources for uncertainty and biasin the process of Technology Readiness Assessment. The uncertainty included inthe process can be reduced by collecting large amount of data and building a modelthat tries to resolve the uncertainty as much as possible. From this perspective,one possible solution would be to de�ne Technology Readiness Levels in such detailthat the experts can give their estimate in binary statements of either true or false.This decomposition would �rst of all make TRL related claims observable variables,which would lead to a simpler assessment problem for the experts. A simple processis essential for reducing expert originating motivational and cognitive biases.
The main challenge is that de�ning very detailed claims of each TRL is a di�cult taskfor anyone. It is also very di�cult to create a technology independent questionnairethat consists of dozens of claims. Another approach for designing the questionnaireis to leave it as simple as possible and rely on each experts ability to understandand assess technology readiness as a whole. This kind of approach would require theexpert to give only one assessment of TRL per technology resulting in a very simplestatistical model where TRL would be assigned to the category which got the mostexpert votes.
In conclusion, two extreme approaches are possible in choosing the modeling ap-proach for TRA. The �rst tries to minimise expert originated biases by de�ning anexhaustive questionnaire for TRA. The challenge is that de�ning such questionnaireis a di�cult task and will probably introduce analyst originated motivational biasdue to the analyst not fully understanding the technologies being assessed. Theother approach where a minimal questionnaire is designed tries to eliminate anymodel originated biases by using as simple model as possible. This relies on theexperts in determining the TRL and requires clear de�nition of TRLs to be avail-able to the experts. As more room is left for experts own assessment, it is likelythat there will be a greater amount of motivational bias as well as cognitive biasoriginating from the expert assessment.
Other sources of biases present are more clearly related to the data collection proce-dure. The selection of respondent population is crucial to the assessment. It shouldbe large enough to cover all relevant experts but compact enough not to include anypeople that do not understand the area under study. Moreover, the questionnaireinvitation and structure need to be so attractive that the invited experts feel it isuseful for them to participate. Response rate is a good indicator for the qualityof results. A very low response rate (e.g. below 10%) indicates that there may besomething wrong with the questionnaire as the experts are not interested in takingpart. A faulty questionnaire will naturally lead in very biased estimates of the TRL.
Most of the subjects relevant for TRA require a global perspective. Especiallyin case of information and communication technologies, experts are distributed allover the world most notably in Europe, Asia and America. The English languageis a natural choice for the study but it needs to be noticed that people have very

47
di�erent levels of pro�ciency in English. Very simple language should be used toavoid bias originating from di�erent interpretations of questions. In extreme casespeople understand the question in opposite ways rendering it totally useless.
It is likely that the experts su�er from wishful thinking when assessing technologiesthey are personally working with. If TRA is used for instance in European Unionlevel funding decision, it is obvious that many experts would answer in such way thatcould increase their chances in getting more funding. One solution is to assign lowweights to experts considered su�ering from wishful thinking, which is of course verydi�cult to know. Somewhat easier task is to try weighing experts based on estimateson their expertise level. Weighing tries to ensure that opinions from best expertswould a�ect the results most but it is di�cult to de�ne who is a high quality expertand who is not. A simple weighing scheme is present in the weighed multinomialmodel as well as in subjective logic and it can be used to assign weights on expertsby any ranking considered appropriate.
2.6 Implementation
The practical implementation of the expert elicitation process consists of the follow-ing steps. First, some desk research is required for the analyst to become familiarwith the subject. It is crucial to understand the big picture of technologies to beassessed in order to design a valid questionnaire. The knowledge on current state-of-the-art and most potential emerging technologies is especially needed. In thequestionnaire design phase, the analyst needs to de�ne what is the set of technolo-gies to be assessed and what are the most relevant factors corresponding to thetechnology impact. The questionnaire is designed based on the �ndings in the deskresearch based and then executed by a web survey tool.
Analysis of the questionnaire data is typically done in either the web survey toolor in a spreadsheet application. For this study, a simple tool is developed to per-form all data preparation, analysis and reporting work semi-automatically based onanalysts commands. As the questionnaire structure is di�erent each time, a fullyautomatic solution cannot be achieved. The implementation follows the guidelinesset in requirements speci�cation in the beginning of this section. The visualisationprovided by the tool is in �gure 12 in section 3.
The tool developed is a front-end for loading the data, performing the analysis andsaving the results for later time. It also contains the analysis engine allowing aneasy extension of new analysis or visualisation methods. The main advantages ofthe tool are to reduce bias from individual analysts actions and o�er a consistentframework for visualising the results. Moreover, as the data is encapsulated by thetool there is a smaller chance for altering or losing the work in progress by accident.In conclusion, the tool developed makes the process much less vulnerable to analystoriginated biases, reduces the amount of work needed and in general results in aleaner process.

48
3 Results
3.1 Comparison
In total 8 methods are compared in this section. They are a basic multinomial model(Basic), a weighed multinomial model (Weighed), three subjective logic models (SLBasic, SL Averaging, SL Medium) with di�erent parameters, a judge-speci�c latentvariable model (Judge-speci�c), ICC based latent variable model (ICC) and raterbehaviour based latent variable model (Ratings). The basic subjective logic modelassumes that expert opinions are in the extreme ends of the belief-disbelief scale andtherefore it closely resembles the basic multinomial model. The averaging subjectivelogic model distributes the expert opinion uniformly between belief and disbelief andas a results provides estimates that are heavily biased towards neutral values, thusthe name "averaging". The SL Medium model is in between these two in terms ofthe model behaviour.
The basic multinomial model is used as a reference for the comparisons. The basicmodel does not make any assumptions on the data and it is not able to include anyadditional data in calculating the TRL score. All other methods try to bene�t fromadditional data either from the analyst (weighed multinomial and subjective logic)or from the latent structure of data and larger data set for performing the analysis(latent variable models). For instance, the basic model uses data from 28 raters forassessing the score of an individual TRL item whereas latent variable models areable to use data from roughly 28 × 13 × 4 = 1456 individual ratings (experts,TRLitems and technologies).
Table 7 reveals that from the methods compared, averaging subjective logic andratings are the least discriminating and the weighed multinomial model is the mostdiscriminating. This means that 65% of the scores given by the averaging subjectivelogic model are closer to the neutral or indecisive value than the scores given by thebasic model. To give a practical example, a model assigning all scores to the neutralvalue would get the most robust results with highest bias. Similarly the averagingsubjective logic clearly biases the scores towards the neutral value because of thehandling of uncertainty in the model. Therefore, on average the scores given by theaveraging subjective logic model are 4 percentage points closer to the neutral valuethan the scores given by the basic model. Full table of results used for calculatingthe scores for comparison can be found in Appendix D.
The latent variable models, Ratings and ICC, are also less discriminating than thebasic model. The only model that is more discriminating than the basic modelis the weighed multinomial. If the comparison is taken on the level of individualtechnologies (Tab. 8), one can see that the pattern is the same for each technology.This is because the weighed multinomial assigns larger weights for experts thatwork with a certain technology and these experts are more likely to give answerswith more con�dence and tend to favour the technology they are working with.

49
Table 7: The e�ect of models in comparison to the basic multinomial model. The�rst row indicates the share of individual TRL scores being closer to neutral opinion.The second row contains the average e�ect of the model: e.g. -4% means that onaverage subjective logic scores were 4 percentage points closer to neutral than withthe basic model. Notable deviations from expected value labeled by exclamationmarks.
Measure(unit,expected)
Weighed SL Aver-aging
SLMedium
SL Basic Ratings ICC Judge-speci�c
Scores closerto neutral (%,50%)
21 (!) 65 (!) 48 31 (!) 67 (!) 54 54
Median e�ect(pp,0%)
2 -3 (!) 1 6 (!) -2 0 0
Average e�ect(pp,0%)
2 -4 (!) 1 5 (!) -2 -1 0
St dev of the ef-fect (pp,0%)
5 7 (!) 7 (!) 8 (!) 6 (!) 5 3
The comparison on the level of individual technologies also reveals that the methodstend to favour gravure and �exography printing. In case of weighed multinomial,this is probably due to the fact that they are the least known technologies regardingtheir ability to print nanoscale features. Therefore the amount of highly skilledexperts is lower and high weights are assigned on them. The same behaviour, wheregravure and �exography get more extreme scores, can be seen for all other methods,too. This is clearly an adverse results because it means that two technologies thatget the most extreme scores with the basic method get less extreme scores with othermodels. The more advanced methods therefore tend to average the scores especiallywhen there is a clear indication of an extreme value. In practice this would leadto a situation where an item that gets 100% respondents agreeing a priori wouldget signi�cantly lower score after applying the more advanced models because themodels would think this as a faulty score that is not likely given rest of the data.
Table 8: Results broken down on the level of individual technologies show thatnanoimprint lithography is drawn most aggressively towards neutral values. Weighedmultinomial model on the other hand provides more extreme results for each tech-nology. ICC and Judge-speci�c models provide the most robust results in broadsense. Notable deviations from expected value labeled by exclamation marks.
[pp] Weighed SL Aver-aging
SLMedium
SL Basic Ratings ICC Judge-speci�c
NILAverage 1 -8 (!) -3 2 -7 -2 0Median 0 -11 (!) -4 -1 -6 -2 0St dev 4 8 (!) 8 (!) 9 (!) 5 5 0
INKAverage 2 -3 0 4 -2 -2 0Median 2 -3 2 5 -2 -2 0St dev 5 8 (!) 8 (!) 8 (!) 6 5 3
GRAAverage 3 -1 4 8 (!) 1 0 1Median 2 0 5 8 (!) 2 1 0St dev 3 4 4 4 6 4 3
FLEAverage 4 -3 1 4 -2 1 1Median 5 -1 0 5 -2 2 0St dev 5 8 (!) 8 (!) 10 (!) 6 5 3

50
3.2 Reliability, robustness and sensitivity
A view to the reliability of methods is got by comparing them in terms of deviationfrom the best available estimate as well as their variability. The deviation from thebest available estimate, as a function of number of respondents, is calculated foreach method separately. The reference value, i.e. the best available estimate, is themedian estimate with the full population of respondents. Using bootstrap sampling,1000 samplings for an increasing number of respondents (15 to 28) are drawn fromthe full dataset for comparing the methods. All estimates are then compared to thereference value and an average relative error (in percentages) is plotted in �gure 9a.
Tests were executed at the same time with same samples for all methods apartfrom "Judge-speci�c". A sample size of 1000 was used, which seems to be largeenough for the results to converge close to their �nal values. Tests for the "Judge-speci�c" method were run independently from others with 500 samples and 500MCMC iterations for each sample. The convergence of MCMC iterations was onlyinspected visually because it is not in the focus of this thesis. The results are verywell in line with other methods and do not indicate that further inspection would berequired for MCMC convergence. Execution of 500 samplings for "Judge-speci�c"method and 1000 samplings for other methods takes a full weekend to �nish evenon the most powerful student computer provided by the Aalto University.
Figure 9a shows that there are clear di�erences in the robustness of the methods.This is closely linked with the type of the methods, as the three least averagingmethods perform the worst. This is because the basic methods do not make anyassumptions on the data, which increases the variance of results. From robustnessviewpoint, latent variable models Ratings and ICC, achieve similar performanceeven though their implementations di�er signi�cantly. Finally, the subjective logicimplementing a classi�cation for expert uncertainty seems to be the most robust ofthe compared methods. This, however, comes with a price of the method being themost biased as well.
Another view to robustness is achieved by calculating the Median Absolute De-viation (MAD) for the bootstrapped estimates. The MADs in �gure 9b show asimilar pattern that is achieved for average errors. This concludes the point thatthe more advanced methods for aggregating expert opinion have clearly an e�ect inthe robustness of results achieved.
Based on results introduced earlier in this section, subjective logic seems the mostconvenient method for expert opinion aggregation in this case. None of the more ad-vanced latent variable models proved to be signi�cantly better than subjective logicin terms of reliability, robustness and sensitivity measures used. Moreover, sub-jective logic provides very convenient operators for combining beliefs from varioussources of information and merging of di�erent statements by e.g. the multipli-cation operator. The performance of ICC is perhaps the largest surprise in thecomparison. It is the simplest from latent variable models, results in good robust-ness and relatively low bias. The reason for choosing subjective logic over ICC for

51
16 18 20 22 24 26 28
010
2030
40
Relative errors of estimates
Number of experts
MA
PE
[%]
010
2030
40BasicWeighedSL BasicSL AveragingRatingsICCJudge−specific
(a) Median Absolute Percentage Error (MAPE)
16 18 20 22 24 26 28
0.00
0.05
0.10
0.15
0.20
Median absolute deviations of estimates
Number of experts
MA
D
0.00
0.05
0.10
0.15
0.20
BasicWeighedSL BasicSL AveragingRatingsICCJudge−specific
(b) Median Absolute Deviation (MAD)
Figure 9: Median Absolute Percentage Error (MAPE) (a) and Median Absolute De-viation (MAD)(b) for estimates of methods compared. Clear groups with di�erentperformance levels are present in �gure (a) whereas the results in (b) are more dis-persed. Both measures, however, lead to same conclusion of methods' performances.

52
full TRL estimates is that subjective logic can be modi�ed more easily for di�erentquestionnaire settings and the performance di�erence is very small between the twomethods.
Based on the TRL data interpretation scheme suggested in section 2, the �nal beliefmass in favour of a certain TRL level to be reached is equal to the average of beliefmasses in favour of sub-TRLs have been reached according to the equation below.In the equation a denotes the number of items agreed on the left hand side and ieach item the TRL consists of.
b(3a) +2
3b(2a) +
1
3b(1a) =
b(i1) + b(i2) + b(i3)
3(29)
Figure 10 represents the average error in case of TRL 1 as a function of the numberof respondents. TRL 1 consists of 3 items and it is easy to notice that the aver-age errors are in fact approximately one third of the average error of item speci�cerrors. Moreover, when three items have been composed into the TRL estimator,the di�erence in relative errors between the methods get smaller. It is very likelythat this e�ect results from the correlation between the items. In case of TRL 1,all the items describe actions in fundamental research phase, which are interlinkedwith each other up to some extent. This linkage or correlation between items resultsin lower variance in the �nal results.
10 15 20 25
05
1015
Relative error of final estimate
Number of experts (bootstrapped)
MA
PE
05
1015
SL BasicSL AveragingSL Medium
Figure 10: MAPE for TRL 1 probability of Nanoimprint lithography as function ofnumber of respondents. Sampling with replacement (bootstrap), number of samples100.

53
Even though the variance of the results is smaller in the �nal estimates, there arestill signi�cant di�erences between di�erent methods. Figure 11 shows that theaveraging subjective logic framework in terms of deviation of results estimates theprobability of TRL 1 at 65%. On the other hand, the SL Basic with most deviationswould suggest the probability of TRL 1 being approximately 75%. Based on theseresults of the �nal estimates, using multiple items to de�ne the levels of TRL is away to decrease variability of the �nal results but it does not guarantee that therewould be no di�erences between the analysis methods used.
10 15 20 25
0.0
0.2
0.4
0.6
0.8
1.0
Number of experts
Qua
ntile
s fo
r S
L B
asic
0.0
0.2
0.4
0.6
0.8
1.0
10 15 20 25
0.0
0.2
0.4
0.6
0.8
1.0
Number of experts
Qua
ntile
s fo
r S
L A
vera
ging
0.0
0.2
0.4
0.6
0.8
1.0
Quantiles
minimum5%25%median75%95%maximum
10 15 20 250.
00.
20.
40.
60.
81.
0
Number of experts
Qua
ntile
s fo
r S
L M
ediu
m0.
00.
20.
40.
60.
81.
0
(a) Sampling with replacement (Bootstrap)
10 15 20 25
0.0
0.2
0.4
0.6
0.8
1.0
Number of experts
Qua
ntile
s fo
r S
L B
asic
0.0
0.2
0.4
0.6
0.8
1.0
10 15 20 25
0.0
0.2
0.4
0.6
0.8
1.0
Number of experts
Qua
ntile
s fo
r S
L A
vera
ging
0.0
0.2
0.4
0.6
0.8
1.0
Quantiles
minimum5%25%median75%95%maximum
10 15 20 25
0.0
0.2
0.4
0.6
0.8
1.0
Number of experts
Qua
ntile
s fo
r S
L M
ediu
m0.
00.
20.
40.
60.
81.
0
(b) Sampling without replacement
Figure 11: Distribution of the �nal estimate of TRL 1 for Nanoimprint lithogra-phy. (a) Sampling with replacement (bootstrap), (b) sampling without replacement.Number of samples 100. The most averaging subjective logic variant has least vari-ation whereas the basic subjective logic has most variation.

54
3.3 Final estimates
Figure 12 represents the �nal results obtained by the tool implemented. Basedon the evidence reported earlier in this section, subjective logic was selected asthe aggregation method because it is simple to implement and provides adequateperformance. The same method is used for aggregating both TRLs and technologyimpacts taking into consideration that 4 level ordinal scale was used for TRLs and 5levels for the impact. Estimates of individual impacts are listed in table 9 suggestingthat the nanoimprint lithography has clearly the highest potential of succeeding infuture.
Figure 12: Final estimates obtained by the tool. Analysis method used is subjectivelogic
In case of TRLs, achieving the �nal estimates requires de�nition of a probability levelwhen a certain TRL level is reached. Figure 11 shows that di�erent analysis methodssuggested di�erent probabilities for TRL 1 to be reached in case of Nanoimprintlithography technology and whether TRL 1 can be assigned for NIL technologydepends on the limit. The motivation for using expert elicitation scheme in the�rst place is to obtain as objective estimates for the TRL status as possible. It isvery di�cult to know, which one of the experts possesses correct information onthe TRL status and therefore it is also di�cult to set the decision limit when a

55
Table 9: Impact values for nanoscale printing technologies for the moment beingand at estimated time of market entry. Resulting impacts are plotted in �gure 12
[%] Novel features Performance Cost e�ectiveness Scalability EHS AverageNowNIL 78 73 71 81 75 76INK 77 51 63 64 66 64GRA 51 59 63 63 60 59FLE 41 60 73 75 58 62Market entryNIL 89 86 84 87 81 85INK 77 70 73 72 70 72GRA 64 71 76 73 57 68FLE 62 69 74 71 55 66
level of TRL should be reached. Based on practical consideration, the decision limitshould lie somewhere between 70% and 90%. Limits above 90% would result in eachtechnology obtaining TRL 0 just because there is a small number of experts whodo not really know what is really going on in the �eld. Setting the limit so highwould mean a highly negative approach. On the other hand, a limit of 50% wouldmean that only half of the probability mass is in favour of reaching a TRL leadingto highly positive and thus biased estimates.
The e�ect of decision limit setting can be seen in table 10. The e�ect is huge as 10%di�erence in the decision limit can result in one level di�erence in the TRL estimate.One possible explanation based on �ndings in ObservatoryNANO (2010c) can bethat nanoimprint lithography and ink-jet printing are the most common printedelectronic technologies used. Therefore, if all the issues of printing nanoscale featurescan be solved, these technologies are immediately ready for prototype productionthus leading to rapid development in the technology readiness. This is not the casewith gravure and �exography printing with which it is unclear if they can ever beused for printing nanoscale features. Nevertheless, the choice of the decision limititself is very di�cult and can lead to highly biased results. The results here alsoindicate that technology readiness is not a strictly linear process. Linearity, however,is assumed in this work to make analysis and visualisation of results simpler.
Table 10: TRL level estimates on di�erent decision limits. The limit setting greatlya�ects the results, which need to be considered when analysing the results.
Limit 50% 60% 70 % 80 % 90%NIL 2.5 2.5 1.9 0.9 0.8INK 2.7 1.9 0.9 0.8 0.7GRA 0.5 0.5 0.4 0.3 0.3FLE 0.6 0.5 0.4 0.4 0.3
The decision tool was also used for TRA of universal memory technologies, whichare a group of non-volatile random access memory technologies (ObservatoryNANO,2010a). The questionnaire had similar structure to ones used for printed electronicsand optical interconnects with the di�erence of TRL assessment consisting of onlyone question per TRL. Some of the universal memory technologies have already

56
entered the market and therefore there is clearly more variation in the TRL levelsassigned to di�erent technologies. Corresponding results of the universal memoryTRA are in table 11.
In case of universal memory (table 11), there is much less sensitivity in the resultsthan in the printed electronics case. It is clear that decision limit of 90% is too high.There is also little di�erence between results based on decision limit of 50% and60% indicating that both are too low values for the limit. According to the table,four of the technologies (MRAM, FeRAM, PCRAM and SONOS) are already in themarket. This correctly represents the reality and can be validated from multiplesources in the media and was con�rmed by a number of experts in the peer-reviewof the ObservatoryNANO project Universal Memory brie�ng (ObservatoryNANO,2010a). Based on this reasoning, the correct decision limit in this case is somewhereclose to 70%.
Table 11: TRL level estimates on di�erent decision limits. The limit setting greatlya�ects the results, which need to be considered when analysing the results.
Limit 50% 60% 70 % 80 % 90%MRAM 5.0 4.9 4.7 4.0 1.0QD RAM 3.0 2.8 2.7 2.6 2.0FeRAM 5.0 5.0 5.0 5.0 4.0PCRAM 4.8 4.7 4.6 3.9 1.0RRAM 3.5 3.4 2.9 2.8 0.9CNT RAM 3.4 3.3 3.3 3.0 0.9Racetrack 3.6 2.9 1.9 0.9 0.8Millipede 0.5 0.4 0.4 0.3 0.3CBRAM 3.6 3.5 3.4 3.4 0.9SONOS 5.0 4.9 4.8 3.9 3.0NEMS RAM 5.0 5.0 3.9 3.8 0.9
Given the tables 10 and 11, it is not clear where the decision limit of reaching acertain TRL should be set. There is no correct value for the limit and it is verylikely that best results will be achieved by tuning the parameter case speci�callybecause the data set properties vary between di�erent questionnaires and respondentpopulations. Tuning the decision limit brings another source of bias in the analysisprocess. The e�ect of di�erent parameter values is brie�y discussed here but a moredetailed discussion would require more experience for applying the tool in real worldTRA exercises.
3.4 Validation of results: case universal memory
The most recent application of the tool and process in practice at time of writingthis thesis is the ObservatoryNANO universal memory brie�ng (ObservatoryNANO,2010a). In total 51 experts in various areas of emerging memory technologies were

57
contacted during the process and the composed results can be seen in �gure 13.The information collection process included quantitative questions regarding TRL,technology impact and time estimates. A large amount of qualitative informationwas also collected.
Figure 13: Final estimates obtained by the tool for Universal Memory technologies.Original �gure provided by the tool slightly modi�ed manually in order to �t it inreport template. Circle size denotes the number of respondents to the questionnaire,which is directly related to reliability of the results. Therefore the conclusion forRRAM, PCRAM and MRAM can be considered most reliable. Red color used showswhat are the most potential technologies according to qualitative feedback from theexperts. The number inside circles tells the median estimate of time to market entryor maturation.
The validation of results was performed by both expert peer review and validationby publicly available cues. Four technologies, namely PCRAM, MRAM, SONOSand FeRAM, are claimed to lie in between market entry and mature markets ac-cording to the experts contacted. This can be validated by public search enginesand press releases from semiconductor companies developing memory technologies.For instance, Fujitsu company reports on its website that it has already deliveredsome 100 million FeRAM devices, which concludes the point. None of the expertsin the review process argued against the TRL suggestion regarding these maturetechnologies. Hewlett-Packard and Hynix have reported their plans to sell RRAMend-user products by the end of 2013, which is reasonable close to the expert assess-ment3. According to the news article and other news on the subject, the RRAM isclearly in the prototype phase.
3EETimes: "HP, Hynix to commercialize the memristor" (August, 2010)

58
3.5 Other means for estimating technology readiness level
The questionnaire used for nanoscale printed electronics TRL assessment also in-cluded a question where experts were asked to indicate a time estimate of whenthey expect a certain TRL to be reached 4.3. A 5 point scale is used with levelscorresponding to TRL already reached (Now), TRL will be reached in short term(1-3 years), TRL will be reached in medium term (4-7 years), TRL will be reachedin long term (Later) or TRL will never be reached (Never). The last option is givenfor the experts to indicate that the technology will never mature up to a certainlevel due to e.g. limitations in the technology.
Table 12: Estimating TRL by year estimates. Experts gave their answer on scale{Now, 1-3 years (Short), 4-7 years (Medium), Later (Long), Never}. The scale isalso transformed to numerical values and means are calculated for the values. TRLestimated from expert given year estimates gives slightly more optimistic resultsthan the detailed claims.
TRL 1 TRL 2 TRL 3 TRL 4 TRL 5
NILMode Now Short Short Medium Long
Median Now Short Short Medium LongMean [1.0, 2.9] [1.3, 3.7] [1.7, 4.6] [3.3, 7.0] [5.9, 10.1]
INKMode Now Short Short Medium Long
Median Now Short Short Medium LongMean [0.6, 2.1] [1.5, 4.0] [1.8, 4.7] [3.3, 6.9] [5.5, 9.5]
GRAMode Now Short Short Medium Long
Median Now-Short Short Medium Medium LongMean [0.6, 2.5] [1.3, 3.8] [2.9, 6.4] [4.0, 7.9] [6.7, 11.0]
FLEMode Short Short Short Medium Long
Median Short Short Medium Medium LongMean [0.5, 2.6] [1.6, 4.6] [2.9, 6.4] [3.7, 7.6] [6.4, 10.8]
Table 12 presents this data in terms of mode, median and mean. Mode and medianrepresent the original categories whereas the mean is calculated from lower and upperlimits of the categories. Based on the table, it can be concluded that nanoimprintlithography, ink-jet printing and gravure printing either have reached TRL 1 or arevery close to reaching it. Flexography printing will most probably reach TRL 1 in1-3 years if time. Moreover, according to the time estimates it is quite clear thatnone of the technologies have reached TRL 2 or any of the higher TRLs. It will takemore at least 4 years for any nanoscale printing method to reach the market andalmost 10 years to reach the mature market phase.
Means calculated from the category limits give somewhat controversial results whencompared to modes and medians. For instance, the mode and median state that�exography printing will be the last technology to reach TRL 1 but mean indicatesthat it would be among the �rst ones. The means seem to be well in line with modesand medians in case of TRL 2 and TRL 4.

59
As a conclusion, year estimates can be used for estimating TRLs up to some extentbut the largest challenge is that estimating reliability of the results becomes muchmore di�cult. On the other hand, the year estimates provide perhaps the mostimportant results of the whole TRL assessment scheme as they provide an insightin what will happen in the future. They can be used for assessing the TRLs, too,but decision on the assessment scheme should be made case by case. Use of yearestimates for TRL estimation was tested in practice for the optical interconnectscase (ObservatoryNANO, 2010b) and it proved to work reasonably well.

60
4 Discussion
4.1 Process
The process for TRA has been considered from multiple points of view during thecourse of this thesis. The background of this work lies in various attempts in indus-try and academia to understand technology readiness and its assessment. On theother hand, expert opinion elicitation and aggregation along with its advantages,limitations and uncertainties have been considered. As a result, a process and a toolfor expert elicitation for Technology Readiness Assessment was developed.
The work from NASA and DoD for evaluating the TRL shows that the scheme haspractical relevance and the fact that TRLs have been adopted by multiple organ-isations around the world (including the ObservatoryNANO project) proves thatthere is a need for such concept. All the organisations so far have been using TRLsas an internal tool where the assessment work is done by an individual or a smallgroup. In the ObservatoryNANO project, TRLs are used for reporting technologicaladvancements to the general public. The general process for producing reports forthe project have included desk research, expert interviews and questionnaire andtherefore it is sensible to try to improve the quality of the process and make it more�uent by designing a process for expert elicitation.
Apart from executing expert interviews and questionnaires, there was no priorknowledge on how the experts would react to the web questionnaires and how toanalyse the data. A practical approach was selected using a set of simple emailbased questionnaires for obtaining the data. This kind of approach is reasonablebecause in general expert opinion data is very costly to obtain. As a surprise, thereception of questionnaires and feedback from experts was very positive. Moreover,the response rates reaching 30% can be considered very high for web questionnaireson any standards. Many of the respondents replied to the invitation with gratitudeand they were also eager to see the results when published.
Despite the warm welcome, it is by no means easy to design and execute such surveys.Even though much consideration is put in questionnaire design and understandingthe technology, there is a chance of asking wrong questions. Therefore, understand-ing the technology is crucial and the requirement cannot be bypassed by developingthe process further. The worst case scenario for questionnaire design would be thatit cannot be used at all because irrelevant or faulty questions were asked becauseof limited technological knowledge. Language and cultural issues also play a rolein the data collection. The scope of questionnaires is world-wide and the languageskills and culture vary from expert to expert. The questions should be so unam-biguous that every respondent understands them in the same way. This requirementis very hard to satisfy and one has to rely on the assumption that majority of therespondents got the question correctly.
It is also very di�cult to obtain a statistically valid sample, which needs to be

61
taken into account when analysing and interpreting the results. The amount ofresponses received should be at least on the level achieved in this study: from 30 to50 experts. This of course depends on the number of technologies to be assessed,the more technologies the more experts need to be reached. As the response ratesachieved were above 10%, the number of respondents can be quite easily increasedby inviting more people to participate in the study. There is of course a limit to thisbecause there is no reason to invite non-experts to join the study and therefore thesample size cannot be increased in�nitely.
The results and �ndings of this study can be considered from qualitative and quan-titative points of view. The former includes the whole process as a way for collect-ing and analysing expert opinion and reporting the TRL status based on multiplesources of information. Previously, the process for producing reports for the Obser-vatoryNANO project has included desk research, expert interviews and case speci�cquestionnaires. The process developed here partially answers to each part by provid-ing a lot of qualitative information on the TRL status, which could only be receivedby extensive expert interviews. Quantitative data is also obtained and this datacan be used for creating visualisations to support other parts of the TRA. Similarlyto the Delphi process, the quantitative data cannot be considered as a statisticalrepresentation of the technology status and therefore one needs to be careful on howto interpret the results.
4.2 Methodology
Altogether three approaches for questionnaire design and TRL assessment were pre-sented in sections 2 and 3. The most thorough follows the guidelines of NASA/DoD'sTRA process where each TRL consists of several items, which need to be achievedbefore a certain TRL can be reached. This approach was applied for analysingnanoscale printed electronics manufacturing technologies. It is mostly used in de-velopment of the analysis framework presented in this study.
A simpler approach was employed in the case of optical interconnects consisting ofbare time estimates provided by the experts. This results in a much shorter ques-tionnaire still making proper execution of TRA possible. The largest disadvantageis that the experts only provide a time estimate without any indications of theircon�dence, which makes estimation of uncertainty more di�cult. TRA frameworkdeveloped in this study does not currently utilise time estimates but their analysisis rather simple in a spreadsheet program.
The �nal approach simpli�ed the original TRA scheme by using only one questionper TRL, i.e. whether the TRL has been reached or not. A 7-point ordinal scalewas used and the analysis was performed with the framework developed.
In conclusion, there is no clear answer to how the TRL status should be asked fromthe experts. According to table 3 in section 2, the respondents behaved similarly ineach case and approximately 55% of the experts who clicked the invitation link also

62
responded to the questionnaire. The di�erences in the ratio of "Clicked" invitees isdependent on the population and attractiveness of the invitation letter. These �nd-ings suggest that the questionnaire design can be altered case speci�cally accordingto expectations from the TRA results. For a general overview, it may be enough touse a simple questionnaire but in more complex cases more thorough approach canbe applied.
The TRA process developed by NASA/DoD is essentially linear and results in binaryestimates of TRL. This is understandable when the TRA is used for risk analysisand a certain risks are closely related to TRLs. For forecasting purposes that are acentral part of this study, greater �exibility could be allowed in assigning the TRL.This could in practice mean assigning a probability for each TRL and visualising theinformation e�ectively. The visualisation is, however, supposed to be very simpleand including the distributions could end up in a messy result di�cult to use inpractice. The process as such does not take into consideration the fact that maturetechnologies also develop all the time. The development can be modelled by technol-ogy impact but currently the model is only a static representation of the technologystatus. An estimate for TRL development is included in the visualisation and futureimpact estimates were asked in the printed electronics questionnaire but the expertsfound it di�cult because the de�nition of a reference level is not unambiguous.
4.3 Future research
The process developed in this thesis deals with multiple disciplines. Background forthe assessment framework includes technology readiness assessment by NASA/DoD,general technology assessment theories from multiple authors, decision analysis the-ory and elicitation and aggregation of expert opinion. Based on the �ndings of thisstudy, there is no clear need for studying di�erent analysis methods further unlessmore e�ort is put in the data collection �rst.
Before executing the questionnaires for the three cases presented earlier, it was veryuncertain if a web questionnaire is a suitable tool for collecting expert opinion forTRA. It turned out that a large amount of both quantitative and qualitative datacan be collected in such way and it is possible to �nd out the technological status bythe process developed here. The simplest way for achieving higher quality resultswould be increasing the amount of experts taking part in the process and furtherimproving the questionnaire invitation letter and structure.
To increase the amount of expert contribution the questionnaires could be used aspart of a Delphi process for instance in an international conference. This would, ofcourse, require a signi�cant e�ort from the analyst, which is in contrast with therequirements speci�ed in section 2. Another more likely scenario could be intro-ducing periodical screening of certain technology areas, where the same group ofexperts would provide their feedback in e.g. 6 or 12 month intervals. This kind ofapproach would add a temporal dimension in TRA. Thus, one possible theme for

63
future research would be how to improve the reliability of the analysis by gettingthe experts more involved in the process.
Another viable goal for future research would be to study the e�ect of variations inthe questionnaire design to the �nal results. This could include both questionnairestructure and data type to be collected. Three di�erent structures were introducedin this study and further research could try to address what are the factors in thequestionnaire structure a�ecting response rate and what kind of questionnaire hasthe best balance between response rate and quality of responses. Another importantpart in the questionnaire design is also the model and corresponding data collectionof expert uncertainty.
The subjective logic framework, for instance, allows the use of continuous scalesfor both belief and uncertainty for each individual item. Therefore, it would befavourable if the questionnaire allowed the experts to give estimates of their levelof certainty for each individual item. One possible method for gathering this kindof information could be the Visual Analog Scale (VAS) used in psychometrics andimplemented in some web survey platforms. Such method for data collection couldpotentially lead to simpler questionnaire structure capable of collecting more datathan the current solution. Visual Analog Scale is not, however, implemented in thesurvey platform used and therefore its application was not possible for this thesis.Currently, most commercial survey platforms do not have an implementation forVAS which furthermore limits its applicability.
In conclusion, the framework and tool for technology readiness assessment haveproven to be useful for the purpose they are designed. The process provides in-dependent information to support traditional qualitative analysis, which de�nitelyhelps the TRA process even though the statistical signi�cance cannot be guaranteed.This is in line with the Delphi method that is the closest counterpart in technologyassessment methodology. Based on practical experience from applying the tool inreal world exercises of printed electronics, optical interconnects and universal mem-ory, the methodology works as it was intended to. According to expert reviewsand manual validation of results from various sources, it seems that the estimatesrepresent the current technology status rather accurately.
64
References
Aaltonen, M. (2009). Evaluation and organization of futures research methodology- version 3.0.
Altunok, T. and Cakmak, T. (2010). A technology readiness levels (TRLs) calculatorsoftware for systems engineering and technology management tool. Advances inEngineering Software, 41(5):769 � 778.
Bhushan, B., editor (2006). Springer handbook of nanotechnology. Springer� NewYork.
Britt, B. L., Berry, M. W., Browne, M., Merrell, M. A., and Kolpack, J. (2008). Doc-ument classi�cation techniques for automated technology readiness level analysis.J. Am. Soc. Inf. Sci. Technol., 59(4):675�680.
Clemen, R. T. (1987). Combining overlapping information. Management Science,33(3):373�380.
Clemen, R. T. (1996.). Making hard decisions: an introduction to decision analysis.Duxbury Press� Belmont, CA.
Clemen, R. T. and Winkler, R. L. (1999). Combining probability distributions fromexperts in risk analysis. Risk Analysis, 19:187�203(17).
Daneshkhah, A. R. (2004). Uncertainty in probabilistic risk assessment: A review.A BEEP working paper, The University of She�eld.
DoD (2009). Technology Readiness Assessment (TRA) Deskbook. Department ofDefense.
European Space Agency (ESA) (2009). What is technology? http://www.
esa.int/SPECIALS/Technology/SEMYSRWPXPF_0.html. [Online; Accessed 20-October-2010].
Galbraith, C., Ehrlich, S., and DeNoble, A. (2006). Predicting technology success:Identifying key predictors and assessing expert evaluation for advanced technolo-gies. The Journal of Technology Transfer, 31(6):673�684.
Garthwaite, P. and Dickey, J. (1985). Double- and single-bisection methods for sub-jective probability assessment in a location-scale family. Journal of Econometrics,29(1-2):149�163.
Glenn, J. C. and Gordon, T. J. (2009). Futures Research Methodology Version 3.0.The Millennium Project, 3.0 edition.
Graettinger, C. P., Garcia, S., Siviy, J., Schenk, R. J., and Syckle, P. J. V. (2002).Using the technology readiness scale to support technology management in thedod's atd/sto environments - a �ndings and recommendations report conductedfor army cecom. Technical report, Carnegie Mellon Software Engineering Institute.

65
Hamilton, M. B. (2009). Online survey response rates and times. http://www.
supersurvey.com/papers/supersurvey_white_paper_response_rates.pdf.[Online; Accessed 20-October-2010].
Hassall, J. (1999). Methods of analysing ordinal/interval questionnaire data usingfuzzy mathematical principle.
Ho, D. E. and Quinn, K. M. (2008). Improving the presentation and interpreta-tion of online ratings data with model-based �gures. The American Statistician,62(4):279�288.
James, A., Choy, S. L., and Mengersen, K. (2010a). Elicitator: An expert elicitationtool for regression in ecology. Environmental Modelling & Software, 25(1):129 �145.
James, A., Choy, S. L., and Mengersen, K. (2010b). Elicitator: An expert elicitationtool for regression in ecology. Environ. Model. Softw., 25(1):129�145.
Johnson, V. E. and Albert, J. H. (2001). Ordinal Data Modeling (Statistics for Socialand Behavioral Sciences). Springer, 1st ed. 1999. corr. 2nd printing edition.
Jøsang, A. (2001). A logic for uncertain probabilities. International Journal ofUncertainty, Fuzziness and Knowlege-Based Systems, 9(3):279�311.
Jøsang, A. (2002). The consensus operator for combining beliefs. Arti�cial Intelli-gence, 141(1-2):157�170.
Jøsang, A. (2010). Subjective logic. http://persons.unik.no/josang/papers/
subjective_logic.pdf. Unpublished draft [Online; Accessed 20-October-2010].
Jøsang, A. and Knapskog, S. J. (1998). A metric for trusted systems. Proceedingsof the 21st National Security Conference.
Kaplowitz, M. D., Hadlock, T. D., and Levine, R. (2004). A Comparison of Weband Mail Survey Response Rates. Public Opin Q, 68(1):94�101.
Kuhnert, P., Hayes, K., Martin, T. G., and F., M. M. (2009). Expert opinion instatistical models. 18th World IMACS / MODSIM Congress.
Kynn, M. (2008). The heuristics and biases bias in expert elicitation. Journal ofthe Royal Statistical Society: Series A (Statistics in Society), 171:239�264(26).
Lipscomb, J., Parmigiani, G., and Hasselblad, V. (1998). Combining expert judg-ment by hierarchical modeling: An application to physician sta�ng. ManagementScience, 44(2):149�161.
Liu, I. and Agresti, A. (2005). The analysis of ordered categorical data: An overviewand a survey of recent developments. TEST: An O�cial Journal of the SpanishSociety of Statistics and Operations Research, 14(1):1�73.

66
Malhotra, N. K. (cop. 2004.). Marketing research: an applied orientation. PrenticeHall� Upper Saddle River, N.J.
Mankins, J. C. (1995). Technology readiness levels. http://www.hq.nasa.gov/
office/codeq/trl/trl.pdf. [Online; Accessed 20-October-2010].
Mankins, J. C. (2009). Technology readiness assessments: A retrospective. ActaAstronautica, 65(9-10):1216 � 1223.
Martin, H. and Daim, T. (2007). Technology roadmapping through intelligenceanalysis: Nanotechnology. pages 1613 �1622.
Mast, J. D. and Wieringen, W. V. (2004). Special issue measurement system analysisfor bounded ordinal data. Quality and Reliability Engineering International.
Merriam-Webster Online Dictionary (2010a). "science". http://www.
merriam-webster.com/dictionary/science. [Online; Accessed 20-October-2010].
Merriam-Webster Online Dictionary (2010b). "technology". http://www.
merriam-webster.com/dictionary/technology. [Online; Accessed 20-October-2010].
Meyer, M. A. and Booker, J. M. (1991.). Eliciting and analyzing expert judgement:a practical guide. Academic Press� London.
Morris, P. A. (1974). Decision analysis expert use. Management Science, 20(9):1233�1241.
Morris, P. A. (1977). Combining expert judgments: A bayesian approach. Manage-ment Science, 23(7):679�693.
Nolte, W. L., Kennedy, B. C., and Dziegiel, R. J. J. (2003). Technology readi-ness level calculator. www.dtic.mil/ndia/2003systems/nolte.ppt. [Online;Accessed 20-October-2010].
ObservatoryNANO (2010a). Brie�ng no.4: Universal memory. http://www.
observatorynano.eu/project/document/3357/. [Online; Accessed 20-October-2010].
ObservatoryNANO (2010b). Ict sector focus report: Nanophotonics for optical com-munications. http://www.observatorynano.eu/project/filesystem/files/
ObservatoryNanoFocusReport_OpticalInterconnects.pdf. [Online; Accessed20-October-2010].
ObservatoryNANO (2010c). Ict sector focus report: Printed electron-ics. http://www.observatorynano.eu/project/filesystem/files/
ObservatoryNanoFocusReport_PrintedElectronics.pdf. [Online; Accessed20-October-2010].

67
ObservatoryNANO (2010d). Observatorynano factsheets. http://www.
observatorynano.eu/project/document/3319/. [Online; Accessed 20-October-2010].
Ouchi, F. (2004). A literature review on the use of expert opinion in probabilisticrisk analysis. Policy Research Working Paper Series 3201, The World Bank.
Pearl, J. (1990). Reasoning with belief functions: An analysis of compatibility.International Journal of Approximate Reasoning, 4:363�389.
Poole, C. P., Jones, F. J., and Owens, F. J. (2003). Introduction to Nanotechnology.John Wiley & Sons, Inc., New York, NY, USA.
Porter, A. L., Ashton, W. B., Clar, G., Coates, J. F., Cuhls, K., Cunningham,S. W., Ducatel, K., van der Duin, P., Georgehiou, L., Gordon, T., Linstone, H.,Marchau, V., Massari, G., Miles, I., Mogee, M., Salo, A., Scapolo, F., Smits, R.,and Thissen, W. (2004). Technology futures analysis: Toward integration of the�eld and new methods. Technological Forecasting and Social Change, 71(3):287�303.
Roco, M. (2001). International strategy for nanotechnology research and develop-ment. Journal of Nanoparticle Research, 3(5-6):353�360.
Sheehan, K. (2001). E-mail survey response rates: A review. http://jcmc.
indiana.edu/vol6/issue2/sheehan.html. [Online; Accessed 20-October-2010].
Stevens, S. S. (1946). On the theory of scales of measurement. Science,103(2684):677�680.
UK MOD (2010). Policy, information and guidance on the technology managementaspects of uk mod defence acquisition. http://www.aof.mod.uk/aofcontent/
tactical/techman/index.htm. [Online; Accessed 20-October-2010].
Winkler, R. L. (1996). Uncertainty in probabilistic risk assessment. ReliabilityEngineering & System Safety, 54(2-3):127 � 132. Treatment of Aleatory andEpistemic Uncertainty.

68
Appendix A
0 % 10 % 20 % 30 % 40 % 50 % 60 % 70 % 80 % 90 % 100 %
Fundamental 1
Fundamental 2
Fundamental 3
Applied 1
Applied 2
Applied 3
Applied 4
Prototype 1
Prototype 2
Prototype 3
Markets 1
Markets 2
Markets 3
Strongly agree Moderately agree Moderately disagree Strongly disagree
(a) Nanoimprint lithography
0 % 10 % 20 % 30 % 40 % 50 % 60 % 70 % 80 % 90 % 100 %
Fundamental 1
Fundamental 2
Fundamental 3
Applied 1
Applied 2
Applied 3
Applied 4
Prototype 1
Prototype 2
Prototype 3
Markets 1
Markets 2
Markets 3
Strongly agree Moderately agree Moderately disagree Strongly disagree
(b) Ink-jet printing
Figure A.1: Data on TRL related claims for printed electronic manufacturing tech-nologies: Nanoimprint lithography (a) and ink-jet printing (b)

69
0 % 10 % 20 % 30 % 40 % 50 % 60 % 70 % 80 % 90 % 100 %
Fundamental 1
Fundamental 2
Fundamental 3
Applied 1
Applied 2
Applied 3
Applied 4
Prototype 1
Prototype 2
Prototype 3
Markets 1
Markets 2
Markets 3
Strongly agree Moderately agree Moderately disagree Strongly disagree
(a) Gravure printing
0 % 10 % 20 % 30 % 40 % 50 % 60 % 70 % 80 % 90 % 100 %
Fundamental 1
Fundamental 2
Fundamental 3
Applied 1
Applied 2
Applied 3
Applied 4
Prototype 1
Prototype 2
Prototype 3
Markets 1
Markets 2
Markets 3
Strongly agree Moderately agree Moderately disagree Strongly disagree
(b) Flexography printing
Figure A.2: Data on TRL related claims for printed electronic manufacturing tech-nologies: gravure printing (a) and �exography printing (b)

70
Appendix B
Table B.1: A simple taxonomy of Futures Research Methods (Glenn and Gordon,2009)
Method Quantitative Qualitative Normative ExploratoryAgent Modeling X XCausal Layered Analysis X XChaos and Non-Linear Systems X XCross-Impact Analysis X XDecision Modeling X XDelphi Techniques X X XEconometrics and Statistical Modeling XEnvironmental Scanning X XField Anomaly Relaxation X XFutures Polygon X X X XFutures Wheel X X XGenius Forecasting, Vision, and Intuition X X XInteractive Scenarios X X XMorphological Analysis X XMultiple Perspective X X XParticipatory Methods X XPrediction Markets X XRelevance Trees X XRobust Decisionmaking X XScenarios X X X XScience and Technology Roadmapping X X X XSimulation-Gaming X XState of the Future Index X X X XStructural Analysis X X XSubstitution AnalysisSystems Modeling X XTechnological Sequence Analysis X XText Mining X X XTrend Impact Analysis X XVisioning X XWild Cards X X X

71
Appendix C
Printed electronics questionnaire with the following manufacturing technologies assessed:
• Roll-to-roll nanoimprinting
• Inkjet printing
• Gravure printing
• Flexography printing
1. How familiar are you with the following technologies?
• I am (or have been) working with or studying this technology
• I know how the technology works
• I am not familiar with this technology
2. Fundamental research
(a) Physical laws and phenomena behind this technology for printing nanoscale features are known?
• Strongly agree
• Moderately agree
• Moderately disagree
• Strongly disagree
(b) Bene�ts of this technology in nanoscale printed electronics for ICT applications are known?
(c) Critical elements (functions/components/materials/inks) of this technology enabling ICT applica-tions have been identi�ed?
3. Applied research: Component and system level proof-of-concept
(a) Critical elements (functions/components/materials/inks) are available for printing proof-of-conceptnanoscale features for ICT applications?
(b) This technology has been demonstrated in printing proof-of-concept nanoscale features for ICT ap-plications?
(c) End user requirements for the ICT applications have been de�ned?
(d) Performance of proof-of-concept models is on required level?
4. Prototype
(a) Final operating environment and external interfaces for ICT applications have been de�ned?
(b) Prototype products with all required functionalities have been printed with this technology?
(c) Performance of prototype products in the �nal operating environment is on required level ?
5. Market phase
(a) There is an ICT market need for nanoscale electronics printed with this technology?
(b) First products for ICT applications containing nanoscale features printed with this technology haveentered the market?
(c) Multiple vendors are providing products printed with this technology?
6. Please indicate the year when you expect the listed Technology Readiness Levels to be reached
(a) Fundamental research: Basic elements and technology concept
• Now

72
• 1-3 years
• 4-7 years
• Later
• Never
(b) Applied research: Component and system level proof-of-concept
(c) Prototype: Functional prototypes built
(d) Markets: Market entry
(e) Markets: Mature markets
7. What is the current status of technologies listed compared to the current state-of-the-art printed electronicsmanufacturing technologies?
(a) Manufacturing process enables novel features in nanoscale printed electronics ICT applications
• Very good
• Good
• Neutral
• Bad
• Very bad
(b) Performance (e.g. speed, linewidth, yield, reliability) of the manufacturing process
(c) Cost e�ectiveness of the manufacturing process
(d) Scalability of the manufacturing process
(e) Environment, Health and Safety (EHS) aspects of the manufacturing process
8. Please estimate the status of technologies listed when they hit the market compared to the current state-of-the-art printed electronics manufacturing technologies?
(a) Manufacturing process enables novel features in nanoscale printed electronics ICT applications
(b) Performance (e.g. speed, linewidth, yield, reliability) of the manufacturing process
(c) Cost e�ectiveness of the manufacturing process
(d) Scalability of the manufacturing process
(e) Environment, Health and Safety (EHS) aspects of the manufacturing process
9. What kind of ICT applications could need printed nanoscale features? Comments?
10. Are there any other signi�cant impacts or issues related to technologies assessed?
11. Please, give general feedback on technologies assessed or the questionnaire here

73
Appendix D
Table D.1: Full results of method comparisons for the printed electronics data
Basicmulti-nomial
Weighedmulti-nomial
SL Aver-aging
SLMedium
SL Basic Ratings ICC Judge-speci�c
1
NIL 67 % 68 % 63 % 66 % 70 % 61 % 63 % 66 %INK 62 % 67 % 65 % 70 % 75 % 56 % 61 % 65 %GRA 38 % 36 % 33 % 29 % 26 % 36 % 38 % 40 %FLE 41 % 32 % 32 % 28 % 24 % 36 % 38 % 43 %
2
NIL 85 % 89 % 72 % 82 % 91 % 73 % 78 % 85 %INK 62 % 63 % 57 % 61 % 65 % 53 % 53 % 61 %GRA 38 % 38 % 45 % 40 % 36 % 42 % 42 % 35 %FLE 45 % 50 % 47 % 48 % 49 % 41 % 40 % 43 %
3
NIL 59 % 63 % 60 % 62 % 64 % 60 % 60 % 59 %INK 45 % 46 % 54 % 52 % 50 % 46 % 51 % 43 %GRA 33 % 29 % 33 % 28 % 23 % 36 % 34 % 32 %FLE 32 % 23 % 31 % 25 % 19 % 38 % 35 % 30 %
4
NIL 63 % 68 % 63 % 68 % 74 % 58 % 57 % 63 %INK 48 % 52 % 56 % 57 % 58 % 48 % 51 % 46 %GRA 30 % 30 % 35 % 29 % 24 % 33 % 35 % 32 %FLE 38 % 33 % 35 % 34 % 33 % 35 % 32 % 40 %
5
NIL 65 % 78 % 75 % 83 % 91 % 60 % 64 % 65 %INK 50 % 57 % 58 % 61 % 65 % 40 % 50 % 44 %GRA 30 % 29 % 29 % 26 % 22 % 25 % 28 % 22 %FLE 38 % 29 % 29 % 26 % 24 % 26 % 28 % 31 %
6
NIL 44 % 44 % 48 % 47 % 47 % 49 % 48 % 44 %INK 48 % 54 % 51 % 53 % 54 % 47 % 46 % 48 %GRA 50 % 50 % 51 % 55 % 58 % 43 % 45 % 47 %FLE 37 % 45 % 50 % 53 % 56 % 43 % 38 % 34 %
7
NIL 25 % 28 % 44 % 37 % 31 % 39 % 38 % 26 %INK 27 % 30 % 44 % 41 % 38 % 36 % 34 % 31 %GRA 11 % 10 % 21 % 13 % 5 % 17 % 21 % 13 %FLE 5 % 0 % 18 % 9 % 1 % 17 % 16 % 7 %
8
NIL 38 % 36 % 45 % 41 % 38 % 39 % 38 % 37 %INK 46 % 50 % 47 % 49 % 51 % 41 % 45 % 44 %GRA 42 % 37 % 39 % 34 % 29 % 34 % 41 % 41 %FLE 30 % 29 % 40 % 36 % 32 % 34 % 33 % 28 %
9
NIL 17 % 17 % 31 % 24 % 17 % 24 % 19 % 17 %INK 32 % 36 % 43 % 39 % 36 % 35 % 34 % 32 %GRA 37 % 35 % 39 % 37 % 35 % 28 % 32 % 35 %FLE 25 % 25 % 34 % 32 % 30 % 26 % 21 % 22 %
10
NIL 13 % 16 % 30 % 23 % 17 % 22 % 16 % 13 %INK 13 % 12 % 25 % 19 % 12 % 22 % 15 % 14 %GRA 24 % 16 % 21 % 15 % 8 % 19 % 22 % 25 %FLE 11 % 5 % 19 % 11 % 3 % 19 % 13 % 12 %
11
NIL 91 % 88 % 80 % 83 % 86 % 78 % 93 % 91 %INK 69 % 78 % 68 % 74 % 81 % 68 % 66 % 65 %GRA 71 % 72 % 68 % 72 % 77 % 57 % 70 % 67 %FLE 63 % 71 % 67 % 73 % 79 % 58 % 63 % 59 %
12
NIL 17 % 20 % 30 % 26 % 21 % 21 % 15 % 17 %INK 10 % 0 % 13 % 7 % 1 % 14 % 8 % 10 %GRA 19 % 12 % 16 % 12 % 9 % 14 % 14 % 19 %FLE 13 % 6 % 14 % 9 % 4 % 14 % 11 % 13 %
13
NIL 25 % 25 % 37 % 34 % 30 % 25 % 20 % 25 %INK 36 % 33 % 31 % 31 % 31 % 30 % 28 % 38 %GRA 14 % 7 % 14 % 9 % 4 % 16 % 12 % 14 %FLE 19 % 17 % 25 % 21 % 17 % 20 % 15 % 19 %


![133 SamiRuoho Full paper - Universitylib.tkk.fi/Diss/2011/isbn9789526040011/article2.pdfBoucherit et al. [9] have used the superposition theorem to model demagnetization. ... In this](https://img.pdfslide.us/doc/110x75/5ac853d17f8b9a42358c3d30/133-samiruoho-full-paper-et-al-9-have-used-the-superposition-theorem-to-model.jpg)