Embed Size (px)
Citation preview
HELSINKI UNIVERSITY OF TECHNOLOGYDepartment of Electrical and Communications EngineeringLaboratory of Acoustics and Audio Signal Processing
Jukka Pätynen
Virtual acoustics in practice rooms
Master’s Thesis submitted in partial fulfillment of the requirements for the degree ofMaster of Science in Technology.
Espoo, Oct 15, 2007
Supervisor: Adjunct professor Tapio Lokki, D.Sc. (Tech.)Instructor: Olli Salmensaari, M.Sc.
HELSINKI UNIVERSITY ABSTRACT OF THEOF TECHNOLOGY MASTER’S THESISAuthor: Jukka Pätynen
Name of the thesis: Virtual acoustics in practice roomsDate: Oct 15, 2007 Number of pages: 95
Department: Electrical and Communications EngineeringProfessorship: S-89
Supervisor: Adjunct professor Tapio Lokki, D.Sc. (Tech.)Instructor: Olli Salmensaari, M.Sc.
Due to their small size, the acoustical design of music practice rooms at music institutespresents designers with challenges and requires compromises between absorption and rever-beration. In practice, some reverberation is needed to provide support and more lively soundfor the musician. Playing in a room with plenty of absorption and very little reverberation isoften uninspiring and easily causes fatigue. On the other hand, increasing reverberation byreducing the absorption results in higher sound pressure levels. As music teachers are exposedto these conditions for long periods of time, in the long term this can lead to hearing problems.Similar problems are often also faced by orchestras when rehearsals are held in facilities withpoor acoustical conditions.
This work investigates the use of an electro-acoustic system to improve the acoustics in practicespaces. The electro-acoustic system uses an active method to create additional reverberationwithout increasing the sound pressure levels. A second objective is to evaluate the acceptanceof virtual acoustics by users in music practice spaces.
For this purpose, a prototype of an electro-acoustic system was installed in three differentrooms, and the reverberation time and sound pressure level of the rooms were measured. Thesecase studies consist of two small classrooms and a theater hall converted to a rehearsal hall fora symphony orchestra. For each case study, subjective opinions were collected. The resultsfor each room were then analyzed in terms of the feedback from the users. The case studiesshow that with a careful tuning, and especially in larger spaces, a virtual acoustic system is apotential solution for improving the room acoustics of a practice room.
Keywords: electro-acoustics, practice room, rehearsal hall, reverberation enhancement, roomacoustics, time variance, truncated hall
i
TEKNILLINEN KORKEAKOULU DIPLOMITYÖN TIIVISTELMÄTekijä: Jukka Pätynen
Työn nimi: Virtuaaliakustiikka musiikin harjoitustiloissaPäivämäärä: 15.10.2007 Sivuja: 95
Osasto: Sähkö- ja tietoliikennetekniikkaProfessuuri: S-89
Työn valvoja: Dosentti Tapio LokkiTyön ohjaaja: DI Olli Salmensaari
Musiikin harjoitusluokkien pienestä koosta johtuen akustiikkasuunnittelussa joudutaan useintekemään kompromisseja jälkikaiunnan ja tarvittavan vaimennusmateriaalin määrän suhteen.Harjoittelua ja instrumentin ääntä tukevaa sointia silmälläpitäen olisi suotavaa, ettei huoneolisi kaiunnaltaan täysin kuiva. Kaiuttomassa tilassa soittaminen käy nopeasti raskaaksi ja saat-taa vähentää aloittelevien soittajien harjoitteluintoa. Jälkikaiuntaa pieneen tilaan tavoiteltaes-sa joudutaan perinteisin akustisin menetelmin vähentämään vaimennuksen määrää, mikäpuolestaan nostaa tilan äänitasoa. Varsinkin musiikin opettajien pidemmät altistusajat hyvinkaiuntaisissa opetusluokissa saattavat johtaa kuuloon liittyviin ongelmiin. Orkesterien tilanneon usein samankaltainen, kun harjoituksia joudutaan varsinaisen konserttisalin sijasta jär-jestämään akustisesti sopimattomissa tiloissa.
Tässä työssä tutkitaan sähköakustisen järjestelmän käyttöä harjoitustilojen akustiikan paran-tamiseksi. Tarkoituksena on näin ollen lisätä jälkikaiuntaa nostamatta tilan äänitasoa. Tavoit-teena on myös tutkia käyttäjien suhtautumista sähköakustiikan käyttöön.
Työssä esitettyjä tutkimuksia varten sähköakustista järjestelmää kokeiltiin yhteensä kolmes-sa tilassa. Tutkituista tiloista kaksi ensimmäistä olivat tyypillisiä musiikkioppilaitoksen pieniäharjoitus- ja opetusluokkia. Kolmas tila oli monikäyttösali, johon sähköakustiikan avulla pyrit-tiin luomaan konserttisalin lavaa muistuttava akustiikka sinfoniaorkesterin harjoitusta varten.Tiloissa tehtiin huoneakustisia mittauksia sekä haastateltiin käyttäjiä kyselytutkimuksella.Tutkimusten tulosten perusteella on todettavissa, että harjoitustilojen akustiikan parantaminensähköakustisella järjestelmällä on mahdollista.
Avainsanat: sähköakustiikka, harjoitushuone, saliakustiikka, jälkikaiunta, huoneakustiikanparantaminen, aikavarianssi, katkaistu sali
ii
Acknowledgements
I want to thank Tapio Lokki for supervising this thesis, for the practical arrangements andthe guidance and corrections in every stage of the work.
My gratitude also goes to Olli Salmensaari and Timo Peltonen at Akukon Oy for providinginsight into the room acoustics in the case studies and for the invaluable expertise in acous-tical measurements and analysis. Without their help the results of this work would havebeen much more modest.
I would also like to thank the personnel of Espoo Music Institute and Espoo Cultural Centrefor the contribution to this project as well as Tapiola Sinfonietta for participating in therehearsal room study without prejudice. Particularly, I want to thank Acoustics Laboratoryof Helsinki University of Technology, Espoo Cultural Centre, City of Espoo (Tekninenkeskus) and Espoo Music Institute for funding this work.
I wish to thank my parents for giving their support in my studies of technology and musicduring all these years.
Special thanks go also to Ronja, our dog, for providing repeatable excitations for demon-strating real-world examples of sound propagation and decay on various occasions.
Finally, I would like to thank Marika from all my heart for inspiring me in every imaginableway.
Espoo, October 15, 2007
Jukka Pätynen
iii
Contents
Abbreviations viii
List of Figures x
List of Tables xi
1 Introduction 1
1.1 Research problem statement . . . . . . . . . . . . . . . . . . . . . . . . . 2
2 Room acoustics 3
2.1 Sound propagation in spaces . . . . . . . . . . . . . . . . . . . . . . . . . 3
2.1.1 Absorption . . . . . . . . . . . . . . . . . . . . . . . . . . . . . . 6
2.1.2 Diffuse sound field . . . . . . . . . . . . . . . . . . . . . . . . . . 8
2.2 Room response . . . . . . . . . . . . . . . . . . . . . . . . . . . . . . . . 9
2.2.1 Reverberation time . . . . . . . . . . . . . . . . . . . . . . . . . . 11
2.2.2 Measurement of reverberation time . . . . . . . . . . . . . . . . . 13
2.3 Concert hall acoustics . . . . . . . . . . . . . . . . . . . . . . . . . . . . . 14
2.3.1 Stage acoustics . . . . . . . . . . . . . . . . . . . . . . . . . . . . 16
3 Electro-acoustics 19
3.1 System classification . . . . . . . . . . . . . . . . . . . . . . . . . . . . . 20
3.2 Regenerative systems and signal processing . . . . . . . . . . . . . . . . . 21
3.2.1 Reduction of feedback . . . . . . . . . . . . . . . . . . . . . . . . 24
iv
3.3 Microphones . . . . . . . . . . . . . . . . . . . . . . . . . . . . . . . . . 27
3.4 Loudspeakers . . . . . . . . . . . . . . . . . . . . . . . . . . . . . . . . . 28
3.5 Existing solutions . . . . . . . . . . . . . . . . . . . . . . . . . . . . . . . 29
3.6 Psychoacoustics and hearing . . . . . . . . . . . . . . . . . . . . . . . . . 30
4 Concept model 33
4.1 Truncated hall concept . . . . . . . . . . . . . . . . . . . . . . . . . . . . 33
4.2 Symphony orchestra rehearsal room . . . . . . . . . . . . . . . . . . . . . 34
4.3 Damped small practice room . . . . . . . . . . . . . . . . . . . . . . . . . 35
4.4 Challenges . . . . . . . . . . . . . . . . . . . . . . . . . . . . . . . . . . . 36
4.5 Reverberation algorithm . . . . . . . . . . . . . . . . . . . . . . . . . . . 40
5 Case studies 43
5.1 Cage . . . . . . . . . . . . . . . . . . . . . . . . . . . . . . . . . . . . . . 43
5.2 Ives . . . . . . . . . . . . . . . . . . . . . . . . . . . . . . . . . . . . . . 46
5.3 Louhi hall . . . . . . . . . . . . . . . . . . . . . . . . . . . . . . . . . . . 47
5.4 Expectations . . . . . . . . . . . . . . . . . . . . . . . . . . . . . . . . . . 51
6 Results 52
6.1 Measurement arrangements . . . . . . . . . . . . . . . . . . . . . . . . . . 52
6.2 Case study: Cage . . . . . . . . . . . . . . . . . . . . . . . . . . . . . . . 53
6.3 Case study: Ives . . . . . . . . . . . . . . . . . . . . . . . . . . . . . . . . 61
6.4 Case study: Louhi hall . . . . . . . . . . . . . . . . . . . . . . . . . . . . 66
7 Discussion 72
7.1 Case study: Cage . . . . . . . . . . . . . . . . . . . . . . . . . . . . . . . 72
7.2 Case study: Ives . . . . . . . . . . . . . . . . . . . . . . . . . . . . . . . . 74
7.3 Case study: Louhi hall . . . . . . . . . . . . . . . . . . . . . . . . . . . . 75
7.4 Future improvements . . . . . . . . . . . . . . . . . . . . . . . . . . . . . 77
8 Conclusions and Future Work 80
v

A User evaluation questionnaires 88
B Additional reverberation figures 92
vi
Symbols
α Absorption coefficientA Absorption areac Speed of sound in airβ Maximum phase deviationB Bandwidthfg Schroeder frequencyGML Gain matrixh(t) Acoustical impulse responseH Transfer functionI Unity matrixk Wave numberλ Wave lengthm Air absorption coefficientm(t) Modulation functionnl Number of loudspeakersnm Number of microphonesϕ Incident sound anglep PressureR(ω) Received signal in frequency domainθ(t) Phase angleV Room volumeS Surface areaS(ω) Source signal in frequency domainx(t) Input signal
vii
Abbreviations
ACS Acoustic Control SystemAD/DA Analog-to-digital / digital-to-analog conversionAR Assisted ResonanceDM Delay modulationDSP Digital signal processingEDT Early decay timeEDTF Early decay time frequency ratioEDTP Early decay time on platformFIR Finite impulse responseFM Frequency modulationFS Frequency shiftGBI Gain before instabilityIIR Infinite impulse responseLTI Linear, time-invariantLTV Linear, time-variantMIDI Musical instrument digital interfaceMLG Mean loop gainMLS Maximum length sequencePM Phase modulationRT60 Reverberation timeSNR Signal-to-noise ratio
viii
List of Figures
2.1 A basic model for impulse response in closed spaces. . . . . . . . . . . . . 11
3.1 A simplified diagram for an active electro-acoustic system. . . . . . . . . . 22
4.1 A diagram of the time-variant reverberation algorithm. . . . . . . . . . . . 41
4.2 A section of the magnitude response of the time-variant algorithm. . . . . . 42
5.1 Cage, plan and positions of equipment and absorption materials. . . . . . . 44
5.2 Practice room Cage with the system installed. . . . . . . . . . . . . . . . . 45
5.3 Ives, plan and positions of equipment and absorption materials. . . . . . . . 47
5.4 Practice room Ives with the system installed. . . . . . . . . . . . . . . . . . 48
5.5 Plan (a) and section (b) of Louhi hall with equipment positions. . . . . . . . 49
6.1 Cage, sound decay, without absorption (curve plain) and with absorption(curve off ), octave bands 250 Hz and 2000 Hz. . . . . . . . . . . . . . . . 54
6.2 Cage, sound decay, without (plain) and with absorption (off ), octave band125 Hz. . . . . . . . . . . . . . . . . . . . . . . . . . . . . . . . . . . . . 54
6.3 Cage, sound decay, settings off, on2 and on4, octave bands 250 Hz and 1000Hz. . . . . . . . . . . . . . . . . . . . . . . . . . . . . . . . . . . . . . . . 57
6.4 Cage, sound decay, settings off, on3 and on4, octave band 1000 Hz. . . . . . 58
6.5 Cage, sound decay, settings off, on1 and on2, octave band 1000 Hz. . . . . . 59
6.6 Cage, sound decay, original room (plain) and settings on2 and on4, octaveband 500 Hz. . . . . . . . . . . . . . . . . . . . . . . . . . . . . . . . . . 60
6.7 Ives, sound decay, without absorption (plain) and with additional absorp-tion (off ), octave bands 250 Hz and 2000 Hz. . . . . . . . . . . . . . . . . 62
ix
6.8 Ives, sound decay, without (plain) and with absorption (off ), octave band125 Hz. . . . . . . . . . . . . . . . . . . . . . . . . . . . . . . . . . . . . 63
6.9 Ives, sound decay, original room (plain) and settings on2 and on4, octaveband 500 Hz. . . . . . . . . . . . . . . . . . . . . . . . . . . . . . . . . . 64
6.10 Ives, sound decay, settings off, on1 and on2, octave bands 250 Hz and 1000Hz. . . . . . . . . . . . . . . . . . . . . . . . . . . . . . . . . . . . . . . . 65
6.11 Ives, sound decay, without the system (off ) and on with settings on2 andon3, octave band 500 Hz. . . . . . . . . . . . . . . . . . . . . . . . . . . . 66
6.12 Louhi hall, time energy curves with and without the system. In bottomfigures only the stage system is in use. . . . . . . . . . . . . . . . . . . . . 68
6.13 Louhi hall, time energy curves with and without the system. . . . . . . . . 69
6.14 Louhi hall, on the left with the system ready to use, Tapiola Sinfonietta inrehearsal on the right. . . . . . . . . . . . . . . . . . . . . . . . . . . . . . 70
7.1 Louhi hall, time energy curves with and without the system. . . . . . . . . 78
x
List of Tables
2.1 Absorption coefficients of selected materials in octave bands. . . . . . . . . 7
5.1 Reverberation system parameters in Cage. . . . . . . . . . . . . . . . . . . 46
5.2 Reverberation system parameters in Louhi hall. . . . . . . . . . . . . . . . 51
6.1 Cage relative sound pressure levels in dB, octave bands and A-weightedaverage. . . . . . . . . . . . . . . . . . . . . . . . . . . . . . . . . . . . . 56
6.2 Ives relative sound pressure levels in dB, octave bands and A-weighted av-erage. . . . . . . . . . . . . . . . . . . . . . . . . . . . . . . . . . . . . . 63
6.3 Reverberation times in Louhi hall with and without the electro-acoustic sys-tem, octave bands. . . . . . . . . . . . . . . . . . . . . . . . . . . . . . . . 67
6.4 Early decay times on stage in Louhi hall with and without the electro-acoustic system, octave bands. . . . . . . . . . . . . . . . . . . . . . . . . 67
6.5 ST1 (early) and ST2 (total) support values in Louhi hall with and withoutthe electro-acoustic system, octave bands. . . . . . . . . . . . . . . . . . . 71
6.6 Sound pressure levels in Louhi hall, octave bands. SPL figures are relativeto the hall without the system. . . . . . . . . . . . . . . . . . . . . . . . . 71
6.7 Clarity on stage values in Louhi hall with and without the electro-acousticsystem, octave bands. . . . . . . . . . . . . . . . . . . . . . . . . . . . . . 71
A.1 Louhi hall questions and answers. . . . . . . . . . . . . . . . . . . . . . . 90
A.2 Tapiola hall questions and answers. . . . . . . . . . . . . . . . . . . . . . . 91
xi
Chapter 1
Introduction
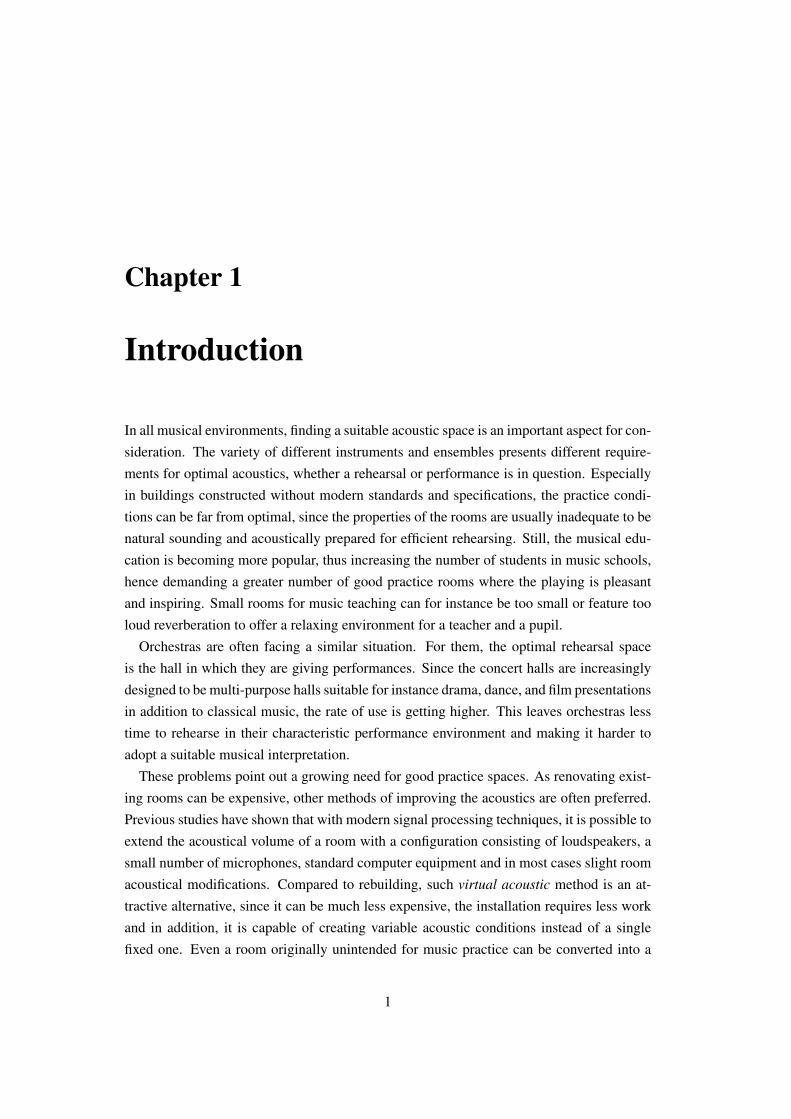
In all musical environments, finding a suitable acoustic space is an important aspect for con-sideration. The variety of different instruments and ensembles presents different require-ments for optimal acoustics, whether a rehearsal or performance is in question. Especiallyin buildings constructed without modern standards and specifications, the practice condi-tions can be far from optimal, since the properties of the rooms are usually inadequate to benatural sounding and acoustically prepared for efficient rehearsing. Still, the musical edu-cation is becoming more popular, thus increasing the number of students in music schools,hence demanding a greater number of good practice rooms where the playing is pleasantand inspiring. Small rooms for music teaching can for instance be too small or feature tooloud reverberation to offer a relaxing environment for a teacher and a pupil.
Orchestras are often facing a similar situation. For them, the optimal rehearsal spaceis the hall in which they are giving performances. Since the concert halls are increasinglydesigned to be multi-purpose halls suitable for instance drama, dance, and film presentationsin addition to classical music, the rate of use is getting higher. This leaves orchestras lesstime to rehearse in their characteristic performance environment and making it harder toadopt a suitable musical interpretation.
These problems point out a growing need for good practice spaces. As renovating exist-ing rooms can be expensive, other methods of improving the acoustics are often preferred.Previous studies have shown that with modern signal processing techniques, it is possible toextend the acoustical volume of a room with a configuration consisting of loudspeakers, asmall number of microphones, standard computer equipment and in most cases slight roomacoustical modifications. Compared to rebuilding, such virtual acoustic method is an at-tractive alternative, since it can be much less expensive, the installation requires less workand in addition, it is capable of creating variable acoustic conditions instead of a singlefixed one. Even a room originally unintended for music practice can be converted into a
1
CHAPTER 1. INTRODUCTION 2
proper practice space with virtual acoustic solution, provided some further modifications tothe room are feasible.
The first published research on electro-acoustic systems for reverberation enhancementdates from over 30 years ago. During the last ten years, virtual acoustics has gatheredmore attention as the required technology has become more affordable. A small numberof commercial concepts have been developed since by specialized manufacturers. Whilemost of the products are intended for either enhancing reverberation in existing halls, onlyfew are designed for practice room use. A master’s thesis by Nummela [48] presented animplementation of a prototype system that could provide a virtual acoustic environment forfull-scale symphony orchestras. Such a system with minor adaptations is used in this workto investigate the usage of virtual acoustic system in practice. Theoretically, an electro-acoustic system could be refined to such a level that modeling of existing spaces is possible.However, an accurate modeling of a specific hall or room demands a lot of work, becausethis system depends on traditional room acoustics in addition to the electro-acoustic system.
1.1 Research problem statement
The purpose of this work is to investigate whether virtual acoustics can be used in prac-tice to enhance or improve room acoustics in existing music practice spaces of differentsizes. For this purpose, three real world installations are studied. The methods consist ofanalyzing objective acoustical measurements and subjective opinions from the real worldinstallations.
Chapter 2
Room acoustics
Sound in every space is a mixed combination of direct sound waves emanating from thesource and reflected waves from the surroundings of an environment. Depending on thenature of boundaries in conventional acoustical space, the distribution of audible sound be-tween direct sound and its reflections varies greatly. This variation creates the fundamentalacoustical features in rooms.
Traditionally, the acoustic qualities of a room have been a result of a careful combinationof forms, materials and structures. These architectural matters affect the direction and levelof the reflections which in proper mixture forms a favorable acoustical environment forperformances and practice in halls and rooms. Because the modern understanding of roomacoustics is based on the importance of the relation between the direct sound, the firstreflections and the reverberant sound, the design and analysis of the boundaries are takenunder careful investigation when designing or improving acoustical spaces [42, 31]. Variousdifferent approaches to the acoustical analysis exist, of which some of the principal theoriesare presented here.
2.1 Sound propagation in spaces
Sound in all spaces can be seen as pressure waves propagating longitudinally with a certainfrequency and amplitude in a medium from a single point or a set of sources. With thebasic assumption of a homogeneous medium, the propagation is straightforward. Changesin pressure are caused by the movement of particles in a compressible fluid. For a simple si-nusoidal wave, the displacement of particles [72] in two-dimensional cartesian coordinatesfollows the equation
y(x, t) = A sin(ωt− kx) . (2.1)
3
CHAPTER 2. ROOM ACOUSTICS 4
Here the sound wave has a direction +x and at a certain moment of time t, it has thedisplacement y. k = ω/c is called wave number and parameter ω = 2πf is a function ofthe frequency f . c denotes the speed of sound. By substituting the particle velocity usingthe laws of conservation of momentum and compression, the equation can be expressed asdifferential equation
∂2p
∂x2=
1c2∂2p
∂t2(2.2)
with pressure p as function of time and place [31]. An expression of this differential equa-tion is possible so that the wave propagation can be inspected in a three-dimensional space:
∇2p =1c2∂2p
∂t2. (2.3)
Equation (2.3) is called the Helmholz equation [72]. It is noticeable that equation (2.1) isan arbitrary solution for the differential equation above [31], [72].
Having the acoustic space limited by rigid walls, boundary conditions must be set forwave equations. For simplicity it is assumed - dissimilarly to natural phenomena - thatincident waves are plane waves. Calculating reflections for natural sound waves propagatingspherically is more complicated. The reflection factor of a boundary is defined by thechange in the amplitude and phase. Complex reflection factorR = |R|eiϕ is used to expressabsorption coefficient of a wall [31]:
α = 1− |R|2. (2.4)
The sound absorption in more comprehensively reviewed later in this chapter. In addition tothe absorption coefficient, acoustic impedance must be defined for describing the acousticproperties of a wall as following [31]:
Z =p
vn, (2.5)
where vn denotes the component of the particle velocity normal to the wall surface. Sincean ideal, non-absorbing surface has zero particle velocity component normal to the wall,the impedance is evaluated as infinite, thus leading to boundary conditions
dpxdx
= 0, x = 0 ∨ x = Lx (2.6)
dpydy
= 0, y = 0 ∨ y = Ly (2.7)
dpzdz
= 0, z = 0 ∨ x = Lz . (2.8)
CHAPTER 2. ROOM ACOUSTICS 5
These conditions are for ideal rectangular room with dimensions Lx, Ly and Lz . In thiscase, the wave equation is of form
∂2p
∂x2+∂2p
∂y2+∂2p
∂z2+ k2p = 0 , (2.9)
where k denotes a variable of characteristic value. With initial and boundary values ineffect, performing a separation of variables is possible, thus being able to have the form
p(x, y, z) = px(x)py(y)pz(z)⇒
d2px(x)dx2 + k2
xpx = 0d2py(y)dy2
+ k2ypy = 0
d2pz(z)dz2
+ k2zpz = 0.
(2.10)
and having alsok2x + k2
y + k2z = k. (2.11)
The solution for equation (2.10) is of form
px(x) = Ax cos(kxx) +Bx sin(kxx) (2.12)
correspondingly for all axis. Constants Ax and Bx are determined against boundary condi-tions (2.6), and therefore
dpxdx
= 0, when x = 0⇒ Bx = 0 (2.13)
dpxdx
= 0, when x = Lx ⇒ kx = nπ/Lx, n ∈ 1, 2 . . . . (2.14)
ky and kz are solved correspondingly. Placing constants from equation (2.13) for x, y andz into equation (2.11) eigenvalues for wave equation
k = π
√(nxLx
)2 + (nyLy
)2 + (nzLz
)2 (2.15)
and room eigenfrequencies
p(x, y, z) = C cos (nxπx
Lx) cos (
nyπy
Ly) cos (
nzπz
Lz) (2.16)
fnxnynz =knxnynzc
2π(2.17)
can be solved [31]. With different values for k = 1, 2 . . . room modes of k th order arecalculated, of which the lowest ones are important in small room acoustic design princi-ples. In a space having only small differences between the dimensions Lx, Ly and Lz , it
CHAPTER 2. ROOM ACOUSTICS 6
is noticeable that the room modes are also distributed proportionally to the correspondingdimensions or its multiplies [57]. To avoid disturbing effects in small rooms, it is rec-ommended that the dimensions are carefully selected to obtain evenly distributed modes.Examples of certain favorable proportions can be found in [66] and [40].
The above solution for the wave equation is directly applicable only to perfectly rect-angular rooms with ideal reflective walls which in real world does not exist. Solving theequations for surfaces with non-infinite impedance is possible, unlike for arbitrary shapes,which is no longer sensible. Numerical techniques, such as finite element method (FEM),finite volume method (FVM) and boundary element methods (BEM) are developed for solv-ing wave equation in more complex domains. The use of FEM method has been studiedby i.e. Pietrzyk and Kleiner [52] while more traditional modeling relying on geometricalmethods have been reviewed by Kuttruff [31] as well as Svensson and Kristiansen [63].
2.1.1 Absorption
By the term of improving acoustics in small rooms, the unprofessional understanding isthat the process is about clapping hands at different positions and installing proper conve-nient panels to the walls. In more scientific sense, it is not so far-fetched than it soundslike. Studying existing sound fields and treating the surfaces with appropriate materials de-scribes perhaps better the room acoustical methods. In this section, principles of commonabsorption materials and their effect to the acoustical conditions are discussed.
In rooms where the dimensions and wall proportions cannot be altered, themeans for con-trolling reflections are in most cases limited to the use of absorptive and diffusing materials.Unwanted reflections can be attenuated to some extent with such elements, depending onthe original state and the intended result. In the case of a specular reflection from a hard sur-face, placing an absorbent results in a reduced amplitude of the reflected sound. Choosinga suitable absorbent depends on the frequency band that is wanted to attenuate.
There are mainly three types of absorbents used, of which each is suitable for absorbingsound energy at a certain frequency band. In porous materials, such as carpets and acous-tical panels, the sound absorption is effective from low middle frequencies and reaches thehighest effect at high frequencies. Physically the sound absorption occurs in the numerouspores in the material in which the energy is converted into heat due to the increased fric-tion of particle movement [57]. Sudden changes in the direction of movement increasesthe effect [64]. As the absorption is most effective when the amplitude maximum of thewave is placed inside the material, porous materials of equal thickness function more effec-tively when they are suspended from the ceiling or walls. The resulting air gap improvesthe absorption compared to a situation where the material is directly attached to the surface.From this phenomenon it is possible to calculate the lower frequency limit of effective ab-
CHAPTER 2. ROOM ACOUSTICS 7
sorption, although the thickness of magnitude λ/4 is not required for noticeable absorption[64]. Wave length is denoted with λ.
A second type of absorption materials is panel absorbents, whose effect is based on mem-brane resonance typically present in wall structures. Common wall types featuring goodabsorption are light partition walls and doors - generally all light, larger surfaces that arecomparably loosely fastened. A fairly good example is a basic gypsum board wall on awooden frame. The effect of resonant absorption can be further increased by combiningit with a porous absorbent placed beneath the surface. Unlike porous materials, panel ab-sorbents are most effective at low frequencies, depending on the mass of the material andthe method of attachment [31].
A third kind of absorbing element is Helmholz resonator, which differs from the othertwo absorbers by being specially tuned for a limited frequency band. Usually this type ofabsorption is used in small rooms for reducing energy at low frequencies, which are oftencausing problems due to the low frequency modes [57]. The portability of such element isan advantage when a single room requires different absorption characteristics.
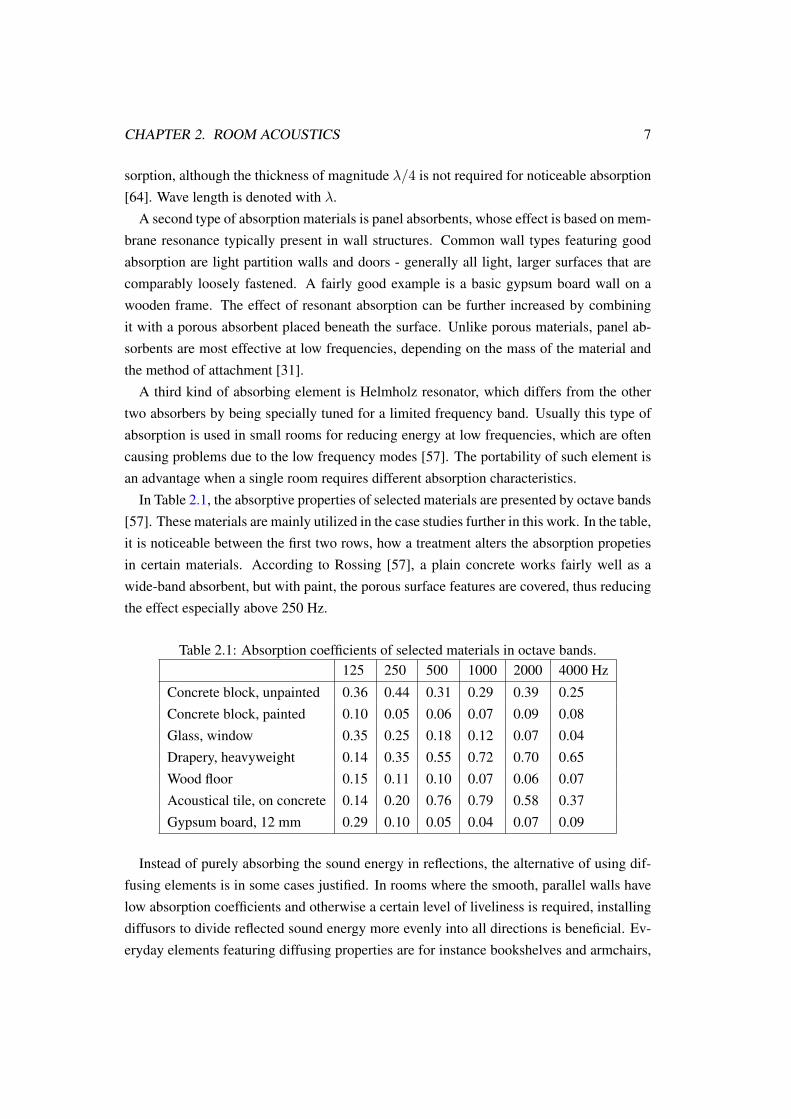
In Table 2.1, the absorptive properties of selected materials are presented by octave bands[57]. These materials are mainly utilized in the case studies further in this work. In the table,it is noticeable between the first two rows, how a treatment alters the absorption propetiesin certain materials. According to Rossing [57], a plain concrete works fairly well as awide-band absorbent, but with paint, the porous surface features are covered, thus reducingthe effect especially above 250 Hz.
Table 2.1: Absorption coefficients of selected materials in octave bands.125 250 500 1000 2000 4000 Hz
Concrete block, unpainted 0.36 0.44 0.31 0.29 0.39 0.25Concrete block, painted 0.10 0.05 0.06 0.07 0.09 0.08Glass, window 0.35 0.25 0.18 0.12 0.07 0.04Drapery, heavyweight 0.14 0.35 0.55 0.72 0.70 0.65Wood floor 0.15 0.11 0.10 0.07 0.06 0.07Acoustical tile, on concrete 0.14 0.20 0.76 0.79 0.58 0.37Gypsum board, 12 mm 0.29 0.10 0.05 0.04 0.07 0.09
Instead of purely absorbing the sound energy in reflections, the alternative of using dif-fusing elements is in some cases justified. In rooms where the smooth, parallel walls havelow absorption coefficients and otherwise a certain level of liveliness is required, installingdiffusors to divide reflected sound energy more evenly into all directions is beneficial. Ev-eryday elements featuring diffusing properties are for instance bookshelves and armchairs,
CHAPTER 2. ROOM ACOUSTICS 8
although specially designed diffusor panels are usually preferred in more professional en-vironments. Correctly placed diffusors result in a pleasant, less colored sound field [57].Diffuse sound fields are more closely discussed in Section 2.1.2.
The methods discussed here for altering absorption properties of a space give usefulmeans to control acoustical properties, whether by simply adding beneficial materials ormodifying the wall structures. In existing rooms, the use of acoustical panels and othereasily installable absorbents are usually favored, since altering wall structures is often con-sidered too extensive operation and is regarded the last resort in difficult cases.
2.1.2 Diffuse sound field
Theory of diffuse sound field is a common assumption used with the investigations of thebehavior of reverberant sound in closed spaces. The main idea behind the concept is that theflow of sound energy is statistically zero, thus the sound intensity is also zero. In practicethis means that in a diffuse field, reflections from surrounding surfaces are equal from allrandom directions. An important property can be derived from the diffusion assumption.When the attenuation of direct sound from a source naturally follows the 1/r-rule, thushalving the sound pressure when the distance is doubled, in diffuse field the attenuation iszero.
To define more accurately where this rule is valid, the boundary for diffuse sound fieldmust be established. A property of diffuse field in closed space called reverberation radiusis derived from the equation of pressure levels of direct and reverberant sound:
Lp = Lw + 10 lg(
Q
4πr2
), Lp,reverberant = Lw + 10 lg
(4A
)⇒ (2.18)
Lp = Lw + 10 lg(
Q
4πr2+
4A
)⇒ (2.19)
Q
4πr2=
4A⇔ (2.20)
r =14
√A
π, (2.21)
where A is the absorption area, similarly as in the equations for calculating reverberationtime. The result r obtained from the equation is the minimum distance from a single sourcewhere the sound field is supposed to be diffuse. In this case omnidirectional source (Q = 1)is supposed. With other directivity values the equation changes respectively.
In special cases where absorption is not evenly distributed on the surfaces, the equation(2.21) gives only a coarse approximation, which results from the non-diffuse property ofthe sound field. In such situation the sound intensity is not zero in the vicinity of the moreabsorbing surfaces, thus the original assumption of diffuse field is not valid.
CHAPTER 2. ROOM ACOUSTICS 9
In addition a low-frequency boundary, over which frequencies the room can be supposedto be diffusing enough, can be evaluated by the Schroeder frequency:
fg = 2000
√RT60
V, (2.22)
where V represents the total volume of the room. RT60 denotes the reverberation time (seedefinition in Section 2.2.1). The principle behind this theory is to approximate in whichfrequencies the room modes (equation 2.17) begin to lose their resonant characteristics.Below this threshold the frequency response measurements can give erratic results if thereceiving positions are carelessly selected. However, in large halls this is a negligible issue,since these frequencies are below normally measured range.
In generic small rooms, sound diffusion can be improved by adding arbitrary objects withsufficient dimensions. An effective diffusion is possible with additional obstacles that haveminimum measures comparable to the wavelength. The importance of diffusing elementsis emphasized in small listening spaces such as sound studios.
The importance of diffuse sound field is the most apparent in the definition of reverber-ation time, since the definition of RT60 assumes that the reverberant sound field is fullydiffuse [57]. In a situation where a considerable amount of absorptive materials is concen-trated on a single area, sound intensity is no longer zero, thus the flow in sound energyhas a direction toward the absorbing surface. This breaks the condition of diffuse soundfield, but according to Nummela [48], the result from reverberation radius calculation byusing equation (2.21) can be regarded as a reference, and the real reverberation radius canbe assumed higher than the resulting number.
Since the absorption area depends on absorptive properties of all surfaces, it is notice-able that in cases where active acoustics is used together with additional absorption, thereverberation radius does not remain constant, thus having an influence on microphone andloudspeaker positioning. On the other hand, the reverberation radius of instruments andloudspeakers must be considered in active acoustic system design in order to gain balancedsounding results and avoiding unwanted localization effects.
2.2 Room response
Natural acoustical systems in closed spaces are usually assumed to have properties of alinear, time-invariant (LTI) system. Conditions that are to be fulfilled are linearity, stability,time-invariant parameters and causality, of which linearity sets additivity (f(x + y) =f(x) + f(y)) and homogeneity (f(ax) = af(x)) properties. Stability requires that theresponse from system to an input signal is limited, whereas time-invariance demands that
CHAPTER 2. ROOM ACOUSTICS 10
parameters of the system response are constant through time. Causality condition supposesthat the system produces no response before an input signal is supplied [16].
Some of the conditions may be broken in unrestricted spaces or by an active acoustics.Common examples of such cases is the varying wind in open areas, which changes the over-all system response depending on time. With an electro-acoustic system, feedback resultingfrom poorly designed algorithms or adversely positioned microphones or loudspeakers canbreak the stability property by generating a response saturated to the maximum amplifica-tion limit. However, some system implementations have time-variant features specificallyin order to prevent instability as presented later in this work.
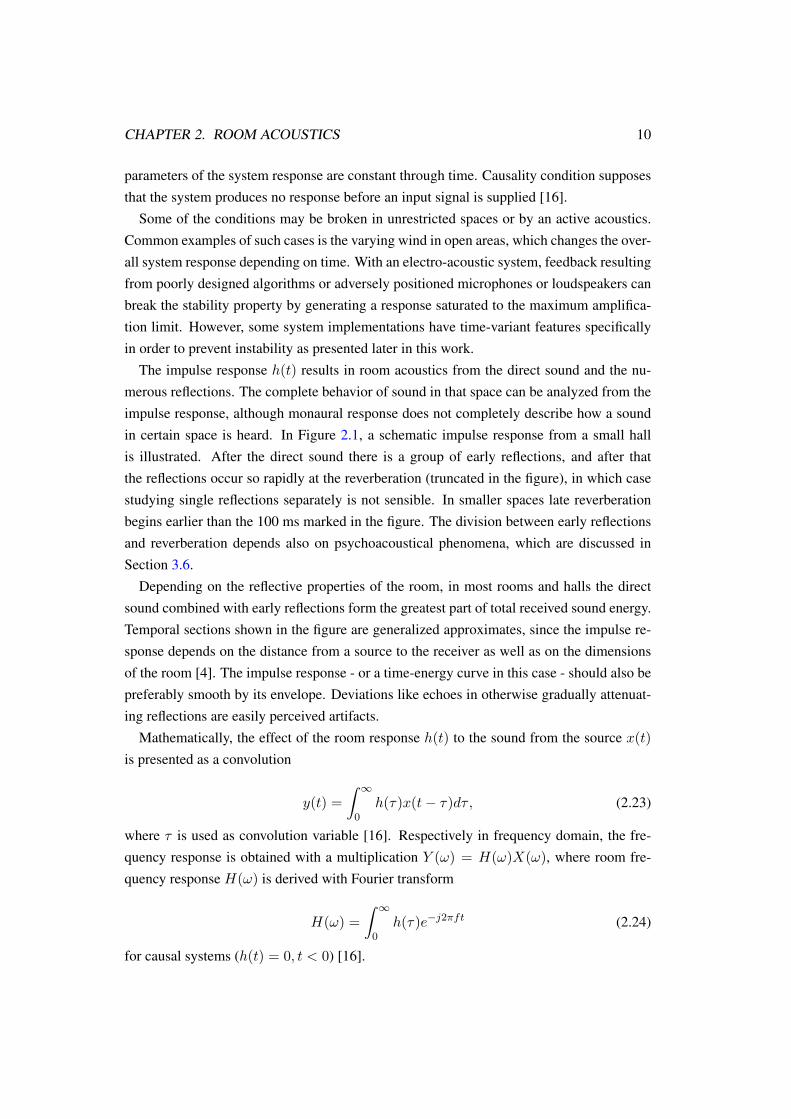
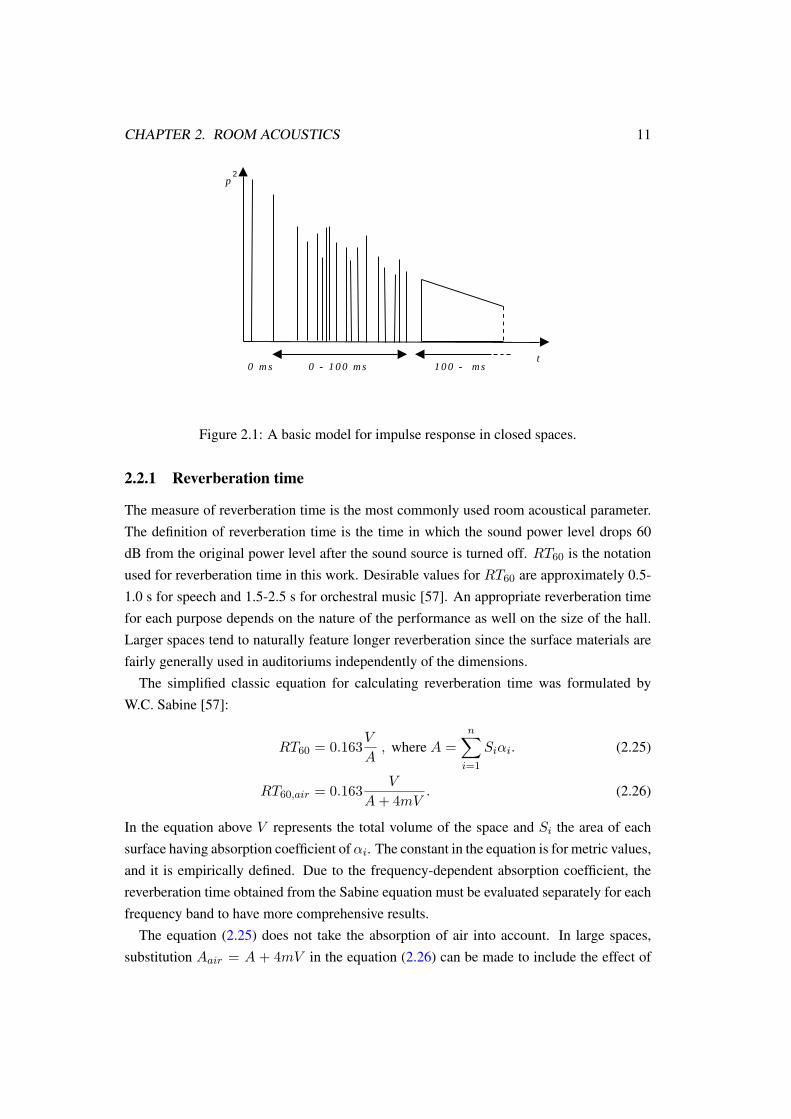
The impulse response h(t) results in room acoustics from the direct sound and the nu-merous reflections. The complete behavior of sound in that space can be analyzed from theimpulse response, although monaural response does not completely describe how a soundin certain space is heard. In Figure 2.1, a schematic impulse response from a small hallis illustrated. After the direct sound there is a group of early reflections, and after thatthe reflections occur so rapidly at the reverberation (truncated in the figure), in which casestudying single reflections separately is not sensible. In smaller spaces late reverberationbegins earlier than the 100 ms marked in the figure. The division between early reflectionsand reverberation depends also on psychoacoustical phenomena, which are discussed inSection 3.6.
Depending on the reflective properties of the room, in most rooms and halls the directsound combined with early reflections form the greatest part of total received sound energy.Temporal sections shown in the figure are generalized approximates, since the impulse re-sponse depends on the distance from a source to the receiver as well as on the dimensionsof the room [4]. The impulse response - or a time-energy curve in this case - should also bepreferably smooth by its envelope. Deviations like echoes in otherwise gradually attenuat-ing reflections are easily perceived artifacts.
Mathematically, the effect of the room response h(t) to the sound from the source x(t)is presented as a convolution
y(t) =∫ ∞
0h(τ)x(t− τ)dτ, (2.23)
where τ is used as convolution variable [16]. Respectively in frequency domain, the fre-quency response is obtained with a multiplication Y (ω) = H(ω)X(ω), where room fre-quency response H(ω) is derived with Fourier transform
H(ω) =∫ ∞
0h(τ)e−j2πft (2.24)
for causal systems (h(t) = 0, t < 0) [16].
CHAPTER 2. ROOM ACOUSTICS 11
t
p
0 - 1 0 0 m s 1 0 0 - m s0 m s
2
Figure 2.1: A basic model for impulse response in closed spaces.
2.2.1 Reverberation time
The measure of reverberation time is the most commonly used room acoustical parameter.The definition of reverberation time is the time in which the sound power level drops 60dB from the original power level after the sound source is turned off. RT60 is the notationused for reverberation time in this work. Desirable values for RT60 are approximately 0.5-1.0 s for speech and 1.5-2.5 s for orchestral music [57]. An appropriate reverberation timefor each purpose depends on the nature of the performance as well on the size of the hall.Larger spaces tend to naturally feature longer reverberation since the surface materials arefairly generally used in auditoriums independently of the dimensions.
The simplified classic equation for calculating reverberation time was formulated byW.C. Sabine [57]:
RT60 = 0.163V
A, where A =
n∑i=1
Siαi. (2.25)
RT60,air = 0.163V
A+ 4mV. (2.26)
In the equation above V represents the total volume of the space and Si the area of eachsurface having absorption coefficient ofαi. The constant in the equation is for metric values,and it is empirically defined. Due to the frequency-dependent absorption coefficient, thereverberation time obtained from the Sabine equation must be evaluated separately for eachfrequency band to have more comprehensive results.
The equation (2.25) does not take the absorption of air into account. In large spaces,substitution Aair = A + 4mV in the equation (2.26) can be made to include the effect of
CHAPTER 2. ROOM ACOUSTICS 12
air absorption [31], where the air absorption is noted with m. The effect is notable only atfrequencies above 2000 Hz.
However, the equation (2.25) has some properties that are inconsistent with the practice.For anechoic rooms, this equation gives a result of existing reverberation. Therefore moreaccurate mathematical approaches have been developed to replace the subjectively devisedSabine equation. Kuttruff [31] has stated that the total energy of reflected sound at a certaintime t in a room is
E(t) = E0 exp {[−mc+ n ln(1− α)t]}, (2.27)
where c represents the sound velocity in air, E0 the initial sound energy, m the absorptionof air, n the average count of reflections occurring per second and α the average absorptioncoefficient of all surfaces of the room, thus
α =1S
∑i
Siαi. (2.28)
In the equation above S is the total area of all surfaces of the room. Variable n in equation(2.27) can be solved with equation
n =c
2
(1Lx
+1Ly
+1Ly
)=cS
4V, (2.29)
where Lx, Ly and Lz are the dimensions of the room. By combining equations (2.29) and(2.27)
E(t) = E0 exp(−ct
[4V m− ln (1− α)t
4V
]). (2.30)
Reverberation time RT60 representing the sound energy of one millionth of the original,substitution E(t) = E0 10−6 can be made, thus giving
t = RT60 =24V ln 10
4mV −A ln (1− α)(2.31)
= −0.163V
A ln (1− α)− 4mV. (2.32)
The latter equation is known as the Eyring reverberation formula. By assuming that α issmall, substituting − ln (1− α) with a series expansion and neglecting the terms higherthan second order, equation (2.31) is equal to the Sabine reverberation formula with airabsorption included (equation 2.26). Comparative evaluations between Eyring and Sabineformulas have been performed in measurements of large churches by Carvalho [12].
CHAPTER 2. ROOM ACOUSTICS 13
In addition to the two formulas for reverberation time calculation, probably the nextfamiliar method is the Fitzroy equation [19], which is recommended to be used in caseswhere the absorption properties are not similar between surfaces. Neubauer [46] has alsostudied more closely the differences in reverberation time predictions using a variety offormulas.
2.2.2 Measurement of reverberation time
For real-world measurements of reverberation time, multiple methods have been developed,each having their own advantages and characteristics. Some of the most commonly usedmeans are presented here.
The most traditional way of analyzing reverberation is to produce whether an impulse-like or truncated sound and measure or listen to the attenuating sound. This is analogousto the definition of reverberation time. While it seems very simple compared to the moreadvanced methods, it is an easy way to roughly evaluate the reverberation properties. Inlarger spaces, this method can be used for analyzing the directions of early reflections. Witha recorded impulse response, fitting a straight line to the logarithmic sound decay curve isneeded for defining RT60. In cases where the signal-to-noise ratio is less than the required60 dB, or the measurement provides unreliable results, alternatively the attenuation time of20 or 30 dB can be used when multiplied with 3 or 2, respectively. These measured valuesare commonly noted with T20 and T30. Usually filtered or unfiltered noise, shooting blanksor popping balloons are used to produce repeatable excitation signals. For reliable results,averaged measurements have to be performed in multiple source and receiving positions[33].
Measurement methods using pseudorandom noise sequences, such as maximum lengthsequence (MLS), require dedicated signal processing equipment in the analysis stage forcalculating the correlation between a synchronized source and the receiver. One of the ad-vantages in MLS method is the ability to measure in situations where the signal-to-noiseratio is very low. According to Lahti [33], by using long measurement sequences, SNRcan be increased by over 80 dB. Also, the ability to function at low sound pressure levelsmakes this method suitable for situations where discreet measurement is required. One im-portant weakness in MLS measurement is the dependency on time invariance. As modernactive acoustic implementations are often incorporating time-variant properties for control-ling acoustic feedback, the MLS method is not usable in these cases.
Logarithmic sine-sweep measurement, however, is an usable method when high soundpressure levels are not problematic. A paper by Müller and Massarani presents a com-parison between sweep and MLS techniques. Advantages for the sweep measurements areequally good resistance for background noise, loudspeaker nonlinearities and distortion, but
CHAPTER 2. ROOM ACOUSTICS 14
most importantly regarding this work, the ability to reliably measure time-variant systems[44].
Independent of the method used to measure reverberation time, the measurement resultcan be often used in order to define the average absorption coefficient in a room by measur-ing the effective dimensions of the space and utilizing suitable reverberation time formulato calculate the absorption. This is a widely used practice especially in sound insulationmeasurements.
A plotting technique called Schroeder integration is a method of integrating a measuredor calculated impulse response starting from the end. An advantage of such a procedure isthat the resulting smooth decay curve is easily interpreted even with noise excitation signals[33]. Limiting the integration to the actual impulse response and neglecting the excess noiseis necessary for the efficient use of this technique [50].
2.3 Concert hall acoustics
As has been mentioned earlier, the impulse response in a closed space defines how a certainroom sounds. The temporal period of early reflections is regarded as one of the most im-portant factors related to hall acoustical descriptors. More accurately, the relation betweenamplitudes and delays of the direct and reflected sound defines the impression of a hallreceived by the listener.
Some of the most commonly used descriptors for acoustics especially in concert halls arepresented in the following. For a specific area of reverberation, liveliness is used to describethe reverberation time at middle and high frequencies, normally above 350 Hz. Intimacyis related to the perceived size of the hall, where a large space giving an impression ofthe performers playing closer to the listener than in reality, is a preferred feature. Also agood envelopment gives an impression of being surrounded by the performance, instead offollowing it from a distance. In addition, there are plenty of other descriptions, such asblend, ensemble and spaciousness [42, 57]. Generally all the terms above require binauralmeasurements for obtaining numerical results for objective comparison. Since the directionof reflections are considered as the most significant factor in spatial impression, monauralmeasurements do not provide sufficient information about concert hall acoustics.
The most commonly used properties that can be seen from monaural impulse responsesare early decay time (EDT) and clarity (C80). EDT is similar measure to the reverberationtime, but in this case only the deacy time for the first 10 dB is measured. EDT is interpretedby the listener as a clue of reverberation time RT60. Clarity on the other hand is calculatedas a fraction of integrals from squared impulse response h2(t)
CHAPTER 2. ROOM ACOUSTICS 15
C80 = 10 lg
∫ 80ms0 h2(t)dt∫∞80ms h
2(t)dt[dB] . (2.33)
In practice the result describes how easily or clearly transients and changes in the soundsource are perceived at the receiving point, whereas higher numbers represent more trans-parent clarity [31]. Definition (D50) is similar measure, but the time limits are different[4]:
D50 = 10 lg
∫ 50ms0 h2(t)dt∫∞
0 h2(t)dt. (2.34)
According to Kuttruff [31], definition describes better speech intelligibility, whereas clarityis more closely related to music acoustics. Barron [4] has stated that for definition parame-ter, the 80 ms time interval should be normally used for music application, while the 50 msinterval is more suitable for speech.
The effect of a room to the experienced sound pressure level is indicated by a strengthparameter G. Generally, it is defined as the ratio of the total energy of the impulse responseand the measured energy at 10 m from the source [50]. In situations where the acousticproperties are changed, it is also possible to compare the energy from two measurementsperformed in the same position to obtain the relative change in strength.
Grelative = 10 lg
∫∞0 h1
2(t)dt∫∞0 h2
2(t)dt[dB] . (2.35)
Besides the basic reverberation time, the property of running reverberance (RR) existsto describe reverberation conditions between the stage and hall. RR defines how well theperformers on the stage are supported by the reverberation from the hall. According toGade [22], the support consists of the perceived reverberation during breaks and pauses thatbind the consecutive notes. A descriptive number for running reverberance is calculated bycomparing the total sound energy between two 160 ms periods:
RR = 10 lg
∫ 160ms0 p2(t)dt∫ 320ms160ms p
2(t)dt. (2.36)
According to Möller, subjective parameters of reverberance and liveliness are mostly con-nected with the early decay time, neglecting the RR parameter. Like the envelopment andintimacy parameters, also spaciousness and apparent source width (ASW) parameters alldepend on the objective binaural measurements of early lateral energy fractions and inter-aural cross-correlations [42].
In general, reverberation times suitable for different types of music vary in relation to theroom volume. For instance, for chamber music in 500 m3 room an average reverberation
CHAPTER 2. ROOM ACOUSTICS 16
time of 1.2 s is recommended by Möller, whereas symphony orchestra needs approximately2.0 s in 3000 m3 hall [42]. According to the same reference, desirable values for orchestrarehearsal is about 1.5 s. In fact, requirements for shorter reverberation during practice israther inconsistent with the effect of audience in concert halls. Since the audience createsadditional absorption, the reverberation time is shorter than in empty hall. The relativechange in absorption is the greater the more modestly the seats are upholstered. The volumeoccupied by the attending audience is considered negligible in this case.
2.3.1 Stage acoustics
Although in performance spaces the hall and the stage are inseparably connected, the acous-tical conditions have different requirements for both sections. Orchestra pits in operaspresent yet special needs for the co-operation between the orchestra and singers. However,in this section the discussion is concentrated only on traditional stages found in concerthalls.
While the audience usually expects to hear the performed music as whole, balanced anddetailed, the performers preferably require additionally such acoustical environment thatperforming at optimum level is possible, since the acoustical conditions perceived by themusicians have a direct influence on the interpretation and playing style. Most importantly,the players should be able to hear themselves clearly, so that possible corrections in playingtechnique would be possible in order to adapt to the current acoustical conditions. Thusthe selected tempo, volume and articulation depend on how the performer perceives theplayed music, which is usually different from the music heard in the audience. The spaceitself should provide support to the performer in a way that the instrument is acousticallyconnected to the hall, and not just being a distant sound source.
In the case of performance by an ensemble, there is certain measures to describe how wellthe musicians can hear each other and how the sound of individual performers are blended.As an extreme example, an orchestra, where the players could only hear themselves playing,would definitely not perform with the same quality as in normal circumstances due to theloss of synchronization, balance and the perception of integrity.
According to Nummela [48], in acoustical design, the aspect of the performers has notbeen taken into account until the end of the 20th century. According to Meyer [41], begin-ning from the 1980’s, a series of publications have studied the acoustical conditions on thestage. Meyer has also stated three degrees of quality for musical communication on stage.At the first degree the volume of produced sound of a single player is related to the into-nation and rhythmic precision and at the second degree the quality of sound is consideredagainst the acoustical support. The third degree emphasizes the integration of the wholeorchestra to produce balanced and precisely articulated music as discussed above. Also
CHAPTER 2. ROOM ACOUSTICS 17
the importance of the acoustic conditions at the conductors position is pointed out as theconductor can be seen between the audience and the orchestra from the acoustical aspect.
As for the audience, early reflections are important as well for the performers, since theearliest response even in small halls is received from the surrounding walls and the ceilingafter the floor reflection. Early reflections have to be also well balanced compared to thelate reverberation from the hall to give sufficient clarity. Support at the stage is usuallypresented with separate early, total and late support parameters [23], respectively:
ST1 = STearly = 10 lg
∫ 100ms20ms h2(t)dt∫ 10ms0 h2(t)dt
(2.37)
ST2 = STtotal = 10 lg
∫ 1000ms20ms h2(t)dt∫ 10ms0 h2(t)dt
(2.38)
STlate = 10 lg
∫∞100ms h
2(t)dt∫ 10ms0 h2(t)dt
(2.39)
According to Möller [42], total support parameter has been found to have correlation withthe musicians perceived support with his own instrument, while STearly describes more theability to hear other musicians on stage. Similarly to the hall clarity parameter (equation(2.33)), clarity on stage (CS) is used to describe the musicians feeling of reverberance:
For all the ST parameters discussed above, the measurements are performed by using aomnidirectional microphone at 1 m distance from the sound source [42].
CS = 10 lg
∫ 80ms0 h2(t)dt∫∞80ms h
2(t)dt. (2.40)
Gade has stated that STlate parameter would replace CS parameter for the measure of re-verberance on stage. Besides for the audience section of a hall, the early decay time is alsoused to describe the impression of timbre or frequency response on the stage. Möller [42]suggests that the approximate value for stage would be 30% lower than the values mea-sured in the audience. Gade [23] on the other hand has presented that evaluating averagingequation of early decay time at selected frequencies
EDTF =EDT (250Hz) + EDT (500Hz)EDT (1kHz) + EDT (2kHz)
(2.41)
can be used to describe the tonal characteristics or brightness perceived by the musicianson stage.
The shape and dimensions of the stage have been studied by Nakamura et al. [45] bygathering subjective opinions from members of various orchestras. Three general types ofstages were involved in the investigations, of which conventional-type stages was the most
CHAPTER 2. ROOM ACOUSTICS 18
common. Also a small number of sound-diffusing and arena-type stages were studied. Inthe conventional stages the walls were rather smooth compared to diffusion-type stagesthat had plenty of sound scattering surfaces on the walls of the orchestra shell. Results ofthe study suggested that the musicians preference correlated negatively with the increasedinclination of the shell walls. This would suggest that with stages featuring a strongly fan-shape, the early reflections are directed away from the orchestra. Also a small size of thestage was seen to have a negative effect. In the study of Nakamura, 1000 m3 was consideredthe minimum for an acceptable stage volume.
Barron [4] has suggested an average area of 1.5 m2 to be reserved for each string andwind instrument and an area from 10 m2 for large percussion instruments. In reality, thenet area covered by a full-scale symphony orchestra of 100 members is approximately 150m2. Nummela [48] suggests that in addition to the clearance at the sides of the stage, alsoan area of 1 m wide should be left free at the front of stage to provide floor reflections tothe audience area.
The height of the ceiling is also an important consideration from the aspect of total stagevolume. By having a ceiling excessively high, reflections are delayed, which makes theplaying in an ensemble more difficult. According to Gade [23], early reflections shouldnot be delayed more than 35 ms from the direct sound in ideal conditions, which resultsin the maximum distance of 6 m for reflecting surfaces above. In cases where the stage isdesigned to have a height higher than this, a popular solution for providing early reflectionsfor the orchestra without reducing the physical volume is to suspended reflective elementsfrom the ceiling.
Chapter 3
Electro-acoustics
In addition to the traditional design paradigms for room acoustics, modern audio process-ing systems can be used to whether enhance or modify the room acoustical properties orto create a totally new acoustical environment. The latter alternative is often used in lis-tening situations to simulate a certain impression of acoustical space. Common techniquesinvolving so called auralization systems are filtering and convolution, but also complexphysical models can be used to give the original sound new surroundings [29]. This kindof electro-acoustics is commonly featured in consumers audio products, such as computersound devices and also utilized in architectural simulations, virtual reality or even in a high-quality car audio systems [3, 13, 15, 24]. However, since auralization techniques are notdirectly in the scope of this work, the subject is not discussed further here.
Another approach to electro-acoustics is a system being functional inside an existingacoustic space. The functioning of these kinds of solutions depends on real sound fields,and the processing is performed to add or remove certain acoustical characteristics, of whichthe reverberation properties form clearly the most popular application. From the equipmentpoint of view, besides the signal processing needs of auralization systems, equipment fa-miliar from sound recording and reproduction are needed. Systems having reverberationenhancing properties and featuring receiving and transmitting electro-acoustic transducersin the same acoustic space are called regenerative systems. During the last decades, thisscheme has been utilized in a number of halls in order to increase the impression of spa-ciousness or to fix acoustical design flaws.
By using an electro-acoustic system, it is possible to create a space with variable acous-tic conditions. This permits a single hall or large room to be suitable for multiple uses,such as classical concerts, theater plays or opera performances. Implementing a systemwith variable acoustics in an existing hall can be economically much more viable alterna-tive compared to building several separate halls. Practically all electro-acoustic systems
19
CHAPTER 3. ELECTRO-ACOUSTICS 20
installed in music halls have been designed to provide better acoustics for the audience.
3.1 System classification
The acoustical systems shortly described earlier represent different approaches to activeacoustics. Kleiner and Svensson [30] have proposed a classification of acoustic systemsaccording to their operating principles. In addition to the active systems, also some passivemethods are included in this reference, such as auxiliary reverberation chambers embeddedto the actual room. In the following, the basic principles of active acoustic systems arepresented.
Of non-reverberant systems, a traditional public address sound reinforcement can be seenas a very basic reference for most of the active systems included in the classification byKleiner and Svensson. In this scenario, the signal chain consists of a microphone (re-ceiver), an amplifier (processor) and a loudspeaker (source). This chain then works as asingle-channel direct sound enhancement system. Sound reinforcement systems often uti-lize microphones and loudspeakers with at least modest directivity. With this and carefullyselected microphone positions close to the original sound source, acoustic feedback prob-lems causing coloration can be usually circumvented by maximizing the direct sound andminimizing the amplified sound arriving to the microphone, which also renders the sys-tem non-regenerative. However, if the acoustic feedback occurs, coloration in this case iseasily audible usually in very characteristic howling sound. Although such systems canbe transformed into reverberant systems with suitable reverberation equipment, this typeof systems are neither naturally reverberant nor regenerative, thus for enhancing the realacoustical properties of a room, they are hardly suitable. [30]
Enhancing early reflections in a non-reverberative manner is a less used method in activeacoustic systems. According to Kleiner and Svensson, wave front synthesis, employing ar-rays of loudspeakers and microphones to generate additional early reflections in larger halls,is the most advanced concept in this area [30]. This technique is usable in situations wherethe shape of the hall does not provide enough early reflections from side walls or ceiling.Commercial concepts using this principle, for instance Acoustic Control System ACS byBerkhout et al. [7], have been developed earlier. Nummela has stated that the implemen-tations of early reflection enhancement systems tend to work more or less as regenerativesystems in contrary to the wave field synthesis concept due to the natural acoustic feedbackoccurring in the system [48].
The last of the three active system types is an enhancement for reverberant sound, whichcan be accomplished by either regenerative or non-regenerative methods. While the non-regenerative option uses the same operating principles as the early reflection enhancement
CHAPTER 3. ELECTRO-ACOUSTICS 21
described above, the regenerative alternative is mainly based on the acoustic feedback in thesystem. The reverberant sound is amplified and then directed to the loudspeakers to createan impression of additional reverberation. While the amplification alone can provide ade-quate enhancement, the reverberation can be increased with a signal processing algorithm[30].
Instead of classifying active systems purely on the basis whether they are reverberativeor regenerative, audio bandwidth affected by the system or the impulse response type canbe also used as the classifying factor between active systems. In multi-channel applica-tion, a wide-band solution affects to the whole audio frequency range simultaneously in allchannels, whereas narrow band systems consist of separate channels for narrow frequencybands each. Hence, a narrow band system generally requires a large amount of channels, thenumber being reciprocally proportional to the selected bandwidth of a single channel. Anadvantage in this solution is a comparably good resistance against coloration and instability[48]. A large number of channels is also required for achieving sufficient amplification.In contrary, nowadays the most often used applications utilizing wide-band systems needmuch less channels, but as a consequence coloration and stability conditions must be care-fully examined. Since the room and acoustic system are coupled in series and amplificationor additional reverberation is added to the signal, control of regeneration is required in mostcases to prevent excess feedback. This issue is reviewed in the next sections.
According to the classification by Svensson [61], the active acoustic system utilized forthe investigations in this work is of a regenerative type. As the loudspeakers and micro-phones are placed in the same acoustical space, the traditional problem is the resultingacoustic feedback. Without any control, this can cause sound coloration and easily distin-guishable noise artifacts, namely feedback whistle or howling. Some general methods forfeedback control are reviewed in the next sections.
3.2 Regenerative systems and signal processing
Since this work concentrates on creating a natural sounding reverberation enhancement inspaces of various sizes, regenerative reverberation is practically the only viable alternativefor implementing such systems. In this section, some details are discussed more thoroughlyconcerning the signal processing in reverberation enhancement.
Before the digital signal processing era, electro-acoustic systems were utilizing analogdevices like plate reverberation and tape delay units, even in large-scale installations. As anexample, Ditamore [17], dating back to 1965, presented an acoustic control system for 6000seat fan-shaped multifunction auditorium for combined reverberation and sound reinforce-ment implementation. Signal chain in that system was rather similar to generic solutions,
CHAPTER 3. ELECTRO-ACOUSTICS 22
but with less regenerative properties, thus resembling wave-field synthesis described earlierin this chapter.
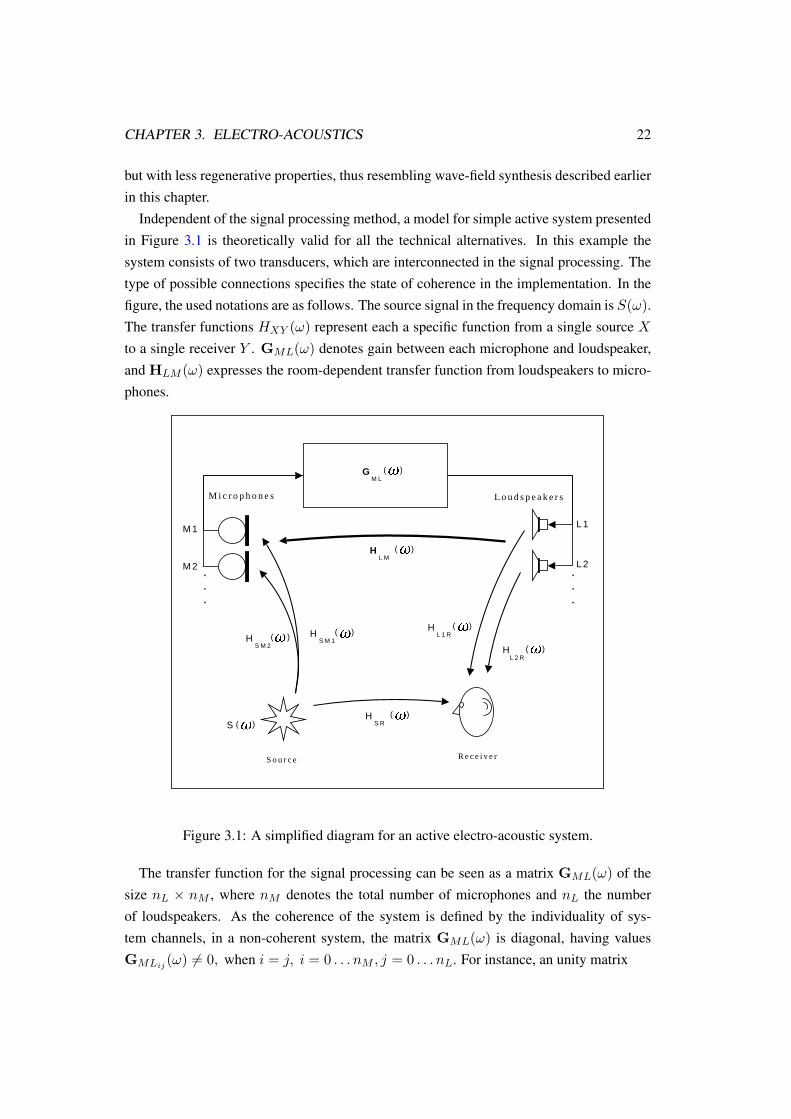
Independent of the signal processing method, a model for simple active system presentedin Figure 3.1 is theoretically valid for all the technical alternatives. In this example thesystem consists of two transducers, which are interconnected in the signal processing. Thetype of possible connections specifies the state of coherence in the implementation. In thefigure, the used notations are as follows. The source signal in the frequency domain is S(ω).The transfer functions HXY (ω) represent each a specific function from a single source Xto a single receiver Y . GML(ω) denotes gain between each microphone and loudspeaker,and HLM (ω) expresses the room-dependent transfer function from loudspeakers to micro-phones.
M i c r o p h o n e s L o u d s p e a k e r s
R e c e i v e rS o u r c e
G M L
( )
L1
L2
M 1
M 2
H L M
( )
H S R
( )
H L 1 R
( )
L 2 R( )
H S M 1
( )H
S M 2( )
.
.
.
.
.
.
H
S ( )
Figure 3.1: A simplified diagram for an active electro-acoustic system.
The transfer function for the signal processing can be seen as a matrix GML(ω) of thesize nL × nM , where nM denotes the total number of microphones and nL the numberof loudspeakers. As the coherence of the system is defined by the individuality of sys-tem channels, in a non-coherent system, the matrix GML(ω) is diagonal, having valuesGMLij (ω) 6= 0, when i = j, i = 0 . . . nM , j = 0 . . . nL. For instance, an unity matrix
CHAPTER 3. ELECTRO-ACOUSTICS 23
GML(ω) =
[1 00 1
](3.1)
would represent a system with two separate transducers with ideal frequency-independentunity gain. Griesinger [25] has stated that designing a system with diagonal gain matrix isnot sensible due to the excess need of separate channels.
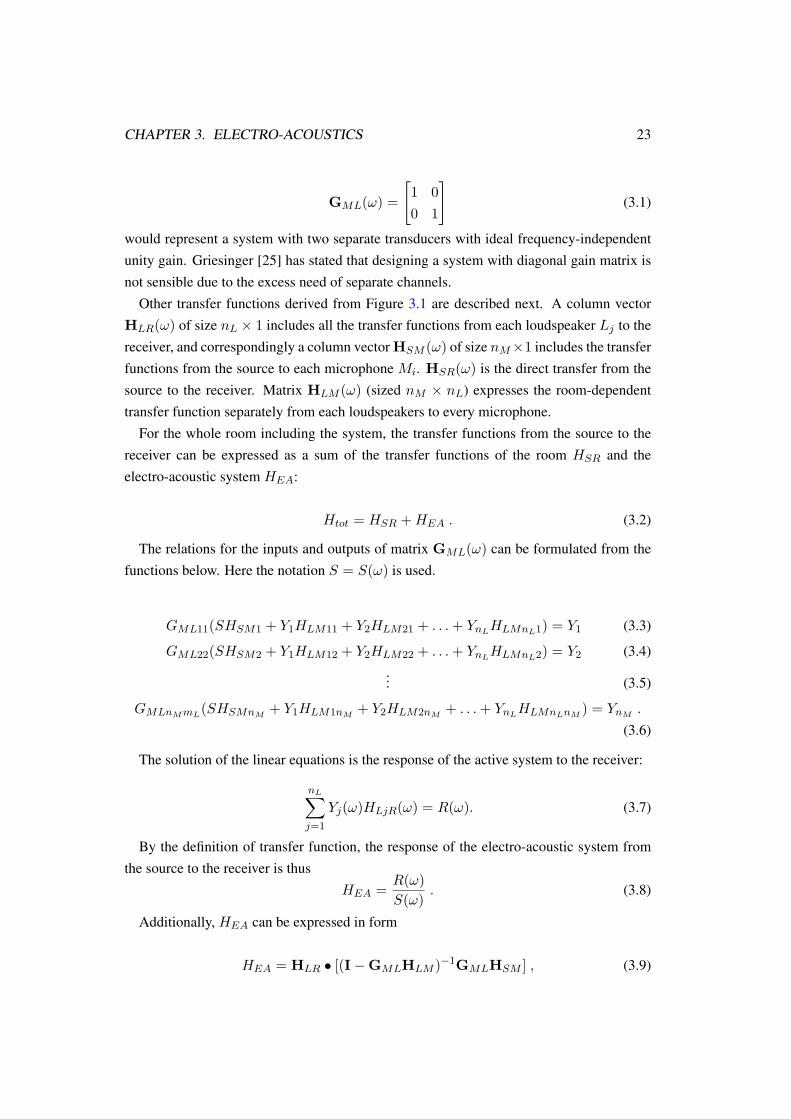
Other transfer functions derived from Figure 3.1 are described next. A column vectorHLR(ω) of size nL × 1 includes all the transfer functions from each loudspeaker Lj to thereceiver, and correspondingly a column vector HSM (ω) of size nM×1 includes the transferfunctions from the source to each microphone Mi. HSR(ω) is the direct transfer from thesource to the receiver. Matrix HLM (ω) (sized nM × nL) expresses the room-dependenttransfer function separately from each loudspeakers to every microphone.
For the whole room including the system, the transfer functions from the source to thereceiver can be expressed as a sum of the transfer functions of the room HSR and theelectro-acoustic system HEA:
Htot = HSR +HEA . (3.2)
The relations for the inputs and outputs of matrix GML(ω) can be formulated from thefunctions below. Here the notation S = S(ω) is used.
GML11(SHSM1 + Y1HLM11 + Y2HLM21 + . . .+ YnLHLMnL1) = Y1 (3.3)
GML22(SHSM2 + Y1HLM12 + Y2HLM22 + . . .+ YnLHLMnL2) = Y2 (3.4)... (3.5)
GMLnMmL(SHSMnM
+ Y1HLM1nM+ Y2HLM2nM
+ . . .+ YnLHLMnLnM) = YnM .
(3.6)
The solution of the linear equations is the response of the active system to the receiver:
nL∑j=1
Yj(ω)HLjR(ω) = R(ω). (3.7)
By the definition of transfer function, the response of the electro-acoustic system fromthe source to the receiver is thus
HEA =R(ω)S(ω)
. (3.8)
Additionally, HEA can be expressed in form
HEA = HLR • [(I−GMLHLM )−1GMLHSM ] , (3.9)
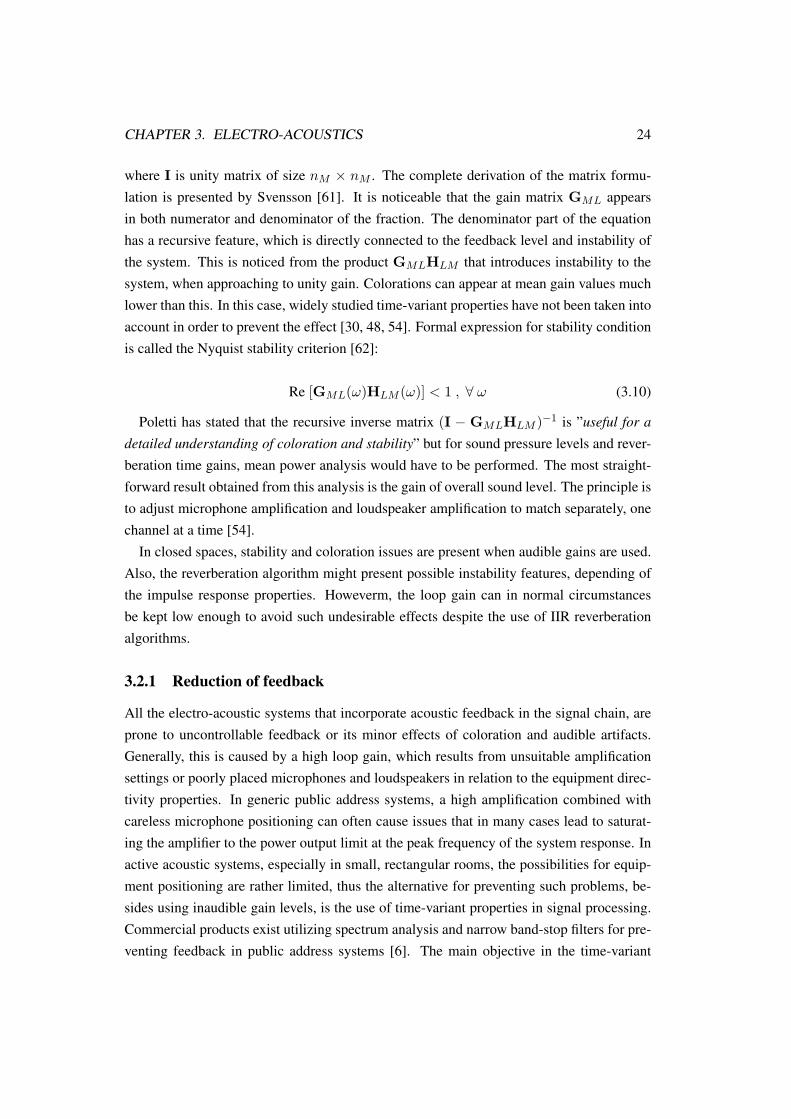
CHAPTER 3. ELECTRO-ACOUSTICS 24
where I is unity matrix of size nM × nM . The complete derivation of the matrix formu-lation is presented by Svensson [61]. It is noticeable that the gain matrix GML appearsin both numerator and denominator of the fraction. The denominator part of the equationhas a recursive feature, which is directly connected to the feedback level and instability ofthe system. This is noticed from the product GMLHLM that introduces instability to thesystem, when approaching to unity gain. Colorations can appear at mean gain values muchlower than this. In this case, widely studied time-variant properties have not been taken intoaccount in order to prevent the effect [30, 48, 54]. Formal expression for stability conditionis called the Nyquist stability criterion [62]:
Re [GML(ω)HLM (ω)] < 1 , ∀ ω (3.10)
Poletti has stated that the recursive inverse matrix (I − GMLHLM )−1 is ”useful for adetailed understanding of coloration and stability” but for sound pressure levels and rever-beration time gains, mean power analysis would have to be performed. The most straight-forward result obtained from this analysis is the gain of overall sound level. The principle isto adjust microphone amplification and loudspeaker amplification to match separately, onechannel at a time [54].
In closed spaces, stability and coloration issues are present when audible gains are used.Also, the reverberation algorithm might present possible instability features, depending ofthe impulse response properties. Howeverm, the loop gain can in normal circumstancesbe kept low enough to avoid such undesirable effects despite the use of IIR reverberationalgorithms.
3.2.1 Reduction of feedback
All the electro-acoustic systems that incorporate acoustic feedback in the signal chain, areprone to uncontrollable feedback or its minor effects of coloration and audible artifacts.Generally, this is caused by a high loop gain, which results from unsuitable amplificationsettings or poorly placed microphones and loudspeakers in relation to the equipment direc-tivity properties. In generic public address systems, a high amplification combined withcareless microphone positioning can often cause issues that in many cases lead to saturat-ing the amplifier to the power output limit at the peak frequency of the system response. Inactive acoustic systems, especially in small, rectangular rooms, the possibilities for equip-ment positioning are rather limited, thus the alternative for preventing such problems, be-sides using inaudible gain levels, is the use of time-variant properties in signal processing.Commercial products exist utilizing spectrum analysis and narrow band-stop filters for pre-venting feedback in public address systems [6]. The main objective in the time-variant
CHAPTER 3. ELECTRO-ACOUSTICS 25
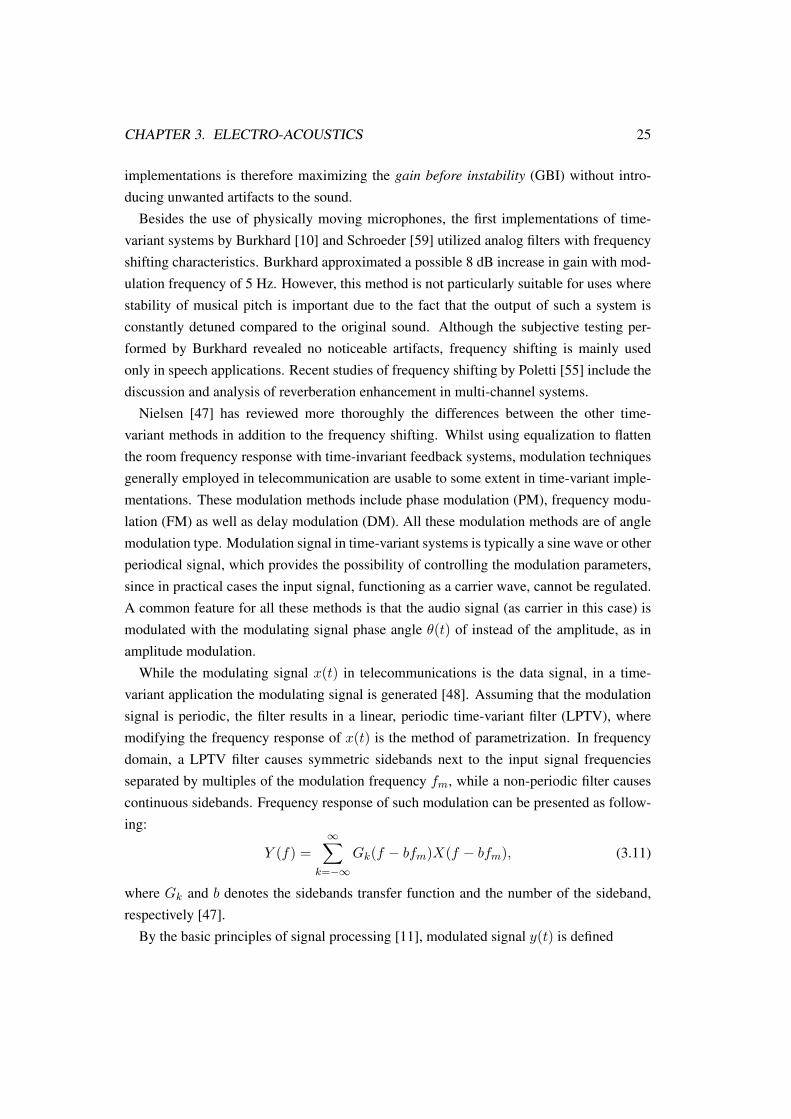
implementations is therefore maximizing the gain before instability (GBI) without intro-ducing unwanted artifacts to the sound.
Besides the use of physically moving microphones, the first implementations of time-variant systems by Burkhard [10] and Schroeder [59] utilized analog filters with frequencyshifting characteristics. Burkhard approximated a possible 8 dB increase in gain with mod-ulation frequency of 5 Hz. However, this method is not particularly suitable for uses wherestability of musical pitch is important due to the fact that the output of such a system isconstantly detuned compared to the original sound. Although the subjective testing per-formed by Burkhard revealed no noticeable artifacts, frequency shifting is mainly usedonly in speech applications. Recent studies of frequency shifting by Poletti [55] include thediscussion and analysis of reverberation enhancement in multi-channel systems.
Nielsen [47] has reviewed more thoroughly the differences between the other time-variant methods in addition to the frequency shifting. Whilst using equalization to flattenthe room frequency response with time-invariant feedback systems, modulation techniquesgenerally employed in telecommunication are usable to some extent in time-variant imple-mentations. These modulation methods include phase modulation (PM), frequency modu-lation (FM) as well as delay modulation (DM). All these modulation methods are of anglemodulation type. Modulation signal in time-variant systems is typically a sine wave or otherperiodical signal, which provides the possibility of controlling the modulation parameters,since in practical cases the input signal, functioning as a carrier wave, cannot be regulated.A common feature for all these methods is that the audio signal (as carrier in this case) ismodulated with the modulating signal phase angle θ(t) of instead of the amplitude, as inamplitude modulation.
While the modulating signal x(t) in telecommunications is the data signal, in a time-variant application the modulating signal is generated [48]. Assuming that the modulationsignal is periodic, the filter results in a linear, periodic time-variant filter (LPTV), wheremodifying the frequency response of x(t) is the method of parametrization. In frequencydomain, a LPTV filter causes symmetric sidebands next to the input signal frequenciesseparated by multiples of the modulation frequency fm, while a non-periodic filter causescontinuous sidebands. Frequency response of such modulation can be presented as follow-ing:
Y (f) =∞∑
k=−∞Gk(f − bfm)X(f − bfm), (3.11)
where Gk and b denotes the sidebands transfer function and the number of the sideband,respectively [47].
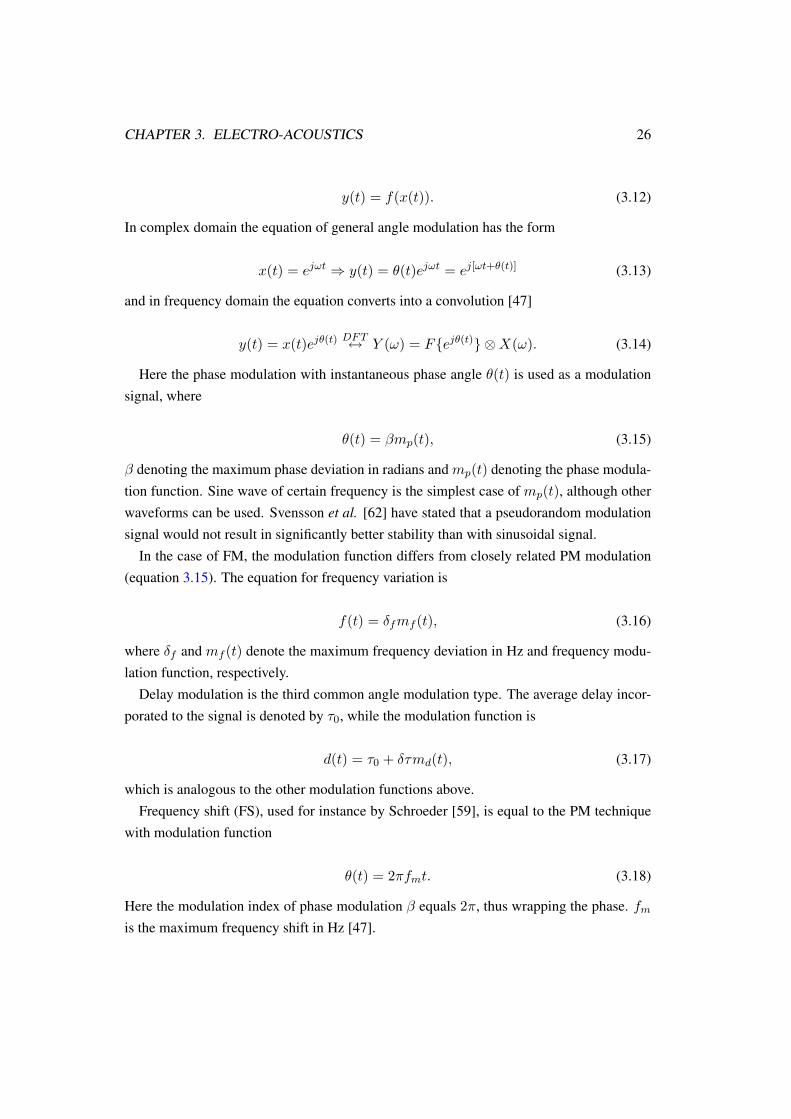
By the basic principles of signal processing [11], modulated signal y(t) is defined
CHAPTER 3. ELECTRO-ACOUSTICS 26
y(t) = f(x(t)). (3.12)
In complex domain the equation of general angle modulation has the form
x(t) = ejωt ⇒ y(t) = θ(t)ejωt = ej[ωt+θ(t)] (3.13)
and in frequency domain the equation converts into a convolution [47]
y(t) = x(t)ejθ(t) DFT↔ Y (ω) = F{ejθ(t)} ⊗X(ω). (3.14)
Here the phase modulation with instantaneous phase angle θ(t) is used as a modulationsignal, where
θ(t) = βmp(t), (3.15)
β denoting the maximum phase deviation in radians and mp(t) denoting the phase modula-tion function. Sine wave of certain frequency is the simplest case of mp(t), although otherwaveforms can be used. Svensson et al. [62] have stated that a pseudorandom modulationsignal would not result in significantly better stability than with sinusoidal signal.
In the case of FM, the modulation function differs from closely related PM modulation(equation 3.15). The equation for frequency variation is
f(t) = δfmf (t), (3.16)
where δf and mf (t) denote the maximum frequency deviation in Hz and frequency modu-lation function, respectively.
Delay modulation is the third common angle modulation type. The average delay incor-porated to the signal is denoted by τ0, while the modulation function is
d(t) = τ0 + δτmd(t), (3.17)
which is analogous to the other modulation functions above.Frequency shift (FS), used for instance by Schroeder [59], is equal to the PM technique
with modulation function
θ(t) = 2πfmt. (3.18)
Here the modulation index of phase modulation β equals 2π, thus wrapping the phase. fmis the maximum frequency shift in Hz [47].
CHAPTER 3. ELECTRO-ACOUSTICS 27
Of the techniques above, according to Nielsen [47], DM is a popular modulation used incommercial reverberation enhancement system due to its rather straightforward implemen-tation. Studies comparing the efficiency and audibility of discussed modulation methodshave been performed by Svensson [61], whereas many publications concentrate on dis-cussing only a single technique.
For all modulation techniques in electro-acoustic systems, an equation by Schroeder [60]defines the mean loop gain parameter MLG
MLG = |S(f)|2, (3.19)
where the system response over effective frequencies is averaged. From this equationthe definition for gain before instability is derived, indicating the performance of electro-acoustic system
GBI = 10 lgMLG [dB]. (3.20)
The value for GBI depends on the irregularity of the loop gain S(f), where a very unevengain through the effective frequencies lowers GBI. Schroeder has derived a formula forevaluating expected GBI from the loop gain
〈GBI〉 = −10 lg [lg (BRT60
22)]− 3.8 [dB]. (3.21)
In this equation bandwidth and reverberation time are denoted with B and RT60, respec-tively. The equation is valid only in diffuse sound fields.
Also, a theoretical maximum value of 2.5 dB for GBI, attainable with FS modulation,is calculated by Nielsen and Svensson [47]. Schroeder, on the other hand, has stated thattraditional values for GBI without feedback control are approximately -10 dB. This indi-cates that considerable improvement can be gained with various feedback control methodsin active systems. According to Nummela [48], approximate GBI values of -4 dB and -1dB have been reached by Nielsen and Schroeder, respectively with time-variant systems.
3.3 Microphones
The type and properties of the microphones used in active acoustic systems have a greateffect on how the system sounds. However, the positions where the microphones are placedhave an even more important role in the system configuration. Of the two most commonmicrophone types, condenser microphones are typically used in active systems due to thehigher sensitivity and linear frequency response compared to those of dynamic counterparts.
CHAPTER 3. ELECTRO-ACOUSTICS 28
Naturally, a frequency response for an optimal microphone should be as flat as possibleto capture uncolored sound from the space. Dynamic ranges of over 130 dB featured in pro-fessional quality condenser microphones [2] are sufficient for capturing the sound pressurelevels produced by the traditional orchestral instruments, especially when not placed in thevicinity of percussion instruments. A high signal-to-noise ratio is also required to maintainthe captured signal free from excess background noise.
Directivity requirements for microphones in use are related to the positioning of the mi-crophones and loudspeakers as well as the regenerative features of the system. Omnidi-rectional and cardioid patterns are most commonly used in all reverberation enhancementsystems. In modern microphones, the directional pattern is changeable, thus making itpossible to experiment with different settings without having to replace the microphones.Selection of used directivity pattern depends on in what relation the direct and reverber-ant sound are intended to be captured. With a cardioid pattern directed to the source, thereflected sound is neglected more than in the case of omnidirectional pattern.
Recommendations for the microphone positions are often found in papers discussingreverberation systems generally. Vuichard and Meynial [69] and Lokki et al. [38] havepresented discussion of using individual microphones for each instrument in an orchestra.While Griesinger [25] has suggested using pickup microphones, the implementations basedon per-instrument approach are rather awkward. Since the change in playing position canresult in a considerable variation in captured sound pressure levels, close microphones re-quire constant adjustments.
Using a set of microphones in the reverberant field have been a popular method for mi-crophone positioning in earlier studies of regenerative systems. Vuichard and Meynial [69]have stated that the minimum suggested microphone distance from the source is 0.2 timesthe reverberation radius, where the diffuse field assumption should still be approximatelyvalid. Griesinger [25] has used a microphone pair positioned at the front of the balcony in atheater. This position is a good example of positioning the microphones in the diffuse field.The hall in question seats 1500 people.
3.4 Loudspeakers
The loudspeakers in an active acoustic systems represent the other electro-acoustic inter-face between the system and room acoustical environment. In addition to the microphones,also the performance of the loudspeakers should exceed the frequency response and noiserequirements. Considering orchestral music, fundamental frequencies from traditional in-struments range from 40 Hz to approximately 4000 Hz [57]. Although some organ anddrum instruments are capable to produce frequencies even lower, the response at high fre-
CHAPTER 3. ELECTRO-ACOUSTICS 29
quencies is more crucial, since the harmonic frequencies are important for the correct timbreof the instruments.
The directivity of the loudspeakers is an important factor. In active acoustic systems,omnidirectional radiation pattern is the most desirable when reaching for an uniform effectin the acoustic space. Unfortunately in most loudspeakers suitable for active systems, thesound directivity is noticeable in high frequencies. These impairments can be circumventedby choosing more distant loudspeaker positions from the listening area, thus extending thesound field of flat frequency response. Also a larger set of equally spaced loudspeakershelps in creating an uniform sound field.
In order to create convincing reverberant room with an electro-acoustic system, the lis-tener must not be able to distinguish the sound coming from a single or multiple loudspeak-ers. In real acoustic space, the early reflections and late reverberation arrive from nearlyinfinite number of directions, thus the situation with acoustic system have to be as real aspossible. Naturally, the reverberant sound in larger spaces, such as at the concert hall stage,can have a noticeable general direction.
A sufficient loudspeaker distance from the listener in relation to the distance between ad-jacent loudspeakers is an essential factor in preventing localization effects. Since the humanhearing has a limited accuracy of reliably localizing single sources, positioning loudspeak-ers closely in a row or array formation is an effective way to weaken a sense of separatesound sources if the reverberation algorithm output signals are uncorrelated.
3.5 Existing solutions
While several active acoustic systems has been developed for enhancing the acoustics inperformance spaces, only few are designed for practice rooms. In this section, existingelectro-acoustic systems are briefly presented.
In Royal Albert Hall, London, a system called Assisted Resonance (AR) was installedin the 1960’s to produce additional reverberation to otherwise dry hall by electro-acousticmeans. For the system itself, a narrow-band solution consisting of approximately 100 indi-vidual channels was used. The AR system in Royal Albert Hall has the effect of providing0.4-0.5 s longer reverberation time at middle frequencies compared to the same hall withoutthe system [8, 30].
The LARES system [25, 26], originally developed by Griesinger for Lexicon Inc., isa commercialized virtual acoustic product similar to the AR system. This system also ismeant to improve the acoustical qualities mainly for the audience, not the performers. TheLARES system is possible to be installed for music rehearsal spaces, which on the otherhand is closer to the subject of this work. This product under the name Wenger Corporation
CHAPTER 3. ELECTRO-ACOUSTICS 30
V-Room includes a small sound insulated room in which the electro-acoustic system isinstalled to provide multiple acoustical settings. Systems of this type are in use in a numberof locations in United States [34]. Nummela [48] has compared the performance of LARESsystem and the time-variant reverberation algorithm discussed in Section 4.5.
The CARMEN system, developed in France by CSTB [14], provides an active acousticsolution for performance halls. The product is based on a number of units, consisting of amicrophone and a loudspeaker, which are positioned on the walls and ceiling of the hall.With a small number of presets, the acoustics can be modified suitable for several musicstyles, such as chamber music, symphony orchestra or opera. In Brighton Dome, England,the system provides a reverberation time approximately 1 s longer than without a system,depending on the selected system configuration. CARMEN system is presently installed innine multipurpose halls in France and England. A new system, called Carmencita, has beenrecently developed further to function with smaller amount of equipment [58].
Information about other practice room systems besides the V-Room is not widely avail-able as in most of the publications variable concert hall acoustics are discussed. Notablestudies include Variable Room Acoustics (VRA) system by Poletti [54], Acoustic ControlSystem (ACS) by Berkhout et al. [7] and the Electronic Reflected Energy System (ERES)by Jaffe and Scarbrough [27]. Of these systems, ACS is commercialized by Acoustic Con-trol Systems B.V. [1] and the product is in use in various halls, churches and auditoriums.While the most recent versions provide the possibility for early reflection and orchestrashell acoustics enhancement, the system is intended for performance spaces, not rehearsalrooms.
3.6 Psychoacoustics and hearing
While the domain of psychoacoustics is generally not directly related to electro-acoustics,in this work these two branches are closely connected. Therefore the discussion concerningpsychoacoustical perspective is presented here.
For designing and implementing acoustic systems utilizing active components, it is im-portant to understand some of the basic functions of hearing and auditory systems. Themain considerations are connected to the sense of sound direction and coloration. Since thepurpose of active acoustic systems is to produce artificial environments in spaces that wouldnaturally sound very different and often present contradictions with visual impression con-tradictions, the acoustic system must be convincing enough to create pleasant acousticalsurroundings.
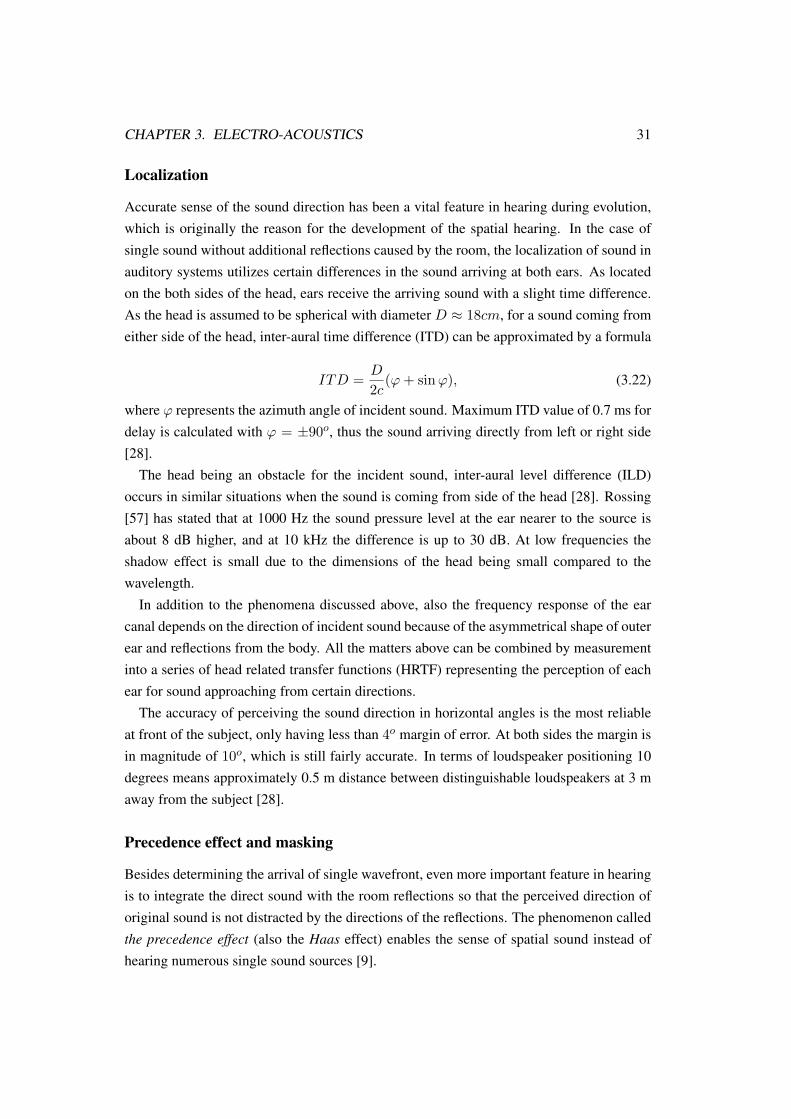
CHAPTER 3. ELECTRO-ACOUSTICS 31
Localization
Accurate sense of the sound direction has been a vital feature in hearing during evolution,which is originally the reason for the development of the spatial hearing. In the case ofsingle sound without additional reflections caused by the room, the localization of sound inauditory systems utilizes certain differences in the sound arriving at both ears. As locatedon the both sides of the head, ears receive the arriving sound with a slight time difference.As the head is assumed to be spherical with diameter D ≈ 18cm, for a sound coming fromeither side of the head, inter-aural time difference (ITD) can be approximated by a formula
ITD =D
2c(ϕ+ sinϕ), (3.22)
where ϕ represents the azimuth angle of incident sound. Maximum ITD value of 0.7 ms fordelay is calculated with ϕ = ±90o, thus the sound arriving directly from left or right side[28].
The head being an obstacle for the incident sound, inter-aural level difference (ILD)occurs in similar situations when the sound is coming from side of the head [28]. Rossing[57] has stated that at 1000 Hz the sound pressure level at the ear nearer to the source isabout 8 dB higher, and at 10 kHz the difference is up to 30 dB. At low frequencies theshadow effect is small due to the dimensions of the head being small compared to thewavelength.
In addition to the phenomena discussed above, also the frequency response of the earcanal depends on the direction of incident sound because of the asymmetrical shape of outerear and reflections from the body. All the matters above can be combined by measurementinto a series of head related transfer functions (HRTF) representing the perception of eachear for sound approaching from certain directions.
The accuracy of perceiving the sound direction in horizontal angles is the most reliableat front of the subject, only having less than 4o margin of error. At both sides the margin isin magnitude of 10o, which is still fairly accurate. In terms of loudspeaker positioning 10degrees means approximately 0.5 m distance between distinguishable loudspeakers at 3 maway from the subject [28].
Precedence effect and masking
Besides determining the arrival of single wavefront, even more important feature in hearingis to integrate the direct sound with the room reflections so that the perceived direction oforiginal sound is not distracted by the directions of the reflections. The phenomenon calledthe precedence effect (also the Haas effect) enables the sense of spatial sound instead ofhearing numerous single sound sources [9].
CHAPTER 3. ELECTRO-ACOUSTICS 32
There are some limits that have to be met in the precedence effect. The time window inwhich the reflections are assumed to result from the original source is 35 ms, the successivesounds are required to have similar spectra and time envelopes to the original sound andthe amplitude in reflections must not be considerably louder [57]. The latter condition ispractically never a problem in active acoustic systems with reasonable gain. According toKarjalainen [28], the sound pressure level of the reflections have to be over 15 dB higherthan the direct sound in order to prohibit the direct sound to be heard. If single reflectionsarrive later than the mentioned 35 ms, they are heard as separate echoes from their owndirections, not blending to the source. Möller [42] has presented that reflections arrivingtoo early are perceived as sound coloration rather than spatial effect. In a situation wherethe reflections are received 45o from the side, coloration effect is noticed in reflections withdelays less than 20 ms. Also, with suitable reflection levels the spatial impression couldbe attained with reflections as late as 45 ms. Very early (approximately 5 ms) reflectionsat relative sound pressure levels of approximately -10 dB cause false deductions of theoriginal sound source direction. Sound coloration effects due to artificially amplified soundare discussed more thoroughly in Section 4.4.
Chapter 4
Concept model
In this work, a concept model of an electro-acoustic system for practice rooms of varioussizes is implemented and studied. In order to respond to the growing needs for practicespaces in music institutions and orchestras, an active system presents a technique enablingthe musicians to rehearse in acoustical environment which resembles the real venue of per-formance. By the means of traditional acoustic design and passive elements, the sameobjective would require building a copy of the performance space. Naturally, this is rarelypossible due to economical limitations. The electro-acoustic system makes it possible todecrease the size of the hall or room but still have sufficient reverberation to support play-ing solo or in an ensemble. On the other hand, creating a small space with adequate re-verberation results in an excessive sound pressure levels. An additional advantage of anelectro-acoustic system is that in similarly sized rooms the sound pressure levels can belowered considerably by artificially creating the needed reverberation.
4.1 Truncated hall concept
The increasing usage of the facilities in many concert and multi-purpose halls decreasesthe possibilities of the orchestras to rehearse in their principal performance space. Thisproblem has been tried to partially solve by converting rooms from less demanding use torehearsal halls. With slight room acoustical modifications, the room can provide a space fororchestral rehearsal. However, such solution rarely results in acceptable acoustic conditionsthat satisfy the needs of the musicians. In this kind of solution common acoustical flawslike focusing and echoes, poor support and reverberation or excess sound pressure levelscan be present, due to the fact that the room does not feature proper acoustical design in thefirst place [32]. In addition, the acoustics in such rehearsal hall do not correspond to theacoustics in the real concert hall.
33
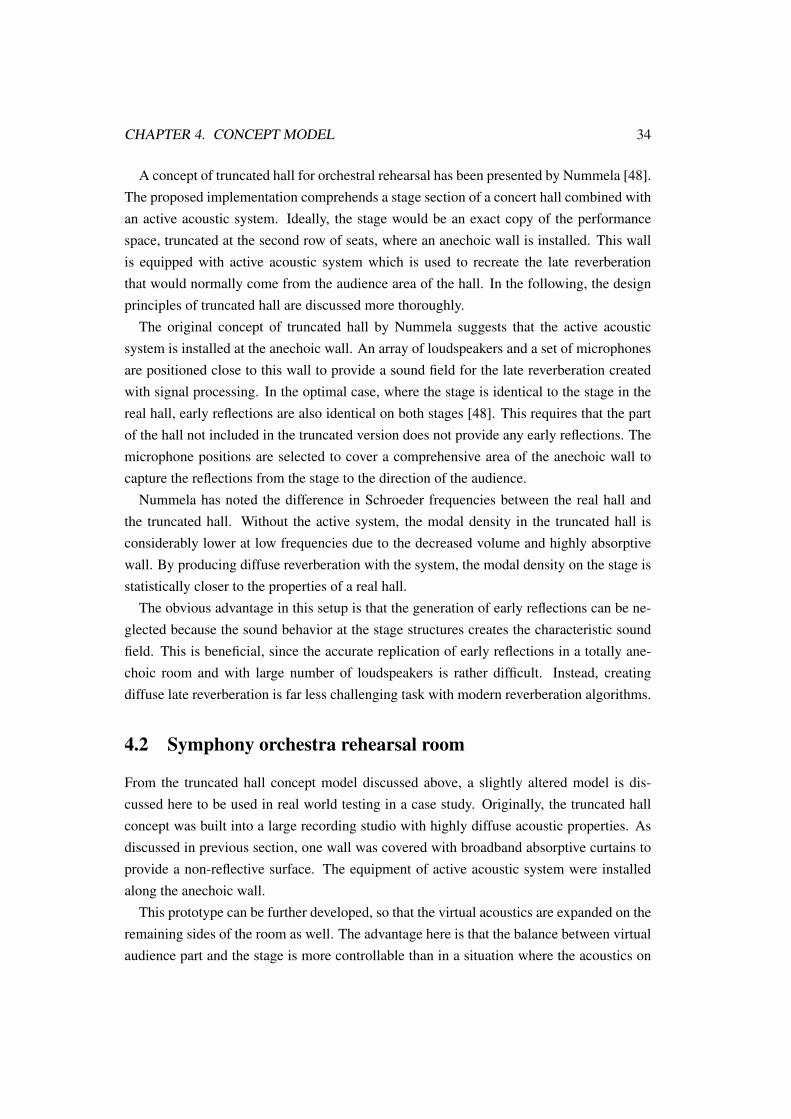
CHAPTER 4. CONCEPT MODEL 34
A concept of truncated hall for orchestral rehearsal has been presented by Nummela [48].The proposed implementation comprehends a stage section of a concert hall combined withan active acoustic system. Ideally, the stage would be an exact copy of the performancespace, truncated at the second row of seats, where an anechoic wall is installed. This wallis equipped with active acoustic system which is used to recreate the late reverberationthat would normally come from the audience area of the hall. In the following, the designprinciples of truncated hall are discussed more thoroughly.
The original concept of truncated hall by Nummela suggests that the active acousticsystem is installed at the anechoic wall. An array of loudspeakers and a set of microphonesare positioned close to this wall to provide a sound field for the late reverberation createdwith signal processing. In the optimal case, where the stage is identical to the stage in thereal hall, early reflections are also identical on both stages [48]. This requires that the partof the hall not included in the truncated version does not provide any early reflections. Themicrophone positions are selected to cover a comprehensive area of the anechoic wall tocapture the reflections from the stage to the direction of the audience.
Nummela has noted the difference in Schroeder frequencies between the real hall andthe truncated hall. Without the active system, the modal density in the truncated hall isconsiderably lower at low frequencies due to the decreased volume and highly absorptivewall. By producing diffuse reverberation with the system, the modal density on the stage isstatistically closer to the properties of a real hall.
The obvious advantage in this setup is that the generation of early reflections can be ne-glected because the sound behavior at the stage structures creates the characteristic soundfield. This is beneficial, since the accurate replication of early reflections in a totally ane-choic room and with large number of loudspeakers is rather difficult. Instead, creatingdiffuse late reverberation is far less challenging task with modern reverberation algorithms.
4.2 Symphony orchestra rehearsal room
From the truncated hall concept model discussed above, a slightly altered model is dis-cussed here to be used in real world testing in a case study. Originally, the truncated hallconcept was built into a large recording studio with highly diffuse acoustic properties. Asdiscussed in previous section, one wall was covered with broadband absorptive curtains toprovide a non-reflective surface. The equipment of active acoustic system were installedalong the anechoic wall.
This prototype can be further developed, so that the virtual acoustics are expanded on theremaining sides of the room as well. The advantage here is that the balance between virtualaudience part and the stage is more controllable than in a situation where the acoustics on
CHAPTER 4. CONCEPT MODEL 35
the stage are predetermined by the acoustical design.Requirements for the existing room in case of such implementation are somewhat differ-
ent from the original concept. The recording studio used by Nummela provided very diffusereflections, which for the side walls of the stage is rather less wanted feature for naturalsounding result [48]. On the other hand, while the orchestra shell on a real stage providesrealistic early reflections, the natural high reflectivity is probably excessive in order to beenhanced with an electro-acoustic system without acoustical contradictions. Thus, in thiscase a stage with some reflective properties would be ideal. While the natural reverberationtime should be comparably low, some theater venues could feature suitable acoustics forthis kind of implementation.
4.3 Damped small practice room
Using small spaces with electro-acoustic system has many common considerations withlarge rooms. However, shorter distances between the equipment may introduce some chal-lenges that otherwise would not be encountered.
The basic principle in electro-acoustically enhanced small practice rooms is similar tothe system in larger spaces. The room should feature reflective surfaces to some extent forproducing natural early reflections. However, depending on the natural reverberation timeof the room, some absorption is most likely needed to accommodate the artificial rever-beration. Otherwise the decay rates and timbre could appear to be too different betweenthe room and the system. Also, too apparent natural reverberation would cause mixed per-ception with the electro-acoustic system when using clearly distinguishable reverberationparameters. Because of the wide variety of acoustical conditions in existing practice rooms,using such a system in acoustically poorly designed rooms can cause issues that could beaddressed as acoustical incompatibility.
The aim for using virtual acoustics in small rehearsal rooms is to provide an environmentthat is perceived acoustically more spacious and enables to practice in conditions closer tothe performance situation. The electro-acoustic system can easily be implemented to havemultiple settings for different acoustics. This gives the user more flexibility than merelyhaving only the option to enable or disable the system. According to the quality require-ments by Meyer [41], music ensembles could also benefit from the enhanced reverberationin a better integration between the musicians.
CHAPTER 4. CONCEPT MODEL 36
4.4 Challenges
Planning and implementing an active-acoustic system is not necessarily a straightforwardprocedure. This of course depends on the properties of the room where the system is in-tended to be set up. The main challenge in this work is to decrease the sound pressurelevels in practice rooms without compromising the support of the room for playing. Theissues encountered in the small practice rooms are different than those of in larger halls, forinstance in equipment positioning, feasible reverberation parameters and computing effi-ciency and delay. In the following, the most important general considerations are analyzedand discussed.
Room damping
Especially in small rooms, sufficient damping is required for creating more natural soundingenvironment with an active system. Practice rooms that were inspected prior to the casestudy testing periods were found to have some absorptive panels installed on the walls andceiling [39]. To loosely follow the concept of truncated hall, compared to basic acousticaltreatment, more absorption was needed.
Nummela has used thick suspended curtains in the truncated hall prototype [48]. Thismethod provides easily removable absorption for large areas. Depending on the quality ofthe curtain material, the absorption is effective at rather wide frequency band (see Table2.1). Besides the additional damping, some reflective surfaces are required with regenera-tive systems. Therefore the walls must not be completely covered with absorptive materialin order to preserve some of the naturally occurring early reflections and liveliness. Thus,the amount of absorption has to be balanced so that the lack of it does not interfere withthe artificial late reverberation. With excess absorption, the regenerative properties of theactive system begins to suffer, which results in increasing the system gain and reverberationtime for obtaining audible effect.
In small rooms with an ordinary height of approximately 2.8 m, the first reflections fromthe ceiling give an impression of certain height, which has an undesirable effect on creat-ing an impression of large spaces. For avoiding the issue, damping the ceiling would berequired. However, this is often very obtrusive if dark clothes, such as theater curtains, areused.
With active acoustic systems, the ideal absorption material would need reactive proper-ties, thus having a higher absorption coefficient for higher incident sound energy. Unfor-tunately, such materials do not currently exist. This would enable to have smooth sounddecay instead of a rapidly attenuating sound followed by a quieter artificial reverberation.
CHAPTER 4. CONCEPT MODEL 37
Acoustic feedback
The acoustic feedback occurring in active acoustic systems is an issue that needs very care-ful equipment positioning and feedback controlling integrated in the system. The methodsof using time-variance, frequency response equalization, controlling directivity or bringingthe microphone closer to the source all aim to increase the gain before instability. Un-successful system design and installation is perceived in coloration, artifacts or feedbackhowling. As described in Section 3.2.1, time-variant system design allows much higherGBI before effects caused by feedback are noticeable. However, being closely related tothe above discussion of absorption, the problem with feedback in the system can be formu-lated as the balance between the acoustics of a room and the active acoustic system as wellas with the equipment positioning.
With higher signal amplification, the acoustical effect is more pronounced, but as a resultthe danger of instability increases. This can be prevented by bringing the microphonescloser to the source, which leads to losing the effect of natural properties of the room.Introducing more absorption can also reduce the loop gain, but again, the characteristicacoustics will suffer. The advantage of using time-variant components in the reverberationalgorithm gives more latitude in finding suitable combination for these variables.
Coloration
The term timbre in music and acoustics refers to the perceived differences in nuances of asound produced by a certain source. As of the color of sound, it is determined by the shapeof the frequency spectrum, comparably to the visual perception of colors. Coloration inacoustics can be established by an emphasized or attenuated frequencies in the spectrum.A typical cause for coloration in traditional room acoustics is reflections that act as a combfilter, attenuating and amplifying frequencies of certain intervals [48, 53].
While coloration in active acoustic systems can be a result of approaching instability atsome frequencies, inherent coloration of the artificial reverberation is less apparent phe-nomenon than effects directly caused by instability. Experienced subjects can easily distin-guish even a slight coloration or unnatural feature which reduces the perceived quality ofthe system thus lowering the acceptance of the system.
Especially in systems of regenerative type a non-flat frequency response of room transferfunction is a significant source of coloration. In the frequency response, room modes causepeaks that are emphasized as the room is acoustically coupled with the reverberation system.This leads to longer decay times at the peak frequencies. Other common type of colorationis a metallic sounding ringing, which is induced by a series of harmonic frequencies froma comb filter characteristics in reverberation system [48]. As mentioned in Section 3.2.1,
CHAPTER 4. CONCEPT MODEL 38
Väänänen has stated that in active systems, metallic artifacts are caused by the lack of modaldensity [67].
Also a time-dependent periodicity in the reverberation is an effect comparable to col-oration. The reverberation algorithm featuring time-variant comb-allpass filters (Figure4.1) introduces flutter to the generated reverberation with higher modulation parameters[36, 68]. As a downside, a sound from an instrument fluctuating at a very low frequencycan be interfered by an active system that fluctuates at a slightly different frequency.
Reverberation modeling
Enhancing the reverberation and impression of acoustic spaciousness for music practice ap-plications can be approached from various directions. In a small practice room, the intendedbenefit from such installation is to provide a possibility of experiencing the playing as whatit would sound like in a larger space. In this case the aim is not necessarily the acoustics ofa concert hall stage, but a less confined room. This raises a question whether the acousticsshould be similar to a certain existing room.
For less experienced users, the acoustics with a resemblance of a generic chamber musichall could provide a fairly good representation of how the music would sound in a spacelarger than an ordinary classroom. On the other hand, creating a convincing simulation of alarge concert hall in a very small room is difficult due to the limited capability to modelingearly reflections.
The situation in larger spaces is rather different in this matter. The dimensions in a roomof a normal size stage implies that the first reflections from the walls represent roughly thereflections of a real stage. Therefore adding only the late reverberation of a concert hallcould provide a more convincing result. In this case, tuning the stage acoustical parametersto conform the parameters measured from an existing hall is possible to some extent. As anaudience part is not included in the rehearsal hall concept, only the parameters measured onthe stage have to be taken into account. In an orchestra rehearsal room the primary concernare the same measured values as on an ordinary stage of a hall, such as support, EDTP, RT60
and clarity. Most halls have been measured for the standard parameters, so the desirabletarget parameters are available. During the tuning process, the objective measurementsmust not be used as the only design criteria, but subjective impression of the acousticsshould be evaluated as well.
Processing delay
With a reverberation algorithm running in a generic PC hardware, the required calculationpower must be considered. This is a concern mainly in small rooms where an instant re-
CHAPTER 4. CONCEPT MODEL 39
sponse from the system is more important due to the proximity of the loudspeakers. Inlarger spaces the impact of a larger buffer size, thus longer delay, is less problematic.
A recommended reverberation time by Teuber and Voelker [65] for practice rooms islow, 0.2-0.6 s. Such dry acoustics do not provide much masking that would allow longerdelays in late reverberation, in which case the added reverberation from an electro-acousticsystem have to begin in the time window of time masking of approximately 20 ms [28].Longer delays are audible as echos and are easily detected. Griesinger has suggested thatthe simulated reflected energy should not be delayed more than 15 ms from the direct energy[35].
Suitability for purpose
Regarding the investigations performed in the case studies, an important aspect is to deter-mine what are the acoustic requirements and recommendations for small practice rooms.For instance excess reverberation in small rooms results in unclear sound. This reduces thequality of the practice by masking the playing faults.
Teuber and Voelker [65] have studied comprehensively the needs in rooms for differentpractice usage. For small spaces of 30-200 m3, the average reverberation time is suggestedto be between 0.2-0.6 s. A practice room of 30 m3 is not uncommon in music institutes,and the cited 0.2 s reverberation time is very short. However, they have cited that ”with thelack of any sound reflection, the impression of the instruments is unbalanced”.
In the same study, Teuber and Voelker have not mentioned the use of active acoustics.From this perspective, in the smallest rooms there is not much need for artificial reverber-ation, since in most cases the reverberation time of around 0.2 s requires the damping tobe rather effective. The difference here is that a modest increase in the reverberation doesnot compromise the clarity. Instead, the intention is to improve the impression of spacious-ness. In practice use, an active acoustic solution with selectable settings can provide analternative for the acoustics in the room. Naturally, it is up to the user whether the selectedacoustics is favorable for practice.
For larger orchestra rehearsal rooms, Teuber and Voelker suggest that the difference ofacoustics between the rehearsal space and the concert hall should be as small as possible.By using an electro-acoustic system, the reverberation time and timbre in the hall is possibleto be roughly simulated, depending on the capabilities of the system. Here, the suggestedreverberation time for small 1000 m3 rehersal hall is 1.3 s. Such a reverberation time canbe considered very low for orchestral music, but longer times would result correspondinglyin high sound pressure levels with passive acoustics [65].
CHAPTER 4. CONCEPT MODEL 40
User interface
The design of an user interface for reverberation enhancement system is not essentiallya challenge, but the subject is important to consider. To be used by teachers and musicstudents of various ages, the user interface must be very simple and self-explanatory so thatoperating the system is straightforward. A limited set of pre-configured options must beprogrammed, since the subjects cannot be presumed to be able to modify the reverberationparameters manually. Depending on the number of different acoustical settings, switchingbetween presets or disabling the system must be incorporated to the control interface.
Of the commercial products, V-room by Wenger Corp. [70] uses a MIDI interface forcommunicating with the reverberation control. This solution enables to control the systemby using a wide selection of different user interfaces.
PureData environment allows to program simple user interfaces utilizing radio buttontype selections for switching between the operation modes. Each button having a shortdescriptive label, controlling the reverberation system with a mouse is not challenging. Theactual implementation of the user interface is discussed in the next chapter.
4.5 Reverberation algorithm
In this section, an advanced method for increasing stability in active systems is discussed.For reverberation enhancement, a simple solution is to add a multi-channel reverberatorin order to implement a time-variant active acoustic system. Väänänen et al. [68] havepresented a time-invariant parametric reverberator. This algorithm consists of a number ofparallel channels, each featuring a delay line, an IIR lowpass filter and a comb-allpass filter.Each individual filter channel is fed back to itself and then added to the combined input forall channels. According to the preceding studies, this algorithm produces natural soundingdiffuse reverberation, well suitable for reverberation enhancement applications [36].
Figure 4.1 [37] shows the structure of the reverberator, which in this case contains 8channels. Each fed back channel contains a delay line DLi, a lowpass filter Li(z) and acomb-allpass filter Ai(z). β represents the reverberation feedback coefficient. The functionof the lowpass filter is to simulate the air absorption and the generally higher absorptioncoefficient at high frequencies.
The beauty of this algorithm lies in a time-variant version by Lokki and Hiipakka [36].The time-variance is implemented to the allpass filter feedback and feed-forward parameterai. This filter is depicted in the lower part of Figure 4.1. Corresponding to the digital filter-ing principles, the parameter affects to the distance of poles and zeros from the unit circleon the pole-zero plot while the delay z−Di length in samplesD dictates the number of pole-zero pairs [16]. By modulating the parameter ai with a continuous signal, the amplification
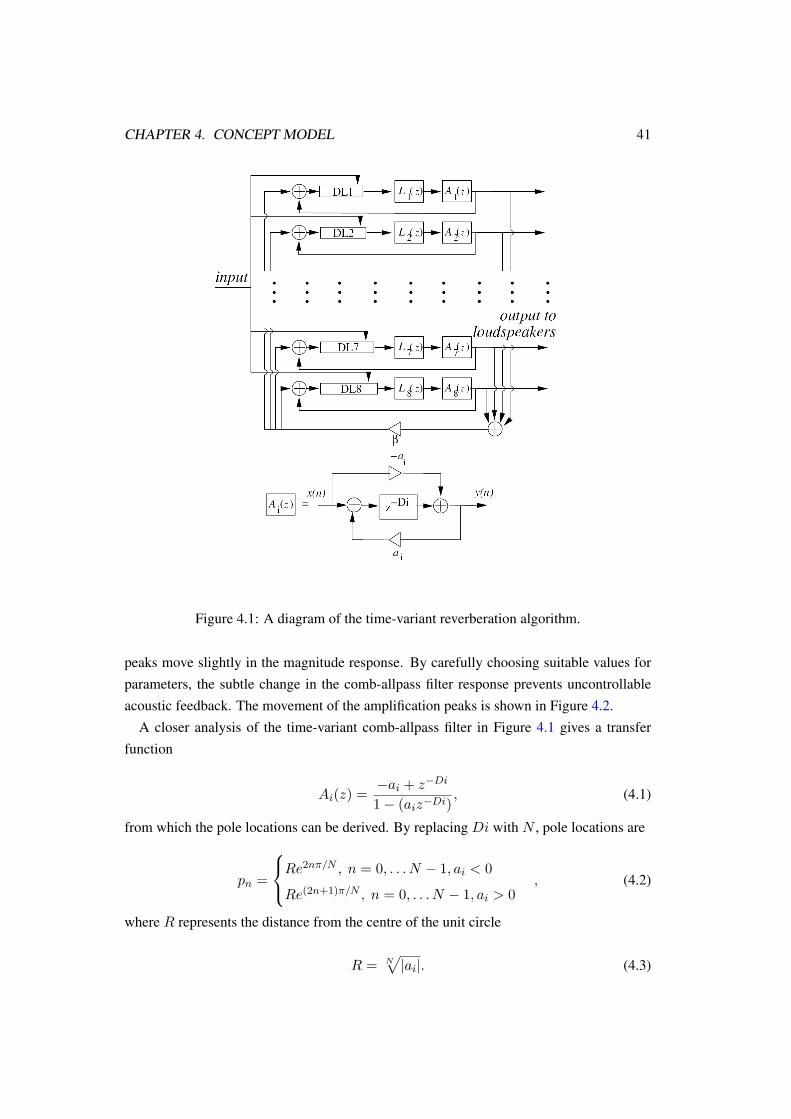
CHAPTER 4. CONCEPT MODEL 41
Figure 4.1: A diagram of the time-variant reverberation algorithm.
peaks move slightly in the magnitude response. By carefully choosing suitable values forparameters, the subtle change in the comb-allpass filter response prevents uncontrollableacoustic feedback. The movement of the amplification peaks is shown in Figure 4.2.
A closer analysis of the time-variant comb-allpass filter in Figure 4.1 gives a transferfunction
Ai(z) =−ai + z−Di
1− (aiz−Di), (4.1)
from which the pole locations can be derived. By replacing Di with N , pole locations are
pn =
Re2nπ/N , n = 0, . . . N − 1, ai < 0
Re(2n+1)π/N , n = 0, . . . N − 1, ai > 0, (4.2)
where R represents the distance from the centre of the unit circle
R = N√|ai|. (4.3)
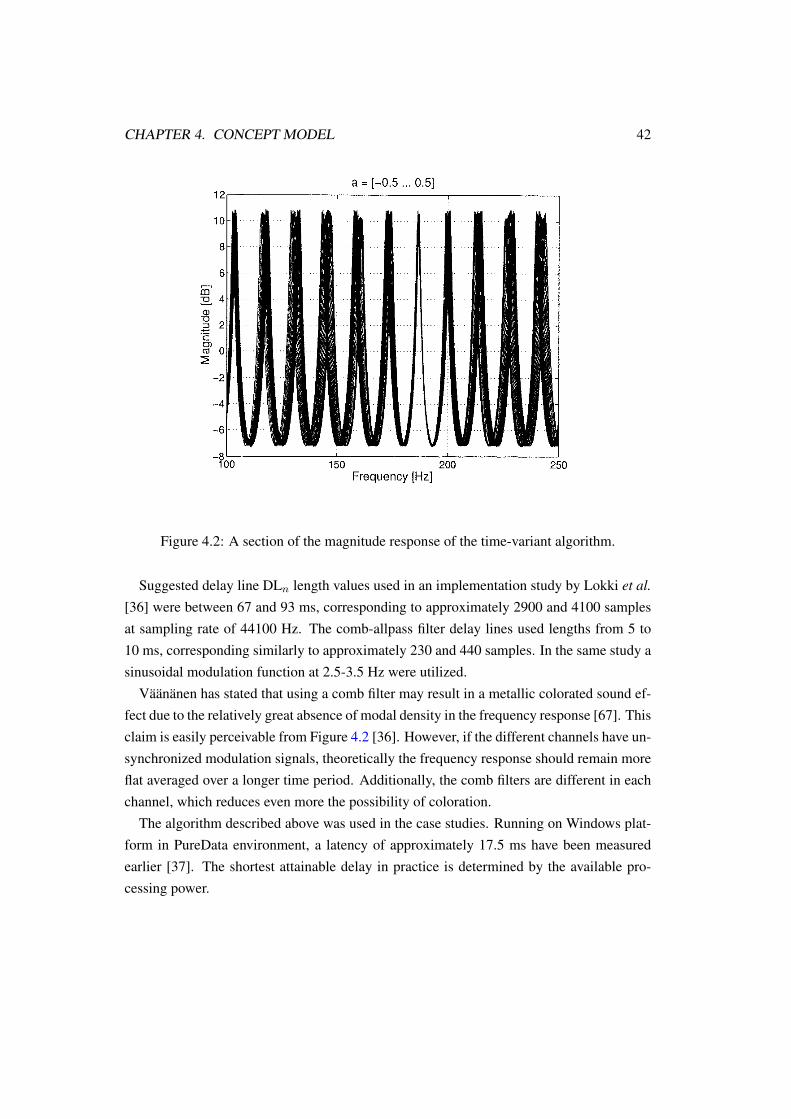
CHAPTER 4. CONCEPT MODEL 42
Figure 4.2: A section of the magnitude response of the time-variant algorithm.
Suggested delay line DLn length values used in an implementation study by Lokki et al.[36] were between 67 and 93 ms, corresponding to approximately 2900 and 4100 samplesat sampling rate of 44100 Hz. The comb-allpass filter delay lines used lengths from 5 to10 ms, corresponding similarly to approximately 230 and 440 samples. In the same study asinusoidal modulation function at 2.5-3.5 Hz were utilized.
Väänänen has stated that using a comb filter may result in a metallic colorated sound ef-fect due to the relatively great absence of modal density in the frequency response [67]. Thisclaim is easily perceivable from Figure 4.2 [36]. However, if the different channels have un-synchronized modulation signals, theoretically the frequency response should remain moreflat averaged over a longer time period. Additionally, the comb filters are different in eachchannel, which reduces even more the possibility of coloration.
The algorithm described above was used in the case studies. Running on Windows plat-form in PureData environment, a latency of approximately 17.5 ms have been measuredearlier [37]. The shortest attainable delay in practice is determined by the available pro-cessing power.
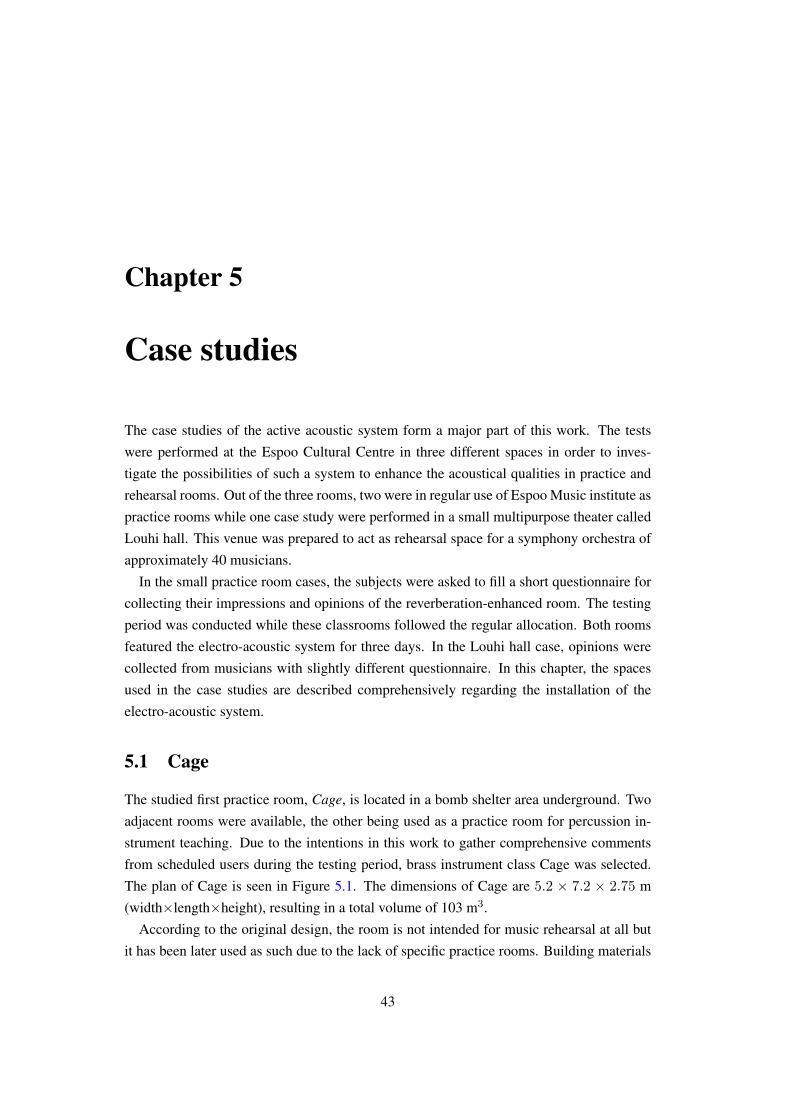
Chapter 5
Case studies
The case studies of the active acoustic system form a major part of this work. The testswere performed at the Espoo Cultural Centre in three different spaces in order to inves-tigate the possibilities of such a system to enhance the acoustical qualities in practice andrehearsal rooms. Out of the three rooms, two were in regular use of Espoo Music institute aspractice rooms while one case study were performed in a small multipurpose theater calledLouhi hall. This venue was prepared to act as rehearsal space for a symphony orchestra ofapproximately 40 musicians.
In the small practice room cases, the subjects were asked to fill a short questionnaire forcollecting their impressions and opinions of the reverberation-enhanced room. The testingperiod was conducted while these classrooms followed the regular allocation. Both roomsfeatured the electro-acoustic system for three days. In the Louhi hall case, opinions werecollected from musicians with slightly different questionnaire. In this chapter, the spacesused in the case studies are described comprehensively regarding the installation of theelectro-acoustic system.
5.1 Cage
The studied first practice room, Cage, is located in a bomb shelter area underground. Twoadjacent rooms were available, the other being used as a practice room for percussion in-strument teaching. Due to the intentions in this work to gather comprehensive commentsfrom scheduled users during the testing period, brass instrument class Cage was selected.The plan of Cage is seen in Figure 5.1. The dimensions of Cage are 5.2 × 7.2 × 2.75 m(width×length×height), resulting in a total volume of 103 m3.
According to the original design, the room is not intended for music rehearsal at all butit has been later used as such due to the lack of specific practice rooms. Building materials
43
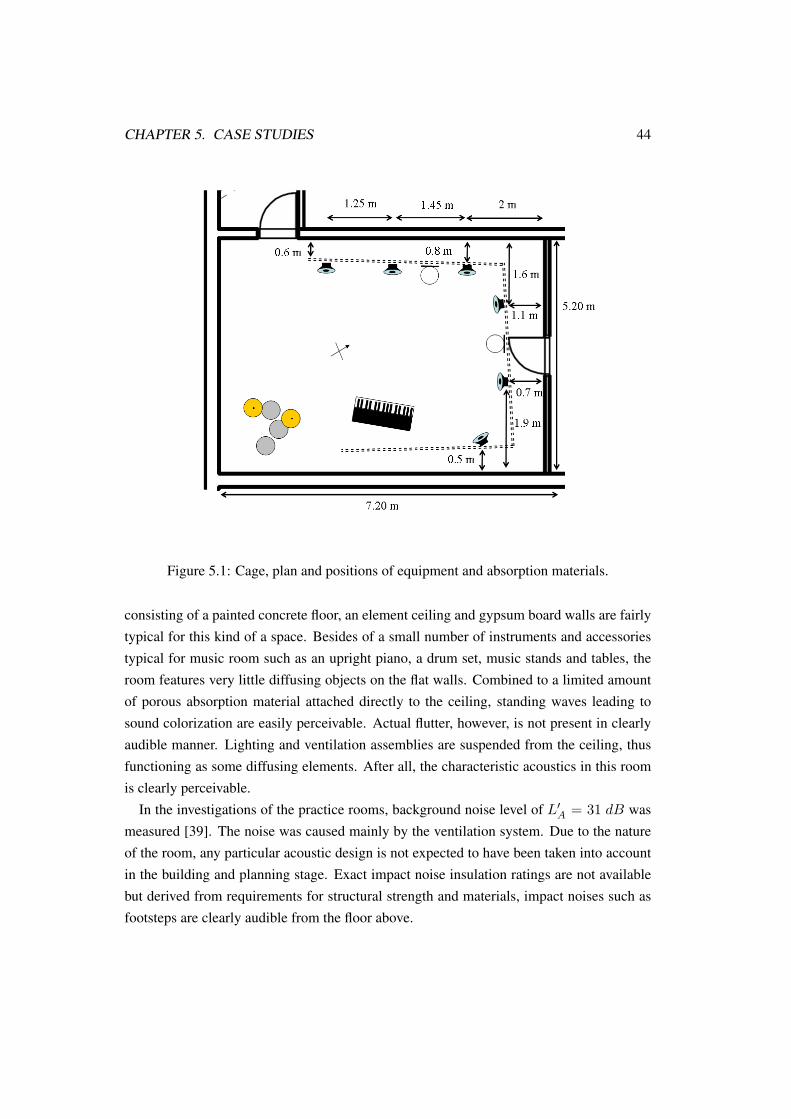
CHAPTER 5. CASE STUDIES 44
Figure 5.1: Cage, plan and positions of equipment and absorption materials.
consisting of a painted concrete floor, an element ceiling and gypsum board walls are fairlytypical for this kind of a space. Besides of a small number of instruments and accessoriestypical for music room such as an upright piano, a drum set, music stands and tables, theroom features very little diffusing objects on the flat walls. Combined to a limited amountof porous absorption material attached directly to the ceiling, standing waves leading tosound colorization are easily perceivable. Actual flutter, however, is not present in clearlyaudible manner. Lighting and ventilation assemblies are suspended from the ceiling, thusfunctioning as some diffusing elements. After all, the characteristic acoustics in this roomis clearly perceivable.
In the investigations of the practice rooms, background noise level of L′A = 31 dB wasmeasured [39]. The noise was caused mainly by the ventilation system. Due to the natureof the room, any particular acoustic design is not expected to have been taken into accountin the building and planning stage. Exact impact noise insulation ratings are not availablebut derived from requirements for structural strength and materials, impact noises such asfootsteps are clearly audible from the floor above.
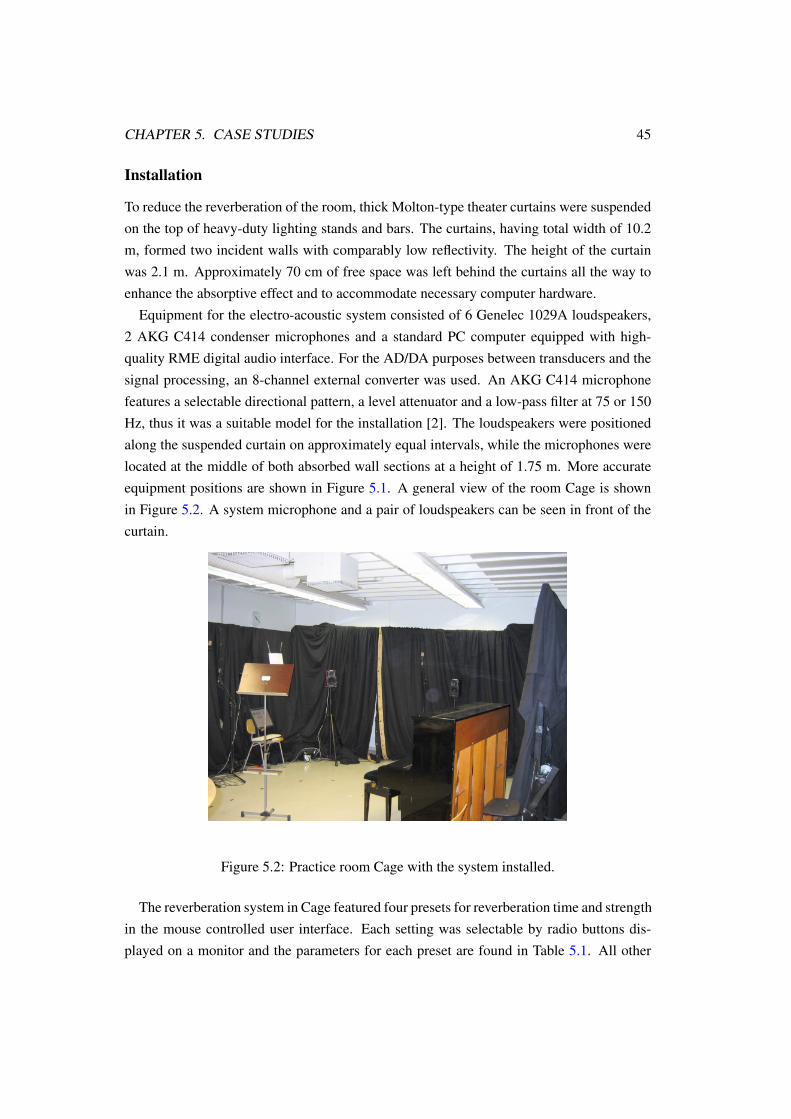
CHAPTER 5. CASE STUDIES 45
Installation
To reduce the reverberation of the room, thick Molton-type theater curtains were suspendedon the top of heavy-duty lighting stands and bars. The curtains, having total width of 10.2m, formed two incident walls with comparably low reflectivity. The height of the curtainwas 2.1 m. Approximately 70 cm of free space was left behind the curtains all the way toenhance the absorptive effect and to accommodate necessary computer hardware.
Equipment for the electro-acoustic system consisted of 6 Genelec 1029A loudspeakers,2 AKG C414 condenser microphones and a standard PC computer equipped with high-quality RME digital audio interface. For the AD/DA purposes between transducers and thesignal processing, an 8-channel external converter was used. An AKG C414 microphonefeatures a selectable directional pattern, a level attenuator and a low-pass filter at 75 or 150Hz, thus it was a suitable model for the installation [2]. The loudspeakers were positionedalong the suspended curtain on approximately equal intervals, while the microphones werelocated at the middle of both absorbed wall sections at a height of 1.75 m. More accurateequipment positions are shown in Figure 5.1. A general view of the room Cage is shownin Figure 5.2. A system microphone and a pair of loudspeakers can be seen in front of thecurtain.
Figure 5.2: Practice room Cage with the system installed.
The reverberation system in Cage featured four presets for reverberation time and strengthin the mouse controlled user interface. Each setting was selectable by radio buttons dis-played on a monitor and the parameters for each preset are found in Table 5.1. All other
CHAPTER 5. CASE STUDIES 46
Table 5.1: Reverberation system parameters in Cage.Setting label RT60 output gain (linear)
Small hall, quiet (setting on1) 1.5 s 0.4Small hall, loud (setting on2) 1.5 s 0.8Large hall, quiet (setting on3) 2.4 s 0.4Large hall, loud (setting on4) 2.4 s 0.8
variables in the reverberation algorithm were fixed during the tests.
5.2 Ives
The second practice room, Ives, is located in the third floor of the Espoo Cultural Centre andrepresents typical practice conditions in Espoo Music Institute. Exact dimensions for theroom are 3.8 × 3.75 × 2.8 m (width×length×height). The volume of 40 m3 is very smallcompared to the official recommendations1 to provide sufficient room for music practice.As in the usual utilization, accompanying rehearsals are scheduled for this room, whichsuggests that the regulations are exceeded easily.
However, the room itself is constructed of more suitable materials for music practicingthan Cage. With wooden floor, gypsum board walls and some absorption panels, subjectiveopinion on the acoustics is more neutral than in Cage. Narrow windows are situated at therear wall. A Steinway model B grand piano and a locker are also found in the room. Theplan of the room Ives is shown in Figure 5.3.
Background noise of L′A = 33 dB was measured. The measurement report shows thatthe airborne sound insulation values R′w from room to room in this floor are between 52-58dB [39].
Installation
The system used in Ives is very similar to the one in the first case study room, Cage. Theadditional absorption was created with the same curtains as in Cage, although the morelimited floor space required the use of more compact suspension technique. For this pur-pose, lighting support tripods were utilized. Of the total wall width of 15.1 m, 11.5 m werecovered with the absorbing material. The curtains reached the height of 2.2 m, and the airgaps between the curtains and the walls were in the range of 30-50 cm.
1Finnish Institute of Occupational Health regulation 85/2006 recommends minimum volumes of 80 m3 fora grand piano or a drum set, 30 m3 for wind instruments and 10 m3 for other instruments each.
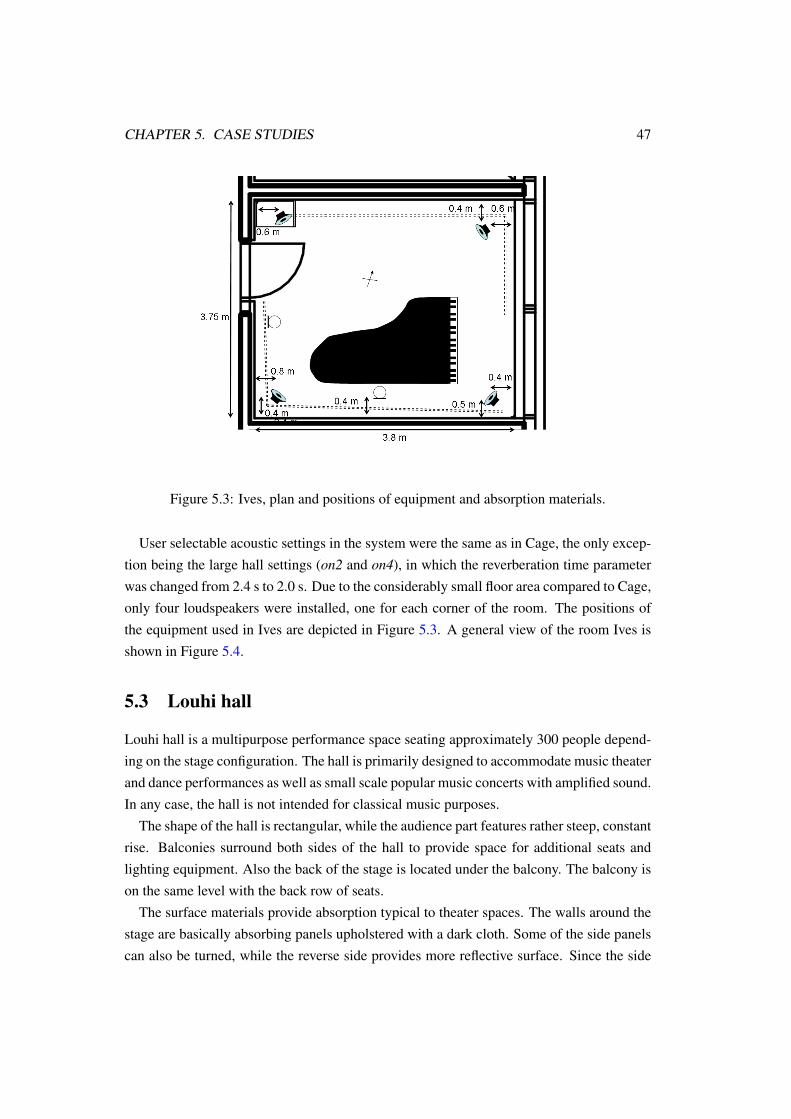
CHAPTER 5. CASE STUDIES 47
Figure 5.3: Ives, plan and positions of equipment and absorption materials.
User selectable acoustic settings in the system were the same as in Cage, the only excep-tion being the large hall settings (on2 and on4), in which the reverberation time parameterwas changed from 2.4 s to 2.0 s. Due to the considerably small floor area compared to Cage,only four loudspeakers were installed, one for each corner of the room. The positions ofthe equipment used in Ives are depicted in Figure 5.3. A general view of the room Ives isshown in Figure 5.4.
5.3 Louhi hall
Louhi hall is a multipurpose performance space seating approximately 300 people depend-ing on the stage configuration. The hall is primarily designed to accommodate music theaterand dance performances as well as small scale popular music concerts with amplified sound.In any case, the hall is not intended for classical music purposes.
The shape of the hall is rectangular, while the audience part features rather steep, constantrise. Balconies surround both sides of the hall to provide space for additional seats andlighting equipment. Also the back of the stage is located under the balcony. The balcony ison the same level with the back row of seats.
The surface materials provide absorption typical to theater spaces. The walls around thestage are basically absorbing panels upholstered with a dark cloth. Some of the side panelscan also be turned, while the reverse side provides more reflective surface. Since the side
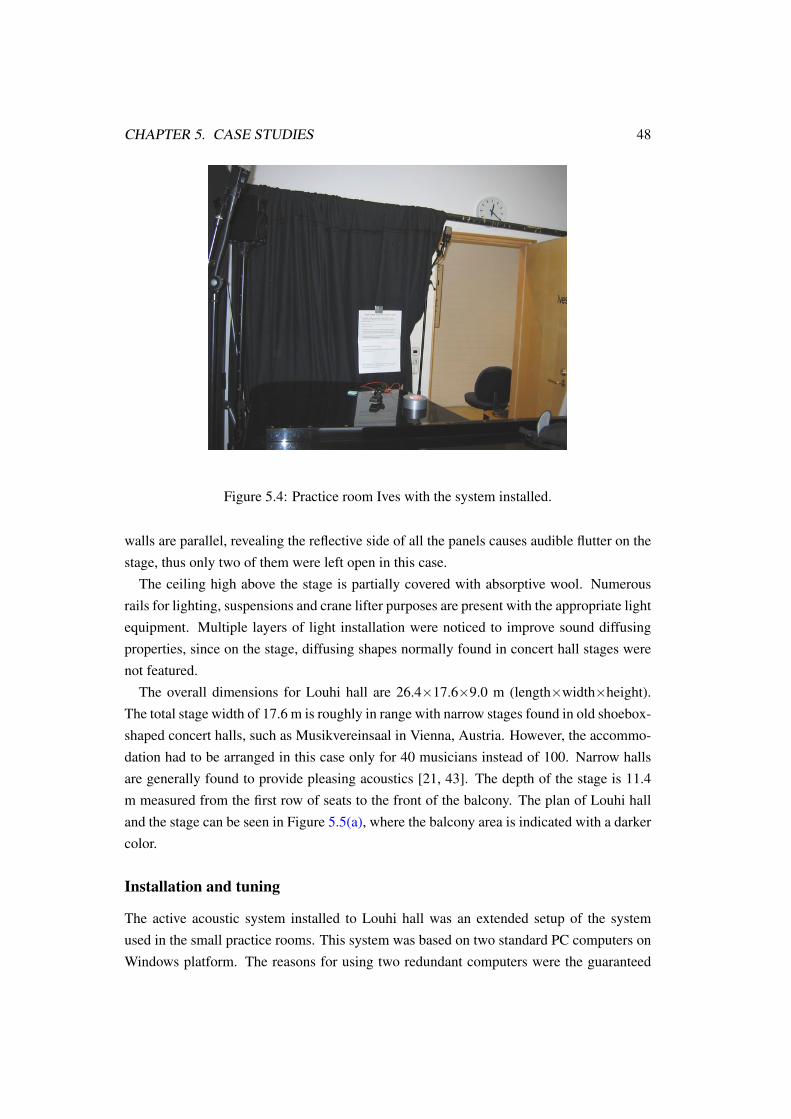
CHAPTER 5. CASE STUDIES 48
Figure 5.4: Practice room Ives with the system installed.
walls are parallel, revealing the reflective side of all the panels causes audible flutter on thestage, thus only two of them were left open in this case.
The ceiling high above the stage is partially covered with absorptive wool. Numerousrails for lighting, suspensions and crane lifter purposes are present with the appropriate lightequipment. Multiple layers of light installation were noticed to improve sound diffusingproperties, since on the stage, diffusing shapes normally found in concert hall stages werenot featured.
The overall dimensions for Louhi hall are 26.4×17.6×9.0 m (length×width×height).The total stage width of 17.6 m is roughly in range with narrow stages found in old shoebox-shaped concert halls, such as Musikvereinsaal in Vienna, Austria. However, the accommo-dation had to be arranged in this case only for 40 musicians instead of 100. Narrow hallsare generally found to provide pleasing acoustics [21, 43]. The depth of the stage is 11.4m measured from the first row of seats to the front of the balcony. The plan of Louhi halland the stage can be seen in Figure 5.5(a), where the balcony area is indicated with a darkercolor.
Installation and tuning
The active acoustic system installed to Louhi hall was an extended setup of the systemused in the small practice rooms. This system was based on two standard PC computers onWindows platform. The reasons for using two redundant computers were the guaranteed
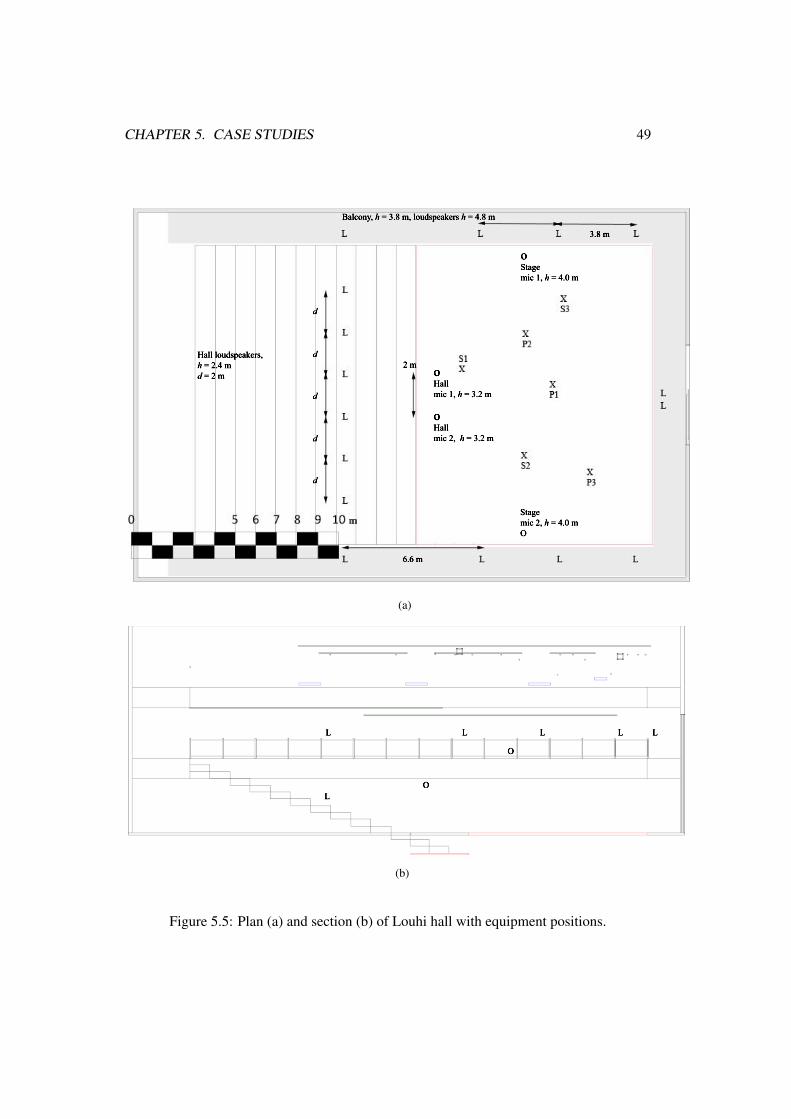
CHAPTER 5. CASE STUDIES 49
m
Balcony, h = 3.8 m, loudspeakers h = 4.8 m
oHall mic 1, h = 3.2 m
oStagemic 1, h = 4.0 m
Stagemic 2, h = 4.0 mO
6.6 m
d
d
d
d
d
Hall loudspeakers,h = 2.4 md = 2 m
3.8 m
2 m
oHall mic 2, h = 3.2 m
(a)
L LLLL
L
O
O
(b)
Figure 5.5: Plan (a) and section (b) of Louhi hall with equipment positions.
CHAPTER 5. CASE STUDIES 50
processing power and the possibility of dedicating separate systems for running one systemfor the stage acoustics and the other for the hall simulation. Extremely long cable runs werealso avoided by having separate systems for the hall and the stage. A total of 16 two-wayGenelec 1029A loudspeakers and four AKG C414 condenser microphones were used in thisinstallation, of which a half were for the stage purposes and the other half for the audiencearea.
On both sides of the stage, three loudspeakers on discrete stands were installed on thebalcony to simulate the energy reflected from the orchestra shell. Due to the considerabledirectivity at higher frequencies, the loudspeakers were tilted downwards to point moredirectly to the center of the stage and for delivering more brightness to the sound. Theremaining loudspeaker pair were positioned on the balcony behind the orchestra, facing tothe sides of the stage. All loudspeakers on the balcony were at the total height of 4.5 mfrom the stage floor. The positions of the stage microphones were at the balcony floor levelat the end of microphone stands that extended approximately 1 m toward the center of thestage.
Six loudspeakers for the hall acoustics were positioned on the fifth row in the audiencearea at 2 m intervals. These loudspeakers were facing straight forward at a total height of2.4 m from the stage floor level. The remaining stage loudspeaker pair was positioned onthe sides of the audience area on the balconies, facing to the center stage without tilting.Microphones for the hall simulation were positioned at the front of the first seat row, be-hind the conductor’s podium at a height of 3.2 m with a mutual distance of 2.2 m. Theconcertmaster playing position was 2.4 m in front of the microphones. The positioningof hall microphones was similar to the presented prototype by Nummela [48]. Completerepresentation of equipment positions in Louhi hall is seen in plan and section Figures 5.5.In these figures, the loudspeakers are marked with letter ’L’ and the microphones with let-ter ’O’. A cardioid directional pattern were used in all system microphones. On the stagemicrophones located on the balcony, a built-in low-pass filter of 150 Hz were selected todecrease the ventilation hum from nearby vents.
System tuning was commenced by equalizing the sound pressure levels from each loud-speaker individually at the receiving point at the center of the stage. After the calibration,proper configuration for the stage system were applied by acoustical measurement itera-tions. The same procedure was repeated for the system in the auditorium part of the hall.During the tuning, several combinations of output gain, reverberation time and delay pa-rameters were tried out until satisfactory results were reached. An important step was toadd a delay of approximately 90 ms for the hall system and 60 ms for the stage system forcreating more natural reverberation. Final parameters for the systems are listed in Table5.2. In addition, reverberation time at high frequencies were enhanced by applying slight
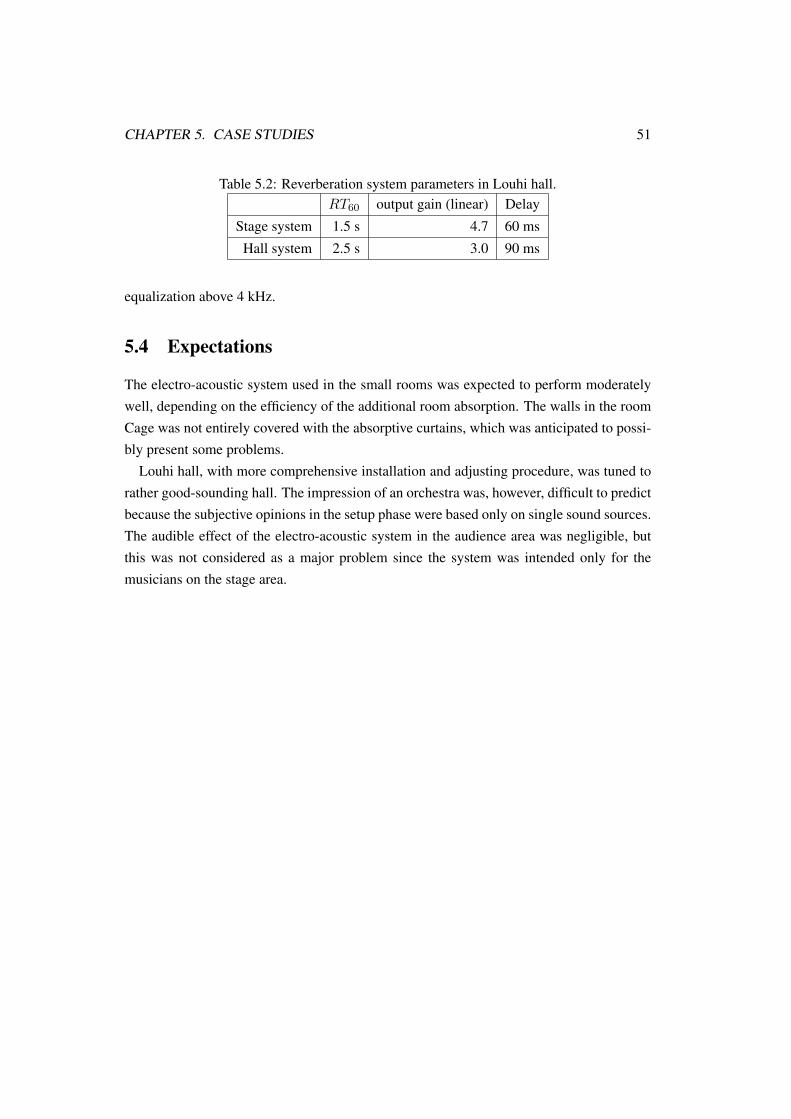
CHAPTER 5. CASE STUDIES 51
Table 5.2: Reverberation system parameters in Louhi hall.RT60 output gain (linear) Delay
Stage system 1.5 s 4.7 60 ms
Hall system 2.5 s 3.0 90 ms
equalization above 4 kHz.
5.4 Expectations
The electro-acoustic system used in the small rooms was expected to perform moderatelywell, depending on the efficiency of the additional room absorption. The walls in the roomCage was not entirely covered with the absorptive curtains, which was anticipated to possi-bly present some problems.
Louhi hall, with more comprehensive installation and adjusting procedure, was tuned torather good-sounding hall. The impression of an orchestra was, however, difficult to predictbecause the subjective opinions in the setup phase were based only on single sound sources.The audible effect of the electro-acoustic system in the audience area was negligible, butthis was not considered as a major problem since the system was intended only for themusicians on the stage area.
Chapter 6
Results
In this chapter, the objective results from the acoustical measurements in the case studyrooms are presented. To study the acceptance of the system in small rooms, subjectiveresponses from music students and teachers were collected with a questionnaire. The ques-tions concentrated on the perceived acoustical space, loudness of the sound and the enjoy-ment of playing with the system. Also some opinions about the practice rooms in generalwere inquired.
A group of nine brass instrument students of varying experience and their teacher par-ticipated in the user evaluation for Cage. Disappointingly, only single responses from aclarinet student and teacher were received concerning the room Ives. Three people wereinterviewed afterward to obtain more comprehensive impressions about the system.
In the Louhi hall case study, a symphony orchestra Tapiola Sinfonietta agreed to rehearsefor one day in the virtual acoustic environment. After the rehearsal, a questionnaire similarto the small room cases was asked to be filled by the musicians. To obtain slightly moreperspective to the answers concerning Louhi hall, similar questions were asked after theirnext rehearsal in Tapiola hall about their native rehearsal and concert hall. The questionsfor Tapiola Sinfonietta were directed toward the ease of ensemble playing with the systemand to have comparing analysis between virtual acoustics and good, traditional acousticconditions.
6.1 Measurement arrangements
The acoustical measurements in small practice rooms were performed within the PureDataenvironment [56] in an automatic playback-recording sequence integrated to the user inter-face. The only additional equipment needed in the measurements was an omni-directionalmicrophone for signal recording. This microphone was identical to the system micro-
52
CHAPTER 6. RESULTS 53
phones. The excitation signal was a logarithmic sine sweep in a single channel.Room responses were recorded from three source and receiving locations with each
acoustic conditions resulting in 54 sweeps in one room. Conversion from deterministicsweeps to impulse responses was performed by using a theory by Farina [18] and the ob-tained impulse responses were analyzed with the help of IRMA routines for Matlab devel-oped by Peltonen [50]. All the following figures present a backward Schroeder integrateddecay curve.
Suitable measurement positions in both small rooms were selected by choosing a combi-nation of possible player locations and a set of system loudspeaker positions. Following themeasurement basics, the receiving positions should be located in reverberant and diffusesound field, instead of the vicinity of the loudspeakers. Especially in the smaller case studyroom Ives these requirements were followed loosely due to the limited room dimensions.In the reverberation measurements of both rooms, effects of a non-diffuse sound field canbe seen at low frequencies. At an early stage the rooms were noticed to have very differentacoustics.
The measurements in Louhi hall were performed with IRMA system [50], and standardmeasurement equipment consisting of a Bruel & Kjaer 4006 omni-directional microphoneand an omni-directional source were applied. Unlike in Cage and Ives, different user se-lectable settings were not used. Hence, the representation and analysis of the results isslightly different from the small room case studies.
The questionnaire answers are interpreted in the same manner in all case studies. Thescale of accordance in each question is evaluated between -10 and 10.
6.2 Case study: Cage
Labeling custom used in figures and tables for different system settings used in Cage andIves are as follows. An original room without absorption or the acoustic system is referredas plain whereas the room with additional absorption installed is called setting off. Theroom with each one of the four different acoustic settings in use are called on1, on2, on3,and on4 depending of the selected setting. The additional absorption was installed in allthese settings. Descriptions for the acoustic system settings were presented earlier in Table5.1.
Results obtained from the Cage revealed that in its natural state with limited amount ofabsorption materials, there are certain challenges concerning the sound reflections. Thesound decay of the original room (setting plain) and when equipped with curtains (settingoff ) at low frequencies, as seen in Figures 6.1(a) and 6.2, is not as smooth as in Figure 6.1(b)at 2000 Hz octave band. This difference results from strong concentration of reflections,
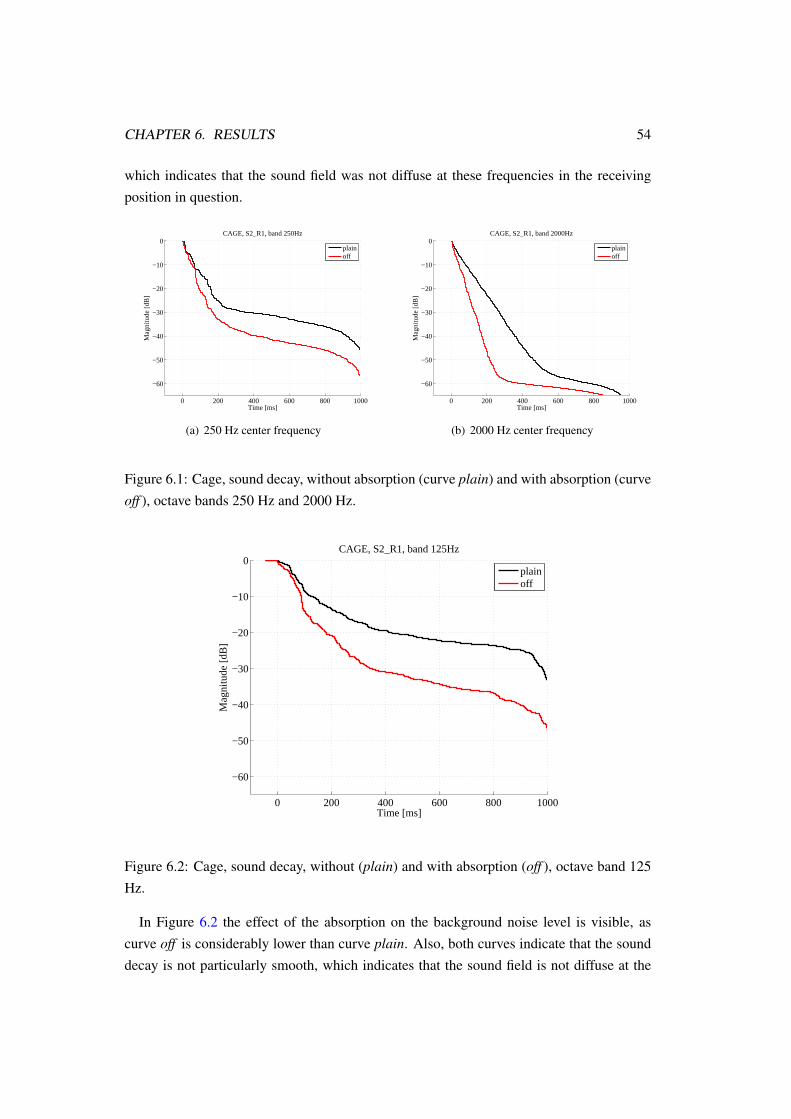
CHAPTER 6. RESULTS 54
which indicates that the sound field was not diffuse at these frequencies in the receivingposition in question.
0 200 400 600 800 1000
−60
−50
−40
−30
−20
−10
0CAGE, S2_R1, band 250Hz
Mag
nitu
de [d
B]
Time [ms]
plainoff
(a) 250 Hz center frequency
0 200 400 600 800 1000
−60
−50
−40
−30
−20
−10
0CAGE, S2_R1, band 2000Hz
Mag
nitu
de [d
B]
Time [ms]
plainoff
(b) 2000 Hz center frequency
Figure 6.1: Cage, sound decay, without absorption (curve plain) and with absorption (curveoff ), octave bands 250 Hz and 2000 Hz.
0 200 400 600 800 1000
−60
−50
−40
−30
−20
−10
0CAGE, S2_R1, band 125Hz
Mag
nitu
de [d
B]
Time [ms]
plainoff
Figure 6.2: Cage, sound decay, without (plain) and with absorption (off ), octave band 125Hz.
In Figure 6.2 the effect of the absorption on the background noise level is visible, ascurve off is considerably lower than curve plain. Also, both curves indicate that the sounddecay is not particularly smooth, which indicates that the sound field is not diffuse at the
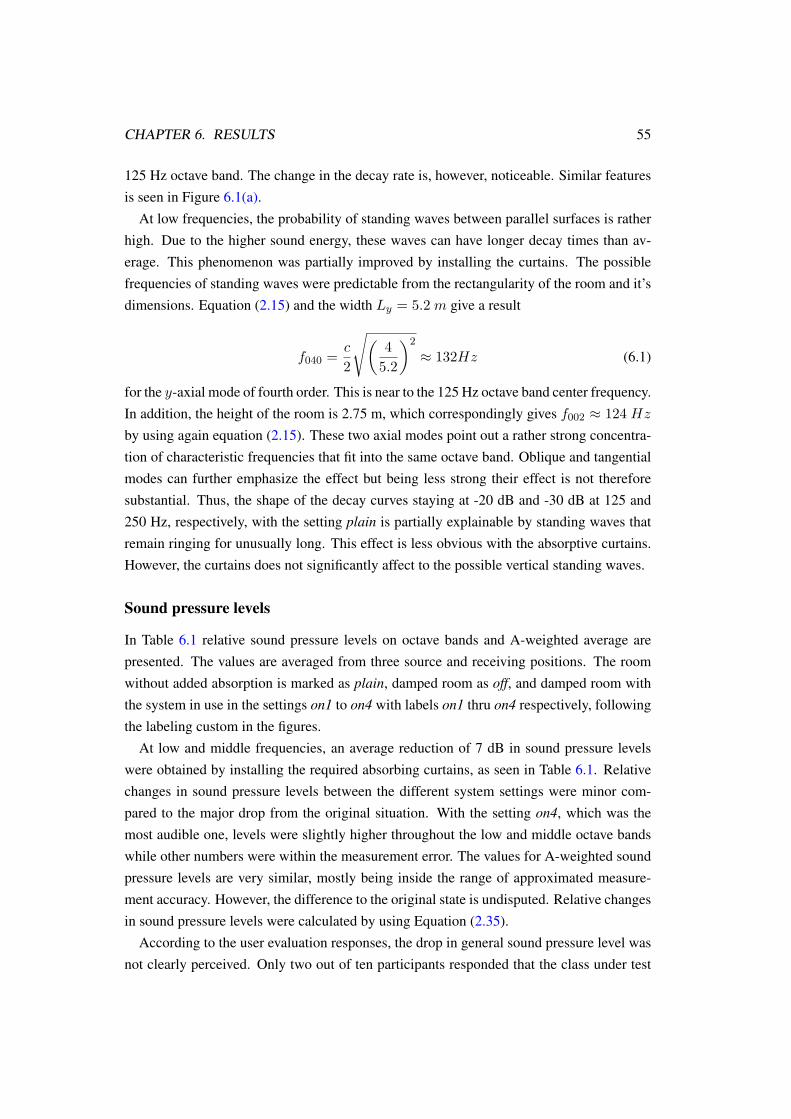
CHAPTER 6. RESULTS 55
125 Hz octave band. The change in the decay rate is, however, noticeable. Similar featuresis seen in Figure 6.1(a).
At low frequencies, the probability of standing waves between parallel surfaces is ratherhigh. Due to the higher sound energy, these waves can have longer decay times than av-erage. This phenomenon was partially improved by installing the curtains. The possiblefrequencies of standing waves were predictable from the rectangularity of the room and it’sdimensions. Equation (2.15) and the width Ly = 5.2 m give a result
f040 =c
2
√(4
5.2
)2
≈ 132Hz (6.1)
for the y-axial mode of fourth order. This is near to the 125 Hz octave band center frequency.In addition, the height of the room is 2.75 m, which correspondingly gives f002 ≈ 124 Hzby using again equation (2.15). These two axial modes point out a rather strong concentra-tion of characteristic frequencies that fit into the same octave band. Oblique and tangentialmodes can further emphasize the effect but being less strong their effect is not thereforesubstantial. Thus, the shape of the decay curves staying at -20 dB and -30 dB at 125 and250 Hz, respectively, with the setting plain is partially explainable by standing waves thatremain ringing for unusually long. This effect is less obvious with the absorptive curtains.However, the curtains does not significantly affect to the possible vertical standing waves.
Sound pressure levels
In Table 6.1 relative sound pressure levels on octave bands and A-weighted average arepresented. The values are averaged from three source and receiving positions. The roomwithout added absorption is marked as plain, damped room as off, and damped room withthe system in use in the settings on1 to on4 with labels on1 thru on4 respectively, followingthe labeling custom in the figures.
At low and middle frequencies, an average reduction of 7 dB in sound pressure levelswere obtained by installing the required absorbing curtains, as seen in Table 6.1. Relativechanges in sound pressure levels between the different system settings were minor com-pared to the major drop from the original situation. With the setting on4, which was themost audible one, levels were slightly higher throughout the low and middle octave bandswhile other numbers were within the measurement error. The values for A-weighted soundpressure levels are very similar, mostly being inside the range of approximated measure-ment accuracy. However, the difference to the original state is undisputed. Relative changesin sound pressure levels were calculated by using Equation (2.35).
According to the user evaluation responses, the drop in general sound pressure level wasnot clearly perceived. Only two out of ten participants responded that the class under test
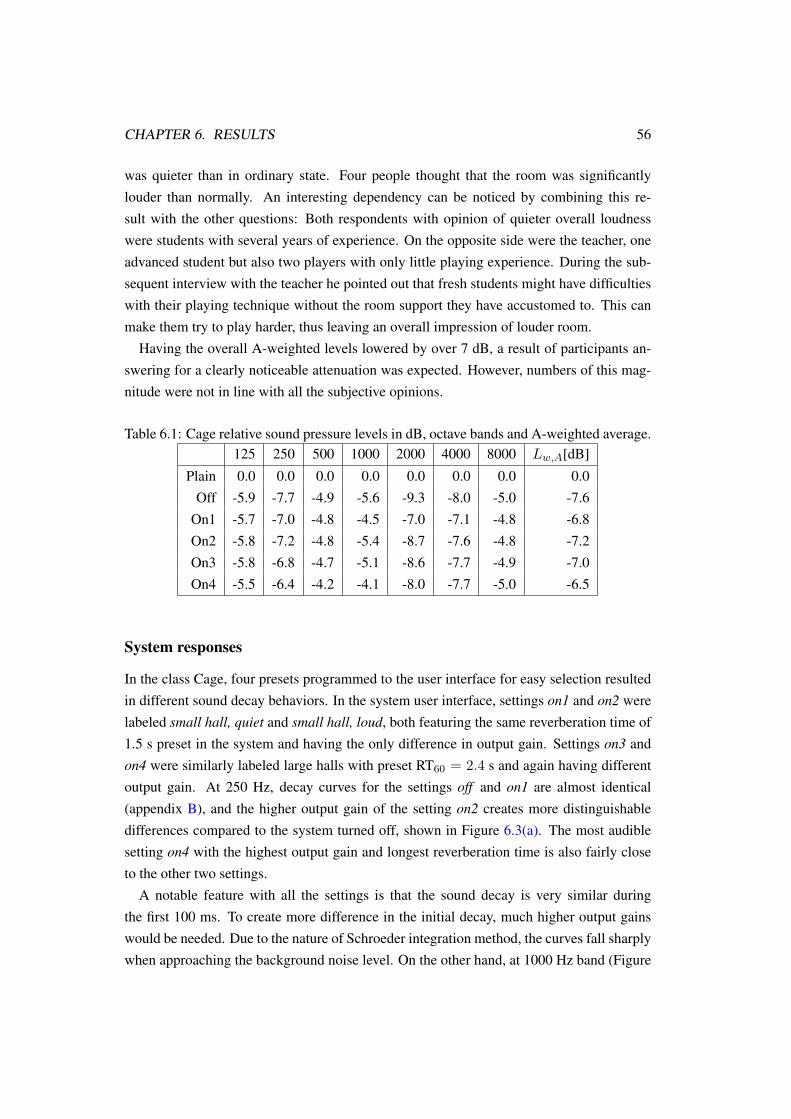
CHAPTER 6. RESULTS 56
was quieter than in ordinary state. Four people thought that the room was significantlylouder than normally. An interesting dependency can be noticed by combining this re-sult with the other questions: Both respondents with opinion of quieter overall loudnesswere students with several years of experience. On the opposite side were the teacher, oneadvanced student but also two players with only little playing experience. During the sub-sequent interview with the teacher he pointed out that fresh students might have difficultieswith their playing technique without the room support they have accustomed to. This canmake them try to play harder, thus leaving an overall impression of louder room.
Having the overall A-weighted levels lowered by over 7 dB, a result of participants an-swering for a clearly noticeable attenuation was expected. However, numbers of this mag-nitude were not in line with all the subjective opinions.
Table 6.1: Cage relative sound pressure levels in dB, octave bands and A-weighted average.125 250 500 1000 2000 4000 8000 Lw,A[dB]
Plain 0.0 0.0 0.0 0.0 0.0 0.0 0.0 0.0Off -5.9 -7.7 -4.9 -5.6 -9.3 -8.0 -5.0 -7.6
On1 -5.7 -7.0 -4.8 -4.5 -7.0 -7.1 -4.8 -6.8On2 -5.8 -7.2 -4.8 -5.4 -8.7 -7.6 -4.8 -7.2On3 -5.8 -6.8 -4.7 -5.1 -8.6 -7.7 -4.9 -7.0On4 -5.5 -6.4 -4.2 -4.1 -8.0 -7.7 -5.0 -6.5
System responses
In the class Cage, four presets programmed to the user interface for easy selection resultedin different sound decay behaviors. In the system user interface, settings on1 and on2 werelabeled small hall, quiet and small hall, loud, both featuring the same reverberation time of1.5 s preset in the system and having the only difference in output gain. Settings on3 andon4 were similarly labeled large halls with preset RT60 = 2.4 s and again having differentoutput gain. At 250 Hz, decay curves for the settings off and on1 are almost identical(appendix B), and the higher output gain of the setting on2 creates more distinguishabledifferences compared to the system turned off, shown in Figure 6.3(a). The most audiblesetting on4 with the highest output gain and longest reverberation time is also fairly closeto the other two settings.
A notable feature with all the settings is that the sound decay is very similar duringthe first 100 ms. To create more difference in the initial decay, much higher output gainswould be needed. Due to the nature of Schroeder integration method, the curves fall sharplywhen approaching the background noise level. On the other hand, at 1000 Hz band (Figure
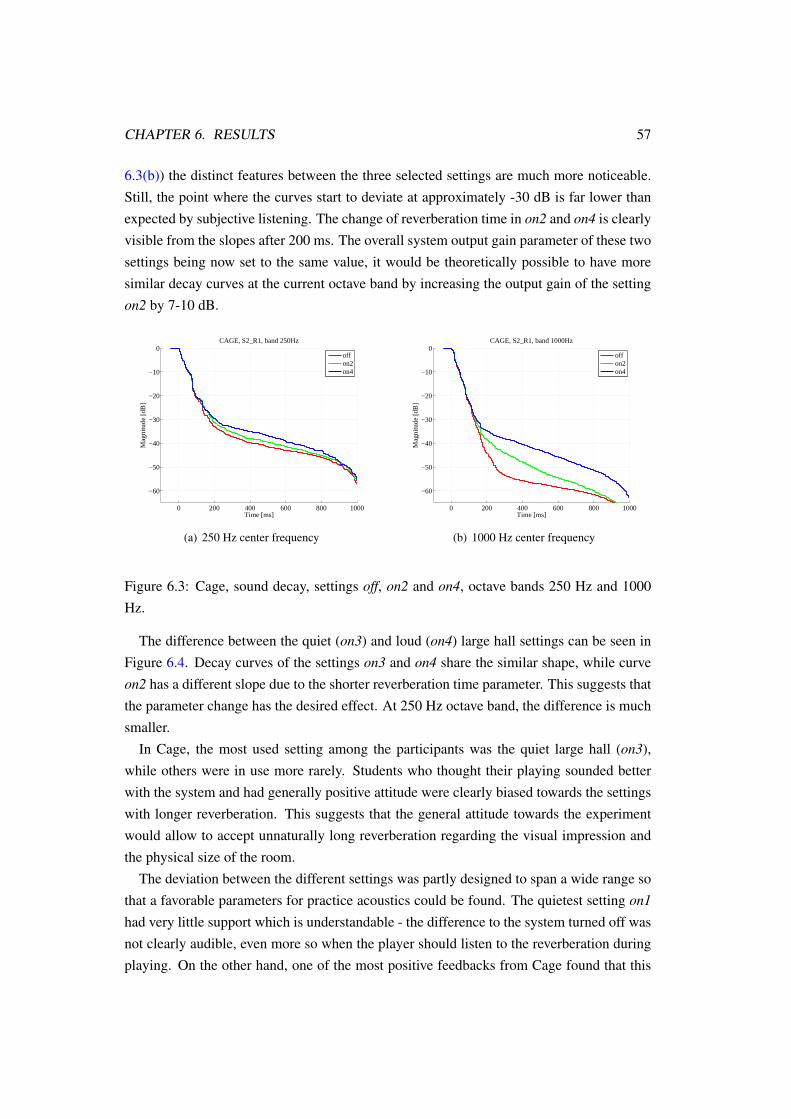
CHAPTER 6. RESULTS 57
6.3(b)) the distinct features between the three selected settings are much more noticeable.Still, the point where the curves start to deviate at approximately -30 dB is far lower thanexpected by subjective listening. The change of reverberation time in on2 and on4 is clearlyvisible from the slopes after 200 ms. The overall system output gain parameter of these twosettings being now set to the same value, it would be theoretically possible to have moresimilar decay curves at the current octave band by increasing the output gain of the settingon2 by 7-10 dB.
0 200 400 600 800 1000
−60
−50
−40
−30
−20
−10
0CAGE, S2_R1, band 250Hz
Mag
nitu
de [d
B]
Time [ms]
offon2on4
(a) 250 Hz center frequency
0 200 400 600 800 1000
−60
−50
−40
−30
−20
−10
0CAGE, S2_R1, band 1000Hz
Mag
nitu
de [d
B]
Time [ms]
offon2on4
(b) 1000 Hz center frequency
Figure 6.3: Cage, sound decay, settings off, on2 and on4, octave bands 250 Hz and 1000Hz.
The difference between the quiet (on3) and loud (on4) large hall settings can be seen inFigure 6.4. Decay curves of the settings on3 and on4 share the similar shape, while curveon2 has a different slope due to the shorter reverberation time parameter. This suggests thatthe parameter change has the desired effect. At 250 Hz octave band, the difference is muchsmaller.
In Cage, the most used setting among the participants was the quiet large hall (on3),while others were in use more rarely. Students who thought their playing sounded betterwith the system and had generally positive attitude were clearly biased towards the settingswith longer reverberation. This suggests that the general attitude towards the experimentwould allow to accept unnaturally long reverberation regarding the visual impression andthe physical size of the room.
The deviation between the different settings was partly designed to span a wide range sothat a favorable parameters for practice acoustics could be found. The quietest setting on1had very little support which is understandable - the difference to the system turned off wasnot clearly audible, even more so when the player should listen to the reverberation duringplaying. On the other hand, one of the most positive feedbacks from Cage found that this
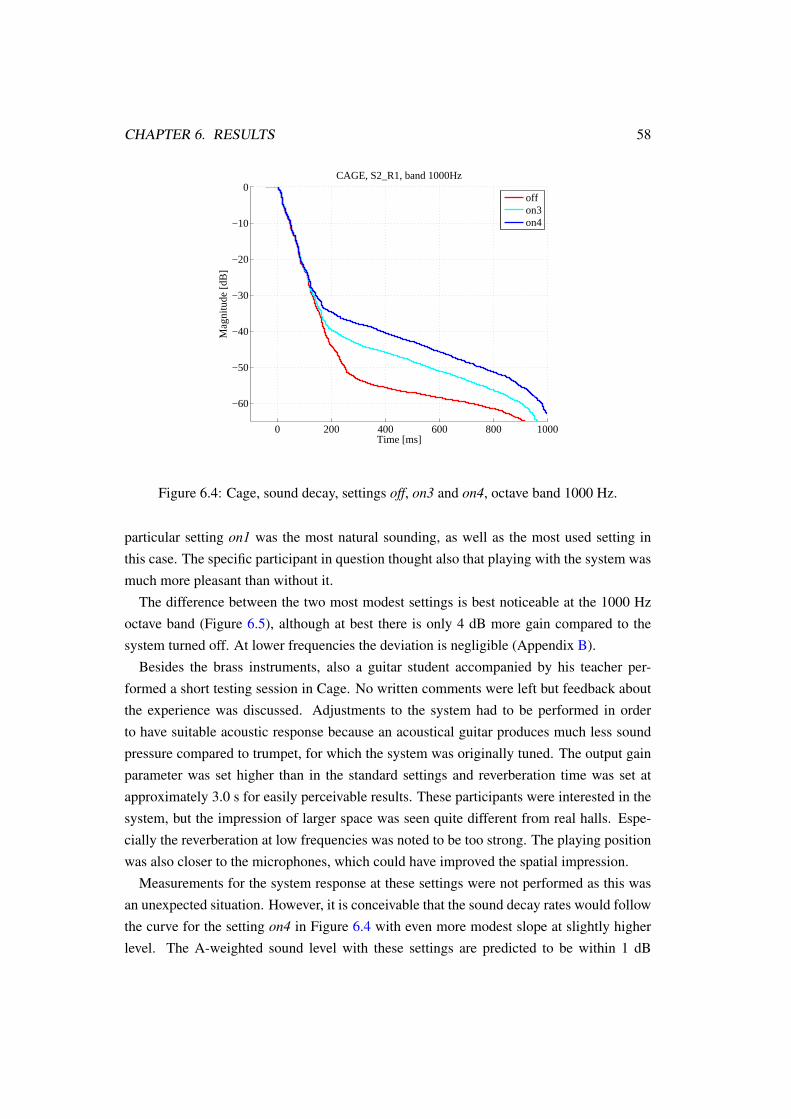
CHAPTER 6. RESULTS 58
0 200 400 600 800 1000
−60
−50
−40
−30
−20
−10
0CAGE, S2_R1, band 1000Hz
Mag
nitu
de [d
B]
Time [ms]
offon3on4
Figure 6.4: Cage, sound decay, settings off, on3 and on4, octave band 1000 Hz.
particular setting on1 was the most natural sounding, as well as the most used setting inthis case. The specific participant in question thought also that playing with the system wasmuch more pleasant than without it.
The difference between the two most modest settings is best noticeable at the 1000 Hzoctave band (Figure 6.5), although at best there is only 4 dB more gain compared to thesystem turned off. At lower frequencies the deviation is negligible (Appendix B).
Besides the brass instruments, also a guitar student accompanied by his teacher per-formed a short testing session in Cage. No written comments were left but feedback aboutthe experience was discussed. Adjustments to the system had to be performed in orderto have suitable acoustic response because an acoustical guitar produces much less soundpressure compared to trumpet, for which the system was originally tuned. The output gainparameter was set higher than in the standard settings and reverberation time was set atapproximately 3.0 s for easily perceivable results. These participants were interested in thesystem, but the impression of larger space was seen quite different from real halls. Espe-cially the reverberation at low frequencies was noted to be too strong. The playing positionwas also closer to the microphones, which could have improved the spatial impression.
Measurements for the system response at these settings were not performed as this wasan unexpected situation. However, it is conceivable that the sound decay rates would followthe curve for the setting on4 in Figure 6.4 with even more modest slope at slightly higherlevel. The A-weighted sound level with these settings are predicted to be within 1 dB
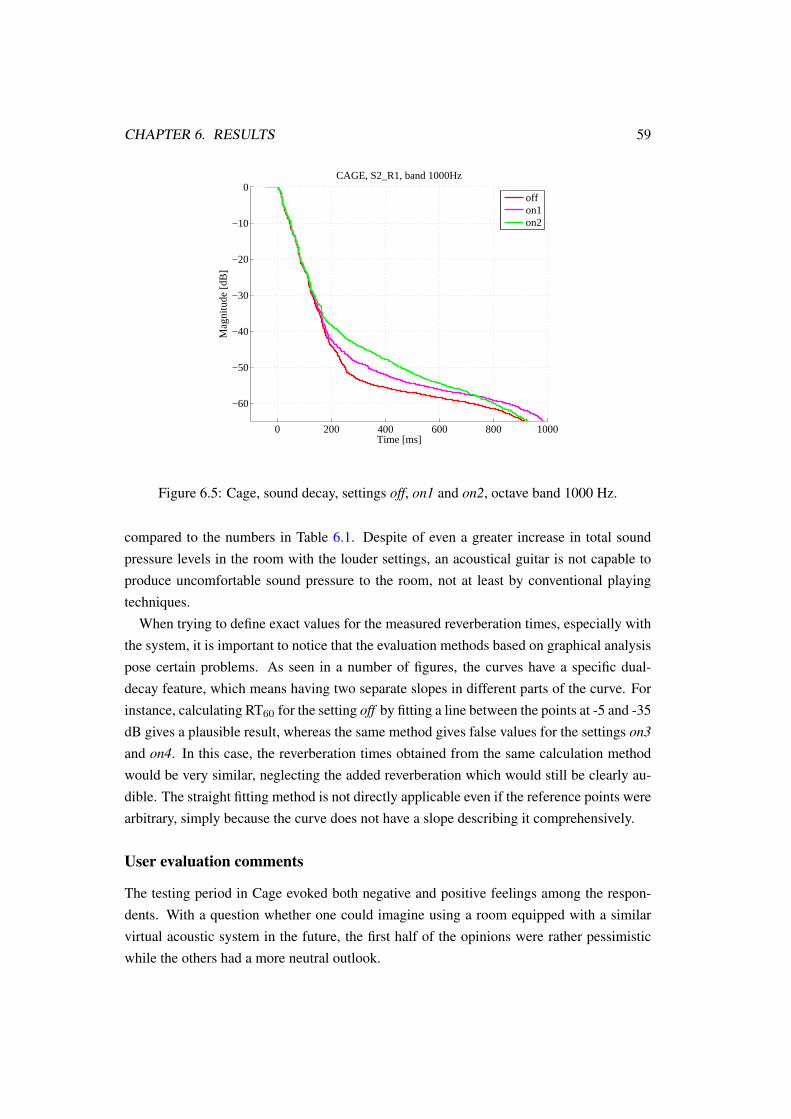
CHAPTER 6. RESULTS 59
0 200 400 600 800 1000
−60
−50
−40
−30
−20
−10
0CAGE, S2_R1, band 1000Hz
Mag
nitu
de [d
B]
Time [ms]
offon1on2
Figure 6.5: Cage, sound decay, settings off, on1 and on2, octave band 1000 Hz.
compared to the numbers in Table 6.1. Despite of even a greater increase in total soundpressure levels in the room with the louder settings, an acoustical guitar is not capable toproduce uncomfortable sound pressure to the room, not at least by conventional playingtechniques.
When trying to define exact values for the measured reverberation times, especially withthe system, it is important to notice that the evaluation methods based on graphical analysispose certain problems. As seen in a number of figures, the curves have a specific dual-decay feature, which means having two separate slopes in different parts of the curve. Forinstance, calculating RT60 for the setting off by fitting a line between the points at -5 and -35dB gives a plausible result, whereas the same method gives false values for the settings on3and on4. In this case, the reverberation times obtained from the same calculation methodwould be very similar, neglecting the added reverberation which would still be clearly au-dible. The straight fitting method is not directly applicable even if the reference points werearbitrary, simply because the curve does not have a slope describing it comprehensively.
User evaluation comments
The testing period in Cage evoked both negative and positive feelings among the respon-dents. With a question whether one could imagine using a room equipped with a similarvirtual acoustic system in the future, the first half of the opinions were rather pessimisticwhile the others had a more neutral outlook.
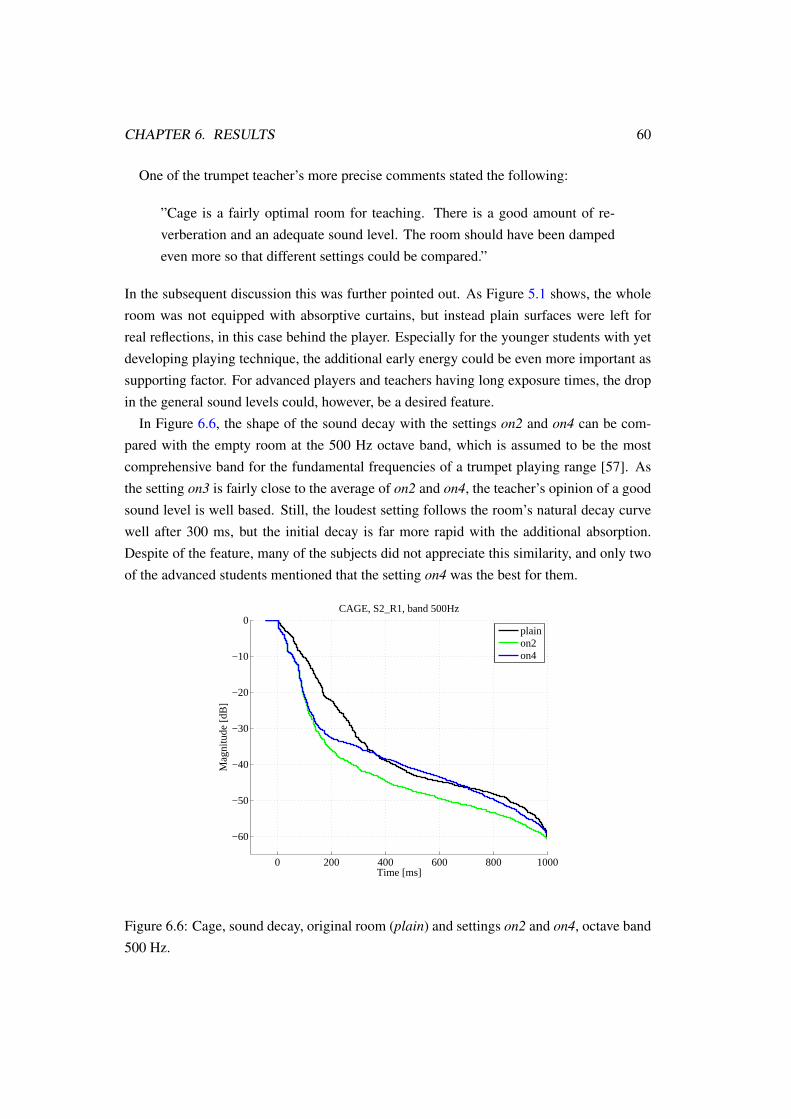
CHAPTER 6. RESULTS 60
One of the trumpet teacher’s more precise comments stated the following:
”Cage is a fairly optimal room for teaching. There is a good amount of re-verberation and an adequate sound level. The room should have been dampedeven more so that different settings could be compared.”
In the subsequent discussion this was further pointed out. As Figure 5.1 shows, the wholeroom was not equipped with absorptive curtains, but instead plain surfaces were left forreal reflections, in this case behind the player. Especially for the younger students with yetdeveloping playing technique, the additional early energy could be even more important assupporting factor. For advanced players and teachers having long exposure times, the dropin the general sound levels could, however, be a desired feature.
In Figure 6.6, the shape of the sound decay with the settings on2 and on4 can be com-pared with the empty room at the 500 Hz octave band, which is assumed to be the mostcomprehensive band for the fundamental frequencies of a trumpet playing range [57]. Asthe setting on3 is fairly close to the average of on2 and on4, the teacher’s opinion of a goodsound level is well based. Still, the loudest setting follows the room’s natural decay curvewell after 300 ms, but the initial decay is far more rapid with the additional absorption.Despite of the feature, many of the subjects did not appreciate this similarity, and only twoof the advanced students mentioned that the setting on4 was the best for them.
0 200 400 600 800 1000
−60
−50
−40
−30
−20
−10
0CAGE, S2_R1, band 500Hz
Mag
nitu
de [d
B]
Time [ms]
plainon2on4
Figure 6.6: Cage, sound decay, original room (plain) and settings on2 and on4, octave band500 Hz.
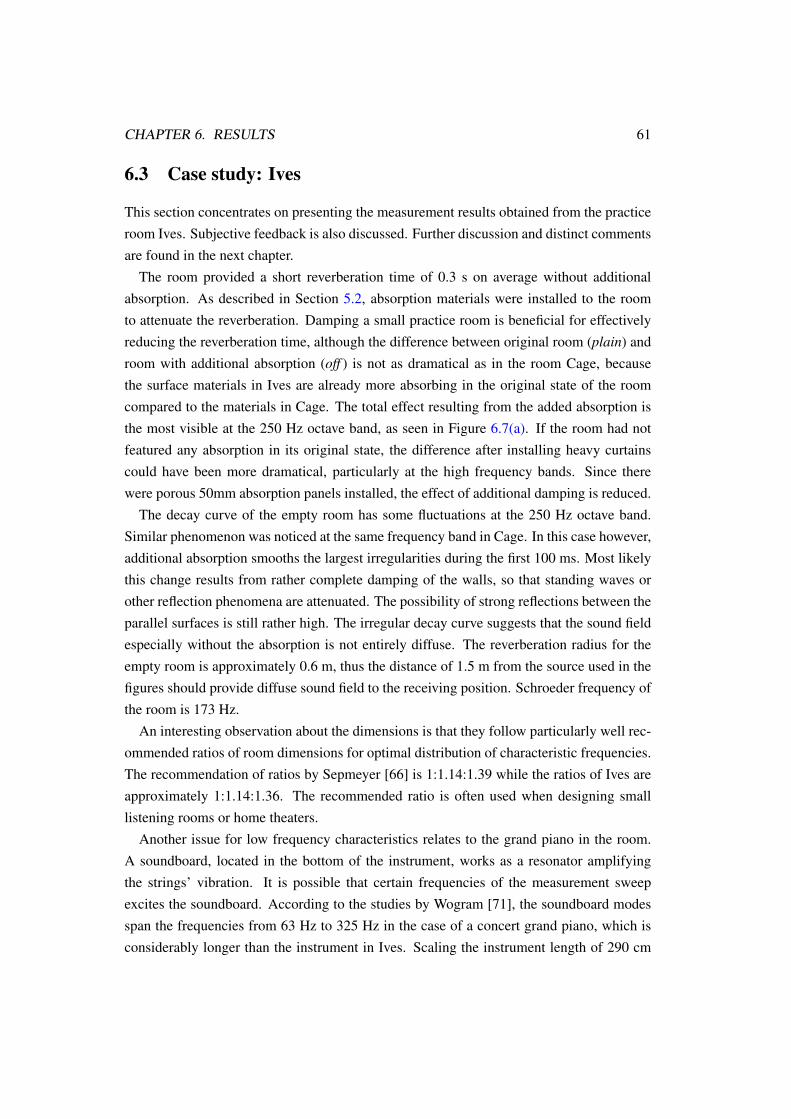
CHAPTER 6. RESULTS 61
6.3 Case study: Ives
This section concentrates on presenting the measurement results obtained from the practiceroom Ives. Subjective feedback is also discussed. Further discussion and distinct commentsare found in the next chapter.
The room provided a short reverberation time of 0.3 s on average without additionalabsorption. As described in Section 5.2, absorption materials were installed to the roomto attenuate the reverberation. Damping a small practice room is beneficial for effectivelyreducing the reverberation time, although the difference between original room (plain) androom with additional absorption (off ) is not as dramatical as in the room Cage, becausethe surface materials in Ives are already more absorbing in the original state of the roomcompared to the materials in Cage. The total effect resulting from the added absorption isthe most visible at the 250 Hz octave band, as seen in Figure 6.7(a). If the room had notfeatured any absorption in its original state, the difference after installing heavy curtainscould have been more dramatical, particularly at the high frequency bands. Since therewere porous 50mm absorption panels installed, the effect of additional damping is reduced.
The decay curve of the empty room has some fluctuations at the 250 Hz octave band.Similar phenomenon was noticed at the same frequency band in Cage. In this case however,additional absorption smooths the largest irregularities during the first 100 ms. Most likelythis change results from rather complete damping of the walls, so that standing waves orother reflection phenomena are attenuated. The possibility of strong reflections between theparallel surfaces is still rather high. The irregular decay curve suggests that the sound fieldespecially without the absorption is not entirely diffuse. The reverberation radius for theempty room is approximately 0.6 m, thus the distance of 1.5 m from the source used in thefigures should provide diffuse sound field to the receiving position. Schroeder frequency ofthe room is 173 Hz.
An interesting observation about the dimensions is that they follow particularly well rec-ommended ratios of room dimensions for optimal distribution of characteristic frequencies.The recommendation of ratios by Sepmeyer [66] is 1:1.14:1.39 while the ratios of Ives areapproximately 1:1.14:1.36. The recommended ratio is often used when designing smalllistening rooms or home theaters.
Another issue for low frequency characteristics relates to the grand piano in the room.A soundboard, located in the bottom of the instrument, works as a resonator amplifyingthe strings’ vibration. It is possible that certain frequencies of the measurement sweepexcites the soundboard. According to the studies by Wogram [71], the soundboard modesspan the frequencies from 63 Hz to 325 Hz in the case of a concert grand piano, which isconsiderably longer than the instrument in Ives. Scaling the instrument length of 290 cm
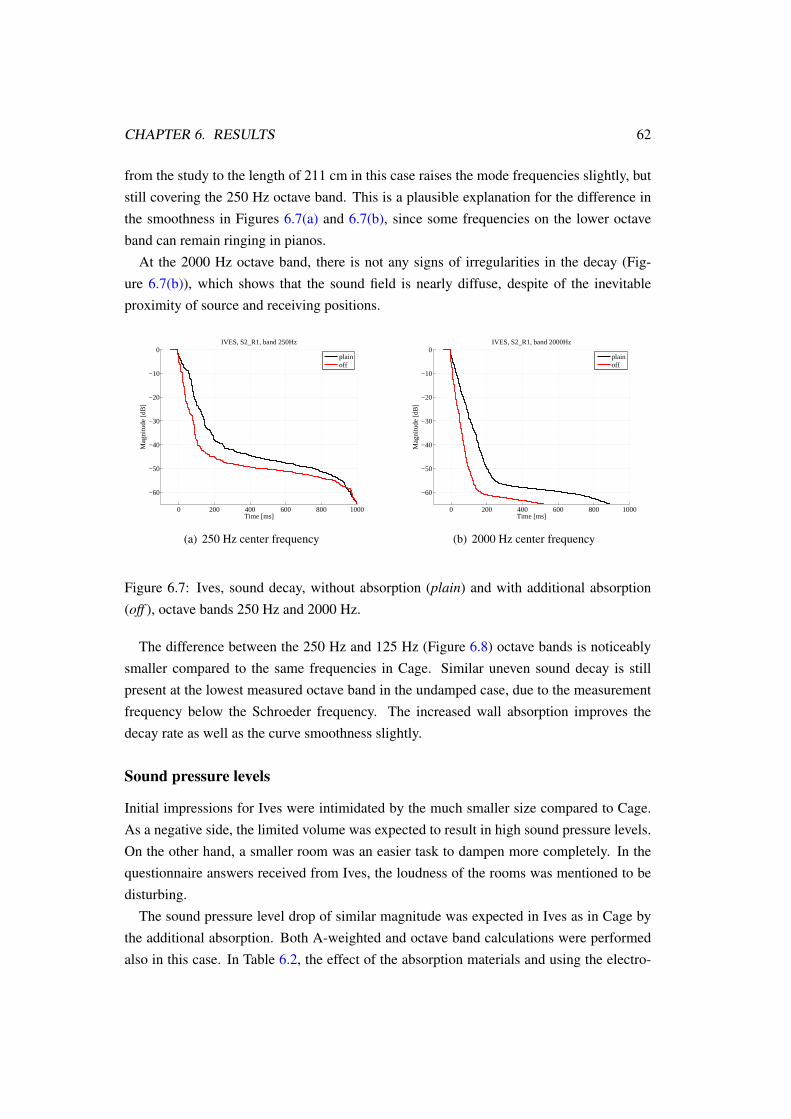
CHAPTER 6. RESULTS 62
from the study to the length of 211 cm in this case raises the mode frequencies slightly, butstill covering the 250 Hz octave band. This is a plausible explanation for the difference inthe smoothness in Figures 6.7(a) and 6.7(b), since some frequencies on the lower octaveband can remain ringing in pianos.
At the 2000 Hz octave band, there is not any signs of irregularities in the decay (Fig-ure 6.7(b)), which shows that the sound field is nearly diffuse, despite of the inevitableproximity of source and receiving positions.
0 200 400 600 800 1000
−60
−50
−40
−30
−20
−10
0IVES, S2_R1, band 250Hz
Mag
nitu
de [d
B]
Time [ms]
plainoff
(a) 250 Hz center frequency
0 200 400 600 800 1000
−60
−50
−40
−30
−20
−10
0IVES, S2_R1, band 2000Hz
Mag
nitu
de [d
B]
Time [ms]
plainoff
(b) 2000 Hz center frequency
Figure 6.7: Ives, sound decay, without absorption (plain) and with additional absorption(off ), octave bands 250 Hz and 2000 Hz.
The difference between the 250 Hz and 125 Hz (Figure 6.8) octave bands is noticeablysmaller compared to the same frequencies in Cage. Similar uneven sound decay is stillpresent at the lowest measured octave band in the undamped case, due to the measurementfrequency below the Schroeder frequency. The increased wall absorption improves thedecay rate as well as the curve smoothness slightly.
Sound pressure levels
Initial impressions for Ives were intimidated by the much smaller size compared to Cage.As a negative side, the limited volume was expected to result in high sound pressure levels.On the other hand, a smaller room was an easier task to dampen more completely. In thequestionnaire answers received from Ives, the loudness of the rooms was mentioned to bedisturbing.
The sound pressure level drop of similar magnitude was expected in Ives as in Cage bythe additional absorption. Both A-weighted and octave band calculations were performedalso in this case. In Table 6.2, the effect of the absorption materials and using the electro-
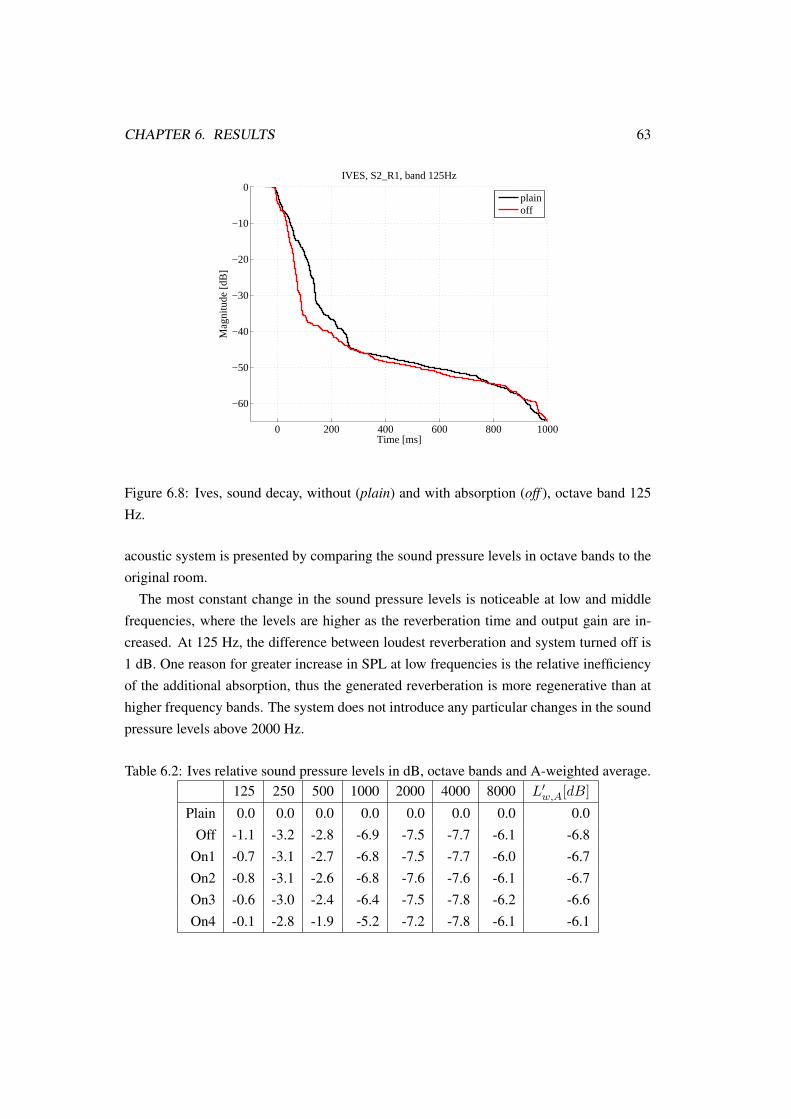
CHAPTER 6. RESULTS 63
0 200 400 600 800 1000
−60
−50
−40
−30
−20
−10
0IVES, S2_R1, band 125Hz
Mag
nitu
de [d
B]
Time [ms]
plainoff
Figure 6.8: Ives, sound decay, without (plain) and with absorption (off ), octave band 125Hz.
acoustic system is presented by comparing the sound pressure levels in octave bands to theoriginal room.
The most constant change in the sound pressure levels is noticeable at low and middlefrequencies, where the levels are higher as the reverberation time and output gain are in-creased. At 125 Hz, the difference between loudest reverberation and system turned off is1 dB. One reason for greater increase in SPL at low frequencies is the relative inefficiencyof the additional absorption, thus the generated reverberation is more regenerative than athigher frequency bands. The system does not introduce any particular changes in the soundpressure levels above 2000 Hz.
Table 6.2: Ives relative sound pressure levels in dB, octave bands and A-weighted average.125 250 500 1000 2000 4000 8000 L′w,A[dB]
Plain 0.0 0.0 0.0 0.0 0.0 0.0 0.0 0.0Off -1.1 -3.2 -2.8 -6.9 -7.5 -7.7 -6.1 -6.8
On1 -0.7 -3.1 -2.7 -6.8 -7.5 -7.7 -6.0 -6.7On2 -0.8 -3.1 -2.6 -6.8 -7.6 -7.6 -6.1 -6.7On3 -0.6 -3.0 -2.4 -6.4 -7.5 -7.8 -6.2 -6.6On4 -0.1 -2.8 -1.9 -5.2 -7.2 -7.8 -6.1 -6.1
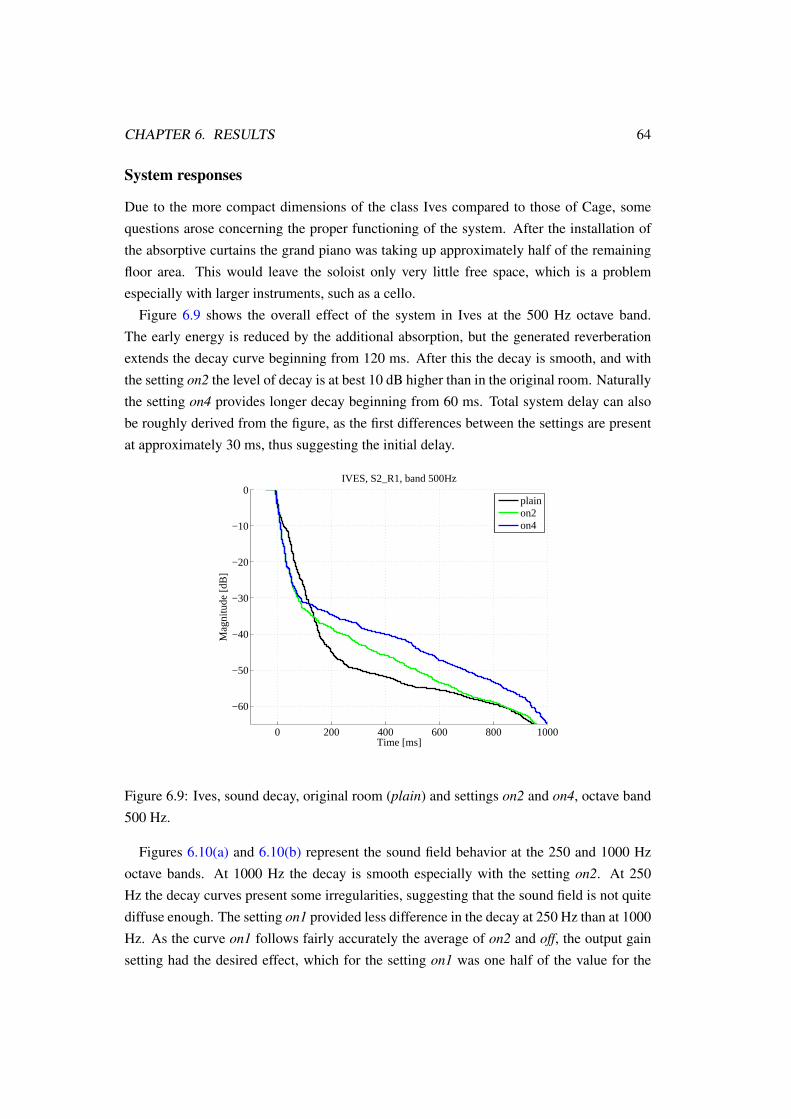
CHAPTER 6. RESULTS 64
System responses
Due to the more compact dimensions of the class Ives compared to those of Cage, somequestions arose concerning the proper functioning of the system. After the installation ofthe absorptive curtains the grand piano was taking up approximately half of the remainingfloor area. This would leave the soloist only very little free space, which is a problemespecially with larger instruments, such as a cello.
Figure 6.9 shows the overall effect of the system in Ives at the 500 Hz octave band.The early energy is reduced by the additional absorption, but the generated reverberationextends the decay curve beginning from 120 ms. After this the decay is smooth, and withthe setting on2 the level of decay is at best 10 dB higher than in the original room. Naturallythe setting on4 provides longer decay beginning from 60 ms. Total system delay can alsobe roughly derived from the figure, as the first differences between the settings are presentat approximately 30 ms, thus suggesting the initial delay.
0 200 400 600 800 1000
−60
−50
−40
−30
−20
−10
0IVES, S2_R1, band 500Hz
Mag
nitu
de [d
B]
Time [ms]
plainon2on4
Figure 6.9: Ives, sound decay, original room (plain) and settings on2 and on4, octave band500 Hz.
Figures 6.10(a) and 6.10(b) represent the sound field behavior at the 250 and 1000 Hzoctave bands. At 1000 Hz the decay is smooth especially with the setting on2. At 250Hz the decay curves present some irregularities, suggesting that the sound field is not quitediffuse enough. The setting on1 provided less difference in the decay at 250 Hz than at 1000Hz. As the curve on1 follows fairly accurately the average of on2 and off, the output gainsetting had the desired effect, which for the setting on1 was one half of the value for the
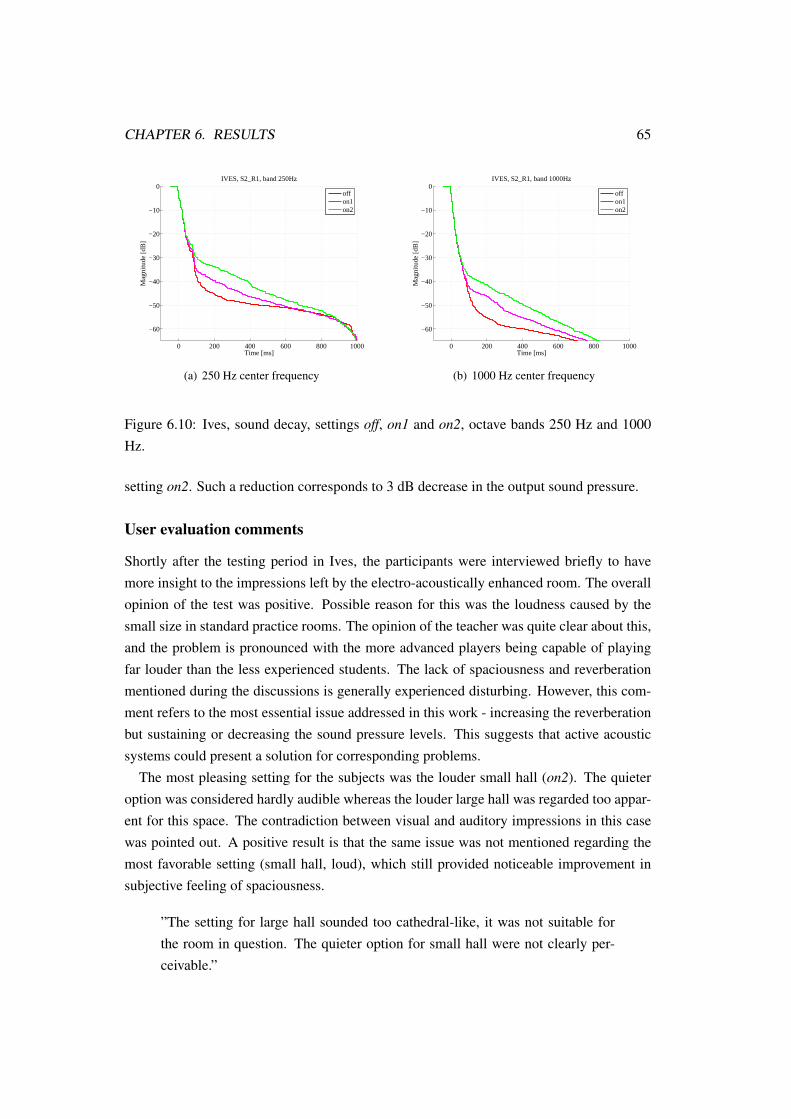
CHAPTER 6. RESULTS 65
0 200 400 600 800 1000
−60
−50
−40
−30
−20
−10
0IVES, S2_R1, band 250Hz
Mag
nitu
de [d
B]
Time [ms]
offon1on2
(a) 250 Hz center frequency
0 200 400 600 800 1000
−60
−50
−40
−30
−20
−10
0IVES, S2_R1, band 1000Hz
Mag
nitu
de [d
B]
Time [ms]
offon1on2
(b) 1000 Hz center frequency
Figure 6.10: Ives, sound decay, settings off, on1 and on2, octave bands 250 Hz and 1000Hz.
setting on2. Such a reduction corresponds to 3 dB decrease in the output sound pressure.
User evaluation comments
Shortly after the testing period in Ives, the participants were interviewed briefly to havemore insight to the impressions left by the electro-acoustically enhanced room. The overallopinion of the test was positive. Possible reason for this was the loudness caused by thesmall size in standard practice rooms. The opinion of the teacher was quite clear about this,and the problem is pronounced with the more advanced players being capable of playingfar louder than the less experienced students. The lack of spaciousness and reverberationmentioned during the discussions is generally experienced disturbing. However, this com-ment refers to the most essential issue addressed in this work - increasing the reverberationbut sustaining or decreasing the sound pressure levels. This suggests that active acousticsystems could present a solution for corresponding problems.
The most pleasing setting for the subjects was the louder small hall (on2). The quieteroption was considered hardly audible whereas the louder large hall was regarded too appar-ent for this space. The contradiction between visual and auditory impressions in this casewas pointed out. A positive result is that the same issue was not mentioned regarding themost favorable setting (small hall, loud), which still provided noticeable improvement insubjective feeling of spaciousness.
”The setting for large hall sounded too cathedral-like, it was not suitable forthe room in question. The quieter option for small hall were not clearly per-ceivable.”
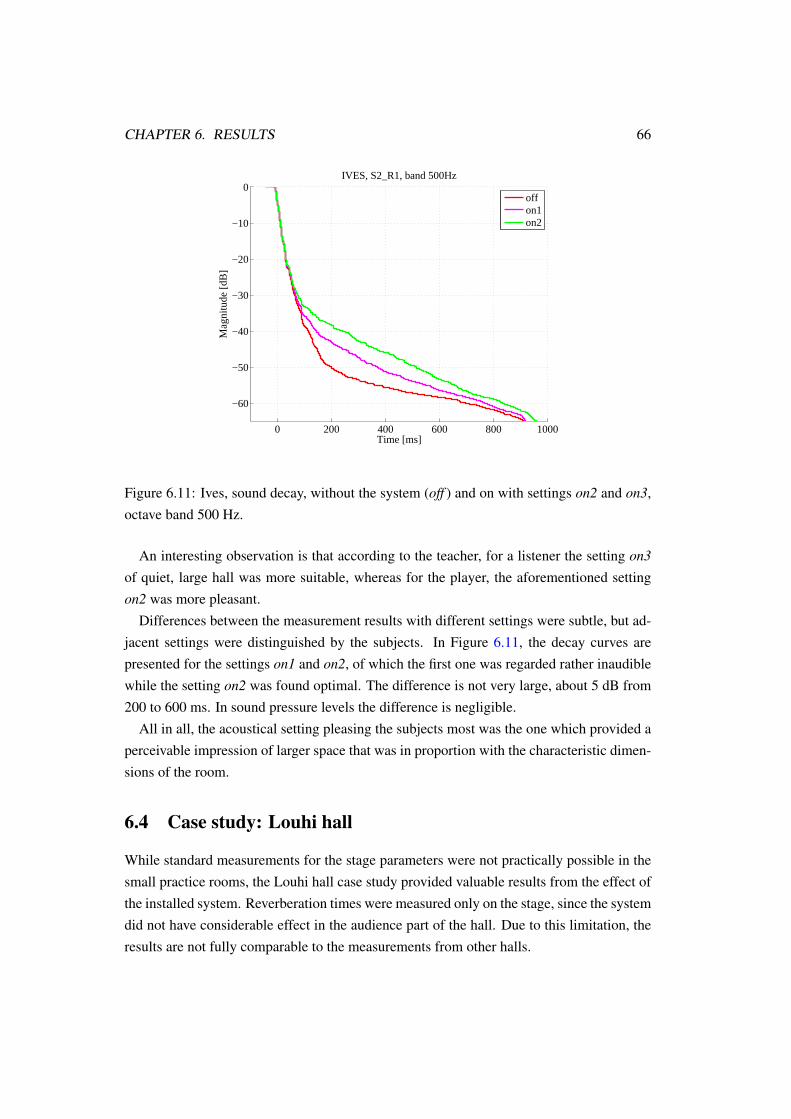
CHAPTER 6. RESULTS 66
0 200 400 600 800 1000
−60
−50
−40
−30
−20
−10
0IVES, S2_R1, band 500Hz
Mag
nitu
de [d
B]
Time [ms]
offon1on2
Figure 6.11: Ives, sound decay, without the system (off ) and on with settings on2 and on3,octave band 500 Hz.
An interesting observation is that according to the teacher, for a listener the setting on3of quiet, large hall was more suitable, whereas for the player, the aforementioned settingon2 was more pleasant.
Differences between the measurement results with different settings were subtle, but ad-jacent settings were distinguished by the subjects. In Figure 6.11, the decay curves arepresented for the settings on1 and on2, of which the first one was regarded rather inaudiblewhile the setting on2 was found optimal. The difference is not very large, about 5 dB from200 to 600 ms. In sound pressure levels the difference is negligible.
All in all, the acoustical setting pleasing the subjects most was the one which provided aperceivable impression of larger space that was in proportion with the characteristic dimen-sions of the room.
6.4 Case study: Louhi hall
While standard measurements for the stage parameters were not practically possible in thesmall practice rooms, the Louhi hall case study provided valuable results from the effect ofthe installed system. Reverberation times were measured only on the stage, since the systemdid not have considerable effect in the audience part of the hall. Due to this limitation, theresults are not fully comparable to the measurements from other halls.
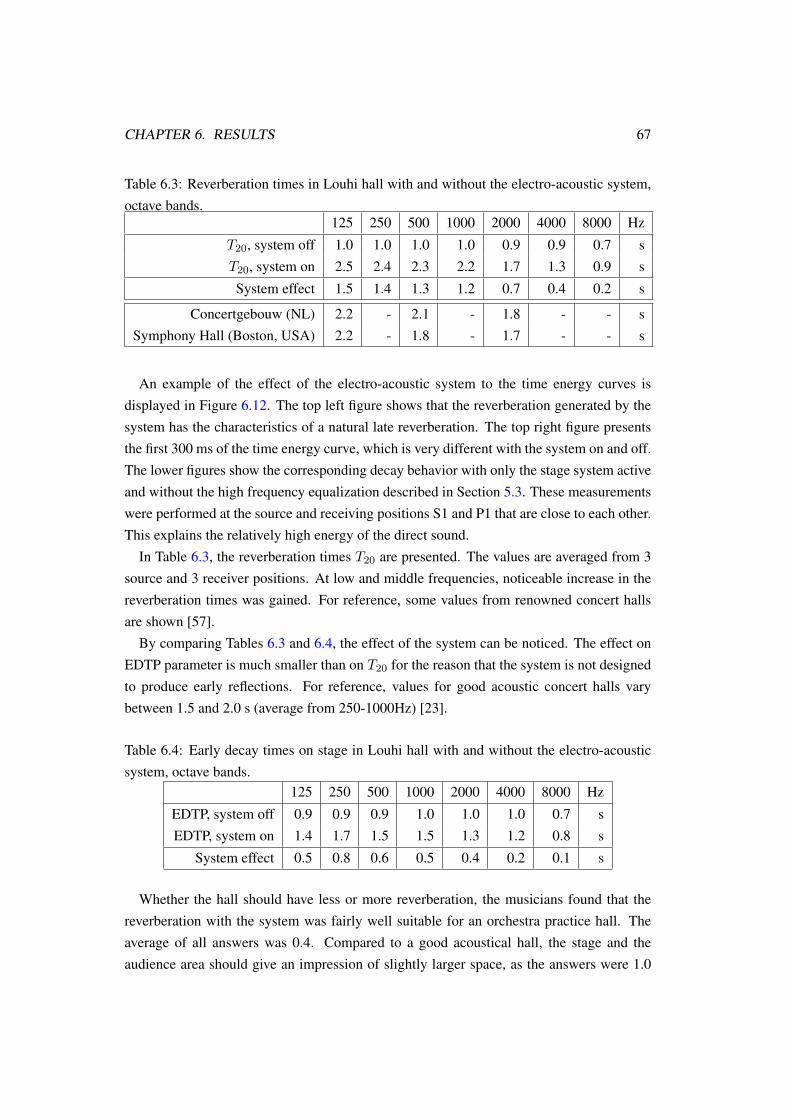
CHAPTER 6. RESULTS 67
Table 6.3: Reverberation times in Louhi hall with and without the electro-acoustic system,octave bands.
125 250 500 1000 2000 4000 8000 Hz
T20, system off 1.0 1.0 1.0 1.0 0.9 0.9 0.7 sT20, system on 2.5 2.4 2.3 2.2 1.7 1.3 0.9 s
System effect 1.5 1.4 1.3 1.2 0.7 0.4 0.2 s
Concertgebouw (NL) 2.2 - 2.1 - 1.8 - - sSymphony Hall (Boston, USA) 2.2 - 1.8 - 1.7 - - s
An example of the effect of the electro-acoustic system to the time energy curves isdisplayed in Figure 6.12. The top left figure shows that the reverberation generated by thesystem has the characteristics of a natural late reverberation. The top right figure presentsthe first 300 ms of the time energy curve, which is very different with the system on and off.The lower figures show the corresponding decay behavior with only the stage system activeand without the high frequency equalization described in Section 5.3. These measurementswere performed at the source and receiving positions S1 and P1 that are close to each other.This explains the relatively high energy of the direct sound.
In Table 6.3, the reverberation times T20 are presented. The values are averaged from 3source and 3 receiver positions. At low and middle frequencies, noticeable increase in thereverberation times was gained. For reference, some values from renowned concert hallsare shown [57].
By comparing Tables 6.3 and 6.4, the effect of the system can be noticed. The effect onEDTP parameter is much smaller than on T20 for the reason that the system is not designedto produce early reflections. For reference, values for good acoustic concert halls varybetween 1.5 and 2.0 s (average from 250-1000Hz) [23].
Table 6.4: Early decay times on stage in Louhi hall with and without the electro-acousticsystem, octave bands.
125 250 500 1000 2000 4000 8000 Hz
EDTP, system off 0.9 0.9 0.9 1.0 1.0 1.0 0.7 sEDTP, system on 1.4 1.7 1.5 1.5 1.3 1.2 0.8 s
System effect 0.5 0.8 0.6 0.5 0.4 0.2 0.1 s
Whether the hall should have less or more reverberation, the musicians found that thereverberation with the system was fairly well suitable for an orchestra practice hall. Theaverage of all answers was 0.4. Compared to a good acoustical hall, the stage and theaudience area should give an impression of slightly larger space, as the answers were 1.0
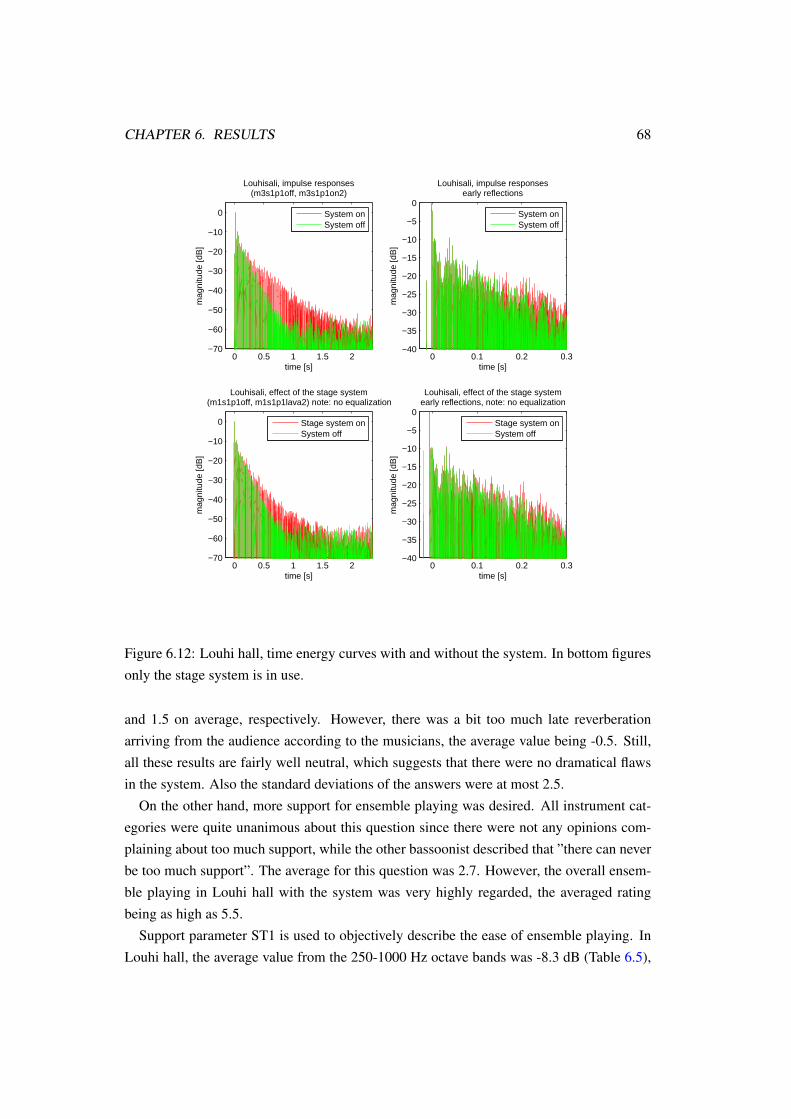
CHAPTER 6. RESULTS 68
0 0.5 1 1.5 2−70
−60
−50
−40
−30
−20
−10
0
Louhisali, impulse responses(m3s1p1off, m3s1p1on2)
time [s]
mag
nitu
de [d
B]
System onSystem off
0 0.1 0.2 0.3−40
−35
−30
−25
−20
−15
−10
−5
0
Louhisali, impulse responsesearly reflections
time [s]
mag
nitu
de [d
B]
System onSystem off
0 0.5 1 1.5 2−70
−60
−50
−40
−30
−20
−10
0
Louhisali, effect of the stage system(m1s1p1off, m1s1p1lava2) note: no equalization
time [s]
mag
nitu
de [d
B]
Stage system onSystem off
0 0.1 0.2 0.3−40
−35
−30
−25
−20
−15
−10
−5
0
Louhisali, effect of the stage systemearly reflections, note: no equalization
time [s]
mag
nitu
de [d
B]
Stage system onSystem off
Figure 6.12: Louhi hall, time energy curves with and without the system. In bottom figuresonly the stage system is in use.
and 1.5 on average, respectively. However, there was a bit too much late reverberationarriving from the audience according to the musicians, the average value being -0.5. Still,all these results are fairly well neutral, which suggests that there were no dramatical flawsin the system. Also the standard deviations of the answers were at most 2.5.
On the other hand, more support for ensemble playing was desired. All instrument cat-egories were quite unanimous about this question since there were not any opinions com-plaining about too much support, while the other bassoonist described that ”there can neverbe too much support”. The average for this question was 2.7. However, the overall ensem-ble playing in Louhi hall with the system was very highly regarded, the averaged ratingbeing as high as 5.5.
Support parameter ST1 is used to objectively describe the ease of ensemble playing. InLouhi hall, the average value from the 250-1000 Hz octave bands was -8.3 dB (Table 6.5),
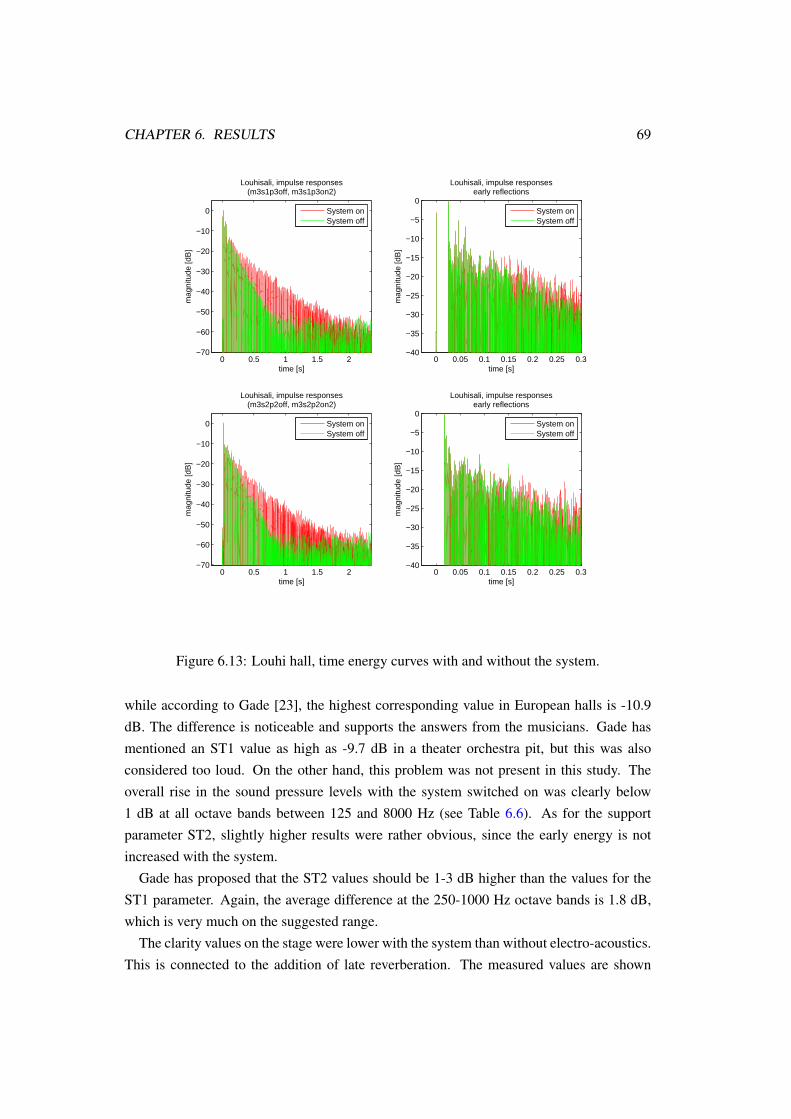
CHAPTER 6. RESULTS 69
0 0.5 1 1.5 2−70
−60
−50
−40
−30
−20
−10
0
Louhisali, impulse responses(m3s1p3off, m3s1p3on2)
time [s]
mag
nitu
de [d
B]
System onSystem off
0 0.05 0.1 0.15 0.2 0.25 0.3−40
−35
−30
−25
−20
−15
−10
−5
0
Louhisali, impulse responsesearly reflections
time [s]
mag
nitu
de [d
B]
System onSystem off
0 0.5 1 1.5 2−70
−60
−50
−40
−30
−20
−10
0
Louhisali, impulse responses(m3s2p2off, m3s2p2on2)
time [s]
mag
nitu
de [d
B]
System onSystem off
0 0.05 0.1 0.15 0.2 0.25 0.3−40
−35
−30
−25
−20
−15
−10
−5
0
Louhisali, impulse responsesearly reflections
time [s]
mag
nitu
de [d
B]
System onSystem off
Figure 6.13: Louhi hall, time energy curves with and without the system.
while according to Gade [23], the highest corresponding value in European halls is -10.9dB. The difference is noticeable and supports the answers from the musicians. Gade hasmentioned an ST1 value as high as -9.7 dB in a theater orchestra pit, but this was alsoconsidered too loud. On the other hand, this problem was not present in this study. Theoverall rise in the sound pressure levels with the system switched on was clearly below1 dB at all octave bands between 125 and 8000 Hz (see Table 6.6). As for the supportparameter ST2, slightly higher results were rather obvious, since the early energy is notincreased with the system.
Gade has proposed that the ST2 values should be 1-3 dB higher than the values for theST1 parameter. Again, the average difference at the 250-1000 Hz octave bands is 1.8 dB,which is very much on the suggested range.
The clarity values on the stage were lower with the system than without electro-acoustics.This is connected to the addition of late reverberation. The measured values are shown
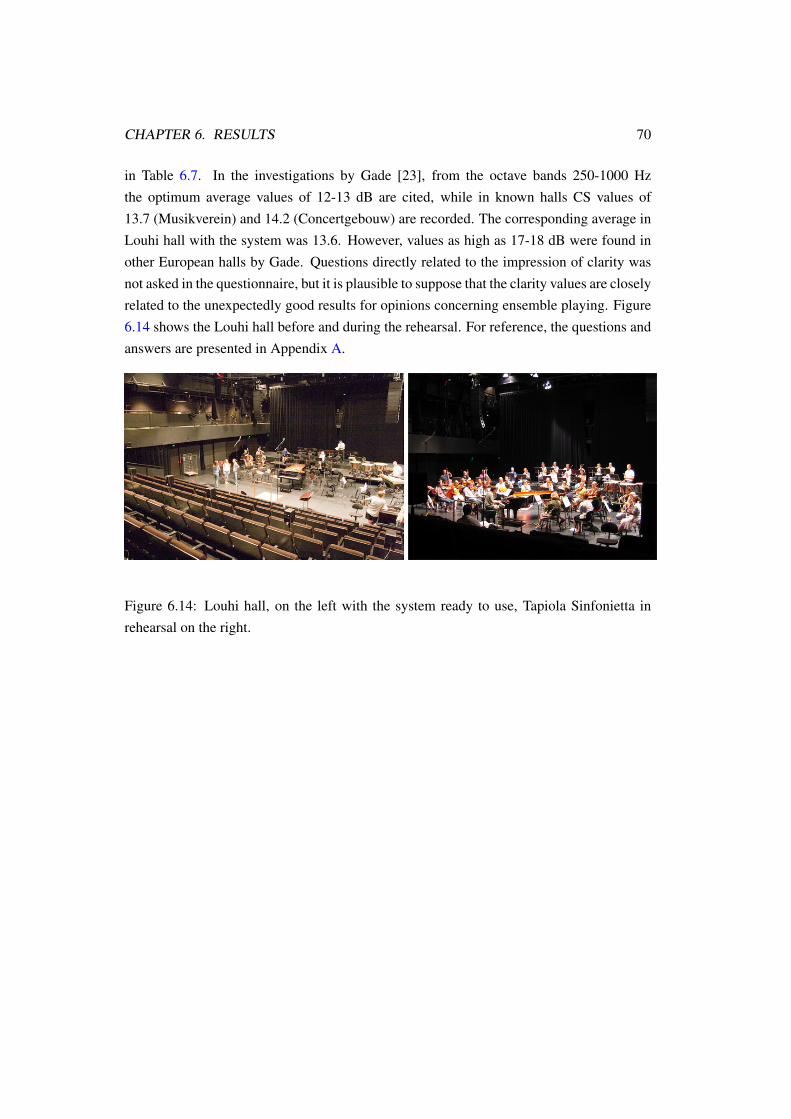
CHAPTER 6. RESULTS 70
in Table 6.7. In the investigations by Gade [23], from the octave bands 250-1000 Hzthe optimum average values of 12-13 dB are cited, while in known halls CS values of13.7 (Musikverein) and 14.2 (Concertgebouw) are recorded. The corresponding average inLouhi hall with the system was 13.6. However, values as high as 17-18 dB were found inother European halls by Gade. Questions directly related to the impression of clarity wasnot asked in the questionnaire, but it is plausible to suppose that the clarity values are closelyrelated to the unexpectedly good results for opinions concerning ensemble playing. Figure6.14 shows the Louhi hall before and during the rehearsal. For reference, the questions andanswers are presented in Appendix A.
Figure 6.14: Louhi hall, on the left with the system ready to use, Tapiola Sinfonietta inrehearsal on the right.
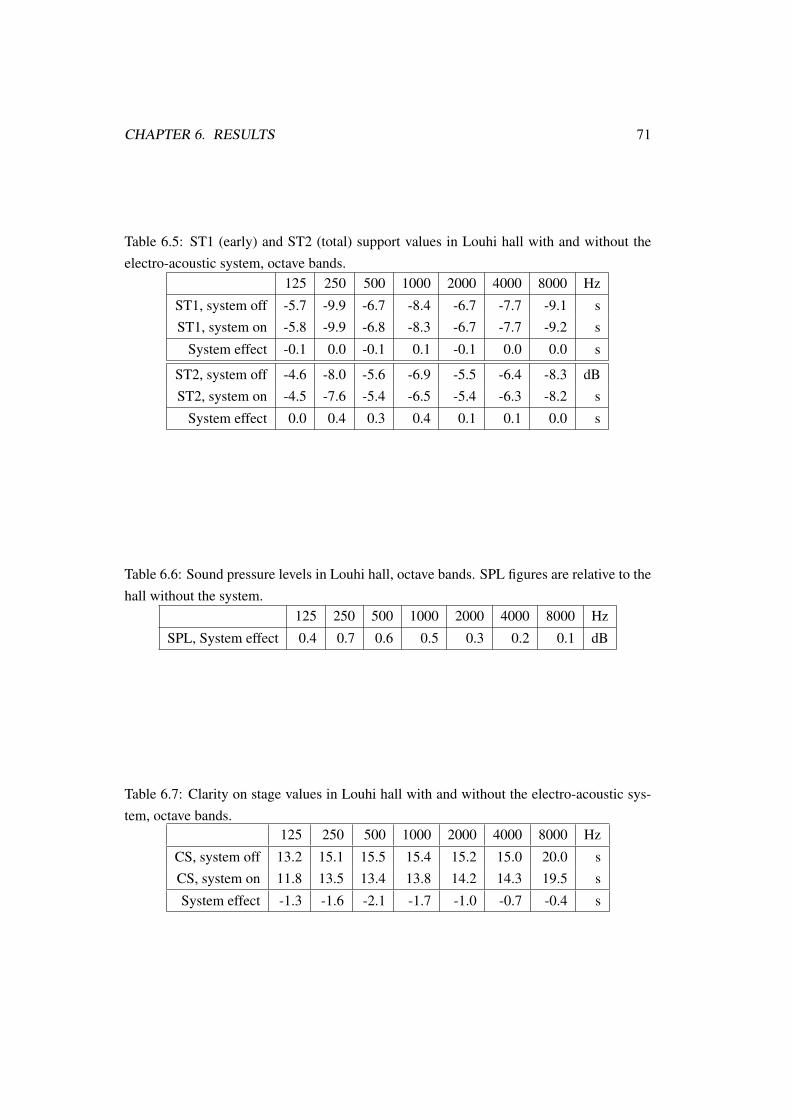
CHAPTER 6. RESULTS 71
Table 6.5: ST1 (early) and ST2 (total) support values in Louhi hall with and without theelectro-acoustic system, octave bands.
125 250 500 1000 2000 4000 8000 Hz
ST1, system off -5.7 -9.9 -6.7 -8.4 -6.7 -7.7 -9.1 sST1, system on -5.8 -9.9 -6.8 -8.3 -6.7 -7.7 -9.2 s
System effect -0.1 0.0 -0.1 0.1 -0.1 0.0 0.0 s
ST2, system off -4.6 -8.0 -5.6 -6.9 -5.5 -6.4 -8.3 dBST2, system on -4.5 -7.6 -5.4 -6.5 -5.4 -6.3 -8.2 s
System effect 0.0 0.4 0.3 0.4 0.1 0.1 0.0 s
Table 6.6: Sound pressure levels in Louhi hall, octave bands. SPL figures are relative to thehall without the system.
125 250 500 1000 2000 4000 8000 Hz
SPL, System effect 0.4 0.7 0.6 0.5 0.3 0.2 0.1 dB
Table 6.7: Clarity on stage values in Louhi hall with and without the electro-acoustic sys-tem, octave bands.
125 250 500 1000 2000 4000 8000 Hz
CS, system off 13.2 15.1 15.5 15.4 15.2 15.0 20.0 sCS, system on 11.8 13.5 13.4 13.8 14.2 14.3 19.5 s
System effect -1.3 -1.6 -2.1 -1.7 -1.0 -0.7 -0.4 s
Chapter 7
Discussion
The measurements performed in case study rooms provided valuable results of the systembehavior. In the next sections, the subjective opinions as well as possible causes and im-provements for some issues are discussed. For the Louhi hall case study, the responsesgathered from the musicians are compared to the questionnaire results obtained in Tapiolahall (Appendix A).
7.1 Case study: Cage
The properties of the instrument - more closely the sound pressure level, dynamics anddirectivity - were noticed to be surprisingly important for making a small practice roomssuitable for music rehearsal. The brass instruments, of which the trumpet and the cornetwere used in Cage, represent a category with comparably narrow dynamic range but highsound level and directivity [20, 49, 57].
Directivity properties for the used instruments can be found problematic with the systeminstalled in a room like Cage. With a setup using two microphones placed along adja-cent walls, the distance between these receiving positions was large. The gap between themicrophones was covered by curtains that absorb the sound energy. Normally the soundwould reflect back from the plain wall. Thus, when the instrument is pointed between themicrophones, part of the sound is attenuated before the reflections reach the player again.The floor and ceiling being now highly reflective compared to the area covered with the ab-sorbing material, the direction of the reflections and feedback is changed. For some users,this might result in a situation where the system itself is generating ambiguous ambianceinstead of real reverberation. However, by installing absorptive and diffusing elements alsoon the floor and at the ceiling, the system reverberation could be more easily distinguished.The overall output gain of the system could be then increased, but only to a certain limit
72
CHAPTER 7. DISCUSSION 73
due to the coloration and acoustic feedback problems.In the discussions after the testing period in Cage, one reason considered for the effect de-
scribed above was the low height of the room and insufficient floor and wall absorption. Ac-cording to the teacher, the undamped areas did produce reverberation of their own in somedegree so that the abilities of the installed system could not be fully used. The commentsuggests that the surround-like approach is probably not the best solution for equipmentpositioning with instruments having high directivity. This indicates that for more directiveinstruments, the loudspeakers and microphones should be positioned to the playing direc-tion instead of around the musician. As a consequence, the artificial reverberation wouldappear to arrive from the same direction and provide more support.
Some complaints were also addressed to the partially audible localization of some speak-ers. The main concern was the loudspeaker situated utmost to the left from the playingposition. This speaker was also the closest to the teacher while a student was playing.Therefore the output level of the loudspeaker in question had to be slightly lowered aftertesting the system for a while. Half of the answerers claimed that there were not any per-ceptible localization, also the very same respondents expressing that their playing did soundbetter or similar with the system but not worse. In addition, the same set of answers statedthat the system reverberation did not contradict with the natural reverberation of the room.The issue of localization was improved for the room Ives with custom tuned delay lines foreach output channel to equalize the arrival times from each speaker to the principal playingspot while maintaining equal output levels.
From the visual perspective, the thick, black curtains installed in any ordinary room makethe surroundings look smaller and less spacious. This can be seen as a contradiction causingan unnatural reaction towards reverberation properties dissimilar to the visual appearance[5]. Perrott [51] has stated that visual stimuli is regarded more important than those ofauditory system’s. This phenomenon lowers the possibility of credibly using settings thatcreate an impression of noticeably larger spaces. This rather psychological issue is notdirectly belonging to the scope of this work and is not analyzed further.
By paying more regard to the instrument directivity and the echoic properties of theacoustics in the room where the subjects were accustomed to practice, more positive generalopinions could have been received in Cage. As the optimal solution in this case wouldoffer plenty of early energy to provide the responsiveness for the ease of playing, the roomshould have been equipped more completely with absorptive materials and correspondinglyincrease the output gain of the system. However, this would easily result as disturbingcoloration in the sound.
An alternative for this method would be to distribute the absorption materials evenlythroughout the room and leaving small sections without absorption. By adjusting the re-
CHAPTER 7. DISCUSSION 74
lation of plain walls and the absorption, a satisfactory amount of early energy could beattained while slightly reducing the sound pressure levels. After all, this is close to theprinciple of truncated hall concept, but only in a small room.
7.2 Case study: Ives
Altough a very small number of participants took part to the Ives case study, some goodimpressions were gathered in the interviews. Similar concerns of loudness and support forinexperienced students were discussed as in Cage. Advanced players, such as the participantin Ives, do not have problems practicing in acoustically dry rooms. On the contrary, freshstudents might find such an environment uninspiring and cause unnecessary stress due tothe apparent lack of usual acoustical support, even if the enhancement of late reverberationwould give the impression of a larger hall.
Issues of lacking responsiveness - similar to those encountered in Cage - were not ex-perienced in Ives. As the clarinet is more omnidirectional than the trumpet, the clarinetsound is distributed more evenly to the room. Regarding to this theory, the clarinet tends tocreate more easily a diffuse sound field, which could provide more room support than in thecase of the trumpet. This would also make the clarinet a more suitable instrument for smallrooms. The slightly different playing position of the clarinet is as well a possible causefor the difference in perceived support. Conventional trumpet playing position causes thesound to radiate to more forward direction, while in Cage a lot of absorption was positionedin this direction. Hence, the sound energy normally reflected from the playing direction wasreduced.
It is also possible that the subjects tended to directly associate the impression of supportto higher sound pressure levels. However, the decrease in sound pressure levels with theadditional absorption did not receive complaints as the subjects found that the practicerooms were generally too loud.
In the subsequent discussions, the reduced sound pressure levels were regarded an ex-tremely positive feature, especially according to the clarinet teacher. Although in the ques-tionnaire answers this was not clearly perceived, the change was mentioned afterward. Mul-tiple practice rooms were described as intolerably loud during long exposures. As the di-mensions are similar in most practice rooms, it is possible that some room modes are excitedby the clarinet sound. Hence, an increase in the sound pressure and sound coloration canbe perceived in certain playing positions. This issue was addressed in the interviews andsupports the assumption above.
The drop of over 6 dB in A-weighted levels compared to the original room correspondsroughly to a decrease of the noise dosage to one-fourth from the original, which is a notable
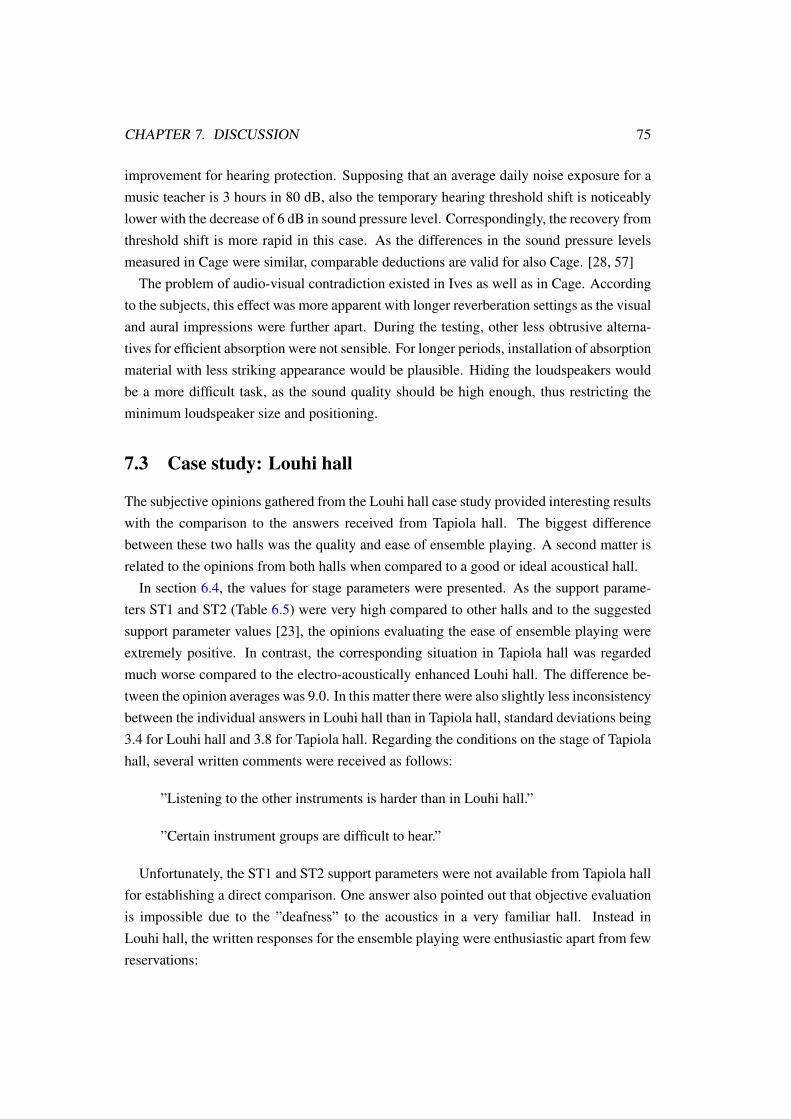
CHAPTER 7. DISCUSSION 75
improvement for hearing protection. Supposing that an average daily noise exposure for amusic teacher is 3 hours in 80 dB, also the temporary hearing threshold shift is noticeablylower with the decrease of 6 dB in sound pressure level. Correspondingly, the recovery fromthreshold shift is more rapid in this case. As the differences in the sound pressure levelsmeasured in Cage were similar, comparable deductions are valid for also Cage. [28, 57]
The problem of audio-visual contradiction existed in Ives as well as in Cage. Accordingto the subjects, this effect was more apparent with longer reverberation settings as the visualand aural impressions were further apart. During the testing, other less obtrusive alterna-tives for efficient absorption were not sensible. For longer periods, installation of absorptionmaterial with less striking appearance would be plausible. Hiding the loudspeakers wouldbe a more difficult task, as the sound quality should be high enough, thus restricting theminimum loudspeaker size and positioning.
7.3 Case study: Louhi hall
The subjective opinions gathered from the Louhi hall case study provided interesting resultswith the comparison to the answers received from Tapiola hall. The biggest differencebetween these two halls was the quality and ease of ensemble playing. A second matter isrelated to the opinions from both halls when compared to a good or ideal acoustical hall.
In section 6.4, the values for stage parameters were presented. As the support parame-ters ST1 and ST2 (Table 6.5) were very high compared to other halls and to the suggestedsupport parameter values [23], the opinions evaluating the ease of ensemble playing wereextremely positive. In contrast, the corresponding situation in Tapiola hall was regardedmuch worse compared to the electro-acoustically enhanced Louhi hall. The difference be-tween the opinion averages was 9.0. In this matter there were also slightly less inconsistencybetween the individual answers in Louhi hall than in Tapiola hall, standard deviations being3.4 for Louhi hall and 3.8 for Tapiola hall. Regarding the conditions on the stage of Tapiolahall, several written comments were received as follows:
”Listening to the other instruments is harder than in Louhi hall.”
”Certain instrument groups are difficult to hear.”
Unfortunately, the ST1 and ST2 support parameters were not available from Tapiola hallfor establishing a direct comparison. One answer also pointed out that objective evaluationis impossible due to the ”deafness” to the acoustics in a very familiar hall. Instead inLouhi hall, the written responses for the ensemble playing were enthusiastic apart from fewreservations:
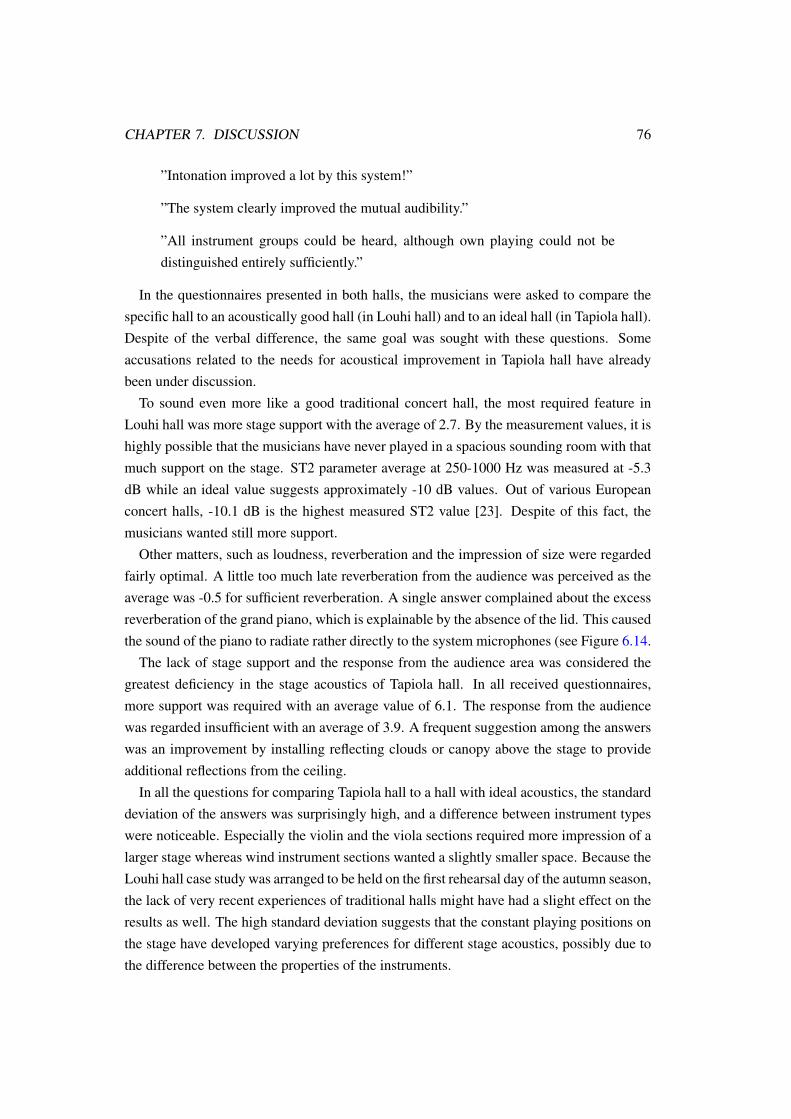
CHAPTER 7. DISCUSSION 76
”Intonation improved a lot by this system!”
”The system clearly improved the mutual audibility.”
”All instrument groups could be heard, although own playing could not bedistinguished entirely sufficiently.”
In the questionnaires presented in both halls, the musicians were asked to compare thespecific hall to an acoustically good hall (in Louhi hall) and to an ideal hall (in Tapiola hall).Despite of the verbal difference, the same goal was sought with these questions. Someaccusations related to the needs for acoustical improvement in Tapiola hall have alreadybeen under discussion.
To sound even more like a good traditional concert hall, the most required feature inLouhi hall was more stage support with the average of 2.7. By the measurement values, it ishighly possible that the musicians have never played in a spacious sounding room with thatmuch support on the stage. ST2 parameter average at 250-1000 Hz was measured at -5.3dB while an ideal value suggests approximately -10 dB values. Out of various Europeanconcert halls, -10.1 dB is the highest measured ST2 value [23]. Despite of this fact, themusicians wanted still more support.
Other matters, such as loudness, reverberation and the impression of size were regardedfairly optimal. A little too much late reverberation from the audience was perceived as theaverage was -0.5 for sufficient reverberation. A single answer complained about the excessreverberation of the grand piano, which is explainable by the absence of the lid. This causedthe sound of the piano to radiate rather directly to the system microphones (see Figure 6.14.
The lack of stage support and the response from the audience area was considered thegreatest deficiency in the stage acoustics of Tapiola hall. In all received questionnaires,more support was required with an average value of 6.1. The response from the audiencewas regarded insufficient with an average of 3.9. A frequent suggestion among the answerswas an improvement by installing reflecting clouds or canopy above the stage to provideadditional reflections from the ceiling.
In all the questions for comparing Tapiola hall to a hall with ideal acoustics, the standarddeviation of the answers was surprisingly high, and a difference between instrument typeswere noticeable. Especially the violin and the viola sections required more impression of alarger stage whereas wind instrument sections wanted a slightly smaller space. Because theLouhi hall case study was arranged to be held on the first rehearsal day of the autumn season,the lack of very recent experiences of traditional halls might have had a slight effect on theresults as well. The high standard deviation suggests that the constant playing positions onthe stage have developed varying preferences for different stage acoustics, possibly due tothe difference between the properties of the instruments.
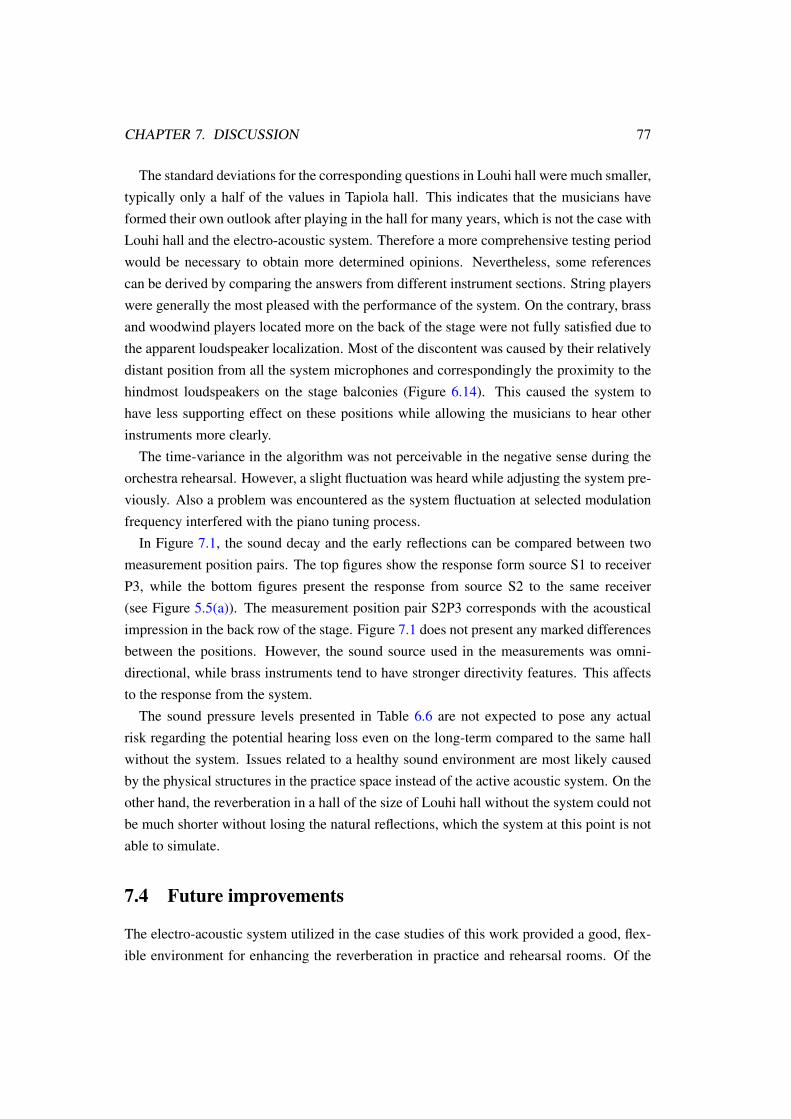
CHAPTER 7. DISCUSSION 77
The standard deviations for the corresponding questions in Louhi hall were much smaller,typically only a half of the values in Tapiola hall. This indicates that the musicians haveformed their own outlook after playing in the hall for many years, which is not the case withLouhi hall and the electro-acoustic system. Therefore a more comprehensive testing periodwould be necessary to obtain more determined opinions. Nevertheless, some referencescan be derived by comparing the answers from different instrument sections. String playerswere generally the most pleased with the performance of the system. On the contrary, brassand woodwind players located more on the back of the stage were not fully satisfied due tothe apparent loudspeaker localization. Most of the discontent was caused by their relativelydistant position from all the system microphones and correspondingly the proximity to thehindmost loudspeakers on the stage balconies (Figure 6.14). This caused the system tohave less supporting effect on these positions while allowing the musicians to hear otherinstruments more clearly.
The time-variance in the algorithm was not perceivable in the negative sense during theorchestra rehearsal. However, a slight fluctuation was heard while adjusting the system pre-viously. Also a problem was encountered as the system fluctuation at selected modulationfrequency interfered with the piano tuning process.
In Figure 7.1, the sound decay and the early reflections can be compared between twomeasurement position pairs. The top figures show the response form source S1 to receiverP3, while the bottom figures present the response from source S2 to the same receiver(see Figure 5.5(a)). The measurement position pair S2P3 corresponds with the acousticalimpression in the back row of the stage. Figure 7.1 does not present any marked differencesbetween the positions. However, the sound source used in the measurements was omni-directional, while brass instruments tend to have stronger directivity features. This affectsto the response from the system.
The sound pressure levels presented in Table 6.6 are not expected to pose any actualrisk regarding the potential hearing loss even on the long-term compared to the same hallwithout the system. Issues related to a healthy sound environment are most likely causedby the physical structures in the practice space instead of the active acoustic system. On theother hand, the reverberation in a hall of the size of Louhi hall without the system could notbe much shorter without losing the natural reflections, which the system at this point is notable to simulate.
7.4 Future improvements
The electro-acoustic system utilized in the case studies of this work provided a good, flex-ible environment for enhancing the reverberation in practice and rehearsal rooms. Of the
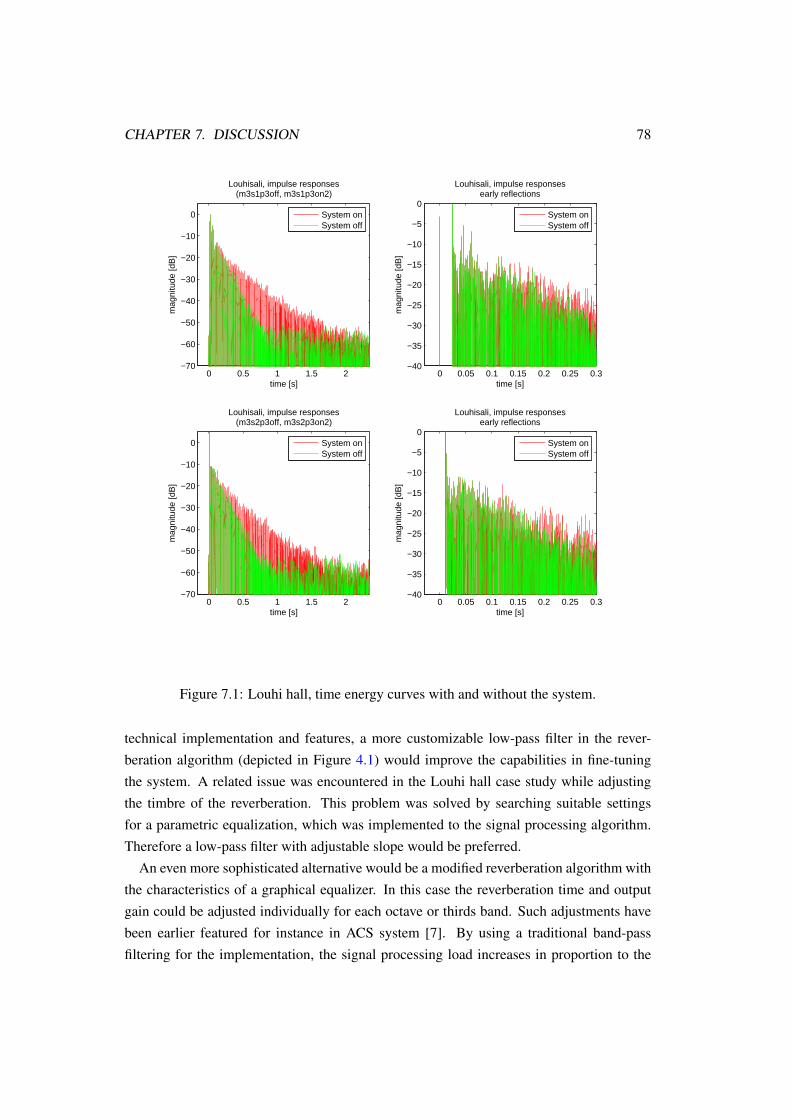
CHAPTER 7. DISCUSSION 78
0 0.5 1 1.5 2−70
−60
−50
−40
−30
−20
−10
0
Louhisali, impulse responses(m3s1p3off, m3s1p3on2)
time [s]
mag
nitu
de [d
B]
System onSystem off
0 0.05 0.1 0.15 0.2 0.25 0.3−40
−35
−30
−25
−20
−15
−10
−5
0
Louhisali, impulse responsesearly reflections
time [s]
mag
nitu
de [d
B]
System onSystem off
0 0.5 1 1.5 2−70
−60
−50
−40
−30
−20
−10
0
Louhisali, impulse responses(m3s2p3off, m3s2p3on2)
time [s]
mag
nitu
de [d
B]
System onSystem off
0 0.05 0.1 0.15 0.2 0.25 0.3−40
−35
−30
−25
−20
−15
−10
−5
0
Louhisali, impulse responsesearly reflections
time [s]
mag
nitu
de [d
B]
System onSystem off
Figure 7.1: Louhi hall, time energy curves with and without the system.
technical implementation and features, a more customizable low-pass filter in the rever-beration algorithm (depicted in Figure 4.1) would improve the capabilities in fine-tuningthe system. A related issue was encountered in the Louhi hall case study while adjustingthe timbre of the reverberation. This problem was solved by searching suitable settingsfor a parametric equalization, which was implemented to the signal processing algorithm.Therefore a low-pass filter with adjustable slope would be preferred.
An even more sophisticated alternative would be a modified reverberation algorithm withthe characteristics of a graphical equalizer. In this case the reverberation time and outputgain could be adjusted individually for each octave or thirds band. Such adjustments havebeen earlier featured for instance in ACS system [7]. By using a traditional band-passfiltering for the implementation, the signal processing load increases in proportion to the
CHAPTER 7. DISCUSSION 79
number of bands.In Louhi hall with two separate systems, the tested environment had only an acoustical
coupling between the systems. With additional channels it would be possible to directlyconnect the systems to provide more realistic reflections normally occurring in concert halls.While both systems had their different, subjectively tuned reverberation parameters, feedingsome of the hall system output to the stage system inputs could generate more late supportfor the musicians. This would have only a small impact on the system stability. With theexperiences on the system resiliency against coloration, this should not pose any difficulties.
A whole different approach could be designed with wave field synthesis [30]. Withseveral loudspeaker arrays, the system could reduce the loudpeaker localization especiallyin small rooms. Downsides for this kind of systems are considerably more complicatedimplementation and installation in addition to more extensive needs for equipment, thusalso larger spaces. In small practice rooms, such as Cage and Ives, this would not bepractical.
The setup of two separate systems could be used also in smaller spaces than Louhi hall.A minimum floor area of the room for such an installation would be approximately 120 m2.Firstly, the rooms of this size would allow to position the equipment at sufficient distancefrom the musicians. Secondly, the natural reverberation of such a room is in most casesadequate to permit the use of additional delays in the artificial reverberation. In Louhihall, these delays were seen to markedly improve the quality of the generated reverberation.The installation would feature different systems for simulating the stage and the audiencearea. With a careful system tuning, this concept could provide an environment for smallerensembles with less than 10 musicians.
An important area for research in the future is an efficient solution for the sound pick-upwith different instruments. As described earlier, microphone positioning has a significanteffect on the quality of the electro-acoustic system. With the current microphone knowl-edge, adjustment of the system is required depending on the instrument. Therefore anoptimal solution would remove this problem.
Chapter 8
Conclusions and Future Work
In this work the use of electro-acoustic systems for enhancing the acoustics in music prac-tice and rehearsal spaces has been studied. Two typical small practice rooms were investi-gated in addition to the conversion of a small multipurpose hall to a rehearsal space for asymphony orchestra. In each case, subjective opinions were gathered with a questionnaireto study whether virtual acoustic systems could be used as a part of acoustical design inpractice spaces.
The main idea behind the investigations was to increase the total absorption in a closedspace to decrease reverberation times but also the sound pressure levels, and to add thereverberation with an electro-acoustic system. As a result, the room would appear to beacoustically larger than in reality.
The system utilized a time-variant reverberation algorithm in order to increase systemstability and to produce as natural reverberation as possible. The small rooms were treatedwith an absorbing drapery sustained on lighting supports and bars. The room acousticsin the symphony orchestra rehearsal hall investigation was already sufficiently dry withoutadditional absorption.
The results obtained in the small rooms showed that the sound pressure levels were con-siderably lower with the system installed than in their original states. In both rooms theA-weighted sound pressure levels were about 6 dB lower with the system independent ofthe reverberation settings. Not even the use of excess reverberation did have any notableeffect on the levels.
Of the four available settings, the reverberation parameters featuring RT60 of approx-imately 1.5 s and clearly distinguishable output gain was regarded the most useful andnatural sounding option. Half of the subjects in small rooms considered that similar sys-tems could be used in practice rooms in the future. Psychological aspects were also foundto have an effect on the acoustical impression.
80
CHAPTER 8. CONCLUSIONS AND FUTURE WORK 81
In the symphony orchestra rehearsal hall case, the system was tuned so that the subjectsdid not have any control to the system. With the system, the reverberation time increasedfrom 1.0 to 2.3 s at middle frequencies while other stage acoustic parameters were broughtto similar values with renowned European concert halls. On the other hand, the soundpressure level increase introduced by the system was below 0.7 dB at all octave bands.
The system was received very positively by the musicians. Only four out of 30 musiciansresponded that such a system could not be used in orchestra rehearsals. The hall equippedwith virtual acoustics was regarded a good rehearsal space and the improvement over thesame hall without the system was remarkable.
As these investigations have proved, practice rooms can be modified by an electro-acoustic system. Improvements in small rooms require different installations dependingon the instruments and the acoustical properties of the original room. Hence, additional re-search in the fields of small practice rooms and microphone positioning is needed. In largerspaces the problems are mainly related to providing sufficient effect to all positions on thestage area. Also the importance of careful fine-tuning of the system was found essential.
The future research on this subject should concentrate on modifying the used reverber-ation algorithm to provide more customizable decay in frequency domain. An interestingadvance would be the possibility to interpret previously recorded impulse response from anexisting acoustical space and automatically adjust the reverberation parameters to complywith the principal acoustical features. In the studies concerning virtual acoustics in smallpractice rooms, a sufficient number of experienced subjects should be ensured over a longertime period.
”The operation of such a system requires personnel having a sense of mu-sical appreciation with regard to levels and balance of the various elements.”-J.W. Ditamore, 1965 [17]
Bibliography
[1] Acoustic Control Systems B.V. Website, Oct. 2007. http://www.acs-bv.nl/.
[2] AKG Acoustics Gmbh. Model C414 datasheet, June 2007. http://www.akg.com/.
[3] Alpine Electronics Inc. Website, June 2007. http://www.alpine-europe.com/.
[4] M. Barron. Auditorium acoustics and architectural design. Taylor & Francis, 1stedition, 1993.
[5] D. R. Begault. Auditory and non-auditory factors that potentially influence virtualacoustic imagery. In the 16th Audio Engineering Society (AES) International Confer-ence, Rovaniemi, Finland, Apr. 1999. paper no. 16-002.
[6] Behringer International GmbH. Website, September 2007.http://www.behringer.com/.
[7] A. J. Berkhout, D. de Vries, J. R. Hemingway, and A. Griffioen. Experience with theacoustical control system ACS. In the 6th Audio Engineering Society (AES) Interna-tional Conference, pages 534–555, Nashville, USA, Apr. 1988.
[8] G. Berry and G. L. Crouse. Assisted resonance. Journal of the Audio EngineeringSociety, 24(3):171–176, Apr. 1976.
[9] J. Blauert. Spatial Hearing: The Psychophysics of Human Sound Localization. MITPress, 1st edition, 1997.
[10] M. D. Burkhard. A simplified frequency shifter for improving acoustic feedback sta-bility. In the 14th Audio Engineering Society (AES) annual meeting, Illinois, USA,Oct. 15-19 1962. preprint no. 258.
[11] A. B. Carlson. Communication systems. Mc. Graw-Hill, 4th edition, 2001.
[12] A. P. O. Carvalho. The use of the Sabine and Eyring reverberation time equations tochurches. Journal of the Acoustical Society of America, 97(5):3319, 1995.
82
BIBLIOGRAPHY 83
[13] Creative Technology Ltd. Website, June 2007. http://www.creative.com/.
[14] CSTB - Centre Scientifique et Technique du Bâtiment. Website, September 2007.http://www.cstb.fr/.
[15] B. Dalenbäck, M. Kleiner, and P. Svensson. Auralization, virtually everywhere. Inthe 100th Audio Engineering Society (AES) Convention, Copenhagen, Denmark, May11-14 1996. preprint no. 4228.
[16] P. S. R. Diniz, A. B. de Silva, and S. L. Netto. Digital Signal Processing: SystemAnalysis and Design. Cambridge University Press, 1st edition, 2001.
[17] J. W. Ditamore. Application of electronic acoustical control in a large multipurposeauditorium. In the 17th Audio Engineering Society (AES) Annual meeting, Lafayette,USA, Oct. 11-15 1965. preprint no. 387.
[18] A. Farina. Simultaneous measurement of impulse response and distortion with aswept-sine technique. In the 108th Audio Engineering Society (AES) Convention,Paris, France, Feb. 19-22 2000. preprint no. 5093.
[19] D. Fitzroy. Reverberation formulae which seems to be more accurate with non-uniform distribution of absorption. Journal of the Acoustical Society of America,31(3):p. 118, Jan 1959.
[20] N.H. Fletcher and A. Tarnopolsky. Blowing pressure, power, and spectrum in trumpetplaying. Journal of Acoustical Society of America, 105(2):874–881, Feb. 1999.
[21] A. C. Gade. Acoustical survey of eleven european concert halls - a basis for discussionof halls in Denmark. Report no. 44, 1989. Technical University of Denmark.
[22] A. C. Gade. Investigations of musicians’ room acoustic conditions in concert halls,part I: Methods and laboratory experiments. Acustica, 69:193–203, 1989.
[23] A. C. Gade. Investigations of musicians’ room acoustic conditions in concert halls,part II: Field experiments and synthesis of results. Acustica, 69:249–262, 1989.
[24] E. Granier, M. Kleiner, . B.-I. Dalenbäck, and P. Svensson. Experimental auralizationof car audio installations. the Journal of Audio Engineering Society, 44(10):835–849,Oct. 1996.
[25] D. Griesinger. Improving room acoustics through time-variant synthetic reverberation.In the 90th Audio Engineering Society (AES) Convention, Paris, France, Feb. 19-221991. preprint no. 3014.
BIBLIOGRAPHY 84
[26] D. Griesinger. Variable acoustics using multiple time variant reverberation: recentexperiences in halls, churches and opera houses. In ICA 2001 conference, May 7-112001. Presentation material.
[27] J. C. Jaffe and P. H. Scarbrough. Electronic architecture: Toward a better understand-ing of theory and application. In the 93th Audio Engineering Society (AES) Conven-tion, San Francisco, USA, 1992. preprint no. 3382.
[28] M. Karjalainen. Kommunikaatioakustiikka. Laboratory of acoustics and audio signalprocessing, Report 51, Helsinki University of Technology, 1999.
[29] M. Kleiner, B. Dalenbäck, and P. Svensson. Auralization - an overview. In the 91th Au-dio Engineering Society (AES) Convention, New York, USA, Oct. 4-8 1991. preprintno. 3119.
[30] M. Kleiner and P. Svensson. Review of active systems in room acoustics and electroa-coustics. In Active 95, pages 39–54, Newport Beach, USA, Jul. 6-8 1995.
[31] H. Kuttruff. Room Acoustics. Spon Press, 4th edition, 2000.
[32] M. Kylliäinen and H. Helimäki. Kansallisoopperan orkesteriharjoitussalinhuoneakustiikan ongelmat. In the Proc. of Akustiikkapäivät 2005, Acoustical Soci-ety of Finland, Kuopio, Finland, Sep. 26-27 2005.
[33] T. Lahti. Akustinen mittaustekniikka. Lecture material, Helsinki University of Tech-nology, 1995.
[34] Lares Associates. Website, June 2007. http://www.lares-lexicon.com/.
[35] Lexicon Inc. Us patent, 1992. number 5,109,419.
[36] T. Lokki and J. Hiipakka. A time-variant reverberation algorithm for reverberationenhancement systems. In the COST G-6 Conference on Digital Audio Effects DAFX-01, pages 28–32, Limerick, Ireland, Dec. 6-8 2001.
[37] T. Lokki, R. Kajastila, and T. Takala. Virtual acoustic spaces with multiple reverbera-tion enhancement systems. In the 30th Audio Engineering Society (AES) InternationalConference, Saariselkä, Finland, Mar. 15-17 2007. paper no. 10.
[38] T. Lokki, J. Nummela, and T. Lahti. An electro-acoustic enhancement system forrehearsal rooms. EAA Symposium on Architectural Acoustics, Oct. 16-20 2000. paperAAQ06.
BIBLIOGRAPHY 85
[39] T. Lokki and O. Salmensaari. Measurement report, no. 71119-1. Akukon Oy. EspoonMusiikkiopiston opetusluokat, 2007.
[40] H. Malmquist. Helmer Malmquist Audio, June 2007.http://www.hmaudio.se/studio/studio03.htm.
[41] J. Meyer. Understanding the orchestral stage environment from the musican’s, singer’sand conductor’s point of view. In Wallace Clement Sabine centennial symposium,pages 93–96, Cambridge, USA, Jun. 5-7 1994.
[42] H. Möller. Room Acoustics. Lecture material, Helsinki University of Technology,2005.
[43] H. Möller and T. Peltonen. Lateral efficiency in small auditoriums. In Baltic-NordicAcoustics Meeting 2004, Mariehamn, Åland, Jun. 8-10 2004.
[44] S. Müller and P. Massarani. Transfer-function measurement with sweeps. Journal ofAudio Engineering Society, 49(6):443–471, Jun. 2001.
[45] S. Nakamura, K. Takaku, and Shin-ichirokan. A report on the relationship betweenorchestra shell design and musicians’ acoustical impression. In 15th InternationalConference on Acoustics, pages 525–528, Trondheim, Norway, Jun. 26-30 1995.
[46] R. O. Neubauer. Prediction of reverberation time in rectangular rooms with non uni-formly distributed absorption using a new formula. In Acustica 2000, Madrid, Spain,Oct. 2000.
[47] J. L. Nielsen and U. P. Svensson. Performance of some linear time-varying sys-tems in control of acoustic feedback. Journal of the Acoustical Society of America,106(1):240–254, 1999.
[48] J. Nummela. Sähköakustinen harjoitussali sinfoniaorkesterille. Master’s thesis,Helsinki University of Technology, Finland, 2001.
[49] F. Otondo, J. H. Rindel, R. Caussé, N. Misdariis, and P. de la Cuadra. Directivity ofmusical instruments in a real performance situation. In the International Symposiumon Musical Acoustics, pages 312–318, Mexico City, Mexico, 2002.
[50] T. Peltonen. A multichannel measurement system for room acoustics analysis. Mas-ter’s thesis, Helsinki University of Technology, Finland, 2000.
[51] D. R. Perrott. Auditory and visual localization: Two modalities, one world. In the 12thAudio Engineering Society (AES) International Conference, pages 221–231, Copen-hagen, Denmark, Jun. 28-30 1993.
BIBLIOGRAPHY 86
[52] A. Pietrzyk and M. Kleiner. The application of the Finite Element Method to theprediction of sound fields of small rooms at low frequencies. In the 102nd AudioEngineering Society (AES) Convention, Munich, Germany, Mar. 22-25 1997. preprintno. 4423.
[53] M. A. Poletti. Colouration in assisted reverberation systems. In IEEE InternationalConference on Acoustics, Speech and Signal Processing, Vol. 2, pages 269–272, Ade-laide, Australia, 1994.
[54] M. A. Poletti. An assisted reverberation system for controlling apparent room ab-sorption and volume. In the 101th Audio Engineering Society (AES) Convention, LosAngeles, USA, 1996. preprint no. 4365.
[55] M. A. Poletti. The stability of multichannel sound systems with frequency shifting.Journal of the Acoustical Society of America, 116(2):853–871, 2004.
[56] M. Puckette. Pure Data, June 2007. http://puredata.info/.
[57] T. D. Rossing. The Science of Sound. Addison-Wesley, 3rd edition, 2002.
[58] I. Schmich, P. Chervin, J. Maillard, and C. Rougier. A new reverberation enhancementsystem - carmencita. In the Proc. of 19th Internation Congress on Acoustics, Madrid,Spain, Sep. 2-7 2007.
[59] M. R. Schroeder. Improvement of feedback stability of public address systems byfrequency shifting. the Journal of Audio Engineering Society, 10(2):108–109, Apr.1962.
[60] M. R. Schroeder. Improvement of acoustic-feedback stability by frequency shifting.Journal of the Acoustical Society of America, 36(9):1718–1724, 1964.
[61] P. Svensson. On reverberation enhancement in auditoria. PhD thesis, Chalmers Uni-versity of Technology, Gothenburg, Sweden, 1994.
[62] P. Svensson, M. Kleiner, and J. L. Nielsen. The use of time-varying filters for acousticfeedback control. In the Active 95, pages 941–950, Newport Beach, USA, Jul. 6-81995.
[63] P. Svensson and U. R. Kristiansen. Computational modelling and simulation of acous-tic spaces. In the 22th Audio Engineering Society (AES) International Conference,Espoo, Finland, Jun. 15-17 2002. paper no. 266.
BIBLIOGRAPHY 87
[64] P. Taina. Pientalon huoneakustiikan parantaminen. Master’s thesis, Helsinki Univer-sity of Technology, Finland, 2006.
[65] W. Teuber and E. Voelker. Acoustical requirements and results for music rehearsalrooms. In the 94th Audio Engineering Society (AES) Convention, Berlin, Germany,Mar. 16-19 1993. preprint no. 3549.
[66] S. Uosukainen. Acoustics and Physics of Sound. Lecture material, Helsinki Universityof Technology, 2006.
[67] R. Väänänen. Parametrization, auralization and authoring of room acoustics for vir-tual reality applications. PhD thesis, Helsinki University of Technology, Finland,2003.
[68] R. Väänänen, V. Välimäki, and J. Huopaniemi. Efficient and parametric reverber-ator for room acoustics modeling. In International Computer Music Conference(ICMC’97), pages 200–203, Thessaloniki, Greece, Sep. 1997.
[69] O. Vuichard and X. Meynial. On microphone positioning in electroacoustic reverber-ation enhancement systems. Acustica, 86(5):853–859, 2000.
[70] Wenger Corporation. Website, June 2007. http://www.wengercorp.com/.
[71] K. Wogram. Five lectures on the acoustics of the piano, June 2007.http://www.speech.kth.se/music/5_lectures/wogram/index.html.
[72] H. D. Young and R. A. Freedman. University Physics. Addison-Wesley, 10th edition,2000.
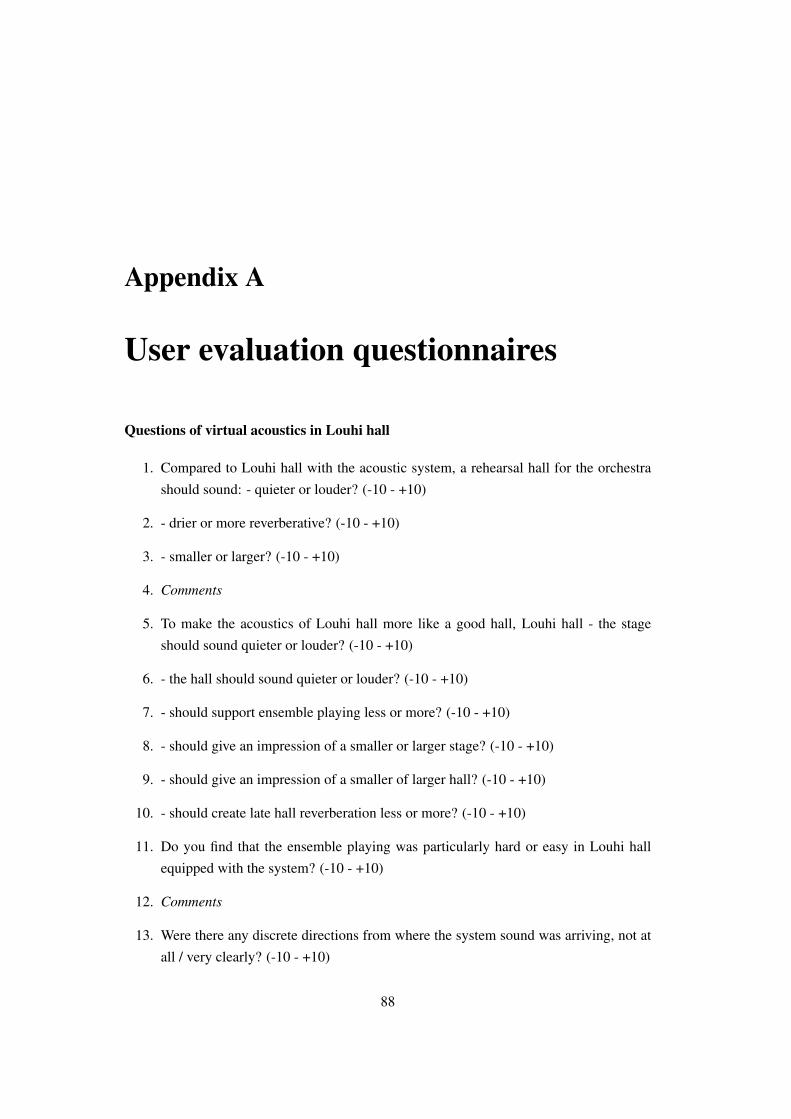
Appendix A
User evaluation questionnaires
Questions of virtual acoustics in Louhi hall
1. Compared to Louhi hall with the acoustic system, a rehearsal hall for the orchestrashould sound: - quieter or louder? (-10 - +10)
2. - drier or more reverberative? (-10 - +10)
3. - smaller or larger? (-10 - +10)
4. Comments
5. To make the acoustics of Louhi hall more like a good hall, Louhi hall - the stageshould sound quieter or louder? (-10 - +10)
6. - the hall should sound quieter or louder? (-10 - +10)
7. - should support ensemble playing less or more? (-10 - +10)
8. - should give an impression of a smaller or larger stage? (-10 - +10)
9. - should give an impression of a smaller of larger hall? (-10 - +10)
10. - should create late hall reverberation less or more? (-10 - +10)
11. Do you find that the ensemble playing was particularly hard or easy in Louhi hallequipped with the system? (-10 - +10)
12. Comments
13. Were there any discrete directions from where the system sound was arriving, not atall / very clearly? (-10 - +10)
88
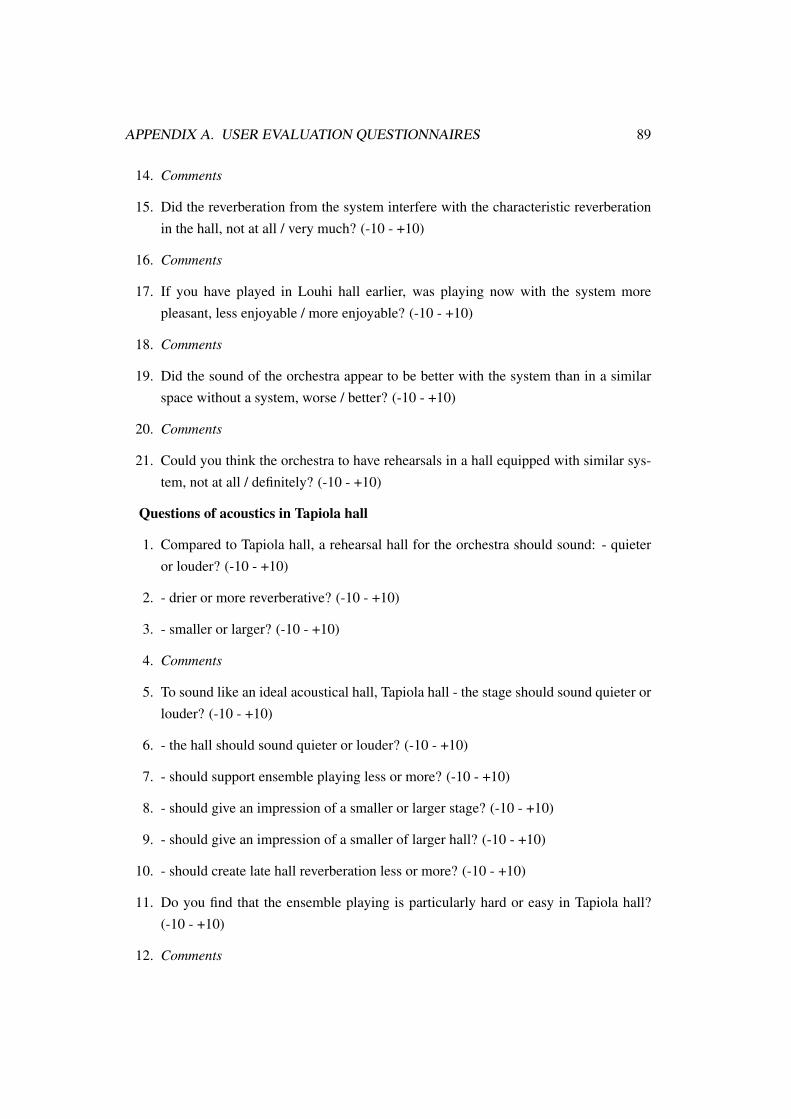
APPENDIX A. USER EVALUATION QUESTIONNAIRES 89
14. Comments
15. Did the reverberation from the system interfere with the characteristic reverberationin the hall, not at all / very much? (-10 - +10)
16. Comments
17. If you have played in Louhi hall earlier, was playing now with the system morepleasant, less enjoyable / more enjoyable? (-10 - +10)
18. Comments
19. Did the sound of the orchestra appear to be better with the system than in a similarspace without a system, worse / better? (-10 - +10)
20. Comments
21. Could you think the orchestra to have rehearsals in a hall equipped with similar sys-tem, not at all / definitely? (-10 - +10)
Questions of acoustics in Tapiola hall
1. Compared to Tapiola hall, a rehearsal hall for the orchestra should sound: - quieteror louder? (-10 - +10)
2. - drier or more reverberative? (-10 - +10)
3. - smaller or larger? (-10 - +10)
4. Comments
5. To sound like an ideal acoustical hall, Tapiola hall - the stage should sound quieter orlouder? (-10 - +10)
6. - the hall should sound quieter or louder? (-10 - +10)
7. - should support ensemble playing less or more? (-10 - +10)
8. - should give an impression of a smaller or larger stage? (-10 - +10)
9. - should give an impression of a smaller of larger hall? (-10 - +10)
10. - should create late hall reverberation less or more? (-10 - +10)
11. Do you find that the ensemble playing is particularly hard or easy in Tapiola hall?(-10 - +10)
12. Comments
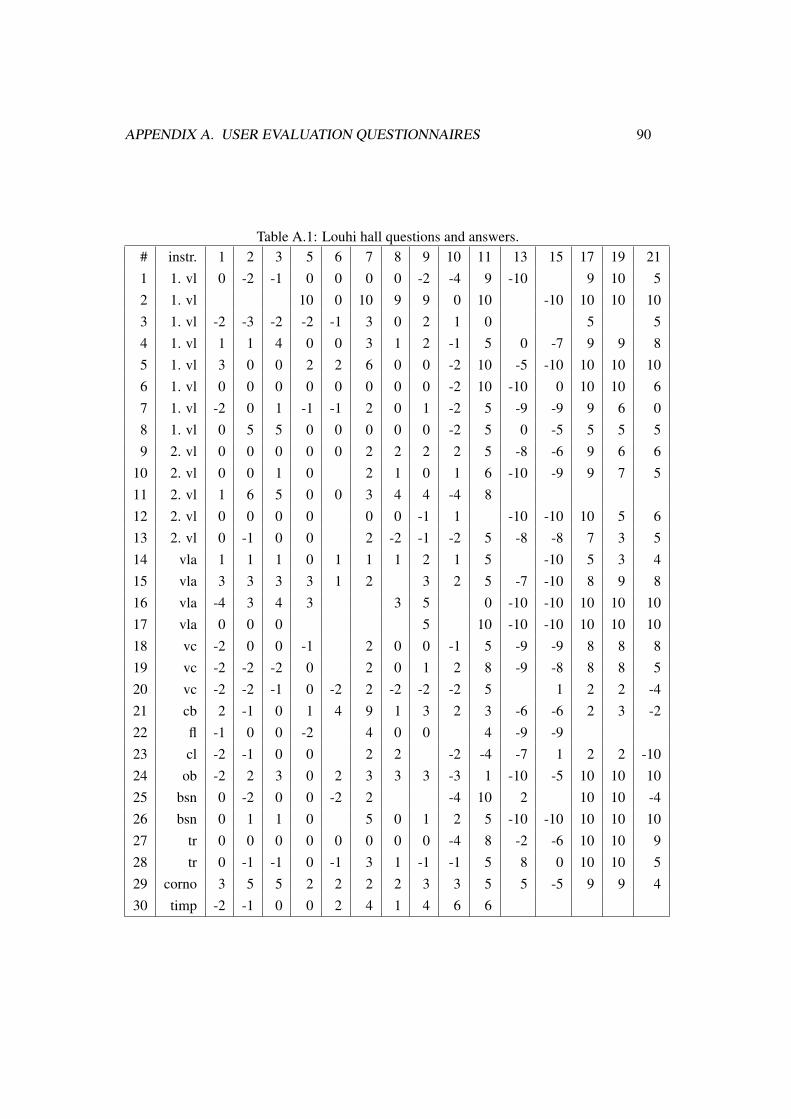
APPENDIX A. USER EVALUATION QUESTIONNAIRES 90
Table A.1: Louhi hall questions and answers.# instr. 1 2 3 5 6 7 8 9 10 11 13 15 17 19 211 1. vl 0 -2 -1 0 0 0 0 -2 -4 9 -10 9 10 52 1. vl 10 0 10 9 9 0 10 -10 10 10 103 1. vl -2 -3 -2 -2 -1 3 0 2 1 0 5 54 1. vl 1 1 4 0 0 3 1 2 -1 5 0 -7 9 9 85 1. vl 3 0 0 2 2 6 0 0 -2 10 -5 -10 10 10 106 1. vl 0 0 0 0 0 0 0 0 -2 10 -10 0 10 10 67 1. vl -2 0 1 -1 -1 2 0 1 -2 5 -9 -9 9 6 08 1. vl 0 5 5 0 0 0 0 0 -2 5 0 -5 5 5 59 2. vl 0 0 0 0 0 2 2 2 2 5 -8 -6 9 6 6
10 2. vl 0 0 1 0 2 1 0 1 6 -10 -9 9 7 511 2. vl 1 6 5 0 0 3 4 4 -4 812 2. vl 0 0 0 0 0 0 -1 1 -10 -10 10 5 613 2. vl 0 -1 0 0 2 -2 -1 -2 5 -8 -8 7 3 514 vla 1 1 1 0 1 1 1 2 1 5 -10 5 3 415 vla 3 3 3 3 1 2 3 2 5 -7 -10 8 9 816 vla -4 3 4 3 3 5 0 -10 -10 10 10 1017 vla 0 0 0 5 10 -10 -10 10 10 1018 vc -2 0 0 -1 2 0 0 -1 5 -9 -9 8 8 819 vc -2 -2 -2 0 2 0 1 2 8 -9 -8 8 8 520 vc -2 -2 -1 0 -2 2 -2 -2 -2 5 1 2 2 -421 cb 2 -1 0 1 4 9 1 3 2 3 -6 -6 2 3 -222 fl -1 0 0 -2 4 0 0 4 -9 -923 cl -2 -1 0 0 2 2 -2 -4 -7 1 2 2 -1024 ob -2 2 3 0 2 3 3 3 -3 1 -10 -5 10 10 1025 bsn 0 -2 0 0 -2 2 -4 10 2 10 10 -426 bsn 0 1 1 0 5 0 1 2 5 -10 -10 10 10 1027 tr 0 0 0 0 0 0 0 0 -4 8 -2 -6 10 10 928 tr 0 -1 -1 0 -1 3 1 -1 -1 5 8 0 10 10 529 corno 3 5 5 2 2 2 2 3 3 5 5 -5 9 9 430 timp -2 -1 0 0 2 4 1 4 6 6
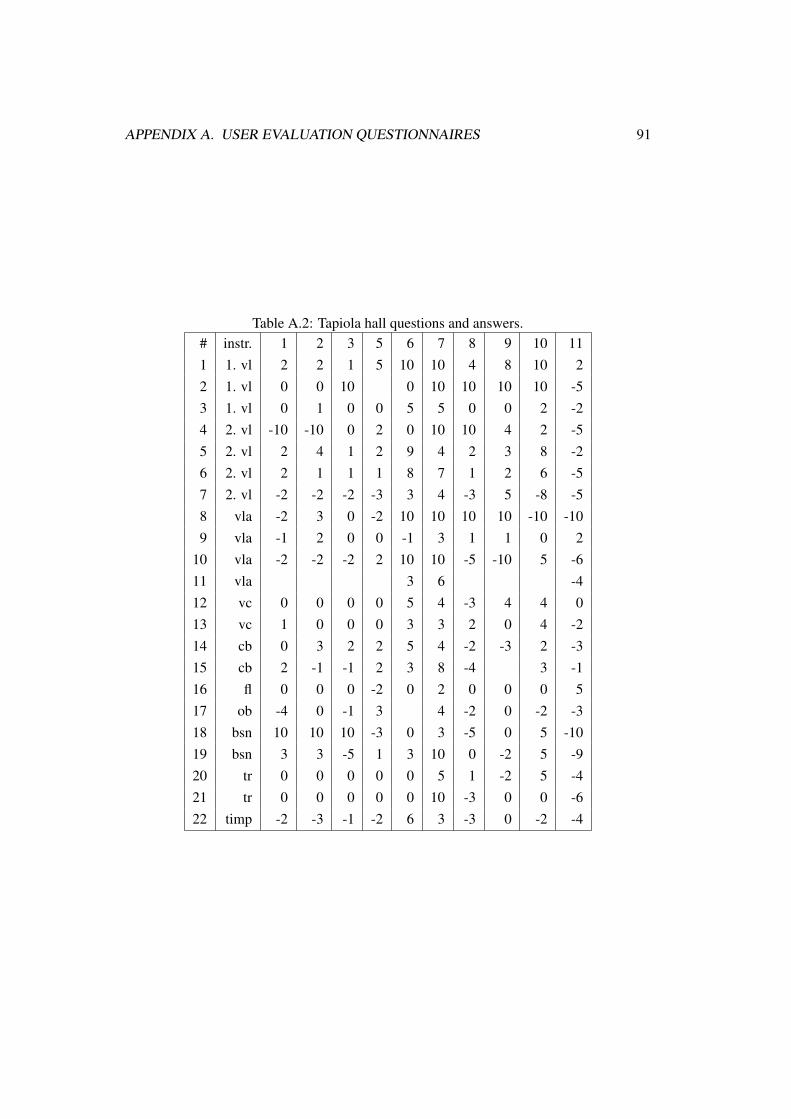
APPENDIX A. USER EVALUATION QUESTIONNAIRES 91
Table A.2: Tapiola hall questions and answers.# instr. 1 2 3 5 6 7 8 9 10 111 1. vl 2 2 1 5 10 10 4 8 10 22 1. vl 0 0 10 0 10 10 10 10 -53 1. vl 0 1 0 0 5 5 0 0 2 -24 2. vl -10 -10 0 2 0 10 10 4 2 -55 2. vl 2 4 1 2 9 4 2 3 8 -26 2. vl 2 1 1 1 8 7 1 2 6 -57 2. vl -2 -2 -2 -3 3 4 -3 5 -8 -58 vla -2 3 0 -2 10 10 10 10 -10 -109 vla -1 2 0 0 -1 3 1 1 0 2
10 vla -2 -2 -2 2 10 10 -5 -10 5 -611 vla 3 6 -412 vc 0 0 0 0 5 4 -3 4 4 013 vc 1 0 0 0 3 3 2 0 4 -214 cb 0 3 2 2 5 4 -2 -3 2 -315 cb 2 -1 -1 2 3 8 -4 3 -116 fl 0 0 0 -2 0 2 0 0 0 517 ob -4 0 -1 3 4 -2 0 -2 -318 bsn 10 10 10 -3 0 3 -5 0 5 -1019 bsn 3 3 -5 1 3 10 0 -2 5 -920 tr 0 0 0 0 0 5 1 -2 5 -421 tr 0 0 0 0 0 10 -3 0 0 -622 timp -2 -3 -1 -2 6 3 -3 0 -2 -4
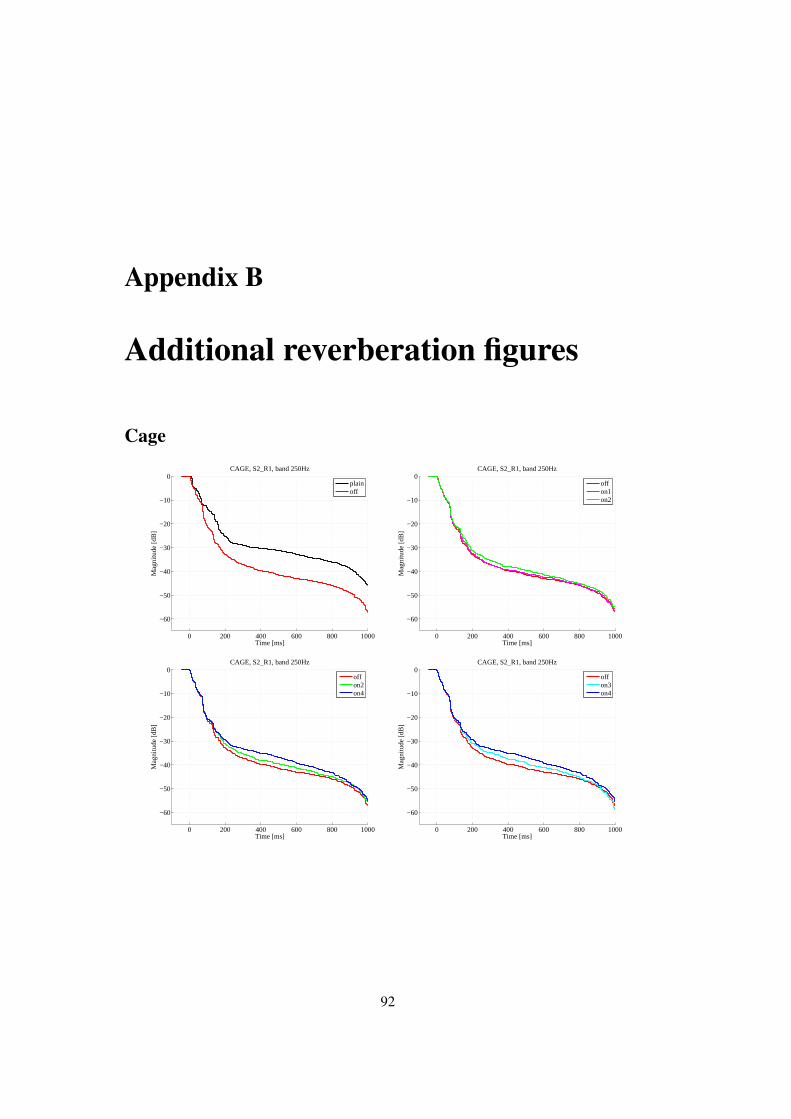
Appendix B
Additional reverberation figures
Cage
0 200 400 600 800 1000
−60
−50
−40
−30
−20
−10
0CAGE, S2_R1, band 250Hz
Mag
nitu
de [d
B]
Time [ms]
plainoff
0 200 400 600 800 1000
−60
−50
−40
−30
−20
−10
0CAGE, S2_R1, band 250Hz
Mag
nitu
de [d
B]
Time [ms]
offon1on2
0 200 400 600 800 1000
−60
−50
−40
−30
−20
−10
0CAGE, S2_R1, band 250Hz
Mag
nitu
de [d
B]
Time [ms]
offon2on4
0 200 400 600 800 1000
−60
−50
−40
−30
−20
−10
0CAGE, S2_R1, band 250Hz
Mag
nitu
de [d
B]
Time [ms]
offon3on4
92
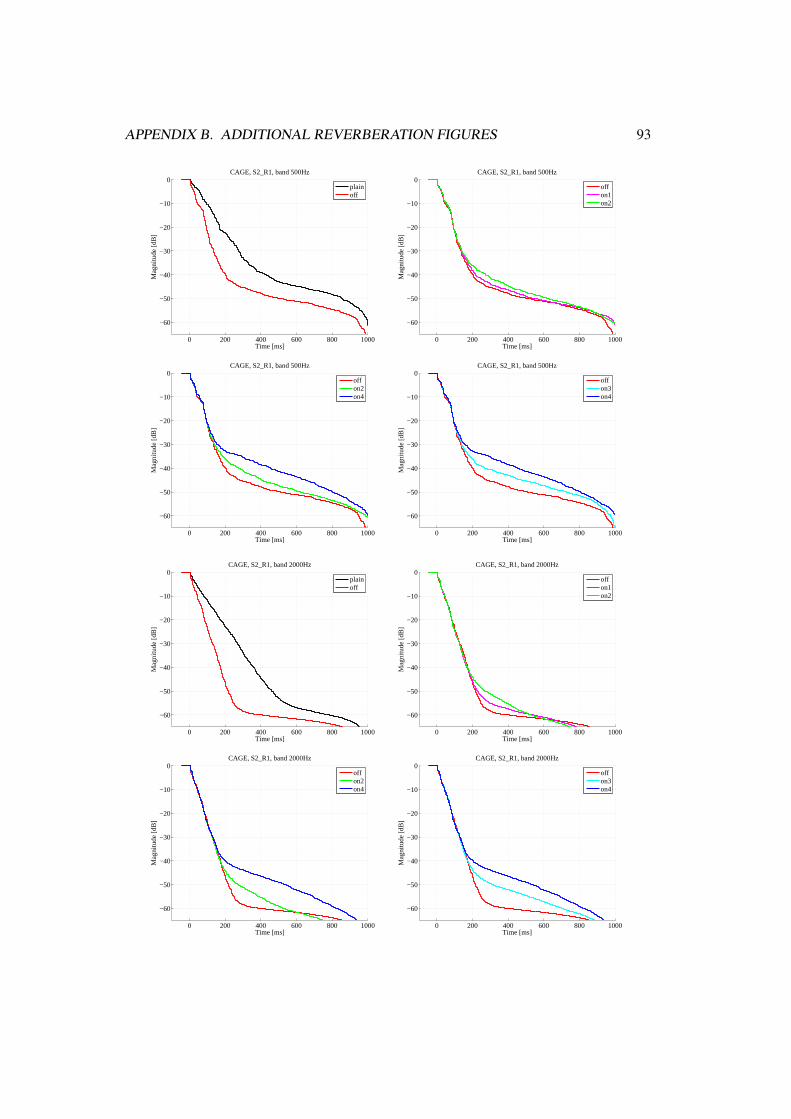
APPENDIX B. ADDITIONAL REVERBERATION FIGURES 93
0 200 400 600 800 1000
−60
−50
−40
−30
−20
−10
0CAGE, S2_R1, band 500Hz
Mag
nitu
de [d
B]
Time [ms]
plainoff
0 200 400 600 800 1000
−60
−50
−40
−30
−20
−10
0CAGE, S2_R1, band 500Hz
Mag
nitu
de [d
B]
Time [ms]
offon1on2
0 200 400 600 800 1000
−60
−50
−40
−30
−20
−10
0CAGE, S2_R1, band 500Hz
Mag
nitu
de [d
B]
Time [ms]
offon2on4
0 200 400 600 800 1000
−60
−50
−40
−30
−20
−10
0CAGE, S2_R1, band 500Hz
Mag
nitu
de [d
B]
Time [ms]
offon3on4
0 200 400 600 800 1000
−60
−50
−40
−30
−20
−10
0CAGE, S2_R1, band 2000Hz
Mag
nitu
de [d
B]
Time [ms]
plainoff
0 200 400 600 800 1000
−60
−50
−40
−30
−20
−10
0CAGE, S2_R1, band 2000Hz
Mag
nitu
de [d
B]
Time [ms]
offon1on2
0 200 400 600 800 1000
−60
−50
−40
−30
−20
−10
0CAGE, S2_R1, band 2000Hz
Mag
nitu
de [d
B]
Time [ms]
offon2on4
0 200 400 600 800 1000
−60
−50
−40
−30
−20
−10
0CAGE, S2_R1, band 2000Hz
Mag
nitu
de [d
B]
Time [ms]
offon3on4
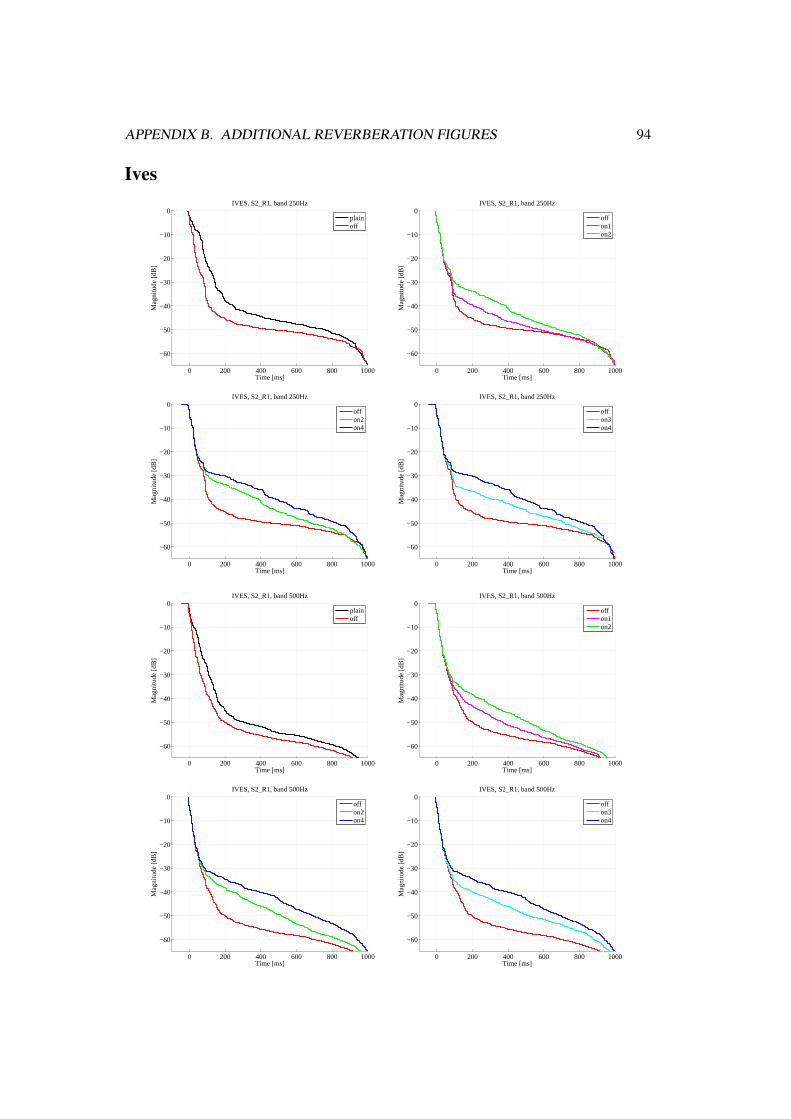
APPENDIX B. ADDITIONAL REVERBERATION FIGURES 94
Ives
0 200 400 600 800 1000
−60
−50
−40
−30
−20
−10
0IVES, S2_R1, band 250Hz
Mag
nitu
de [d
B]
Time [ms]
plainoff
0 200 400 600 800 1000
−60
−50
−40
−30
−20
−10
0IVES, S2_R1, band 250Hz
Mag
nitu
de [d
B]
Time [ms]
offon1on2
0 200 400 600 800 1000
−60
−50
−40
−30
−20
−10
0IVES, S2_R1, band 250Hz
Mag
nitu
de [d
B]
Time [ms]
offon2on4
0 200 400 600 800 1000
−60
−50
−40
−30
−20
−10
0IVES, S2_R1, band 250Hz
Mag
nitu
de [d
B]
Time [ms]
offon3on4
0 200 400 600 800 1000
−60
−50
−40
−30
−20
−10
0IVES, S2_R1, band 500Hz
Mag
nitu
de [d
B]
Time [ms]
plainoff
0 200 400 600 800 1000
−60
−50
−40
−30
−20
−10
0IVES, S2_R1, band 500Hz
Mag
nitu
de [d
B]
Time [ms]
offon1on2
0 200 400 600 800 1000
−60
−50
−40
−30
−20
−10
0IVES, S2_R1, band 500Hz
Mag
nitu
de [d
B]
Time [ms]
offon2on4
0 200 400 600 800 1000
−60
−50
−40
−30
−20
−10
0IVES, S2_R1, band 500Hz
Mag
nitu
de [d
B]
Time [ms]
offon3on4
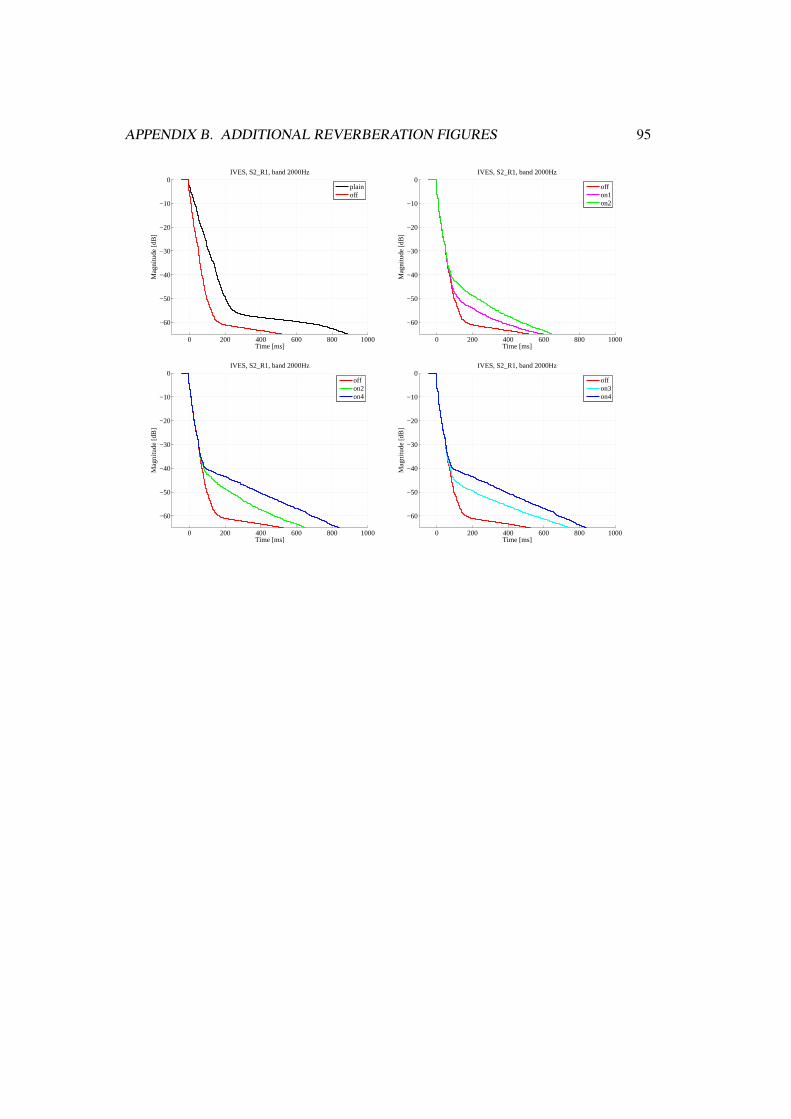
APPENDIX B. ADDITIONAL REVERBERATION FIGURES 95
0 200 400 600 800 1000
−60
−50
−40
−30
−20
−10
0IVES, S2_R1, band 2000Hz
Mag
nitu
de [d
B]
Time [ms]
plainoff
0 200 400 600 800 1000
−60
−50
−40
−30
−20
−10
0IVES, S2_R1, band 2000Hz
Mag
nitu
de [d
B]
Time [ms]
offon1on2
0 200 400 600 800 1000
−60
−50
−40
−30
−20
−10
0IVES, S2_R1, band 2000Hz
Mag
nitu
de [d
B]
Time [ms]
offon2on4
0 200 400 600 800 1000
−60
−50
−40
−30
−20
−10
0IVES, S2_R1, band 2000Hz
Mag
nitu
de [d
B]
Time [ms]
offon3on4