Embed Size (px)
Citation preview

1
OKLAHOMA GAS and ELECTRIC
COMPANY
2013 Arkansas Energy Efficiency Program Portfolio
Annual Report
Section 9: Annual Reporting Requirements, and Order No. 18 in Docket No. 06-004-R.
Version 3.0 September 27, 2013
March 31, 2014
APSC FILED Time: 4/1/2014 12:29:49 PM: Recvd 4/1/2014 11:59:47 AM: Docket 07-075-tf-Doc. 229

2
Table of Contents _______________________________________________________________________
Contents 1.0 Executive Summary ............................................................................................................. 3
Executive Summary ................................................................................................................4
2.0 Portfolio Programs ............................................................................................................... 9
2.1 OG&E Weatherization Program ...................................................................................... 11
2.2 Student Energy Education Program (LivingWise® ) ......................................................... 14
2.3 Commercial Lighting Program ......................................................................................... 16
2.4 Energy Efficiency Education Program ............................................................................. 18
2.5 HVAC Tune-Up and Duct Repair Program...................................................................... 20
2.6 Window Unit A/C Program .............................................................................................. 22
2.7 Commercial Tune-Up Program ....................................................................................... 24
2.8 Commercial/Industrial Standard Offer Program .............................................................. 26
2.9 Multi-Family Program ...................................................................................................... 28
2.10 Arkansas Weatherization Program (AWP) .................................................................... 29
3.0 Supplemental Requirements ............................................................................................. 31
3.1 Staffing ............................................................................................................................ 32
3.2 Stakeholders Activities .................................................................................................... 32
3.3 Information provided to Customer to Promote EE ........................................................... 33
4.0 Appendix A: EM&V Contractor Report .............................................................................. 34
5.0 Appendix X ........................................................................................................................ 36
Attachment B Cost Effectiveness Frontier ………………………………………...…… 38 Attachment C AWP EM&V Evaluation ……………………………………………….… 50 Attachment D OG&E AOG Weatherization …………………………………………….. 79 Attachment E EnerNoc Program Evaluation …………………………………………… 146
APSC FILED Time: 4/1/2014 12:29:49 PM: Recvd 4/1/2014 11:59:47 AM: Docket 07-075-tf-Doc. 229

3
1.0 Executive Summary
APSC FILED Time: 4/1/2014 12:29:49 PM: Recvd 4/1/2014 11:59:47 AM: Docket 07-075-tf-Doc. 229

4
Executive Summary
Oklahoma Gas and Electric Company (“OG&E” or “Company”) hereby submits its Energy Efficiency
(“EE”) program portfolio Annual Report for Plan Year (“PY”) 2013 to the Arkansas Public Service
Commission (“APSC” or “Commission”) pursuant to Order No. 18 in Docket 06-004-R. This report is
required to be filed annually by April 1, per Section 9 of the APSC Rules for Conservation and Energy
Efficiency Programs.
HISTORY:
OG&E began implementation of Energy Efficiency Programs in Arkansas in December 2007 with its
Quick Start Program Portfolio. The Quick Start Program continued through December 31, 2009. That
portfolio contained seven programs in total; five OG&E administered programs and two state
administered programs. The OG&E administered programs included; Livingwise® Student Energy
Education, Residential Energy Audit, Commercial Lighting, Motor Replacement and Compact
Fluorescents (“CFL”). The two state administered programs included are the Arkansas Weatherization
Program (“AWP”), and the Energy Efficiency Arkansas (“EEA”) program. The CFL program was not
launched with the other Quick-Start programs and was ultimately discontinued. The Quick-Start
portfolio allowed OG&E to build a framework to deliver programs to over 65,000 customers in the
Arkansas jurisdiction.
The initial Comprehensive Energy Efficiency (“CEE”) Portfolio was approved and implemented on
February 3, 2010 and ended on June 30, 2011. That CEE portfolio included the continuation of the two
statewide programs AWP and EEA, and three OG&E programs; Livingwise® Student Energy
Education, Commercial Lighting and Motor Replacement programs. The Residential Energy Audit
program was renamed the Custom Energy Report (“CER”) program and the new OG&E Weatherization
program was introduced. The OG&E Weatherization program was established to offer weatherization
for residential customers that would not otherwise qualify for the AWP.
The current Comprehensive Portfolio was approved on June 30, 2011 for the remainder of PY 2011. The
PY’s 2012 and 2013 were subsequently approved on December 30, 2011. The two statewide programs,
AWP and EEA, were continued as were OG&E’s Commercial Lighting program and the Livingwise®
Student Energy Education program. The CER program was discontinued as an EE program but is still
available through OG&E’s website. The OG&E Weatherization program was modified to a
collaborative program with Arkansas Oklahoma Gas Corporation (“AOG”) to take advantage of
administrative efficiencies and cost sharing. The Motor Replacement Program was incorporated into the
new Commercial and Industrial Standard Offer Program (“C&I SOP”). In addition, new programs were
created for both residential and nonresidential customers. For residential customers, the HVAC tune-up
and duct repair program, the Window Unit A/C program, and the Multi-family program were created to
provide a more diverse residential portfolio of programs. After the plan was approved, it was determined
the Multi-family program could not be implemented as designed and was discontinued. For
nonresidential customers, in addition to the C&I SOP, the Commercial Tune-up program was created to
inspect and tune commercial HVAC systems.
APSC FILED Time: 4/1/2014 12:29:49 PM: Recvd 4/1/2014 11:59:47 AM: Docket 07-075-tf-Doc. 229

5
The following table summarizes historical EE savings achieved by OG&E’s previous efforts:
Energy Demand
PY 2008 2,434,738 kWh 665.9 kW
PY 2009 5,607,951 kWh 921.3 kW
PY 2010 4,143,096 kWh 1,317.1 kW
PY 2011 4,985,328 kWh* 1,520.2 kW
PY 2012 7,595,741 kWh* 1,840.6 kW
* EM&V evaluated energy savings conducted by 3
rd party independent evaluation since July 2011.
GOALS AND OBJECTIVES:
Order No. 15 in Docket 08-137-U established default energy savings goals as a percent of 2010 energy
sales. The annual energy savings goals are shown in the following table.
Program Year Percent of 2010 Sales Energy Savings Goals
PY 2011 0.25 6,752,758 kWh
PY 2012 0.50 11,363,560 kWh
PY 2013 0.75 16,843,560 kWh
PY 2014 0.75 16,287,689 kWh
OG&E’s energy savings goal for 2013 was 16,843,560 kWh or 0.75% of 2010 weather normalized sales
as adjusted for self-direct exemptions. The 2013 EE portfolio actual results achieved for energy savings
were 13,410,729 kWh.
MAJOR ACCOMPLISHMENTS:
The collaborative Weatherization Program with AOG remains very successful and exceeded energy
savings targets for 2013 by 101% and is 37% of the Portfolio savings. Word of mouth marketing from
customers continues to be the main source of new customers in the program for both OG&E and AOG.
In a 2013 EVOLVE Research survey the AOG-OGE Weatherization customers ranked whether they
would recommend the program to friends and relatives at an exceptionally high 9.25 on a scale of 0-10.
The AOG-OGE cross fuel Weatherization Program was given an excellent review in the recent PWC
Unified Weatherization Technical Conference.
In July 2013 CLEAResult was commissioned to provide a Direct Install component to the Commercial
Tune and Standard Offer Programs. The Direct Installs added significantly to the kWh savings for those
programs and also increased customer leads for other commercial projects.
PROGRESS ACHIEVED:
The 2013 Portfolio Goal was 47% higher than the 2012 Portfolio Goal and the Portfolio savings
increased from 54% of Goal in 2012 to 79.6% of Goal in 2013. This is a major step forward for OG&E
and reflects significant enhancements in many program areas and confirms we are on the right track to
meet our 2014 savings Goals.
APSC FILED Time: 4/1/2014 12:29:49 PM: Recvd 4/1/2014 11:59:47 AM: Docket 07-075-tf-Doc. 229

6
The 2013 OG&E portfolio increased energy savings 177% over 2012. This represents significant
progress for OG&E’s energy efficiency (“EE”) efforts. OG&E’s performance in 2013 is clear evidence
of its commitment to helping customers save energy through Company sponsored programs and
measures and commitment to achieving APSC EE goals. The Company’s EE portfolio performance
reflects adjustments and modifications made to address deficiencies in program and measure
implementation.
HIGH-LEVEL RECAP:
The 2013 portfolio produced 13,410,729 kWh or 79.6% of the energy savings goal. These on-going
energy savings will accumulate over the life of the measures. The EE Program recoverable expenses of
$3,714,378 for 2013 were 94% of the approved annual budget of $3,938,015. Customer incentives and
rebates account for 73% of the total program expenses. OG&E did not earn an incentive for 2013 due to
actual kWh savings performing just below the 80% threshold.
HIGHLIGHTS OF WELL PERFORMING PROGRAMS:
OG&E achieved 107% of its 2013 residential goal. OG&E weatherized 1,623 homes, representing 7%
of its residential customers in Arkansas. This program performed very well in 2013 and accounted for
87% of OG&E’s residential portfolio energy savings.
OG&E’s added focus of a full-time employee working the Commercial & Industrial market assisted the
Commercial Lighting program to grow by over 230% from 2012.
The C&I Standard offer program grew by over 400% over 2012 with the use of additional crews
performing energy efficiency improvements along with direct installs.
WHAT’S WORKING, WHAT’S NOT:
The residential portfolio of EE programs is working well. OG&E is reached 107% of energy savings
targets within its budgets and has successfully enhanced operating procedures. The current EM&V
reports validate the impact and process success of OG&E’s residential programs.
The C&I portfolio of EE programs met 71% of the 2013 goals compared to only 33% of goals in 2012,
this is a significant increase in performance. OG&E’s marketing and sales efforts have begun to
effectively penetrate the C&I customer base.
The Commercial Lighting Program achieved 70% of goal in 2013, an 18% increase over 2012, and
continues to pick up momentum from lighting customers. The new Direct Install component of the C&I
programs has provided a major increase to savings for the 6 months that it has been implemented. Even
so, the C&I Standard Offer Program continues to struggle achieving only 35% of 2013 goal.
The Window AC Program is not working, although the savings was 127% of the 2013 goal it had a TRC
of only 0.33, which is too low to maintain.
PLANNED CHANGES:
On February 14, 2014, OG&E filed for interim modifications to the current portfolio and subsequently
received approval in case 07-075-TF order 55 approved on March 17, 2014. The changes include
APSC FILED Time: 4/1/2014 12:29:49 PM: Recvd 4/1/2014 11:59:47 AM: Docket 07-075-tf-Doc. 229

7
discontinuing three underperforming programs, adding one new residential program, increasing the
customer rebate for commercial programs, modifying the rebate structure and finally increasing
marketing efforts to reach more commercial and industrial customers. The programs that were
discontinued had not performed as well as expected in 2011, and 2012. OG&E plans to review the
discontinued programs to see if opportunities exist for reintroducing the programs in future portfolios
with modifications that improve consistency in their ability to be cost effective. The new residential
program is a multi-family direct install program designed to addresses a hard to reach customer segment.
For commercial and industrial programs the modification of customer rebates and increased marketing
efforts are expected to drive participation levels in those programs.
TRAINING ACHIEVEMENTS:
OG&E provided training to approximately 751 individuals in 2013. The training included
weatherization contractors and crews, hosting seminars to explain how the residential program works
and educating the commercial and industrial customers on the benefits of energy efficient lighting.
EM&V ACTIVITIES:
EnerNOC Utility Solutions was selected to perform the EM&V for all of the Energy Efficiency
programs in the portfolio except the AWP and the OGE/AOG Weatherization program. ADM
Associates, Inc. performs the EM&V for both the AWP and the OGE/AOG Weatherization Program.
Using the same contractor for both weatherization programs ensures consistency in evaluation. For PY
2013 both EM&V contractors performed process and impact evaluations of the programs delivering
measure by measure evaluated net savings. The three EM&V reports detail their finding and are in the
appendix of this annual report.
LONG-TERM ENERGY SAVINGS:
The current program portfolio was developed to meet the energy efficiency targets established by the
APSC in Order No.15 in Docket 08-137-U. The expected kW and kWh savings delivered by this
portfolio, estimated kW and kWh savings from future portfolios and the cumulative kW and kWh
savings from previous portfolios, are included in the Company’s Load forecast. The IRP incorporates
this information in its planning report.
Estimation of EE Resource Potential
EE OVERVIEW:
The following three tables provide an overview of the EE portfolio results for PY 2013:
Demand Energy
Actual
Expenses LCFC
Performance
Incentives
TRC
Net Benefits
TRC
Ratio
MW MWh
2.8 13,411 3,714,378$ 898,331$ $0 6,823$ 2.90
2013 Portfolio SummaryNet Energy Savings Cost Cost-Benefits
APSC FILED Time: 4/1/2014 12:29:49 PM: Recvd 4/1/2014 11:59:47 AM: Docket 07-075-tf-Doc. 229

8
Budget ActualProgram Name Target Sector Program Type ($) ($)
Custom Energy Report (Discontinued) Residential Behavior/Education - - -
Multi-Family (Discontinued) Residential Market Specific/Hard to Reach - - -
OG&E - AOG Weatherization Residential Whole Home 2,302,446 2,302,158 100%
Residential HVAC Tune-up & Duct Repair Residential Measure/Technology Focus 121,169 122,004 101%
Student Energy Education Residential Behavior/Education 76,298 73,907 97%
Window A/C Residential Market Specific/Hard to Reach 10,519 9,089 86%
C&I Standard Offer Commercial & Industrial Measure/Technology Focus 537,940 523,591 97%
Motors (Discontinued) Commercial & Industrial Measure/Technology Focus - - -
Commercial HVAC Tune-up Small Business/C&I Measure/Technology Focus 134,206 107,724 80%
Commercial Lighting Small Business/C&I Measure/Technology Focus 514,899 387,722 75%
Arkansas Weatherization Program (AWP) Residential Whole Home 85,730 38,714 45%
Energy Efficiency Arkansas (EEA) All Classes Behavior/Education 24,000 18,659 78%
Regulatory - - 130,809 130,809 100%
Total 3,938,015 3,714,378 94%
2013% of
RBudget
EE Portfolio Cost by Program
EE Program Cost Summary
% of Budget Actual % of
Cost Type Total ($) ($) Total
Planning / Design 0% 17,707 - 0%
Marketing & Delivery 5% 208,886 238,943 6%
Incentives / Direct Install Costs 81% 3,186,825 2,728,787 73%
EM&V 5% 200,000 151,082 4%
Administration 5% 193,789 464,757 13%
Regulatory 3% 130,809 130,809 4%
100% 3,938,015 3,714,378 100%
EE Portfolio Summary by Cost Type2013 Total Cost
Portfolio
Budget
(b)
% of
RevenuePortfolio
Spending
(c)
% of
RevenueNet Annual
Savings
(e)
% of
Energy
Sales
Net Annual
Savings
(f)
% of
Energy
Sales
($000's ) ($000's ) (%=b/a) ($000's ) (%=b/a) (MWh) (MWh) (%=b/a) (MWh) (%=b/a)
2009 140,287$ 421$ 0.3% 352$ 0.3% 2,558,917 3,971 0.2% 5,608 0.2%
2010 176,717$ 1,364$ 0.8% 1,305$ 0.7% 2,837,921 2,667 0.1% 4,143 0.1%
2011 180,406$ 2,680$ 1.5% 2,172$ 1.2% 2,802,634 6,991 0.2% 4,985 0.2%
2012 167,615$ 3,524$ 2.1% 3,149$ 1.9% 2,743,246 14,145 0.5% 7,596 0.3%
2013 179,047$ 3,938$ 2.2% 3,714$ 2.1% 2,710,927 20,848 0.8% 13,411 0.5%
Revenue and Expenses Energy
Company Statistics
Program
YearTotal Revenue
(a)
Budget Actual
Total Annual
Energy Sales
(d)
Plan Evaluated
APSC FILED Time: 4/1/2014 12:29:49 PM: Recvd 4/1/2014 11:59:47 AM: Docket 07-075-tf-Doc. 229

9
2.0 Portfolio Programs
APSC FILED Time: 4/1/2014 12:29:49 PM: Recvd 4/1/2014 11:59:47 AM: Docket 07-075-tf-Doc. 229

10
Program Overview
OG&E has developed energy efficiency programs to help customers manage their energy usage and to
reduce load during periods of high peak demand. The programs allow OG&E the ability to alleviate
potential power shortages and achieve energy savings by enabling customers to change their behavior,
attitudes, awareness and knowledge about energy savings and the use of energy efficient technologies.
By implementing energy efficiency programs, demand for electricity will decrease which in turn avoids
emissions that would otherwise be produced by increased power generation. Energy efficiency programs
have the potential to significantly reduce the effect power generation has on the environment by
reducing pollutants emitted during the process of generating electricity. These energy efficiency
programs decrease electric demand for generation which reduces emissions.
All customer classes may benefit from energy efficiency programs. Hard-to-reach residential customers
benefit by keeping more of their disposable income, maintaining the same quality of lifestyle and
adopting a more energy efficient philosophy. Energy efficiency programs lower operating costs and
enable the efficient use of energy throughout all customer classes. With lower operating costs and
enhanced productivity, Arkansas businesses remain competitive in the global economy and avoid the
outsourcing of jobs and services.
APSC FILED Time: 4/1/2014 12:29:49 PM: Recvd 4/1/2014 11:59:47 AM: Docket 07-075-tf-Doc. 229

11
2.1 OG&E Weatherization Program
2.1.1 Program Description Designed to target residential customers and allow them to participate in the program for free, this
program allows customers the opportunity to participate in managing their energy costs and begin
participating in the price response tariffs. The program targets all residential customers of single family
homes which were built before 1997, specifically those that are severely energy inefficient. The
program is designed to upgrade and improve the thermal envelope of the dwelling. Homes in all of the
OG&E service territory were targeted to participate by having an energy audit performed utilizing
blower door technology on the structure to capitalize on specific weatherization techniques.
OG&E serves more than 54,000 residential customers in Arkansas and has estimated there are as many
as 30,000 homes in need of weatherization improvements. OG&E views the Weatherization Program as
a key component in the EE area, and uses three independent contractors: DK Construction, based in Van
Buren (Crawford County), Total Home Efficiency, based in south Fort Smith (Sebastian County) and
Williams Energy Efficiency, based in Barling (East Sebastian County). The contractors received over
20 hours of training on weatherization techniques. Each contractor has certified Building Performance
Institute (“BPI”) and RESNET, HESP auditors on staff. OG&E personnel also conducted in-the-field
training throughout the course of the program which will continue throughout the remainder of the
existing program. Some of the cost effective and energy saving equipment that was installed in the
homes include: replacement of glass, and or windows, doors, ground cover for vapor barrier, compact
fluorescent lighting, return air cavity sealing, CO detectors, and smoke detectors. Utilizing blower door
technology the contractors were able to locate and seal larger areas of air infiltration on the homes.
Contractors are encouraged to attend and receive additional education on weatherization of homes, both
online and in classrooms, for improvement in proper home weatherization techniques. Additional
training is recommended for National Certifications for each of the contractors.
The partnership with Arkansas Oklahoma Gas Corporation (“AOG”) has proved to be successful in the
joint weatherization program. The ability to work together with other utilities is an ongoing effort to
combine resources as well as to reach out to more customers in our adjoining market place. OG&E and
AOG continued to work in an atmosphere of transparency with the existing contractors already in the
program while OG&E recruited an additional contractor to help relieve the stress of the summer time
heat for the existing contractors. OG&E and AOG, along with the efforts of Frontier Associates,
continue to fine tune the software package to meet the criteria of the TRM put in place by the Arkansas
Public Service Commission. The improvements were to help insure the software would capture more
accurate field data as well as a split payment process for each of the utilities to pay the individual
contractors assigned to the program. The contractors continued to weatherize homes even during
another hot summer allowing OG&E customers to receive the rewards and benefits of maintaining or
reducing their overall utility bills while increasing their comfort in the home.
APSC FILED Time: 4/1/2014 12:29:49 PM: Recvd 4/1/2014 11:59:47 AM: Docket 07-075-tf-Doc. 229

12
2.1.2 Program Highlights
Civic and community presentations highlighting the program were conducted throughout
each town served by OG&E promoting the Weatherization Program.
OG&E achieved 122% of planned energy savings.
OG&E weatherized 1,623 home in 2013 (100% of planned participation).
2.1.3 Program Budget, Savings and Number of Measures
2.1.4 Description of Participants
Participants of this program fall into two groups. The first group is customers that typically are
mature customer in the lower middle class. Participants live in older single family homes over 15
years of age. Many of these participants are either retired or near retirement and they own their
own home. They maintain a low-key lifestyle and typically do not have kids at home. These
customers are high school educated.
The second groups of customer are younger with kids and are in the lower middle class. These
families live in small cities and ethnically diverse parents working in entry level service jobs.
2.1.5 Challenges and Opportunities
Working in conjunction with the Community Clearinghouse, OG&E has been able to maintain a
steady pace in obtaining and qualifying customers’ homes in a timely manner for weatherization.
As OG&E evaluated the opportunity to complete the desired number of homes in this program,
the need was present to bring an additional contractor on in June 2012. With the assistance of
this contractor, OG&E was able to meet its goal on homes weatherized.
2.1.6 Planned or Proposed Changes to Program and Budget
This Comprehensive program ended on June 30, 2011 and a new Energy Efficiency Program
was approved on June 30, 2011 for the program years 2011-2013. The program was enhanced
Program Budget Actual % Plan Evaluated % Plan Evaluated % Plan Acutal %
Program Year 2011 1,964,321$ 1,645,000$ 84% 2,721,699 1,595,413 59% 642 544 85% 1,300 953 73%
Program Year 2012 2,296,960$ 2,296,935$ 100% 2,994,261 3,638,503 122% 516 1,006 195% 1,620 1,631 101%
Program Year 2013 2,302,198$ 2,302,158$ 100% 2,994,261 3,655,091 122% 516 1,040 202% 1,620 1,623 100%
OG&E AOG WeatherizationCost Energy Savings (kWh) ParticipantsDemand Savings (kW)
APSC FILED Time: 4/1/2014 12:29:49 PM: Recvd 4/1/2014 11:59:47 AM: Docket 07-075-tf-Doc. 229

13
to include duplexes, condos, rental property or any residential customer in the Arkansas
Territory. OG&E plans on exceeding the overall program goals for weatherization by
performing an additional 3240 homes by the end of the 2014.
APSC FILED Time: 4/1/2014 12:29:49 PM: Recvd 4/1/2014 11:59:47 AM: Docket 07-075-tf-Doc. 229

14
2.2 Student Energy Education Program (LivingWise® )
The program provides 6
th grade teachers and their students a curriculum on home energy
efficiency. At the end of the curriculum a LivingWise® education kit provides the students the
opportunity to participate with their families on energy awareness. LivingWise® education kit
contains a CFL, air filter alarm, aerator, low-flow shower head, LED night light, thermometer
and a student handbook on energy efficiency for the home and community. The students take
the LivingWise® kit home and install the energy efficiency measures with the assistance of their
parents.
OG&E agreed to provide a list of schools each semester to Resource Action Programs (RAP) for
potential participation in the LivingWise® Program. RAP contacts the school, enrolls the
teacher and quantifies the number of students. A list of enrolled schools and participation
information is sent to OG&E each month. There was an overwhelming consensus from all
participating teachers that it was an informative and easy curriculum and each teacher felt that
with the uncertain environmental and energy situation, the teaching materials were both timely
and important.
The selection process for LivingWise® begins with a list of potential elementary public schools
for 6th
grade classes that OG&E sends to LivingWise®. This is a turn-key program, where the
following services are performed by RAP:
o Contact the school
o Verify school address
o Speak with the teacher(s)
o Produce and mail the required number of kits for students and teachers
o Follow up with teachers on the class participation during the curriculum and then on the
activities provided in the kit for the students to take home and interact with their parents.
2.2.2 Program Highlights
The LivingWise® Program provided Energy Efficiency and Awareness training for 2,006
students from January 2013 through December 31, 2013, targeting 9 school districts in
Arkansas.
Created OG&E customized box to improve the generic look for the LivingWise® Kits.
OG&E utilized Community Coordinators along with key contact personnel for promotion of
the program.
A report is then submitted to OG&E at the end of each semester detailing the activity, the
results and the participation level and acceptance of the program.
OG&E has had a 100% return rate from teachers responding to the follow-up surveys.
APSC FILED Time: 4/1/2014 12:29:49 PM: Recvd 4/1/2014 11:59:47 AM: Docket 07-075-tf-Doc. 229

15
2.2.3 Program Budget, Savings and Participants
2.2.4 Description of Participants
This program focuses on 6th grade students in the public school system. Providing several small
self-installing energy efficiency products will allow both the student and the parents to have
energy efficiency conservations. This program provides energy efficiency education to the
future home owners so they will understand the impacts for energy conservation.
2.2.5 Challenges and Opportunities
OG&E’s success with this program has been through key contacts in each of the school districts.
Each of the participating schools within the OG&E territory have embraced the concept and
curriculum provided through Resource Actions.
2.2.6 Planned or Proposed Changes to Program and Budget
This Comprehensive program ended on June 30, 2011 and a new Energy Efficiency Program
was approved on June 30, 2011 for the program years 2011-2013. OG&E plans to continue its
support for the Student Energy Education Program.
Program Budget Actual % Plan Evaluated % Plan Evaluated % Plan Acutal %
Program Year 2011 87,963$ 74,373$ 85% 160,441 46,227 29% 15 4 26% 1,840 1,813 99%
Program Year 2012 87,508$ 82,273$ 94% 152,120 291,628 192% 15 36 237% 1,840 1,817 99%
Program Year 2013 76,298$ 73,907$ 97% 152,120 126,084 83% 15 15 99% 1,840 2,006 109%
Student Energy Education Cost Energy Savings (kWh) ParticipantsDemand Savings (kW)
APSC FILED Time: 4/1/2014 12:29:49 PM: Recvd 4/1/2014 11:59:47 AM: Docket 07-075-tf-Doc. 229

16
2.3 Commercial Lighting Program
2.3.1 Program Description
The purpose of the Commercial Lighting Program is to provide incentives to the OG&E Commercial
and Industrial customers during change outs. The program targets commercial, public authority and
industrial facilities of all sizes with a focus on the small to medium-sized facilities, where saturation
rates and awareness levels of high efficiency lighting are expected to be lower than in larger operations.
To encourage commercial customers to participate, incentives are offered for the following upgrades; T-
12 to T-8 or T-5 lamps, upgrading HID to high efficiency T-8, or T-5’s, installation of sensors, LED exit
lighting, incandescent lighting to CFL’s or the upgrade of parking lot lighting. The new program also
encourages new construction to upgrade their lighting utilizing the 2006 IECC code for standards and
guidelines. Incentives were based on lamp replacement or kW reduced on the structure.
The Energy Efficiency Lighting Program was designed to reach existing customers including large
school districts, commercial, and industrial complexes. OG&E personnel continued to recruit and
educate commercial customers on the advantages of upgrading their lighting systems, through
educational seminars and booth displays at local vendor open houses. OG&E personnel utilized many
different avenues and strategies to help entice customers to upgrade the lighting in each of the business
including working with lighting manufacture representatives, conducting walk through audits and
detailed audits.. The program is very well received with the incentives allowing for quicker payback on
the lighting and enhanced lighting levels in their facilities. More of the commercial customers took
advantage of the rebate while educating themselves on the benefits of more efficient lighting and
controls.
2.3.2 Program Highlights
Presentations were made at supply and distributor warehouses throughout the year.
Civic and community presentations highlighting the program were conducted throughout each
town served by OG&E promoting the lighting program.
Clearesults® Consulting was contracted in June to assist OG&E personnel in capturing lighting
opportunities with all classifications of C&I consumers.
APSC FILED Time: 4/1/2014 12:29:49 PM: Recvd 4/1/2014 11:59:47 AM: Docket 07-075-tf-Doc. 229

17
2.3.3 Program Budget, Savings and Participants
2.3.4 Description of Participants Participants in the program included all classifications of commercial and industrial customers.
2.3.5 Challenges and Opportunities
Notification of distributors and contractor on program advantages and opportunities.
Presentations to distributors and civic clubs.
DOE regulations.
2.3.6 Planned or Proposed Changes to Program and Budget
OG&E plans to spend the approved budgeted amount and does not anticipate any changes to the
goals or budget for 2013. OG&E has filed an amended program for 2014.
Program Budget Actual % Plan Evaluated % Plan Evaluated % Plan Acutal %
Program Year 2011 118,763$ 66,689$ 56% 1,797,729 1,531,936 85% 451 413 92% 35 24 69%
Program Year 2012 323,331$ 246,824$ 76% 5,238,456 2,725,963 52% 1,323 512 39% 125 66 53%
Program Year 2013 514,899$ 387,722$ 75% 9,010,145 6,325,111 70% 2,275 967 43% 215 186 87%
Commercial LightingCost Energy Savings (kWh) ParticipantsDemand Savings (kW)
APSC FILED Time: 4/1/2014 12:29:49 PM: Recvd 4/1/2014 11:59:47 AM: Docket 07-075-tf-Doc. 229

18
2.4 Energy Efficiency Education Program
2.4.1 Program Description:
The Energy Efficiency Education Program provides information to all customers, of all classes, allowing
them to make informed decisions about how they use energy and to look at alternatives to improve their
consumption, thereby decreasing demand and energy usage.
OG&E has continued its support of the EEA Comprehensive Plan through three components: 1)
Residential Education and Information Outreach; 2) Media Promotion; 3) Commercial and Industrial
Education and Outreach, provided by the Arkansas Energy Office.
The Arkansas Energy Office (“AEO”) administered the collaborative efforts of the Arkansas utilities
educational profile in training opportunities. The AEO also provided educational pamphlets, DVDs, and
training materials to homeowners throughout the OG&E service territory. Multiple classes were held
throughout the State of Arkansas on residential, commercial, and industrial energy efficient usage and
design. Area industry plant engineers as well as CEOs, CFOs, and purchasing agents were updated on
techniques of how to manage energy consumption in their plants. Courses on Refrigeration and
Compressed Air were held in the Fort Smith area to update individual businesses on energy efficiency
operations within the industrial segment.
2.4.2 Program Highlights:
The Arkansas Energy office provides various methods of reaching all classifications of OG&E
customers through radio, print, and seminars.
The Arkansas Energy office offered training through Arkansas Manufacturing Solutions
throughout the year in the OG&E territory.
Additional information is submitted by the Arkansas Energy Office annual report.
Comprehensive Program began February 3, 2010 and ended on June 30, 2011. The Energy
Efficiency Program began on July 1, 2011 and continues on through December 2013.
APSC FILED Time: 4/1/2014 12:29:49 PM: Recvd 4/1/2014 11:59:47 AM: Docket 07-075-tf-Doc. 229
19
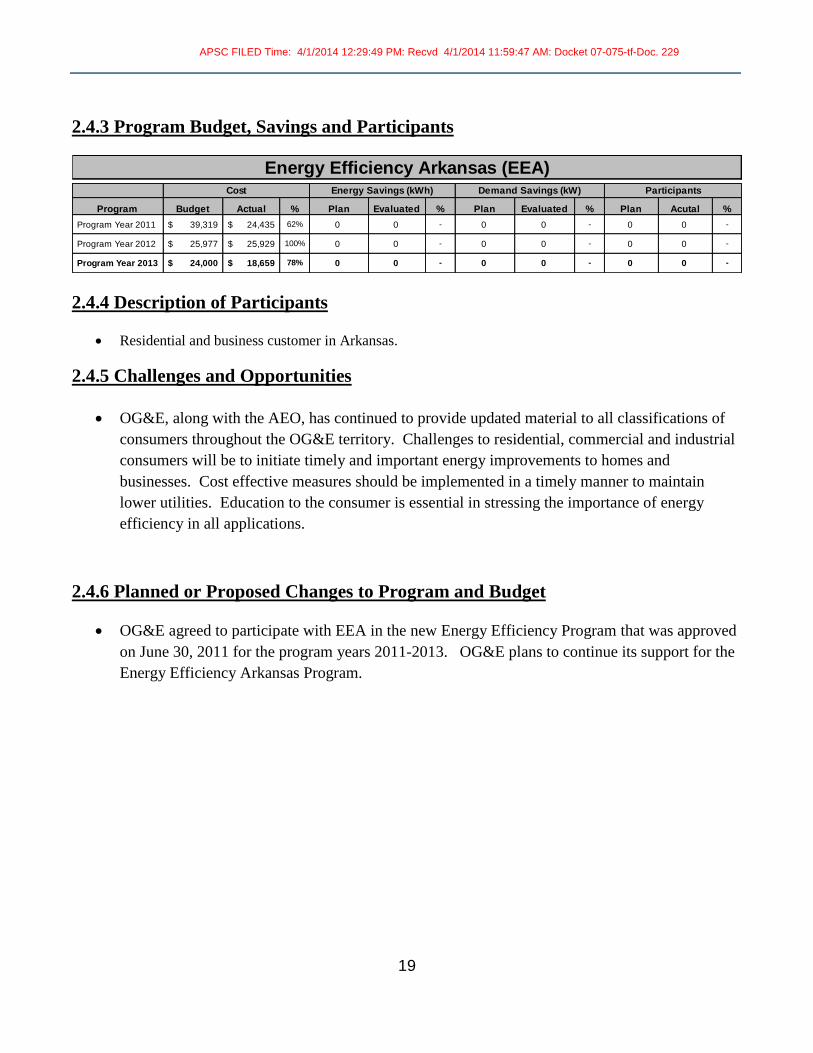
2.4.3 Program Budget, Savings and Participants
2.4.4 Description of Participants
Residential and business customer in Arkansas.
2.4.5 Challenges and Opportunities
OG&E, along with the AEO, has continued to provide updated material to all classifications of
consumers throughout the OG&E territory. Challenges to residential, commercial and industrial
consumers will be to initiate timely and important energy improvements to homes and
businesses. Cost effective measures should be implemented in a timely manner to maintain
lower utilities. Education to the consumer is essential in stressing the importance of energy
efficiency in all applications.
2.4.6 Planned or Proposed Changes to Program and Budget
OG&E agreed to participate with EEA in the new Energy Efficiency Program that was approved
on June 30, 2011 for the program years 2011-2013. OG&E plans to continue its support for the
Energy Efficiency Arkansas Program.
Program Budget Actual % Plan Evaluated % Plan Evaluated % Plan Acutal %
Program Year 2011 39,319$ 24,435$ 62% 0 0 - 0 0 - 0 0 -
Program Year 2012 25,977$ 25,929$ 100% 0 0 - 0 0 - 0 0 -
Program Year 2013 24,000$ 18,659$ 78% 0 0 - 0 0 - 0 0 -
Energy Efficiency Arkansas (EEA)Cost Energy Savings (kWh) ParticipantsDemand Savings (kW)
APSC FILED Time: 4/1/2014 12:29:49 PM: Recvd 4/1/2014 11:59:47 AM: Docket 07-075-tf-Doc. 229

20
2.5 HVAC Tune-Up and Duct Repair Program
2.5.1 Program Description The HVAC Tune-Up and Duct Repair program is a comprehensive long-term energy efficiency program
to reach customers who normally do not participate in annual services of an HVAC company. This
residential program is for customers who need assistance in improving the efficiency of their existing
HVAC equipment and/or assistance in sealing or repairing HVAC ductwork. This program helps the
customer realize the need of regular scheduled maintenance on their equipment. The program will allow
customers to maximize efficiency of existing equipment and increase the comfort in their home.
2.5.2 Program Highlights
The HVAC Tune-Up and Duct Repair program began with contractor meetings in March 2012,
with a total of 7 contractors and 49 technicians in attendance.
OG&E signed an agreement with 7 contractors to participate in the program.
OG&E promoted the program through civic presentations, direct mail pieces and the Fort Smith
Home Show as well as across the Fort Smith Territory.
Audits were performed in the field with the service technician at the customer’s residence.
With the help of 7 HVAC companies in Fort Smith and Van Buren, and with the OG&E
Weatherization crews; OG&E was able to complete 300 tune-ups which included 305 Duct &
Plenum seals on homes throughout the OG&E Arkansas territory.
2.5.3 Program Budget, Savings and Participants
2.5.4 Description of Participants
Many home owners’ financial resources are limited and homeowner choose lesser efficiency
options because of their lower initial costs than other energy cost options. Many homes built
before 2000, energy efficiency options were not installed or energy efficiency options were not
available. This program will allow customer to maximize efficiency of existing equipment.
Program Budget Actual % Plan Evaluated % Plan Evaluated % Plan Acutal %
Program Year 2011 35,443$ 11,442$ 32% 43,720 17,049 39% 29 9 29% 50 77 154%
Program Year 2012 147,471$ 147,271$ 100% 229,025 214,632 94% 155 97 63% 300 464 155%
Program Year 2013 121,169$ 122,004$ 101% 229,025 354,058 155% 155 130 84% 300 510 170%
Residential HVAC Tune-up & Duct RepairCost Energy Savings (kWh) ParticipantsDemand Savings (kW)
APSC FILED Time: 4/1/2014 12:29:49 PM: Recvd 4/1/2014 11:59:47 AM: Docket 07-075-tf-Doc. 229

21
Sample of Events:
Training was held with each contractor on expectations of the program.
Presentations were performed for local civic groups in various areas of the OG&E territory.
Name solicitations were also done by direct mail campaigns and during the Greater Fort Smith
Home Builders home show.
2.5.5 Challenges and Opportunities
Meeting with each technician on the program qualifications and expectations.
2.5.6 Planned or Proposed Changes to Program and Budget
This Energy Efficiency program will continue to be implemented through the budget years of
2012-2013.
APSC FILED Time: 4/1/2014 12:29:49 PM: Recvd 4/1/2014 11:59:47 AM: Docket 07-075-tf-Doc. 229

22
2.6 Window Unit A/C Program
2.6.1 Program Description
The objective of the Comprehensive Energy Efficient Window Unit A/C Program is to provide OG&E
single family residential customers without central HVAC systems incentives for purchasing and
installing high-efficiency window air conditioners. The program is designed to help increase energy
efficiency of window unit sales, while reducing energy consumption, lowering energy costs, and
increasing the comfort of the residential customers’ home with window units.
2.6.2 Program Highlights OG&E has partnered with a local family owned hardware store which has outlets in 4 major areas of the
Fort Smith service area, to help promote the program. Along with the local hardware stores, OG&E
partnered with Home Depot and LOWES to promote the program.
2.6.3 Program Budget, Savings and Participants
2.6.4 Description of Participants
Many home owners’ financial resources are limited and homeowners choose lesser efficient options
because of lower initial costs. In many homes built before 1997, energy efficiency options were not
installed over energy efficiency options was not available.
2.6.5 Challenges and Opportunities
This is a very limited market; OG&E estimates that only 700 homes are cooled with window units in the
Fort Smith area.
OG&E will continue to pursue additional avenues to help promote and meet target market areas for
window unit sales.
Consumers will continue to be educated on the benefits of high efficiency window units and encouraged
to participate in the program through civic presentations in 2013.
Program Budget Actual % Plan Evaluated % Plan Evaluated % Plan Acutal %
Program Year 2011 6,460$ 402$ 6% 1,260 206 16% 1 0 15% 13 1 8%
Program Year 2012 12,065$ 4,240$ 35% 2,423 2,161 89% 2 2 88% 25 30 120%
Program Year 2013 10,519$ 9,089$ 86% 2,423 3,075 127% 2 3 129% 25 30 120%
Window A/CCost Energy Savings (kWh) ParticipantsDemand Savings (kW)
APSC FILED Time: 4/1/2014 12:29:49 PM: Recvd 4/1/2014 11:59:47 AM: Docket 07-075-tf-Doc. 229

23
2.6.6 Planned or Proposed Changes to Program and Budget
No changes planned.
APSC FILED Time: 4/1/2014 12:29:49 PM: Recvd 4/1/2014 11:59:47 AM: Docket 07-075-tf-Doc. 229

24
2.7 Commercial Tune-Up Program
2.7.1 Program Description
This is a comprehensive long term energy efficiency program targeted to commercial and industrial
customers. The Commercial Tune-Up program will continue to offer financial incentives for air
conditioning, foodservice, refrigeration and/or ventilation systems upgrades in efficiency. The intent of
the program is to provide inducements for energy savings and peak demand reductions produced
through any measured, verified, and inspected efficiency improvements.
2.7.2 Program Highlights
The Commercial Tune-Up program was initiated with a contractor meeting on July 22, 2011
with 15 contractors in attendance.
Contractors have been slow to embrace the program.
OG&E continued to promote the program through civic presentations and customer calls across
the Fort Smith service area.
Rebate dollars have been adjusted downward with the new TRM standards.
CLearesults® Consulting were contracted in June 2013 to assist OG&E personnel in promoting
the Commercial Tune-Up program.
2.7.3 Program Budget, Savings and Number of Measures
2.7.4 Description of Participants Participants in the program were small to medium size C&I consumers. Actual participation was
upgrades in Energy Efficiency on HVAC equipment.
2.7.5 Challenges and Opportunities
Meeting with each technician and HVAC companies on the program qualifications and
expectations.
Program Budget Actual % Plan Evaluated % Plan Evaluated % Plan Acutal %
Program Year 2011 50,884$ 6,370$ 13% 227,991 20,845 9% 33 10 32% 3 2 67%
Program Year 2012 141,423$ 57,840$ 41% 759,969 26,059 3% 112 22 19% 10 11 110%
Program Year 2013 134,206$ 107,724$ 80% 759,969 356,827 47% 112 41 37% 10 159 1590%
Commercial HVAC Tune-upCost Energy Savings (kWh) ParticipantsDemand Savings (kW)
APSC FILED Time: 4/1/2014 12:29:49 PM: Recvd 4/1/2014 11:59:47 AM: Docket 07-075-tf-Doc. 229

25
Economic conditions in the Fort Smith market place have been slow to rebound; however, have
seemed to level off with unemployment numbers holding steady. Energy efficiency
improvements with many commercial customers have continued to be delayed with due to
tighter budgets from their corporate office.
2.7.6 Planned or Proposed Changes to Program and Budget
This Energy Efficiency program will continue to be implemented through the budget years of
2012-2013 with no changes to the format or additional budget. This program may be modified in
2014.
APSC FILED Time: 4/1/2014 12:29:49 PM: Recvd 4/1/2014 11:59:47 AM: Docket 07-075-tf-Doc. 229

26
2.8 Commercial/Industrial Standard Offer Program
2.8.1 Program Description This is a comprehensive long term energy efficiency program targeted to Commercial and Industrial
Power and Light rate customers. The program provides inducements for the energy savings and peak
demand reductions produced through energy efficiency improvements. This program provides
customized energy efficiency solutions to meet requirements unique to each facility. It has proven to be
successful in helping to not only manage but to assist in upgrading existing equipment to higher
efficiency. This program has an on-going opportunity to help industrial customers achieve higher
efficiency standards while providing incentives to help lower payback periods. OG&E personnel made
calls on individual industrial customers along with local Engineering firms to inform them of the new
TRM3 standards set by the Arkansas Public Service Commission.
2.8.2 Program Highlights
The Commercial/Industrial Standard Offer program was promoted through various functions to
Industrial customers throughout 2013.
Contractors, Public School Districts, and customers embraced the program with HVAC
equipment upgrades.
OG&E promoted the program through various civic presentations across the Fort Smith
Territory.
OG&E contracted with Clearesults® Consulting to assist OG&E personnel in the Commercial
and Industrial programs.
2.8.3 Program Budget, Savings and Participants
2.8.4 Description of Participants
Most of the participants were small to medium size C&I customers.
Program Budget Actual % Plan Evaluated % Plan Evaluated % Plan Acutal %
Program Year 2011 141,589$ 109,419$ 77% 1,688,328 1,080,273 64% 402 349 87% 5 6 120%
Program Year 2012 327,434$ 161,145$ 49% 4,246,188 619,897 15% 1,141 154 13% 12 22 183%
Program Year 2013 537,940$ 523,591$ 97% 7,177,710 2,535,967 35% 1,962 570 29% 18 2,469 #####
C&I Standard OfferCost Energy Savings (kWh) ParticipantsDemand Savings (kW)
APSC FILED Time: 4/1/2014 12:29:49 PM: Recvd 4/1/2014 11:59:47 AM: Docket 07-075-tf-Doc. 229

27
2.8.5 Challenges and Opportunities
Economic conditions in the Fort Smith market place have started to rebound slowly, along with
the unemployment rate leveling off; however, the energy efficiency improvements with many
industrial customers continue to move at a slow pace due to budget limitations.
Available dollars in O&M budgets for Industrial Plants.
Projects may take up to 18 months from start to finish.
2.8.6 Planned or Proposed Changes to Program and Budget
This Energy Efficiency program will continue to be implemented through the budget years of
2012-2013. Possible modifications to the program for 2014.
APSC FILED Time: 4/1/2014 12:29:49 PM: Recvd 4/1/2014 11:59:47 AM: Docket 07-075-tf-Doc. 229
28
2.9 Multi-Family Program
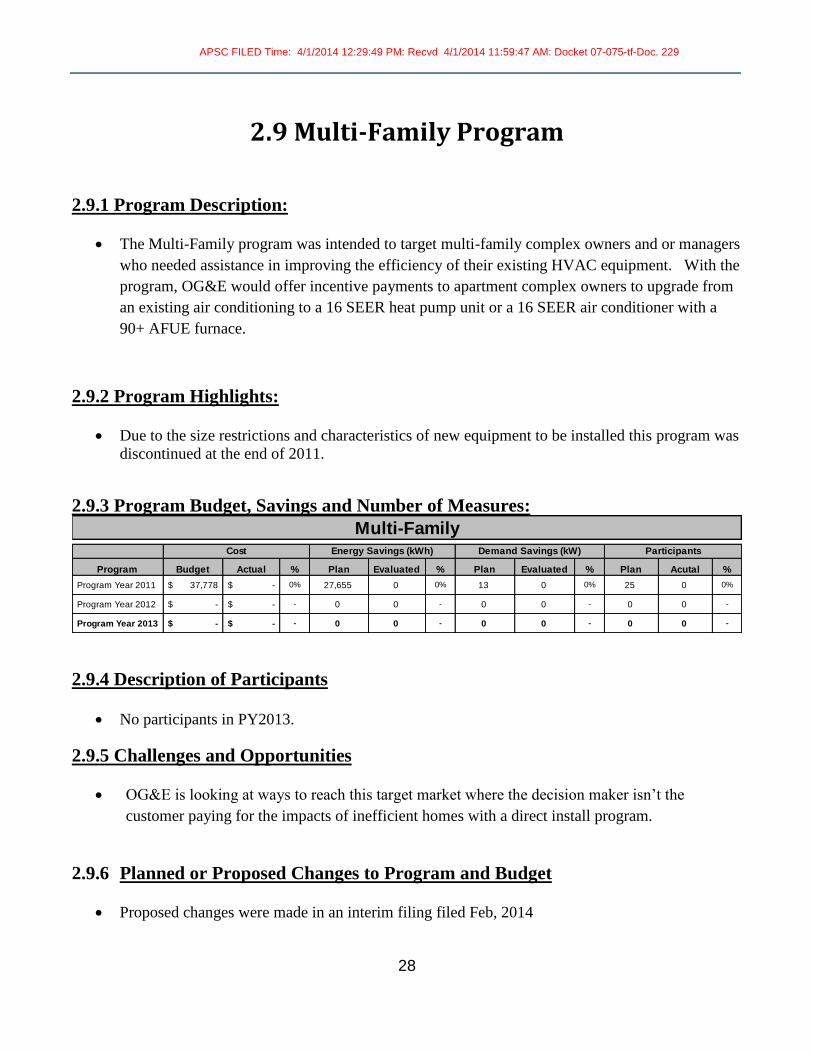
2.9.1 Program Description:
The Multi-Family program was intended to target multi-family complex owners and or managers
who needed assistance in improving the efficiency of their existing HVAC equipment. With the
program, OG&E would offer incentive payments to apartment complex owners to upgrade from
an existing air conditioning to a 16 SEER heat pump unit or a 16 SEER air conditioner with a
90+ AFUE furnace.
2.9.2 Program Highlights:
Due to the size restrictions and characteristics of new equipment to be installed this program was
discontinued at the end of 2011.
2.9.3 Program Budget, Savings and Number of Measures:
2.9.4 Description of Participants
No participants in PY2013.
2.9.5 Challenges and Opportunities
OG&E is looking at ways to reach this target market where the decision maker isn’t the
customer paying for the impacts of inefficient homes with a direct install program.
2.9.6 Planned or Proposed Changes to Program and Budget
Proposed changes were made in an interim filing filed Feb, 2014
Program Budget Actual % Plan Evaluated % Plan Evaluated % Plan Acutal %
Program Year 2011 37,778$ -$ 0% 27,655 0 0% 13 0 0% 25 0 0%
Program Year 2012 -$ -$ - 0 0 - 0 0 - 0 0 -
Program Year 2013 -$ -$ - 0 0 - 0 0 - 0 0 -
Multi-FamilyCost Energy Savings (kWh) ParticipantsDemand Savings (kW)
APSC FILED Time: 4/1/2014 12:29:49 PM: Recvd 4/1/2014 11:59:47 AM: Docket 07-075-tf-Doc. 229

29
2.10 Arkansas Weatherization Program (AWP)
2.10.1 Program Description
The Arkansas Weatherization Program was designed to promote energy efficiency in homes throughout
the Fort Smith service area. This Program is monitored by the Arkansas Community Action Agencies
Association. The Energy Efficiency Program is targeted to residential customers and allows the
customer to participate in programs to assist in managing energy costs and to begin to utilize price
response tariffs. This program focused on customers who owned their home and who have homes that
were severely energy inefficient. The program design is to upgrade and improve the thermal envelope of
the dwelling and the energy use of appliances.
OG&E continued their participation with the Arkansas Weatherization Program in conjunction with
other utilities across the state. The Central Arkansas Development Council has control of the
disbursement of funding for the collaborative. OG&E serves over 54,000 residential customers its
Arkansas service area Region and has estimated as many as 30,000 homes needs weatherization
improvements. It also estimates there are 10,000 severely energy inefficient homes in the service area.
OG&E views the Weatherization Program as a key component in the DSM area. Presentations on the
Weatherization Program were made to Civic and Senior Citizen Groups throughout the OG&E territory
to inform customers of the program. Agency contractor crews installed key weatherization components
in the homes to help upgrade the homes from energy inefficient to modern day standards. Some of the
components that were installed are as follows: ceiling insulation, caulking, insulating foam, weather
stripping, replacement of glass and, or windows, doors, ground cover, compact fluorescent lighting, duct
and plenum repair, return air cavity sealing, CO detectors, smoke detectors, HVAC tune-ups,
replacements, and indoor coil cleaning.
OG&E provided funding for the Arkansas Community Action Agency Associations to weatherize
severely energy inefficient homes in the Fort Smith service area. Working with the Crawford-Sebastian
Community Development Council, Inc., located in Fort Smith, and the Universal Housing Authority
based in Russellville, the AWP program weatherized 45 severely energy inefficient residential homes in
2012. Many of these homes also utilized DOE monies, as well as LIHEAP funding and additional
grants, for improvements to the home. Area counties served by the agencies are Crawford, Sebastian,
Franklin, Johnson, and Logan.
2.10.2 Program Highlights
Energy Efficiency Arkansas Weatherization Program was launched on July 1, 2011.
AWP weatherized 35 homes in 2013 at an average cost per home of $1,106.
Civic and community presentations on the program were conducted throughout each town served
by OG&E promoting the Arkansas Weatherization Program.
APSC FILED Time: 4/1/2014 12:29:49 PM: Recvd 4/1/2014 11:59:47 AM: Docket 07-075-tf-Doc. 229

30
The Arkansas Weatherization Program was administered through the Central Arkansas
Development Council.
The Crawford-Sebastian Community Development Council Inc., Universal Housing
Corporation, (Russellville based), performed audits and jobs in the OG&E District.
2.10.3 Program Budget, Savings and Participants
2.10.4 Description of Participants
This program looks for customer with inefficient homes and limited disposable income for
energy efficiency measures. Customer may qualify for federal funds based on low income.
2.10.5 Challenges & Opportunities
The ability to process lead generation in a timely manner continues to be a challenge in the
program.
Fluctuations in the funding process.
2.10.6 Planned or Proposed Changes to Program & Budget
This Comprehensive program ended on June 30, 2011 and a new Energy Efficiency Program
was approved on June 30, 2011 for the program years 2011-2013. OG&E plans to continue its
support for the Arkansas Weatherization Program.
Program Budget Actual % Plan Evaluated % Plan Evaluated % Plan Acutal %
Program Year 2011 114,582$ 130,358$ 114% 205,519 232,805 113% 27 115 425% 59 89 151%
Program Year 2012 86,988$ 66,767$ 77% 522,485 76,898 15% 69 12 17% 59 45 76%
Program Year 2013 85,730$ 38,714$ 45% 522,485 54,516 10% 69 31 46% 59 35 59%
Arkansas Weatherization Program (AWP)Cost Energy Savings (kWh) ParticipantsDemand Savings (kW)
APSC FILED Time: 4/1/2014 12:29:49 PM: Recvd 4/1/2014 11:59:47 AM: Docket 07-075-tf-Doc. 229
31
3.0 Supplemental Requirements
APSC FILED Time: 4/1/2014 12:29:49 PM: Recvd 4/1/2014 11:59:47 AM: Docket 07-075-tf-Doc. 229

32
3.1 Staffing
OG&E has 2 FTE’s working full time managing the programs and an EM&V Specialist and Clerical
Support making up the remaining .75 FTE. EM&V Specialist and Clerical Support also have additional
responsibilities in Oklahoma Programs.
New staffing in 2014 will include one additional supervisor in the Arkansas area that is currently in rate
base. Having a local working supervisor with relationships with the large commercial and industrial
customers is expected to offer additional opportunities for the EE programs along with local supervision
that will assist in the delivery of the programs by the program managers
3.2 Stakeholders Activities Training classes fall into three categories: first, training for trade allies who are working with OG&E on
the implementation of the program. Their purpose is to educate the installers of the components and
operations of the program. Second, classes for customers will provide information on both OG&E’s
program and how energy efficiency products can assist their facility in being more energy wise. Third,
classes were held to train OG&E members, installers and customers on the technical issues to improve
energy efficiencies for customers.
Please see training activity included in annual workbook tables.
ProgramsBack Office Support
(hours per week)
Program
Management
(hours per week)
Sales
(hours per week)
Hours per week to
manage ProgramsFTE
Weatherization 5 35 40 1
HVAC Tune-Up and Duct Repair 1 3 6 10 0.25
Window Unit A/C 0.25 3.25 3.5 7 0.175
Commercial Lighting 5 10 5 20 0.5
Commercial Tune-Up 3 4 8 15 0.375
C&I Standard Offer 3 4 8 15 0.375
Student Energy Education 0.5 2.5 3 0.075
Totals 17.75 61.75 30.5 110 2.75
APSC FILED Time: 4/1/2014 12:29:49 PM: Recvd 4/1/2014 11:59:47 AM: Docket 07-075-tf-Doc. 229

33
3.3 Information provided to Customer to Promote EE Please see Section 5.0 Appendix X for samples of educational materials and information used in the program year.
APSC FILED Time: 4/1/2014 12:29:49 PM: Recvd 4/1/2014 11:59:47 AM: Docket 07-075-tf-Doc. 229

34
4.0 Appendix A: EM&V Contractor
Report
Attach as an appendix, any materials or documentation which is deemed useful in explaining or
clarifying the results or performance of any program conducted during the program year. At minimum,
the appendix should include any study or research relied upon in the delivery or EM&V of any program
conducted during the program year. If any such items include confidential information shall be
redacted in the public version of the document.
APSC FILED Time: 4/1/2014 12:29:49 PM: Recvd 4/1/2014 11:59:47 AM: Docket 07-075-tf-Doc. 229
35
EM&V Contractor Report
OG&E has three different EM&V Reports associated with evaluated savings for PY2012. ADM &
Associates provided Results for both the AWP Program and OG&E’s Weatherization Program while
EnerNOC provided results for the remaining programs. OG&E is attaching each of these reports as
provided to OG&E in the attached exhibits.
Attachments:
Attachment B) contains Frontier’s Cost Effective Analysis
Attachment C) contains ADM’s evaluation for the AWP Program.
Attachment D) contains ADM’s evaluation of OG&E/AOG’s Weatherization Program.
Attachment E) contains EnerNOC’s evaluation of the remaining programs.
Attachment F) contains Energy Efficiency Arkansas (Collaborative)
APSC FILED Time: 4/1/2014 12:29:49 PM: Recvd 4/1/2014 11:59:47 AM: Docket 07-075-tf-Doc. 229

36
5.0 Appendix X
APSC FILED Time: 4/1/2014 12:29:49 PM: Recvd 4/1/2014 11:59:47 AM: Docket 07-075-tf-Doc. 229

5.0 Appendix X:
APSC FILED Time: 4/1/2014 12:29:49 PM: Recvd 4/1/2014 11:59:47 AM: Docket 07-075-tf-Doc. 229

LivingWise® Kit
APSC FILED Time: 4/1/2014 12:29:49 PM: Recvd 4/1/2014 11:59:47 AM: Docket 07-075-tf-Doc. 229

Living Wise Education Materials
APSC FILED Time: 4/1/2014 12:29:49 PM: Recvd 4/1/2014 11:59:47 AM: Docket 07-075-tf-Doc. 229

Weatherization Program Energy Savings Tips
APSC FILED Time: 4/1/2014 12:29:49 PM: Recvd 4/1/2014 11:59:47 AM: Docket 07-075-tf-Doc. 229

Weatherization Flyer
APSC FILED Time: 4/1/2014 12:29:49 PM: Recvd 4/1/2014 11:59:47 AM: Docket 07-075-tf-Doc. 229

APSC FILED Time: 4/1/2014 12:29:49 PM: Recvd 4/1/2014 11:59:47 AM: Docket 07-075-tf-Doc. 229

Window Unit A/C Program Energy Tips For Window AC
Rebate Flyer
APSC FILED Time: 4/1/2014 12:29:49 PM: Recvd 4/1/2014 11:59:47 AM: Docket 07-075-tf-Doc. 229

Geothermal Program Geothermal information on Web
APSC FILED Time: 4/1/2014 12:29:49 PM: Recvd 4/1/2014 11:59:47 AM: Docket 07-075-tf-Doc. 229

Positive Energy Home
Web Information
APSC FILED Time: 4/1/2014 12:29:49 PM: Recvd 4/1/2014 11:59:47 AM: Docket 07-075-tf-Doc. 229

Commercial Lighting
Retrofit Information Sheet
APSC FILED Time: 4/1/2014 12:29:49 PM: Recvd 4/1/2014 11:59:47 AM: Docket 07-075-tf-Doc. 229

APSC FILED Time: 4/1/2014 12:29:49 PM: Recvd 4/1/2014 11:59:47 AM: Docket 07-075-tf-Doc. 229

APSC FILED Time: 4/1/2014 12:29:49 PM: Recvd 4/1/2014 11:59:47 AM: Docket 07-075-tf-Doc. 229

APSC FILED Time: 4/1/2014 12:29:49 PM: Recvd 4/1/2014 11:59:47 AM: Docket 07-075-tf-Doc. 229

Commercial Tune Up Program Contractor Information Sheet
APSC FILED Time: 4/1/2014 12:29:49 PM: Recvd 4/1/2014 11:59:47 AM: Docket 07-075-tf-Doc. 229

C&I Standard Offer Program Web Information
APSC FILED Time: 4/1/2014 12:29:49 PM: Recvd 4/1/2014 11:59:47 AM: Docket 07-075-tf-Doc. 229

APSC FILED Time: 4/1/2014 12:29:49 PM: Recvd 4/1/2014 11:59:47 AM: Docket 07-075-tf-Doc. 229

APSC FILED Time: 4/1/2014 12:29:49 PM: Recvd 4/1/2014 11:59:47 AM: Docket 07-075-tf-Doc. 229

HVAC Tune Up and Duct Repair Customer Postcard
Contractor Recruitment Information
APSC FILED Time: 4/1/2014 12:29:49 PM: Recvd 4/1/2014 11:59:47 AM: Docket 07-075-tf-Doc. 229

APSC FILED Time: 4/1/2014 12:29:49 PM: Recvd 4/1/2014 11:59:47 AM: Docket 07-075-tf-Doc. 229

5.0 Attachment B
APSC FILED Time: 4/1/2014 12:29:49 PM: Recvd 4/1/2014 11:59:47 AM: Docket 07-075-tf-Doc. 229

Annual Report of Energy Efficiency Programs – Program Year 2013
March 2014
Evaluation Conducted by: Frontier Associates
APSC FILED Time: 4/1/2014 12:29:49 PM: Recvd 4/1/2014 11:59:47 AM: Docket 07-075-tf-Doc. 229

Table of Contents
TABLE OF CONTENTS ..................................................................................... 2
INTRODUCTION ............................................................................................. 3
REPORT ORGANIZATION .................................................................................. 3
PROGRAM DESCRIPTIONS ............................................................................................................................ 3
PROGRAM PROJECTIONS AND RESULTS .......................................................................................................... 5
PROGRAM-RELATED EXPENDITURES ............................................................................................................ 11
APSC FILED Time: 4/1/2014 12:29:49 PM: Recvd 4/1/2014 11:59:47 AM: Docket 07-075-tf-Doc. 229

3 OG&E Arkansas Energy Efficiency Report Program Year 2013
Introduction
Oklahoma Gas & Electric’s Arkansas Energy Efficiency portfolio was approved by the Arkansas Public
Service Commission (APSC) for program year 2013 on December 30, 2011 in Docket Number 07-075-TF,
Order Number 34. As required by the Conservation and Energy Efficiency Rules, OG&E is submitting its
annual report addressing the performance of all approved energy efficiency programs. This report covers
program savings and the amount spent per program and total amount spent. It also includes a cost-
effectiveness analysis of each program and the portfolio of programs, including all costs and benefits
from January 1, 2013 through December 31, 2013.
Report Organization
This report presents the following information, which is based on the Commission’s Energy Efficiency
Rule, but also includes the results of California Standard Practice Manual cost-benefit tests:
1. Brief description of each program;
2. The most current information available comparing projected savings to reported savings for each
of the utility's programs;
3. The results of the standard cost/benefit tests for each program;
4. A statement of funds expended by the utility for program administration.
Program Descriptions
Student Energy Education (SEE):
The Student Energy Education program is an established residential energy efficiency program that uses
a school delivery format, in which students are provided with take-home kits containing efficiency devices
and are exposed to creative classroom and in-home education techniques which inspire families to adopt
new resource usage habits. Students receive a kit of energy and water efficient devices, which are taken
home and installed, and the learning experience is shared with family members. They work on subjects
required by state learning standards to understand and appreciate the value of natural resources in
everyday life. The program aims to shape new behaviors and encourage reduced energy use through a
mix of new product installation and resource efficiency knowledge.
In OG&E’S Arkansas service territory, the program provides the teachers and their classes of 6th grade
students a curriculum on home energy efficiency. At the end of the curriculum a SEE education kit,
(which includes a CFL, air filter, aerator, low-flow shower head, night light and energy efficiency
information), provides the students the opportunity to participate with their families on energy
APSC FILED Time: 4/1/2014 12:29:49 PM: Recvd 4/1/2014 11:59:47 AM: Docket 07-075-tf-Doc. 229

4 OG&E Arkansas Energy Efficiency Report Program Year 2013
awareness. The students take the kit home and install the energy efficiency measures with the assistance
of their parents.
SEE is a turnkey program managed by Resource Action Programs (RAP) of Modesto, California. In
coordination with OG&E, Resource Action Programs performs the marketing and outreach to acquire
participation and enrollment in the program. Once schools are enrolled into the program, Resource
Action Programs will deliver educational materials directly to participant teachers.
Arkansas Weatherization Program (AWP):
This program is targeted to severely energy inefficient homes. It provides energy efficiency
improvements to participants, thereby decreasing demand and energy usage for those customers. The
purpose of the AWP is to improve comfort and reduce energy costs by upgrading the thermal envelope
and appliances in severely energy inefficient homes. The AWP program is designed to work in partnership
with agencies that assist residents occupying severely energy inefficient homes. OG&E partners with the
Fort Smith Community Clearing House and other CAP Agencies in Fort Smith, Arkansas. The program
helps individuals and families primarily by making their homes more secure from the weather, which
helps to conserve energy and reduce energy bills for future years. In addition, homes that are warm in
the winter and cool in the summer are more comfortable for individuals.
OG&E Weatherization Program:
This measure is targeted to acutely energy inefficient homes. It provides energy efficiency improvements
to participants, thereby decreasing demand and energy usage for those customers. The purpose of
OG&E’s Weatherization Program is to improve comfort and reduce energy costs by upgrading the thermal
envelope and appliances in targeted households.
This program is delivered in association with the Ft. Smith region gas distribution company, Arkansas
Oklahoma Gas (AOG). AOG is contributing resources to be used alongside OG&E’s on a per household
basis to ensure the most effective application of energy efficiency possible.
HVAC Tune-Up and Duct Repair Program:
This is an optional program offered by OG&E Arkansas, designed to help them reach the energy savings
goals outlined in the Order. The program is targeted toward single family residential customers with
central HVAC systems, and works towards improving the efficiency of these units. For both the HVAC
tune-up portion and the duct repair portion of this program, the customer must contract for air
conditioning tune-up and inspection services from an OG&E approved local, certified, and licensed HVAC
contractor.
Window Unit A/C Program:
The purpose of the Window Unit A/C Program is to provide OG&E single family residential customers
without central HVAC systems incentives for purchasing and installing high-efficiency air conditioners. The
program is designed to increase energy efficiency of window unit sales, while is reducing energy
consumption, lowering energy costs, and increasing the comfort of residential customers that cool part or
all or their home with window units. This program is available to any residential customer without a
central HVAC system.
APSC FILED Time: 4/1/2014 12:29:49 PM: Recvd 4/1/2014 11:59:47 AM: Docket 07-075-tf-Doc. 229

5 OG&E Arkansas Energy Efficiency Report Program Year 2013
Commercial Lighting Program:
The Commercial Lighting Program provides prescriptive rebates for customers that improve the efficiency
of lighting systems in existing buildings. This measure is designed to educate, offer performance
contracting services, and provide incentives on replacement of inefficient T-12 or T-8 lamps with higher
efficiency T-8 or T-5 lamps to commercial and industrial customers. It also promotes replacing less
efficient high intensity discharge (HID) lighting with high-bay and low-bay fluorescent lamps, replacing
inefficient incandescent lighting with hardwired CFLs, and replacing incandescent exit lighting with LED
exit lighting.
Additionally, this program provides incentives to OG&E construction commercial and industrial (C & I)
customers who purchase and install energy efficient indoor and outdoor lighting, lighting controls,
occupancy sensors, light emitting diode (LED), and exit lights. The measure offers incentives based on
the kW and kWh reduction calculated from a lighting survey by a lighting contractor that takes into
account the type and quantity of lighting fixtures installed, the building type, and control technologies in
place.
Commercial and Industrial Standard Offer Program (SOP):
The SOP offers financial incentives for the installation of a wide range of measures that reduce customer
energy costs, reduce peak demand, and/or save energy in non-residential facilities such as public
authority buildings, schools, hospitals, and other industrial customers in OG&E’s Arkansas jurisdiction
(entities that qualify for the Power and Light rate or the Large power and Light rate). In this program,
large individual customers, energy service companies (ESCOs), and qualified contractors are eligible for
incentive payments for energy efficiency projects that significantly reduce customer peak demand. The
applying entity, whether the customer, ESCO, or other contractor, is a “Project Sponsor,” and is the
responsible party for complying with all program requirements.
The SOP allows for incentivizing of many measures not covered under other OG&E programs. If the
Commercial/Industrial customer participates in this program then they are not eligible to participate in
the Commercial Lighting Program.
Commercial Tune-Up Program:
The program is designed to help customers by improving the efficiency of their Commercial Air
Conditioning, Food Service, Refrigeration and/or Ventilation systems to upgrade in efficiency or tune-up
of Commercial Air Conditioning. Commercial Tune-Up Program will target commercial, public authority
and industrial facilities of all sizes for efficiency information and upgrades. OG&E will pay an incentive for
Commercial Air Conditioning, Foodservice, Refrigeration and/or Ventilation systems to upgrades in
efficiency. OG&E will also pay to tune-up the Commercial Air Conditioning systems.
Program Projections and Results
The following tables present program specific information, including forecasted savings, reported savings,
the number of participants, participant costs, the economic benefit realized in 2013, and the economic
benefits to be expected over the life of the measures. Note that economic benefits are restricted to
avoided electricity generation and capacity costs and avoided natural gas costs.
Note also the important distinction between the “Forecasted Net Savings” displayed in this section and
the “Ex Ante” savings stated as “Actual Net Savings”. The “Forecasted Net Savings” are the net savings
APSC FILED Time: 4/1/2014 12:29:49 PM: Recvd 4/1/2014 11:59:47 AM: Docket 07-075-tf-Doc. 229

6 OG&E Arkansas Energy Efficiency Report Program Year 2013
included in OG&E’s Arkansas Energy Efficiency Program Analysis and Plan, filed in Docket No. 07-075-TF
(William L. Brooks’ testimony, Exhibit WLB-01, No. 123), which were based on projections of program
participation. The “Ex Ante” savings reflect the savings calculated using actual participation data and the
deemed savings used to develop the forecasted savings and in continuous tracking of program savings.
Assumptions related to measure costs, energy and demand savings used to calculate projected impacts,
discount rates, line losses, fuel costs and other inputs in the cost-benefit calculation can be found in the
exhibit accompanying Brooks’ testimony. The modeling of the Forecasted Net Savings and Project Net
Savings are based on the following assumptions:
(a) Forecasted savings are based on the target participation levels for program year 2013 as
approved by the APSC in Order 34 of Docket No. 07-075-TF. (b) Program participants are those who participated in the program year 2013.
(c) The cost per kWh saved is calculated by dividing the total program costs by the lifetime energy saved. The cost per kW-year is calculated by dividing the total program costs by the
product of the kW reduction and the approximate average effective useful life (EUL) of measures installed in the program.
(d) The net present value of the total economic benefits was calculated by taking the discounted
value of the annual avoided cost times the annual savings over the useful life of each program measure.
(e) The Projected Net Savings for residential programs assume an energy rate based on Rate Arkansas Rate Tariff R-1. Commercial energy rates are assumed to be $.09/kWh for all
seasons. Commercial load rates are accounted for in this assumption. The energy rates’
escalation rates are derived from the avoided costs.
Considerations
The cost-effectiveness results of OG&E Arkansas’ 2013 energy efficiency program should be evaluated with the following considerations:
OG&E Arkansas’ avoided costs show a new cost of capacity appearing in 2020. This additional cost of capacity is not reflected in the retail rates provided for this cost-effectiveness evaluation. Because this new avoided cost of capacity in 2020 is not included in the customer retail rates, the Ratepayer Impact Measure (“RIM”) passes 1.0 for two programs, the Arkansas Weatherization Program (AWP) and the Residential HVAC and Duct Repair Program. The AWP, emphasizing annual energy savings, should not pass the RIM. Residential HVAC and Duct Repair Program measures would have a less, although still, negative RIM net benefit, with net benefits improving as the percentage of electric AC with gas heat homes increases. Frontier recommends developing rate forecasts that more accurately reflect changes in avoided costs over time, or to reduce the period included in the RIM analysis to no more than five years, or the soonest expected rate change.
Not all incentive costs ended up as direct payment to customers. These incentive costs contribute to the exaggerated Participant Test (“PT”) results for the Commercial SOP. In future cost-effectiveness analyses, OG&E Arkansas may want to consider alternative methods for handling these non-direct payment incentives in the cost-effectiveness analysis.
Detailed information on measure type and measure costs was not available for some measures within this analysis. For these measures, incremental cost estimates were made using high-level assumptions about the most common measure installations in the OG&E Arkansas service territory. To refine the incremental cost data for future analyses, OG&E Arkansas may want to consider capturing more detailed information about the baseline and change case equipment and measure costs.
APSC FILED Time: 4/1/2014 12:29:49 PM: Recvd 4/1/2014 11:59:47 AM: Docket 07-075-tf-Doc. 229
7 OG&E Arkansas Energy Efficiency Report Program Year 2013
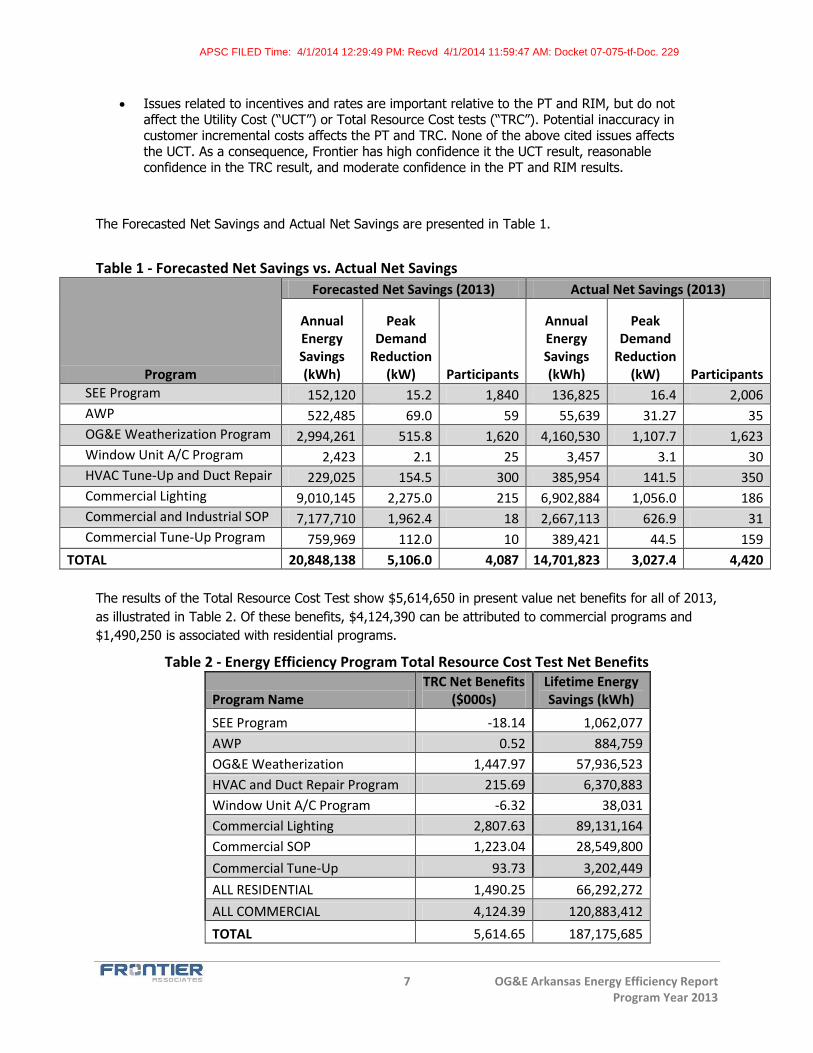
Issues related to incentives and rates are important relative to the PT and RIM, but do not affect the Utility Cost (“UCT”) or Total Resource Cost tests (“TRC”). Potential inaccuracy in customer incremental costs affects the PT and TRC. None of the above cited issues affects the UCT. As a consequence, Frontier has high confidence it the UCT result, reasonable confidence in the TRC result, and moderate confidence in the PT and RIM results.
The Forecasted Net Savings and Actual Net Savings are presented in Table 1.
Table 1 - Forecasted Net Savings vs. Actual Net Savings
Program
Forecasted Net Savings (2013) Actual Net Savings (2013)
Annual Energy Savings (kWh)
Peak Demand
Reduction (kW) Participants
Annual Energy Savings (kWh)
Peak Demand
Reduction (kW) Participants
SEE Program 152,120 15.2 1,840 136,825 16.4 2,006 AWP 522,485 69.0 59 55,639 31.27 35 OG&E Weatherization Program 2,994,261 515.8 1,620 4,160,530 1,107.7 1,623 Window Unit A/C Program 2,423 2.1 25 3,457 3.1 30 HVAC Tune-Up and Duct Repair 229,025 154.5 300 385,954 141.5 350 Commercial Lighting 9,010,145 2,275.0 215 6,902,884 1,056.0 186 Commercial and Industrial SOP 7,177,710 1,962.4 18 2,667,113 626.9 31 Commercial Tune-Up Program 759,969 112.0 10 389,421 44.5 159
TOTAL 20,848,138 5,106.0 4,087 14,701,823 3,027.4 4,420
The results of the Total Resource Cost Test show $5,614,650 in present value net benefits for all of 2013,
as illustrated in Table 2. Of these benefits, $4,124,390 can be attributed to commercial programs and
$1,490,250 is associated with residential programs.
Table 2 - Energy Efficiency Program Total Resource Cost Test Net Benefits
Program Name TRC Net Benefits
($000s) Lifetime Energy Savings (kWh)
SEE Program -18.14 1,062,077
AWP 0.52 884,759
OG&E Weatherization 1,447.97 57,936,523
HVAC and Duct Repair Program 215.69 6,370,883
Window Unit A/C Program -6.32 38,031
Commercial Lighting 2,807.63 89,131,164
Commercial SOP 1,223.04 28,549,800
Commercial Tune-Up 93.73 3,202,449
ALL RESIDENTIAL 1,490.25 66,292,272
ALL COMMERCIAL 4,124.39 120,883,412
TOTAL 5,614.65 187,175,685
APSC FILED Time: 4/1/2014 12:29:49 PM: Recvd 4/1/2014 11:59:47 AM: Docket 07-075-tf-Doc. 229

8 OG&E Arkansas Energy Efficiency Report Program Year 2013
Table 3 shows the cumulative results of OG&E’s residential energy efficiency programs cost-effectiveness
portfolio. The five cost tests deliver a snapshot of the general benefit of the residential energy efficiency
programs. The TRC, being above 1, indicates that the residential programs produce an aggregate
benefit.
Table 3 - ALL Residential Cost/Benefit Tests
PCT UCT RIM TRC SCT
Benefit/Cost Ratio 2.25 1.39 0.80 1.53 1.55
Net Benefits ($000s) 2,793.27 1,062.17 -925.60 1,490.25 1,564.19
Total Benefits ($000s) 5,024.03 3,757.52 3,757.52 4,325.25 4,399.18
Total Costs ($000s) 2,230.75 2,695.35 4,683.12 2,835.00 2,835.00
Tables 4 through 8 individually show the results of OG&E’s residential energy efficiency programs cost-
effective portfolio.
Table 4 – SEE Program Cost/Benefit Tests
PCT UCT RIM TRC SCT
Benefit/Cost Ratio 1.91 0.58 0.41 0.71 0.73
Net Benefits ($000s) 59.58 -30.89 -61.58 -18.14 -16.73
Total Benefits ($000s) 125.32 43.01 43.01 44.59 46.00
Total Costs ($000s) 65.75 73.91 104.60 62.73 62.73
Table 5 - AWP Cost/Benefit Tests
PCT UCT RIM TRC SCT
Benefit/Cost Ratio 0.93 1.72 1.08 1.01 1.02
Net Benefits ($000s) -2.42 28.04 5.04 0.52 1.48
Total Benefits ($000s) 31.58 66.75 66.75 73.23 74.19
Total Costs ($000s) 34.00 38.71 61.71 72.71 72.71
APSC FILED Time: 4/1/2014 12:29:49 PM: Recvd 4/1/2014 11:59:47 AM: Docket 07-075-tf-Doc. 229

9 OG&E Arkansas Energy Efficiency Report Program Year 2013
Table 6 – OG&E Weatherization Program Cost/Benefit Tests
PCT UCT RIM TRC SCT
Benefit/Cost Ratio 2.30 1.42 0.81 1.62 1.65
Net Benefits ($000s) 2,538.94 960.15 -767.68 1,447.97 1,512.52
Total Benefits ($000s) 4,499.40 3,262.32 3,262.32 3,789.34 3,853.89
Total Costs ($000s) 1,960.47 2,302.17 4,030.00 2,341.37 2,341.37
Table 7 – HVAC Tune-Up and Duct Repair Program Cost/Benefit Tests
PCT UCT RIM TRC SCT
Benefit/Cost Ratio 2.17 3.14 1.17 2.08 2.12
Net Benefits ($000s) 195.38 260.49 56.15 215.69 222.65
Total Benefits ($000s) 362.02 382.50 382.50 414.98 421.94
Total Costs ($000s) 166.64 122.00 326.35 199.29 199.29
Table 8 – Window Unit A/C Program Cost/Benefit Tests
PCT UCT RIM TRC SCT
Benefit/Cost Ratio 1.46 0.32 0.27 0.33 0.33
Net Benefits ($000s) 1.80 -6.15 -8.02 -6.32 -6.27
Total Benefits ($000s) 5.70 2.94 2.94 3.11 3.16
Total Costs ($000s) 3.90 9.09 10.95 9.43 9.43
Table 9 shows the cumulative results of OG&E’s commercial energy efficiency programs cost-
effectiveness portfolio. Tables 10-12 individually show the results of OG&E’s commercial energy efficiency
programs cost-effective portfolio. All Commercial Programs pass the Total Resource Cost Test.
Table 9 - All Commercial Cost/Benefit Tests
PCT UCT RIM TRC SCT
Benefit/Cost Ratio 4.83 5.61 0.84 3.13 3.20
Net Benefits ($000s) 6,557.73 4,693.01 -1,124.30 4,124.39 4,269.12
Total Benefits ($000s) 8,269.22 5,712.05 5,712.05 6,062.95 6,207.68
Total Costs ($000s) 1,711.49 1,019.04 6,836.35 1,938.56 1,938.56
APSC FILED Time: 4/1/2014 12:29:49 PM: Recvd 4/1/2014 11:59:47 AM: Docket 07-075-tf-Doc. 229

10 OG&E Arkansas Energy Efficiency Report Program Year 2013
Table 10 - Commercial Lighting Cost/Benefit Tests
PCT UCT RIM TRC SCT
Benefit/Cost Ratio 3.68 10.72 0.89 2.74 2.81
Net Benefits ($000s) 4,319.58 3,766.78 -500.37 2,807.63 2,913.20
Total Benefits ($000s) 5,931.54 4,154.51 4,154.51 4,417.33 4,522.90
Total Costs ($000s) 1,611.95 387.72 4,654.88 1,609.71 1,609.71
Table 11 – Commercial and Industrial Standard Offer Program Cost/Benefit Tests
PCT UCT RIM TRC SCT
Benefit/Cost Ratio 36.26 2.67 0.73 5.80 5.93
Net Benefits ($000s) 2,001.22 875.13 -516.67 1,223.04 1,258.13
Total Benefits ($000s) 2,057.97 1,398.72 1,398.72 1,478.01 1,513.10
Total Costs ($000s) 56.75 523.59 1,915.39 254.97 254.97
Table 12 – Commercial Tune-Up Program Cost/Benefit Tests
PCT UCT RIM TRC SCT
Benefit/Cost Ratio 6.54 1.47 0.60 2.27 2.32
Net Benefits ($000s) 236.93 51.09 -107.38 93.73 97.79
Total Benefits ($000s) 279.71 158.82 158.82 167.61 171.67
Total Costs ($000s) 42.78 107.72 266.20 73.88 73.88 Table 13 shows the cumulative cost-effectiveness results for OG&E’s energy efficiency portfolio for
program year 2013.
Table 13 – Portfolio Cost/Benefit Tests
PCT UCT RIM TRC SCT
Benefit/Cost Ratio 3.37 2.55 0.82 2.18 2.22
Net Benefits ($000s) 9,351.00 5,755.18 -2,049.91 5,614.65 5,833.31
Total Benefits ($000s) 13,293.24 9,469.57 9,469.57 10,388.20 10,606.86
Total Costs ($000s) 3,942.24 3,714.39 11,519.47 4,773.56 4,773.56
APSC FILED Time: 4/1/2014 12:29:49 PM: Recvd 4/1/2014 11:59:47 AM: Docket 07-075-tf-Doc. 229

11 OG&E Arkansas Energy Efficiency Report Program Year 2013
Program-Related Expenditures
All program-related expenditures are presented in Table 14 and are separated by administrative costs
and inducements. The administrative costs include program planning and design, marketing and delivery,
EM&V, and third party implementation costs.
Table 14 - Program Costs - 2013 Program Name Administrative and Other
Non-Inducement Costs ($) Inducements ($) Total Program
Cost ($)
SEE Program 8,161 65,746 73,907
AWP 4,716 33,998 38,714
OG&E Weatherization 341,693 1,960,465 2,302,158 HVAC and Duct Repair Program 49,312 72,693 122,004 Window Unit A/C Program 6,310 2,779 9,089
Commercial Lighting 158,947 228,776 387,722
Commercial SOP 198,999 324,592 523,591
Commercial Tune-Up 31,307 76,417 107,724
TOTAL 799,445 2,765,465 3,564,910
Planned and actual program costs, including additional regulatory costs and costs associated with the
Energy Efficiency Arkansas Program, are compared in Table 15.
Table 15- Planned and Actual Program Costs - 2013
Program Name Planned Program
Cost ($) Actual Program
Cost ($)
SEE Program 82,800 73,907
AWP 80,771 38,714
OG&E Weatherization 2,135,023 2,302,158
HVAC and Duct Repair Program 131,495 122,004
Window Unit A/C Program 11,416 9,089
Commercial Lighting 558,780 387,722
Commercial SOP 579,915 523,591
Commercial Tune-Up 133,815 107,724
Energy Efficiency AR Not provided 18,659
Regulatory Costs Not provided 130,809
TOTAL 3,714,377
APSC FILED Time: 4/1/2014 12:29:49 PM: Recvd 4/1/2014 11:59:47 AM: Docket 07-075-tf-Doc. 229

12 OG&E Arkansas Energy Efficiency Report Program Year 2012
APSC FILED Time: 4/1/2014 12:29:49 PM: Recvd 4/1/2014 11:59:47 AM: Docket 07-075-tf-Doc. 229

5.0 Attachment C
APSC FILED Time: 4/1/2014 12:29:49 PM: Recvd 4/1/2014 11:59:47 AM: Docket 07-075-tf-Doc. 229

Evaluation of 2013 Arkansas Weatherization Program
Submitted to:
Arkansas Community Action Agencies Association
Arkansas Oklahoma Gas Corporation
CenterPoint Energy Arkansas
Oklahoma Gas and Electric
Southwestern Electric Power Company
Empire District Electric Company
Entergy Arkansas, Inc.
SourceGas Arkansas
March 2014
Prepared by:
ADM Associates, Inc.
APSC FILED Time: 4/1/2014 12:29:49 PM: Recvd 4/1/2014 11:59:47 AM: Docket 07-075-tf-Doc. 229

Corporate Headquarters: 3239 Ramos Circle Sacramento, CA 95827 Tel: (916) 363-8383
ADM Associates Inc. Energy Research & Evaluation
200 Brown Road Suite 208 Fremont, CA 94539 Tel: (510) 371-0763
Prepared by:
Brian Harold Adam Thomas
Matthew Jaoudi Jeremy Offenstein, Ph.D
Evan Clark William Holleran
APSC FILED Time: 4/1/2014 12:29:49 PM: Recvd 4/1/2014 11:59:47 AM: Docket 07-075-tf-Doc. 229

Acknowledgements
We would like to thank the staff at each of the Arkansas Weatherization Program
sponsoring utilities, including Arkansas Oklahoma Gas Corporation, CenterPoint Energy
Arkansas, Oklahoma Gas and Electric, Southwestern Electric Power Company, Empire
District Electric Company, Entergy Arkansas, Inc. (“EAI”), and SourceGas Arkansas for
the time and effort they have contributed to the evaluation, measurement, and
verification (EM&V) of the Arkansas Weatherization Program. This evaluation required
accessible communications with staff at each utility, who actively responded to
evaluation inquiries and requests.
Additionally, we would like to thank participating customers of the aforementioned
utilities, the community action agencies and the Arkansas Community Action Agencies
Association (ACAAA), and program tracking database management staff for their
cooperation and assistance throughout the evaluation.
We would also like to thank Independent Evaluation Monitor staff for their active
involvement in providing thorough answers and clarification to the evaluation team when
higher-level questions arose during the EM&V effort.
APSC FILED Time: 4/1/2014 12:29:49 PM: Recvd 4/1/2014 11:59:47 AM: Docket 07-075-tf-Doc. 229

i
TABLE OF CONTENTS
Section Title Page
1. Executive Summary ................................................................... ..1-1
2. Impact Findings ........................................................................... 2-1
3. Process Findings and Program Updates ..................................... 3-1
4. Conclusions & Recommendations ............................................... 4-1
Appendix A: Supplemental Survey for Billing Analysis……………………….…...A-1
Appendix B: Sample AWP Marketing and Outreach Materials ………….....……B-1
Appendix C: Annual Report Summary of Program Budgets and Goals.......……C-1
APSC FILED Time: 4/1/2014 12:29:49 PM: Recvd 4/1/2014 11:59:47 AM: Docket 07-075-tf-Doc. 229
ii
LIST OF TABLES
Title Page
Table 1-1 Key Activities and Program Stages, 2013 Program Year ............................. 1-3
Table 1-2 Net Verified Savings by Electric Utility ......................................................... 1-5
Table 1-3 Net Verified Savings by Gas Utility ............................................................... 1-5
Table 1-4 Net Verified Savings by Measure Type – Overall ......................................... 1-6
Table 1-5 Per-Participants Annual Savings Comparison.............................................. 1-8
Table 1-6 Recommendations from 2013 Program Year Evaluation ........................... 1-16
Table 2-1 Ex Ante Savings by Measure Type – Overall ............................................... 2-2
Table 2-2 Ex Ante Savings by Electric Utility ................................................................ 2-3
Table 2-3 Ex Ante Savings by Measure Type – AEP-SWEPCO .................................. 2-3
Table 2-4 Ex Ante Savings by Measure Type – EDEC ................................................ 2-4
Table 2-5 Ex Ante Savings by Measure Type - EAI ..................................................... 2-5
Table 2-6 Ex Ante Savings by Measure Type – OG&E ................................................ 2-6
Table 2-7 Ex Ante Savings by Measure Type – Non-IOU (Electric) ............................. 2-7
Table 2-8 Ex Ante Savings by Gas Utility ..................................................................... 2-7
Table 2-9 Ex Ante Savings by Measure Type - AOG ................................................... 2-8
Table 2-10 Ex Ante Savings by Measure Type – CenterPoint ..................................... 2-9
Table 2-11 Ex Ante Savings by Measure Type – SourceGas .................................... 2-10
Table 2-12 Ex Ante Savings Values by Measure Type – Non-IOU (Gas) .................. 2-11
Table 2-13 TRM Sections by Measure Type .............................................................. 2-12
Table 2-14 Deemed Savings Values for Air Infiltration Reduction, Zone 7 ................. 2-13
Table 2-15 Deemed Savings Values for Ceiling Insulation, Zone 8 ........................... 2-14
Table 2-16 Net Verified Savings by Measure Type – Overall ..................................... 2-18
Table 2-17 Net Verified Savings by Electric Utility ..................................................... 2-19
APSC FILED Time: 4/1/2014 12:29:49 PM: Recvd 4/1/2014 11:59:47 AM: Docket 07-075-tf-Doc. 229

iii
Table 2-18 Net Verified Savings by Measure Type – AEP – SWEPCO ..................... 2-19
Table 2-19 Net Verified Savings by Measure Type – EDEC ...................................... 2-20
Table 2-20 Net Verified Savings by Measure Type – EAI .......................................... 2-21
Table 2-21 Net Verified Savings by Measure Type – OG&E ...................................... 2-22
Table 2-22 Net Verified Savings by Measure Type – Non-IOU (Electric) ................... 2-23
Table 2-23 Net Verified Savings by Gas Utility ........................................................... 2-24
Table 2-24 Net Verified Savings by Measure Type – AOG ........................................ 2-24
Table 2-25 Net Verified Savings by Measure Type – CenterPoint ............................. 2-25
Table 2-26 Net Verified Savings by Measure Type – Source Gas ............................. 2-26
Table 2-27 Net Savings by Measure Type – Non-IOU (Gas) ..................................... 2-27
Table 2-28 Detail of Treatment and Control Specifications by Year ........................... 2-28
Table 2-29 Weather Data Source by IOU ................................................................... 2-28
Table 2-30 Description of Variables Used in the AWP Regression Model ................. 2-29
Table 2-31 Electric Regression Results ..................................................................... 2-30
Table 2-32 Gas Regression Results........................................................................... 2-31
Table 2-33 Per-Participants Annual Savings Comparison .......................................... 2-31
Table 3-1 Determining Process Evaluation Timing ...................................................... 3-1
Table 3-2 Determining Process Evaluation Conditions ................................................ 3-2
Table 3-3 Interview and Survey Data Collection Summary .......................................... 3-3
Table 3-4 Status of Recommendations from 2012 Program Year ................................ 3-4
Table 3-5 Total Participation by Community Action Agency ....................................... 3-10
Table 3-6 Participation by Associated Utility .............................................................. 3-11
Table 3-7 Total Installations by Measure .................................................................... 3-12
Table 3-8 Database Review Goals & Activities .......................................................... 3-20
Table 4-1 Recommendations from 2013 Program Year Evaluation ............................. 4-7
APSC FILED Time: 4/1/2014 12:29:49 PM: Recvd 4/1/2014 11:59:47 AM: Docket 07-075-tf-Doc. 229

iv
LIST OF FIGURES
Title Page
Figure 3-1 Arkansas Weatherization Program Logic Model ......................................... 3-9
Figure 3-2 Participation Rates by Month, 2012 vs. 2013 ............................................ 3-11
APSC FILED Time: 4/1/2014 12:29:49 PM: Recvd 4/1/2014 11:59:47 AM: Docket 07-075-tf-Doc. 229

Executive Summary 1-1
1. Executive Summary
The purpose of this report is to provide a summary of the evaluation effort of the 2013
Arkansas Weatherization Program (AWP). This evaluation was conducted by ADM
Associates (referred to in this report as the Evaluators). This report provides verified
gross savings estimates for the evaluated program, and discusses changes and
updates in the program since the prior program year.
This report primarily focuses on program gas and electric savings impacts. As there
have been few significant modifications to overall program structure and delivery, the
process findings are limited to assessing recent program improvements, modifications,
and performance characteristics. A comprehensive process evaluation can be found in
the 2012 Arkansas Weatherization Program Evaluation Report.
1.1 Summary of Arkansas Weatherization Program
Much of the program’s structure has remained consistent since the 2012 program year.
The following provides a review of program design characteristics and operational
procedures, noting any specific updates for 2013.
In 2013, the Arkansas Weatherization Program (AWP) provided residential energy
audits and energy efficiency installations to customers within the following gas and
electric utility service territories:
American Electric Power – Southwestern Electric Power Company (AEP-
SWEPCO);
Empire District Electric Company (EDEC);
EAI;
Oklahoma Gas and Electric (OG&E);
Arkansas Oklahoma Gas Corporation (AOG);
CenterPoint Energy (CenterPoint); and
SourceGas Arkansas (SGA).
Participating homes were evaluated in order to determine potential energy efficiency
measures that would improve overall building efficiency and reduce energy usage. The
measures typically implemented through the program include:
Ceiling, floor and wall insulation;
Air sealing;
Window sealing and replacement;
APSC FILED Time: 4/1/2014 12:29:49 PM: Recvd 4/1/2014 11:59:47 AM: Docket 07-075-tf-Doc. 229

2013 Arkansas Weatherization Program EM&V Report
Executive Summary 1-2
Furnace, air conditioner, and heat pump tune-up and replacement;
Water heater insulation and replacement;
Lighting retrofits;
Low flow shower heads; and
Other measures as deemed appropriate.1
The AWP is designed to use both gas utility and electric utility funds to assist customers
with the costs of the in-home audit and installation of energy efficiency improvements.
Program services such as residential audits and measure installation are implemented
by local community action agencies in Arkansas. These agencies comprise the
Arkansas Community Action Agencies Association (ACAAA), which works with each
agency to plan and coordinate program services. Under the AWP, customers are
responsible for a portion of the audit cost, as well as a portion of resulting equipment or
measures to be installed in the home.
The program is offered in conjunction with the Department of Energy (DOE)
Weatherization Assistance Program (WAP), which provides federal assistance to fund
the customer co-payment in the AWP for income-qualified households. Customers are
able to pay their own co-payment or, if eligible for the WAP, receive these federal funds
for the energy efficiency improvements in their homes.2 Through this arrangement, the
AWP is able to leverage federal funding in order to generate participation and offset the
audit and implementation cost to a large percentage of participants (approximately 90%
of 2013 participants received WAP funding in conjunction with AWP funds). In 2013, the
administrative roles for the WAP transitioned to the Arkansas Energy Office (AEO) from
the Department of Human Services (DHS). This transition was implemented for
organizational efficiency purposes, and is expected to result in some procedural
modifications for the WAP.
Rather than an income requirement, eligibility for the AWP is based on a set of criteria
regarding customer residence energy efficiency. In order to qualify, customer homes
must meet specific criteria indicating that the residence is severely energy-inefficient.
There were no modifications to these criteria for the 2013 program year. The AWP is
designed based on the “whole house” approach to residential energy efficiency, where
energy efficiency measures are chosen and implemented based on total cost and
1 This list contains a sample of some of the most commonly installed program measures. A complete list
of measures that were implemented during the 2013 program year can be found in Table 1-4 of Section 1.3 in this report. A complete list of all eligible program measures can be found in ACAAA Docket no. 07-079-TF, Attachment A (AWP Modified Program Design and Description).
2 Eligibility for the Weatherization Assistance Program (WAP) is based on income thresholds, which increase with the number of residents in the home. A description of the WAP, along with the associated income requirements, can be found here: http://www.benefits.gov/benefits/benefit-details/1843.
APSC FILED Time: 4/1/2014 12:29:49 PM: Recvd 4/1/2014 11:59:47 AM: Docket 07-075-tf-Doc. 229

2013 Arkansas Weatherization Program EM&V Report
Executive Summary 1-3
energy savings rather than focusing on a specific fuel type or measure category. The
program provides a wide range of measures in order to improve residential energy
efficiency and to increase comfort and safety levels in the home.
Local community action agencies work with customers to enroll in the program and
determine AWP and WAP eligibility. In 2013, the number of active community action
agencies for weatherization services was reduced to six, although some of the previous
agencies continued to provide weatherization during the first few months of the year.
After the customer is approved and the in-home audit is performed, optimal energy
efficiency measures for AWP (and WAP, for eligible customers) are identified through
the use of National Energy Audit Tool (NEAT) or Mobile Home Energy Audit (MHEA)
software. The local agencies then use their internal crews or hire contractors to install
these measures in the home. These installation crews record all relevant measure input
data and report it to the Central Arkansas Development Council (CADC), who
aggregates the information from each agency. Batches of data are then sent to Frontier
Associates, the program database provider that manages the EnerTrek software tool.
EnerTrek incorporates the onsite data into TRM savings formulas (and NEAT/MHEA
values for measures not included in the TRM) to calculate ex ante savings for each
measure. The resulting savings are made accessible to program utilities and EM&V
contractors, who use EnerTrek database exports to conduct measure implementation
and savings verification activities.
Table 1-1 identifies core program stages and includes key activities performed
throughout the program process. The activities and stages shown for 2013 are
consistent with those that were in place during 2012 and prior years.
Table 1-1 Key Activities and Program Stages, 2013 Program Year
Program Stage Key Activities
Program Design Planning
ACAAA, CADC and utilities discuss program delivery and make design changes.
Necessary modifications made to program structure and operations.
Key parties meet to discuss program expectations and goals.
Training and Implementation Planning
Community action agencies, contractors, and other program operations staff attend program-relevant training sessions.
ACAAA, CADC, and local agencies discuss implementation and program updates.
Program Promotion
Community action agencies market the program to local customers.
Utility representatives may cross-promote the AWP with other programs.
Program Participation
Customers apply for the AWP and home eligibility is determined.
WAP eligibility is determined.
Participants receive in-home audits and measures are identified.
Contractors install measures that are either stipulated based on NEAT or MHEA software or are agreed upon with the customer (depending on whether or not WAP funds are used for the co-pay).
APSC FILED Time: 4/1/2014 12:29:49 PM: Recvd 4/1/2014 11:59:47 AM: Docket 07-075-tf-Doc. 229
2013 Arkansas Weatherization Program EM&V Report
Executive Summary 1-4
Program Stage Key Activities
Data Processing and Monitoring
Measures and associated savings are calculated and recorded.
Agencies update CADC, ACAAA, and utilities with participation data throughout the year.
Utilities, ACAAA, CADC, and local agencies continue to communicate regarding program progress and participation.
1.2 Evaluation Objectives
The evaluation of the 2013 Arkansas Weatherization Program (AWP) consisted of
several objectives and tasks. These evaluation objectives were primarily focused on
savings analysis and verification, as well as program updates and tracking of prior
evaluation findings. Specifically, the objectives of this evaluation include:
Documentation review of deemed savings calculations. The Evaluators reviewed
all savings calculations for measures included in the Arkansas Technical
Reference Manual, Versions 3.0, 2.0, and 1.0, (TRM), in order to ensure that
measure savings were properly calculated according to TRM protocols.
Tracking database and documentation review. The Evaluators conducted a
comparative assessment of the AWP tracking database in order to evaluate
tracking data modifications and improvements since the 2012 program year.
Additionally, the Evaluators assessed whether there had been modifications to
post-implementation field forms and other program materials since the prior year.
Regression analysis of participant billing data. The Evaluators analyzed pre- and
post-implementation billing data for participants in both the 2012 and 2013
program years in order to develop savings estimates for major program
measures. The purpose of this analysis is to compare results with the TRM
verified savings and to gain insight into the reasonableness of TRM calculations.
Supplemental participant impact survey. In order to inform the evaluation’s
regression analysis of program savings, a sample of participants from both the
2013 and 2012 program years were surveyed. This survey focused on identifying
behavioral variables that may affect household energy usage, in order to provide
context for and clarity within the analysis results.
Community Action Agency Interviews. The Evaluators conducted interviews with
the local community action agencies responsible for promoting the program,
interacting with customers, and coordinating program implementation tasks.
These interviews focused on assessing the extent of changes in program
performance, delivery, and organizational structure during the 2013 program
year.
APSC FILED Time: 4/1/2014 12:29:49 PM: Recvd 4/1/2014 11:59:47 AM: Docket 07-075-tf-Doc. 229

2013 Arkansas Weatherization Program EM&V Report
Executive Summary 1-5
Program staff interviews. Interviews were conducted with utility staff and
implementation staff (members of ACAAA). These interviews provided insight
into recent program changes for 2013, updates in specific program processes,
potential future improvements to program operation, and overall 2013 program
performance.
1.3 Summary of TRM Verification Findings
Table 1-2 and Table 1-3 present net savings for electric utilities and gas utilities,
respectively. Table 1-4 presents the net impact by measure, including measure-level
realization rates (RR). The Evaluators conducted a net-to-gross assessment of the
program during the previous evaluation (2012 program year) in order to determine the
likelihood of significant free-ridership or savings spillover. Due to program design
factors, target customer segment characteristics, and lack of participant spillover found
during 2012, the Evaluators determined the net-to-gross ratio for the Arkansas
Weatherization Program to be 1, or 100% of gross savings, for the 2012 program year.
This determination has been carried over and applied to the 2013 program year, and
2013 AWP gross savings are equal to net savings.
Table 1-2 Net Verified Savings by Electric Utility
Electric Utility # of
Homes
Peak Demand
Annual Savings
Lifetime Savings Realization
Rate Savings (kW)
(kWh) (kWh)
AEP-SWEPCO 29 18.50 47,714 664,523 59%
EDEC 1 0.36 3,240 33,577 54%
EAI 177 161.48 444,779 5,909,257 85%
OG&E 35 31.41 54,516 905,726 90%
Non-IOU3 49 42.91 86,217 1,142,144 82%
Total 291 254.66 636,467 8,655,227 82%
Table 1-3 Net Verified Savings by Gas Utility
Gas Utility # of
Homes
Peak Demand Savings (Therms)
Annual Savings (Therms)
Lifetime Savings (Therms)
Realization Rate
AOG 36 179.2623191 6,100 97,852 91%
CenterPoint 177 1152.428749 49,858 706,563 90%
SGA 23 144.1994378 7,829 123,705 93%
Non-IOU 55 119.5031302 5,032 71,732 100%
Total 291 1,595.39 68,820 999,852 91%
3 The “Non-IOU” category refers to savings that were achieved as a result of program services, but were not attributable to the
investor-owned utilities (IOUs) that fund the Arkansas Weatherization Program.
APSC FILED Time: 4/1/2014 12:29:49 PM: Recvd 4/1/2014 11:59:47 AM: Docket 07-075-tf-Doc. 229

2013 Arkansas Weatherization Program EM&V Report
Executive Summary 1-6
Table 1-4 Net Verified Savings by Measure Type – Overall
All calculations were verified as per the appropriate TRM based on available information
within the tracking data. For the most part, the inputs specified within TRM 3.0 were
present for each major measure type. However, there were a few measure types
representing a very minor portion of savings that did not include sufficient inputs for
TRM 3.0 or previous TRM versions.
1.3.1 Summary of Tracking Data Findings
Ex post savings were based on TRM verification of EnerTrek inputs and savings values.
Thus, instances of discrepancies between ex ante and ex post savings were due to
TRM compliance issues and errors within EnerTrek calculations. The overall realization
rates for electric utilities ranged from 54% to 90%, while the realization rates for gas
utilities ranged from 90% to 93%. Low realization rates were due to several factors,
including:
Air Infiltration, Attic Insulation, Double Pane Windows, and Floor Insulation
- According to all versions of the TRM (V1.0, V2.0, V3.0), savings for these
measures are calculated with a deemed value that is a function of a
household’s heating and cooling equipment type (i.e., electric air
Measure
Peak
Demand
Savings
(kW)
Annual
Savings
(kWh)
Lifetime
Savings
(kWh)
Peak
Demand
Savings
(Therms)
Annual
Savings
(Therms)
Lifetime
Savings
(Therms)
kWh
RR
Therms
RR
Air Infiltration 69.77 180,764 1,988,405 1,012.94 41,064 451,702 79% 100%
Attic Insulation 86.1 115,579 2,311,586 183.48 11,486 229,718 66% 84%
Central AC 17.66 40,658 609,870 - - - 100% -
Double Pane Window 46.76 64,510 1,290,193 175.11 3,943 78,861 82% 100%
Floor Insulation - 16,192 323,837 50.93 3,564 71,288 97% 102%
Gas Central Replacement - - - 76.38 3,883 77,668 - 97%
Heat Pump Replacement 2.3 25,610 384,150 - - - 115% -
Inside Lighting 27.72 168,669 1,315,620 - - - 107% -
Low-flow Shower Heads - - - 0.05 16 161 - 100%
Refrigerator Replacement 0.59 4,240 64,408 - - - 99% -
Smart Thermostat - 1,675 20,096 - 436 5,232 100% 100%
Storm Windows 2.62 14,113 282,267 65.85 2,164 43,280 100% 100%
Vented Space Heater - - - 21.81 1,358 27,151 - 100%
Wall Insulation 0.49 1,140 22,796 6.96 514 10,286 3% 10%
Water Heater Insulation 0.1 1,292 16,796 0.18 100 1,299 100% 100%
Water Heater Replacement 0.01 147 1,906 0.21 87 955 100% 100%
Water Pipe Insulation 0.45 1,429 18,571 1.49 205 2,250 101% 101%
Window AC 0.1 450 4,725 - - - 100% -
Window Sealing - - - - - - 0% 0%
Total 254.66 636,467 8,655,227 1,595.39 68,820 999,852 82% 91%
APSC FILED Time: 4/1/2014 12:29:49 PM: Recvd 4/1/2014 11:59:47 AM: Docket 07-075-tf-Doc. 229

2013 Arkansas Weatherization Program EM&V Report
Executive Summary 1-7
conditioning with gas heat, or gas heat only, or electric air conditioning with
resistance heat, or a heat pump). The ex ante savings were calculated
using the appropriate TRM methodologies; however, for some households,
an incorrect heating and cooling equipment type was applied. Additionally,
some attic insulation measures were installed with insufficient R-values,
and did not qualify for savings under any TRM.
Heat Pump Replacement
- According to Section 2.1.8 of TRM V2.0 and TRM V3.0, there are cooling
energy savings and heating energy savings associated with the heat pump
replacement measure. The cooling and heating savings are a function of
size (tons). The data provided by Frontier Associates tracks a size for
cooling, as well as a size for heating. The evaluators utilized the
corresponding size when calculating the savings associated with heating
and with cooling. However, ex ante savings were calculating using only
cooling size for both cooling and heating savings.
Inside Lighting (CFLs)
- The Evaluators applied TRM V3.0 to estimate savings for the inside lighting
measure, resulting in higher savings than were claimed for lighting in the
tracking data.
Wall Insulation
- According to Section 2.2.3 of TRM V3.0 and TRM V2.0, the minimum
efficiency standard is an R-value of 13. However, all but one household
had an R-value of only 11 and, therefore, did not qualify for savings.
A detailed description of the savings verification findings can be found in Section 2.5 of
this report.
1.4 Summary of Regression Analysis Findings
Utilizing both 2012 and 2013 participants in the AWP, the Evaluators conducted a
regression analysis in order to estimate the reasonableness of measure level savings
reported in the TRM. This analysis was performed as a research activity that may be
used to inform future TRM updates and to gain insight into participant behavioral
effects.
The Evaluators received a sample of monthly billing data for 2012 and 2013 program
participants. The billing data spanned from January 2011 to October 2013.
1.4.1 Incorporating Survey Responses
The Evaluators conducted a survey of 2012 and 2013 participants to inform the
regression models as to which participants may have undertaken activities that may
APSC FILED Time: 4/1/2014 12:29:49 PM: Recvd 4/1/2014 11:59:47 AM: Docket 07-075-tf-Doc. 229

2013 Arkansas Weatherization Program EM&V Report
Executive Summary 1-8
impact their savings when analyzed at the premise level. A total of 181 fully completed
surveys were used for the analysis. The specific survey questions that were used to
inform this analysis are as follows:
Did you increase (decrease cooling) your heating thermostat set-point after the
program implementation?
Did you add a new appliance to the premise after the program implementation?
Was an appliance returned to operation as a result of the program?
Was there a change in population in the household after the program
implementation?
These details were used to split the dataset into four groups:
Customers who have changed their usage behavior (snapback) in the post
period.
Customers who have an appliance returned to operation or added appliances to
their home in the post period (takeback).
Customers who exhibit potential snapback or have takeback influences (member
of group 1 and 2).
The full data set consisting of all customers who completed a survey, regardless
of response indicators.
1.4.1 Energy Savings Derived From Regression Models
The results from each model are applied in combination with the average HDD by
month in the baseline period (2012), and then applied as a percentage savings on a
monthly basis with the average monthly baseline usage. The resulting savings are listed
in Table 1-5, including realization rates (RR) as compared to TRM savings.
Table 1-5 Per-Participants Annual Savings Comparison
Group
Annual Regression Model kWh
Savings
% kWh Savings
TRM Based kWh
Savings
kWh RR
Annual Regression
Model Therms Savings
% Therms Savings
TRM Based Therms Savings
Therms RR
Group 1 - No
Snapback
1,231 9% 2,083 79% 56 11% 236 24%
Group 2 - No
Takeback
1,061 8% 2,083 68% 76 15% 236 32%
APSC FILED Time: 4/1/2014 12:29:49 PM: Recvd 4/1/2014 11:59:47 AM: Docket 07-075-tf-Doc. 229

2013 Arkansas Weatherization Program EM&V Report
Executive Summary 1-9
Group 3 - No
Snapback or
Takeback
1,550 12% 2,083 99% 84 17% 236 36%
Group 4 - All
Customers
901 7% 2,083 58% 53 11% 236 22%
The significance of these results shows that there is an impact on program savings due
to takeback and snapback with Group 1 showing much lower savings than the
takeback-excluded or snapback-excluded models. Using the comparable regression
results, the impact of snapback is estimated as 2.5% of annual kWh usage, while and
the impact of takeback is estimated as 2.4% of annual usage. When all snapback and
takeback participants are removed from the model, electric savings are very closely
aligned with those in the TRM (showing a realization rate of 99%).
With regard to Therms results, takeback (4.7%) has a much larger impact than
snapback (1.7%). This is to be expected, as the impact of returning a furnace or water
heater to service will have a much larger impact than a set point change in a home.
1.4.2 Billing Analysis Summary Results
The analysis of participant billing data shows a significant difference in savings based
on behavioral changes after program implementation. Based on the questions asked of
participants, it appears that the deemed electric savings within the TRM accurately
represent actual participant savings, in isolation of changes in customer behavior.
The analysis identified a larger discrepancy between the modeled Therms savings and
TRM savings even after taking into account behavioral changes. The realization rate for
the snapback- and takeback-excluded group is 36%. This suggests that at the premise
level for a complete weatherization project, the TRM may be overestimating total
Therms savings. As a percentage of total annual residence usage, the TRM based
Therms savings are 47%. This is a potentially unrealistic savings target, further
indicating that the TRM savings are overstating the actual impacts. This may be due to
interaction effects between measures, as the TRM provides savings for isolated
measures rather than at the aggregated premise level.
1.5 Summary of Conclusions and Recommendations
The Arkansas Weatherization Program was evaluated for overall effectiveness,
performance, and design, and the Evaluators developed conclusions with consideration
of the seven comprehensiveness factors developed by the Arkansas Public Service
Commission. After reviewing the Arkansas Weatherization Program for 2013, the
Evaluators highlight the following conclusions:
APSC FILED Time: 4/1/2014 12:29:49 PM: Recvd 4/1/2014 11:59:47 AM: Docket 07-075-tf-Doc. 229

2013 Arkansas Weatherization Program EM&V Report
Executive Summary 1-10
WAP Reliance Issues: The community action agencies and ACAAA are working in the
context of their other community programs and the statewide Weatherization Assistance
Program (WAP), which is directly tied to federal funding. Ideally, this arrangement would
use utility funds to efficiently leverage federal funding and substantially increase the
number of weatherization projects that the agencies are able to perform. However, it
appears that the AWP’s inherent link to the WAP has resulted in performance issues
due to federal funding reductions and statewide program reorganization.
As noted during the 2012 program evaluation, based on the Commission’s Order in
docket no. 13-002-U, all of the utility energy efficiency programs, including the AWP, will
be revised through the Collaborative process outlined in the Order. In addition, the
transfer of the WAP to the Arkansas Energy Office may result in beneficial modifications
that alleviate some of these issues.
Beneficial Agency Reduction Effects: Nearly all interview respondents reported that
the reduction in weatherization agencies has been a beneficial modification. As the
remaining agencies appear to be actively recruiting participants and implementing
services, the weatherization network may become more engaged as a whole as
compared to previous years. Additionally, if the per-agency funding levels are
increased, this will likely allow the agencies to weatherize additional homes and improve
savings performance.
The agencies appear to be adequately managing the increased distance between
service providers, and all utility service territories are represented by at least one of the
six agencies. Although the majority of the remaining agencies report that they do not
prioritize AWP funds over WAP funds, two agencies report that they are actively
seeking non-WAP participants and that they expect to recruit a substantial number in
the coming year.
Program Coordination Complexity: Interviewed utility staff reiterated their main
concerns from the prior program year, and generally reported that the program has
continued to struggle with meeting participation goals, facilitating efficient
communication, and ensuring prompt, accurate data reporting. The AWP operational
structure is composed of many different entities: Six active community action agencies
and their contractors, the Arkansas Community Action Agency Association (ACAAA),
and seven utility providers. Each utility is operating within the context of its other energy
savings programs, with specific energy savings goals and cost effectiveness targets.
The program incorporates many organizations that must communicate clearly and
operate cooperatively in order for the program to avoid reporting delays and
inconsistent program delivery. These factors place the AWP in a somewhat fragile
operational framework, where delays and performance issues have been difficult to
avoid.
Data Revision and Transfer Issues: One of the most commonly mentioned issues by
program staff has been the consistent delays in the data transfer and reporting process.
APSC FILED Time: 4/1/2014 12:29:49 PM: Recvd 4/1/2014 11:59:47 AM: Docket 07-075-tf-Doc. 229

2013 Arkansas Weatherization Program EM&V Report
Executive Summary 1-11
The program is structured such that CADC collects the completed weatherization data
from each agency, and then delivers it to Frontier Associates, the EnerTrek software
provider. Frontier then enters the data into the EnerTrek software tool and then makes
the data available to the program utilities. Ideally, this would be a one-way process, but
Frontier Associates has needed to obtain additional data, data corrections, or data
revisions from CADC for each batch of data. These tasks and their associated
turnaround times have added to the lead time between job completion and final data
reporting. This situation is reportedly being addressed through clarifying discussions
between CADC and Frontier, although thus far it is unclear whether all issues will be
quickly resolved.
Program Interruption: Although the AWP has not met participation or savings goals in
prior years, the additional decrease in participation levels during the 2013 program year
may be mainly attributable to the fact that the program paused implementation activity in
April due to funding issues. These issues were partially related to the initiation of
program restructuring on a statewide level, and the overall fact that the timing and level
of DOE funding for the WAP was uncertain. The end result has left the AWP with fewer
participants than past years, and the program has not met the savings goals for any of
the participating utilities.
The AWP has operated within a transitional phase of the WAP, and program
performance difficulties may have been expected during this time. However, it appears
that the performance issues noted in prior years have persisted during this period. This
issue may be avoided if funding levels are maintained and delivered as expected during
the 2014 program year.
Potential for Collaborative Communication: Utility and agency staff noted that it may
be useful to hold introductory meetings between the utilities and local agencies so that
all parties may familiarize themselves with each other and develop a more collaborative
working relationship. With the recent transition to a smaller group of agency providers,
participants in some utility service territories will now be served by different agency
organizations. Additionally, with a smaller number of entities working to implement the
program, it may be more feasible to develop and mutually agree on promotional or
general implementation strategies.
A collaborative relationship among all utilities and agency implementers has been a
goal and an integral component of the AWP since its inception. In 2013, WAP transition
and funding issues, as well as uncertainty due to the Commission’s requirement to
develop and submit for approval collaborative procedural guidelines, led to fewer AWP
Collaborative meetings. Such meetings had been a regular part of AWP
implementation in prior years. While these discussions may reveal opportunities to
improve marketing efforts towards non-WAP participants or other aspects of program
performance, the actual result may simply serve to acknowledge the new utility-agency
partnerships that have resulted from the weatherization agency transition.
APSC FILED Time: 4/1/2014 12:29:49 PM: Recvd 4/1/2014 11:59:47 AM: Docket 07-075-tf-Doc. 229

2013 Arkansas Weatherization Program EM&V Report
Executive Summary 1-12
Tracking Data Limitations: While the tracking database has been updated to contain
adequate inputs for the majority of measures, the process of uploading data to the
database and updating database structure has been fairly inefficient. Thus far, it
appears that the current arrangement of attempting to periodically update EnerTrek and
align NEAT and MHEA measures and calculations with TRM requirements has been
costly and time-consuming. In addition to administrative costs, the time and budget
required to retroactively update the database can affect program cost-effectiveness and
create barriers to program performance.
Additionally, EnerTrek has encountered difficulties with accurately constructing savings
algorithms for certain measures. Low realization rates were primarily due to some
homes being labeled with a specific heating or cooling type, but where the EnerTrek
calculation assumed a different cooling or heating type that overestimated savings.
The most notable instances of this involved attic insulation, air infiltration, and window
replacement. As these measure types were not evenly distributed across service
territories, overall realization rates varied widely among IOUs. This appears to be a
savings algorithm issue rather than a data collection issue. Resolving this error should
be fairly straightforward and require only a minor adjustment to the EnerTrek savings
algorithms. This has led to low realization rates on the measure and overall program
level.
In order to fully comply with TRM V3.0 and any future TRM updates, EnerTrek will have
to be flexible enough to receive updates without disrupting the data input process or
delaying savings reporting. This will likely require substantial improvements in staff
coordination and potentially significant changes to how the software is maintained.
Without approval of additional budgets to implement substantial changes, database
modifications will likely be limited to minor improvements that focus on the highest
impact measures.
Based on these conclusions and other findings, the Evaluators make the following
recommendations:
Resolve Data Transfer Issues: If there are any remaining uncertainties between
CADC and Frontier regarding the format, content, or interpretation of data fields or
inputs, these should be reconciled prior to the data transfer process in upcoming years.
Resolving these uncertainties should reduce the number of data correction or
clarification requests and increase the efficiency of the data reporting process. Ideally, it
will not be necessary to reprogram the EnerTrek software or revise the structure of
CADC data batches during the program year.
Maintain Electronic Records: It would be beneficial for each agency to collect and
maintain accessible electronic records of any data that may be requested by Frontier, or
that CADC aggregate the data from each agency and store it in a centrally accessible
way. Situations where there are implementation, audit, or verification data that only exist
APSC FILED Time: 4/1/2014 12:29:49 PM: Recvd 4/1/2014 11:59:47 AM: Docket 07-075-tf-Doc. 229

2013 Arkansas Weatherization Program EM&V Report
Executive Summary 1-13
in hardcopy format at the end of the program year should be avoided. Additionally it
may be beneficial for CADC to eventually develop a shared database that is accessible
to all agencies for the purposes of submitting implementation data. This would ensure
that all relevant data are stored in a single location, and would likely reduce the
turnaround time for data requests.
Utility-Agency Communication: Although the AWP is intended to be fully
implemented and delivered by the community action agencies and ACAAA, regular
communication and information accessibility are key factors to facilitate a cooperative
working relationship. While CADC consolidates agency-collected data and holds a key
role as a lead agency, it may not have the bandwidth to serve as the sole contact point
between each agency and utility for all purposes. Thus, the Evaluators provide two
recommendations that may improve communications among program entities:
Collaboration Meeting: It may be useful for the utilities and the agencies within
their respective service territories to hold an introductory meeting in order to
recognize the newly established agency-utility connections that have resulted
from the reduction in weatherization providers. This may facilitate a mutually
beneficial working relationship, or at a minimum allow territory-specific questions
to be answered more efficiently.
Updated Organizational Chart: Along with the reduction in weatherization
service providers and the broader changes in statewide weatherization, some
program staff has reported that they are not currently aware of the roles and
responsibilities of each entity. As recommended by utility staff, CADC and the
utilities should consider developing an organizational chart showing the
relationship among all AWP entities, as well as the roles, responsibilities, and
contact information of representatives at each agency and utility. This is related
to the overall coordination of the program, and explicitly identifying key roles and
connections between organizations would likely facilitate effective working
relationships.
Incrementally Increase Compliance with TRM Requirements: As with the prior
program year, the tracking data was found to include sufficient information for the
majority of the measures. However, the tracking data did not include sufficient
information for the following measures:
Water Heater Replacement
- The tracking data did not present the energy factor (EF) of the energy
efficient equipment, which is a necessary input in TRM V3.0 for savings
calculation. As this measure accounted for a minor portion of program
savings, the Evaluators classified it as a low rigor measure and
determined that the ex ante savings were reasonable. The ex ante
savings were carried over to ex post results.
APSC FILED Time: 4/1/2014 12:29:49 PM: Recvd 4/1/2014 11:59:47 AM: Docket 07-075-tf-Doc. 229

2013 Arkansas Weatherization Program EM&V Report
Executive Summary 1-14
Vented Space Heater
- The tracking data did not present the square footage or age of the
replaced vented space heater, which is are necessary inputs in TRM V3.0
for savings calculation. As this measure accounted for a minor portion of
program savings, the Evaluators classified it as a low rigor measure and
determined that the ex ante savings were reasonable. The ex ante
savings were carried over to ex post results.
The weather zone of each household is necessary for many of the savings calculations.
This information was used by Frontier Associates to calculate savings; however, it was
not presented in the tracking data. Additionally, TRM V3.0 contains additional
requirements that may require further updates to the EnerTrek software tool. The
utilities and CADC should ensure that all possible updates to this database are included
prior to the end of the 2014 program year.
Increase Level of Detail in Utility Updates: Utility staff reported that the updates they
receive from CADC regarding program performance are mainly limited to participant
counts and overall costs. Utility staff are not aware which customers participated in the
program or which measures were installed until the end of the program year. CADC
should increase the level of detail within these reports and include participant names,
addresses, measure counts, and other information if possible. This will allow the utilities
to identify participants, to understand more about how the program is performing, and to
potentially estimate preliminary savings.
Adjust EnerTrek Algorithms and Conduct Thorough Quality Assurance: Frontier
should conduct more thorough quality assurance procedures when verifying the
accuracy of EnerTrek savings algorithms. The largest contributors to low realization
rates for this program year were related to simple errors within EnerTrek calculations.
Although the heating system type was provided within program tracking data, EnerTrek
did not reliably incorporate the correct heating type into savings calculations for attic
insulation, air infiltration, and window replacement. This specific issue, and any other
algorithm errors, should be addressed as soon as possible.
Another issue is that some insulation measures were installed without meeting minimum
TRM R-value requirements. This is related to both the measure installation and savings
calculation program phases, as agency contractors should avoid implementing
measures that will not qualify for savings under the TRM. Additionally, if these
measures are implemented, the EnerTrek system should be adjusted to eliminate
savings for measures that do not meet minimum requirements.
Conduct Further Research Assessing Air Infiltration and Insulation Estimates:
The ability to isolate specific measure effects and behavioral variables with regression
analyses of the AWP may be somewhat restricted by the limited participant population
size and high presence of measure crossover, in that the majority of residences
received both air infiltration and attic insulation measures. However, a billing analysis
APSC FILED Time: 4/1/2014 12:29:49 PM: Recvd 4/1/2014 11:59:47 AM: Docket 07-075-tf-Doc. 229

2013 Arkansas Weatherization Program EM&V Report
Executive Summary 1-15
involving a larger participant population may allow for quantitative isolation of individual
behavioral variables and measure types. This may provide further evidence that
necessitates revisions to the TRM with regard to the reasonableness of air infiltration
and insulation measure savings calculations. These are the two highest-impact gas
savings measures that are implemented through the AWP. The Evaluators recommend
conducting additional research in the form of billing analysis and reviews of industry
standards for TRM estimates of weatherization savings prior to implementing any
specific changes to existing TRM formulas.
APSC FILED Time: 4/1/2014 12:29:49 PM: Recvd 4/1/2014 11:59:47 AM: Docket 07-075-tf-Doc. 229

2013 Arkansas Weatherization Program EM&V Report
Executive Summary 1-16
Table 1-6 Recommendations from 2013 Program Year Evaluation
Issue Consequences Recommendation
There have been delays in database finalization due to uncertainties in data interpretation and requirements between CADC and Frontier.
Reduces accessibility to database for utilities Delays savings reporting and may cause inaccurate reports
Resolve issues early in 2014 program year, including data interpretation issues, so that multiple data and database revisions are not necessary.
Some data are not available due to being only in hardcopy form or decentralized from the CADC.
Potential lost data Potential delays in data transfer if additional data are needed
Agencies should maintain electronic records of all collected audit, implementation, and verification data.
Communication among utilities and agencies is limited.
Causes difficulties in utility-agency coordination
Recommendation 1: Hold introductory meetings between utilities and the remaining six agencies in order to develop familiarity and identify key contact persons, establish communication lines Recommendation 2: Develop an organizational chart displaying roles, responsibilities, and contact persons for each entity (utilities, agencies, ACAAA, etc.)
Some data required for TRM 2.0 and 3.0 do not appear to have been collected.
Creates difficulties in savings verification May result in inaccurate ex ante savings estimates if insufficient inputs are used
Ensure that the data collection forms and database are compliant with relevant TRM requirements to the extent possible based on budget constraints.
APSC FILED Time: 4/1/2014 12:29:49 PM: Recvd 4/1/2014 11:59:47 AM: Docket 07-075-tf-Doc. 229

2013 Arkansas Weatherization Program EM&V Report
Executive Summary 1-17
Utilities are not aware of project details until end of year.
Limits utility ability to plan for annual reporting Limits utility awareness of program performance
Include more details in the periodic reports that are sent to utilities, including measure counts/descriptions, customer names, etc.
EnerTrek contains erroneous assumptions for individual measure algorithms (air infiltration, attic insulation, window replacement).
Results in inaccurate ex ante savings (in this case savings were highly overestimated) Decreases program realization rates
Frontier should perform thorough quality assurance practices and verify that EnerTrek calculations comply with TRM algorithms.
TRM estimates for Therms savings substantially exceed regression analysis results.
TRM formulas may be inaccurately estimating Therms savings.
Conduct further research into TRM industry standards for weatherization, or perform a more in-depth billing analysis for a larger population, prior to implementing TRM changes for air infiltration or insulation.
APSC FILED Time: 4/1/2014 12:29:49 PM: Recvd 4/1/2014 11:59:47 AM: Docket 07-075-tf-Doc. 229

2013 Arkansas Weatherization Program EM&V Report
Executive Summary 1-18
1.6 Report Organization
The report is organized as follows:
Chapter 2 presents the impact findings and discusses the methods used for, and
the results obtained from, estimating gross and net savings for the program;
Chapter 3 presents the results of the process evaluation tasks and additional
program findings;
Chapter 4 presents key conclusions and recommendations from the evaluation of
the program;
Appendix A presents the survey instrument that was administered to program
participants in order to supplement the regression analysis of customer billing
data;
Appendix B presents sample marketing materials that are used by the utilities
and community action agencies to promote AWP services to customers; and
Appendix C provides summary tables of planned and achieved program costs
and savings goals.
APSC FILED Time: 4/1/2014 12:29:49 PM: Recvd 4/1/2014 11:59:47 AM: Docket 07-075-tf-Doc. 229

Impact Findings 2-1
2. Impact Findings
This chapter presents the results of the gross savings verification and savings
calculation review for the Arkansas Weatherization Program (AWP) in the 2013 program
year. Additionally, this chapter summarizes the methodology and results obtained from
the regression analysis of billing data that was conducted in order to inform the
reasonableness of participant savings estimates.
2.1 Glossary of Terms
As a first step to detailing the evaluation methodologies, the Evaluators provide a
glossary of terms to follow:
Ex Ante – A program parameter or value used by implementers/sponsoring
utilities in estimating savings before implementation
Ex Post – A program parameter or value as verified by the Evaluators following
completion of the evaluation effort
Deemed Savings – A savings estimate for homogenous measures, in which an
assumed average savings across a large number of rebated units is applied
Gross Savings – Energy savings as determined through engineering analysis,
statistical analysis, and/or onsite verification
Gross Realization Rate – Ratio of Ex Post Savings / Ex Ante Savings
Free-Ridership – Percentage of participants who would have implemented the
same energy efficiency measures in a similar timeframe absent the program.
Spillover – Savings generated by a program that are not incentivized. Examples
of this include a customer that is introduced to energy efficiency through one
rebated project and due to this undertakes other projects for which they do not
apply for a program incentive.
Net Savings – Gross savings factoring off free-ridership and adding in spillover.
Net-to-Gross-Ratio (NTGR) = (1 – Free-Ridership % + Spillover %), also defined
as Net Savings / Gross Savings
Ex Ante Net Savings = Ex Ante Gross Savings x Ex Ante Free-Ridership Rate
Ex Post Net Savings = Ex Post Gross Savings x Ex Post Free-Ridership Rate
Net Realization Rate = Ex Post Net Savings / Ex Ante Net Savings
2.2 Summary of Ex Ante Savings
The Arkansas Weatherization Program is designed to use both electric and gas utility
funds to assist customers with the cost of the in-home audit and energy efficient
measures. Table 2-1 presents the overall ex ante, or utility-reported, savings by
APSC FILED Time: 4/1/2014 12:29:49 PM: Recvd 4/1/2014 11:59:47 AM: Docket 07-075-tf-Doc. 229

2013 Arkansas Weatherization Program EM&V Report
Impact Findings 2-2
measure. These values are based on the claimed savings values within the EnerTrek
software tool. Exports of these data were provided to the Evaluators for verification
purposes.
Table 2-1 Ex Ante Savings by Measure Type – Overall
Measure
Peak Demand Savings
(kW)
Annual Savings (kWh)
Peak Demand Savings (Therms)
Annual Savings (Therms)
Air Infiltration 115.17 229,682 1,014.90 41,093
Attic Insulation 99.59 176,274 218.47 13,615
Central AC 17.66 40,658 - -
Double Pane Window 57.75 78,416 175.39 3,947
Floor Insulation - 16,742 50.50 3,508
Gas Central Replacement
- - 78.81 4,020
Heat Pump Replacement 2.32 22,311 - -
Inside Lighting 16.48 158,195 - -
Low-flow Shower Heads - - 0.05 16
Refrigerator Replacement
0.60 4,294 - -
Smart Thermostat - 1,675 - 436
Storm Windows 2.62 14,113 65.85 2,164
Vented Space Heater - - 21.81 1,358
Wall Insulation 10.04 33,216 82.32 5,065
Water Heater Insulation 0.10 1,292 0.18 100
Water Heater Replacement
0.01 147 0.21 87
Water Pipe Insulation 0.45 1,420 1.48 203
Window AC 0.10 450 - -
Window Sealing - 284 - 135
Total 322.87 779,170 1,709.97 75,745
2.2.1 Ex Ante Savings for Electric Utilities
The participating electric utilities are AEP-SWEPCO, EDEC, EAI, and OG&E. Table 2-2
presents the savings results of the evaluation of the 2013 AWP for electric utilities.
Table 2-3 through Table 2-6 summarize the ex ante savings by measure for each
electric utility. The “Non-IOU” category refers to savings that were achieved as a result
of program services, but were not attributable to the investor-owned utilities (IOUs) that
fund the Arkansas Weatherization Program.
APSC FILED Time: 4/1/2014 12:29:49 PM: Recvd 4/1/2014 11:59:47 AM: Docket 07-075-tf-Doc. 229

2013 Arkansas Weatherization Program EM&V Report
Impact Findings 2-3
Table 2-2 Ex Ante Savings by Electric Utility
Electric Utility # of Homes Peak Demand Annual Savings
Savings (kW) (kWh)
AEP-SWEPCO 29 28.49 81,394
EDEC 1 0.30 5,952
EAI 177 203.42 526,161
OG&E 35 34.82 60,567
Non-IOU 49 55.84 105,095
Total 291 322.87 779,170
Table 2-3 Ex Ante Savings by Measure Type – AEP-SWEPCO
Measure
Peak Demand Savings
(kW)
Annual Savings (kWh)
Air Infiltration 10.85 18,314
Attic Insulation 11.26 26,505
Central AC - -
Double Pane Window 1.61 1,891
Floor Insulation - 878
Gas Central Replacement
- -
Heat Pump Replacement 0.29 1,054
Inside Lighting 1.42 13,685
Low-flow Shower Heads - -
Refrigerator Replacement
0.05 386
Smart Thermostat - 469
Storm Windows 0.42 1,402
Vented Space Heater - -
Wall Insulation 2.44 16,533
Water Heater Insulation - -
Water Heater Replacement
- -
Water Pipe Insulation 0.04 127
Window AC 0.10 150
Window Sealing - -
Total 28.49 81,394
APSC FILED Time: 4/1/2014 12:29:49 PM: Recvd 4/1/2014 11:59:47 AM: Docket 07-075-tf-Doc. 229

2013 Arkansas Weatherization Program EM&V Report
Impact Findings 2-4
Table 2-4 Ex Ante Savings by Measure Type – EDEC
Measure
Peak Demand Savings
(kW)
Annual Savings (kWh)
Air Infiltration 0.22 2,594
Attic Insulation - -
Central AC - -
Double Pane Window - -
Floor Insulation - -
Gas Central Replacement
- -
Heat Pump Replacement - 2,646
Inside Lighting 0.07 712
Low-flow Shower Heads - -
Refrigerator Replacement
- -
Smart Thermostat - -
Storm Windows - -
Vented Space Heater - -
Wall Insulation - -
Water Heater Insulation - -
Water Heater Replacement
- -
Water Pipe Insulation - -
Window AC - -
Window Sealing - -
Total 0.30 5,952
APSC FILED Time: 4/1/2014 12:29:49 PM: Recvd 4/1/2014 11:59:47 AM: Docket 07-075-tf-Doc. 229

2013 Arkansas Weatherization Program EM&V Report
Impact Findings 2-5
Table 2-5 Ex Ante Savings by Measure Type - EAI
Measure
Peak Demand Savings
(kW)
Annual Savings (kWh)
Air Infiltration 77.90 171,050
Attic Insulation 67.14 116,015
Central AC 15.34 35,312
Double Pane Window 20.51 31,416
Floor Insulation - 14,573
Gas Central Replacement
- -
Heat Pump Replacement 2.03 17,399
Inside Lighting 11.38 109,171
Low-flow Shower Heads - -
Refrigerator Replacement
0.36 2,587
Smart Thermostat - 1,206
Storm Windows 1.73 11,897
Vented Space Heater - -
Wall Insulation 6.56 12,909
Water Heater Insulation 0.09 1,156
Water Heater Replacement
0.01 147
Water Pipe Insulation 0.37 1,158
Window AC - -
Window Sealing - 167
Total 203.42 526,161
APSC FILED Time: 4/1/2014 12:29:49 PM: Recvd 4/1/2014 11:59:47 AM: Docket 07-075-tf-Doc. 229

2013 Arkansas Weatherization Program EM&V Report
Impact Findings 2-6
Table 2-6 Ex Ante Savings by Measure Type – OG&E
Measure
Peak Demand Savings
(kW)
Annual Savings (kWh)
Air Infiltration 2.53 8,121
Attic Insulation 5.31 8,872
Central AC - -
Double Pane Window 25.93 33,179
Floor Insulation - 229
Gas Central Replacement
- -
Heat Pump Replacement - 1,212
Inside Lighting 0.82 7,886
Low-flow Shower Heads - -
Refrigerator Replacement
0.07 482
Smart Thermostat - -
Storm Windows 0.15 252
Vented Space Heater - -
Wall Insulation - -
Water Heater Insulation 0.01 68
Water Heater Replacement
- -
Water Pipe Insulation 0.01 44
Window AC - 150
Window Sealing - 74
Total 34.82 60,567
Table 2-7 presents the ex ante electric savings that were not associated with any IOU.
These ex ante savings are attributable to municipal utilities, co-op utilities, or other
energy providers. These savings are not attributed to any specific program sponsoring
utility, and are provided for reference only.
APSC FILED Time: 4/1/2014 12:29:49 PM: Recvd 4/1/2014 11:59:47 AM: Docket 07-075-tf-Doc. 229

2013 Arkansas Weatherization Program EM&V Report
Impact Findings 2-7
Table 2-7 Ex Ante Savings by Measure Type – Non-IOU (Electric)
Measure
Peak Demand Savings
(kW)
Annual Savings (kWh)
Air Infiltration 23.67 29,603
Attic Insulation 15.88 24,882
Central AC 2.32 5,346
Double Pane Window 9.69 11,931
Floor Insulation - 1,063
Gas Central Replacement
- -
Heat Pump Replacement - -
Inside Lighting 2.78 26,741
Low-flow Shower Heads - -
Refrigerator Replacement
0.12 839
Smart Thermostat - -
Storm Windows 0.32 563
Vented Space Heater - -
Wall Insulation 1.03 3,774
Water Heater Insulation 0.01 68
Water Heater Replacement
- -
Water Pipe Insulation 0.03 91
Window AC - 150
Window Sealing - 43
Total 55.84 105,095
2.2.2 Ex Ante Savings for Gas Utilities
The participating gas utilities are AOG, CenterPoint, and SourceGas. Table 2-8
presents the savings results of the evaluation of the 2013 AWP for gas utilities. Table
2-9 through Table 2-11 summarize the ex ante savings by measure for each gas utility.
The “Non-IOU” category refers to savings that were achieved as a result of program
services, but were not attributable to the investor-owned utilities (IOUs) that fund the
Arkansas Weatherization Program.
Table 2-8 Ex Ante Savings by Gas Utility
Gas Utility # of
Homes
Peak Demand Savings (Therms)
Annual Savings (Therms)
AOG 36 189.371165 6,715
CenterPoint 177 1248.68097 55,538
SGA 23 151.593877 8,439
Non-IOU 55 120.328163 5,053
Total 291 1,709.97 75,745
APSC FILED Time: 4/1/2014 12:29:49 PM: Recvd 4/1/2014 11:59:47 AM: Docket 07-075-tf-Doc. 229

2013 Arkansas Weatherization Program EM&V Report
Impact Findings 2-8
Table 2-9 Ex Ante Savings by Measure Type - AOG
Measure
Peak Demand Savings (Therms)
Annual Savings (Therms
Air Infiltration 65.12 2,658
Attic Insulation 21.25 1,287
Central AC - -
Double Pane Window 91.94 1,995
Floor Insulation 4.39 305
Gas Central Replacement
- -
Heat Pump Replacement - -
Inside Lighting - -
Low-flow Shower Heads - -
Refrigerator Replacement
- -
Smart Thermostat - -
Storm Windows 4.24 294
Vented Space Heater 2.31 149
Wall Insulation - -
Water Heater Insulation 0.01 4
Water Heater Replacement
0.02 9
Water Pipe Insulation 0.10 13
Window AC - -
Window Sealing - -
Total 189.37 6,715
APSC FILED Time: 4/1/2014 12:29:49 PM: Recvd 4/1/2014 11:59:47 AM: Docket 07-075-tf-Doc. 229

2013 Arkansas Weatherization Program EM&V Report
Impact Findings 2-9
Table 2-10 Ex Ante Savings by Measure Type – CenterPoint
Measure
Peak Demand Savings (Therms)
Annual Savings (Therms
Air Infiltration 794.61 31,700
Attic Insulation 167.98 10,326
Central AC - -
Double Pane Window 61.16 1,409
Floor Insulation 20.73 1,293
Gas Central Replacement
70.20 3,581
Heat Pump Replacement - -
Inside Lighting - -
Low-flow Shower Heads - -
Refrigerator Replacement
- -
Smart Thermostat - 357
Storm Windows 48.55 1,505
Vented Space Heater 13.25 818
Wall Insulation 70.79 4,213
Water Heater Insulation 0.13 73
Water Heater Replacement
0.19 78
Water Pipe Insulation 1.10 152
Window AC - -
Window Sealing - 35
Total 1,248.68 55,538
APSC FILED Time: 4/1/2014 12:29:49 PM: Recvd 4/1/2014 11:59:47 AM: Docket 07-075-tf-Doc. 229

2013 Arkansas Weatherization Program EM&V Report
Impact Findings 2-10
Table 2-11 Ex Ante Savings by Measure Type – SourceGas
Measure
Peak Demand Savings (Therms)
Annual Savings (Therms
Air Infiltration 72.48 3,532
Attic Insulation 18.60 1,338
Central AC - -
Double Pane Window 13.01 339
Floor Insulation 20.64 1,581
Gas Central Replacement
2.33 154
Heat Pump Replacement - -
Inside Lighting - -
Low-flow Shower Heads 0.05 16
Refrigerator Replacement
- -
Smart Thermostat - 79
Storm Windows 11.45 334
Vented Space Heater 1.32 80
Wall Insulation 11.53 852
Water Heater Insulation 0.03 15
Water Heater Replacement
- -
Water Pipe Insulation 0.16 20
Window AC - -
Window Sealing - 99
Total 151.59 8,439
Table 2-12 presents the ex ante gas savings that were not associated with any AWP
IOU. As there are few non-IOU gas utility providers in the state of Arkansas, the “non-
IOU” ex ante gas savings may represent propane customers or possibly tracking
database errors that claim gas savings for homes that are not serviced by a gas utility.
Therefore, Table 2-12 is a reflection of the non-IOU ex ante gas savings that are
claimed within the tracking system, and these savings are not applicable to any specific
service provider.
APSC FILED Time: 4/1/2014 12:29:49 PM: Recvd 4/1/2014 11:59:47 AM: Docket 07-075-tf-Doc. 229

2013 Arkansas Weatherization Program EM&V Report
Impact Findings 2-11
Table 2-12 Ex Ante Savings Values by Measure Type – Non-IOU (Gas)
Measure
Peak Demand Savings (Therms)
Annual Savings (Therms
Air Infiltration 82.69 3,202
Attic Insulation 10.65 664
Central AC - -
Double Pane Window 9.28 204
Floor Insulation 4.74 329
Gas Central Replacement
6.29 285
Heat Pump Replacement - -
Inside Lighting - -
Low-flow Shower Heads - -
Refrigerator Replacement
- -
Smart Thermostat - -
Storm Windows 1.62 31
Vented Space Heater 4.92 311
Wall Insulation - -
Water Heater Insulation 0.01 8
Water Heater Replacement
- -
Water Pipe Insulation 0.13 18
Window AC - -
Window Sealing - 1
Total 120.33 5,053
2.3 Gross Savings Calculation Methodology
For equipment and retrofits rebated through the 2013 program, calculation
methodologies were performed as described in the applicable TRM. Table 2-13
identifies the sections in the applicable TRM that were used for verification of measure-
level savings under the AWP. There were three measures implemented under the AWP
that are not addressed within the set of TRM savings algorithms. The ex ante savings
for these measures resulted from NEAT/MHEA stipulated calculations. As these
measures accounted for a minor portion of total program savings, the Evaluators
deferred to the NEAT/MHEA results during savings verification.
APSC FILED Time: 4/1/2014 12:29:49 PM: Recvd 4/1/2014 11:59:47 AM: Docket 07-075-tf-Doc. 229

2013 Arkansas Weatherization Program EM&V Report
Impact Findings 2-12
Table 2-13 TRM Sections by Measure Type
Measure TRM Version Section in TRM
Air Infiltration 3.0 2.2.9
Attic Insulation 3.0 2.2.2
Central AC 3.0 2.1.6
Double Pane Window 3.0 2.2.7
Floor Insulation 3.0 2.2.4
Gas Central Replacement 2.0 2.1.3
Heat Pump Replacement 3.0 2.1.8
Inside Lighting 3.0 2.5.1
Low-flow Shower Heads 3.0 2.3.5
Refrigerator Replacement 3.0 2.4.3
Smart Thermostat N/A N/A
Storm Windows N/A N/A
Vented Space Heater 3.0 2.1.1
Wall Insulation 3.0 2.2.3
Water Heater Insulation 3.0 2.3.2
Water Heater Replacement 3.0 2.3.1
Water Pipe Insulation 3.0 2.3.3
Window AC 3.0 2.1.10
Window Sealing N/A N/A
Three measures accounted for the majority of the gross savings for the AWP: air
infiltration reduction, attic insulation, and indoor lighting (the replacement of
incandescent lamps with compact fluorescent lamps). The calculation methodologies for
these measures are detailed in the following sections. In these examples, energy units
are expressed in kWh.
2.3.1 Air Infiltration Reduction Savings Calculations
The deemed savings values for air infiltration reduction were developed through
EnergyGauge, a simulation software program. Multiple equipment configurations were
simulated in each of the four Arkansas weather zones in developing savings values
denominated in deemed savings per CFM50 of air leakage rate reduction. The
following table summarizes the deemed savings values for Weather Zone 7 (from TRM
V3.0).
APSC FILED Time: 4/1/2014 12:29:49 PM: Recvd 4/1/2014 11:59:47 AM: Docket 07-075-tf-Doc. 229

2013 Arkansas Weatherization Program EM&V Report
Impact Findings 2-13
Table 2-14 Deemed Savings Values for Air Infiltration Reduction, Zone 7
Equipment Type kWh Savings /
CFM50 kW Savings /
CFM50 Therm Savings /
CFM50 Peak Therms /
CFM50
Electric AC with Gas Heat
0.2387 0.0002171 0.0790 0.001853
Gas Heat Only (no AC)
0.0565 n/a 0.0790 0.001853
Elec. AC with Resistance heat
1.7891 0.0001584 n/a n/a
Heat Pump 1.1295 0.0001584 n/a n/a
The following example considers a residence in Weather Zone 7 with electric AC and
gas heat. If the residence had a leakage rate of 16,100 CFM50 before air infiltration
reduction and a leakage rate of 7,220 CFM50 after, then the residence would have an
annual gross savings of 2,120 kWh.
( )
It should be noted that as the air infiltration calculation is based on whole house leakage
reduction, this calculation accounts for leakage reductions from a wide range of building
shell improvements. These improvements include door sweeps, structural repairs, and
window sealing measures. Although window sealing was performed on many homes
that received overall air infiltration work, this air infiltration calculation inherently includes
the leakage reduction resulting from the window sealing measure. Therefore, homes
that claimed ex ante savings for both the air infiltration and window sealing measures
only received verified gross savings for the air infiltration measure. This determination
was also applied to 2012 program savings.
2.3.2 Attic Insulation Savings Calculations
The deemed savings values for ceiling insulation were developed through
EnergyGauge, a simulation software program. Multiple equipment configurations were
simulated in each of the four Arkansas weather zones in developing savings values
denominated in deemed savings per square footage of ceiling area. Table 2-15
summarizes the deemed savings values for Weather Zone 8 (from TRM V3.0).
APSC FILED Time: 4/1/2014 12:29:49 PM: Recvd 4/1/2014 11:59:47 AM: Docket 07-075-tf-Doc. 229

2013 Arkansas Weatherization Program EM&V Report
Impact Findings 2-14
Table 2-15 Deemed Savings Values for Ceiling Insulation, Zone 8
Ceiling Insulation Base
R- Value
AC/Gas Heat
kWh/sq ft
Gas Heat (no AC)
Therms/sq ft
AC/Electrical Resistance kWh/sq ft
Heat Pump
kWh/sq ft
AC Peak Savings kW/ sq ft
Peak Gas Savings
Therms/sq ft
0 to 4 1.53 0.145 4.8 2.83 0.00115 0.00244
5 to 8 0.756 0.0841 2.65 1.53 0.00038 0.00140
9 to 14 0.451 0.0547 1.68 0.969 0.00029 0.00090
15 to 22 0.28 0.0359 1.1 0.629 0.00013 0.00059
The following example considers a residence in Weather Zone 8 with a heat pump, and
a pre-retrofit R-value of ceiling insulation in the range of 9 to 14. If the residence has a
ceiling area of 1,200 sq. ft., then the residence would have an annual gross savings of
1,163 kWh.
( )
2.3.3 Compact Fluorescent Lamps (CFLs) Savings Calculations
The deemed savings for compact fluorescent lamps can be calculated by using the
following equation.
(( ) )
The inputs, which assume the following prerequisite knowledge, can be found in Section
2.5.1 of TRM V3.0:
The quantity and wattages of both pre and post fixtures;
Whether or not the retrofits were indoor or outdoor;
Whether or not the retrofits were time of sale or direct install; and
The heating type of the residence.
For example, if in March 2013 (5) 23W CFLs were directly installed to replace (5) 75W
incandescent lamps in a residence with gas heating, then the residence would have an
annual gross savings of 231.0kWh.
(( )
2.4 Net Savings Determination
The Evaluators conducted a net-to-gross assessment of the program in 2012 in order to
determine the likelihood of significant free-ridership or savings spillover. Feedback
obtained from customers, community action agencies, and utility staff indicates that the
likelihood for program free-ridership is very low. As a high percentage of AWP
participants qualified for and participated in the income-qualified statewide
APSC FILED Time: 4/1/2014 12:29:49 PM: Recvd 4/1/2014 11:59:47 AM: Docket 07-075-tf-Doc. 229

2013 Arkansas Weatherization Program EM&V Report
Impact Findings 2-15
Weatherization Assistance Program (WAP), they are unlikely to be candidates for free-
ridership in the AWP. The promotional structure of the AWP targets customer groups
who would be very unlikely to pursue these weatherization projects in the absence of
the program, and who would likely not seek out an energy audit at their own cost.
Additionally, participants who were visited by the Evaluators’ field staff were asked a
series of questions related to program savings spillover, and none of these customers
identified any potential spillover savings.
Due to these factors, the Evaluators determined the net-to-gross ratio for the Arkansas
Weatherization Program to be 1, or 100% of gross savings, for the 2012 program year.
This determination has been carried over and applied to the 2013 program year, and
2013 AWP gross savings are equal to net savings. This determination may be modified,
with an additional net-to-gross assessment required, if the portion of participants who
provide their own private co-pay (non-WAP) increases significantly.
2.5 Verified Savings by Measure
After reviewing the tracking data and inputs for savings calculations, the Evaluators
provided verified gross savings according to TRM protocols. Savings from the following
measures were verified and matched or mostly matched the calculations provided by
Frontier Associates:
Central AC;
Gas Central Replacement;
Low-flow Shower Heads;
Refrigerator Replacement;
Water Heater Insulation; and
Water Pipe Insulation.
The savings calculated through this verification process differed from Frontier
Associates’ calculations for several items in the applicable TRM. The Evaluators verified
measure-level savings according to the applicable TRM guidelines and obtained results
that differed from Frontier Associates’ calculations for the following measures:
Air Infiltration, Attic Insulation, Double Pane Windows, and Floor Insulation
- According to all versions of the TRM (V1.0, V2.0, V3.0), savings for these
measures are calculated with a deemed value that is a function of a
household’s heating and cooling equipment type (i.e., electric air
conditioning with gas heat, or gas heat only, or electric air conditioning with
resistance heat, or a heat pump). The ex ante savings were calculated
using the appropriate TRM methodologies; however, for some households,
an incorrect heating and cooling equipment type was applied.
APSC FILED Time: 4/1/2014 12:29:49 PM: Recvd 4/1/2014 11:59:47 AM: Docket 07-075-tf-Doc. 229

2013 Arkansas Weatherization Program EM&V Report
Impact Findings 2-16
Heat Pump Replacement
- According to Section 2.1.8 of TRM V2.0 and TRM V3.0, there are cooling
energy savings and heating energy savings associated with the heat pump
replacement measure. The cooling and heating savings are a function of
size (tons). The data provided by Frontier Associates tracks a size for
cooling, as well as a size for heating. The evaluators utilized the
corresponding size when calculating the savings associated with heating
and with cooling. However, ex ante savings were calculating using only
cooling size for both cooling and heating savings.
Inside Lighting (CFLs)
- The Evaluators applied TRM V3.0 to estimate savings for the inside lighting
measure, resulting in higher savings than were claimed for lighting in the
tracking data.
Wall Insulation
- According to Section 2.2.3 of TRM V3.0 and TRM V2.0, the minimum
efficiency standard is an R-value of 13. However, all but one household
had an R-value of only 11 and, therefore, did not qualify for savings.
Savings for some of the measure types could not be verified due to a lack of information
within the tracking data received or within the TRM. As these measures comprised a
small portion of overall program savings, they are considered low rigor measures that
did not call for additional data input collection during the evaluation. Thus, the
Evaluators deferred to the listed ex ante savings and carried these values over to the ex
post results. These measures include:
Smart Thermostat, Storm Windows, Window Sealing
- These measures are not detailed in the TRM, and savings were obtained
from NEAT/MHEA calculations. The Smart Thermostat measure only
accounts for 0.215% of the overall claimed kWh savings and 0.056% of
the overall claimed Therms savings. The Storm Windows measure only
accounts for 1.811% of the overall claimed kWh savings and 0.278% of
the overall claimed Therms savings. The Window Sealing measure
accounts for 0.036% of the overall claimed kWh savings and 0.017% of
the overall claimed Therms savings. However, the Evaluators determined
that the claimed Window Sealing savings were already accounted for
under the Air Infiltration measure.
Direct Vent Heaters
- As described in Section 2.1.1 of TRM V3.0, savings for direct vent heaters
are calculated as a function of the heat load, and the AFUE of the baseline
and energy efficient equipment. A deemed value for the heating load is
APSC FILED Time: 4/1/2014 12:29:49 PM: Recvd 4/1/2014 11:59:47 AM: Docket 07-075-tf-Doc. 229

2013 Arkansas Weatherization Program EM&V Report
Impact Findings 2-17
available in the TRM as a function of square feet. However, in the data
provided by Frontier Associates, square feet were unavailable, and as a
result, savings could not be verified. This measure accounts for only
1.79% of the claimed Therms savings.
Water Heater Replacement
- As described in Section 2.3.1 of TRM V3.0, savings for water heaters are
calculated as a function of the energy factor (EF) of the baseline and
energy efficient equipment. In the data provided by Frontier Associates,
there was a column tracking the EF of the energy efficient equipment;
however, it was not populated, and as a result, savings could not be
verified. This measure accounts for only 0.019% of the claimed kWh
savings, and 0.011% of the claimed Therms savings
Window AC
- In section 2.1.10 of TRMV3.0, savings for window air conditioners are
calculated as a function of the capacity, and the energy efficiency rating
(EER) of the baseline and energy efficient equipment. Not all of the EER
values tracked in the data provided by Frontier Associates correspond to a
deemed value in the TRM. This measure accounts for only 0.058% of the
claimed kWh savings.
Table 2-16 presents the savings results of the evaluation of the 2013 Arkansas
Weatherization Program, by measure. Total savings summarizes the savings
calculations performed as per TRM protocols for the AWP. As discussed above, the net-
to-gross ratio for the 2013 program year is 1.
APSC FILED Time: 4/1/2014 12:29:49 PM: Recvd 4/1/2014 11:59:47 AM: Docket 07-075-tf-Doc. 229

2013 Arkansas Weatherization Program EM&V Report
Impact Findings 2-18
Table 2-16 Net Verified Savings by Measure Type – Overall
Measure
Peak Demand Savings
(kW)
Annual Savings (kWh)
Lifetime Savings (kWh)
Peak Demand Savings (Therms)
Annual Savings (Therms)
Lifetime Savings (Therms)
Air Infiltration 69.77 180,764 1,988,405 1,012.94 41,064 451,702
Attic Insulation 86.10 115,579 2,311,586 183.48 11,486 229,718
Central AC 17.66 40,658 609,870 - - -
Double Pane Window 46.76 64,510 1,290,193 175.11 3,943 78,861
Floor Insulation - 16,192 323,837 50.93 3,564 71,288
Gas Central Replacement - - - 76.38 3,883 77,668
Heat Pump Replacement 2.30 25,610 384,150 - - -
Inside Lighting 27.72 168,669 1,315,620 - - -
Low-flow Shower Heads - - - 0.05 16 161
Refrigerator Replacement 0.59 4,240 64,408 - - -
Smart Thermostat - 1,675 20,096 - 436 5,232
Storm Windows 2.62 14,113 282,267 65.85 2,164 43,280
Vented Space Heater - - - 21.81 1,358 27,151
Wall Insulation 0.49 1,140 22,796 6.96 514 10,286
Water Heater Insulation 0.10 1,292 16,796 0.18 100 1,299
Water Heater Replacement 0.01 147 1,906 0.21 87 955
Water Pipe Insulation 0.45 1,429 18,571 1.49 205 2,250
Window AC 0.10 450 4,725 - - -
Window Sealing - - - - - -
Total 254.66 636,467 8,655,227 1,595.39 68,820 999,852
2.6 Verified Savings for Electric Utilities
The participating electric utilities are AEP-SWEPCO, EDEC, EAI, and OG&E. Table
2-17 presents the savings results of the evaluation of the 2013 AWP for electric utilities.
Table 2-18 through Table 2-21 summarize the savings by measure for each electric
utility.
The overall realization rates for electric utilities ranged from 54% to 90%. Low
realization rates were primarily due to some homes being labeled with a specific heating
or cooling type, but where the EnerTrek calculation assumed a different cooling or
heating type that overestimated savings. The most notable instances of this involved
attic insulation, air infiltration, and window replacement. As these measure types were
not evenly distributed across service territories, overall realization rates varied widely
among IOUs. This appears to be a savings algorithm issue rather than a data collection
issue. Resolving this error should be fairly straightforward and require only a minor
adjustment to the EnerTrek savings algorithms.
APSC FILED Time: 4/1/2014 12:29:49 PM: Recvd 4/1/2014 11:59:47 AM: Docket 07-075-tf-Doc. 229

2013 Arkansas Weatherization Program EM&V Report
Impact Findings 2-19
Table 2-17 Net Verified Savings by Electric Utility
Electric Utility # of
Homes
Peak Demand
Annual Savings
Lifetime Savings Realization
Rate Savings (kW)
(kWh) (kWh)
AEP-SWEPCO 29 18.50 47,714 664,523 59%
EDEC 1 0.36 3,240 33,577 54%
EAI 177 161.48 444,779 5,909,257 85%
OG&E 35 31.41 54,516 905,726 90%
Non-IOU 49 42.91 86,217 1,142,144 82%
Total 291 254.66 636,467 8,655,227 82%
Table 2-18 Net Verified Savings by Measure Type – AEP – SWEPCO
Measure
Peak Demand Savings
(kW)
Annual Savings (kWh)
Lifetime Savings (kWh)
Realization Rate
Air Infiltration 4.68 9,942 109,357 54%
Attic Insulation 9.61 15,977 319,537 60%
Central AC - - - -
Double Pane Window 0.45 626 12,511 33%
Floor Insulation - 708 14,167 81%
Gas Central Replacement - - - -
Heat Pump Replacement 0.27 1,718 25,770 163%
Inside Lighting 2.39 15,098 117,762 110%
Low-flow Shower Heads - - - -
Refrigerator Replacement 0.05 357 5,717 93%
Smart Thermostat - 469 5,627 100%
Storm Windows 0.42 1,402 28,035 100%
Vented Space Heater - - - -
Wall Insulation 0.49 1,140 22,796 7%
Water Heater Insulation - - - -
Water Heater Replacement
- - - -
Water Pipe Insulation 0.04 128 1,669 101%
Window AC 0.10 150 1,575 100%
Window Sealing - - - -
Total 18.50 47,714 664,523 59%
APSC FILED Time: 4/1/2014 12:29:49 PM: Recvd 4/1/2014 11:59:47 AM: Docket 07-075-tf-Doc. 229

2013 Arkansas Weatherization Program EM&V Report
Impact Findings 2-20
Table 2-19 Net Verified Savings by Measure Type – EDEC
Measure
Peak Demand Savings
(kW)
Annual Savings (kWh)
Lifetime Savings (kWh)
Realization Rate
Air Infiltration 0.22 2,594 28,535 100%
Attic Insulation - - - -
Central AC - - - -
Double Pane Window - - - -
Floor Insulation - - - -
Gas Central Replacement - - - -
Heat Pump Replacement - - - 0%
Inside Lighting 0.13 646 5,041 91%
Low-flow Shower Heads - - - -
Refrigerator Replacement - - - -
Smart Thermostat - - - -
Storm Windows - - - -
Vented Space Heater - - - -
Wall Insulation - - - -
Water Heater Insulation - - - -
Water Heater Replacement
- - - -
Water Pipe Insulation - - - -
Window AC - - - -
Window Sealing - - - -
Total 0.36 3,240 33,577 54%
APSC FILED Time: 4/1/2014 12:29:49 PM: Recvd 4/1/2014 11:59:47 AM: Docket 07-075-tf-Doc. 229
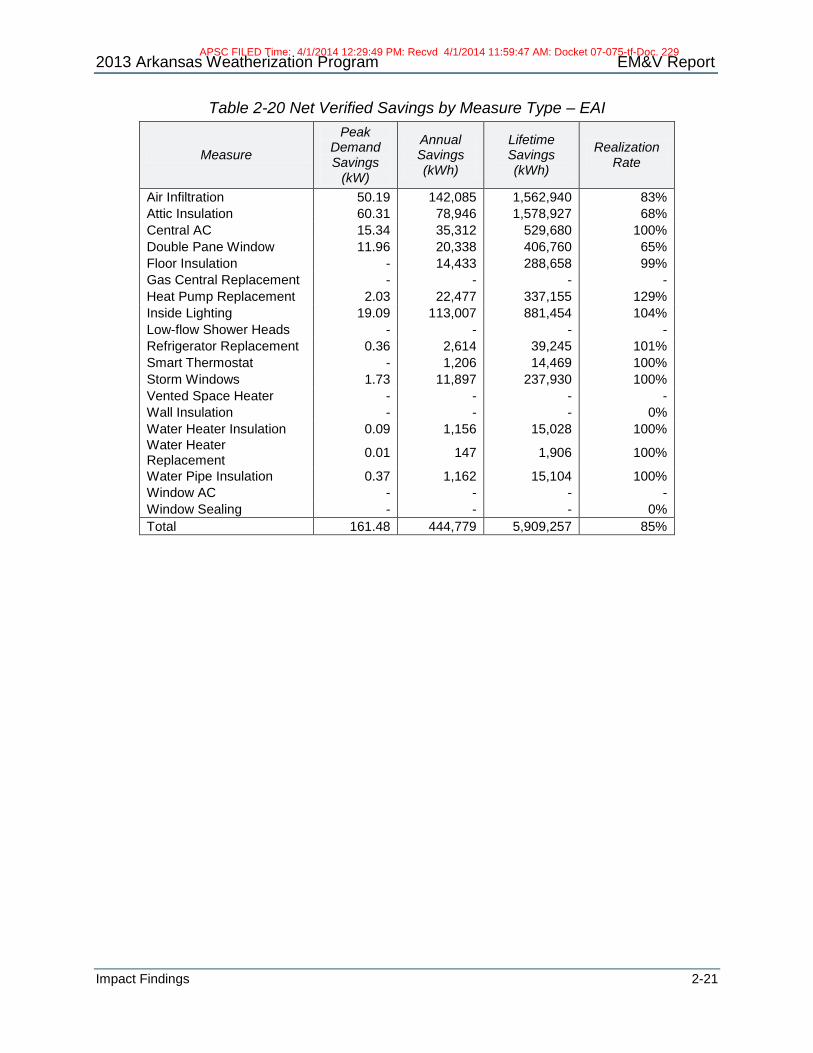
2013 Arkansas Weatherization Program EM&V Report
Impact Findings 2-21
Table 2-20 Net Verified Savings by Measure Type – EAI
Measure
Peak Demand Savings
(kW)
Annual Savings (kWh)
Lifetime Savings (kWh)
Realization Rate
Air Infiltration 50.19 142,085 1,562,940 83%
Attic Insulation 60.31 78,946 1,578,927 68%
Central AC 15.34 35,312 529,680 100%
Double Pane Window 11.96 20,338 406,760 65%
Floor Insulation - 14,433 288,658 99%
Gas Central Replacement - - - -
Heat Pump Replacement 2.03 22,477 337,155 129%
Inside Lighting 19.09 113,007 881,454 104%
Low-flow Shower Heads - - - -
Refrigerator Replacement 0.36 2,614 39,245 101%
Smart Thermostat - 1,206 14,469 100%
Storm Windows 1.73 11,897 237,930 100%
Vented Space Heater - - - -
Wall Insulation - - - 0%
Water Heater Insulation 0.09 1,156 15,028 100%
Water Heater Replacement
0.01 147 1,906 100%
Water Pipe Insulation 0.37 1,162 15,104 100%
Window AC - - - -
Window Sealing - - - 0%
Total 161.48 444,779 5,909,257 85%
APSC FILED Time: 4/1/2014 12:29:49 PM: Recvd 4/1/2014 11:59:47 AM: Docket 07-075-tf-Doc. 229

2013 Arkansas Weatherization Program EM&V Report
Impact Findings 2-22
Table 2-21 Net Verified Savings by Measure Type – OG&E
Measure
Peak Demand Savings
(kW)
Annual Savings (kWh)
Lifetime Savings (kWh)
Realization Rate
Air Infiltration 1.92 7,016 77,176 86%
Attic Insulation 2.66 3,716 74,315 42%
Central AC - - - -
Double Pane Window 25.13 32,187 643,733 97%
Floor Insulation - 147 2,945 64%
Gas Central Replacement - - - -
Heat Pump Replacement - 1,415 21,225 117%
Inside Lighting 1.46 9,026 70,405 114%
Low-flow Shower Heads - - - -
Refrigerator Replacement 0.07 495 7,855 103%
Smart Thermostat - - - -
Storm Windows 0.15 252 5,040 100%
Vented Space Heater - - - -
Wall Insulation - - - -
Water Heater Insulation 0.01 68 884 100%
Water Heater Replacement
- - - -
Water Pipe Insulation 0.01 44 574 101%
Window AC - 150 1,575 100%
Window Sealing - - - 0%
Total 31.41 54,516 905,726 90%
Table 2-22 presents the electric savings that were not associated with any AWP IOU.
These savings are attributable to municipal utilities, co-op utilities, or other energy
providers. Thus, the savings are not attributed to any specific program sponsoring utility,
and are provided for reference only.
APSC FILED Time: 4/1/2014 12:29:49 PM: Recvd 4/1/2014 11:59:47 AM: Docket 07-075-tf-Doc. 229

2013 Arkansas Weatherization Program EM&V Report
Impact Findings 2-23
Table 2-22 Net Verified Savings by Measure Type – Non-IOU (Electric)
Measure
Peak Demand Savings
(kW)
Annual Savings (kWh)
Lifetime Savings (kWh)
Realization Rate
Air Infiltration 12.74 19,127 210,397 65%
Attic Insulation 13.52 16,940 338,807 68%
Central AC 2.32 5,346 80,190 100%
Double Pane Window 9.22 11,359 227,189 95%
Floor Insulation - 903 18,067 85%
Gas Central Replacement - - - -
Heat Pump Replacement - - - -
Inside Lighting 4.64 30,892 240,958 116%
Low-flow Shower Heads - - - -
Refrigerator Replacement 0.11 774 11,591 92%
Smart Thermostat - - - -
Storm Windows 0.32 563 11,262 100%
Vented Space Heater - - - -
Wall Insulation - - - 0%
Water Heater Insulation 0.01 68 884 100%
Water Heater Replacement
- - - -
Water Pipe Insulation 0.03 94 1,224 103%
Window AC - 150 1,575 100%
Window Sealing - - - 0%
Total 42.91 86,217 1,142,144 82%
2.7 Verified Savings for Gas Utilities
The participating gas utilities are AOG, CenterPoint, and SourceGas. Table 2-23
presents the savings results of the evaluation of the 2013 AWP for gas utilities and for
non-IOU savings sources. Table 2-24 through Table 2-26 summarize the savings by
measure for each gas utility.
The primary reason that the realization rate is less than 100% is that the EnerTrek
savings algorithms calculated savings for attic insulation measures that did not meet the
stipulated R-value within the TRM. Resolving this issue within EnerTrek should be
straightforward, and will involve adjusting the savings algorithm to eliminate savings for
any measures that do not meet minimum R-value requirements. Additionally,
community action agency contractors should avoid implementing insulation measures
that do not meet minimum R-value requirements in the TRM. Implementing measures
that do not achieve savings reduces overall program cost-effectiveness.
APSC FILED Time: 4/1/2014 12:29:49 PM: Recvd 4/1/2014 11:59:47 AM: Docket 07-075-tf-Doc. 229

2013 Arkansas Weatherization Program EM&V Report
Impact Findings 2-24
Table 2-23 Net Verified Savings by Gas Utility
Gas Utility # of
Homes
Peak Demand Savings (Therms)
Annual Savings (Therms)
Lifetime Savings (Therms)
Realization Rate
AOG 36 179.2623191 6,100 97,852 91%
CenterPoint 177 1152.428749 49,858 706,563 90%
SGA 23 144.1994378 7,829 123,705 93%
Non-IOU 55 119.5031302 5,032 71,732 100%
Total 291 1,595.39 68,820 999,852 91%
Table 2-24 Net Verified Savings by Measure Type – AOG
Measure Peak Demand
Savings (Therms)
Annual Savings (Therms)
Lifetime Savings (Therms)
Realization Rate
Air Infiltration 65.12 2,658 29,243 100%
Attic Insulation 11.14 672 13,442 52%
Central AC - - - -
Double Pane Window 91.94 1,995 39,902 100%
Floor Insulation 4.39 305 6,102 100%
Gas Central Replacement
- - - -
Heat Pump Replacement - - - -
Inside Lighting - - - -
Low-flow Shower Heads - - - -
Refrigerator Replacement
- - - -
Smart Thermostat - - - -
Storm Windows 4.24 294 5,880 100%
Vented Space Heater 2.31 149 2,982 100%
Wall Insulation - - - -
Water Heater Insulation 0.01 4 51 100%
Water Heater Replacement
0.02 9 99 100%
Water Pipe Insulation 0.10 14 150 101%
Window AC - - - -
Window Sealing - - - -
Total 179.26 6,100 97,852 91%
APSC FILED Time: 4/1/2014 12:29:49 PM: Recvd 4/1/2014 11:59:47 AM: Docket 07-075-tf-Doc. 229

2013 Arkansas Weatherization Program EM&V Report
Impact Findings 2-25
Table 2-25 Net Verified Savings by Measure Type – CenterPoint
Measure Peak Demand
Savings (Therms)
Annual Savings (Therms)
Lifetime Savings (Therms)
Realization Rate
Air Infiltration 793.20 31,684.19 348,526 100%
Attic Insulation 145.92 8,983.69 179,674 87%
Central AC - - - -
Double Pane Window 61.16 1,408.60 28,172 100%
Floor Insulation 21.15 1,353.57 27,071 105%
Gas Central Replacement 67.77
3,444.80 68,896 96%
Heat Pump Replacement - - - -
Inside Lighting - - - -
Low-flow Shower Heads - - - -
Refrigerator Replacement -
- - -
Smart Thermostat - 357.00 4,284 100%
Storm Windows 48.55 1,505.00 30,100 100%
Vented Space Heater 13.25 817.81 16,356 100%
Wall Insulation - - - 0%
Water Heater Insulation 0.13 72.79 946 100%
Water Heater Replacement 0.19
77.80 856 100%
Water Pipe Insulation 1.11 152.89 1,682 101%
Window AC - - - -
Window Sealing - - - 0%
Total 1,152.43 49,858.14 706,563 90%
APSC FILED Time: 4/1/2014 12:29:49 PM: Recvd 4/1/2014 11:59:47 AM: Docket 07-075-tf-Doc. 229

2013 Arkansas Weatherization Program EM&V Report
Impact Findings 2-26
Table 2-26 Net Verified Savings by Measure Type – Source Gas
Measure Peak Demand
Savings (Therms)
Annual Savings (Therms)
Lifetime Savings (Therms)
Realization Rate
Air Infiltration 72.48 3,532.40 38,856 100%
Attic Insulation 15.77 1,165.79 23,316 87%
Central AC - - - -
Double Pane Window 13.01 339.42 6,788 100%
Floor Insulation 20.64 1,578.42 31,568 100%
Gas Central Replacement 2.33
153.75 3,075 100%
Heat Pump Replacement - - - -
Inside Lighting - - - -
Low-flow Shower Heads 0.05 16.09 161 100%
Refrigerator Replacement -
- - -
Smart Thermostat - 79.00 948 100%
Storm Windows 11.45 334.00 6,680 100%
Vented Space Heater 1.32 80.12 1,602 100%
Wall Insulation 6.96 514.28 10,286 60%
Water Heater Insulation 0.03 15.26 198 100%
Water Heater Replacement -
- - -
Water Pipe Insulation 0.16 20.48 225 101%
Window AC - - - -
Window Sealing - - - 0%
Total 144.20 7,829.02 123,705 93%
Table 2-27 presents the gas savings that were not associated with any AWP IOU. As
there are few non-IOU gas utility providers in the state of Arkansas, the “non-IOU” ex
ante gas savings may represent propane customers or possibly tracking database
errors that claim gas savings for homes that are not serviced by a gas utility. Therefore,
Table 2-27 is a reflection of the non-IOU gas savings that are claimed within the
tracking system, and these savings are not applicable to any specific service provider.
APSC FILED Time: 4/1/2014 12:29:49 PM: Recvd 4/1/2014 11:59:47 AM: Docket 07-075-tf-Doc. 229

2013 Arkansas Weatherization Program EM&V Report
Impact Findings 2-27
Table 2-27 Net Savings by Measure Type – Non-IOU (Gas)
Measure Peak Demand
Savings (Therms)
Annual Savings (Therms)
Lifetime Savings (Therms)
Realization Rate
Air Infiltration 82.14 3,188.78 35,077 100%
Attic Insulation 10.65 664.32 13,286 100%
Central AC - - - -
Double Pane Window 9.00 199.96 3,999 98%
Floor Insulation 4.74 327.32 6,546 99%
Gas Central Replacement
6.29 284.82 5,696 100%
Heat Pump Replacement - - - -
Inside Lighting - - - -
Low-flow Shower Heads - - - -
Refrigerator Replacement
- - - -
Smart Thermostat - - - -
Storm Windows 1.62 31.00 620 100%
Vented Space Heater 4.92 310.53 6,211 100%
Wall Insulation - - - -
Water Heater Insulation 0.01 7.92 103 100%
Water Heater Replacement
- - - -
Water Pipe Insulation 0.12 17.60 194 99%
Window AC - - - -
Window Sealing - - - 0%
Total 119.50 5,032.24 71,732 100%
2.8 Regression Analysis of Customer Billing Data
Utilizing both 2012 and 2013 participants in the AWP, the Evaluators conducted a
regression analysis in order to estimate the reasonableness of measure level savings
reported in the TRM. This analysis was performed as a research activity that may be
used to inform future TRM updates and to gain insight into participant behavioral
effects.
The Evaluators received a sample of monthly billing data for 2012 and 2013 program
participants. The billing data spanned from January 2011 to October 2013.
2.8.1 Control Group Selection
The inherent difficulty in conducting a billing analysis for the AWP is the lack of a
randomized control group. As assignment into the participant group was non-random, it
is necessary to select a control group that can successfully replicate the usage profile of
the participants. In this analysis, the 2012 cohort was assigned as the treatment group,
with the 2013 cohort as the control when analyzing 2012 program effects. This is
detailed in Error! Reference source not found..
APSC FILED Time: 4/1/2014 12:29:49 PM: Recvd 4/1/2014 11:59:47 AM: Docket 07-075-tf-Doc. 229

2013 Arkansas Weatherization Program EM&V Report
Impact Findings 2-28
The 2013 participants are the most viable, available replacement for a randomized
control group because their selection into the program necessitates that they have
similar needs and home characteristics. The only drawback to using the 2013 group as
a control is the delay that this imposes on the analysis. As such, the results from this
year’s evaluation will be comparable to measures installed in 2012. The analysis will
only use Pre-Implementation data from the 2013 Cohort as a control.
Table 2-28 Detail of Treatment and Control Specifications by Year
Year 2012 Cohort (Treatment) 2013 Cohort (Control)
2011 Pre-Implementation Pre-Implementation
2012 Mix of Pre and Post data Pre-Implementation
2013 Post Implementation Pre-Implementation
2.8.2 Regression Model Specification
The regression models utilize a fixed effects specification with pre/post data for
treatment and control groups. Specifically, monthly treatment and controls data were
used from 2011 to 2013 and incorporated with weather data. The weather data were
matched using a representative city for each IOU. This is specified in Error! Reference
ource not found..
Table 2-29 Weather Data Source by IOU
IOU Weather Station
OGE Fort Smith, KSFM
AOG Little Rock, KLIT
AEP-SWEPCO Texarkana, KTXK
EAI Little Rock, KLIT
Centerpoint Little Rock, KLIT
SGA Fort Smith, KSFM
For each weather station, daily Heating Degree Days (HDD) and Cooling Degree Days
(CDD) are calculated with a base of 65 degrees. These values are matched by IOU to
each customer’s usage data by billing period.
The fixed-effects regression model was specified as follows:
4
4 This equation is used for both kWh and Therms regressions. The two models were determined to have the same
specification (using both HDD and CDD) after checking the coefficients for statistical significance.
APSC FILED Time: 4/1/2014 12:29:49 PM: Recvd 4/1/2014 11:59:47 AM: Docket 07-075-tf-Doc. 229
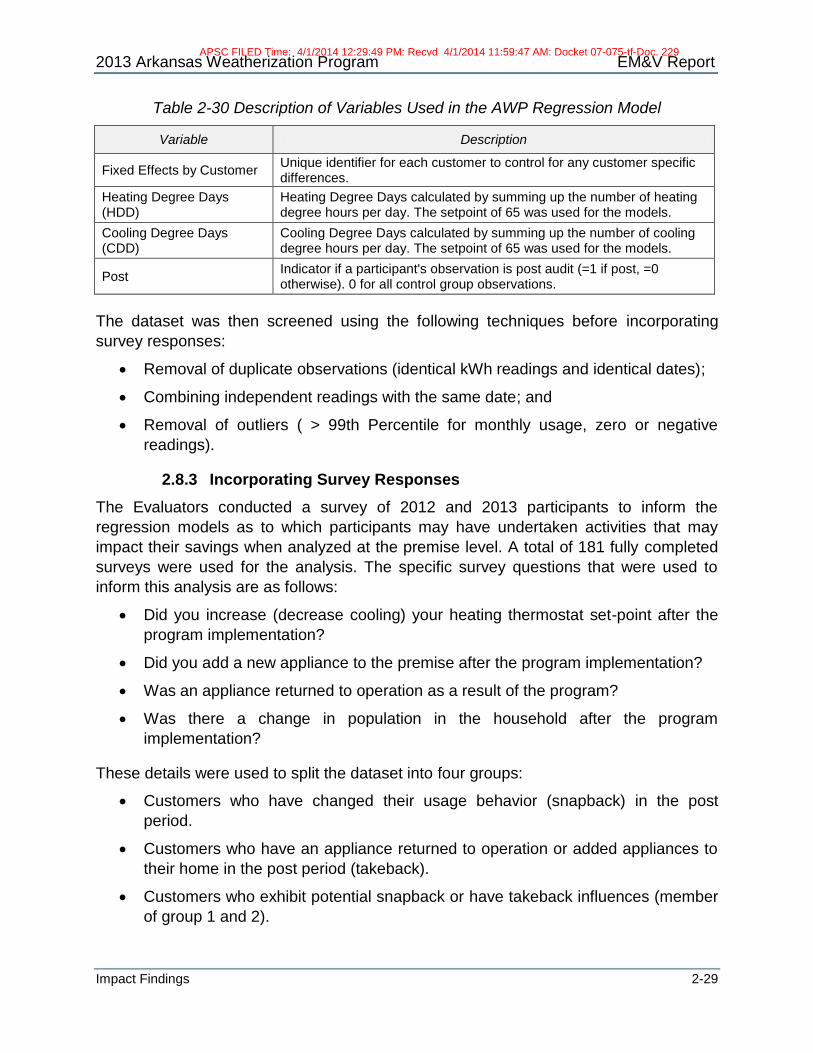
2013 Arkansas Weatherization Program EM&V Report
Impact Findings 2-29
Table 2-30 Description of Variables Used in the AWP Regression Model
Variable Description
Fixed Effects by Customer Unique identifier for each customer to control for any customer specific differences.
Heating Degree Days (HDD)
Heating Degree Days calculated by summing up the number of heating degree hours per day. The setpoint of 65 was used for the models.
Cooling Degree Days (CDD)
Cooling Degree Days calculated by summing up the number of cooling degree hours per day. The setpoint of 65 was used for the models.
Post Indicator if a participant's observation is post audit (=1 if post, =0 otherwise). 0 for all control group observations.
The dataset was then screened using the following techniques before incorporating
survey responses:
Removal of duplicate observations (identical kWh readings and identical dates);
Combining independent readings with the same date; and
Removal of outliers ( > 99th Percentile for monthly usage, zero or negative
readings).
2.8.3 Incorporating Survey Responses
The Evaluators conducted a survey of 2012 and 2013 participants to inform the
regression models as to which participants may have undertaken activities that may
impact their savings when analyzed at the premise level. A total of 181 fully completed
surveys were used for the analysis. The specific survey questions that were used to
inform this analysis are as follows:
Did you increase (decrease cooling) your heating thermostat set-point after the
program implementation?
Did you add a new appliance to the premise after the program implementation?
Was an appliance returned to operation as a result of the program?
Was there a change in population in the household after the program
implementation?
These details were used to split the dataset into four groups:
Customers who have changed their usage behavior (snapback) in the post
period.
Customers who have an appliance returned to operation or added appliances to
their home in the post period (takeback).
Customers who exhibit potential snapback or have takeback influences (member
of group 1 and 2).
APSC FILED Time: 4/1/2014 12:29:49 PM: Recvd 4/1/2014 11:59:47 AM: Docket 07-075-tf-Doc. 229

2013 Arkansas Weatherization Program EM&V Report
Impact Findings 2-30
The full data set consisting of all customers who completed a survey, regardless
of response indicators.
2.8.4 Regression Results
Four separate regression models are tested to evaluate the program savings versus the
TRM determined values in 2012. The first model excludes participants who exhibit
snapback activities in the post period. The second excludes participants who exhibit
takeback behaviors. The third excludes both takeback and snapback, providing the
most un-impacted savings value that is comparable with TRM values. The fourth model
contains all participants.
The coefficient of importance in the models is HDD65*Post, as it determines the
program impacts. As only the interaction term HDD65*Post has statistical significance, it
alone will be used to calculate per premise savings. The results from these regressions
are detailed in Error! Reference source not found..
Table 2-31 Electric Regression Results
Variable Description
Regression Coefficients and Standard Errors
(1) No Snapback (2) No Takeback (3) No Snapback or
Takeback (4) All Participants
HDD65 0.00125 ** 0.00126 ** 0.00131 ** 0.00123 **
-0.00008 -0.00008 -0.00009 -0.00007
CDD65 0.00215 ** 0.00215 ** 0.00218 ** 0.0021 **
-0.00008 -0.00008 -0.00009 -0.00007
HDD65*Post -0.00047 ** -0.00041 ** -0.0006 ** -0.00035 **
-0.00013 -0.00013 -0.00015 -0.00012
Dependent Variable Mean 6.722 6.7125 6.7235 6.7036
Sample Size 1,684 1,612 1,359 2,013
R-Squared 0.6855 0.6572 0.6638 0.6625
Notes: (1) The dependent variable is Log Monthly kWh. (2) * and ** denote statistical significance at the 0.10 level and 0.05 levels, respectively. (3) Standard Errors are in parenthesis. (4) Variables Post and CDD*Post were tested but found to be insignificant and not included in the final model.
2.8.5 Therms Regression Results
The same model specifications are then repeated with Therms as the dependent
variable. The coefficient of importance in the models is HDD65*Post, as it determines
the program impacts. As only the interaction term HDD65*Post has statistical
significance, it alone will be used to calculate per premise savings. The results from this
regression are detailed in Table 2-32.
APSC FILED Time: 4/1/2014 12:29:49 PM: Recvd 4/1/2014 11:59:47 AM: Docket 07-075-tf-Doc. 229

2013 Arkansas Weatherization Program EM&V Report
Impact Findings 2-31
Table 2-32 Gas Regression Results
Variable Description Regression Coefficients and Standard Errors
(1) No Snapback (2) No Takeback (3) No Snapback or
Takeback (4) All Participants
HDD65 0.003 ** 0.00285 ** 0.00291 ** 0.00293 **
-0.00009 -0.0001 -0.00011 -0.00008
CDD65 -0.00129 ** -0.00142 ** -0.00153 ** -0.00124 **
-0.00009 -0.00011 -0.00012 -0.00008
HDD65*Post -0.00028 ** -0.00038 ** -0.00043 ** -0.00027 **
-0.00013 -0.00014 -0.00017 -0.00012
Dependent Variable Mean 3.3288 3.3195 3.3084 3.3353
Sample Size 1,651 1,565 1,367 1,874
R-Squared 0.7661 0.7532 0.7552 0.7667
Notes: (1) The dependent variable is Log Monthly Therms. (2) * and ** denote statistical significance at the 0.10 level and 0.05 levels, respectively. (3) Standard Errors are in parenthesis. (4) Variables Post and CDD*Post were tested but found to be insignificant and not included in the final model.
2.8.6 Energy Savings Derived From Regression Models
The results from each model are applied in combination with the average HDD by
month in the baseline period (2012), and then applied as a percentage savings on a
monthly basis with the average monthly baseline usage. The resulting savings are listed
in Table 2-33, including realization rates (RR) as compared to TRM savings.
Table 2-33 Per-Participants Annual Savings Comparison
Group
Annual Regression Model kWh
Savings
% kWh Savings
TRM Based kWh
Savings
kWh RR
Annual Regression
Model Therms Savings
% Therms Savings
TRM Based
Therms Savings
Therms RR
Group 1 - No Snapback
1,231 9% 2,083 79% 56 11% 236 24%
Group 2 - No Takeback
1,061 8% 2,083 68% 76 15% 236 32%
Group 3 - No Snapback or
Takeback 1,550 12% 2,083 99% 84 17% 236 36%
Group 4 - All Customers
901 7% 2,083 58% 53 11% 236 22%
APSC FILED Time: 4/1/2014 12:29:49 PM: Recvd 4/1/2014 11:59:47 AM: Docket 07-075-tf-Doc. 229

2013 Arkansas Weatherization Program EM&V Report
Impact Findings 2-32
The significance of these results shows that there is an impact on program savings due
to takeback and snapback with Group 1 showing much lower savings than the
takeback-excluded or snapback-excluded models. Using the comparable regression
results, the impact of snapback is estimated as 2.5% of annual kWh usage, while and
the impact of takeback is estimated as 2.4% of annual usage. When all snapback and
takeback participants are removed from the model, electric savings are very closely
aligned with those in the TRM (showing a realization rate of 99%).
With regard to Therms results, takeback (4.7%) has a much larger impact than
snapback (1.7%). This is to be expected, as the impact of returning a furnace or water
heater to service will have a much larger impact than a set point change in a home.
2.8.7 Billing Analysis Summary Results
The analysis of participant billing data shows a significant difference in savings based
on behavioral changes after program implementation. Based on the questions asked of
participants, it appears that the deemed electric savings within the TRM accurately
represent actual participant savings, in isolation of changes in customer behavior.
The analysis identified a larger discrepancy between the modeled Therms savings and
TRM savings even after taking into account behavioral changes. The realization rate for
the snapback- and takeback-excluded group is 36%. This suggests that at the premise
level for a complete weatherization project, the TRM may be overestimating total
Therms savings. As a percentage of total annual residence usage, the TRM based
Therms savings are 47%. This is a potentially unrealistic savings target, further
indicating that the TRM savings are overstating the actual impacts. This may be due to
interaction effects between measures, as the TRM provides savings for isolated
measures rather than at the aggregated premise level.
The scope of the current analysis did not isolate the effects of individual measures,
although it may be possible to identify the effects of specific, high-impact measures. The
accuracy and detail of further analysis may be somewhat restricted by the limited
participant population size and high presence of measure crossover, in that the majority
of residences received both air infiltration and attic insulation measures. These are the
two highest-impact gas savings measures that are implemented through the AWP.
A billing analysis involving a larger participant population may allow for quantitative
isolation of individual behavioral variables and measure types. This may provide further
evidence that necessitates revisions to the TRM. A future assessment of TRM accuracy
should revisit the reasonableness of air infiltration and insulation measure savings
calculations.
APSC FILED Time: 4/1/2014 12:29:49 PM: Recvd 4/1/2014 11:59:47 AM: Docket 07-075-tf-Doc. 229

Process Findings and Program Updates 3-1
3. Process Findings and Program Updates
This chapter presents the key findings related to program operation, performance, and
delivery. This includes a status assessment of recommendations from prior program
evaluations and a summary of updates to program operation and delivery. Additionally,
the chapter presents findings from in-depth interviews with program staff and addresses
the checklist factors for portfolio comprehensiveness.
3.1 Process Evaluation Considerations
The Evaluators conducted a formal process evaluation of the AWP in 2012. This
process evaluation resulted in several recommendations and identified program
strengths and weaknesses, as well as existing opportunities. TRM V3.0 Protocol C
addresses the criteria used to determine the timing and conditions needed for a process
evaluation, and the following tables summarize the AWP in the context of these
requirements.
Table 3-1 Determining Process Evaluation Timing
Component Determination
New and Innovative Components
No. The overall program design has not been modified in the past year.
No Previous Process Evaluation
No. A formal process evaluation was conducted in 2012.
New Vendor or Contractor
No. The number of active community action agencies has been reduced, but all agencies were already participating during 2012.
APSC FILED Time: 4/1/2014 12:29:49 PM: Recvd 4/1/2014 11:59:47 AM: Docket 07-075-tf-Doc. 229

2013 Arkansas Weatherization Program EM&V Report
Process Findings and Program Updates 3-2
Table 3-2 Determining Process Evaluation Conditions
Component Determination
Are program impacts lower or slower than expected?
Yes. The program has fallen short of savings goals due to several factors including delays and reductions in federal funding for the WAP.
Are the educational or informational goals not meeting program goals?
No. Program awareness appears to be high, and the AWP has actively provided energy and non-energy education to participants and prospective participants.
Are the participation rates lower or slower than expected?
Yes. The program has fallen short of participation goals due to several factors including delays and reductions in federal funding for the WAP.
Are the program’s operational or management structure slow to get up and running or not meeting program administrative needs?
Yes. There have been delays in the data reporting process, including errors within the tracking database.
Is the program’s cost-effectiveness less than expected?
No. The program’s cost-effectiveness has been maintained at expected levels.
Do participants report problems with the programs or low rates of satisfaction?
No. Participants in 2012 reported very high levels of satisfaction with their participation and with the quality of work performed.
Is the program producing the intended market effects?
Yes. Overall weatherization activity, including development of additional weatherization programs, has increased since the initiation of the AWP.
Based on these findings, there are certain areas of the program that call for process
evaluation activities. While the timing components indicate that a full process evaluation
is not currently necessary, the Evaluators determined that the 2013 evaluation of the
AWP calls for a limited process evaluation focusing on specific program areas. These
areas include:
Program operations and managerial structure;
Program savings performance; and
Program participation levels.
In order to address these areas, the Evaluators conducted the following research tasks:
Tracking database and documentation review;
Interviews with community action agency and ACAAA staff; and
Utility staff interviews.
Additionally, the Evaluators gained insight into savings performance through the impact
evaluation. Results from the TRM verification and regression analysis activities provided
insight into ex ante vs. ex post savings discrepancies and overall measure savings
estimates.
APSC FILED Time: 4/1/2014 12:29:49 PM: Recvd 4/1/2014 11:59:47 AM: Docket 07-075-tf-Doc. 229

2013 Arkansas Weatherization Program EM&V Report
Process Findings and Program Updates 3-3
Table 3-3 below summarizes the survey and interview data collection for these process
evaluation activities, including data collection type, number of respondents, and
additional details.
Table 3-3 Interview and Survey Data Collection Summary
Target Component Activity N Details
Program Management
Staff
AOG Program Manager Interview 2 The program manager and operational staff are responsible for coordinating program data, managing reimbursements to local agencies,
planning for overall program activity and savings expectations, and communicating with
utility and ACAAA staff as necessary throughout the program year.
OG&E Program Manager and Staff Interview 3
SourceGas Program Manager Interview 1
SWEPCO Program Manager Interview 1
CenterPoint Program Manager Interview 1
EAI Program Manager and Staff Interview 2
ACAAA Staff AWP Coordination Staff Interview 2
The Energy Policy Coordinator and other ACAAA staff are responsible for coordinating
efforts among the local agencies and providing information to the utility program managers.
Community Action Agency Directors and
Staff
Central Arkansas Development Council (CADC)
Interview 1 The community action agency directors and staff members are responsible for coordinating the audit and installation crews throughout the measure implementation process. Additionally, local agencies promote the program and reach out to customers who are potential participants
in the AWP. Agency directors plan program operations and activity, and manage agency
funding throughout the program year.
Crowley's Ridge Development Council (CRDC)
Interview 1
Crawford-Sebastian Community Development Council, Inc. (C-SCDC)
Interview 1
Pine Bluff Jefferson County Economic Opportunities Commission, Inc. (PBJCEOC)
Interview 1
3.2 Response to Program Recommendations
Table 3-4 summarizes the status of issues and recommendations identified in the 2012
process evaluation and impact evaluation of the Arkansas Weatherization Program.
While some of the recommendations have been addressed, such as individual tracking
data discrepancies and incremental improvements in non-WAP participation, the
majority of issues have persisted through the 2013 program year.
APSC FILED Time: 4/1/2014 12:29:49 PM: Recvd 4/1/2014 11:59:47 AM: Docket 07-075-tf-Doc. 229

2013 Arkansas Weatherization Program EM&V Report
Process Findings and Program Updates 3-4
Table 3-4 Status of Recommendations from 2012 Program Year
Issue Consequences Recommendation Utility/ACAAA Response Status of
Issue
Tracking data missing some measure inputs required by TRM
Program cannot comply with current TRM calculation requirements May negatively affect the accuracy of ex ante calculations
Add inputs to tracking system in accordance with the most up-to-date TRM (TRM 2.0 at the time of recommendation)
Frontier has continually modified the program tracking database to revise calculations but some TRM V2.0/TRM V3.0 inputs are not present. Rather than retroactively adjusting the database to match previous versions of the TRM, efforts should be made to reconcile the database with up-to-date TRM requirements, taking into account TRM grace periods and any other stipulated time frames and budget constraints.
Partially addressed
Some measure labels listed in the tracking data do not match measure names listed in the TRM (e.g. ‘Vented Space Heater’ vs. ‘Direct Vent Heater’)
Causes difficulties during savings verification, potential to calculate savings for incorrect measure.
Standardize tracking data measure terminology with TRM language
No observed change in tracking data measure labels. While the TRM does not include all of the NEAT and MHEA measures, it is important to reconcile measure labels for those measures that do appear in both NEAT/MHEA, and the TRM so that they clearly match.
Persists
Program is fairly dependent on the success of the Weatherization Assistance Program (WAP)
Delayed or reduced federal funding results in delayed or limited AWP completions Some agencies prioritize WAP over AWP, delaying AWP completions
Increase focus on recruiting non-WAP participants by promoting it as a general utility program in addition to a WAP leveraging program Strongly encourage agencies to directly seek out and work with non-WAP customers
Two agencies recruited non-WAP participants, most agencies continue to report reliance on WAP funds Marketing materials that exclusively mention the AWP without the WAP have been developed and distributed (see Appendix B)
Partially addressed
APSC FILED Time: 4/1/2014 12:29:49 PM: Recvd 4/1/2014 11:59:47 AM: Docket 07-075-tf-Doc. 229

2013 Arkansas Weatherization Program EM&V Report
Process Findings and Program Updates 3-5
Some errors exist within tracking data calculations (CFL hours of use and refrigerator replacement at the time of recommendation)
Creates difficulties in M&V, specifically savings verification May negatively affect the accuracy of ex ante calculations
Review all calculation assumptions and remove/replace any erroneous values within the tracking database
There continue to be calculation discrepancies between TRM savings calculation results and tracking data claimed savings for some measures.
Persists
Private co-pay customers are able to select measures more freely than WAP recipient participants
Some participants may only select measures that have a lower savings-to-investment ratio (SIR) than the average SIR for WAP participants, reducing overall program cost-effectiveness May detract from the program’s “whole house approach” to weatherization if participants approach the AWP only seeking individual measures (such as windows).
Require private co-pay participants to select highly cost-effective measures, potentially prioritizing measures by their savings-to-investment ratio and requiring participants to install measures in order
No observed modifications to program structure for private co-pay participants
Persists
Delays in collecting all necessary project data from agencies and reporting data to database provider
Places stress on utility and evaluator deadlines Reduces the time available to ensure accuracy and completeness within data
Ensure that all necessary data are provided to CADC and then to Frontier Associates as soon as available, or develop a shared electronic system for data input by all agencies
Agencies/CADC collected and finalized the dataset earlier than the prior year, but delays continued to occur for some data. No observed change in the method of data transfer
Partially addressed
APSC FILED Time: 4/1/2014 12:29:49 PM: Recvd 4/1/2014 11:59:47 AM: Docket 07-075-tf-Doc. 229

2013 Arkansas Weatherization Program EM&V Report
Process Findings and Program Updates 3-6
3.3 Program Structure Overview
The overall design, structure, and objectives of the Arkansas Weatherization Program
have remained fairly constant throughout 2011-2013. This section provides a summary
of current program design characteristics and processes, noting any new differences
between 2013 and prior program years.
The most notable modification has been the 2013 restructuring of weatherization
service providers, where the decision was made to reduce the number of agencies
promoting and implementing program services from 15 to 6. Some of the remaining
agencies continued to provide weatherization services through 2013, as it was a
transitional year. This modification was made in conjunction with the administrative
transition of the Weatherization Assistance Program from the Department of Human
Services (DHS) to the Arkansas Energy Office (AEO). During 2013, the agencies that
participated in program implementation provided residential energy audits and energy
efficiency installations to customers within the following gas and electric utility service
territories:
American Electric Power – Southwestern Electric Power Company (AEP-
SWEPCO);
Empire District Electric Company (EDEC);
EAI;
Oklahoma Gas and Electric (OG&E);
Arkansas Oklahoma Gas Corporation (AOG);
CenterPoint Energy (CenterPoint); and
SourceGas Arkansas (SGA).
As with prior years, participating homes were evaluated in order to determine potential
energy efficiency measures that would improve overall building efficiency and reduce
residential energy usage. The AWP provided funds for the installation of various
measures, including:
Ceiling, floor and wall insulation;
Air sealing;
Window sealing and replacement;
Furnace, air conditioner, and heat pump tune-up and replacement;
Water heater insulation and replacement;
Lighting retrofits;
APSC FILED Time: 4/1/2014 12:29:49 PM: Recvd 4/1/2014 11:59:47 AM: Docket 07-075-tf-Doc. 229

2013 Arkansas Weatherization Program EM&V Report
Process Findings and Program Updates 3-7
Low flow shower heads; and
Other measures as deemed appropriate.5
Program structure has remained fairly consistent through the 2013 program year. As
noted above, the most notable modification involved the decision to reduce the number
of agencies (from 15 to 6). These agencies continued to receive federal funding for the
WAP as well as utility funds for the AWP for use in weatherization implementation
activities.
As with prior years, customers who do not receive funding through the statewide
income-qualified WAP are responsible for a portion of the audit cost, as well as a
portion of the resulting equipment or measures to be installed in the home.
In order to qualify for the AWP, customer homes must meet specific criteria indicating
that the residence is severely energy-inefficient. Participants must be a residential
customer of at least one utility that is involved in the AWP. The program is available
only to residences built prior to 1997. Additionally, participant homes must meet three of
the following seven criteria:6
Ceiling insulation less than or equal to R-30;
Wall insulation equal to R-0;
Floor insulation equal to R-0;
Single pane windows with no storm windows attached;
Non-working heating system or heating system with less than 70% AUE;
Non- working cooling system or cooling system with SEER of 8 or less; and
Air infiltration problems identified through a) visual inspection of duct-work, walls,
floors, ceilings, doors, and windows; or b) pre-blower door test.
In the 2013 program year, private co-pay customers paid between $50 and $200 for the
audit upfront depending on how many participating utilities the customer had. For
customers qualifying for WAP funding, the combined federal and utility sources fully
cover the cost of the initial energy audit, and up to approximately $8,000 can be spent
on associated energy efficiency measures. Energy efficiency measures for WAP and
AWP participants are identified through the use of National Energy Audit Tool (NEAT) or
5 This list contains a sample of some of the most commonly installed program measures. A complete list of measures
that were implemented during the 2013 program year can be found in Table 1-4 of Section 1.3 in this report. A complete list of all eligible program measures can be found in ACAAA Docket no. 07-079-TF, Attachment A (AWP Modified Program Design and Description).
6 Eligibility requirements are taken from AWP program design filed March 15, 2011 with the Commission. These can
be found at: http://www.apscservices.info/pdf/07/07-079-tf_62_1.pdf. The Commission Order approving the design was order # 20 located at: http://www.apscservices.info/pdf/07/07-079-tf_76_1.pdf issued on June 30, 2011.
APSC FILED Time: 4/1/2014 12:29:49 PM: Recvd 4/1/2014 11:59:47 AM: Docket 07-075-tf-Doc. 229

2013 Arkansas Weatherization Program EM&V Report
Process Findings and Program Updates 3-8
Mobile Home Energy Audit (MHEA) software, which determines the most cost-effective
and energy-saving measures for each home.
Participating homes must be serviced by one or more of the participating utilities, and
may also be serviced by municipal co-ops. If the home has natural gas and electric
service provided by participating utilities, or is all-electric, the participant receives the
maximum funds through the program. In order to maintain cost-effectiveness, homes
that are neither all-electric nor serviced by two participating utilities receive a lower level
of assistance through the program.
The active weatherization agencies continued to recruit and enroll customers in the
program and determine AWP and WAP eligibility. After the customer is approved and
the in-home audit is performed, optimal energy efficiency measures for AWP (and WAP,
for eligible customers) are identified through the use of NEAT or MHEA software. The
local agencies then use their internal crews or hire contractors to install these measures
in the home.
The AWP has continued to use a “whole house” approach to residential energy
efficiency, where energy efficiency measures are chosen and implemented based on
total cost and energy savings rather than focusing on a specific fuel type or measure
category. This varies somewhat for participants who provide their own private co-
payment for the audit and for energy efficiency measures, in that these participants are
able to individually select measures rather than receiving a predetermined group of
measures based on the NEAT or MHEA recommendations.
Agencies collect onsite data documenting initial home conditions, the set of measures
installed, and post-implementation conditions and measurements. The agencies then
provide these data to CADC, who aggregates the information and submits it to Frontier
Associates for processing within the EnerTrek software tool. EnerTrek incorporates the
onsite data into TRM savings formulas (and NEAT/MHEA values for measures not
included in the TRM) to calculate ex ante savings for each measure. The resulting
savings are made accessible to program utilities and EM&V contractors, who use
EnerTrek database exports to conduct measure implementation and savings verification
activities.
3.4 Arkansas Weatherization Program Logic Model
Figure 3-1 presents a logic model for the Arkansas Weatherization Program, divided
into stages to represent the phases involved in administering and operating the
program. As discussed above, the overall structure and phases have remained fairly
consistent since 2012 and prior years. The 2013 logic model has been updated to
reflect the stipulated number of active weatherization agencies.
APSC FILED Time: 4/1/2014 12:29:49 PM: Recvd 4/1/2014 11:59:47 AM: Docket 07-075-tf-Doc. 229

2013 Arkansas Weatherization Program EM&V Report
Process Findings and Program Updates 3-9
ACAAA and utilities
discuss program
delivery and goals
Program Design
Planning
Training and
Implementation
Planning
Data Processing and
Monitoring
Program Promotion
Each of the 6
agencies market
program to local
customers
Staff from the 6 weatherization agencies,
contractors, and other operations staff attend
program-relevant training sessions
ACAAA and the 6
weatherization
agencies discuss
implementation and
program updates
Customer qualifies
for WAP
Customer placed on
WAP waiting list
Measures and
associated savings
are sent to Frontier
Associates for
processing
Program is
evaluated through
EM&V process
Agencies and
utilities monitor
progress, make
improvements as
needed
Audit crew conducts ex post
data collection
Agency staff conduct post-
implementation verification
Ineligible customers
disqualified based on
participation criteria
Program Participation
Work within regulatory
environment to
implement modifications
Utilities may cross-
promote AWP with
other programs
Program
awareness
spreads indirectly
Customers
apply for
program
services
Customer provides
private co-pay
Auditing crew conducts initial
baseline measurements and
NEAT/MHEA processing
Implementation crew installs
recommended measures
Customer chooses
measures to install
Auditing crew conducts initial
baseline measurements and
NEAT/MHEA processing
Figure 3-1 Arkansas Weatherization Program Logic Model
APSC FILED Time: 4/1/2014 12:29:49 PM: Recvd 4/1/2014 11:59:47 AM: Docket 07-075-tf-Doc. 229
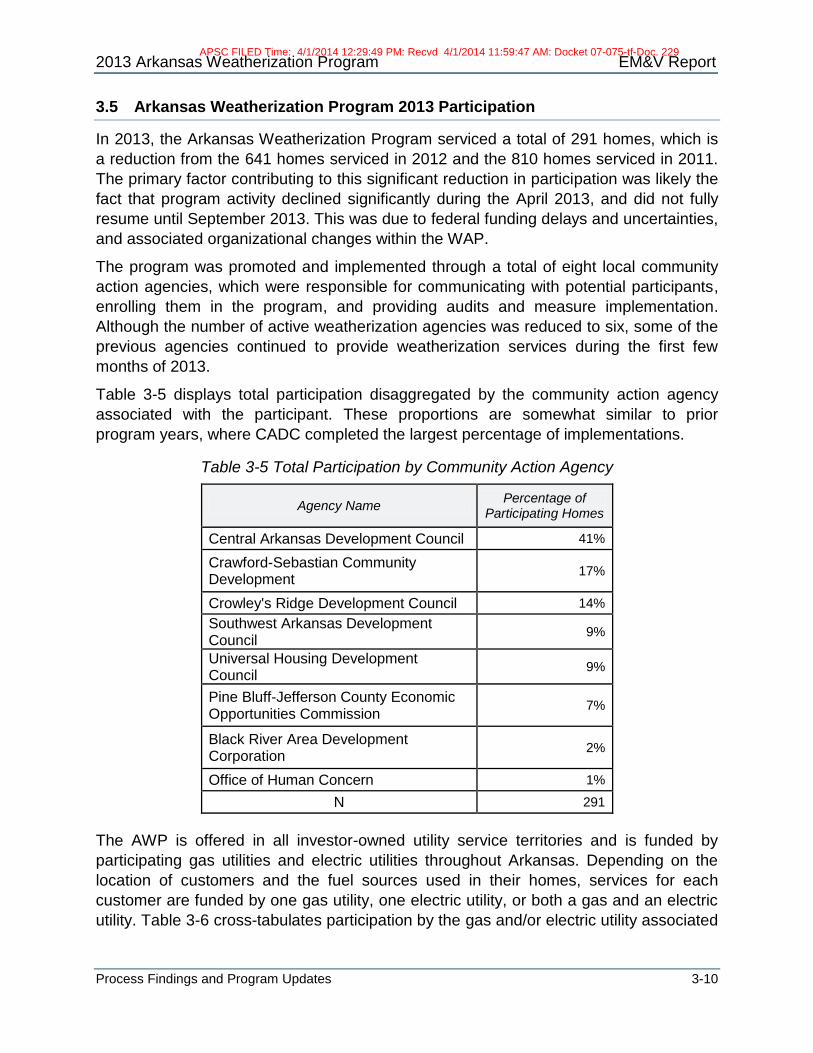
2013 Arkansas Weatherization Program EM&V Report
Process Findings and Program Updates 3-10
3.5 Arkansas Weatherization Program 2013 Participation
In 2013, the Arkansas Weatherization Program serviced a total of 291 homes, which is
a reduction from the 641 homes serviced in 2012 and the 810 homes serviced in 2011.
The primary factor contributing to this significant reduction in participation was likely the
fact that program activity declined significantly during the April 2013, and did not fully
resume until September 2013. This was due to federal funding delays and uncertainties,
and associated organizational changes within the WAP.
The program was promoted and implemented through a total of eight local community
action agencies, which were responsible for communicating with potential participants,
enrolling them in the program, and providing audits and measure implementation.
Although the number of active weatherization agencies was reduced to six, some of the
previous agencies continued to provide weatherization services during the first few
months of 2013.
Table 3-5 displays total participation disaggregated by the community action agency
associated with the participant. These proportions are somewhat similar to prior
program years, where CADC completed the largest percentage of implementations.
Table 3-5 Total Participation by Community Action Agency
Agency Name Percentage of
Participating Homes
Central Arkansas Development Council 41%
Crawford-Sebastian Community Development
17%
Crowley's Ridge Development Council 14%
Southwest Arkansas Development Council
9%
Universal Housing Development Council
9%
Pine Bluff-Jefferson County Economic Opportunities Commission
7%
Black River Area Development Corporation
2%
Office of Human Concern 1%
N 291
The AWP is offered in all investor-owned utility service territories and is funded by
participating gas utilities and electric utilities throughout Arkansas. Depending on the
location of customers and the fuel sources used in their homes, services for each
customer are funded by one gas utility, one electric utility, or both a gas and an electric
utility. Table 3-6 cross-tabulates participation by the gas and/or electric utility associated
APSC FILED Time: 4/1/2014 12:29:49 PM: Recvd 4/1/2014 11:59:47 AM: Docket 07-075-tf-Doc. 229

2013 Arkansas Weatherization Program EM&V Report
Process Findings and Program Updates 3-11
with the participant. “N/A” represents projects performed in homes with only one utility
source or with a utility service provider that is not part of the AWP.
Table 3-6 Participation by Associated Utility
Electric Utility
Gas Utility
Arkansas Oklahoma Gas
CenterPoint Source
Gas N/A
EAI - 125 6 46
OG&E 29 - 4 2
AEP-SWEPCO 3 15 5 6
Empire Electric - - - 1
N/A 4 37 8 -
Figure 3-2 displays a comparison between 2013 and 2012 in terms of participation rates
by month. Overall, the 2013 program year experienced more participation seasonality
and lower participation rates than the 2012 year. As noted above, much of the program
activity ceased during the spring months, primarily due to funding delays and
transitional activity within the WAP. However, even after program activity fully resumed,
the 2013 program year achieved substantially less participation per month than the
2012 year.
Figure 3-2 Participation Rates by Month, 2012 vs. 2013
17 14
34
8 12 11
32
54
42
24 24 20
68
73
47
55 53
47
53 57
62
43 42 42
0
10
20
30
40
50
60
70
80
Nu
mb
er
of
Ho
me
s Se
rvic
ed
2013 Program Year (N = 291)
2012 Program Year (N = 641)
APSC FILED Time: 4/1/2014 12:29:49 PM: Recvd 4/1/2014 11:59:47 AM: Docket 07-075-tf-Doc. 229

2013 Arkansas Weatherization Program EM&V Report
Process Findings and Program Updates 3-12
Approximately 1,440 measures were installed during the 2013 program year, as
compared to nearly 3,700 in the 2012 year and more than 4,700 in the 2011 year. Table
3-7 displays the number of installations by measure type, arranged by the most
commonly installed measures. CFL installations were the most common measure type,
followed by air infiltration improvements. Heat pump, water heater, and window air
conditioner replacement comprised a small percentage of measures.
Table 3-7 Total Installations by Measure
Measure Number of
Installations
CFL 291*
Air Infiltration 265
Water Heater Pipe 183
Ceiling Insulation 164
Window Replacement 109*
Vented Space Heater 63
Gas Furnace Replacement 60
Central AC Replacement 51
Water Heater Jacket 50
Storm Windows 49*
Energy Star Refrigerator 45
Floor Insulation 23
Wall Insulation 23
Smart Thermostat 19
Central HP Replacement 18
Water Heater Replacement 9
Window Sealing 9*
Window AC Replacement 3
Low Flow Showerhead 1
*Values are based on total number of projects rather than on total number of units installed.
The average square footage of participating residences was 1,361 while the median
square footage was 1,292. The average age of participant homes was 45.5 years, and
all homes complied with the 1997 or prior construction date program requirement.
3.6 Utility Staff and ACAAA Interviews
As part of the evaluation of the 2013 Arkansas Weatherization Program, the Evaluators
conducted in-depth interviews with utility staff members involved in managing and
operating the program, as well as ACAAA representatives and community action
agency directors. As a formal process evaluation was conducted in 2012, these
interviews primarily served to assess the status of previous evaluation conclusions and
recommendations, as well as to identify notable changes in program operation.
APSC FILED Time: 4/1/2014 12:29:49 PM: Recvd 4/1/2014 11:59:47 AM: Docket 07-075-tf-Doc. 229

2013 Arkansas Weatherization Program EM&V Report
Process Findings and Program Updates 3-13
Thus, the 2013 evaluation interviews seek to follow-up on key issues and draw
comparisons between program years where appropriate.
This section presents key findings and issues identified through these interviews.
3.6.1 Statewide Weatherization Transition
WAP Software Update: Interviewed staff noted that the transition of the WAP from the
Department of Human Services to the Arkansas Energy Office is expected to have
several effects. The AEO has reportedly adopted a new software system for savings
tracking and other database activities, which will likely result in a new audit form for the
WAP. Staff noted that this new software, along with any changes to the audit form, will
likely have to be reconciled with the AWP in order to prevent confusion and inaccurate
or insufficient data collection on the part of the agencies. As the AWP was designed to
adhere to WAP protocols, including the use of NEAT and MHEA as audit tools, new
software may require substantial changes to AWP implementation procedures.
Transition Awareness: Utility and ACAAA staff reported that news releases and other
informational materials had been developed in order to inform customers of the agency
transition and to direct them to the appropriate weatherization provider. However, some
utility staff reported that they would like to have a more clear understanding of how the
transition will affect the program and whether there will be additional requirements on
the part of the utilities or service providers.
Waiting List Status: As mentioned in prior years, the majority of AWP participants
have also qualified for WAP funding. Due to the high demand for WAP funds, the
waiting list for the federal program has increased substantially over the past several
years. This has affected AWP participation, as the timeline for a participant of both AWP
and WAP to receive services is dependent on the speed of the statewide waiting list.
However during 2013, interview respondents reported that the Arkansas Energy Office
may allow for some flexibility within the WAP waiting list for projects that are able to
leverage additional funding sources. For example, customers who are on the WAP
waiting list but who also qualify for AWP funds may be moved to a higher priority on the
list.
While this would not alleviate the overall waiting list for the federal program, it may
increase the participation rate for the AWP. Interviewed staff noted that the community
action agencies will have the authority to increase AWP participants to a higher waiting
list priority level. The extent to which this arrangement will improve AWP participation is
unclear thus far, although interviewees estimated that there are several thousand
customers who may potentially benefit. As the WAP waiting list appears to have had a
bottleneck effect on AWP performance across program years, this development has the
potential to address a primary program issue.
APSC FILED Time: 4/1/2014 12:29:49 PM: Recvd 4/1/2014 11:59:47 AM: Docket 07-075-tf-Doc. 229

2013 Arkansas Weatherization Program EM&V Report
Process Findings and Program Updates 3-14
3.6.2 Data Quality and Availability
Data Quality: Interviewed utility staff members generally reported that there were
persisting communication issues with regard to participation data, program planning,
reimbursements, and savings results. Staff members explained that they had typically
not received timely information regarding how many of their customers had received
weatherization services, and that when the information was delivered it did not include
sufficient detail to accurately estimate where the utilities stood in terms of their goals.
For instance, utility staff reported that it would be useful to know which measures had
been implemented, and to have cost levels broken down into more specific categories.
Data Availability: Although detailed participation data are intended to be available to
the utilities throughout the program year, there were difficulties in accessing EnerTrek
and some of the initial data reports contained inaccuracies that had to be corrected.
During follow-up discussions, Frontier staff acknowledged these delays and explained
that each year of the AWP had involved updates to the data collection and reporting
process. This required programming modifications, and Frontier staff noted that there
had been some issues during this process. As the utilities rely on the database for
details such as types of measures installed and estimated savings, and as EnerTrek
also serves as a consistency check against information obtained through CADC, utility
staff noted that regular access to this portal is important for performance tracking and
planning purposes. These issues suggest that although nearly all of the necessary data
are being collected onsite in participant homes, there are lag points in multiple stages of
the data reporting process that result in delays and missing information.
3.6.3 Community Action Agency Involvement
Agency Coverage: ACAAA staff reported that one primary objective during the agency
transition was to ensure that the remaining agencies would cover all of the utilities’
service territories. As there are now fewer service providers, each agency now has an
expanded territory of activity. ACAAA staff also noted that some agencies have
established outpost offices in order to mitigate distances between agency headquarters
and participant homes. Additionally, the six agencies are able to work with the nine
additional previous providers in order to obtain participant referrals and potentially
contract out some of the installation work. This arrangement is intended to simplify the
weatherization provider network while maintaining collaborative efforts among all
agencies.
Agency Engagement: Interviewed staff noted that on average, the remaining six
implementing agencies have been more active in providing AWP services than the initial
15 organizations. One interviewee explained that the AEO is planning to strongly
encourage or require the six agencies to leverage funding from sources such as the
AWP, which is expected to further increase participation activity.
APSC FILED Time: 4/1/2014 12:29:49 PM: Recvd 4/1/2014 11:59:47 AM: Docket 07-075-tf-Doc. 229

2013 Arkansas Weatherization Program EM&V Report
Process Findings and Program Updates 3-15
3.6.4 Recruiting Private Co-payment Customers
Participation Issues: When asked about the presence of AWP participants who are
not eligible for WAP-funding, the general statement among interviewees was that the
AWP has continued to encounter barriers to participation for these customers. As with
prior years, staff identified barriers including AWP eligibility requirements, the reliance
on WAP funding and participation levels, and the continued customer perspective that
the AWP is associated with an income requirement. Interviewees reported that while the
percentage of participants who are not WAP-eligible has increased slightly, the program
still heavily relies on the availability of federal funding. ACAAA staff also noted that the
availability of other utility-sponsored weatherization programs may serve as a barrier to
AWP participation, as customers may be drawn away from the AWP and instead
choose to enroll in these alternative programs. Overall, utility staff members reiterated
their perspectives from prior program years: that they would like to achieve increased
participation from private co-payment customers, but that these existing barriers are
well-established and difficult to reduce.
Measure Selection: Interviewees reported that even with additional private co-pay
participation, there may be issues with program cost-effectiveness targets. Specifically,
utility staff members noted that participants who provide their own co-pay are still able
to determine which measures to install in their homes. As mentioned in the 2012
evaluation, these customers may select measures that are not necessarily as cost-
effective as the full set of measures recommended by NEAT or MHEA.
3.6.5 Program Efficiency and Performance
Program Interruption: Utility staff explained that while the funding from the program
utilities was available to the AWP for the entire program year, uncertainty regarding the
timing and total amount of government funding for weatherization services had limited
the number of homes that the agencies were able to service. Several staff members
noted that the decrease in participation levels during the 2013 program year may be
mainly attributable to the fact that the program paused implementation activity in April
through well into the fall due to funding and transition issues. These issues were
partially related to the initiation of program restructuring on a statewide level, and
caused the agencies to halt their activities for several months.
Savings Issues: Some utility staff members reported that they have attempted to offset
the low savings achieved through the AWP by focusing on one or more of their other
energy efficiency programs. These interviewees reported that as they did not have the
ability to significantly influence the performance of the AWP, they decided to focus their
attention towards internal programs in order to meet savings targets. Overall, comments
suggested that the AWP is not currently successful in serving its intended purpose
within utility energy efficiency portfolios.
APSC FILED Time: 4/1/2014 12:29:49 PM: Recvd 4/1/2014 11:59:47 AM: Docket 07-075-tf-Doc. 229

2013 Arkansas Weatherization Program EM&V Report
Process Findings and Program Updates 3-16
3.6.6 Communication and Collaborative Efforts
Establishing Communications: Utility staff members reported that their interactions
with the program were typically limited to receiving periodic notifications of job
completions and having weekly conference calls regarding EnerTrek software updates.
Some interview respondents noted that it may be useful to hold introductory meetings or
monthly calls between the utilities and local agencies so that all parties may familiarize
themselves with each other and develop a more collaborative working relationship.
These interviewees explained that with the recent transition to a smaller group of
agency providers, participants in some utility service territories will now be served by
different agency organizations. Additionally, with a smaller number of entities working to
implement the program, it may be more feasible to develop and mutually agree on
promotional or general implementation strategies.
Roles and Responsibilities: All interview respondents acknowledged that overall
communication among parties has been fairly infrequent, and that it has been difficult to
coordinate tasks or arrive at mutual understandings regarding program objectives and
strategies. One utility staff member noted that it would be useful to have an
organizational chart showing the relationship among all AWP entities, as well as the
roles, responsibilities, and contact information of representatives at each agency and
utility. This interviewee explained that this information is crucial for moving forward as a
cooperative group.
3.7 Community Action Agency Interviews
The Evaluators conducted interviews with community action agencies who were
selected to continue providing weatherization services through the AWP. These
interviews were designed to revisit topics from the 2012 process evaluation, as well as
to identify any changes in program operation or delivery. The Evaluators were provided
with a list of contact information for the six remaining weatherization service providers
and were able to contact and conduct interviews with four of these organizations. This
section highlights key findings from these interviews.
3.7.1 Service Interruption
Agency staff reported that the combination of uncertainty regarding federal funding, and
the complexities of transitioning the WAP from the Department of Human Services to
the Arkansas Energy Office resulted in service interruptions for nearly all of the
weatherization providers. Agency staff explained that there had been a lack of
communication from the DOE regarding expected funding for 2013. As the agencies
typically plan their activity levels based on WAP funding, they had been hesitant to hire
contractor staff and begin providing weatherization services. Additionally, although the
nine agencies that were not chosen as future weatherization services providers were
APSC FILED Time: 4/1/2014 12:29:49 PM: Recvd 4/1/2014 11:59:47 AM: Docket 07-075-tf-Doc. 229

2013 Arkansas Weatherization Program EM&V Report
Process Findings and Program Updates 3-17
able to continue implementation during the beginning of the year, several of these
agencies ceased weatherization services early.
3.7.2 Transitional Effects
WAP Administration: For the most part, agency staff reported that the WAP transition
to the AEO has been beneficial, and that they expect the AEO to implement some
positive changes to statewide weatherization. For example, one agency staff member
reported that the AEO is more focused on energy efficiency and savings, and that this is
expected to lead to a more accurate and comprehensive energy audit tool. Additionally,
one agency staff member reported that the AEO has raised the standards for providing
weatherization services, which is expected to increase safety levels and improve
accuracy within data collection and reporting.
Agency Coverage: One interviewed agency director noted that the transition has
actually resulted in more complete coverage of the state, as some regions were
previously represented by agencies that were not actively providing weatherization.
Agency staff stated that the expanded service areas have been manageable, and that
they have established auxiliary facilities in order to reduce distance issues.
3.7.1 Funding Issues
Absence of ARRA: When asked about funding levels, agency staff stated that the
absence of American Recovery and Reinvestment Act (ARRA) funding has significantly
reduced participation potential, for both the WAP and the AWP. Agency staff explained
that the ARRA funding had allowed the agencies to hire more implementation crews
and that the lack of ARRA funding has substantially reduced their resources and
implementation potential.
DOE Reliance: Agency staff members noted that while the AWP utility funding is
beneficial and available, the agencies’ weatherization activity is heavily dependent on
the status and level of federal funding. Several agency staff members noted that
although total DOE funding is expected to decrease, the reduction in service providers
will likely result in more funding per agency.
Participant Recruiting: Several agency staff members noted that they do not focus on
recruiting non-WAP participants because those customers are typically much more
difficult to find. One agency noted that they only use AWP funds when they are coupled
with WAP funds, because that is the most efficient use of their resources.
3.7.1 Communication with Utilities
Interviewed agency staff confirmed that communications with the utilities have been
fairly limited and infrequent. Another agency respondent explained that while there had
been meetings between the utilities and CADC, there had not been much interaction
between each agency and its respective utilities. This interviewee noted that it may be
APSC FILED Time: 4/1/2014 12:29:49 PM: Recvd 4/1/2014 11:59:47 AM: Docket 07-075-tf-Doc. 229
2013 Arkansas Weatherization Program EM&V Report
Process Findings and Program Updates 3-18
useful to meet with the utilities in order to make efforts to collaborate and reach a
mutual understanding about how to approach program operation and delivery.
3.7.1 Data Collection and Reporting
AWP Data Collection Requirements: Agency staff members reported that they have
received modified data collection requirements for the AWP, and that they have already
implemented these changes. This includes collecting exact inches of pipe insulation and
recording the square footage of windows. One agency staff member stated that their
contractors typically collect all of this information, and that it would be very easy to
comply with any further data requests.
AEO Data Collection Requirements: Agency staff reported that the WAP transition to
the AEO has required the agencies to modify their data collection forms. For example,
the data collection forms now indicate the temperature settings of water heaters and
collect exact SEER ratings rather than ranges for air conditioner systems.
Database Issues: When asked about data reporting, agency staff noted that the
change in data collection inputs had caused some issues within the EnerTrek software.
Specifically, it had been challenging to ensure that the data were being interpreted
correctly, and that no inputs were being lost. Agency staff reported that these issues
had for the most part been resolved, but that it had taken a considerable amount of
troubleshooting before the database could be finalized.
3.8 Post-Implementation Verification Review
As per the February 8, 2012 Supplemental Guidance Regarding Evaluation Strategies
memorandum, programs are assessed for their internal quality assurance and quality
control procedures conducted by program operations staff. The goals of this QA/QC
assessment include:
Identifying the goals for the inspection and verification of the Arkansas
Weatherization Program;
Determining the specific parameters used in the verification process and whether
these parameters are appropriate for the program;
Identifying the target and actual confidence and precision levels for the
inspection and verification activities;
Reviewing the internal M&V participant selection process and the sampling
techniques employed by program implementation staff;
Reviewing site inspection documents and findings, and evaluating any savings
adjustments that were made; and
Providing recommendations for the design and operation of future verification
activities.
APSC FILED Time: 4/1/2014 12:29:49 PM: Recvd 4/1/2014 11:59:47 AM: Docket 07-075-tf-Doc. 229

2013 Arkansas Weatherization Program EM&V Report
Process Findings and Program Updates 3-19
The Evaluators assessed these factors during the 2012 program evaluation, and
provided recommendations as necessary. Overall, the verification efforts were found to
be sufficient, with few issues identified. Other than minor data collection modifications
such as additional measure inputs, the verification methods within the AWP have not
been notably modified during 2013. This section provides a brief overview of the
existing verification procedures, for reference.
3.8.1 Verification Overview
Community action agency staff members conduct verification visits continually
throughout the program year as projects are completed. Additionally, CADC staff
visit the agencies in order to review documentation and visit a sample of
participant homes which are randomly selected.
The objective during the verification visits is to verify that all recorded measures
have been properly installed and are operational. The agency staff members
perform a visual inspection of each measure and compare the implemented work
to the reported measures in the field work form.
The continued introduction of new TRM protocols has required the agencies to
conduct additional measurement and verification procedures in order to satisfy
the stipulated data requirements, such as exact pipe insulation inches and the
square footage of windows. Several agency directors reported that the continued
introduction of new TRM requirements has been fairly straightforward without
resulting in issues.
Agency representatives reported that few errors or missing measures had been
identified throughout the course of the verification visits during 2013. Any errors
were corrected prior to final data reporting and savings finalization.
3.8.2 Overall Review Findings
As the verification efforts have been maintained through 2013, the Evaluators conclude
that the Arkansas Weatherization Program currently has sufficient internal verification
procedures to provide accurate and complete implementation data. As with prior years,
the current procedures involve conducting post-implementation verification on all
participant homes in order to identify any outstanding discrepancies between contractor
reports and actual implementation. As CADC typically reviews contractor and agency
reports during visits to the agency offices, there are several quality control procedures in
place to ensure that reported data are accurate and reliable.
As previously noted, it is crucial that the community action agencies and their
subcontractors collect all data required by the applicable TRM. Tracking data reviewed
for the 2013 year suggests that some minor inputs are not currently being collected.
Additionally, each agency should submit all collected data to CADC, whether it is
currently required for TRM verification or it is supplemental. This is best suited to an
electronic format, perhaps in the form of a shared database entry system for all
APSC FILED Time: 4/1/2014 12:29:49 PM: Recvd 4/1/2014 11:59:47 AM: Docket 07-075-tf-Doc. 229

2013 Arkansas Weatherization Program EM&V Report
Process Findings and Program Updates 3-20
agencies. Supplementary implementation data such as specific measures implemented
for air infiltration work, for example, may be beneficial during the ex-post verification
process.
3.9 Tracking Database Review
Frontier Associates develops and maintains EnerTrek, a software tool that is used to
store participant data and to calculate measure level savings based on collected inputs
and TRM formulas. EnerTrek includes a full list of all participants, the measures that
were installed in their homes, and the kWh and Therms savings associated with each
measure. The Evaluators received periodic tracking data updates as well as final
tracking exports. These tracking files were evaluated for overall organization and
content, particularly in order to identify any changes that had been made since the 2012
evaluation.
According per protocol A of the TRM V3.0, tracking data should be checked for:
Participating Customer Information;
Measure Specific Information;
Vendor Specific Information;
Program Tracking Information;
Program Costs;
Marketing & Outreach Activities; and
Premise Characteristics;
Table 3-8 below summarizes the goals and activities of the Database Review of the
Arkansas Weatherization Program.
Table 3-8 Database Review Goals & Activities
Category Activity
Participating Customer Information The dataset should contain unique customer identifiers and full customer contact information.
Measure Specific Information The tracking data should identify all measures that were installed in each participant home, with associated energy savings.
Vendor Specific Information The dataset should include the name of the installation contractor associated with each participant.
Program Tracking Information If possible, the dataset needs to include the dates in which the installations, as well as the initial residential energy audit, were performed.
Program Costs Cost summaries are recorded and separately reviewed by the utilities, although the AWP data exports do contain measure costs.
APSC FILED Time: 4/1/2014 12:29:49 PM: Recvd 4/1/2014 11:59:47 AM: Docket 07-075-tf-Doc. 229

2013 Arkansas Weatherization Program EM&V Report
Process Findings and Program Updates 3-21
Category Activity
Marketing & Outreach Activities
In addition to information gathered during the tracking data review and program staff interviews, the Evaluators conducted participant surveys to gather information related to participant interaction with program marketing and outreach.
Premise Characteristics The dataset should include all measure inputs needed for savings verification, including relevant square footage measurements.
3.9.1 Customer, Premise, and Vendor Information
Each of these factors was assessed individually based on the guidelines stated in the
TRM V3.0. Overall, the Evaluators conclude the following regarding tracking data
completeness:
The tracking data contained names and addresses for all participants, and
contained contact information for all but one participant. All participants were
listed with a Job ID number. Additional participant information present in the
tracking data included gas and electric utility provider designations and utility
account numbers.
All participant records included the name of the agency that implemented the
weatherization services, and all records included the date of measure installation.
Additionally, all records included the date that that energy audit was conducted.
Premise characteristics such as home heating type, cooling type, construction
date, baseline measurements, and attic square footage were present for all
participants where necessary.
Section 3.9.2 includes specific findings related to measure-level tracking data.
As mentioned in the 2012 evaluation, the tracking data did not specifically include
information related to program marketing and outreach. The Evaluators confirmed that
the agencies have continued to administer participant surveys to program participants,
and that these surveys collect participant satisfaction and program feedback. ACAAA
tracks the results of these surveys separately.
3.9.2 Energy Savings Calculation Data
As with the prior program year, the tracking data was found to include sufficient
information for the majority of the measures. However, the tracking data did not include
sufficient information for the following measures:
Water Heater Replacement
- The tracking data did not present the energy factor (EF) of the energy
efficient equipment, which is a necessary input in TRM V3.0 for savings
calculation.
APSC FILED Time: 4/1/2014 12:29:49 PM: Recvd 4/1/2014 11:59:47 AM: Docket 07-075-tf-Doc. 229

2013 Arkansas Weatherization Program EM&V Report
Process Findings and Program Updates 3-22
Vented Space Heater
- The tracking data did not present the square footage or age of the
replaced vented space heater, which is are necessary inputs in TRM V3.0
for savings calculation.
The weather zone of each household is necessary for many of the savings calculations.
This information was used by Frontier Associates to calculate savings; however, it was
not presented in the tracking data.
Additionally, some of the calculations found within the tracking data resulted in
inaccurate ex ante savings estimates. The most significant case of this involved air
infiltration and insulation calculations that were based on a different heating and cooling
type than what was recorded for the specific home within the tracking data. Further
details regarding this issue, and other database calculation discrepancies, can be found
within Section 2.5 of Chapter 2.
3.9.3 Tracking Data Recommendations
While the current version of the tracking database contains adequate calculations and
inputs for the majority of measures, the processes of uploading data to the database
and updating database structure have both been fairly inefficient. Thus far, it appears
that the current arrangement of attempting to periodically update EnerTrek and align
NEAT and MHEA measures and calculations with TRM requirements has been costly
and time-consuming. In order to fully comply with TRM V3.0 and any future TRM
updates, EnerTrek will have to be flexible enough to receive updates without disrupting
the data input process or delaying savings reporting. This will likely require substantial
improvements in staff coordination and potentially significant changes to how the
software is maintained. Without approval of additional budgets to implement substantial
changes, database modifications will likely be limited to minor improvements that focus
on the highest impact measures.
Following this database review, the following recommendations should be considered:
Agencies mentioned that their contractors typically collect more data than is
required for AWP reporting purposes. Including all collected data in an electronic
format, potentially separate from the savings tracking database, may be useful
for measure verification purposes. This may include the presence of window air
conditioner units, in-progress construction work, or whether the home
configuration required any atypical methods to be performed during the
contractor blower door test.
The EnerTrek software should be updated to include the inputs noted above in
Section 3.9.2 in order to comply with TRM 3.0 calculation requirements.
As noted above, ensure that the weather zone is designated within the tracking
data for each participant record.
APSC FILED Time: 4/1/2014 12:29:49 PM: Recvd 4/1/2014 11:59:47 AM: Docket 07-075-tf-Doc. 229

2013 Arkansas Weatherization Program EM&V Report
Process Findings and Program Updates 3-23
3.10 Comprehensiveness Factors
The Arkansas Public Service Commission has in place a set of criteria in order to
determine whether a DSM portfolio qualifies as “Comprehensive”. These criteria are:
Factor 1: Whether the programs and/or portfolio provide, either directly or
through identification and coordination, the education, training, marketing, or
outreach needed to address market barriers to the adoption of cost-effective
energy efficiency measures;
Factor 2: Whether the programs and/or portfolio, have adequate budgetary,
management, and program delivery resources to plan, design, implement,
oversee and evaluate energy efficiency programs;
Factor 3: Whether the programs and/or portfolio, reasonably address all major
end-uses of electricity or natural gas, or electricity and natural gas, as
appropriate;
Factor 4: Whether the programs and/or portfolio, to the maximum extent
reasonable, comprehensively address the needs of customers at one time, in
order to avoid cream-skimming and lost opportunities
Factor 5: Whether such programs take advantage of opportunities to address
the comprehensive needs of targeted customer sectors (for example, schools,
large retail stores, agricultural users, or restaurants) or to leverage non-utility
program resources (for example, state or federal tax incentive, rebate, or lending
programs)
Factor 6: Whether the programs and/or portfolio enables the delivery of all
achievable, cost-effective energy efficiency within a reasonable period of time
and maximizes net benefits to customers and to the utility system;
Factor 7: Whether the programs and/or portfolio, have evaluation, measurement,
and verification "EM&V") procedures adequate to support program management
and improvement, calculation of energy, demand and revenue impacts, and
resource planning decisions.
This section reviews the Arkansas Weatherization Program in relation to each factor,
but does not provide a portfolio-wide perspective. The AWP is one component of the
larger utility energy efficiency program portfolios, and a broader perspective is
necessary in order to determine how well it is serving its intended role in those groups
of programs. Utility annual reports and portfolio evaluations may present the AWP within
the context of these broader energy efficiency portfolios.
Factor 1: Whether the programs and/or portfolio provide, either directly or
through identification and coordination, the education, training, marketing, or
outreach needed to address market barriers to the adoption of cost-effective
energy efficiency measures;
APSC FILED Time: 4/1/2014 12:29:49 PM: Recvd 4/1/2014 11:59:47 AM: Docket 07-075-tf-Doc. 229

2013 Arkansas Weatherization Program EM&V Report
Process Findings and Program Updates 3-24
o Assessment of Education
The AWP sufficiently implements educational efforts towards its
prospective participants and other customers. Appendix B provides
examples of the educational messages and materials used by the utilities
and community action agencies for this purpose. This includes:
Providing educational materials (energy audit, brochures,
demonstrations)
Providing outreach through multiple channels (news releases, in-
person, direct mail, informational flyers, website)
Providing education targeted to specific market barriers
(emphasizing increased comfort and safety levels as a benefit of
energy efficiency)
The AWP could potentially improve the following component:
Providing coordinated education from multiple entities. Each
agency and some utilities provide this, but based on interviews with
agency and utility staff, the coordination could be improved. For
example, seeking best practices from agency to agency may lead
to a unified and effective educational approach.
o Assessment of Training
The majority of active agencies have continued to participate in multiple
training courses throughout the year. Nearly all of these training courses
award certifications and each attendee logged between 35 and 237
training hours on average.7 These courses maintain contractor skill levels
and ensure that agency services comply with up-to-date audit and
installation requirements.
o Marketing and Outreach
The marketing methods that have been used during 2013 meet the
following criteria: 8
Address specific barriers (emphasizing association with utility
providers, emphasizing lack of income requirement)
Performed through several channels (in-person, websites, direct
mail, word-of-mouth)
7 These values are based on information received from ACAAA staff regarding the types and attendance level of training courses offered to community action agencies. Further training information may be found in Section 5.1 (Training) of the Arkansas Weatherization Program annual report:
(http://www.apscservices.info/EEInfo/EEReports/AWP%202012.pdf)
8 Specific examples of marketing and outreach materials used for the AWP can be found in Appendix B.
APSC FILED Time: 4/1/2014 12:29:49 PM: Recvd 4/1/2014 11:59:47 AM: Docket 07-075-tf-Doc. 229

2013 Arkansas Weatherization Program EM&V Report
Process Findings and Program Updates 3-25
The AWP could potentially improve the following component:
Promoted by trade allies (agencies and their contractors). Program
marketing activity has generally been negatively correlated with the
increase in WAP waiting list participants. Agencies could be more
active in promoting the program to non-WAP participants, although
these efforts appear to have increased during the 2013 program
year. 9
Factor 2: Budgetary, Management, and Program Delivery Resources
The funding provided by AWP utility sponsors is sufficient based on the
program’s objective of leveraging the WAP.10 However, utility and ACAAA staff
noted that issues within the WAP, including the participation waiting list and
reduced agency staffing due to funding uncertainties, have resulted in fewer
resources than initially expected. Agencies report that their staffing is highly
dependent on WAP funding, meaning that it will be very difficult to meet program
goals if there continue to be issues within the federal component.
These issues cannot specifically be attributed to the design of the AWP, as they
are related to external factors that cannot easily be addressed within the
program’s structure. However, adequate budgetary and staffing levels may not
be achieved unless the agencies have access to additional funding. Thus far, it is
unclear whether the transition of the WAP to the Arkansas Energy Office will
alleviate some of these issues. An increased level of funding per home from the
utilities could mitigate issues with reliance on WAP funding for the AWP. This
issue should be addressed through the new Weatherization Collaborative.
Factor 3: Addressing Major End-Uses
The AWP offers a wide range of measures, which are chosen based on cost-
effectiveness testing through NEAT and MHEA. The list of eligible program
measures covers all major end-uses for targeted customer homes, including:
o HVAC systems;
o Equipment tune-ups;
o Hot water measures;
o Appliances (refrigerators);
o Safety measures (smoke detectors);
9 Based on program tracking data, a higher percentage (~10%) of participants were non-WAP customers as compared to prior years where less than 5% of participants were non-WAP customers.
10 Program planning documentation such as ACAAA Docket no. 07-079-TF and the Arkansas Weatherization Program Annual Reports provide estimated participation levels based on available WAP and AWP budgets: (http://www.apscservices.info/EEInfo/EEReports/AWP%202012.pdf). Appendix C of this report provides summary tables of planned vs. achieved program costs and savings goals.
APSC FILED Time: 4/1/2014 12:29:49 PM: Recvd 4/1/2014 11:59:47 AM: Docket 07-075-tf-Doc. 229

2013 Arkansas Weatherization Program EM&V Report
Process Findings and Program Updates 3-26
o Lighting; and
o Building envelope measures.11
The “whole house” approach to participant home improvements is conducive to
providing a comprehensive set of measures in each home. The eligible measure
list may be modified if additional energy efficiency measures become relevant to
the residential sector.
Factor 4: Comprehensively Addressing Customer Needs
The AWP comprehensively addresses the major needs of most of its
participants. The program primarily provides services to customers who likely
would not otherwise make major efficiency improvements to their homes, and
whose homes are in substantial need of energy efficiency improvements and
repairs. Specifically, the program provides the following benefits:
o Technical assistance through in-home audits;
o Energy and monthly bill savings through measure installation; and
o Increased comfort and/or safety for participants.
Participants who provide their own private co-pay for the audit and energy
efficiency measures may choose to receive a less comprehensive set of services
as they are allowed to select individual measures. These participants are
encouraged to install the full set of recommended items, but comprehensiveness
within measure installation is not required by the program in these cases.
Factor 5: Targeting Market Sectors & Leveraging Opportunities
The AWP focuses on a specific market of utility residential customers whose
homes are severely energy inefficient. This program is intended to amplify the
benefits of the statewide Weatherization Assistance Program (WAP) in order to
provide additional services to customers who have substantial weatherization
needs. Thus, the program leverages WAP resources and is delivered through the
same channels as the WAP. The AWP also involves utility partnerships and is
intended to provide cross-fuel coordination rather than focusing only on gas or
electric savings in isolation.
Factor 6: Cost-Effectiveness of Energy Efficiency
The program is designed to cost-effectively generate net savings and meet the
stated annual program goals. However, the program has been unable to meet
the annual goals thus far. Additionally, cost-effectiveness has varied widely
11 A complete list of eligible AWP measures can be found in program filing and planning documentation
such as Attachment A, (AWP Modified Program Design and Description), of ACAAA Docket no. 07-079-TF.
APSC FILED Time: 4/1/2014 12:29:49 PM: Recvd 4/1/2014 11:59:47 AM: Docket 07-075-tf-Doc. 229

2013 Arkansas Weatherization Program EM&V Report
Process Findings and Program Updates 3-27
among utilities, with TRC scores ranging from .31 to 5.01.12 The AWP has
successfully met industry standards for net-to-gross levels, as the Evaluators
have determined that it calls for a net-to-gross ratio of 1. However, in terms of
cost-effectiveness and savings goals, the AWP has not performed sufficiently.
Factor 7: Adequacy of EM&V Procedures
The AWP was reviewed for EM&V procedures in the following areas:
o QA/QC and EM&V procedures conducted by utility staff;
o QA/QC and EM&V procedures conducted by installation contractor staff;
and
o QA/QC and EM&V procedures conducted by the Evaluators.
The onsite QA/QC procedures currently conducted by utility staff and agency
staff are adequate. These procedures monitor implementation quality, ensure the
accuracy of ex ante records, and are able to resolve onsite issues soon after they
occur. During onsite field verification visits during 2012, the Evaluators found that
the reported installation data was fairly accurate and matched actual observed
conditions.
Although there have been various issues regarding data consistency, calculation
accuracy, and data cleaning, the current version of the tracking database within
EnerTrek contains nearly all necessary information to comply with existing TRM
requirements.13 Frontier Associates, the EnerTrek provider, has made efforts to
update the system as needed, and although this has resulted in delays and
access issues, the system appears to be functional at this point. There continue
to be some improvements that could be made to the tracking system, as
identified within this report. Additionally, in the future it will be necessary to
ensure that the data are accessible and accurate earlier in the program year.
This may require including additional information, such as measure counts, within
the periodic updates that are provided to utilities throughout the year.
These results indicate that the Arkansas Weatherization Program partially meets the
comprehensiveness criteria outlined above. There are issues within multiple areas, and
further changes will likely be necessary both within the program’s operational structure
and within the external market, before these criteria can be fully met. As previously
noted, utility annual reports and other portfolio-level assessments may provide a more
comprehensive view of how the AWP fits into the larger context of the sponsoring
utilities’ energy efficiency program portfolios.
12
Further information regarding program cost-effectiveness can be found in utility-specific cost-benefit spreadsheets on the Arkansas Public Service Commission (APSC) website: http://www.apscservices.info/eeAnnualReports.aspx
13 See Section 2.5 of this report for detailed information regarding the program tracking data review.
APSC FILED Time: 4/1/2014 12:29:49 PM: Recvd 4/1/2014 11:59:47 AM: Docket 07-075-tf-Doc. 229

Conclusions & Recommendations 4-1
4. Conclusions & Recommendations
After reviewing the Arkansas Weatherization Program for 2013, the Evaluators highlight
the following conclusions:
WAP Reliance Issues: The community action agencies and ACAAA are working in the
context of their other community programs and the statewide Weatherization Assistance
Program (WAP), which is directly tied to federal funding. Ideally, this arrangement would
use utility funds to efficiently leverage federal funding and substantially increase the
number of weatherization projects that the agencies are able to perform. However, it
appears that the AWP’s inherent link to the WAP has resulted in performance issues
due to federal funding reductions and statewide program reorganization.
As noted previously, based on the Commission’s Order in docket no. 13-002-U, all of
the utility energy efficiency programs, including the AWP, will be revised through the
Collaborative process outlined in the Order. In addition, the transfer of the WAP to the
Arkansas Energy Office may result in beneficial modifications that alleviate some of
these issues.
Beneficial Agency Reduction Effects: Nearly all interview respondents reported that
the reduction in weatherization agencies has been a beneficial modification. As the
remaining agencies appear to be actively recruiting participants and implementing
services, the weatherization network may become more engaged as a whole as
compared to previous years. Additionally, if the per-agency funding levels are
increased, this will likely allow the agencies to weatherize additional homes and improve
savings performance.
The agencies appear to be adequately managing the increased distance between
service providers, and all utility service territories are represented by at least one of the
six agencies. Although the majority of the remaining agencies report that they do not
prioritize AWP funds over WAP funds, two agencies report that they are actively
seeking non-WAP participants and that they expect to recruit a substantial number in
the coming year.
Program Coordination Complexity: Interviewed utility staff reiterated their main
concerns from the prior program year, and generally reported that the program has
continued to struggle with meeting participation goals, facilitating efficient
communication, and ensuring prompt, accurate data reporting. The AWP operational
structure is composed of many different entities: Six active community action agencies
and their contractors, the Arkansas Community Action Agency Association (ACAAA),
and seven utility providers. Each utility is operating within the context of its other energy
savings programs, with specific energy savings goals and cost effectiveness targets.
The program incorporates many organizations that must communicate clearly and
operate cooperatively in order for the program to avoid reporting delays and
APSC FILED Time: 4/1/2014 12:29:49 PM: Recvd 4/1/2014 11:59:47 AM: Docket 07-075-tf-Doc. 229

2013 Arkansas Weatherization Program EM&V Report
Conclusions & Recommendations 4-2
inconsistent program delivery. These factors place the AWP in a somewhat fragile
operational framework, where delays and performance issues have been difficult to
avoid.
Data Revision and Transfer Issues: One of the most commonly mentioned issues by
program staff has been the consistent delays in the data transfer and reporting process.
The program is structured such that CADC collects the completed weatherization data
from each agency, and then delivers it to Frontier Associates, the EnerTrek software
provider. Frontier then enters the data into the EnerTrek software tool and then makes
the data available to the program utilities. Ideally, this would be a one-way process, but
Frontier Associates has needed to obtain additional data, data corrections, or data
revisions from CADC for each batch of data. These tasks and their associated
turnaround times have added to the lead time between job completion and final data
reporting. This situation is reportedly being addressed through clarifying discussions
between CADC and Frontier, although thus far it is unclear whether all issues will be
quickly resolved.
Program Interruption: Although the AWP has not met participation or savings goals in
prior years. the additional decrease in participation levels during the 2013 program year
may be mainly attributable to the fact that the program paused implementation activity in
April due to funding issues. These issues were partially related to the initiation of
program restructuring on a statewide level, and the overall fact that the timing and level
of DOE funding for the WAP was uncertain. The end result has left the AWP with fewer
participants than past years, and the program has not met the savings goals for any of
the participating utilities.
The AWP has operated within a transitional phase of the WAP, and program
performance difficulties may have been expected during this time. However, it appears
that the performance issues noted in prior years have persisted during this period. This
issue may be avoided if funding levels are maintained and delivered as expected during
the 2014 program year.
Potential for Collaborative Communication: Utility and agency staff noted that it may
be useful to hold introductory meetings between the utilities and local agencies so that
all parties may familiarize themselves with each other and develop a more collaborative
working relationship. With the recent transition to a smaller group of agency providers,
participants in some utility service territories will now be served by different agency
organizations. Additionally, with a smaller number of entities working to implement the
program, it may be more feasible to develop and mutually agree on promotional or
general implementation strategies.
A collaborative relationship among all utilities and agency implementers has been a
goal and an integral component of the AWP since its inception. In 2013, WAP transition
and funding issues, as well as uncertainty due to the Commission’s requirement to
develop and submit for approval collaborative procedural guidelines, led to fewer AWP
APSC FILED Time: 4/1/2014 12:29:49 PM: Recvd 4/1/2014 11:59:47 AM: Docket 07-075-tf-Doc. 229

2013 Arkansas Weatherization Program EM&V Report
Conclusions & Recommendations 4-3
Collaborative meetings. Such meetings had been a regular part of AWP
implementation in prior years. ACAAA staff reported that collaborative discussions have
been a key aspect of AWP design since its inception, and that collaborative meetings
had been common in years prior to 2013. The 2013 WAP transition and funding issues,
as well as uncertainty regarding the future of weatherization in Arkansas, likely created
additional barriers to this type of collaboration. While future discussions may reveal
opportunities to improve marketing efforts towards non-WAP participants or other
aspects of program performance, the actual result may simply serve to acknowledge the
new utility-agency partnerships that have resulted from the weatherization agency
transition.
Tracking Data Limitations: While the current version of the tracking database contains
adequate calculations and inputs for the majority of measures, the processes of
uploading data to the database and updating database structure have both been fairly
inefficient. Thus far, it appears that the current arrangement of attempting to periodically
update EnerTrek and align NEAT and MHEA measures and calculations with TRM
requirements has been costly and time-consuming. In addition to administrative costs,
the time and budget required to retroactively update the database can affect program
cost-effectiveness and create barriers to program performance.
In order to fully comply with TRM V3.0 and any future TRM updates, EnerTrek will have
to be flexible enough to receive updates without disrupting the data input process or
delaying savings reporting. This will likely require substantial improvements in staff
coordination and potentially significant changes to how the software is maintained.
Without approval of additional budgets to implement substantial changes, database
modifications will likely be limited to minor improvements that focus on the highest
impact measures.
Based on these conclusions and other findings, the Evaluators make the following
recommendations:
Resolve Data Transfer Issues: If there are any remaining uncertainties between
CADC and Frontier regarding the format, content, or interpretation of data fields or
inputs, these should be reconciled prior to the data transfer process in upcoming years.
Resolving these uncertainties should reduce the number of data correction or
clarification requests and increase the efficiency of the data reporting process. Ideally, it
will not be necessary to reprogram the EnerTrek software or revise the structure of
CADC data batches during the program year.
Maintain Electronic Records: It would be beneficial for each agency to collect and
maintain accessible electronic records of any data that may be requested by Frontier, or
that CADC aggregate the data from each agency and store it in a centrally accessible
way. Situations where there are implementation, audit, or verification data that only exist
in hardcopy format at the end of the program year should be avoided. Additionally it
may be beneficial for CADC to eventually develop a shared database that is accessible
APSC FILED Time: 4/1/2014 12:29:49 PM: Recvd 4/1/2014 11:59:47 AM: Docket 07-075-tf-Doc. 229

2013 Arkansas Weatherization Program EM&V Report
Conclusions & Recommendations 4-4
to all agencies for the purposes of submitting implementation data. This would ensure
that all relevant data are stored in a single location, and would likely reduce the
turnaround time for data requests.
Utility-Agency Communication: Although the AWP is intended to be fully
implemented and delivered by the community action agencies and ACAAA, regular
communication and information accessibility are key factors to facilitate a cooperative
working relationship. While CADC consolidates agency-collected data and holds a key
role as a lead agency, it may not have the bandwidth to serve as the sole contact point
between each agency and utility for all purposes. Thus, the Evaluators provide two
recommendations that may improve communications among program entities:
Collaboration Meeting: It may be useful for the utilities and the agencies within
their respective service territories to hold an introductory meeting in order to
recognize the newly established agency-utility connections that have resulted
from the reduction in weatherization providers. This may facilitate a mutually
beneficial working relationship, or at a minimum allow territory-specific questions
to be answered more efficiently.
Updated Organizational Chart: Along with the reduction in weatherization
service providers and the broader changes in statewide weatherization, some
program staff has reported that they are not currently aware of the roles and
responsibilities of each entity. As recommended by utility staff, CADC and the
utilities should consider developing an organizational chart showing the
relationship among all AWP entities, as well as the roles, responsibilities, and
contact information of representatives at each agency and utility. This is related
to the overall coordination of the program, and explicitly identifying key roles and
connections between organizations would likely facilitate effective working
relationships.
Incrementally Increase Compliance with TRM Requirements: As with the prior
program year, the tracking data was found to include sufficient information for the
majority of the measures. However, the tracking data did not include sufficient
information for the following measures:
Water Heater Replacement
- The tracking data did not present the energy factor (EF) of the energy
efficient equipment, which is a necessary input in TRM V3.0 for savings
calculation.
Vented Space Heater
- The tracking data did not present the square footage or age of the
replaced vented space heater, which are necessary inputs in TRM V3.0
for savings calculation.
APSC FILED Time: 4/1/2014 12:29:49 PM: Recvd 4/1/2014 11:59:47 AM: Docket 07-075-tf-Doc. 229

2013 Arkansas Weatherization Program EM&V Report
Conclusions & Recommendations 4-5
The weather zone of each household is necessary for many of the savings calculations.
This information was used by Frontier Associates to calculate savings; however, it was
not presented in the tracking data. Additionally, TRM V3.0 contains additional
requirements that may require further updates to the EnerTrek software tool. The
utilities and CADC should ensure that all possible updates to this database are included
prior to the end of the 2014 program year.
Increase Level of Detail in Utility Updates: Utility staff reported that the updates they
receive from CADC regarding program performance are mainly limited to participant
counts and overall costs. Utility staff are not aware which customers participated in the
program or which measures were installed until the end of the program year. CADC
should increase the level of detail within these reports and include participant names,
addresses, measure counts, and other information if possible. This will allow the utilities
to identify participants, to understand more about how the program is performing, and to
potentially estimate preliminary savings.
Adjust EnerTrek Algorithms and Conduct Thorough Quality Assurance: Frontier
should conduct more thorough quality assurance procedures when verifying the
accuracy of EnerTrek savings algorithms. The largest contributors to low realization
rates for this program year were related to simple errors within EnerTrek calculations.
Although the heating system type was provided within program tracking data, EnerTrek
did not reliably incorporate the correct heating type into savings calculations for attic
insulation, air infiltration, and window replacement. This specific issue, and any other
algorithm errors, should be addressed as soon as possible.
Another issue is that some insulation measures were installed without meeting minimum
TRM R-value requirements. This is related to both the measure installation and savings
calculation program phases, as agency contractors should avoid implementing
measures that will not qualify for savings under the TRM. Additionally, if these
measures are implemented, the EnerTrek system should be adjusted to eliminate
savings for measures that do not meet minimum requirements.
Conduct Further Research Assessing Air Infiltration and Insulation Estimates:
The ability to isolate specific measure effects and behavioral variables with regression
analyses of the AWP may be somewhat restricted by the limited participant population
size and high presence of measure crossover, in that the majority of residences
received both air infiltration and attic insulation measures. However, a billing analysis
involving a larger participant population may allow for quantitative isolation of individual
behavioral variables and measure types. This may provide further evidence that
necessitates revisions to the TRM with regard to the reasonableness of air infiltration
and insulation measure savings calculations. These are the two highest-impact gas
savings measures that are implemented through the AWP. The Evaluators recommend
conducting additional research in the form of billing analysis and reviews of industry
APSC FILED Time: 4/1/2014 12:29:49 PM: Recvd 4/1/2014 11:59:47 AM: Docket 07-075-tf-Doc. 229

2013 Arkansas Weatherization Program EM&V Report
Conclusions & Recommendations 4-6
standards for TRM estimates of weatherization savings prior to implementing any
specific changes to existing TRM formulas.
APSC FILED Time: 4/1/2014 12:29:49 PM: Recvd 4/1/2014 11:59:47 AM: Docket 07-075-tf-Doc. 229

2013 Arkansas Weatherization Program EM&V Report
Conclusions & Recommendations 4-7
Table 4-1 Recommendations from 2013 Program Year Evaluation
Issue Consequences Recommendation
There have been delays in database finalization due to uncertainties in data interpretation and requirements between CADC and Frontier.
Reduces accessibility to database for utilities Delays savings reporting and may cause inaccurate reports
Resolve issues early in 2014 program year, including data interpretation issues, so that multiple data and database revisions are not necessary.
Some data are not available due to being only in hardcopy form or decentralized from the CADC.
Potential lost data Potential delays in data transfer if additional data are needed
Agencies should maintain electronic records of all collected audit, implementation, and verification data.
Communication among utilities and agencies is limited.
Causes difficulties in utility-agency coordination
Recommendation 1: Hold introductory meetings between utilities and the remaining six agencies in order to develop familiarity and identify key contact persons, establish communication lines Recommendation 2: Develop an organizational chart displaying roles, responsibilities, and contact persons for each entity (utilities, agencies, ACAAA, etc.)
Some data required for TRM 2.0 and 3.0 do not appear to have been collected.
Creates difficulties in savings verification May result in inaccurate ex ante savings estimates if insufficient inputs are used
Ensure that the data collection forms and database are compliant with relevant TRM requirements to the extent possible based on budget constraints.
APSC FILED Time: 4/1/2014 12:29:49 PM: Recvd 4/1/2014 11:59:47 AM: Docket 07-075-tf-Doc. 229

2013 Arkansas Weatherization Program EM&V Report
Conclusions & Recommendations 4-8
Utilities are not aware of project details until end of year.
Limits utility ability to plan for annual reporting Limits utility awareness of program performance
Include more details in the periodic reports that are sent to utilities, including measure counts/descriptions, customer names, etc.
EnerTrek contains erroneous assumptions for individual measure algorithms (air infiltration, attic insulation, window replacement).
Results in inaccurate ex ante savings (in this case savings were highly overestimated) Decreases program realization rates
Frontier should perform thorough quality assurance practices and verify that EnerTrek calculations comply with TRM algorithms.
TRM estimates for Therms savings substantially exceed regression analysis results.
TRM formulas may be inaccurately estimating Therms savings.
Conduct further research into TRM industry standards for weatherization, or perform a more in-depth billing analysis for a larger population, prior to implementing TRM changes for air infiltration or insulation.
APSC FILED Time: 4/1/2014 12:29:49 PM: Recvd 4/1/2014 11:59:47 AM: Docket 07-075-tf-Doc. 229

Appendix A: Supplemental Survey for Billing Analysis A-1
5. Appendix A: Supplemental Survey for Billing Analysis
APSC FILED Time: 4/1/2014 12:29:49 PM: Recvd 4/1/2014 11:59:47 AM: Docket 07-075-tf-Doc. 229

2013 Arkansas Weatherization Program EM&V Report
Appendix A: Supplemental Survey for Billing Analysis A-2
APSC FILED Time: 4/1/2014 12:29:49 PM: Recvd 4/1/2014 11:59:47 AM: Docket 07-075-tf-Doc. 229

2013 Arkansas Weatherization Program EM&V Report
Appendix A: Supplemental Survey for Billing Analysis A-3
APSC FILED Time: 4/1/2014 12:29:49 PM: Recvd 4/1/2014 11:59:47 AM: Docket 07-075-tf-Doc. 229
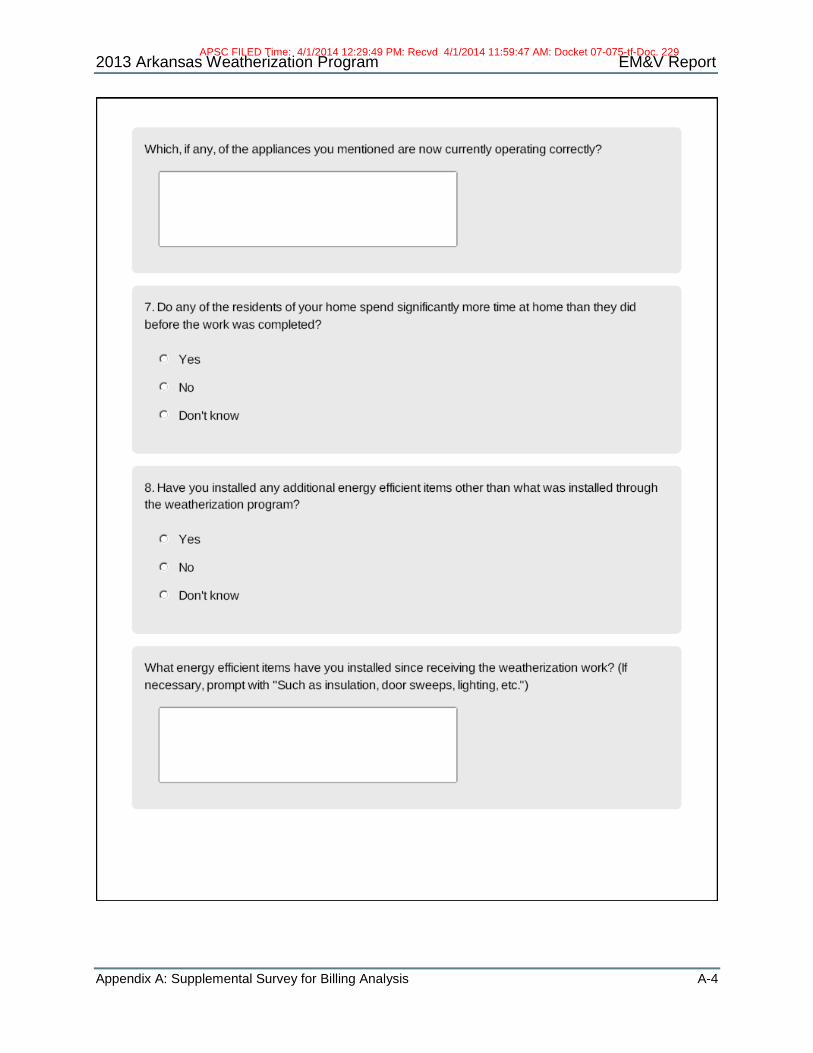
2013 Arkansas Weatherization Program EM&V Report
Appendix A: Supplemental Survey for Billing Analysis A-4
APSC FILED Time: 4/1/2014 12:29:49 PM: Recvd 4/1/2014 11:59:47 AM: Docket 07-075-tf-Doc. 229

2013 Arkansas Weatherization Program EM&V Report
Appendix A: Supplemental Survey for Billing Analysis A-5
APSC FILED Time: 4/1/2014 12:29:49 PM: Recvd 4/1/2014 11:59:47 AM: Docket 07-075-tf-Doc. 229

2013 Arkansas Weatherization Program EM&V Report
Appendix A: Supplemental Survey for Billing Analysis A-6
APSC FILED Time: 4/1/2014 12:29:49 PM: Recvd 4/1/2014 11:59:47 AM: Docket 07-075-tf-Doc. 229

2013 Arkansas Weatherization Program EM&V Report
Appendix A: Supplemental Survey for Billing Analysis A-7
APSC FILED Time: 4/1/2014 12:29:49 PM: Recvd 4/1/2014 11:59:47 AM: Docket 07-075-tf-Doc. 229

Appendix B: AWP Sample Marketing Materials B-1
6. Appendix B: Sample AWP Marketing Materials
APSC FILED Time: 4/1/2014 12:29:49 PM: Recvd 4/1/2014 11:59:47 AM: Docket 07-075-tf-Doc. 229

2013 Arkansas Weatherization Program EM&V Report
Appendix B: AWP Sample Marketing Materials B-2
APSC FILED Time: 4/1/2014 12:29:49 PM: Recvd 4/1/2014 11:59:47 AM: Docket 07-075-tf-Doc. 229

2013 Arkansas Weatherization Program EM&V Report
Appendix B: AWP Sample Marketing Materials B-3
APSC FILED Time: 4/1/2014 12:29:49 PM: Recvd 4/1/2014 11:59:47 AM: Docket 07-075-tf-Doc. 229

2013 Arkansas Weatherization Program EM&V Report
Appendix B: AWP Sample Marketing Materials B-4
APSC FILED Time: 4/1/2014 12:29:49 PM: Recvd 4/1/2014 11:59:47 AM: Docket 07-075-tf-Doc. 229

Appendix C: Annual Report Summary of Program Budgets and Goals C-1
7. Appendix C: Annual Report Summary of Program Budgets and Goals
This section presents tables summarizing annual program budgets, expenses, and
energy savings goals for each of the utilities funding the Arkansas Weatherization
Program. These tables were extracted directly from the Arkansas Weatherization
Program Annual Report for 201214, and are included in this report for reference
purposes.
The data presented in these tables represent program activity from January 2010
through December 2012. Achieved savings values shown are based on the Evaluators’
prior program evaluation report results. Further detail and narrative regarding the
information presented in these tables may be found in the full versions of the
aforementioned report.
Figure C-1 AWP 2012 Annual Report: Weatherization Program Costs, Natural Gas Utilities
14
Obtained from Section 3.1.3 of the Arkansas Weatherization Program Annual Report for 2012 (http://www.apscservices.info/EEInfo/EEReports/AWP%202012.pdf)
APSC FILED Time: 4/1/2014 12:29:49 PM: Recvd 4/1/2014 11:59:47 AM: Docket 07-075-tf-Doc. 229

2013 Arkansas Weatherization Program EM&V Report
Appendix C: Annual Report Summary of Program Budgets and Goals C-2
Figure C-2 AWP 2012 Annual Report: Weatherization Program Savings Goals, Natural Gas Utilities
Figure C-3 AWP 2012 Annual Report: Weatherization Program Costs, Electric Utilities
APSC FILED Time: 4/1/2014 12:29:49 PM: Recvd 4/1/2014 11:59:47 AM: Docket 07-075-tf-Doc. 229

2013 Arkansas Weatherization Program EM&V Report
Appendix C: Annual Report Summary of Program Budgets and Goals C-3
Figure C-4 AWP 2012 Annual Report: Weatherization Program Savings Goals, Electric Utilities
APSC FILED Time: 4/1/2014 12:29:49 PM: Recvd 4/1/2014 11:59:47 AM: Docket 07-075-tf-Doc. 229

5.0 Attachment D
APSC FILED Time: 4/1/2014 12:29:49 PM: Recvd 4/1/2014 11:59:47 AM: Docket 07-075-tf-Doc. 229

Evaluation of 2013 AOG/OG&E Weatherization Program
Submitted to:
Arkansas Oklahoma Gas Corporation Oklahoma Gas and Electric
March 2014
Prepared by:
ADM Associates, Inc.
APSC FILED Time: 4/1/2014 12:29:49 PM: Recvd 4/1/2014 11:59:47 AM: Docket 07-075-tf-Doc. 229

Corporate Headquarters: 3239 Ramos Circle Sacramento, CA 95827 Tel: (916) 363-8383
ADM Associates Inc. Energy Research & Evaluation
200 Brown Road Suite 208 Fremont, CA 94539 Tel: (510) 371-0763
Prepared by:
Brian Harold Adam Thomas
Matthew Jaoudi Jeremy Offenstein, Ph.D
William Holleran
APSC FILED Time: 4/1/2014 12:29:49 PM: Recvd 4/1/2014 11:59:47 AM: Docket 07-075-tf-Doc. 229

Acknowledgements
We would like to thank the staff at both Arkansas Oklahoma Gas (AOG) and Oklahoma
Gas and Electric (OG&E) for their time and effort in contributing to the evaluation,
measurement, and verification (EM&V) of the AOG/OG&E Weatherization Program.
This evaluation required regular communications with staff at AOG and OG&E, who
were very responsive to evaluation requests and actively participated in interviews and
other discussions.
Additionally, we would like to thank AOG and OG&E participating customers, program
contractors, and program tracking database management staff for their cooperation and
assistance throughout the evaluation.
We would also like to thank Independent Evaluation Monitor staff for their active
involvement in providing thorough answers and clarification to the evaluation team in
response to higher-level questions that arose throughout the EM&V effort.
APSC FILED Time: 4/1/2014 12:29:49 PM: Recvd 4/1/2014 11:59:47 AM: Docket 07-075-tf-Doc. 229

i
TABLE OF CONTENTS
Section Title Page
1. Executive Summary .................................... Error! Bookmark not defined.
2. Impact Findings .......................................... Error! Bookmark not defined.
3. Process Findings and Program Updates .... Error! Bookmark not defined.
4. Conclusions and Recommendations .......... Error! Bookmark not defined.
Appendix A: Sample AOG-OG&E Weatherization Marketing………………………….…A-1
Appendix B: Annual Report Summary of Program Budgets and Goals …..……………B-1
APSC FILED Time: 4/1/2014 12:29:49 PM: Recvd 4/1/2014 11:59:47 AM: Docket 07-075-tf-Doc. 229

ii
LIST OF TABLES
Title Page
Table 1-1 Key Activities and Program Stages, 2013 Program Year ............................. 1-2
Table 1-2 TRM Sections by Measure Type .................................................................. 1-4
Table 1-3 Gross Savings for AOG and OG&E ............................................................. 1-5
Table 1-4 Net Savings for AOG and OG&E ................................................................. 1-5
Table 1-5 Net Savings by Measure Type, AOG and OG&E ......................................... 1-5
Table 1-6 Recommendations from 2013 Program Year Evaluation ........................... 1-11
Table 2-1 Ex Ante Savings by Measure Type – AOG .................................................. 2-2
Table 2-2 Ex Ante Savings by Measure Type – OG&E ................................................ 2-2
Table 2-3 Ex Ante Savings by Measure Type – Non-Program ..................................... 2-2
Table 2-4 TRM Sections by Measure Type .................................................................. 2-3
Table 2-5 Deemed Savings Values for Air Infiltration Reduction, Zone 7 ..................... 2-3
Table 2-6 Deemed Savings Values for Ceiling Insulation, Zone 8 ............................... 2-4
Table 2-7 Distribution of Respondents across Indicator Variable Combinations .......... 2-8
Table 2-8 Verified Gross Savings by Measure Type, AOG and OG&E ...................... 2-11
Table 2-9 Verified Gross Savings by Measure Type, Non-Program ........................... 2-11
Table 2-10 Verified Net Savings for AOG and OG&E ................................................ 2-12
Table 2-11 Verified Net Savings for AOG by Measure ............................................... 2-12
Table 2-12 Verified Net Savings for OG&E by Measure............................................. 2-13
Table 2-13 Net Savings by Measure Type – Non-Program ........................................ 2-13
Table 3-1 Determining Process Evaluation Timing ...................................................... 3-1
Table 3-2 Determining Process Evaluation Conditions ................................................ 3-1
Table 3-3 Interview and Survey Data Collection Summary .......................................... 3-2
Table 3-4 Status of 2012 Evaluation Recommendations.............................................. 3-3
APSC FILED Time: 4/1/2014 12:29:49 PM: Recvd 4/1/2014 11:59:47 AM: Docket 07-075-tf-Doc. 229

iii
Table 3-5 Participation by Associated Utility ................................................................ 3-3
Table 3-6 Total Implementations by Measure .............................................................. 3-4
Table 3-7 Database Review Goals & Activities .......................................................... 3-12
Table 4-1 Recommendations from 2013 Program Year Evaluation ............................. 4-5
APSC FILED Time: 4/1/2014 12:29:49 PM: Recvd 4/1/2014 11:59:47 AM: Docket 07-075-tf-Doc. 229

iv
LIST OF FIGURES
Title Page
Figure 3-1 AOG/OG&E Weatherization Program Logic Model ..................................... 3-2
Figure 3-2 Homes Serviced by Month, 2013 ................................................................ 3-4
Figure B-1 OGE 2012 Annual Report: Weatherization Program Budgets and Goals ...B-1
Figure B-2 AOG 2012 Annual Report: Weatherization Program Budgets and Goals ...B-2
APSC FILED Time: 4/1/2014 12:29:49 PM: Recvd 4/1/2014 11:59:47 AM: Docket 07-075-tf-Doc. 229

Executive Summary 1-1
1. Executive Summary
The purpose of this report is to provide a summary of the evaluation effort of the 2013
AOG/OG&E Weatherization Program. This evaluation was conducted by ADM
Associates (referred to in this report as the Evaluators). This report provides verified
gross and net savings findings for the evaluated program, and discusses overall
program progress as well as notable changes from the prior program year.
As there have been few modifications to program structure, operation, and delivery
since the prior program year, this report primarily focuses on program impacts in terms
of gas and electric savings. While this report provides a review of previous program
findings and recommendations, a full process evaluation can be found in the 2012
AOG/OG&E Weatherization Program Evaluation Report.
1.1 Overview of AOG/OG&E Weatherization Program
The general structure of the program has for the most part remained unchanged since
the 2012 program year. The following provides a review of program design
characteristics and operational procedures.
In 2013, the AOG/OG&E Weatherization Program provided residential energy audits
and energy efficiency installations to customers within the service territory of Arkansas
Oklahoma Gas Corporation (AOG) and Oklahoma Gas and Electric (OG&E).
Participating homes were evaluated in order to determine potential energy efficiency
measures that would improve overall building efficiency and reduce residential energy
usage. The program provided funds for the installation of various measures, including
insulation, lighting, air infiltration, air conditioner replacement, and refrigerator
replacement.1
The AOG/OG&E Weatherization Program is designed to provide utility funds to
customers in order to assist customers with the costs of the in-home audit and
installation of energy efficiency improvements. Eligible customers receive funds from
both AOG and OG&E in this co-funded program. As with the prior program year, total
utility funding is a maximum of $3,000 per participant home.
Eligible OG&E customers include homeowners or leaseholders of a single family home,
duplex condos, townhouses or mobile home constructed prior to 1997. Participants
1 Refrigerator replacements were performed during the beginning of the program year, but were ceased due to cost effectiveness factors. The measures listed are those that were installed during the 2013 program year; a full list of measures can be found within the program filing documentation.
APSC FILED Time: 4/1/2014 12:29:49 PM: Recvd 4/1/2014 11:59:47 AM: Docket 07-075-tf-Doc. 229
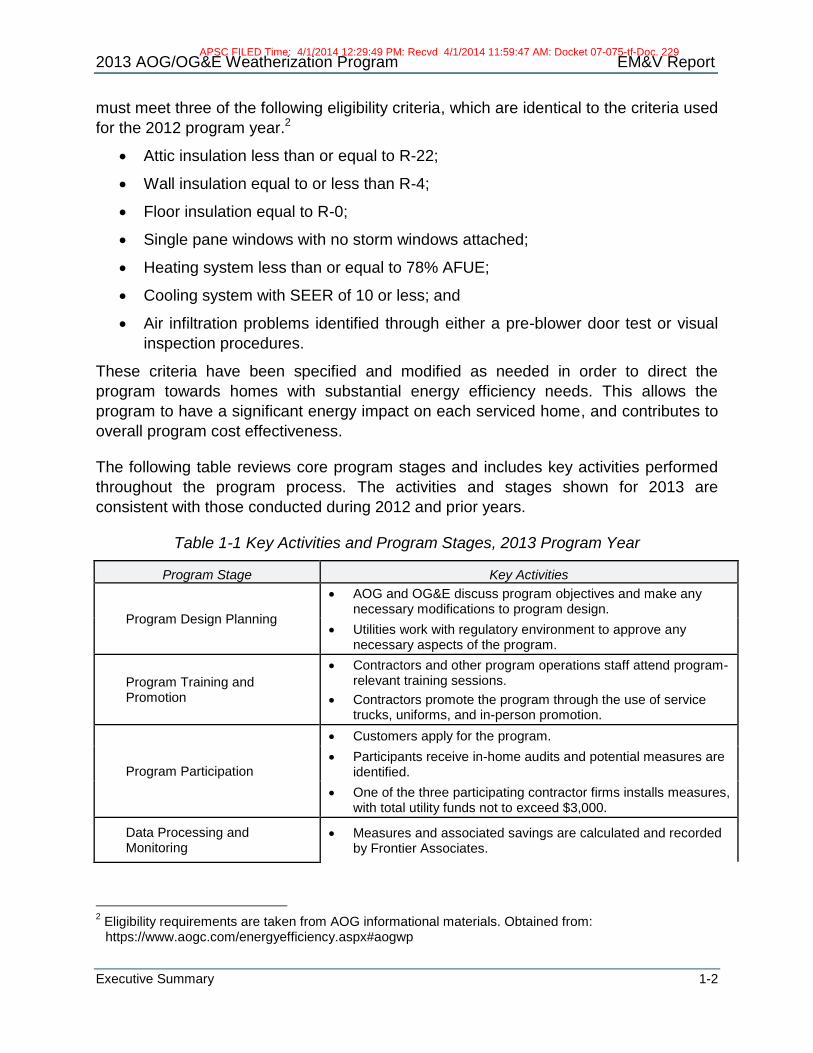
2013 AOG/OG&E Weatherization Program EM&V Report
Executive Summary 1-2
must meet three of the following eligibility criteria, which are identical to the criteria used
for the 2012 program year.2
Attic insulation less than or equal to R-22;
Wall insulation equal to or less than R-4;
Floor insulation equal to R-0;
Single pane windows with no storm windows attached;
Heating system less than or equal to 78% AFUE;
Cooling system with SEER of 10 or less; and
Air infiltration problems identified through either a pre-blower door test or visual
inspection procedures.
These criteria have been specified and modified as needed in order to direct the
program towards homes with substantial energy efficiency needs. This allows the
program to have a significant energy impact on each serviced home, and contributes to
overall program cost effectiveness.
The following table reviews core program stages and includes key activities performed
throughout the program process. The activities and stages shown for 2013 are
consistent with those conducted during 2012 and prior years.
Table 1-1 Key Activities and Program Stages, 2013 Program Year
Program Stage Key Activities
Program Design Planning
AOG and OG&E discuss program objectives and make any necessary modifications to program design.
Utilities work with regulatory environment to approve any necessary aspects of the program.
Program Training and Promotion
Contractors and other program operations staff attend program-relevant training sessions.
Contractors promote the program through the use of service trucks, uniforms, and in-person promotion.
Program Participation
Customers apply for the program.
Participants receive in-home audits and potential measures are identified.
One of the three participating contractor firms installs measures, with total utility funds not to exceed $3,000.
Data Processing and Monitoring
Measures and associated savings are calculated and recorded by Frontier Associates.
2 Eligibility requirements are taken from AOG informational materials. Obtained from: https://www.aogc.com/energyefficiency.aspx#aogwp
APSC FILED Time: 4/1/2014 12:29:49 PM: Recvd 4/1/2014 11:59:47 AM: Docket 07-075-tf-Doc. 229

2013 AOG/OG&E Weatherization Program EM&V Report
Executive Summary 1-3
AOG and OG&E monitor program progress and cooperate to make program improvements and maintain customer satisfaction.
Program is evaluated through the use of measurement and verification activities.
1.2 Evaluation Objectives
The evaluation of the 2013 AOG/OG&E Weatherization Program consisted of several
objectives and tasks. These evaluation objectives were related to program savings
verification and tracking of program changes and improvements. Specifically, the
objectives of this evaluation include:
Documentation review of deemed savings calculations. The Evaluators reviewed
all savings calculations for measures included in the Technical Reference
Manual, Versions 3.0, 2.0, and 1.0, (TRM), as applicable, in order to ensure that
measure savings were properly calculated according to TRM protocols.
Tracking database and documentation review. The Evaluators conducted a
tracking database review according to the guidelines defined in Protocol A of the
TRM. Additionally, post-implementation field forms and other program materials
were reviewed for completeness, accuracy, and overall structure.
On-site field verification. The Evaluators scheduled and conducted site visits to
participant homes in order to verify complete and proper measure installation, to
conduct post-implementation measurements, and to follow-up with participants
regarding efficiency improvements that they have done, or would like to do, since
participating in the program.
Program staff interviews. Interviews were conducted with utility staff who are
responsible for designing and managing the program. These interviews primarily
served to assess the status of previous evaluation conclusions and
recommendations, as well as to identify notable changes in program operation,
delivery, and performance.
1.3 Summary of Findings
1.3.1 Onsite Verification Results
The Evaluators conducted onsite verification visits to 58 participant homes,
supplemented by 10 telephone verifications. These site visits were conducted in order
to verify complete and proper measure installation, to conduct post-implementation
measurements, and to follow-up with participants regarding efficiency improvements
that they have done, or would like to do, since participating in the program. The onsite
field verification showed that the weatherization measures had for the most part been
APSC FILED Time: 4/1/2014 12:29:49 PM: Recvd 4/1/2014 11:59:47 AM: Docket 07-075-tf-Doc. 229

2013 AOG/OG&E Weatherization Program EM&V Report
Executive Summary 1-4
installed in the quantities reported within program tracking data. Specific notes
illustrating the accuracy of program tracking data include:
Contact information: All residences were located at the addresses provided
within the tracking data. Additionally, in cases where it was necessary for the
field engineer to call a customer, all telephone numbers were found to be
accurate.
Air infiltration: For homes receiving blower door testing for air infiltration, the
reported leakage value and measured leakage value closely matched in
approximately 80% of cases. There were two instances where measured leakage
was more than 50% greater than reported leakage, and two instances where
reported leakage was more than 50% greater than measured leakage.
Attic insulation: All reported instances of attic insulation were verified. There
were only three instances where the inches of insulation differed slightly from
reported values, and four instances of a discrepancy between reported insulation
square footage and the observed square footage. These differences were very
infrequent and minor.
There were a few instances of missing measures or discrepancies between the tracking
data and field visit data, including:
Out of 58 onsite verification visits, there were three cases where the reported
heating type did not match the actual heating type found in the home.
Approximately ten percent of homes had significantly fewer (i.e. less than half) of
the CFL quantity that was reported in the program tracking data. This was
typically due to customers replacing specific bulbs due to lighting preference,
rather than due to bulb burnout.
There were three instances of missing water heater jackets, and four instances of
missing water heater pipe wrap. All other water heater measures were verified as
being installed correctly.
1.3.2 Gross and Net Savings Results
For equipment and retrofits rebated through the 2013 program, calculation
methodologies were performed as described in TRM V3.0. The following table identifies
the sections in the TRM that were used for verification of measure-level savings under
the AOG/OG&E Weatherization Program:
Table 1-2 TRM Sections by Measure Type
Measure Type TRM
Section(s)
Air Infiltration 2.2.9
Ceiling Insulation 2.2.2
CFLs 2.5.1
APSC FILED Time: 4/1/2014 12:29:49 PM: Recvd 4/1/2014 11:59:47 AM: Docket 07-075-tf-Doc. 229

2013 AOG/OG&E Weatherization Program EM&V Report
Executive Summary 1-5
Refrigerator Replacement 2.4.3
Window AC 2.1.10
Water Heater Measures 2.3.2, 2.3.3
Table 1-3 presents gross savings for AOG and OG&E, including utility-level realization
rates.
Table 1-3 Gross Savings for AOG and OG&E
Utility # of
homes
Peak Demand Savings (Therms)
Annual Savings (Therms)
Lifetime Savings (Therms)
Peak Demand Savings
(kW)
Annual Savings (kWh)
Lifetime Savings (kWh)
Gross Realization
Rate
AOG 1,278 4,274.25 207,661 3,213,126 - - - 99%
OG&E 1,623 - - - 1,031.67 3,618,154 51,535,375 98%
A net-to-gross analysis for the program was performed during the 2012 evaluation year,
resulting in free-ridership and spillover savings estimates. These estimates have been
carried over and applied to the 2013 evaluated gross savings in order to determine
program net kWh and Therms impacts. The 2012 net savings assessment resulted in a
program free-ridership rate of 2.0%. The participant spillover rate for Therms was
calculated as 4.4%, while the participant spillover rate for kWh was calculated as 3.0%
of program gross realized savings. Peak Therms and kW spillover savings were
calculated at 2.8% and 1.4% of program savings, respectively. These values are
reflected in the net savings tables below. Table 1-4 presents the net savings by utility.
Table 1-5 presents the net impact by measure for AOG and OG&E.
Table 1-4 Net Savings for AOG and OG&E
Utility Peak Demand
Savings (Therms)
Annual Savings (Therms)
Lifetime Savings (Therms)
Peak Demand Savings
(kW)
Annual Savings (kWh)
Lifetime Savings (kWh)
AOG 4,248.34 212,663 3,290,526 - - -
OG&E - - - 1,039.84 3,655,091 52,061,484
Table 1-5 Net Savings by Measure Type, AOG and OG&E
Measure
Peak Demand Savings (Therms)
Annual Savings(Ther
ms)
Lifetime Savings (Therms)
Peak Demand Savings
(kW)
Annual Savings (kWh)
Lifetime Savings (kWh)
13-17w CFLs - - - 176.07 1,013,259 6,586,184
26-32w CFLs - - - 0.46 1,158 7,527
Air Infiltration 2,517.30 105,943 1,165,374 138.52 785,073 8,635,800
Ceiling Insulation 1,700.53 105,692 2,113,841 718.63 1,823,929 36,478,572
Refrigerator Replacement
- - - 1.16 8,341 51,522
Window AC - - - 1.05 572 6,009
APSC FILED Time: 4/1/2014 12:29:49 PM: Recvd 4/1/2014 11:59:47 AM: Docket 07-075-tf-Doc. 229

2013 AOG/OG&E Weatherization Program EM&V Report
Executive Summary 1-6
Water Heater Measures
30.52 1,028 11,311 3.94 22,759 295,870
Total 4,248.34 212,663 3,290,526 1,039.84 3,655,091 52,061,484
Ex post savings were based on TRM verification of EnerTrek inputs and savings values.
Thus, the minor instances of discrepancies between ex ante and ex post savings were
due to TRM compliance issues and errors within EnerTrek calculations. The Evaluators
verified measure-level savings according to applicable TRM guidelines and obtained
results that differed from Frontier Associates’ calculations for the following measures:
CFLs
o Originally, TRM V1.0 assumed 2.28 hours of use per day (as shown in
section 2.28). However, this value has since been updated for TRM V1.0
to 2.20 hours of use per day. For the most part, EnerTrek used TRM
V1.0, but used the outdated value of 2.28 hours of use per day in their
calculations of savings for CFLs. The Evaluators used TRM V3.0 to
calculate savings and assumed all retrofits were performed indoors.
Refrigerator Replacement
o In section 2.4.3, TRM V3.0 provides an energy savings algorithm for early
retirement. However, the savings EnerTrek reports differs from the
savings values that result from using this algorithm.
Water Heater measures (water heater jacket and water heater pipe insulation)
o EnerTrek uses TRM V1.0 to estimate savings for the water heater
measures. The Evaluators used TRM V3.0 to estimate savings for the
water heater measures. For water heater jacket, Section 2.3.2 of TRM
V3.0 provides tables with savings values based on jacket thickness, type
of water heating, and tank size. However, the tracking data received by
the Evaluators did not include jacket thickness or tank size. As a result,
the Evaluators made conservative estimates and assumed the minimum
jacket thickness and tank size. For water heater pipe insulation, the
Evaluators assumed a pipe diameter of 1 inch, an R-value of insulation of
3, and a length of 5 feet.
Window AC
o The Evaluators used TRM V3.0 to estimate savings for the window air
conditioner replacement measures. It is unclear what methodology was
employed to estimate ex ante savings.
A detailed description of the savings verification findings can be found in Section 2.6 of
this report.
APSC FILED Time: 4/1/2014 12:29:49 PM: Recvd 4/1/2014 11:59:47 AM: Docket 07-075-tf-Doc. 229

2013 AOG/OG&E Weatherization Program EM&V Report
Executive Summary 1-7
1.3.1 Conclusions and Recommendations
The AOG-OG&E Weatherization Program was evaluated for overall effectiveness,
performance, and design, and the Evaluators developed conclusions with consideration
of the seven comprehensiveness factors developed by the Arkansas Public Service
Commission. The key conclusions from the 2013 evaluation of the AOG/OG&E
Weatherization Program are as follows:
Improved Utility Coordination: AOG and OG&E staff reported that the previous issue
of occasionally miscategorizing participants’ utility providers has for the most part been
resolved. Program staff explained that the process of verifying customer utility providers
has become more efficient and accurate, and that very few 2013 program participants
were mislabeled. Overall, both AOG and OG&E staff members noted that the working
relationship between the two utilities has continued to function effectively, and that at
this point all parties are sufficiently familiar with program procedures.
Program Resources are Sufficient: The AOG/OG&E Weatherization Program
currently has adequate staffing and budget allocations. The utility staff members have
the resources to sufficiently manage and operate the program, and the number of
contractors performing installations is reasonable and appropriate. Program budgets are
sufficient to support the savings goals, and the overall program infrastructure is able to
meet program demands. Current staffing levels will likely support increased demands in
future years if needed.
Effective Measure Installation Procedures: During onsite field verification, the
tracking data were found to be accurate and there were very few observed
discrepancies. Additionally, the Evaluator field engineer reported that the majority of
customers were satisfied with the measures that had been installed, and that there were
very few complaints about the work that was performed by utility contractors. Utility staff
members also reported that very few issues had been brought up by participating
customers during visits or at other points. These findings confirm that the QA/QC
procedures for the AOG/OG&E Weatherization Program have continued to adequately
verify measure installation and to sufficiently monitor the quality of work being
performed within participant residences.
Opportunities for Database Improvement: Although the actual implementation of
measures and the associated data collection required during onsite visits have been
sufficient, there are some persisting issues within the data processing stage. The
EnerTrek database has been improved since prior years, but there are minor errors that
should be addressed in order to ensure accurate data reporting. This includes resolving
the summation issue identified in Section 3.9.3 of this report, and addressing any
savings calculation issues such as those identified in Section 2.6 of this report.
Program is Responsive to TRM Needs: Program staff reported that there have been
no significant changes to the home audit data collection forms or measure verification
forms. Additionally, the updates to the Arkansas TRM (TRM 3.0) have not required a
APSC FILED Time: 4/1/2014 12:29:49 PM: Recvd 4/1/2014 11:59:47 AM: Docket 07-075-tf-Doc. 229

2013 AOG/OG&E Weatherization Program EM&V Report
Executive Summary 1-8
notable increase in data collection requirements for the program measures other than
water heater jackets and pipe wrap. Staff explained that the existing program
contractors will be able to collect additional measure inputs if needed. In terms of any
relevant changes due to TRM 3.0, program staff reported that Frontier is scheduled to
incorporate all updates into the EnerTrek system for the 2014 year.
Program is Meeting Savings, Participation, and Satisfaction Goals: The
AOG/OG&E Weatherization Program has succeeded in reaching its savings and
performance goals for the 2013 program year. Program staff indicate that the program
demand has been consistently increasing, and that there remains a large pool of
potential participants for future program years. Additionally, utility staff noted that there
have been very few issues or negative feedback from customers, and that the quality of
work performed has continued to be high.
The AOG/OG&E Weatherization Program was very successful in 2013. The Evaluators
identified few specific, systematic or persistent issues with program operation and
design. Consideration of the following recommendations may benefit program
performance and efficiency in future years:
Include Itemized Air Infiltration Measures: The initial home audit data collection form
and the post-implementation measure verification form both include fields for detailed
measure information and additional field notes. However, some of this information is not
present in the tracking data exports. For example, the air infiltration section on the
verification form includes fields to record which specific improvements were made (e.g.
window caulking, door sweeps, weather stripping). The actual EnerTrek tracking exports
include blower door readings for air infiltration, but do not itemize the air infiltration
improvements. Maintaining complete electronic records of all collected data, including
any qualitative comments on specific jobs, is beneficial from a program evaluation
standpoint especially when onsite verification is conducted. Additionally, uploading all
relevant data into a single accessible database will ensure that potentially useful
information is not lost or discarded.
Add Cursory Outreach Check to Audit: The data collected onsite at participant
homes during the audit and installation procedures is primarily quantitative in nature.
However, these site visits also provide an opportunity to gain insight into customer
awareness of the AOG/OG&E Weatherization Program (and other programs, if desired)
in order to monitor marketing effects. As a process evaluation with participant surveys
will likely not be required each year, collecting this type of information on the installation
contractor level may be a more consistent method of assessing awareness methods. It
would be beneficial to add one or two short questions to the contractor field forms
asking how the customer learned of the program and/or what program information they
have seen (website, flyers, etc.). During years where a broad participant survey is not
performed, these inquiries may provide useful information for tracking program
marketing and outreach effectiveness.
APSC FILED Time: 4/1/2014 12:29:49 PM: Recvd 4/1/2014 11:59:47 AM: Docket 07-075-tf-Doc. 229

2013 AOG/OG&E Weatherization Program EM&V Report
Executive Summary 1-9
Resolve Database Errors: The Evaluators found that some of the columns within the
tracking exports conflicted with data recorded in other columns. Specifically, the tracking
database included summary columns of savings for each participant. However, for
many participants, the overall savings value found in this column did not match the sum
of the savings from the associated measures performed by the participant. Additionally,
savings calculations for a few measures, itemized in Section 2.6 of this report, did not
match TRM specifications. In the future, the utilities and database provider should
ensure that the summary columns containing savings or other aggregated data match
the sum of the individual fields being referenced, and that the savings calculations
match TRM protocols. This could likely be done with a database query or cursory
manual review of the data prior to database finalization.
Investigate Duct Sealing Procedures: AOG and OG&E did not perform duct sealing
during the 2013 program year, but the cost-effectiveness and need for duct sealing is
typically correlated with the need for air infiltration measures. It should be noted that
duct sealing as a service is not absent from the utilities’ energy efficiency portfolios;
some AOG-OG&E Weatherization Program participants received duct sealing
improvements through a separate OG&E residential tune-up and duct sealing program.
It may be beneficial to implement duct sealing in a larger portion of participating homes
as an included aspect of the weatherization services, but this is not recommended
unless a separate deemed formula can be applied, the utilities are able to coordinate
separate post-installation measurements, or the TRM is updated to allow measurement
of air infiltration and duct sealing at the same pressure.
Take Advantage of Cross-Promotion Opportunities: AOG and OG&E reported that
a substantial number of customers have expressed interest in the program but have not
been eligible to participate due to the age or size of their home. Utility staff members
explained that they have encouraged local contractors to provide weatherization
services within the residential market in order to assist these customers. There is also
an opportunity to refer these customers to other AOG or OG&E energy efficiency
programs, such as the OG&E Custom Energy Report Program or the AOG Water
Heating Equipment Rebate Program. The utilities should take advantage of their cross-
fuel coordination relationship to provide customers with useful information about both
gas and electric incentives programs. This will help to provide energy efficiency options
to customers who are unable to receive services through the AOG-OG&E
Weatherization Program.
Table 1-6 presents the above items, outlining the relevant issue, potential
consequences, and associated recommendations. The following recommendation is
listed as ongoing, as it is in the process of being implemented and will continue to be
relevant until a 2014 tracking database is finalized.
Ensure that Planned Tracking Improvements are Implemented (Ongoing): Utility
staff reported that Frontier is scheduled to incorporate all updates into the EnerTrek
system for the 2014 year. This includes necessary measure inputs such as water heater
APSC FILED Time: 4/1/2014 12:29:49 PM: Recvd 4/1/2014 11:59:47 AM: Docket 07-075-tf-Doc. 229

2013 AOG/OG&E Weatherization Program EM&V Report
Executive Summary 1-10
jacket and pipe wrap length and thickness, and making any other modifications as
needed in order to comply with TRM V3.0. As updating the database can be time
consuming, it is crucial to initiate all changes early in the program year. This is likely to
be an ongoing recommendation, as future TRM updates may include additional data
collection or savings calculation requirements.
APSC FILED Time: 4/1/2014 12:29:49 PM: Recvd 4/1/2014 11:59:47 AM: Docket 07-075-tf-Doc. 229

2013 AOG/OG&E Weatherization Program EM&V Report
Executive Summary 1-11
Table 1-6 Recommendations from 2013 Program Year Evaluation
Issue Consequences Recommendation
Tracking data do not include specific measure details for some items (i.e. whether
door sweeps, window sealing, etc. were installed, whether lighting was installed
indoors or outdoors)
Difficult to completely inspect measure installation
Limits level of detail possible
for measure tracking
Include an itemized list of all air infiltration reduction measures installed in each home.
Limited onsite feedback from participants regarding program awareness and
marketing effectiveness
Possible missed opportunities for collecting useful marketing
and outreach results during years where broad customer surveys are not administered
Add one or two short questions to the contractor field forms asking how the customer learned of the program and/or what program information they have seen (website, flyers, etc.)
For many participants, the overall savings value found in the aggregated savings
column of the tracking data did not match the sum of the savings from the associated
measures performed by the participant. Additionally, some savings calculations did
not match TRM protocols.
May cause discrepancies between expected savings and
verified savings
Ensure that the summary columns containing savings or other aggregated data match the sum of the individual fields being
referenced. Also check to ensure that database calculations match TRM formulas. This could likely be done with a database query or cursory manual review of the data prior to database finalization.
Duct sealing measurement requirements conflict with air infiltration measurement
requirements in the TRM (must be measured at different pressures)
Discourages implementation and claiming savings of duct sealing with air infiltration
Difficult to verify duct sealing savings when combined with
air infiltration
Investigate the feasibility of adding duct sealing to common program measures and whether the TRM can be modified to allow air infiltration and duct sealing to be tested at the same pressure. Avoid implementation of duct sealing with air infiltration measures unless measurement procedures can comply with TRM requirements or TRM is updated to facilitate efficient measurement (i.e. both measures can be tested at the same pressure).
Some customers are interested in participating but are ineligible due to home
age or size
A portion of the customer base may not have access to
alternative energy efficiency options
Actively refer ineligible customers to alternative AOG and OG&E energy efficiency programs.
APSC FILED Time: 4/1/2014 12:29:49 PM: Recvd 4/1/2014 11:59:47 AM: Docket 07-075-tf-Doc. 229

2013 AOG/OG&E Weatherization Program EM&V Report
Executive Summary 1-12
1.4 Report Organization
The report is organized as follows:
Chapter 2 presents the impact findings and discusses the methods used for, and
the results obtained from, estimating gross and net savings for the program;
Chapter 3 presents the results of the process evaluation tasks and additional
program findings;
Chapter 4 presents key conclusions and recommendations from the evaluation of
the program;
Appendix A presents sample marketing materials used by AOG and OG&E in
promotion of their energy efficiency programs; and
Appendix B provides reference tables from AOG and OG&E 2012 annual reports,
summarizing annual program budgets and goals.
APSC FILED Time: 4/1/2014 12:29:49 PM: Recvd 4/1/2014 11:59:47 AM: Docket 07-075-tf-Doc. 229

Impact Findings 2-1
2. Impact Findings
This section presents the results of the gross savings verification and savings
calculation review for the AOG/OG&E Weatherization Program in the 2013 program
year.
2.1 Glossary of Terms
As a first step to detailing the evaluation methodologies, the Evaluators provide a
glossary of terms to follow:
Ex Ante – A program parameter or value used by implementers/sponsoring
utilities in estimating savings before implementation
Ex Post – A program parameter or value as verified by the Evaluators following
completion of the evaluation effort
Deemed Savings – A savings estimate for homogenous measures, in which an
assumed average savings across a large number of rebated units is applied
Gross Savings – Energy savings as determined through engineering analysis,
statistical analysis, and/or onsite verification
Gross Realization Rate – Ratio of Ex Post Savings / Ex Ante Savings
Free-Ridership – Percentage of participants who would have implemented the
same energy efficiency measures in a similar timeframe absent the program
Spillover – Savings generated by a program that are not incentivized. Examples
of this include a customer that is introduced to energy efficiency through one
rebated project and due to this undertakes other projects for which they do not
apply for a program incentive.
Net Savings – Gross savings factoring off free-ridership and adding in spillover
Net-to-Gross-Ratio (NTGR) = (1 – Free-Ridership % + Spillover %), also defined
as Net Savings / Gross Savings
Ex Ante Net Savings = Ex Ante Gross Savings x Ex Ante Free-Ridership Rate
Ex Post Net Savings = Ex Post Gross Savings x Ex Post Free-Ridership Rate
Net Realization Rate = Ex Post Net Savings / Ex Ante Net Savings
2.2 Summary of Ex Ante Savings
The AOG/OG&E Weatherization Program generated savings through the
implementation of several energy efficient measure types, such as ceiling insulation,
CFLs, air infiltration reduction, and water heater insulation. Table 2-1 and Table 2-2
present the overall ex ante, or expected, savings for AOG and OG&E by measure,
APSC FILED Time: 4/1/2014 12:29:49 PM: Recvd 4/1/2014 11:59:47 AM: Docket 07-075-tf-Doc. 229

2013 AOG/OG&E Weatherization Program EM&V Report
Impact Findings 2-2
respectively. These values were obtained from the program tracking database exports
that were provided to the Evaluators.
Table 2-1 Ex Ante Savings by Measure Type – AOG
Measure
Peak Demand Savings (Therms)
Annual Savings (Therms)
13-17w CFLs - -
26-32w CFLs - -
Air Infiltration 2,532.65 103,453
Ceiling Insulation 1,711.03 103,210
Refrigerator Replacement
- -
Window AC - -
Water Heater Measures 3.25 3,381
Total 4,246.92 210,044
Table 2-2 Ex Ante Savings by Measure Type – OG&E
Measure
Peak Demand Savings
(kW)
Annual Savings (kWh)
13-17w CFLs 120.12 1,090,828
26-32w CFLs 0.50 4,636
Air Infiltration 137.38 776,127
Ceiling Insulation 712.99 1,805,517
Refrigerator Replacement
0.56 4,137
Window AC 1.62 2,784
Water Heater Measures 5.52 26,508
Total 978.69 3,710,537
The following table presents the ex ante gas and electric savings that were not
associated with either AOG or OG&E as utility providers. These ex ante savings are
attributable to municipal utilities, co-op utilities, or other investor owned utilities which
are not sponsors of this program.
Table 2-3 Ex Ante Savings by Measure Type – Non-Program
Measure
Peak Demand Savings (Therms)
Annual Savings (Therms)
Peak Demand Savings
(kW)
Annual Savings (kWh)
13-17w CFLs - - 3.78 34,151
26-32w CFLs - - - -
Air Infiltration 264.69 10,886 24.12 62,622
Ceiling Insulation 202.98 12,307 99.07 173,830
APSC FILED Time: 4/1/2014 12:29:49 PM: Recvd 4/1/2014 11:59:47 AM: Docket 07-075-tf-Doc. 229

2013 AOG/OG&E Weatherization Program EM&V Report
Impact Findings 2-3
Measure
Peak Demand Savings (Therms)
Annual Savings (Therms)
Peak Demand Savings
(kW)
Annual Savings (kWh)
Refrigerator Replacement
- - - -
Window AC - - - -
Water Heater Measures
0.22 233 0.24 1,000
Total 467.90 23,426 127.21 271,604
2.3 Gross Savings Calculation Methodology
For equipment and retrofits rebated through the 2013 program, calculation
methodologies were performed as described in the TRM V3.0. Table 2-4 identifies the
sections in the TRM that were used for verification of measure-level savings under the
AOG/OG&E Weatherization Program.
Table 2-4 TRM Sections by Measure Type
Measure Type TRM
Section(s)
Air Infiltration 2.2.9
Ceiling Insulation 2.2.2
CFLs 2.5.1
Refrigerator Replacement 2.4.3
Window AC 2.1.10
Water Heater Measures 2.3.2, 2.3.3
Three measures were responsible for nearly all of the gross savings for the AOG/OG&E
Weatherization Program: air infiltration reduction, ceiling insulation, and the replacement
of incandescent lamps with compact fluorescent lamps (CFLs). The calculation
methodologies for these measures are detailed in the following sections. In these
examples, energy units are expressed in kWh.
2.3.1 Air Infiltration Reduction Savings Calculations
The deemed savings values for air infiltration reduction were developed through
EnergyGauge, a simulation software program. Multiple equipment configurations were
simulated in each of the four Arkansas weather zones in developing savings values
denominated in deemed savings per CFM50 of air leakage rate reduction. The
following table summarizes the deemed savings values for Weather Zone 7 (from TRM
V3.0).
Table 2-5 Deemed Savings Values for Air Infiltration Reduction, Zone 7
Equipment Type kWh Savings /
CFM50 kW Savings /
CFM50 Therm Savings /
CFM50 Peak Therms /
CFM50
Electric AC with Gas Heat
0.2387 0.0002171 0.0790 0.001853
APSC FILED Time: 4/1/2014 12:29:49 PM: Recvd 4/1/2014 11:59:47 AM: Docket 07-075-tf-Doc. 229

2013 AOG/OG&E Weatherization Program EM&V Report
Impact Findings 2-4
Equipment Type kWh Savings /
CFM50 kW Savings /
CFM50 Therm Savings /
CFM50 Peak Therms /
CFM50
Gas Heat Only (no AC)
0.0565 n/a 0.0790 0.001853
Elec. AC with Resistance heat
1.7891 0.0001584 n/a n/a
Heat Pump 1.1295 0.0001584 n/a n/a
The following example considers a residence in Weather Zone 7 with electric AC and
gas heat. If the residence had a leakage rate of 16,100 CFM50 before air infiltration
reduction and a leakage rate of 7,220 CFM50 after, then the residence would have an
annual gross savings of 2,120 kWh.
( )
2.3.2 Ceiling Insulation Savings Calculations
The deemed savings values for ceiling insulation were developed through
EnergyGauge, a simulation software program. Multiple equipment configurations were
simulated in each of the four Arkansas weather zones in developing savings values
denominated in deemed savings per square footage of ceiling area. Table 2-6
summarizes the deemed savings values for Weather Zone 8 (from TRM V3.0).
Table 2-6 Deemed Savings Values for Ceiling Insulation, Zone 8
Ceiling Insulation Base
R- Value
AC/Gas Heat
kWh/sq ft
Gas Heat (no AC)
Therms/sq ft
AC/Electrical Resistance kWh/sq ft
Heat Pump
kWh/sq ft
AC Peak Savings kW/ sq ft
Peak Gas Savings
Therms/sq ft
0 to 4 1.53 0.145 4.8 2.83 0.00115 0.00244
5 to 8 0.756 0.0841 2.65 1.53 0.00038 0.00140
9 to 14 0.451 0.0547 1.68 0.969 0.00029 0.00090
15 to 22 0.28 0.0359 1.1 0.629 0.00013 0.00059
The following example considers a residence in Weather Zone 8 with a heat pump, and
a pre-retrofit R-value of ceiling insulation in the range of 9 to 14. If the residence has a
ceiling area of 1,200 sq. ft., then the residence would have an annual gross savings of
1,163 kWh.
( )
APSC FILED Time: 4/1/2014 12:29:49 PM: Recvd 4/1/2014 11:59:47 AM: Docket 07-075-tf-Doc. 229

2013 AOG/OG&E Weatherization Program EM&V Report
Impact Findings 2-5
2.3.3 Compact Fluorescent Lamps (CFLs) Savings Calculations
The deemed savings for compact fluorescent lamps can be calculated by using the
following equation.
(( ) )
The inputs, which assume the following prerequisite knowledge, can be found in Section
2.5.1 of TRM V3.0:
The quantity and wattages of both pre and post fixtures;
Whether or not the retrofits were indoor or outdoor;
Whether or not the retrofits were time of sale or direct install; and
The heating type of the residence.
For example, if in March 2013 (5) 23W CFLs were directly installed to replace (5) 75W
incandescent lamps in a residence with gas heating, the residence would have an
annual gross savings of 231.0kWh.
(( )
2.4 On-site Verification Procedure
In addition to TRM verification, the Evaluators conducted on-site field verification of a
sample of participant homes. This process involved reviewing tracking information and
inspecting the completeness and accuracy of the implemented measures. Collected
field data were incorporated into the gross savings analysis where appropriate. The
methodologies for sampling and conducting field visits during the 2013 program
evaluation year are identical to those employed for the 2012 evaluation. A summary
review of these methods is provided below.
2.4.1 Verification Sampling Methodology
The Evaluators conducted a simple random sample of participants for the ex-post
verification process. The sample size for verification surveys is calculated to meet 90%
confidence and 10% precision (90/10). The sample size to meet 90/10 requirements is
calculated based on the coefficient of variation of savings for program participants.
Coefficient of Variation (CV) is defined as:
( ) ( )
( )
Where x is the average Therms or kWh savings per participant. Without data to use as
a basis for a higher value, it is typical to apply a CV of .5 in residential program
evaluations. The resulting sample size is estimated at:
APSC FILED Time: 4/1/2014 12:29:49 PM: Recvd 4/1/2014 11:59:47 AM: Docket 07-075-tf-Doc. 229

2013 AOG/OG&E Weatherization Program EM&V Report
Impact Findings 2-6
(
)
Where,
1.645 = Z Score for 90% confidence interval in a normal distribution
CV = Coefficient of Variation
RP = Required Precision, 10% in this evaluation
With 10% required precision (RP), this calls for a sample of 68 for programs with a
sufficiently large population. In total, the Evaluators scheduled appointments with 70
participants. Due to cancellations and customer absences, Evaluator field staff
members were able to conduct on-site visits for 58 program participants. This was
supplemented by telephone verification with an additional 10 participants in order to
reach the 68 participant target.
2.4.2 Verification Procedure
The primary goal of field verification was to ensure that the reported measures were
installed and operating correctly in participant homes. Participants were given VISA gift
cards for their time; these were in the amount of $20. During the on-site visits, the
Evaluators’ field technicians accomplished the following:
Verified the implementation status of the measures; verified that the measures
were indeed installed, that they were installed correctly, and were functioning
properly. Photographs were taken of most of the installed measures.
Data collected at each site focused on obtaining more specific information
regarding the characteristics of the home where the measures were
implemented.
Interviewed customers to obtain additional information on any additional
customer energy efficiency improvements that the customer had implemented or
planned to implement in the future.
A field visit form was completed for each visited site in order to document measure
quantities, home characteristics, and any needed additional commentary regarding the
visit. Specifically, the field form included the following fields:
Home Characteristics: The field engineer documented the type of home (i.e.
single story vs. multi-story), number of bedrooms, number of bathrooms, total
conditioned area, and heating type.
Measure Quantity Verification: The engineer documented reported vs. actual
quantities of each measure type (i.e. 13w-17w CFLs, 26w -32w CFLs, water
APSC FILED Time: 4/1/2014 12:29:49 PM: Recvd 4/1/2014 11:59:47 AM: Docket 07-075-tf-Doc. 229

2013 AOG/OG&E Weatherization Program EM&V Report
Impact Findings 2-7
heater measures) and any applicable notes regarding burnt out bulbs or non-
operational equipment.
Insulation Assessment: The field form asks for insulation square footage, the R-
value or inches of insulation, and the type of insulation (i.e. blown cell).
Infiltration Assessment: For homes receiving air infiltration measures, the field
engineer conducted a blower door test and recorded ex-post leakage for
comparison with reported leakage values.
Supplemental Implementation Inquiry: This included questions regarding whether
the customer had implemented any major improvements to their home (i.e.
appliance replacements, structural renovations, major repairs) since the
weatherization work was completed, as well as whether there are additional
improvements that they would like to implement in the future.
For the most part, field staff found the reported tracking information to be accurate, and
confirmed that nearly all reported measures had been installed completely and
correctly. There were few discrepancies between the reported data and actual verified
sites. Further information detailing the overall results of the field verification visits can be
found in Chapter 3.
2.5 2013 Net Savings Approach
This section provides methodologies and results of the net savings analysis for the
AOG/OG&E Weatherization Program. For this program, net savings incorporated
participant free-ridership as well as participant spillover savings.
For the 2013 program year evaluation, net savings are calculated by applying the free-
ridership and spillover findings from the previous year (program year 2012). As there
have been no major modifications to program structure or delivery, a separate net
savings analysis was not necessary for the current year. For reference purposes, this
section provides a brief review of the 2012 net savings analysis results. Further
information, including a detailed outline of the free-ridership and spillover savings
methodologies, can be found in the 2012 AOG/OG&E Weatherization Program
Evaluation Report.
2.5.1 Overall 2012 Net-to-Gross Results
A net-to-gross analysis for the program was performed during the 2012 evaluation year,
resulting in free-ridership and spillover savings estimates. As described above, these
estimates have been carried over and applied to the 2013 evaluated gross savings in
order to determine program net kWh and Therms impacts.
The 2012 net savings assessment resulted in a program free-ridership rate of 2.0%.
The participant spillover rate for Therms was calculated as 4.4%, while the participant
APSC FILED Time: 4/1/2014 12:29:49 PM: Recvd 4/1/2014 11:59:47 AM: Docket 07-075-tf-Doc. 229

2013 AOG/OG&E Weatherization Program EM&V Report
Impact Findings 2-8
spillover rate for kWh was calculated as 3.0% of program gross realized savings. Peak
Therms and kW spillover savings were calculated at 2.8% and 1.4% of program
savings, respectively.
2.5.2 Participant Free-ridership
Several criteria were used for determining what portion of a customer’s savings for a
particular project should be attributed to free ridership. The first criterion was based on
the response to the question: “Would you have been financially able to have an audit
performed and install these energy efficient measures without the Weatherization
Program provided by AOG and OG&E?” If a customer answered “No” to this question,
a free ridership score of 0% was assigned to the project. That is, if a customer required
financial assistance from the AOG/OG&E Weatherization Program to undertake the
project, then that customer was not deemed a free rider.
For decision makers that indicated that they were able to undertake the energy
efficiency project without financial assistance from the program, three factors were
analyzed to determine what percentage of savings may be attributed to free ridership.
The three factors were:
Plans and intentions of respondent to have an audit conducted or install similar
measures without support from the program;
The respondent’s previous knowledge of energy efficiency options and benefits;
and
The respondent’s previous experience with energy efficiency improvements in
their home.
For each of these factors, rules were applied to develop binary variables indicating
whether or not a participant’s behavior showed free ridership. These rules were used to
construct four different indicator variables that address free ridership behavior. For each
customer, a free ridership value of either 0 or 1 was assigned based on the combination
of variables. Quantifiable program spillover was added to the program net savings after
free-ridership was calculated.
Table 2-7 displays each combination of indicator variables, along with the percentage of
responding participants falling into each category. After applying the financial ability
variable to these groups, the calculated free-ridership level of the AOG/OG&E
Weatherization Program in 2012 was 2%.
Table 2-7 Distribution of Respondents across Indicator Variable Combinations
Indicator Variable
Combination
Associated Free-ridership Score (as
binary variable)
Percentage of Respondents in Category
YYYY 1 1%
APSC FILED Time: 4/1/2014 12:29:49 PM: Recvd 4/1/2014 11:59:47 AM: Docket 07-075-tf-Doc. 229

2013 AOG/OG&E Weatherization Program EM&V Report
Impact Findings 2-9
NNNY 0 42%
YYNN 1 0%
NYYN 0 1%
YYNY 1 0%
YYYN 1 0%
NNNN 0 13%
NNYN 0 12%
NYNN 0 0%
NNYY 0 26%
NYNY 1 4%
NYYY 0 1%
Total Free-ridership rate 2%
2.5.3 Participant Spillover
The 2012 participant survey and on-site verification visits addressed participant
spillover. This was done through a battery of questions designed to:
1) Assess the behaviors taken by customers after their program participation where
they installed energy efficient equipment; and
2) Obtain the respondent’s self-reported value for how important they felt
information from AOG and/or OG&E was in inducing this non-incentivized
behavior.
In total, 339 unique participants responded to the spillover instrument in 2012. Of these
respondents, 45 indicated that they had purchased and installed one or more measures
for which they did not receive an incentive. These respondents were then asked to rate
on a scale of 1-10 how important the information from AOG or OG&E was in influencing
their decision to purchase this equipment. If the respondent rated information from the
utilities at 6 or higher, the savings associated with their installation were attributed to the
program. In total, 51 additional measures were reported to have been influenced by the
AOG/OG&E program in 2012.
Savings estimates were calculated by determining average likely spillover savings per
customer in the sample of 339 unique respondents. In cases where some details were
not collected, available inputs from survey data and conservative inputs for values were
applied (such as assuming that all high efficiency central air conditioners were in the
14.00 – 14.99 SEER range) and applying TRM V2.0 savings calculations. For cited
measures that are included in program offerings, the average savings for a participant
receiving this measure were applied.
The resulting spillover values represented 3% of gross realized kWh savings, and 4.4%
of gross realized Therms savings for the 2012 program. Peak Therms and kW spillover
savings were calculated at 2.8% and 1.4% of program savings, respectively.
APSC FILED Time: 4/1/2014 12:29:49 PM: Recvd 4/1/2014 11:59:47 AM: Docket 07-075-tf-Doc. 229

2013 AOG/OG&E Weatherization Program EM&V Report
Impact Findings 2-10
2.5.1 Future Net Savings Approach
As the free-ridership and spillover rates nearly offset one another, it may not be
necessary to continue applying a net-to-gross ratio to program savings in the future.
Based on the program’s structure and responses to the field visit survey, spillover
savings and free-ridership are likely to be minimal unless substantial changes are made
to program eligibility requirements. If the program structure and delivery remains fairly
constant in future years, it would be reasonable to assume a net-to-gross ratio of 1 for
the program.
2.6 Verified Savings by Measure
After reviewing the tracking data and inputs for savings calculations, the Evaluators
provided verified gross savings according to protocols from the TRM. Savings from the
following measures were verified and matched the calculations provided by Frontier
Associates through the EnerTrek software tool:
Air Infiltration
o Accounts for 13.3% of claimed kWh savings, and 49.3% of claimed
Therms savings.
Ceiling Insulation
o Accounts for 69.1% of claimed kWh savings and 49.1% of claimed
Therms savings.
The savings calculated in this evaluation differed from Frontier Associates’ calculations
for several items. The Evaluators verified measure-level savings according to applicable
TRM guidelines and obtained results that differed from Frontier Associates’ calculations
for the following measures:
CFLs
o Originally, TRM V1.0 assumed 2.28 hours of use per day (as shown in
section 2.28). However, this value has since been updated for TRM 1 to
2.20 hours of use per day. For the most part, EnerTrek used TRM V1.0,
but used the outdated value of 2.28 hours of use per day in their
calculations of savings for CFLs. The Evaluators used TRM V3.0 to
calculate savings and assumed all retrofits were performed indoors.
Refrigerator Replacement
o In section 2.4.3, TRM V3.0 provides an energy savings algorithm for early
retirement. However, the savings EnerTrek reports differs from the
savings values that result from using this algorithm.
Water Heater measures (water heater jacket and water heater pipe insulation)
APSC FILED Time: 4/1/2014 12:29:49 PM: Recvd 4/1/2014 11:59:47 AM: Docket 07-075-tf-Doc. 229

2013 AOG/OG&E Weatherization Program EM&V Report
Impact Findings 2-11
o EnerTrek uses TRM V1.0 to estimate savings for the water heater
measures. The Evaluators used TRM V3.0 to estimate savings for the
water heater measures. For water heater jacket, Section 2.3.2 of TRM
V3.0 provides tables with savings values based on jacket thickness, type
of water heating, and tank size. However, the tracking data received by
the Evaluators did not include jacket thickness or tank size. As a result,
the Evaluators made conservative estimates and assumed the minimum
jacket thickness and tank size. For water heater pipe insulation, the
Evaluators assumed a pipe diameter of 1 inch, an R-value of insulation of
3, and a length of 5 feet.
Window AC
o The Evaluators used TRM V3.0 to estimate savings for the window air
conditioner replacement measures. It is unclear what methodology was
employed to estimate ex ante savings.
The following table presents the savings results of the evaluation of the 2013
AOG/OG&E Weatherization Program, by measure type. Table 2-8 includes gross
realized savings by measure for AOG and OG&E. Table 2-9 including any savings that
are not attributable to either AOG or OG&E but that were reported in the tracking
database. Net savings are presented by utility in the following section.
Table 2-8 Verified Gross Savings by Measure Type, AOG and OG&E
Measure Peak Demand
Savings (Therms)
Annual Savings (Therms)
Lifetime Savings (Therms)
Realization Rate
Peak Demand Savings
(kW)
Annual Savings (kWh)
Lifetime Savings (kWh)
Realization Rate
13-17w CFLs - - - - 174.69 1,003,020 6,519,627 92%
26-32w CFLs - - - - 0.46 1,146 7,451 25%
Air Infiltration 2,532.65 103,451 1,137,962 100% 137.43 777,139 8,548,530 100%
Ceiling Insulation
1,710.90 103,206 2,064,119 100% 712.99 1,805,497 36,109,936 100%
Refrigerator Replacement
- - - - 1.15 8,257 51,001 200%
Window AC - - - - 1.04 566 5,948 20%
Water Heater Measures
30.70 1,004 11,045 30% 3.91 22,529 292,880 85%
Total 4,274.25 207,661 3,213,126 99% 1,031.67 3,618,154 51,535,375 98%
Table 2-9 Verified Gross Savings by Measure Type, Non-Program
Measure Peak Demand
Savings (Therms)
Annual Savings (Therms)
Lifetime Savings (Therms)
Realization Rate
Peak Demand Savings
(kW)
Annual Savings (kWh)
Lifetime Savings (kWh)
Realization Rate
13-17w CFLs - - - - 5.55 36,261 235,699 106%
26-32w CFLs - - - - - - - -
Air Infiltration 264.69 10,884 119,727 100% 24.16 62,725 689,978 100%
APSC FILED Time: 4/1/2014 12:29:49 PM: Recvd 4/1/2014 11:59:47 AM: Docket 07-075-tf-Doc. 229

2013 AOG/OG&E Weatherization Program EM&V Report
Impact Findings 2-12
Ceiling Insulation
202.79 12,303 246,067 100% 99.01 173,848 3,476,964 100%
Refrigerator Replacement
- - - - - - - -
Window AC - - - - - - - -
Water Heater Measures
0.51 72 787 31% 0.16 790 10,272 79%
Total 467.99 23,259 366,581 99% 128.88 273,625 4,412,913 101%
2.7 Verified Savings by Utility
In the AOG/OG&E Weatherization Program, the participating utilities are AOG and
OG&E. Savings not attributable to either of these utilities are listed as “Non-Program”.
These savings are attributable to municipal utilities, co-op utilities, or other investor
owned utilities which are not sponsors of this program. Table 2-10 presents the
AOG/OG&E Weatherization Program net savings results for each utility, and Table 2-11
through Table 2-12 summarize the gross savings by measure for each utility.
Table 2-10 Verified Net Savings for AOG and OG&E
Utility Peak Demand
Savings (Therms)
Annual Savings (Therms)
Lifetime Savings (Therms)
Peak Demand Savings
(kW)
Annual Savings (kWh)
Lifetime Savings (kWh)
AOG 4,248.34 212,663 3,290,526 - - -
OG&E - - - 1,039.84 3,655,091 52,061,484
Table 2-11 Verified Net Savings for AOG by Measure
Measure
Peak Demand Savings (Therms)
Annual Savings (Therms)
Lifetime Savings (Therms)
13-17w CFLs - - -
26-32w CFLs - - -
Air Infiltration 2,517.30 105,943 1,165,374
Ceiling Insulation
1,700.53 105,692 2,113,841
Refrigerator Replacement
- - -
Window AC - - -
Water Heater Measures
30.52 1,028 11,311
Total 4,248.34 212,663 3,290,526
APSC FILED Time: 4/1/2014 12:29:49 PM: Recvd 4/1/2014 11:59:47 AM: Docket 07-075-tf-Doc. 229

2013 AOG/OG&E Weatherization Program EM&V Report
Impact Findings 2-13
Table 2-12 Verified Net Savings for OG&E by Measure
Measure
Peak Demand Savings
(kW)
Annual Savings (kWh)
Lifetime Savings (kWh)
13-17w CFLs 176.07 1,013,259 6,586,184
26-32w CFLs 0.46 1,158 7,527
Air Infiltration 138.52 785,073 8,635,800
Ceiling Insulation
718.63 1,823,929 36,478,572
Refrigerator Replacement
1.16 8,341 51,522
Window AC 1.05 572 6,009
Water Heater Measures
3.94 22,759 295,870
Total 1,039.84 3,655,091 52,061,484
Table 2-13 presents the gas and electric savings that were not associated with either
AOG or OG&E. These savings were generated when a project was performed at a
home that was serviced by both a program sponsoring utility and a non-program utility
(such as AOG as a gas provider and a municipal utility as an electric provider).
Table 2-13 Net Savings by Measure Type – Non-Program
Measure
Peak Demand Savings (Therms)
Annual Savings (Therms)
Lifetime Savings (Therms)
Peak Demand Savings (kW)
Annual Savings (kWh)
Lifetime Savings (kWh)
13-17w CFLs - - - 5.55 36,261 235,699
26-32w CFLs - - - - - -
Air Infiltration 264.69 10,884 119,727 24.16 62,725 689,978
Ceiling Insulation 202.79 12,303 246,067 99.01 173,848 3,476,964
Refrigerator Replacement
- - - - - -
Window AC - - - - - -
Water Heater Measures
0.51 72 787 0.16 790 10,272
Total 467.99 23,259 366,581 128.88 273,625 4,412,913
APSC FILED Time: 4/1/2014 12:29:49 PM: Recvd 4/1/2014 11:59:47 AM: Docket 07-075-tf-Doc. 229

Process Findings and Program Updates 3-1
3. Process Findings and Program Updates
This chapter presents the key findings from the limited process evaluation that the
Evaluators conducted in 2013, including tracking recommendations from prior program
evaluations and summarizing updates to program operation and delivery. Additionally,
the chapter presents findings from in-depth interviews with program staff and addresses
the checklist factors for portfolio comprehensiveness.
3.1 Process Evaluation Considerations
The Evaluators conducted a formal process evaluation of the AOG/OG&E
Weatherization Program in 2012 and determined that the program was operating
effectively and had been successful in meeting its goals. TRM V3.0 Protocol C
addresses the criteria used to determine the timing and conditions needed for a process
evaluation, and the following tables summarize the program in the context of these
requirements.
Table 3-1 Determining Process Evaluation Timing
Component Determination
New and Innovative Components
No. The program design has not been modified in the past year.
No Previous Process Evaluation
No. A formal process evaluation was conducted in 2012.
New Vendor or Contractor No. The program continues to use three installation contractors and is otherwise operated by AOG and OG&E jointly.
Table 3-2 Determining Process Evaluation Conditions
Component Determination
Are program impacts lower or slower than expected?
No. The program met its goals in 2012 and 2013.
Are the educational or informational goals not meeting program goals?
No. Program awareness within the customer market has increased, and educational efforts have been successful.
Are the participation rates lower or slower than expected?
No. The program has met its participation goals in 2012 and 2013.
Are the program’s operational or management structure slow to get up and running or not meeting program administrative needs?
No. The prior process evaluation found these structures to be operating efficiently with adequate resources.
Is the program’s cost-effectiveness less than expected?
No. The program’s cost-effectiveness has been maintained at expected levels.
Do participants report problems with the programs or low rates of satisfaction?
No. Participants in 2012 reported very high levels of satisfaction and quality of work performed.
Is the program producing the intended market effects?
Yes. Non-program contractors are being informed of opportunities within the non-participant market.
APSC FILED Time: 4/1/2014 12:29:49 PM: Recvd 4/1/2014 11:59:47 AM: Docket 07-075-tf-Doc. 229

2013 AOG/OG&E Weatherization Program EM&V Report
Process Findings and Program Updates 3-2
Based on these findings, the Evaluators determined that the 2013 evaluation of the
AOG/OG&E Weatherization Program calls for a limited process evaluation. This
consists of the following research tasks:
Tracking database and documentation review;
On-site field verification with supplemental questionnaires; and
Program staff interviews.
Table 3-3 below summarizes the survey and interview data collection for the 2013
program evaluation, including data collection type, number of respondents, and
additional details.
Table 3-3 Interview and Survey Data Collection Summary
Target Component Activity N Details
Program Staff
AOG Program Staff
Interview 2 The program manager and operational staff are responsible for coordinating program data, managing program resources, directing installation contractors,
and communicating with AOG or OG&E staff as needed during the program process.
OG&E Program Staff
Interview 2
Program Participants
Onsite Supplemental Questionnaire
Survey 68
This constituted a participant questionnaire administered to customers whose homes were visited by evaluator field staff for measure verification purposes.
3.2 Response to Program Recommendations
Table 3-4 summarizes the status of issues and recommendations identified in the 2012
process evaluation and impact evaluation of the AOG/OG&E Weatherization Program.
Overall, AOG and OG&E have been very responsive to previous findings and
recommendations, and in particular have actively made improvements to program data
collection and reporting procedures.
APSC FILED Time: 4/1/2014 12:29:49 PM: Recvd 4/1/2014 11:59:47 AM: Docket 07-075-tf-Doc. 229

2013 AOG/OG&E Weatherization Program EM&V Report
Process Findings and Program Updates 3-3
Table 3-4 Status of 2012 Evaluation Recommendations
Issue Consequences Recommendation AOG/OG&E Response Status of Issue
Tracking data missing some measure inputs required by TRM
Program cannot comply with current TRM calculation requirements May negatively affect the accuracy of ex ante calculations
Add inputs to tracking system in accordance with the most up-to-date TRM (TRM 2.0 at the time of recommendation)
The utilities have worked with Frontier to add necessary inputs into the EnerTrek software, which is scheduled to be compliant with TRM 3.0 in the 2014 program year.
Reviewed & adopted
Tracking data lacks contractor comments regarding unique premise characteristics (e.g. whether fireplace flue was open or closed at time of infiltration test)
During onsite evaluation, it is difficult to recreate blower door conditions.
Include all relevant field notes in tracking database, such as unique premise characteristics and additional comments
The utilities are exploring the possibility of adding field notes and other collected qualitative data to the tracking system.
Reviewed & under consideration
Risk of eligibility requirements becoming outdated (e.q. age of home)
Exclusion of potential suitable program participants Decreased participation potential over time
Monitor program participation levels and participation potential; only expand program requirements such as the age of participant homes if needed.
The utilities have been considering this change across program years, and thus far have determined that eligibility expansion is not yet needed.
Reviewed & under consideration
Some errors exist within tracking data calculations for CFL hours of use, refrigerator replacement
Creates difficulties in M&V, specifically savings verification May negatively affect the accuracy of ex ante calculations
Review all calculation assumptions and remove/replace any erroneous values within the tracking database
The utilities and Frontier have corrected these issues, no erroneous assumptions present in 2013 data.
Reviewed & adopted
APSC FILED Time: 4/1/2014 12:29:49 PM: Recvd 4/1/2014 11:59:47 AM: Docket 07-075-tf-Doc. 229

2013 AOG/OG&E Weatherization Program EM&V Report
Process Findings and Program Updates 3-0
3.3 Program Structure Overview
The overall structure and delivery of the AOG/OG&E Weatherization Program has
remained fairly constant throughout 2011-2013. This section provides a summary of
current program design features and procedures, noting any differences between 2013
and prior years.
As with prior years, the 2013 AOG/OG&E Weatherization Program provided residential
energy audits and energy efficiency installations to customers within the service territory
of Arkansas Oklahoma Gas Corporation (AOG) and Oklahoma Gas and Electric
(OG&E). Participating homes were evaluated in order to determine cost-effective energy
efficiency measures that would improve overall building efficiency and reduce
residential energy usage. The program provided funds for the installation of various
measures, including insulation, lighting, air infiltration, and refrigerator replacement.
The AOG/OG&E Weatherization Program is designed to provide utility funds to
customers in order to fully offset the costs of energy efficiency audits and resulting
energy efficiency measures and installations. Eligible customers receive funds from
both AOG and OG&E in this co-funded program. As with prior years, the utilities jointly
cover up to $3,000 of services in participant homes. Payment is designated based on
the specific utility provider for each participant, such that weatherization services in
homes that are customers of both AOG and OG&E are paid for by both utilities.
The eligibility requirements for the 2013 program year have remained unchanged.
Eligible OG&E customers include homeowners or leaseholders of a single family home,
duplex condos, townhouses or mobile home constructed prior to 1997. Participants
must meet three of the following eligibility criteria3:
Attic insulation less than or equal to R-22;
Wall insulation equal to or less than R-4;
Floor insulation equal to R-0;
Single pane windows with no storm windows attached;
Heating system less than or equal to 78% AFUE;
Cooling system with SEER of 10 or less; and
Air infiltration problems identified through either a pre-blower door test or visual
inspection procedures.
3 Eligibility requirements are taken from AOG informational materials. Obtained from: https://www.aogc.com/energyefficiency.aspx#aogwp
APSC FILED Time: 4/1/2014 12:29:49 PM: Recvd 4/1/2014 11:59:47 AM: Docket 07-075-tf-Doc. 229

2013 AOG/OG&E Weatherization Program EM&V Report
Process Findings and Program Updates 3-1
These criteria are designed to target severely energy inefficient residences; this helps to
ensure that each participating home has the potential to generate a substantial amount
of energy savings through the program.
Customers who are interested in participating in the program contact program staff
members to sign up for the in-home audit. Additionally, prospective participants may
learn about the program and apply for enrollment through a local community
clearinghouse. This clearinghouse informs customers of eligibility requirements,
provides informational marketing materials such as flyers, and assists customers with
the program enrollment process.
As with the 2012 year, the program currently uses three installation contractors who
perform the weatherization and measure implementation services.
One of the three program contractors contact customers within 48 hours of receiving
customer information, and the audit is scheduled. During the in-home audit, contractors
determine customer eligibility and identify potential energy efficiency measures for the
residence. After the measures are installed, utility staff members perform post-
inspections in order to verify that all measures have been properly implemented. In
2013, staff members performed these quality control procedures with 10% of
participating homes.
3.4 Program Logic Model
Figure 3-1 presents a logic model for the AOG/OG&E Weatherization Program, divided
into stages to represent the phases involved in administering and operating the
program. The overall structure of the program has remained constant through the 2013
program year, although the 2013 logic model includes an additional component,
outlined with a dashed border, within the Program Participation phase. This component
was added in order to reflect the recent efforts that utility staff has made to inform non-
program contractors of the weatherization opportunities that exist within the broad
customer market.4
4 These efforts are intended to ensure that program-ineligible customers are able to find contractors who can provide weatherization services, minimizing dissatisfaction for customers who cannot participate in the AOG/OG&E Weatherization Program.
APSC FILED Time: 4/1/2014 12:29:49 PM: Recvd 4/1/2014 11:59:47 AM: Docket 07-075-tf-Doc. 229

2013 AOG/OG&E Weatherization Program EM&V Report
Process Findings and Program Updates 3-2
Utility discussion
of program
objectives
Program Design
Planning
Program Training and
Promotion
Data Processing and
Monitoring
Program
Participation
Work within
regulatory
environment to
collaboratively
develop changes
Customer
application
process
Contractors and program operations staff
attend program information sessions and
meetings
Contractors
promote program
on site at
residences
Eligible customers receive in-
home audits
Contractor installs measures
during implementation visit
Measures and
associated savings
are sent to Frontier
Associates for
processing
Program is
evaluated through
EM&V process
Utilities monitor
performance,
make
improvements as
needed
Some utility
marketing (website,
initial mailers)
Contractor auditor conducts ex
post data collection
Utility staff members conduct
post-implementation verification
Ineligible customers
disqualified based on
participation criteria
Ineligible customers
pay full cost for
services from market
contractors
Figure 3-1 AOG/OG&E Weatherization Program Logic Model
APSC FILED Time: 4/1/2014 12:29:49 PM: Recvd 4/1/2014 11:59:47 AM: Docket 07-075-tf-Doc. 229

2013 AOG/OG&E Weatherization Program EM&V Report
Process Findings and Program Updates 3-3
3.5 AOG/OG&E Weatherization Program 2013 Participation
In 2013, the AOG/OG&E Weatherization Program serviced a total of 1,845 homes. This
is a slight increase in participation over the 2012 year and a substantial increase over
the 2011 year, which had 1,786 and 731 participant homes, respectively. Participants
received in-home energy audits and one or more of the following measure types:
13-17 Watt CFLs;
26-32 Watt CFLs;
Ceiling/attic insulation;
Window air conditioner;
Water heater pipe wrap;
Water heater jacket;
Air infiltration reduction improvements; and
Refrigerator replacement.
The audits and measure installation in each home were performed by one of three
program contractors. These contractors also conducted post-implementation visits to
homes, and utility staff performed quality assurance visits on a sample of residences.
The AOG/OG&E Weatherization Program is offered in the service territories of both
utilities, which are estimated to have an overlap of approximately 30,000 customers.
Depending on the location of customers and the fuel sources used in their homes,
services for each customer are funded by AOG, OG&E, or both AOG and OG&E. Table
3-5 cross-tabulates the number of participating homes by utility. As participants were
only required to be customers of one of the two participating utilities, some residences
in the program were serviced by utilities other than AOG and OG&E. These utilities
included municipal utilities, Co-Ops, or non-participating investor owned utilities.
Table 3-5 Participation by Associated Utility
Electric Utility
Gas Utility
AOG Other/None
OG&E 1,056 567
Other/None 222 -
OG&E Total AOG Total
Total Homes
1,623 1,278 1,845
Figure 3-1 displays the month of weatherization for homes serviced during the 2013
program year, based on the weatherization date listed in program tracking data.
January was the most active month, followed by March. Overall, participation was fairly
APSC FILED Time: 4/1/2014 12:29:49 PM: Recvd 4/1/2014 11:59:47 AM: Docket 07-075-tf-Doc. 229

2013 AOG/OG&E Weatherization Program EM&V Report
Process Findings and Program Updates 3-4
active throughout the program year, although the first six months of the year had about
50% more activity than the second six months.
Figure 3-2 Homes Serviced by Month, 2013
Table 3-6 displays the number of 2013 measure installations by measure type for each utility, arranged by the most commonly installed measures.5 Air infiltration was the most common measure type, followed by ceiling insulation and CFLs.
Table 3-6 Total Implementations by Measure
Measure Type
Number of attributable installations
AOG OG&E
Air Infiltration 1,225 1,561
Ceiling Insulation 1,091 1,400
13-17w CFL - 1,632
26-32w CFL - 11
Water Heater Jacket/Pipe 895 1,200
Refrigerator - 19
Window AC - 18
Total 3,099 4,874
5 For the purposes of this table, the values represent the number of homes receiving the measure, rather than the total number of measures installed at all homes. Thus, the values for CFLs do not present the total number of bulbs installed, but the total number of participants receiving at least one of that CFL type.
230
164
194 181
191
161 164 142
153
178
86
0 0
50
100
150
200
250
Nu
mb
er
of
Ho
me
s Se
rvic
ed
(N = 1,844)
APSC FILED Time: 4/1/2014 12:29:49 PM: Recvd 4/1/2014 11:59:47 AM: Docket 07-075-tf-Doc. 229

2013 AOG/OG&E Weatherization Program EM&V Report
Process Findings and Program Updates 3-5
The distribution of measures is fairly consistent with the 2012 program year. The
notable differences between 2013 and 2012 measure counts include:
There was a substantial increase in the number of water heater pipe wrap
measures installed in OG&E serviced homes.
A small number of 26-32 Watt CFLs were installed, when previously the program
had exclusively installed 13-17 Watt CFLs.
A small number of window air conditioners were installed. Utility staff reported
that this was not a likely measure for most participants, but that there had been a
few opportunities during 2013 to install the air conditioners in multifamily
residences.
Refrigerator installations decreased substantially. This is due to the fact that
OG&E determined that refrigerator replacement did not meet the designated
savings to investment ratio (SIR) target of 1, and thus this measure was only
installed during the first few months of the program year.
Overall, the number of measure installations attributable to AOG increased from 3,099
in 2012 to 3,211 in 2013. The number of measure installations attributable to OG&E
increased from 4,874 in 2012 to 5,841 in 2013.
3.6 Utility Staff Member Interviews
As part of the 2013 program evaluation, interviews were conducted with utility staff
members responsible for managing and designing the AOG/OG&E Weatherization
Program. These interviews primarily served to assess the status of previous evaluation
conclusions and recommendations, as well as to identify notable changes in program
operation, delivery, and performance.
As the evaluation of the 2011 and 2012 program years provided details regarding
program operation and design, the 2013 evaluation interviews are intended to explore
any changes in the program and any new developments over the past year. The 2013
evaluation seeks to follow-up on key issues and draw comparisons between program
years where appropriate.
These findings are based on utility staff in-depth interviews, as well as program
documentation and periodic communications with program and regulatory staff.
3.6.1 Data Collection and Reporting
Utility Coordination: AOG and OG&E staff reported that the previous issue of
occasionally miscategorizing participants’ utility providers has for the most part been
resolved. Previously, some participants were incorrectly identified as being AOG
customers when they were in fact OG&E all-electric customers, or were identified as
OG&E customers when they were actually serviced by AOG and a municipal electric
APSC FILED Time: 4/1/2014 12:29:49 PM: Recvd 4/1/2014 11:59:47 AM: Docket 07-075-tf-Doc. 229

2013 AOG/OG&E Weatherization Program EM&V Report
Process Findings and Program Updates 3-6
utility. Although the participants were correctly relabeled prior to savings finalization, this
had created initial issues in determining payment responsibilities and savings
attribution. Program staff explained that the process of verifying customer utility
providers has become more efficient and accurate, and that very few 2013 program
participants were mislabeled. Overall, both AOG and OG&E staff members noted that
the working relationship between the two utilities has continued to function effectively,
and that at this point all parties are sufficiently familiar with program procedures.
Data Entry Revisions: OG&E staff noted that there had been some manual data entry
errors during the 2013 program year that delayed the finalization of program tracking
data. Specifically, there was a discrepancy between the billed jobs and tracking data of
approximately 300 homes. This caused some initial delays, but did not result in any
substantial issues in savings calculations or job reimbursement. Utility staff noted that
there is now a weekly consistency check which verifies that all reported jobs are
correctly recorded in the tracking database.
Data Collection Requirements: Program staff reported that there have been no
significant changes to the home audit data collection forms or measure verification
forms. Additionally, the updates to the Arkansas TRM (TRM 3.0) have not required a
notable increase in data collection requirements for the program measures. Staff
explained that the existing program contractors would be able to collect additional
measure inputs if needed, but that the savings calculation procedures for the program’s
currently implemented measures have remained largely unchanged. In terms of any
relevant changes due to TRM 3.0, program staff reported that Frontier is scheduled to
incorporate all updates into the database system for the 2014 year.
3.6.1 Program Implementation
Installation Contractors: Program staff reported that there have been no changes to
the existing group of contractors who implement measures under the AOG/OG&E
Weatherization Program. Additionally, interviewed staff stated that the existing three
contractor organizations have had sufficient resources to meet program demands, and
that there are no current plans to add or remove contractors from the program.
Implemented Measures: Although no new measures were implemented through the
program during 2013, OG&E decided to cease the purchase and installation of energy
efficient refrigerators. Program staff explained that the savings-to-investment ratio was
typically too low for the measure to be considered cost effective, and that program
resources would be better spent on the remaining set of measures (lighting, insulation,
air infiltration improvements, etc.). This decision was put into effect early in the program
year, and only a few refrigerators were installed during 2013. Other than this, there were
no changes to the set of measures provided, and there are no immediate plans to
further modify the measure list.
APSC FILED Time: 4/1/2014 12:29:49 PM: Recvd 4/1/2014 11:59:47 AM: Docket 07-075-tf-Doc. 229

2013 AOG/OG&E Weatherization Program EM&V Report
Process Findings and Program Updates 3-7
3.6.1 Program Marketing
Outreach Consistency: AOG and OG&E staff confirmed that the marketing structure
has continued to focus primarily on word-of-mouth messaging and indirect marketing
through logos on contractor shirts and vehicles. There have been a few modifications to
program branding, such that most program materials have been changed to show the
names of both AOG and OG&E rather than solely OG&E.
Additional Outreach: The utilities have also spoken with community organizations
about conducting public presentations in order to increase program awareness and
educate customers about weatherization benefits. Additionally, program staff noted that
some customers subscribe to a monthly newsletter that contains information about the
available measures and programs, and that a local community clearinghouse has
continued to provide eligibility information, marketing flyers, and enrollment assistance
to prospective participants. Overall, staff stated that program awareness is continually
increasing, and that there has not yet been a need to explore substantial marketing
modifications such as mainstream media messaging. Appendix A presents examples of
marketing materials that are currently used by AOG and OG&E to promote energy
efficiency opportunities including the weatherization program.
3.6.1 Program Performance and Market Effects
Savings and Participation Goals: The AOG/OG&E Weatherization Program has
succeeded in reaching its savings and performance goals for the 2013 program year.
Program staff indicate that the program demand has been consistently increasing, and
that there remains a large pool of potential participants for future program years.
Additionally, utility staff noted that there have been very few issues or negative
feedback from customers, and that the quality of work performed has continued to be
high.
Eligibility Considerations: Utility staff is still considering expanding program eligibility
requirements such as the criteria for age of residence, but reported that there had not
yet been a need to do so. However, the 2013 year saw an increase in the number of
ineligible customers who expressed interest in the program.
Market Engagement: Utility staff reported that with the growing level of program
awareness, some customers who have expressed interest in the program have been
ineligible due to the size or age of their home. In order to manage this, utility staff has
started to speak with various contractors in the service territory and inform them of the
available weatherization opportunities within the customer population. Although the
utilities cannot refer a customer to a specific non-program contractor or provide services
to ineligible customers, encouraging contractors to promote weatherization services
may help to service the non-participant market. This does not provide a direct savings
APSC FILED Time: 4/1/2014 12:29:49 PM: Recvd 4/1/2014 11:59:47 AM: Docket 07-075-tf-Doc. 229
2013 AOG/OG&E Weatherization Program EM&V Report
Process Findings and Program Updates 3-8
or financial benefit to the utilities, but may improve non-participant satisfaction and
encourage energy usage reduction in the broader customer pool.
3.7 Onsite Verification Results
As described in Section 2.4 of this report, the Evaluators conducted onsite verification
visits to 58 participant homes, supplemented by 10 telephone verifications. These site
visits were conducted in order to verify complete and proper measure installation, to
conduct post-implementation measurements, and to follow-up with participants
regarding efficiency improvements that they have done, or would like to do, since
participating in the program.
This section summarizes the key findings from these field visits, highlighting results from
the measure verification tasks and supplemental questionnaire.
3.7.1 Measure Verification Findings
The onsite field verification showed that the weatherization measures had for the most
part been installed in the quantities reported within program tracking data. Specific
notes illustrating the accuracy of program tracking data include:
Contact information: All residences were located at the addresses provided
within the tracking data. Additionally, in cases where it was necessary for the
field engineer to call a customer, all telephone numbers were found to be
accurate.
Air infiltration: For homes receiving blower door testing for air infiltration, the
reported leakage value and measured leakage value closely matched in
approximately 80% of cases. Due to differences in equipment type, weather
changes, and situational residence characteristics (e.g. whether a fireplace flue is
open or closed), it is difficult to reproduce blower door test leakage values on
separate occasions. Thus, the field visit focused on identifying any cases where
measured leakage varied greatly from reported values. There were two instances
where measured leakage was more than 50% greater than reported leakage,
and two instances where reported leakage was more than 50% greater than
measured leakage.
Attic insulation: All reported instances of attic insulation were verified. There
were only three instances where the inches of insulation differed slightly from
reported values, and four instances of a discrepancy between reported insulation
square footage and the observed square footage. These differences were very
infrequent and minor.
There were a few instances of missing measures or discrepancies between the tracking
data and field visit data, including:
APSC FILED Time: 4/1/2014 12:29:49 PM: Recvd 4/1/2014 11:59:47 AM: Docket 07-075-tf-Doc. 229

2013 AOG/OG&E Weatherization Program EM&V Report
Process Findings and Program Updates 3-9
Out of 58 onsite verification visits, there were three cases where the reported
heating type did not match the actual heating type found in the home.
Approximately ten percent of homes had significantly fewer (i.e. less than half) of
the CFL quantity that was reported in the program tracking data. This was
typically due to customers replacing specific bulbs due to lighting preference,
rather than due to bulb burnout.
There were three instances of missing water heater jackets, and four instances of
missing water heater pipe wrap. All other water heater measures were verified as
being installed correctly.
3.7.2 Supplemental Questionnaire
In order to supplement the information gained during the field visit, and to provide
insight into customer behavior since the implementations were performed, the field
engineer administered a short questionnaire to visited customers. These questions
asked whether the customer had implemented any improvements or repairs to their
homes since the work was performed, as well as whether they desired or planned to
implement any such improvements in the future.
Findings from prior evaluation years indicate that program participants are unlikely to
spend their own funds on energy efficiency improvements or major repairs. This is
consistent with the current findings. As only three respondents reported that they had
implemented any major improvements since the weatherization work was performed.
One of these customers reported that they had built an addition to their home consisting
of a bedroom, bathroom, and laundry room. Another customer stated that they had
installed new windows, while the third explained that they had made several
improvements such as replacing tile, doors, sinks, and faucets.
When asked whether they would like to make further improvements to their homes, 10
of the respondents described the projects that they would like to implement. The most
commonly mentioned measure was new windows, followed by floor replacement,
kitchen remodeling, and additional leakage repairs. The desire for additional leakage
repairs was due to persisting holes in customers’ floors, ceilings, and walls. Out of all of
the improvements mentioned by customers, repairing these holes would likely result in
the greatest energy savings and would also substantially improve the quality of living in
the home. Window replacement would also result in energy savings, but is typically a
low priority for weatherization programs due to the low savings-to-investment ratio.
The results of the field visit questionnaire suggest that participants have many additional
improvements in mind, but that they are unlikely to implement these without additional
assistance. Most of these improvements, including major structural repairs, are outside
the scope of the AOG/OG&E Weatherization Program. However, if program contractors
notice opportunities for structural improvements that may be covered by community
programs or possibly the statewide Weatherization Assistance Program, it may be
APSC FILED Time: 4/1/2014 12:29:49 PM: Recvd 4/1/2014 11:59:47 AM: Docket 07-075-tf-Doc. 229

2013 AOG/OG&E Weatherization Program EM&V Report
Process Findings and Program Updates 3-10
appropriate to inform participants of how they may be able to receive additional
assistance.
3.7.1 Field Visit Summary
Overall, the tracking data were found to be accurate and there were very few observed
discrepancies. It is also likely that some of the discrepancies were due to customer
actions after the contractors had implemented the measures. For measures such as
CFLs, this is accounted for in the TRM calculations via an in-service factor, and some
removal of measures is anticipated. Additionally, the field engineer reported that the
majority of customers were satisfied with the measures that had been installed, and that
there were very few complaints about the work that was performed by utility contractors.
These results suggest that the implementation work is being conducted adequately, and
that contractors are accurately documenting the work that is performed.
3.8 Post-Implementation Verification Review
As per the February 8, 2012 Supplemental Guidance Regarding Evaluation Strategies
memorandum, programs are evaluated for their internal quality assurance and quality
control procedures. The goals of this QA/QC assessment include:
Identifying the goals for the inspection and verification of the AOG/OG&E
Weatherization Program;
Determining the specific parameters used in the verification process and whether
these parameters are appropriate for the program;
Identifying the target and actual confidence and precision levels for the
inspection and verification activities;
Reviewing the internal M&V participant selection process and the sampling
techniques employed by program implementation staff;
Reviewing site inspection documents and findings, and evaluating any savings
adjustments that were made; and
Providing recommendations for the design and operation of future verification
activities.
During the 2012 evaluation the Evaluators assessed the program’s quality assurance
and quality control procedures in order to document the QA/QC structure and to identify
any opportunities for improvement. Overall, the existing verification methods were found
to be sufficient. For the 2013 evaluation, the Evaluators revisited these verification
procedures during interviews with utility staff members in order to identify any
modifications or updates. For the most part, there have been no changes to quality
assurance and control since the 2012 program year. The QA/QC process for the
program continues to involve the following components:
APSC FILED Time: 4/1/2014 12:29:49 PM: Recvd 4/1/2014 11:59:47 AM: Docket 07-075-tf-Doc. 229

2013 AOG/OG&E Weatherization Program EM&V Report
Process Findings and Program Updates 3-11
Sites are randomly selected weekly from the population of participants who have
recently received program services. Interviewed program staff reported that this
sample typically represents approximately 10% of all homes serviced under the
program.
The utility staff members perform a visual inspection of each measure that has
been recorded in the contractor installation form. Throughout the visit, the
inspector completes the Weatherization Quality Control Form detailing the
inspection findings.
In cases where a measure is not functioning properly, such as damaged or loose
air infiltration work, the contractor would be scheduled to return to the home in
order to repair the measure.
The Evaluators previously conducted a document review of the field form used during
the utility inspection procedures. This form was found to be sufficiently detailed and
well-suited to the program’s QA/QC needs. Specifically, the field form included the
following categories of fields:
Measure verification checks;
Premise characteristics;
Health and safety checks; and
Additional notes.
During staff interviews for the current program year, utility program managers reported
that no changes had been made to the inspection form, although some minor changes
may be needed depending on the data requirements of future TRM updates.
3.8.1 Overall QA/QC Status
Utility staff confirmed that no new significant issues were found during verification visits
in 2013. The program contractors are now very familiar with program requirements and
with the consistent set of implemented measures. Staff members also reported that very
few issues had been brought up by participating customers during visits or at other
points during their participation. These findings confirm that the QA/QC procedures for
the AOG/OG&E Weatherization Program have continued to adequately verify measure
installation and to sufficiently monitor the quality of work being performed.
3.9 Tracking Database Review
Frontier Associates develops and maintains a participant tracking database that
includes a full list of all participants, the measures that were installed in their homes,
and the kWh and Therms savings associated with each measure. The Evaluators
received periodic tracking data updates as well as final tracking exports. These tracking
files were evaluated for overall organization and content.
According per protocol A of the TRM V3.0, tracking data should be checked for:
APSC FILED Time: 4/1/2014 12:29:49 PM: Recvd 4/1/2014 11:59:47 AM: Docket 07-075-tf-Doc. 229

2013 AOG/OG&E Weatherization Program EM&V Report
Process Findings and Program Updates 3-12
Participating Customer Information;
Measure Specific Information;
Vendor Specific Information;
Program Tracking Information;
Program Costs;
Marketing & Outreach Activities; and
Premise Characteristics;
Table 3-7 below summarizes the goals and activities of the Database Review of the
AOG/OG&E Weatherization Program.
Table 3-7 Database Review Goals & Activities
Category Activity
Participating Customer Information
The dataset should contain unique customer identifiers and full customer contact information.
Measure Specific Information
The tracking data should identify all measures that were installed in each participant home, with associated energy savings.
Vendor Specific Information
The dataset should include the name of the installation contractor associated with each participant.
Program Tracking Information
If possible, the dataset needs to include the dates in which the installations, as well as the initial residential energy audit, were performed.
Program Costs
Not applicable. Cost summaries are recorded and separately reviewed by the utilities.
Marketing & Outreach Activities
In addition to information gathered during the tracking data review and program staff interviews, the Evaluators previously conducted participant surveys to gather information related to participant interaction with program marketing and outreach.
Premise Characteristics
The dataset should include all measure inputs needed for savings verification, including relevant square footage measurements.
APSC FILED Time: 4/1/2014 12:29:49 PM: Recvd 4/1/2014 11:59:47 AM: Docket 07-075-tf-Doc. 229

2013 AOG/OG&E Weatherization Program EM&V Report
Process Findings and Program Updates 3-13
3.9.1 Customer, Premise, and Vendor Information
Each of these factors was assessed individually based on the guidelines stated in the
TRM V3.0. Overall, the Evaluators conclude the following regarding tracking data
completeness:
Participating customer information was complete for all participants. This
included Job IDs, telephone numbers, addresses, full names, and utility account
numbers for AOG and OG&E. This is an improvement over the 2012 data, where
a small percentage of participants (less than 10%) were missing one or more of
these fields.
Ninety-eight percent of participant records included the name of the installation
contractor who performed the implementation as well as the invoice date. All but
one participant record contained the home’s weatherization date.
As with the 2012 program year, premise characteristics such as home heating
type, cooling type, and attic square footage were present for all participants
where appropriate and needed.
Section 2.6 includes specific findings related to measure-level tracking data.
3.9.2 Measure Specific Information
The content of tracking data was found to include sufficient information for the majority
of the measures. However, the tracking data did not include sufficient information for the
following measure:
Water Heater Measures (Water Heater Jacket & Water Heater Pipe Insulation)
For water heater jacket, TRM V3.0 presents savings values as a function
of jacket thickness, type of water heating, and tank size. The tracking
data did not present jacket thickness or tank size.
For water heater pipe insulation, TRM V3.0 presents savings values as a
function of length of pipe, diameter of pipe, and r-value of insulation. The
tracking data did not present these values.
It should be noted that these measures only accounted for 0.38% of the total claimed
kWh savings and 1.6% of the total gross Therms savings, and that all measures
associated with a high level of energy savings included sufficient tracking information.
The tracking database included summary columns of savings for each participant.
However, for many participants, the overall savings value found in this column did not
match the sum of the savings from the associated measures performed by the
participant.
APSC FILED Time: 4/1/2014 12:29:49 PM: Recvd 4/1/2014 11:59:47 AM: Docket 07-075-tf-Doc. 229

2013 AOG/OG&E Weatherization Program EM&V Report
Process Findings and Program Updates 3-14
The tracking database was for the most part well-organized. The recommended
changes to the tracking data include providing a complete set of calculation inputs and
being consistent when reporting claimed savings for each participant.
3.9.3 Tracking Data Recommendations
Overall, the tracking data were found to be highly detailed and complete. The following
recommendations should be considered for future program years:
Additional field notes may be useful for the measure verification process, such as
including details regarding any unique home characteristics that may change
over time and influence energy usage. This may include the presence of window
air conditioner units, in-progress construction work, or whether the home
configuration required any atypical methods to be performed during the
contractor blower door test.
The field forms used by program contractors, and the measure verification form
used by the utilities, both contain fields for recording which specific air infiltration
improvements (e.g. door sweeps, window sealing) were made. These data do
not appear in the tracking exports, but would likely be useful for evaluator
verification purposes and detailed measure tracking.
The tracking data focuses on quantitative inputs such as savings and measure
details. If the installation contractors collect any information related to program
marketing and customer awareness during their home visits, including these
inputs in the tracking database would help to track program effects in years when
a broad participant survey effort is not conducted.
The EnerTrek software should be updated to include the inputs noted above in
Section 3.9.2 in order to comply with TRM 3.0 calculation requirements.
Ensure that the summary columns containing savings or other aggregated data
match the sum of the individual fields being referenced. This could likely be done
with a database query or cursory manual review of the data prior to database
finalization.
3.10 Potential TRM Issues for Duct Sealing with Air Infiltration
Upon review of the current program offerings, TRM requirements, and measurement
and verification procedures, the Evaluators found that there may be issues if AOG and
OG&E implement duct sealing in combination with air infiltration measures during future
years. The current measurement requirements for air infiltration and duct sealing testing
create savings verification difficulties if both measure types are implemented in the
same home. This section provides an overview of the issue for consideration.
APSC FILED Time: 4/1/2014 12:29:49 PM: Recvd 4/1/2014 11:59:47 AM: Docket 07-075-tf-Doc. 229

2013 AOG/OG&E Weatherization Program EM&V Report
Process Findings and Program Updates 3-15
According to TRM 3.0, the air infiltration measure must be tested via pre- and post-
installation leakage measurements at a pressure of 50 pascals.6 This requires the
installer to make an initial infiltration reading and then a second reading after the air
infiltration measures are installed. In contrast, the TRM states that the duct sealing
measure must also receive pre- and post-installation leakage measurements, but at a
pressure of 25 pascals.7 The pre- measurements for these measures are feasible, but if
both air infiltration and duct sealing are performed on a single home, it becomes very
difficult to isolate the savings for each measure or to combine the savings achieved.
In order to isolate the savings, post-installation leakage measurements would have to
be performed twice, once after the duct sealing is performed and then again after the air
infiltration items are installed (or vice versa). However, as these two tests would be
performed at different pressures, it would not be reasonable to assume that the
difference in leakage during the second post-installation test is exclusively attributable
to the second measure type. If both measures were individually tested at the same
pressure, it would be possible to record the leakage reduction of the first and then
subtract that reduction from the second in order to isolate the two measures.
Additionally, if both measure types could be tested at the same pressure level it may be
reasonable to perform only one post-installation leakage test and estimate a combined
savings total for the two measures in cooperation.
AOG and OG&E did not perform duct sealing during the 2013 program year, but the
cost-effectiveness and need for duct sealing is typically correlated with the need for air
infiltration measures. It should be noted that duct sealing as a service is not absent from
the utilities’ energy efficiency portfolios; some AOG-OG&E Weatherization Program
participants received duct sealing improvements through a separate OG&E residential
tune-up and duct sealing program. It may be beneficial to implement duct sealing in a
larger portion of participating homes as an included aspect of the weatherization
services, , but this is not recommended unless the utilities are able to coordinate
separate post-installation measurements or the TRM is updated to allow measurement
of air infiltration and duct sealing at the same pressure.
Alternatively, OG&E has developed a deemed savings formula for duct sealing that has
been applied to its other programs. If duct sealing services are added to the
AOG/OG&E Weatherization Program, and the measurement issues associated with
cross-implementing air infiltration and duct sealing improvements persist, it may be
appropriate to assess the reasonableness of these deemed results and potentially use
them to determine duct sealing savings rather than conducting separate pre- and post-
measurements.
6 From Section 2.2.9 of the Arkansas Technical Reference Manual Version 3.0, Volume 2
7 From Section 2.1.11 of the Arkansas Technical Reference Manual 3.0, Volume 2
APSC FILED Time: 4/1/2014 12:29:49 PM: Recvd 4/1/2014 11:59:47 AM: Docket 07-075-tf-Doc. 229

2013 AOG/OG&E Weatherization Program EM&V Report
Process Findings and Program Updates 3-16
3.11 Comprehensiveness Factors
The Arkansas Public Service Commission has in place a set of criteria in order to
determine whether a DSM portfolio qualifies as “Comprehensive”. These criteria are:
Factor 1: Whether the programs and/or portfolio provide, either directly or
through identification and coordination, the education, training, marketing, or
outreach needed to address market barriers to the adoption of cost-effective
energy efficiency measures;
Factor 2: Whether the programs and/or portfolio, have adequate budgetary,
management, and program delivery resources to plan, design, implement,
oversee and evaluate energy efficiency programs;
Factor 3: Whether the programs and/or portfolio, reasonably address all major
end-uses of electricity or natural gas, or electricity and natural gas, as
appropriate;
Factor 4: Whether the programs and/or portfolio, to the maximum extent
reasonable, comprehensively address the needs of customers at one time, in
order to avoid cream-skimming and lost opportunities
Factor 5: Whether such programs take advantage of opportunities to address
the comprehensive needs of targeted customer sectors (for example, schools,
large retail stores, agricultural users, or restaurants) or to leverage non-utility
program resources (for example, state or federal tax incentive, rebate, or lending
programs)
Factor 6: Whether the programs and/or portfolio enables the delivery of all
achievable, cost-effective energy efficiency within a reasonable period of time
and maximizes net benefits to customers and to the utility system;
Factor 7: Whether the programs and/or portfolio, have evaluation, measurement,
and verification "EM&V") procedures adequate to support program management
and improvement, calculation of energy, demand and revenue impacts, and
resource planning decisions.
This section reviews the AOG/OG&E Weatherization Program in relation to each factor,
but does not provide a portfolio-wide perspective. As these criteria are intended to
evaluate a portfolio of programs as a whole, assessment of the comprehensiveness
factors is best suited to portfolio-level evaluations and reports. As such, a review of how
the AOG/OG&E Weatherization Program fits into the overall utility profile can be found
in the Evaluation of 2013 DSM Portfolio Report for AOG. The portfolio report includes
the AOG/OG&E Weatherization Program in its tests for portfolio comprehensiveness,
assessing the comprehensiveness factors in a cross-program context.
Factor 1: Education, Training, Marketing, and Outreach
o Assessment of Education
APSC FILED Time: 4/1/2014 12:29:49 PM: Recvd 4/1/2014 11:59:47 AM: Docket 07-075-tf-Doc. 229

2013 AOG/OG&E Weatherization Program EM&V Report
Process Findings and Program Updates 3-17
The AOG/OG&E Weatherization Program sufficiently implements
educational efforts towards its prospective participants and other
customers. Appendix A provides examples of educational messages and
materials used. This includes:
Providing educational materials (flyers, brochures)
Providing outreach through multiple channels (in-person, utility
websites, direct mail)
Providing education targeted to specific market barriers (focusing
on connection between comfort and energy efficiency,
demonstrating potential savings from program measures)
Providing coordinated education from multiple entities (staff
members from both utilities and each of the three program
contractors)
o Assessment of Training
As mentioned in utility staff interviews and the utilities’ annual energy
efficiency reports, the program has continued to provide updated and
relevant training to its contractors and has reached out to non-program
contractors in order to inform them of existing opportunities within
weatherization services to residences.
o Marketing and Outreach
Program marketing has proven to be conservative in cost and scope but
sufficient to recruit a high level of participation. The marketing methods of
the program meet the following criteria:8
Address specific barriers (informing customers that the program is
available at no additional cost, demonstrating potential savings and
increase in comfort level)
Promoted by trade allies (program and non-program contractors
inform prospective participants of program services and
opportunities)
Performed through several channels (in-person, websites, direct
mail, word-of-mouth)
Factor 2: Budgetary, Management, and Program Delivery Resources
The AOG/OG&E Weatherization Program currently has adequate staffing and
budget allocations. According to utility program management staff members, the
utilities have the resources to sufficiently manage and operate the program, and
8 Appendix A contains specific examples of AOG and OG&E marketing and outreach materials.
APSC FILED Time: 4/1/2014 12:29:49 PM: Recvd 4/1/2014 11:59:47 AM: Docket 07-075-tf-Doc. 229

2013 AOG/OG&E Weatherization Program EM&V Report
Process Findings and Program Updates 3-18
the number of contractors performing installations is reasonable and appropriate.
As can be seen within the utilities’ annual reports, program budgets are sufficient
to support the savings goals, and the overall program infrastructure is able to
meet program demands.9 According to interviews with utility staff during the
current year, and interviews with installation contractors during the prior program
year, current staffing levels will likely support increased demands in future years
if needed.
Factor 3: Addressing Major End-Uses
The AOG/OG&E Weatherization Program offers a wide range of measures,
which are chosen based on cost-effectiveness testing. The large list of eligible
program measures covers all major end-uses for targeted customer homes,
including:
o HVAC systems;
o Hot water measures;
o Appliances (refrigerators);
o Lighting; and
o Building envelope measures.10
Program staff monitors costs and customer needs and continually considers
modifications to program measure offerings and services in order to fully address
the scope of available end-uses.
Factor 4: Comprehensively Addressing Customer Needs
The program comprehensively addresses the major needs of its targeted
customer market by providing several benefits to participants. The program
provides services to customers who likely would not otherwise make major
efficiency improvements to their homes, and may not have the opportunity to
participate in other utility-sponsored energy efficiency programs. Specifically, the
program provides the following benefits:
o Technical assistance through in-home audits;
o Energy and monthly bill savings through measure installation; and
o Increased comfort and/or safety for participants.
Factor 5: Targeting Market Sectors & Leveraging Opportunities
9 Appendix B provides reference tables from AOG and OG&E 2012 annual reports, summarizing annual program budgets and goals.
10 A complete list of eligible measures for the AOG-OG&E Weatherization Program can be found in utility documentation such as filing documents and annual reports (for example: http://www.apscservices.info/pdf/07/07-075-tf_75_1.pdf)
APSC FILED Time: 4/1/2014 12:29:49 PM: Recvd 4/1/2014 11:59:47 AM: Docket 07-075-tf-Doc. 229

2013 AOG/OG&E Weatherization Program EM&V Report
Process Findings and Program Updates 3-19
The AOG/OG&E Weatherization Program focuses on a specific market of utility
residential customers whose homes are sufficiently energy inefficient. This is an
important program in the residential sector of portfolio offerings. The AOG/OG&E
Weatherization Program is also an example of utility leveraging of available
partnerships: AOG and OG&E have successfully engaged in cross-fuel
coordination in order to provide combined benefits to customers of one or both
utilities.
Factor 6: Cost-Effectiveness of Energy Efficiency
The program is designed to cost-effectively generate net savings and meet the
stated annual program goals. It has been successful in these efforts thus far,
meeting specific criteria such as:
o Meeting net savings goals (overall program net-to-gross ratio is 101%,
program has met goals through 2013);
o Meeting industry norms for net-to-gross (expected net-to-gross of
approximately 100%); and
o Meeting cost-effectiveness goals (the program is designed to meet cost-
effectiveness on the measure level and as a whole, and has been
successful in doing so).11
Factor 7: Adequacy of EM&V Procedures
The AOG/OG&E Weatherization Program was reviewed for EM&V procedures in
the following areas:
o QA/QC and EM&V procedures conducted by utility staff;
o QA/QC and EM&V procedures conducted by installation contractor staff;
and
o QA/QC and EM&V procedures conducted by the Evaluators
The quality assurance and verification procedures currently conducted by utility
staff and installation contractors continue to be sufficient for monitoring
implementation quality and ensuring the accuracy of ex ante installation records.
The Evaluators’ field data was fairly consistent with reported tracking data
values, indicating that overall measure implementation is recorded accurately
and consistently.12
Several improvements have been made to the tracking database since the 2011
and 2012 program years, leading to greater clarity within program data and more
11
Further information regarding program cost-effectiveness can be found in utility-specific cost-benefit spreadsheets on the Arkansas Public Service Commission (APSC) website: http://www.apscservices.info/eeAnnualReports.aspx
12 See Section 3.7 of this report for detailed information regarding program implementation verification.
APSC FILED Time: 4/1/2014 12:29:49 PM: Recvd 4/1/2014 11:59:47 AM: Docket 07-075-tf-Doc. 229

2013 AOG/OG&E Weatherization Program EM&V Report
Process Findings and Program Updates 3-20
accurate initial savings estimates. There are a few improvements that may
further increase the reliability of program data, but these are fairly minor in
nature.13 Overall, the AOG/OG&E Weatherization Program has continued to
accurately and efficiently collect, analyze, and report the information required for
program evaluation.
These results indicate that the AOG/OG&E Weatherization Program is sufficiently
contributing to portfolio comprehensiveness as a residential services offering. As
mentioned above, a full review of the utilities’ portfolio comprehensiveness factors can
be found in the utilities’ portfolio-wide evaluation reports.
13
See Section 3.9 of this report for detailed information regarding the program tracking data review.
APSC FILED Time: 4/1/2014 12:29:49 PM: Recvd 4/1/2014 11:59:47 AM: Docket 07-075-tf-Doc. 229

Conclusions & Recommendations 4-1
4. Conclusions & Recommendations
After reviewing the AOG/OG&E Weatherization Program for 2013, the Evaluators
conclude that:
Utility Coordination Has Improved: AOG and OG&E staff reported that the previous
issue of occasionally miscategorizing participants’ utility providers has for the most part
been resolved. Program staff explained that the process of verifying customer utility
providers has become more efficient and accurate, and that very few 2013 program
participants were mislabeled. Overall, both AOG and OG&E staff members noted that
the working relationship between the two utilities has continued to function effectively,
and that at this point all parties are sufficiently familiar with program procedures.
Program Resources are Sufficient: The AOG/OG&E Weatherization Program
currently has adequate staffing and budget allocations. The utility staff members have
the resources to sufficiently manage and operate the program, and the number of
contractors performing installations is reasonable and appropriate. Program budgets are
sufficient to support the savings goals, and the overall program infrastructure is able to
meet program demands. Current staffing levels will likely support increased demands in
future years if needed.
Effective Measure Installation Procedures: During onsite field verification, the
tracking data were found to be accurate and there were very few observed
discrepancies. Additionally, the Evaluator field engineer reported that the majority of
customers were satisfied with the measures that had been installed, and that there were
very few complaints about the work that was performed by utility contractors. Utility staff
members also reported that very few issues had been brought up by participating
customers during visits or at other points. These findings confirm that the QA/QC
procedures for the AOG/OG&E Weatherization Program have continued to adequately
verify measure installation and to sufficiently monitor the quality of work being
performed within participant residences.
Opportunities for Database Improvement: Although the actual implementation of
measures and the associated data collection required during onsite visits have been
sufficient, there are some persisting issues within the data processing stage. The
EnerTrek database has been improved since prior years, but there are minor errors that
should be addressed in order to ensure accurate data reporting. This includes resolving
the summation issue identified in Section 3.9.3 of this report, and addressing any
savings calculation issues such as those identified in Section 2.6 of this report.
Program is Responsive to TRM Needs: Program staff reported that there have been
no significant changes to the home audit data collection forms or measure verification
forms. Additionally, the updates to the Arkansas TRM (TRM 3.0) have not required a
notable increase in data collection requirements for the program measures other than
APSC FILED Time: 4/1/2014 12:29:49 PM: Recvd 4/1/2014 11:59:47 AM: Docket 07-075-tf-Doc. 229

2013 AOG/OG&E Weatherization Program EM&V Report
Conclusions & Recommendations 4-2
water heater jackets and pipe wrap. Staff explained that the existing program
contractors will be able to collect additional measure inputs if needed. In terms of any
relevant changes due to TRM 3.0, program staff reported that Frontier is scheduled to
incorporate all updates into the EnerTrek software system for the 2014 year.
Program is Meeting Savings, Participation, and Satisfaction Goals: The
AOG/OG&E Weatherization Program has succeeded in reaching its savings and
performance goals for the 2013 program year. Program staff indicate that the program
demand has been consistently increasing, and that there remains a large pool of
potential participants for future program years. Additionally, utility staff noted that there
have been very few issues or negative feedback from customers, and that the quality of
work performed has continued to be high.
The AOG/OG&E Weatherization Program was very successful in 2013. The Evaluators
identified few specific, systematic or persistent issues with program operation and
design. Consideration of the following recommendations may benefit program
performance and efficiency in future years:
Include Itemized Air Infiltration Measures: The initial home audit data collection form
and the post-implementation measure verification form both include fields for detailed
measure information and additional field notes. However, some of this information is not
present in the tracking data exports. For example, the air infiltration section on the
verification form includes fields to record which specific improvements were made (e.g.
window caulking, door sweeps, weather stripping). The actual EnerTrek tracking exports
include blower door readings for air infiltration, but do not itemize the air infiltration
improvements. Maintaining complete electronic records of all collected data, including
any qualitative comments on specific jobs, is beneficial from a program evaluation
standpoint especially when onsite verification is conducted. Additionally, uploading all
relevant data into a single accessible database will ensure that potentially useful
information is not lost or discarded.
Add Cursory Outreach Check to Audit: The data collected onsite at participant
homes during the audit and installation procedures is primarily quantitative in nature.
However, these site visits also provide an opportunity to gain insight into customer
awareness of the AOG/OG&E Weatherization Program (and other programs, if desired)
in order to monitor marketing effects. As a process evaluation with participant surveys
will likely not be required each year, collecting this type of information on the installation
contractor level may be a more consistent method of assessing awareness methods. It
would be beneficial to add one or two short questions to the contractor field forms
asking how the customer learned of the program and/or what program information they
have seen (website, flyers, etc.). During years where a broad participant survey is not
performed, these inquiries may provide useful information for tracking program
marketing and outreach effectiveness.
APSC FILED Time: 4/1/2014 12:29:49 PM: Recvd 4/1/2014 11:59:47 AM: Docket 07-075-tf-Doc. 229

2013 AOG/OG&E Weatherization Program EM&V Report
Conclusions & Recommendations 4-3
Resolve Tracking Data Errors: The Evaluators found that some of the columns within
the tracking exports conflicted with data recorded in other columns. Specifically, the
tracking database included summary columns of savings for each participant. However,
for many participants, the overall savings value found in this column did not match the
sum of the savings from the associated measures performed by the participant.
Additionally, savings calculations for a few measures, itemized in Section 2.6 of this
report, did not match TRM specifications. In the future, the utilities and database
provider should ensure that the summary columns containing savings or other
aggregated data match the sum of the individual fields being referenced, and that the
savings calculations match TRM protocols. This could likely be done with a database
query or cursory manual review of the data prior to database finalization.
Investigate Duct Sealing Procedures: AOG and OG&E did not perform duct sealing
during the 2013 program year, but the cost-effectiveness and need for duct sealing is
typically correlated with the need for air infiltration measures. It should be noted that
duct sealing as a service is not absent from the utilities’ energy efficienct portfolios;
some AOG-OG&E Weatherization Program participants received duct sealing
improvements through a separate OG&E residential tune-up and duct sealing program.
It may be beneficial to implement duct sealing in a larger portion of participating homes
as an included aspect of the weatherization services, but this is not recommended
unless a separate deemed formula can be applied, the utilities are able to coordinate
separate post-installation measurements, or the TRM is updated to allow measurement
of air infiltration and duct sealing at the same pressure.
Take Advantage of Cross-Promotion Opportunities: AOG and OG&E reported that a
substantial number of customers have expressed interest in the program but have not
been eligible to participate due to the age or size of their home. Utility staff members
explained that they have encouraged local contractors to provide weatherization
services within the residential market in order to assist these customers. There is also
an opportunity to refer these customers to other AOG or OG&E energy efficiency
programs, such as the OG&E Custom Energy Report Program or the AOG Water
Heating Equipment Rebate Program. The utilities should take advantage of their cross-
fuel coordination relationship to provide customers with useful information about both
gas and electric incentives programs. This will help to provide energy efficiency options
to customers who are unable to receive services through the AOG-OG&E
Weatherization Program.
Table 4-1 presents the above items, outlining the relevant issue, potential
consequences, and associated recommendations. The following recommendation is
listed as ongoing, as it is in the process of being implemented and will continue to be
relevant until a 2014 tracking database is finalized.
Ensure that Planned Tracking Improvements are Implemented (Ongoing): Utility
staff reported that Frontier is scheduled to incorporate all updates into the EnerTrek
system for the 2014 year. This includes necessary measure inputs such as water heater
APSC FILED Time: 4/1/2014 12:29:49 PM: Recvd 4/1/2014 11:59:47 AM: Docket 07-075-tf-Doc. 229

2013 AOG/OG&E Weatherization Program EM&V Report
Conclusions & Recommendations 4-4
jacket and pipe wrap length and thickness, and making any other modifications as
needed in order to comply with TRM V3.0. As updating the database can be time
consuming, it is crucial to initiate all changes early in the program year. This is likely to
be an ongoing recommendation, as future TRM updates may include additional data
collection or savings calculation requirements.
APSC FILED Time: 4/1/2014 12:29:49 PM: Recvd 4/1/2014 11:59:47 AM: Docket 07-075-tf-Doc. 229

2013 AOG/OG&E Weatherization Program EM&V Report
Conclusions & Recommendations 4-5
Table 4-1 Recommendations from 2013 Program Year Evaluation
Issue Consequences Recommendation
Tracking data do not include specific measure details for some items (i.e. whether door
sweeps, window sealing, etc. were installed, whether lighting was installed indoors or
outdoors)
Difficult to completely inspect measure installation
Limits level of detail possible
for measure tracking
Include an itemized list of all air infiltration reduction measures installed in each home.
Limited onsite feedback from participants regarding program awareness and marketing
effectiveness
Possible missed opportunities for collecting
useful marketing and outreach results during years
where broad customer surveys are not administered
Add one or two short questions to the contractor field forms asking how the customer learned of the program and/or what program
information they have seen (website, flyers, etc.)
For many participants, the overall savings value found in the aggregated savings column of the tracking data did not match the sum of
the savings from the associated measures performed by the participant. Additionally,
some savings calculations did not match TRM protocols.
May cause discrepancies between expected savings
and verified savings
Ensure that the summary columns containing savings or other aggregated data match the sum of the individual fields being
referenced. Also check to ensure that database calculations match TRM formulas. This could likely be done with a database query or cursory manual review of the data prior to database finalization.
Duct sealing measurement requirements conflict with air infiltration measurement
requirements in the TRM (must be measured at different pressures)
Discourages implementation and claiming savings of duct sealing with air infiltration
Difficult to verify duct sealing savings when combined with
air infiltration
Investigate the feasibility of adding duct sealing to common program measures and whether the TRM can be modified to allow air
infiltration and duct sealing to be tested at the same pressure.
Avoid implementation of duct sealing with air infiltration measures unless measurement procedures can comply with TRM requirements
or TRM is updated to facilitate efficient measurement (i.e. both measures can be tested at the same pressure).
Some customers are interested in participating but are ineligible due to home age or size
A portion of the customer base may not have access to alternative energy efficiency
options
Actively refer ineligible customers to alternative AOG and OG&E energy efficiency programs.
APSC FILED Time: 4/1/2014 12:29:49 PM: Recvd 4/1/2014 11:59:47 AM: Docket 07-075-tf-Doc. 229

Appendix A: Sample AOG-OG&E Weatherization Marketing A-1
Appendix A: Sample AOG-OG&E Weatherization Marketing
APSC FILED Time: 4/1/2014 12:29:49 PM: Recvd 4/1/2014 11:59:47 AM: Docket 07-075-tf-Doc. 229

2013 AOG/OG&E Weatherization Program EM&V Report
Appendix A: Sample AOG-OG&E Weatherization Marketing A-2
APSC FILED Time: 4/1/2014 12:29:49 PM: Recvd 4/1/2014 11:59:47 AM: Docket 07-075-tf-Doc. 229

2013 AOG/OG&E Weatherization Program EM&V Report
Appendix A: Sample AOG-OG&E Weatherization Marketing A-3
APSC FILED Time: 4/1/2014 12:29:49 PM: Recvd 4/1/2014 11:59:47 AM: Docket 07-075-tf-Doc. 229

2013 AOG/OG&E Weatherization Program EM&V Report
Appendix A: Sample AOG-OG&E Weatherization Marketing A-4
APSC FILED Time: 4/1/2014 12:29:49 PM: Recvd 4/1/2014 11:59:47 AM: Docket 07-075-tf-Doc. 229

Appendix B: Annual Report Summary of Program Budgets and Goals B-1
Appendix B: Annual Report Summary of Program Budgets and Goals
This section presents tables summarizing AOG and OG&E’s annual budgets, expenses,
and energy savings goals for the AOG-OG&E Weatherization Program. These tables
were extracted directly from the utilities’ 2012 energy efficiency annual reports14 and
are included in this report for reference purposes.
Achieved savings values shown are based on the Evaluators’ prior program evaluation
report results. Further detail and narrative regarding the information presented in these
tables may be found in the full versions of each utility’s annual reports.
Figure B-1 OGE 2012 Annual Report: Weatherization Program Budgets and Goals
14
AOG table obtained from: http://www.apscservices.info/EEInfo/EEReports/AOG%202012.pdf
OG&E table obtained from: http://www.apscservices.info/EEInfo/EEReports/OG&E%202012.pdf
APSC FILED Time: 4/1/2014 12:29:49 PM: Recvd 4/1/2014 11:59:47 AM: Docket 07-075-tf-Doc. 229

2013 AOG/OG&E Weatherization Program EM&V Report
Appendix B: Annual Report Summary of Program Budgets and Goals B-2
Figure B-2 AOG 2012 Annual Report: Weatherization Program Budgets and Goals
APSC FILED Time: 4/1/2014 12:29:49 PM: Recvd 4/1/2014 11:59:47 AM: Docket 07-075-tf-Doc. 229

5.0 Attachment E
APSC FILED Time: 4/1/2014 12:29:49 PM: Recvd 4/1/2014 11:59:47 AM: Docket 07-075-tf-Doc. 229

EVALUATION OF ENERGY EFFICIENCY PROGRAMS Arkansas Program Year 2013 Report Number 1383-2013
EnerNOC Utility Solutions
EnerNOC, Inc 500 Ygnacio Valley Road
Suite 450
Walnut Creek, CA 94596 Tel: 925.482.2000
www.enernoc.com
Prepared for: OG&E
Project Manager:
Gay Cook
Project Director:
Craig Williamson
Prepared by: EnerNOC, Inc.
Presented on:
March 1, 2014
APSC FILED Time: 4/1/2014 12:29:49 PM: Recvd 4/1/2014 11:59:47 AM: Docket 07-075-tf-Doc. 229

APSC FILED Time: 4/1/2014 12:29:49 PM: Recvd 4/1/2014 11:59:47 AM: Docket 07-075-tf-Doc. 229

EnerNOC Utility Solutions 2
This report was prepared by
EnerNOC Utility Solutions
500 Ygnacio Valley Blvd., Suite 450
Walnut Creek, CA 94596
Principal Investigator(s):
P. Ignelzi
D. Dragon
I. Zhao
D. Burdjalov
APSC FILED Time: 4/1/2014 12:29:49 PM: Recvd 4/1/2014 11:59:47 AM: Docket 07-075-tf-Doc. 229

EnerNOC Utility Solutions 3
EXECUTIVE SUMMARY
As per regulatory requirements, in 2013 OG&E Arkansas implemented programs as per its approved DSM plan for 2011-2013. EnerNOC Utility Solutions (“EnerNOC”) evaluated six of the
programs implemented by OG&E in Arkansas: 1) Student Energy Education, 2) HVAC Tune-Up
and Duct Repair, 3) Window Air Conditioning, 4) Commercial Lighting, 5) Commercial and Industrial Standard Offer, and 6) Commercial Tune-Up. This report covers the evaluated savings
for PY2012 and actual program costs.
Approach
EnerNOC’s evaluation of the PY 2013 programs was limited by a small budget and focused mainly
on the impact of the programs. In addition to providing adjusted estimates of peak demand and annual energy savings, EnerNOC’s evaluation activities included a study to assess distribution
system efficiency changes, a focused literature review of net-to-gross savings for similar
programs implemented in Arkansas, limited engineering reviews of program results, checking compliance with the Arkansas Technical Reference Manual (TRM 2.0 or TRM 3.0), and applying
net-to-gross values to EnerNOC-adjusted savings. Process evaluation activities included in-depth interviews with program staff and comparing database tracking to recommendations from
Protocol A (Program Tracking and Database Development).
Results
Table ES-1-1 shows the reported gross savings and evaluated gross and net savings. Reported
demand reductions were 1,820 kW, with a gross savings realization rate of 102% and net evaluated demand reduced was 1,726 kW. OG&E reported energy savings of 10,615 MWh with a
gross savings realization rate of 99% and net evaluated savings were 9,701 MWh.
Table ES-1-1 OG&E Arkansas PY 2013 Results by Program
Program
Demand (kW) Annual Energy (MWh)
OG&E Claimed
EnerNOC-adjusted
Net Savings
OG&E Claimed
EnerNOC-adjusted
Net Savings
HVAC Tune-Up/Duct Repair 73 144 130 183 393 354
Window Unit A/C 3 3 3 4 4 3
Student Energy Education 40 19 15 322 151 126
C&I Standard Offer 590 572 570 2,692 2,552 2,536
Commercial Tune-Up 37 42 41 359 359 357
Commercial Lighting 1,077 1,075 967 7,056 7,028 6,325
Totals 1,820 1,855 1,726 10,615 10,487 9,701
Realization Rates
102%
99%
Greater than expected participation and savings in the residential programs. Participation in all three residential programs was higher than OG&E had anticipated in the
program plans. The PY 2013 residential programs achieved evaluated gross savings 166 peak kW
and 548 annual MWh with realization rates of 143% and 108% and net savings of 148 kW and
APSC FILED Time: 4/1/2014 12:29:49 PM: Recvd 4/1/2014 11:59:47 AM: Docket 07-075-tf-Doc. 229

EnerNOC Utility Solutions 4
483 annual MWh. With these results, OG&E achieved 88% of net program goals for demand
savings and exceeded energy savings goals by 137%.
Greater than expected participation in the C&I programs overall but savings were
much lower than goals. Participation in C&I Standard Offer was much higher than expected due the direct installation of measures; the other programs fell short of partic ipation goals. The
PY 2013 C&I programs achieved evaluated gross savings of 1,689 peak kW and 9,939 annual
MWh with realization rates of 99% and 98% and net savings of 1,578 kW and 9,218 annual MWh. With these results, OG&E achieved 36% of net program goals for demand savings and
54% of net goals for energy savings.
Most savings are from commercial lighting and direct installation of measures. Most of
the savings were from commercial lighting, primarily T5 and T8 fixtures but also a lot of savings were from LED lighting. Standard Offer resulted in the next highest level of savings but mainly
from the direct installation of vending misers. As reported by the program manager, custom
projects under SOP and CTU did not provide savings expected due to problems wi th level of incentives provided and availability of efficient equipment. Residential HVAC Tune-up and Duct
Repair program provided strong savings mainly because of the evaluated distribution system efficiency value of 12.7%, which is much higher than the TRM default value of 5%. However,
contractors show little interest installing the duct repair measures.
Actual data tracked and savings calculations are not easily accessed. It was difficult to pin down the program goals as some of them had changed. The use of multiple databases
because of problems with the official database (Saratoga) is confusing, e.g. the initial summary savings reports from Saratoga for Commercial Lighting contained errors (i.e. energy savings
summations were incorrect) and all files contained overlapping projects. Values are hard coded and sometimes rounded, e.g. EERs of 12 instead of 11.5. OG&E has developed a body of
information about each program and associated measures, including Excel-based savings
calculators that apply the algorithms from the TRMs. However, for some programs, EnerNOC found it difficult to readily assess what is tracked and how to replicate savings estimates, e.g.
needed climate zone information per project for Window AC program calculations. In addition, reporting seems to be done only at an aggregate level, i.e. not broken down by measure.
Quality control procedures were not adequate. OG&E currently uses a tracking system
(Saratoga database) to document savings and provide saving reports for all OG&E programs. We identified issues with the provided Saratoga reports and found quite a number of cases where
data were not fully entered or entered incorrectly. The Saratoga system itself or the queries to it often understate the actual level of program activity. Based on data retrieved from the Saratoga
system for this evaluation, we find that the system is not sufficiently reliable in its present state.
Most of the required data is tracked but not all is inputted in the database in a timely fashion, i.e. EnerNOC had to keep requesting updated/corrected reports. Provided reports were missing
data or values, e.g. Residential HVAC Tune-up HVAC projects not entered in database and one of the measure descriptions for an SOP project was ‘????’. In addition EnerNOC found incorrect data
for Residential Window AC, and for Residential HVAC Tune-Up and Duct Repair projects; some project entries were somewhat convoluted and led to issues such as separate projects grouped
together, rounding issues, and project lines duplicated 2 to 3 times. EnerNOC also had some
difficulty in getting information on the calculations underlying the savings values and the correct savings summary reports for custom projects under SOP and CTU.
Recommendations
Create and implement QA/QC procedures
OG&E should develop a set of procedure/quality control steps in order to report consistent and
accurate savings results. For example, OG&E can create a check list and have a supervisor initial
and verify that check list tasks were completed before documents are provided to the evaluation
APSC FILED Time: 4/1/2014 12:29:49 PM: Recvd 4/1/2014 11:59:47 AM: Docket 07-075-tf-Doc. 229

EnerNOC Utility Solutions 5
team. An example check list is provided below and is not limited to the following (EnerNOC
recommends that OG&E create a checklist that is suited to their protocols and procedures, the following is purely an example):
Read previous Evaluation reports to better understand what information is needed.
Review saving reports before submitting and:
Check savings values; does the PM agree with savings values included in report?
Check all measures to see if anything (goals, measures, etc.) are missing
Check to see if there is enough information in the report to figure out the savings algorithms and replicate the savings
If any of the above information is missing or incorrect, fix the report and/or provide supplemental information (see Improve Documentation and Reporting sections below) so
that the savings can be evaluated
Improve Documentation
A data dictionary should be developed for all database maintained by OG&E, CLEAResult, and
DirectOptions. A data dictionary is a set of information describing the contents, format, and
structure of a database and the relationship between its elements, used to control access to and manipulation of the database.
In addition, for each program, OG&E should consolidate all backup documentation and
explanations for each parameters tracked, as well as the calculations and methods including the relevant TRM sections for each program measure. Improving the program documentation
such that all the key elements of savings calculations and assumptions are included will
improve confidence in and efficient verification of OG&E’‘s claimed savings.
Reporting
Savings summary sheets provided for the evaluation should include all parameters used to
calculate savings to the second decimal (or third if parameter used was taken to the third decimal).
Create monthly reports with details by measure for each program to provide feedback to
program managers and allow corrections and changes to be made during the program year
rather than during the evaluation.
Residential HVAC Tune-Up Program
Replace distribution system efficiency (DSE) TRM default value with field-verified value in
claimed savings calculations and urge APSC to adopt in next TRM version.
Address contractors’ disinterest in installing measures by either providing better or different
support to increase their interest or move to using direct installation to achieve savings.
Investigate—perhaps as part of the statewide potential study—whether Arkansas customers
need adjustments to refrigerant charges; there may not be much opportunities for savings
from this measure as the program manager noted that many of the customers did not need a change of refrigerant charge.
Window AC Program
The program seems to be working as planned. May want to consider expanding the program
to cover other efficiency products if they are cost-effective.
APSC FILED Time: 4/1/2014 12:29:49 PM: Recvd 4/1/2014 11:59:47 AM: Docket 07-075-tf-Doc. 229

EnerNOC Utility Solutions 6
Use climate zone appropriate deemed savings. The claimed savings used the TRM but some
projects were assigned values from the incorrect zone. While the effect is small, the
correction is easy and will increase confidence in OG&E’s savings claims.
Student Energy Education
Check in with teachers during the participation period to ensure kit distribution and
encourage installation of measures in kits. We believe that the implementer should provide this level of monitoring as part of the turn-key service.
Eliminate sending duplicate kits to teachers who repeatedly enroll in the program. This would
reduce program costs by about 2%. These free-up funds could be used to increase
participation by additional students.
Commercial Lighting Program
The tracking tool used for the Commercial Lighting program seems comprehensive and well
maintained. It would be a good idea to have Direct Options create data dictionary and set up procedures to extract usable data and provide
Ensure all new equipment for custom applications, i.e. rebated on the basis of kW savings, is
captured, perhaps with a drop down menu that requires a response.
Create monthly program reports with measure details, participant information, as well as demand
and energy savings, and enhance the ability to create ad hoc reports as needed. This will provide valuable feedback to program managers.
Standard Offer and Commercial Tune-Up Programs
For PY 2014, add or reallocate funds to enable independent estimation of direct install
measures over custom measures if they again comprise the majority of savings OG&E claims
for the program.
Focus outreach and recruitment on customers with larger energy savings opportunities. While the number of projects processed under the program was far higher than expected in PY
2013, in order to reach the kW and kWh goals, recruitment needs to focus on achieving
larger and/or more comprehensive projects. One suggestion is to introduce tiered incentives which would provide higher per-kW for projects above a threshold level.
Claim kW savings for vending misers in addition to kWh savings, as indicated in the TRM.
As part of the upcoming market potential study assess the focus and appeal of the custom
projects components of these programs. This program is underperforming in terms of both peak kW reductions and annual kWh savings. The program either needs to include more
measures that interest customers or a different outreach approach to reach the target
market. Very few of the participants in the Commercial Tune-Up Program installed the high-impact measures promoted or expected by the program.
APSC FILED Time: 4/1/2014 12:29:49 PM: Recvd 4/1/2014 11:59:47 AM: Docket 07-075-tf-Doc. 229

EnerNOC Utility Solutions 7
CONTENTS
EXECUTIVE SUMMARY ...................................................................................................... 3
1 INTRODUCTION ......................................................................................................10
Background for OG&E Arkansas DSM Program .................................................................. 10
2013 Program Goals Compared to Reported ..................................................................... 10
Structure of the Report.................................................................................................... 11
2 EVALUATION METHODS ..........................................................................................12
Introduction.................................................................................................................... 12
Process Evaluation .......................................................................................................... 13
Impact Evaluation ........................................................................................................... 13
3 NTG STUDY RESULTS ..............................................................................................15
Commercial Lighting ........................................................................................................ 15
Custom Projects (SOP and CTU) ...................................................................................... 16
Residential HVAC Tune-Up and Duct Repair ...................................................................... 16
NTG Ratios for PY 2013 Arkansas Programs ...................................................................... 17
4 RESIDENTIAL PROGRAMS ......................................................................................18
HVAC Tune-Up and Duct Repair ....................................................................................... 18
Window AC Program ....................................................................................................... 20
Student Energy Education ............................................................................................... 21
5 COMMERCIAL & INDUSTRIAL PROGRAMS .............................................................30
Standard Offer Program .................................................................................................. 30
Commercial Tune-Up Program ......................................................................................... 33
Commercial Lighting Program .......................................................................................... 35
6 PROCESS EVALUATION AND RESPONSE TO PY 2102 RECOMMENDATIONS ..........38
Process Evaluation .......................................................................................................... 38
Response to PY 2012 Recommendations .......................................................................... 41
7 FINDINGS AND RECOMMENDATIONS ....................................................................44
PY 2013 Program Impacts ............................................................................................... 44
Comprehensive Factors ................................................................................................... 47
A PROGRAM MANAGER INTERVIEW GUIDE ............................................................ A-1
APSC FILED Time: 4/1/2014 12:29:49 PM: Recvd 4/1/2014 11:59:47 AM: Docket 07-075-tf-Doc. 229

EnerNOC Utility Solutions 8
CONTENTS
EXECUTIVE SUMMARY ...................................................................................................... 3
8 INTRODUCTION ...................................................................................................... 10
Background for OG&E Arkansas DSM Program .................................................................. 10
2013 Program Goals Compared to Reported ..................................................................... 10
Structure of the Report.................................................................................................... 11
9 EVALUATION METHODS .......................................................................................... 12
Introduction.................................................................................................................... 12
Process Evaluation .......................................................................................................... 13
Impact Evaluation ........................................................................................................... 13
10 NTG STUDY RESULTS .............................................................................................. 15
Commercial Lighting ........................................................................................................ 15
Custom Projects (SOP and CTU) ...................................................................................... 16
Residential HVAC Tune-Up and Duct Repair ...................................................................... 16
NTG Ratios for PY 2013 Arkansas Programs ...................................................................... 17
11 RESIDENTIAL PROGRAMS ...................................................................................... 18
HVAC Tune-Up and Duct Repair ....................................................................................... 18
Window AC Program ....................................................................................................... 20
Student Energy Education ............................................................................................... 21
12 COMMERCIAL & INDUSTRIAL PROGRAMS ............................................................. 30
Standard Offer Program .................................................................................................. 30
Commercial Tune-Up Program ......................................................................................... 33
Commercial Lighting Program .......................................................................................... 35
13 PROCESS EVALUATION AND RESPONSE TO PY 2102 RECOMMENDATIONS .......... 38
Process Evaluation .......................................................................................................... 38
Response to PY 2012 Recommendations .......................................................................... 41
14 FINDINGS AND RECOMMENDATIONS .................................................................... 44
PY 2013 Program Impacts ............................................................................................... 44
Key Findings ...................................................................... Error! Bookmark not defined.
Recommendations.............................................................. Error! Bookmark not defined.
Comprehensive Factors ................................................................................................... 44
B PROGRAM MANAGER INTERVIEW GUIDE ............................................................ A-1
LIST OF FIGURES
Figure 4-1 LivingWise® Kit ...................................................................................................... 22
Figure 5-1 Breakdown of OG&E-Reported Lighting Demand (kW) Savings by Measure ............... 36
APSC FILED Time: 4/1/2014 12:29:49 PM: Recvd 4/1/2014 11:59:47 AM: Docket 07-075-tf-Doc. 229

EnerNOC Utility Solutions 9
LIST OF TABLES
Table ES-1-1 OG&E Arkansas PY 2013 Results by Program ............................................................. 3
Table 1-1 2013 Program Participation and Gross Savings (Planned vs. Reported Savings) ......... 11
Table 2-1 DSE Factors by State and Combined Across All Homes ............................................. 13
Table 3-1 NTG Results for Commercial Lighting Programs ....................................................... 15
Table 3-2 NTG Results for C&I Custom Rebate Programs ........................................................ 16
Table 3-3 NTG Approaches used for HVAC Tune Up and Duct Repair Program ......................... 17
Table 3-4 Recommended NTG Values for Arkansas DSM Programs .......................................... 17
Table 4-1 2013 HVAC Tune Up and Duct Repair Program Summary Results ............................. 19
Table 4-2 2013 Impact Results for HVAC Tune Up and Duct Repair ......................................... 20
Table 4-3 Window AC PY 2013 Program Summary Results ...................................................... 20
Table 4-4 2013 Impact Results for Window AC ....................................................................... 21
Table 4-5 Student Education Energy Participation and Savings Projections .............................. 22
Table 4-6 Distribution of Kits in PY 2013 ................................................................................ 23
Table 4-7 TRM-Calculated Savings by Measure, Per Unit Installed ............................................ 24
Table 4-8 SEE Realized Program Savings by Measure, Total and Per Participant ....................... 25
Table 4-9 Faucet Aerator Realized Savings ............................................................................. 26
Table 4-10 Low-Flow Showerhead Realized Savings .................................................................. 27
Table 4-11 CFL Realized Savings ............................................................................................. 28
Table 4-12 Student Education Energy Net Program Savings by Measure .................................... 29
Table 4-13 PY 2013 Student Education Energy Program Goals and Savings ................................ 29
Table 5-1 Standard Offer PY 2013 Program Projects by Type Measure ..................................... 30
Table 5-2 PY 2013 SOP Comparison of Goals to Reported Savings ........................................... 31
Table 5-3 Calculations of Embedded Energy Savings for Commercial Faucet Aerators ............... 32
Table 5-4 Calculations of Embedded Energy Savings for Pre-Rinse Spray Valves ....................... 32
Table 5-5 2013 Impact Results for SOP .................................................................................. 33
Table 5-6 CTU PY 2013 Program: OG&E Reported Savings and Gross Savings Goals ................. 34
Table 5-7 Reported, Gross and Net Savings for CTU Projects in PY 2013 .................................. 35
Table 5-8 2013 Commercial Lighting Measure Descriptions and Total Projects Reported ............ 36
Table 5-9 Commercial Lighting PY 2013 Program: Participation and Claimed Savings ................ 37
Table 5-10 PY 2013 Impact Results for Commercial Lighting ..................................................... 37
Table 6-1 Adherence to Protocol A: Residential Programs ........................................................ 39
Table 6-2 Adherence to Protocol A: C&I Programs .................................................................. 40
Table 8-1 PY 2012 Results by Program (Reported, Adjusted, Net Savings) ............................... 44
APSC FILED Time: 4/1/2014 12:29:49 PM: Recvd 4/1/2014 11:59:47 AM: Docket 07-075-tf-Doc. 229

EnerNOC Utility Solutions 10
CHAPTER 1
INTRODUCTION
Background for OG&E Arkansas DSM Program In January 2006, the Arkansas Public Service Commission (APSC) began the rulemaking for
developing and implementing energy efficiency programs for Arkansas’s four electric utilities. By May of 2007, these rules were finalized, adopting protocols and procedures for testing the cost-
effectiveness of energy efficiency (EE) programs and conducting evaluation, measurement, and
verification (EM&V) of claimed savings. In October 2007, OG&E introduced a Quick Start Program in the Arkansas jurisdiction. Two of the Quick Start measures, Weatherization and Education, are
collaborative efforts by all Arkansas utilities.
In June 2011, the APSC approved OG&E’s portfolio of energy efficiency programs for that
program year (2011-2013 Energy Efficiency and Load Management Plan). In Sept 2011, OG&E
filed a revised proposal to achieve the energy savings goals required by the Order for the 2012 and 2013 program years, Oklahoma Gas & Electric’s 2011-2013 Arkansas Energy Efficiency
Program Analysis and Plan prepared by Frontier Associates, Sept 2011 (“the Plan”).
OG&E Electric Services offers retail electric service in Oklahoma and Arkansas, servicing
approximately 65,000 residential customers in Arkansas. OG&E’s Arkansas service area encompasses the City of Fort Smith and several nearby municipalities. In 2010, OG&E’s Arkansas
retail customer classes used 2,700,703 MWh which is 10.8% of all OG&E energy.
In December 2011, OG&E engaged EnerNOC Utility Solutions (EnerNOC) to evaluate following programs:
Residential
o HVAC Tune-up and Duct Repair
o Window AC Tune-up
o Student Energy Education Program (LivingWise®)
Commercial & Industrial
o Commercial Lighting
o Standard Offer
o Commercial Tune-up
2013 Program Goals Compared to Reported
This evaluation covers six of the programs implemented by OG&E in Arkansas—HVAC Tune-Up
and Duct Repair, Window Air Conditioning, Student Energy Education, Commercial Lighting, Commercial and Industrial Standard Offer, and Commercial Tune-Up.
In total, the program participation was higher than expected (139%), but OG&E-reported savings for both demand and energy fell below projections. The programs achieved 32% of planned
demand reductions and 49% of energy savings.
Table 1-1 below compares planned and reported participation, gross demand reduction, and gross energy savings for these programs.
APSC FILED Time: 4/1/2014 12:29:49 PM: Recvd 4/1/2014 11:59:47 AM: Docket 07-075-tf-Doc. 229

EnerNOC Utility Solutions 11
Table 1-1 2013 Program Participation and Gross Savings (Planned vs. Reported Savings)
Program
Participation Demand (kW) Annual Energy (kWh)
Planned Reported Planned Reported Planned Reported
HVAC Tune-Up/Duct Repair 300 510 194 73 286,281 182,551
Window Unit A/C 25 30 2 3 2,423 3,748
Student Energy Education 1,840 2,006 15 40 152,120 321,962
C&I Standard Offer 984 2,469 2,452 590 8,972,138 2,691,590
Commercial Tune-Up 483 140 140 37 949,961 359,174
Commercial Lighting 215 186 2,844 1,077 11,262,681 7,056,125
Totals 3,847 5,341 5,647 1,820 21,625,604 10,615,150
Structure of the Report This report is structured as shown below:
Chapter 1, Introduction
Chapter 2, Evaluation Methods
Chapter 3, NTG Study
Chapter 4, Residential Programs
Chapter 5, Commercial & Industrial Programs
Chapter 6, Process Evaluation and Response to PY 2012 Recommendations
Chapter 7, Findings and Recommendations
Appendices
APSC FILED Time: 4/1/2014 12:29:49 PM: Recvd 4/1/2014 11:59:47 AM: Docket 07-075-tf-Doc. 229

EnerNOC Utility Solutions 12
CHAPTER 2
EVALUATION METHODS
Introduction
The methods EnerNOC used for the PY 2013 evaluation were limited by a small budget. OG&E
assigned a budget of 7% of total program budgets for the evaluation of the three -year program
cycle (2011-2013) which began in July 2011. EnerNOC assigned the work by year as follows:
22% for PY 2011 evaluation – programs were relatively new in the market and less than
10% of overall participation was expected in this period.
62% for PY 2012 evaluation – assigned most of the budget for this evaluation in order to
provide timely input to planning for the next program cycle.
17% for PY 2013 evaluation – expected to use results from PY 2012 evaluation for the
work which would have been completed by Dec 2013.
Due to developments in the Arkansas regulatory climate, the program cycle has been extended
to the end of 2014. However, there was no more funding available for the PY 2013 evaluation. There was only one major change in the programs for PY 2013. As both the custom programs
(SOP and CTU) were underperforming, OG&E engaged ClearResult to implement a direct installation program using some of the funds from SOP/CTU.
Here’s what we did:
Reviewed calculators and other tools developed by OG&E for tracking custom project
savings before they were implemented in the tracking system.
Provided input to OG&E for the redevelopment of the online Commercial Lighting tracking
system used in both Oklahoma and Arkansas.
Repeated the DSE study with a sample of Arkansas homes to develop a combined DSE
factor for Oklahoma and Arkansas.
Applied realization rates for PY 2012 evaluations to PY 2013 results.
Conducted a focused literature review of net-to-gross findings for programs similar to
those offered in Oklahoma and Arkansas.
Interviewed residential program manager, C&I program manager, and LivingWise®
program manager
Collected detailed program data to assess compliance with TRM
Assessed compliance with the appropriate TRM
Adjusted for load factors, errors in data entry, and climate zones
Reviewed databases provided by OG&E and implementers and reconciled where
necessary
APSC FILED Time: 4/1/2014 12:29:49 PM: Recvd 4/1/2014 11:59:47 AM: Docket 07-075-tf-Doc. 229

EnerNOC Utility Solutions 13
Process Evaluation
Review of Databases/Protocol A
EnerNOC reviewed the tracking databases in reference to recommendations in Protocol A. In addition, as part of the evaluation process, EnerNOC identified several issues with the databases
and quality control processes and procedures.
Interviews with Program Managers
EnerNOC interviewed three program managers involved with the delivery of the DSM programs, the manager in charge of implementing the C&I programs, the manager in charge of delivering
the Window AC and Residential HVAC Tune-up and Duct Repair Program and the manager
responsible for the Student Energy Education program.
Impact Evaluation The impact evaluation focused on assessing adherence to the TRM and spot-checking for errors. EnerNOC also reviewed calculators for custom project measures such as chillers and HVAC
equipment. Other studies conducted for OG&E for both Oklahoma and Arkansas are discussed below.
Distribution System Efficiency Study
Duct blaster tests were conducted under the Oklahoma Home Energy Efficiency Program (HEEP)
for PY 2011. The Arkansas program was designed based on HEEP. A total of 32 homes (24 Oklahoma HEEP 2011 study participants and eight homes tested in 2010) were included in this
program and associated results were used to calculate estimated Distribution System Efficiency
(DSE) per ton. Similarly, duct blaster tests were conducted with homes participating in the 2013 AOG Weatherization program in Arkansas.
As described in Chapter 4, participants in the Arkansas Residential HVAC Tune-up and Duct Repair Program were not interested in the duct/plenum seal measure so OG&E used the program
funds to implement these measures in the AOG Weatherization program with results counted
under the original program.
A total of 25 homes were included in this study and associated results were used to calculate
estimated DSE per ton. The average DSE per ton is calculated based on the average pre -seal, post-seal, and total system cubic feet per minute (CFM), and is estimated to be 13.5% and
11.6% for Oklahoma 2011 and Arkansas 2013, respectively, as shown in Table 2-1. The stratified estimate used previously resulted in a DSE value of 13.2%. The average DSE for all 57 homes
was 12.7%1. EnerNOC recommends that OG&E use a DSE factor of 12.7% in the formula to
calculate energy savings from sealing plenums in eligible homes in both Oklahoma and Arkansas.
Table 2-1 DSE Factors by State and Combined Across All Homes
State # of Homes in Sample DSE Factor
Oklahoma 32 13.5%
Arkansas 25 11.6%
Combined 57 12.7%
1 Cook, G., Zhao, I, Marrin, K., and Dragon, D. OG&E Distribution System Efficiency Study, Dec. 2013.
APSC FILED Time: 4/1/2014 12:29:49 PM: Recvd 4/1/2014 11:59:47 AM: Docket 07-075-tf-Doc. 229

EnerNOC Utility Solutions 14
Net To-Gross Factors
For both PY 2011 and PY 2012, EnerNOC applied the default NTG factor of 0.8 to most program
results. Although EnerNOC conducted primary research with some program participants, with such limited participation (18 respondents for C&I programs and 52 respondents for the
residential HVAC tune-up program) we did not feel comfortable applying the results from very
small samples. EnerNOC conducted a study to support use of more appropriate NTG factors for OG&E’s programs.
We started with research completed by Navigant2 for the two largest Ontario gas utilities in early 2013 designed to investigate approaches to determining NTG across the continent. The focus
was on custom programs but the study was helpful in identifying a range of options for
estimating NTG that are used in North America. The options listed in the table below from least to most costly, ranging from as low as $3,000 for the first two options to over $500,000 for
option 5.
Assigning NTG Values to Energy Efficiency Programs
1. Transfer NTG Values from Other Research. There is some clustering of values which could be used to inform a deemed value.
2. Adjust NTG Values based on Program Factors. Select a NTG value accounting for
comparable program factors such as utility-type, program-type, targeted sector, program maturity, program marketing and region.
3. Align NTG Values using Limited Primary Data. Enhance the precision of comparative NTG values by applying a small set of selected primary data gathered
during program implementation and/or evaluation. Interviews with trade allies (both
participating and non-participating) can provide insight into free riders and spillover with relatively limited data collection requirements.
4. Full NTG Research Study – After Program Year. These studies are done for each program and use various methods including surveys of participants and non-
participants, interviews with trade allies and other market actors, as well as econometric modeling such as discrete choice.
5. Integrated/Fast Feedback NTG Estimation. This reduces the bias in NTG
estimates by collecting data frequently over time and getting fast feedback which can reduce recall bias by surveying participants closer to when decisions are made.
In fall 2013, EnerNOC conducted a literature review of NTG approaches for programs in othe r
jurisdictions that are similar to those implemented in Oklahoma and Arkansas. Sources used included: EnerNOC’s internal database of evaluation reports; CALMAC; NEEP Repository of State
and Topical EM&V Studies; CEE database; multiple state and utility websites; and general internet searches.
Based on this research, we assess which of the Navigant NTG approaches that could be used for
each OG&E programs including comparing program factors such as maturity, location, target markets, etc. EnerNOC then recommended approaches and research to refine NTG values for
each program where needed.
2 Navigant Consulting, “Custom Free Ridership and Participant Spillover Jurisdictional Review,” prepared for Enbridge and Union Gas,
May 2013.
APSC FILED Time: 4/1/2014 12:29:49 PM: Recvd 4/1/2014 11:59:47 AM: Docket 07-075-tf-Doc. 229

EnerNOC Utility Solutions 15
CHAPTER 3
NTG STUDY RESULTS
This chapter shows the results of the net-to-gross literature review3 for the following programs:
Commercial Lighting
Custom Rebates (SOP and CTU)
Residential HVAC and Tune-Ups
EnerNOC did not find any relevant evaluation studies for the Window AC program so we applied
the default NTG ratio of 0.8.
EnerNOC also found no comparable program NTG values for the Student Energy Education program. For PY 2012, however, we had identified and gained IEM approval for applying
individual measure NTGs supported by other studies or mandated by the IEM, and calculated a savings-weighted average NTG for the program. Again with approval by the IEM, we applied
these same individual values to the PY 2013 savings. The individual measure values are: 1.0 for faucet aerators and low-flow showerheads, and 0.63 for CFLs. Based on the realized savings for
PY 2013, the program NTG is 0.83
Commercial Lighting
The table below shows the results of the literature review for evaluations of commercial lighting
programs implemented in Arkansas. For Arkansas PY 2013 commercial lighting program we used
the findings from two evaluations done by Cadmus in 2013 for Entergy’s Small Business Program 4 and SWEPCO’s C&I Prescriptive Program5. Both of these programs have a similar target market
and maturity as the OG&E program. Although the programs are not exclusively lighting programs they both include a strong lighting component. EnerNOC applied a NTG ratio of 0.9 for these
program results.
Table 3-1 NTG Results for Commercial Lighting Programs
Program Location Target Market
Program Year (s)
Maturity of Program
NTG Approach
Includes Spillover?
NTG Ratio
Small Business Program
Arkansas C&I less than
100 kW 2012
Early (1st year)
Full NTG research
Yes 1.0
C&I Prescriptive
Program Arkansas
Nonresidential customers
2012
Early (1st year but based on an existing program)
Full NTG research
Yes .89
3 Ryan, B., Cook, G., Ignelzi, P., and Shah, T. Approach to Net Savings: Oklahoma & Arkansas, Dec 2013. 4 Cadmus. (2013). Energy-Efficiency Portfolio Evaluation Report; 2012 Program Year. Entergy Arkansas. 5 Cadmus. (2013). Energy-Efficiency Portfolio Evaluation Report; 2012 Program Year. Southwestern Electric Power Company.
APSC FILED Time: 4/1/2014 12:29:49 PM: Recvd 4/1/2014 11:59:47 AM: Docket 07-075-tf-Doc. 229

EnerNOC Utility Solutions 16
Custom Projects (SOP and CTU)
The following table shows the results of the literature review for evaluation of custom programs
implemented in Arkansas. For Arkansas PY 2013 Commercial Lighting Program EnerNOC used the
findings from two evaluations done by Cadmus in 2013 for Entergy’s C itySmart and C&I Custom
Solutions Programs3 and SWEPCO’s C&I Energy Efficiency Program4. These programs have a similar target market and maturity as the OG&E program. For the results of the custom projects
implemented in PY 2013 EnerNOC applied a NTG ratio of 0.98.
Table 3-2 NTG Results for C&I Custom Rebate Programs
Program Location Target Market
Program Year (s)
Maturity of
Program
NTG Approach
Includes Spillover?
NTG Ratio
CitySmart Arkansas Institutional and Public
Entities 2012
Early (3rd year)
Full NTG Research
Yes 1.0
C&I Custom
Solutions Program
Arkansas Large C&I (over 100
kW) 2012
Early (2nd year)
Full NTG Research
Yes .98
C&I Energy Efficiency Program
Arkansas Large C&I (over 50
kW) 2012
Early (1st year)
Full NTG Research
Yes .97
The other component of the SOP/CTU programs is direct installation of selected measures at no
cost to the customer; these measures include CFLs, vending machine controllers and water -saving equipment, such as faucet aerators and low-flow pre-rinse values, for customers with
electric hot water. An implementation contractor, CLEAResult, recruits and trains trade allies, processes applications, conducts inspections before and after implementation, installs DI
measures, and makes incentive payments. This is the same initiative as Entergy used in its Small
Business Program for which the Cadmus evaluation found a NTG ratio of 1.0 (as shown in Table 3-3). EnerNOC will apply a NTG ratio of 1.0 for OG&E results from the direct installation
component.
Residential HVAC Tune-Up and Duct Repair
The following table shows the results of the literature review for evaluation of residential HVAC
tune-up programs implemented in Arkansas. For Arkansas PY 2013 we used the findings from two evaluations done by Cadmus in 2013 for Entergy’s Home Energy Solutions Program 3 and
SWEPCO’s Cool Saver Program4 and an evaluation done by Navigant for Public Service of Oklahoma’s Residential AC Tune-Up Program6. These programs have a similar target market and
maturity as the OG&E program. For the results of the custom projects implemented in PY 2013
EnerNOC applied a NTG ratio of 0.9.
6 Navigant. (2012). Public Service Company Report on the Performance of Energy Efficiency and Demand Response Programs; Program Year 2011.
APSC FILED Time: 4/1/2014 12:29:49 PM: Recvd 4/1/2014 11:59:47 AM: Docket 07-075-tf-Doc. 229

EnerNOC Utility Solutions 17
Table 3-3 NTG Approaches used for HVAC Tune Up and Duct Repair Program
Program Location Target Market
Program Year (s)
Maturity of
Program
NTG Approach
Includes Spillover?
NTG Ratio
Home Energy1 Solutions
Arkansas Residential 2012 Early (2nd
Year) Full NTG Research
Yes .89
Cool Saver Program
Arkansas Residential 2012 Early (2nd
Year) Full NTG Research
No .91
Residential AC Tune Up
Oklahoma Residential 2011 Early (2nd
Year) Full NTG Research
Yes .95
1This program includes additional measures that the OG&E program does not offer.
NTG Ratios for PY 2013 Arkansas Programs
The table below outlines our recommended NTG ratio for each program.
Table 3-4 Recommended NTG Values for Arkansas DSM Programs
Program Components PY 2013 NTG
Ratio
Commercial Lighting .9
C&I Custom Custom projects for SOP and CTU 0.98
Direct Installation 1.0
Residential HVAC Tune Up and Duct Repair 0.9
Window AC 0.8
Student Energy Education Self-installed aerators,
showerheads, and CFLs 0.83
Sources
ADM. (2010). Residential Living Wise Program Measurement & Verification Report , 2009 Program Year. El Paso Electric Company; and IEM directive for CFLs (2013).
Cadmus. (2013). Energy-Efficiency Portfolio Evaluation Report; 2012 Program Year. Entergy
Arkansas.
Cadmus. (2013). Energy-Efficiency Portfolio Evaluation Report; 2012 Program Year.
Southwestern Electric Power Company.
Navigant. (2012). Public Service Company Report on the Performance of Energy Efficiency and Demand Response Programs; Program Year 2011.
APSC FILED Time: 4/1/2014 12:29:49 PM: Recvd 4/1/2014 11:59:47 AM: Docket 07-075-tf-Doc. 229

EnerNOC Utility Solutions 18
RESIDENTIAL PROGRAMS
This section describes the findings from the evaluation of the impacts of the three residential
programs, the HVAC Tune-Up and Duct Repair Program, the Window AC Program, and the Student
Energy Education Program (LivingWise®). The LivingWise program is delivered and tracked in a different way than are the other two programs.
HVAC Tune-Up and Duct Repair The HVAC Tune-Up and Duct Repair program was launched July 2011 and continued through
2013. This program targeted single family residential customers with central HVAC systems and worked towards improving the efficiency of these units. The program contained two major
components: (1) HVAC inspection and tune-up and (2) duct repair including plenum sealing. In
order to pursue either measure, the customer was required to contract work from an OG&E approved local, certified, and licensed HVAC contractor. At the completion of each project, the
results were documented through the use of the OG&E Post-Inspection Survey Form completed by the licensed contractor. This program was based on an existing program offered in Oklahoma,
called the Home Energy Efficiency Program or HEEP.7 As program participants were not interested in the duct repair measure, program funds were used to install the measure in homes
participating in the AOG Weatherization program and savings were counted under this program.
HVAC Inspection and Tune-Up
In completing the first component, a technician certified in the use of an approved diagnostic
system will analyze the air conditioner or heat pump’s refrigerant charge, using superheat, subcooling, or another approach per the equipment manufacturer’s recommendation. The
following pre- and post-service measurements shall be recorded and reported to the utility:
Condenser air entering temperature
Return plenum dry bulb and wet bulb temperatures
Supply plenum dry bulb temperature
Refrigerant suction line and liquid line temperatures
Refrigerant suction and discharge pressures
These tune-ups will be done using utility-approved diagnostic equipment or protocols, such as: Honeywell Service Assistant™, Proctor Engineering CheckMe!, Enalasys™, Verified RCA™ or other
approved diagnostic system. Airflow may either be measured directly or estimated using the temperature split method. OG&E will pay the $75 incentive directly to the contractor to off-set
inspection and tune-up costs. If any repair is needed to the HVAC equipment whose cost exceeds $75, the customer will be responsible for payment of any such repairs.
7 The major difference between Oklahoma HEEP and Arkansas HVAC Tune-Up and Duct Repair program is that HEEP offered a free 1 lb
refrigeration charge and the Arkansas program did not.
CHAPTER 4
APSC FILED Time: 4/1/2014 12:29:49 PM: Recvd 4/1/2014 11:59:47 AM: Docket 07-075-tf-Doc. 229

EnerNOC Utility Solutions 19
Duct Repair
Duct repair measures involved the assistance of sealing or repairing HVAC duct work. The customer was required to contract duct inspection services for a certified technician to identify
loose duct connections, collapsed ducts, or uninsulated ducts. If such faulty ducts were found, OG&E paid up to $300 directly to the contractor to offset the cost of the duct repair.
Summary of Program Results
This section includes a summary of program participation, demand and energy savings, and
program costs. Goals for 2013 included implementing 300 projects for a total gross savings of 194 kW and 286,281 kWh per year. With the exception of meeting and exceeding the
participation goals, goals were not met. A total of 510 projects were reported as implemented
with demand and energy savings of 73 kW and 182,551 kWh per year, respectively.
Table 4-1 below shows the total participation and gross claimed savings in the tracking database
for PY 2013 as well as gross savings goals.
Table 4-1 2013 HVAC Tune Up and Duct Repair Program Summary Results
Metric Participation
(AC Units)
Demand Savings
(kW)
Energy Savings
(kWh/yr)
OG&E Reported 510 73 182,551
OG&E Goal 300 194 286,281
Goal % 170% 37% 64%
Program Evaluation
Based on conversations with OG&E and spot checks with submitted data, the methods used to
estimate savings are in-line with TRM 2.0 methods for HVAC Tune-Ups and Duct Repair measures. OG&E confirmed that all Residential projects were implemented in homes located in
Climate Zone 8. For the HVAC Tune-Up projects, one entry had an error and used Climate Zone 7 effective full load hours for cooling season instead of hours for Climate Zone 8. This finding
resulted in a slightly lower evaluated gross energy savings for HVAC Tune-Up projects. Please
note that all the HVAC Tune-Up projects considered that the baseline system was undercharged by 20% and had an EER of 10.235. Supporting documentation for this claim was not provided
and the evaluated savings assume that the certified technician was able to prove the baseline claims. For the Duct Repair projects, the evaluated savings consider that all units have default
efficiency ratings of: 11.5 SEER (all unit types) and 7.3 HSPF (for heat pumps). 8 Evaluated savings for the Duct Repair projects consider the following updates:
1. Distribution System Efficiency (DSE) of 12.7% (from the 2013 study) instead of the
TRM 2.0 default value of 0.05%.
2. Corrected the savings estimates for two projects that over estimated annual energy
savings by about 30 kWh.
3. Included annual energy savings for one project that was missing an estimated annual
energy savings value.
For the program as a whole, EnerNOC found realization rates of 197% for the demand savings and 216% for the energy savings. The NTG ratio of 90% from Chapter 3 was applied to the
gross savings. Table 4-2 below shows the reported savings, evaluated savings, realization rates for the gross impact estimates, and net savings for the implemented projects.
8 SEER and HSPF are the abbreviations for seasonal energy efficiency ratio and heating seasonal performance factor, respectively.
APSC FILED Time: 4/1/2014 12:29:49 PM: Recvd 4/1/2014 11:59:47 AM: Docket 07-075-tf-Doc. 229

EnerNOC Utility Solutions 20
Table 4-2 2013 Impact Results for HVAC Tune Up and Duct Repair
Measure Net Savings
Gross Impacts
Net Impact Reported Evaluated
Realization Rate
HVAC Tune-up Demand Savings (kW) 27 27 100% 24
Annual Energy (kWh) 45,870 45,589 99% 41,030
Duct Repair Demand Savings (kW) 46 117 254% 105
Annual Energy (kWh) 136,681 347,809 254% 313,028
Totals Demand Savings (kW) 73 144 197% 130
Annual Energy (kWh) 182,551 393,398 216% 354,058
Window AC Program The Window Air Conditioner (Window AC) program was launched in July 2011 and continued
through 2013. This program targeted single family residential homes without central HVAC systems and worked towards influencing these customers to purchase high-efficiency window air
conditioners. To qualify for this program, the new window AC unit energy efficiency ratio (EER)
was required to exceed corresponding Nation Appliance Energy Conservation Act (NAECA) baseline standards by 10% or more. The baseline is assumed to be a new air conditioning unit
with an EER rating meeting current NAECA standards. In order for a customer to receive a $40 rebate per high-efficiency window AC unit, the installation of the new unit was required to be
installed by a certified third-party contractor and the customer was required to submit an invoice.
Summary of Program Results
This section includes a summary of program participation, demand and energy savings, and
program costs. Goals for 2013 included implementing 25 projects for a total savings of 2.5 kW and 3,029 kWh/yr. Goals were met and exceeded in 2013 with a total of 30 projects reported
with demand and energy savings of 3.3 kW and 3,748 kWh per year, respectively. Table 4-3
below compares goals to the total participation and claimed savings in the tracking database for PY 2013.
Table 4-3 Window AC PY 2013 Program Summary Results
Metric Participation
(projects)
Demand Savings
(kW)
Energy Savings
(kWh/yr)
OG&E Reported 30 3.3 3,748
OG&E Goal 25 2.5 3,029
Goal % 120% 132% 124%
Program Evaluation
The reported net energy and demand savings are based on deemed saving values provided in
Section 2.1.10 Window Air Conditioner Replacement of the Arkansas TRM 2.0. Applying TRM 2.0
deemed savings for this measure is consistent with EnerNOC’s proposed method for the Window AC PY 2012 evaluation; this included applying deemed savings per unit size and project climate
zone. Project locations or associated climate zones were not provided in the 2013 Window AC database. However, OG&E confirmed that all considered projects were implemented in Climate
Zone 8 (even though some of the projects’ reported savings were based on deemed savings of
other Arkansas climate zones: 6, 7, and 9). EnerNOC updated the gross savings estimates based on Climate Zone 8 deemed savings and corrected values that were entered incorrectly.
APSC FILED Time: 4/1/2014 12:29:49 PM: Recvd 4/1/2014 11:59:47 AM: Docket 07-075-tf-Doc. 229

EnerNOC Utility Solutions 21
Table 4-4 includes the 2013 impact results for the Window AC program and shows that the
reported savings were underestimated with demand and energy saving realization rates of 103%. The NTG ratio of 80% was applied to the gross savings. The reported savings values have a net
impact of 2.7 kW and 3,075 kWh per year.
Table 4-4 2013 Impact Results for Window AC
Savings
Gross Impacts
Net Impact Reported Evaluated
Realization Rate
Demand Savings (kW) 3.3 3.4 103% 2.7
Annual Energy (kWh) 3,748 3,844 103% 3,075
Student Energy Education The SEE is a turnkey program, with all activities managed directly by the provider, RAP. Nothing in the design or delivery of the program in PY 2013 changed from the previous year. So, our
findings about the program and its compliance with Arkansas guidelines are the same. For completeness, we largely repeat them here from the previous year’s evaluation report.
The tables, figures, and related text have all been updated to reflect results for the PY 2013
program. The key differences between this report and PY 2012 are:
The savings for PY 2013 have been calculated using TRM 3.0. The new TRM yields
notably different per-unit savings for faucet aerator and showerhead measures in the kit.
The savings have been calculated based on PY 2013 participant data. They incorporate
updated measure installation rates and water and space heating fuel shares of this year’s participants.
We were able to confirm that the faucet aerators included in the PY 2013 kit were the
more efficient 1.5 gpm model (which was not unequivocally confirmed in previous year).
Based on findings in a recently conducted study, these results include the embedded
savings associated with treatment of drinking water and wastewater for the faucet and
showerhead measures, in addition to savings by participants.
Program Description
The purpose of the Student Energy Education (SEE) program is to shape household behaviors about resource use and encourage reduced energy use through a combination of information
about resource efficiency and access to efficient products.
The program has been in operation since before this 2011-2013 program cycle. Under the program, 6th grade students in participating schools are each provided with a take-home kit
containing energy and water efficiency devices and are exposed to information about energy efficiency, both in the classroom and through materials in the kit.
SEE is operated as a turn-key program. Under contract to OG&E, Resource Action Programs
(RAP) implements its LivingWise® program by enrolling schools and furnishing the materials and training to teachers who then conduct the in-classroom lessons and provide the students with
take-home kits that contain several energy and water savings devices, along with additional
information about how to install the devices and save resources. The OG&E program manager and the RAP website confirm that the LivingWise® kits include: a low-flow showerhead, a CFL, a
kitchen faucet aerator, an LED nightlight, and other items designed to help families check for inefficiencies in their homes. Both the kits and the RAP website contain explicit instructions on
how to install each of the items.
APSC FILED Time: 4/1/2014 12:29:49 PM: Recvd 4/1/2014 11:59:47 AM: Docket 07-075-tf-Doc. 229

EnerNOC Utility Solutions 22
Figure 4-1 LivingWise® Kit
The Plan shows the participation goals for the three-year cycle. A participant is defined as a
student. Under the program, each participant is issued a kit with the above noted items. The savings the program expects to realize and that OG&E is claiming, derive from the installation of
three of the items in the kit: the low-flow showerhead, the CFL, and the kitchen faucet aerator.
Table 4-5 shows the participation and savings that OG&E anticipates the program will achieve annually during this program cycle.
Table 4-5 Student Education Energy Participation and Savings Projections
Program Year Annual Participants Annual Savings (kW) Annual Savings (kWh)
2011 1,240 students 10.3 102,516
2012 1,840 students 15.2 152,120
2013 1,840 students 15.2 152,120
Source: Oklahoma Gas & Electric’s 2011-2013 Arkansas Energy Efficiency Program Analysis and Plan, Table 7, p. 16.
Summary of Program Operations
As noted, the SEE is operated by the contracted implementer, RAP, as a turnkey program, under
the brand name LivingWise®. To meet the program objectives and savings goals, OG&E provides
RAP with a list of potential schools who have indicated a willingness to participate. RAP has the following responsibilities:
Conduct outreach and enroll schools
APSC FILED Time: 4/1/2014 12:29:49 PM: Recvd 4/1/2014 11:59:47 AM: Docket 07-075-tf-Doc. 229

EnerNOC Utility Solutions 23
The OG&E program manager said that RAP researches the number of eligible students/schools in
the area and allows teachers to enroll in many ways, i.e. via telephone, email, and website. RAP also mails letters to the schools and even call the schools each year. Teachers can also contact
RAP or OG&E to request inclusion of their classes in the program. In interviews with both the OG&E program manager and a RAP manager, we learned that RAP had no trouble enrolling
teachers into the program to meet the goal for number of kits distributed. That number of kits
distributed is strictly capped by the program budget. Both indicated that, once the quota is reached each year, RAP stops recruitment. Part of what makes it easy for RAP to meet the
participation goal is that they return to the same schools and teachers each year. According to the RAP annual report, teachers are pleased with the program 9, and are interested in
participating again. While not confirmed, the full enrollment readily achieved each year suggests it is possible that some interested teachers are turned away. It does appear that teacher interest
in the program is high and the program budget is the limitation to program participation.
One note about the participation limits. OG&E’s participation goal for PY 2013 was 1840 participants. As Table 4-6 shows RAP delivered and billed for a total of 2,050 kits. Of these, only
2,006 were for distribution to students. This means that 2% of kits paid for by the program were very likely not installed. As in past years, a substantial number of teachers participated in both
years and received kits both years. The cost of each kit to OG&E is $40. While the total cost of
the teacher kits is not especially large, it is unlikely that they result in any savings. Eliminating delivery of kits to teachers or having them reuse ones from previous year would allow the
program budget to add more participants. We recommend that, unless the contents of the kit have changed or the teacher no longer has his/her kit, RAP should not send a kit to repeat -
participant teachers each year.
Table 4-6 Distribution of Kits in PY 2013
Number of Kits Distributed Spring 2013 Fall 2013 Total
RAP delivered to classrooms 1,100 950 2,050
For teachers 28 16 44
For students 1,072 934 2,006
Develop and assemble all materials and deliver them to the participating classrooms
As indicated in the program description above, RAP has created a set of instructional materials
and measures for students to install at home. They also provide an educational curriculum for
the teachers to use. In a quick review of the student materials, we found that the installation instructions seem complete and easy to follow. The kits come with specialty tools to install and
measure the low-flow showerheads; the faucet aerator and CFL require common or no tools to install.
The information RAP has provided to OG&E in equipment spec sheets and in savings estimates in
the annual report now seems to match what is in the kits. All three of the measures have efficiency levels at or above the minimum required by TRM 3.0.
Provide support to participating teachers throughout the program
The RAP manager told us that the company is available to answer any questions from the
participating teachers. Teachers have a phone number to contact RAP. Teachers are encouraged to use the curriculum, distribute the kits to students, and then have them return a survey that
indicates what measures they installed at home. It does not appear that RAP initiates contact
9It is not clear how many teachers provided a program evaluation, but 100% of those who did said they would conduct the program again, given the chance. Reported in OG&E Arkansas LivingWise Program Summary Report 2012, prepared by Resource Action Programs, January 2013.
APSC FILED Time: 4/1/2014 12:29:49 PM: Recvd 4/1/2014 11:59:47 AM: Docket 07-075-tf-Doc. 229

EnerNOC Utility Solutions 24
with the teachers after delivery of the kits. RAP apparently does not confirm whether the kits are
distributed, the curriculum is taught, or the students are encouraged to install the measures. Based on the results and comments in the student surveys returned, it is evident that a very high
percentage of the teachers did do those things. But in PY 2013, as in previous years, some teachers had no students return surveys. We recommend that RAP include a question on the
teacher survey that explicitly asks whether the teacher taught the curriculum, distributed the
kits, and/or encouraged students install the measures.
Request return of audit forms and evaluations of the program from participants
As part of enrollment, RAP asks teachers to have students complete a survey about their installation of the measures and to complete a survey of their own satisfaction with the program.
As inducement, teachers whose students do return surveys are offered a nominal gift card for purchase of educational materials or supplies for their classrooms. In PY 2013, 1,168 of the
2,006 students who were provided kits returned completed surveys, a response rate of 58%.
Provide OG&E with an annual report of results, in time for inclusion in OG&E report to the APSC
According to the OG&E program manager, RAP provides OG&E with monthly reports on the number of kits delivered to classrooms. RAP provided a full-year summary and results of the
participant survey for use in this evaluation. RAP also provides OG&E with a complete report
after the program year is complete that shows the number of kits delivered, as well as their own estimates of savings associated with each of the measures.
Review of Program Tracking and Database
OG&E maintains a tracking system that shows the number of participants in the program each
year and recorded savings. With the exception of the expected electric savings, all the data are provided by RAP and transferred into the Saratoga tracking system by OG&E. According to the
OG&E program manager, RAP sends monthly electronic reports that show of the number of students enrolled and the number of kits shipped to schools. OG&E enters its own estimate of
per-participant savings, using the results from the most recent estimate of per-participant realized savings.
Use of Technical Reference Manual (TRM) Values
The TRM 3.0 provides algorithms for the estimation of savings for all three of the claimed
savings measures in the program. It also provides default values for all of the inputs in the algorithms. The IEM has advised the use of default values in cases where there is no reliable
data from participant sites.
EnerNOC was able to replicate the example results in the TRM for the faucet aerator, low-flow showerhead, and CFL measures, ensuring that we could properly apply them. We then used the
algorithms to estimate the savings in OG&E’s Arkansas service territory, using default input values for OG&E’s service territory in Arkansas (Ft. Smith) and program-specific data from
participants. The algorithms and resulting estimates in Table 4-7 represent savings per measure
installed. That is, they do not adjust for the installation rate of each measure or the relative share of participants’ homes with electric versus natural gas water heating.
Table 4-7 TRM-Calculated Savings by Measure, Per Unit Installed
Measure Annual kWh kW Annual Therms
Faucet Aerator 34.26 0.0036 1.47
Low-Flow Showerhead 137.20 0.0143 5.88
13-watt CFL 44.40 0.0070 --
APSC FILED Time: 4/1/2014 12:29:49 PM: Recvd 4/1/2014 11:59:47 AM: Docket 07-075-tf-Doc. 229

EnerNOC Utility Solutions 25
We show how the algorithms were applied in the results for each measure in the following
subsection.
To estimate the overall program savings and savings realized per participant, we followed
guidelines from the IEM regarding the use of as much reliable program-specific data as possible to inform the impact estimates. We used the following data from the participant surveys to
estimate the per-participant and total program savings by measure reported below:
Wattage of the lamp replaced by the CFL in the kit (in the per-unit savings above)
Installation rate of the measure (for aerator, showerhead, and CFL)
Share of electric versus natural gas water heating (for aerator and showerhead)
Share of electric versus natural gas space heating (for CFL interactive effects)
Program Year 2013 Results
Documentation for 2013 from OG&E shows that the implementer sent 2,050 kits to serve 2,006 students in 24 Arkansas schools. Using data provided by OG&E and the implementer, the TRM-
based per-unit measure energy savings estimates, and information from the participant surveys, we estimated total program savings for each of the measures in the PY 2013 program. These are
summarized in Table 4-8.
While OG&E does not provide natural gas to customers in Arkansas and has no goals for natural gas savings, 41% of the participants said they have gas water heat and realized significant
natural gas savings from installation of the aerator and showerhead measures. In Btu equivalents, the natural gas savings for those measures are as high as the electric savings. We
include those savings here as well.
The measures vary considerably in their contribution to the total savings. Low-flow showerheads and CFLs yield similar kWh energy but peak kW is notably higher for CFLs. The relative
contribution of each measure differs considerably from PY 2012. This is due to several factors, key among them: changes in the TRM allowances and changes in the participant installation
rates of the measures. Combining the savings from all measures for all participants, the average
savings per participant is 75.3 annual kWh, .01 kW, and 1.2 annual therms.
Table 4-8 SEE Realized Program Savings by Measure, Total and Per Participant
Annual kWh kW Annual Therms
Aerator 19,073 1.99 544
Showerhead 64,368 6.72 1,838
CFL 67,687 10.71 --
Total 151,128 19.41 2,382
Per Participant 75.3 0.010 1.2
In addition to the end-user savings, the values in the table above include water supply and wastewater treatment savings accrued to local water agencies due to reduced water usage from
faucet aerators and low-flow showerheads. Each gallon of water saved reduces the drinking water or wastewater utility’s energy requirements for functions such as collecting, treating,
storing, and transporting water/wastewater. We refer to these as embedded savings and apply them based on a recent report prepared for OG&E by EnerNOC.10
10 Parmenter, K., Ehrhard, R., Cook, G. and Williamson, C. Embedded Energy Savings from Water Saving Measures: Electricity Savings Due to Avoided Water Supply and Wastewater Treatment, Jan. 2014.
APSC FILED Time: 4/1/2014 12:29:49 PM: Recvd 4/1/2014 11:59:47 AM: Docket 07-075-tf-Doc. 229

EnerNOC Utility Solutions 26
The study involved interviewing local water and wastewater agencies to determine typical energy
intensity values for representative cities in Oklahoma and Arkansas and a literature review of energy intensity values as a function of water and wastewater plant characteristics to validate
interview findings. Based on the research, the project team determined energy and average demand savings per unit of avoided water as a function of location across the electric utility’s
service territory. The research revealed that water treatment in the part of Arkansas that OG&E
serves has lower energy intensity than other parts of the service territory. We used the lower Fort Smith, Arkansas per-gallon kWh and kW intensities rather than the regional averages,
resulting in a more conservative estimate of the embedded savings. Using the same TRM water reduction values as for the end-user savings, we calculated the following embedded energy
savings, which are reflected in the savings in Table 4-8.
Embedded Energy Savings
Annual water savings per unit installed Faucet aerator = 381 gal/yr Showerhead = 1457 gal/yr
Water & wastewater energy and demand savings 2.4 Watt-hr/gal 0.0003 Watt/gal
Total embedded energy and demand savings Units installed x gallons saved x savings/gal
Faucet aerators = 824 kWh, .09 kW Showerheads = 2,662 kWh, .30 kW
Faucet Aerators
The per-unit installed savings for faucet aerators were calculated using the following TRM 3.0
algorithm:
Deemed kWh or Therms = (rho x C (p) x V x (Tmixed - Tsupp) x 1/RE)/CF
where:
rho = Water density, 8.33 lbs./gal. (TRM default)
C (p) = Specific heat of water, 1 BTU/lb·°F (TRM default)
V = Gallons of water saved per year per faucet = 381, for aerator rated 1.5 gpm (TRM default)
Tmixed = Mixed water temperature at faucet (TRM default)
Tsupp = Average supply water temperature (TRM Water Main Temperature for Ft. Smith)
RE = Recovery Efficiency of water heater, excluding standby losses (TRM default)
CF = 3,412 BTU/kWh for electric water heating or 100,000 BTU/Therm for gas water heating
Table 4-9 Faucet Aerator Realized Savings
Realized Gross
Savings Per Unit Installed Per Participant Participant Total
Annual kWh 34.26 9.508 19,073
Peak kW 0.0036 0.00099 1.99
Annual Therms 1.48 0.271 544
APSC FILED Time: 4/1/2014 12:29:49 PM: Recvd 4/1/2014 11:59:47 AM: Docket 07-075-tf-Doc. 229

EnerNOC Utility Solutions 27
We calculated the per-participant and total savings using the TRM 3.0 algorithm and the
following information:
Each kit contained one faucet aerator.
The per-participant savings reflect adjustments to the per-unit installed savings we made
based on program-specific information from the PY 2013 participants. These include:
Aerator installation or in-service rate (ISR) = 45%
Water heat fuel shares = 59% electric and 41% natural gas
They also include drinking water and wastewater treatment savings accrued from the
reduced water use, as identified in report on embedded savings. 11
Energy intensity of treatment = 2,397 kWh and .27 kW per million gal. water
Embedded savings total from aerators = 824 kWh/yr and .09 peak kW
Treatment is electric and applies to all water used by installed units, regardless of
water heat fuel
Low-Flow Showerheads
The per-unit installed savings for low-flow showerheads were calculated using the following TRM
3.0 algorithm:
Deemed kWh or Therms = (rho x C(p) x V x (Tmixed - Tsupp) x 1/RE)/CF
where:
rho = Water density, 8.33 lbs./gal. (TRM default)
C(p) = Specific heat of water, 1 BTU/lb·°F (TRM default)
V = Gallons of water saved per year per showerhead
(showerhead in kit = 2.0 gpm; other inputs TRM default)
Tmixed=Mixed water temperature at showerhead (TRM default)
Tsupp = Average supply water temperature (TRM Water Main Temperature for Ft. Smith)
RE = Recovery Efficiency of water heater, excluding standby losses (TRM default)
CF = 3,412 BTU/kWh for electric water heating or 100,000 BTU/Therm for gas water heating
Table 4-10 Low-Flow Showerhead Realized Savings
Realized Gross Savings Per Unit Installed Per Participant Participant Total
Annual kWh 137.20 32.088 64,368
Peak kW 0.0143 0.00335 6.72
Annual Therms 5.88 .916 1,838
We calculated the per-participant and total savings using the TRM 3.0 algorithm and the
following information:
Each kit provided one low-flow showerhead.
The per-participant savings reflect adjustments to the per-unit installed savings we made
based on program-specific information from the PY 2013 participants. These include:
Low-flow showerhead installation or in-service rate (ISR) = 38%
11 "Embedded Energy Savings From Water Saving Measures: Electricity Savings Due to Avoided Water Supply and Wastewater
Treatment," prepared by EnerNOC for OG&E, January 21, 2014.
APSC FILED Time: 4/1/2014 12:29:49 PM: Recvd 4/1/2014 11:59:47 AM: Docket 07-075-tf-Doc. 229
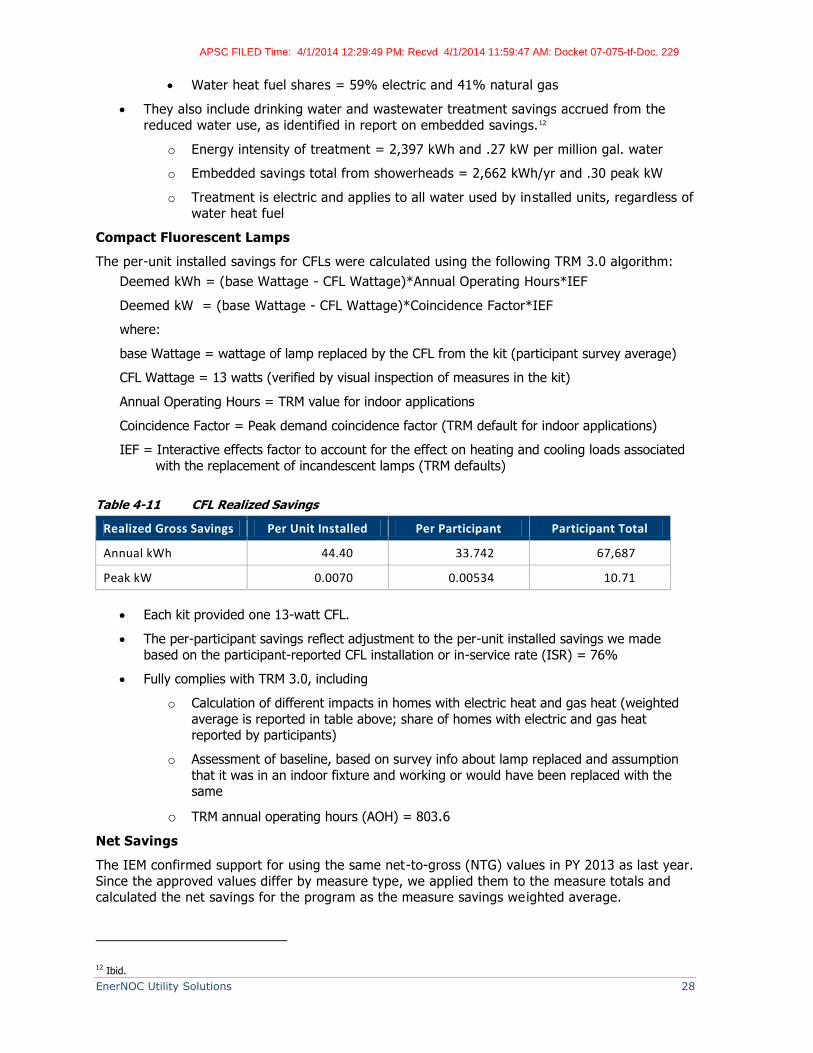
EnerNOC Utility Solutions 28
Water heat fuel shares = 59% electric and 41% natural gas
They also include drinking water and wastewater treatment savings accrued from the
reduced water use, as identified in report on embedded savings.12
o Energy intensity of treatment = 2,397 kWh and .27 kW per million gal. water
o Embedded savings total from showerheads = 2,662 kWh/yr and .30 peak kW
o Treatment is electric and applies to all water used by installed units, regardless of water heat fuel
Compact Fluorescent Lamps
The per-unit installed savings for CFLs were calculated using the following TRM 3.0 algorithm:
Deemed kWh = (base Wattage - CFL Wattage)*Annual Operating Hours*IEF
Deemed kW = (base Wattage - CFL Wattage)*Coincidence Factor*IEF
where:
base Wattage = wattage of lamp replaced by the CFL from the kit (participant survey average)
CFL Wattage = 13 watts (verified by visual inspection of measures in the kit)
Annual Operating Hours = TRM value for indoor applications
Coincidence Factor = Peak demand coincidence factor (TRM default for indoor applications)
IEF = Interactive effects factor to account for the effect on heating and cooling loads associated
with the replacement of incandescent lamps (TRM defaults)
Table 4-11 CFL Realized Savings
Realized Gross Savings Per Unit Installed Per Participant Participant Total
Annual kWh 44.40 33.742 67,687
Peak kW 0.0070 0.00534 10.71
Each kit provided one 13-watt CFL.
The per-participant savings reflect adjustment to the per-unit installed savings we made
based on the participant-reported CFL installation or in-service rate (ISR) = 76%
Fully complies with TRM 3.0, including
o Calculation of different impacts in homes with electric heat and gas heat (weighted
average is reported in table above; share of homes with electric and gas heat reported by participants)
o Assessment of baseline, based on survey info about lamp replaced and assumption
that it was in an indoor fixture and working or would have been replaced with the same
o TRM annual operating hours (AOH) = 803.6
Net Savings
The IEM confirmed support for using the same net-to-gross (NTG) values in PY 2013 as last year.
Since the approved values differ by measure type, we applied them to the measure totals and calculated the net savings for the program as the measure savings weighted average.
12 Ibid.
APSC FILED Time: 4/1/2014 12:29:49 PM: Recvd 4/1/2014 11:59:47 AM: Docket 07-075-tf-Doc. 229

EnerNOC Utility Solutions 29
Table 4-12 shows the effects of applying these NTG ratios to the Realized Gross Savings
estimates for each measure. The overall program net-to-gross ratio is 0.83.
Table 4-12 Student Education Energy Net Program Savings by Measure
Measure NTG Ratio Annual kWh kW
Faucet Aerator 1.0 19,073 1.99
Low-Flow Showerhead 1.0 64,368 6.72
13-watt CFL 0.63 42,643 6.75
Total 0.83 126,084 15.45
The final estimated impacts from the PY 2013 Student Energy Education Program are shown in
Table 4-13. While the program met or exceeded all of its goals, the realized savings are below the tracking system values. The lower than expected savings are due to a combination of lower
measure installation rates and changes in the TRM 3.0 calculations. Installation of aerators declined from 59% in PY 2012 to 45% in PY 2013, showerheads from 58% to 38%, and CFLs
from 81% to 76%.
Table 4-13 PY 2013 Student Education Energy Program Goals and Savings
Metric Goal
Reported (Gross)
Realized (Gross)
Realization Rate Net Savings
Participants 1,840 2,006 2,006 109% n/a
Energy kWh/year Demand kW
152,120 15
321,962 40
151,128 19
48% 47%
126,084 15
Recommendations
Check in with teachers during the participation period to ensure kit distribution and encourage installation of measures in kits, and ask teachers to note their activities.
We learned that no one tracks teacher activities or asks them to report on whether they
actually taught the curriculum, distributed the kits, or encouraged their use at home. At the end of the participation period, teachers are asked to rate their experience with the
program, but are not asked what steps they took. We recommend adding a simple
checklist of items to the teacher survey that allows them to report whether they taught the curriculum, distributed the kits, and/or encouraged students install the measures
The program could likely achieve higher measure installation rates if every teacher is pro -
active. Adding a checklist to the instructions and the teacher evaluation questionnaire could help assess and encourage teacher activity.
Eliminate sending duplicate kits to teachers who repeatedly enroll in the program.
Many teachers enroll in successive years. Since there is no evidence that teachers install
the measures in their kits, no savings are counted for them. But costs are incurred.
Teachers’ kits currently account for about 2% of annual kit cost invoice from RAP. The
program could be made more cost effective if excess kits were eliminated.
If more funds could be allocated to the SEE program, the program can multiply savings.
Not all Grade 6 students in OG&E’s service territory have access to kits. Teachers decide
whether to enroll. If they do, a kit is sent for every student (plus the teacher).
The implementer easily meets its participation quota each year and participation is
limited by program funding.
APSC FILED Time: 4/1/2014 12:29:49 PM: Recvd 4/1/2014 11:59:47 AM: Docket 07-075-tf-Doc. 229

EnerNOC Utility Solutions 30
CHAPTER 5
COMMERCIAL & INDUSTRIAL PROGRAMS
OG&E implemented three programs for C&I customers in PY 2013—Standard Offer, Commercial Tune-Up, and Commercial Lighting. This chapter describes the goals and OG&E reported savings,
as well as the evaluation of each program including realization rates for gross savings and net
savings achieved.
Standard Offer Program The Commercial & Industrial Standard Offer Program (SOP) offers financial incentives of $250/kW for the installation of a wide range of measures that reduce customer energy costs,
reduce peak demand, and/or save energy in non-residential facilities such as public authority buildings, schools, hospitals, and other industrial customers. Large individual customers, energy
service companies (ESCOs), and qualified contractors are all eligible to participate in the SOP.
The SOP provides incentives for many energy efficiency measures that are not covered under other OG&E programs. The Commercial & Industrial SOP PY 2013 custom projects included three
high-efficiency measures: chillers, HVAC, and motors.
In addition, OG&E used some of the funds for this program to engage CLEAResult to install p re-
rinse spray valves, CFLs, and faucet aerators under this program. Unit costs for the measures installed through CLEAResult were as follows:
Pre-rinse spray valves $140/unit
CFLs $4/unit
Faucet aerators $13/unit
Table 5-1 includes the breakdown of total projects by measure. Most of the custom projects (61%) consisted of motor retrofits, whereas most of the direct installation projects involved
faucet aerators (58%) and CFLs (42%).
Table 5-1 Standard Offer PY 2013 Program Projects by Type Measure
Type of Project Measure Participation
Custom (projects) Chillers 1
HVAC 11
Motors 19
Direct Installation (units) Pre-rinse spray valves 20
CFLs 1,014
Faucet aerators 1,404
Total 2,469
Summary of Program Results
This section includes a summary of program participation, demand and energy savings, and
program costs for the SOP projects. Goals for 2013 included implementing 984 projects for a
total savings of 2,452 kW and 8,972,138 kWh per year. A total of 2,469 projects were reported implemented with gross demand and energy savings of 590 kW and 2,691,590 kWh per year,
respectively.
APSC FILED Time: 4/1/2014 12:29:49 PM: Recvd 4/1/2014 11:59:47 AM: Docket 07-075-tf-Doc. 229

EnerNOC Utility Solutions 31
In Table 5-2 actual participation and savings are compared to program goals; savings are
compared at the gross level.
Table 5-2 PY 2013 SOP Comparison of Goals to Reported Savings
Metric Measure Participation Demand Savings
(kW)
Energy Savings
(kWh/yr)
OG&E Reported Custom (projects) 31 155 994,173
Pre-rinse spray valves 20 24 180,752
CFLs 1,014 32 193,795
Faucet Aerators 1,404 379 1,322,870
Total 2,469 590 2,691,590
Goal Custom (projects) 18
Pre-rinse spray valves 20
CFLs 473
Faucet Aerators 473
Total 984 2,452 8,972,138
Goal % 251% 24% 30%
Program Evaluation
Custom Projects
OG&E provided EnerNOC with both SOP HVAC and Chiller TRM 2.0 Excel-based calculators to be
reviewed. OG&E used the TRM 2.0 as the database was not able to be updated in time to report results using TRM 3.0. As a result of the review, EnerNOC recommended OG&E remove some
descriptors that were not referenced and to update a formula that contained an error. The
calculators assume that the HVAC and chiller units are sized correctly and use full -load TRM algorithms. EnerNOC collected the motor calculation algorithms and found that the final
submitted savings summary report had entries entered correctly. However, the motor measures algorithms (that were not based on full-load analysis strategies) did not include load factors. It is
assumed that motor’s operation is not weather dependent and the evaluated energy and demand savings consider load factors of 0.75.
Direct Installation
Given the budget constraints, EnerNOC did not conduct an evaluation of the direct installation results for the SOP program. The evaluation of results for the same program implemented by
CLEAResult for another Arkansas utility showed that realization rates were 100%; EnerNOC used these findings for the OG&E program for PY 2013.
In addition EnerNOC included an estimate of embedded energy savings for measures that
decreased water use—faucet aerators and pre-rinse spray valves. The first step was to calculate the water savings for each measure for each sector using TRM 2.0 or TRM 3.0 as a source. The
CLEAResult database included the efficiency level for each new measure which enabled the calculation of water savings in gallons per minute for each sector.
The next step was to apply the energy saved through reduced water use as discussed in Chapter
4 section for the Student Energy Education Program. Water and wastewater energy and demand savings in the part of Arkansas served by OG&E are 2.4 Watts-hr/gal and 0.0003 Watts/gal,
respectively.
APSC FILED Time: 4/1/2014 12:29:49 PM: Recvd 4/1/2014 11:59:47 AM: Docket 07-075-tf-Doc. 229

EnerNOC Utility Solutions 32
Water saved (gal/year) = (Baselinegpm - Replacedgpm-) * water use (min/day) * days/year * # of measures installed
Demand reduced (kW) = (0.0003 Watts/gal * Water saved (gal/year)) / 1,000
Energy saved (kWh) = (2.4 Watts-hr/gal * Water saved (gal/year)) / 1,000
Faucet Aerators
As shown in Table 5-3 below faucet aerators reduced water use by 14,197,601 gallons per year, reducing demand by an additional 4 kW and saving an additional 34,074 kWh per year in energy.
Table 5-3 Calculations of Embedded Energy Savings for Commercial Faucet Aerators
Sector Water Use
(min/day)13
# of Measures Installed
Water Saved
(gal/min)
Water Saved
(gal/min)
Days Per Year13
Water Saved
(gal/year)
Hospital 30 35 55.5 1,665 365 607,725
Lodging 3 152 242.9 729 365 265,976
Commercial 30 660 1059 31,770 250 7,942,500
School 30 557 896.9 26,907 200 5,381,400
Total 1,404 2,254.3 61,071 14,197,601
Demand Savings (kW) = (0.0003 Watts * 14,197,601) = 4 kW
Energy Savings (kWh) = (2.4 Watts-hr/gal * 14,191,601) = 34,074 kWh
Pre-Rinse Spray Valves
As shown in Table 5-4 below pre-rinse spray valves reduced water use by 499,200 gallons per year, reducing demand by an additional 0.15 kW and saving an additional 1,198 kWh per year in energy.
Table 5-4 Calculations of Embedded Energy Savings for Pre-Rinse Spray Valves
Sector Water Use
(min/day)14
# of Measures Installed
Water Saved
(gal/min)
Water Saved
(gal/min)
Days Per Year14
Water Saved
(gal/year)
Fast Food Restaurant 45 4 3 135 365 49,275
Casual Dining 105 9 7 735 365 268,275
Institutional 210 1 1 210 365 76,650
K-12 School 105 6 5 525 200 105,000
Total 20 16 1605 499,200
Demand Savings (kW) = (0.0003 Watts * 499,200) = 0.15 kW
Energy Savings (kWh) = (2.4 Watts-hr/gal * 499,200 = 1,198 kWh
13 TRM 3.0 3.3.2 Table 220 Parameters for Annual Energy and Peak Demand Savings Calculations 14 TRM 3.0 3.8.9 Table 310 Variables for the Deemed Savings Algorithm
APSC FILED Time: 4/1/2014 12:29:49 PM: Recvd 4/1/2014 11:59:47 AM: Docket 07-075-tf-Doc. 229
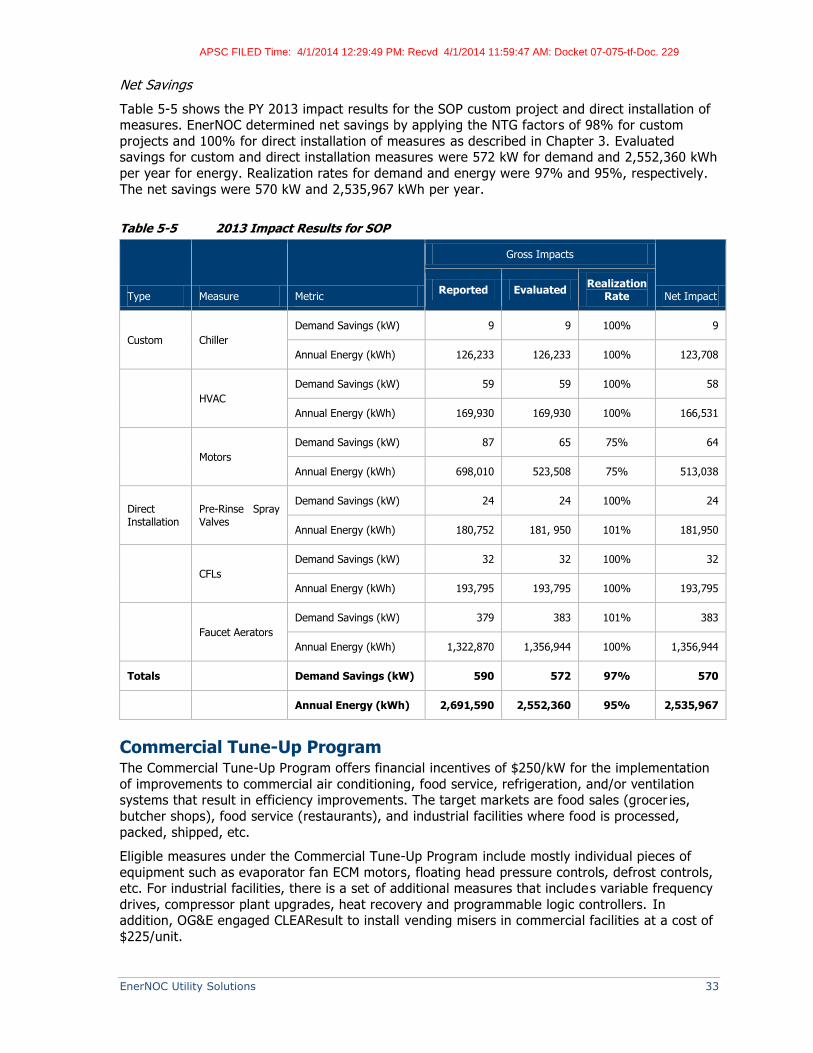
EnerNOC Utility Solutions 33
Net Savings
Table 5-5 shows the PY 2013 impact results for the SOP custom project and direct installation of measures. EnerNOC determined net savings by applying the NTG factors of 98% for custom
projects and 100% for direct installation of measures as described in Chapter 3. Evaluated savings for custom and direct installation measures were 572 kW for demand and 2,552,360 kWh
per year for energy. Realization rates for demand and energy were 97% and 95%, respectively.
The net savings were 570 kW and 2,535,967 kWh per year.
Table 5-5 2013 Impact Results for SOP
Type Measure Metric
Gross Impacts
Net Impact Reported Evaluated
Realization Rate
Custom Chiller
Demand Savings (kW) 9 9 100% 9
Annual Energy (kWh) 126,233 126,233 100% 123,708
HVAC
Demand Savings (kW) 59 59 100% 58
Annual Energy (kWh) 169,930 169,930 100% 166,531
Motors
Demand Savings (kW) 87 65 75% 64
Annual Energy (kWh) 698,010 523,508 75% 513,038
Direct Installation
Pre-Rinse Spray Valves
Demand Savings (kW) 24 24 100% 24
Annual Energy (kWh) 180,752 181, 950 101% 181,950
CFLs
Demand Savings (kW) 32 32 100% 32
Annual Energy (kWh) 193,795 193,795 100% 193,795
Faucet Aerators
Demand Savings (kW) 379 383 101% 383
Annual Energy (kWh) 1,322,870 1,356,944 100% 1,356,944
Totals Demand Savings (kW) 590 572 97% 570
Annual Energy (kWh) 2,691,590 2,552,360 95% 2,535,967
Commercial Tune-Up Program The Commercial Tune-Up Program offers financial incentives of $250/kW for the implementation
of improvements to commercial air conditioning, food service, refrigeration, and/or ventilation systems that result in efficiency improvements. The target markets are food sales (grocer ies,
butcher shops), food service (restaurants), and industrial facilities where food is processed,
packed, shipped, etc.
Eligible measures under the Commercial Tune-Up Program include mostly individual pieces of
equipment such as evaporator fan ECM motors, floating head pressure controls, defrost controls, etc. For industrial facilities, there is a set of additional measures that includes variable frequency
drives, compressor plant upgrades, heat recovery and programmable logic controllers. In addition, OG&E engaged CLEAResult to install vending misers in commercial facilities at a cost of
$225/unit.
APSC FILED Time: 4/1/2014 12:29:49 PM: Recvd 4/1/2014 11:59:47 AM: Docket 07-075-tf-Doc. 229

EnerNOC Utility Solutions 34
Summary of Program Results
This section includes a summary of program participation, gross demand and energy savings,
and program costs. Goals for 2013 were provided by OG&E and included implementing 10 custom projects and installation of 473 vending misers for a total gross savings of 140 kW and
949,961 kWh per year. OG&E reported that nine custom projects were implemented and 150
vending misers were installed resulting demand and energy savings of 37 kW and 359,174 kWh per year, respectively.
As shown in Table 5-6 below participation was 33% of expected with reported demand savings achieving 26% of the goal and energy savings achieving 38% of goals.
Table 5-6 CTU PY 2013 Program: OG&E Reported Savings and Gross Savings Goals
Metric Measure Participation
(projects)
Demand Savings
(kW)
Energy Savings
(kWh/yr)
OG&E Reported Custom 9 37 117,374
Vending Misers 150 0 241,800
Total 159 37 359,174
OG&E Goal Custom 10 140 949,961
Vending Misers 473 n/a n/a
Total 483 140 949,961
Goal % 33% 26% 38%
Program Evaluation
Custom Projects
EnerNOC spot checked a few entries and found that the entered projects’ information matched with data in the provided calculators, invoices and photographs of the pre- and post-case units.
Vending Misers
EnerNOC applied the TRM 3.0 deemed savings values for vending misers of 0.03 kW and 1,612 kWh per year to the reported participation (Section 3.7.4). The database used 0.0 kW for
vending misers but applied the correct values for energy savings.
Net Savings
As discussed in Chapter 3, EnerNOC applied the NTG value of 98% to both energy and demand
savings for custom projects and 100% to the direct installation of vending misers . Table 5-7 includes the OG&E reported results compared to the EnerNOC evaluated results and the
realization rates for gross savings of 114% for demand savings and 100% for energy savings. Net savings for the CTU program were 41 kW and 356,827 kWh per year.
APSC FILED Time: 4/1/2014 12:29:49 PM: Recvd 4/1/2014 11:59:47 AM: Docket 07-075-tf-Doc. 229

EnerNOC Utility Solutions 35
Table 5-7 Reported, Gross and Net Savings for CTU Projects in PY 2013
Savings Measure
Gross Impacts
Net Impact Reported Evaluated
Realization Rate
Demand Savings (kW) Custom 37 36 100% 36
Vending Miser 0 5 n/a 5
Total 37 41 114% 41
Energy (kWh/year) Custom 117,374 117,374 75% 115,027
Vending Miser 241,800 241,800 100% 241,800
Total 359,174 359,174 100% 356,827
Commercial Lighting Program
The Commercial Lighting program provides incentives to Arkansas commercial and industrial
(C&I) customers who purchase and install energy efficient indoor and outdoor lighting, lighting
controls, light emitting diode (LED) exit lights in both retrofit and new construction applications. Incentive levels for the measures are shown below.
Replace T12 with T8 or T5 Lamps (4 foot fixtures only)
o $4/fixture for one- or two-lamp fixtures
o $8/fixture for three- or four-lamp fixtures
o Other fixtures rebated at 16 cents per Watt of reduced demand
Replace HID fixtures with High-Efficiency Fluorescent Fixtures
o $52 per 400 Watt HID Fixture Replaced
o $102 per >750 Watt HID Fixture Replaced
Replace Inefficient Incandescent Lamps with Hard-wired Compact Fluorescent Lamps
o $8 per Fluorescent Fixture of 26 Watts or Less
o $11 per Fluorescent Fixture of Greater than 26 Watts
Replace Inefficient Incandescent Exit Fixtures with Energy Efficient LED Fixtures
o $5 per LED Fixture
Lighting, Sensors or Controls Not Specified
o $160 per kW of Reduced Peak Demand
The incentives are based on the kW and kWh savings calculated from a lighting survey that takes
into account the type and quantity of lighting fixtures replaced, the new fixtures installed, the building type, and any control technologies in place.
Most of the projects (91%) consisted of high-efficiency fluorescent lighting with a total of 103 projects, followed by LED lighting with 58 total projects. Table 5-8 below includes a summary of
all the commercial lighting projects reported in 2013, with associated demand and energy
savings.
Figure 5-1 shows the breakdown of demand savings reported by measure with T5 & T8 measures
providing 75% of OG&E’s reported savings, followed by LEDs with 14% of savings. Energy savings show the same pattern.
APSC FILED Time: 4/1/2014 12:29:49 PM: Recvd 4/1/2014 11:59:47 AM: Docket 07-075-tf-Doc. 229

EnerNOC Utility Solutions 36
Table 5-8 2013 Commercial Lighting Measure Descriptions and Total Projects Reported
Category Lighting Measure Participation
(projects)
Demand Savings
(kW)
Energy Savings
(kWh/yr)
Other HID 4 8.24 29,121
New Construction 7 65.20 343,379
Hardwired CFL 6 1.29 12,882
Unknown 2 2.63 9,466
Parking lot Lighting 1 29.00 117,266
Controls Controls 5 45.40 444,487
T8 & T5 High Bay T8 & T5 32 347.82 2,656,298
T8 & T5 71 461.36 2,453,796
LED LED 58 115.58 989,430
TOTAL
186 1,077 7,056,125
Figure 5-1 Breakdown of OG&E-Reported Lighting Demand (kW) Savings by Measure
Summary of Program Results
This section includes a summary of program participation, net demand and energy savings, and
program costs. Goals for 2013 included implementing 215 projects for a total gross savings of 2,844 kW and 11,262,681 kWh per year. OG&E implemented 186 projects and achieved demand
and energy savings of 1,077 kW and 7,056,125 kWh per year, respectively. Participation was
Controls, 45
Other, 106
LED, 116 T5&T8, 809
APSC FILED Time: 4/1/2014 12:29:49 PM: Recvd 4/1/2014 11:59:47 AM: Docket 07-075-tf-Doc. 229

EnerNOC Utility Solutions 37
87% of the goal however demand savings were only 38% of the goal and energy savings 63% of
the goal.
Table 5-9 below shows the total participation and claimed savings from the OG&E Saratoga
database for the first four months and from DirectOptions Commercial Lighting Program tracking database for the remainder of PY 2013.
Table 5-9 Commercial Lighting PY 2013 Program: Participation and Claimed Savings
Metric
Participation
(projects)
Demand Savings
(kW)
Energy Savings
(kWh/yr)
Actual 186 1,077 7,056,125
Goal 215 2,844 11,262,681
Goal % 87% 38% 63%
Program Evaluation
The lighting projects were entered by OG&E in a web-based tool at www.ogelighting.com. DirectOptions supports this website and was able to provide up-to-date dataset for the 2013
Commercial Lighting program. Entered projects included information about pre- and post-cases and most entered projects were accompanied by invoices and/or pre- and post-case photographs.
EnerNOC spot checked a few entries and found that most of the reported savings were accurate. Because not all the projects could be evaluated due to the low budget and because the spot checks
that were performed found that the entered savings were mostly accurate, EnerNOC applied the PY
2012 Commercial Lighting program demand and energy realization rates of 99.6% and 99.8%, respectively to the gross savings achieved in PY 2013.
Table 5-10 includes the PY 2013 impact results for the Commercial Lighting program. EnerNOC
applied the NTG ratio of 90% (from Chapter 3) to the gross savings resulting in net impacts of 967
kW and 6,325,111 kWh per year.
Table 5-10 PY 2013 Impact Results for Commercial Lighting
Savings
Gross Impacts
Net Impact Reported
Realization Rate (PY 2012)
Evaluated
Demand Savings (kW) 1,077 99.8% 1,075 967
Annual Energy (kWh) 7,056,125 99.6% 7,027,901 6,325,111
APSC FILED Time: 4/1/2014 12:29:49 PM: Recvd 4/1/2014 11:59:47 AM: Docket 07-075-tf-Doc. 229

EnerNOC Utility Solutions 38
CHAPTER 6
PROCESS EVALUATION AND RESPONSE TO PY 2102 RECOMMENDATIONS
Process Evaluation
Interviews with Program Managers
The following are the key points from the in-depth interview with program managers.
HVAC tune up program – customers are interested; contractors are not. OG&E is reaching the target market but not overcoming barriers to participation. Contractors are not offering 1
lb of free refrigerant charge, so customers are not having this done. Also a lot of customers already had the correct refrigerant charge. Contractors are not interested in sealing plenums,
even with the rebate. Since contractors were not interested in doing the duct sealing and
repair, OG&E used program funds to have the measures installed as part of the Weatherization program but counted the savings achieved under this program.
Window AC - increased awareness and product availability. The program, which is offered to
allow customers without central air-conditioning to participate in DSM offerings, has exceeded its goal of 25 participants.
Student Energy Education – participation goals easily met but no tracking of what teachers do with the curriculum or kits. Every aspect of the program, from recruitment through reporting of installations, is left in the hands of the implementer. The OG&E project manager
has no contact with the teachers who enroll in the program and does not ask the
implementer to check in with teachers regarding whether they teach the curriculum, distribute the kits, or encourage students to install the measures.
SOP/CTU – difficult to overcome barriers to participation. The TRM promotes the use of
efficient equipment but efficient equipment is not stocked. Incentives are too low to overcome financial concerns, especially for industrial projects. Sometimes too much time is
spent chasing down small opportunities. Both mechanical and HVAC contractors work with
the participants.
Direct Installation – CLEAResult achieving success with several measures. In 2013, OG&E
transferred money from the SOP and CTU programs to engage ClearResult to implement
vending misers, pre-rinse spray valves, and faucet aerators with C&I customers. This began in June. In mid-August, OG&E extended the contract to include CFL installation; ClearResult
identified this opportunity.
Commercial Lighting – the improved economy has increased participation. Participation has
been increasing steadily since May. Companies are starting to release capital funds and lighting upgrades are seen as providing instant savings.
Refer to Appendix A for a copy of the interview guide used for the program managers.
Adherence to Protocol A
The tracking systems for each of the databases conform reasonably well to the tracking system protocol developed for use in Arkansas.
Table 6-1 shows a summary of how well the residential program tracking systems meets the components of the protocol and Table 6-2 shows the same information for the C&I programs.
APSC FILED Time: 4/1/2014 12:29:49 PM: Recvd 4/1/2014 11:59:47 AM: Docket 07-075-tf-Doc. 229

EnerNOC Utility Solutions 39
Table 6-1 Adherence to Protocol A: Residential Programs
Student Energy Education
Participating Customer Information - not provided for individual participants; only for teachers.
Customer milestone tracked is the date kits are shipped.
Measure Specific Information - not applicable as all kits the same and info provided by implementer on
spec sheets. Estimated savings are included as well as equipment useful life. Kits are provided by OG&E at
no cost to participants. Reported measure type of equipment replaced is tracked by participant surveys from
implementer.
Measure Codes - individual measures not identified; all kits provided to participants are supposed to be the
same.
Vendor Specific Information - n/a—measures self installed
Program Tracking Information - date of the initial program contact provided. Rebate information n/a;
provided @ no cost to participants
Marketing and Outreach Activities - RAP conducts a well-established pattern of outreach activities.
It is not known whether OG&E keeps records of how many outreach letters the staff sends each year or
to whom. RAP handles all other marketing.
Residential Tune-up & Duct Repair
Participating Customer Information - includes customer identifier (account number) and customer
contact information. Date/s of services provided is major customer milestone recorded.
Measure Specific Information – includes equipment type serviced, equipment fuel source, size (tons),
and quantity as well as estimated savings. Identifies actions taken, e.g. plenum sealed. There is no
equipment involved so information n/a for efficiency level, equipment useful life, and incremental measure
cost, etc.
Measure Codes - not implemented; costs to change the database to include measure number and measure
code would be relatively high compared to benefits. Need data dictionary for existing database fields.
Vendor Specific Information - contractor contact information collected on application forms; contractor
type is always HVAC.
Program Tracking Information - includes amount of incentive paid to contractor and date measures
implemented; application status is n/a.
Marketing and Outreach Activities – reaching the target market but not overcoming barriers to
participation by the contractors.
Window AC Replacement
Participating Customer Information - includes customer identifier (account number and name) but not
contact information. Date of purchase is tracked.
Measure Specific Information - includes window A/C model #, size, quantity and efficiency level, as well
as estimated savings.
Measure Codes - not implemented; costs to change the database to include measure number and measure
code would be relatively high compared to benefits. Need data dictionary for existing database fields.
Vendor Specific Information - contractor information n/a; collect cost and efficiency level of windows
purchased.
Program Tracking Information - tracks date and amount of incentive paid.
Marketing and Outreach Activities - increased public awareness with local outreach to large stores and
in-store signage.
APSC FILED Time: 4/1/2014 12:29:49 PM: Recvd 4/1/2014 11:59:47 AM: Docket 07-075-tf-Doc. 229

EnerNOC Utility Solutions 40
Table 6-2 Adherence to Protocol A: C&I Programs
Standard Offer
Participating Customer Information - includes customer identifier (account number), location of building
site, date completed and date rebate paid, but not customer contact information.
Measure Specific Information – includes new equipment type and description but not size, quantity or
efficiency level; includes estimated savings, hours of operation, and some information on replaced equipment.
Measure Codes – n/a; description fields could be used for a measure description such as motors, chiller,
HVAC, etc. Need data dictionary for existing database fields.
Vendor Specific Information – n/a.
Program Tracking Information – includes date of installation and date rebate paid as well as amount of
rebate; application status is not included.
Marketing and Outreach Activities – working on influencing the engineering community to work in the
market; CLEAResult is conducting cold calls for direct installation measures; at least 4 mails-outs this year.
Commercial Tune-up
Participating Customer Information - includes customer identifier (account number), description of project,
and date completed, but not customer contact information.
Measure Specific Information – includes new equipment type and description but not size, quantity or
efficiency level; includes estimated savings and some information on replaced equipment.
Measure Codes – n/a; need data dictionary for existing database fields.
Vendor Specific Information – n/a.
Program Tracking Information – includes date rebate paid and amount of rebate; date of installation and
application status not included.
Marketing and Outreach Activities – working on influencing the engineering community to work in the
market; CLEAResult is conducting cold calls for vending miser measure; at least 4 mails-outs this year.
Commercial Lighting (Direct Options Database)
Participating Customer Information – contains all information collected from the online application
including customer identifier (account number), and customer contact information. Also includes milestone
dates in terms of application, installation, approval, rebate sent.
Measure Specific Information – collects type of equipment (and measure name), quantity, existing and new
wattage, hours of operation, and estimated savings. Some other information on replaced equipment is available
but not consistently.
Measure Codes – all data is captured such that it can be used in reports; database’s supporting materials
should be developed and/or enhanced to include a data dictionary.
Vendor Specific Information - contractor information included on application such as contact name and
phone number; could collect type of contractor (equipment or installation) on online application.
Program Tracking Information - tracks dates of program contacts (application, approval, rebate sent, etc.),
amount of incentive, and application status.
Marketing and Outreach Activities - OG&E has done extensive marketing over the years and with the
improving economy customers are implementing projects that have been in the pipeline.
APSC FILED Time: 4/1/2014 12:29:49 PM: Recvd 4/1/2014 11:59:47 AM: Docket 07-075-tf-Doc. 229

EnerNOC Utility Solutions 41
Tracking System Issues
Provided goals needed to be reviewed by OG&E again and updated
Values in Saratoga are hard coded and some values are rounded in spreadsheets provided to
EnerNOC, e.g. EERs of 12 instead of 11.5
Confusion about what parameters are needed/available to verify calculations and adherence to
TRM, e.g. needed climate zone information per project for Window AC program calculations
Missing data or values, e.g. Residential HVAC Tune-up HVAC projects not entered in database
and one of the measure descriptions for an SOP project was ‘????’
Incorrect data for Window AC, and for Residential Tune-Up and Duct Repair some project entries
were somewhat convoluted and led to issues such as separate projects grouped together,
rounding issues, and project lines duplicated 2 to 3 times
Some difficulty in getting information on the calculations underlying the savings values and the
correct savings summary reports for custom projects under SOP and CTU
Conflicting datasets, e.g. the initial summary savings reports from Saratoga for Commercial
Lighting contained errors (i.e. energy savings summations were incorrect) and all files contained
overlapping projects.
Multiple data sources with values that did not always match, e.g. program manager tracking
sheets and Saratoga
Information not kept up to date in Saratoga for all programs
Response to PY 2012 Recommendations This section describes the recommendations from the PY 2012 evaluation report and OG&E
response to each recommendation.
General
Recommendation: Develop a naming convention for project files that is consistent with the customer account or project ID number so that individual files can be readily located and to
simplify tracking of program documentation. (Residential HVAC Tune-Up Program, Window AC Program, Commercial Lighting Program, Standard Offer).
Response: OG&E implemented a “Check ID” unique number to identify Commercial Lighting “Projects” in OK and AR. In 2014 the Check ID will be used to count
projects as opposed to counting customers.
Residential HVAC Tune-Up Program
Recommendation: Repeat the DSE study with an appropriate sample to determine the percentage improvement in DSE in Arkansas.
Response: Undertaken and completed.
Recommendation: Conduct a NTG study to more accurately determine NTG.
Response: Undertaken and completed.
APSC FILED Time: 4/1/2014 12:29:49 PM: Recvd 4/1/2014 11:59:47 AM: Docket 07-075-tf-Doc. 229

EnerNOC Utility Solutions 42
Student Energy Education
Recommendation: Include more efficient measure models in kits and review actual kit contents regularly.
Response: OG&E sent a copy of the kit to EnerNOC to review contents and is currently
considering options for new or additional measures for kits in 2014.
Recommendation: Document savings in OG&E tracking system.
Response: Not completed.
Recommendation: Consider allocating more funds to the program to increase participation and savings.
Response: OG&E had been considering dropping the program but based on the savings achieved decided to keep offering it in the schools. In PY 2013, participation
exceeded the goal.
None of the following recommendations have been implemented.
Check in with teachers during the participation period to ensure kit distribution and
encourage installation of measures in kits, and ask teachers to note their activities. This
was not done because it would increase the cost of the program.
Reduce program costs that don’t contribute to savings. Eliminate or reuse teachers’ kits
which currently account for average 2% of annual kit cost invoice from RAP.
Have the implementer stop reporting energy savings in its annual report since they are
not based on TRM algorithms.
Modify the student survey to get information about free riders. The implementer uses a
standard battery of questions and changing it would increase the cost of the program.
C&I Programs - General
Recommendation: Increase or improve the marketing and advertising of the C&I programs.
Response: OG&E contracted with CLEAResult for PY 2013 for Direct Installation of
measures and to provide additional marketing and advertising for C&I programs.
Recommendation: Conduct research with contractors in the area.
Response: The OG&E program manager met one-on-one with contractors and attended
local events such as the Fort Smith HVACR Association Chapter meetings for input on program ideas.
Recommendation: Research the target market to find current market share of high efficiency equipment.
Response: Arkansas will be conducting a potential study which should provide this information.
APSC FILED Time: 4/1/2014 12:29:49 PM: Recvd 4/1/2014 11:59:47 AM: Docket 07-075-tf-Doc. 229

EnerNOC Utility Solutions 43
Commercial Lighting Program
Recommendation: Calculate kW and kWh savings for future projects consistent with the most relevant TRM.
Response: Compliant with TRM 2.0 for PY 2013 projects and with TRM 3.0 for PY 2014
projects.
Recommendation: Make Commercial Lighting Rebate Submission Forms and other project documentation available to program evaluators for all projects.
Response: All supporting documents are uploaded on the Lighting website.
Standard Offer Program
Recommendation: Calculate kW and kWh savings for future projects based on the appropriate
TRM.
Response: TRM 2.0 in 2013 HVAC-Chiller calculator and TRM 3.0 in 2014 calculator.
Recommendation: Ensure that HVAC units installed meet minimum federal standards listed in the TRM.
Response: This has been checked by the OG&E program manager for each project.
Commercial Tune-Up Program
Recommendation: Calculate kW and kWh savings for future projects based on the appropriate
TRM.
Response: Completed.
Recommendation: Ensure that HVAC units installed as part of the program meet the minimum efficiency levels prescribed in the TRM.
Response: This has been checked by the OG&E program manager for each project.
Recommendation: Clearly label Rebate Submission Forms for the Commercial Tune-Up program
so as not to confuse them with Rebate Submission Forms for the Standard Offer Program.
Response: Completed.
APSC FILED Time: 4/1/2014 12:29:49 PM: Recvd 4/1/2014 11:59:47 AM: Docket 07-075-tf-Doc. 229

EnerNOC Utility Solutions 44
CHAPTER 7
FINDINGS AND RECOMMENDATIONS
PY 2013 Program Impacts This section presents the program impacts for each program for PY 2013. As shown in Table 8-1, OG&E reported 1,820 kW of demand reduced and 10,615 MWh in annual energy savings from the six programs evaluated. Overall, the EnerNOC-adjusted savings realization rates were 102% for demand
and 99% for energy. Net savings were calculated by using the values outlined in Chapter 3. OG&E achieved 1,726 kW of net savings for demand and 9,701 MWh of annual energy savings.
Table 8-1 PY 2012 Results by Program (Reported, Adjusted, Net Savings)
Program
Demand (kW) Annual Energy (MWh)
OG&E Reported
EnerNOC-adjusted
Net Savings
OG&E Reported
EnerNOC-adjusted
Net Savings
HVAC Tune-Up/Duct Repair 73 144 130 183 393 354
Window Unit A/C 3 3 3 4 4 3
Student Energy Education 40 19 15 322 151 126
C&I Standard Offer 590 572 570 2,692 2,552 2,536
Commercial Tune-Up 37 42 41 359 359 357
Commercial Lighting 1,077 1,075 967 7,056 7,028 6,325
Totals 1,820 1,855 1,726 10,615 10,488 9,701
Key Findings
Greater than expected participation and savings in the residential programs. Participation in all three residential programs was higher than OG&E had anticipated in the
program plans. The PY 2013 residential programs achieved evaluated gross savings 166 peak kW and 548 annual MWh with realization rates of 143% and 108% and net savings of 148 kW and
483 annual MWh. With these results, OG&E achieved 88% of net program goals for demand
savings and exceeded energy savings goals by 137%.
Greater than expected participation in the C&I programs overall but savings were
much lower than goals. Participation in C&I Standard Offer was much higher than expected due the direct installation of measures; the other programs fell short of participation goals. The
PY 2013 C&I programs achieved evaluated gross savings of 1,689 peak kW and 9,939 annual
MWh with realization rates of 99% and 98% and net savings of 1,578 kW and 9,218 annual MWh. With these results, OG&E achieved 36% of net program goals for demand savings and
54% of net goals for energy savings.
Most savings are from commercial lighting and direct installation of measures. Most of
the savings were from commercial lighting, primarily T5 and T8 fixtures but also a lot of savings were from LED lighting. Standard Offer resulted in the next highest level of savings but mainly
from the direct installation of vending misers. As reported by the program manager, custom
projects under SOP and CTU did not provide savings expected due to problems with level of
APSC FILED Time: 4/1/2014 12:29:49 PM: Recvd 4/1/2014 11:59:47 AM: Docket 07-075-tf-Doc. 229

EnerNOC Utility Solutions 45
incentives provided and availability of efficient equipment. Residential HVAC Tune-up and Duct
Repair program provided strong savings mainly because of the evaluated distribution system efficiency value of 12.7%, which is much higher than the TRM default value of 5%. However,
contractors show little interest installing the duct repair measures.
Actual data tracked and savings calculations are not easily accessed. It was difficult to
pin down the program goals as some of them had changed. The use of multiple databases
because of problems with the official database (Saratoga) is confusing, e.g. the initial summary savings reports from Saratoga for Commercial Lighting contained errors (i.e. energy savings
summations were incorrect) and all files contained overlapping projects . Values are hard coded and sometimes rounded, e.g. EERs of 12 instead of 11.5. OG&E has developed a body of
information about each program and associated measures, including Excel -based savings calculators that apply the algorithms from the TRMs. However, for some programs, EnerNOC
found it difficult to readily assess what is tracked and how to replicate savings estimates, e.g.
needed climate zone information per project for Window AC program calculations. In addition, reporting seems to be done only at an aggregate level, i.e. not broken down by measure.
Quality control procedures were not adequate. OG&E currently uses a tracking system (Saratoga database) to document savings and provide saving reports for all OG&E programs. We
identified issues with the provided Saratoga reports and found quite a number of cases where
data were not fully entered or entered incorrectly. The Saratoga system itself or the queries to it often understate the actual level of program activity. Based on data retrieved from the Saratoga
system for this evaluation, we find that the system is not sufficiently reliable in its present state.
Most of the required data is tracked but not all is inputed in the database in a timely fashion, i.e.
EnerNOC had to keep requesting updated/corrected reports. Provided reports were missing data or values, e.g. Residential HVAC Tune-up HVAC projects not entered in database and one of the
measure descriptions for an SOP project was ‘????’. In addition EnerNOC found incorrect data for
Residential Window AC, and for Residential HVAC Tune-Up and Duct Repair projects; some project entries were somewhat convoluted and led to issues such as separate projects grouped
together, rounding issues, and project lines duplicated 2 to 3 times. EnerNOC also had some difficulty in getting information on the calculations underlying the savings values and the correct
savings summary reports for custom projects under SOP and CTU.
Recommendations
Create and implement QA/QC procedures
OG&E should develop a set of procedure/quality control steps in order to report consistent and
accurate savings results. For example, OG&E can create a check list and have a supervisor initial
and verify that check list tasks were completed before documents are provided to the evaluation team. An example check list is provided below and is not limited to the following (EnerNOC
recommends that OG&E create a checklist that is suited to their protocols and procedures, the following is purely an example):
o Read previous Evaluation reports to better understand what information is needed.
o Review saving reports before submitting and:
Check savings values; does the PM agree with savings values included in report?
Check all measures to see if anything (goals, measures, etc.) are missing
Check to see if there is enough information in the report to figure out the savings algorithms and replicate the savings
If any of the above information is missing or incorrect, fix the report and/or provide
supplemental information (see Improve Documentation and Reporting sections below) so that the savings can be evaluated
APSC FILED Time: 4/1/2014 12:29:49 PM: Recvd 4/1/2014 11:59:47 AM: Docket 07-075-tf-Doc. 229

EnerNOC Utility Solutions 46
Improve Documentation
A data dictionary should be developed for all database maintained by OG&E, CLEAResult, and
DirectOptions. A data dictionary is a set of information describing the contents, format, and structure of a database and the relationship between its elements, used to control access to and
manipulation of the database.
In addition, for each program, OG&E should consolidate all backup documentation and
explanations for each parameters tracked, as well as the calculations and methods including
the relevant TRM sections for each program measure. Improving the program documentation
such that all the key elements of savings calculations and assumptions are included will improve confidence in and efficient verification of OG&E’‘s claimed savings.
Reporting
Savings summary sheets provided for the evaluation should include all parameters used to
calculate savings to the second decimal (or third if parameter used was taken to the third
decimal).
Create monthly reports with details by measure for each program to provide feedback to
program managers and allow corrections and changes to be made during the program year rather than during the evaluation.
Residential HVAC Tune-Up Program
Replace distribution system efficiency (DSE) TRM default value with field-verified value in
claimed savings calculations and urge APSC to adopt in next TRM version.
Address contractors’ disinterest in installing measures by either providing better or different
support to increase their interest or move to using direct installation to achieve savings.
Investigate—perhaps as part of the statewide potential study—whether Arkansas customers
need adjustments to refrigerant charges; there may not be much opportunities for savings from this measure as the program manager noted that many of the customers did not need a
change of refrigerant charge.
Window AC Program
The program seems to be working as planned. May want to consider expanding the program
to cover other efficiency products if they are cost-effective.
Use climate zone appropriate deemed savings. The claimed savings used the TRM but some
projects were assigned values from the incorrect zone. While the effect is small, the
correction is easy and will increase confidence in OG&E’s savings claims.
Student Energy Education
Check in with teachers during the participation period to ensure kit distribution and
encourage installation of measures in kits. We believe that the implementer should provide
this level of monitoring as part of the turn-key service.
Eliminate sending duplicate kits to teachers who repeatedly enroll in the program. This would
reduce program costs by about 2%. These free-up funds could be used to increase
participation by additional students.
Commercial Lighting Program
The tracking tool used for the Commercial Lighting program seems comprehensive and well
maintained. It would be a good idea to have Direct Options create data dictionary and set up
procedures to extract usable data and provide
APSC FILED Time: 4/1/2014 12:29:49 PM: Recvd 4/1/2014 11:59:47 AM: Docket 07-075-tf-Doc. 229

EnerNOC Utility Solutions 47
Ensure all new equipment for custom applications, i.e. rebated on the basis of kW savings, is
captured, perhaps with a drop down menu that requires a response.
Create monthly program reports with measure details, participant information, as well as demand
and energy savings, and enhance the ability to create ad hoc reports as needed. This will provide valuable feedback to program managers.
Standard Offer and Commercial Tune-Up Programs
For PY 2014, add or reallocate funds to enable independent estimation of direct install
measures over custom measures if they again comprise the majority of savings OG&E claims
for the program.
Focus outreach and recruitment on customers with larger energy savings opportunities. While
the number of projects processed under the program was far higher than expected in PY 2013, in order to reach the kW and kWh goals, recruitment needs to focus on achieving
larger and/or more comprehensive projects. One suggestion is to introduce tiered incentives which would provide higher per-kW for projects above a threshold level.
Claim kW savings for vending misers in addition to kWh savings, as indicated in the TRM.
As part of the upcoming market potential study assess the focus and appeal of the custom
projects components of these programs. This program is underperforming in terms of both peak kW reductions and annual kWh savings. The program either needs to include more
measures that interest customers or a different outreach approach to reach the target
market. Very few of the participants in the Commercial Tune-Up Program installed the high-impact measures promoted or expected by the program.
Comprehensive Factors
This section describes EnerNOC’s assessment of how effectively six of OG&E Arkansas programs
(Student Energy Education, HVAC Tune-Up & Duct Repair, Window Unit A/C, Commercial Lighting,
Commercial Tune-Up, and Standard Offer) have addressed the following comprehensive factors:
Factor 1: Whether the programs and/or portfolio provide, either directly or through identification
and coordination, the education, training, marketing, or outreach needed to address market barriers to the adoption of cost-effective energy efficiency measures;
OG&E has increased marketing and outreach which has had some success in addressing market
barriers such as availability of efficient window air-conditioners and customer awareness of
program opportunities. However marketing and outreach cannot overcome all market barriers such as level of incentives, lack of trade ally interest, and product availability for commercial and
industrial applications. OG&E is increasing the level of incentives for some products in 2014 and has outsourced marketing and outreach for direct installation of measures which has led to
increased program participation.
Factor 2: Whether the programs and/or portfolio, have adequate budgetary, management, and program delivery resources to plan, design, implement, oversee and evaluate energy efficiency
programs;
Reported and EnerNOC-adjusted savings have increased steadily over the program cycle, by
about 1,000 kW and by over 7,500 annual MWh from 2011 to 2013 with available resources.
OG&E has moved budget dollars to optimize program delivery resources by outsourcing the
marketing and installation of measures directly on customer premises and outsourcing the online commercial lighting tracking database to DirectOptions. EnerNOC believes this has increased
OG&E’s ability to oversee and evaluate the DSM programs. SOP and CTU custom projects are clearly not successful but not due to lack of management and resources.
APSC FILED Time: 4/1/2014 12:29:49 PM: Recvd 4/1/2014 11:59:47 AM: Docket 07-075-tf-Doc. 229

EnerNOC Utility Solutions 48
The two areas that EnerNOC suggests need more resources are quality assurance and program
evaluation. Using existing or new OG&E staff resources to improve results tracking, reporting,
and especially documentation, would expedite evaluation activities and allow for better program management and oversight. A larger EM&V budget than for PY 2013 would allow EnerNOC to
assess the in-service rates for measures installed by CLEAResult and more detailed engineering review of program results.
Factor 3: Whether the programs and/or portfolio, reasonably address all major end-uses of
electricity or natural gas, or electricity and natural gas, as appropriate;
The programs reasonably address all the major end uses for the commercial and industrial
sectors as shown in the following table.
OG&E Program Commercial End Uses Industrial End Uses
Standard Offer HVAC, Cooking, Refrigeration, Water Heating,
Motors, Air Compressors, Process, Lighting
Refrigeration, Motors, Air Compressors,
Pumps, Process
Commercial Tune-Up HVAC, Cooking, Refrigeration, Water Heating,
Motors, Air Compressors, Process
Refrigeration, Motors, Air Compressors,
Pumps, Process
Commercial Lighting Lighting Lighting
It is more difficult to affirm that the major end uses in the residential sector are reasonably
addressed by the residential programs without a recent market and/or potential study to draw
on. We expect that the move to statewide programs will address this in time for the new cycle of program designs. The programs do address the major end residential uses—HVAC (HVAC Tune-
Up & Duct Repair), lighting and water heating (Student Energy Education), and appliances (Window AC, Weatherization).
Factor 4: Whether the programs and/or portfolio, to the maximum extent reasonable,
comprehensively address the needs of customers at one time, in order to avoid cream-skimming and lost opportunities;
The current mix of programs addresses individual customer needs and OG&E adjusts the
program delivery options to minimize any lost opportunities, especially in the C&I sector. In the residential sector, OG&E offers programs that ensure all of its customers are able to participate,
e.g. customers without central air-conditioning and thus unable to participate in the HVAC Tune-up and Duct Repair Program are eligible for the Window AC program.
Factor 5: Whether such programs take advantage of opportunities to address the comprehensive
needs of targeted customer sectors (for example, schools, large retail stores, agricultural users, or restaurants) or to leverage non-utility program resources (for example, state or federal tax incentive,
rebate, or lending programs);
Both the Standard Offer and Commercial Tune-Up programs target a variety of sectors and the
direct installation of measures by CLEAResult also focuses on sectors such schools, retails stores
and restaurants to implement measures such as vending misers and faucet aerators. In addition,
OG&E will leverage any non-utility resources such as tax credits where possible.
APSC FILED Time: 4/1/2014 12:29:49 PM: Recvd 4/1/2014 11:59:47 AM: Docket 07-075-tf-Doc. 229

EnerNOC Utility Solutions 49
Factor 6: Whether the programs and/or portfolio enables the delivery of all achievable, cost-effective
energy efficiency within a reasonable period of time and maximizes net benefits to customers and to the utility system;
We cannot address this since EnerNOC is not responsible for cost-effectiveness analysis.
Factor 7: Whether the programs and/or portfolio, have evaluation, measurement, and verification "EM&V") procedures adequate to support program management and improvement, calculation of
energy, demand and revenue impacts, and resource planning decisions.
The EM&V procedures are working quite well with the addition of a dedicated OG&E EM&V
contact. The procedures would be greatly enhanced by implementing quality assurance procedures and more regular and detailed reports. More transparency in what is tracked and
how calculations are applied will improve the quality of data as well as program management and improvement.
APSC FILED Time: 4/1/2014 12:29:49 PM: Recvd 4/1/2014 11:59:47 AM: Docket 07-075-tf-Doc. 229

APSC FILED Time: 4/1/2014 12:29:49 PM: Recvd 4/1/2014 11:59:47 AM: Docket 07-075-tf-Doc. 229

EnerNOC Utility Solutions A-1
APPENDIX A
PROGRAM MANAGER INTERVIEW GUIDE
Name ________________________________________________________________
Date ________________________________________________________________
Phone ________________________________________________________________
Email ________________________________________________________________
Interviewer(s)__________________________________________________________________
_______________________________________________________________________________
Introduction
Thank you for talking with us today about OG&E’s Arkansas Energy Efficiency Programs. We will
discuss the residential programs (HVAC tune up and window a/c) and non-residential programs
(commercial lighting, commercial tune up, and standard offer).
The areas we will be discussing are:
Any changes in the programs since PY 2012
Program components for the Residential and Commercial & Industrial (C&I) markets
Administration and tracking
Delivery, including marketing and outreach
Program effectiveness
Program Design and Development
1. Have there been any changes or updates to the design of the programs in the last year?
Program/Change Description Comments
Direct Installation
Commercial Lighting
SOP
CTU
Window AC
LivingWise
Res HVAC Tune Up
APSC FILED Time: 4/1/2014 12:29:49 PM: Recvd 4/1/2014 11:59:47 AM: Docket 07-075-tf-Doc. 229

EnerNOC Utility Solutions A-2
Next, I’d like to discuss your views on how the programs are being implemented in 2013.
Program Implementation – Residential
1. Overall, how effective do you feel the HVAC tune up program is in terms of the following:
a. Reaching the target market
b. Overcoming barriers to participation
c. Educating the target market
d. Achieving savings goals
2. What appear to be the most successful program components for HVAC tune up so far?
a. Use of contractors
b. AC-tunes and Duct work
c. Customer education
d. Contractor Rebates
3. For the Window AC rebate program, what did you change or improve in order to reach your
participation goals?
Program Implementation – Non-residential
1. Overall, how effective do you feel the non- residential programs are in terms of the following:
a. Reaching the target market
b. Overcoming barriers to participation
c. Educating the target market
d. Achieving its savings goals
e. Coordinating with other agencies
2. What appear to be the most successful program components so far?
a. Use of contractors
b. On-site audits
c. Customer education
d. Customer follow up, including visits
Program Tracking
1. How do you feel about the current program tracking system?
a. Have you made changes to include the additional information identified in the 2012
evaluation?
b. Is there anything else that you would you improve/change?
Next, I’d like to discuss your role in helping to deliver the programs in 2013.
APSC FILED Time: 4/1/2014 12:29:49 PM: Recvd 4/1/2014 11:59:47 AM: Docket 07-075-tf-Doc. 229

EnerNOC Utility Solutions A-3
Program Administration
1. Have you been able to maintain a high level of contact with contractors?
a. Is there anything that could be improved?
b. What type of feedback have you received from implementers and/or contractors?
2. Do you feel that the contractors are performing well on each of the programs?
Now let’s move to program delivery.
Program Delivery
1. Are there any specific aspects of a particular program(s) that are working very well? Any not
working well? Program details.
2. What challenges have occurred during PY 2013? How were they overcome?
3. Are the programs efficient and well managed? Why or why not? How are problems resolved?
4. What could be done to improve the program?
Let’s move to discussion of how the market is made aware of the programs.
Marketing and Outreach
1. Have you been able to continue the grass roots hands-on approach to marketing? Does it
continue to be effective? Given your level of staffing is this type of marketing sustainable?
2. What other marketing has been done?
3. What type of feedback have you received from customers about the programs?
a. What did they like?
b. What did they not like?
Lastly, let’s discuss program effectiveness.
Program Effectiveness
1. What is your impression regarding likely program free ridership? Meaning do you think
customers would pay for the measures on their own, outside of the program. Why do you
say that?
2. Do you think the programs are changing customers’ energy efficiency attitudes and actions?
What specifically has changed?
These are all my questions. Do you have anything else you’d like to add?
Thank you again for taking the time to discuss these programs.
APSC FILED Time: 4/1/2014 12:29:49 PM: Recvd 4/1/2014 11:59:47 AM: Docket 07-075-tf-Doc. 229

APSC FILED Time: 4/1/2014 12:29:49 PM: Recvd 4/1/2014 11:59:47 AM: Docket 07-075-tf-Doc. 229

EnerNOC Utility Solutions Consulting 500 Ygnacio Valley Road, Suite 450 Walnut Creek, CA 94596
P: 925.482.2000 F: 925.284.3147
About EnerNOC
EnerNOC’s Utility Solutions Consulting team is part of EnerNOC’s Utility Solutions,
which provides a comprehensive suite of demand-side management (DSM)
services to utilities and grid operators worldwide. Hundreds of utilities have
leveraged our technology, our people, and our proven processes to make their
energy efficiency (EE) and demand response (DR) initiatives a success. Utilities
trust EnerNOC to work with them at every stage of the DSM program lifecycle –
assessing market potential, designing effective programs, implementing those
programs, and measuring program results.
EnerNOC’s Utility Solutions deliver value to our utility clients through two
separate practice areas – Implementation and Consulting.
• Our Implementation team leverages EnerNOC’s deep “behind-the-meter
expertise” and world-class technology platform to help utilities create and
manage DR and EE programs that deliver reliable and cost-effective energy
savings. We focus exclusively on the commercial and industrial (C&I)
customer segments, with a track record of successful partnerships that
spans more than a decade. Through a focus on high quality, measurable
savings, EnerNOC has successfully delivered hundreds of thousands of MWh
of energy efficiency for our utility clients, and we have thousands of MW of
demand response capacity under management.
• The Consulting team provides expertise and analysis to support a broad
range of utility DSM activities, including: potential assessments; end-use
forecasts; integrated resource planning; EE, DR, and smart grid pilot and
program design and administration; load research; technology assessments
and demonstrations; evaluation, measurement and verification; and
regulatory support.
The team has decades of combined experience in the utility DSM industry. The
staff is comprised of professional electrical, mechanical, chemical, civil, industrial,
and environmental engineers as well as economists, business planners, project
managers, market researchers, load research professionals, and statisticians.
Utilities view EnerNOC’s experts as trusted advisors, and we work together
collaboratively to make any DSM initiative a success.
APSC FILED Time: 4/1/2014 12:29:49 PM: Recvd 4/1/2014 11:59:47 AM: Docket 07-075-tf-Doc. 229