Embed Size (px)
Citation preview
Oil Tanker Spill Statistics 2019
January 2020 Special edition50 years of data, 1970-2019
January 2020
2
OIL
TA
NKE
R SP
ILL
STA
TIST
ICS
2019
Front cover image: Tanker, Todos os Santos Bay, Brazil
Information in this paper may be produced with the prior express permission of ITOPF. For further information, please contact Naa Sackeyfio, Information Data Analyst ([email protected]).
Practical guidance on oil and chemical spill response and effects in the marine environment is available through ITOPF’s Technical Information Papers (TIPs) and its Response to Marine Oil Spills film series.
ITOPF TIPs1 Aerial Observation of Marine Oil Spills 2 Fate of Marine Oil Spills3 Use of Booms in Oil Pollution Response4 Use of Dispersants to Treat Oil Spills5 Use of Skimmers in Oil Pollution Response6 Recognition of Oil on Shorelines7 Clean-up of Oil from Shorelines8 Use of Sorbent Materials in Oil Spill Response9 Disposal of Oil and Debris10 Leadership, Command & Management of Oil
Spills11 Effects of Oil Pollution on Fisheries and
Mariculture12 Effects of Oil Pollution on Social and Economic
Activities13 Effects of Oil Pollution on the Environment14 Sampling and Monitoring of Marine Oil Spills15 Preparation and Submission of Claims from Oil
Pollution16 Contingency Planning for Marine Oil Spills 17 Response to Marine Chemical Incidents
ITOPF Film Series1 Introduction to Oil Spills2 Aerial Surveillance3 At-Sea Response4 Shoreline Clean-up5 Waste Management6 Environmental Impacts7 Oil Spill Compensation8 Oil Spills in Cold Climates
The TIPs and films are available in multiple languages on ITOPF’s website www.itopf.org.
About ITOPF
ITOPF is maintained by the world’s shipowners and their insurers on a not-for-profit basis to promote
effective response to spills of oil, chemicals and other substances in the marine environment.
Since ITOPF’s establishment in 1968, our technical staff have attended on-site at over 800 shipping incidents in 100 countries to provide objective and scientific advice on clean-up measures, the effects of pollutants on the environment and economic activities, and on compensation. These incidents can involve oil, chemicals and other cargoes, whether bulk or packaged, as well as bunker fuel from all types of ship. We also provide advice in relation to oil spills from other potential sources of marine pollution, including pipelines and offshore installations; physical damage to coral reefs resulting from ship groundings; and environmental impacts associated with shipwrecks.
Our first-hand experience of pollution incidents is utilised during contingency planning and other advisory assignments for government and industry. We are an authoritative source of information on marine spills and share our knowledge at training courses and seminars throughout the world, encouraging best practice through outreach and education.
3
OIL
TA
NKE
R SP
ILL
STA
TIST
ICS
2019
About ITOPF 2Introduction 4Oil tanker spill statistics infographic 5Major oil spills in history 6Global oil spill trend 7Number of oil spills 8Quantities of oil spilt 11Influence of large spills on quantities of oil spilt 12Tanker spills vs seaborne oil trade 13Causes of spills 14Spills recorded in 2019 18Current trends – the 2010s 18
Contents
4
OIL
TA
NKE
R SP
ILL
STA
TIST
ICS
2019
This special edition of ITOPF’s annual Oil Tanker Spill Statistics publication presents 50 years of data on
accidental spills of oil from tankers. We also report on new tanker spills that occurred in 2019 and trends for the decade.
ITOPF first began compiling statistics in the mid-1970s in response to the lack of reliable information on the number of oil spills from tankers occurring throughout the world. It was known that oil was being spilt but it had not been established with any accuracy how, when, where, why, or how much. ITOPF, with the owners of almost all the world’s tanker tonnage as its Members, was in a unique position to gather this information. Following an initial pilot exercise, ITOPF’s data collection programme was officially launched in 1974. In the early days, the voluntary nature of the reporting (via the P&I Clubs) resulted in a number of imbalances in the data but, where possible, gaps were filled by monitoring the shipping press and checking lists of spills from external sources, such as national governments, international organisations and research institutes. The programme proved successful and produced statistics capable of clarifying the size and scale of oil spills from tanker incidents. This made it possible to identify trends, highlighting common areas of concern and enabling industry discussions to be better informed.
Today, ITOPF continues to gather information from shipping and other specialist publications, as well as from vessel owners, their insurers and ITOPF’s own experience at incidents. Historically, information from published sources mostly related to large spills, often resulting from collisions, groundings, structural damage, fire or explosions. In recent decades however, reporting of smaller spills has improved.
IntroductionInformation is held on over 10,000 oil spills from tank vessels, including combined carriers, FPSOs and barges from 1970 onwards. This includes incidents involving both persistent and non-persistent oil from tankers, except those resulting from acts of war. Information recorded includes the location and cause of the incident, the vessel involved, the type of oil spilt and the spill amount. Spills are categorised by size, ie small (<7 tonnes or 50 bbls), medium (7-700 tonnes or 50-5000 bbls) or large (>700 tonnes or 50,000 bbls), although the actual amount spilt is also recorded.
It should be noted that the figures for the amount of oil spilt in an incident include all oil lost to the environment, including that which burnt or remained in a sunken vessel. There is considerable annual variation in both the number of oil spills and the amount lost.
While we strive to maintain precise records for all spill information, we cannot guarantee that the information taken from the shipping press and other sources is complete or accurate. The number of incidents and volumes of oil spilt are recorded based on the most up to date information available. Occasionally, data is received after publication and, in this case, adjustment to previous entries may be made. Consequently, the figures in the following tables, and any averages derived from them, should be viewed with a degree of caution.
For further information on ITOPF’s spill statistics, please contact Naa Sackeyfio, Information Data Analyst ([email protected]). We regret that it is not possible to provide direct access to our database or to release the names of individual tanker incidents, except major spills.
5
OIL
TA
NKE
R SP
ILL
STA
TIST
ICS
2019
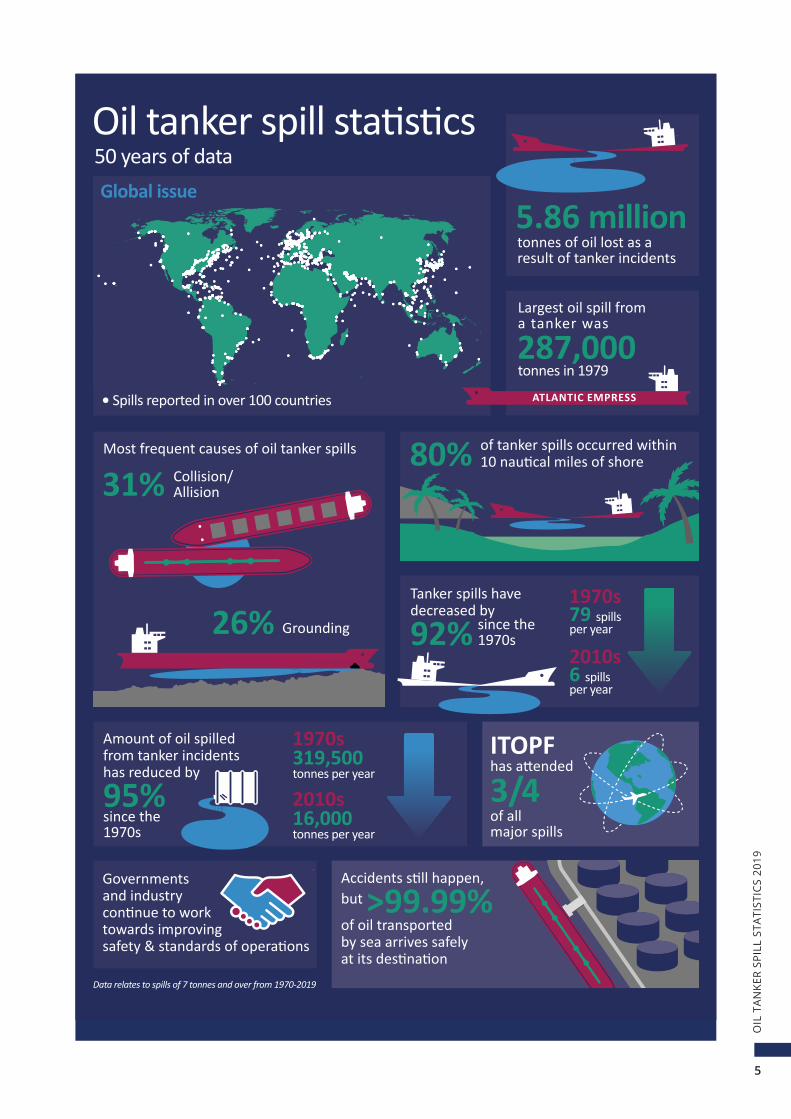
Data relates to spills of 7 tonnes and over from 1970-2019
Oil tanker spill statistics50 years of data
Amount of oil spilled from tanker incidents has reduced by
95% since the 1970s
1970s 319,500 tonnes per year
2010s 16,000 tonnes per year
Governments and industry continue to work towards improving safety & standards of operations
tonnes of oil lost as a result of tanker incidents
5.86 million
!
1970s 79 spills per year
2010s 6 spills per year
Tanker spills have decreased by
92% since the 1970s
Most frequent causes of oil tanker spills
31% Collision/ Allision
26% Grounding
80% of tanker spills occurred within 10 nautical miles of shore
Accidents still happen, but >99.99%of oil transported by sea arrives safely at its destination
ITOPFhas attended
3/4 of all major spills
!
!
!
!
!
!
!
!
!
!
!
!
!
!
!
!
!
!
!
!
!
!
!
!
!
!
!
!
!
!
!
!
!
!
!!!
!
!
!
!
!
!
!
!
!!
!
!
!!
!!
!
!
!
!
!
!
!
!
!
!
!
!
!
!
!
!
!
!
!
!
!
!
!
!
!
!
!!
!! !
!!
!
!
!
!
!
!
!
!
!
!
!
!
!!
!
!!
!
!!!!
!
!
!
!
!
!
!
!
!
!
!! !
!
!
!
!
!
!
!
!
!
!
!
!
!
!
!
!
!
!
!
!
!!
!
!!! !
!
!
!
!
!!
!
!
!!
! !
!
!
!!
!
!
!!
!
!
!
!
!
!
!!
!
!
!
!
!
!
!
!
!
!
!
!
!
!!
!!
!
!
!
!
!
!
!
!
!
!
!
!
!
!
!
!
!
!!
!
!
!
!
!!
!
!
!
!
!
!
!
!
!
!
!
!
!
!
!
!
!
!
!
!
!
!
!
!
!
!
!
!
!
!
!
!
!
!
!
!
!
!
!
!!
!
!!
!!
!
!!
!
!
!
!
!
!
!
!
!
!
!!
!
!
!
!
!!
!
!
!
!
!
!
!
!
!
!
!! !
!
!
!
!
!
!
!
!
!!!
!
!
!
!
!
!
!!
!
!
!
!
!
!
!
!
!
!
!!
!
!
!
!
!
!
!
!
!
!
!
!!
!
!
!
!!
!
!
!
!
!
!
!
!
!
!
!
!
!
!
!
!
!
!
!
!!
!
!
!
!!
!
!
!
!
!
!
!
!
!
!
!
!
!
!
!
!
!
!
!
!
!
!
!
!!
!
!
!!
!
!
!
!
!
!
!
!
!!
!
!
!
!
!
!!
!
!
!
!!
!
!
!
!
!
!!!
!
!
!!
!
!
!
!
!!
!
!
!
!
!
!
!
!
!
!!
!
!!!
!
!
!
!
!
!
!
!
!
!
!
!
!
!
!
!
!
!
!
!
!
!
!
!
!
!
!
!
!
!!
!
!
!
!
!
!
!
!
!
!
! !
!
!
!
!
!!
!
!
!
!!
!
!
!
!
!
!
!
!
!
!
!
!
!
!
!
!
!
!
!
!
!
!
!
!
!
!!
!
!!!
!
!
!
!
!!
!
!
!!
!
!
!
!
!
!
!
!
!
!
!
!
!
!
!
!
!
!
!
!
!!!
!
!!
!!
!
!!
!
!
!
!
!
!
!
!
!
!!
!
!
!
!
!
!
!
!
!
!!
!!
!
!
!
!
!
!
!
!
!
!
!
!
!
!
!
!
!
!
!
!
!
!
!
!
!!
!
! !
!!
!
!
!
!
!!
!
!
!!
!
!
!
!!
!
!
!
!
!!
!
!
!
!
!
!
!!
!
!
!
!
!!
!
!!
!
!
!
!
!!
!
!
!!
!
!
!
!
!
!
!
!
!
!
!
!
!!
!
!
!!
!
!
!
!
!
!
!
!
!
!
!
!
!
!
!
!
!
!!
!
!
!
!
!
!
!!
!
!
!
!
!
!!
!
!!
!!
!!
!
!!
!
!
!
!
!
!
!
!
!
!
!
!
!
!
!
!
!
!
!
!
!
!!
!
!
!!
!
!
!
!
!
!
!!
!
!
!!!
!
!
!
!
!!
!
!
!!!!!!!
!
!
!
!
!
!
!
!
!
!
!
!!
!
!
!
!
!
!
!
!
!
!!
!
!
!
!
!!
!
!
!
!
!
!
!
!
!
!
!
!
!
!
!
!
!
!
!
!
!
!
!
!
!!
!
!
!!
!
!
!
!
!
!!
!
!
!
!
!
!
!
!
!
!
!
!
!
! !!
!
!
!
!
!
!
!
!
!
!
!
!
!
!
!
!
!
!
!
!
!
!
!
! !
!
!
!
!
!
!
!
!
!!
!
!
!!
!
!
!
!
!
!
!
!
!
!
!
!
!
!
!
!
!!
!
!
!
!
!
!
!
!!
!
!
!
!
!
!!
!
!
!
!
!
!
!!
!
!
!
!
!
!
!
!
!!
!
!
!
!
!
!
!
!
!
!
!
!
!
!
! !
!
!
!
!
!
!
!
!
!
!
!
!
!
!!
!
!
!
!
!
!
!
!
!
!
!
!
!
!
!
!
!
!
!
!
!!
!
!
!
!
!
!
!
!
!
!!
!
!
!
!
!
!
!
! !
!
!
!
!
!
!
!
!
!
!
!
!
!
!
!
!
!!
!
!
!
!
!
!
!!
!
!
!
!
!
!
!
!
!
!
! !
!
!
!!
!
!
!
!
!
!
!!
!!
!
!
!!
!
!
!
!
!!
!
!
!
!!
!
!
!
!
!
!
!
!
!
!
!
!
!!
!
!
!
!
!
!
!
!
!
!
!
!!
!
!
!
!
!
!
!
!
!
!
!
!
!!
!
!
!
!!
!
!
!
! !
!!
!
!
!!
!
!
!
!
!
!
!
!!
!
!
!
!
!
!
!!
!
!
!
!
!!!!
!
!
!
!
!
!
! !
!
!!
!
!
!
!
!!
!
!
!
!
!
!
!
!
!
!
!
!
!
!
!
!
!
!!
!
!
!
!
!
!
!
!
!
!
!
!
!
!
!
!
!
!
!
!
!
!
!
!!
!
!
!
!!
!
!
!
!
!
!!
!
!
!
!
!
!
!
!
!
!
!
!
!
!
!
!
!
!
!
!
!
! !
!
!
!!
!
!
!
!
!
!
!
!
!
!
!
!
!
!!!
!
!!
!
!
!
!
!
!
!
!
!
!
!
!
!
!
!
!
!!
!
!
!
!
!
!
!
!
!
!
!
!
!
!
!
!
!
!
!
!
!
!
!
!
!
!
!
!
!
!
!
!
!
!
!
!
!
!
!
!
! !
!
!
!
!
!
!
!
!
!
!
!!
!!
!
!
!
!
!
!
!!
!
!
!
!
!!
!
!
!
!
!
!
!
!
!!
!
!
!
!
!
!
!
!
!
!
!
!
!
!
!
!
!
!
!
!
!
!
!!
!
!
!
!
!
!
! !
!!
!
!
!
!
!
!
!
!
!
!
!
!
!!!
!
!
!!
!
!
!
!
!
!
!
!
!
!
!
!
!
!
!
!
!
!
!
!
!
!
!
!!
!
!
!
!
!!
!
!
!
!
!
!
!
!
!
!
!
!
!
!
!
!
!
!
!
!
!
!
!
!
!
!!
!
!
!
!
!!
!
!
!
!
!
!
!
!
!
!
!
!
!
!
!
!
!
!
!
!
!
!
!!
!
!
!
!
!
!
!!
!
!
!
!
!
!
!
!
!
!
!
!
!
!
!
!
!
!
!
!
!
!
!
!
!
!!
!
!
!
!
!
!
!
!
!
!!
!
!
!
!
!!
!
!!
!
!
!
!
!
!
!
!
!
!
!
!
!
!
!
!
!
!
!
!
!
!
!
!
!
!
!
!
!
!
!
!
!
!
!
!
!
!
!
!
!
!
!
!
!
!
!
!
!
!
!
!
!
!
!
!
!!!
!
!
!
!
!
!
!
!
!!
!
!
!!
!!
!
!
!
!
!
!
!
!
!
!
!
!
!
!
!
!
!
!
!
!
!
!
!
!
!
!
!!
!! !
!!
!
!
!
!
!
!
!
!
!
!
!
!
!!
!
!!
!
!!!!
!
!
!
!
!
!
!
!
!
!
!! !
!
!
!
!
!
!
!
!
!
!
!
!
!
!
!
!
!
!
!
!
!!
!
!!! !
!
!
!
!
!!
!
!
!!
! !
!
!
!!
!
!
!!
!
!
!
!
!
!
!!
!
!
!
!
!
!
!
!
!
!
!
!
!
!!
!!
!
!
!
!
!
!
!
!
!
!
!
!
!
!
!
!
!
!!
!
!
!
!
!!
!
!
!
!
!
!
!
!
!
!
!
!
!
!
!
!
!
!
!
!
!
!
!
!
!
!
!
!
!
!
!
!
!
!
!
!
!
!
!
!!
!
!!
!!
!
!!
!
!
!
!
!
!
!
!
!
!
!!
!
!
!
!
!!
!
!
!
!
!
!
!
!
!
!
!! !
!
!
!
!
!
!
!
!
!!!
!
!
!
!
!
!
!!
!
!
!
!
!
!
!
!
!
!
!!
!
!
!
!
!
!
!
!
!
!
!
!!
!
!
!
!!
!
!
!
!
!
!
!
!
!
!
!
!
!
!
!
!
!
!
!
!!
!
!
!
!!
!
!
!
!
!
!
!
!
!
!
!
!
!
!
!
!
!
!
!
!
!
!
!
!!
!
!
!!
!
!
!
!
!
!
!
!
!!
!
!
!
!
!
!!
!
!
!
!!
!
!
!
!
!
!!!
!
!
!!
!
!
!
!
!!
!
!
!
!
!
!
!
!
!
!!
!
!!!
!
!
!
!
!
!
!
!
!
!
!
!
!
!
!
!
!
!
!
!
!
!
!
!
!
!
!
!
!
!!
!
!
!
!
!
!
!
!
!
!
! !
!
!
!
!
!!
!
!
!
!!
!
!
!
!
!
!
!
!
!
!
!
!
!
!
!
!
!
!
!
!
!
!
!
!
!
!!
!
!!!
!
!
!
!
!!
!
!
!!
!
!
!
!
!
!
!
!
!
!
!
!
!
!
!
!
!
!
!
!
!!!
!
!!
!!
!
!!
!
!
!
!
!
!
!
!
!
!!
!
!
!
!
!
!
!
!
!
!!
!!
!
!
!
!
!
!
!
!
!
!
!
!
!
!
!
!
!
!
!
!
!
!
!
!
!!
!
! !
!!
!
!
!
!
!!
!
!
!!
!
!
!
!!
!
!
!
!
!!
!
!
!
!
!
!
!!
!
!
!
!
!!
!
!!
!
!
!
!
!!
!
!
!!
!
!
!
!
!
!
!
!
!
!
!
!
!!
!
!
!!
!
!
!
!
!
!
!
!
!
!
!
!
!
!
!
!
!
!!
!
!
!
!
!
!
!!
!
!
!
!
!
!!
!
!!
!!
!!
!
!!
!
!
!
!
!
!
!
!
!
!
!
!
!
!
!
!
!
!
!
!
!
!!
!
!
!!
!
!
!
!
!
!
!!
!
!
!!!
!
!
!
!
!!
!
!
!!!!!!!
!
!
!
!
!
!
!
!
!
!
!
!!
!
!
!
!
!
!
!
!
!
!!
!
!
!
!
!!
!
!
!
!
!
!
!
!
!
!
!
!
!
!
!
!
!
!
!
!
!
!
!
!
!!
!
!
!!
!
!
!
!
!
!!
!
!
!
!
!
!
!
!
!
!
!
!
!
! !!
!
!
!
!
!
!
!
!
!
!
!
!
!
!
!
!
!
!
!
!
!
!
!
! !
!
!
!
!
!
!
!
!
!!
!
!
!!
!
!
!
!
!
!
!
!
!
!
!
!
!
!
!
!
!!
!
!
!
!
!
!
!
!!
!
!
!
!
!
!!
!
!
!
!
!
!
!!
!
!
!
!
!
!
!
!
!!
!
!
!
!
!
!
!
!
!
!
!
!
!
!
! !
!
!
!
!
!
!
!
!
!
!
!
!
!
!!
!
!
!
!
!
!
!
!
!
!
!
!
!
!
!
!
!
!
!
!
!!
!
!
!
!
!
!
!
!
!
!!
!
!
!
!
!
!
!
! !
!
!
!
!
!
!
!
!
!
!
!
!
!
!
!
!
!!
!
!
!
!
!
!
!!
!
!
!
!
!
!
!
!
!
!
! !
!
!
!!
!
!
!
!
!
!
!!
!!
!
!
!!
!
!
!
!
!!
!
!
!
!!
!
!
!
!
!
!
!
!
!
!
!
!
!!
!
!
!
!
!
!
!
!
!
!
!
!!
!
!
!
!
!
!
!
!
!
!
!
!
!!
!
!
!
!!
!
!
!
! !
!!
!
!
!!
!
!
!
!
!
!
!
!!
!
!
!
!
!
!
!!
!
!
!
!
!!!!
!
!
!
!
!
!
! !
!
!!
!
!
!
!
!!
!
!
!
!
!
!
!
!
!
!
!
!
!
!
!
!
!
!!
!
!
!
!
!
!
!
!
!
!
!
!
!
!
!
!
!
!
!
!
!
!
!
!!
!
!
!
!!
!
!
!
!
!
!!
!
!
!
!
!
!
!
!
!
!
!
!
!
!
!
!
!
!
!
!
!
! !
!
!
!!
!
!
!
!
!
!
!
!
!
!
!
!
!
!!!
!
!!
!
!
!
!
!
!
!
!
!
!
!
!
!
!
!
!
!!
!
!
!
!
!
!
!
!
!
!
!
!
!
!
!
!
!
!
!
!
!
!
!
!
!
!
!
!
!
!
!
!
!
!
!
!
!
!
!
!
! !
!
!
!
!
!
!
!
!
!
!
!!
!!
!
!
!
!
!
!
!!
!
!
!
!
!!
!
!
!
!
!
!
!
!
!!
!
!
!
!
!
!
!
!
!
!
!
!
!
!
!
!
!
!
!
!
!
!
!!
!
!
!
!
!
!
! !
!!
!
!
!
!
!
!
!
!
!
!
!
!
!!!
!
!
!!
!
!
!
!
!
!
!
!
!
!
!
!
!
!
!
!
!
!
!
!
!
!
!
!!
!
!
!
!
!!
!
!
!
!
!
!
!
!
!
!
!
!
!
!
!
!
!
!
!
!
!
!
!
!
!
!!
!
!
!
!
!!
!
!
!
!
!
!
!
!
!
!
!
!
!
!
!
!
!
!
!
!
!
!
!!
!
!
!
!
!
!
!!
!
!
!
!
!
!
!
!
!
!
!
!
!
!
!
!
!
!
!
!
!
!
!
!
!
!!
!
!
!
!
!
!
!
!
!
!!
!
!
!
!
!!
!
!!
!
!
!
!
!
!
!
!
!
!
!
!
!
!
!
!
!
!
!
!
!
!
!
• Spills reported in over 100 countries
Global issue
Largest oil spill from a tanker was
tonnes in 1979287,000
!
ATLANTIC EMPRESS
6
OIL
TA
NKE
R SP
ILL
STA
TIST
ICS
2019
Major oil spills in history
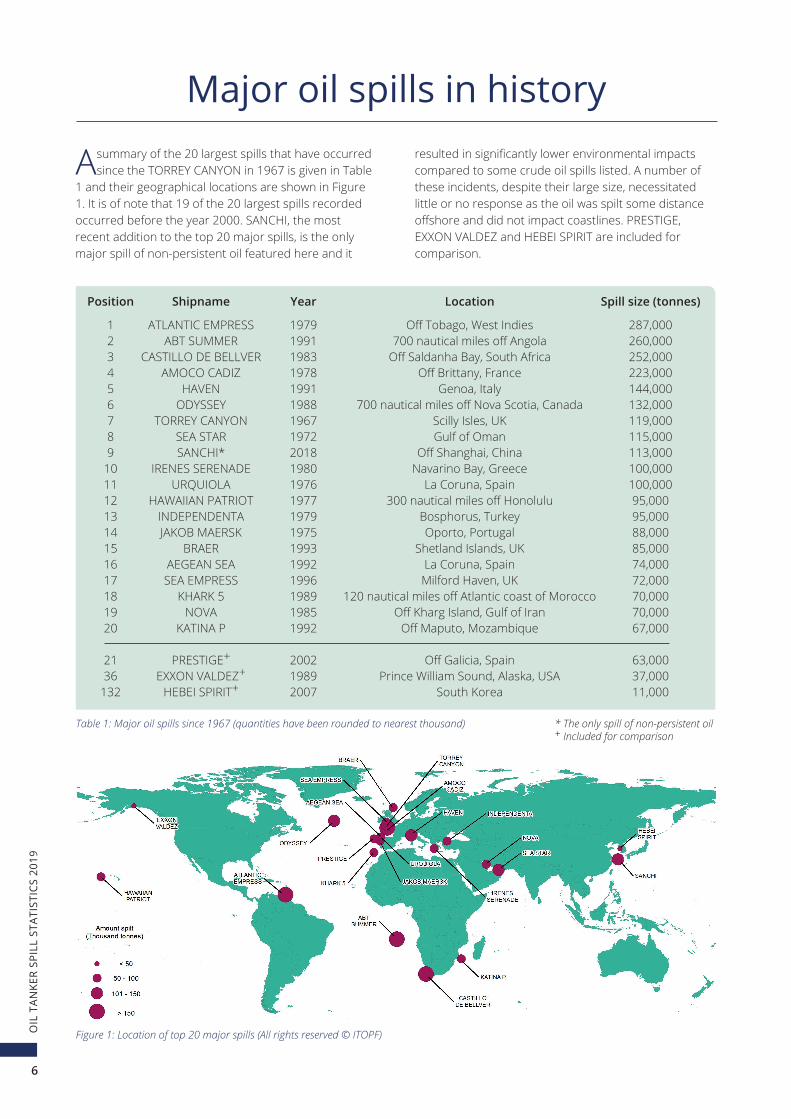
Asummary of the 20 largest spills that have occurred since the TORREY CANYON in 1967 is given in Table
1 and their geographical locations are shown in Figure 1. It is of note that 19 of the 20 largest spills recorded occurred before the year 2000. SANCHI, the most recent addition to the top 20 major spills, is the only major spill of non-persistent oil featured here and it
resulted in significantly lower environmental impacts compared to some crude oil spills listed. A number of these incidents, despite their large size, necessitated little or no response as the oil was spilt some distance offshore and did not impact coastlines. PRESTIGE, EXXON VALDEZ and HEBEI SPIRIT are included for comparison.
Position Shipname Year Location Spill size (tonnes)
1 ATLANTIC EMPRESS 1979 Off Tobago, West Indies 287,000 2 ABT SUMMER 1991 700 nautical miles off Angola 260,000 3 CASTILLO DE BELLVER 1983 Off Saldanha Bay, South Africa 252,000 4 AMOCO CADIZ 1978 Off Brittany, France 223,000 5 HAVEN 1991 Genoa, Italy 144,000 6 ODYSSEY 1988 700 nautical miles off Nova Scotia, Canada 132,000 7 TORREY CANYON 1967 Scilly Isles, UK 119,000 8 SEA STAR 1972 Gulf of Oman 115,000 9 SANCHI* 2018 Off Shanghai, China 113,000 10 IRENES SERENADE 1980 Navarino Bay, Greece 100,000 11 URQUIOLA 1976 La Coruna, Spain 100,000 12 HAWAIIAN PATRIOT 1977 300 nautical miles off Honolulu 95,000 13 INDEPENDENTA 1979 Bosphorus, Turkey 95,000 14 JAKOB MAERSK 1975 Oporto, Portugal 88,000 15 BRAER 1993 Shetland Islands, UK 85,000 16 AEGEAN SEA 1992 La Coruna, Spain 74,000 17 SEA EMPRESS 1996 Milford Haven, UK 72,000 18 KHARK 5 1989 120 nautical miles off Atlantic coast of Morocco 70,000 19 NOVA 1985 Off Kharg Island, Gulf of Iran 70,000 20 KATINA P 1992 Off Maputo, Mozambique 67,000 21 PRESTIGE+ 2002 Off Galicia, Spain 63,000 36 EXXON VALDEZ+ 1989 Prince William Sound, Alaska, USA 37,000 132 HEBEI SPIRIT+ 2007 South Korea 11,000
* The only spill of non-persistent oil+ Included for comparison
Table 1: Major oil spills since 1967 (quantities have been rounded to nearest thousand)
Figure 1: Location of top 20 major spills (All rights reserved © ITOPF)
7
OIL
TA
NKE
R SP
ILL
STA
TIST
ICS
2019
0
20
40
60
80
100
120
7-700 tonnes>700 tonnes
20182015201220092006200320001997199419911988198519821979197619731970
78.8
45.4
35.8
18.1
6.2
Num
ber
of S
pills
Average number of spills per year by decade
Over the last 50 years, there has been a marked downward trend in oil spills from tankers. Statistics for the frequency of spills greater than 7 tonnes is illustrated in Figure 2. The average number of spills per year in the
1970s was about 79 and has now decreased by over 90 percent to a low of 6.
Global oil spill trend
Figure 2: Number of spills (>7 tonnes) from 1970–2019
*This map represents nearly 90% of the spills (>7 tonnes) recorded in the ITOPF database. Records without specific location information have been omitted. Please note that approximate geographic coordinates have been used to map some records.
Figure 3: Location of spills >7 tonnes from 1970–2019 (All rights reserved © ITOPF)
* The only spill of non-persistent oil+ Included for comparison
8
OIL
TA
NKE
R SP
ILL
STA
TIST
ICS
2019
0
5
10
15
20
25
30
35
1970 1973 1976 1979 1982 1985 1988 1991 1994 1997 2000 2003 2006 2009 2012 2015 2018
Num
ber
of S
pills
1970-79: 24.5 spills per year
on average
1980-89: 9.4 spills per year
on average 1990-99:7.7 spills
per year on average
2000-09:3.2 spills
per year onaverage
2010-19:1.8 spills
per year onaverage
Number of oil spills
Over 80% of oil spills recorded in the last five decades fall into the smallest spill size category
(<7 tonnes). Unfortunately, reliable reporting of this category of spills is difficult to achieve as data is often incomplete. The following analysis therefore relates to large (>700 tonnes) and medium (7–700 tonnes) spills with a focus on identifying trends and revealing patterns in the data to present the most accurate result.
The number of large spills has continued to decrease over the last 50 years (Figure 4). The yearly average recorded this decade is 1.8 spills. To put this in perspective, this is less than a tenth of the average recorded in the 1970s. Also, it can be observed from
Figure 5 that 52% of all large spills recorded over the five decades occurred in the 1970s and only 4% was recorded this decade. It is, however, interesting to note that the progressive reduction in the number of large spills is significant when data is analysed per decade rather than annually, as demonstrated in Figure 4. Data recorded from 1970 to 2019 illustrate fluctuations in the yearly values within a decade.
A continuation of long-term decline can also be seen with medium sized spills (7–700 tonnes) as shown in Table 2 and Figure 6. The average number of spills per year this decade is 4.4, which is below a tenth of the average recorded in the 1970s.
Figure 4: Number of large spills (>700 tonnes) from 1970–2019
9
OIL
TA
NKE
R SP
ILL
STA
TIST
ICS
2019
Year 7–700 >700 Tonnes Tonnes 1970 7 29 1971 18 14 1972 48 27 1973 28 31 1974 90 27 1975 96 20 1976 67 26 1977 70 16 1978 59 23 1979 60 32
Total 543 245
Average 54.3 24.5
Year 7–700 >700 Tonnes Tonnes 1980 52 13 1981 54 7 1982 46 4 1983 52 13 1984 26 8 1985 33 8 1986 27 7 1987 27 11 1988 11 10 1989 32 13
Total 360 94
Average 36 9.4
Year 7–700 >700 Tonnes Tonnes 1990 50 14 1991 30 7 1992 31 10 1993 31 11 1994 26 9 1995 20 3 1996 20 3 1997 28 10 1998 25 5 1999 20 5
Total 281 77 Average 28.1 7.7
Year 7–700 >700 Tonnes Tonnes 2000 21 4 2001 18 3 2002 11 3 2003 19 4 2004 20 5 2005 22 3 2006 12 4 2007 12 3 2008 7 1 2009 7 2
Total 149 32 Average 14.9 3.2
Year 7–700 >700 Tonnes Tonnes 2010 5 4 2011 4 1 2012 7 0 2013 5 3 2014 4 1 2015 6 2 2016 4 1 2017 4 2 2018 3 3 2019 2 1
Total 44 18
Average 4.4 1.8
Table 2: Annual number of oil spills (>7 tonnes)
1970
s19
80s
1990
s
2000
s20
10s
10
OIL
TA
NKE
R SP
ILL
STA
TIST
ICS
2019 Figure 6: Number of medium (7–700 tonnes) and large (>700 tonnes) spills per decade from 1970–2019
543
360
281
149
44
245
9477
3218
1970s 1980s 1990s 2000s 2010s
7-700 tonnes
>700 tonnes
Figure 5: Large spills (>700 tonnes) as a percentage of those recorded from 1970–2019 per decade
1970s
1980s
1990s
2000s
2010s
245 incidents52 %
94 incidents20%
77 incidents17%
32 incidents7%
19 incidents4%
11
OIL
TA
NKE
R SP
ILL
STA
TIST
ICS
2019
Year Quantity (Tonnes) 1970 383,000 1971 144,000 1972 313,000 1973 159,000 1974 174,000 1975 352,000 1976 365,000 1977 276,000 1978 393,000 1979 636,000
Total 3,195,000
Year Quantity (Tonnes) 1980 206,000 1981 48,000 1982 12,000 1983 384,000 1984 29,000 1985 85,000 1986 19,000 1987 38,000 1988 190,000 1989 164,000
Total 1,175,000
Year Quantity (Tonnes) 1990 61,000 1991 431,000 1992 167,000 1993 140,000 1994 130,000 1995 12,000 1996 80,000 1997 72,000 1998 13,000 1999 28,000
Total 1,134,000
Year Quantity (Tonnes) 2000 14,000 2001 9,000 2002 66,000 2003 43,000 2004 17,000 2005 15,000 2006 12,000 2007 15,000 2008 2,000 2009 3,000
Total 196,000
Year Quantity (Tonnes) 2010 12,000 2011 2,000 2012 1,000 2013 7,000 2014 5,000 2015 7,000 2016 6,000 2017 7,000 2018 116,000 2019 1,000
Total 164,000
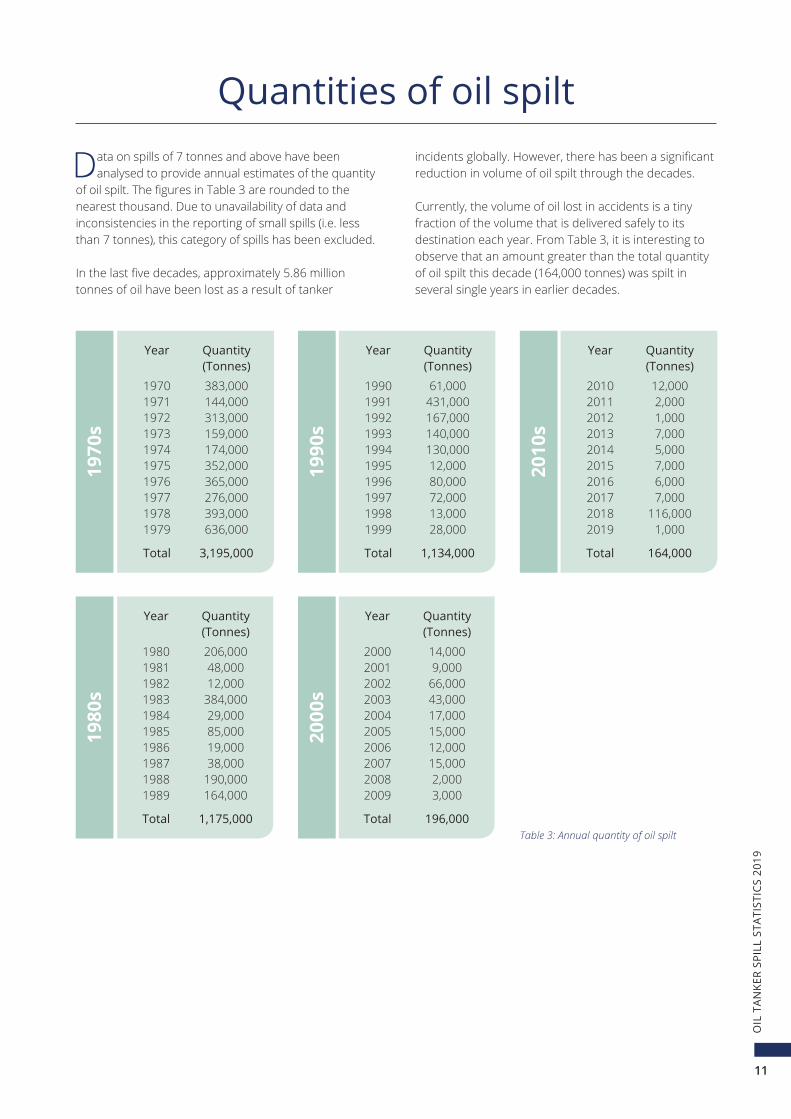
Table 3: Annual quantity of oil spilt
Data on spills of 7 tonnes and above have been analysed to provide annual estimates of the quantity
of oil spilt. The figures in Table 3 are rounded to the nearest thousand. Due to unavailability of data and inconsistencies in the reporting of small spills (i.e. less than 7 tonnes), this category of spills has been excluded.
In the last five decades, approximately 5.86 million tonnes of oil have been lost as a result of tanker
Quantities of oil spiltincidents globally. However, there has been a significant reduction in volume of oil spilt through the decades.
Currently, the volume of oil lost in accidents is a tiny fraction of the volume that is delivered safely to its destination each year. From Table 3, it is interesting to observe that an amount greater than the total quantity of oil spilt this decade (164,000 tonnes) was spilt in several single years in earlier decades.
1970
s19
80s
1990
s20
00s
2010
s
12
OIL
TA
NKE
R SP
ILL
STA
TIST
ICS
2019
51% from 768 incidents 29% from
444 incidents27% from
348 incidents
25% from 171 incidents 9% from 52 incidents
49% from 20 incidents
71% from 10 incidents
73% from 10 incidents
75% from 10 incidents 91% from 10 incidents
0
0.5
1
1.5
2
2.5
3
3.5
1970s 1980s 1990s 2000s 2010s
Mil
lion
ton
nes
of o
il s
pil
tInfluence of large spills on
quantities of oil spilt
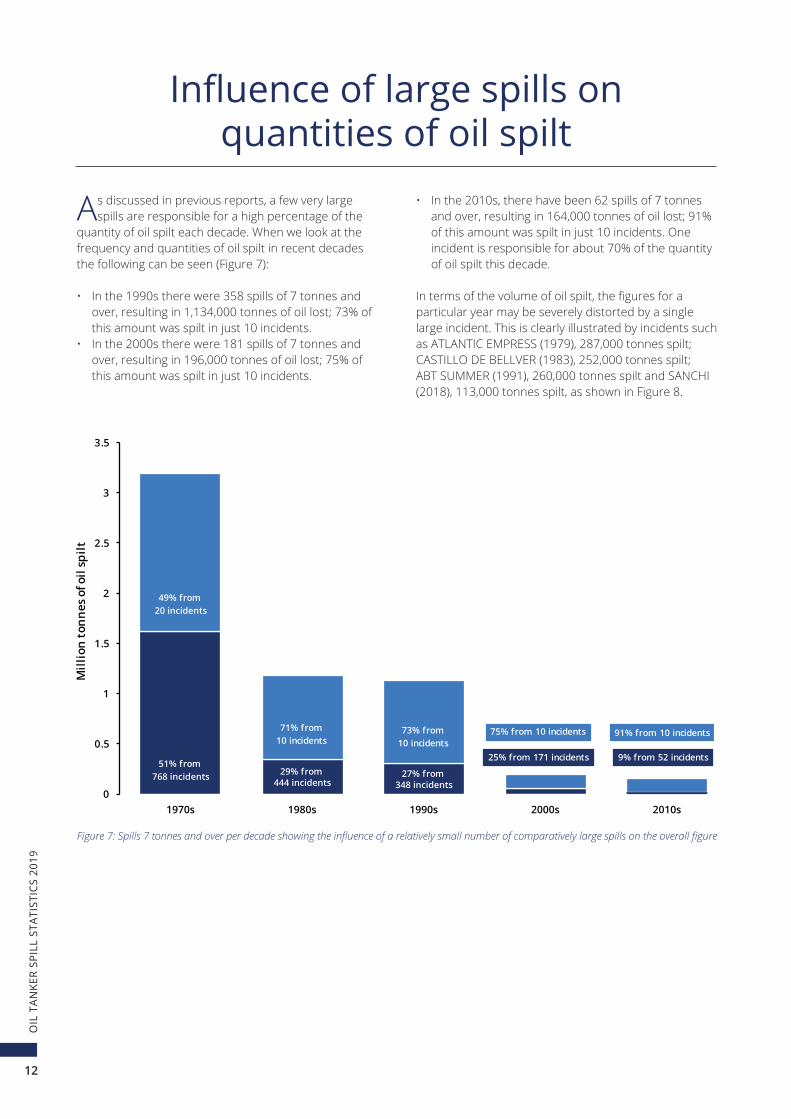
Figure 7: Spills 7 tonnes and over per decade showing the influence of a relatively small number of comparatively large spills on the overall figure
As discussed in previous reports, a few very large spills are responsible for a high percentage of the
quantity of oil spilt each decade. When we look at the frequency and quantities of oil spilt in recent decades the following can be seen (Figure 7):
• In the 1990s there were 358 spills of 7 tonnes and over, resulting in 1,134,000 tonnes of oil lost; 73% of this amount was spilt in just 10 incidents.
• In the 2000s there were 181 spills of 7 tonnes and over, resulting in 196,000 tonnes of oil lost; 75% of this amount was spilt in just 10 incidents.
• In the 2010s, there have been 62 spills of 7 tonnes and over, resulting in 164,000 tonnes of oil lost; 91% of this amount was spilt in just 10 incidents. One incident is responsible for about 70% of the quantity of oil spilt this decade.
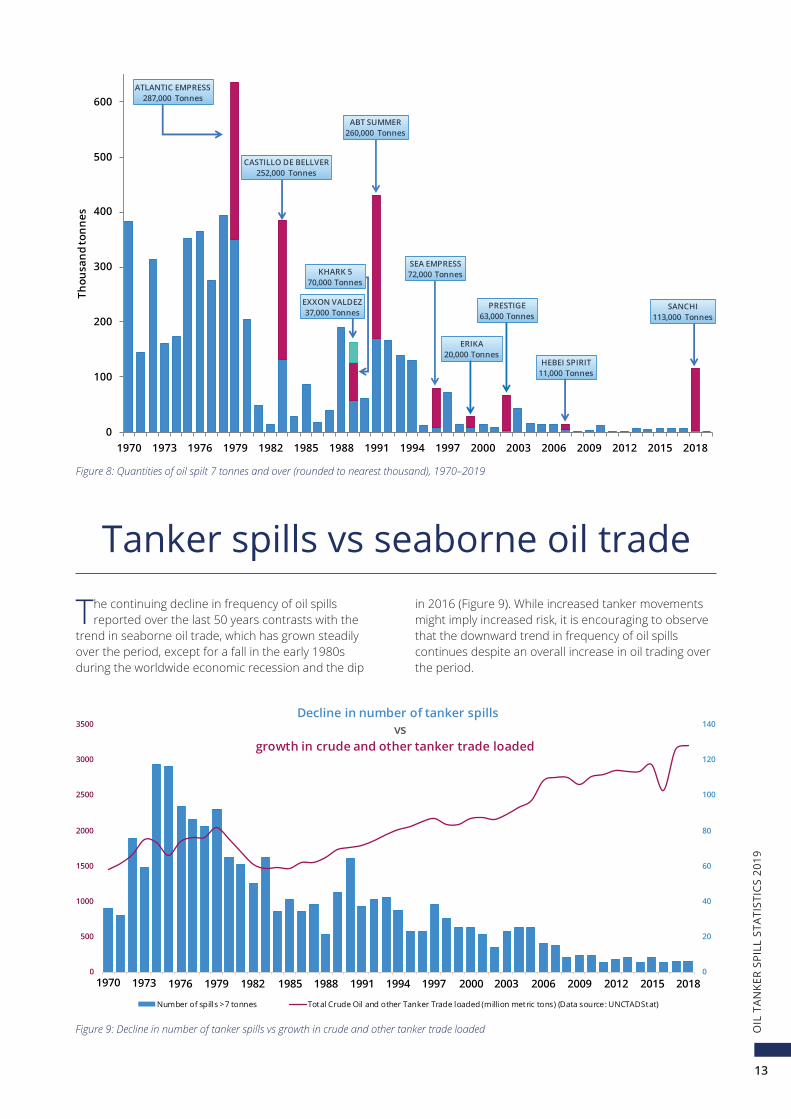
In terms of the volume of oil spilt, the figures for a particular year may be severely distorted by a single large incident. This is clearly illustrated by incidents such as ATLANTIC EMPRESS (1979), 287,000 tonnes spilt; CASTILLO DE BELLVER (1983), 252,000 tonnes spilt; ABT SUMMER (1991), 260,000 tonnes spilt and SANCHI (2018), 113,000 tonnes spilt, as shown in Figure 8.
13
OIL
TA
NKE
R SP
ILL
STA
TIST
ICS
2019
0
500
1000
1500
2000
2500
3000
3500
1970 1973 1976 1979 1982 1985 1988 1991 1994 1997 2000 2003 2006 2009 2012 2015 20180
20
40
60
80
100
120
140Decline in number of tanker spills
vs growth in crude and other tanker trade loaded
Number of spills >7 tonnes Total Crude Oil and other Tanker Trade loaded (million metric tons) (Data source: UNCTADS tat)
Tanker spills vs seaborne oil trade
Figure 9: Decline in number of tanker spills vs growth in crude and other tanker trade loaded
The continuing decline in frequency of oil spills reported over the last 50 years contrasts with the
trend in seaborne oil trade, which has grown steadily over the period, except for a fall in the early 1980s during the worldwide economic recession and the dip
in 2016 (Figure 9). While increased tanker movements might imply increased risk, it is encouraging to observe that the downward trend in frequency of oil spills continues despite an overall increase in oil trading over the period.
ATLANTIC EMPRESS287,000 Tonnes
CASTILLO DE BELLVER252,000 Tonnes
KHARK 570,000 Tonnes
ABT SUMMER260,000 Tonnes
SEA EMPRESS72,000 Tonnes
ERIKA20,000 Tonnes
PRESTIGE63,000 Tonnes
HEBEI SPIRIT11,000 Tonnes
SANCHI113,000 Tonnes
EXXON VALDEZ37,000 Tonnes
0
100
200
300
400
500
600
700
1970 1973 1976 1979 1982 1985 1988 1991 1994 1997 2000 2003 2006 2009 2012 2015 2018
Thou
san
d to
nn
es
Figure 8: Quantities of oil spilt 7 tonnes and over (rounded to nearest thousand), 1970–2019
14
OIL
TA
NKE
R SP
ILL
STA
TIST
ICS
2019
27%
20%7%
15%
3%
13%
15%
30%
32%
13%
4%
11%
7%3%
Allision/Collision
Grounding
Hull Failure
Equipment Failure
Fire/Explosion
Other
Unknown
0% 20% 40%
2010s
2000s
1990s
1980s
1970s
ALLISION/COLLISION
0% 20% 40%
EQUIPMENT FAILURE
0% 20% 40%
HULL FAILURE
0% 20% 40%
FIRE/EXPLOSION
0% 20% 40%
GROUNDING
0% 20% 40%
OTHER
Causes of spills
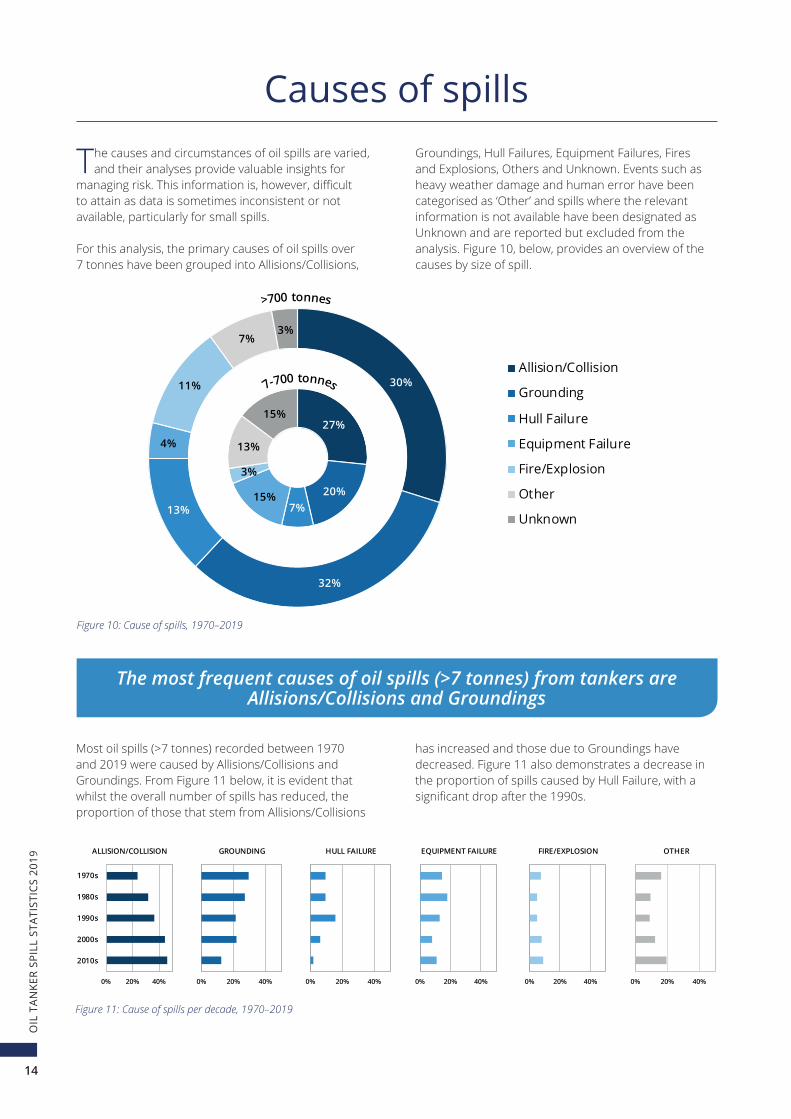
The causes and circumstances of oil spills are varied, and their analyses provide valuable insights for
managing risk. This information is, however, difficult to attain as data is sometimes inconsistent or not available, particularly for small spills.
For this analysis, the primary causes of oil spills over 7 tonnes have been grouped into Allisions/Collisions,
Groundings, Hull Failures, Equipment Failures, Fires and Explosions, Others and Unknown. Events such as heavy weather damage and human error have been categorised as ‘Other’ and spills where the relevant information is not available have been designated as Unknown and are reported but excluded from the analysis. Figure 10, below, provides an overview of the causes by size of spill.
Figure 10: Cause of spills, 1970–2019
Most oil spills (>7 tonnes) recorded between 1970 and 2019 were caused by Allisions/Collisions and Groundings. From Figure 11 below, it is evident that whilst the overall number of spills has reduced, the proportion of those that stem from Allisions/Collisions
has increased and those due to Groundings have decreased. Figure 11 also demonstrates a decrease in the proportion of spills caused by Hull Failure, with a significant drop after the 1990s.
The most frequent causes of oil spills (>7 tonnes) from tankers are Allisions/Collisions and Groundings
Figure 11: Cause of spills per decade, 1970–2019
15
OIL
TA
NKE
R SP
ILL
STA
TIST
ICS
2019
29%
2%
14%
55%
Loading/Discharging
Bunkering
Other Operations
Unknown
7-700 tonnes
9%
<1%
4%2%
17%
50%
18% Loading/Discharging
Bunkering
At Anchor (Inland/Restricted)
At Anchor (Open Water)
Underway (Inland/Restricted)
Underway (Open Water)
Other/Unknown
>700 tonnes
29%
2%
14%
55%
Loading/Discharging
Bunkering
Other Operations
Unknown
7-700 tonnes
9%
<1%
4%2%
17%
50%
18% Loading/Discharging
Bunkering
At Anchor (Inland/Restricted)
At Anchor (Open Water)
Underway (Inland/Restricted)
Underway (Open Water)
Other/Unknown
>700 tonnes
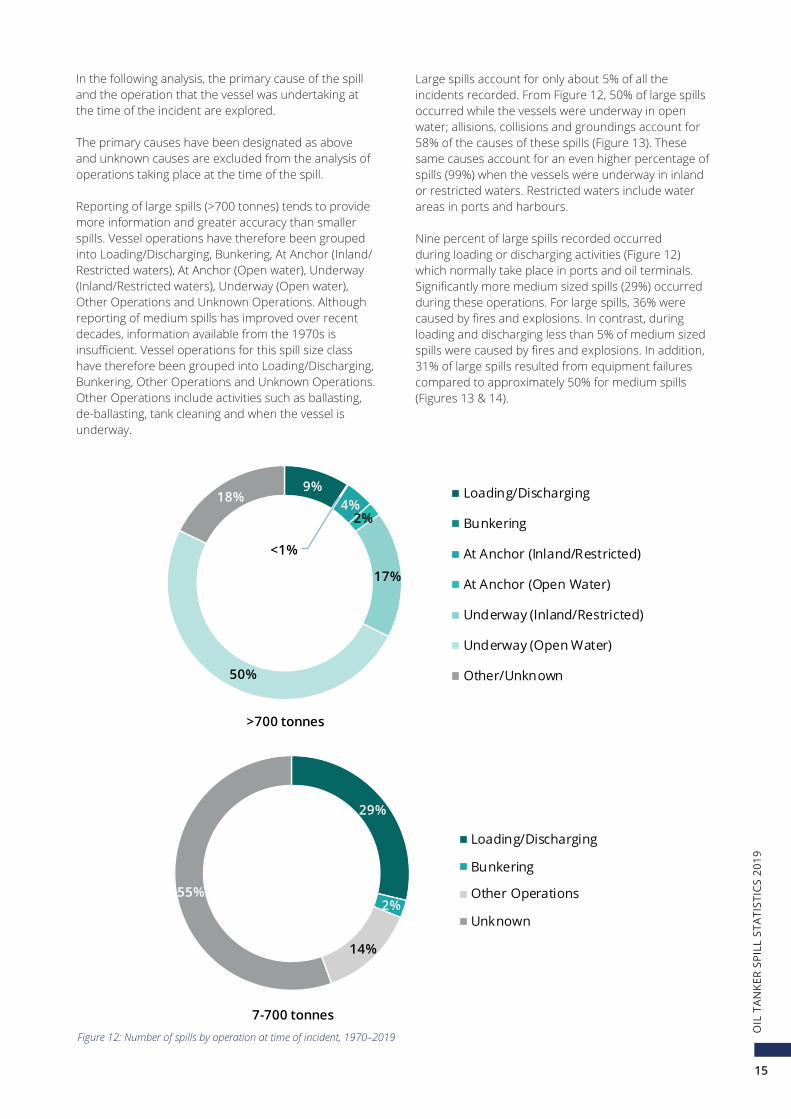
In the following analysis, the primary cause of the spill and the operation that the vessel was undertaking at the time of the incident are explored.
The primary causes have been designated as above and unknown causes are excluded from the analysis of operations taking place at the time of the spill.
Reporting of large spills (>700 tonnes) tends to provide more information and greater accuracy than smaller spills. Vessel operations have therefore been grouped into Loading/Discharging, Bunkering, At Anchor (Inland/Restricted waters), At Anchor (Open water), Underway (Inland/Restricted waters), Underway (Open water), Other Operations and Unknown Operations. Although reporting of medium spills has improved over recent decades, information available from the 1970s is insufficient. Vessel operations for this spill size class have therefore been grouped into Loading/Discharging, Bunkering, Other Operations and Unknown Operations. Other Operations include activities such as ballasting, de-ballasting, tank cleaning and when the vessel is underway.
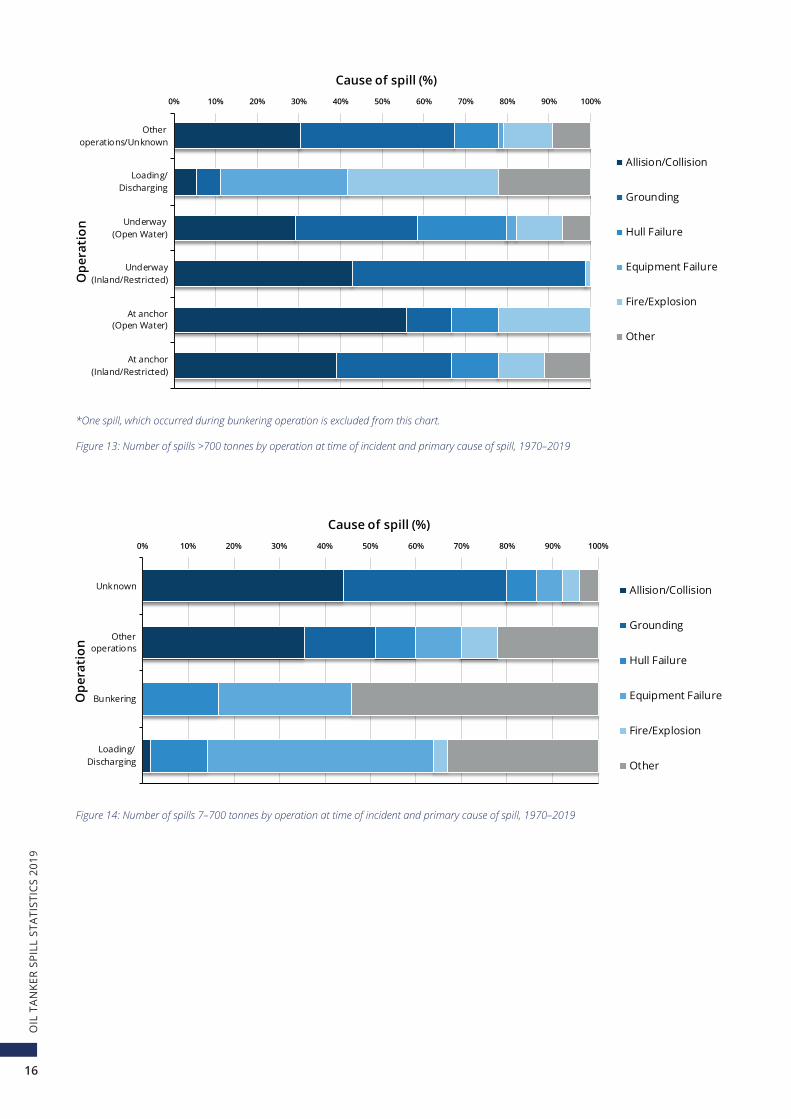
Large spills account for only about 5% of all the incidents recorded. From Figure 12, 50% of large spills occurred while the vessels were underway in open water; allisions, collisions and groundings account for 58% of the causes of these spills (Figure 13). These same causes account for an even higher percentage of spills (99%) when the vessels were underway in inland or restricted waters. Restricted waters include water areas in ports and harbours.
Nine percent of large spills recorded occurred during loading or discharging activities (Figure 12) which normally take place in ports and oil terminals. Significantly more medium sized spills (29%) occurred during these operations. For large spills, 36% were caused by fires and explosions. In contrast, during loading and discharging less than 5% of medium sized spills were caused by fires and explosions. In addition, 31% of large spills resulted from equipment failures compared to approximately 50% for medium spills (Figures 13 & 14).
Figure 12: Number of spills by operation at time of incident, 1970–2019
16
OIL
TA
NKE
R SP
ILL
STA
TIST
ICS
2019
0% 10% 20% 30% 40% 50% 60% 70% 80% 90% 100%
Loading/Discharging
Bunkering
Otheroperations
Unknown
Ope
rati
on
Cause of spill (%)
Allision/Collision
Grounding
Hull Failure
Equipment Failure
Fire/Explosion
Other
Figure 14: Number of spills 7–700 tonnes by operation at time of incident and primary cause of spill, 1970–2019
0% 10% 20% 30% 40% 50% 60% 70% 80% 90% 100%
At anchor(Inland/Restricted)
At anchor(Open Water)
Underway(Inland/Restricted)
Underway(Open Water)
Loading/Discharging
Otheroperations/Unknown
Ope
rati
onCause of spill (%)
Allision/Collision
Grounding
Hull Failure
Equipment Failure
Fire/Explosion
Other
*One spill, which occurred during bunkering operation is excluded from this chart.
Figure 13: Number of spills >700 tonnes by operation at time of incident and primary cause of spill, 1970–2019
17
OIL
TA
NKE
R SP
ILL
STA
TIST
ICS
2019
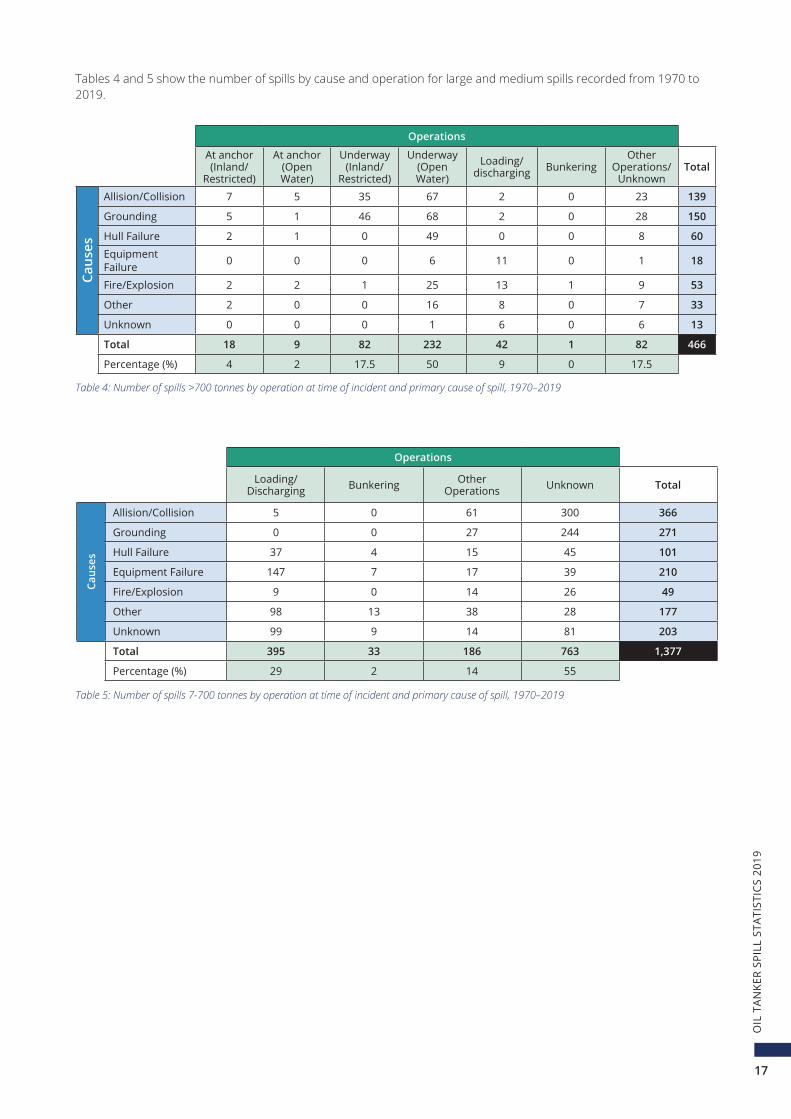
Operations
At anchor (Inland/
Restricted)
At anchor (Open Water)
Underway (Inland/
Restricted)
Underway (Open Water)
Loading/discharging Bunkering
Other Operations/
UnknownTotal
Caus
es
Allision/Collision 7 5 35 67 2 0 23 139
Grounding 5 1 46 68 2 0 28 150
Hull Failure 2 1 0 49 0 0 8 60
Equipment Failure 0 0 0 6 11 0 1 18
Fire/Explosion 2 2 1 25 13 1 9 53
Other 2 0 0 16 8 0 7 33
Unknown 0 0 0 1 6 0 6 13
Total 18 9 82 232 42 1 82 466
Percentage (%) 4 2 17.5 50 9 0 17.5
Operations
Loading/Discharging Bunkering Other
Operations Unknown Total
Caus
es
Allision/Collision 5 0 61 300 366
Grounding 0 0 27 244 271
Hull Failure 37 4 15 45 101
Equipment Failure 147 7 17 39 210
Fire/Explosion 9 0 14 26 49
Other 98 13 38 28 177
Unknown 99 9 14 81 203
Total 395 33 186 763 1,377
Percentage (%) 29 2 14 55
Tables 4 and 5 show the number of spills by cause and operation for large and medium spills recorded from 1970 to 2019.
Table 5: Number of spills 7-700 tonnes by operation at time of incident and primary cause of spill, 1970–2019
Table 4: Number of spills >700 tonnes by operation at time of incident and primary cause of spill, 1970–2019
18
OIL
TA
NKE
R SP
ILL
STA
TIST
ICS
2019
9
5
7
8
5
8
5
6 6
3
0
2
4
6
8
10
2010 2011 2012 2013 2014 2015 2016 2017 2018 2019
Nu
mb
er o
f Sp
ills
(>7
ton
nes
)
Average of 6.2,66% down
from previous decade
Spills recorded in 2019
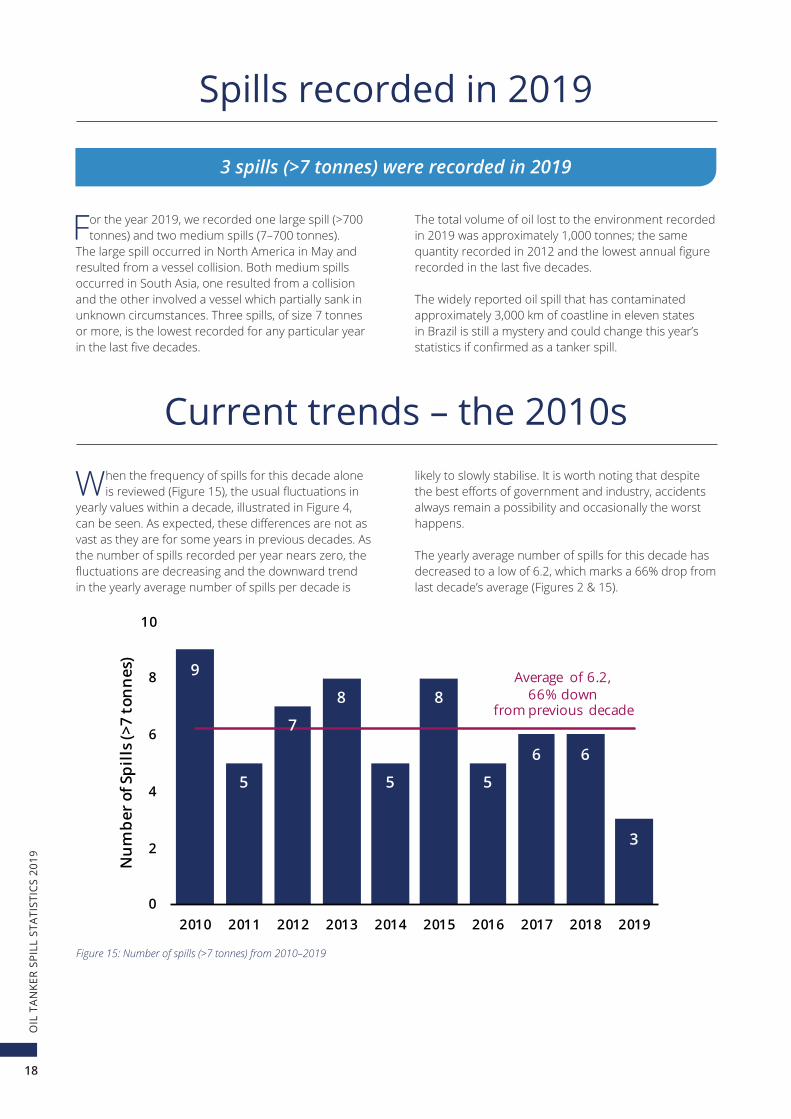
For the year 2019, we recorded one large spill (>700 tonnes) and two medium spills (7–700 tonnes).
The large spill occurred in North America in May and resulted from a vessel collision. Both medium spills occurred in South Asia, one resulted from a collision and the other involved a vessel which partially sank in unknown circumstances. Three spills, of size 7 tonnes or more, is the lowest recorded for any particular year in the last five decades.
The total volume of oil lost to the environment recorded in 2019 was approximately 1,000 tonnes; the same quantity recorded in 2012 and the lowest annual figure recorded in the last five decades.
The widely reported oil spill that has contaminated approximately 3,000 km of coastline in eleven states in Brazil is still a mystery and could change this year’s statistics if confirmed as a tanker spill.
3 spills (>7 tonnes) were recorded in 2019
Current trends – the 2010s
When the frequency of spills for this decade alone is reviewed (Figure 15), the usual fluctuations in
yearly values within a decade, illustrated in Figure 4, can be seen. As expected, these differences are not as vast as they are for some years in previous decades. As the number of spills recorded per year nears zero, the fluctuations are decreasing and the downward trend in the yearly average number of spills per decade is
likely to slowly stabilise. It is worth noting that despite the best efforts of government and industry, accidents always remain a possibility and occasionally the worst happens.
The yearly average number of spills for this decade has decreased to a low of 6.2, which marks a 66% drop from last decade’s average (Figures 2 & 15).
Figure 15: Number of spills (>7 tonnes) from 2010–2019
19
OIL
TA
NKE
R SP
ILL
STA
TIST
ICS
2019
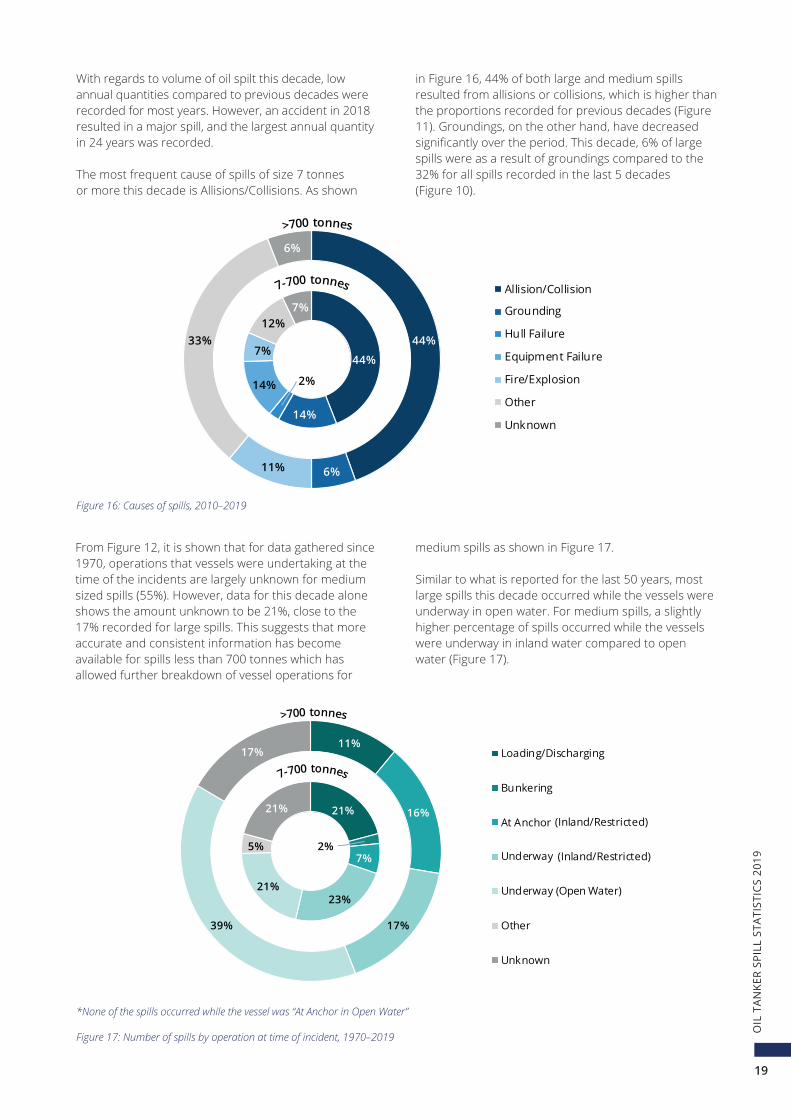
With regards to volume of oil spilt this decade, low annual quantities compared to previous decades were recorded for most years. However, an accident in 2018 resulted in a major spill, and the largest annual quantity in 24 years was recorded.
The most frequent cause of spills of size 7 tonnes or more this decade is Allisions/Collisions. As shown
in Figure 16, 44% of both large and medium spills resulted from allisions or collisions, which is higher than the proportions recorded for previous decades (Figure 11). Groundings, on the other hand, have decreased significantly over the period. This decade, 6% of large spills were as a result of groundings compared to the 32% for all spills recorded in the last 5 decades (Figure 10).
From Figure 12, it is shown that for data gathered since 1970, operations that vessels were undertaking at the time of the incidents are largely unknown for medium sized spills (55%). However, data for this decade alone shows the amount unknown to be 21%, close to the 17% recorded for large spills. This suggests that more accurate and consistent information has become available for spills less than 700 tonnes which has allowed further breakdown of vessel operations for
medium spills as shown in Figure 17.
Similar to what is reported for the last 50 years, most large spills this decade occurred while the vessels were underway in open water. For medium spills, a slightly higher percentage of spills occurred while the vessels were underway in inland water compared to open water (Figure 17).
*None of the spills occurred while the vessel was “At Anchor in Open Water”
Figure 17: Number of spills by operation at time of incident, 1970–2019
21%
2%7%
23%21%
5%
21%
11%
16%
17%39%
17% Loading/Discharging
Bunkering
At Anchor
Underway
Underway (Open Water)
Other
Unknown
44%
14%
14%
7%
12%7%
44%
6%11%
33%
6%
Allision/Collision
Grounding
Hull Failure
Equipment Failure
Fire/Explosion
Other
Unknown
(Inland/Restricted)
(Inland/Restricted)2%
21%
2%7%
23%21%
5%
21%
11%
16%
17%39%
17% Loading/Discharging
Bunkering
At Anchor
Underway
Underway (Open Water)
Other
Unknown
44%
14%
14%
7%
12%7%
44%
6%11%
33%
6%
Allision/Collision
Grounding
Hull Failure
Equipment Failure
Fire/Explosion
Other
Unknown
(Inland/Restricted)
(Inland/Restricted)2%
Figure 16: Causes of spills, 2010–2019

ITOPF Limited1 Oliver’s Yard, 55 City Road, London EC1Y 1DT, UKRegistered Office – No. 944863
Tel: +44 (0)20 7566 699924hr: +44 (0)20 7566 6998Email: [email protected]: www.itopf.org
© 2020 ITO
PF Limited