Embed Size (px)
Citation preview

Office of the OmbudsmanState of Hawaii
Fiscal Year 2019-2020Report Number 51
State of Hawaii
Report of the Ombudsman
For the Period July 1, 2019 - June 30, 2020 Report No. 51
Presented to the Legislature pursuant to Section 96-16 of the Hawaii Revised Statutes
April 2021


TABLE OF CONTENTS Page LETTER OF TRANSMITTAL I. THE CORONAVIRUS PANDEMIC ....................................................... 1 II. THE YEAR IN BRIEF ............................................................................ 3
Total Inquiries Received ........................................................................ 3
Two-Year Comparison ................................................................... 3
Staff Notes ............................................................................................ 4
Staff Activities ........................................................................................ 4 III. STATISTICAL TABLES ........................................................................ 7
Description of Terms Used in Statistical Tables ................................... 7
Table 1 Numbers and Types of Inquiries ............................................. 9
Table 2 Means by Which Inquiries Are Received .............................. 11
Table 3 Distribution of Population and Inquirers by Residence ......... 13
Table 4 Distribution of Types of Inquiries by
Residence of Inquirers .......................................................... 15
Table 5 Means of Receipt of Inquiries by Residence ........................ 17
Table 6 Distribution and Disposition of Jurisdictional Complaints by Agency .......................................................... 19
Table 7 Distribution and Disposition of Substantiated Jurisdictional Complaints by Agency .................................... 21
Table 8 Distribution of Information Requests ..................................... 23
Table 9 Distribution of Non-Jurisdictional Complaints ....................... 25
Table10 Inquiries Carried Over to Fiscal Year 2019-2020 and Their Dispositions, and Inquiries Carried Over to Fiscal Year 2020-2021 .......................................................... 27
Appendix CUMULATIVE INDEX OF SELECTED CASE SUMMARIES .................... 29

1
Chapter I
THE CORONAVIRUS PANDEMIC On December 31, 2019, health officials in Wuhan, China, notified the World Health Organization (WHO) of a cluster of pneumonia-like illnesses, the origin of which was unknown. On January 9, 2020, the WHO announced that the illness may be caused by a new coronavirus, which would later be identified as the 2019 Novel Coronavirus, or 2019-nCoV. On January 20, 2020, cases of this illness were reported in Thailand and Japan, and on January 21, the Centers for Disease Control and Prevention (CDC) confirmed the first case of 2019-nCoV in the United States in the state of Washington. The illness continued to spread through human-to-human transmission and on January 30, with more than 9,800 confirmed cases and over 200 deaths around the globe, the WHO declared the 2019-nCoV a global health emergency. On February 11, the WHO announced an official name for the 2019-nCoV as COVID-19, short for “coronavirus disease 2019,” and on March 11, 2020, declared the COVID-19 outbreak a global pandemic. With COVID-19 spreading rapidly and confirmed cases being reported in 78 countries, on March 4, 2020, Governor David Ige issued an emergency proclamation allowing for certain statutes to be suspended so that government agencies could prepare themselves and the public to combat the outbreak. On March 22, 2020, Honolulu Mayor Kirk Caldwell issued an emergency order requiring all persons in the City and County of Honolulu to stay at their place of residence, except to perform essential government or business functions and to access essential services. On March 23, 2020, Governor Ige issued a third supplementary emergency proclamation ordering all persons in the State of Hawaii to stay in their place of residence starting March 25, 2021, except for work in essential businesses or operations. The proclamation also mandated social distancing and other requirements to help prevent the spread of COVID-19. These orders were extended and remained in place through the end of the fiscal year. We consider the services that our office provides to the public to be essential and the Legislature agreed, so in order to continue operations, we immediately took steps to prevent the spread of COVID-19 within the office, including installing partitions in shared work areas, purchasing hand sanitizer dispensing stations, and establishing protocols for temperature checks, movement by staff within the office, and disinfecting of high-touch surfaces. In addition, although it would negatively impact our efficiency, we restricted the number of employees who could work within the office at any given time from 14 employees to 5 employees and stopped accepting walk-in complainants to further minimize the potential for spreading COVID-19 in the office. We continued to accept complaints via telephone, postal mail, email, and fax and to investigate complaints that were determined to be appropriate
2
for investigation as timely and thoroughly as possible without jeopardizing the health of our employees. As agencies at the state and county levels of government in Hawaii acted to comply with the emergency orders, including configuring their work spaces and adjusting in-office staffing levels to prevent the spread of COVID-19, we expected a decrease in the level and timeliness of government services being provided to the public, and a resulting increase in the number of complaints filed with our office. In total, we did not experience the increase in number of complaints that we expected during the first three months following the Governor’s third supplementary emergency proclamation, as a 9.2 percent decrease in the number of prison-related complaints offset a 9.3 percent increase in complaints against other jurisdictional agencies. However, from July 1, 2020, through December 31, 2020, we received over 20 percent more jurisdictional complaints than we did during the corresponding period in 2019. Prison-related complaints increased by 8.6 percent and complaints against other jurisdictional agencies increased by 41.7 percent. In addition, complainants, in general, have followed up more frequently on their complaints, in some cases with multiple telephone calls or emails daily, requiring our office to spend significantly more time on each case just in responding to and documenting the inquiries. Consequently, while our caseload during the first half of the current fiscal year increased by 20 percent, our workload increased by approximately 40 percent during this period. It is important for the Legislature and public to know that the stress on the staff of our office to continue to provide timely service to the public during this period has been compounded by a significant and troubling increase in the frequency of threats by complainants against our staff when we are unable to provide the complainant the remedy the complainant is seeking. The office is fortunate to have staff who are tolerant of the threats and abusive language directed toward them; who understand the important role our office serves and who continue to treat each complainant respectfully and professionally, while remaining empathetic to the complainant’s situation.
3
Chapter II
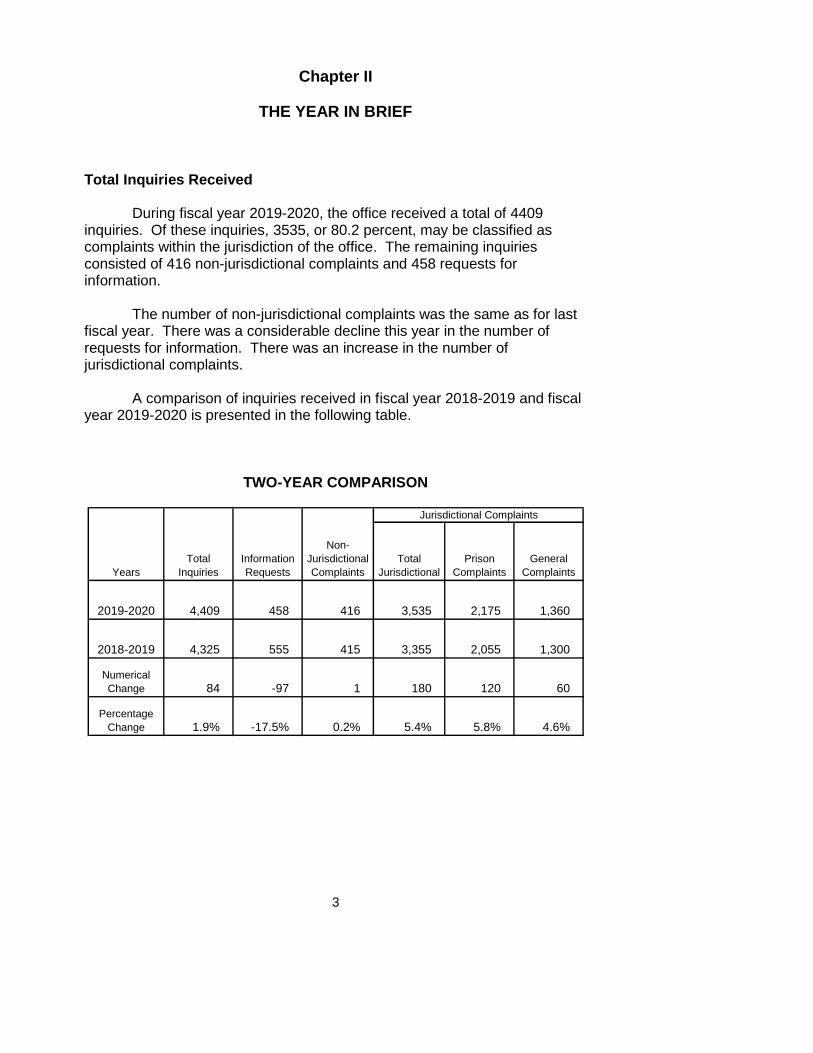
THE YEAR IN BRIEF Total Inquiries Received During fiscal year 2019-2020, the office received a total of 4409 inquiries. Of these inquiries, 3535, or 80.2 percent, may be classified as complaints within the jurisdiction of the office. The remaining inquiries consisted of 416 non-jurisdictional complaints and 458 requests for information. The number of non-jurisdictional complaints was the same as for last fiscal year. There was a considerable decline this year in the number of requests for information. There was an increase in the number of jurisdictional complaints. A comparison of inquiries received in fiscal year 2018-2019 and fiscal year 2019-2020 is presented in the following table.
TWO-YEAR COMPARISON
Jurisdictional Complaints
Years
Total
Inquiries
Information
Requests
Non-
Jurisdictional
Complaints
Total
Jurisdictional
Prison
Complaints
General
Complaints
2019-2020 4,409 458 416 3,535 2,175 1,360
2018-2019 4,325 555 415 3,355 2,055 1,300
Numerical
Change 84 -97 1 180 120 60
Percentage
Change 1.9% -17.5% 0.2% 5.4% 5.8% 4.6%

4
Staff Notes
In July 2019, Drake Akiyoshi joined our office as an Analyst. Prior to joining our team, Mr. Akiyoshi was employed at the Department of Commerce and Consumer Affairs. Mr. Akiyoshi is a graduate of Wayland Baptist University, where he earned a Bachelor of Applied Science degree in Justice Administration.
In March 2020, Analyst Sean Aronson resigned from our office. We
wish Mr. Aronson the best in his new endeavors. In June 2020, Analyst Drake Akiyoshi accepted a position with the
federal government. We wish Mr. Akiyoshi the best as he pursues his new career.
At the end of fiscal year 2020, our office staff consisted of
Ombudsman Robin Matsunaga; First Assistant Melissa Chee; Senior Analyst Rene Dela Cruz, Analysts Herbert Almeida, Yvonne Jinbo, Gansin Li, Marcie McWayne, and Ryan Yeh; Administrative Services Officer Cindy Yee; and Administrative Assistants Sheila Alderman, Carliza Elido, and Debbie Goya.
Staff Activities In September 2019, our office hosted the 40th Annual Conference of
the United States Ombudsman Association (USOA) in Honolulu, Hawaii. The USOA Annual Conference continues to provide the most relevant training for public sector ombudsman offices that investigate complaints about administrative acts of government agencies. In addition to providing attendees new ideas, skills, and tools for handling complaints, it provides opportunities for attendees to network with peers for technical and moral support. The 40th Annual Conference also provided attendees, over 100 individuals from 27 states and 11 countries, an opportunity to experience the unique culture of Hawaii.
We sincerely thank Kumu Hula Todd Punawai Jinbo for providing a
Hawaiian chant and Senator Jarett Keohokalole for his warm welcome remarks to the attendees at the opening of the 40th Annual Conference. We also thank Kumu Hinaleimoana Wong-Kalu for her engaging keynote address that captured the attention and emotions of each attendee.
Ombudsman Matsunaga was one of several instructors who
conducted a two-day training workshop for new ombudsman that immediately preceded the 40th Annual Conference. Other conference attendees from our office included Herbert Almeida, Drake Akiyoshi, Sean Aronson, Yvonne Jinbo, Marcie McWayne, and Ryan Yeh. At the annual membership meeting during the 40th Annual Conference, Ombudsman Matsunaga was elected by
5
the 2019-2021 USOA Board of Directors to serve a fifth consecutive term as President of the USOA Board.
On January 2, 2020, Mr. Ryuhei Kawada, a member of the House of
Councillors, the National Diet (Parliament) of Japan, and his wife, Mika, visited our office. The House of Councillors is the upper house of the bicameral Japanese Parliament. Mr. Kawada is the Chair of the Committee on Oversight of Administration. During their visit, Ombudsman Matsunaga discussed our office’s complaint handling process and standards of practice for governmental ombudsman offices, as well as Mr. Kawada’s efforts to establish similar services in Japan.
On January 14, 2020, Ombudsman Matsunaga met with delegates
from the Myanmar Anti-Corruption Commission, along with their support staff and interpreters. Commission Chairman U Aung Kyi shared information on the Commission’s role and function and Ombudsman Matsunaga answered questions from the delegates regarding our office’s complaint handling process and the classical model of ombudsman practice.
On March 17, 2020, Ombudsman Matsunaga was an online guest
lecturer for a graduate course on Public Sector Ombudsman Practices and Principles at California State University, Dominguez Hills. Ombudsman Matsunaga provided 13 highly motivated students a background of the public sector ombudsman models of practice before discussing the future of the profession in the United States.

6

7
CHAPTER III
STATISTICAL TABLES Description of Terms Used in Statistical Tables
The statistical tables provide information on two basic types of inquiries – information requests and complaints.
Information requests are inquiries regarding matters not
related to the operations of our office for which we provide a response or referral, such as to another government agency or a private entity. Thus, requests for records and queries regarding our office’s function, jurisdiction, etc., are not included in this statistic.
There are two types of complaints - jurisdictional and non-
jurisdictional. A jurisdictional complaint is one that our office is authorized to investigate; that is, a complaint about an administrative act of a Hawaii state executive branch or county agency, except for the governor, lieutenant governor, and county mayors and councils. All other complaints are non-jurisdictional. For a non-jurisdictional complaint, we try to refer the complainant to a governmental agency or private entity that we believe may be able to help the complainant.
Table 6 provides statistical information on the disposition of
jurisdictional complaints. Our office has authority to decide whether to investigate or not investigate a jurisdictional complaint. There are four ways that a jurisdictional complaint may be disposed of - declined, assisted, discontinued, or completed. Complaints that are still open at the close of the fiscal year are reported as pending complaints.
A declined complaint is one that we determine is not
appropriate for investigation by our office at the time the complaint is received. There are various reasons why we may decline to investigate, the most common of which are that there is a formal administrative appeal process that the complainant should use; the complainant has not yet attempted to informally resolve the complaint with the agency; or the action being complained of occurred too long ago. We also decline to investigate secondhand complaints due to concerns about the accuracy of information provided by the complainant and because we do not know if the aggrieved individual wants our office to investigate.
8
An assisted complaint is one that we determine is not appropriate for investigation, but due to the nature of the complaint, we contact the agency the complaint is against, inform it of the nature of the complaint, and ask it to contact the complainant directly to address the matter. We invite the complainant to contact us again if the complainant does not hear from the agency or is unable to resolve the complaint.
A discontinued complaint is one that we decide to investigate
based on the nature and circumstances of the complaint, but for certain reasons we do not investigate to completion. Reasons for discontinuing an investigation include when the complainant withdraws the complaint or fails to submit additional information that is required to properly investigate the complaint, or no further action is required because the complaint is resolved.
A completed investigation is one in which we conducted a
full and thorough investigation and arrived at a finding. Table 7 provides information on the disposition of the completed investigations, which are reported as either substantiated or not substantiated.
A not substantiated complaint is one in which we determine
that the agency’s actions were in accordance with the law and were appropriate and reasonable. We include in this category for statistical purposes complaints that were investigated to completion but for which there was insufficient evidence to determine whether the complaint was substantiated or not substantiated.
A substantiated complaint is one that in which we determined
that the agency did not act properly or reasonably, based on the preponderance of the evidence. For substantiated complaints, we report if the complaint is rectified or not rectified.
A complaint is rectified when the agency complies with our
recommendation and the desired remedy is provided to the complainant and/or action is taken to prevent similar problems from arising in the future. A complaint is not rectified when the agency does not adopt our recommendation or when we are unable to make a recommendation because no resolution is possible.

9
For all tables, the percentages may not add up to
a total of 100% due to rounding.
TABLE 1 NUMBERS AND TYPES OF INQUIRIES
Fiscal Year 2019-2020
Month Total Inquiries
Jurisdictional
Complaints
Non-
Jurisdictional
Complaints
Information
Requests
July 466 375 49 42
August 390 300 46 44
September 342 287 28 27
October 396 330 32 34
November 349 280 30 39
December 312 243 38 31
January 309 240 24 45
February 342 275 31 36
March 390 311 37 42
April 422 359 31 32
May 388 297 44 47
June 303 238 26 39
TOTAL 4,409 3,535 416 458
% of Total
Inquiries -- 80.2% 9.4% 10.4%

10
11
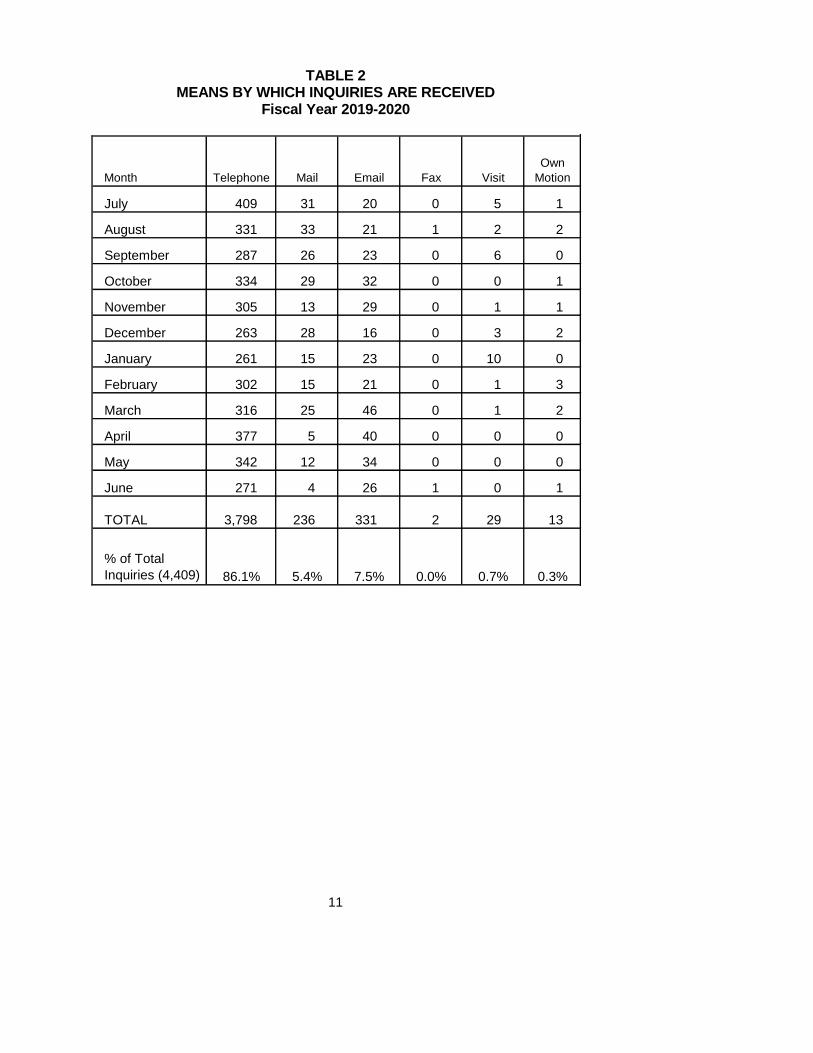
TABLE 2 MEANS BY WHICH INQUIRIES ARE RECEIVED
Fiscal Year 2019-2020
Month Telephone Mail Email Fax Visit
Own
Motion
July 409 31 20 0 5 1
August 331 33 21 1 2 2
September 287 26 23 0 6 0
October 334 29 32 0 0 1
November 305 13 29 0 1 1
December 263 28 16 0 3 2
January 261 15 23 0 10 0
February 302 15 21 0 1 3
March 316 25 46 0 1 2
April 377 5 40 0 0 0
May 342 12 34 0 0 0
June 271 4 26 1 0 1
TOTAL 3,798 236 331 2 29 13
% of Total
Inquiries (4,409) 86.1% 5.4% 7.5% 0.0% 0.7% 0.3%

12
13
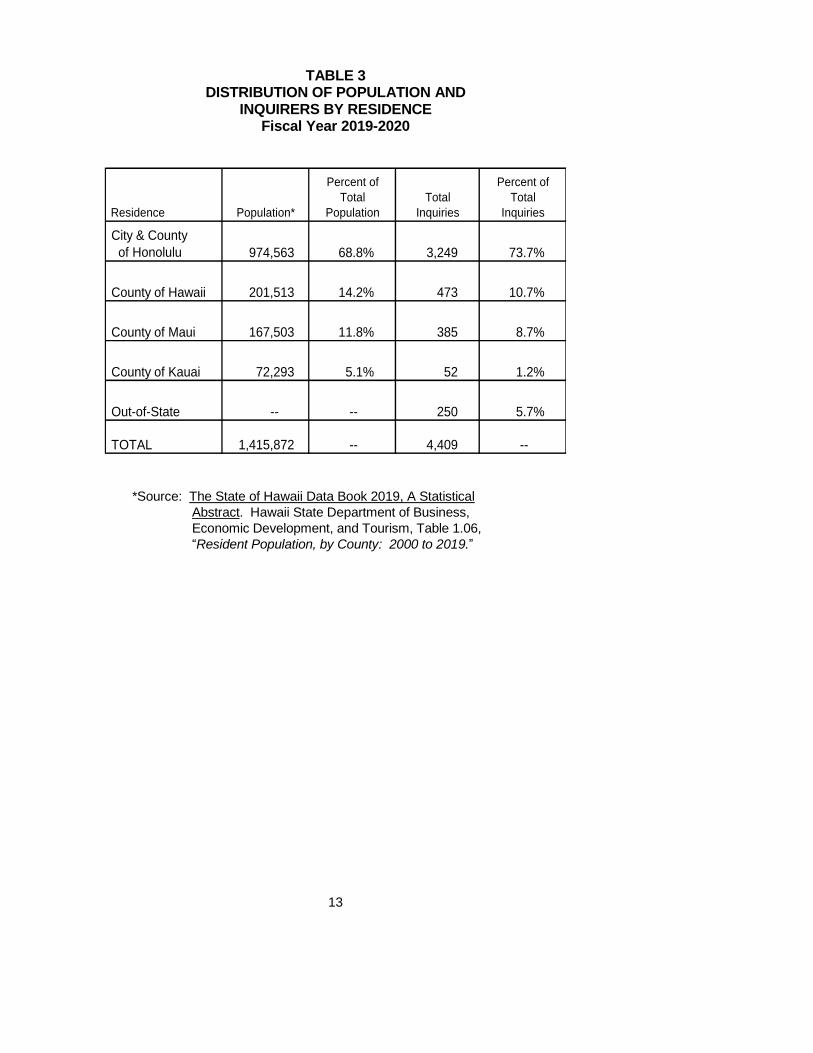
TABLE 3 DISTRIBUTION OF POPULATION AND
INQUIRERS BY RESIDENCE Fiscal Year 2019-2020
Residence Population*
Percent of
Total
Population
Total
Inquiries
Percent of
Total
Inquiries
City & County
of Honolulu 974,563 68.8% 3,249 73.7%
County of Hawaii 201,513 14.2% 473 10.7%
County of Maui 167,503 11.8% 385 8.7%
County of Kauai 72,293 5.1% 52 1.2%
Out-of-State -- -- 250 5.7%
TOTAL 1,415,872 -- 4,409 --
*Source: The State of Hawaii Data Book 2019, A Statistical
Abstract. Hawaii State Department of Business,
Economic Development, and Tourism, Table 1.06,
“Resident Population, by County: 2000 to 2019.”

14
15
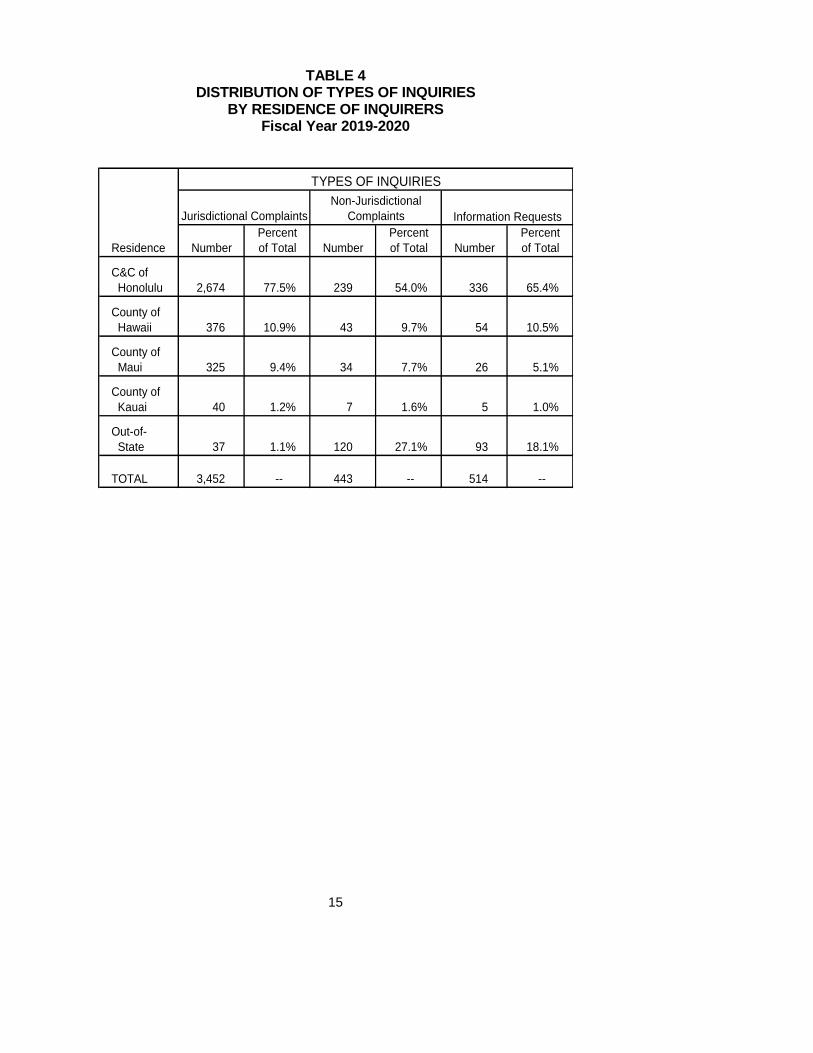
TABLE 4 DISTRIBUTION OF TYPES OF INQUIRIES
BY RESIDENCE OF INQUIRERS Fiscal Year 2019-2020
TYPES OF INQUIRIES
Jurisdictional Complaints
Non-Jurisdictional
Complaints Information Requests
Residence Number
Percent
of Total Number
Percent
of Total Number
Percent
of Total
C&C of
Honolulu 2,674 77.5% 239 54.0% 336 65.4%
County of
Hawaii 376 10.9% 43 9.7% 54 10.5%
County of
Maui 325 9.4% 34 7.7% 26 5.1%
County of
Kauai 40 1.2% 7 1.6% 5 1.0%
Out-of-
State 37 1.1% 120 27.1% 93 18.1%
TOTAL 3,452 -- 443 -- 514 --

16
17
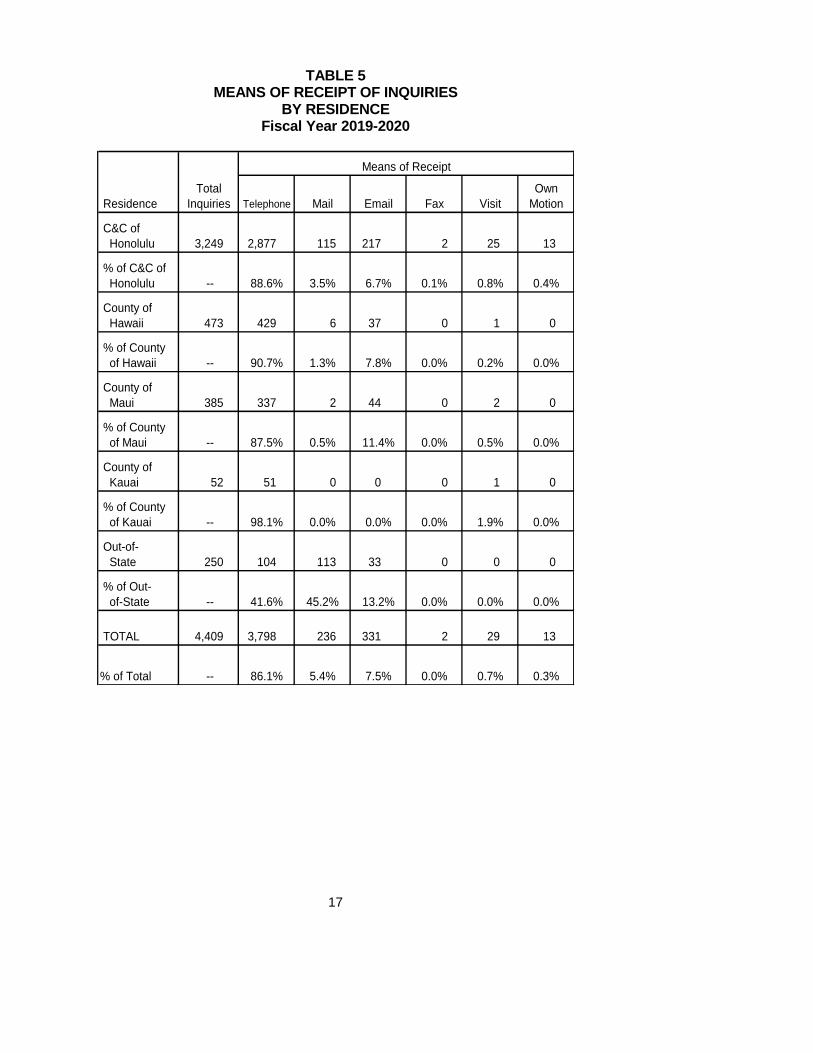
TABLE 5 MEANS OF RECEIPT OF INQUIRIES
BY RESIDENCE Fiscal Year 2019-2020
Means of Receipt
Residence
Total
Inquiries Telephone Mail Email Fax Visit
Own
Motion
C&C of
Honolulu 3,249 2,877 115 217 2 25 13
% of C&C of
Honolulu -- 88.6% 3.5% 6.7% 0.1% 0.8% 0.4%
County of
Hawaii 473 429 6 37 0 1 0
% of County
of Hawaii -- 90.7% 1.3% 7.8% 0.0% 0.2% 0.0%
County of
Maui 385 337 2 44 0 2 0
% of County
of Maui -- 87.5% 0.5% 11.4% 0.0% 0.5% 0.0%
County of
Kauai 52 51 0 0 0 1 0
% of County
of Kauai -- 98.1% 0.0% 0.0% 0.0% 1.9% 0.0%
Out-of-
State 250 104 113 33 0 0 0
% of Out-
of-State -- 41.6% 45.2% 13.2% 0.0% 0.0% 0.0%
TOTAL 4,409 3,798 236 331 2 29 13
% of Total -- 86.1% 5.4% 7.5% 0.0% 0.7% 0.3%

18
19
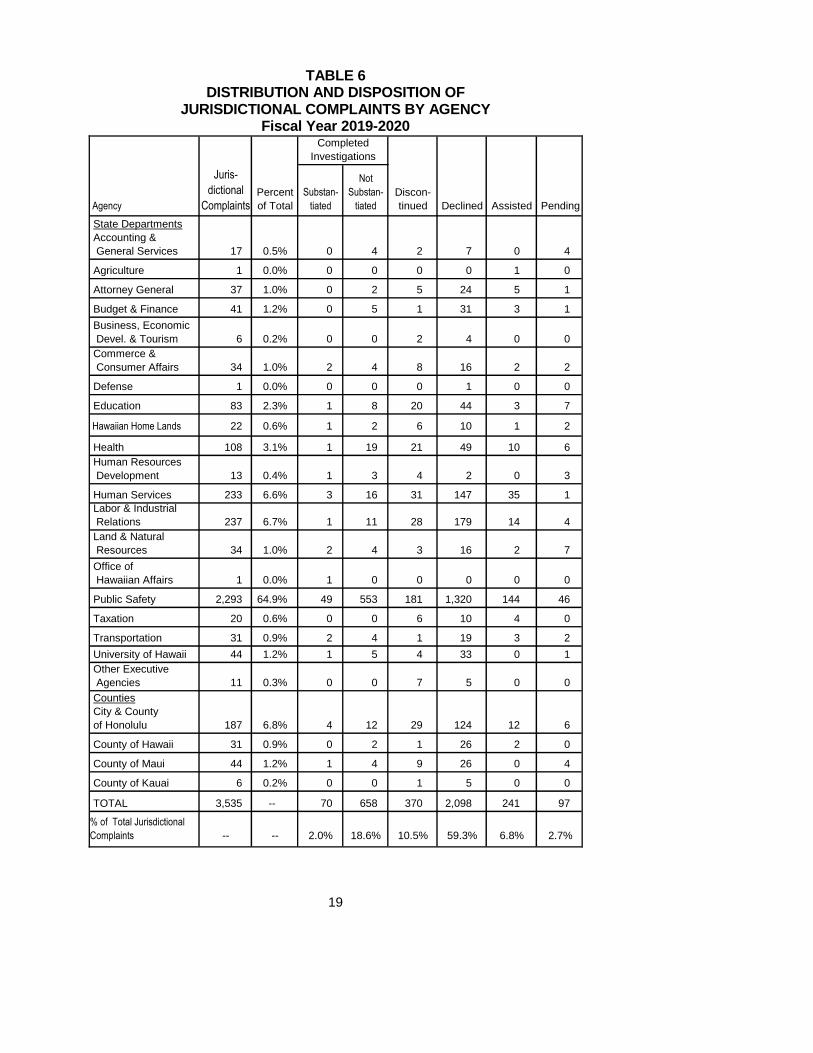
TABLE 6 DISTRIBUTION AND DISPOSITION OF
JURISDICTIONAL COMPLAINTS BY AGENCY Fiscal Year 2019-2020
Completed
Investigations
Agency
Juris-
dictional
ComplaintsPercent
of Total
Substan-
tiated
Not
Substan-
tiated
Discon-
tinued Declined Assisted Pending
State Departments
Accounting &
General Services 17 0.5% 0 4 2 7 0 4
Agriculture 1 0.0% 0 0 0 0 1 0
Attorney General 37 1.0% 0 2 5 24 5 1
Budget & Finance 41 1.2% 0 5 1 31 3 1
Business, Economic
Devel. & Tourism 6 0.2% 0 0 2 4 0 0
Commerce &
Consumer Affairs 34 1.0% 2 4 8 16 2 2
Defense 1 0.0% 0 0 0 1 0 0
Education 83 2.3% 1 8 20 44 3 7
Hawaiian Home Lands 22 0.6% 1 2 6 10 1 2
Health 108 3.1% 1 19 21 49 10 6
Human Resources
Development 13 0.4% 1 3 4 2 0 3
Human Services 233 6.6% 3 16 31 147 35 1
Labor & Industrial
Relations 237 6.7% 1 11 28 179 14 4
Land & Natural
Resources 34 1.0% 2 4 3 16 2 7
Office of
Hawaiian Affairs 1 0.0% 1 0 0 0 0 0
Public Safety 2,293 64.9% 49 553 181 1,320 144 46
Taxation 20 0.6% 0 0 6 10 4 0
Transportation 31 0.9% 2 4 1 19 3 2
University of Hawaii 44 1.2% 1 5 4 33 0 1
Other Executive
Agencies 11 0.3% 0 0 7 5 0 0
Counties
City & County
of Honolulu 187 6.8% 4 12 29 124 12 6
County of Hawaii 31 0.9% 0 2 1 26 2 0
County of Maui 44 1.2% 1 4 9 26 0 4
County of Kauai 6 0.2% 0 0 1 5 0 0
TOTAL 3,535 -- 70 658 370 2,098 241 97
% of Total Jurisdictional
Complaints -- -- 2.0% 18.6% 10.5% 59.3% 6.8% 2.7%

20
21
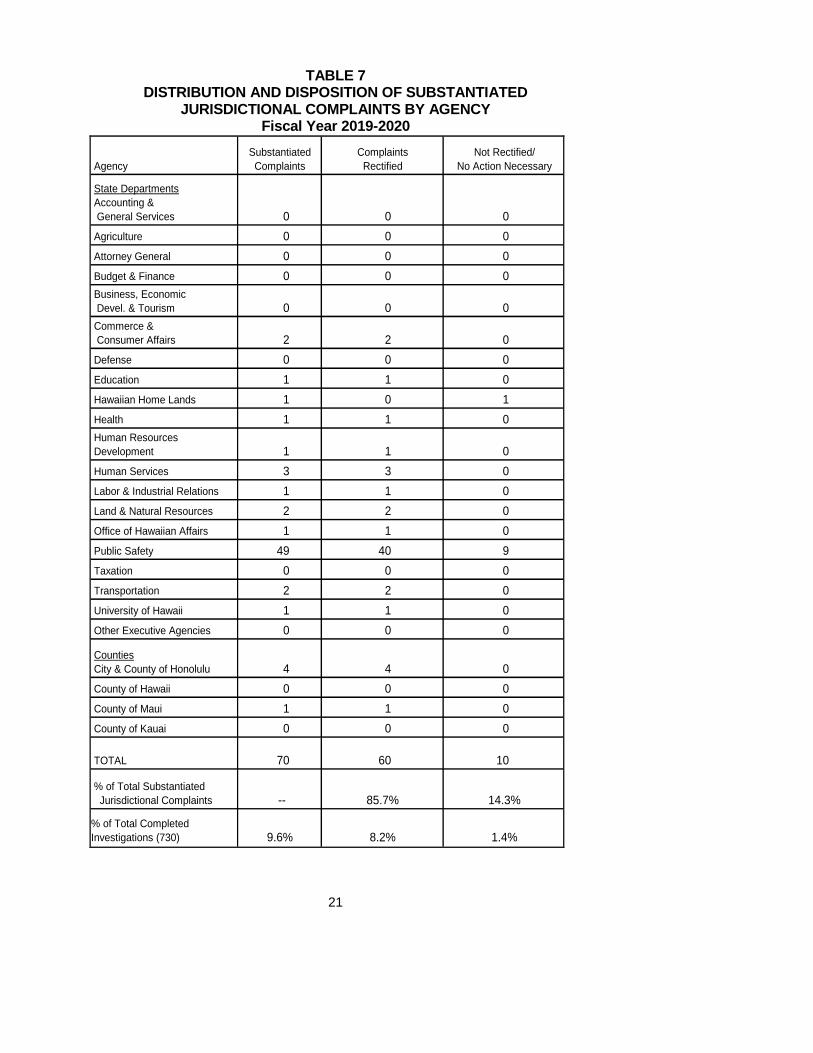
TABLE 7 DISTRIBUTION AND DISPOSITION OF SUBSTANTIATED
JURISDICTIONAL COMPLAINTS BY AGENCY Fiscal Year 2019-2020
Agency
Substantiated
Complaints
Complaints
Rectified
Not Rectified/
No Action Necessary
State Departments
Accounting &
General Services 0 0 0
Agriculture 0 0 0
Attorney General 0 0 0
Budget & Finance 0 0 0
Business, Economic
Devel. & Tourism 0 0 0
Commerce &
Consumer Affairs 2 2 0
Defense 0 0 0
Education 1 1 0
Hawaiian Home Lands 1 0 1
Health 1 1 0
Human Resources
Development 1 1 0
Human Services 3 3 0
Labor & Industrial Relations 1 1 0
Land & Natural Resources 2 2 0
Office of Hawaiian Affairs 1 1 0
Public Safety 49 40 9
Taxation 0 0 0
Transportation 2 2 0
University of Hawaii 1 1 0
Other Executive Agencies 0 0 0
Counties
City & County of Honolulu 4 4 0
County of Hawaii 0 0 0
County of Maui 1 1 0
County of Kauai 0 0 0
TOTAL 70 60 10
% of Total Substantiated
Jurisdictional Complaints -- 85.7% 14.3%
% of Total Completed
Investigations (730) 9.6% 8.2% 1.4%

22
23
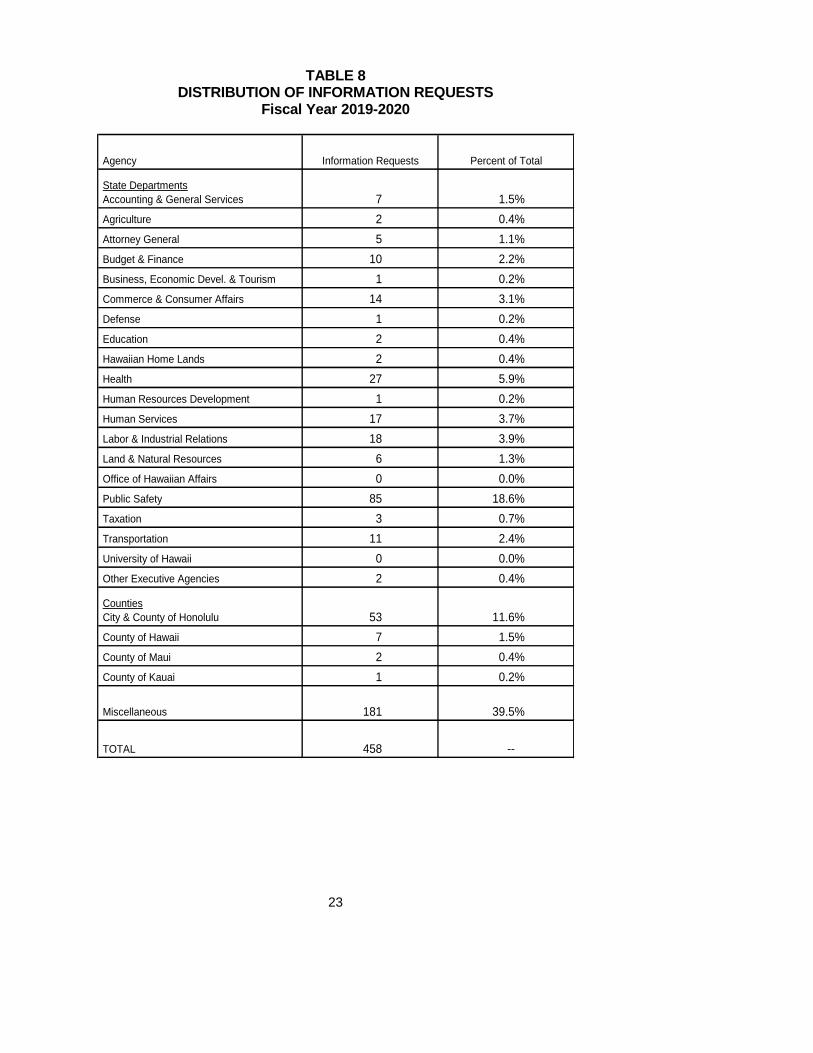
TABLE 8 DISTRIBUTION OF INFORMATION REQUESTS
Fiscal Year 2019-2020
Agency Information Requests Percent of Total
State Departments
Accounting & General Services 7 1.5%
Agriculture 2 0.4%
Attorney General 5 1.1%
Budget & Finance 10 2.2%
Business, Economic Devel. & Tourism 1 0.2%
Commerce & Consumer Affairs 14 3.1%
Defense 1 0.2%
Education 2 0.4%
Hawaiian Home Lands 2 0.4%
Health 27 5.9%
Human Resources Development 1 0.2%
Human Services 17 3.7%
Labor & Industrial Relations 18 3.9%
Land & Natural Resources 6 1.3%
Office of Hawaiian Affairs 0 0.0%
Public Safety 85 18.6%
Taxation 3 0.7%
Transportation 11 2.4%
University of Hawaii 0 0.0%
Other Executive Agencies 2 0.4%
Counties
City & County of Honolulu 53 11.6%
County of Hawaii 7 1.5%
County of Maui 2 0.4%
County of Kauai 1 0.2%
Miscellaneous 181 39.5%
TOTAL 458 --

24

25
TABLE 9 DISTRIBUTION OF NON-JURISDICTIONAL COMPLAINTS
Fiscal Year 2019-2020
Jurisdictional Exclusions Number of Complaints Percent of Total
Collective Bargaining 14 3.4%
County Councils 3 0.7%
Federal Government 25 6.0%
Governor 14 3.4%
Judiciary 43 10.3%
Legislature 6 1.4%
Lieutenant Governor 0 0.0%
Mayors 5 1.2%
Multi-State Governmental Entity 3 0.7%
Private Transactions 205 49.3%
Miscellaneous 98 23.6%
TOTAL 416 --

26
27
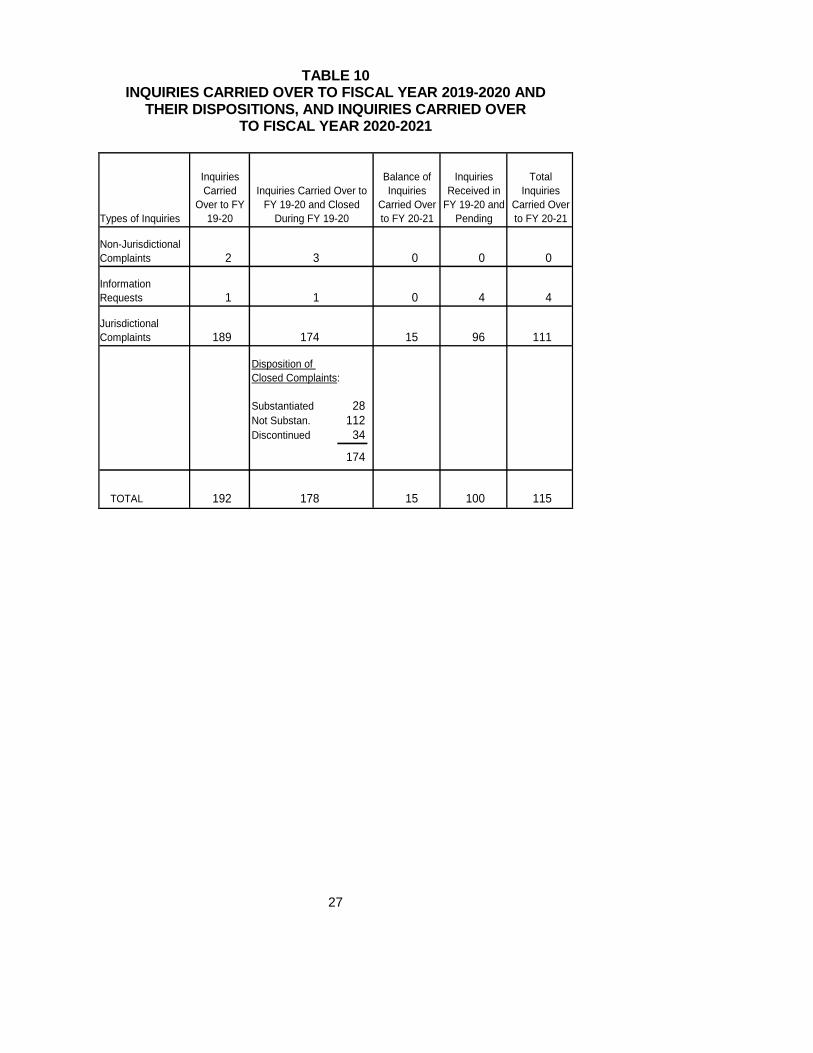
TABLE 10 INQUIRIES CARRIED OVER TO FISCAL YEAR 2019-2020 AND
THEIR DISPOSITIONS, AND INQUIRIES CARRIED OVER TO FISCAL YEAR 2020-2021
Types of Inquiries
Inquiries
Carried
Over to FY
19-20
Inquiries Carried Over to
FY 19-20 and Closed
During FY 19-20
Balance of
Inquiries
Carried Over
to FY 20-21
Inquiries
Received in
FY 19-20 and
Pending
Total
Inquiries
Carried Over
to FY 20-21
Non-Jurisdictional
Complaints 2 3 0 0 0
Information
Requests 1 1 0 4 4
Jurisdictional
Complaints 189 174 15 96 111
Substantiated 28
Not Substan. 112
Discontinued 34
174
TOTAL 192 178 15 100 115
Disposition of
Closed Complaints:

28
29
Appendix
CUMULATIVE INDEX OF SELECTED CASE SUMMARIES
To view a cumulative index of all selected case summaries that appeared in our Annual Report Nos. 1 through 50, please visit our website at ombudsman.hawaii.gov and select the “Cumulative Index” link from the homepage. If you do not have access to our cumulative index via the Internet, you may contact our office to request a copy.