Embed Size (px)
Citation preview
Office of Research and Engineering
Safety Study Report:Introduction of Glass Cockpit Avionics into Light Aircraft
Safety Study Report:Introduction of Glass Cockpit Avionics into Light Aircraft
Quantitative Analysis Results
Loren Groff
2
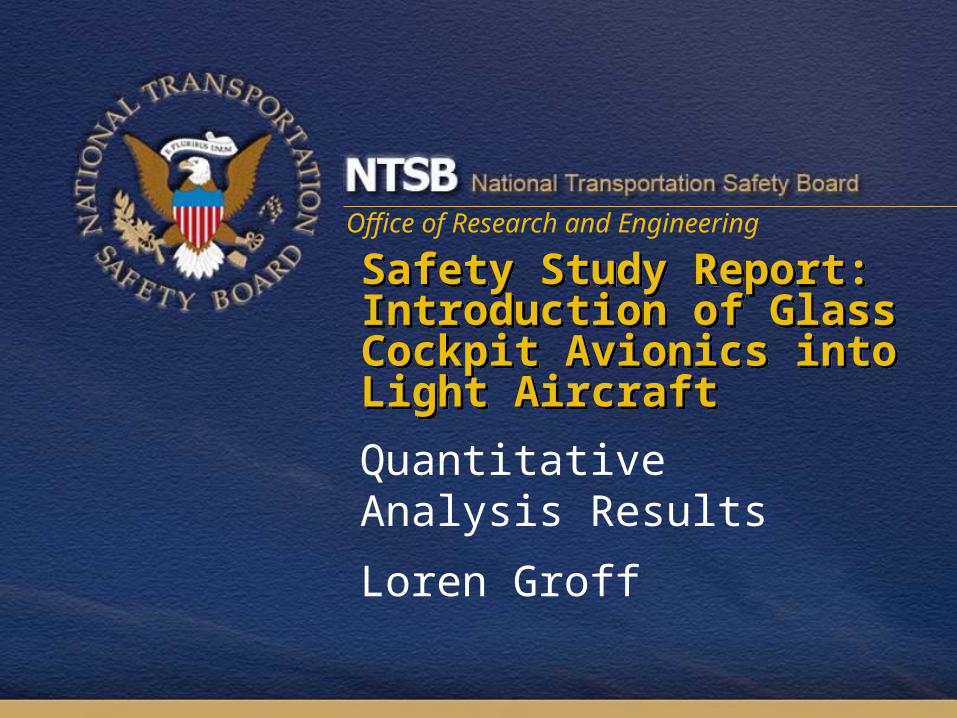
Quantitative Analysis
• Goals– Identify operational differences between
two groups of aircraft–Determine effect of glass cockpits on
safety
• Comparisons–Accident information–Aircraft activity–Accident rates
3
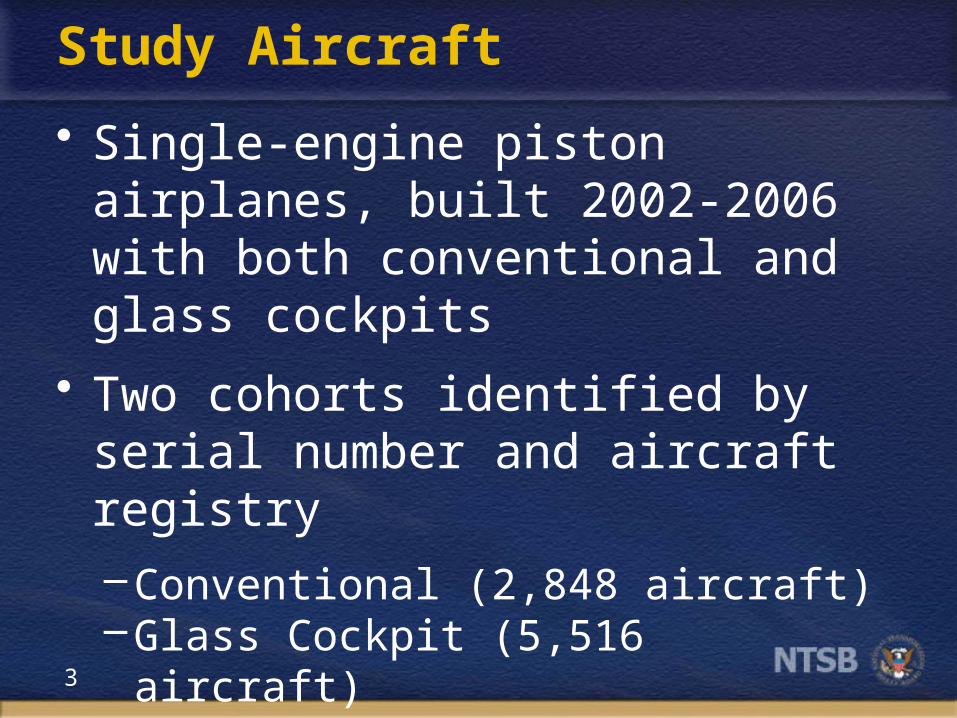
Study Aircraft
• Single-engine piston airplanes, built 2002-2006 with both conventional and glass cockpits
• Two cohorts identified by serial number and aircraft registry
–Conventional (2,848 aircraft)–Glass Cockpit (5,516 aircraft)
4
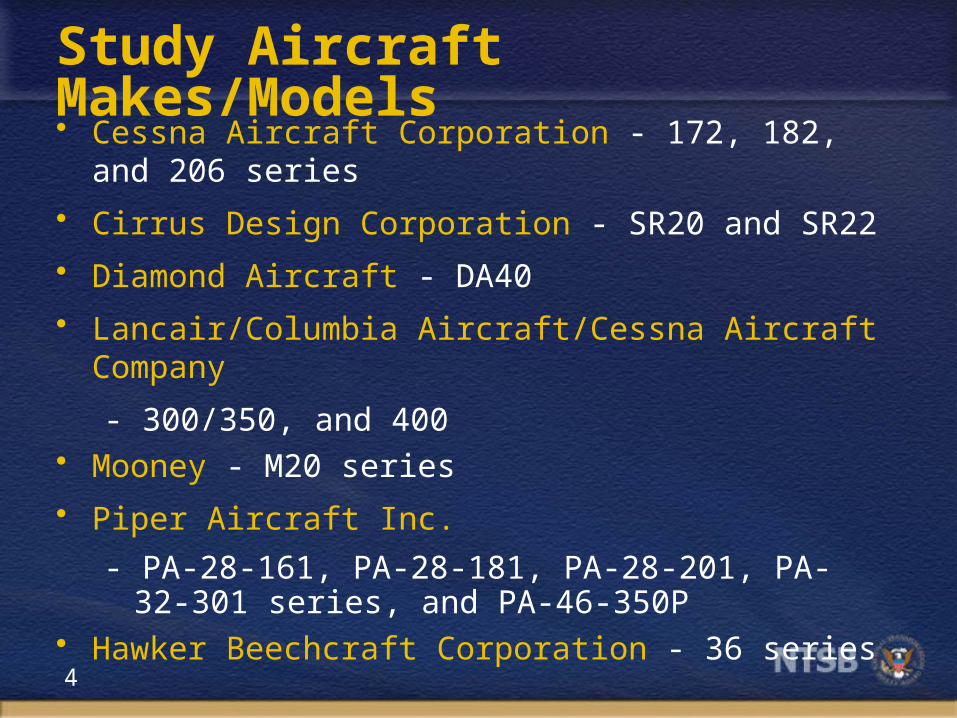
Study Aircraft Makes/Models• Cessna Aircraft Corporation - 172, 182, and 206 series
• Cirrus Design Corporation - SR20 and SR22
• Diamond Aircraft - DA40
• Lancair/Columbia Aircraft/Cessna Aircraft Company
- 300/350, and 400• Mooney - M20 series
• Piper Aircraft Inc.
- PA-28-161, PA-28-181, PA-28-201, PA-32-301 series, and PA-46-350P
• Hawker Beechcraft Corporation - 36 series
5
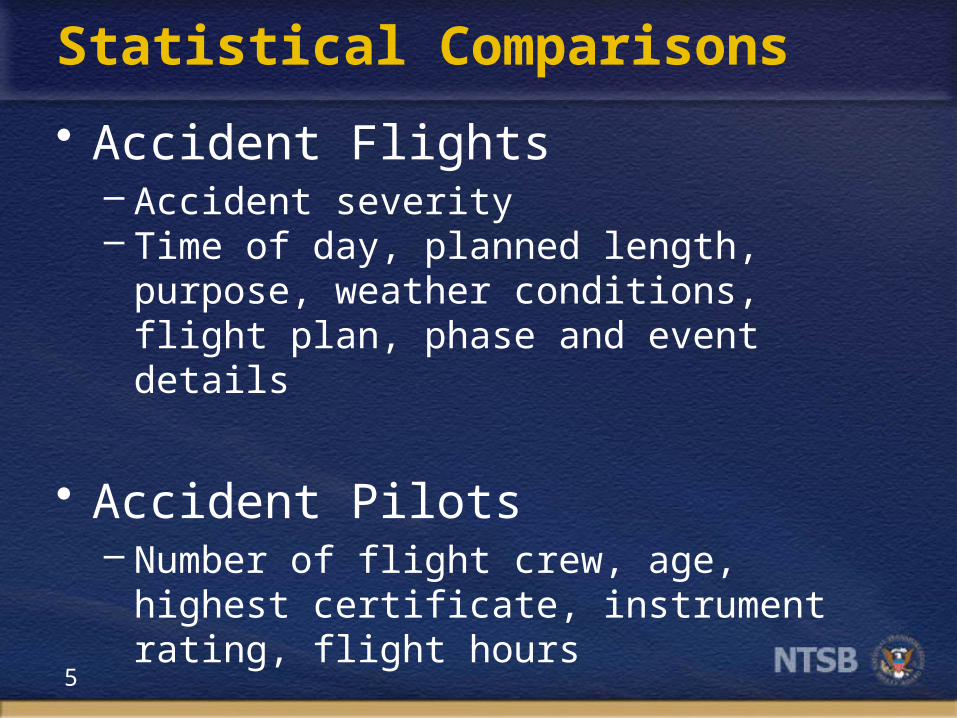
Statistical Comparisons
• Accident Flights– Accident severity– Time of day, planned length, purpose,
weather conditions, flight plan, phase and event details
• Accident Pilots– Number of flight crew, age, highest
certificate, instrument rating, flight hours
6
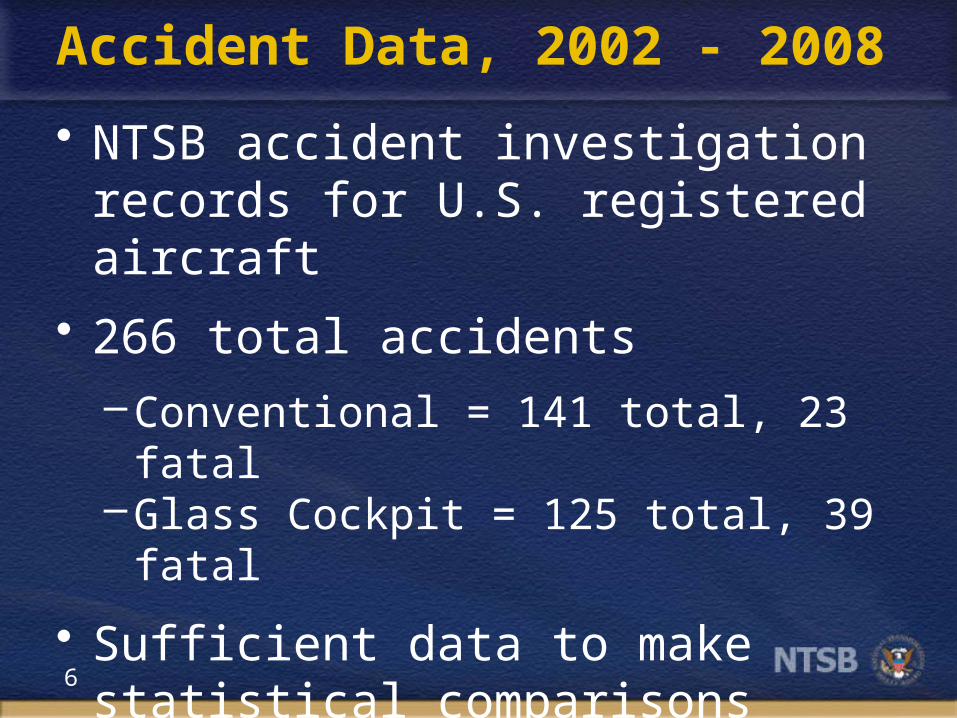
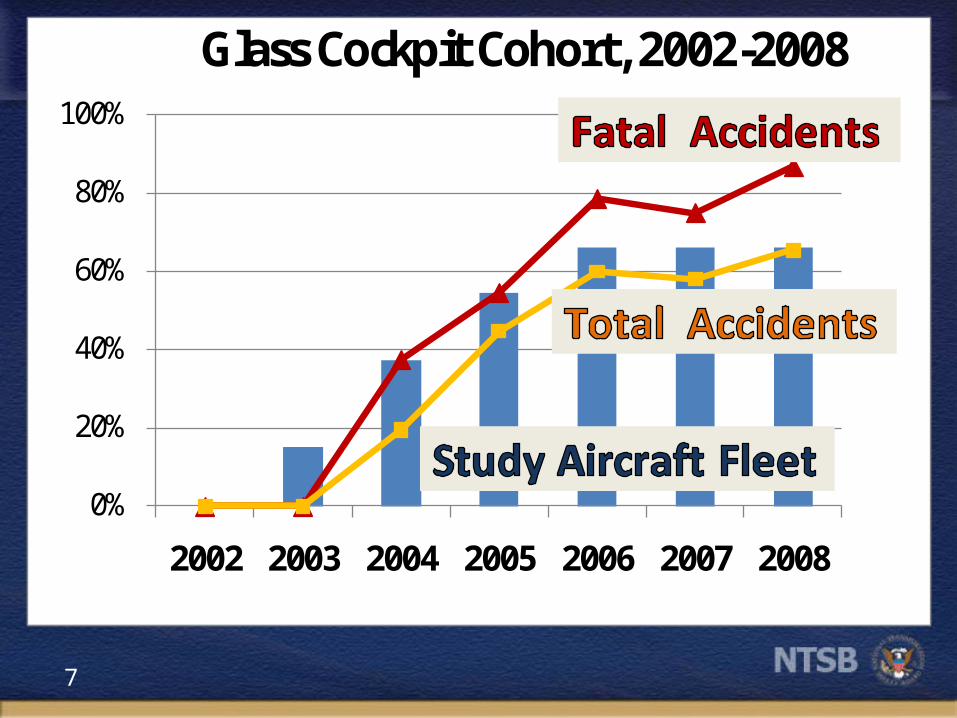
Accident Data, 2002 - 2008
• NTSB accident investigation records for U.S. registered aircraft
• 266 total accidents
–Conventional = 141 total, 23 fatal–Glass Cockpit = 125 total, 39 fatal
• Sufficient data to make statistical comparisons
7
0%
20%
40%
60%
80%
100%
2002 2003 2004 2005 2006 2007 2008
Glass Cockpit Cohort, 2002-2008
0%
20%
40%
60%
80%
100%
2002 2003 2004 2005 2006 2007 2008
Glass Cockpit Cohort, 2002-2008
0%
20%
40%
60%
80%
100%
2002 2003 2004 2005 2006 2007 2008
Glass Cockpit Cohort, 2002-2008
8
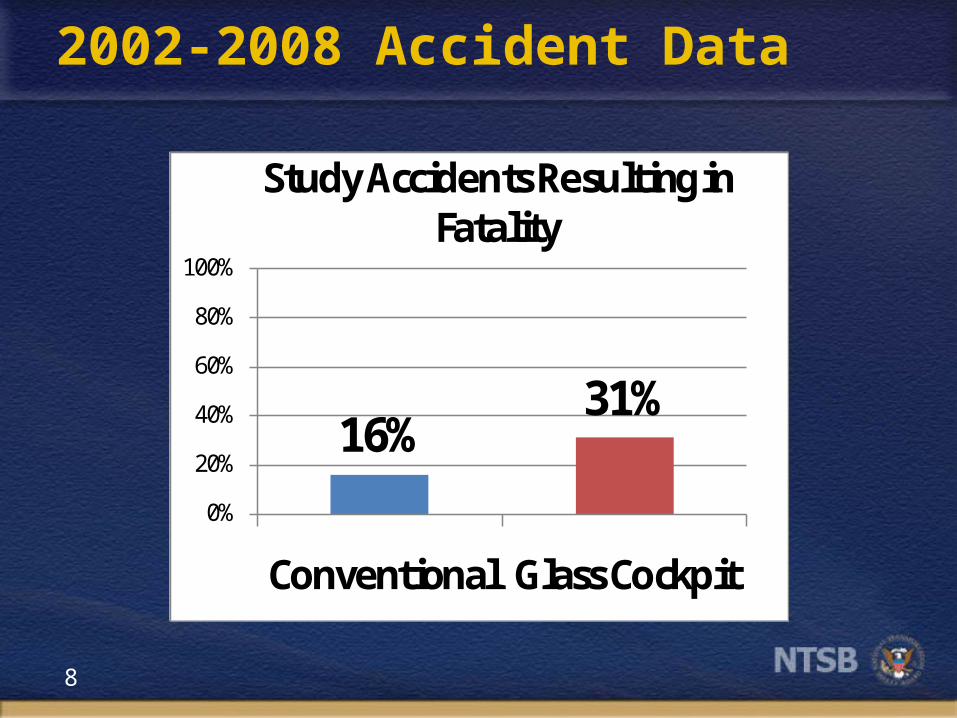
2002-2008 Accident Data
16%31%
0%
20%
40%
60%
80%
100%
Conventional Glass Cockpit
Study Accidents Resulting in Fatality
9
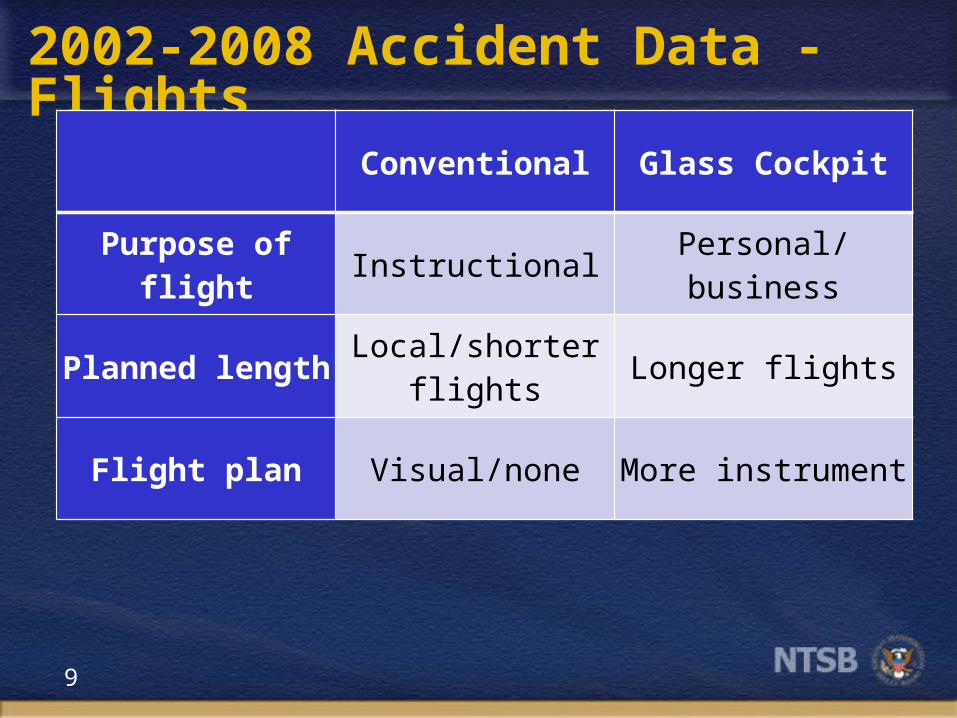
2002-2008 Accident Data - Flights
Conventional Glass Cockpit
Purpose of flight Instructional Personal/business
Planned length Local/shorter flights Longer flights
Flight plan Visual/none More instrument
10
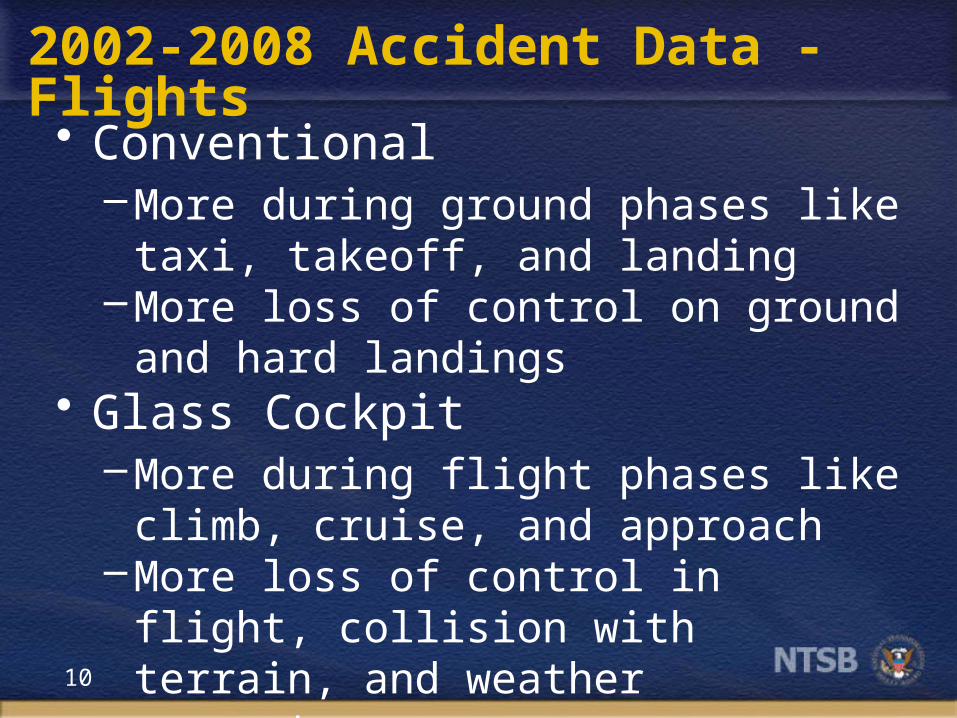
2002-2008 Accident Data - Flights
• Conventional –More during ground phases like taxi,
takeoff, and landing –More loss of control on ground and hard
landings• Glass Cockpit
–More during flight phases like climb, cruise, and approach
–More loss of control in flight, collision with terrain, and weather encounters
11
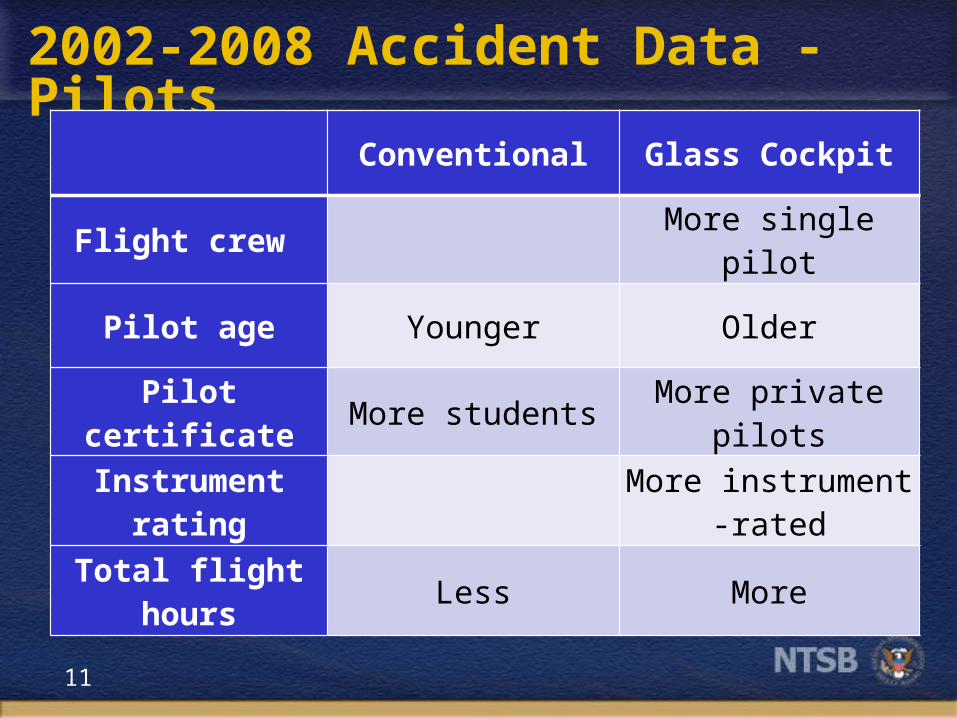
2002-2008 Accident Data - Pilots
Conventional Glass Cockpit
Flight crew More single pilot
Pilot age Younger Older
Pilot certificate More students More private pilots
Instrument rating More instrument -rated
Total flight hours Less More
13
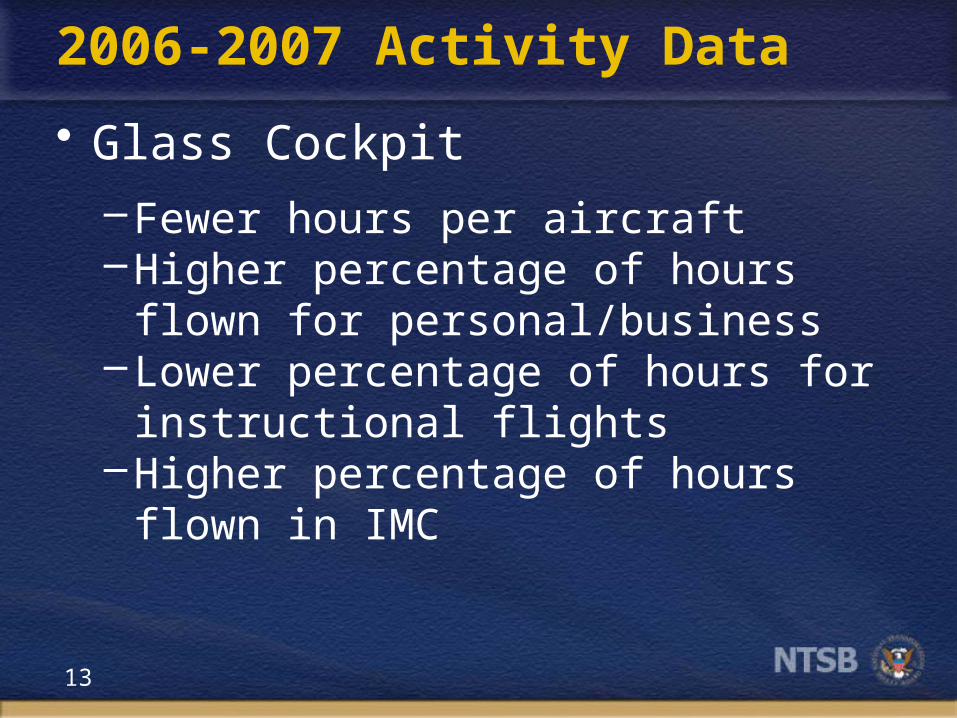
2006-2007 Activity Data
• Glass Cockpit
–Fewer hours per aircraft–Higher percentage of hours flown for
personal/business–Lower percentage of hours for
instructional flights–Higher percentage of hours flown in
IMC
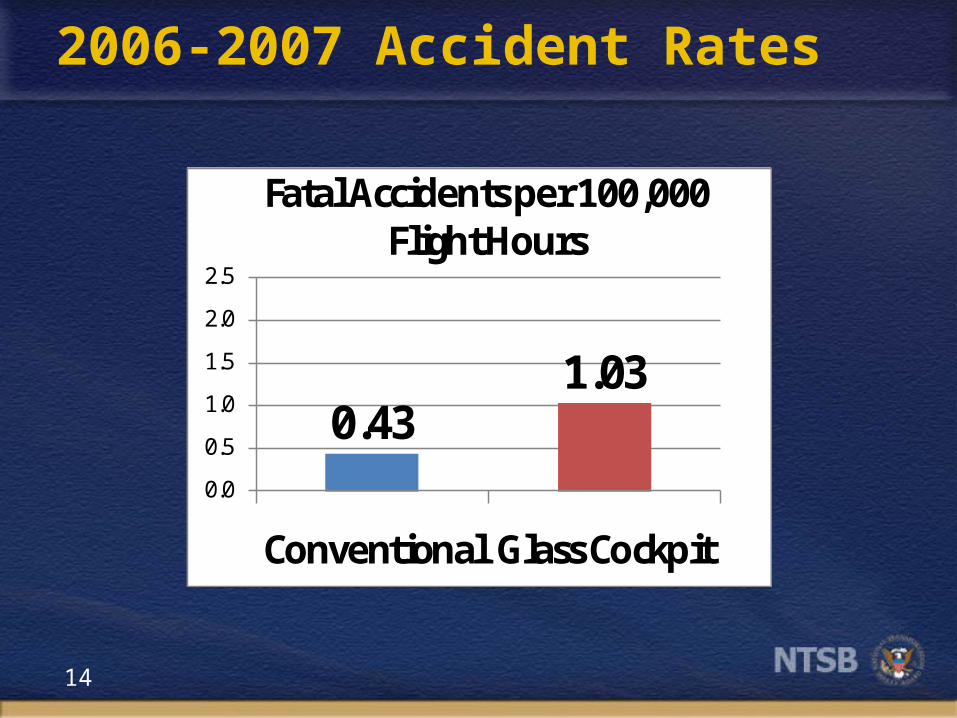
14
2006-2007 Accident Rates
3.71 3.77
0.0
1.0
2.0
3.0
4.0
5.0
Conventional Glass Cockpit
Accidents per 100,000 Flight Hours
0.431.03
0.0
0.5
1.0
1.5
2.0
2.5
Conventional Glass Cockpit
Fatal Accidents per 100,000 Flight Hours
15
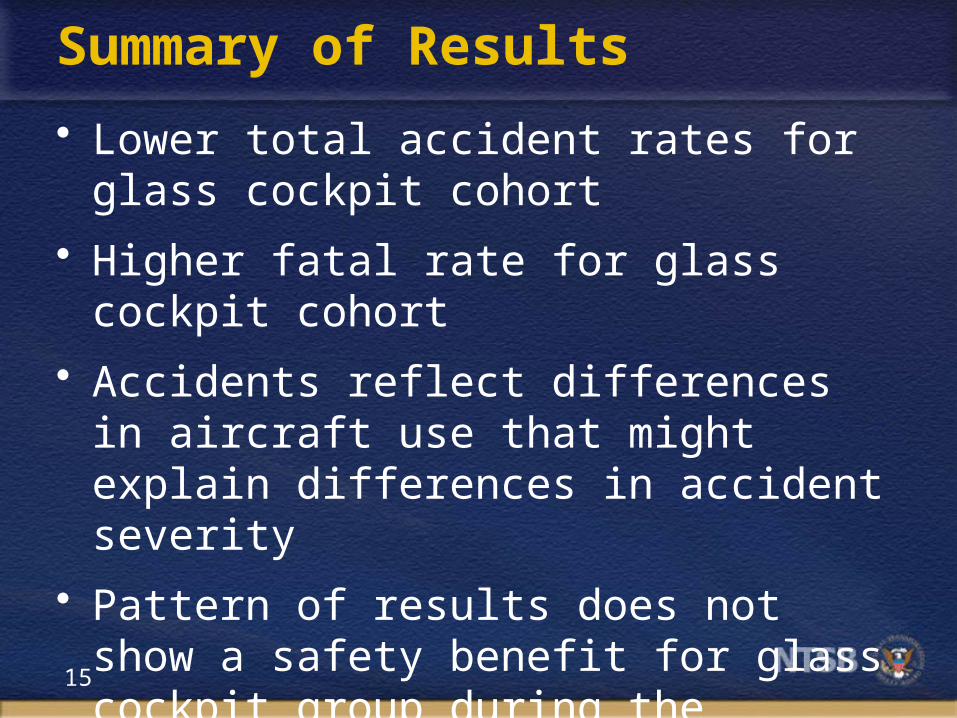
Summary of Results
• Lower total accident rates for glass cockpit cohort
• Higher fatal rate for glass cockpit cohort
• Accidents reflect differences in aircraft use that might explain differences in accident severity
• Pattern of results does not show a safety benefit for glass cockpit group during the studied period
16