Embed Size (px)
Citation preview
UNCLASSIFIED
Office of Infrastructure Protection (IP) National Infrastructure Simulation and Analysis Center (NISAC)Global Finance as a Complex Adaptive SystemMORS Workshop on Risk-Informed Decision MakingApril 15, 2009

2
Outline Financial interactions through payment systems
Some effects of coupling through foreign exchange
Controlling global financial instabilities
2

3
Payment Systems Banking and Finance infrastructure makes and moves money; payment
systems are an important mechanism.
Fedwire is the operational backbone of the US banking system. Overnight lending of reserve account balances is the target of monetary policy.
Opportunity to share data and ideas.– Walt Beyeler and Robert J. Glass at Sandia National Laboratories
– Morten L. Bech at Federal Reserve Bank of New York
– Kimmo Soramäki at Helsinki University of Technology
Operation depends on perceptions of counterparty reliability.

4
Congestion and Cascades in Payment Systems Network defined by Fedwire transaction data:
Payments among more than 6500 large commercial banks Typical daily traffic: more than 350,000 payments totaling more than $1
trillion Node degree and numbers of payments follow power-law distributions
Bank behavior controlled by system liquidity: Payment activity is funded by initial account balances, incoming payments,
and market transactions Payments are queued pending funding Queued payments are submitted promptly when funding becomes available
Bank i
Central Bank
Balance Bi
Productive Agent
Instructions Ii
Submitted
Payment S
i
Balance BjProcessed Payment Rj
1 Productive agent instructs bank to send a payment
2 Depositor account is debited
4 Payment account is debited
5 Payment account is credited
Queue Qi Deposits DiIi-Si
3 Payment is submitted or queued
Ii
Bank j
Queue QjDeposits Dj
7 Queued payment is submitted if there is one
6 Depositor account is credited
Released
Payment
Bi > 0 ? Qj > 0 ?
Findings Payment flows follow a scale-free distribution Performance is a function of both topology and
behavior – neither alone can explain robustness Liquidity limits can lead to congestion and limit
throughput, but performance can be greatly improved by moving small amounts of liquidity to the places where it’s needed, e.g. through markets
5
Settlements
0
2 0 0 0
4 0 0 0
6 0 0 0
8 0 0 0
1 0 0 0 0
1 2 0 0 0
1 4 0 0 0
1 6 0 0 0
1 8 0 0 0
2 0 0 0 0
0 2 0 0 4 0 0 6 0 0 8 0 0 1 0 0 0 1 2 0 0 1 4 0 0 1 6 0 0 1 8 0 0 2 0 0 0
Time
Instructions
0
2 0 0 0
4 0 0 0
6 0 0 0
8 0 0 0
1 0 0 0 0
1 2 0 0 0
1 4 0 0 0
1 6 0 0 0
1 8 0 0 0
2 0 0 0 0
0 2 0 0 4 0 0 6 0 0 8 0 0 1 0 0 0 1 2 0 0 1 4 0 0 1 6 0 0 1 8 0 0 2 0 0 0
Time
Queued instructions
0
500
1000
1500
2000
2500
3000
3500
4000
4500
5000
0 2000 4000 6000 8000 10000 12000 14000
Time
Que
ueHigh liquidity
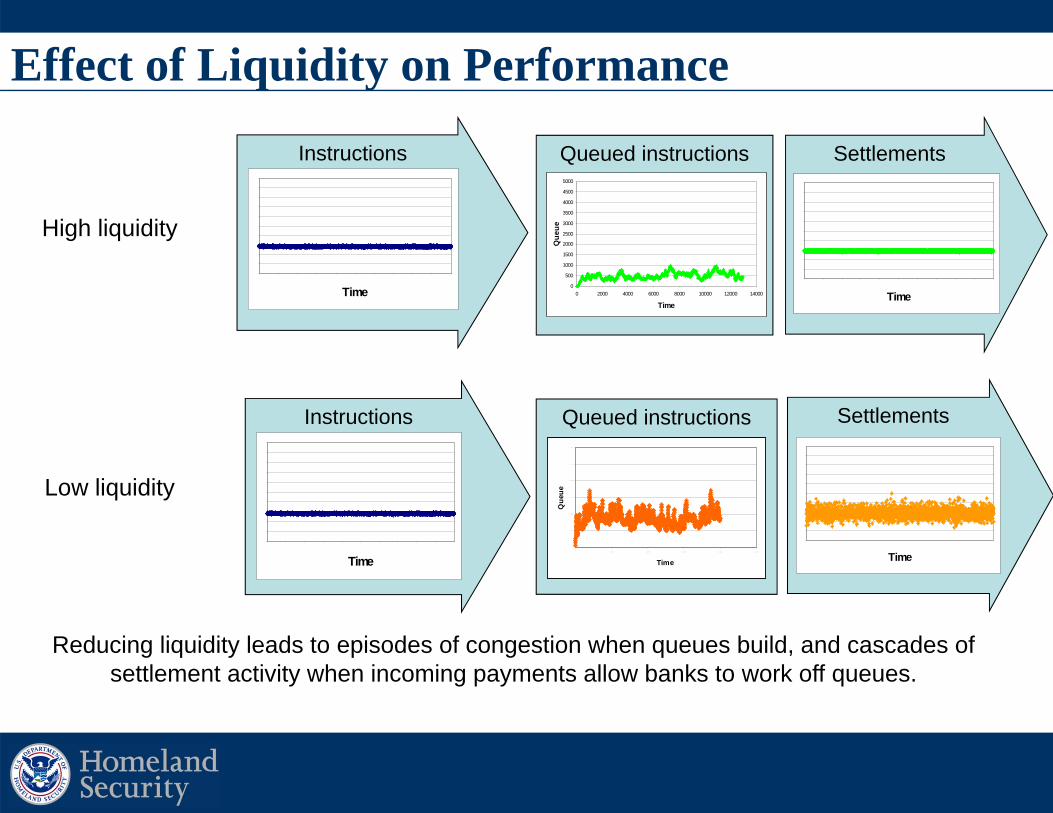
Reducing liquidity leads to episodes of congestion when queues build, and cascades of settlement activity when incoming payments allow banks to work off queues.
Settlements
0
2 0 0 0
4 0 0 0
6 0 0 0
8 0 0 0
1 0 0 0 0
1 2 0 0 0
1 4 0 0 0
1 6 0 0 0
1 8 0 0 0
2 0 0 0 0
0 2 0 0 4 0 0 6 0 0 8 0 0 1 0 0 0 1 2 0 0 1 4 0 0 1 6 0 0 1 8 0 0 2 0 0 0
Time
Instructions
0
2 0 0 0
4 0 0 0
6 0 0 0
8 0 0 0
1 0 0 0 0
1 2 0 0 0
1 4 0 0 0
1 6 0 0 0
1 8 0 0 0
2 0 0 0 0
0 2 0 0 4 0 0 6 0 0 8 0 0 1 0 0 0 1 2 0 0 1 4 0 0 1 6 0 0 1 8 0 0 2 0 0 0
Time
Queued instructions
0
2 0 0 0 0
4 0 0 0 0
6 0 0 0 0
8 0 0 0 0
1 0 0 0 0 0
1 2 0 0 0 0
0 5 0 0 0 1 0 0 0 0 1 5 0 0 0 2 0 0 0 0 2 5 0 0 0
TimeQ
ueueLow liquidity
Effect of Liquidity on Performance
6
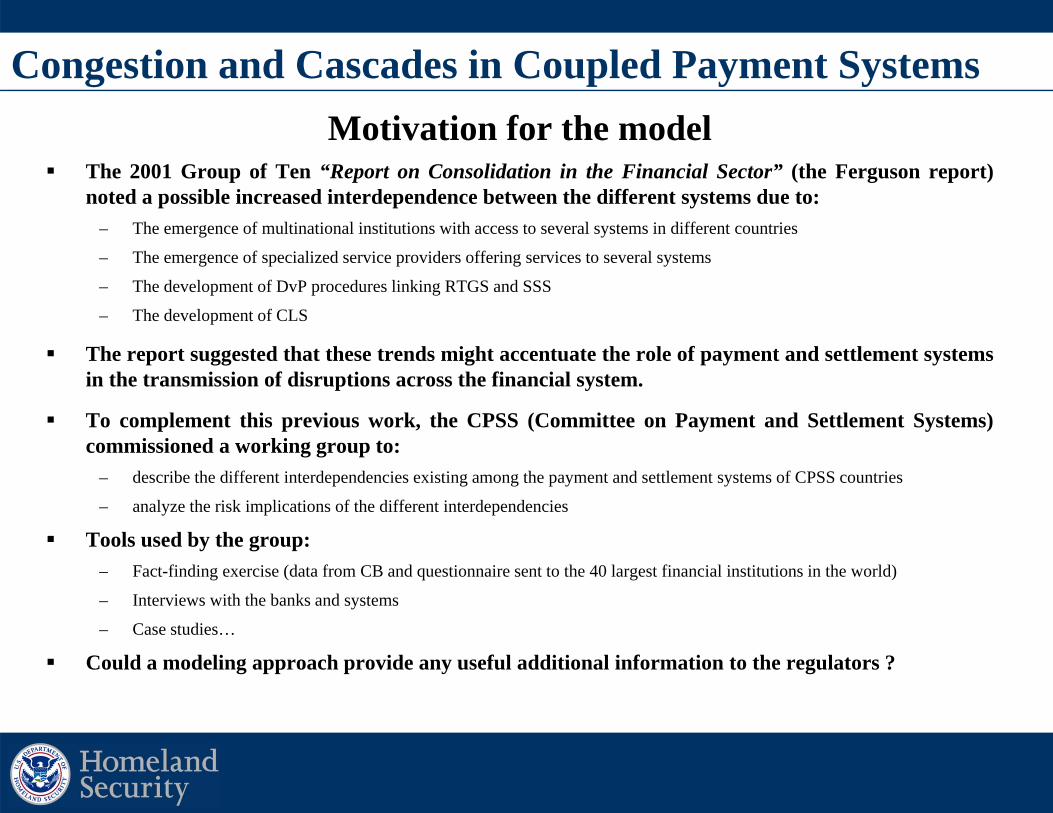
Congestion and Cascades in Coupled Payment SystemsMotivation for the model
The 2001 Group of Ten “Report on Consolidation in the Financial Sector” (the Ferguson report)noted a possible increased interdependence between the different systems due to:
– The emergence of multinational institutions with access to several systems in different countries
– The emergence of specialized service providers offering services to several systems
– The development of DvP procedures linking RTGS and SSS
– The development of CLS
The report suggested that these trends might accentuate the role of payment and settlement systemsin the transmission of disruptions across the financial system.
To complement this previous work, the CPSS (Committee on Payment and Settlement Systems)commissioned a working group to:
– describe the different interdependencies existing among the payment and settlement systems of CPSS countries
– analyze the risk implications of the different interdependencies
Tools used by the group:– Fact-finding exercise (data from CB and questionnaire sent to the 40 largest financial institutions in the world)
– Interviews with the banks and systems
– Case studies…
Could a modeling approach provide any useful additional information to the regulators ?

7
RTGS €RTGS$
Payment Systems Coupled through Foreign Exchange RTGS$ and RTGS€ are two large-value payment systems with two
different currencies: $ and €
RTGS$ and RTGS€ have similar structures, based on the network statistics of the large core banks in the Fedwire and TARGET systems
6 large “global” banks make FX trades (at constant exchange rate) among themselves
The systems are coupled:
– At input via the coupled instructions from FX trades
– At output via a possible PvP constraint
RTGS€
RTGS$
Local €Payment orders
Local $Payment orders
Settled $ transactions
PvP Constraint(possibly)
FX trades
Settled €transactions
Each system processes:
– Local payment orders
– Their leg of FX trades
timeFX Instruction
Arrives
$ Pays
€ Pays
Settlement Time DifferencesCreate Exposures
Payment vs. Payment (PvP)Eliminates Exposures byRequiring Simultaneous Settlement
timeFX Instruction
Arrives
$ Pays
€ Pays
System liquidity controls congestion,Thereby Settlement delays and cascades

8
High liquidityPvP or non-PvP
Low liquiditynon-PvP
Low liquidityPvP
PvP link
Local $ payment orders
Local € payment orders
FX trades
$ legs
€ legs
Settled payments
Settled payments
Congestions and
cascades
Congestions and
cascades
Findings: Settlement CascadesHigh L iquid ity, CC=0.22
1 2 0 0 0
1 2 1 0 0
1 2 2 0 0
1 2 3 0 0
1 2 4 0 0
1 2 5 0 0
1 2 6 0 0
1 2 7 0 0
1 2 8 0 0
1 2 9 0 0
1 3 0 0 0
1 2 0 0 0 1 2 2 0 0 1 2 4 0 0 1 2 6 0 0 1 2 8 0 0 1 3 0 0 0
€ Settlement Rate
$Se
ttlem
ent R
ate
• Output tracks input• Little variance in settlement
rate• Output correlation reflects
common FX input
• Congestion greatly increases settlement variance
• Common input is no longer visible
• PvP constraint coordinatesand enlarges cascades
• Settlements have high variance and more correlation than input
0
5000
10000
15000
20000
25000
30000
0 5000 10000 15000 20000 25000 30000
0
5000
10000
15000
20000
25000
30000
0 5000 10000 15000 20000 25000 30000
Local $ payment orders
Local € payment orders
$ legs
€ legs
Settled payments
Settled payments
Congestions and
cascades
Congestions and
cascades
FX trades
Local $ payment orders
Local € payment orders
$ legs
€ legs
Settled payments
Settled payments
FX trades
RTGS€
RTGS$

9
Exposure of Banks
Non-PvP Creates Exposure due to Differences in Settlement Times
time
DollarBank
EuroBank
FX InstructionArrives
D Pays
E Pays
Settlement times may differ due to:• structural differences (e.g. time zone differences or topology). • Liquidity differences
10
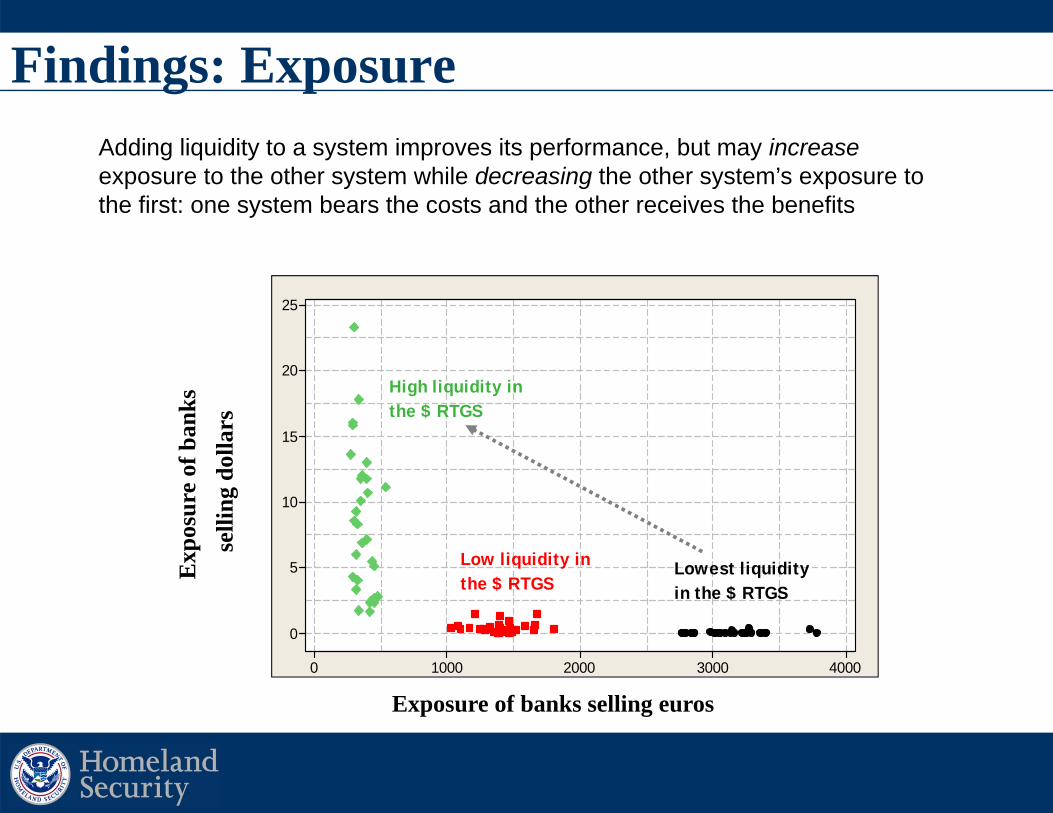
Findings: Exposure
Exposure of banks selling euros
Exp
osur
e of
ban
ksse
lling
dol
lars
40003000200010000
25
20
15
10
5
0
in the $ RTGSLowest liquidity
the $ RTGSLow liquidity in
the $ RTGSHigh liquidity in
Adding liquidity to a system improves its performance, but may increaseexposure to the other system while decreasing the other system’s exposure to the first: one system bears the costs and the other receives the benefits

11
Conclusions At high liquidity the common FX drive creates discernable correlation in settlement
At low liquidity– Congestion destroys instruction/settlement correlation in each system,
– Coupling via PvP amplifies the settlement/settlement correlation by coordinating the settlement cascades in the two systems
Queuing in systems increases and becomes interdependent with PvP
Congestion and cascades becomes more prevalent with PvP
Exposure among banks in the two systems– Is inversely related to liquidity available.
– Is reduced by prioritizing FX
Banks selling the most liquid currency are exposed
Results are not confined to FX; other linked settlements will create the same kinds of interdependencies

1212
Performance During Disruptions
Fabien Renault1, Morten L. Bech2, Walt Beyeler3 ,Robert J. Glass3, Kimmo Soramäki4
1Banque de France
, 2Federal Reserve Bank of New York,
3Sandia National Laboratories, 4Helsinki University of Technology
Performance and resilience to liquidity disruptions in interdependent RTGS payment systems
Joint Banque de France / European Central Bank conference on"Liquidity in interdependent transfer systems"
Paris, 9 June 2008
Conclusions During normal operation, the two RTGS are interdependent
When a liquidity crisis affects one RTGS, the crisis propagates to second RTGS in all considered cases
– PvP:o sharp decrease in activity (local and FX) in second RTGS
– Non-PvP: o Decrease in activity in second RTGS due to fewer FX trades emittedo At low liquidity, local payments in second RTGS are also affectedo Large increase of FX exposures during crisis and recovery

13
Enlarging scope to study bigger risks
Expansion from money transfer into money creation was planned for some time
Motivated by prevalence of innovative finance with no performance history
Focus on disruptions in credit flows rather than payment flows
13
Traders inequity, commodity, and bond markets
Economic growthin regions with
different currencies,production bases, etc.
Simple reactingtraders
Fedwiremodel
Euro payment system model
Foreignexchange
Multi-region model offinancial flows and
economic drive
Product innovation and specialization leading
to economicgrowth
Economic Drives(yellow)
Institutions and Technologiesfor Moving Money
(pale blue)
FY2004-2006
FY2007
FY2008
Central bank with implementation
of policy

14
Causes of instability Typical pattern of financial crises:
– Displacement followed by asset inflation
– Credit expansion
– Asset price leveling and collapse
– Default
“Details proliferate; structure abides”- Charles P. Kindleberger Most markets at most times are
dominated by negative feedbacks
Sometime reinforcing feedbacks predominate
Basic feature: price movements change expectations in a way that fosters stronger movements in the same direction
Financial systems are rife with such structures

15
Modeling global financial instability Details of global finance are fiendishly complicated and
dynamic, and there will always be destabilizing feedbacks in financial systems. Models are unlikely to be able to predict the next collapse.
CASoS engineering framework leads to appropriately focused analyses:
– Goals: Moderate the episodic crises that occur in financial systems, as measured by
o Productiono Employment
– Controls:o Countercyclical policies (asset prices, spreads,…)o Adaptive capital requirementso Exchanges for new financial instrumentso …
15

16
Intermediation is the key role of finance
Risk perception is essential:
– Anticipated performance of allocation to different sectors
– Counterparty reliability
Innovation is essential:– Creates new investment
opportunities with uncertain prospects
– Financial innovation is a feature of many crises.
Economic context of finance

17
Staged implementation I
1. Initial model includes only essential economic pieces: households, industry, and commerce, with no differentiation of products and no capital investments by firms.
2. The productive sector (commerce and industry) is allowed to specialize by implementing one of a set of randomly-generated technologies. Each technology will employ one or more inputs, one of which will be labor, and produce one or more outputs.
3. Technological improvement (via drift in the coefficients of firms’ technology reactions) and disruption (via mutations in firms’ reactions to include newly-created resources as inputs or catalysts) is added. Expansion is funded only from retained earnings.

18
Staged implementation II4. A government sector is added as employer and
consumer, funded by taxes on transactions. By including this sector, demand and production patterns should shift because the services provided by government (for example, infrastructure, defense and law enforcement) are implicit in the operation of the economy.
5. A basic financial layer is added in which firms, governments, and households can become indebted. Initially only lending is implemented because, unlike equity, debt is available to all entities (households, firms of any size)
6. Add equity markets, allowing firms of a certain size to issue publicly-traded stock. This introduces the second major mechanism for firms to raise capital. Equity shares are another kind of contract, in which the initial purchase gives the buyer a claim on a future revenue stream from dividends.

19
Explanation
Resources
InterregionBroker
Information/Control
MultiregionEntities
8. Allow regions to exchange financial instruments as well, allowing for investment to flow among regions. Including global financial markets will give the model all significant processes characteristic of modern finance. The full model will allow NISAC to evaluate the stability characteristics of the system, and effectiveness of mitigations in controlling financial crises and on general economic growth.
Staged implementation III7. Replicate for multiple regions which can exchange goods.
These regions will have different endowments of basic resources (that is resources requiring only labor to produce), and may be assigned different values for other important initial parameters (such as the connectivity of markets and their transaction costs, and the speed of technological change) in order to create persistent trade incentives among regions and to study their effect on relative growth rates, stability, and propagation of instabilities.

20
Summary Financial systems are driven by perceptions of risk and value
These perceptions are shaped by experience with the performance of the system
The resulting feedback is often destabilizing
Specific predictions are impossible, but the CASoS framework allows us to use models to inform decisions

21
References: Publications A General Engineering Framework for the Definition, Design, Testing and Actualization of Solutions within Complex
Adaptive Systems of Systems (CASoS) with Application to the Global Energy System (GES), Robert J. Glass, Arlo L. Ames, Walter E. Beyeler, Bernard Zak, David A. Schoenwald, Sean A. McKenna, Stephen H. Conrad , S. Louise Maffitt, Sandia National Laboratories SAND 2008-7952, December 2008
The Payments System and the Market of Interbank Funds, Morten L. Bech, Walter E. Beyeler, Robert J. Glass, and Kimmo Soramäki, Part 4 in New Directions for Understanding Systemic Risk, Economic Policy Review, Federal Reserve Bank of New York, 2007, .
Congestion and Cascades in Interdependent Payment Systems, Fabien Renault, Walter E. Beyeler, Robert J. Glass, Kimmo Soramäki, Morten L. Bech, Submitted to International Journal of Central Banking, 2009 .
New Approaches for Payment System Simulation Research, Kimmo Soramäki, Walter E. Beyeler, Morten Bech, and Robert J. Glass in: Simulation studies of liquidity needs, risks and efficiency in payment networks, Proceedings from the Bank of Finland Payment and Settlement System Seminars 2005-2006, Harry Leinonen ed., (Bank of Finland Studies E:39/2007)
Congestion and cascades in payment systems (2007-7271), Walter E. Beyeler, Robert J. Glass, Morten Bech and Kimmo Soramäki, Physica A, 15 Oct. 2007; v.384, no.2, p.693-718, accepted May 2007 (also available from Elsevier B.V. /Physica A)
The Topology of Interbank Payment Flows, Kimmo Soramaki, Morten L. Bech, Jeffrey Arnold, Robert J. Glass, Walter E. Beyeler, Physica A: Statistical Mechanics and Its Applications, June 2007; vol.379, no.1, p.317-33.(also available fromElsevier B.V. /Physica A)
Congestion and Cascades in Payment Systems, Walter E. Beyeler, Robert J. Glass, Morten L. Bech, Kimmo Soramaki, Federal Reserve Board of New York Staff report, July 2006
The Topology of Interbank Payment Flows (2006-1984 J), Soramäki, K, ML Bech, J Arnold, RJ Glass, and WE Beyeler, Federal Reserve Bank of New York Staff Reports, no. 243, March 2006
Advanced Simulation for Analysis of Critical Infrastructure: Abstract Cascades, the Electric power grid, and Fedwire (2004-4239), Robert J. Glass, Walt E. Beyeler, and Kevin L. Stamber
Defining Research and Development Directions for Modeling and Simulation of Complex, Interdependent Adaptive Infrastructures (2003-1778), Robert J Glass, Walter E Beyeler, Stephen H Conrad, Nancy S Brodsky, Paul G Kaplan, and Theresa J Brown
21
22
References: Conference Papers and Presentations
Joint Bank of France / European Central Bank Conference on Liquidity in interdependent transfer systems, Paris, 9-10 June 2008
Performance and Resilience to liquidity disruptions in interdependent RTGS payment systems , F. Renault, WE Beyeler, RJ Glass, K. Soramäki and ML Bech
Modeling Critical Infrastructures with Networked Agent-based Approaches, RJ Glass and WE Beyeler (also presented at Lawrence Livermore, March 2008)
Joint Bank of England & European Central Bank Conference on Payments and monetary and financial stability, November 2007
Congestion and Cascades in Coupled Payment Systems (paper), F. Renault, WE Beyeler, RJ Glass, K. Soramäki and ML Bech
International Society of Dynamic Games Workshop, Rabat, Morocco September 2007
Effect of Learning and Market Structure on Price Level and Volatility in a Simple Market, WE Beyeler, K Soramäki and RJ Glass
Bank of Finland 5th Payment and Settlement Simulation Seminar and Workshop. Helsinki, Finland, August 2007
Congestion and Cascades in Coupled Payment Systems, WE Beyeler, RJ Glass
Bank of Finland 4th Payment and Settlement Simulation Seminar and Workshop, Helsinki, Finland, August 2006
Network Topology and Payment System Resilience - first results, K Soramaki, WE Beyeler, ML Bech, RJ Glass
Congestion and Cascades in Payment Systems, WE Beyeler, K Soramaki, ML Bech, RJ Glass
The National Academy of Sciences of the National Academies/ The Federal Reserve Bank of New York: New Directions for Understanding Systemic Risk, New York City, May 2006
Contagion, Cascades and Disruptions to the Interbank Payment System (2005-4915 C), ML Bech, WE Beyeler, RJ Glass, K Soramaki
Bank of Finland 3rd Payment and Settlement Simulation Seminar and Workshop, Helsinki, Finland, August 2005
Network relationships and network models in payment systems, K Soramaki, ML Bech, J Arnold, WE Beyeler, RJ Glass
Modeling Banks' Payment Submittal Decisions, WE Beyeler, K Soramaki, ML Bech, RJ Glass
Simulation and Analysis of Cascading Failure in Critical Infrastructure, RJ Glass, WE Beyeler, K Soramaki, ML Bech, J Arnold
Working Together: R&D Partnerships in Homeland Security Conference, May 2005
Complexity Science: Implications for Critical Infrastructures, RJ Glass, WE Beyeler, SH Conrad, PG Kaplan, TJ Brown
22

23
Contact Information Sandia National Labs:
– Walt Beyeler [email protected], 505-844-5212
– Robert J. Glass [email protected], 505-844-5606
23

24
Details

25
X2Y1
X1
X3Y2
Z1 Z2
1 1 2 2 1 1 2 2
1 1 2 2
... ..., , ...
n n m m
l l
ra x a x a x b y b y b y
c z c z c z
All processes are modeled on chemical transformations. Rates may be limited by inputs or catalysts
BuyingResource Bought
Resource
EntityDecision Basic structure of a
Immediate Exchange process.
BuyingResource Bought
Resource
ContractResource
ContractBuying
Resource
EntityDecision
Basic structure of a Contracted Exchangeprocess. The decision to contract is a kind of second-order control, analogous to changing catalyst amounts. Variants include adding decisions to the primary exchange, having no Contract Buying Resource, etc.
Production and exchange processes

26
TransformationNetwork
Process Knowledge Network
ExplanationProcess
Resource
Utility
Knowledge ofProcess
Knowledgeof
Resource
ExchangeProcess
AssessmentProcess
Process networks

27
X
Y
a
b
time
R(t)
b/a
time
Ay(t)
Ay(0)
time
AyR(t)
time
Ax(t,t)
time
Exp(-t/tu)
time
axAx(t,t)
(1) Exchange rates are uncertain and may have a trend
(2) Attractiveness of the output is also uncertain and may have a trend
(3) The possible attractiveness of X combines these factors, and includes increasing uncertainty with time
(4) Risk aversion biases attractiveness in proportion to uncertainty
(5) Future values are discounted at some rate…
(5) The current attractiveness is the best current value of all possible exchanges. It is associated with some envisioned exchange time
Exchange evaluation model