Embed Size (px)
Citation preview

No. ID -21 (revised)
OFFICE OF INDUSTRIES WORKING PAPER U.S. INTERNATIONAL TRADE COMMISSION
How Do Exchange Rates Affect Import Prices? Recent Economic Literature and Data Analysis
Cathy L. Jabara Office of Industries
U.S. International Trade Commission
Revised, October 2009 Cathy Jabara is a Senior Economist with the Office of Industries of the U.S. International Trade Commission. Office of Industries working papers are the result of the ongoing professional research of USITC Staff and are solely meant to represent the opinions and professional research of individual authors. These papers are not meant to represent in any way the views of the U.S. International Trade Commission or any of its individual Commissioners. Working papers are circulated to promote the active exchange of ideas between USITC Staff and recognized experts outside the USITC, and to promote professional development of Office staff by encouraging outside professional critique of staff research. This paper is a revised version of Working Paper No. 21 dated May 2009. The paper has been updated to include 4 lags in the exchange rate estimation, instead of 3, and a new equation for Latin America is included. JEL codes: F10, F12 Key words: Exchange rates, pass-through, U.S. imports
Address correspondence to: Office of Industries
U.S. International Trade Commission Washington, DC 20436

2
How Do Exchange Rates Affect Import Prices? Recent Economic Literature and Data Analysis
Cathy L. Jabara U.S. International Trade Commission
ABSTRACT: An important issue for U.S. trade and domestic pricing is the extent to which
exchange rate changes affect the prices of imported goods. In theory, a change in the value of the
dollar should raise or lower the cost of foreign goods, thereby reducing or increasing U.S.
demand for imports. However, numerous economic studies have shown that when the dollar
fluctuates against foreign currencies, U.S. import prices tend to show much less change. This
paper reviews some of the recent economic literature, such as pricing-to-market, currency
invoicing, and cross-border production, which explains why U.S. import prices tend to show
little change. Using data for 1999 to 2008, the paper estimates exchange rate pass-through to
U.S. import prices for aggregate U.S. imports (all imports excluding oil and consumer goods),
and for prices of imports from Japan, the European Union (EU), Canada, the NIEs (Taiwan,
Singapore, South Korea, and Hong Kong), and Latin America (largely Mexico). The exchange-
rate pass-through estimates were found to be low (0.47 for all imports excluding oil and 0.26 for
consumer goods) over 4 quarters. Estimates of bilateral exchange- rate pass-through range from
0.59 for Latin America to 0.0 for the NIEs. These estimates contribute to understanding of how
changes in the dollar effect the prices of goods in international trade.

3
I. Introduction
The relationship between exchange rates and U.S. import prices is important to
understand the nature of U.S. import flows as well as the behavior of U.S. consumer prices. For
example, a weaker dollar is usually considered to be a key mechanism for increasing the
international competitiveness of U.S. producers. However, economists have generally found that
prices of imported goods do not usually respond with one-to-one to changes in the exchange rate.
For example, between February 2002 and July 2008, the dollar fell by almost 35 percent against
a broad index of foreign currencies, while U.S. Department of Labor (DOL), Bureau of Labor
Statistics (BLS) price index for all imports excluding petroleum rose by 20 percent, and the price
index for imported consumer goods rose by only 6 percent.1 The lack of a strong historical
relationship between the dollar and import prices is often cited as a factor affecting broad
measures of core inflation.2
This paper explores some of the reasons why some import prices change so little relative
to a change in the value of the dollar. In theory, a weaker dollar should raise the cost of foreign
goods for U.S. consumers, thereby reducing U.S. demand for imports, while boosting foreign
demand for U.S. goods by making exports more price-competitive abroad. However, economic
research suggests that the link between the exchange rate and the prices of imported goods is
more complex, with fluctuations affecting U.S. import prices to varying degrees, depending on
the industry. These studies show that the effect of an exchange rate change depends on firms’
price-setting behavior.
1 DOL, BLS import price indexes. http://www.bls.gov/mxp/ (accessed January, 2009). 2 Wall Street Journal, “Slack Labor Markets Will Hold Down Prices,” June 24, 2009, 15.

4
Exchange rate studies usually focus on the rate of exchange-rate pass-through-- the
impact of a change in the exchange rate on prices in the importing country. There are three
prominent explanations of why exchange-rate pass-through to U.S. import prices might be low:3
(1) exporters “price to market” by lowering or raising their profit margins to offset the effects of
the exchange rate change; (2) exporters set their prices in the local currency of the importing
country and these prices do not fluctuate with the exchange rate, at least in the short run; and
(3) cross-border production which leads to lower pass-through when production costs are
denominated in different currencies. In addition, Marazzi and Sheets (2007) found a decrease in
exchange rate pass-through for product markets in which Chinese exports gained market share, at
least through 2004, when the Chinese yuan was pegged to the dollar.
3 These are the three main explanations cited by Mishkin (2008). See also Campa and Goldberg (2002) and Marazzi and
Sheets (2007).
In addition to discussing pass-through behavior, the paper provides econometric
estimates of exchange-rate pass-through to the U.S. market both for aggregate U.S. import prices
and for the prices of imports from bilateral trading partners. The paper takes advantage of the
locality price indexes that have been collected by the BLS since 1999 to estimate how exchange-
rate pass-through behavior differs among U.S. trading partners. Exchange-rate pass-through
estimates are for U.S. aggregate imports (imports excluding oil and consumer goods) and for
U.S. imports from Canada, the European Union (EU), Japan, the Newly Industrializing
Economies (NIEs–Hong Kong, Singapore, Taiwan, and South Korea), and Latin America. The
estimates of exchange-rate pass-through are found to be low, well less than 1, and are consistent
with other estimates obtained from the literature. However, a major finding is that exchange-rate
5
pass-through does vary by country or origin, with NAFTA partners Mexico and Canada having
the highest estimated exchange rate pass-through, and Japan and the NIEs having the lowest.
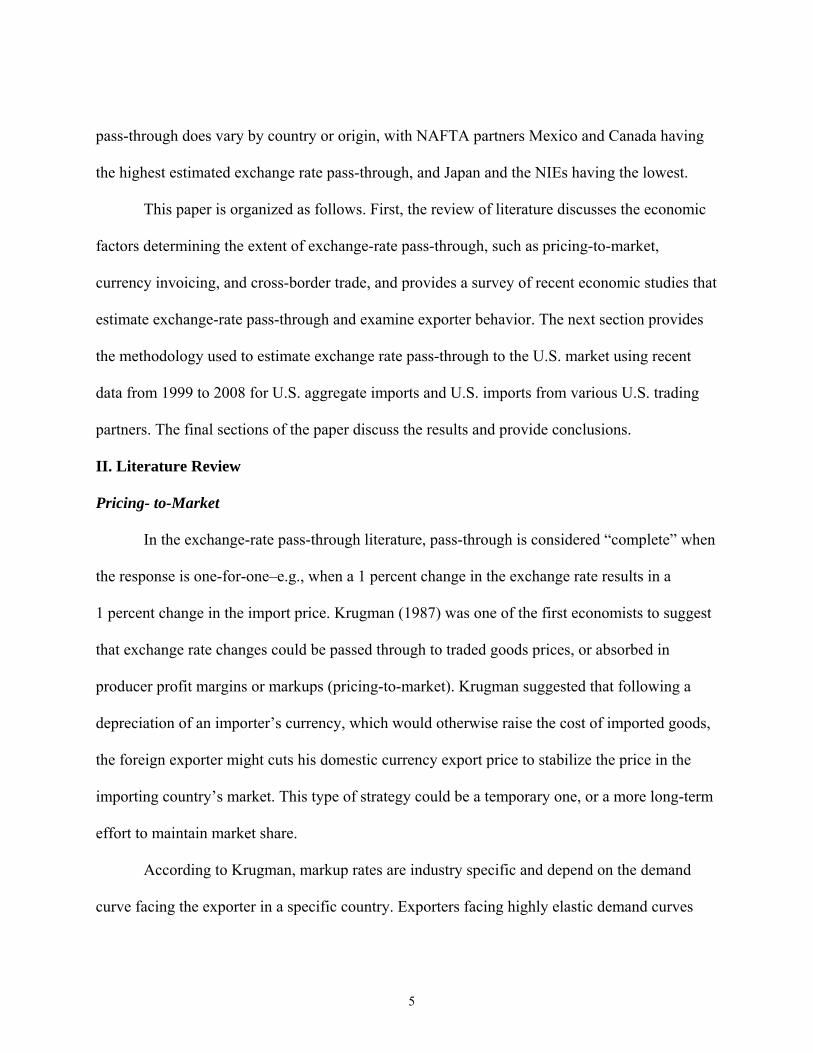
This paper is organized as follows. First, the review of literature discusses the economic
factors determining the extent of exchange-rate pass-through, such as pricing-to-market,
currency invoicing, and cross-border trade, and provides a survey of recent economic studies that
estimate exchange-rate pass-through and examine exporter behavior. The next section provides
the methodology used to estimate exchange rate pass-through to the U.S. market using recent
data from 1999 to 2008 for U.S. aggregate imports and U.S. imports from various U.S. trading
partners. The final sections of the paper discuss the results and provide conclusions.
II. Literature Review
Pricing- to-Market
In the exchange-rate pass-through literature, pass-through is considered “complete” when
the response is one-for-one–e.g., when a 1 percent change in the exchange rate results in a
1 percent change in the import price. Krugman (1987) was one of the first economists to suggest
that exchange rate changes could be passed through to traded goods prices, or absorbed in
producer profit margins or markups (pricing-to-market). Krugman suggested that following a
depreciation of an importer’s currency, which would otherwise raise the cost of imported goods,
the foreign exporter might cuts his domestic currency export price to stabilize the price in the
importing country’s market. This type of strategy could be a temporary one, or a more long-term
effort to maintain market share.
According to Krugman, markup rates are industry specific and depend on the demand
curve facing the exporter in a specific country. Exporters facing highly elastic demand curves

6
and competition might reduce their markups in the event the importer’s currency depreciates in
order to keep importer prices constant and preserve market share. On the other hand, an exporter
facing few competitors and inelastic demand might pass-through the exchange rate change to
maintain his profit margin (markup over cost). The exchange-rate pass-through therefore
depends on the structure of demand and competition in the industry.
Cross-Border Production
Another reason advanced for low exchange-rate pass-through is cross-border production.4
If firms are using imported inputs, then the exchange rate is also an argument in the exporter’s
cost function. For example, assume an exporter imports raw materials in dollars that account for
50 percent of production costs, the rest of the production cost is denominated in the exporter’s
currency, and the dollar depreciates relative to the exporter’s currency by 5 percent. The
exporter would only have to raise his price by 2.6 percent to generate enough local currency to
cover the local costs– an exchange-rate pass-through of .52—because the cost of the raw
material is fixed in dollars. If production occurs in several stages in a number of different
countries, then production costs are incurred in different currencies. The exchange rate pass-
through can be less than 1 as long as all the currencies do not experience the same
appreciation/depreciation against the currency of the exporter.5
Currency Invoicing and U.S. Imports
A closely related phenomenon to the principle of pricing-to-market is local currency
pricing (LCP). Exporters can invoice in their own home currency (producer currency pricing–
PCP), in the currency of the importer (LCP), or in a third-party currency (“vehicle”currency
4 Campa and Goldberg (2002) discuss the role of cross-border production and the exporter’s markup. 5 Marazzi and Sheets (2007).

7
pricing–VCP).6 There is a close relationship between PTM and LCP. In the short-run, import
prices will stay the same when the exchange rate changes if they are priced in local currency.
Thus, invoicing in LCP reduces exchange-rate pass-through, at least in the short run. However,
foreign producers could resist increasing the local-currency-denominated prices of their goods in
the long term to remain competitive in foreign markets. According to Kamps (2006), a key
reason to use LCP is to keep prices stable in the importing market, but exporters then face
uncertainty in the actually price they receive (in their own currency).
In theory, if the exporter using LCP adjusts the importer’s price to an exchange rate
change in the longer run, there should be no difference in exchange-rate pass-through using PCP
or LCP, and the pass-through should equal one. However, Gopinath, Itshoki, and Rigobon (2007)
suggest that currency invoicing does matter. Using unpublished monthly BLS data for 1994-
2005, they estimated the average long-term pass-through for imports priced in dollars to be 0.25,
whereas for import goods not priced in dollars, the average pass-through was .95, or almost 1.
Gopinath, Itshoki, and Rigobon further report that in 2004, 93 percent of U.S. imports were
priced in dollars, up from 88 percent in 1994. This indicates the strong presence of LCP in U.S.
imports.
Vehicle Currencies and Commodity Prices
In cases where goods are very close substitutes and consumers can easily shift among
suppliers, an exporter may prefer to price in the same currency as his competitors (vehicle
currency). The dollar is the most common “vehicle” currency in international trade (see data in
Figure 1). Homogeneous commodities, such as metals, minerals, and agricultural commodities,
6 For a discussion of currency invoicing see Kamps (2006) and Goldberg and Tille (2007).

8
are typically priced in dollars. In addition, countries such as Korea, Thailand, and other Asian
countries often price most of their exports in dollars, using the dollar for a large part of their
exports, regardless of the U.S. share.
Due to dollar pricing, commodity prices are highly correlated with changes in the dollar,
and are expected to rise when the dollar declines and vice versa. Thus, it has been common to
report pass-through estimates for U.S. imports less oil, or consumer goods alone. More recently,
Marazzi, Sheets, and Vigfusson (2005) included commodity prices as a variable in estimated
pass-through equations to control for the indirect effect of the dollar. Aggregate exchange-rate
pass-through holding commodity prices constant is expected to be lower compared to estimates
that do not control for commodity effects.7
7.Hellerstein, Daly, and Marsh (2006), and Marazzi and Sheets (2007).
United States Korea China* Thailand Canada Australia India Japan0
20
40
60
80
100
dollar percent U.S. export share
Source: Goldberg and Tille; Bank of Thailand; Kamps; Bernard; and GTIS, Global Trade Atlas Database.
Figure 1 Exports: Dollar invoicing, various countries , 2003-2007 and U.S. share ofexports, 2007
*Data are for Chinese exports of textiles only

9
Estimates of Exchange-Rate Pass-Through–United States
Numerous economic studies have examined the extent of exchange-rate pass-through to
import prices both in the United States and in foreign countries. These studies measure the
sensitivity of movements in merchandise import prices to changes in the U.S. dollar (for
exchange-rate pass-through in the U.S. market), after controlling for other factors that influence
the evolution of import prices, such as foreign production costs, and in some cases, commodity
prices.
Marazzi, Sheets, and Vigfusson (2005), using data from 1972 to 2004, found a U.S. pass-
through rate of 0.12 for the sample ending in the last ten years of the study, based on U.S. prices
for imports less energy products, computers, and semi conductors, and holding commodity prices
constant.8 The exchange rate pass-through including the commodity price effects was estimated
to be 0.3. The authors also found that exchange rate pass-through tends to occur quite rapidly,
with the contemporaneous coefficient and one lag accounting for most of the exchange rate pass-
through. The authors cite the increasing role of China in the U.S. market as one of the factors
likely contributing to the low exchange-rate pass-through in recent years. Hellerstein, Daly, and
Marsh (2006) estimated aggregate-level exchange-rate pass-through into U.S. prices to be 0.51
using data on imports less petroleum products from 1985 to 2005 (quarter 2), and 0.36 holding
commodity effects constant.
8 The authors eliminated petroleum products due to high price volatility, and computers and semiconductors due to arguments
that their prices behave differently due to hedonic price adjustments. However, they note that excluding computers and semiconductors did not significantly affect the results as compared to including these products.

10
Estimates of Exchange Rate Pass-through–Foreign Exporters
If pass-through is low, exporters are absorbing changes in exchange rate adjustments in
their profit margins by adjusting their export prices to offset the effects of the exchange rate
change. A number of studies have analyzed the behavior of exporters and how they react to
exchange rate movements in the U.S. market. These studies have generally found that export
prices are tend to be more sensitive for exports to the U.S. market, thus indicating that PTM or
LCP behavior.
Parsons and Sato (2008) investigated exchange rate pass-through by Japanese exporters
for three destinations: the United States, the EU, and East Asia using Japanese 9-digit HS data
for 27 manufactured products. They examined the change in the Japanese export price (in yen) in
response to a bilateral change in the exchange rate using data from 1988 to 2005. The currencies
used by Japanese exporters for invoicing exports affected the estimated pass-through
coefficients. They noted that the United States largely imports in dollars, but the EU tends to
import from Japan in euros, with the yen and dollar occupying smaller shares. In East Asia,
approximately 50 percent of Japanese exports are denominated in yen, but exports in U.S. dollars
are also common.
Regression results showed PTM behavior to be more common in Japanese exports to the
United States, and to a lesser extent, the EU. In contrast, they found exchange-rate pass-through
to be relatively high in East Asia. Parsons and Sato hypothesized that while PTM may not be
occurring in the destination currencies in East Asia, Japanese exporters may set their export
prices in the region in relation to world prices denominated in dollars. They found PTM in
automobiles, and transportation and related parts exports both in the EU and the United States. In
addition, they found PTM behavior in steel in the U.S., EU, and the East Asian market.

11
Fukuda and Ono (2004) investigated the stability of Korean export prices for 19
commodities against changes in the U.S. dollar, Japanese yen, and euro versus the Korean won
from 1998 to 2002 using regression analysis. The purpose of this study was to show how the use
of a dominant vehicle currency (the dollar) for invoicing exports affects Korean export prices.
As noted earlier, payments in U.S. dollars are dominant in East Asian trade. Fukuda and Ono’s
results showed that export prices in Korea have high correlation with the U.S. dollar (0.837
meaning that a 1 percent change in the won/dollar exchange rate is associated with a 0.8 percent
change in won export prices), and modest correlation with the yen and the euro. Moreover, they
showed that Korean export prices were highly correlated in terms of the U.S. dollar even in
commodities for which Japan had the largest export market share.
Fukuda and Ono’s results are consistent with LCP and low ERPT to the U.S. market.9
They also argue that Korean exporters may choose to sell their products in U.S. dollars since
their products are less differentiated and competitive pressures may lead to exporting firms
choosing to invoice in dollars, even if the United States is not a trade partner.
Exchange-Rate Pass-Through--China
Bernard (2008) examined the role of exchange rates on Chinese firms, specifically, textile
and apparel exporters based on an original survey of over 230 firms in 2006. This study found
that Chinese exporters of textiles and apparel receive the majority of their export revenues in
dollars (88 percent), while the United States accounts for roughly 24 percent of sales.10
According to Bernard, the intense competition in textile and apparel markets makes the dollar an
9 For example, assume the dollar depreciates against the Korean won. If Korean prices are set in U.S. dollars, then we would
expect that Korean export prices in won to fall with the dollar depreciation. 10Bernard (2008), 6–7.

12
attractive vehicle currency, but combined with low margins on exports, places many Chinese
firms in a position of substantial exchange rate risk. The study suggests that the most likely
response of Chinese textile and apparel exporters in the event of an appreciation of the yuan is to
raise export prices due to the lack of alternatives to minimize exchange rate risk.
III. Methodology
Estimation of exchange-rate pass-through has typically been based on the law of one
price, combined with the pricing-to-market literature. According to standard economic trade
theory, if we ignore transport and other border costs, the dollar price of U.S. imports equals the
foreign currency export prices converted into dollars (E = $/foreign currency) for sale in the U.S.
market as shown in equation 1 below:
(1) Ptm
= EtPtx
where Ptm is the domestic price in the importing country;
Et is the nominal exchange rate (domestic currency per unit of foreign exchange); and
Ptx is the foreign price (in units of foreign currency).
As denoted above, a depreciation of the dollar (increase in Et) must result in a rise in U.S. import
prices of the same magnitude, unless there is a decline in the prices foreign producers receive,
and vice versa.
The impact of an exchange rate change on import prices is usually defined as the percent
change in the local currency import price (Ptm) resulting from a one percent change in the
exchange rate between the exporting and importing country (Et). For example, if the dollar falls
by 10 percent, equation (1) implies that the import price in the United States in dollars should
increase by 10 percent–a pass-through equal to one. If this does not occur, equation (1) suggests

13
that foreign producers must be absorbing some of the decline in the value of the dollar. This is
labeled as “incomplete” pass-through of exchange rates to import prices.
The analysis of pricing-to-market considers the following relationships among prices,
exchange rates, and costs for differentiated products characterized by monopolistic
competition:11
(2) Ptm = EtPt
x = EtMkupxCtx
and
(3) Mkuptx = Pt
x/Ctx
where (Ctx) is the exporters marginal cost, and Mkupt
x is the exporter’s markup over marginal
cost. The markup rate could be 2, for example, giving the exporter a profit of 200 percent over
marginal cost.
Based upon equation (2) and the pricing-to-market literature, the following equation was
used to estimate the pass-through of exchange rates to U.S. import prices:
(4) Ptm = α + Et-i + wpt-j + dt(U.S. GDPt) + εt
where: Ptm is an index of U.S. import prices in period t; " is a constant; Et-i is the U.S. exchange
rate (broad-based or bilateral with the specific country, in dollars per foreign currency unit) at
time t minus i; wpt-j is a control for price (cost) movements that affect import prices
independently of the exchange rate in period t-j. In addition, Campa and Goldberg (2002)
suggest that exchange-rate pass-through equations should control for the effects of U.S. demand
11 See, Campa and Goldberg (2002). Pricing-to-market requires differentiated goods and a markup over price.
a i
i
i
=
=
∑0
4
cj
j
j
=
=
∑0
4

14
on import prices, thus U.S. GDPt (U.S. gross domestic product [volume basis] in period t) is
included in the equation. Finally, gt is a regression error term.
In equation (4), the estimated coefficient on Et, ai, is the pass-through coefficient, and is
expected to be between 0 and 1:
ai = 1, import prices change with exchange rates on a 1 to 1 basis, and pass-through is complete; ai = 0, denotes import prices do not change with exchange rates, and there is no pass-through;
0 < ai < 1, import prices change with exchange rates, but less than the change in the exchange rate, and pass-through is incomplete.
The equation was estimated for aggregate U.S. import prices, and for import prices from
Canada, Japan, the NIEs (Taiwan, South Korea, Singapore, and Hong Kong), the EU, and Latin
America. The aggregate price indexes are the import price index for all commodities excluding
oil, and the aggregate import price index for consumer goods from the BLS. The bilateral import
price indexes are the BLS locality price indexes. Exchange rates are from the Federal Reserve
Board.12
12 Board of Governors of the Federal Reserve System, Foreign Exchange Rates.
The exchange rate used in the aggregate price equations is a weighted average of
exchange rates of major U.S. trading partners. The exchange rate in the bilateral equations is the
dollar exchange rate relative to the bilateral trading partner, or the euro, in the case of the EU.
The variable wpt-j is measured as foreign wholesale (producer) prices in all equations except the
U.S. aggregate import equations where wpt-j is measured as the percent change in the average
world consumer price index. The foreign price indexes and the U.S. GDP data are from the
International Monetary Fund, International Financial Statistics. All variables are in logarithm
first differences, except the world consumer price, which is on a percentage change basis.

15
The use of the BLS locality price indexes limited the length of time over which the
exchange-rate pass-through could be estimated since the locality price series was instituted in
1999. However, the use of actual prices collected by BLS, rather than unit value import data,
helps to correct for the well-known deficiencies of import unit value data, which are often poor
and do not reflect changes in products and product composition. The equations were estimated
using quarterly data from 1999 to 2008. To control for commodity effects, the import prices
indices for Canada, the EU, and Latin America are for manufactured goods only. For Japan and
the NIEs, the import price indices are for all commodities (which are heavily weighted toward
imports of manufactures).
The BLS locality price index for the NIEs includes import prices for four countries
(South Korea, Taiwan, Hong Kong, and Singapore). Therefore, the exchange rate and the
domestic price variables for the NIEs are trade-weighted averages based on U.S. Customs import
value data, with the weights adjusted every year. Similarly, the locality index for Latin America
includes Mexico and countries in Central America, the Caribbean, and South America. However,
an analysis of manufactured goods imports from these countries indicated that, in recent years,
approximately 85 percent of these imports are from Mexico and Brazil, with Mexico accounting
for the preponderance. Thus, the exchange rate and domestic price variables for Latin America
are weighted averages, with the weights based on Brazilian and Mexican U.S. import data.
An additional limitation of the locality import price data is that the EU index includes all
the EU countries–including the United Kingdom. The EU regressions were estimated relative to
changes in the euro–no correction was made for the effect of the UK pound.
The exchange rate and price variables are entered in the equations for the current period
include four lags. Thus, the estimated exchange-rate pass through takes into account the amount

16
of time that it often takes for exchange rates to affect import prices. The equations were
estimated using ordinary least squares with a correction for serial correlation.
IV. Findings/Discussion
The data showing the graphical relationships between U.S. dollar exchange rate changes,
aggregate import prices, and import prices for Japan, the NIEs, the EU, and Japan are shown in
Appendix Figures A.1 to A.6. The exchange rate is denoted as dollars per foreign currency unit
so that an increase in the exchange rate represents a depreciation of the dollar. One would expect
a positive correlation between the exchange rate and import price changes. All data are in natural
log first differences, reported on a quarterly basis. The figures show how import prices have
changed with the exchange rate from 1999 to 2008. The data as graphed do not take account
possible lags in the effect of exchange rate changes on import prices and they do not control for
movements in import prices that are unrelated to changes in the exchange rate.
Appendix Figure A.7 shows BLS import price and exchange rate changes for China,
which allowed the yuan to fluctuate against the dollar starting in July, 2005. The data show an
upward trend in the dollar/yuan exchange rate and in U.S. import prices, particularly starting in
2006. The available data did not support econometric estimation of exchange-rate pass-through
for U.S. imports from China due to the small number of observations available after the yuan was
allowed to fluctuate.13 However, due to the importance of China in U.S. trade, the extent to
which import prices for Chinese goods increase with the dollar exchange rate will have a large
effect on the overall estimate of U.S. exchange rate pass-through.
13 OLS estimation with just 14 quarterly observations resulted in a 0.41 exchange-rate pass-through, statistically significant at
the 10 percent level. The estimation period included China’s elimination of some export rebates, which likely affected the estimate. In addition, the quality of China’s producer price data affected the estimate.

17
The OLS coefficients estimated for the exchange-rate pass-through are in Table 1. The
actual regression results are in Appendix Table 1. All of the estimated exchange rate coefficients
are statistically significant at the 1 or 2 percent level, except for the NIEs. The estimated
exchange-rate pass-through of 0.47 for aggregate U.S. imports less oil is higher than the estimate
of Marazzi, Sheets, and Vigfusson (2005), but slightly lower than the estimate of Hellerstein,
Daly and Marsh (2006), both of which were estimated for different time periods. The estimated
exchange rate pass-through for consumer goods of 0.26 for consumer goods is also higher than
the previous studies. In contrast to Marazzi, Sheets, and Vigfusson and Hellerstein, Daly and
Marsh, the estimates in this paper include a number of periods when the Chinese yuan
was appreciating against the dollar, which may have contributed to the higher exchange rate pass-
through.
TABLE 1. U.S. imports: Exchange-rate pass-through, 1999-2008
Imports from: Products Exchange-rate pass-through estimate1 Standard error
All countries Imports less oil 2 0.47** 0.170
All countries Consumer goods 0.26*** 0.026
Japan All products 0.16*** 0.039
EU Manufactures 0.26*** 0.062
Canada Manufactures 0.49*** 0.068
NIEs All products 0.00 0.011
Latin America Manufactures 0.59*** 0.146
Source: Estimated using data from DOL, BLS and the Board of Governors of the Federal Reserve.
1 Quarterly observations. Estimates are long-run. Coefficients give the percent change in import price for a 1 percent change in the exchange rate over 4 quarters. 2 Excludes petroleum and petroleum products. ** = significant at the 2 percent level. *** = significant at the 1 percent level.

18
The exchange-rate estimates show the highest pass-through for manufactured imports
from Latin America (0.59) and Canada (0.49). As noted earlier, the results of the Latin America
equation largely reflect the influence of Mexico, which accounts for the largest part of U.S.
imports from this region. The relatively high estimated exchange-rate pass-through for these
countries is interesting, as it is generally considered that the United States economy and trade are
highly integrated with these countries due to the NAFTA. The high exchange-rate pass-through,
might indicate that exchange rate costs are included in intra-firm pricing and accounting practices.
The actual effects on wholesale and consumer prices might be different once the pricing strategies
of parent firms in the United States are taken into consideration.
The relatively low exchange-rate pass-through for imports from Japan is consistent with
the study by Parsons and Sato (2008), which found that PTM behavior among Japanese exports is
common for exports to the United States. Most of the exchange rate pass-through for Japan is was
found to take place in the first and second quarters. The non-existent exchange-rate pass-through
found for the NIEs is consistent with the study by Fukuda and Ono (2004) which showed that
East Asian countries tend to set their export prices in dollars across export markets. The estimated
exchange-rate pass-through of 0.26 for the EU seems reasonable–the coefficient is lower than that
of Latin America (Mexico) and Canada, whose economies are highly integrated with that of the
United States, but higher than the estimates for Japan and the NIE’s where PTM behavior is
common.
V. Conclusions
This paper has examined some of the reasons why changes in the value of the U.S. dollar
could result in low pass-through to U.S. import prices. This is an important issue for U.S. trade

19
competitiveness because if exchange rate changes are fully passed through to U.S. import prices,
such exchange rate changes could result in increased costs (exchange rate depreciation) or
increased competitiveness (dollar appreciation) of domestic producers relative to foreign
suppliers. Some of the economic explanations for low exchange-rate pass-through include
pricing-to-market, dollar invoicing, and global sourcing.
Both the economic literature, and the data compiled in this report, indicate low exchange-
rate pass-through to U.S. import prices, particularly for consumer goods. However, estimates of
exchange-rate pass-through for various countries indicate it varies by import source. The lowest
exchange-rate pass-through was found for imports from Asian countries--the NIEs and Japan.
Exchange-rate pass- through appears to be highest for the Latin America (Mexico) and Canada,
with the EU in between. The higher rate of exchange-rate pass-through for Latin America and
Canada, may be linked to the interrelated manufacturing processes between these countries and
the United States, although this is not explored in the paper.

20
VI. References
Bank of Thailand, “Structure of Import and Export Payments Classified by Currency.” http://www.bankthailand.info/ExchangeRates.htm (retrieved January 15, 2009). Bernard, Andrew B. “Chinese Exporters, Exchange Rate Exposure, and the Value of the Renminbi,” Working Paper no. 2008-52, Tuck School of Business at Dartmouth, Hanover, N.H., 2008. Board of Governors of the Federal Reserve System. Foreign Exchange Rates (accessed various
dates). http://www.federalreserve.gov/econresdata/releases/statisticsdata.htm. Campa, Jose Manual and Linda S. Goldberg. “Exchange Rate Pass-Through into Import Prices: A Macro or Micro Phenomenon?” Working Paper no. 8934, National Bureau of Economic Research, Cambridge, MA, 2002. Fukuda, Shin-ichi and Masanori Ono. “The Choice of Invoice Currency under Uncertainty: Theory and Evidence from Korea,” CIRJE F-271, Faculty of Economics, University of Tokyo, 2004. Global Trade Information Service, Inc. (GTIS). World Trade Atlas Database (accessed various dates). Goldberg, Linda and Cedric Tille. “Macroeconomic Interdependence and the International Role of the Dollar,” presentation at the 8th Jacques Polak Annual Research Conference, International Monetary Fund, Washington, DC, November 15-16, 2007. Gopinath, Gita, Oleg Itshoki, and Roberto Rigobon. “Currency Choice and Exchange Rate Pass- Through,” Working Paper no. 13432, National Bureau of Economic Research, Cambridge MA, 2007. Hellerstein, Rebecca, Deirdre Daly, and Christina Marsh. “Have U.S. Import Prices Become Less Responsive to Changes in the Dollar?” Current Issues in Economics,12, Federal Reserve Bankof New York, 2006. International Monetary Fund. International Financial Statistics, various issues. Kamps, Annette. “The Euro as Invoicing Currency in International Trade,” Working Paper no. 665, The European Central Bank, Frankfurt, Germany, 2006. Krugman, Paul. “Pricing-to-Market When the Exchange Rate Changes.” in Sven W. Arndt and J. David Richardson, eds., Real Financial Linkages Among Open Economies, MIT Press, Cambridge, MA, 1987: 49-70.

21
Marazzi, Mario, Nathan Sheets, and Robert Vigfusson. “Exchange Rate Pass-through to U.S. Import Prices: Some New Evidence,” International Finance Discussion Paper no. 833, Board of Governors of the Federal Reserve System, Washington, DC, 2005. Marazzi, Mario and Nathan Sheets. “Declining Exchange Rate Pass-through to U.S. Import Prices: The Potential Role of Global Factors,” Journal of International Money and Finance, 26 (2007): 924-47. Mishkin, Governor Frederick S. “Exchange Rate Pass-Through and Monetary Policy,” speech prepared for the Norges Bank Conference on Monetary Policy, Oslo, Norway, March 7, 2008. Parsons, Craig R. and Kiyotaka Sato. “New Estimates of Exchange Rate Pass-Through in Japanese Exports, International Journal of Finance and Economics, 13, (2008): 174- 183. U.S. Department of Labor (DOL), Bureau of Labor Statistics (BLS). Import/Export Price Indexes. http://www.bls.gov/data/#international. Wall Street Journal, “Slack Labor Markets Will Hold Down Prices.” June 24, 2009, 15.

22
Table A.1 Estimation results: Exchange-rate pass-through to U.S. import prices:1
Imports less oil2
Consumer goods Imports From:
Canada Latin
America EU Japan NIEs
U.S. GDP 0.025 -0.160 -0.127 0.955 -0.001 -0.004 0.055
(0.334) (0.123) (0.336) (0.548) (0.269) (0.126) (0.041)
Foreign 0.007 0.004 1.175*** 1.132* 0.669* 0.250* 0.173***
price (0.010) (0.004) (0.312) (0.574) (0.220) (0.136) (0.035)
Exchange 0.467** 0.259*** 0.489*** 0.595*** 0.261*** 0.163*** 0.001
rate (0.170) (0.077) (0.115) (0.145) (0.034) (0.016) (0.011)
Constant 0.000 0.001 0.000 -0.010 0.001 -0.001 -0.002***
(0.001) (0.001) (.002) (0.009) (0.003) (0.001) (0.000)
N= 39
R-sq 0.71 0.61 0.83 0.76 0.78 0.62 0.77
R-sq adj 0.59 0.47 0.77 0.68 0.70 0.49 0.68
DW 1.94 1.87 2.00 1.96 1.86 2.07 1.89
Source: Author’s calculations using OLS regression.
1 Quarterly observations. Exchange rate coefficients give the percent change in import price for a 1 percent change in the exchange rate over four quarters. Standard errors are in parentheses. Data are in log differences or percent change. 2 Excludes petroleum and petroleum products. * = significant at the 10 percent level ** = significant at the 2 percent level *** = significant at the 1 percent level

23
1999 2000 2001 2002 2003 2004 2005 2006 2007 2008-0.2
-0.15
-0.1
-0.05
0
0.05
0.1
Exchange rate All commodities import priceImport price no oil Import price consumer goods
Source: DOL, BLS and Federal Reserve Board. U.S. dollars per foreign currency in terms of a broad basketof currencies.
Figure A.1 Change in U.S. exchange rate and U.S. import prices, 1999–2008
1999 2000 2001 2002 2003 2004 2005 2006 2007 2008-0.2
-0.15
-0.1
-0.05
0
0.05
0.1
U.S./Canadian dollar Canada manfactures
Source: DOL, BLS and Federal Reserve Board.
Figure A.2 U.S.Canadian Dollar exchange rate and Canadian import prices,1999–2008

24
1999 2000 2001 2002 2003 2004 2005 2006 2007 2008-0.25
-0.2
-0.15
-0.1
-0.05
0
0.05
0.1
U.S./NIE exchange rate NIE Import Price
Source: DOL, BLS and Federal Reserve Board. NIEs include South Korea, Taiwan, Singapore, and HongKong. Exchange rate is trade-weighted average using one-year lagged chain.
Figure A.3 Change in U.S./Asia NIEexchange rate and NIE import prices,1999–2008
1999 2000 2001 2002 2003 2004 2005 2006 2007 2008-0.1
-0.05
0
0.05
0.1
0.15
Japan all commodities imports Dollar/yen
Source: DOL, BLS and Federal Reserve Board. U.S. dollars per yen.
Figure A.4 Change in U.S. dollar/yen exchange rate and U.S. import pricesfrom Japan, 1999–2008

25
1999 2000 2001 2002 2003 2004 2005 2006 2007 2008-0.15
-0.1
-0.05
0
0.05
0.1
U.S. dollar/euro Import prices EU manufactures
Source: DOL, BLS and Federal Reserve Board.
Figure A.5 Change in dollar/euro exchange rate and U.S. import prices fromthe EU, 1999–2008
Correlation: 0.69
1999 2000 2001 2002 2003 2004 2005 2006 2007 2008-0.3
-0.25
-0.2
-0.15
-0.1
-0.05
0
0.05
0.1
U.S. dollar/weighted LA exchange rate Import prices LA manufactures
Note: LA exchange rate is a weighted average of Brazil’s and Mexico’s exchange rates relative tothe dollar.
Source: DOL, BLS and Federal Reserve Board.
Figure A.6 Change in dollar/Latin America exchange rate and U.S. importprices from Latin America, 1999–2008

26
2004 2005 2006 2007 2008-0.01
0
0.01
0.02
0.03
0.04
China all imports Dollar/yuan
Source: DOL, BLS and Federal Reserve Board.
Figure A.7 Dollar/yuan exchange rate and U.S. import prices from China,2004–2008