Embed Size (px)
Citation preview
NCC Statement on Prices and Costs 2004
September 2004
Foreword
The extraordinary achievements of the Irish economy over the past decade have been well documented. Our rapid growth in employment and average income has made Ireland the envy of Europe. The favourable economic developments since the late 1990s have, however, left us with a number of challenges, not least of which is the threat to our continued economic success from rising prices and costs.
In May 2003, the National Competitiveness Council issued its Statement on Inflation analysing the key drivers of Irish inflation, examining the consequences of continued high prices and setting forth a number of recommendations designed to address these issues. Many of these recommendations were acted upon by Government and the Social Partners. The NCC recognises the positive impact that these actions have had on lowering inflation and sustaining competitiveness.
The inflation of recent years has, however, left a legacy of high price and cost levels relative to our trading partners that remain to be tackled. The NCC believes that now is an opportune time to highlight again the importance of improving Ireland’s price and cost competitiveness.
The analysis within this Statement confirms the widely held belief that Ireland is an expensive location for both businesses and consumers. In recent years, Ireland has overtaken the UK and Sweden to become the third most expensive country in the EU for consumer goods and services, and is now almost on a par with Finland as the most expensive country in the eurozone. The gap between prices here and elsewhere in Europe is not justified by economic fundamentals.
Ireland’s ascent through the consumer pricing ranks is partly due to fluctuations in the value of the euro, which is out of the control of Irish policy makers. But it also stems from high domestically-generated prices, particularly in the non-traded services sector. Decisions by government, its agencies and regulators have also contributed adversely to inflation. This has damaging implications for the enterprise sector and the ability of Irish firms to compete in foreign markets.
Improving Ireland’s international cost competitiveness should become a priority for Government. This Statement aims to stimulate discussion on how this can be done, identifying the contributions needed from government policy across a range of areas. More detailed recommendations designed to address weaknesses in Ireland’s competitiveness performance will be published in the NCC’s Competitiveness Challenge report later this year.
William Burgess Chairman National Competitiveness Council
Introduction and Executive Summary
There is mounting evidence that prices and costs in Ireland are out of line with other advanced economies:
Consumer Prices • Ireland’s consumer price inflation rate has exceeded the eurozone and wider EU15 average for the past seven
years. In the four years to May 2004, the average price of Irish goods and services (when measured in a common currency) increased by 22 per cent relative to our trading partners.
• Between 2001 and 2002 Ireland overtook the UK and Sweden to become the third most expensive country in the EU for consumer goods and services (behind only Denmark and Finland).
• By 2003 Ireland was virtually on a par with Finland as the most expensive country in the eurozone for consumer goods and services. Ireland was the most expensive country in the eurozone for food, non-alcoholic beverages (retail), tobacco and rentals for housing.
• According to analysis carried out for the NCC, by the end of 2003 Ireland’s price level relative to our trading partners (when measured in a common currency) was eight per cent above its long-run sustainable level – the level that keeps the Irish economy competitive enough to sustain full employment.
• In the five years to January 2004, 68 per cent of inflation occurred in non-traded sectors i.e. most inflation has been generated at home, and has not been sourced from abroad via rising costs for imported goods. The main contributors to inflation over this period were restaurants and pubs (accounting for 25 per cent of the total inflation), alcohol and tobacco (13 per cent of the total), housing, water and fuels (11 per cent of the total), recreation and culture (11 per cent of the total) and food and non-alcoholic beverages (10 per cent of the total).
• In the five years to January 2004, decisions by Government, its agencies and regulators added 7.9 per cent to the total inflation rate (with affected goods and services accounting for 44 per cent of national consumer price inflation compared with approximately 28 per cent of national expenditure).
Business Costs • In the period 1998-2003, nominal compensation per employee (before tax) in Ireland grew by 37.1 per cent –
faster than in any other eurozone country. This compared with growth in nominal compensation per employee of just 8.7 per cent in Germany. In real terms (after inflation), Irish wages increased by 12.1 per cent between 1998 and 2003, compared with 4.0 per cent for the eurozone as a whole.
• By 2004 gross annual average compensation in Ireland (before tax) was estimated at €38,140. This was higher than the EU15 average (€34,630) and the UK (€35,750), although below that of the USA and France.
• Rising pay costs have been offset by rising worker productivity only in a small number of capital-intensive sectors. More labour intensive sectors have, on average, suffered a rise in unit labour costs (wages adjusted by improvements in productivity).
• Research also shows Ireland to be very expensive for a range of non-pay costs for industry. In a 2004 survey of European capital cities, only London and Paris were more expensive than Dublin for the cost of office space.
• In the three years to September 2004, electricity prices for industry have increased by approximately 40 per cent. A typical industrial user pays 40 per cent higher electricity costs in Ireland than in the UK. Of ten countries surveyed Ireland is the second most expensive (behind Italy) for electricity for industrial users.
• Other non-pay costs that are higher in Ireland relative to other EU countries include insurance and waste management charges.
Conclusions
Ireland’s deteriorating cost competitiveness has already undermined the ability of many companies in Ireland to compete in international markets. Employment in manufacturing and other production industries – the sectors of the economy most exposed to international competition – has fallen from a peak of 330,000 in the third quarter of 2001 to 300,000 in the second quarter of this year. The fact that there has not been an even greater loss of employment and output may be partly due to the willingness of firms in Ireland to absorb a temporary decline in profit margins. If the decline in cost competitiveness persists, a lagged response in terms of a more significant loss
i
of employment and living standards may still occur. The recent acceleration in Irish consumer price inflation, together with the growing risk of a further sharp decline in the value of the dollar against the euro, make this outcome all-too possible.
Restoring Ireland’s international cost competitiveness should, therefore, remain a high priority for Government. The challenge for policy makers is to reverse the recent acceleration in inflation and to eliminate the inflation differential with the rest of the eurozone. In the view of the NCC, this can be done by putting in place coherent policies across the following areas:
Incomes Policy and Social Partnership: While the causal relationship between inflation and wage demands is uncertain, there is recognition by all of the social partners that the rates of wage growth recorded in recent years must moderate in order to protect competitiveness and sustain jobs. The commitment by the social partners as part of the new social partnership agreement, Sustaining Progress, to set, in the context of a wider package of commitments from all sides, wage increases at 5.5 per cent over an 18 month period is a welcome development. As part of a more comprehensive set of policy actions to reduce price inflation and protect real income gains, it is imperative that wage drift above this rate be avoided. In applying the pay terms of the agreement there is a need at the firm level to take account of commercial and economic circumstances in order to safeguard competitiveness and employment levels from the effects of exchange rate volatility.
Labour Market Policy: Raising labour market participation (the proportion of the working age population in the workforce) up towards the rate of other northern European countries would ease labour shortages and upward wage pressures. Further lowering the tax burden on the low-paid and better childcare facilities are crucial in this regard. Action to encourage immigration of workers with skills in short supply could also ease labour market constraints.
Fiscal Policy: It is possible that increases in indirect taxes on consumption in Ireland (in terms of VAT and excise duties) may be in another factor in Ireland’s high price levels. The NCC acknowledges that the positive flip-side of this has been the relatively low rates of taxation on employment and capital, which have supported Ireland’s competitiveness. At the same time, it is important that going forward Government fiscal policy help to reduce price inflation and wage demands by avoiding large increases in excise duties, VAT and administered prices. Better public services and infrastructure should instead be financed by intensifying efforts to improve public sector efficiency and effectiveness and, over time, by broadening the Government’s revenue base.
Importing, Distribution and Retailing: Poorly functioning markets, and in particular the efficiency of a country’s importing, distribution and retailing systems, can be an important factor in explaining differentials in consumer prices between countries of similar levels of economic development. Identical goods imported into Europe from Asia (through Rotterdam) might ultimately retail at a higher price in Ireland than in France because of higher markups by Irish importers, wholesalers, distributors and retailers, reflecting either lower Irish levels of efficiency or higher profitability. Better infrastructure and regulation for the importing, transport and retailing industries may help to help to increase competition and efficiency in these sectors and, over time, narrow the gap between consumer prices here and other EU countries.
Competition and Regulation: Better regulation is also needed in sectors such as energy, telecoms and professional services to ensure more vigorous competition and to drive down the cost of doing business in Ireland. At a more general level, the NCC believes that there also needs to be a greater recognition by Government and the Social Partners of the hidden costs of Government regulation, and its impact on prices and the cost of living.
Trade Policy: The Government should support the efforts of the European Commission to open up Irish and other EU markets to more competition from abroad, particularly for food, services and utilities, thereby putting downward pressure on the high Irish prices and costs in these areas.
More specific recommendations on all of these issues will be presented by the NCC in its annual Competitiveness Challenge report, to be published later this year.
ii
Section 1 Irish Consumer Prices Relative to Other EU Countries I i i
I
62
67
70
80
83
84
84
86
88
91
99
104
110
40 50 60 80 110 120
ly
ia
Net l
UK
I
Fi
I f iI l )
62
67
69
79
81
83
83
84
85
85
100
101
70 80 90
t
ly
Belgi
ia
l
I
Fi
Figure 1: ndex of Pr ce of Consumer Goods and Servces EU15, 2002 ( RL = 100)
100
70 90 100
Portugal
Greece
Spain
Ita
Belgium
France
Luxembourg
Austr
her ands
Sw eden
reland
nland
Denmark
Figure 2: ndex o Consumer Good and Serv ces Eurozone, 2003 ( re and = 100
50 60 100 110
Por ugal
Greece
Spain
Ita
um
Luxembourg
France
Austr
Germany
Nether ands
reland
nland
Source: Eurostat / PricewaterhouseCoopers Derived Source: Eurostat / PricewaterhouseCoopers Derived
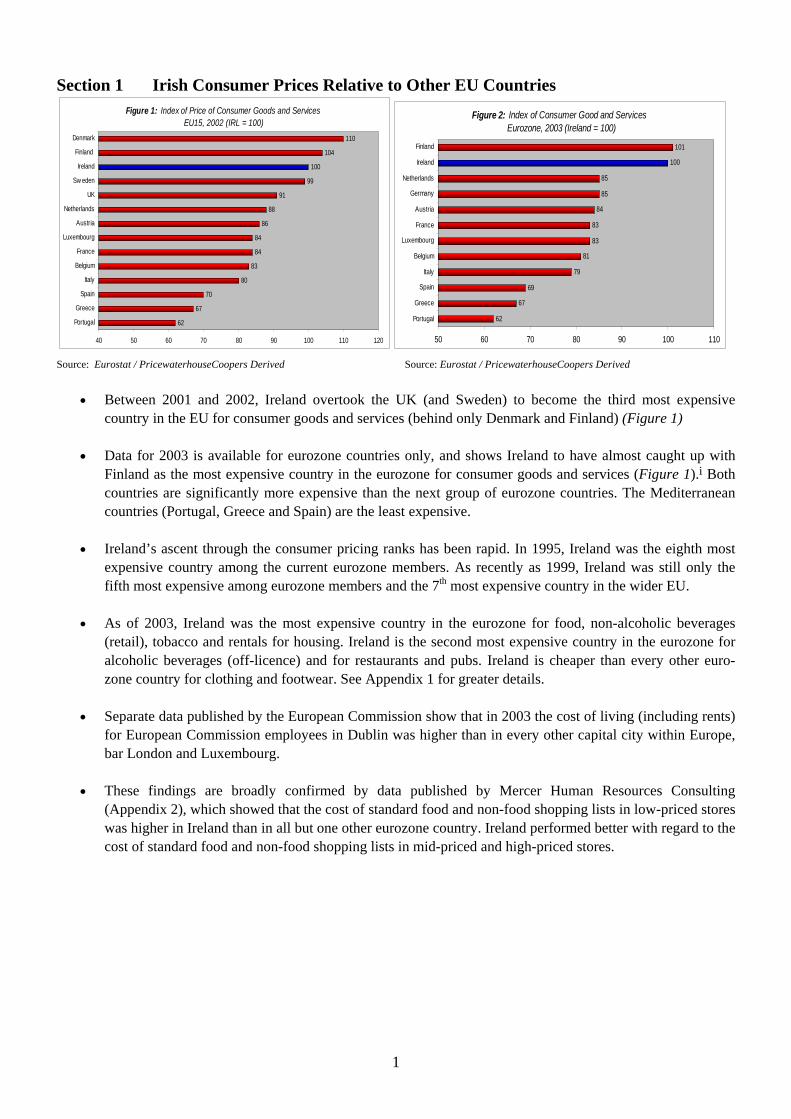
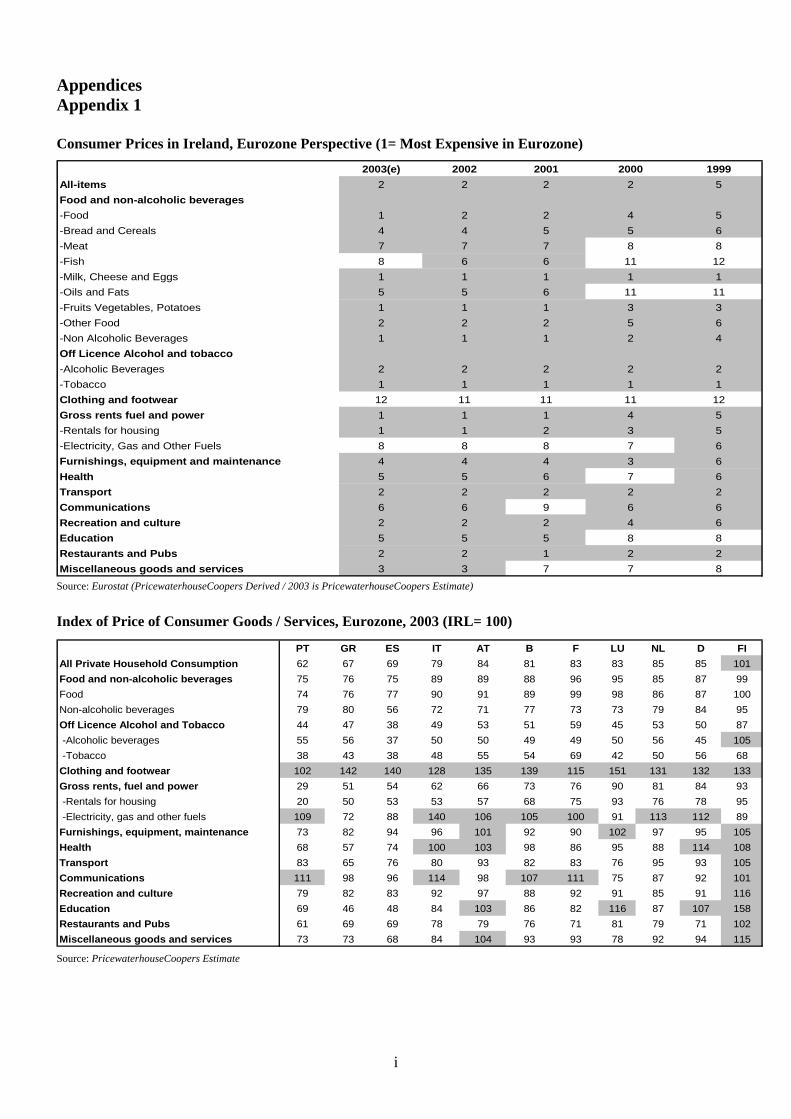
• Between 2001 and 2002, Ireland overtook the UK (and Sweden) to become the third most expensive country in the EU for consumer goods and services (behind only Denmark and Finland) (Figure 1)
• Data for 2003 is available for eurozone countries only, and shows Ireland to have almost caught up with Finland as the most expensive country in the eurozone for consumer goods and services (Figure 1).i Both countries are significantly more expensive than the next group of eurozone countries. The Mediterranean countries (Portugal, Greece and Spain) are the least expensive.
• Ireland’s ascent through the consumer pricing ranks has been rapid. In 1995, Ireland was the eighth most expensive country among the current eurozone members. As recently as 1999, Ireland was still only the fifth most expensive among eurozone members and the 7th most expensive country in the wider EU.
• As of 2003, Ireland was the most expensive country in the eurozone for food, non-alcoholic beverages (retail), tobacco and rentals for housing. Ireland is the second most expensive country in the eurozone for alcoholic beverages (off-licence) and for restaurants and pubs. Ireland is cheaper than every other euro-zone country for clothing and footwear. See Appendix 1 for greater details.
• Separate data published by the European Commission show that in 2003 the cost of living (including rents) for European Commission employees in Dublin was higher than in every other capital city within Europe, bar London and Luxembourg.
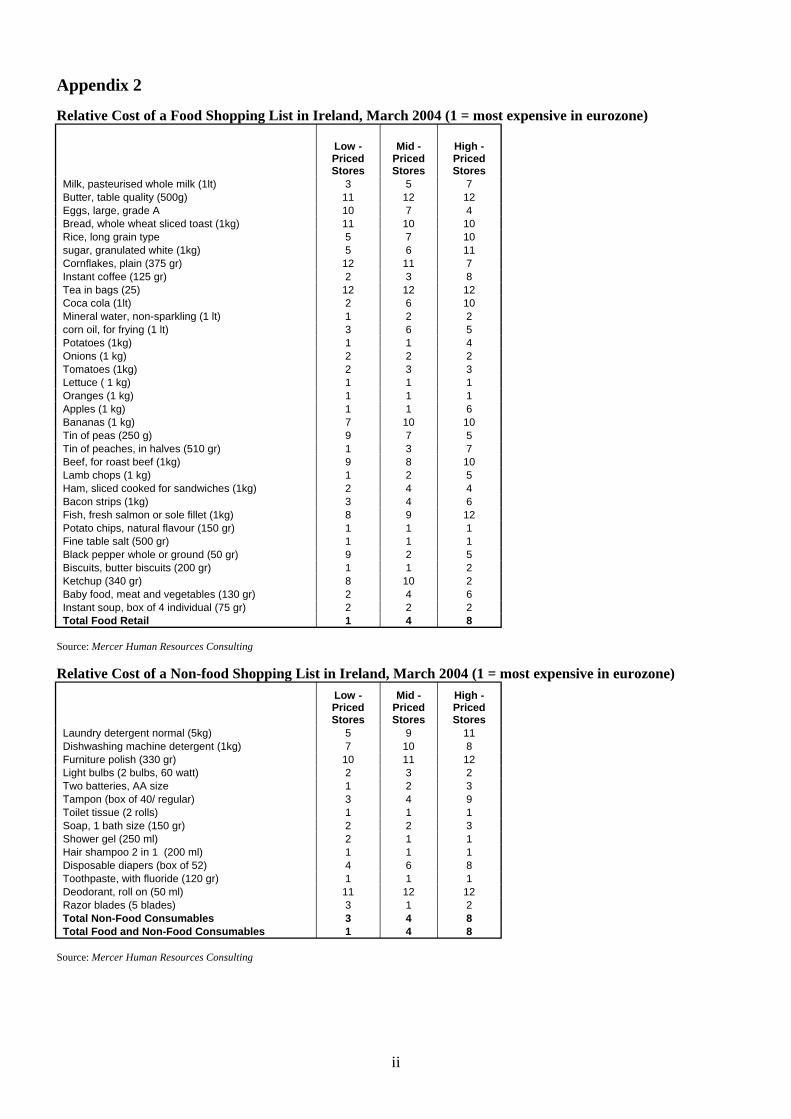
• These findings are broadly confirmed by data published by Mercer Human Resources Consulting (Appendix 2), which showed that the cost of standard food and non-food shopping lists in low-priced stores was higher in Ireland than in all but one other eurozone country. Ireland performed better with regard to the cost of standard food and non-food shopping lists in mid-priced and high-priced stores.
1
Section 2 Factors behind the Rise in the Relative Irish Price Level i flati I )
l
in
l
ia
UK
Nati l I
I i t
85
90
95
i l I ( l i )
Figure 3: Consumer Pr ce In on (H CPDecember 1999-December 2003
0.0 2.0 4.0 6.0 8.0
10.0 12.0 14.0 16.0 18.0 20.0
Irelan d
Po r tu g a
G reece
Sp a
N eth erlan d s
Italy
L u xe m bour g
Den m
ar k
Fin a n d
S w ed en
B elg iu m
F ran ce
Au s tr
Ger m
an y
ona HICP EU15 H CP
Figure 4: Trade-Weighted Competitiveness nd ca ors
100
105
110
115
120
J an-99
May-99
Sep-99
J an-00
May-00
Sep-00
J an-01
May-01
Sep-01
J an-02
May-02
Sep-02
J an-03
May-03
Sep-03
J an-04
May-04
Nomna TWCI Real TWC Def ated by consumer pr ces
Source: Eurostat Source: Central Bank of Ireland
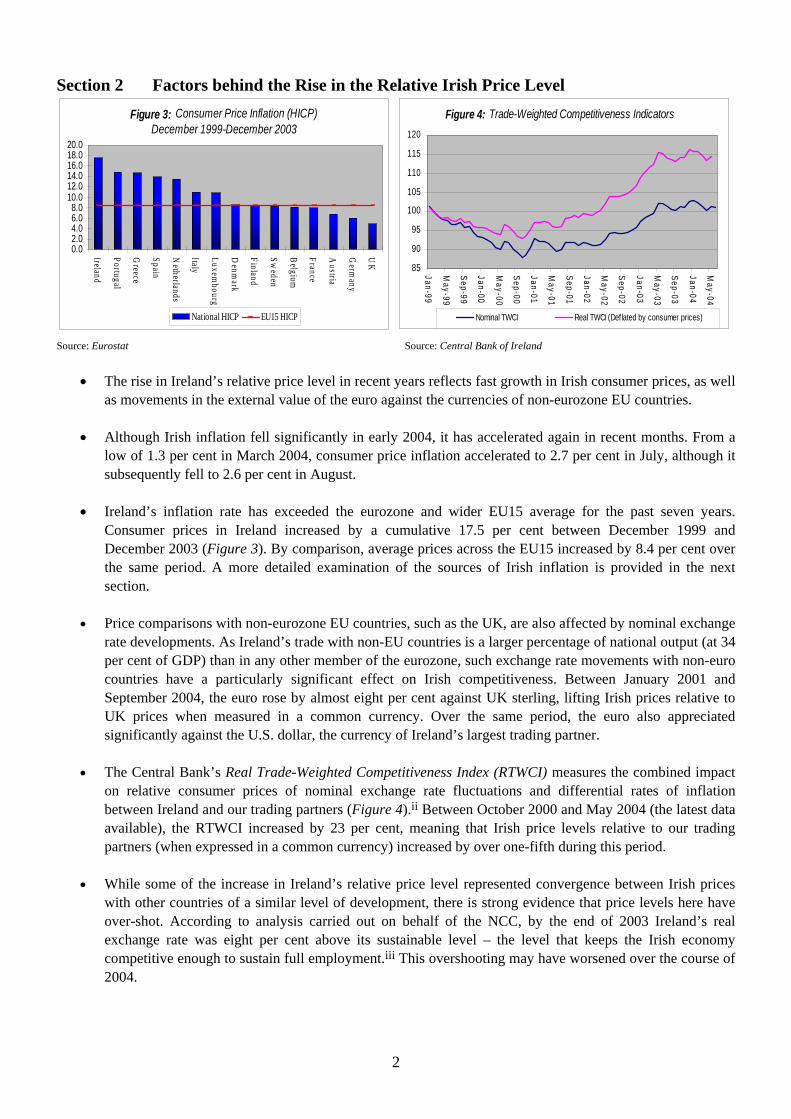
• The rise in Ireland’s relative price level in recent years reflects fast growth in Irish consumer prices, as well as movements in the external value of the euro against the currencies of non-eurozone EU countries.
• Although Irish inflation fell significantly in early 2004, it has accelerated again in recent months. From a low of 1.3 per cent in March 2004, consumer price inflation accelerated to 2.7 per cent in July, although it subsequently fell to 2.6 per cent in August.
• Ireland’s inflation rate has exceeded the eurozone and wider EU15 average for the past seven years. Consumer prices in Ireland increased by a cumulative 17.5 per cent between December 1999 and December 2003 (Figure 3). By comparison, average prices across the EU15 increased by 8.4 per cent over the same period. A more detailed examination of the sources of Irish inflation is provided in the next section.
• Price comparisons with non-eurozone EU countries, such as the UK, are also affected by nominal exchange rate developments. As Ireland’s trade with non-EU countries is a larger percentage of national output (at 34 per cent of GDP) than in any other member of the eurozone, such exchange rate movements with non-euro countries have a particularly significant effect on Irish competitiveness. Between January 2001 and September 2004, the euro rose by almost eight per cent against UK sterling, lifting Irish prices relative to UK prices when measured in a common currency. Over the same period, the euro also appreciated significantly against the U.S. dollar, the currency of Ireland’s largest trading partner.
• The Central Bank’s Real Trade-Weighted Competitiveness Index (RTWCI) measures the combined impact on relative consumer prices of nominal exchange rate fluctuations and differential rates of inflation between Ireland and our trading partners (Figure 4).ii Between October 2000 and May 2004 (the latest data available), the RTWCI increased by 23 per cent, meaning that Irish price levels relative to our trading partners (when expressed in a common currency) increased by over one-fifth during this period.
• While some of the increase in Ireland’s relative price level represented convergence between Irish prices with other countries of a similar level of development, there is strong evidence that price levels here have over-shot. According to analysis carried out on behalf of the NCC, by the end of 2003 Ireland’s real exchange rate was eight per cent above its sustainable level – the level that keeps the Irish economy competitive enough to sustain full employment.iii This overshooting may have worsened over the course of 2004.
2
Section 3 Drivers of Domestic Inflation : i I i )
3.2 2.5
3.2
0.5
3.7
7.5 7.7
3
0
2
4
6
8
10
i
ti l infl
17
0 2 4 6 8
10 12 14 16 18 20
tca ft
L i
i tt
lti tr ic it y
O ff
ight i I t ibuti ional inf lati )
Figure 5 Rates of Consumer Goods & Serv ces nflat on (%1999-2004
4.2
6.2
Jan 99-00 Jan 00-01 Jan 01-02 Jan 02-03 Jan 03-04
Goods Serv ces
Figure 6: Drivers of na ona ation January 2003-January 2004
5.73 6.37 4.39
2.17 1.39 0.84
18.7
14.9
8.1
12.6
2.5
R e s au r a nts ,
e s a n d fa s fo o d
Be erce n cce d
pr em s es
Cig a r e e s
C u ur al se r v c e s
Ele c
S p ir itsLic e n c e
We n CP baske Contr on to nat on (%
Source: Central Statistics Office / PricewaterhouseCoopers Derived Source: Central Statistics Office
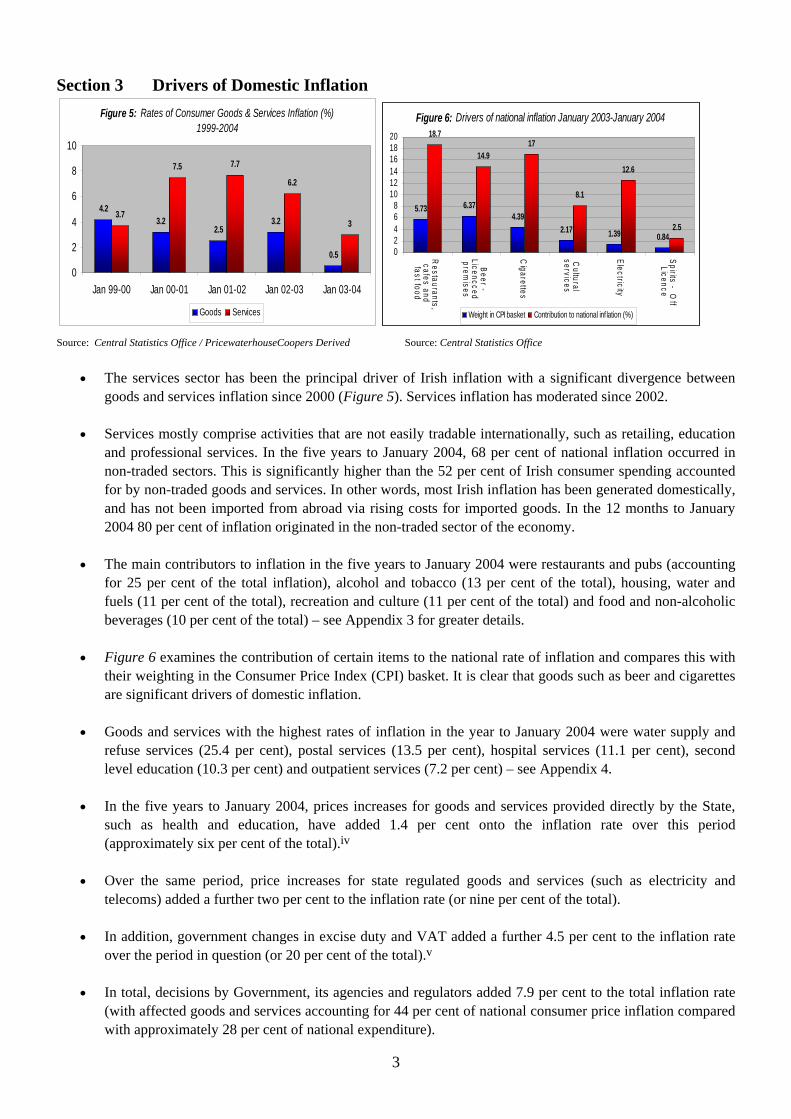
• The services sector has been the principal driver of Irish inflation with a significant divergence between goods and services inflation since 2000 (Figure 5). Services inflation has moderated since 2002.
• Services mostly comprise activities that are not easily tradable internationally, such as retailing, education and professional services. In the five years to January 2004, 68 per cent of national inflation occurred in non-traded sectors. This is significantly higher than the 52 per cent of Irish consumer spending accounted for by non-traded goods and services. In other words, most Irish inflation has been generated domestically, and has not been imported from abroad via rising costs for imported goods. In the 12 months to January 2004 80 per cent of inflation originated in the non-traded sector of the economy.
• The main contributors to inflation in the five years to January 2004 were restaurants and pubs (accounting for 25 per cent of the total inflation), alcohol and tobacco (13 per cent of the total), housing, water and fuels (11 per cent of the total), recreation and culture (11 per cent of the total) and food and non-alcoholic beverages (10 per cent of the total) – see Appendix 3 for greater details.
• Figure 6 examines the contribution of certain items to the national rate of inflation and compares this with their weighting in the Consumer Price Index (CPI) basket. It is clear that goods such as beer and cigarettes are significant drivers of domestic inflation.
• Goods and services with the highest rates of inflation in the year to January 2004 were water supply and refuse services (25.4 per cent), postal services (13.5 per cent), hospital services (11.1 per cent), second level education (10.3 per cent) and outpatient services (7.2 per cent) – see Appendix 4.
• In the five years to January 2004, prices increases for goods and services provided directly by the State, such as health and education, have added 1.4 per cent onto the inflation rate over this period (approximately six per cent of the total).iv
• Over the same period, price increases for state regulated goods and services (such as electricity and telecoms) added a further two per cent to the inflation rate (or nine per cent of the total).
• In addition, government changes in excise duty and VAT added a further 4.5 per cent to the inflation rate over the period in question (or 20 per cent of the total).v
• In total, decisions by Government, its agencies and regulators added 7.9 per cent to the total inflation rate (with affected goods and services accounting for 44 per cent of national consumer price inflation compared with approximately 28 per cent of national expenditure).
3

Section 4 The Cost of Labour – Wage Growth and Levels Figure 7: Irish and EU15 Hourly Manufacturing Wage Figure 8: Nominal compensation per employee 2004 (€ per
Indices (1995 Q3 = 100) annum)
160%
140%
120%
100%
80%
45000 40000 35000 30000 25000 20000 15000 10000
5000 0
2003
2002
2001
2000
1999
1998
1997
1996
1995
lEU15 Ire and
P oland
Hungary
Italy
Germ
any
EU
15
Finland
UK
Ireland
France
US
Denm
ark Source: Eurostat AMECO Database Source: Eurostat AMECO Database
• As with Irish prices, Irish wages have been rising faster than in other EU countries for a number of years. There is no conclusive evidence, however, regarding the direction of causality between prices and wages.
• Irish hourly wages in manufacturing rose by around 20 per cent more than average EU15 wages between March 1995 and September 2003 (Figure 7).
• In the period 1998-2003, nominal compensation per employee (before tax) in Ireland grew by 37.1 per cent – faster than in any other eurozone country. This compared with growth in nominal compensation per employee of just 8.7 per cent in Germany. Other eurozone countries that have recorded fast growth in nominal wages include Greece (37 per cent), Portugal (27.1 per cent) and the Netherlands (25.1 per cent).
• In real terms (after inflation), Irish wages increased by 12.1 per cent between 1998 and 2003. This compares with real wage growth over the same period of four per cent in the eurozone and 5.5 per cent in the EU15.
• Central and eastern European countries recorded the highest real wage growth between 1998 and 2003: 27 per cent growth was recorded in Estonia, 19.2 per cent in Hungary, 15.2 per cent in Slovakia and 25 per cent in Poland. This suggests that wage levels in central and eastern European countries are catching up on Ireland and other EU15 countries, although wages in these countries are growing from a much lower base.
• By 2004, gross annual average compensation in Ireland (before tax) was estimated at €38,140 (Figure 8). This was higher than that of the EU15 average (€34,630), the UK (€35,750) and compares with just €10,920 in Hungary and €8,340 in Poland. On the other hand, it was lower than Denmark (€41,400), the USA (€40,470) and France (€40,370).
• The impact of high wage levels in Ireland on business costs has been offset somewhat by the relatively low level of employers’ social security contributions. OECD figures indicate employers’ social security contributions (as a percentage of GDP) are the 2nd lowest in Europe.vi
4
Section 4 (cont’d) The Cost of Labour – Unit Labour Costs
it ts f t t i
40
60
80
( )
t t tput ( )
i (
it t f t i t(
0
i
Electri
tM i
ts
O t
tic
i
t
tals
t
Figure 9: Un Labour Cos or To al Manufac ur ng 19952003 (1995=100)
100
120
140
160
1995
1996
1997
1998
1999
2000
2001
2002
2003
Earnings Per Hour 1995=100
Unit labour cos s weigh ed by ou 1995=100
Unit wage labour we ghted by employment 1995=100)
Figure 10: Un Labour Cos s By Manu ac ur ng Sec or, 2003 1995=100)
100
200
C hem
cals
F ood
Paper cal
N on-M eallic
nerals
W ood
Produc
hr M anu
R ubber and
Plas
Othr
Mach
nery
T exiles
Basic M e
Leather
TransporEquipm
ent
Least labour intensive Most labour intensive
Source: Central Statistics Office / Forfás Calculations Source: Central Statistics Office
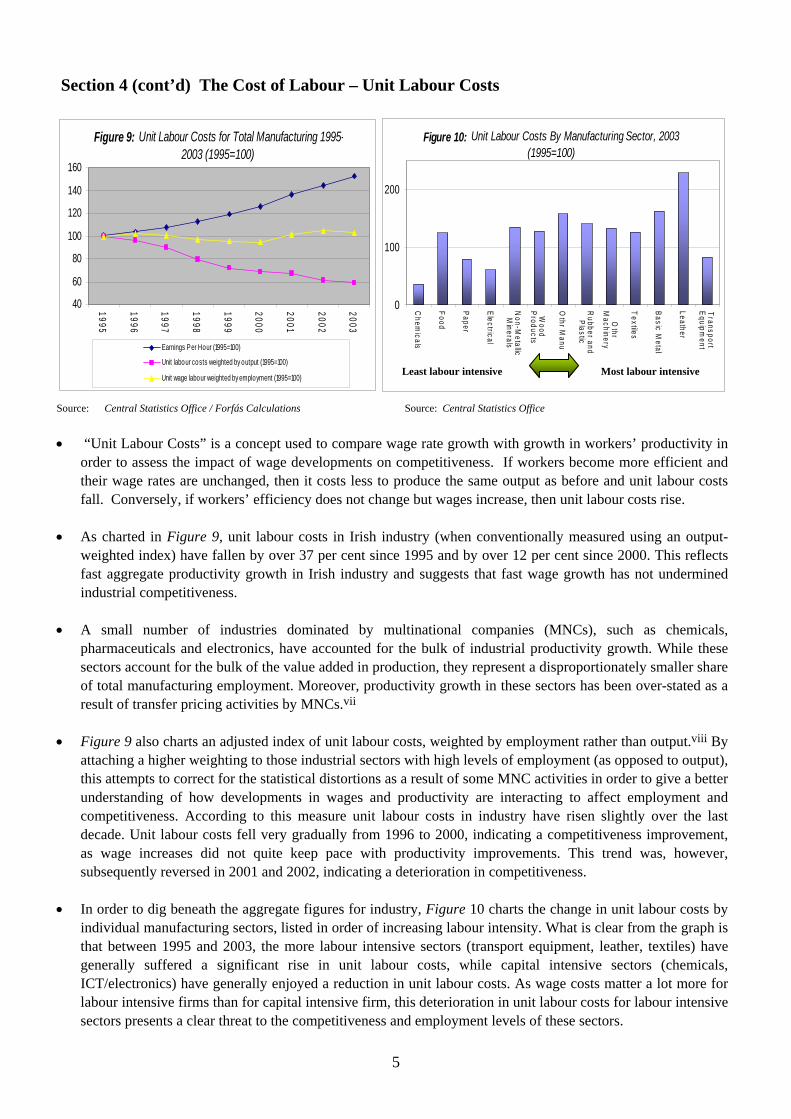
• “Unit Labour Costs” is a concept used to compare wage rate growth with growth in workers’ productivity in order to assess the impact of wage developments on competitiveness. If workers become more efficient and their wage rates are unchanged, then it costs less to produce the same output as before and unit labour costs fall. Conversely, if workers’ efficiency does not change but wages increase, then unit labour costs rise.
• As charted in Figure 9, unit labour costs in Irish industry (when conventionally measured using an output-weighted index) have fallen by over 37 per cent since 1995 and by over 12 per cent since 2000. This reflects fast aggregate productivity growth in Irish industry and suggests that fast wage growth has not undermined industrial competitiveness.
• A small number of industries dominated by multinational companies (MNCs), such as chemicals, pharmaceuticals and electronics, have accounted for the bulk of industrial productivity growth. While these sectors account for the bulk of the value added in production, they represent a disproportionately smaller share of total manufacturing employment. Moreover, productivity growth in these sectors has been over-stated as a result of transfer pricing activities by MNCs.vii
• Figure 9 also charts an adjusted index of unit labour costs, weighted by employment rather than output.viii By attaching a higher weighting to those industrial sectors with high levels of employment (as opposed to output), this attempts to correct for the statistical distortions as a result of some MNC activities in order to give a better understanding of how developments in wages and productivity are interacting to affect employment and competitiveness. According to this measure unit labour costs in industry have risen slightly over the last decade. Unit labour costs fell very gradually from 1996 to 2000, indicating a competitiveness improvement, as wage increases did not quite keep pace with productivity improvements. This trend was, however, subsequently reversed in 2001 and 2002, indicating a deterioration in competitiveness.
• In order to dig beneath the aggregate figures for industry, Figure 10 charts the change in unit labour costs by individual manufacturing sectors, listed in order of increasing labour intensity. What is clear from the graph is that between 1995 and 2003, the more labour intensive sectors (transport equipment, leather, textiles) have generally suffered a significant rise in unit labour costs, while capital intensive sectors (chemicals, ICT/electronics) have generally enjoyed a reduction in unit labour costs. As wage costs matter a lot more for labour intensive firms than for capital intensive firm, this deterioration in unit labour costs for labour intensive sectors presents a clear threat to the competitiveness and employment levels of these sectors.
5
Section 4 (cont’d) The Cost of Labour – The Impact of Exchange Rates
Figure 11: Production-Weighted ULC By Region Figure 12: Employment-Weighted ULC By Region (1998 = 100) (1998 = 100)
120
110
100
90
80
70
60
110
105
100
95
90
85 1998 1999 2000 2001 2002 2003 1998 1999 2000 2001 2002
UK I ( I) UKUSA Eurozone NTW CP USA Eurozone
Source: Eurostat / Forfás derived Source: Eurostat / Forfás derived
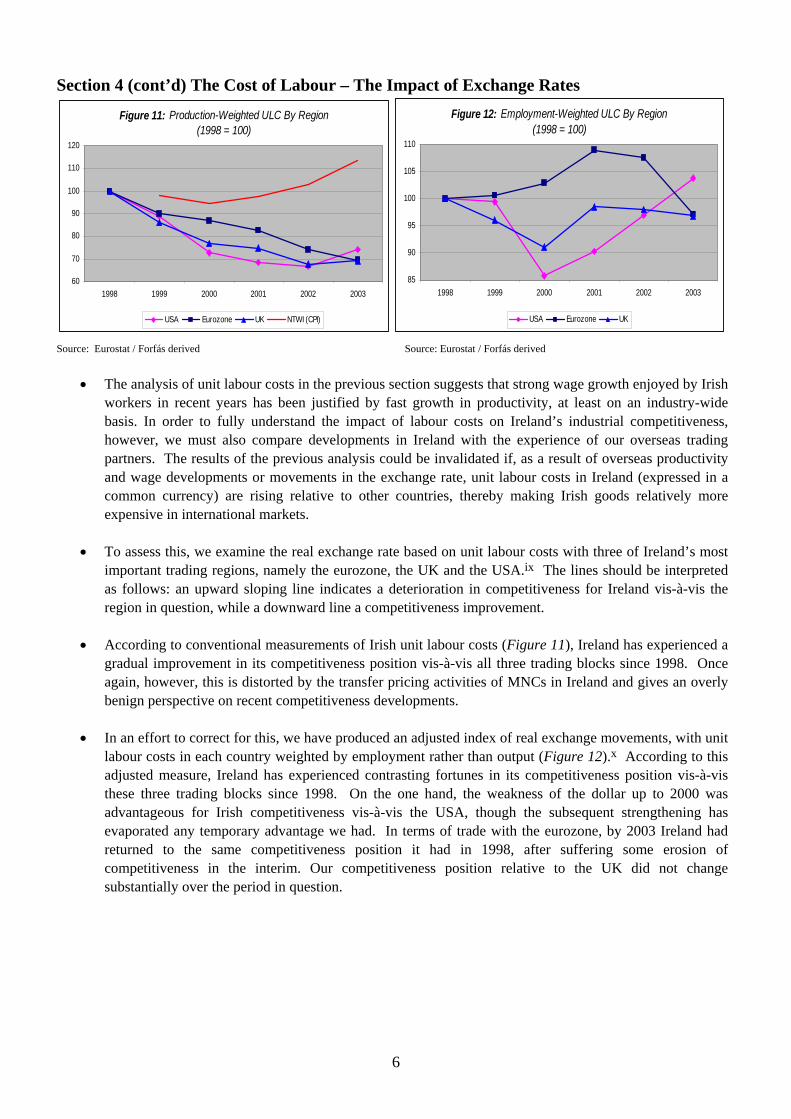
• The analysis of unit labour costs in the previous section suggests that strong wage growth enjoyed by Irish workers in recent years has been justified by fast growth in productivity, at least on an industry-wide basis. In order to fully understand the impact of labour costs on Ireland’s industrial competitiveness, however, we must also compare developments in Ireland with the experience of our overseas trading partners. The results of the previous analysis could be invalidated if, as a result of overseas productivity and wage developments or movements in the exchange rate, unit labour costs in Ireland (expressed in a common currency) are rising relative to other countries, thereby making Irish goods relatively more expensive in international markets.
• To assess this, we examine the real exchange rate based on unit labour costs with three of Ireland’s most important trading regions, namely the eurozone, the UK and the USA.ix The lines should be interpreted as follows: an upward sloping line indicates a deterioration in competitiveness for Ireland vis-à-vis the region in question, while a downward line a competitiveness improvement.
• According to conventional measurements of Irish unit labour costs (Figure 11), Ireland has experienced a gradual improvement in its competitiveness position vis-à-vis all three trading blocks since 1998. Once again, however, this is distorted by the transfer pricing activities of MNCs in Ireland and gives an overly benign perspective on recent competitiveness developments.
• In an effort to correct for this, we have produced an adjusted index of real exchange movements, with unit labour costs in each country weighted by employment rather than output (Figure 12).x According to this adjusted measure, Ireland has experienced contrasting fortunes in its competitiveness position vis-à-vis these three trading blocks since 1998. On the one hand, the weakness of the dollar up to 2000 was advantageous for Irish competitiveness vis-à-vis the USA, though the subsequent strengthening has evaporated any temporary advantage we had. In terms of trade with the eurozone, by 2003 Ireland had returned to the same competitiveness position it had in 1998, after suffering some erosion of competitiveness in the interim. Our competitiveness position relative to the UK did not change substantially over the period in question.
6
2003
Section 5 Office Rents
530 520 510 500 490 480 470 460 450
Figure 13: Office rents, Dublin 2/4, 2000-2003 (per square metre)
t t l t( t )
0 UK
I Swi
land
Italy
Spain
US
lands
Fi
Figure 14: Office ren s, ota occupation cos s Q2 2004 € per sq me re per annum
200 400 600 800
1000 1200 1400 1600 1800
France
reland
tzer
Korea
Poland
Nether
Denm
ark
nland
G erm
any
Hungary
Singapore
New
Zealand
Q 3 2003
Q 2 2003
Q 1 2003
Q 4 2002
Q 3 2002
Q 2 2002
Q 1 2002
Q 4 2001
Q 3 2001
Q 2 2001
Q 1 2001
Q 4 2000
Q 3 2000
Q 2 2000
Q 1 2000
Source: Hamilton Osborne King Source: CB Richard Ellis
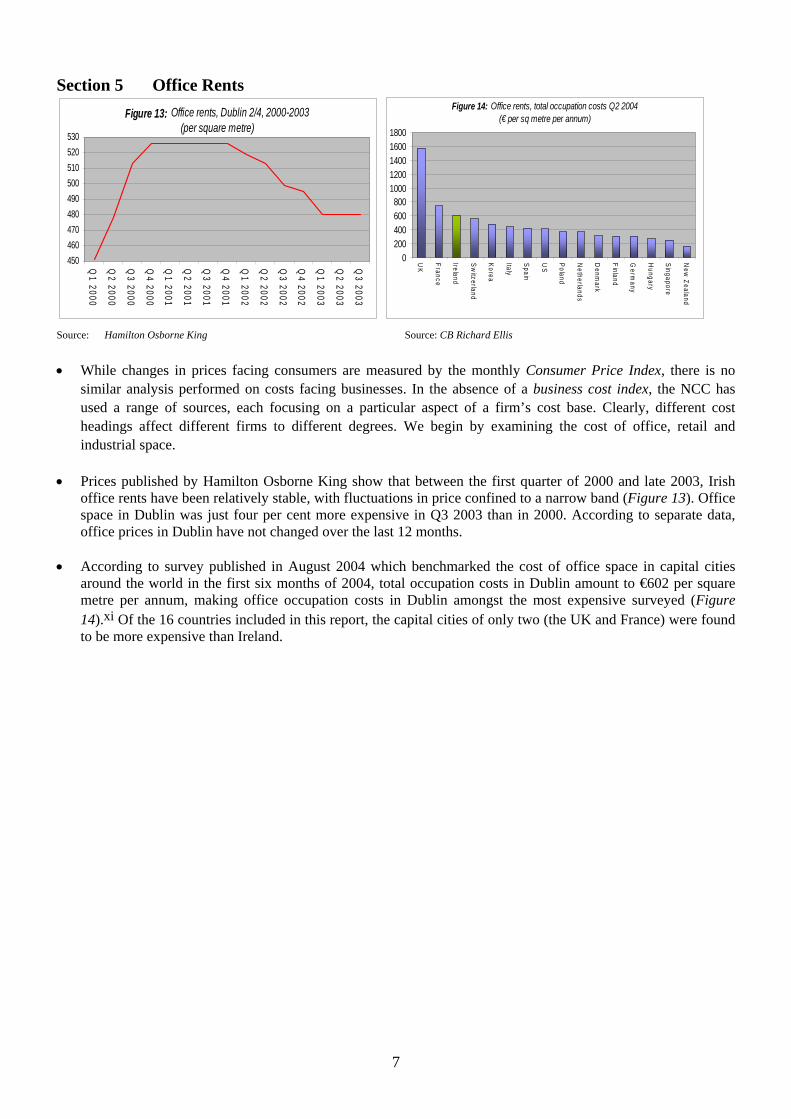
• While changes in prices facing consumers are measured by the monthly Consumer Price Index, there is no similar analysis performed on costs facing businesses. In the absence of a business cost index, the NCC has used a range of sources, each focusing on a particular aspect of a firm’s cost base. Clearly, different cost headings affect different firms to different degrees. We begin by examining the cost of office, retail and industrial space.
• Prices published by Hamilton Osborne King show that between the first quarter of 2000 and late 2003, Irish office rents have been relatively stable, with fluctuations in price confined to a narrow band (Figure 13). Office space in Dublin was just four per cent more expensive in Q3 2003 than in 2000. According to separate data, office prices in Dublin have not changed over the last 12 months.
• According to survey published in August 2004 which benchmarked the cost of office space in capital cities around the world in the first six months of 2004, total occupation costs in Dublin amount to €602 per square metre per annum, making office occupation costs in Dublin amongst the most expensive surveyed (Figure 14).xi Of the 16 countries included in this report, the capital cities of only two (the UK and France) were found to be more expensive than Ireland.
7
Section 5 (cont’d) Other Rents Figure 15: Retail rents, Grafton Street, Dublin 2000-2003 Figure 16: Light industrial property rents, 2000-2003
(per square metre) (per square metre)
7000 6000 5000 4000 3000 2000 1000
0
125
120
115
110
105 Q3 2003
Q2 2003
Q1 2003
Q4 2002
Q3 2002
Q2 2002
Q1 2002
Q4 2001
Q3 2001
Q2 2001
Q1 2001
Q4 2000
Q3 2000
Q2 2000
Q1 2000
Q 4 2003
Q 3 2003
Q 2 2003
Q 1 2003
Q 4 2002
Q 3 2002
Q 2 2002
Q 1 2002
Q 4 2001
Q 3 2001
Q 2 2001
Q 1 2001
Q 4 2000
Q 3 2000
Q 2 2000
Q 1 2000
Source: Hamilton Osborne King Source: Hamilton Osborne King
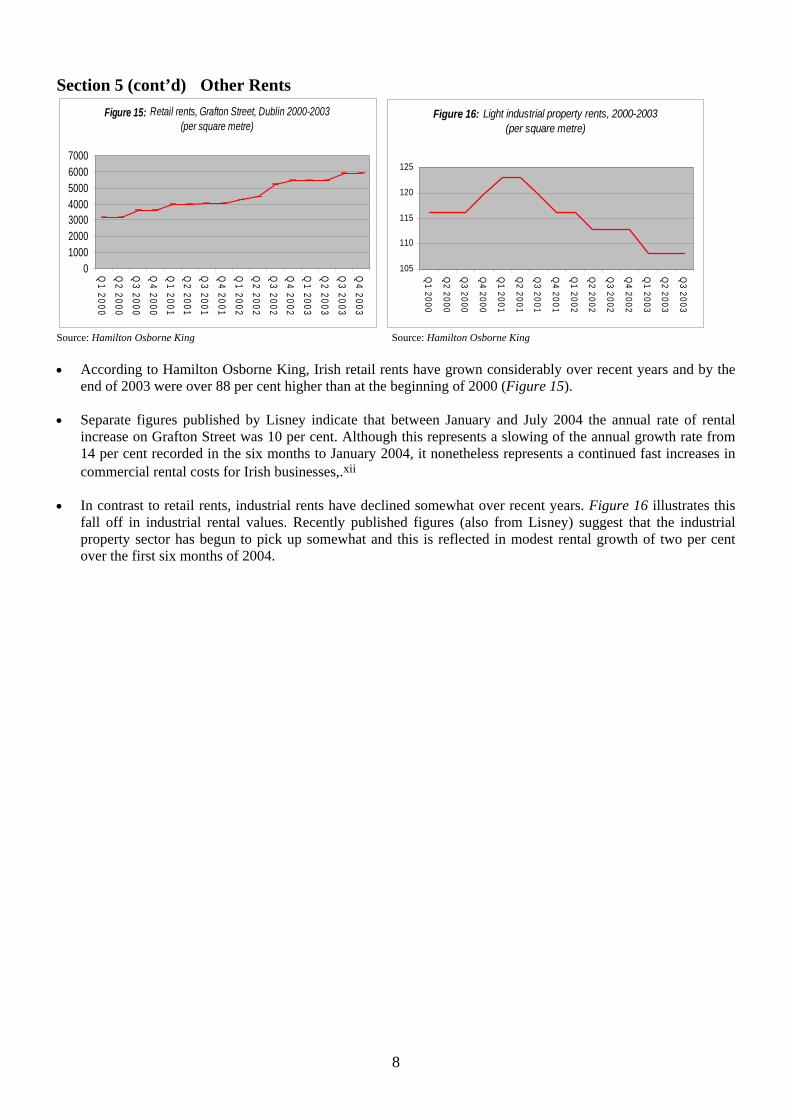
• According to Hamilton Osborne King, Irish retail rents have grown considerably over recent years and by the end of 2003 were over 88 per cent higher than at the beginning of 2000 (Figure 15).
• Separate figures published by Lisney indicate that between January and July 2004 the annual rate of rental increase on Grafton Street was 10 per cent. Although this represents a slowing of the annual growth rate from 14 per cent recorded in the six months to January 2004, it nonetheless represents a continued fast increases in commercial rental costs for Irish businesses,.xii
• In contrast to retail rents, industrial rents have declined somewhat over recent years. Figure 16 illustrates this fall off in industrial rental values. Recently published figures (also from Lisney) suggest that the industrial property sector has begun to pick up somewhat and this is reflected in modest rental growth of two per cent over the first six months of 2004.
8
Section 6 Energy Costs – Electricity I t t it
( it tion of 10 l )
5
5.5
6
6.5
7
7.5
8
Jul
Jul
Jul
Jul
Fi I ial trici if it i i t
)
ly
I F i
in
land
UK
Figure 17: ndus rial elec ric y prices 2000-2004 € per 100 kWh for consumer w h annual consump
GWh, exc uding taxes & VAT
-00
Jan-01
-01
Jan-02
-02
Jan-03
-03
Jan-04
gure 18: ndustr elec ty pr ces Jan 2004 (€ per 100 kWh or consumer w h annual consumpt on of 10 GWh, wth axes &
VAT
0.0 2.0 4.0 6.0 8.0
10.0 12.0
Ita reland
Germ
any
Hungary
nland
France
Spa
P o
Source: Eurostat Source: Eurostat
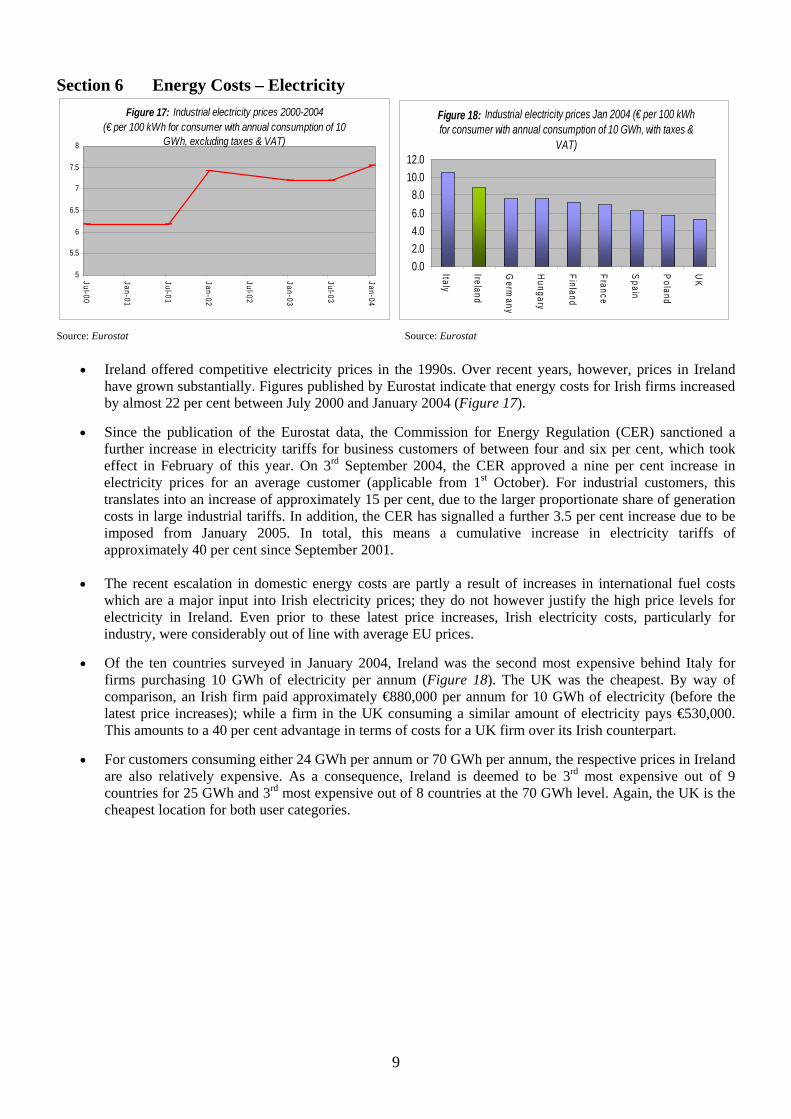
• Ireland offered competitive electricity prices in the 1990s. Over recent years, however, prices in Ireland have grown substantially. Figures published by Eurostat indicate that energy costs for Irish firms increased by almost 22 per cent between July 2000 and January 2004 (Figure 17).
• Since the publication of the Eurostat data, the Commission for Energy Regulation (CER) sanctioned a further increase in electricity tariffs for business customers of between four and six per cent, which took effect in February of this year. On 3rd September 2004, the CER approved a nine per cent increase in electricity prices for an average customer (applicable from 1st October). For industrial customers, this translates into an increase of approximately 15 per cent, due to the larger proportionate share of generation costs in large industrial tariffs. In addition, the CER has signalled a further 3.5 per cent increase due to be imposed from January 2005. In total, this means a cumulative increase in electricity tariffs of approximately 40 per cent since September 2001.
• The recent escalation in domestic energy costs are partly a result of increases in international fuel costs which are a major input into Irish electricity prices; they do not however justify the high price levels for electricity in Ireland. Even prior to these latest price increases, Irish electricity costs, particularly for industry, were considerably out of line with average EU prices.
• Of the ten countries surveyed in January 2004, Ireland was the second most expensive behind Italy for firms purchasing 10 GWh of electricity per annum (Figure 18). The UK was the cheapest. By way of comparison, an Irish firm paid approximately €880,000 per annum for 10 GWh of electricity (before the latest price increases); while a firm in the UK consuming a similar amount of electricity pays €530,000. This amounts to a 40 per cent advantage in terms of costs for a UK firm over its Irish counterpart.
• For customers consuming either 24 GWh per annum or 70 GWh per annum, the respective prices in Ireland are also relatively expensive. As a consequence, Ireland is deemed to be 3rd most expensive out of 9 countries for 25 GWh and 3rd most expensive out of 8 countries at the 70 GWh level. Again, the UK is the cheapest location for both user categories.
9
Section 6 (cont’d) Energy Costs – Gas I trial i ( ) (f t
usi l t )
Ju l
Ju l
Ju l
Ju l
Ju l
Industrial i fith t
VAT)
F i Ita ly l
UK
Po l
Figure 19: ndus gas pr ces 1998-2003 1998 =100 or cus omers ng 4186 GJ and 41860 GJ per annum, exc uding axes & VAT
80.00
100.00
120.00
140.00
160.00
180.00
200.00
J a n-99
-9 9
J a n-00
-0 0
J a n-01
-0 1
J a n-02
-0 2
J a n-03
-0 3
4186 GJ 200 days 41860 GJ 200 days
Figure 20: gas Pr ces Jan 2004 (€ per GJ or a consumer using 4186 GJ per annum, w axes and
0.0
2.0
4.0
6.0
8.0
10.0
12.0
D enm
ark
nland
Ge rm
a n y
F rance
Ire a nd
H unga ry
a nd
Spain
Source: Eurostat Source: Eurostat
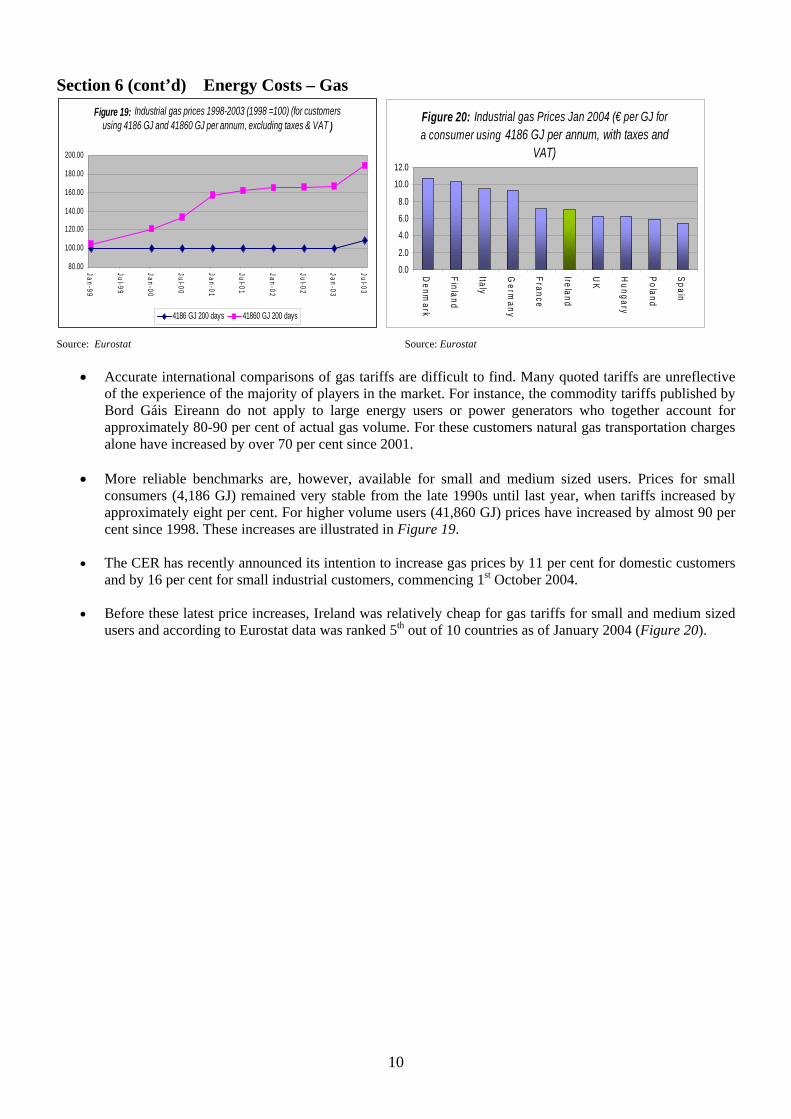
• Accurate international comparisons of gas tariffs are difficult to find. Many quoted tariffs are unreflective of the experience of the majority of players in the market. For instance, the commodity tariffs published by Bord Gáis Eireann do not apply to large energy users or power generators who together account for approximately 80-90 per cent of actual gas volume. For these customers natural gas transportation charges alone have increased by over 70 per cent since 2001.
• More reliable benchmarks are, however, available for small and medium sized users. Prices for small consumers (4,186 GJ) remained very stable from the late 1990s until last year, when tariffs increased by approximately eight per cent. For higher volume users (41,860 GJ) prices have increased by almost 90 per cent since 1998. These increases are illustrated in Figure 19.
• The CER has recently announced its intention to increase gas prices by 11 per cent for domestic customers and by 16 per cent for small industrial customers, commencing 1st October 2004.
• Before these latest price increases, Ireland was relatively cheap for gas tariffs for small and medium sized users and according to Eurostat data was ranked 5th out of 10 countries as of January 2004 (Figure 20).
10
Section 7 Telecommunications – National and International Calls : ti i t t
( ( )
0
500
1000
1500
2000
2500
Pol
UK
US
Italy
I
tlands
F i
itland
it ti / int t ( ) (
0 Pol
UK
l
ly
US
in
l
I
t
Swi
l
Figure 21 OECD Na onal bus ness baske cos of calls May 2004) US$ PPP
H ungary
and
New
Z ealand
F rance
G erm
any
Spain
reland
N eher
nland
Sw zer
Korea
D enm ark
Figure 22: OECD Compos e na onal ernational business baskeMay 2004 US$ PPP)
500
1000
1500
2000
2500
3000
Hungary
and
New
Zeaand
Korea
Ita France
Spa
Germ
any
Finand
reland
Ne
herlands
tzerand
Denm
ark
Source: Teligen Source: Teligen
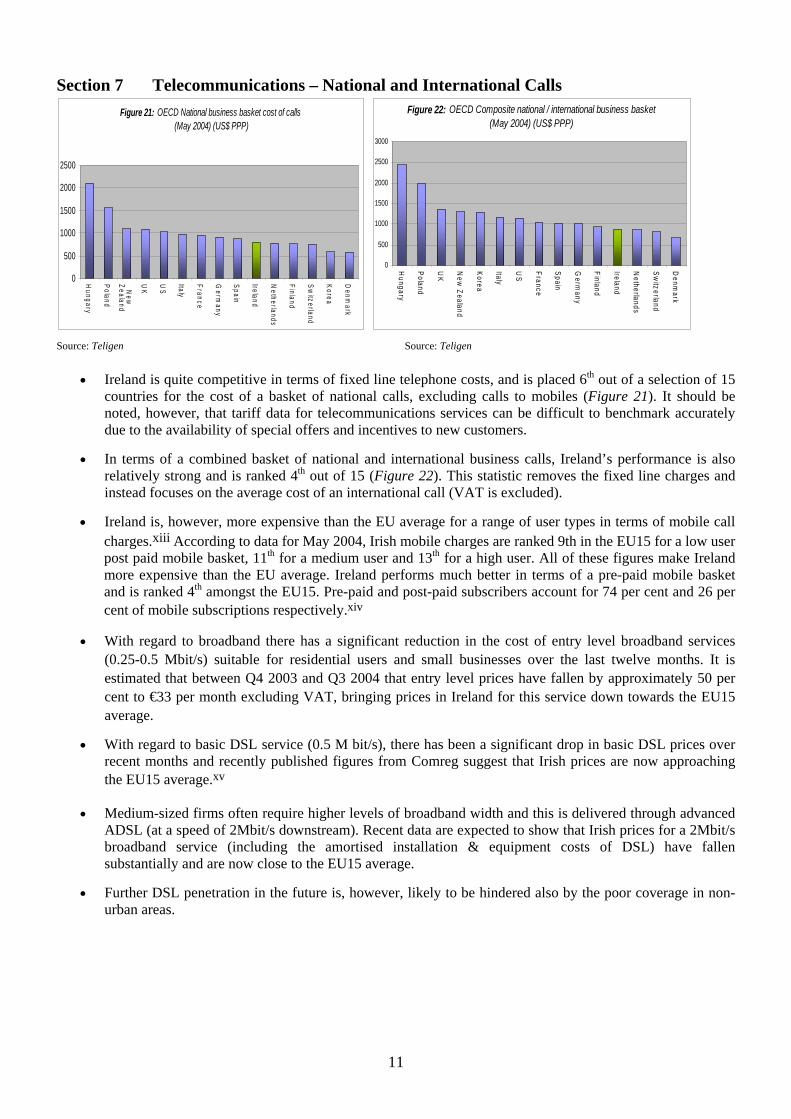
• Ireland is quite competitive in terms of fixed line telephone costs, and is placed 6th out of a selection of 15 countries for the cost of a basket of national calls, excluding calls to mobiles (Figure 21). It should be noted, however, that tariff data for telecommunications services can be difficult to benchmark accurately due to the availability of special offers and incentives to new customers.
• In terms of a combined basket of national and international business calls, Ireland’s performance is also relatively strong and is ranked 4th out of 15 (Figure 22). This statistic removes the fixed line charges and instead focuses on the average cost of an international call (VAT is excluded).
• Ireland is, however, more expensive than the EU average for a range of user types in terms of mobile call charges.xiii According to data for May 2004, Irish mobile charges are ranked 9th in the EU15 for a low user post paid mobile basket, 11th for a medium user and 13th for a high user. All of these figures make Ireland more expensive than the EU average. Ireland performs much better in terms of a pre-paid mobile basket and is ranked 4th amongst the EU15. Pre-paid and post-paid subscribers account for 74 per cent and 26 per cent of mobile subscriptions respectively.xiv
• With regard to broadband there has a significant reduction in the cost of entry level broadband services (0.25-0.5 Mbit/s) suitable for residential users and small businesses over the last twelve months. It is estimated that between Q4 2003 and Q3 2004 that entry level prices have fallen by approximately 50 per cent to €33 per month excluding VAT, bringing prices in Ireland for this service down towards the EU15 average.
• With regard to basic DSL service (0.5 M bit/s), there has been a significant drop in basic DSL prices over recent months and recently published figures from Comreg suggest that Irish prices are now approaching the EU15 average.xv
• Medium-sized firms often require higher levels of broadband width and this is delivered through advanced ADSL (at a speed of 2Mbit/s downstream). Recent data are expected to show that Irish prices for a 2Mbit/s broadband service (including the amortised installation & equipment costs of DSL) have fallen substantially and are now close to the EU15 average.
• Further DSL penetration in the future is, however, likely to be hindered also by the poor coverage in non-urban areas.
11
Section 8 Insurance Costs Figure 23: Non-life insurance premiums 1998-2003
2500
2000
1500
1000
500
0 1998 1999 2000 2001
Source: Swiss Re, sigma
I land UK US EUGermany re
(US$ per annum)
2002 2003
: lif i ita ( l )
0
20
40
60
80
I UK
Sw
itl
therlands
EU ly
US
S i
F i
Figure 24 Non- e insurance prem ums per cap annua % change1998-2003
100
120
140
reland
H ungary
z e ran d
S pain
N e Ne w
Z ealand
Ko re a
Ita ngapore
Fran c e
D enm a rk
nland
G e rm
any
Source: Swiss Re, sigma
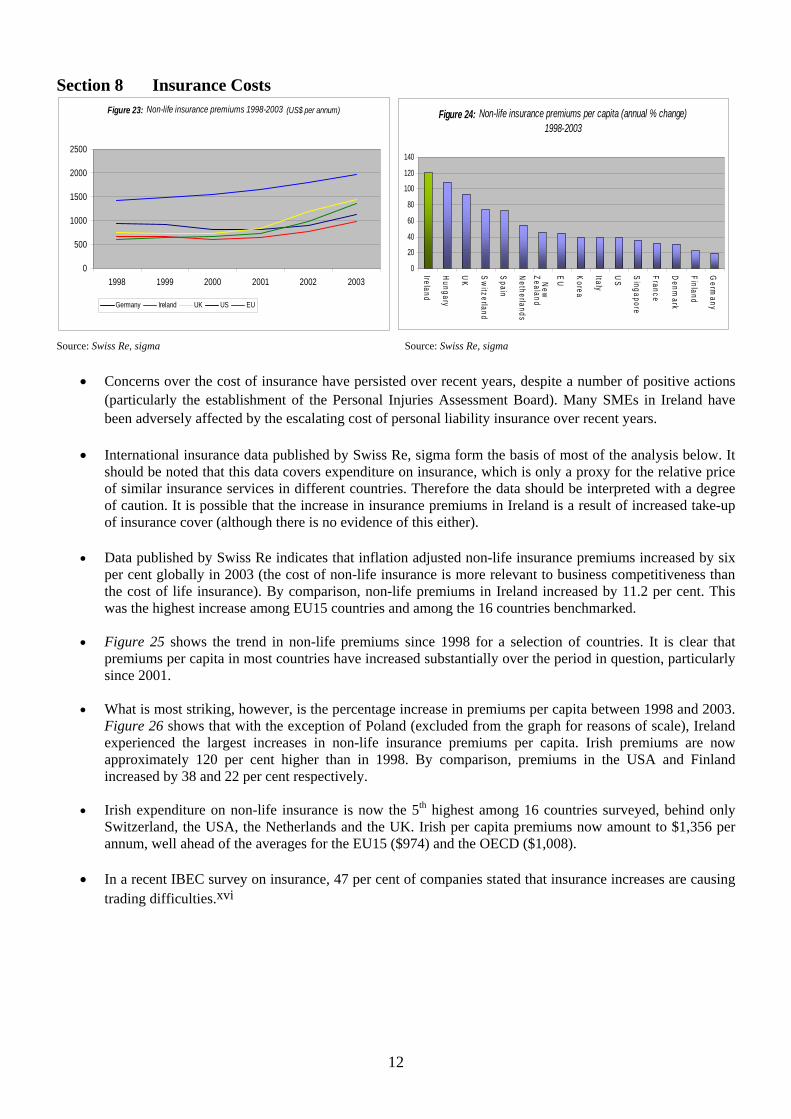
• Concerns over the cost of insurance have persisted over recent years, despite a number of positive actions (particularly the establishment of the Personal Injuries Assessment Board). Many SMEs in Ireland have been adversely affected by the escalating cost of personal liability insurance over recent years.
• International insurance data published by Swiss Re, sigma form the basis of most of the analysis below. It should be noted that this data covers expenditure on insurance, which is only a proxy for the relative price of similar insurance services in different countries. Therefore the data should be interpreted with a degree of caution. It is possible that the increase in insurance premiums in Ireland is a result of increased take-up of insurance cover (although there is no evidence of this either).
• Data published by Swiss Re indicates that inflation adjusted non-life insurance premiums increased by six per cent globally in 2003 (the cost of non-life insurance is more relevant to business competitiveness than the cost of life insurance). By comparison, non-life premiums in Ireland increased by 11.2 per cent. This was the highest increase among EU15 countries and among the 16 countries benchmarked.
• Figure 25 shows the trend in non-life premiums since 1998 for a selection of countries. It is clear that premiums per capita in most countries have increased substantially over the period in question, particularly since 2001.
• What is most striking, however, is the percentage increase in premiums per capita between 1998 and 2003. Figure 26 shows that with the exception of Poland (excluded from the graph for reasons of scale), Ireland experienced the largest increases in non-life insurance premiums per capita. Irish premiums are now approximately 120 per cent higher than in 1998. By comparison, premiums in the USA and Finland increased by 38 and 22 per cent respectively.
• Irish expenditure on non-life insurance is now the 5th highest among 16 countries surveyed, behind only Switzerland, the USA, the Netherlands and the UK. Irish per capita premiums now amount to $1,356 per annum, well ahead of the averages for the EU15 ($974) and the OECD ($1,008).
• In a recent IBEC survey on insurance, 47 per cent of companies stated that insurance increases are causing trading difficulties.xvi
12
Section 9 Local Charges (Waste and Environmental Costs)
Figure 25: Local Authority Charges Waste Charges Per Tonne 2000-2004
fill ts i l i t /t
0 20 40 60 80
100 120 140 160
therl
I Ita ly
F i UK
in
land
Figure 26: Land- cos nc ud ng ax 1999 (€ onne)
N e a nds
D e nm ark
relan d
Fra n c e
nlan d
Sp a
G e rm
any
P o
300 250 200 150 100
50 0 2 004
2 003
2 002
2 001
2 000
il li il i ity il Gal y y il
Cork County Counc Dub n City CouncLimer ck C Counc w a Cit Counc
Source: IBEC Source: Eunomia Economic Research & Consulting
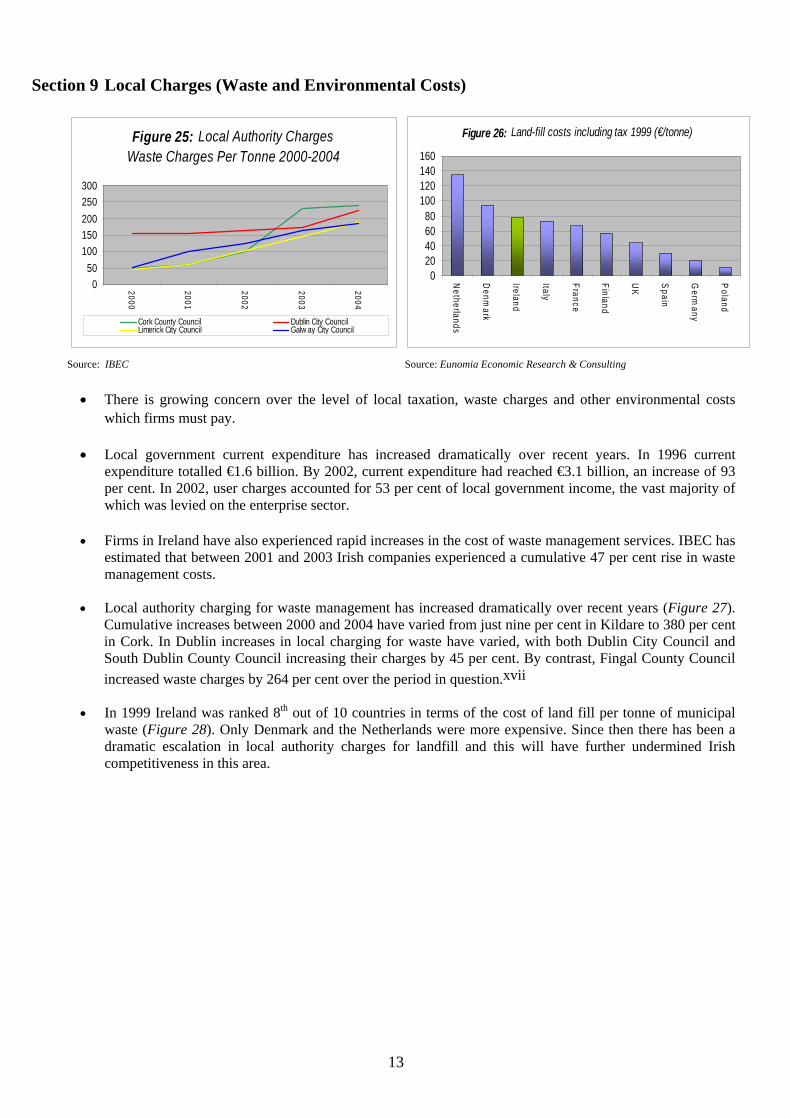
• There is growing concern over the level of local taxation, waste charges and other environmental costs which firms must pay.
• Local government current expenditure has increased dramatically over recent years. In 1996 current expenditure totalled €1.6 billion. By 2002, current expenditure had reached €3.1 billion, an increase of 93 per cent. In 2002, user charges accounted for 53 per cent of local government income, the vast majority of which was levied on the enterprise sector.
• Firms in Ireland have also experienced rapid increases in the cost of waste management services. IBEC has estimated that between 2001 and 2003 Irish companies experienced a cumulative 47 per cent rise in waste management costs.
• Local authority charging for waste management has increased dramatically over recent years (Figure 27). Cumulative increases between 2000 and 2004 have varied from just nine per cent in Kildare to 380 per cent in Cork. In Dublin increases in local charging for waste have varied, with both Dublin City Council and South Dublin County Council increasing their charges by 45 per cent. By contrast, Fingal County Council increased waste charges by 264 per cent over the period in question.xvii
• In 1999 Ireland was ranked 8th out of 10 countries in terms of the cost of land fill per tonne of municipal waste (Figure 28). Only Denmark and the Netherlands were more expensive. Since then there has been a dramatic escalation in local authority charges for landfill and this will have further undermined Irish competitiveness in this area.
13

Section 9 (cont’d) Local Charges (Other)
Figure 27: Water charges (€ per 1000 gallons) Figure 28: Local authority rates 75
70
10
8 65
6 60
554 50
2 45
400 2000 2001 2002 2003 2004 2000 2001 2002 2003 2004
R a t
e of
v al
u a tio
n m
u lt
iplie
r
i il Li i t il Fi i i it il t il i t li it il
Cork Cty Counc mer ck Ci y Counc ngal Co. Co. Dun Laogha re/Rathdow n Co. Co. Limer ck C y Counc Cork Ci y CouncDun Laogha re/Ra hdow n Co. Co. Dub n C y Counc
Source: IBEC Source: IBEC
• There has also been a dramatic increase in local authority charges for water and rates since 2000.
• While local authority charges have increased across the board, there has been significant disparity in the increases amongst the various local authorities. For example, while water charges did not increase between 2000 and 2004 in Cavan, over the same period, Longford County Council and Cork City Council increased their charges by 247 per cent and 230 per cent respectively (Figure 29).
• According to IBEC calculations rates have increased on average by over 30 per cent since 2000 (Figure 30).
• Only commercial enterprises, which consist of less than 10 per cent of premises, are charged rates while exemptions exist for state occupied properties, agricultural lands and households.
14
Cost of Capital
Figure 29: Average interst rate spread 1997-2003 Figure 30: Interest Rate Spread 2003
7
6
5
4
3
2
1
0
8.00 7.00 6.00 5.00 4.00 3.00 2.00 1.00 0.00 S
p ain
H u ngar y
F inland
US
Sw
itz e rla n d
Fr a n c e
Ne w
Z e aland
Ge r m a n y
1997 1998 1999 2000 2001 2002 2003
I USreland
Source: IMD World Competitiveness Yearbook Source: IMD World Competitiveness Yearbook
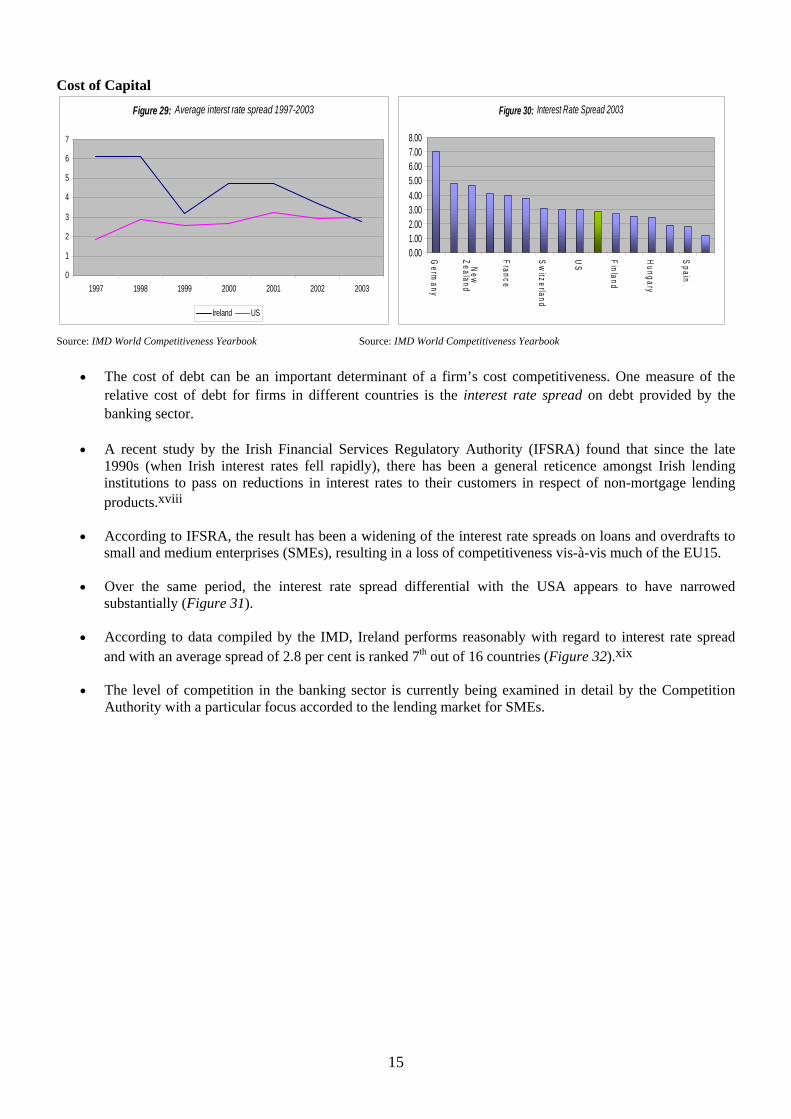
• The cost of debt can be an important determinant of a firm’s cost competitiveness. One measure of the relative cost of debt for firms in different countries is the interest rate spread on debt provided by the banking sector.
• A recent study by the Irish Financial Services Regulatory Authority (IFSRA) found that since the late 1990s (when Irish interest rates fell rapidly), there has been a general reticence amongst Irish lending institutions to pass on reductions in interest rates to their customers in respect of non-mortgage lending products.xviii
• According to IFSRA, the result has been a widening of the interest rate spreads on loans and overdrafts to small and medium enterprises (SMEs), resulting in a loss of competitiveness vis-à-vis much of the EU15.
• Over the same period, the interest rate spread differential with the USA appears to have narrowed substantially (Figure 31).
• According to data compiled by the IMD, Ireland performs reasonably with regard to interest rate spread and with an average spread of 2.8 per cent is ranked 7th out of 16 countries (Figure 32).xix
• The level of competition in the banking sector is currently being examined in detail by the Competition Authority with a particular focus accorded to the lending market for SMEs.
15
Appendices Appendix 1
Consumer Prices in Ireland, Eurozone Perspective (1= Most Expensive in Eurozone)
2 2 2 2 5
1 2 2 4 5 4 4 5 5 6 7 7 7 8 8 8 6 6
-Mil 1 1 1 1 1 -Oil 5 5 6 -Frui 1 1 1 3 3
2 2 2 5 6 l li 1 1 1 2 4
-Al i 2 2 2 2 2 1 1 1 1 1
12 11 11 11 12 1 1 1 4 5
l ing 1 1 2 3 5 -El i 8 8 8 7 6
4 4 4 3 6 5 5 6 7 6 2 2 2 2 2 6 6 9 6 6 2 2 2 4 6 5 5 5 8 8 2 2 1 2 2 3 3 7 7 8
2003(e) 2002 2001 2000 1999 All-items Food and non-alcoholic beverages -Food -Bread and Cereals -Meat-Fish 11 12
k, Cheese and Eggs s and Fats 11 11 ts Vegetables, Potatoes
-Other Food -Non A coho c Beverages Off Licence Alcohol and tobacco
cohol c Beverages -TobaccoClothing and footwear Gross rents fuel and power -Renta s for hous
ectric ty, Gas and Other Fuels Furnishings, equipment and maintenance Health Transport Communications Recreation and culture Education Restaurants and Pubs Miscellaneous goods and services
Source: Eurostat (PricewaterhouseCoopers Derived / 2003 is PricewaterhouseCoopers Estimate)
Index of Price of Consumer Goods / Services, Eurozone, 2003 (IRL= 100)
PT ES B F LU D 62 69 79 83 83 85 75 75 89 96 95 85 99 74 77 90 99 98 86
l li44 38 49 59 45 53 87
38 38 48 69 42 50 68
29 54 62 76 90 81 93
ls 88 91 89 73 94 96 97 68 74 86 95 88 83 76 80 83 76 95
75 87 79 83 92 92 91 85 69 48 84 87 61 69 78 71 81 79 73 68 84
GR IT AT NL FI All Private Household Consumption 67 84 81 85 101 Food and non-alcoholic beverages 76 89 88 87 Food 76 91 89 87 100 Non-a coho c beverages 79 80 56 72 71 77 73 73 79 84 95 Off Licence Alcohol and Tobacco 47 53 51 50 -Alcoholic beverages 55 56 37 50 50 49 49 50 56 45 105 -Tobacco 43 55 54 56 Clothing and footwear 102 142 140 128 135 139 115 151 131 132 133 Gross rents, fuel and power 51 66 73 84 -Rentals for housing 20 50 53 53 57 68 75 93 76 78 95 -Electricity, gas and other fue 109 72 140 106 105 100 113 112
Furnishings, equipment, maintenance 82 101 92 90 102 95 105 Health 57 100 103 98 114 108 Transport 65 93 82 93 105 Communications 111 98 96 114 98 107 111 92 101 Recreation and culture 82 97 88 91 116 Education 46 103 86 82 116 107 158 Restaurants and Pubs 69 79 76 71 102 Miscellaneous goods and services 73 104 93 93 78 92 94 115
Source: PricewaterhouseCoopers Estimate
i
Appendix 2
Relative Cost of a Food Shopping List in Ireland, March 2004 (1 = most expensive in eurozone)
Milk, pasteurised whole milk (1lt) Butter, table quality (500g) Eggs, large, grade A Bread, whole wheat sliced toast (1kg) Rice, long grain type sugar, granulated white (1kg) Cornflakes, plain (375 gr) Instant coffee (125 gr) Tea in bags (25) Coca cola (1lt) Mineral water, non-sparkling (1 lt) corn oil, for frying (1 lt) Potatoes (1kg) Onions (1 kg) Tomatoes (1kg) Lettuce ( 1 kg) Oranges (1 kg) Apples (1 kg) Bananas (1 kg) Tin of peas (250 g) Tin of peaches, in halves (510 gr) Beef, for roast beef (1kg) Lamb chops (1 kg) Ham, sliced cooked for sandwiches (1kg) Bacon strips (1kg) Fish, fresh salmon or sole fillet (1kg) Potato chips, natural flavour (150 gr) Fine table salt (500 gr) Black pepper whole or ground (50 gr) Biscuits, butter biscuits (200 gr) Ketchup (340 gr) Baby food, meat and vegetables (130 gr) Instant soup, box of 4 individual (75 gr) Total Food Retail
Low - Priced Stores
3 11 10 11 5 5
12 2
12 2 1 3 1 2 2 1 1 1 7 9 1 9 1 2 3 8 1 1 9 1 8 2 2 1
Mid -Priced Stores
5 12 7
10 7 6
11 3
12 6 2 6 1 2 3 1 1 1
10 7 3 8 2 4 4 9 1 1 2 1
10 4 2 4
High -Priced Stores
7 12 4
10 10 11 7 8
12 10 2 5 4 2 3 1 1 6
10 5 7
10 5 4 6
12 1 1 5 2 2 6 2 8
Source: Mercer Human Resources Consulting
Relative Cost of a Non-food Shopping List in Ireland, March 2004 (1 = most expensive in eurozone)
Laundry detergent normal (5kg) Dishwashing machine detergent (1kg) Furniture polish (330 gr) Light bulbs (2 bulbs, 60 watt) Two batteries, AA size Tampon (box of 40/ regular) Toilet tissue (2 rolls) Soap, 1 bath size (150 gr) Shower gel (250 ml) Hair shampoo 2 in 1 (200 ml) Disposable diapers (box of 52) Toothpaste, with fluoride (120 gr) Deodorant, roll on (50 ml) Razor blades (5 blades) Total Non-Food Consumables Total Food and Non-Food Consumables
Low - Priced Stores
5 7
10 2 1 3 1 2 2 1 4 1
11 3 3 1
Mid -Priced Stores
9 10 11 3 2 4 1 2 1 1 6 1
12 1 4 4
High -Priced Stores
11 8
12 2 3 9 1 3 1 1 8 1
12 2 8 8
Source: Mercer Human Resources Consulting
ii
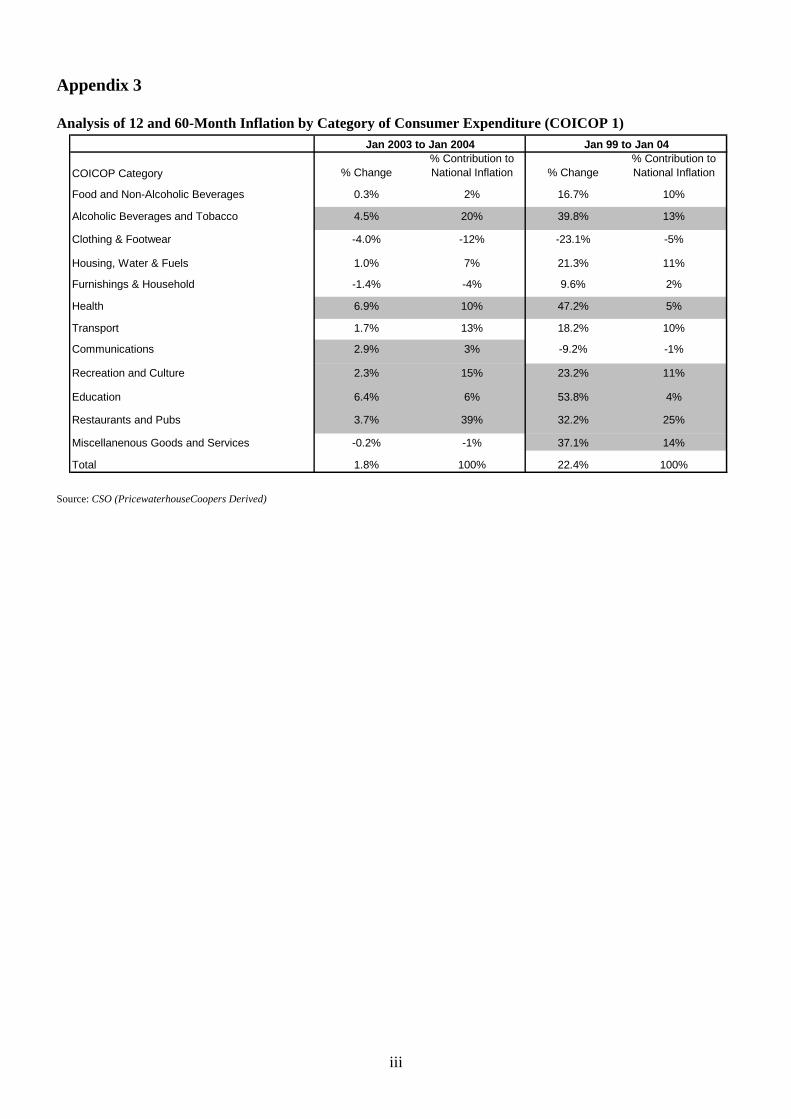
Appendix 3
Analysis of 12 and 60-Month Inflation by Category of Consumer Expenditure (COICOP 1) Jan 2003 to Jan 2004 Jan 99 to Jan 04
% Contribution to % Contribution to COICOP Category % Change National Inflation % Change National Inflation
Food and Non-Alcoholic Beverages 0.3% 2% 16.7% 10%
Alcoholic Beverages and Tobacco 4.5% 20% 39.8% 13%
Clothing & Footwear -4.0% -12% -23.1% -5%
Housing, Water & Fuels 1.0% 7% 21.3% 11%
Furnishings & Household -1.4% -4% 9.6% 2%
Health 6.9% 10% 47.2% 5%
Transport 1.7% 13% 18.2%
-9.2%
10%
-1% Communications 2.9% 3%
Recreation and Culture 2.3% 15% 23.2% 11%
Education 6.4% 6% 53.8% 4%
Restaurants and Pubs 3.7% 39% 32.2% 25%
Miscellanenous Goods and Services -0.2% -1% 37.1% 14%
Total 1.8% 100% 22.4% 100%
Source: CSO (PricewaterhouseCoopers Derived)
iii
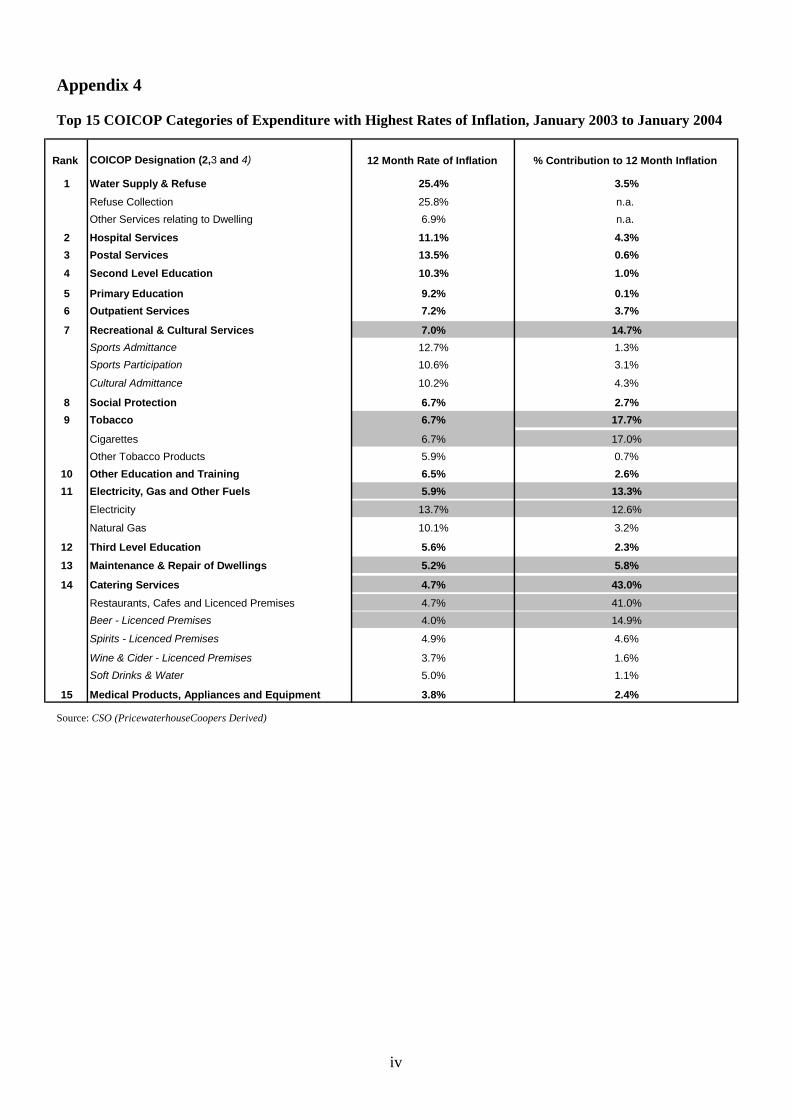
Appendix 4
Top 15 COICOP Categories of Expenditure with Highest Rates of Inflation, January 2003 to January 2004
Rank COICOP Designation (2,3 and 4) 12 Month Rate of Inflation % Contribution to 12 Month Inflation
1 Water Supply & Refuse Refuse Collection
25.4% 25.8%
3.5% n.a.
Other Services relating to Dwelling 6.9% n.a.
2 3
Hospital Services Postal Services
11.1% 13.5%
4.3% 0.6%
4 Second Level Education 10.3% 1.0%
5 6
Primary Education Outpatient Services
9.2% 7.2%
0.1% 3.7%
7 Recreational & Cultural Services 7.0% 14.7% Sports Admittance Sports Participation
Cultural Admittance
12.7% 10.6%
10.2%
1.3% 3.1%
4.3%
8 Social Protection 6.7% 2.7% 9 Tobacco 6.7% 17.7%
Cigarettes 6.7% 17.0% Other Tobacco Products 5.9% 0.7%
10 Other Education and Training 6.5% 2.6% 11 Electricity, Gas and Other Fuels 5.9% 13.3%
Electricity 13.7% 12.6%
Natural Gas 10.1% 3.2%
12 Third Level Education 5.6% 2.3% 13 Maintenance & Repair of Dwellings 5.2% 5.8%
14 Catering Services 4.7% 43.0% Restaurants, Cafes and Licenced Premises 4.7% 41.0% Beer - Licenced Premises 4.0% 14.9%
Spirits - Licenced Premises
Wine & Cider - Licenced Premises
4.9%
3.7%
4.6%
1.6% Soft Drinks & Water 5.0% 1.1%
15 Medical Products, Appliances and Equipment 3.8% 2.4%
Source: CSO (PricewaterhouseCoopers Derived)
iv
End Notes
i This data is derived from Eurostat Purchasing Power Parity (PPP) data. PPPs reflect the fact that national output expressed in a common unit of currency does not provide an adequate reflection of the relative welfare of residents of different countries, i.e. exchange rates do not capture in full the size of the basket of goods/ services that may be acquired in return for a given unit of a common currency. In other words, differentials in the cost of goods and services between countries are not fully reflected in exchanges rates. Eurostat/ PPP-derived comparative price data are representative of consumption in the country in which prices are measured, i.e. the selection of products/ services reflects national preferences, as does the weighting of the different categories of consumer expenditure.
ii Trade Weighted Competitiveness Indices measure how changes in the value of the national currency and changes in the prices of imports and exports combine to improve or worsen the competitiveness of exports and imports. An increase in the index signifies an erosion of trade competitiveness. TWCIs are essentially measures of change in nominal and real exchange rates. These changes are examined through changes in exchange rates, and changes in domestic prices and costs relative to those in our trading partners. The weighting system, on which an exchange rate index is based, is a double weighting scheme that seeks to assign an export weight to the currency of each trading partner according to that trading partner’s share of both its own market and the markets of all other trading partners.
iii “Assessing Ireland’s Price and Wage Competitiveness”, P.R. Lane, Trinity College Dublin and CEPR, July 2004
iv PricewaterhouseCoopers derived, based on CSO Consumer Price Index data
v These calculations are based on the Constant Tax Price Index (CTPI) published by the CSO in the “Consumer Price Index Detailed Sub-indices” release. The Constant Tax Price Index is designed to exclude from the CPI the effect of changes in the level of indirect taxes since the base reference period. It does this by replacing the values of indirect taxation in the current prices with the values of indirect taxation in the corresponding base period prices. It is important to note that the CTPI thus excludes not only the impact due to changes in the taxation regime (e.g. new tax rates or excise duties) but also the impact of the ad valorem effect on tax receipts of changes in the pre-tax level of prices of goods and services. The CTPI can be used readily in conjunction with the CPI to measure the contribution of changes in indirect taxes since the base period to the overall price change.
vi OECD, Revenue Statistics, 1965-2002
vii Transfer pricing is used by affiliated companies to take advantage of differing tax rates in different countries. On transfers between the affiliates, a high price is charged to the affiliate in the high tax state so that it will have a small profit; and a low price is charged to the affiliate in the low tax state so that it will have a large profit. The result for the worldwide operation is a net tax saving.
viii Weighting unit labour costs by employment rather than output better assesses developments in employment intensive sectors (in Ireland’s case, the indigenous sector) as well as the risks to employment posed by international economic events than the standard output-based measure. The IMF (IMF Working Paper, ‘How Competitive Is Irish Manufacturing?’ by Valarie Cerra and Jarkko Soikkeli) have conducted experimental analysis using this model. The figures used in this statement are based on work by Forfás in conjunction with the ERSI.
ix This is calculated by comparing the relative change in ULCs based on production weights for Ireland vis-à-vis three of our most important trading areas, namely the Eurozone, UK and USA. Figures are adjusted for movements in nominal exchange rates.
x Calculated as above, though based on mid-period employment weights. Employment weighted ULCs were not available for other countries, so an adjustment procedure based on a mock economy was employed to ensure comparability with the Irish figures. Given this, the relative position of the Eurozone, UK and USA lines of the graph are of most relevance, not their absolute position.
xi CB Richard Ellis, Global Market Rents August 2004
xii Lisney Property Rentals Indices, July 2004
xiii Commission for Communications Regulation, Irish Communications Market, Quarterly Key Data, September 2004
v

xiv Commission for Communications Regulation, Irish Communications Market, Quarterly Key Data, September 2004
xv Commission for Communications Regulation, Irish Communications Market, Quarterly Key Data, September 2004xvi IBEC, National Survey of Business Costs, November 2003
xvii IBEC, Local Authority Charges 2000-2004
xviii Irish Financial Services Regulatory Authority, Interest Rate Pass Through – A Study of the Extent and Speed of InterestRate Pass-Through on a Basket of Retail Banking Products, July 2004.
xix Sourced from national financial data, this indicator measures the difference between the average lending rate and the average deposit rate available in an economy.
vi