Embed Size (px)
Citation preview

Office Administration Program Review
2017
Program Review 2017 [Top] Page | 1
Modesto Junior College Office Administration Program Review June 2017 Contents Executive Summary ................................................................................................................................................................................................. 2
Program Overview ................................................................................................................................................................................................... 3
Program Overview ............................................................................................................................................................................................. 3
Response and follow-up to previous program reviews ..................................................................................................................... 3
The Mission of Modesto Junior College ................................................................................................................................................... 4
Student Achievement and Completion .......................................................................................................................................................... 5
College Goal for Student Achievement .................................................................................................................................................... 5
Success ................................................................................................................................................................................................................... 5
Conferred Award Trends ................................................................................................................................................................................. 9
Student Learning Outcomes ............................................................................................................................................................................ 12
Student Learning and Outcomes Assessment .................................................................................................................................... 12
Curriculum and Course Offerings Analysis ................................................................................................................................................ 21
Curriculum Analysis ........................................................................................................................................................................................ 21
Course Time, Location and Modality Analysis .................................................................................................................................... 22
Program Analysis .................................................................................................................................................................................................. 24
Program Personnel ......................................................................................................................................................................................... 24
Faculty Assignments ...................................................................................................................................................................................... 24
Departmental Productivity Measurements .......................................................................................................................................... 26
Long Term Planning and Resource Needs ................................................................................................................................................. 28
Long Term Planning ....................................................................................................................................................................................... 28
Resource Request and Action Plan .......................................................................................................................................................... 29
Evaluation of Previous Resource Allocations....................................................................................................................................... 29
Career Technical Education Questions ........................................................................................................................................................ 30
How many students did you serve in the last two academic years? ......................................................................................... 30
What kinds of students are you serving? .............................................................................................................................................. 30
What percentage of your students are persisting? Consider within the program and within the college. ............. 30
Are students getting and keeping jobs? ............................................................................................................................................... 30
What percentage of students are attaining a living wage?........................................................................................................... 30

Program Review 2017 [Top] Page | 2
Executive Summary
Provide an executive summary of the findings of this program review. Your audience will be your Division Program
Review Group, the MJC Program Review Workgroup, and the various councils of MJC.
The Office Administration program continuously evaluates and monitors our program and offerings to be
sure that students are gaining up-to-date employable skills. We updated our programs and courses in fall
2016 as part of the normal curriculum review cycle. We deactivated two outdated courses and created
two new courses that were found to be missing in our program, Introduction to Outlook and
Intermediate Spreadsheets, through Nancy Backlund’s sabbatical project in spring 2016.
We are careful to fulfill all reporting and administrative tasks that the college requires of our program.
This includes a four-semester evaluation plan for CLOs, the CTE annual plan and final plan, CTE quarterly
reports, annual advisory committee meetings and minutes, CTE funding proposals, and Program Review.
We meet with and advise students on a regular basis so that students can successfully complete our
program. We also follow-up with our majors to show that we are interested and willing to help them
complete their chosen degrees and/or certificates.
Kevin Alavezos serves as the Co-Chair of Accreditation Standard IV, and participates in the Educational
Master Plan Workgroup, the Academic Senate, the Resources Allocation Committee, the Accreditation
Council, the Brandman University Business Advisory Committee, and various hiring committees within our
division and other college areas.
Nancy Backlund participates in the Technology Committee, the College Council, the Division Council, the
Turlock High School Advisory Committee, the Brandman University Business Advisory Committee and
various hiring committees within our division and other college areas. She also coordinates the Business
Advisory Committee meetings and is a member of the International Association of Administrative
Professionals (IAAP) and the California Business Educators Association (CBEA). She currently is the
statewide Membership Chairperson for CBEA.
Kevin and Nancy attended Achieving the Dream Conferences, the IEPI Data Unlocked workshop and
Turlock School District Industry Connection Breakfast. Nancy attended the 2016 CBEA Annual Conference
and the CTE Mother Lode Regional Consortium Meeting.
The availability of CTE data in this Program Review allowed us to compare our program to other colleges
and regions. The data revealed that we are one of the top three programs in terms of students served.
The Office Administration program faculty will continue to analyze data to make informed decisions
regarding student completion, success, and employment.

Program Review 2017 [Top] Page | 3
Program Overview
Instructions
Supplemental information, links to previous reviews, and dashboards can be accessed from the review, please
ensure your pop-up blocker is turned off, or use Ctrl-Click to bypass it.
Please review each question below, following the prompts and links given in the help text. Additional help, and a
list of frequently asked questions is available on the Program Review Instructions page.
Program Overview
Please list program awards that are under this department according to the college catalog. Next to each program
award listed;
• Please denote if it should be included here, or should be listed elsewhere.
• Answer yes or no, if the program has external regulations
• Additional lines, if needed, may be added by typing the tab key while in the last cell
• Any additional notes can be added in the box below the table
[addl help]
Program Awards Include in Review (yes/no) External Regulations (yes/no)
A.S. Degree: Clerical Yes No
A.S. Degree: Office Administration Yes No
Certificate of Achievement: Clerical Yes No
Certificate of Achievement: Office
Administration
Yes No
Certificate of Achievement: Office
Computer Applications
Yes No
Certificate of Achievement: Office
Support
Yes No
Certificate of Achievement: Records
Management/Data Entry Specialist
Yes No
Response and follow-up to previous program reviews
On the Curricunet website, please locate your department and the previous program review. After reviewing,
please complete the following questions;
Briefly describe the activities and accomplishments of the department since the last program review.
Several of our students are now employed within the offices of MJC. We are able to place both student
assistants and graduates in a variety of offices on campus. We receive many positive compliments for the
students and employees that have gone through our program. In addition, several MJC employees take
our courses to update their skills and/or finish their degrees.
In fall 2016 all Office Administration curriculum was updated and approved by the MJC Curriculum
Committee. Two new courses were developed—OFADM 260, Intermediate Spreadsheet Software and
OFADM 316, Introduction to Microsoft Outlook.
In partnership with the business department, we submitted a Strong Workforce proposal and were
funded approximately $177,000. The results from this proposal will be documented in future program
reviews.
We are currently fully staffed in the Office Administration Center (OAC). This is a great opportunity for
our students to receive immediate guidance with their coursework and also a great opportunity for our
Program Review 2017 [Top] Page | 4
program to initiate a marketing campaign that highlights student successes within our program and
educates the community about our course/program offerings.
Funding was secured to purchase a learning and testing software from Certiport. This provides MJC
students the opportunity to earn industry-recognized certification, as a Microsoft Office Specialist (MOS),
in the Microsoft Office Suite: Word, Excel, Access, PowerPoint. These certifications align with the Business
Information Worker Pathway of the Doing What Matters program and guarantee proficiencies as
students enter the workforce.
The Mission of Modesto Junior College
MJC is committed to transforming lives through programs and services informed by the latest scholarship of
teaching and learning. We provide a dynamic, innovative, undergraduate educational environment for the ever-
changing populations and workforce needs of our regional community. We facilitate lifelong learning through the
development of intellect, creativity, character, and abilities that shape students into thoughtful, culturally aware,
engaged citizens.
Provide a brief overview of the program and how it contributes to accomplishing the Mission of Modesto Junior
College. (Overview Suggestions: How consistent is the program with the institutional mission, vision, core values
and/or goals? How are aspects of the institutional mission addressed within the program? Is the program critical
to the pursuit of the institutional mission?)
The Office Administration (OA) program at Modesto Junior College provides students an opportunity to
gain appropriate skills for entry-level office positions, retraining, upgrading software skills, and degree
completion. In addition, we provide technology skills to the general MJC student population to support
their success in other MJC courses and career choices. Although we are a CTE program that does not
transfer to a four-year institution, we currently offer seven transfer level courses
The OA program supports the mission of Modesto Junior College by providing dynamic and innovative
curriculum to all MJC students. Our ever-changing curriculum supports workforce needs and facilitates
lifelong learning.

Program Review 2017 [Top] Page | 5
Student Achievement and Completion
College Goal for Student Achievement
Increase Scorecard Completion Rate for Degree and Transfer
The College has a primary aspirational goal of increasing the Completion rate from 43% to 53% on the CCCCO
Scorecard Completion Rate for Degree and Transfer [view] by 2022. The completion rates in the Scorecard
refers to the percentage of degree, certificate and/or transfer-seeking students tracked for six years who
completed a degree, certificate, or transfer-related outcomes (60 transfer units).
As you answer the questions below, please consider how your program is helping the college complete this
aspirational goal of increasing the MJC Degree, Certificate, and Transfer Completion rate by 10% on the CCCCO
Scorecard by 2022.
Success
The following questions refer to data from the Department Success Rates Dashboard. Use the filters to examine
both departmental and course level data. Charts will be included for the record by Research and Planning once the
review is submitted.
Locate your department success rates on the Success Rate Data Dashboard and consider your department
success rates trends over time, especially the last two years. Also, consider the data detailing the variance of
success rate of courses across sections. Are these rates what you expected? Are there any large gaps? Is there
anything surprising about the data? What do you see in the data?
Our face-to-face courses are very interactive, and require heavy student participation. Over the last two
years our face-to-face sections success rate range from 76%-79%. We feel this is an acceptable rate, but
will strive to improve these rates.
Over the last two years our online success rate is in line with the college as a whole—64%. We continue
to refine online curriculum with the intent of increasing success rates.
The data presented in the Course Success printout and the data on the Success Rate Data Dashboard do
not align. The overall numbers appear to be correct, but we are not able to drill down and isolate the
open-entry/open-exit sections. The majority of our sections, 63 percent are open-entry/open-exit
(OE/OE) and the majority of our students are enrolled in these courses. In prior semester, we have
analyzed the success/completion rates from prior semesters in our OE/OE sections and have determined
that approximately 98% of the students that have complete all the course requirements are successful.
Our OE/OE sections are hands-on, skills-based courses that require students to actively participate in the
course and demonstrate mastery of the concepts being taught. Due to the nature of these types of
courses, if they do not complete all the course materials, they will likely not pass the class—thus
contributing to our current success rate.
We have gone to great lengths to encourage, guide, and direct students through the OE/OE experience.
• An OAC Orientation is required prior to starting their course.
• A weekly guideline for course completion is filled in for each student when they start their
course.
• Weekly e-mail/text messages are sent to students not demonstrating progress.
• Supplemental small group instructional opportunities are available Monday – Friday of each
week.
• Immediate assistance is provided for students working on their coursework in Founders Hall
131.
• Exit surveys are given to each student at the completion of their course to solicit feedback on
improving our services.

Program Review 2017 [Top] Page | 6
We will continue to evaluate ourselves and look for opportunities to increase success rates in our OE/OE
course offerings.
What is your set goal for success? Do your department and individual course rates meet this goal?
Our aspirational goal is for 100 percent of our students to successfully complete our courses/program
requirements.
Our data indicates that we have not meet this goal. However, since 2012 our success rate has increased
10 percentage points. We will continue the quest for 100 percent success and completion.
If your rates for success are lower than your goals, what are your plans to improve them?
We have analyzed the success/completion rates in our program and have determined the open-
entry/open-exit (OE/OE) sections have a negative impact on our overall program success rate. We have
determined that approximately 98% of the students that complete all the course requirements are
successful. Our OE/OE sections are hands-on, skills-based courses that require students to actively
participate in the course and demonstrate mastery of the concepts being taught. Due to the nature of
these types of courses, if they do not complete all the course materials, they will likely not pass the class.
We have done a lot of interventions (see previous section) to promote success and will continue to look
for ways to better serve the students and increase success.
Additionally, we are now taking a proactive approach in identifying students pursuing an Office
Administration degree/certificate. Our plan is to initiate contact with each student and arrange multiple
advising opportunities to help guide them in their educational plans
Locate your department equity rates on the Success Rate Data Dashboard (by pressing on the equity tab).
Examine these rates, disaggregated by ethnicity and gender, over the last two years. If there are differences in
success across groups, how do you plan on addressing issues of student equity? In other words, how do you plan
on closing achievement gaps across student populations?
This data confirms the broad student population our program serves. Our two major ethnic groups are
White and Hispanic, which is consistent with the college as a whole.
Our gender and modality data are consistent with the college as a whole and do not appear to have any
major gaps.
If distance education is offered, consider any gaps between distance education and face-to-face courses. Do these
rates differ? If so, how do you plan on closing the achievement gaps between distance education and face-to-face
courses?
Face-to-face courses appear to have a much higher success rate than our Online or OE/OE sections.
As a department we have always collaborated to build our online offerings. Since the adoption of Canvas,
we have designed and built many of our online courses similarly and team-teach several online offerings.
We feel this provides students with a seamless transition from one course to the next and has led to
course design consistency within our department.

Program Review 2017 [Top] Page | 7

Program Review 2017 [Top] Page | 8

Program Review 2017 [Top] Page | 9
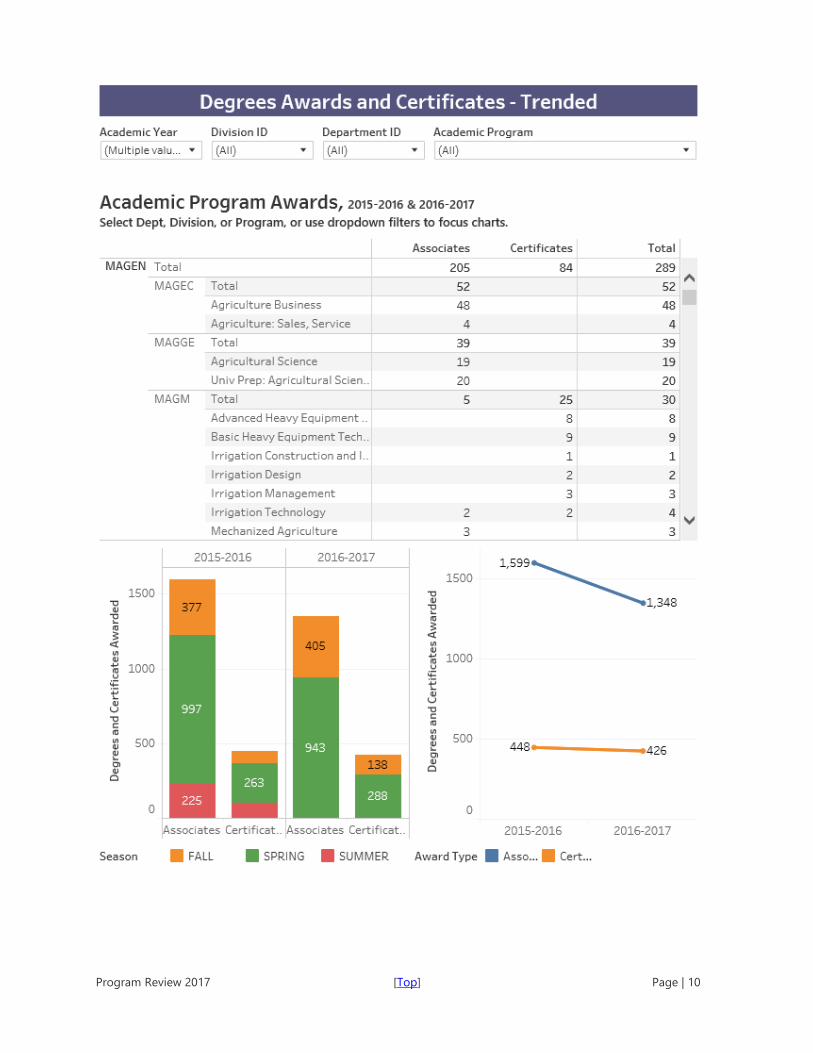
Conferred Award Trends
Review the Program Awards Dashboard, using the drop-down filters to focus the analysis on your department.
Starting with identifying the year, please supply degrees and certificates awarded. These charts will be attached by
Research and Planning before being posted publicly.
What is your set goal for degrees and certificates awarded? Do your rates meet this goal?
Our goal is to serve as many students as possible. Over the last five years, we have averaged 15
degree/certificate earners per year. Considering 75% of our student are part-time students, we feel this
annual number is reasonable; however, we will strive to increase the number of degree/certificate
earners.
If your rates for degrees and certificates awarded are lower than your goals, what are your plans to improve them?
Our plan to increase the number of degree/certificate earners is as follows. During our Office
Administration Center (OAC) Orientation sessions we are now asking students to complete a short
questionnaire that asks if they are pursuing an OA degree or certificate. We will use this information to
follow-up with each student that is seeking an OA degree/certificate and provide them with additional
one-on-one advising to help them achieve their educational goals. Additionally, in face-to-face and
online sections, we will solicit the same questionnaire and reach out to those students as well.
During our last curriculum review cycle (fall 2016) our department decided to keep both A.S. Degrees—
Office Administration and Clerical. After looking at this data, we are re-evaluating the A.S. in Clerical since
the number of completers in this path is low. Additional department discussion will occur and a final
decision will be made during our next curriculum review cycle.
Program Review 2017 [Top] Page | 10

Program Review 2017 [Top] Page | 11

Program Review 2017 [Top] Page | 12
Student Learning Outcomes
Instructions
This section of the Program Review measures student learning.
PLO / GELO / ILO Outcomes
To ease in analysis, trending charts have been created by Research and Planning on the Learning Outcomes
Dashboard website. Using these charts, you can identify your current success rates in student achievement
towards the outcomes. Considering your current outcome success rates, and previous semester, set a department
aspirational goal, and examine what your outcome success rates are currently. Later you will be asked to outline a
plan to achieve this threshold, but for now, simply supply the Goal % and Current % for each level.
Note: If the dashboards do not show your Learning Outcomes, please ensure that they have been mapped in
eLumen. Each course will need to be mapped to each applicable PLO, GELO, and ILO. The Outcome Assessment
Workgroup has created a web page detailing the work already done -> PLO, ILO, and GELO Assessment
grids. For additional assistance, review the Course Learning Outcome Assessment web pages, or contact Nita
Gopal at [email protected].
Student Learning and Outcomes Assessment
Please review your Learning Outcomes data located on the MJC Student Learning Outcomes
Assessment website and below, in regards to any applicable Program, Institutional, and General Education
Learning Outcomes.
For each ILO that your course learning outcomes inform, you will find your overall rate. On the MJC
Student Learning Outcomes Assessment website, you will also see that overall rate disaggregated across student
populations; you can use this information to understand how different student populations are learning in your
courses.
After you have examined your rates and disaggregated data, reflect on the data you encountered. Please address
the program outcomes (PLO), general education outcomes GELO (if any), and institutional outcomes (ILO) in your
analysis.
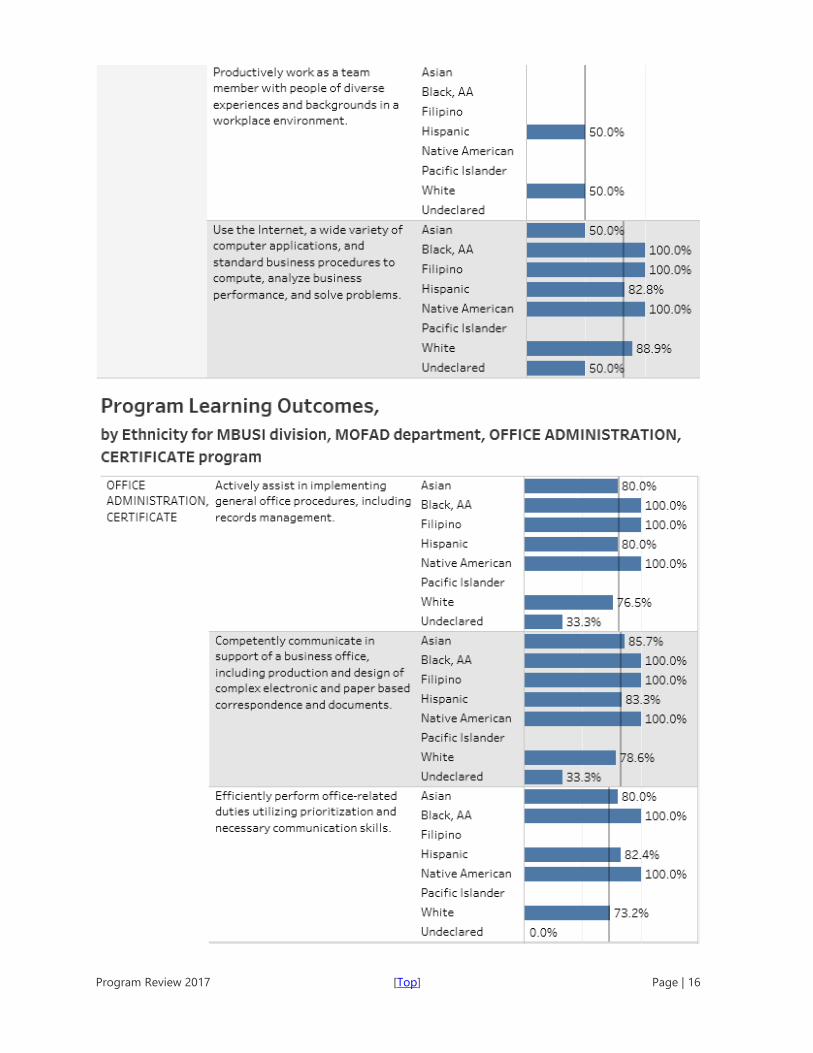
Program Learning Outcomes (PLO)
What is your set goal for PLO success? Do your overall rates meet this goal?
Our goal is for 75% of the students will perform at an acceptable level.
Yes, the overwhelming majority of our students achieve at or above our set goal. Those not performing at
or above our set goal were small student populations ranging from 2 to 6 students.
General Education Learning Outcomes (GELO)
If your program has General Education outcomes, what is your set goal for GELO success? Do your overall rates
meet this goal?
N/A
Institutional Learning Outcomes (ILO)
What is your set goal for ILO success? Do your overall rates meet this goal?
Our goal is for 75% of the students will perform at an acceptable level.
Yes, the overwhelming majority of our students achieve at or above our set goal. Those not performing at
or above our set goal were small student populations ranging from 2 to 6 students.

Program Review 2017 [Top] Page | 13
Continuous Quality Improvement
If your rates for success for any PLOs, GELOs, and ILOs are lower than your goals, what are your plans to improve
them?
We continually evaluation our program and make adjustments to improve success and completion rates.
To help evaluate the effectiveness of our ongoing adjustments to our program, a “master calendar” will
now be implemented to document all changes to our program in the semester they occurred so we can
evaluate the changes in the outcomes and link back to the reason that changes in patterns may have
occurred.
Equity and Success
Do your rates for your PLOs, GELOs, and ILOs vary across student populations? How you do you plan on
addressing issues of equity? In other words, how do you plan on closing the learning gaps across student
populations?
Yes, the overwhelming majority of our students achieve at or above our set goal. Those not performing at
or above our set goal were small student populations ranging from 2 to 6 students.

Program Review 2017 [Top] Page | 14

Program Review 2017 [Top] Page | 15
Program Review 2017 [Top] Page | 16

Program Review 2017 [Top] Page | 17

Program Review 2017 [Top] Page | 18

Program Review 2017 [Top] Page | 19

Program Review 2017 [Top] Page | 20

Program Review 2017 [Top] Page | 21
Curriculum and Course Offerings Analysis
Curriculum Analysis
Courses that have not been reviewed, or not scheduled to be reviewed, are listed on the Curriculum Committee
web pages. To aid in use, please view this filtered spreadsheet, using the drop down menus along the field
headings, to view just your department. On opening the spreadsheet, click the Enable Editing and Enable content
buttons that should appear across the top menu bar.
Considering those courses that have not been reviewed within the last five years, please address these below.
Provide your plans to bring courses into compliance with the 5-year cycle of review. If your department is
compliant, please state that.
The Office Administration courses are all in compliance. All courses were reviewed and updated in fall
2016 with effective dates of summer 2017.
Provide your plans to either inactivate or teach each course not taught in the last two years.
Two courses were inactivated effective summer 2017 due to degree and certificate revisions and industry
needs. Due to our program having only two full-time faculty, semesters are planned so that courses are
offered at least once per year. We do not have any courses that will need to be inactivated.
Does the College Catalog accurately display the descriptions and requirements of all the courses and educational
awards (degrees/certificates) overseen by this program? If not, please describe your plans to correct.
Yes, our programs are current within the catalog. We work closely with the curriculum specialist to correct
any inconsistencies or errors. We have also been diligent in making sure our course learning outcomes
are correct.
One certificate, Office Support, has been changed since its submission and approval in fall 2016 due to
state requirements on the unit level, and that change will go into effect summer 2018.
Are there plans for new courses or educational awards (degrees/certificates) in this program? If so, please describe
the new course(s) or award(s) you intend to create.
Due to the results shown in Nancy Backlund’s sabbatical, two new courses have been implemented,
Introduction to Outlook and Intermediate Spreadsheets. We have discussed the possibility of offering an
Adobe Acrobat course, but we are still investigating the issues with students having access to the
software.
Nancy Backlund is currently working with a few other community college professors in developing CI-D
course descriptors in the office area for common degree patterns or pathways. The team is looking at
ways to utilize office courses to fulfill the requirements of the Business Information Worker course
sequence and have students better prepared for the emerging needs of industry.
What needs or rationale support this action, and when do you expect to submit these items to the Curriculum
Committee?
In addition to many offices utilizing Adobe Acrobat to create web-related documents and forms, the
Adobe Acrobat course is currently part of the 30-unit state level office area course sequence that is being
vetted at the state level. Once the course sequence has been reviewed and approved at the state level, it
may be beneficial for our program to offer this course. The timeline for approval is at least a year away.

Program Review 2017 [Top] Page | 22
Course Time, Location and Modality Analysis
Please follow this link and review the Course Attributes in regards to when, where, and in which method the
courses in this program are taught. Use the filters to focus the report on your department. Then answer the
following questions.
Location/Times/Modality Trend Analysis:
Consider and analyze your location, time, and modality trends. Discuss any program plans that address more
efficient and beneficial location, modality and/or time of day trends.
After a review of our course offerings, we found that all but three courses are offered either online or as
open-entry/open-exit format. The three courses taught face-to-face are Telephone Techniques, Today’s
Office, and Skills for the Workplace. One additional course, Office Procedures and Technologies, has been
offered as a hybrid for the past four years.
Some of the online courses are also taught as open-entry/open-exit courses within the Office
Administration Center (OAC). The OAC is open 9 a.m. to 8 p.m. Monday through Thursday, 9 a.m. to 2
p.m. on Friday, and 9 a.m. to 1 p.m. on Saturday. Due to the amount of open hours, students should be
able to find blocks of time to complete those courses.
Online Office Administration Center On-campus
OFADM 256 (1 unit)* OFADM 201 (1 unit) OFADM 313 (3 units)
OFADM 259 (1 unit)* OFADM 202 (2 units) OFADM 314 (3 units) Hybrid
OFADM 261 (1 unit) OFADM 203 (3 units) OFADM 315 (2 units)
OFADM 262 (1 unit)* OFADM 260 (1 unit) OFADM 320 (1 unit)
OFADM 231 (3 units) OFADM 301 (1.5 units)
OFADM 232 (3 units) OFADM 302 (1.5 units)
OFADM 304 (3 units) OFADM 303 (.5 unit)
OFADM 305 (3 units) OFADM 306 (.5 unit)
OFADM 316 (1 unit) OFADM 307 (.5 unit)
OFADM 330 (3 units) OFADM 353 (1 unit)
OFADM 375 (1 unit)* OFADM 363 (1 unit)
OFADM 364 (1 unit)
OFADM 366 (1 unit)
*also offered in the Office Administration Center
We feel that our program offerings are very flexible for our students. The data does not accurately reflect
the courses taught within the OAC, as they show as only day courses. Since we are open until 8 p.m. four
nights a week, the data is not including those available courses. Also, the one hybrid course has been
taught in the evening on campus for the past three years. This, also, does not appear in the data.

Program Review 2017 [Top] Page | 23

Program Review 2017 [Top] Page | 24
Program Analysis
Program Personnel
Please refer to the Department Faculty and Sections Dashboard to supply the names of faculty and adjuncts for
the periods requested. Use the dashboard filters to focus on your individual department. Due to the complexity of
payroll accounts and assignments, those listed may not match known individuals, please note any discrepancies.
Additional comments or narrative can be added below.
Faculty Name Full-Time or Part-Time (adjunct) Hire Date (optional)
Alavezos, Kevin R Full Time
Backlund, Nancy A Full Time
Jimme Sevick Part Time
Shawne Arnold Part Time
Tony Ipolito Part Time
Faculty Assignments
Please refer to the Department Faculty and Sections Dashboard to supply the number of faculty and adjuncts
for the past two years of regular terms. Use the dashboard filters to focus on your individual department. Due to
the complexity of payroll accounts and assignments, those listed may not match known individuals, please note
any discrepancies. Please note that summer positions are all shown as adjunct due to payroll categories.
Enter figures for each term, to add additional rows, click in last cell on right and push tab on the keyboard.
Additional comments or narrative can be added below.
Term # Taught by FT
Faculty
# Taught by Other
Faculty
# Sections Offered /
Term
Program Fill Rate %
2015 Fall 13 2 14 41
2016 Spring 5 2 7 30
2016 Summer 6 6 20
2016 Fall 14 2 15 34
2017 Spring 13 2 14 31
As discussed earlier in the Program Review, the courses taught within the OAC have not been included in
the data. This table reflects only sections taught outside the OAC in any semester.
Staffing within the OAC is complex. Kevin Alavezos teaches 30 hours as his full-time load in the Center.
Nancy also teaches four hours during the day as part of her load throughout the week and has taught in
the evening as overload. Consequently, due to how the OAC staff is assigned in Datatel each semester,
adjunct sections cannot be measured as in other instructional programs.

Program Review 2017 [Top] Page | 25
Program Review 2017 [Top] Page | 26
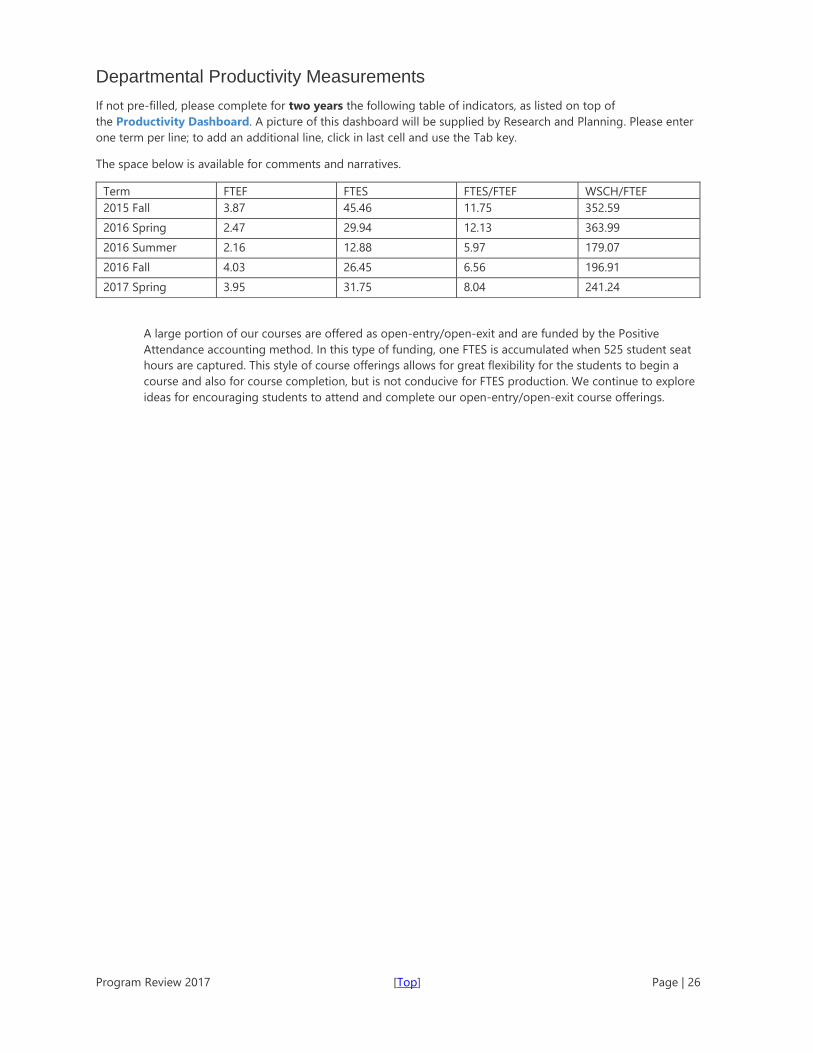
Departmental Productivity Measurements
If not pre-filled, please complete for two years the following table of indicators, as listed on top of
the Productivity Dashboard. A picture of this dashboard will be supplied by Research and Planning. Please enter
one term per line; to add an additional line, click in last cell and use the Tab key.
The space below is available for comments and narratives.
Term FTEF FTES FTES/FTEF WSCH/FTEF
2015 Fall 3.87 45.46 11.75 352.59
2016 Spring 2.47 29.94 12.13 363.99
2016 Summer 2.16 12.88 5.97 179.07
2016 Fall 4.03 26.45 6.56 196.91
2017 Spring 3.95 31.75 8.04 241.24
A large portion of our courses are offered as open-entry/open-exit and are funded by the Positive
Attendance accounting method. In this type of funding, one FTES is accumulated when 525 student seat
hours are captured. This style of course offerings allows for great flexibility for the students to begin a
course and also for course completion, but is not conducive for FTES production. We continue to explore
ideas for encouraging students to attend and complete our open-entry/open-exit course offerings.

Program Review 2017 [Top] Page | 27
Program Review 2017 [Top] Page | 28
Long Term Planning and Resource Needs
Long Term Planning
Provide any additional information that hasn't been addressed elsewhere in this program review, such as
environmental scans for opportunities or threats to your program, or an analysis of important subgroups of the
college population you serve.
View the Program Review Instructions page for reference and inspiration.
Taking into account the trends within this program and the college, describe what you realistically believe your
program will look like in three to five years, including such things as staffing, facilities, enrollments, breadth and
locations of offerings, etc.
We will continue to provide students an opportunity to gain appropriate skills for entry-level office
positions, retraining, upgrading software skills, and degree completion. In addition, we will continue to
provide technology skills to the general MJC student population to support their other courses and
achieve their educational goals.
Our desire is to grow our program in terms of number of students served and substantially increase
degree/certificate completion. We aspire to be the first choice for industry when they are looking to hire
qualified employees. Strong Workforce money has afforded us the opportunity to partner with the
Business Administration program to strengthen our Advisory Committee and develop additional
internship opportunities for our students. This is an exciting opportunity for BUSAD and OFADM faculty
to create strong relationships with our industry partners to ultimately benefit our students.
Our program has only two full-time faculty and in the next five years, we anticipate at least one full-time
faculty retirement. We currently are minimally staffed and struggle to find qualified faculty to teach the
vast breadth of our course offerings. Proper planning and execution of this retirement is critical for our
program, as one full-time faculty member cannot sustain the program. It’s imperative, at the minimum,
this faculty is replaced and consideration be given to hire an additional full-time faculty. Of the last four
full-time Office Administration faculty retirements, none of them were replaced—this is a concern.

Program Review 2017 [Top] Page | 29
Resource Request and Action Plan
Priority Name Resource
Type
Estimated
Cost
Objective
1 Retirement
Replacement
$120,000
One-time
A replacement for an expected faculty
retirement.
5 Marketing Projection
Unit
$400
One-time
Project marketing video to prospective
students and industry professionals
6 Marketing Materials $1,000
Ongoing
Increase awareness of and enrollment in our
program
3 Printers (OAC) $2,000
One-time
Replacement of aging printers
2 Videos $2,000
One-time
Updated Telephone Techniques videos
10 Folding Machine $600
One-time
Exposure to office machines for OA students
9 SMS Program Fee $500
Ongoing
Renewal of text messaging system for student
success and completion
7 Certiport Renewal $2,500
Ongoing
MOUS Certification Renewal for Ag & OA
11 Adobe Software for
OAC & faculty
Unknown
Ongoing
Software for possible new course offering
8 Lab Monitoring
Software
Unknown
Ongoing
Licensing for Founders 131 (OAC) and 111
(shared with other users)
4 Appt. Booking
Software
$150
Ongoing
Subscription to software for advising
appointments
12 Other media site
subscriptions
$500
Ongoing
Various sites used within OA and business
courses
Evaluation of Previous Resource Allocations
Below is a list of resource allocations received in previous Program Reviews. Please evaluate the effectiveness of
the resources utilized for your program. How did these resources help student success and completion?
(https://www.mjc.edu/governance/rac/documents/ielmallocationsummary20142015.pdf)
The Evaluation / Measured Effectiveness can be typed in another program and pasted here, or typed directly in to
the box below. The box will expand with additional text, and paragraphs (hard returns) can be added by using
Ctrl+Enter.
Resource Allocated PR Year Evaluation / Measured Effectiveness
VDI Machines (FH
131 & 133) (IELM)
2017 Not available
Copier (IELM) 2017 Not available
Keyboards (CTE) 2016 Improved keystroking by students
Faculty Office
desktop computers
(Strong Workforce)
2017 Have not arrived
Faculty work area
printers (Strong
Workforce)
2017 Have not arrived
Faculty Surface Pros
(CTE)
2017 Have not arrived
Field Trip 2017 Scheduled for October
Certiport (lottery) 2017 Has not been finalized

Program Review 2017 [Top] Page | 30
Career Technical Education Questions
The following series of question focus on Career and Technical Education, and can be answered using the labor
data from Cal-PASS Plus on Launchboard. You will need to create an account before accessing the Launchboard.
How many students did you serve in the last two academic years?
We served approximately 1,800 students in 2014-15 and 986 in 2015-16.
What kinds of students are you serving?
In 2014-15, our population was 75% female and 23% male. These numbers changed only slightly in 2015-
16 with 75% female, and 24% male. We had 43% Hispanic and 38% white in 2014-15 and 45% Hispanic
and 38% white in 2015-16.
The majority (54%) of our students was made up of the three age groups of 19 and under, 20-24 and 25-
29 years of age in 2014-15; however, our largest population was students aged 40 or more at 27%. In
2015-16 those numbers were slightly different with 51% for the same three age groups and the majority
again being aged 40 or more at 26%. In both years our smallest groups were those 19 years and younger.
The data also indicates that we serve the 30-34 and 35-35 age groups the least with only a total of 19%
in 2014-15 and 22% in 2015-16.
What percentage of your students are persisting? Consider within the program and within the college.
The term-to-term retention of the OA students has improved from 20% in 2014-15 to 26% in 2015-16. In
comparison to the college’s percentage of 40% for both years, our numbers appear low; but we have
many students who come to us for a specific skill or course, and once they obtain it, they do not return
for the next term. This also affects our persistence rate.
Our persistence rate for 2014-15 was 7%. In contrast, the college persistence rate was 16%. The 2015-16
persistence data is not yet available.
Although the OA program rates were lower than all the programs combined at the college, it should be
noted that the OA term-to-term retention and persistence rates were the same as other colleges within
the region.
Are students getting and keeping jobs?
Since 2012-13, the percentage of students employed has climbed steadily. In 2012-13 56% of the
students were employed. In 2013-14 that number increased to 59% and in 2014-15 it increased to 65%.
What percentage of students are attaining a living wage?
For the 2013-14 and 2014-15 years, 55% of our students were making a living wage.