Embed Size (px)
Citation preview

1
Validation of a web mining technique to measure innovation in high technology
Canadian industries Beaudry, Catherinea; Héroux-Vaillancourt, Mikaëla and Rietsch, Constanta aDepartment of Mathematics and Industrial Engineering, Polytechnique Montréal, Canada
Abstract In this exploratory study, we explore a methodology using a web mining technique to source data in order to analyse innovation and commercialisation processes in Canadian aeronautic, space and defense, as well as nanotechnology-related firms. In total, 133 websites have been extracted and analysed based on keywords related to 4 core concepts (R&D, intellectual property, collaboration and external financing) especially important for the commercialisation of high technology. To validate our methodology, we compare our web mining results with those from classic questionnaire-based surveys. Our results show a correlation between the indicators from the two methods of r=0.306 (p-value=0.007) for R&D, of r=0.368 (p-value=0.002) for IP, of r=0.222 (p-value of 0.071) for collaboration and of r=0.222 (p-value=0.067) for external financing in nanotechnology. In aerospace, we find correlations of r=0.372 (p-value=0.006) for R&D, of r=0.27 (p-value=0.046) for IP, of r=0.232 (p-value of 0.089) for collaboration and no significant correlation was found for external financing. We conclude that some of the data extracted via our web mining technique could be used as proxy for specific variables obtained from more classical methods.
Keywords: Web-mining, Innovation, Commercialisation, Nanotechnology.
1 Introduction Data is often hard to come by, and firms are increasingly solicited to answer surveys and participate in interviews. In this paper, we explore a methodology based on a web mining technique to source data and analyse innovation and commercialisation processes in Canadian nanotechnology, aeronautic, space and defense firms to investigate whether it could provide valid proxies for data obtained using surveys and hence help to overcome the notoriously low survey response rate issues.
Public websites are generally freely available and provide relevant information about a firm’s products, services, business models, R&D activities and so on. All this information can be mined by researchers to study innovation and technology management. The question
2
is whether this information is reliable and whether there is enough to give a good portrait of a firm’s characteristics – i.e. can the content of a commercial website be used to identify various innovation characteristics of a company? And if so, can we validate this methodology with concrete evidence?
Nanotechnology-related firms are especially interesting because of their broad set of applications and business sectors. As enabling technology vectors of the 21st century (Siegrist et al. 2007), the vast majority of nanotechnology-related companies have a website that is regularly updated. Regularly updated websites have the advantage of displaying more accurate data than what can be found in governmental databases (Gök, Waterworth, and Shapira 2014). Aeronautic, space and defense related firms are also cutting edge and avid users of websites. In this study, we analysed and compared innovation indicators of nanotechnology, aerospace and space firms in Canada using two different techniques: classic survey-based indicators with web-based measures of innovation activities.
The remainder of the article is organised as follows: Section 2 presents the theoretical framework around web mining and our hypotheses about nanotechnology innovation and commercialisation; Section 3 describes the data and survey-based methodology; Section 4 presents and analyses the results; and finally Section 5 presents our conclusion.
2 Theoretical framework The use of Internet data has the advantage of not being in direct contact with the subjects of the study and ensures a distance between them and the study. Thus, the subject is not led to adapt his behaviour to the study, as can be the case with questionnaires and interviews. These types of unobtrusive measures are suitable for research inquiring into real actions, but are restricted by the access to a given population (Webb et al. 1966). Usually, this type of study is less expensive compared to intrusive studies such as questionnaires and interviews, which require researchers to perform extensive data collection (Lee 2000).
Nowadays, an increasing number of innovation studies tend to rely on online questionnaires that companies must complete themselves inducing the multiple bias related to this technique. According to Sauermann (2013), numerous studies about innovation that had based their data collection process on these Internet surveys typically received low response rates (between 10 and 25%); the non-response bias affecting the analysis of the results. These online questionnaires are often complex and time-consuming for business managers, which explains such low response rates.
An alternative data collection method consists in the exploration of Internet data to retrieve information about companies via their websites to convert them into analytical data. The vast majority of companies working in high technological fields such as those using nanotechnology keep their website updated in order to inform potential customers and investors about the current activities of the company. Of course, the information is made
3
available online by the companies themselves, which suggests the possibility of a strong self-reporting bias. Although it is clear that companies do not disclose all strategic and business data on their websites, as it is already the case with other available data sources such as scientific publications or patents, this source of information access is however suitable for the study of emerging technologies such as nanotechnology (Gök et al. 2014). Furthermore, Youtie et al. (2012) note that small businesses tend to have smaller websites which facilitates data handling. A successful web mining analysis has several advantages over questionnaires, scientific publications and patents. To start with, the population covered by a study using a search of the Web (web mining) is very wide (Herrouz, Khentout and Djoudi 2013) in an area where questionnaire studies find few willing subjects, particularly in the field of new technologies. Contrary to government data, the frequency of updates is high, even daily, in most cases (Gök et al. 2014). Thus the information contained in websites is perfectly suited to many possible types of studies in the field of new technologies. The main disadvantage is the difficulty to organise and interpret data, with each site having different information and being organised differently.
In this study, we focus on parameters influencing innovation and commercialisation of high technology firms such as nanotechnology-related and aeronautic, space and defense industries. According to Lee et al. (2013), 4 important factors are considered to especially influence the commercialisation of such high technology firms: R&D, intellectual property, collaboration and external financing.
Innovation and R&D efforts are likely to influence positively the firms’ commercialisation and financial performance as mentioned in many studies (Geroski et al. 1993; Klette and Griliches, 2000). R&D efforts are likely to give them a technological superiority as compared to the market. Intellectual property, especially patents, are the research outputs giving the company a competitive advantage its competitors by granting a temporary monopoly to the product’s commercialisation. The commercialisation of technology patenting implies a return on investment via technology marketing, patent reselling or licensing. Moreover, patent statistics are also often used as a proxy for innovative activities (Pavitt 1985). Formal IP protection methods are however less important in aerospace compared to other high-tech industries. Firms rely instead on secrecy and design complexity (Armellini et al. 2014; Armellini et al. 2015).
Collaboration is essential for the development and the deployment of emerging technologies such as nanotechnologies. McNeil et al. (2007) show that collaboration with universities or government institutes allows young nanotech companies to access especially expensive tools. Furthermore, Kim et al. (2008) stress the impact of university research and scientists in the industry by providing specialized manpower, patents and innovation. The complexity behind aerospace products requires the whole industry to embrace inter-organizational cooperation and leverage from all necessary knowledge and capabilities (Jordan and Lowe 2004). Collaboration in aerospace is so important that it happens with all kinds of partners, such as clients (Armellini et al., 2015), suppliers
4
(Bozdogan, Deyst, Hoult and Lucas, 1998), universities and research institutes (Armellini et al. 2014; Armellini et al. 2015) and competitors (Esposito 2004; Frear and Metcalf 1995).
Finally, most nanotechnology projects are still in their early stages, i.e. they need private or public funding to reach the commercialisation phase. Furthermore, both nanotechnology-related as well as aeronautic, space and defense industries are mainly composed of SMEs, which require public funding or venture capital investment to support high technology commercialisation helping them to bridge the valley of death (Kalil, 2005; McNeil et al., 2007).
R&D, intellectual property, collaboration and external financing all have synonyms and other related terms that a company can use to refer to them. When we visit a company’s website, we are directed to read what the company wants us to read. Companies use words that can give insight into what they actually do. We suggest that the more a company uses terms related to a certain factor, the more they are likely to perform activities related to that specific factor. Thus, from the 4 factors we mentioned earlier, we suggest the 4 following propositions:
Proposition 1: The more words related to R&D are used on a firm’s website, the more a firm would be likely to perform R&D activities.
Proposition 2: The more words related to intellectual property are used on a firm’s website, the more a firm would be likely to perform intellectual property related activities.
Proposition 3: The more words related to collaboration are used on a firm’s website, the more a firm would be likely to perform collaborations.
Proposition 4: The more words related to external financing are used on a firm’s website, the more a firm would be likely to perform external financing activities.
Each proposition will be tested with the help of the results of a classic questionnaire-based survey using the methodology explained in the following section.
3 Data and methodology 3.1 Data collection and sample methodology
Nanotechnology We started by conducting a classic questionnaire-based survey, the core of which being based on the Oslo Manual (OECD and Eurostat, 2005), and explored the following themes: innovation, commercialisation, collaboration and intellectual property. A sample of the questionnaire can be found in Annex A.
Firms that either use or develop nanotechnology are not labelled nor are searchable in any obvious way. We used a list of 583 firms from AGY consulting, a Canadian firm specialized in emerging technologies such as nanotechnology, clean technology and biotechnology. We asked the companies whether they were performing nanotechnology
5
activities or using nano-enabled products or processes. When the companies were eligible for the study, we listed them with their associated NAICS code. We used a total of 23 NAICS codes representing 67% of all the cumulated frequencies with which we bought lists of over 3,000 companies. We thus contacted 2,971 high technological Canadian firms. 973 firms did not respond, 1,439 were not eligible to the survey, 380 refused to participate and a total of 222 were eligible. The first 13 fully-completed questionnaire served to test and validate the questionnaire in order to mitigate any self-reporting and fatigue bias. We did remove 6 questions in order reduce the completion time and reduce potential fatigue bias. A total of 89 respondents finally accepted to participate in our study allowing us to reach a 40% response rate. Since the population is unknown, we have a non-probabilistic convenience sample for which it is not possible to remove all potential selection bias. Of course, we assume that the respondents were honest and answered the survey with goodwill.
Our sample represents a wide range of Canadian nanotechnology firms. Moreover, 74% of the firms are nanotechnology intensive, which means that at least 80% of their revenues come from nanotechnology-related innovations. The different application domains in nanotechnology are as follows: 54% advanced materials, 21% biotechnology and medicine, 24.4% electronics, 23.30% equipment and devices, 13.3% photonics and 33.3% other. More than 50% of respondents are small businesses and 83.5 % are SMEs with an average of $94 M revenues and $31M, not including the 3 biggest firms. Finally, 85% of the firms come from Quebec and Ontario and 12 % are from British Columbia and Alberta.
In order to test several types of bias such as self-reporting bias, non-response bias and non-selection bias, we gathered 79 eligible enterprises that did not participate in the study into a control sample. To do so, we used an external source of data on companies in different sectors provided by Industry Canada. The database comprises information provided by the companies themselves on a voluntary basis. While Industry Canada does not guarantee the accuracy or the reliability of the content, we assume the companies that willingly update information in an official public database would input accurate information and thus mitigate the self-reporting bias from this source. We used the data available in Industry Canada’s database for the firms where we found the number of employees (for 37 firms in our main sample and 29 firms in our control sample) and the revenues (for 30 firms in our main sample and 26 firms in our control sample). We compared our main sample and our control sample using these two metrics with a Mann-Whitney U test and did not find a significant difference between both samples for both metrics (p-value=0.115, p-value=0.166) which leads us to believe that we are not likely to face a non-response bias.
Aeronautic, Space and defense We conducted a classic questionnaire-based survey structured along 8 themes, of which, themes 1 and 8 collect general information (Armellini, 2013; Koberg et al. 2003; OECD/Eurostat 2005; Smith and Tranfield 2005). The second theme explored on open innovation practices (Armellini 2013; Chesbrough and Brunswicker 2013), the third theme focused on the four different types of innovations: product, process, marketing or
6
organisational (Armellini 2013; OECD/Eurostat 2005). Theme four involved the funding sources and support for R&D (Armellini 2013). Theme five regarded IP protection methods and management (Armellini 2013; Chesbrough 2006a). Theme six measured partnerships (Chesbrough and Brunswicker 2013; Deloitte 2014; Rose-Anderssen et al. 2008; Smith and Tranfield 2005). Finally, theme seven investigated the culture of the firm (Herzog and Leker 2010). For this specific study, we will use some questions specifically from themes II, IV, V, VI, VII. See in Annex B for the questions we used. Again, we assume that the respondents were honest and answered the survey with goodwill.
From November 2014 to October 2015, a total of 71 firms answered the survey from the 652 firms we contacted which allow us to reach a 10.9% response rate. Since completion covered almost one year, an history bias might be induced. A t-test was performed on key variables throughout the questionnaire to compare responses given by respondents that submitted their answers between November 2014 and April 2015 (N = 40) and those who submitted theirs answers between July 2015 and October 2015 (N = 31). We did not find any significant history bias.
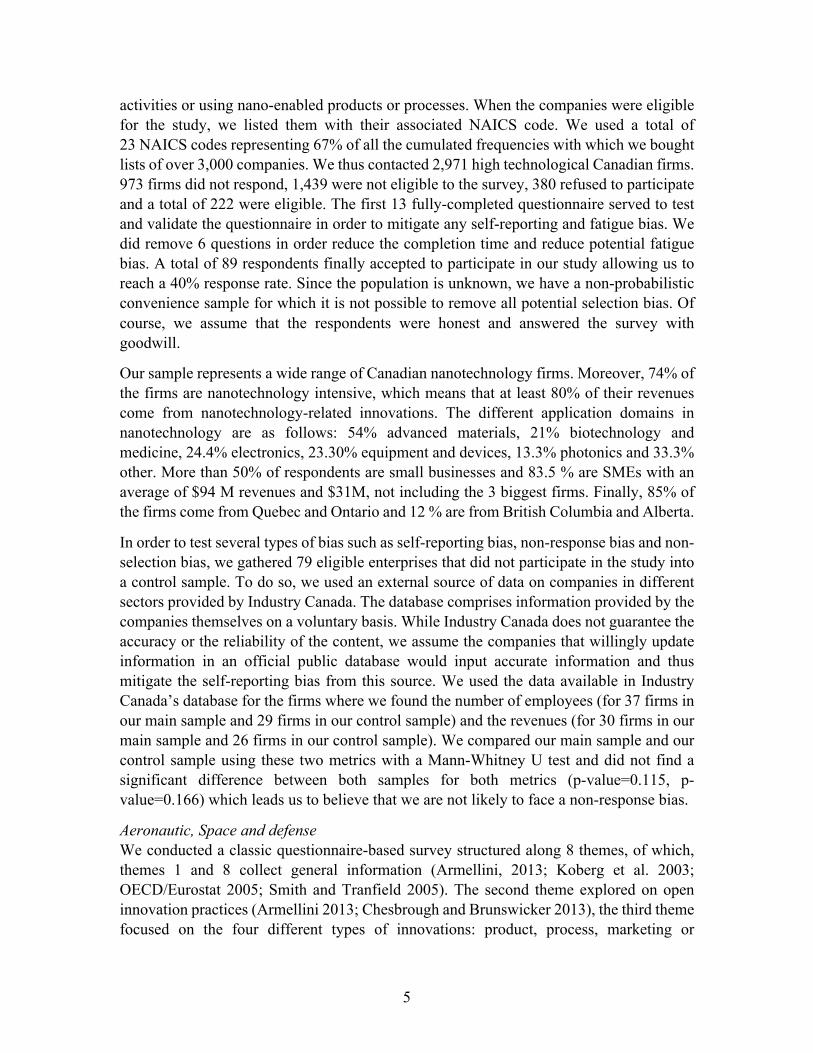
Firms all across Canada answered to the survey with the vast majority (77%) of them coming from Quebec and Ontario alone. Table 4 provides the complete distribution of firms by region and sub-sectors.
Table 1: Number of firms by region and sub-sector (Armellini et al 2016.)
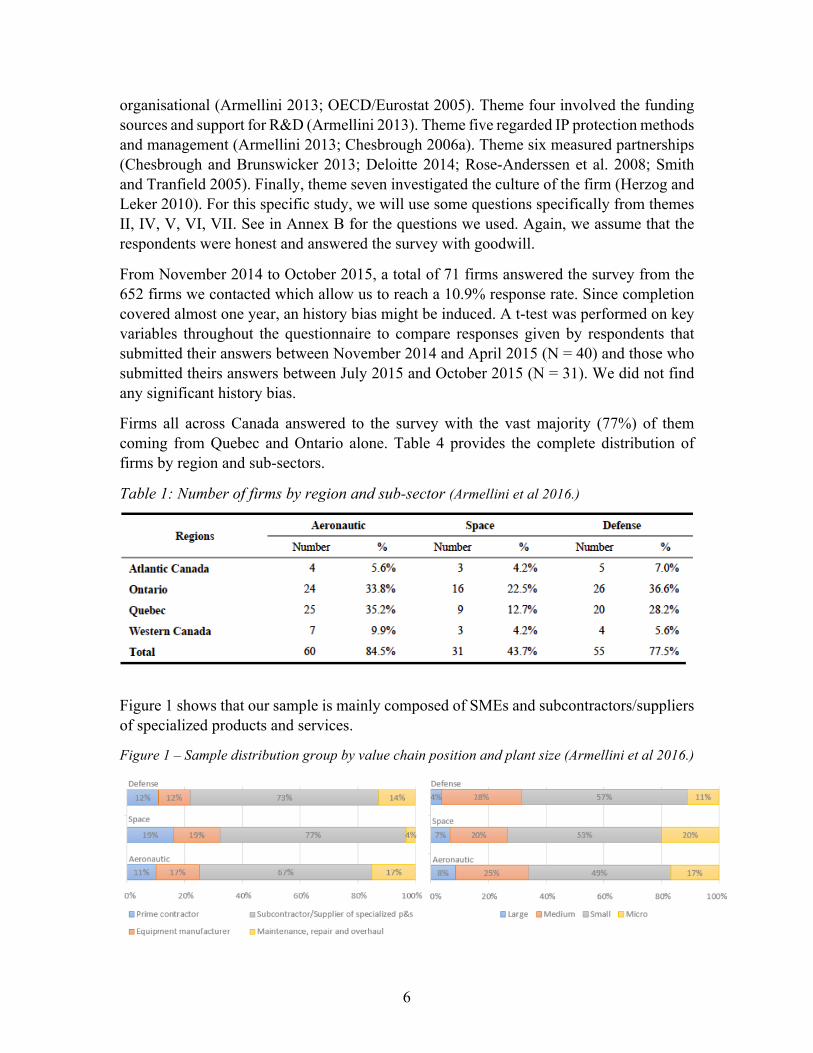
Figure 1 shows that our sample is mainly composed of SMEs and subcontractors/suppliers of specialized products and services.
Figure 1 – Sample distribution group by value chain position and plant size (Armellini et al 2016.)
7
All these proportions are representative of the Canadian aerospace sector. This is a probabilistic convenience sample which reduce considerably the possibility to face a non-response bias and a selection bias that could be induced for the next steps of our methodology.
3.2 Web mining methodology The next step consisted in selecting the 89 enterprises from our nanotechnology sample and the 71 firms from our aerospace sample, and using a web scraper, Nutch, to extract and store the text from their website. Due to technical limitations such as the structure of the websites, only 79 out of the 89 nanotechnology-related firms (88%) and 54 out of 71 firms from the aerospace sample (79%) provided enough information to be included in our study. We then used a content mining technique to perform a word frequency analysis with the text present on the websites. More specifically, in these 133 websites, we looked for innovation and commercialisation core factors: R&D, intellectual property, collaboration and external financing. For each factor, we listed all the relevant keywords that appear in the company web pages. Factors, keywords and the web mining constructs are described in Table 2. R&D and collaboration keywords were selected from the literature while intellectual property and external financing are issued from our own research. The Government of Canada offers many public programs and funding opportunities to companies for the development of high technology projects. The website of Industry Canada identifies funds and programs offered to Canadian firms that we have used for our research.
Table 2: Web Mining construct for nanotechnology and aerospace
Factors Keywords Variables R&D research & development, research and development, r&d,
laboratories, researcher, scientist, product development, technology development, development phase, technical development, development program, development process, development project, development cent, development facility, technological development, development effort, development cycle, development research, development activity, fundamental research, basic research (Gök et al. 2014)
LN_WEB_NANO_RD LN_WEB_AERO_RD
Intellectual property (IP)
Patent, intellectual property, trade secret, industrial design INV_WEB_NANO_IP INV_WEB_AERO_IP
Collaboration affiliation, collaboration, cooperation, partners, partnership (Ramdani et al. 2014)
LN_WEB_NANO_COLLAB LN_WEB_AERO_COLLAB
External financing
atlantic canada opportunities agency, business development bank of canada, sustainable development technology, venture capital, atlantic innovation fund, nrc-irap, fednor, Industrial research assistance program, grants, private investment
WEB_NANO_EXTERN_FINAN WEB_AERO_EXTERN_FINAN
Notes: All indicators are measured by the number of keywords frequencies per webpage; All variables are continuous and normal with the exception of WEB_NANO_EXTERN_FINAN and of WEB_AERO_EXTERN_FINAN.
8
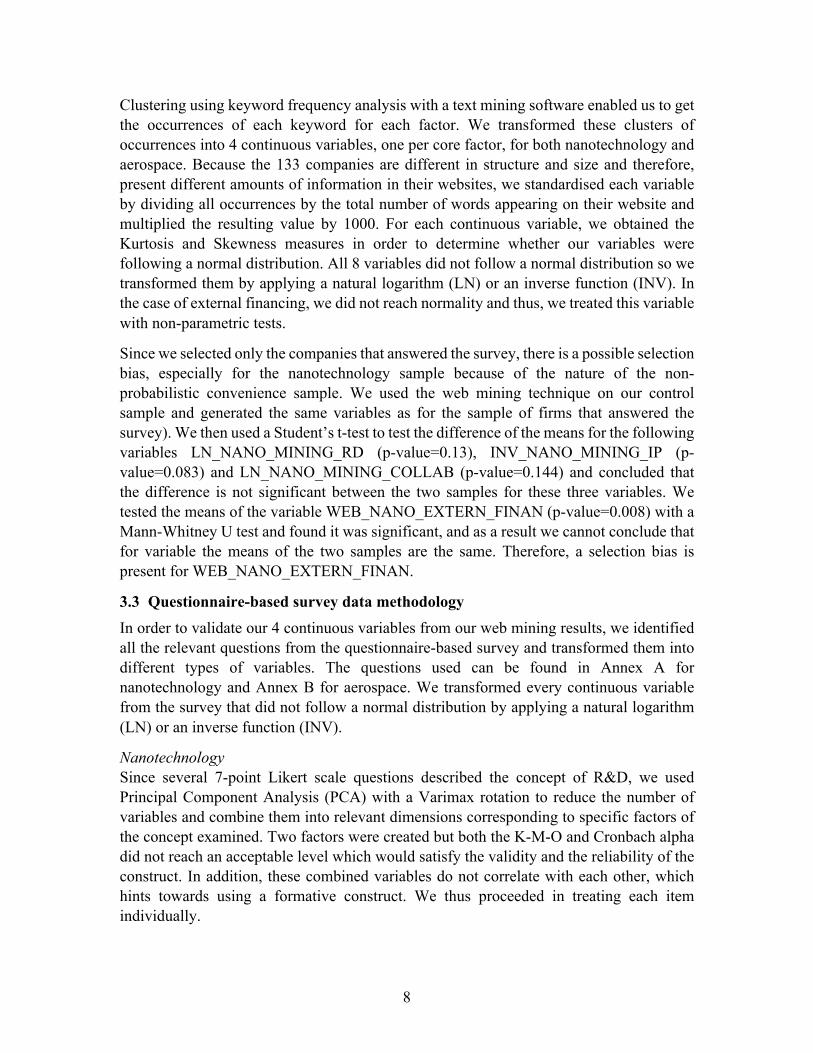
Clustering using keyword frequency analysis with a text mining software enabled us to get the occurrences of each keyword for each factor. We transformed these clusters of occurrences into 4 continuous variables, one per core factor, for both nanotechnology and aerospace. Because the 133 companies are different in structure and size and therefore, present different amounts of information in their websites, we standardised each variable by dividing all occurrences by the total number of words appearing on their website and multiplied the resulting value by 1000. For each continuous variable, we obtained the Kurtosis and Skewness measures in order to determine whether our variables were following a normal distribution. All 8 variables did not follow a normal distribution so we transformed them by applying a natural logarithm (LN) or an inverse function (INV). In the case of external financing, we did not reach normality and thus, we treated this variable with non-parametric tests.
Since we selected only the companies that answered the survey, there is a possible selection bias, especially for the nanotechnology sample because of the nature of the non-probabilistic convenience sample. We used the web mining technique on our control sample and generated the same variables as for the sample of firms that answered the survey). We then used a Student’s t-test to test the difference of the means for the following variables LN_NANO_MINING_RD (p-value=0.13), INV_NANO_MINING_IP (p-value=0.083) and LN_NANO_MINING_COLLAB (p-value=0.144) and concluded that the difference is not significant between the two samples for these three variables. We tested the means of the variable WEB_NANO_EXTERN_FINAN (p-value=0.008) with a Mann-Whitney U test and found it was significant, and as a result we cannot conclude that for variable the means of the two samples are the same. Therefore, a selection bias is present for WEB_NANO_EXTERN_FINAN.
3.3 Questionnaire-based survey data methodology In order to validate our 4 continuous variables from our web mining results, we identified all the relevant questions from the questionnaire-based survey and transformed them into different types of variables. The questions used can be found in Annex A for nanotechnology and Annex B for aerospace. We transformed every continuous variable from the survey that did not follow a normal distribution by applying a natural logarithm (LN) or an inverse function (INV).
Nanotechnology Since several 7-point Likert scale questions described the concept of R&D, we used Principal Component Analysis (PCA) with a Varimax rotation to reduce the number of variables and combine them into relevant dimensions corresponding to specific factors of the concept examined. Two factors were created but both the K-M-O and Cronbach alpha did not reach an acceptable level which would satisfy the validity and the reliability of the construct. In addition, these combined variables do not correlate with each other, which hints towards using a formative construct. We thus proceeded in treating each item individually.
9
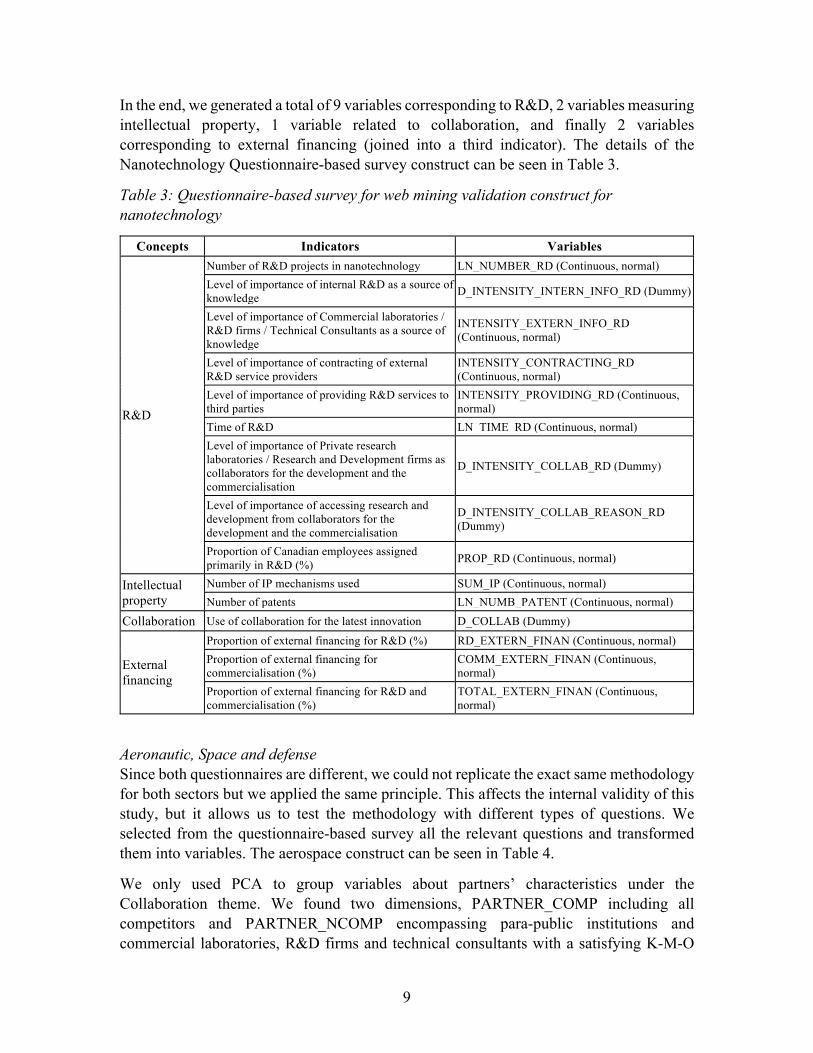
In the end, we generated a total of 9 variables corresponding to R&D, 2 variables measuring intellectual property, 1 variable related to collaboration, and finally 2 variables corresponding to external financing (joined into a third indicator). The details of the Nanotechnology Questionnaire-based survey construct can be seen in Table 3.
Table 3: Questionnaire-based survey for web mining validation construct for nanotechnology
Concepts Indicators Variables
R&D
Number of R&D projects in nanotechnology LN_NUMBER_RD (Continuous, normal) Level of importance of internal R&D as a source of knowledge D_INTENSITY_INTERN_INFO_RD (Dummy)
Level of importance of Commercial laboratories / R&D firms / Technical Consultants as a source of knowledge
INTENSITY_EXTERN_INFO_RD (Continuous, normal)
Level of importance of contracting of external R&D service providers
INTENSITY_CONTRACTING_RD (Continuous, normal)
Level of importance of providing R&D services to third parties
INTENSITY_PROVIDING_RD (Continuous, normal)
Time of R&D LN_TIME_RD (Continuous, normal) Level of importance of Private research laboratories / Research and Development firms as collaborators for the development and the commercialisation
D_INTENSITY_COLLAB_RD (Dummy)
Level of importance of accessing research and development from collaborators for the development and the commercialisation
D_INTENSITY_COLLAB_REASON_RD (Dummy)
Proportion of Canadian employees assigned primarily in R&D (%) PROP_RD (Continuous, normal)
Intellectual property
Number of IP mechanisms used SUM_IP (Continuous, normal) Number of patents LN_NUMB_PATENT (Continuous, normal)
Collaboration Use of collaboration for the latest innovation D_COLLAB (Dummy)
External financing
Proportion of external financing for R&D (%) RD_EXTERN_FINAN (Continuous, normal) Proportion of external financing for commercialisation (%)
COMM_EXTERN_FINAN (Continuous, normal)
Proportion of external financing for R&D and commercialisation (%)
TOTAL_EXTERN_FINAN (Continuous, normal)
Aeronautic, Space and defense Since both questionnaires are different, we could not replicate the exact same methodology for both sectors but we applied the same principle. This affects the internal validity of this study, but it allows us to test the methodology with different types of questions. We selected from the questionnaire-based survey all the relevant questions and transformed them into variables. The aerospace construct can be seen in Table 4.
We only used PCA to group variables about partners’ characteristics under the Collaboration theme. We found two dimensions, PARTNER_COMP including all competitors and PARTNER_NCOMP encompassing para-public institutions and commercial laboratories, R&D firms and technical consultants with a satisfying K-M-O
10
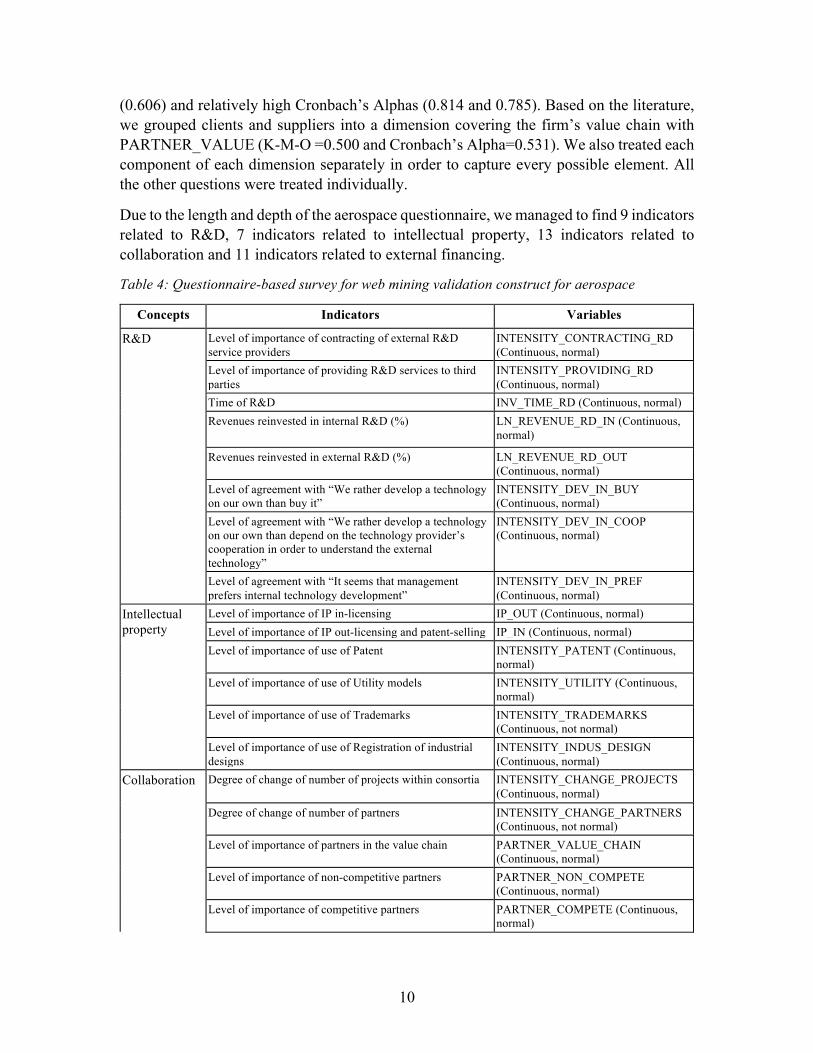
(0.606) and relatively high Cronbach’s Alphas (0.814 and 0.785). Based on the literature, we grouped clients and suppliers into a dimension covering the firm’s value chain with PARTNER_VALUE (K-M-O =0.500 and Cronbach’s Alpha=0.531). We also treated each component of each dimension separately in order to capture every possible element. All the other questions were treated individually.
Due to the length and depth of the aerospace questionnaire, we managed to find 9 indicators related to R&D, 7 indicators related to intellectual property, 13 indicators related to collaboration and 11 indicators related to external financing.
Table 4: Questionnaire-based survey for web mining validation construct for aerospace
Concepts Indicators Variables R&D Level of importance of contracting of external R&D
service providers INTENSITY_CONTRACTING_RD (Continuous, normal)
Level of importance of providing R&D services to third parties
INTENSITY_PROVIDING_RD (Continuous, normal)
Time of R&D INV_TIME_RD (Continuous, normal) Revenues reinvested in internal R&D (%) LN_REVENUE_RD_IN (Continuous,
normal)
Revenues reinvested in external R&D (%) LN_REVENUE_RD_OUT (Continuous, normal)
Level of agreement with “We rather develop a technology on our own than buy it”
INTENSITY_DEV_IN_BUY (Continuous, normal)
Level of agreement with “We rather develop a technology on our own than depend on the technology provider’s cooperation in order to understand the external technology”
INTENSITY_DEV_IN_COOP (Continuous, normal)
Level of agreement with “It seems that management prefers internal technology development”
INTENSITY_DEV_IN_PREF (Continuous, normal)
Intellectual property
Level of importance of IP in-licensing IP_OUT (Continuous, normal) Level of importance of IP out-licensing and patent-selling IP_IN (Continuous, normal) Level of importance of use of Patent INTENSITY_PATENT (Continuous,
normal) Level of importance of use of Utility models INTENSITY_UTILITY (Continuous,
normal) Level of importance of use of Trademarks INTENSITY_TRADEMARKS
(Continuous, not normal) Level of importance of use of Registration of industrial designs
INTENSITY_INDUS_DESIGN (Continuous, normal)
Collaboration Degree of change of number of projects within consortia INTENSITY_CHANGE_PROJECTS (Continuous, normal)
Degree of change of number of partners INTENSITY_CHANGE_PARTNERS (Continuous, not normal)
Level of importance of partners in the value chain PARTNER_VALUE_CHAIN (Continuous, normal)
Level of importance of non-competitive partners PARTNER_NON_COMPETE (Continuous, normal)
Level of importance of competitive partners PARTNER_COMPETE (Continuous, normal)

11
Level of importance of clients, customers and end users PARTNER_CLIENT (Continuous, normal)
Level of importance of universities and educational institutions
PARTNER_UNIVERSITY (Continuous, normal)
Level of importance of public and government institutions PARTNER_PUBLIC (Continuous, normal)
Level of importance of commercial laboratories, R&D firms and technical consultants
PARTNER_PRIVATE_RD (Continuous, normal)
Level of importance of start-ups and entrepreneurs PARTNER_ENTREPRENEUR (Continuous, normal)
Level of importance of suppliers PARTNER_SUPPLIERS (Continuous, normal)
Level of importance of competitors (in the aerospace industry)
PARTNER_DIRECT_COMPETITORS (Continuous, normal)
Level of importance of competitors (external to the aerospace industry)
PARTNER_OTHER_COMPETITORS (Continuous, normal)
External financing
Level of importance of university research grants INTENSITY_UNI_GRANT (Continuous, normal)
Level of importance of publicly funded R&D consortia INTENSITY_PUBLIC_FUND_CONS (Continuous, normal)
Level of importance of R&D tax credits INTENSITY_RD_TAX (Continuous, normal)
Level of importance of government grants for R&D collaborative projects
INTENSITY_GOV_GRANT_COLLAB (Continuous, normal)
Level of importance of government grants for internal R&D projects
INTENSITY_GOV_GRANT_RD (Continuous, not normal)
Level of importance of government venture capital support INTENSITY_GOV_VC (Continuous, normal)
Level of importance of government technology support and assistance programs (ex: IRAPPARI in Quebec)
INTENSITY_GOV_TECH (Continuous, not normal)
Level of importance of government support for training INTENSITY_GOV_ SUPPORT (Continuous, normal)
Level of importance of conventional sources (i.e. banks) INTENSITY_BANKS (Continuous, normal)
Level of importance of collaborative arrangements and alliances
INTENSITY_ALLIANCE (Continuous, normal)
Level of importance of venture capitals INTENSITY_VC (Continuous, normal)
3.4 Web mining validation with questionnaire-based survey methodology
Each pair of variables related to the same concept from the two methods (Web mining and survey) was examined via a Pearson correlation analysis when the subjects were following a normal distribution or a Spearman correlation when they were not following a normal distribution, to assess whether the variables stemming from the Web mining analysis could be used as a proxy for similar concepts measured by a survey. The details concerning our construct comparing a Web Mining technique and a Questionnaire-based survey are listed in Table 5 for nanotechnology and in Table 6 for aerospace.
12
Table 5: Web mining validation with questionnaire-based survey construct for nanotechnology
Concepts Web Mining Variables Questionnaire Variables R&D LN_WEB_NANO_RD
(Continuous, normal) LN_NUMBER_RD (Continue, normal) D_INTENSITY_INTERN_INFO_RD (Dummy) INTENSITY_EXTERN_INFO_RD (Continuous, normal) INTENSITY_CONTRACTING_RD (Continuous, normal) INTENSITY_PROVIDING_RD (Continuous, normal) LN_TIME_RD (Continuous, normal) PROP_RD (Continuous, normal) D_INTENSITY_COLLAB_RD (Dummy) D_INTENSITY_COLLAB_REASON_RD (Dummy)
Intellectual property INV_WEB_NANO_IP (Continuous, normal)
SUM_IP (Continuous, normal) LN_NUMB_PATENT (Continuous, normal)
Collaboration LN_WEB_NANO_COLLAB (Continuous, normal)
D_COLLAB (Dummy)
External financing WEB_NANO_EXTERN_FINAN (Continuous, not normal)
RD_EXTERN_FINAN (Continuous, normal) COMM_EXTERN_FINAN (Continuous, normal) TOTAL_EXTERN_FINAN (Continuous, normal)
Note: Web mining variables and questionnaire variables are compared using Pearson correlation with the exception of the External financing variables which are compared using Spearman correlation.

13
Table 6: Web mining validation with questionnaire-based survey construct for aerospace
Concepts Web Mining Variables Questionnaire Variables R&D LN_WEB_AERO_RD (Continuous,
normal) INTENSITY_CONTRACTING_RD (Continuous, normal) INTENSITY_PROVIDING_RD (Continuous, normal) INV_TIME_RD (Continuous, normal) LN_REVENUE_RD_IN (Continuous, normal) LN_REVENUE_RD_OUT (Continuous, normal) INTENSITY_DEV_IN_BUY (Continuous, normal) INTENSITY_DEV_IN_COOP (Continuous, normal) INTENSITY_DEV_IN_PREF (Continuous, normal)
Intellectual property
INV_WEB_AERO_IP (Continuous, normal)
IP_OUT (Continuous, normal) IP_IN (Continuous, normal) INTENSITY_PATENT (Continuous, normal) INTENSITY_UTILITY (Continuous, normal) INTENSITY_TRADEMARKS (Continuous, not normal) INTENSITY_INDUS_DESIGN (Continuous, normal)
Collaboration LN_WEB_AERO_COLLAB (Continuous, normal)
INTENSITY_CHANGE_PROJECTS (Continuous, normal) INTENSITY_CHANGE_PARTNERS (Continuous, not normal) PARTNER_VALUE_CHAIN (Continuous, normal) PARTNER_ NON_COMPETE (Continuous, normal) PARTNER_COMPETE (Continuous, normal) PARTNER_CLIENT (Continuous, normal) PARTNER_UNIVERSITY (Continuous, normal) PARTNER_PUBLIC (Continuous, normal) PARTNER_PRIVATE_RD (Continuous, normal) PARTNER_ENTREPRENEUR (Continuous, normal) PARTNER_SUPPLIERS (Continuous, normal) PARTNER_DIRECT_COMPETITORS (Continuous, normal) PARTNER_OTHER_COMPETITORS (Continuous, normal)
External financing
WEB_AERO_EXTERN_FUND (Continuous, not normal)
INTENSITY_UNI_GRANT (Continuous, normal) INTENSITY_PUBLIC_FUND_CONS (Continuous, normal) INTENSITY_RD_TAX (Continuous, normal) INTENSITY_GOV_GRANT_COLLAB (Continuous, normal) INTENSITY_GOV_GRANT_RD (Continuous, not normal) INTENSITY_GOV_VC (Continuous, normal) INTENSITY_GOV_TECH (Continuous, not normal) INTENSITY_GOV_SUPPORT (Continuous, normal) INTENSITY_BANKS (Continuous, normal) INTENSITY_ALLIANCE (Continuous, normal) INTENSITY_VC (Continuous, normal)
Note: Web mining variables and questionnaire variables are compared using Pearson correlation with the exception of 2 variables (INTENSITY_TRADEMARKS, INTENSITY_CHANGE_PARTNERS) that were not normal and the External financing variables which are compared using Spearman correlation.
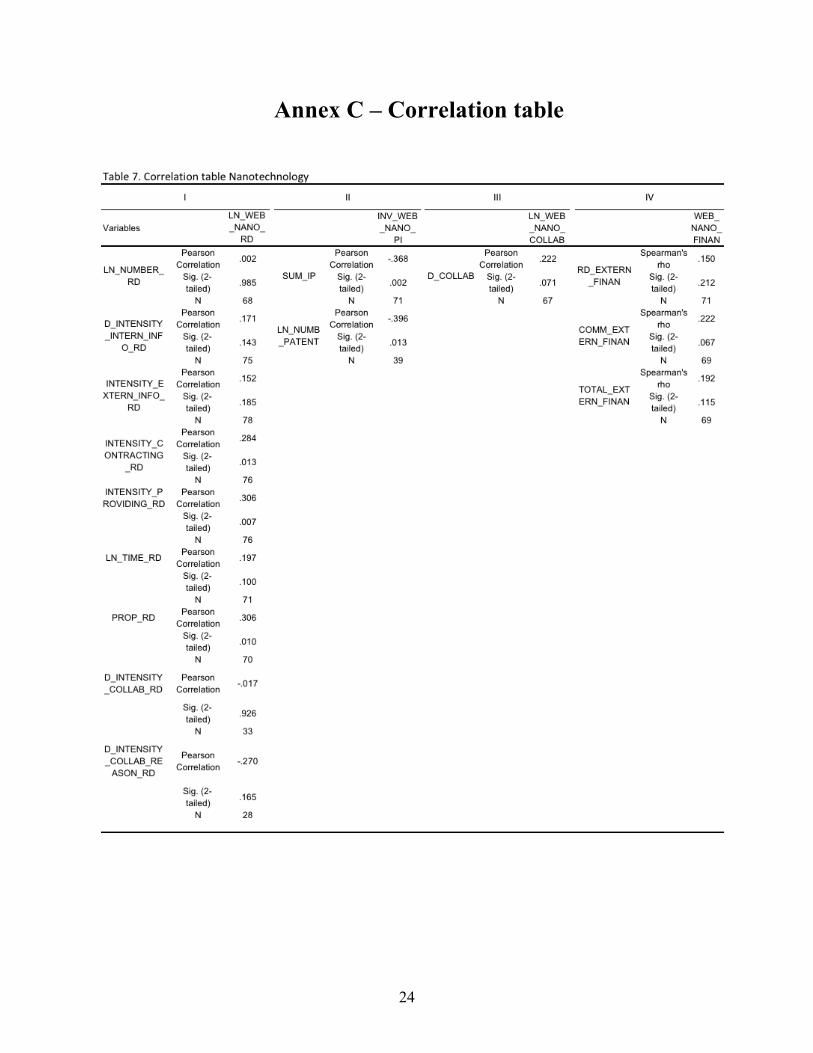
4 Results The results of this paper aim to validate the utilisation of a web-mining-based methodology using firms’ websites as a data source to analyse the extent of commercialisation and innovation, which can be used to better understand innovation practices. Our correlation tables are located in Annex C for both nanotechnology and aerospace.
14
4.1 Nanotechnology Comparing the variables constructed from the web mining and from the survey, we find a correlation of 0.306 (p-value of 0.007) between R&D measures and whether a firm is likely to provide R&D services to third parties. Additionally, we find a correlation of 0.306 (p-value of 0.010) when we associate the R&D concepts on websites with whether a firm has a high percentage of employees allocated to R&D tasks. Moreover, we find a correlation of 0.284 (p-value of 0.013) when we associate the R&D concepts on websites with whether a firm is likely to contract R&D service from external providers. Finally, we find a non-significant correlation of 0.197 (p-value of 0.100) when we associate the R&D concepts on websites with whether a firm has a long R&D process or not. It is important to note that the variable LN_NUMBER_RD, which is related to the number of R&D projects, did not correlate at all with our web mining variable with r =0.002 (p-value=0.985).
Terms related to intellectual property strongly correlate with the variables from the survey with a correlation of 0.368 (p-value of 0.002) regarding the use of intellectual property mechanisms and with a correlation of 0.351 (p-value of 0.033) regarding the activities related to patenting. Web mining methods therefore appear to be able to capture the importance of the use of IP mechanisms.
Collaboration terms from the Web sites are partially correlated with r=0.222 (p-value of 0.071) with the firms that confirmed collaborating from our questionnaire but the result is not significant at the 5% level.
External financing terms (from the web-based analysis) are also partially correlated with the extent of the use of external funds for commercialisation purposes (r=0.222 – p-value of 0.067) but the result is not significant at the 5% level regarding their importance for funding R&D activities.
To conclude, our latest results confirm the data extracted by our web mining technique can be used as a proxy at least for some of the variables issued from classical methods. Although the collaboration and financing concepts did not have a significant correlation, intellectual property and most of R&D web mining variables seem to be, according to our findings, good proxies for innovation studies.
4.2 Aeronautic, Space and defense
From the application of our methodology, we find interesting results regarding R&D in aerospace. Firms that reinvest a higher percentage of their revenues in their internal R&D have a significant positive correlation with data find on their website with r=0.372 (p-value=0.006). Also, firms that rather develop a technology on their own instead of buying it have positive correlation of r=0.259 (p-value=0.056) with our web mining R&D variable.
Terms related to intellectual property did correlate significantly with the level of importance put into patents with r=0.270 (p-value=0.046).
Terms related to collaboration did correlate with the level of importance of collaborating with universities and educational institutions with r=0.232 (p-value=0.089).
15
Finally, no significant correlation has been find with terms related to external financing and the relevant questions from the questionnaire-based survey.
5 Discussion and conclusion Following the ‘Big Data’ movement, Websites have become gold mines of information. Researchers in innovation and technology management are now investigating whether they can mine the data that enterprises provide on their websites in order to get valuable data to their research. Nowadays, researchers rely on questionnaire-based surveys to get most of their data. These questionnaires are costly, time consuming, and sources of multiple biases. We thus explore a technique using data mining to determine whether or not we can use data from websites as proxies for specific indicators that would have required a questionnaire-based survey to be obtained. We tested 4 factors that are consequential for the success of high technology commercialisation: R&D, intellectual property, collaboration and external financing. While results seem conclusive for intellectual property factors and some indicators of R&D, results did not show significant correlations with either collaboration or external financing factors. Therefore, our proposition 3 and 4 are not yet validated.
For the specific case of R&D, we can observe that the web mining indicator seems to reflect the promotion needs in terms of R&D for nanotechnology. Our web mining R&D indicator from nanotechnology did correlate the most when firms are more likely to provide R&D services to third parties. This might be explained by the fact that companies may use their websites to promote their R&D service offerings. Also, our web mining R&D indicator did correlate highly with firms that have a high percentage of employees allocated to R&D tasks for nanotechnology. This can be explained by the willingness of firms to attract new talents in R&D through their websites. Finally, our web mining R&D indicator did correlate significantly with whether firms are more likely to contract R&D services from external providers. However, one of the most important R&D indicators, the number of nanotechnology-related R&D projects, did not correlate at all with our web mining variable, which may seem counterintuitive. Thus, with nanotechnology, we can hardly use our web indicator as a proxy since 3 independent indicators correlate with it and strong indicators of R&D activities are ignored. Therefore, our proposition 1 is partially true.
In aerospace, our web mining R&D indicator did correlate with the amount of revenues reinvested in internal R&D (%). This goes in favour of our proposition 1 for aerospace. Furthermore, our second significant R&D correlation is between our web mining R&D indicator and the Level of agreement with “We rather develop a technology on our own than depend on the technology provider’s cooperation in order to understand the external technology”. This question regards the culture of the firm and suggests that our web mining indicator can also represent the culture of an enterprise that rely heavily on its own R&D capacity.
Our intellectual property web mining variable correlates with the use of intellectual property mechanisms for nanotechnology and the activities related to patenting for both

16
nanotechnology and aerospace. In this respect, our second proposition seems to be true, i.e., intellectual property activities, especially patenting, seem to be explained by an IP web mining proxy.
This research includes some limits. Some variables have not been normalised, which may have caused some bias. More data would allow our research to be more robust, especially when it comes to verifying the concept of collaboration and external financing normally addressed by classical methods, which can be appropriately measured on web sites. For instance, we were not able to crawl data from all the companies from our survey due to technical limitations, and only 133 out of 160 companies were used in this paper. Another limitation of our methodology is the fact that we did not take into account the context of our keywords, possibly leading to multiple false positives. For instance, the mention of the word ‘collaboration’ on a website does not necessarily means that the company in question collaborates with any second party. Qualitative data analysis of the websites’ content could be used to reduce the risk of false positives and to gather more accurate data. Moreover, our data are limited to textual content, while websites also display images, sounds and videos, which are difficult to take into account in our study. Of course, websites, questionnaire-based surveys and the official public database we used are all subject to self-reporting biases, and this is a factor in our limitations.
Websites can be updated from time to time and the results can change accordingly depending on what companies want to display publicly. Thus, it is important to note that a punctual web mine crawl might not be sufficient to capture all relevant information and results are subject to change with updated websites. Thus, a longitudinal study would be required to better assess the validity of our methodology over time.
In the very near future, Partial Least Square (PLS) regression will be tested to determine whether or not it is possible to create reliable and valid reflective indexes from the factors found by the PCA. In addition, we are currently investigating the use of a Multitrait-multimethod matrix (MTMM) to verify the validity and reliability of our constructs and to determine whether our methodology can be used as a valid approach to provide data for future innovation and technology management studies. To do so, we need to ensure that the two methods measure the same traits which this study aimed to enlighten. Future studies including other industries, concepts and keywords will allow for a better understanding of whether or not these web mining indicators capture all the information required to understand the proposed factors and whether they can be used as a proxy for questionnaire-based survey questions or whether these variables provide additional information that might not otherwise have been captured via traditional means.

17
References Armellini, F. (2013), Patterns of open innovation within product development: a
comparative study between Brazilian and Canadian aerospace industries, PhD thesis, Escola Politécnica da Universidade de São Paulo.
Armellini, F., Beaudry, C., & Kaminski, P. (2015). Open within a box: an analysis of open innovation patterns within Canadian aerospace companies. Paper presented at the R&D Management Conference 2015, Pisa, Italy.
Armellini, F., Beaudry, C., & Mahecha, D. (2016). Business models and Innovation in the Canadian aerospace sector. Paper presented at Uddevalla Symposium 2016, London, United Kingdom.
Armellini, F., Kaminski, P., & Beaudry, C. (2014). The Open Innovation Journey in Emerging Economies: An Analysis of the Brazilian Aerospace Industry. Journal of Aerospace Technology and Management, 6(4), 462-474.
Bozdogan, K., Deyst, J., Hoult, D., & Lucas, M. (1998). Architectural innovation in product development through early supplier integration. R&D Management, 28(3), 163-173.
Chesbrough, H. (2006a), Open business models: How to thrive in the new innovation landscape, Harvard Business Press.
Chesbrough, H. & Brunswicker, S. (2013), Managing open innovation in large firms, Fraunhofer Verlag.
Deloitte (2014), Global aerospace and defense industry outlook, Technical report, Deloitte. Esposito, E. (2004). Strategic alliances and internationalisation in the aircraft
manufacturing industry. Technological forecasting and social change, 71(5), 443-468. Frear, C. R., & Metcalf, L. E. (1995). Strategic alliances and technology networks: a study
of a cast-products supplier in the aircraft industry. Industrial Marketing Management, 24(5), 379-390.
Geroski, Paul, Steve Machin, and John Van Reenen. "The profitability of innovating firms." The RAND Journal of Economics (1993): 198-211.
Gök, Abdullah, Alec Waterworth, and Philip Shapira. 2014. “Use of Web Mining in Studying Innovation.” Scientometrics, September, 1–19. doi:10.1007/s11192-014-1434-0.
Herrouz, Abdelhakim, Chabane Khentout, and Mahieddine Djoudi. 2013. “Overview of Web Content Mining Tools.” arXiv Preprint arXiv:1307.1024. http://arxiv.org/abs/1307.1024.
Herzog, P. & Leker, J. (2010), ‘Open and closed innovation–different innovation cultures for different strategies’, International Journal of Technology Management 52(3/4), 322–343.
Jordan, J., & Lowe, J. (2004). Protecting strategic knowledge: insights from collaborative agreements in the aerospace sector. Technology Analysis & Strategic Management, 16(2), 241-259.
Kalil, Thomas A. "Nanotechnology and the valley of death." (2005): 265.
18
Kim, Jinyoung, Sangjoon John Lee, and Gerald Marschke. 2008. “Impact of University Scientists on Innovations in Nanotechnology.”
Klette, Tor Jakob, Jarle Møen, and Zvi Griliches. "Do subsidies to commercial R&D reduce market failures? Microeconometric evaluation studies." Research Policy 29, no. 4 (2000): 471-495.
Koberg, C. S., Detienne, D. R. & Heppard, K. A. (2003), ‘An empirical test of environmental, organizational, and process factors affecting incremental and radical innovation’, The Journal of High Technology Management Research 14(1), 21–45.
Lee, C. J., Lee, S., Jhon, M. S., & Shin, J. (2013). Factors influencing nanotechnology commercialization: an empirical analysis of nanotechnology firms in South Korea. Journal of nanoparticle research, 15(2), 1-17.
OECD, and Eurostat. 2005. Oslo Manual. The Measurement of Scientific and Technological Activities. OECD Publishing. http://www.oecd-ilibrary.org/science-and-technology/oslo-manual_9789264013100-en.
Pavitt, K. 1985. “Patent Statistics as Indicators of Innovative Activities: Possibilities and Problems.” Scientometrics 7 (1-2): 77–99. doi:10.1007/BF02020142.
Ramdani, A. 2014. “Revue systématique de la littérature sur les mesures de la collaboration inter-organisationnelle dans un contexte d’innovation.” http://publications.polymtl.ca/1624/1/2014_AnasRamdani.pdf.
Rose-Anderssen, C., Baldwin, J. S., Ridgway, K., Allen, P. M. & Varga, L. (2008), ‘Aerospace supply chains as evolutionary networks of activities: Innovation via risk-sharing partnerships’, Creativity and innovation management 17(4), 304–318.
Sauermann, Henry, and Michael Roach. 2013. “Increasing Web Survey Response Rates in Innovation Research: An Experimental Study of Static and Dynamic Contact Design Features.” Research Policy 42 (1): 273–86. doi:10.1016/j.respol.2012.05.003.
Siegrist, Michael, Carmen Keller, Hans Kastenholz, Silvia Frey, and Arnim Wiek. "Laypeople's and experts' perception of nanotechnology hazards."Risk Analysis 27, no. 1 (2007): 59-69.
Smith, D. J. & Tranfield, D. (2005), ‘Talented suppliers? Strategic change and innovation in the UK aerospace industry’, R&D Management 35(1), 37–49.
Webb, E. J., Campbell, D. T., & Schwartz, R. D. (1966). Unobtrusive measures: Nonreactive research in the social sciences. Chicago: Rand McNally.
Youtie, Jan, Diana Hicks, Philip Shapira, and Travis Horsley. 2012. “Pathways from Discovery to Commercialisation: Using Web Sources to Track Small and Medium-Sized Enterprise Strategies in Emerging Nanotechnologies.” Technology Analysis &; Strategic Management 24 (10): 981–95. doi:10.1080/09537325.2012.724163.
19
Annex A – Questions from the nanotechnology questionnaire-based survey
R&D
1. How many nanotechnology-related and/or advanced material products in development do you actually have in each of the following phases? 1 - Applied Research, 2- Product Scoping and Business Case Building, 3- Development, Testing and Validation, 4- Commercialisation
2. How important to your plant’s innovation activities are each of the following sources of knowledge and innovation? (1-Not important, 2-Very low, 3-Low, 5-High, 6-Very high, 7-Essential).
• Internal R&D in your firm • Commercial laboratories / R&D firms / Technical Consultants
3. Please indicate the level of importance of each of the following innovation activities to your plant during the period 2010 to 2014 (1-Not important, 2-Very low, 3-Low, 5-High, 6-Very high, 7-Essential).
• Contracting of external R&D service providers • Providing R&D services to third parties
4. How long did it take to develop your most significant and recent (MSR) nanotechnology-related product innovation?
5. How important were each of the following organisations as collaborators in the development and commercialization of your MSR product innovation? (1-Not important, 2-Very low, 3-Low, 5-High, 6-Very high, 7-Essential).
• Private research laboratories / Research and Development firms 6. How important were the following reasons in deciding to collaborate for the
development and the commercialisation of your MSR product innovation? (1-Not important, 2-Very Low, 3-Low, 5-High, 6-Very high, 7-Essential)
• Accessing research and development 7. What proportion of Canadian employees from your firm are assigned primarily in
R&D (%)?
Intellectual property
1. Which of the following mechanisms are used by your firm to protect the intellectual property rights (IPR) for your MSR product innovation?
• Patents • Trademarks • Confidentiality agreements • Trade secrets
20
• First mover advantage • Other
2. How many patents does your firm own? Please note that the same patent filed in different countries is considered as only one patent. • Y: 1- Patent applications, 2- Existing patents, 3- Patents assigned / (sold) to others • X: 1- All patents, 2- Nanotechnology-related and advanced materials patents
Collaboration
1- Did your firm participate in alliances or collaborative agreements with other organisations to develop or commercialise your MSR product innovation? Y/N
2- How important were each of the following organisations as collaborators in the development and commercialisation of your MSR product innovation? (1-Not important, 2-Very low, 3-Low, 5-High, 6-Very high, 7-Essential).
• Universities or higher education institutions, College centres for technology transfer (CCTT) and CEGEPs, university technology transfer offices
External financing 1- Please indicate the proportion (%) of the total amount of financing provided by each
of the following sources for the development and commercialisation of your MSR product innovation. • Y: 1- Internal funds of your firm or establishment, 2- Government subsidies / tax
credits / academics grants, 3- Debt capital (such as bank loans), 4- Venture capital (public/private), 5- Collaboration agreements, 6- Programs from organisations such as nanoQuebec (now PRIMA-Quebec), nanoOntario, nanoAlberta, etc.., 7-Other
• X: 1- Development of innovation, 2- Commercialisation of innovation
21
Annex B – Questions from the Aeronautic, Space and defense questionnaire-based survey
R&D
1. Please indicate the level of importance of each of the following inbound practices to your plant during the past three years (2010 2013):
(1 = extremely low importance, 2 = very low importance, 3 = slightly important, 4 = moderately important, 5 = highly importance, 6 = very high importance, 7 =extremely high importance) • Contracting of external R&D service providers
2. Please indicate the level of importance of each of the following outbound practices to
your plant during the past three years (2010 2013): (1 = extremely low importance, 2 = very low importance, 3 = slightly important, 4 = moderately important, 5 = highly importance, 6 = very high importance, 7 = extremely high importance) • Providing R&D services to third parties
3. On average, how long does it take for your plant to develop a new or significantly
improved product (good or service)? (This represents the time from research to launch) • Please write your answer(s) here:
______Year(s) ______Month(s)
4. Please estimate (as best as you can) the percentage of your plant's total revenues in 2013 that were reinvested in R&D: Revenues reinvested in internal R&D (%) _______ Revenues reinvested in external R&D (%) _______
5. Please indicate the extent to which you agree with the following statements for your plant (1 = strongly disagree, 2 = disagree, 3 = somewhat disagree, 4 = neither agree nor disagree, 5 = somewhat agree, 6 = agree, 7 = strongly agree) • We rather develop a technology on our own than buy it • We rather develop a technology on our own than depend on the technology
provider’s cooperation in order to understand the external technology • It seems that management prefers internal technology development
Intellectual property
1. Please indicate the level of importance of each of the following inbound practices to your plant during the past three years (2010 2013): (1 = extremely low importance, 2 = very low importance, 3 = slightly important, 4 = moderately important, 5 = highly importance, 6 = very high importance, 7 = extremely high importance) • IP in-licensing
22
2. Please indicate the level of importance of each of the following outbound practices to your plant during the past three years (2010 2013): (1= extremely low importance, 2 = very low importance, 3 = slightly important, 4 = moderately important, 5 = highly importance, 6 = very high importance, 7 = extremely high importance) • IP out-licensing and patent-selling
3. How important are the following intellectual property (IP) protection methods for
your plant: (1= extremely low importance, 2 = very low importance, 3 = slightly important, 4 = moderately important, 5 = highly importance, 6 = very high importance, 7 = extremely high importance) • Patents • Utility models • Trademarks • Registration of industrial designs
Collaboration 1. For your plant, please indicate the degree of change from 2010 to 2013 in the
following: (1 = significant decrease, 2 = moderate decrease, 3 = slight decrease, 4 = no change, 5 = slight increase, 6 = moderate increase, 7 = significant increase) • Number of projects within consortia • Number of partners
2. How important are the following partners to your plant's innovation activities during
the past three years (2010 2013): (1 = significant decrease, 2 = moderate decrease, 3 = slight decrease, 4 = no change, 5 = slight increase, 6 = moderate increase, 7 = significant increase) • Clients, customers and end users • Universities and educational institutions • Public and government institutions • Commercial laboratories, R&D firms and technical consultants • Entrepreneurs and startups • Suppliers • Competitors (in the aerospace industry) • Competitors (external to the aerospace industry)
External funding
1. Please indicate the level of importance of each of the following inbound practices to your plant during the past three years (2010 2013) (1= extremely low importance, 2 = very low importance, 3 = slightly important, 4 = moderately important, 5 = highly importance, 6 = very high importance, 7 = extremely high importance)
• University research grants
23
• Publicly funded R&D consortia
2. How important are the following external funding sources for the research and development activities of your plant during the past three years (2010 2013)? (1= extremely low importance, 2 = very low importance, 3 = slightly important, 4 = moderately important, 5 = highly importance, 6 = very high importance, 7 = extremely high importance) • R&D tax credits • Government grants for R&D collaborative projects • Government grants for internal R&D projects • Government venture capital support • Government technology support and assistance programs (ex: IRAPPARI in
Quebec) • Government support for training • Conventional sources (i.e. banks) • Collaborative arrangements and alliances • Venture capitals
24
Annex C – Correlation table

25

![Validation of the (anti-) ERα CALUX bioassay ERa Calux...validation of the ERα CALUX bioassay (agonistic and antagonistic mode) according to the OECD guidelines for validation [2]](https://img.pdfslide.us/doc/110x75/5e63fa0741abdf46ef13e550/validation-of-the-anti-er-calux-bioassay-era-calux-validation-of-the-er.jpg)