Embed Size (px)
Citation preview
The Validation and Development of Analytical Technique for the Fast and Economical Evaluation of Amoxicillin in Solid Dosage form
Through UV/Visible Spectroscopy
ISSN (Print): 2521-8514 ISSN (Online): 2521-8484 RADS J. Pharm. Pharm. Sci. 7
ORIGNAL ARTICLE
The Validation and Development of Analytical Technique for the Fast and Economical Evaluation of Amoxicillin in
Solid Dosage form Through UV/Visible Spectroscopy
Muhammad Iqbal1,3, Syed Saeed ul Hassan2, Muhammad Abbas4,*, Hammad Ahmad2,5 1Department of Chemistry, University of Gujrat, Hafiz Hayat Campus, Gujrat 50700, Pakistan. 2 Imran Idrees College of Pharmacy, Sialkot, Pakistan. 3Munawar Pharm Lahore, Pakistan. 4Ismam College of Pharmacy, Pasrur Road Sialkot-51480, Pakistan. 5Department of Pharmacology, Sialkot Medical College, Pakistan.
A B S T R A C TAuthors’ Contributions 1 Conception & Study design, Data Collection & Processing, Data Analysis and/or Interpretation, Drafting of Manuscript. 2 Conception & Study design, Data Collection & Processing, Data Analysis and/or Interpretation, Critical Review. 3 Data Collection & Processing, Data Analysis and/or Interpretation, Drafting of Manuscript Critical Review. 4 Data Analysis and/or Interpretation, Critical Review.
Article info. Received: December 22, 2020 Accepted: April 15, 2021
Funding Source: Nil Conflict of Interest: Nil
Cite this article: Iqbal M, Hassan SSU, Abbas M, Ahmad H. The Validation and Development of Analytical Technique for the Fast and Economical Evaluation of Amoxicillin in Solid Dosage form Through UV/Visible Spectroscopy. RADS J Pharm Pharm Sci. 2021; 9(1):7-17.
*Address of Correspondence Author:
Objective: The key objective of the study is to explore the sensitive, rapid,
simple, accurate and economic UV/Vis spectrophotometric method to
determine the amount of Amoxicillin trihydrate (AMTR) in bulk
pharmaceuticals and in various formulations including dry powder (syrup),
tablets and capsules by employing Copper sulphate buffer solution.
Methodology: The current spectroscopic analysis performed with 12.5 μg/ml
concentration of AMTR at 320 nm follows the Beer’s Lambert Law. The
linearity range (10-15µg/ml) and regression data presented a significant
correlation coefficient (r2 =0.999). The appropriate level of accuracy,
precision, linearity, and mean percentage recovery of AMTR were found
adequate relating to the % age error and standard deviations.
Results: Amoxicillin trihydrate and its known strengths were scanned and
analyzed by our validated method such as; 10.0 µg/ml Amoxicillin (80%),
11.25 µg/ml Amoxicillin (90%), 12.5 µg/ml Amoxicillin (100%), 13.75 µg/ml
Amoxicillin (110%) and 15.0 µg/ml Amoxicillin (120%).
Conclusions: As the recommended protocol of amoxicillin determination
(spectrophotometry) is accurate, precise and statistically evaluated, therefore
it could readily be employed for qualitative purposes of either for the raw
material and pharmaceutical preparations.
Keywords: UV/Vis Spectroscopy, validation, amoxicillin trihydrate,
Pharmaceutical, formulations.
I N T R O D U C T I O N
Amoxicillin is associated to β lactam antibiotics and
effectively respond to Gram +ve and Gram –ve
strains of bacteria. The infectious diseases in
animals, humans and plants are effectively control
with Amoxicillin [1]. It is hydrolyzed by the
staphylococcal penicillaminase [2]. Amoxicillin is
found in three hydrated forms such as; monohydrate,
dehydrate and trihydrate, while, the trihydrated form is
the supreme stable [3]. Chemical name of Amoxicillin
trihydrate (AMTR) is (2S,5R,6R) -6- [[(2R) – 2 -
Amino- 2 -(4-hydroxyphenyl)-acetyl]amino] -3, 3-
dimethyl -7 –oxo- 4 - thia- 1- azabicyclo [3.2.0]
heptane- 2-carboxylic acid trihydrate [4]. Its molecular
weight and molecular formula are 419.4 and
The Validation and Development of Analytical Technique for the Fast and Economical Evaluation of Amoxicillin in Solid Dosage form
Through UV/Visible Spectroscopy
ISSN (Print): 2521-8514 ISSN (Online): 2521-8484 8 RADS J. Pharm. Pharm. Sci.
8
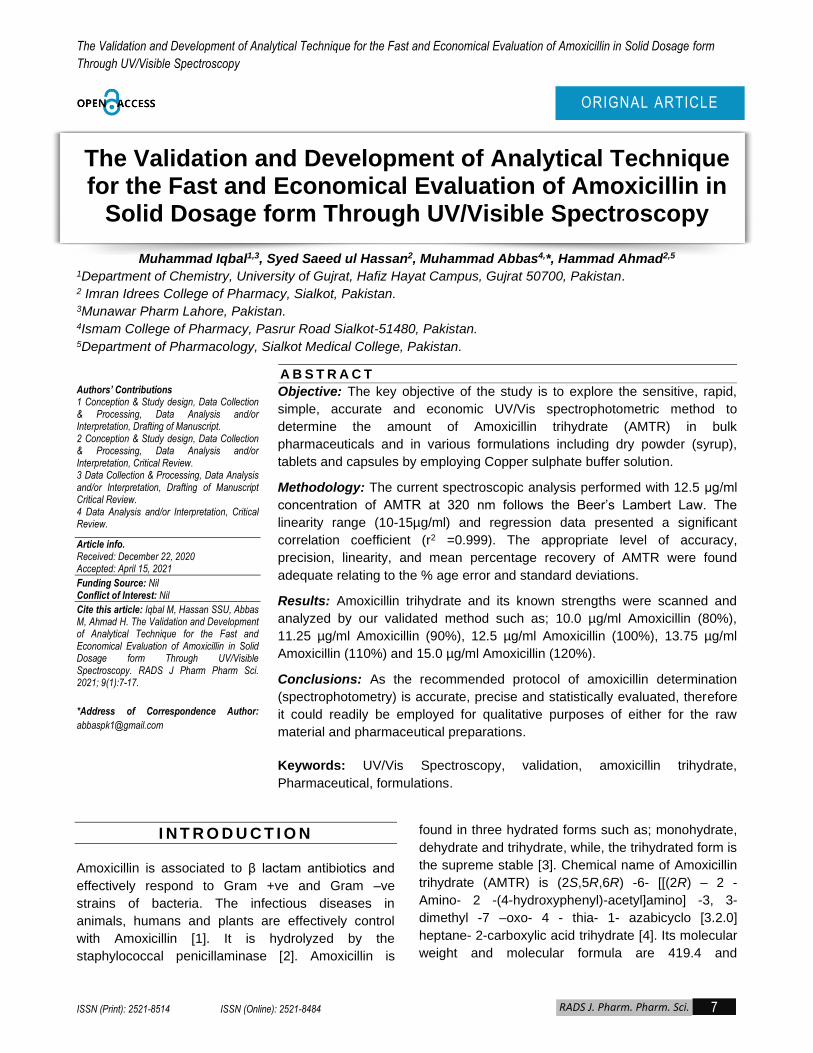
C16H19N3O5S.3H2O respectively as well as structural-
formula [5] is given in Figure 1.
Figure 1. Structure of Amoxicillin-trihydrate.
AMTR is a white crystalline-powder. It is slightly-
soluble in water and ethanol (96 %), practically-
insoluble in oils of fatty acid. In dilute acids and dilute
alkali hydroxides it dissolves in between 15°C - 25°C.
It melts at about 183°C with decomposition
characteristics. Drug is officially listed in British
Pharmacopoeia, United States Pharmacopoeia and
Martindale [6]. Because of therapeutic significance of
Amoxicillin, biological and quality control labs required
rapid, sensitive and reliable method to monitor it
clinically [1]. Therefore, numerous analytical methods
have been reported for the estimation of Amoxicillin in
bulk and pharmaceutical dosage forms like
spectrophotometric [6,7], HPLC [9,10], derivative-
spectrometric and titrimetric techniques [3,11]. The
current study is focused on the validation of simple,
precise and economical UV/Vis spectrophotometer
method to evaluate the Amoxicillin trihydrate in pure
and formulations.
E X P E R I M E N T A L
Preparation of Copper Sulphate buffer solution
Di-potassium hydrogen phosphate was weighed
(15.22g) and dissolved in 900ml distilled water. Citric
acid monohydrate (9.744g) and copper sulphate
pentahydrate (0.117g) were added to the solution and
sonicated. The final 1000 mL volume was made with
distilled-water. [12].
Reagents and Solvents
The standard (reference) Amoxicillin trihydrate
analytical grade (99.88%) and the dry powder (oral
suspension) containing excipients were acquired from
Munawar Pharma Lahore and stored at room
temperature. All other chemicals were of analytical
grades and water was freshly dual distilled.
Instrumentation and Conditions
All analytical works were performed with double-beam
UV/Vis spectrophotometer (Shimadzu UV-1700) fitted
out with dual lamp as energy source and UV-Visible
detector. Analytical balance (Sartorius model
TE214S) was used for weighing solid chemicals.
Development of UV-Vis Spectrophotometer
Method
Standard Solution preparation for Linearity
Solution of Amoxicillin trihydrate equivalent to 62.5
mg was prepared by dissolving 72 mg of standard
Amoxicillin in 180 ml distilled water and diluted to 200
ml with water. Filtered after proper shaking, the 1st
portion of filtrate was discarded and remaining filtrate
was stored as stock solution. Then 02 ml of stock
solution was diluted to 50 ml with Copper sulphate
buffer. We heated (60 - 70ºC) mixture in water-bath
for 30 minutes and cooled in ice-bath to 25C. The
strength of resulting solution was 12.5µg/ml, it
scanned at 250 - 350 nm with UV/Visible
spectrophotometer using copper sulphate buffer as a
blank. The ʎmax we perceived was 320 nm [13].
We perceived linearity and precision of Amoxicillin in
ranges of 10 - 15 µg/mL after preparation of 05
dilutions (80%, 90%, 100%, 110% and 120%) from
the stock solution of reference standard [14].
Preparation of Standard/Sample Solution
The standard solution of sample Amoxcillin powder
was prepared by dissolving 72 mg of powder
equivalent to 62.5 mg of ˚Amoxicillin˚ in 200 ml
distilled water. After filtration, we discarded first
portion of filtrate and remaining amount was collected
as stock solution. 02 ml of stock-solution was mixed
with 48 ml copper sulphate buffer. Then mixture was
heated in water-bath for 30 min and cooled to 25˚C
with ice-bath. The strength of resulting solution was
12.5 μg/mL [15].
Preparation of Sample solution of some
Commercial Brands
CLOCIL, AMOXICAP and LOMOXY Dry powder for
Oral suspension 125mg/5ml
The sample solution of dry powder of samples we
made by liquefying appropriate amount of drugs
equivalent to 62.5 mg of Amoxicillin in 200 ml distilled
The Validation and Development of Analytical Technique for the Fast and Economical Evaluation of Amoxicillin in Solid Dosage form
Through UV/Visible Spectroscopy
ISSN (Print): 2521-8514 ISSN (Online): 2521-8484 9 RADS J. Pharm. Pharm. Sci.
9
water. Then filtered and required strength of
commercially available drugs was prepared with
buffer solution in similar fashion as done with
standards i.e., 12.5 μg/mL [15]. The optimized
situations of the proposed protocol and regression
calibration were accessible in Table 1 and Table 2.
UV-Vis. Spectrophotometer
Drug Solubility
Solubility of the drug was observed in double distilled
water [16].
Table 1. Optimized Conditions for the Proposed Method.
S/N Parameters Optimized condition
1 Quartz Cell Quartz Cell 1cm
2 Solvent (s) Double distilled water; Copper sulphate buffer solution
3 Concentration used 12.5 µg/ml (0.00125%)
4 Cell volume 1ml
5 Detection wavelength (ʎ) 320 nm UV/Vis Spectrophotometer
6 Temperature ambient
Table 2. Regression Study for the Calibration.
Sr. No. Considerations Optimized condition
1 Linearity-range (µg/mL) 10-15µg/ml
2 Correlation coefficient (r²) 0.999
R E S U L T S
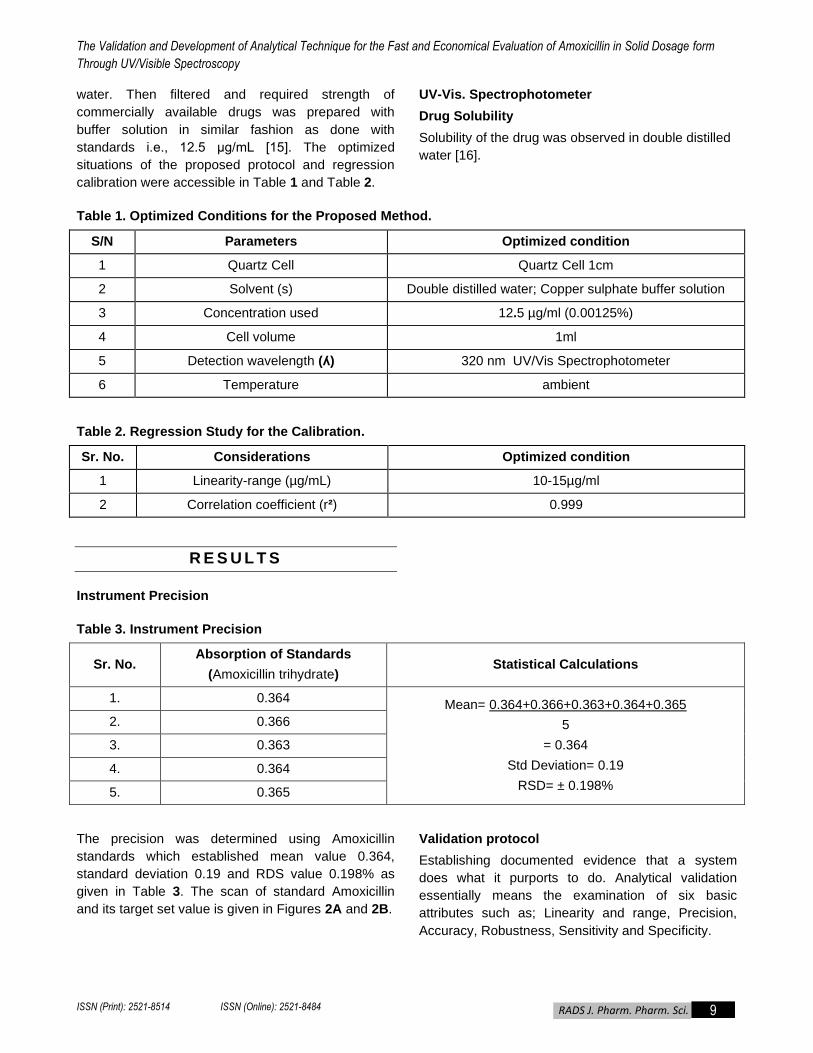
Instrument Precision
Table 3. Instrument Precision
Sr. No. Absorption of Standards
(Amoxicillin trihydrate) Statistical Calculations
1. 0.364 Mean= 0.364+0.366+0.363+0.364+0.365
5
= 0.364
Std Deviation= 0.19
RSD= ± 0.198%
2. 0.366
3. 0.363
4. 0.364
5. 0.365
The precision was determined using Amoxicillin
standards which established mean value 0.364,
standard deviation 0.19 and RDS value 0.198% as
given in Table 3. The scan of standard Amoxicillin
and its target set value is given in Figures 2A and 2B.
Validation protocol
Establishing documented evidence that a system
does what it purports to do. Analytical validation
essentially means the examination of six basic
attributes such as; Linearity and range, Precision,
Accuracy, Robustness, Sensitivity and Specificity.
The Validation and Development of Analytical Technique for the Fast and Economical Evaluation of Amoxicillin in Solid Dosage form
Through UV/Visible Spectroscopy
ISSN (Print): 2521-8514 ISSN (Online): 2521-8484 10 RADS J. Pharm. Pharm. Sci.
10
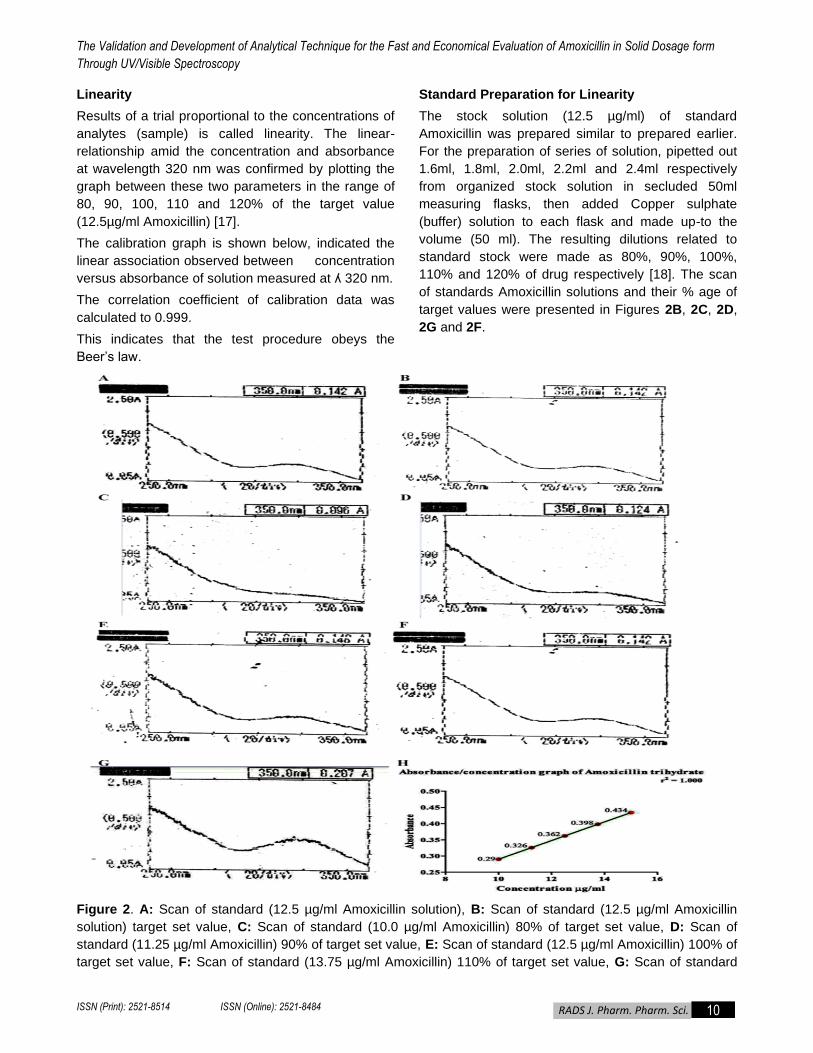
Linearity
Results of a trial proportional to the concentrations of
analytes (sample) is called linearity. The linear-
relationship amid the concentration and absorbance
at wavelength 320 nm was confirmed by plotting the
graph between these two parameters in the range of
80, 90, 100, 110 and 120% of the target value
(12.5µg/ml Amoxicillin) [17].
The calibration graph is shown below, indicated the
linear association observed between concentration
versus absorbance of solution measured at ʎ 320 nm.
The correlation coefficient of calibration data was
calculated to 0.999.
This indicates that the test procedure obeys the
Beer’s law.
Standard Preparation for Linearity
The stock solution (12.5 µg/ml) of standard
Amoxicillin was prepared similar to prepared earlier.
For the preparation of series of solution, pipetted out
1.6ml, 1.8ml, 2.0ml, 2.2ml and 2.4ml respectively
from organized stock solution in secluded 50ml
measuring flasks, then added Copper sulphate
(buffer) solution to each flask and made up-to the
volume (50 ml). The resulting dilutions related to
standard stock were made as 80%, 90%, 100%,
110% and 120% of drug respectively [18]. The scan
of standards Amoxicillin solutions and their % age of
target values were presented in Figures 2B, 2C, 2D,
2G and 2F.
Figure 2. A: Scan of standard (12.5 µg/ml Amoxicillin solution), B: Scan of standard (12.5 µg/ml Amoxicillin
solution) target set value, C: Scan of standard (10.0 µg/ml Amoxicillin) 80% of target set value, D: Scan of
standard (11.25 µg/ml Amoxicillin) 90% of target set value, E: Scan of standard (12.5 µg/ml Amoxicillin) 100% of
target set value, F: Scan of standard (13.75 µg/ml Amoxicillin) 110% of target set value, G: Scan of standard
The Validation and Development of Analytical Technique for the Fast and Economical Evaluation of Amoxicillin in Solid Dosage form
Through UV/Visible Spectroscopy
ISSN (Print): 2521-8514 ISSN (Online): 2521-8484 11 RADS J. Pharm. Pharm. Sci.
11
(15.0 µg/ml Amoxicillin) 120% of target set value, H: Linear Regression Line of Amoxicillin trihydrate
(Concentration vs absorbance).
Acceptance Criteria
Correlation Coefficient (r²) = -1 to +1
Table 4. Amoxicillin Trihydrate Concentration and Absorbance Relationship in Linear Regression.
Sr.# Volume of the
Solution (taken)
%age Conc. of
Target Value
Concentration
(µg/ml)
Absorbance of the test
solution.
1 1.6ml 80% 10.0 µg /ml 0.290
2 1.8ml 90% 11.25 µg/ml 0.326
3 2.0ml 100% 12.5 µg/ml 0.362
4 2.2ml 110% 13.75 µg/ml 0.398
5 2.4ml 120% 15.0 µg/ml 0.434
It is cleared from the calibration chart that linear
relationship existed and followed the Beer’s Law
between absorbance and the concentration of analyte
presented in Table 4 and illustrated in Figure 2H.
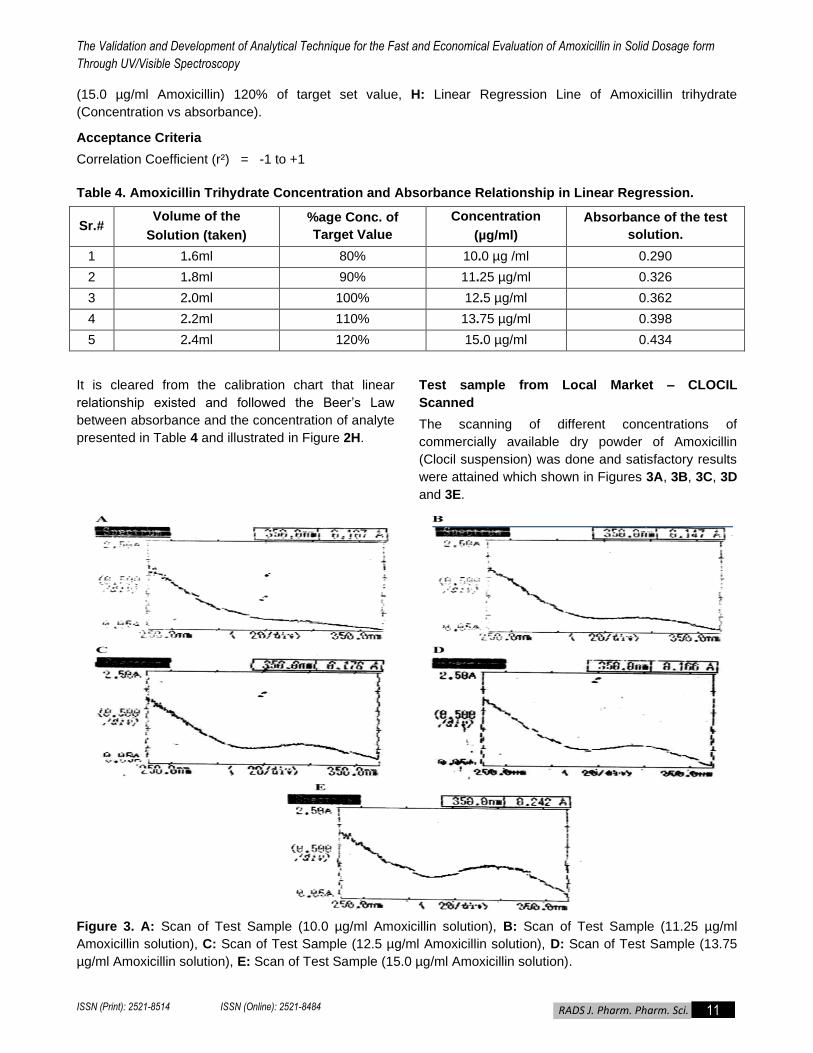
Test sample from Local Market – CLOCIL
Scanned
The scanning of different concentrations of
commercially available dry powder of Amoxicillin
(Clocil suspension) was done and satisfactory results
were attained which shown in Figures 3A, 3B, 3C, 3D
and 3E.
Figure 3. A: Scan of Test Sample (10.0 µg/ml Amoxicillin solution), B: Scan of Test Sample (11.25 µg/ml
Amoxicillin solution), C: Scan of Test Sample (12.5 µg/ml Amoxicillin solution), D: Scan of Test Sample (13.75
µg/ml Amoxicillin solution), E: Scan of Test Sample (15.0 µg/ml Amoxicillin solution).
The Validation and Development of Analytical Technique for the Fast and Economical Evaluation of Amoxicillin in Solid Dosage form
Through UV/Visible Spectroscopy
ISSN (Print): 2521-8514 ISSN (Online): 2521-8484 12 RADS J. Pharm. Pharm. Sci.
12
Acceptance Criteria
The interval between upper and lower concentration
of analyte in analytical procedure has appropriate
level of accuracy, precision, and linearity [19]. The %
age relative SD of triplicates obtained at each level
(80 %, 100 %, 120 %). NMT 2.0 % ± RSD.
Procedure
The range 80 % to 120 % is when the accuracy,
precision and linearity 80% and 120% are
established, % age RSD of triplicates at each level
(80 %, 100 %, 120 %) is < 2.0 % and average of
triplicate values obtained at each level (80 %, 100 %,
120 %).
Hence, the range from 80% to 120% is established.
Precision
Precision is the degree of how close the individual
test results to the replicates of same analyte sample
under identical conditions [20].
Precision is commonly expressed as Relative
Standard-Deviation (Coefficient of variation).
Precision is performed through;
a - Repeatability
b- Reproducibility.
Sample Stock Solution (12.5 µg/ml)
Weighed accurately 1.0417 g of sample powder
equivalent to 62.5 mg of Amoxicillin in 200 ml
measuring-flask and dissolved in 180 mL of double
distilled water then diluted to 200 ml by means of
same solvent and shaken well to mix. Filtered and
discarded first portion of filtrate while remaining part
was collected as stock solution. Diluted 2.0 ml stock-
solution up-to 50 ml with Copper sulphate buffer.
Heated in waterbath for half an hour (70˚C) and then
cooled to room temperature.
Repeatability
Assay was performed on three separate samples in
02 replicates.
Concentration of Reference: 12.5 µg/ml
Wavelength: 320nm
Absorbance of the Reference: 0.363
Table 5. Results of Repeatability.
Samples
Repeatability Results
Concentration of analyte
(µg/ml) Absorbance %age Results
Variation from
Theoretical Results
I
1 12.5 0.364 100.27% 0.27%
2 12.5 0.362 99.72% 0.28%
3 12.5 0.365 100.55% 0.55%
II
4 12.5 0.361 99.44% 0.66%
5 12.5 0.366 100.82% 0.82%
6 12.5 0.364 100.27% 0.27%
Average of 6 Results: 100.17%
Standard Deviation: 0.469
%RSD: 0.47%
RSD of 6 Results is: 100.17 ± 0.47% (Limit: NMT
2%). The results in the tabulation form presented in
Table 5.
Reproducibility
The utilization of analytical procedure by different
analyst within the same laboratory is referred
reproducibility. Assay is performed on three separate
samples in each case. The significant reproducibility
facts revealed in Table 6.
a) Reproducibility
Concentration of Reference: 12.5 µg/ml
Wavelength: 320 nm
Absorbance of the Reference: 0.363
The Validation and Development of Analytical Technique for the Fast and Economical Evaluation of Amoxicillin in Solid Dosage form
Through UV/Visible Spectroscopy
ISSN (Print): 2521-8514 ISSN (Online): 2521-8484 13 RADS J. Pharm. Pharm. Sci.
13
Table 6. The Response of Reproducibility.
Samples
Reproducibility Results
Concentration of
analyte (µg/ml) Absorbance %age Results
Variation from
Theoretical Results
1 12.5 0.362 99.72% 0.28%
2 12.5 0.364 100.27% 0.27%
3 12.5 0.365 100.55% 0.55%
Average of 3 Results: 100.18%
Standard Deviation: 0.344
% RSD: 0.34%
% RSD of 3 Results is: 100.18 ± 0.34% ((Limit: NMT
2%)
Accuracy
It is measure of faithfulness of the analytical
technique and its result value is close to the true
value. The method is said to be accurate if on the
average the method provides the true answer.
Accuracy implies there is no inherent systematic error
or bias - (bias is the deviation from true value). By
using the reference standard the accuracy of a
method can be measured and extent of bias that may
exist can also be determined.
Actually accuracy of an analytical process is the
closeness of test results attained specified protocol to
the factual value. It is evaluated by the addition of
known amounts of an analyte to the Placebo (sample)
with different quantities (3 x 3 replicates) and is
designed as the %age recovery of known added
amount of analyte to the Placebo.
Placebo
For this purpose three samples of about 200 g were
organized in the laboratory, as per to the
manufacturing route for the product, and quantities
equivalent to 80%, 100% and 120% of the labeled
amount of analyte were added to each placebo. Test
solutions were prepared of each concentration (i.e.
80%, 100% and 120%) assayed in duplicate and
tested according to the test procedure of the product
and results are to be tabulated in Table 7.
Concentrations of standards: 10 µg/mL, 12.5 µg/mL,
15 µg/mL
Wavelength: 320 nm
Absorbance of the reference standard 80% = 0.290
Absorbance of the reference standard 100% = 0.363
Absorbance of the reference standard 120%: 0.436
Table 7. The Variation of Theoretical and Claimed Placebo Concentration.
Contents of Active added
in Placebo
(% of Label claim)
80% 100% 120%
Sample1 Sample2 Sample-1 Sample-2 Sample1 Sample2
Abs. of the test sample 0.292 0.289 0.364 0.362 0.437 0.438
%age of label claim 100.68% 99.65% 100.27% 99.72% 100.22% 100.45%
Variation from theoretical
Results or difference 0.68% 0.35% 0.27% 0.28% 0.22% 0.45%
Average or % age Recovery 100.16% 99.99% 100.33%
Standard Deviation of
Variation from Theoretical
Results
± 0.51 ± 0.27 ± 0.11
The Validation and Development of Analytical Technique for the Fast and Economical Evaluation of Amoxicillin in Solid Dosage form
Through UV/Visible Spectroscopy
ISSN (Print): 2521-8514 ISSN (Online): 2521-8484 14 RADS J. Pharm. Pharm. Sci.
14
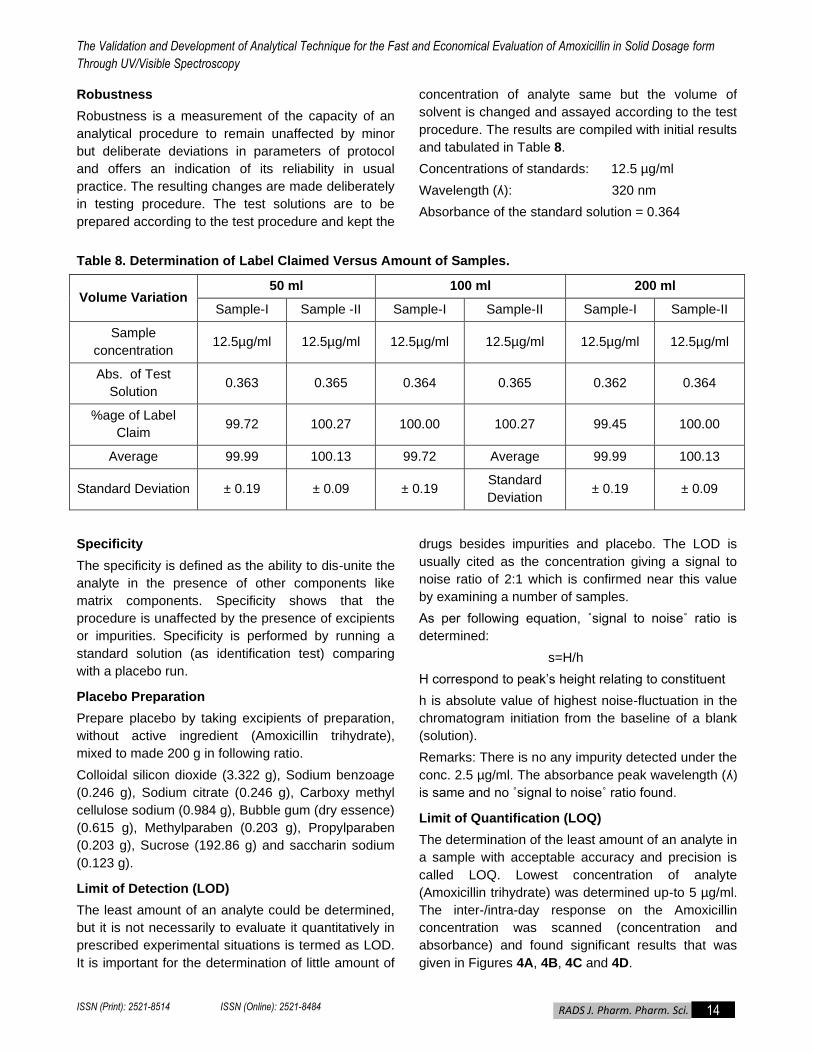
Robustness
Robustness is a measurement of the capacity of an
analytical procedure to remain unaffected by minor
but deliberate deviations in parameters of protocol
and offers an indication of its reliability in usual
practice. The resulting changes are made deliberately
in testing procedure. The test solutions are to be
prepared according to the test procedure and kept the
concentration of analyte same but the volume of
solvent is changed and assayed according to the test
procedure. The results are compiled with initial results
and tabulated in Table 8.
Concentrations of standards: 12.5 µg/ml
Wavelength (ʎ): 320 nm
Absorbance of the standard solution = 0.364
Table 8. Determination of Label Claimed Versus Amount of Samples.
Volume Variation 50 ml 100 ml 200 ml
Sample-I Sample -II Sample-I Sample-II Sample-I Sample-II
Sample
concentration 12.5µg/ml 12.5µg/ml 12.5µg/ml 12.5µg/ml 12.5µg/ml 12.5µg/ml
Abs. of Test
Solution 0.363 0.365 0.364 0.365 0.362 0.364
%age of Label
Claim 99.72 100.27 100.00 100.27 99.45 100.00
Average 99.99 100.13 99.72 Average 99.99 100.13
Standard Deviation ± 0.19 ± 0.09 ± 0.19 Standard
Deviation ± 0.19 ± 0.09
Specificity
The specificity is defined as the ability to dis-unite the
analyte in the presence of other components like
matrix components. Specificity shows that the
procedure is unaffected by the presence of excipients
or impurities. Specificity is performed by running a
standard solution (as identification test) comparing
with a placebo run.
Placebo Preparation
Prepare placebo by taking excipients of preparation,
without active ingredient (Amoxicillin trihydrate),
mixed to made 200 g in following ratio.
Colloidal silicon dioxide (3.322 g), Sodium benzoage
(0.246 g), Sodium citrate (0.246 g), Carboxy methyl
cellulose sodium (0.984 g), Bubble gum (dry essence)
(0.615 g), Methylparaben (0.203 g), Propylparaben
(0.203 g), Sucrose (192.86 g) and saccharin sodium
(0.123 g).
Limit of Detection (LOD)
The least amount of an analyte could be determined,
but it is not necessarily to evaluate it quantitatively in
prescribed experimental situations is termed as LOD.
It is important for the determination of little amount of
drugs besides impurities and placebo. The LOD is
usually cited as the concentration giving a signal to
noise ratio of 2:1 which is confirmed near this value
by examining a number of samples.
As per following equation, ˚signal to noise˚ ratio is
determined:
s=H/h
H correspond to peak’s height relating to constituent
h is absolute value of highest noise-fluctuation in the
chromatogram initiation from the baseline of a blank
(solution).
Remarks: There is no any impurity detected under the
conc. 2.5 µg/ml. The absorbance peak wavelength (ʎ)
is same and no ˚signal to noise˚ ratio found.
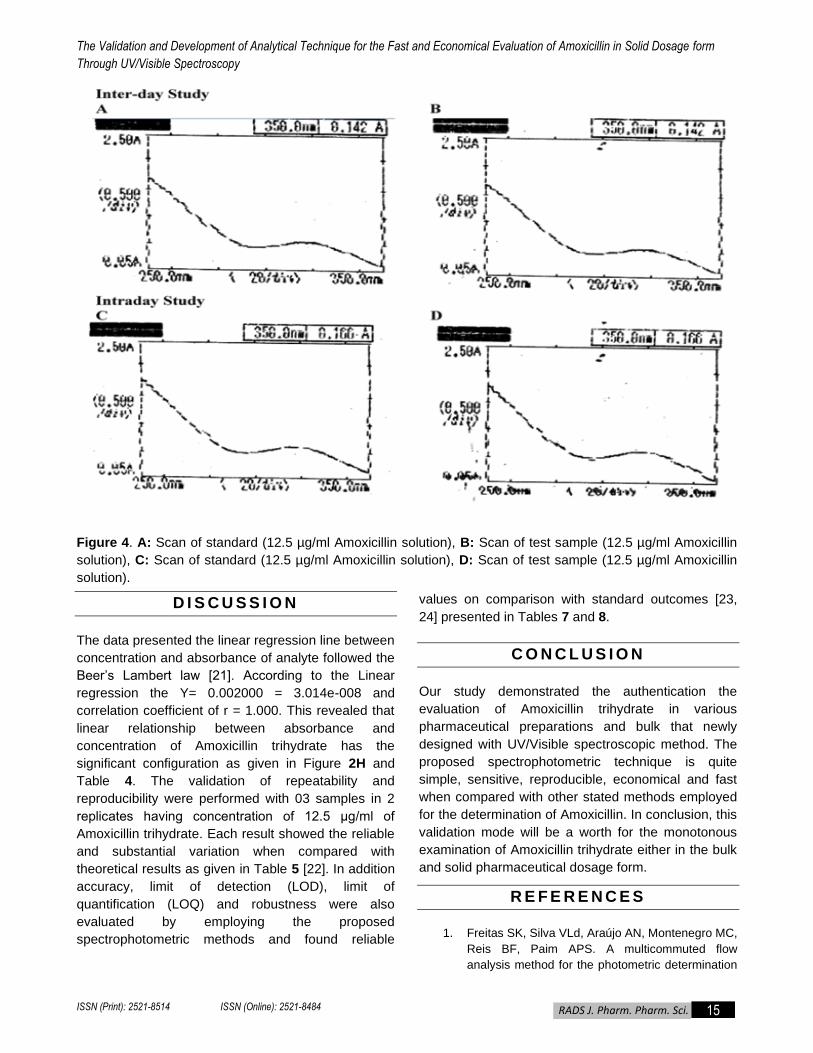
Limit of Quantification (LOQ)
The determination of the least amount of an analyte in
a sample with acceptable accuracy and precision is
called LOQ. Lowest concentration of analyte
(Amoxicillin trihydrate) was determined up-to 5 µg/ml.
The inter-/intra-day response on the Amoxicillin
concentration was scanned (concentration and
absorbance) and found significant results that was
given in Figures 4A, 4B, 4C and 4D.
The Validation and Development of Analytical Technique for the Fast and Economical Evaluation of Amoxicillin in Solid Dosage form
Through UV/Visible Spectroscopy
ISSN (Print): 2521-8514 ISSN (Online): 2521-8484 15 RADS J. Pharm. Pharm. Sci.
15
Figure 4. A: Scan of standard (12.5 µg/ml Amoxicillin solution), B: Scan of test sample (12.5 µg/ml Amoxicillin
solution), C: Scan of standard (12.5 µg/ml Amoxicillin solution), D: Scan of test sample (12.5 µg/ml Amoxicillin
solution).
D I S C U S S I O N
The data presented the linear regression line between
concentration and absorbance of analyte followed the
Beer’s Lambert law [21]. According to the Linear
regression the Y= 0.002000 = 3.014e-008 and
correlation coefficient of r = 1.000. This revealed that
linear relationship between absorbance and
concentration of Amoxicillin trihydrate has the
significant configuration as given in Figure 2H and
Table 4. The validation of repeatability and
reproducibility were performed with 03 samples in 2
replicates having concentration of 12.5 μg/ml of
Amoxicillin trihydrate. Each result showed the reliable
and substantial variation when compared with
theoretical results as given in Table 5 [22]. In addition
accuracy, limit of detection (LOD), limit of
quantification (LOQ) and robustness were also
evaluated by employing the proposed
spectrophotometric methods and found reliable
values on comparison with standard outcomes [23,
24] presented in Tables 7 and 8.
C O N C L U S I O N
Our study demonstrated the authentication the
evaluation of Amoxicillin trihydrate in various
pharmaceutical preparations and bulk that newly
designed with UV/Visible spectroscopic method. The
proposed spectrophotometric technique is quite
simple, sensitive, reproducible, economical and fast
when compared with other stated methods employed
for the determination of Amoxicillin. In conclusion, this
validation mode will be a worth for the monotonous
examination of Amoxicillin trihydrate either in the bulk
and solid pharmaceutical dosage form.
R E F E R E N C E S
1. Freitas SK, Silva VLd, Araújo AN, Montenegro MC,
Reis BF, Paim APS. A multicommuted flow
analysis method for the photometric determination
The Validation and Development of Analytical Technique for the Fast and Economical Evaluation of Amoxicillin in Solid Dosage form
Through UV/Visible Spectroscopy
ISSN (Print): 2521-8514 ISSN (Online): 2521-8484 16 RADS J. Pharm. Pharm. Sci.
16
of amoxicillin in pharmaceutical formulations using
a diazo coupling reaction. J. Braz. Chem. Soc.
2011; 22(2):279-85.
2. Qader HA, Fakhre NA. Spectrophotometric
determination of amoxicillin trihydrate in pure and
pharmaceutical dosage forms. Ibn Al Haitham J.
for Pure and Appl. Sci. 2017; 28(3):142-53.
3. Abdulameer SS, Al-Saidi KH. Simultaneous
determination of amoxicillin and potassium
clavulanate antibiotics in pharmacueutical sample
using derivative spectrophotometric method. J.
Biot. Res. C. 2011; 5(3):49-60.
4. Prakash K, Raju PN, Kumari KS, Narasu ML.
Spectrophotometric estimation of amoxicillin
trihydrate in bulk and pharmaceutical dosage form.
E- J. Chem. 2008; 5:40-45.
5. Santos SM, Roch J, Mafra L. NMR
crystallography: toward chemical shift-driven
crystal structure determination of the β-Lactam
antibiotic amoxicillin trihydrate. Cryst Growth Des.
2013; 13(6):2390-2395.
6. Chitlange SS, Tawargeri SR, Chaturvedi KK.
Simultaneous Determination of Amoxicillin
trihydrate and Ambroxol hydrochloride in solid
dosage form by spectrophotometric and stability
indicating RP-HPLC method. Asian J. Research
Chem. 2011; 4(6):1025-30.
7. Al-Abachi MQ, Hadi H. A developed
spectrophotometric determination of amoxicillin
forms via charge-transfer reaction with metol. Al-
Nahrain J. Sci. 2007; 10(2):1-6.
8. Gujral RS, Haque SM. Simultaneous determination
of potassium clavulanate and amoxicillin trihydrate
in bulk, pharmaceutical formulations and in human
urine samples by UV spectrophotometry. IJBS.
2010; 6(4):335.
9. Nikam DS, Bonde CG, Surana S, Venkateshwarlu
G, Dekate P. Development and validation of RP-
HPLC method for simultaneous estimation of
amoxicillin trihydrate and flucloxacillin sodium in
capsule dosage form. Int J Pharm Tech Res. 2009;
1(3):935-9.
10. Kowalczuk D, Galewska A. HPLC analysis of
amoxicillin using AccQ-Fluor reagent for pre-
column derivatization. Pol. J. Environ. Stud. 2012;
21(1):139-43.
11. Huong VT, Hoang VD. Simultaneous
determination of amoxicillin and clavulanate in
combined tablets by non-derivative and derivative
UV spectrophotometric techniques. Int J
PharmTech Res. 2009; 1:1173-81.
12. Fan J, Ho L, Hobson P, Brookes J. Evaluating the
effectiveness of copper sulphate, chlorine,
potassium permanganate, hydrogen peroxide and
ozone on cyanobacterial cell integrity. Water Res.
2013; 47(14):5153-64.
13. Dhoka M, Gawande V, Joshi P. HPTLC
determination of amoxicillin trihydrate and
bromhexine hydrochloride in oral solid dosage
forms. JPSR. 2010; 2(8):477.
14. Zhu, W, Yang J, Wang Z, Wang C, Liu y, Zhang L.
Rapid determination of 88 veterinary drug residues
in milk using automated TurborFlow online clean-
up mode coupled to liquid chromatography-tandem
mass spectrometry. Talanta. 2016; 148:401-411.
15. Mbinze JK, Mpasi JN, Maghe E, Kobo S, Mwanda
R Mulumba G, Hubert P. Application of Total Error
Strategy in Validation of Affordable and Accessible
UV-Visible Spectrophotometric Methods for Quality
Control of Poor Medicines. AJAC. 2015;
6(02):106-110.
16. Nikolov A, Nedyalkov N, Nikov R, Atanasov P,
Alexandrov M. Characterization of Ag and Au
nanoparticles created by nanosecond pulsed laser
ablation in double distilled water. Appl. Surf. Sci.
2011; 257(12):5278-5282.
17. Safarnejad A, Shaghaghi M, Dehghan G, Soltani
S. Binding of carvedilol to serum albumins
investigated by multi-spectroscopic and molecular
modeling methods. J Lumin. 2016; 176:149-158.
18. Beg S, Kohli K, Swain S, Hasnain MS.
Development and validation of RP-HPLC method
for quantitation of amoxicillin trihydrate in bulk and
pharmaceutical formulations using Box-Behnken
experimental design. J Liq Chromatogr R T. 2012;
35(3):393-406.
19. Ermer J, Ploss HJ. Validation in pharmaceutical
analysis: Part II: central importance of precision to
establish acceptance criteria and for verifying and
improving the quality of analytical data. J
Pharmaceut Biomed. 2005; 37(5):859-870.
20. Bryan CJ, Yeager DS, Brien JM. Replicator
degrees of freedom allow publication of misleading
failures to replicate. P Natl Acad Sci USA. 2019;
116(51):25535-25545.
21. Gobrecht A, Bendoula R, Roger JM, Bellon V.
Combining linear polarization spectroscopy and
the Representative Layer Theory to measure the
Beer-Lambert law absorbance of highly scattering
materias. Anal. Chim. Acta. 2015; 853:486-494.
22. Bartlett J, Frost C. Reliability, repeatability and
reproducibility: analysis of measurement errors in
continuous variables. Ultrasound in Obstetrics and
Gynecology: ISUOG. 2008; 31(4):466-75.
23. Saadati N, Abdullah MP, Zakaria Z, Sany SBT,
Rezayi M, Hassonizadeh H. Limit of detection and
The Validation and Development of Analytical Technique for the Fast and Economical Evaluation of Amoxicillin in Solid Dosage form
Through UV/Visible Spectroscopy
ISSN (Print): 2521-8514 ISSN (Online): 2521-8484 17 RADS J. Pharm. Pharm. Sci.
17
limit of quantification development procedures for
organochlorine pesticides analysis in water and
sediment matrices. Chem. Cent. J. 2013; 7(1):63.
24. Zhang H, Yu Y, Jiao J, Xing EP, Ghaoui LE,
Jordan MI. Theoretically principled trade-off
between robustness and accuracy. arXiv preprint
arXiv. 2019; 1901:8573-8580.
This is an Open Access article distributed under the terms of the Creative Commons Attribution License
(http://creativecommons.org/licenses/by/4.0), which permits unrestricted use, distribution, and reproduction in any medium, provided
the original work is properly cited.