Embed Size (px)
Citation preview

Slide1LabyrinthConsultingServices,Inc. artberman.com
October 2017 Oil & Gas Discussion
MacroVoices
Art Berman Labyrinth Consulting Services, Inc.
October 19, 2017
Slide2LabyrinthConsultingServices,Inc. artberman.com
NegativeCorrelationBetweenComparativeInventoryandWTIPrice
$60.01
$28.14
$50.18
117
239
200
213
74
-50
-25
0
25
50
75
100
125
150
175
200
225
250
275
$0
$5
$10
$15
$20
$25
$30
$35
$40
$45
$50
$55
$60
$65
$70
$75
$80
$85
$90
$95
$100
$105
$110
$115
Jun-14
Jul-1
4 Au
g-14
Sep-14
Oct-14
Nov-14
Dec-14
Jan-15
Feb-15
Mar-15
Apr-15
May-15
Jun-15
Jul-1
5 Au
g-15
Sep-15
Oct-15
Nov-15
Dec-15
Jan-16
Feb-16
Mar-16
Apr-16
May-16
Jun-16
Jul-1
6 Au
g-16
Sep-16
Oct-16
Nov-16
Dec-16
Jan-17
Feb-17
Mar-17
Apr-17
May-17
Jun-17
Jul-1
7 Au
g-17
Sep-17
Oct-17
CrudeOIil+RefinedProductsComparativeInventory(m
mb)
WTIPrice($/barrel)
LimitedPriceResponsetoMassiveCIReductionsin2017
Source:EIA&LabyrinthConsulting Services,Inc.
ComparativeInventory(RHS)
WTIPrice(LHS)
Feb-Oct-139mmb
Ap-Jul 2016-39mmb
Aug2016-Jan2017Undulating
Jun2015-Jul2016+121 mmb
-$32WTIFall$60- $28/barrel $55/barrel
$40/barrel
+$22WTIRise$28-$50/barrel
Limited PriceResponsetoMassiveCIReductionsin2017
GrowingRealization ThatPriceRecoveryTakesTime
1
2
• NegativeCorrelationBetweenComparativeInventoryandWTIPrice.• Mid-FebruaryCI~213mmb nearApril2016CIpeakof239mmb.• 139mmb decreaseinCIsincebyOctober.• Limitedpriceresponse.• Previouspriceresponsebasedonsentiment.• NegativecorrelationafterFeb2017stillgoodjustloweramplitude.
Slide3LabyrinthConsultingServices,Inc. artberman.com
$0
$5
$10
$15
$20
$25
$30
$35
$40
$45
$50
$55
$60
$65
$70
$75
$80
$85
$90
$95
$100
$105
$110
$115
-50 -40 -30 -20 -10 0 10 20 30 40 50 60 70 80 90 100 110 120 130 140 150 160 170 180 190 200 210 220 230 240 250
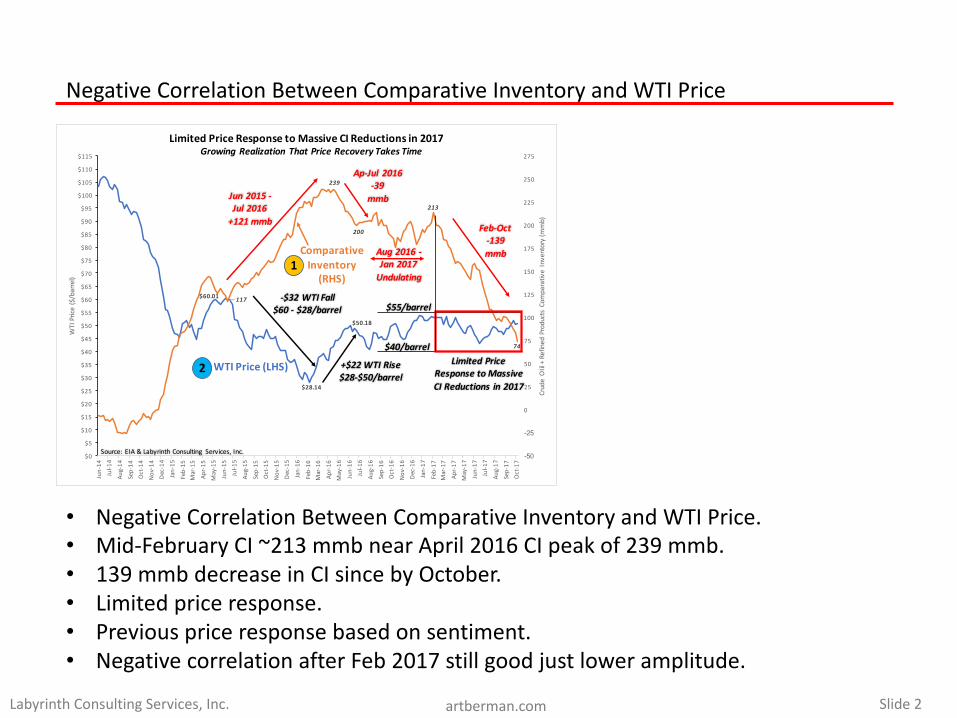
SentimentHasBeenLargelyRemovedFromOilPriceResponsetoCIReductionGrowingRealizationThatPriceRecoveryTakesTime
Comparative Inventory (C.I.)Millionsof Barrels
WTIPrice($/barrel)
Source:EIA&La
byrinthConsultingServices,Inc.
$40
$55
Mar-June 2015Optimism
2014-2017Data Mid-cycleprice
(5-yearaverage)
Late 2015-Early2016Pessimisim(Cushing >
80%Capacity)
OPEC ProductionCutOptimismOct13
Mid-Feb
139mmb
YieldCurve
74mmb
Price responsewill bemorepronouncedgoing forward
becauseofincreasingcurvatureoftheYieldCurve
1
2
ComparativeInventoryvs.WTIPriceYieldCurve
• Yieldcurveisnotamathematicalregressionbecausepriceexcursionsbasedonsentiment(bothpositiveandnegative)arenotbasedonsupply-demandfundamentals.
• Mid-cyclepriceiswhereyieldcurveintersectsy-axis(5-yearaverage).• Limitedpriceresponsein2017becauseofhugeinventoryoverhang.• MorecurvaturegoingforwardmeansgreaterpriceresponsetofallingCI.
Slide4LabyrinthConsultingServices,Inc. artberman.com
$0
$20
$40
$60
$80
$100
$120
800
850
900
950
1,000
1,050
1,100
1,150
1,200
1/1/10 1/1/11 1/1/12 1/1/13 1/1/14 1/1/15 1/1/16 1/1/17
WTIPrice($/barrel)
IvnetoriesofCrudeOil+Products(m
mb)
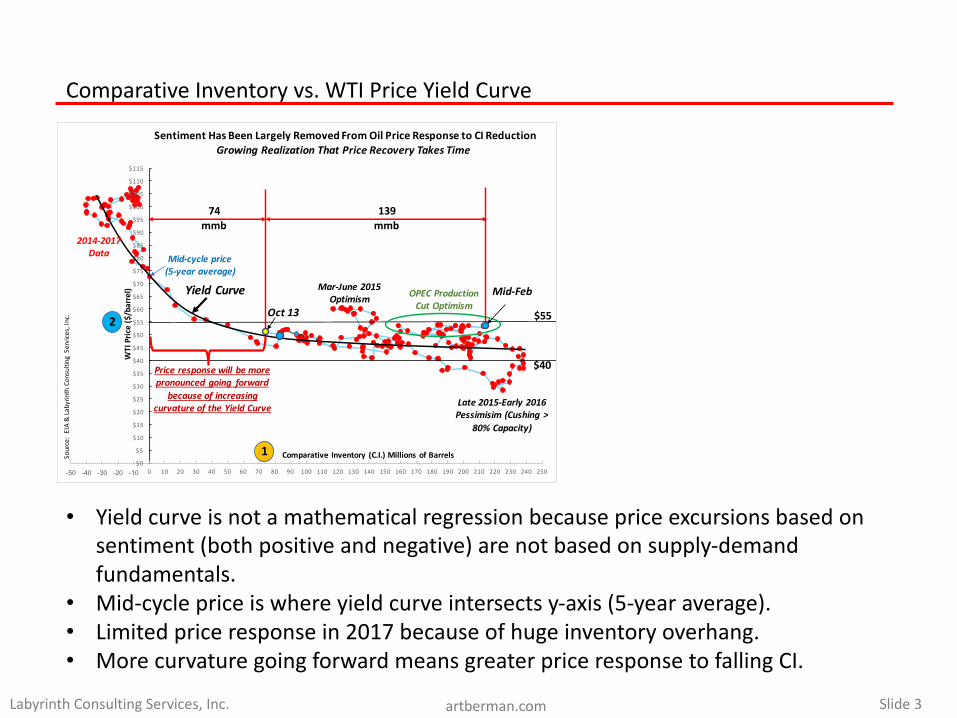
InventoriesHaveFallenFromRecordLevels--ComparativeInventory,TheDifferenceBetweenInventories&The5-YearAverage,RemainsNearRecordPre-2015Levels
Source:EIA &LabyrinthConsulting Services,Inc.
5-YearInventoryAverage(LHS)
WTIPrice(RHS)
Inventories(LHS)
99mmbGap
74mmbGap
RecordInventoryLevel
213mmbGap
1
2
• InventorybuildbeganinJanuary2014butpricecollapsedidnotbeginuntilJune.• Lowpriceandchangefrombackwardationtocontango inforwardcurvesfavored
storingratherthansellingoil.• 5-yearaveragehasrisenovertimeasstoragelevelsincreased.• Current74mmb gapbetweeninventoryand5-yearaveragestillnearhighof99
mmb in2011.
InventoryBuildupExplains2014Oil-PriceCollapse
Slide5LabyrinthConsultingServices,Inc. artberman.com
0
2
4
6
8
10
12
14
16
18
20
5
5.5
6
6.5
7
7.5
8
8.5
9
9.5
10
1/1/16
2/1/16
3/1/16
4/1/16
5/1/16
6/1/16
7/1/16
8/1/16
9/1/16
10/1/
16
11/1/
16
12/1/
16
1/1/17
2/1/17
3/1/17
4/1/17
5/1/17
6/1/17
7/1/17
8/1/17
9/1/17
10/1/
17
RefineryInput&
ImpliedStockChange(m
mb/d)
Production&NetIm
ports(m
mb/d)
RefineryIntakesHaveNotRecoveredAfterHurricaneHarvey;ProductionDropped1.1mmb/dWeekofOctober13
Production(LHS)
NetCrudeImports(LHS)
RefineryIntakes(RHS)
Source:EIA &LabyrinthConsulting Services,Inc.
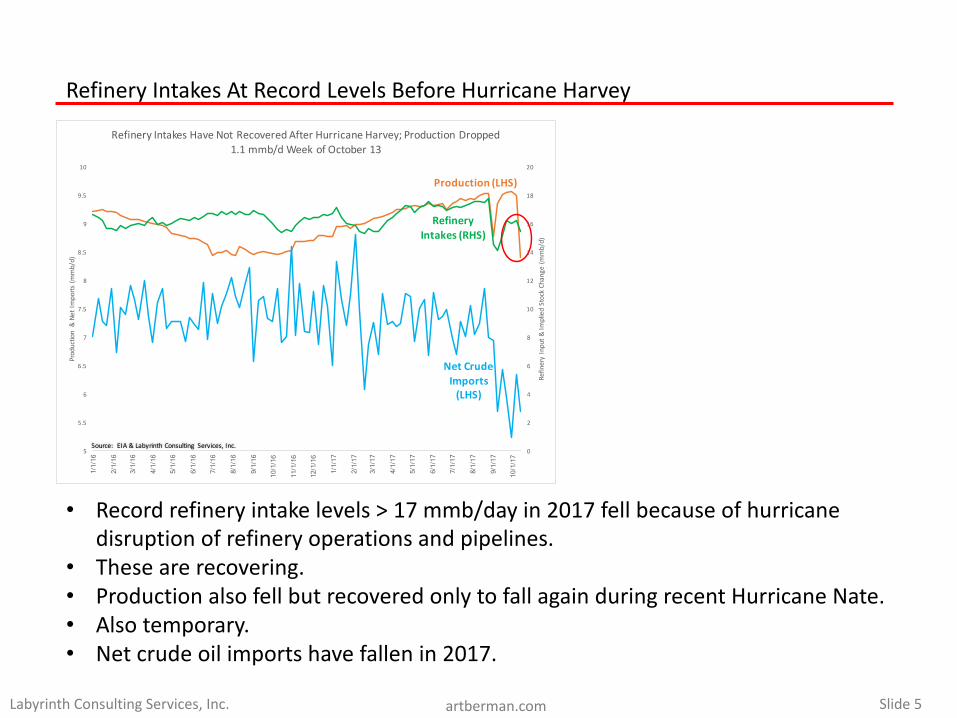
• Recordrefineryintakelevels>17mmb/dayin2017fellbecauseofhurricanedisruptionofrefineryoperationsandpipelines.
• Thesearerecovering.• ProductionalsofellbutrecoveredonlytofallagainduringrecentHurricaneNate.• Alsotemporary.• Netcrudeoilimportshavefallenin2017.
RefineryIntakesAtRecordLevelsBeforeHurricaneHarvey
Slide6LabyrinthConsultingServices,Inc. artberman.com
-100
-50
0
50
100
150
200
250
300
18.0
18.5
19.0
19.5
20.0
20.5
21.0
21.5
22.0
22.5
1/3/14
3/3/14
5/3/14
7/3/14
9/3/14
11/3/
14
1/3/15
3/3/15
5/3/15
7/3/15
9/3/15
11/3/
15
1/3/16
3/3/16
5/3/16
7/3/16
9/3/16
11/3/
16
1/3/17
3/3/17
5/3/17
7/3/17
9/3/17
CrudeOil+
RefinedProductsComparativeInventory(m
mb)
Csonum
ption(ProductSupplied)(m
mb/d)
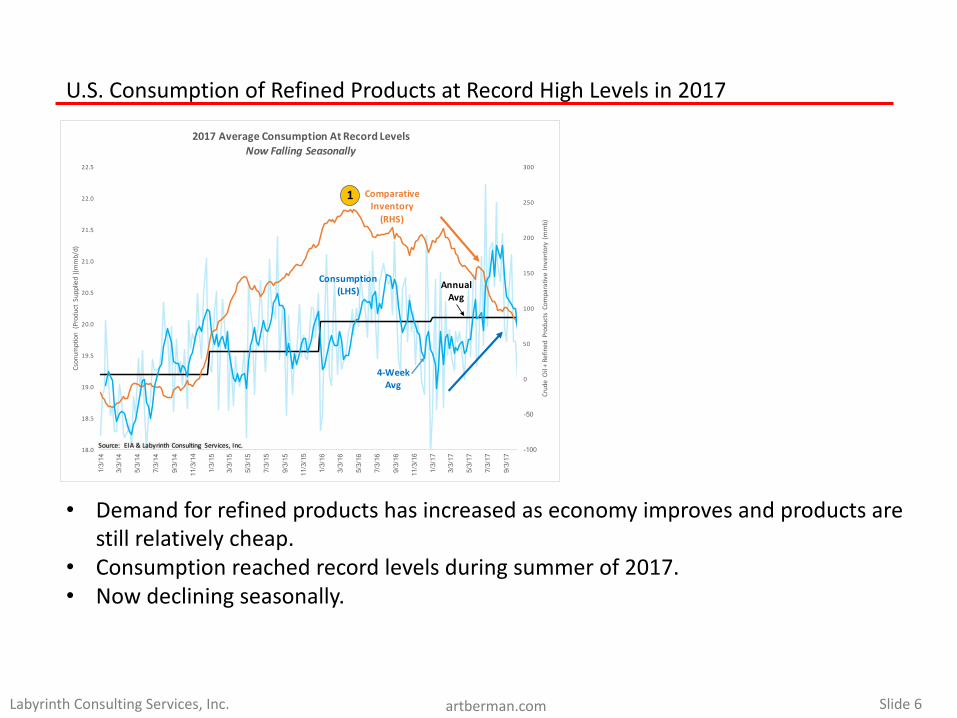
2017AverageConsumptionAtRecordLevelsNowFallingSeasonally
Consumption(LHS)
ComparativeInventory(RHS)
Source:EIA &LabyrinthConsulting Services,Inc.
4-WeekAvg
AnnualAvg
1
• Demandforrefinedproductshasincreasedaseconomyimprovesandproductsarestillrelativelycheap.
• Consumptionreachedrecordlevelsduringsummerof2017.• Nowdecliningseasonally.
U.S.ConsumptionofRefinedProductsatRecordHighLevelsin2017
Slide7LabyrinthConsultingServices,Inc. artberman.com
0
50
100
150
200
250
300
-4500
-4000
-3500
-3000
-2500
-2000
-1500
-1000
-500
0
1/1/16
1/1
5/16
1/29/1
6 2/1
2/16
2/26/1
6 3/1
1/16
3/25/1
6 4/8
/16
4/22/1
6 5/6
/16
5/20/1
6 6/3
/16
6/17/1
6 7/1
/16
7/15/1
6 7/2
9/16
8/12/1
6 8/2
6/16
9/9/16
9/2
3/16
10/7/
16
10/21
/16
11/4/
16
11/18
/16
12/2/
16
12/16
/16
12/30
/16
1/13/1
7 1/2
7/17
2/10/1
7 2/2
4/17
3/10/1
7 3/2
4/17
4/7/17
4/2
1/17
5/5/17
5/1
9/17
6/2/17
6/1
6/17
6/30/1
7 7/1
4/17
7/28/1
7 8/1
1/17
8/25/1
7 9/8
/17
9/22/1
7 10
/6/17
CrudeOIl+ProductsCom
parativeInventories(m
mb)
NetP
etroleum
ProductImports(m
mb/d)
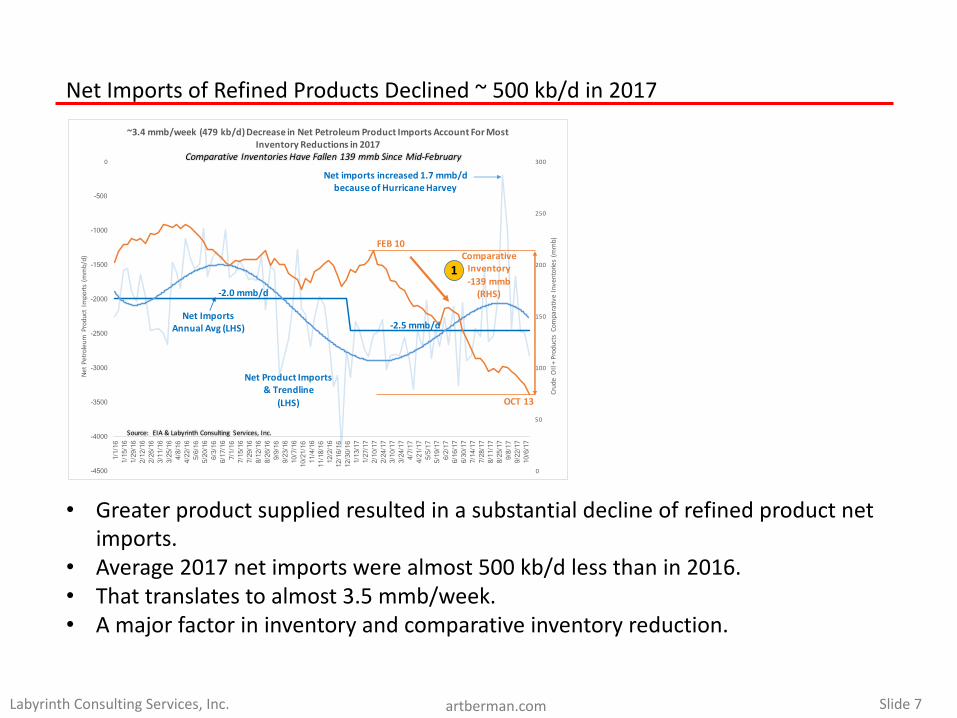
~3.4mmb/week(479kb/d)DecreaseinNetPetroleumProductImportsAccountForMostInventoryReductionsin2017
ComparativeInventory-139mmb(RHS)
NetImportsAnnual Avg(LHS)
NetProductImports&Trendline
(LHS)
-2.0mmb/d
-2.5mmb/d
Source:EIA &LabyrinthConsulting Services,Inc.
ComparativeInventoriesHaveFallen139mmbSinceMid-February
FEB10
OCT13
Netimportsincreased1.7mmb/dbecauseofHurricaneHarvey
1
• Greaterproductsuppliedresultedinasubstantialdeclineofrefinedproductnetimports.
• Average2017netimportswerealmost500kb/dlessthanin2016.• Thattranslatestoalmost3.5mmb/week.• Amajorfactorininventoryandcomparativeinventoryreduction.
NetImportsofRefinedProductsDeclined~500kb/din2017
Slide8LabyrinthConsultingServices,Inc. artberman.com
0
1
2
3
4
5
6
7
8
9
0
0.5
1
1.5
2
2.5
Jan-16
Feb-16
Mar-16
Apr-16
May-16
Jun-16
Jul-16
Aug-16
Sep-16
Oct-16
Nov-16
Dec-16
Jan-17
Feb-17
Mar-17
Apr-17
May-17
Jun-17
Jul-17
Aug-17
Sep-17
Oct-17
NetCrudeO
ilIm
ports(m
mb/d)
CrudeO
ilExports(m
mb/d)
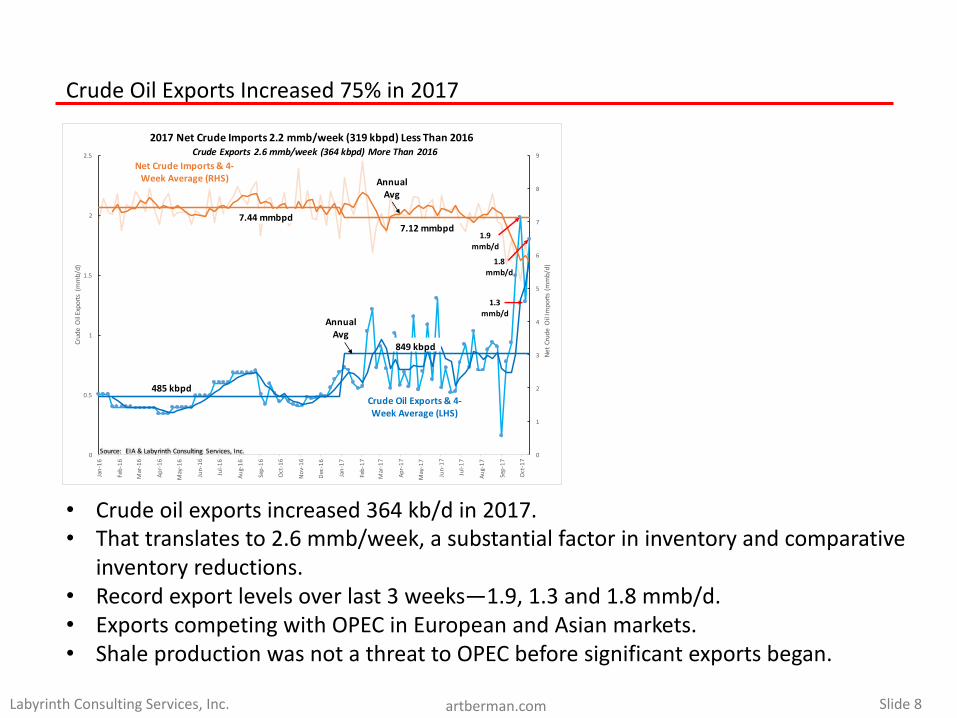
2017NetCrudeImports2.2mmb/week(319kbpd)LessThan2016
CrudeOilExports&4-
WeekAverage(LHS)
NetCrudeImports&4-
WeekAverage(RHS)
Source:EIA &LabyrinthConsulting Services,Inc.
Annual
Avg
Annual
Avg
849kbpd
485kbpd
7.44mmbpd
7.12mmbpd1.9
mmb/d
1.8
mmb/d
CrudeExports 2.6mmb/week(364kbpd)MoreThan2016
1.3
mmb/d
CrudeOilExportsIncreased75%in2017
• Crudeoilexportsincreased364kb/din2017.• Thattranslatesto2.6mmb/week,asubstantialfactorininventoryandcomparative
inventoryreductions.• Recordexportlevelsoverlast3weeks—1.9,1.3and1.8mmb/d.• ExportscompetingwithOPECinEuropeanandAsianmarkets.• ShaleproductionwasnotathreattoOPECbeforesignificantexportsbegan.
Slide9LabyrinthConsultingServices,Inc. artberman.com
-100
-50
0
50
100
150
200
250
300
350
400
1/1/16
2/1/16
3/1/16
4/1/16
5/1/16
6/1/16
7/1/16
8/1/16
9/1/16
10/1/
16
11/1/
16
12/1/
16
1/1/17
2/1/17
3/1/17
4/1/17
5/1/17
6/1/17
7/1/17
8/1/17
9/1/17
10/1/
17
Gasoline&Distilla
teCom
parativeInventory(m
mb)
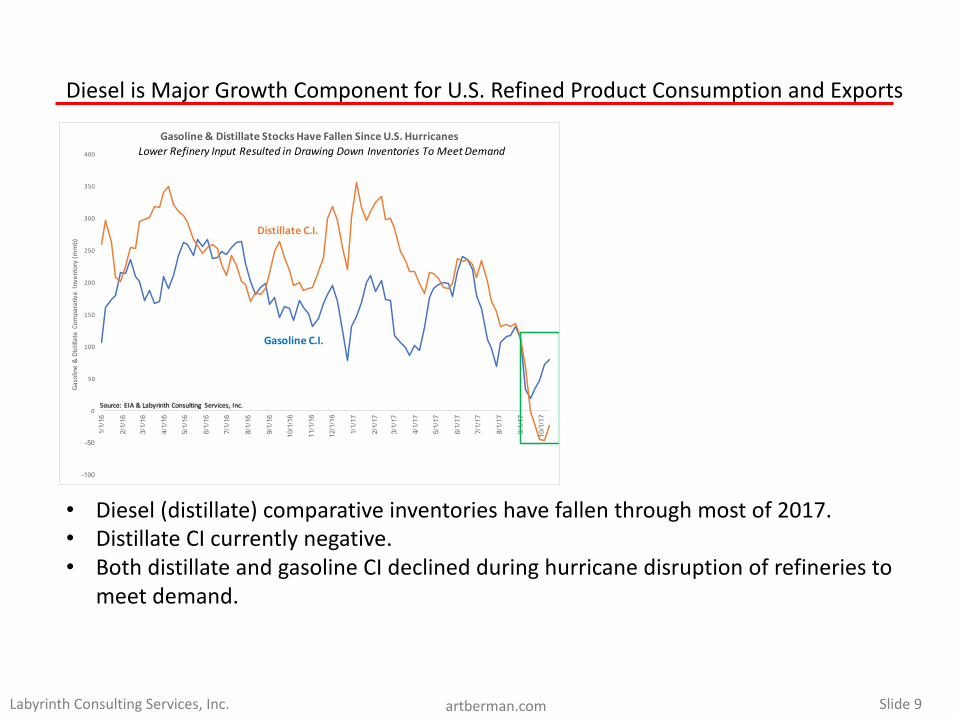
Gasoline&DistillateStocksHaveFallenSinceU.S.Hurricanes
Source:EIA&LabyrinthConsulting Services,Inc.
Gasoline C.I.
Distillate C.I.
LowerRefineryInputResultedinDrawingDownInventories ToMeetDemand
DieselisMajorGrowthComponentforU.S.RefinedProductConsumptionandExports
• Diesel(distillate)comparativeinventorieshavefallenthroughmostof2017.• DistillateCIcurrentlynegative.• BothdistillateandgasolineCIdeclinedduringhurricanedisruptionofrefineriesto
meetdemand.
Slide10LabyrinthConsultingServices,Inc. artberman.com
$44
$45
$46
$47
$48
$49
$50
$51
$52
$53
$54
Oct-17
Dec-17
Feb-18
Ap
r-18
Jun-18
Au
g-18
Oct-18
Dec-18
Feb-19
Ap
r-19
Jun-19
Au
g-19
Oct-19
Dec-19
Feb-20
Ap
r-20
Jun-20
Au
g-20
Oct-20
Dec-20
Feb-21
Ap
r-21
Jun-21
Au
g-21
Oct-21
Dec-21
Feb-22
Ap
r-22
Jun-22
Au
g-22
Oct-22
Dec-22
WTIFuturesPrice($/barrel)
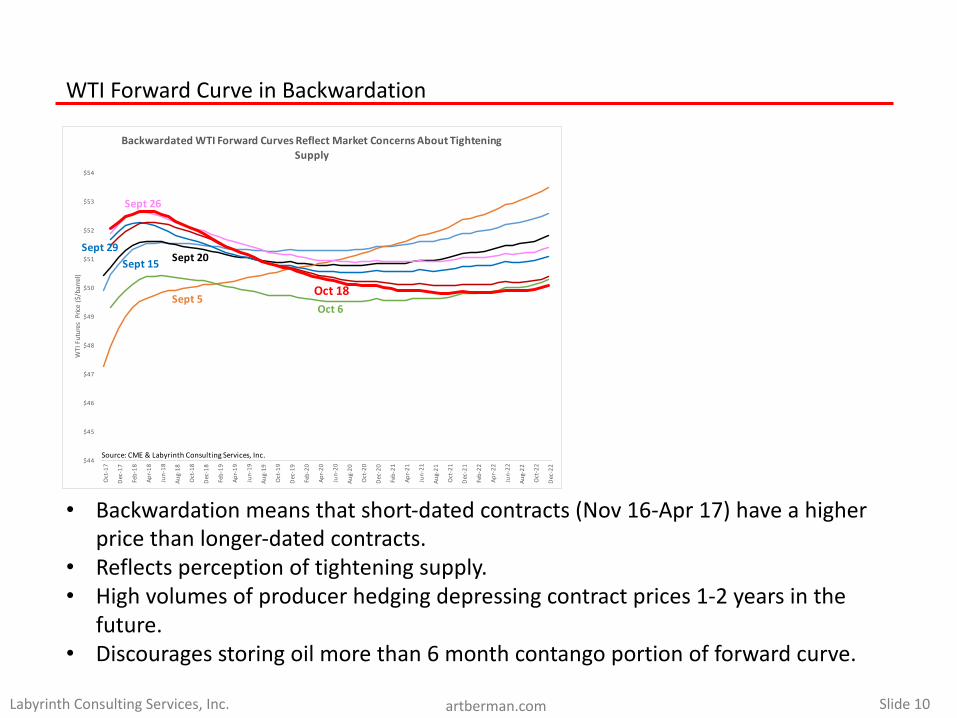
BackwardatedWTIForwardCurvesReflectMarketConcernsAboutTighteningSupply
Source:CME& LabyrinthConsultingServices,Inc.
Sept15 Sept20
Sept5
Sept26
Sept29
Oct6Oct18
WTIForwardCurveinBackwardation
• Backwardationmeansthatshort-datedcontracts(Nov16-Apr17)haveahigherpricethanlonger-datedcontracts.
• Reflectsperceptionoftighteningsupply.• Highvolumesofproducerhedgingdepressingcontractprices1-2yearsinthe
future.• Discouragesstoringoilmorethan6monthcontango portionofforwardcurve.
Slide11LabyrinthConsultingServices,Inc. artberman.com
0.00
-0.27
-1.56
-1.72
-2.25 -2.21
-1.72
-1.41
-1.07
-1.28
-1.08
50
50.5
51
51.5
52
52.5
53
53.5
54
54.5
-2.60
-2.40
-2.20
-2.00
-1.80
-1.60
-1.40
-1.20
-1.00
-0.80
-0.60
-0.40
-0.20
0.00
Nov-16
Dec-16
Jan-17
Feb-17
Mar-17
Apr-17
May-17
Jun-17
Jul-17
Aug-17
Sep-17
LiquidsProduction(m
mb/d)
LiquidsProductionComparedWithNovem
ber2016(m
mb/d)
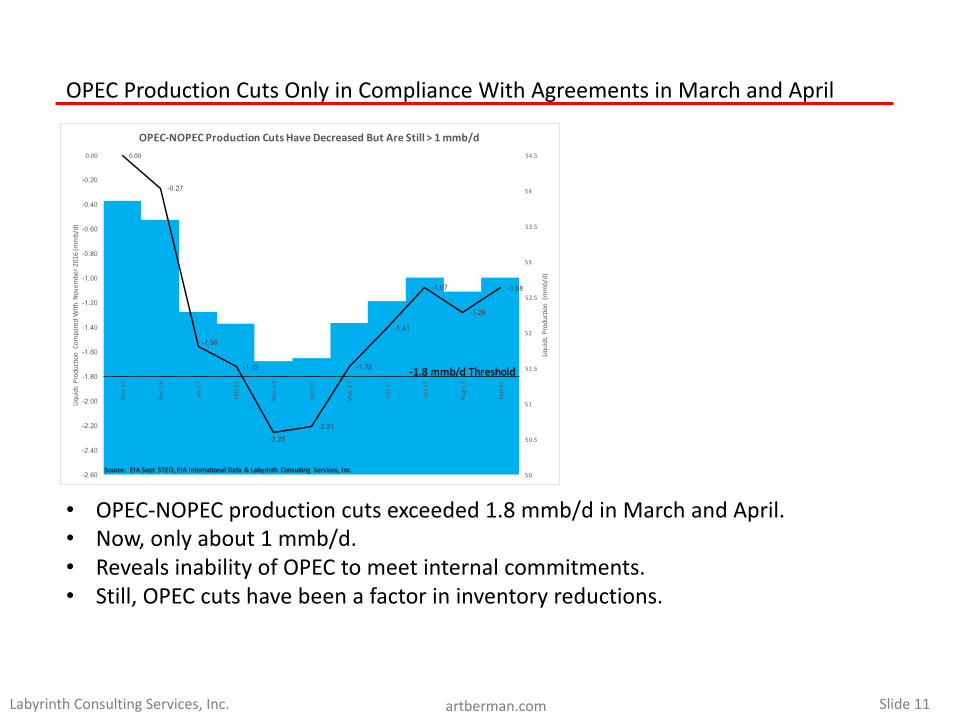
OPEC-NOPECProductionCutsHaveDecreasedButAreStill>1mmb/d
Source:EIASeptSTEO,EIAInternationalData&Labyrinth Consulting Services,Inc.
-1.8mmb/dThreshold
OPECProductionCutsOnlyinComplianceWithAgreementsinMarchandApril
• OPEC-NOPECproductioncutsexceeded1.8mmb/dinMarchandApril.• Now,onlyabout1mmb/d.• RevealsinabilityofOPECtomeetinternalcommitments.• Still,OPECcutshavebeenafactorininventoryreductions.
Slide12LabyrinthConsultingServices,Inc. artberman.com
0.50
0.40
0.40 0.50
0.30
1.30
0.80
0.80 0.85
1.59 1.
722.00
1.20
2.08
1.26
0.46
1.45
0.04 0.440.61
0.50
0.09
-0.90 -1.10 -1.80
-0.90 -1.60
-2.00 -0.70
-0.30 -0.60 -0.70 -0.70
-1.10 -2.10 -2.10
-0.60 -0.70
-1.60 -0.60
-0.50 -1.00
-0.24 -0.11
-0.54 -1.02
-0.02
-0.48 -0.22 -0.25
$0
$20
$40
$60
$80
$100
$120
$140
$160
-2.5
-2
-1.5
-1
-0.5
0
0.5
1
1.5
2
2.5
1Q06
2Q06
3Q06
4Q06
1Q07
2Q07
3Q07
4Q07
1Q08
2Q
083Q
08
4Q08
1Q
09
2Q09
3Q09
4Q09
1Q10
2Q10
3Q10
4Q10
1Q11
2Q11
3Q11
4Q11
1Q12
2Q12
3Q12
4Q12
1Q13
2Q13
3Q13
4Q13
1Q14
2Q14
3Q14
4Q14
1Q15
2Q15
3Q15
4Q15
1Q16
2Q16
3Q16
4Q16
Q11
7Q21
7Q31
7Q41
7Q11
8Q21
8Q31
8Q41
8
BrentPrice
(Decem
ber2016DollarsPerBarrel)
MarketBalance(S
upplyMinusDem
andmmb;d)
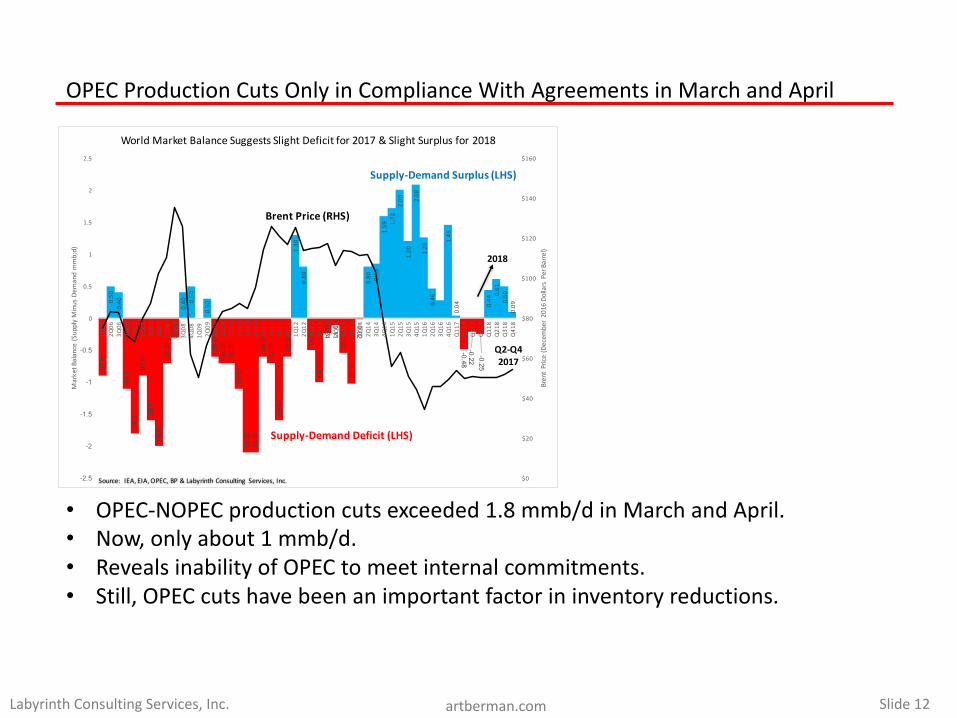
WorldMarketBalanceSuggestsSlightDeficitfor2017&SlightSurplusfor2018
BrentPrice(RHS)
Supply-Demand Surplus(LHS)
Supply-DemandDeficit(LHS)
Source:IEA,EIA,OPEC,BP&LabyrinthConsulting Services,Inc.
Q2-Q42017
2018
OPECProductionCutsOnlyinComplianceWithAgreementsinMarchandApril
• OPEC-NOPECproductioncutsexceeded1.8mmb/dinMarchandApril.• Now,onlyabout1mmb/d.• RevealsinabilityofOPECtomeetinternalcommitments.• Still,OPECcutshavebeenanimportantfactorininventoryreductions.
Slide13LabyrinthConsultingServices,Inc. artberman.com
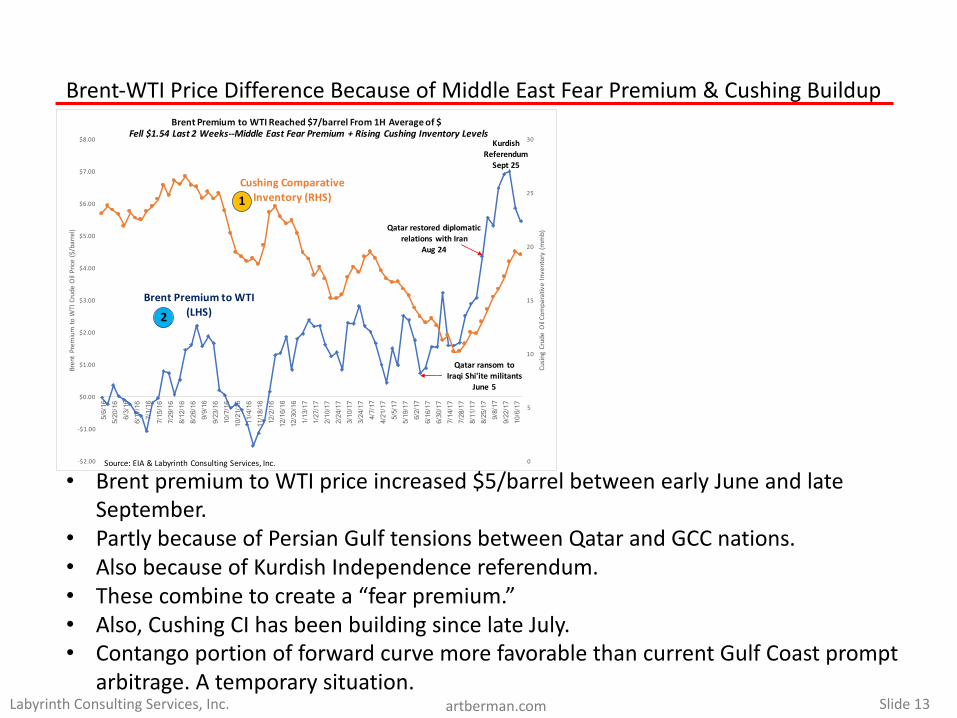
Brent-WTIPriceDifferenceBecauseofMiddleEastFearPremium&CushingBuildup
• BrentpremiumtoWTIpriceincreased$5/barrelbetweenearlyJuneandlateSeptember.
• PartlybecauseofPersianGulftensionsbetweenQatarandGCCnations.• AlsobecauseofKurdishIndependencereferendum.• Thesecombinetocreatea“fearpremium.”• Also,CushingCIhasbeenbuildingsincelateJuly.• Contango portionofforwardcurvemorefavorablethancurrentGulfCoastprompt
arbitrage.Atemporarysituation.
0
5
10
15
20
25
30
-$2.00
-$1.00
$0.00
$1.00
$2.00
$3.00
$4.00
$5.00
$6.00
$7.00
$8.00
5/6/16
5/2
0/16
6/3/16
6/1
7/16
7/1/16
7/1
5/16
7/29/1
6 8/1
2/16
8/26/1
6 9/9
/16
9/23/1
6 10
/7/16
10
/21/16
11
/4/16
11
/18/16
12
/2/16
12
/16/16
12
/30/16
1/1
3/17
1/27/1
7 2/1
0/17
2/24/1
7 3/1
0/17
3/24/1
7 4/7
/17
4/21/1
7 5/5
/17
5/19/1
7 6/2
/17
6/16/1
7 6/3
0/17
7/14/1
7 7/2
8/17
8/11/1
7 8/2
5/17
9/8/17
9/2
2/17
10/6/
17
CusingCrudeO
ilComparativeInventory(m
mb)
BrentPrem
iumtoWTICrudeOilPrice($/barrel)
BrentPremiumtoWTIReached$7/barrelFrom1HAverageof$
Qatar restoreddiplomatic
relationswithIran
Aug24
Qatar ransomto
IraqiShi'itemilitants
June5
Kurdish
Referendum
Sept25
Source:EIA&LabyrinthConsultingServices,Inc.
BrentPremiumtoWTI
(LHS)
Fell$1.54Last2Weeks--MiddleEastFearPremium+Rising CushingInventoryLevels
Cushing Comparative
Inventory(RHS)1
2