Embed Size (px)
Citation preview
Aon Benfield Analytics | Impact Forecasting
Risk. Reinsurance. Human Resources.
Global Catastrophe Recap October 2017
Aon Benfield Analytics | Impact Forecasting
Global Catastrophe Recap: October 2017 2
Table of Contents Executive Summary 3
United States 4
Remainder of North America 5
South America 5
Europe 6
Middle East 7
Africa 7
Asia 7
Oceania 8
Appendix 9
Contact Information 17

Aon Benfield Analytics | Impact Forecasting
Global Catastrophe Recap: October 2017 3
Executive Summary Historic wildfires leave record bill for insurers in the United States and Portugal
Three strong windstorms impact Europe in active beginning of the current season
Continuous rainfall and typhoons cause extensive flooding in Asia-Pacific region; death toll nears 150
A major wildfire outbreak erupted in portions of California starting during the month of October, killing at least 43 people and injuring 185 others. Nearly two-dozen fires were ignited as the blazes – notably the Central LNU Complex Fire around the town of Santa Rosa – would aggregate together as the most damaging event on record in the state. Data from CalFire indicated that nearly 9,300 structures were damaged, of which more than 8,560 were destroyed. The worst damage was noted in Napa, Sonoma, Mendocino, Lake, Solano, Butte, and Yuba counties. The California Department of Insurance cited that at least 19,000 residential, commercial and auto claims had already been filed with payouts exceeding USD3.32 billion. This total was expected to rise to as high as USD8.0 billion as additional claims are processed. On aggregated basis, this is costliest insured wildfire event ever recorded.
Another significant wildfire outbreak engulfed Central and Northern Portugal, killing at least 45 people. The fires swept through several districts, notably Coimbra, Viseu and Castelo Branco, causing significant property and commercial damage. The Portuguese Association of Insurers indicated that total insured losses were likely to reach EUR200 million (USD232 million), which would be the costliest event on record for the local industry. Additional fires caused at least four fatalities in Northwestern Spain.
An active beginning of this year’s European Windstorm season was marked by three notable storms. Windstorm Xavier impacted Northern Germany and Western Poland, prompting moderate damage and causing at least seven fatalities. The extratropical remnants of Ophelia, the easternmost Atlantic major hurricane (Category 3+) on record, hit the British Isles in mid-October. Finally, Windstorm Herwart swept through Central Europe, causing at least 10 deaths and hundreds of millions (USD) in claims payouts.
Super Typhoon Lan caused extensive damage in Philippines and in Japan with powerful winds and torrential rainfall. Total economic losses in Japan were likely to exceed USD1.0 billion. Shortly before Lan, Typhoon Khanun made landfall in southern China.
Hurricane Nate impacted Central America in early October, causing at least 46 deaths and extensive material losses. The storm later caused minor damage in U.S. Gulf and Mid-Atlantic states.
Continuous rainfall prompted widespread flooding in China, Thailand and Vietnam, where at least 98 fatalities were reported. At least 121,000 of homes were affected by flooding in Thailand alone.
Flooding in southern Norway became one of the costliest events for the local industry in recent years. Additional flooding ensued in Queensland, Australia after powerful thunderstorms impacted the region in mid-October.
Multiple severe weather outbreaks affected the United States, primarily in central and eastern sections of the country. Total economic damage topped USD350 million. Also, the remnants of Tropical Storm Philippe combined with a separate system to bring widespread damage in the U.S. and Canada.
Elsewhere, powerful thunderstorms prompted wind and flood damage in Gauteng and KwaZulu-Natal provinces in South Africa, causing notable losses to insurers.
Aon Benfield Analytics | Impact Forecasting
Global Catastrophe Recap: October 2017 4
United States Date Event Location Deaths Structures/
Claims Economic
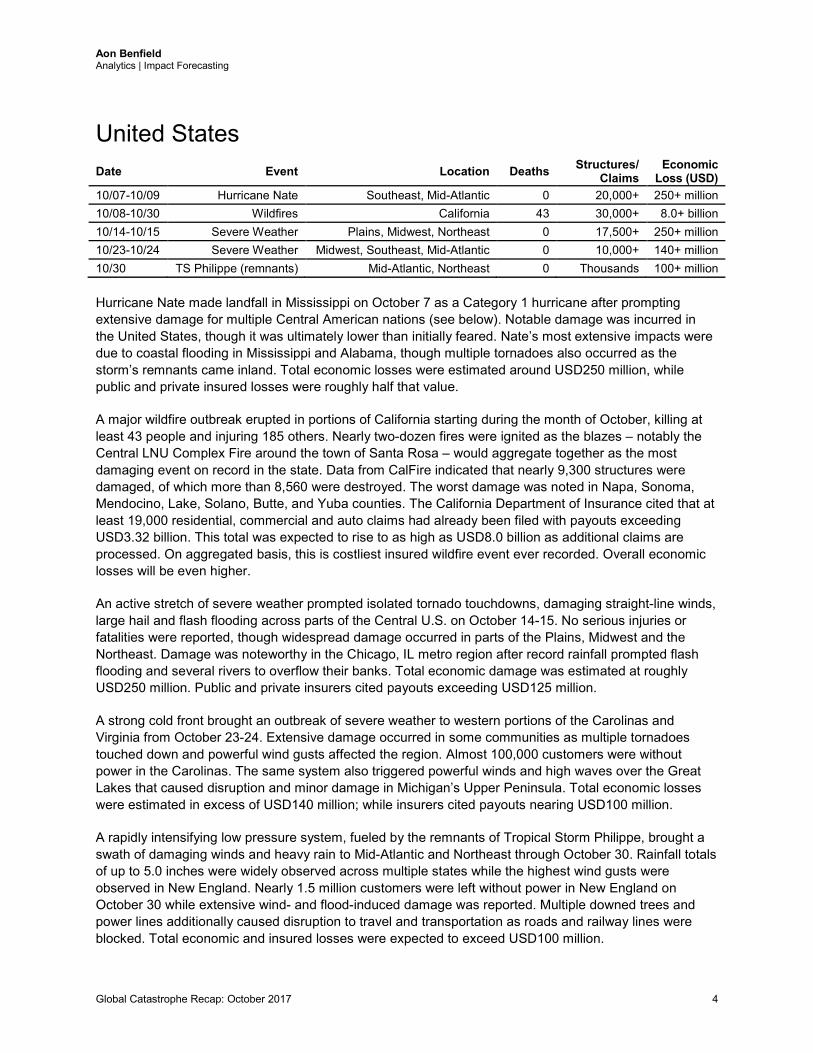
Loss (USD) 10/07-10/09 Hurricane Nate Southeast, Mid-Atlantic 0 20,000+ 250+ million 10/08-10/30 Wildfires California 43 30,000+ 8.0+ billion 10/14-10/15 Severe Weather Plains, Midwest, Northeast 0 17,500+ 250+ million 10/23-10/24 Severe Weather Midwest, Southeast, Mid-Atlantic 0 10,000+ 140+ million 10/30 TS Philippe (remnants) Mid-Atlantic, Northeast 0 Thousands 100+ million Hurricane Nate made landfall in Mississippi on October 7 as a Category 1 hurricane after prompting extensive damage for multiple Central American nations (see below). Notable damage was incurred in the United States, though it was ultimately lower than initially feared. Nate’s most extensive impacts were due to coastal flooding in Mississippi and Alabama, though multiple tornadoes also occurred as the storm’s remnants came inland. Total economic losses were estimated around USD250 million, while public and private insured losses were roughly half that value.
A major wildfire outbreak erupted in portions of California starting during the month of October, killing at least 43 people and injuring 185 others. Nearly two-dozen fires were ignited as the blazes – notably the Central LNU Complex Fire around the town of Santa Rosa – would aggregate together as the most damaging event on record in the state. Data from CalFire indicated that nearly 9,300 structures were damaged, of which more than 8,560 were destroyed. The worst damage was noted in Napa, Sonoma, Mendocino, Lake, Solano, Butte, and Yuba counties. The California Department of Insurance cited that at least 19,000 residential, commercial and auto claims had already been filed with payouts exceeding USD3.32 billion. This total was expected to rise to as high as USD8.0 billion as additional claims are processed. On aggregated basis, this is costliest insured wildfire event ever recorded. Overall economic losses will be even higher.
An active stretch of severe weather prompted isolated tornado touchdowns, damaging straight-line winds, large hail and flash flooding across parts of the Central U.S. on October 14-15. No serious injuries or fatalities were reported, though widespread damage occurred in parts of the Plains, Midwest and the Northeast. Damage was noteworthy in the Chicago, IL metro region after record rainfall prompted flash flooding and several rivers to overflow their banks. Total economic damage was estimated at roughly USD250 million. Public and private insurers cited payouts exceeding USD125 million.
A strong cold front brought an outbreak of severe weather to western portions of the Carolinas and Virginia from October 23-24. Extensive damage occurred in some communities as multiple tornadoes touched down and powerful wind gusts affected the region. Almost 100,000 customers were without power in the Carolinas. The same system also triggered powerful winds and high waves over the Great Lakes that caused disruption and minor damage in Michigan’s Upper Peninsula. Total economic losses were estimated in excess of USD140 million; while insurers cited payouts nearing USD100 million.
A rapidly intensifying low pressure system, fueled by the remnants of Tropical Storm Philippe, brought a swath of damaging winds and heavy rain to Mid-Atlantic and Northeast through October 30. Rainfall totals of up to 5.0 inches were widely observed across multiple states while the highest wind gusts were observed in New England. Nearly 1.5 million customers were left without power in New England on October 30 while extensive wind- and flood-induced damage was reported. Multiple downed trees and power lines additionally caused disruption to travel and transportation as roads and railway lines were blocked. Total economic and insured losses were expected to exceed USD100 million.
Aon Benfield Analytics | Impact Forecasting
Global Catastrophe Recap: October 2017 5
Remainder of North America (Non-U.S.) Date Event Location Deaths Structures/
Claims Economic
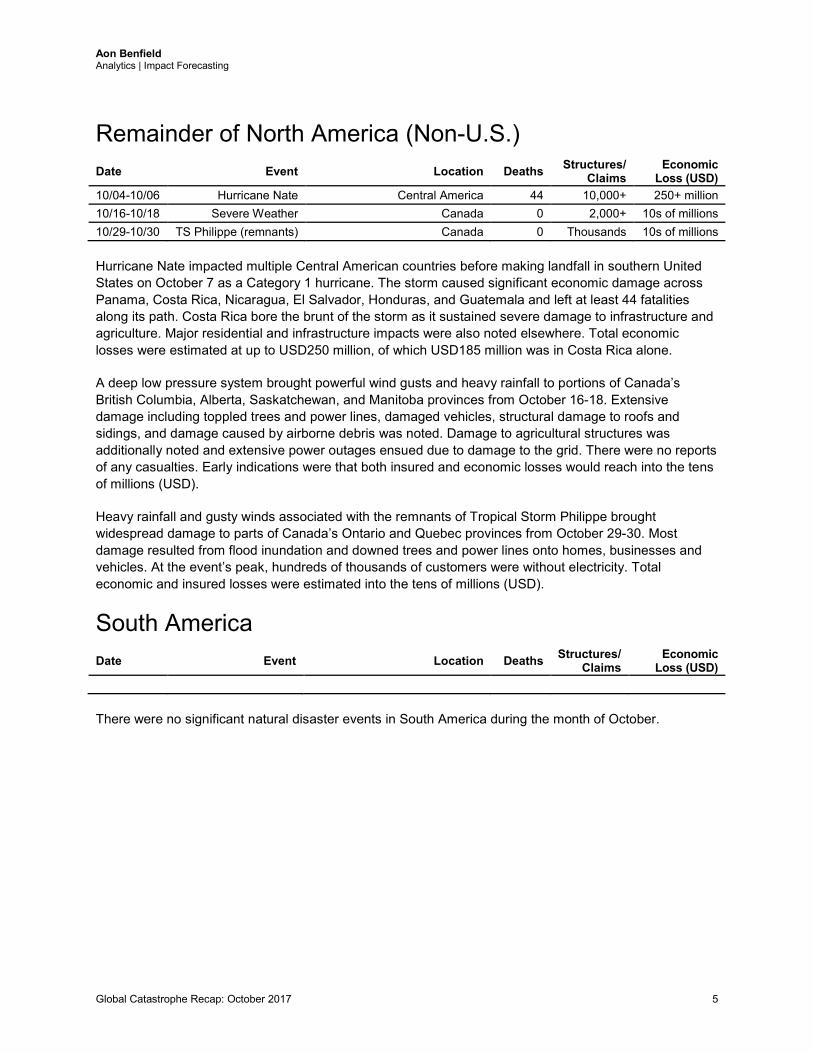
Loss (USD) 10/04-10/06 Hurricane Nate Central America 44 10,000+ 250+ million 10/16-10/18 Severe Weather Canada 0 2,000+ 10s of millions 10/29-10/30 TS Philippe (remnants) Canada 0 Thousands 10s of millions Hurricane Nate impacted multiple Central American countries before making landfall in southern United States on October 7 as a Category 1 hurricane. The storm caused significant economic damage across Panama, Costa Rica, Nicaragua, El Salvador, Honduras, and Guatemala and left at least 44 fatalities along its path. Costa Rica bore the brunt of the storm as it sustained severe damage to infrastructure and agriculture. Major residential and infrastructure impacts were also noted elsewhere. Total economic losses were estimated at up to USD250 million, of which USD185 million was in Costa Rica alone.
A deep low pressure system brought powerful wind gusts and heavy rainfall to portions of Canada’s British Columbia, Alberta, Saskatchewan, and Manitoba provinces from October 16-18. Extensive damage including toppled trees and power lines, damaged vehicles, structural damage to roofs and sidings, and damage caused by airborne debris was noted. Damage to agricultural structures was additionally noted and extensive power outages ensued due to damage to the grid. There were no reports of any casualties. Early indications were that both insured and economic losses would reach into the tens of millions (USD).
Heavy rainfall and gusty winds associated with the remnants of Tropical Storm Philippe brought widespread damage to parts of Canada’s Ontario and Quebec provinces from October 29-30. Most damage resulted from flood inundation and downed trees and power lines onto homes, businesses and vehicles. At the event’s peak, hundreds of thousands of customers were without electricity. Total economic and insured losses were estimated into the tens of millions (USD).
South America Date Event Location Deaths Structures/
Claims Economic
Loss (USD) There were no significant natural disaster events in South America during the month of October.
Aon Benfield Analytics | Impact Forecasting
Global Catastrophe Recap: October 2017 6
Europe Date Event Location Deaths Structures/
Claims Economic
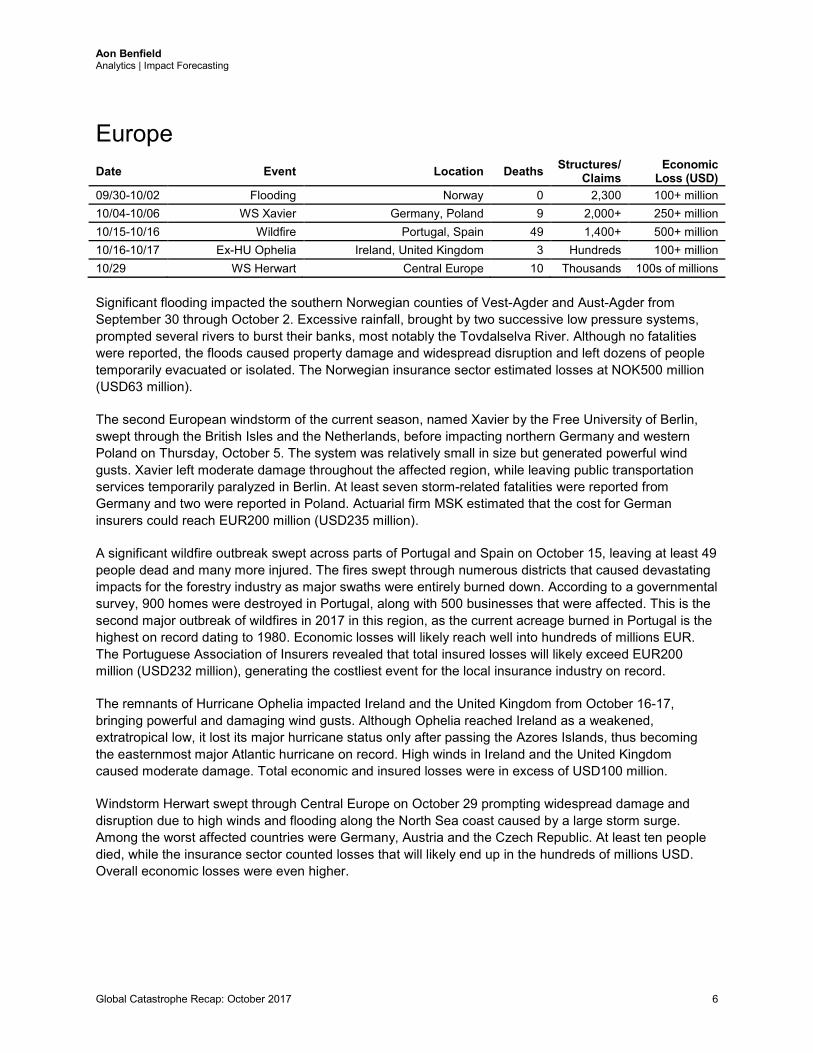
Loss (USD) 09/30-10/02 Flooding Norway 0 2,300 100+ million 10/04-10/06 WS Xavier Germany, Poland 9 2,000+ 250+ million 10/15-10/16 Wildfire Portugal, Spain 49 1,400+ 500+ million 10/16-10/17 Ex-HU Ophelia Ireland, United Kingdom 3 Hundreds 100+ million 10/29 WS Herwart Central Europe 10 Thousands 100s of millions Significant flooding impacted the southern Norwegian counties of Vest-Agder and Aust-Agder from September 30 through October 2. Excessive rainfall, brought by two successive low pressure systems, prompted several rivers to burst their banks, most notably the Tovdalselva River. Although no fatalities were reported, the floods caused property damage and widespread disruption and left dozens of people temporarily evacuated or isolated. The Norwegian insurance sector estimated losses at NOK500 million (USD63 million).
The second European windstorm of the current season, named Xavier by the Free University of Berlin, swept through the British Isles and the Netherlands, before impacting northern Germany and western Poland on Thursday, October 5. The system was relatively small in size but generated powerful wind gusts. Xavier left moderate damage throughout the affected region, while leaving public transportation services temporarily paralyzed in Berlin. At least seven storm-related fatalities were reported from Germany and two were reported in Poland. Actuarial firm MSK estimated that the cost for German insurers could reach EUR200 million (USD235 million).
A significant wildfire outbreak swept across parts of Portugal and Spain on October 15, leaving at least 49 people dead and many more injured. The fires swept through numerous districts that caused devastating impacts for the forestry industry as major swaths were entirely burned down. According to a governmental survey, 900 homes were destroyed in Portugal, along with 500 businesses that were affected. This is the second major outbreak of wildfires in 2017 in this region, as the current acreage burned in Portugal is the highest on record dating to 1980. Economic losses will likely reach well into hundreds of millions EUR. The Portuguese Association of Insurers revealed that total insured losses will likely exceed EUR200 million (USD232 million), generating the costliest event for the local insurance industry on record.
The remnants of Hurricane Ophelia impacted Ireland and the United Kingdom from October 16-17, bringing powerful and damaging wind gusts. Although Ophelia reached Ireland as a weakened, extratropical low, it lost its major hurricane status only after passing the Azores Islands, thus becoming the easternmost major Atlantic hurricane on record. High winds in Ireland and the United Kingdom caused moderate damage. Total economic and insured losses were in excess of USD100 million.
Windstorm Herwart swept through Central Europe on October 29 prompting widespread damage and disruption due to high winds and flooding along the North Sea coast caused by a large storm surge. Among the worst affected countries were Germany, Austria and the Czech Republic. At least ten people died, while the insurance sector counted losses that will likely end up in the hundreds of millions USD. Overall economic losses were even higher.
Aon Benfield Analytics | Impact Forecasting
Global Catastrophe Recap: October 2017 7
Middle East Date Event Location Deaths Structures/
Claims Economic
Loss (USD) There were no significant natural disaster events in Middle East during the month of October.
Africa Date Event Location Deaths Structures/
Claims Economic
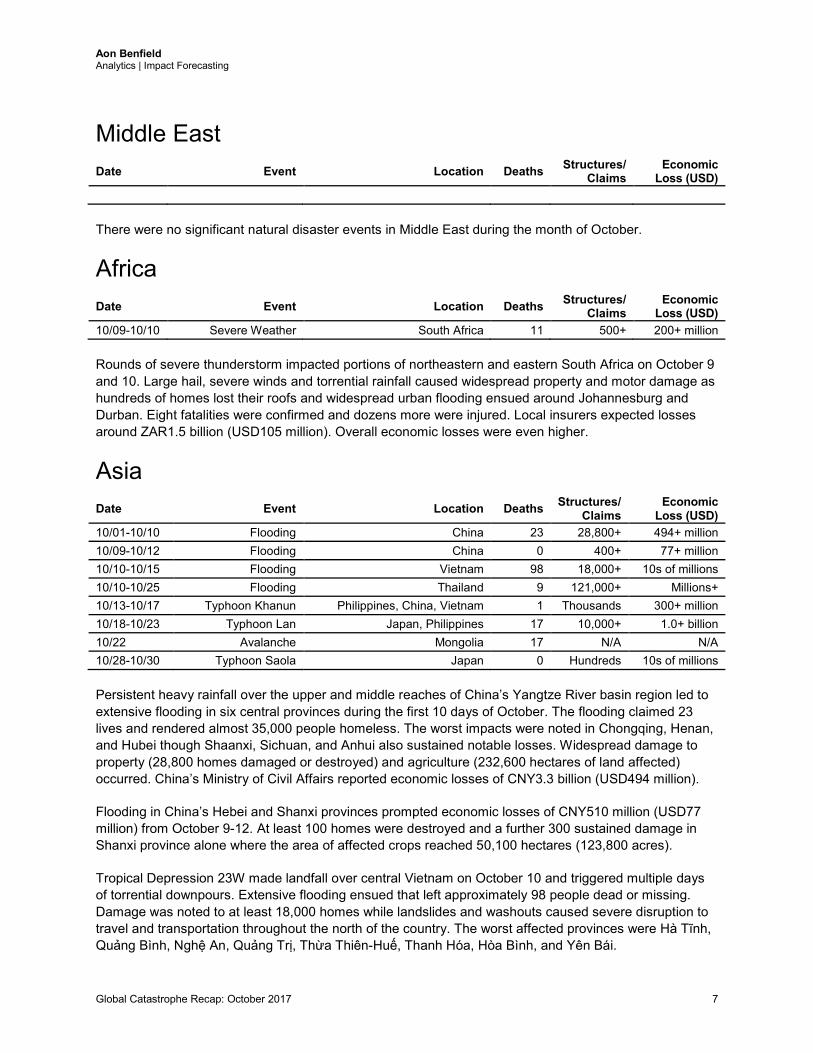
Loss (USD) 10/09-10/10 Severe Weather South Africa 11 500+ 200+ million Rounds of severe thunderstorm impacted portions of northeastern and eastern South Africa on October 9 and 10. Large hail, severe winds and torrential rainfall caused widespread property and motor damage as hundreds of homes lost their roofs and widespread urban flooding ensued around Johannesburg and Durban. Eight fatalities were confirmed and dozens more were injured. Local insurers expected losses around ZAR1.5 billion (USD105 million). Overall economic losses were even higher.
Asia Date Event Location Deaths Structures/
Claims Economic
Loss (USD) 10/01-10/10 Flooding China 23 28,800+ 494+ million 10/09-10/12 Flooding China 0 400+ 77+ million 10/10-10/15 Flooding Vietnam 98 18,000+ 10s of millions 10/10-10/25 Flooding Thailand 9 121,000+ Millions+ 10/13-10/17 Typhoon Khanun Philippines, China, Vietnam 1 Thousands 300+ million 10/18-10/23 Typhoon Lan Japan, Philippines 17 10,000+ 1.0+ billion 10/22 Avalanche Mongolia 17 N/A N/A 10/28-10/30 Typhoon Saola Japan 0 Hundreds 10s of millions Persistent heavy rainfall over the upper and middle reaches of China’s Yangtze River basin region led to extensive flooding in six central provinces during the first 10 days of October. The flooding claimed 23 lives and rendered almost 35,000 people homeless. The worst impacts were noted in Chongqing, Henan, and Hubei though Shaanxi, Sichuan, and Anhui also sustained notable losses. Widespread damage to property (28,800 homes damaged or destroyed) and agriculture (232,600 hectares of land affected) occurred. China’s Ministry of Civil Affairs reported economic losses of CNY3.3 billion (USD494 million).
Flooding in China’s Hebei and Shanxi provinces prompted economic losses of CNY510 million (USD77 million) from October 9-12. At least 100 homes were destroyed and a further 300 sustained damage in Shanxi province alone where the area of affected crops reached 50,100 hectares (123,800 acres).
Tropical Depression 23W made landfall over central Vietnam on October 10 and triggered multiple days of torrential downpours. Extensive flooding ensued that left approximately 98 people dead or missing. Damage was noted to at least 18,000 homes while landslides and washouts caused severe disruption to travel and transportation throughout the north of the country. The worst affected provinces were Hà Tĩnh, Quảng Bình, Nghệ An, Quảng Trị, Thừa Thiên-Huế, Thanh Hóa, Hòa Bình, and Yên Bái.
Aon Benfield Analytics | Impact Forecasting
Global Catastrophe Recap: October 2017 8
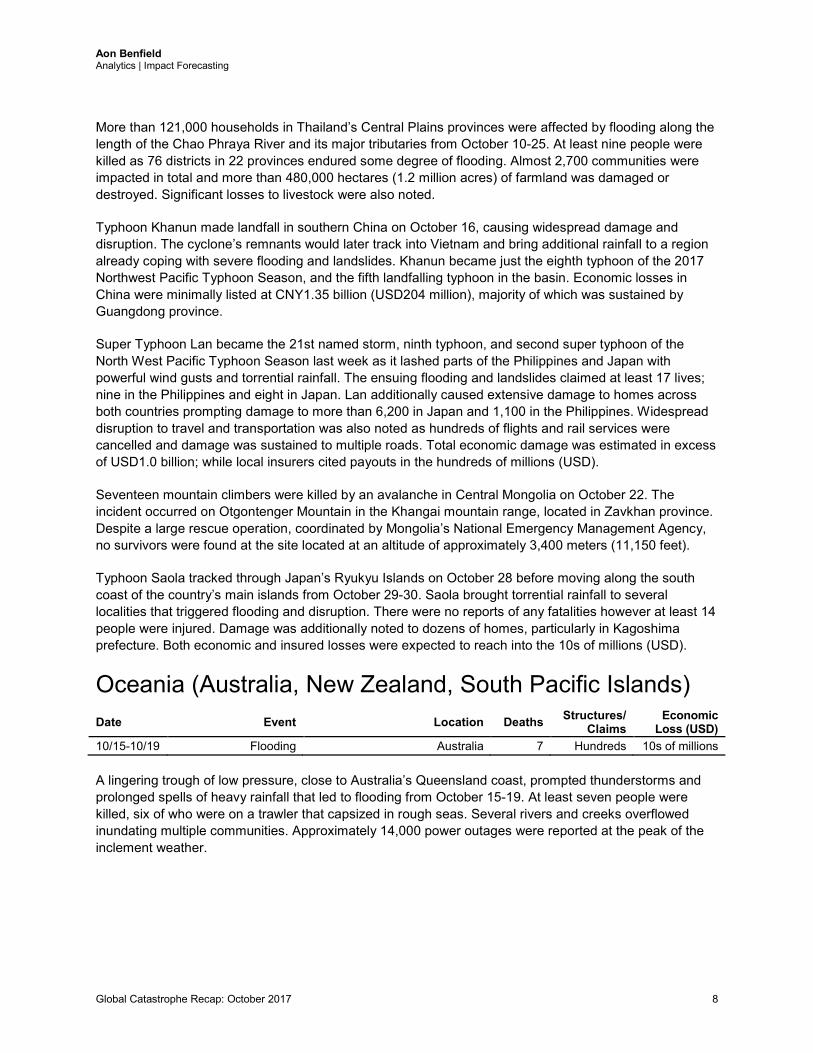
More than 121,000 households in Thailand’s Central Plains provinces were affected by flooding along the length of the Chao Phraya River and its major tributaries from October 10-25. At least nine people were killed as 76 districts in 22 provinces endured some degree of flooding. Almost 2,700 communities were impacted in total and more than 480,000 hectares (1.2 million acres) of farmland was damaged or destroyed. Significant losses to livestock were also noted.
Typhoon Khanun made landfall in southern China on October 16, causing widespread damage and disruption. The cyclone’s remnants would later track into Vietnam and bring additional rainfall to a region already coping with severe flooding and landslides. Khanun became just the eighth typhoon of the 2017 Northwest Pacific Typhoon Season, and the fifth landfalling typhoon in the basin. Economic losses in China were minimally listed at CNY1.35 billion (USD204 million), majority of which was sustained by Guangdong province.
Super Typhoon Lan became the 21st named storm, ninth typhoon, and second super typhoon of the North West Pacific Typhoon Season last week as it lashed parts of the Philippines and Japan with powerful wind gusts and torrential rainfall. The ensuing flooding and landslides claimed at least 17 lives; nine in the Philippines and eight in Japan. Lan additionally caused extensive damage to homes across both countries prompting damage to more than 6,200 in Japan and 1,100 in the Philippines. Widespread disruption to travel and transportation was also noted as hundreds of flights and rail services were cancelled and damage was sustained to multiple roads. Total economic damage was estimated in excess of USD1.0 billion; while local insurers cited payouts in the hundreds of millions (USD).
Seventeen mountain climbers were killed by an avalanche in Central Mongolia on October 22. The incident occurred on Otgontenger Mountain in the Khangai mountain range, located in Zavkhan province. Despite a large rescue operation, coordinated by Mongolia’s National Emergency Management Agency, no survivors were found at the site located at an altitude of approximately 3,400 meters (11,150 feet).
Typhoon Saola tracked through Japan’s Ryukyu Islands on October 28 before moving along the south coast of the country’s main islands from October 29-30. Saola brought torrential rainfall to several localities that triggered flooding and disruption. There were no reports of any fatalities however at least 14 people were injured. Damage was additionally noted to dozens of homes, particularly in Kagoshima prefecture. Both economic and insured losses were expected to reach into the 10s of millions (USD).
Oceania (Australia, New Zealand, South Pacific Islands) Date Event Location Deaths Structures/
Claims Economic
Loss (USD) 10/15-10/19 Flooding Australia 7 Hundreds 10s of millions A lingering trough of low pressure, close to Australia’s Queensland coast, prompted thunderstorms and prolonged spells of heavy rainfall that led to flooding from October 15-19. At least seven people were killed, six of who were on a trawler that capsized in rough seas. Several rivers and creeks overflowed inundating multiple communities. Approximately 14,000 power outages were reported at the peak of the inclement weather.
Aon Benfield Analytics | Impact Forecasting
Global Catastrophe Recap: October 2017 9
Appendix
Updated 2017 Data: January – September
United States
Date Event Location Deaths Structures/ Claims
Economic Loss (USD)
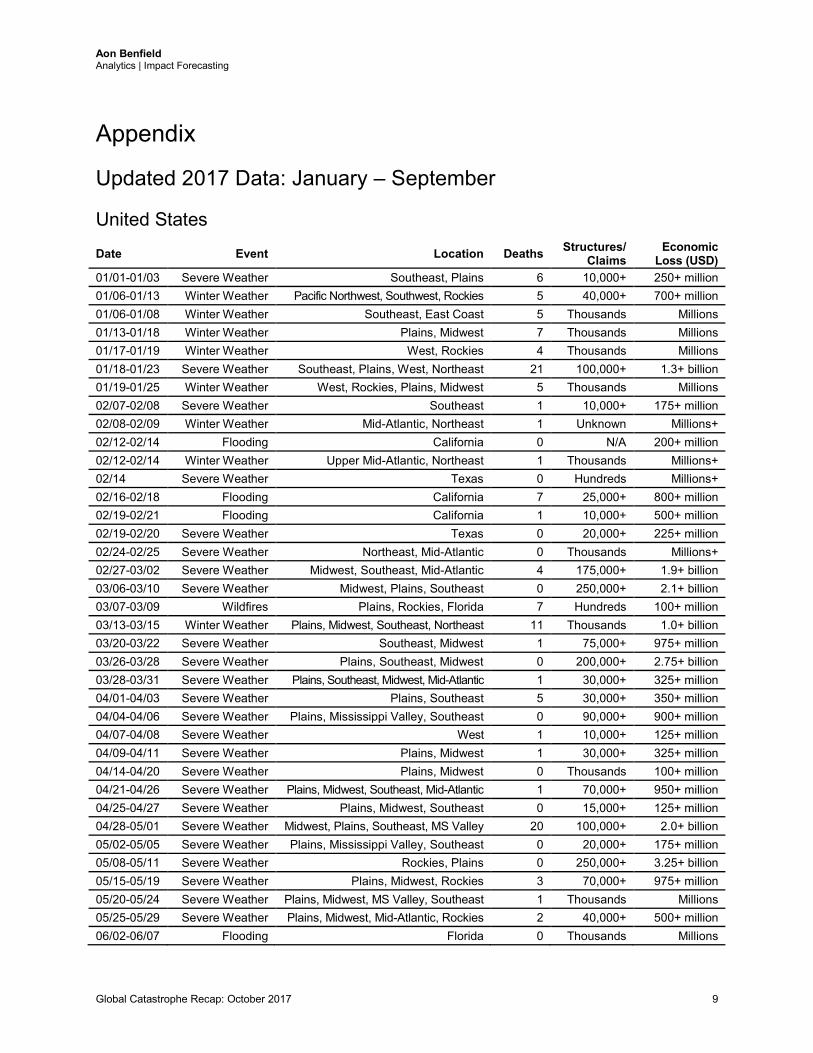
01/01-01/03 Severe Weather Southeast, Plains 6 10,000+ 250+ million 01/06-01/13 Winter Weather Pacific Northwest, Southwest, Rockies 5 40,000+ 700+ million 01/06-01/08 Winter Weather Southeast, East Coast 5 Thousands Millions 01/13-01/18 Winter Weather Plains, Midwest 7 Thousands Millions 01/17-01/19 Winter Weather West, Rockies 4 Thousands Millions 01/18-01/23 Severe Weather Southeast, Plains, West, Northeast 21 100,000+ 1.3+ billion 01/19-01/25 Winter Weather West, Rockies, Plains, Midwest 5 Thousands Millions 02/07-02/08 Severe Weather Southeast 1 10,000+ 175+ million 02/08-02/09 Winter Weather Mid-Atlantic, Northeast 1 Unknown Millions+ 02/12-02/14 Flooding California 0 N/A 200+ million 02/12-02/14 Winter Weather Upper Mid-Atlantic, Northeast 1 Thousands Millions+ 02/14 Severe Weather Texas 0 Hundreds Millions+ 02/16-02/18 Flooding California 7 25,000+ 800+ million 02/19-02/21 Flooding California 1 10,000+ 500+ million 02/19-02/20 Severe Weather Texas 0 20,000+ 225+ million 02/24-02/25 Severe Weather Northeast, Mid-Atlantic 0 Thousands Millions+ 02/27-03/02 Severe Weather Midwest, Southeast, Mid-Atlantic 4 175,000+ 1.9+ billion 03/06-03/10 Severe Weather Midwest, Plains, Southeast 0 250,000+ 2.1+ billion 03/07-03/09 Wildfires Plains, Rockies, Florida 7 Hundreds 100+ million 03/13-03/15 Winter Weather Plains, Midwest, Southeast, Northeast 11 Thousands 1.0+ billion 03/20-03/22 Severe Weather Southeast, Midwest 1 75,000+ 975+ million 03/26-03/28 Severe Weather Plains, Southeast, Midwest 0 200,000+ 2.75+ billion 03/28-03/31 Severe Weather Plains, Southeast, Midwest, Mid-Atlantic 1 30,000+ 325+ million 04/01-04/03 Severe Weather Plains, Southeast 5 30,000+ 350+ million 04/04-04/06 Severe Weather Plains, Mississippi Valley, Southeast 0 90,000+ 900+ million 04/07-04/08 Severe Weather West 1 10,000+ 125+ million 04/09-04/11 Severe Weather Plains, Midwest 1 30,000+ 325+ million 04/14-04/20 Severe Weather Plains, Midwest 0 Thousands 100+ million 04/21-04/26 Severe Weather Plains, Midwest, Southeast, Mid-Atlantic 1 70,000+ 950+ million 04/25-04/27 Severe Weather Plains, Midwest, Southeast 0 15,000+ 125+ million 04/28-05/01 Severe Weather Midwest, Plains, Southeast, MS Valley 20 100,000+ 2.0+ billion 05/02-05/05 Severe Weather Plains, Mississippi Valley, Southeast 0 20,000+ 175+ million 05/08-05/11 Severe Weather Rockies, Plains 0 250,000+ 3.25+ billion 05/15-05/19 Severe Weather Plains, Midwest, Rockies 3 70,000+ 975+ million 05/20-05/24 Severe Weather Plains, Midwest, MS Valley, Southeast 1 Thousands Millions 05/25-05/29 Severe Weather Plains, Midwest, Mid-Atlantic, Rockies 2 40,000+ 500+ million 06/02-06/07 Flooding Florida 0 Thousands Millions
Aon Benfield Analytics | Impact Forecasting
Global Catastrophe Recap: October 2017 10
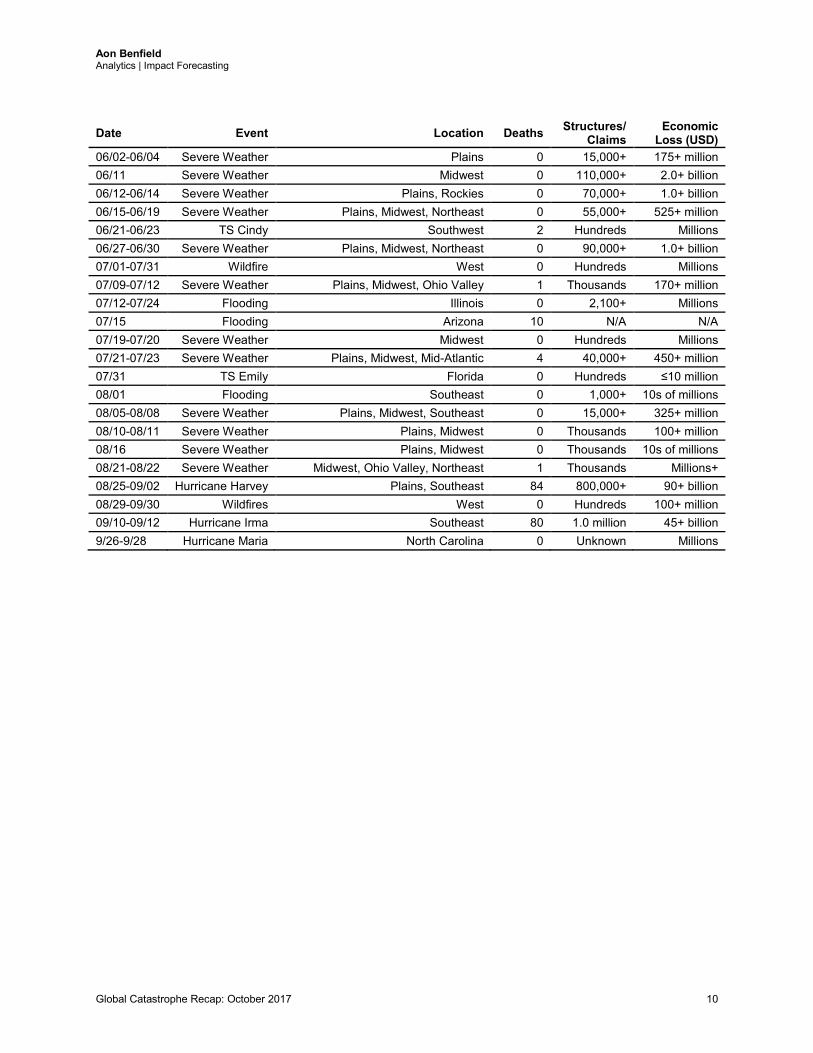
Date Event Location Deaths Structures/ Claims
Economic Loss (USD)
06/02-06/04 Severe Weather Plains 0 15,000+ 175+ million 06/11 Severe Weather Midwest 0 110,000+ 2.0+ billion 06/12-06/14 Severe Weather Plains, Rockies 0 70,000+ 1.0+ billion 06/15-06/19 Severe Weather Plains, Midwest, Northeast 0 55,000+ 525+ million 06/21-06/23 TS Cindy Southwest 2 Hundreds Millions 06/27-06/30 Severe Weather Plains, Midwest, Northeast 0 90,000+ 1.0+ billion 07/01-07/31 Wildfire West 0 Hundreds Millions 07/09-07/12 Severe Weather Plains, Midwest, Ohio Valley 1 Thousands 170+ million 07/12-07/24 Flooding Illinois 0 2,100+ Millions 07/15 Flooding Arizona 10 N/A N/A 07/19-07/20 Severe Weather Midwest 0 Hundreds Millions 07/21-07/23 Severe Weather Plains, Midwest, Mid-Atlantic 4 40,000+ 450+ million 07/31 TS Emily Florida 0 Hundreds ≤10 million 08/01 Flooding Southeast 0 1,000+ 10s of millions 08/05-08/08 Severe Weather Plains, Midwest, Southeast 0 15,000+ 325+ million 08/10-08/11 Severe Weather Plains, Midwest 0 Thousands 100+ million 08/16 Severe Weather Plains, Midwest 0 Thousands 10s of millions 08/21-08/22 Severe Weather Midwest, Ohio Valley, Northeast 1 Thousands Millions+ 08/25-09/02 Hurricane Harvey Plains, Southeast 84 800,000+ 90+ billion 08/29-09/30 Wildfires West 0 Hundreds 100+ million 09/10-09/12 Hurricane Irma Southeast 80 1.0 million 45+ billion 9/26-9/28 Hurricane Maria North Carolina 0 Unknown Millions
Aon Benfield Analytics | Impact Forecasting
Global Catastrophe Recap: October 2017 11
Remainder of North America (Non-U.S.)
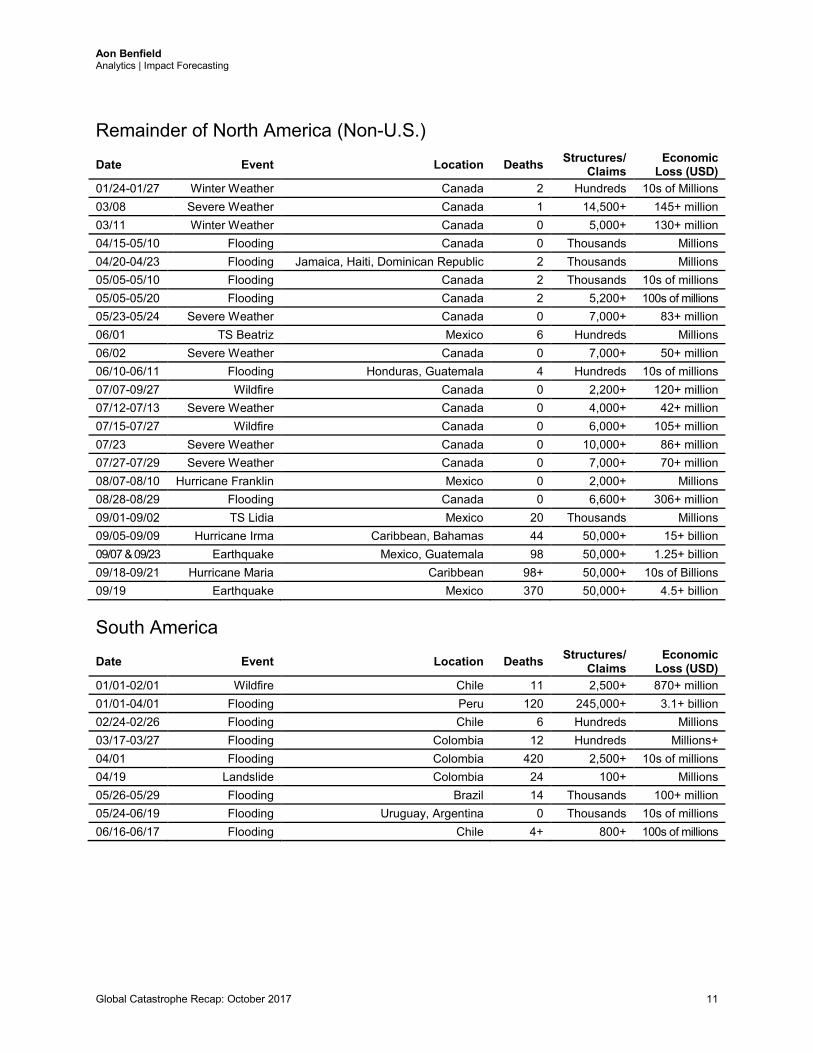
Date Event Location Deaths Structures/ Claims
Economic Loss (USD)
01/24-01/27 Winter Weather Canada 2 Hundreds 10s of Millions 03/08 Severe Weather Canada 1 14,500+ 145+ million 03/11 Winter Weather Canada 0 5,000+ 130+ million 04/15-05/10 Flooding Canada 0 Thousands Millions 04/20-04/23 Flooding Jamaica, Haiti, Dominican Republic 2 Thousands Millions 05/05-05/10 Flooding Canada 2 Thousands 10s of millions 05/05-05/20 Flooding Canada 2 5,200+ 100s of millions 05/23-05/24 Severe Weather Canada 0 7,000+ 83+ million 06/01 TS Beatriz Mexico 6 Hundreds Millions 06/02 Severe Weather Canada 0 7,000+ 50+ million 06/10-06/11 Flooding Honduras, Guatemala 4 Hundreds 10s of millions 07/07-09/27 Wildfire Canada 0 2,200+ 120+ million 07/12-07/13 Severe Weather Canada 0 4,000+ 42+ million 07/15-07/27 Wildfire Canada 0 6,000+ 105+ million 07/23 Severe Weather Canada 0 10,000+ 86+ million 07/27-07/29 Severe Weather Canada 0 7,000+ 70+ million 08/07-08/10 Hurricane Franklin Mexico 0 2,000+ Millions 08/28-08/29 Flooding Canada 0 6,600+ 306+ million 09/01-09/02 TS Lidia Mexico 20 Thousands Millions 09/05-09/09 Hurricane Irma Caribbean, Bahamas 44 50,000+ 15+ billion 09/07 & 09/23 Earthquake Mexico, Guatemala 98 50,000+ 1.25+ billion 09/18-09/21 Hurricane Maria Caribbean 98+ 50,000+ 10s of Billions 09/19 Earthquake Mexico 370 50,000+ 4.5+ billion
South America
Date Event Location Deaths Structures/ Claims
Economic Loss (USD)
01/01-02/01 Wildfire Chile 11 2,500+ 870+ million 01/01-04/01 Flooding Peru 120 245,000+ 3.1+ billion 02/24-02/26 Flooding Chile 6 Hundreds Millions 03/17-03/27 Flooding Colombia 12 Hundreds Millions+ 04/01 Flooding Colombia 420 2,500+ 10s of millions 04/19 Landslide Colombia 24 100+ Millions 05/26-05/29 Flooding Brazil 14 Thousands 100+ million 05/24-06/19 Flooding Uruguay, Argentina 0 Thousands 10s of millions 06/16-06/17 Flooding Chile 4+ 800+ 100s of millions
Aon Benfield Analytics | Impact Forecasting
Global Catastrophe Recap: October 2017 12
Europe
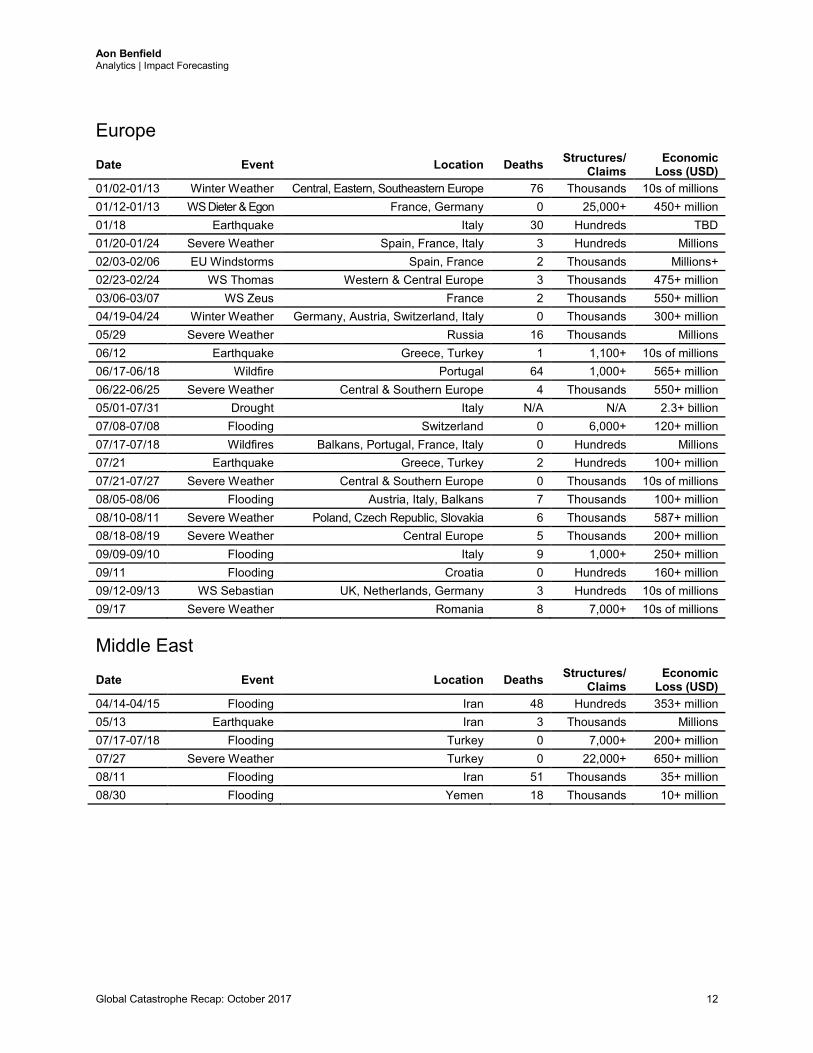
Date Event Location Deaths Structures/ Claims
Economic Loss (USD)
01/02-01/13 Winter Weather Central, Eastern, Southeastern Europe 76 Thousands 10s of millions 01/12-01/13 WS Dieter & Egon France, Germany 0 25,000+ 450+ million 01/18 Earthquake Italy 30 Hundreds TBD 01/20-01/24 Severe Weather Spain, France, Italy 3 Hundreds Millions 02/03-02/06 EU Windstorms Spain, France 2 Thousands Millions+ 02/23-02/24 WS Thomas Western & Central Europe 3 Thousands 475+ million 03/06-03/07 WS Zeus France 2 Thousands 550+ million 04/19-04/24 Winter Weather Germany, Austria, Switzerland, Italy 0 Thousands 300+ million 05/29 Severe Weather Russia 16 Thousands Millions 06/12 Earthquake Greece, Turkey 1 1,100+ 10s of millions 06/17-06/18 Wildfire Portugal 64 1,000+ 565+ million 06/22-06/25 Severe Weather Central & Southern Europe 4 Thousands 550+ million 05/01-07/31 Drought Italy N/A N/A 2.3+ billion 07/08-07/08 Flooding Switzerland 0 6,000+ 120+ million 07/17-07/18 Wildfires Balkans, Portugal, France, Italy 0 Hundreds Millions 07/21 Earthquake Greece, Turkey 2 Hundreds 100+ million 07/21-07/27 Severe Weather Central & Southern Europe 0 Thousands 10s of millions 08/05-08/06 Flooding Austria, Italy, Balkans 7 Thousands 100+ million 08/10-08/11 Severe Weather Poland, Czech Republic, Slovakia 6 Thousands 587+ million 08/18-08/19 Severe Weather Central Europe 5 Thousands 200+ million 09/09-09/10 Flooding Italy 9 1,000+ 250+ million 09/11 Flooding Croatia 0 Hundreds 160+ million 09/12-09/13 WS Sebastian UK, Netherlands, Germany 3 Hundreds 10s of millions 09/17 Severe Weather Romania 8 7,000+ 10s of millions
Middle East
Date Event Location Deaths Structures/ Claims
Economic Loss (USD)
04/14-04/15 Flooding Iran 48 Hundreds 353+ million 05/13 Earthquake Iran 3 Thousands Millions 07/17-07/18 Flooding Turkey 0 7,000+ 200+ million 07/27 Severe Weather Turkey 0 22,000+ 650+ million 08/11 Flooding Iran 51 Thousands 35+ million 08/30 Flooding Yemen 18 Thousands 10+ million
Aon Benfield Analytics | Impact Forecasting
Global Catastrophe Recap: October 2017 13
Africa
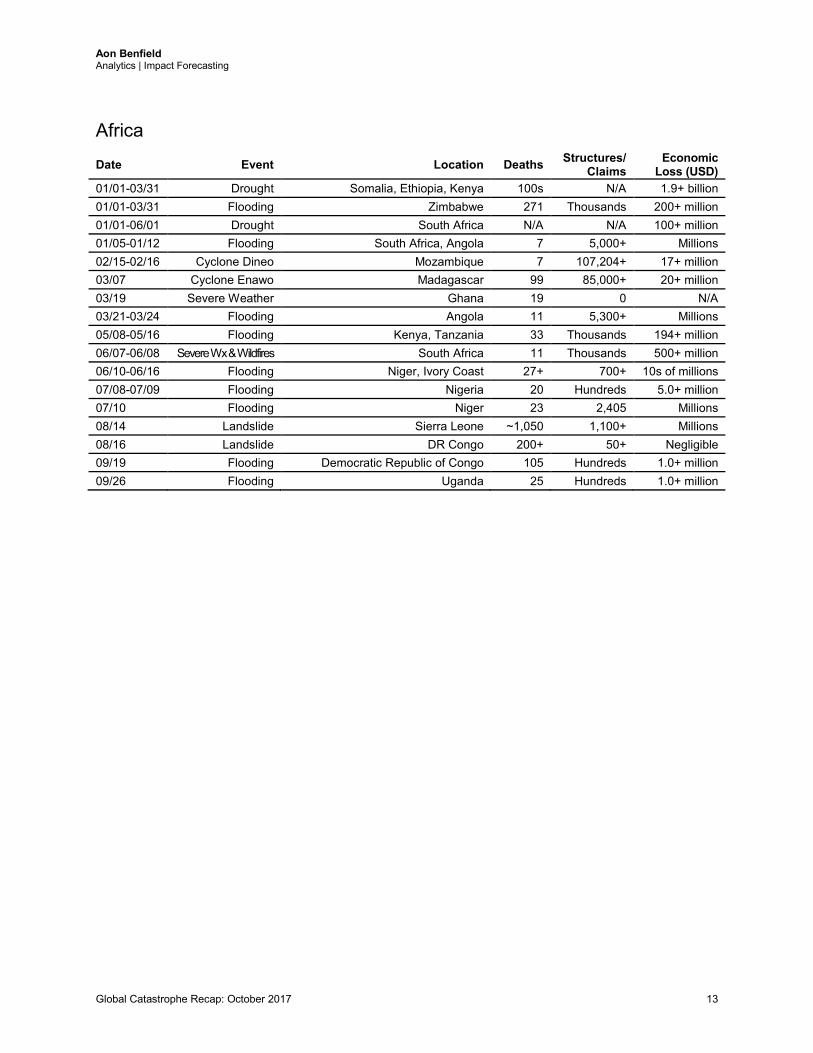
Date Event Location Deaths Structures/ Claims
Economic Loss (USD)
01/01-03/31 Drought Somalia, Ethiopia, Kenya 100s N/A 1.9+ billion 01/01-03/31 Flooding Zimbabwe 271 Thousands 200+ million 01/01-06/01 Drought South Africa N/A N/A 100+ million 01/05-01/12 Flooding South Africa, Angola 7 5,000+ Millions 02/15-02/16 Cyclone Dineo Mozambique 7 107,204+ 17+ million 03/07 Cyclone Enawo Madagascar 99 85,000+ 20+ million 03/19 Severe Weather Ghana 19 0 N/A 03/21-03/24 Flooding Angola 11 5,300+ Millions 05/08-05/16 Flooding Kenya, Tanzania 33 Thousands 194+ million 06/07-06/08 Severe Wx & Wildfires South Africa 11 Thousands 500+ million 06/10-06/16 Flooding Niger, Ivory Coast 27+ 700+ 10s of millions 07/08-07/09 Flooding Nigeria 20 Hundreds 5.0+ million 07/10 Flooding Niger 23 2,405 Millions 08/14 Landslide Sierra Leone ~1,050 1,100+ Millions 08/16 Landslide DR Congo 200+ 50+ Negligible 09/19 Flooding Democratic Republic of Congo 105 Hundreds 1.0+ million 09/26 Flooding Uganda 25 Hundreds 1.0+ million
Aon Benfield Analytics | Impact Forecasting
Global Catastrophe Recap: October 2017 14
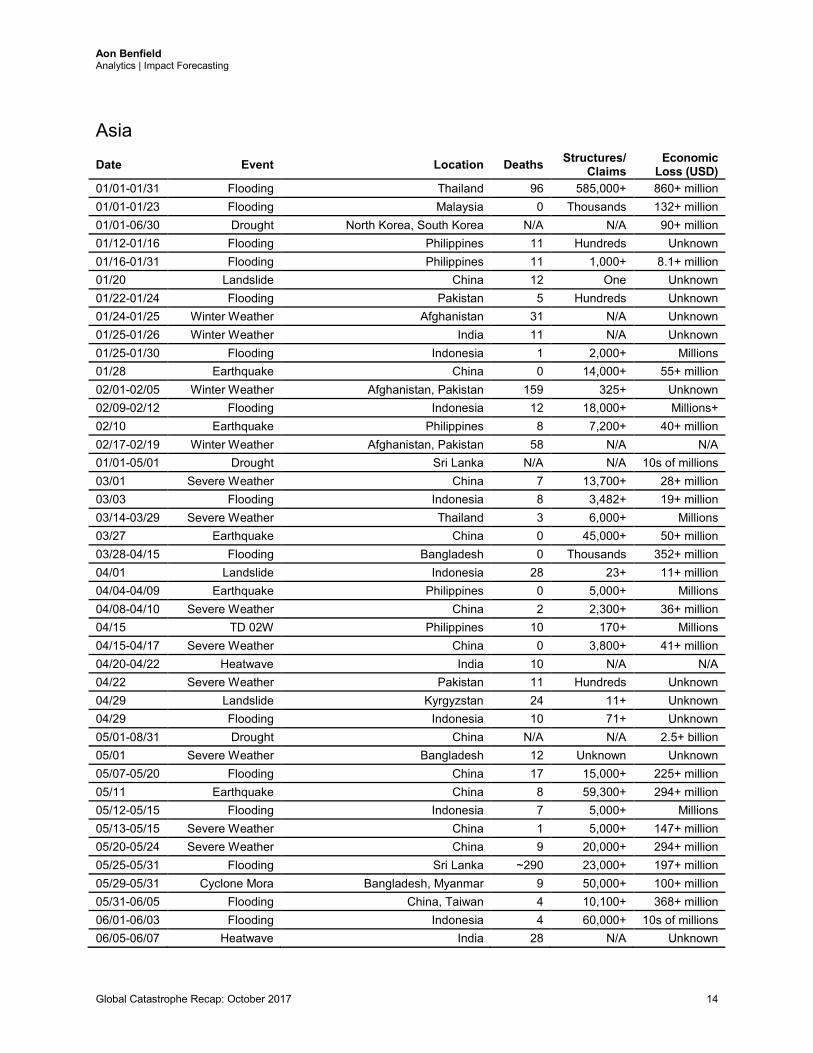
Asia
Date Event Location Deaths Structures/ Claims
Economic Loss (USD)
01/01-01/31 Flooding Thailand 96 585,000+ 860+ million 01/01-01/23 Flooding Malaysia 0 Thousands 132+ million 01/01-06/30 Drought North Korea, South Korea N/A N/A 90+ million 01/12-01/16 Flooding Philippines 11 Hundreds Unknown 01/16-01/31 Flooding Philippines 11 1,000+ 8.1+ million 01/20 Landslide China 12 One Unknown 01/22-01/24 Flooding Pakistan 5 Hundreds Unknown 01/24-01/25 Winter Weather Afghanistan 31 N/A Unknown 01/25-01/26 Winter Weather India 11 N/A Unknown 01/25-01/30 Flooding Indonesia 1 2,000+ Millions 01/28 Earthquake China 0 14,000+ 55+ million 02/01-02/05 Winter Weather Afghanistan, Pakistan 159 325+ Unknown 02/09-02/12 Flooding Indonesia 12 18,000+ Millions+ 02/10 Earthquake Philippines 8 7,200+ 40+ million 02/17-02/19 Winter Weather Afghanistan, Pakistan 58 N/A N/A 01/01-05/01 Drought Sri Lanka N/A N/A 10s of millions 03/01 Severe Weather China 7 13,700+ 28+ million 03/03 Flooding Indonesia 8 3,482+ 19+ million 03/14-03/29 Severe Weather Thailand 3 6,000+ Millions 03/27 Earthquake China 0 45,000+ 50+ million 03/28-04/15 Flooding Bangladesh 0 Thousands 352+ million 04/01 Landslide Indonesia 28 23+ 11+ million 04/04-04/09 Earthquake Philippines 0 5,000+ Millions 04/08-04/10 Severe Weather China 2 2,300+ 36+ million 04/15 TD 02W Philippines 10 170+ Millions 04/15-04/17 Severe Weather China 0 3,800+ 41+ million 04/20-04/22 Heatwave India 10 N/A N/A 04/22 Severe Weather Pakistan 11 Hundreds Unknown 04/29 Landslide Kyrgyzstan 24 11+ Unknown 04/29 Flooding Indonesia 10 71+ Unknown 05/01-08/31 Drought China N/A N/A 2.5+ billion 05/01 Severe Weather Bangladesh 12 Unknown Unknown 05/07-05/20 Flooding China 17 15,000+ 225+ million 05/11 Earthquake China 8 59,300+ 294+ million 05/12-05/15 Flooding Indonesia 7 5,000+ Millions 05/13-05/15 Severe Weather China 1 5,000+ 147+ million 05/20-05/24 Severe Weather China 9 20,000+ 294+ million 05/25-05/31 Flooding Sri Lanka ~290 23,000+ 197+ million 05/29-05/31 Cyclone Mora Bangladesh, Myanmar 9 50,000+ 100+ million 05/31-06/05 Flooding China, Taiwan 4 10,100+ 368+ million 06/01-06/03 Flooding Indonesia 4 60,000+ 10s of millions 06/05-06/07 Heatwave India 28 N/A Unknown
Aon Benfield Analytics | Impact Forecasting
Global Catastrophe Recap: October 2017 15
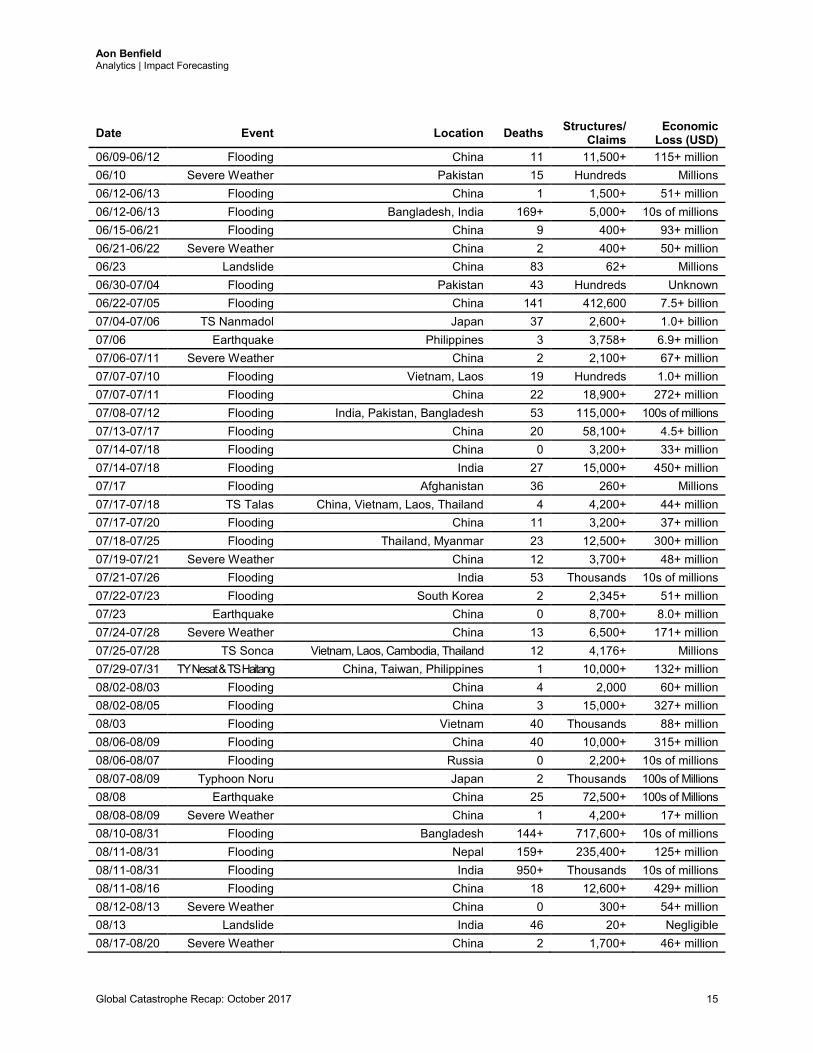
Date Event Location Deaths Structures/ Claims
Economic Loss (USD)
06/09-06/12 Flooding China 11 11,500+ 115+ million 06/10 Severe Weather Pakistan 15 Hundreds Millions 06/12-06/13 Flooding China 1 1,500+ 51+ million 06/12-06/13 Flooding Bangladesh, India 169+ 5,000+ 10s of millions 06/15-06/21 Flooding China 9 400+ 93+ million 06/21-06/22 Severe Weather China 2 400+ 50+ million 06/23 Landslide China 83 62+ Millions 06/30-07/04 Flooding Pakistan 43 Hundreds Unknown 06/22-07/05 Flooding China 141 412,600 7.5+ billion 07/04-07/06 TS Nanmadol Japan 37 2,600+ 1.0+ billion 07/06 Earthquake Philippines 3 3,758+ 6.9+ million 07/06-07/11 Severe Weather China 2 2,100+ 67+ million 07/07-07/10 Flooding Vietnam, Laos 19 Hundreds 1.0+ million 07/07-07/11 Flooding China 22 18,900+ 272+ million 07/08-07/12 Flooding India, Pakistan, Bangladesh 53 115,000+ 100s of millions 07/13-07/17 Flooding China 20 58,100+ 4.5+ billion 07/14-07/18 Flooding China 0 3,200+ 33+ million 07/14-07/18 Flooding India 27 15,000+ 450+ million 07/17 Flooding Afghanistan 36 260+ Millions 07/17-07/18 TS Talas China, Vietnam, Laos, Thailand 4 4,200+ 44+ million 07/17-07/20 Flooding China 11 3,200+ 37+ million 07/18-07/25 Flooding Thailand, Myanmar 23 12,500+ 300+ million 07/19-07/21 Severe Weather China 12 3,700+ 48+ million 07/21-07/26 Flooding India 53 Thousands 10s of millions 07/22-07/23 Flooding South Korea 2 2,345+ 51+ million 07/23 Earthquake China 0 8,700+ 8.0+ million 07/24-07/28 Severe Weather China 13 6,500+ 171+ million 07/25-07/28 TS Sonca Vietnam, Laos, Cambodia, Thailand 12 4,176+ Millions 07/29-07/31 TY Nesat & TS Haitang China, Taiwan, Philippines 1 10,000+ 132+ million 08/02-08/03 Flooding China 4 2,000 60+ million 08/02-08/05 Flooding China 3 15,000+ 327+ million 08/03 Flooding Vietnam 40 Thousands 88+ million 08/06-08/09 Flooding China 40 10,000+ 315+ million 08/06-08/07 Flooding Russia 0 2,200+ 10s of millions 08/07-08/09 Typhoon Noru Japan 2 Thousands 100s of Millions 08/08 Earthquake China 25 72,500+ 100s of Millions 08/08-08/09 Severe Weather China 1 4,200+ 17+ million 08/10-08/31 Flooding Bangladesh 144+ 717,600+ 10s of millions 08/11-08/31 Flooding Nepal 159+ 235,400+ 125+ million 08/11-08/31 Flooding India 950+ Thousands 10s of millions 08/11-08/16 Flooding China 18 12,600+ 429+ million 08/12-08/13 Severe Weather China 0 300+ 54+ million 08/13 Landslide India 46 20+ Negligible 08/17-08/20 Severe Weather China 2 1,700+ 46+ million
Aon Benfield Analytics | Impact Forecasting
Global Catastrophe Recap: October 2017 16
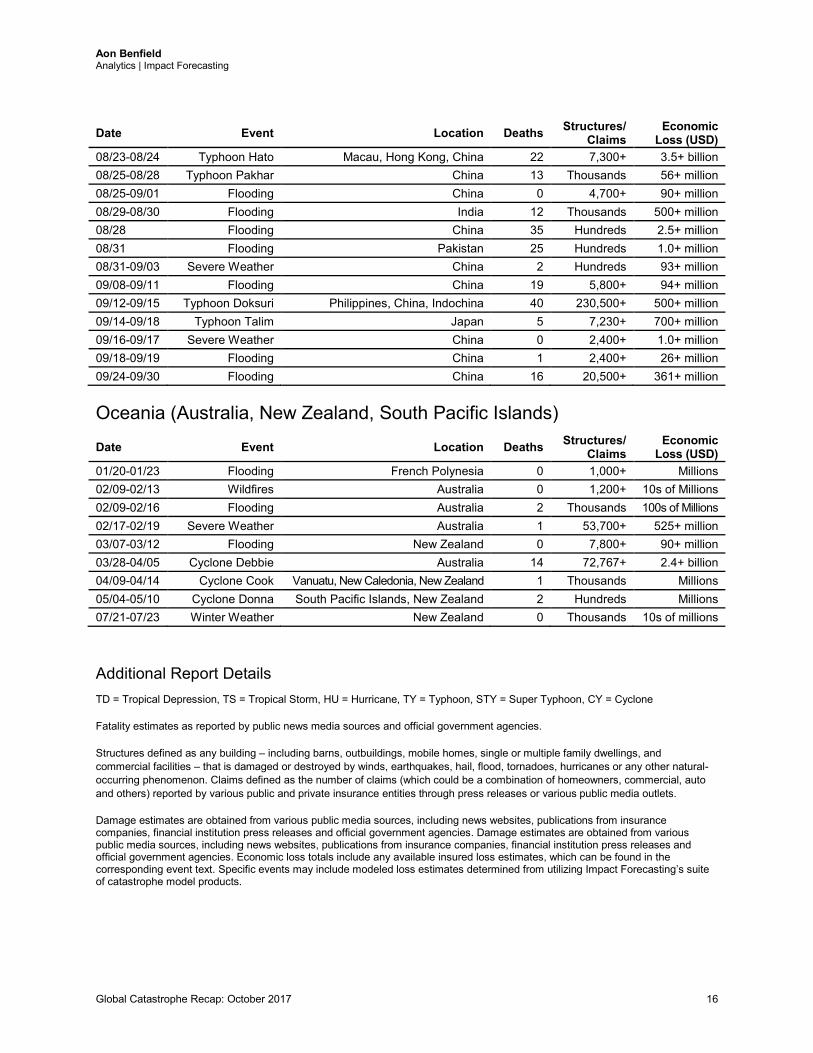
Date Event Location Deaths Structures/ Claims
Economic Loss (USD)
08/23-08/24 Typhoon Hato Macau, Hong Kong, China 22 7,300+ 3.5+ billion 08/25-08/28 Typhoon Pakhar China 13 Thousands 56+ million 08/25-09/01 Flooding China 0 4,700+ 90+ million 08/29-08/30 Flooding India 12 Thousands 500+ million 08/28 Flooding China 35 Hundreds 2.5+ million 08/31 Flooding Pakistan 25 Hundreds 1.0+ million 08/31-09/03 Severe Weather China 2 Hundreds 93+ million 09/08-09/11 Flooding China 19 5,800+ 94+ million 09/12-09/15 Typhoon Doksuri Philippines, China, Indochina 40 230,500+ 500+ million 09/14-09/18 Typhoon Talim Japan 5 7,230+ 700+ million 09/16-09/17 Severe Weather China 0 2,400+ 1.0+ million 09/18-09/19 Flooding China 1 2,400+ 26+ million 09/24-09/30 Flooding China 16 20,500+ 361+ million
Oceania (Australia, New Zealand, South Pacific Islands)
Date Event Location Deaths Structures/ Claims
Economic Loss (USD)
01/20-01/23 Flooding French Polynesia 0 1,000+ Millions 02/09-02/13 Wildfires Australia 0 1,200+ 10s of Millions 02/09-02/16 Flooding Australia 2 Thousands 100s of Millions 02/17-02/19 Severe Weather Australia 1 53,700+ 525+ million 03/07-03/12 Flooding New Zealand 0 7,800+ 90+ million 03/28-04/05 Cyclone Debbie Australia 14 72,767+ 2.4+ billion 04/09-04/14 Cyclone Cook Vanuatu, New Caledonia, New Zealand 1 Thousands Millions 05/04-05/10 Cyclone Donna South Pacific Islands, New Zealand 2 Hundreds Millions 07/21-07/23 Winter Weather New Zealand 0 Thousands 10s of millions
Additional Report Details TD = Tropical Depression, TS = Tropical Storm, HU = Hurricane, TY = Typhoon, STY = Super Typhoon, CY = Cyclone Fatality estimates as reported by public news media sources and official government agencies. Structures defined as any building – including barns, outbuildings, mobile homes, single or multiple family dwellings, and commercial facilities – that is damaged or destroyed by winds, earthquakes, hail, flood, tornadoes, hurricanes or any other natural-occurring phenomenon. Claims defined as the number of claims (which could be a combination of homeowners, commercial, auto and others) reported by various public and private insurance entities through press releases or various public media outlets. Damage estimates are obtained from various public media sources, including news websites, publications from insurance companies, financial institution press releases and official government agencies. Damage estimates are obtained from various public media sources, including news websites, publications from insurance companies, financial institution press releases and official government agencies. Economic loss totals include any available insured loss estimates, which can be found in the corresponding event text. Specific events may include modeled loss estimates determined from utilizing Impact Forecasting’s suite of catastrophe model products.

Aon Benfield Analytics | Impact Forecasting
Global Catastrophe Recap: October 2017 17
Contact Information Adam Podlaha Head of Impact Forecasting Aon Benfield Analytics Impact Forecasting +44.20.7522.3820 [email protected] Claire Darbinyan Associate Director (Meteorologist) Aon Benfield Analytics Impact Forecasting +65.6645.0110 [email protected]
Steve Bowen Director (Meteorologist) Aon Benfield Analytics Impact Forecasting +1.312.381.5883 [email protected] Michal Lörinc Catastrophe Analyst Aon Benfield Analytics Impact Forecasting +420.234.618.358 [email protected]
About Aon Benfield
Aon Benfield, a division of Aon plc (NYSE: AON), is the world’s leading reinsurance intermediary and full-service capital advisor. We empower our clients to better understand, manage and transfer risk through innovative solutions and personalized access to all forms of global reinsurance capital across treaty, facultative and capital markets. As a trusted advocate, we deliver local reach to the world’s markets, an unparalleled investment in innovative analytics, including catastrophe management, actuarial and rating agency advisory. Through our professionals’ expertise and experience, we advise clients in making optimal capital choices that will empower results and improve operational effectiveness for their business. With more than 80 offices in 50 countries, our worldwide client base has access to the broadest portfolio of integrated capital solutions and services. To learn how Aon Benfield helps empower results, please visit aonbenfield.com. Copyright © by Impact Forecasting® No claim to original government works. The text and graphics of this publication are provided for informational purposes only. While Impact Forecasting® has tried to provide accurate and timely information, inadvertent technical inaccuracies and typographical errors may exist, and Impact Forecasting® does not warrant that the information is accurate, complete or current. The data presented at this site is intended to convey only general information on current natural perils and must not be used to make life-or-death decisions or decisions relating to the protection of property, as the data may not be accurate. Please listen to official information sources for current storm information. This data has no official status and should not be used for emergency response decision-making under any circumstances. Cat Alerts use publicly available data from the internet and other sources. Impact Forecasting® summarizes this publicly available information for the convenience of those individuals who have contacted Impact Forecasting® and expressed an interest in natural catastrophes of various types. To find out more about Impact Forecasting or to sign up for the Cat Reports, visit Impact Forecasting’s webpage at impactforecasting.com.
Copyright © by Aon plc. All rights reserved. No part of this document may be reproduced, stored in a retrieval system, or transmitted in any form or by any means, electronic, mechanical, photocopying, recording or otherwise. Impact Forecasting® is a wholly owned subsidiary of Aon plc.